FLOODED TWO PHASE FLOW DYNAMICS AND HEAT TRANSFER …
62
FLOODED TWO-PHASE FLOW DYNAMICS AND HEAT TRANSFER WITH ENGINEERED WETTABILITY ON MICROSTRUCTURED SURFACES _______________________________________ A Thesis Presented to the Faculty of the Graduate School at the University of Missouri-Columbia _______________________________________________________ In Partial Fulfillment of the Requirements for the Degree Master of Science _____________________________________________________ by BO CHEN Dr. Chung-Lung Chen, Thesis Supervisor MAY 2015
Transcript of FLOODED TWO PHASE FLOW DYNAMICS AND HEAT TRANSFER …
FLOODED TWO-PHASE FLOW DYNAMICS AND HEAT TRANSFER WITH
ENGINEERED WETTABILITY ON MICROSTRUCTURED SURFACES
_______________________________________
A Thesis Presented to the Faculty of the Graduate School
at the University of Missouri-Columbia
_______________________________________________________
In Partial Fulfillment
of the Requirements for the Degree
Master of Science
_____________________________________________________
by
BO CHEN
Dr. Chung-Lung Chen, Thesis Supervisor
MAY 2015

The undersigned, appointed by the dean of the Graduate School, have examined the thesis entitled
FLOODED TWO-PHASE FLOW DYNAMICS AND HEAT TRANSFER WITH
ENGINEERED WETTABILITY ON MICROSTRUCTURED SURFACES
Presented by Bo Chen,
A candidate for the degree of Master of Science
And hereby certify that, in their opinion, it is worthy of acceptance.
Professor Chung-Lung Chen
Professor Gary Solbrekken
Professor Carmen Chicone

ii
ACKNOWLEDGEMENTS
I would like to express my profound gratitude and deep regards to my advisor, Dr.
Chen, for his continuous support for my project, from initial advice in the early stages
of conceptual inception to the warm encouragement to this day. He is a perfect teacher
when I ask him for professional knowledge, while he is a lot like my father when we
talk about career, life and future.
A special thank of mine goes to postdoc Sean and Simon for their valuable and
constructive suggestions during the research. Sean gave me lots of suggestion and
discussed with me on the numerical simulation and modeling. Simon advised me on
the writing of papers and thesis, as well as rendering me some deep discussions
related to my project.
I’m grateful to my friends Jingwen, Chenxing, Tiancheng and Steve who helped
me a lot in completing my project and motivated me to keep working on the
challenging project.
I wish to thank my parents for their undivided support which inspired me.
iii
TABLE OF CONTENTS ACKNOWLEDGEMENTS ...................................................................................................... II
LIST OF ILLUSTRATIONS .................................................................................................... V
LIST OF TABLES ................................................................................................................... VI
NOMENCLATURE ............................................................................................................... VII
ABSTRACT ............................................................................................................................. X
CHAPTER 1 INTRODUCTION ............................................................................................. 1
1.1 BACKGROUND ............................................................................................................. 1
1.2 LITERATURE REVIEW .................................................................................................. 4
Effects of wettability patterning and micro-structure ............................................ 4 1.2.1
VOF and mass transfer model in phase change investigations .............................. 7 1.2.2
CHAPTER 2 NUCLEATION STUDY .................................................................................. 11
2.1 TYPES OF NUCLEATION .............................................................................................. 11
Homogeneous nucleation ..................................................................................... 11 2.1.1
Heterogeneous nucleation .................................................................................... 11 2.1.2
2.2 NUCLEATION ANALYSIS ............................................................................................. 12
CHAPTER 3 NUMERICAL MODELING ............................................................................ 14
3.1 COMPUTATIONAL DOMAIN AND FLOODING SCENARIO ................................................ 14
3.2 GOVERNING EQUATIONS ............................................................................................ 16
Volume of fluid method ....................................................................................... 16 3.2.1
Interface Representation ...................................................................................... 17 3.2.2
Surface tension ..................................................................................................... 18 3.2.3
Wall adhesion ....................................................................................................... 20 3.2.4
iv
3.3 MASS TRANSFER MODEL ........................................................................................... 20
Net mass flux ....................................................................................................... 20 3.3.1
Mass source term ................................................................................................. 22 3.3.2
Relaxation time coefficient .................................................................................. 23 3.3.3
3.4 SPECIES TRANSPORT MODEL ...................................................................................... 24
3.5 NUMERICAL SIMULATION INFORMATION ................................................................... 26
Numerical simulation method .............................................................................. 26 3.5.1
Mesh independent study ...................................................................................... 26 3.5.2
CHAPTER 4 RESULTS AND DISCUSSION ....................................................................... 30
4.1 STRUCTURE EFFECT AND THERMAL PERFORMANCE ................................................... 30
4.2 EFFECT OF WETTABILITY PATTERN ON BUBBLE DYNAMIC BEHAVIOR ......................... 33
4.3 COMPARATIVE STUDIES FOR STRUCTURE WITH DIFFERENT WETTABILITY
PATTERNS .............................................................................................................................. 44
CHAPTER 5 CONCLUSIONS.............................................................................................. 46
REFERENCE ........................................................................................................................... 47
v
LIST OF ILLUSTRATIONS
Fig. 1 Bubble equilibrium radius changes with superheat ....................................................... 13
Fig. 2 Computational domain and flooding scenario ............................................................... 15
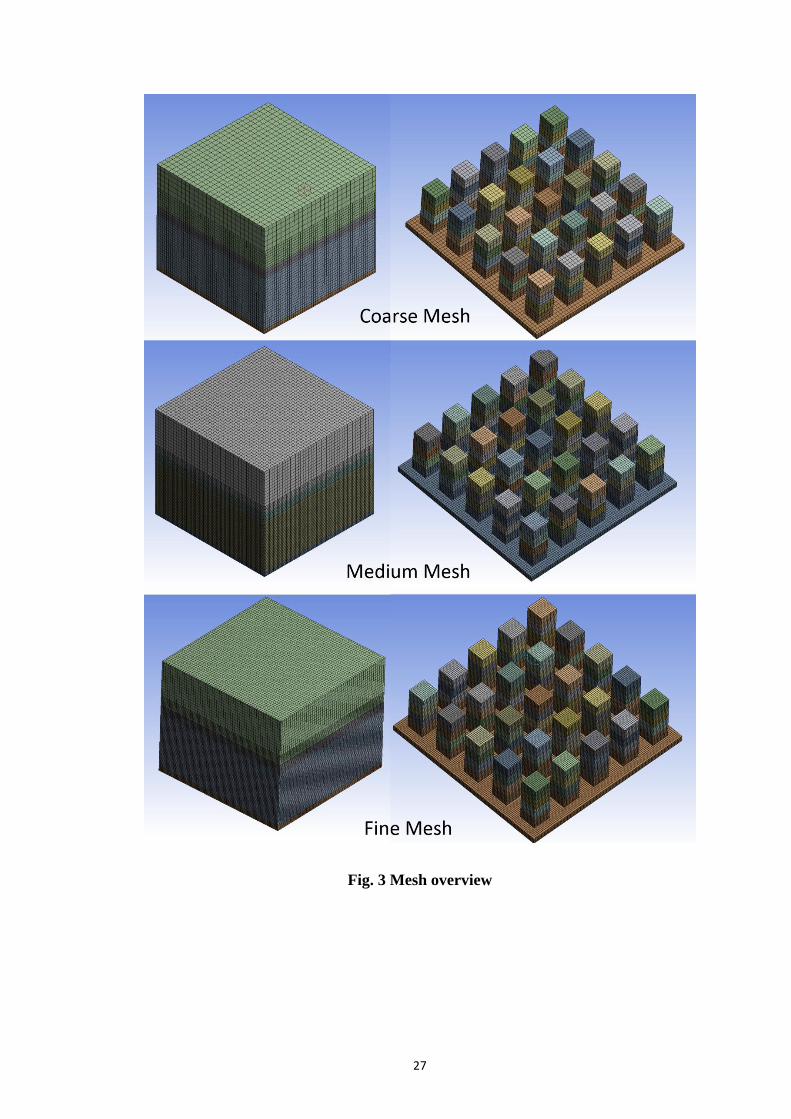
Fig. 3 Mesh overview .............................................................................................................. 27
Fig. 4 Bottom temperature for different meshes ...................................................................... 28
Fig. 5 Bubble evolution for different meshes .......................................................................... 29
Fig. 6 Configurations of series with different pillar heights .................................................... 31
Fig. 7 Heat transfer coefficients of different micro-structures ................................................. 31
Fig. 8 Liquid-gas interface pins at the top edges of the pillars ................................................ 32
Fig. 9 Configurations of series with different wettability patterns .......................................... 33
Fig. 10 Bubble evolution on four kinds of micro-structures .................................................... 35
Fig. 11 Comparison of bubble upward velocity between micro-structures with wholly
hydrophilic and wettability gradient patterns .......................................................................... 36
Fig. 12 Comparison of velocity field between micro-structures with wholly
hydrophilic and wettability gradient patterns at 0.058 ms ....................................................... 36
Fig. 13 Sketch of surface tension force analysis ...................................................................... 37
Fig. 14 Imaginary movement of a bubble pinning between two pillars .................................. 38
Fig. 15 Pulling effect of sit-on-top bubble ............................................................................... 40
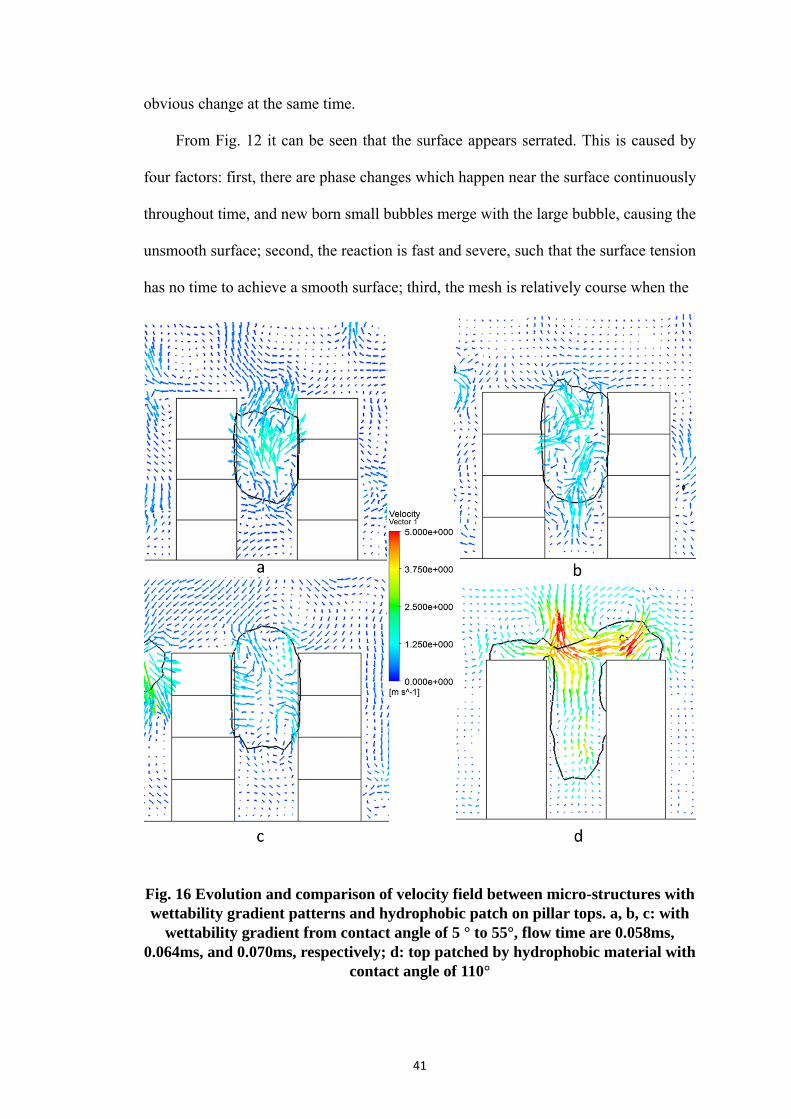
Fig. 16 Evolution and comparison of velocity field between micro-structures with
wettability gradient patterns and hydrophobic patch on pillar tops. ........................................ 41
Fig. 17 Bottom surface temperatures for different wettability patterns ................................... 44
Fig. 18 Heat transfer coefficients on surfaces with different wettability patterns ................... 45

vi
LIST OF TABLES
Tab. 1 Geometry details and wettability patterns of the simulation ........................................ 15
vii
NOMENCLATURE
𝐴𝑝 Surface area of a particle (m2)
Cl Relaxation coefficient for liquid phase (s-1)
Cg Relaxation coefficient for gas phase (s-1)
Dsm Sauter Mean Diameter (m)
𝐷𝑣,𝑎𝑖𝑟 Mass diffusion coefficient between species of water vapor and air (m2/s)
𝑑𝑠 Surface diameter (m)
𝑑𝑣 Volume diameter (m)
𝐽𝑖 Diffusion flux of species i (mol/m2 s)
𝑀 Molecular weight (kg/kmol)
𝑚′′ Mass flux (kg/m2 s)
�� Volumetric mass flux (kg/m3 s)
n Mole’s number (mol)
�� Surface normal of a cell
�� Unit normal
��𝑤 Unit vector normal to the wall
𝐹𝑣𝑜𝑙 Volume force (N)
𝑔 Gravitation acceleration (m/s2)
ℎ𝑙𝑔 Latent heat between liquid and gas phases (J/kg)
𝑘 Thermal conductivity (W/m K)
��𝑙→𝑔 Volumetric mass transfer rate from liquid phase to gas phase (kg/m3 s)
��𝑔→𝑙 Volumetric mass transfer rate from gas phase to liquid phase (kg/m3 s)
𝑝 Pressure (Pa)
𝑝𝑔_𝑙𝑔 Pressure near the liquid-gas interphase on the gas side (Pa)
viii
𝑝𝑠𝑎𝑡 Saturation pressure (Pa)
𝑄 Volumetric heat source term (W/m3)
𝑄𝑙→𝑔 Volumetric heat source term from liquid phase to gas phase (W/m3)
𝑄𝑔→𝑙 Volumetric heat source term from gas phase to liquid phase (W/m3)
𝑅 Universal gas constant (J/mol K)
𝑟𝑒 Radius of bubble at equilibrium state (m)
𝑇 Temperature (K)
𝑇𝑔_𝑙𝑔 Temperature near the liquid-gas interface on the gas side (K)
𝑇𝑙𝑔 Temperature on the liquid-gas interface (K)
𝑇𝑠𝑎𝑡 Saturation temperature (K)
𝑡 Time (s)
��𝑤 Unit vector tangential to the wall
𝑉𝑝 Volume of a particle (m3)
𝑉𝑐𝑒𝑙𝑙 Volume of a cell (m3)
𝑣 Overall velocity vector (m/s)
𝑣𝑙 Inverse of density of the liquid (m3/kg)
𝑣𝑔 Inverse of density of the gas (m3/kg)
W Work (J)
𝑌𝑖𝑗 Local mass fraction of species i for phase j
Greek Symbols
𝛼 Volume fraction
𝛽 An expression of the accommodation coefficient
𝜀 Accommodation coefficient
ix
𝜃𝑤 Contact angle at the wall (degree)
𝜅𝑙 Curvature for the liquid phase (1/m)
𝜅𝑔 Curvature for the gas phase (1/m)
𝜇 Dynamic viscosity (Pa s)
𝜌 Density (kg/m3)
𝜍 Surface tension (N/m)
Abbreviations
CHF Critical Heat Flux
CSF Continuum Surface Force model
HTC Heat Transfer Coefficient
SMD Sauter Mean Diameter
VOF Volume of Fluid method
x
FLOODED TWO-PHASE FLOW DYNAMICS AND HEAT TRANSFER WITH
ENGINEERED WETTABILITY ON MICROSTRUCTURED SURFACES
Bo Chen
Dr. Chung-Lung Chen, Thesis Advisor
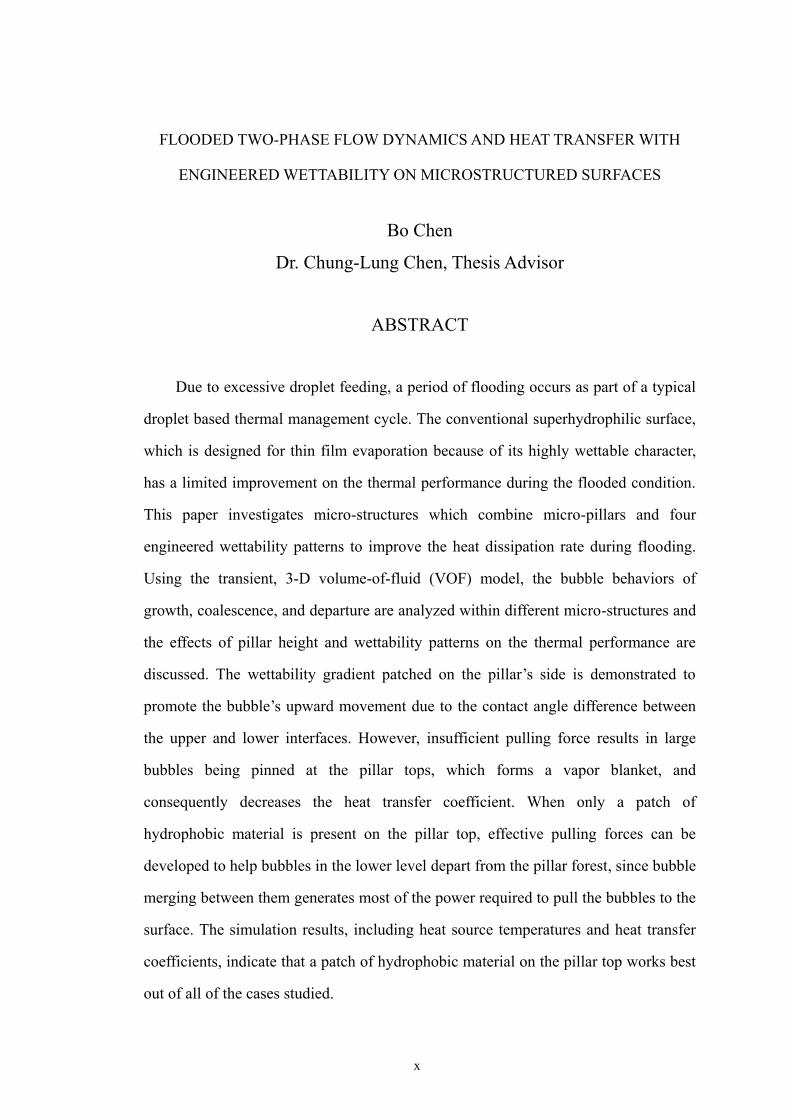
ABSTRACT
Due to excessive droplet feeding, a period of flooding occurs as part of a typical
droplet based thermal management cycle. The conventional superhydrophilic surface,
which is designed for thin film evaporation because of its highly wettable character,
has a limited improvement on the thermal performance during the flooded condition.
This paper investigates micro-structures which combine micro-pillars and four
engineered wettability patterns to improve the heat dissipation rate during flooding.
Using the transient, 3-D volume-of-fluid (VOF) model, the bubble behaviors of
growth, coalescence, and departure are analyzed within different micro-structures and
the effects of pillar height and wettability patterns on the thermal performance are
discussed. The wettability gradient patched on the pillar’s side is demonstrated to
promote the bubble’s upward movement due to the contact angle difference between
the upper and lower interfaces. However, insufficient pulling force results in large
bubbles being pinned at the pillar tops, which forms a vapor blanket, and
consequently decreases the heat transfer coefficient. When only a patch of
hydrophobic material is present on the pillar top, effective pulling forces can be
developed to help bubbles in the lower level depart from the pillar forest, since bubble
merging between them generates most of the power required to pull the bubbles to the
surface. The simulation results, including heat source temperatures and heat transfer
coefficients, indicate that a patch of hydrophobic material on the pillar top works best
out of all of the cases studied.
1
Chapter 1 INTRODUCTION
1.1 Background
Microelectronics is the heart of any modern electronic product, from household
electronic items, to large electronic management systems. However, over the past
several decades, transistor development has followed Moore’s Law, which is the
observation that the number of transistors on integrated circuits doubles every two
years. This has led to significantly risen of heat flux from power devices, approaching
as high as 1kW/cm2 [1]. If not properly managed, the high microprocessor
temperature will deeply affect the performance of the microelectronic assembly,
degrade the system reliability, or even cause catastrophic failure. Moreover, the device
miniaturization and design complexity are causing non-uniform power distribution on
the microprocessors, leading to “high flux hot spot” [2, 3]. The heat flux in these
regions can have a value that is several times higher than the average heat flux on the
chip, reaching values as high as 5kW/cm2. Therefore, novel cooling technologies must
be developed for efficient thermal management, especially the cooling approaches
that can specifically handle the microscale, high flux hot spot.
Conventional heat dissipation methods for high heat flux electronic modules are
natural, forced, and mixed convection with single phase working fluids. However, the
only determinant of the cooling efficiency is the sensible heat of the coolant.
Accordingly, a high flow rate of the coolant is required to maximize the effect, and
this approach brings up the pumping power issues. The other method is phase change
heat transfer method, which has been extensively investigated in the past two decades,
such as direct liquid immersion cooling [4, 5], microchannel cooling [6, 7], jet
impingement cooling [8, 9], spray cooling [9-14], and electro-wetting cooling [15-17].
2
These phase change cooling techniques, which involve boiling and thin film
evaporation, can transfer huge amounts of heat per unit area due to the large amount
of latent heat.
Liquid immersion cooling is a practice to submerge electronic components into a
thermal conductive liquid [5, 18]. Since some hot spots are susceptible to
electromagnetic interference, such as Central Processing Unit (CPU), the liquid must
have sufficiently low electrical conductivity to avoid interfering with the normal
operation of the transistors. For this reason, the dielectric liquid is preferred. However,
the liquid may require either to be regularly refilled or sealed, which is inconvenient,
makes it an uncommon way for cooling computers, while it is the routine method of
cooling large power distribution components such as transformers.
The microchannel was introduced by Tuckerman and Pease in 1981 [19]. Since
the heat transfer efficiency can be greatly increased by decreasing the passage size,
which results in a larger surface-area-to-volume ratio, the microchannels are usually
made as small as possible. Tuckerman and Pease tested their optimum sized
michrochannel, and found that a heated device could dissipate heat flux as high as
790W/cm2, with only a 71 °C temperature rise. However, the high power consumption
of pumps and valves, and the increased pressure loss in the microchannel passages, as
well as the micro fabrication challenge, attenuate the benefits of this great invention
[15].
Droplet based thermal management, including spray cooling and electro-wetting
cooling, enables precise droplet feeding to the designed area, and has the potential to
create a more uniform temperature distribution. Kim [12] gave a review regarding the
mechanism for spray cooling, and the effects of non-condensable gas, surface
enhancement, spray inclination and gravity. Horacek et al. [13] measured wall heat
3
transfer during spray cooling. The length of the contact line was shown to correlate
with wall heat flux rather than the surface wetted area. Yang et al. [11] suggested that
heat flux of 1000 W/cm2 can be achieved using water at low flow rates. Another spray
cooling investigation, using ammonia, by Bostanci et al. [14] showed high Critical
Heat Flux (CHF) with 1100 W/cm2.
Cheng and Chen [15] demonstrated that electrowetting-on-dielectric can cool
down the hot spot surface by more than 40 °C within 2 s. Another work [16]
published by them reported that a hot spot with a heat flux of 27 W/cm2 was rapidly
cooled down by 30 °C. The theoretical and numerical results for digitized heat
transfer investigated by Baird and Mohseni [17] revealed that the enhancement of the
heat transfer coefficient was due to the internal circulation inside of the droplets. They
also summarized that the digitized heat transfer has the capability for active,
on-demand suppression of transient heating on hot spots.
Inadequate coolant feeding frequency by droplet-based thermal management
methods can easily cause periodic flooding. A flooded regime was reported as a
periodic scenario occurring in droplet-based thermal management in Hsieh and Shen’s
work [10, 20]. Due to the favorable superhydrophilic surface used for liquid spreading,
micro-structures worked efficiently in the thin film and partial dryout regimes. For the
flooded regime, Hsieh and Yao [10] claimed that negligible effect on heat transfer
performance can be induced by highly wettable surface textures. The flooded regime,
which occupies about 20% of the total evaporation time [20], comes with boiling
phenomenon which may cause large surface heat flux and surface temperature
oscillations. Thus the heat transfer performance in the flooded regime will
undoubtedly affect the thermal performance of the entire cooling process. However,

4
boiling and evaporation phenomena during flooding were rarely mentioned in former
studies.
Our group [21] has proposed a micro-structure, which combines micro-pillar and
engineered wettability patterns, to investigate the thermal phenomena under flooded
conditions and improve the heat dissipation rate. The work compared the proposed
structure with the flat hydrophilic surface and wettability patterned flat surface, and
found that bubbles formed on the flat surface can hardly generate vertical momentum,
while the proposed bi-philic micro-pillar structure can guide bubbles upwards,
enhance bubble departure rate, and reduce bubble sizes. Additionally, the smoothness
and coherence of the bubble departure were enhanced.
Following our prior work, micro-structures with different pillar heights under a
flooded condition are examined to define the effect of pillar geometry on the thermal
performance. Four wettability patterns combined with the micro-pillar structure are
studied to understand their capability on facilitating bubble departure and thereby
enhancing the heat transfer performance. The bubble’s force and energy analysis are
presented to explain the bubble dynamics.
1.2 Literature Review
Effects of wettability patterning and micro-structure 1.2.1
Surface physicochemical properties, including micro-structure and wettability,
play an important role in boiling heat transfer [22]. One common approach to increase
Heat Transfer Coefficient (HTC) and Critical Heat Flux (CHF) is to modify the
heating surface condition by micro-structure fabrications [23]: (1) Surface
modification by increasing surface roughness. Such modification generally increases
surface wettability, which causes an increased CHF through the enhanced liquid

5
spreading over the heated area. Another effect of the surface modification is to
increase the number of microscale cavities, which serve as the starting sites for
heterogeneous nucleation of liquid for bubble formation; (2) Increasing the effective
heat transfer surface area by thermal fin effect with microfabricated pin-fin structures;
(3) Employing wicking structures to promote the liquid supply to the heated area by
capillary pumping, thereby delaying the dry out.
Chen at el. [23] reported the study on pool boiling of water on Cu/Si made
nanowires. They observed significant enhancement of both critical heat flux and
thermal conductance on nanowires compared with plain surface. The reported CHF
was about 200W/cm2 among the highest value of pool boiling heat transfer. The
enhancement could be attributed to some unique properties of nanowires. First, a
surface coated with nanowires can be superhydrophilic; Second, nanowire arrays
contain many orders of magnitude of cavities and pores compared to other treated
surfaces, thereby effectively increased the nucleation site density and surface
roughness; Third, nanowire arrays may act as efficient wicking structures.
Shen et al. [20] investigated the heated droplet impingement hydrodynamics for
a range of heating levels corresponding to droplet non-boiling and boiling conditions.
Impingement was tested on three types of surfaces: polished silicon, nano-structured
porous silicon, and gold layered polished silicon. The nano-structured surface resulted
in a reduced equilibrium contact angle and a significant reduction in energy
dissipation during the initial impact spreading. They also pointed out that there were
four major stages identified during the total droplet evaporation process, which were
impact, boiling, nearly constant diameter evaporation and dry-out period. The nearly
constant diameter increased with heating for the nano-structured non-boiling and
boiling cases compared with the polished surfaces.
6
Biporous media consisting of large clusters of small particles have been shown to
increase the heat dissipation capacity due to the capillary suction generated by small
pores inside the particle clusters [24]. Coso et al. [25] studied micro structures in
which pores separated microscale pin fins and generated high capillary suction, while
larger microchannels were used to reduce overall flow resistance. Their experimental
data showed that heat fluxes of up to 119.6 (±4.2) W/cm2 can be dissipated in
predominantly evaporation heat transfer. For larger pores and deeper wicks (pore >
16μm and depth >145μm respectively), nucleate boiling regime was observed with
high dryout heat fluxes up to 277.0 (±9.7) W/cm2 for large heaters (~1cm2). For small
heaters of area 0.0625 cm2, high heat flux of up to 733.1 (±103.4) W/cm2 can be
dissipated. The overall HTC was increased with a reduction in pore size and
accompanying increase in surface area.
Since the influence of wettability on boiling is complex: hydrophobic zones
promote nucleation, while the hydrophilicity enhance the CHF, researchers raised
many wettability patterns combining both hydrophobic and hydrophilic coatings to
improve the thermal performance.
Betz et al. [26] demonstrated that smooth and flat surfaces combining
hydrophilic and hydrophobic patterns improve pool boiling performance. They
characterized different networks combining hydrophilic and hydrophobic regions.
Patterning of mixed hydrophilic and hydrophobic areas can improve the CHF and
HTC of a plain hydrophilic surface by 65% and 100%, respectively. Especially,
spaces with hydrophilic networks (patterned with hydrophobic islands) enhance both
CHF and HTC, while surfaces with hydrophobic networks seem to only enhance the
HTC and might even reduce the CHF.
7
In another of their work, Betz et al. [27] characterize pool boiling on surfaces
with wettabilities varied from superhydrophobic to superhydrophilic. The
measurement results showed that the largest HTC were reached not on surfaces with
spatially uniform wettability, but on biphilic surfaces, which juxtaposed hydrophilic
and hydrophobic regions. They manufactured and tested the superbiphilic surfaces,
which showed exceptional performance in pool boiling, combing high CHF over
100W/cm2 with HTC over 100 kW/m2K. They developed an analytical model, which
described how biphilic surfaces effectively manage the vapor and liquid transport,
delaying critical heat flux and maximizing the HTC. Both the analytical modeling and
the experiments showed that the superbiphilic surfaces outperform all other surfaces
in the low superheat regime.
Wang et al. [22] compared bubble formation on the micropattern coated copper
surfaces with the uniform superhydrophobic coating and bare copper surfaces. They
revealed that the micropattern coated copper surfaces had low bubble formation
temperature to 85 °C which was similar to the uniformly coated superhydrophobic
surfaces, whereas that of the bare copper surface stuck to around 124 °C with
considerable super heat. Moreover, the superhydrophobic micropatterns controlled the
nucleation sites, bubble shapes and growth rates, and prevented formation of a
continuous vapor film which was likely developed on a uniform hydrophobic coating.
VOF and mass transfer model in phase change investigations 1.2.2
The VOF model can model two or more immiscible fluids by solving a single set
of momentum equations and tracking the volume fraction of each of the fluids
throughout the domain. It is widely used for the prediction of jet breakup, the motion
8
of bubbles in a liquid, the motion of liquid after a dam break, and the steady or
transient tracking of any liquid-gas interface.
Yang et al. [28] investigated the boiling flow of R141B in a horizontal coiled
tube. A numerical simulation, using the VOF method and the corresponding
experiments were conducted. The comparison indicated that the phase distribution in
various cases predicted by the simulations were consistent with the phenomenon
observed in the experiments. The flow velocity showed a strong dependence on the
phase distribution. Yang et al pointed out that, in bubbly flow vapor phase flowed
with liquid phase, with little velocity differences between two phases, whereas in
stratified flow vapor phase flowed much faster than the liquid phase, caused
significant wave of the phase interface.
Chen et al. [29] numerically simulated the vapor-venting process in 3D in a
rectangular microchannel with a hydrophobic porous membrane bounded on one side
for phase-seperation. The simulation was based on the VOF method, and showed the
vapor-venting mechanism can effectively mitigate the vapor accumulation issue,
reduce the pressure drop, and suppress the local dry-out inside the microchannel. The
pressure surge was also observed in the vapor-venting channel. Their simulation
provided some insight into the design and optimization of vapor-venting heat
exchangers.
A numerical investigation on bubble behavior in subcooled flow boiling of water
under the effect of additional inertial forces has been performed by Wei et al. [30]
based on the VOF method. The simulations were carried out on upward water flow in
a vertical, rectangular duct with single side heating surface. It was pointed out by
them that the centrifugal force and tangential inertia force generated by swing were
negligible. But the fluctuation of mass flow rate caused by swing motion affected the
9
hydrodynamic pressure force, drag force and shear lift force significantly, which
would affect bubble sliding and detachment, and change the heat transfer near the
heated wall eventually. The pressure drop under the swing conditions was larger than
that under the motionless condition. The pressure drop of boiling flow fluctuated
around that of the single phase flow, and the amplitude of fluctuation increased with
the wall heat flux.
Mass transfer is one of the most significant parts of the numerical model.
Schrage proposed a theory for evaporation at liquid-vapor interfaces in which the net
mass flux across the interface is given by [31]
𝑚′′ =2𝜀
2 − 𝜀√
𝑀
2𝜋𝑅(
𝑃𝑔_𝑙𝑔
√𝑇𝑔_𝑙𝑔
−𝑃𝑠𝑎𝑡
√𝑇𝑙𝑔
) (1)
Eq. (1) is also called Hertz-Knudsen-Schrage Equation [32] or
Kucherov-Rikenglaz Equation [32-34]. It is derived based on the Maxwell velocity
distribution, the detailed derivation can be found in Dr. Carey’s book [33] (page
135-140). Lee [35] further assumed the phase change occurs at a constant pressure
and at a quasi thermo-equilibrium state. Under Lee’s assumption, Clausius-Clapeyron
equation can be applied to Hertz-Knudsen Equation to eliminate pressure and result in
a new form which is mainly dependent of the saturation temperature and the
relaxation time coefficient. It is stated in ANSYS FLUENT Theory Guide (on page
16-104) that the relaxation time coefficient needs to be tuned. An analysis of
evaporation coefficient and condensation coefficient of water has been studied by
Marek et al. [32]. They proved that evaporation and condensation coefficient of water
obtained theoretically and experimentally rather scatter in a range of more than two
decades with the condensation coefficient exceeding the evaporation coefficient, and
both coefficients decrease with increasing temperature and increasing pressure,
10
whereas the relaxation time for both liquid and gas were adopted as 100 s-1 in Yang
[28], Chen [29], and Wei’s [30] work. Yang et al. pointed out that excessively large
value of the relaxation time coefficient causes a numerical convergence problem,
while too small values lead to a significant deviation between the interfacial
temperature and the saturation temperature. Since the Clausius-Clapeyron equation
was applied in the derivation of the mass source term, which requires a small
temperature difference, large temperature deviation will invalid the accurateness of
the mass source term. The value of both evaporation and condensation coefficient are
adopted as 100 s-1 in this work. The reason for the value of the coefficients and
relative derivation will be discussed in the part of mass transfer in Chapter 3.
11
Chapter 2 NUCLEATION STUDY
2.1 Types of nucleation
Homogeneous nucleation 2.1.1
Bubble nucleation completely within a superheated uniform liquid without any
preferential nucleation sites is called homogeneous nucleation. The same term can
also be used to describe droplet formation completely within supercooled vapor.
Homogeneous nucleation occurs spontaneously and randomly, but it requires
superheating of the medium. Compared to heterogeneous nucleation, homogeneous
nucleation occurs with much more difficulty in the interior of a substance. Pure
liquids that have been thoroughly degassed may still experience bubble formation at
molecular vapor clusters within the bulk liquid.
Heterogeneous nucleation 2.1.2
Heterogeneous nucleation occurs much more often than homogeneous nucleation.
Heterogeneous nucleation forms at preferential sites such as phase boundaries, surface
of containers, impurities like dust, and minute bubbles, which are either from
non-condensable gas or entrapped in micro cavities. At such preferential sites, the
effective surface energy is lower, thus diminishes the free energy barrier and
facilitating nucleation. Compared with homogeneous nucleation, heterogeneous
nucleation is by far the common process at the low superheat due to the larger
required superheat for homogeneous nucleation.
12
2.2 Nucleation analysis
Most of the time, since the temperature is highest at the solid surface, formation
of a vapor embryo is most likely to occur at the solid-liquid interface, with one
possibility of homogeneous nucleation within the liquid closest to the solid surface,
and the alternative of formation of a vapor embryo as a heterogeneous nucleation
process. The possibilities have been studied as flowing from both homogeneous and
heterogeneous points of view.
Based on the assumption that the temperature and chemical potential in the two
phases must be equal at equilibrium, using the Gibbs-Duhem equation, ideal gas law,
and Young-Laplace equation, the radius of a stable bubble 𝑟𝑒 has been derived as
follows [33]
𝑟𝑒 =2𝜍
𝑃𝑠𝑎𝑡(𝑇𝑙) 𝑒𝑥𝑝 (𝑣𝑙(𝑃𝑙 − 𝑃𝑠𝑎𝑡(𝑇𝑙))
𝑅𝑇𝑙) − 𝑃𝑙
(2)
where 𝑣𝑙 is the inverse of density for liquid.
The pressure of liquid is atmospheric in this work, whereas the saturation
pressure of liquid changes with the liquid temperature. By substituting a sequence of
reliable data [33] into this equation, a curve has been plotted showing the radius
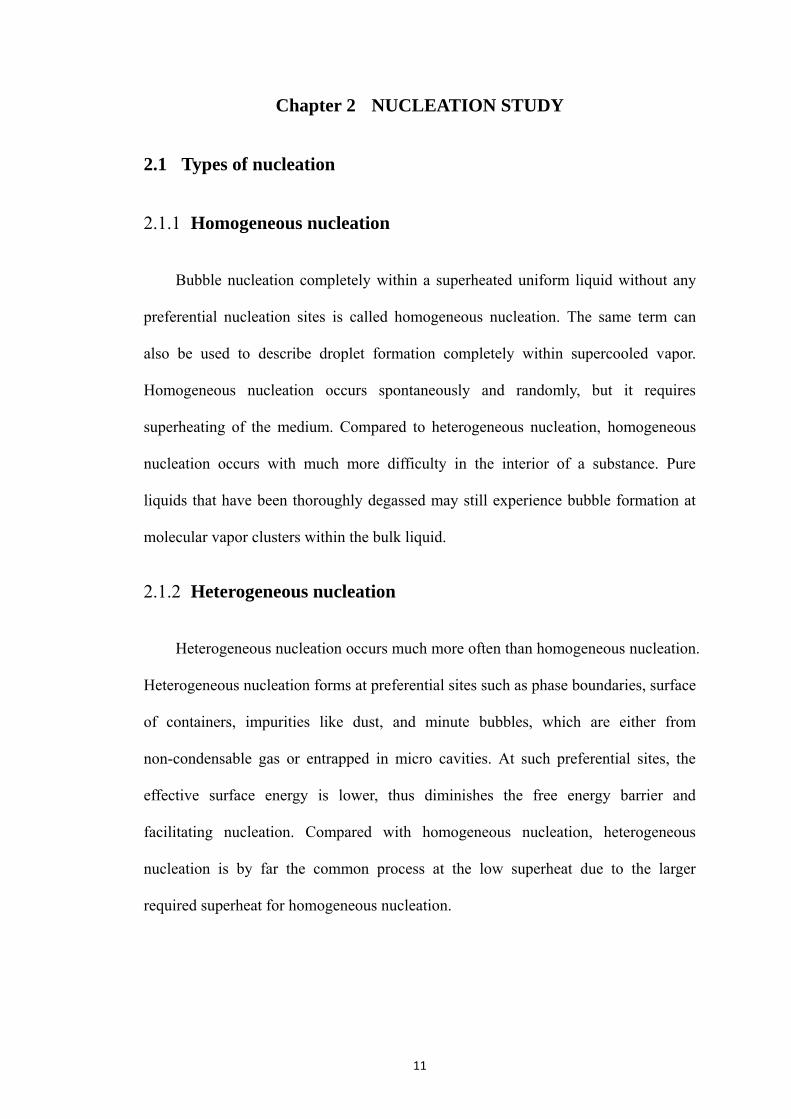
changing with superheat of the liquid. It can be seen from the figure that when the
superheat is small, the radius of a stable bubble is very large. Especially, if 𝑃𝑙 equals
to 𝑃𝑠𝑎𝑡, the radius will be infinity, which means all the liquid will evaporate. Since
the film thickness is small which is about micrometers, large bubble is impossible to
be formed. Moreover, the reasonable radius in accordance with the film thickness
requires high superheat.
13
On the other hand, the non-condensable gas and mini bubbles trapped in the
micro-structure supply the preferential nucleation sites for the heterogeneous
nucleation. Accordingly, water nearby the mini bubble embryo evaporate and lead to
bubble growing.
Fig. 1 Bubble equilibrium radius changes with superheat
Generally, since homogeneous nucleation requires a higher superheat than the
heterogeneous nucleation, and the water pressure in this work is atmospheric pressure
which confines the superheat, the nucleation sites in this work result from the
non-condensable minute bubbles near the solid substrate.
14
Chapter 3 NUMERICAL MODELING
3.1 Computational domain and flooding scenario
The computational domain, composed of solid, liquid and gas parts, is shown in
Fig. 2 as is the flooding scenario. The solid material and working fluid are aluminum
and water, respectively. The length, width, and height are denoted by “L”, “W”, and
“H”, respectively. The subscripts “s”, “l”, “g”, and “p” represent solid, liquid, gas, and
pillar. “H”, without any subscript, is the height of the entire domain. The flooded
condition requires Hl > Hp, which means the pillars are fully immersed by the working
liquid. The four vertical boundaries in the 3-D domain are considered to be periodic in
order to practically enable the limited computational domain to work as a horizontally
extensive domain. A constant heat flux is given to the bottom surface of the solid as
the heat source. In this work, we focus on the confined domain when the flooding
condition occurs, thus the vapor which flows out of the computational domain is
assumed to be removed quickly. Air with a constant temperature of 373.15 K is set at
the outlet. Microstructures covered by four types of wettability patterns are done
separately in this work, the geometry and wettability patterns are listed in Tab. 1.

15
Fig. 2 Computational domain and flooding scenario
Tab. 1 Geometry details and wettability patterns of the simulation
Length unit: μm Hs Hl Hg W L Pillar
size
Gap between
two pillars
Pillar heights and wettability patterns
Structure effect on thermal
performance
5 10 15 30 30 3 × 3 3
Pillar height for the hydrophilic flat surface: 0; Pillar heights for the hydrophobic patched cases: 0, 3, 5, 7, 9; The contact angles of hydrophilic and hydrophobic area are 5° and 108°, respectively.
Wettability pattern effect
on bubble dynamic behavior
1 12 12 30 30 3 × 3 3
Pillar heights are 8 for all the four cases, wettability patterns are: 1. Wholly hydrophilic 2. Wettability gradient from 5° to 55° 3. Wettability gradient from 5° to 110° 4. Top patched with hydrophobic 110°

16
3.2 Governing equations
Volume of fluid method 3.2.1
The transient, three-dimensional Volume of Fluid (VOF) model is used, which
has the capability of tracking the liquid-vapor interface and bubble trajectories
continuously for the visualization of multi-bubble dynamics. A scalar field
representing the portion of a phase volume occupation in a certain computational cell
is defined as the phase volume fraction, which is denoted by 𝛼 in this thesis. The
liquid and gas phase volume fractions sum to unity,
𝛼𝑙 + 𝛼𝑔 = 1 (3)
The cell represents a liquid region if 𝛼𝑔= 0 and a gas region if 𝛼𝑔= 1. The
relation 0 < 𝛼𝑔 < 1 indicates that the cell contains both liquid and gas phases. The
mixed properties for each cell, such as density, viscosity and thermal conductivity can
be averaged by:
𝜌 = 𝛼𝑙𝜌𝑙 + 𝛼𝑔𝜌𝑔 (4 − 1)
𝜇 = 𝛼𝑙𝜇𝑙 + 𝛼𝑔𝜇𝑔 (4 − 2)
𝑘 = 𝛼𝑙𝑘𝑙 + 𝛼𝑔𝑘𝑔 (4 − 3)
By introducing the phase volume fraction, the continuity equation, momentum
equation, and energy equation can be modified. The tracking of the interfaces between
the phases is accomplished by the solution of the continuity equations for the volume
fraction of the phases:
𝜕𝛼𝑙
𝜕𝑡+ 𝛻 ∙ (𝑣 𝛼𝑙) =
��𝑔→𝑙
𝜌𝑙 (5 − 1)
𝜕𝛼𝑔
𝜕𝑡+ 𝛻 ∙ (𝑣 𝛼𝑔) =
��𝑙→𝑔
𝜌𝑔 (5 − 2)
17
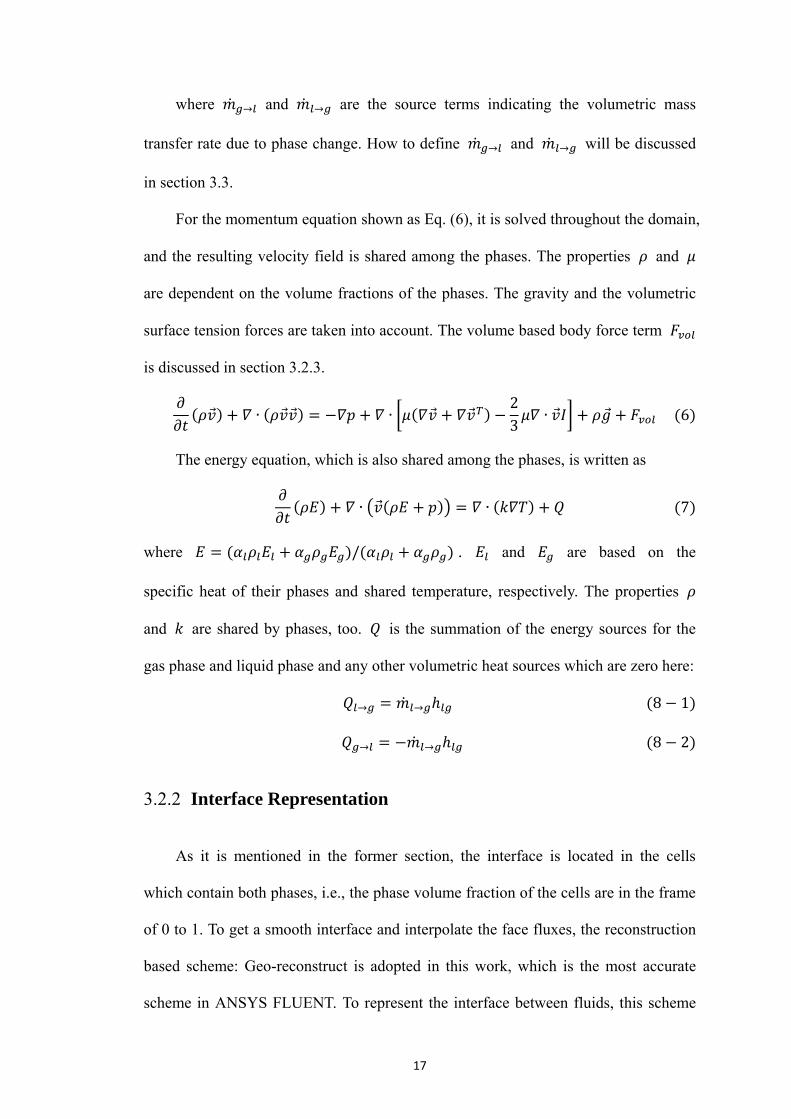
where ��𝑔→𝑙 and ��𝑙→𝑔 are the source terms indicating the volumetric mass
transfer rate due to phase change. How to define ��𝑔→𝑙 and ��𝑙→𝑔 will be discussed
in section 3.3.
For the momentum equation shown as Eq. (6), it is solved throughout the domain,
and the resulting velocity field is shared among the phases. The properties 𝜌 and 𝜇
are dependent on the volume fractions of the phases. The gravity and the volumetric
surface tension forces are taken into account. The volume based body force term 𝐹𝑣𝑜𝑙
is discussed in section 3.2.3.
𝜕
𝜕𝑡(𝜌𝑣 ) + 𝛻 ∙ (𝜌𝑣 𝑣 ) = −𝛻𝑝 + 𝛻 ∙ [𝜇(𝛻𝑣 + 𝛻𝑣 𝑇) −
2
3𝜇𝛻 ∙ 𝑣 𝐼] + 𝜌𝑔 + 𝐹𝑣𝑜𝑙 (6)
The energy equation, which is also shared among the phases, is written as
𝜕
𝜕𝑡(𝜌𝐸) + 𝛻 ∙ (𝑣 (𝜌𝐸 + 𝑝)) = 𝛻 ∙ (𝑘𝛻𝑇) + 𝑄 (7)
where 𝐸 = (𝛼𝑙𝜌𝑙𝐸𝑙 + 𝛼𝑔𝜌𝑔𝐸𝑔)/(𝛼𝑙𝜌𝑙 + 𝛼𝑔𝜌𝑔) . 𝐸𝑙 and 𝐸𝑔 are based on the
specific heat of their phases and shared temperature, respectively. The properties 𝜌
and 𝑘 are shared by phases, too. 𝑄 is the summation of the energy sources for the
gas phase and liquid phase and any other volumetric heat sources which are zero here:
𝑄𝑙→𝑔 = ��𝑙→𝑔ℎ𝑙𝑔 (8 − 1)
𝑄𝑔→𝑙 = −��𝑙→𝑔ℎ𝑙𝑔 (8 − 2)
Interface Representation 3.2.2
As it is mentioned in the former section, the interface is located in the cells
which contain both phases, i.e., the phase volume fraction of the cells are in the frame
of 0 to 1. To get a smooth interface and interpolate the face fluxes, the reconstruction
based scheme: Geo-reconstruct is adopted in this work, which is the most accurate
scheme in ANSYS FLUENT. To represent the interface between fluids, this scheme
18
applies a piecewise-linear approach to the cells that lie near the interphase between
two phases. It assumes that the interface between two fluids has a linear slope within
each cell, and uses this linear shape for calculation of the advection of fluid through
the cell faces [36].
There are three steps in the reconstruction scheme: the first step is calculating the
position of the linear interface relative to the center of each partially-filled cell, based
on information about the volume fraction and its derivatives in the cell. The second
step is calculating the advecting amount of fluid through each face using the
computed linear interface representation and information about the normal and
tangential velocity distribution on the face. The third step is calculating the volume
fraction in each cell using the balance of fluxes calculated during the previous step.
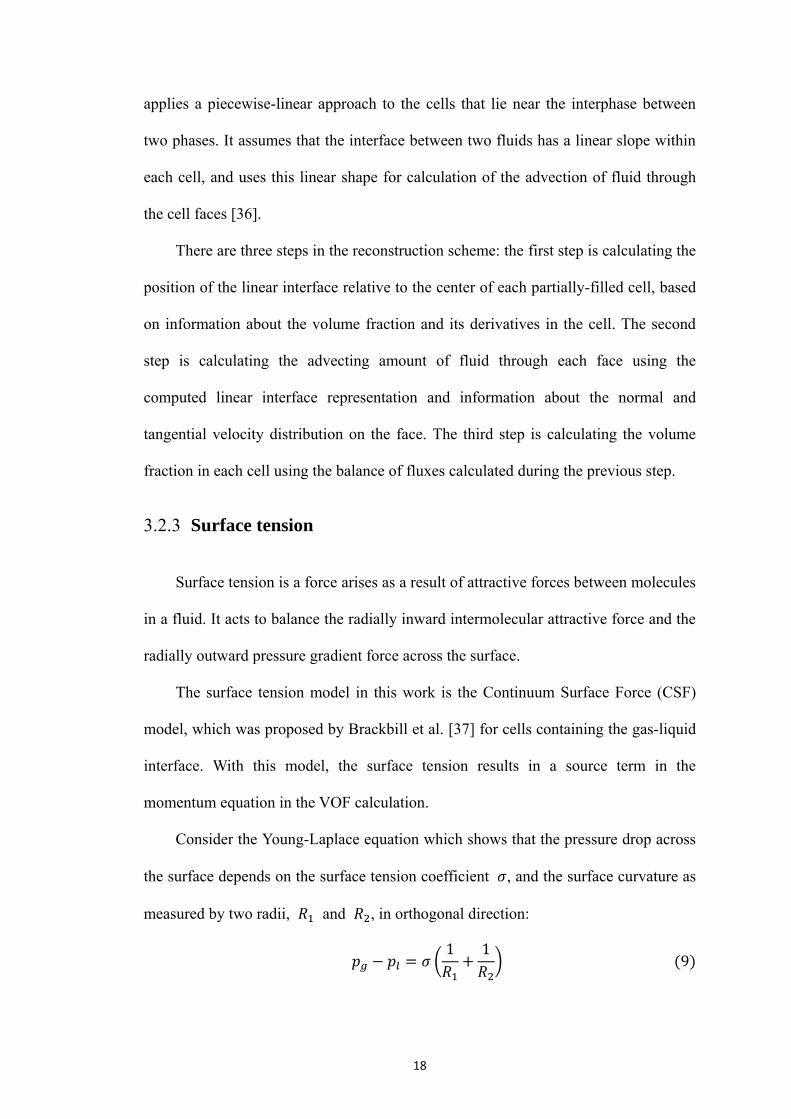
Surface tension 3.2.3
Surface tension is a force arises as a result of attractive forces between molecules
in a fluid. It acts to balance the radially inward intermolecular attractive force and the
radially outward pressure gradient force across the surface.
The surface tension model in this work is the Continuum Surface Force (CSF)
model, which was proposed by Brackbill et al. [37] for cells containing the gas-liquid
interface. With this model, the surface tension results in a source term in the
momentum equation in the VOF calculation.
Consider the Young-Laplace equation which shows that the pressure drop across
the surface depends on the surface tension coefficient 𝜍, and the surface curvature as
measured by two radii, 𝑅1 and 𝑅2, in orthogonal direction:
𝑝𝑔 − 𝑝𝑙 = 𝜍 (1
𝑅1+
1
𝑅2* (9)

19
where the pressure 𝑝𝑔 and 𝑝𝑙 are the pressure on either side of the liquid-gas
interface.
In the CSF model, the surface curvature is computed from local gradient in the
surface normal at the interface. The surface normal �� can be defined as the gradient
of 𝛼 in the relative phase.
�� = 𝛻𝛼 (10)
The curvature is defined in terms of the divergence of the unit normal
𝜅 = 𝛻 ∙ �� (11)
where
�� =��
|𝑛| (12)
The surface tension can be written in term of the pressure jump across the
surface. By using the divergence theorem, the force at the surface can be expressed as
a volume force, acting as a source term in the momentum equation with the following
form:
𝐹𝑣𝑜𝑙 = 𝜍𝛼𝑙𝜌𝑙𝜅𝑔𝛻𝛼𝑔 + 𝛼𝑔𝜌𝑔𝜅𝑙𝛻𝛼𝑙
12(𝜌𝑙 + 𝜌𝑔)
(13)
Since only two phases are present in a cell in this work, 𝜅𝑙 = −𝜅𝑔, and 𝛻𝛼𝑙 = 𝛻𝛼𝑔,
then Eq. (13) simplifies to
𝐹𝑣𝑜𝑙 = 𝜍𝜌𝜅𝑔𝛻𝛼𝑔
12(𝜌𝑙 + 𝜌𝑔)
(14)
or
𝐹𝑣𝑜𝑙 = 𝜍𝜌𝜅𝑙𝛻𝛼𝑙
12(𝜌𝑙 + 𝜌𝑔)
(15)
where 𝜌 is the volume averaged density using Eq. (4-1).
20
Wall adhesion 3.2.4
The model used in this work to specify a wall adhesion angle in conjunction with
the surface tension model is taken from Brackbill’s work [37]. Instead of imposing the
boundary condition at the wall itself, the contact angle is used to adjust the surface
normal in cells near the wall. The according result of the so called dynamic boundary
condition is the adjustment of the curvature of the surface near the wall. If 𝜃𝑤 is the
contact angle, then the surface normal at the live cell next to the wall is
�� = ��𝑤𝑐𝑜𝑠𝜃𝑤 + ��𝑤𝑠𝑖𝑛𝜃𝑤 (16)
where ��𝑤 and ��𝑤 are the unit vectors normal and tangential to the wall, respectively.
The local curvature of the surface is determined by the combination of this
contact angle and the normally calculated surface normal one cell away from the wall.
The body force term is adjusted accordingly by the obtained curvature to implement
the surface tension calculation.
3.3 Mass transfer model
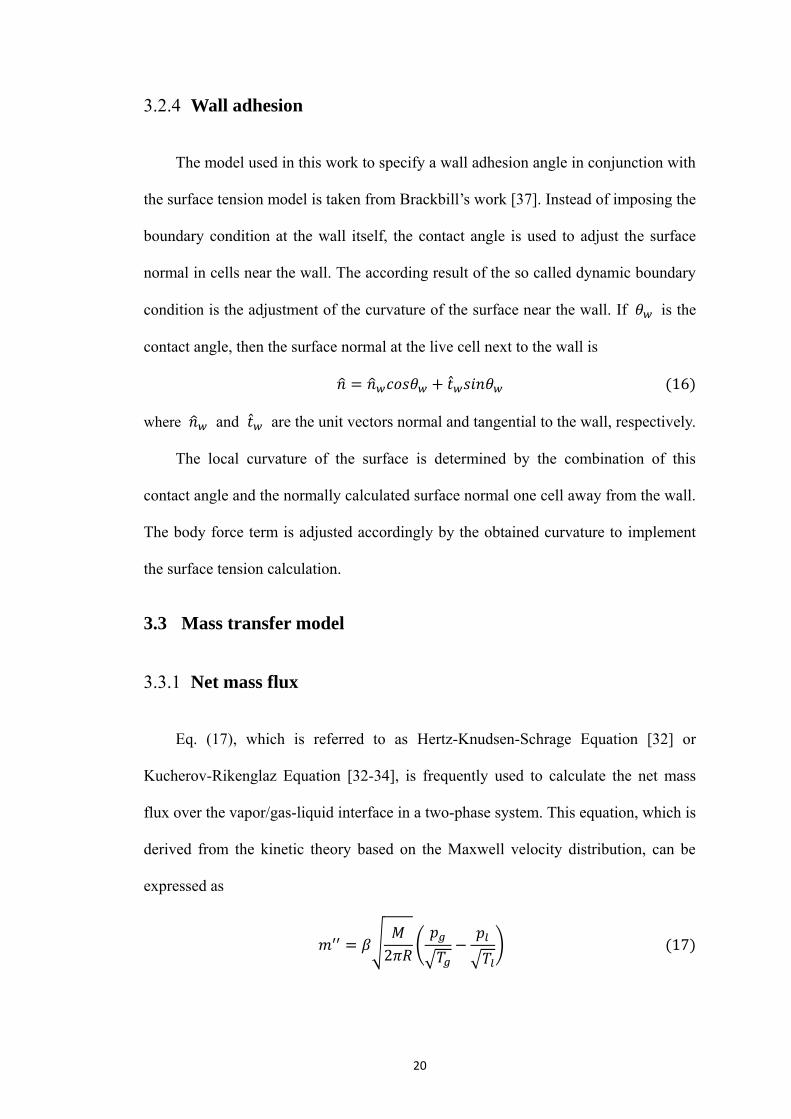
Net mass flux 3.3.1
Eq. (17), which is referred to as Hertz-Knudsen-Schrage Equation [32] or
Kucherov-Rikenglaz Equation [32-34], is frequently used to calculate the net mass
flux over the vapor/gas-liquid interface in a two-phase system. This equation, which is
derived from the kinetic theory based on the Maxwell velocity distribution, can be
expressed as
𝑚′′ = 𝛽√𝑀
2𝜋𝑅(
𝑝𝑔
√𝑇𝑔−
𝑝𝑙
√𝑇𝑙
) (17)

21
in which the subscriptions “g” and “l” represent gas and liquid phases. Eq. (17) can
also be written as Eq. (1), which deems the liquid-gas interface saturated and the gas
temperature and pressure is measured in the gas phase near the liquid-gas interface.
β can be expressed as
𝛽 =2𝜀
2 − 𝜀 (18)
The ε is derived from the vaporization coefficient ε𝑒 and the condensation
coefficient ε𝑐. ε𝑒 is defined as the portion of liquid molecules going to the vapor/gas
side due to vaporization . The remaining fraction 1 − ε𝑒 is due to the “reflection” of
vapor molecules that strike the interface but do not condense. The fraction ε𝑐 is the
fraction of molecules crossing the surface towards liquid that condense and are not
“reflected”. Usually ε𝑒 and ε𝑐 are assumed to be equal, although the validity of this
assumption is suspect [33]. As a result, ε𝑒 = ε𝑐 = ε, where ε is often referred to as
vaporization, evaporation, condensation, or accommodation coefficient.
Assuming the interface temperature to be equal to the vapor temperature near the
interface [38, 39], Eq. (1) becomes
𝑚′′ = 𝛽√𝑀
2𝜋𝑅𝑇𝑠𝑎𝑡(𝑝𝑔_𝑙𝑔 − 𝑝𝑠𝑎𝑡) (19)
The Clapeyron-Clausius equation as shown in Eq. (20) relates the pressure to the
temperature for the saturation condition.
𝑑𝑝
𝑑𝑇=
ℎ𝑙𝑔
𝑇(𝑣𝑔 − 𝑣𝑙) (20)
𝑣𝑔 and 𝑣𝑙 are the inverse of the density for the gas and liquid, respectively. ℎ𝑙𝑔 is
the latent heat. Based on the Clapeyron-Clausius equation, the variation of
temperature can be obtained from variation of pressure close to the saturation
temperature.
22
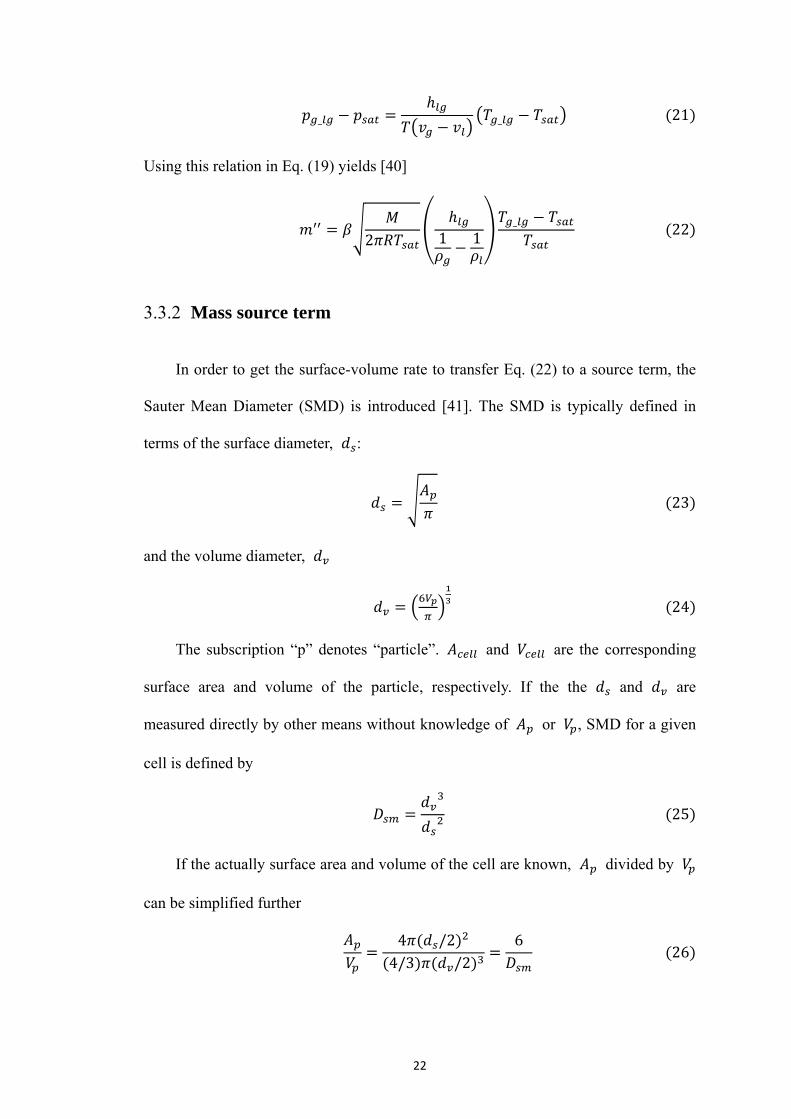
𝑝𝑔_𝑙𝑔 − 𝑝𝑠𝑎𝑡 =ℎ𝑙𝑔
𝑇(𝑣𝑔 − 𝑣𝑙)(𝑇𝑔_𝑙𝑔 − 𝑇𝑠𝑎𝑡) (21)
Using this relation in Eq. (19) yields [40]
𝑚′′ = 𝛽√𝑀
2𝜋𝑅𝑇𝑠𝑎𝑡(
ℎ𝑙𝑔
1𝜌𝑔
−1𝜌𝑙
)𝑇𝑔_𝑙𝑔 − 𝑇𝑠𝑎𝑡
𝑇𝑠𝑎𝑡 (22)
Mass source term 3.3.2
In order to get the surface-volume rate to transfer Eq. (22) to a source term, the
Sauter Mean Diameter (SMD) is introduced [41]. The SMD is typically defined in
terms of the surface diameter, 𝑑𝑠:
𝑑𝑠 = √𝐴𝑝
𝜋 (23)
and the volume diameter, 𝑑𝑣
𝑑𝑣 = (6𝑉𝑝
𝜋)
1
3 (24)
The subscription “p” denotes “particle”. 𝐴𝑐𝑒𝑙𝑙 and 𝑉𝑐𝑒𝑙𝑙 are the corresponding
surface area and volume of the particle, respectively. If the the 𝑑𝑠 and 𝑑𝑣 are
measured directly by other means without knowledge of 𝐴𝑝 or 𝑉𝑝, SMD for a given
cell is defined by
𝐷𝑠𝑚 =𝑑𝑣
3
𝑑𝑠2 (25)
If the actually surface area and volume of the cell are known, 𝐴𝑝 divided by 𝑉𝑝
can be simplified further
𝐴𝑝
𝑉𝑝=
4𝜋(𝑑𝑠/2)2
(4/3)𝜋(𝑑𝑣/2)3=
6
𝐷𝑠𝑚 (26)
23
It is assumed in FLUENT that all vapor bubbles have the same diameter, then the
surface-volume rate can be estimated by the 𝐷𝑠𝑚 of the bubbles. Considering the
definition of the phase volume fraction α, we have
𝑉𝑝 = 𝛼𝑉𝑐𝑒𝑙𝑙 (27)
Substitute it back into Eq. (26), yields
𝐴𝑝
𝑉𝑐𝑒𝑙𝑙=
6𝛼
𝐷𝑠𝑚 (28)
Then the mass flux over the liquid vapor interface can be transformed into
volume based mass source terms:
�� = 𝑚′′𝐴𝑝
𝑉𝑐𝑒𝑙𝑙=
6𝛼𝛽
𝐷𝑠𝑚√
𝑀
2𝜋𝑅𝑇𝑠𝑎𝑡(ℎ𝑙𝑔𝜌𝑙𝜌𝑔
𝜌𝑙 − 𝜌𝑔)
𝑇𝑔_𝑙𝑔 − 𝑇𝑠𝑎𝑡
𝑇𝑠𝑎𝑡 (29)
where Ap and Vcell are the bubble surface area and cell volume, respectively.
Relaxation time coefficient 3.3.3
The mass transport in this simulation is implemented using the
evaporation-condensation mechanistic model proposed by Lee [35] in 1979. This
model primarily concerns phase change at a quasi thermo-equilibrium state, and
depends on the temperature difference between local temperature and saturation
temperature. If local temperature is higher than the saturation temperature, the
evaporation and boiling occurs, liquid water mass is transferred to a water vapor
species of gas phase. Otherwise condensation will take place.
The relaxation time coefficients, which are represented by 𝐶𝑙 and 𝐶𝑔 in this
article, were introduced in Lee’s model:
𝐶𝑙 =6𝛽
𝐷𝑠𝑚√
𝑀
2𝜋𝑅𝑇𝑠𝑎𝑡
𝜌𝑣ℎ𝑙𝑔
𝜌𝑙 − 𝜌𝑔 (30 − 1)
24
𝐶𝑔 =6𝛽
𝐷𝑠𝑚√
𝑀
2𝜋𝑅𝑇𝑠𝑎𝑡
𝜌𝑙ℎ𝑙𝑔
𝜌𝑙 − 𝜌𝑔 (30 − 2)
Considering the mass transfer direction and applying Eq. (30) in Eq. (29), the
mass transfer can be simplified and described based on different temperature regimes
as follows
��𝑙→𝑔 = {𝐶𝑙 ∙
𝛼𝑙𝜌𝑙(𝑇𝑙 − 𝑇𝑠𝑎𝑡)
𝑇𝑠𝑎𝑡 𝑇𝑙 > 𝑇𝑠𝑎𝑡
0 𝑇𝑙 ≤ 𝑇𝑠𝑎𝑡
(31 − 1)
��𝑔→𝑙 = {
0 𝑇𝑔 ≥ 𝑇𝑠𝑎𝑡
𝐶𝑔 ∙𝛼𝑔𝜌𝑔(𝑇𝑠𝑎𝑡 − 𝑇𝑔)
𝑇𝑠𝑎𝑡 𝑇𝑔 < 𝑇𝑠𝑎𝑡
(31 − 2)
where m (kg/m3-s) is the mass transfer rate between two phases and is regarded
as the source term in the continuity equation and energy equation; 𝛼 and ρ are the
phase volume fraction and density, respectively. Thus, the source term in the energy
equation can be obtained by multiplying the mass transfer rate by the latent heat.
The mass transfer model described in Eq. (30-31), which was proposed by Lee,
is implemented by FLUENT as the evaporation-condensation model. Since 𝜀 scatters
in a range of more than two decades [32], as well as 𝐷𝑠𝑚 in Eq. (30) is difficult to
determine, it is stated in FLUENT theory guide that the relaxation time coefficient
needs to be fine tuned. Researchers [28-30] usually calibrate 𝐶𝑙 and 𝐶𝑔 using the
experimental results. Yang et al.[28], Chen et al. [42], and Wei et al. [30] used a value
of 100 s-1 for both 𝐶𝑙 and 𝐶𝑔 in their studies. Since there are not any experimental
results reported on this problem, and the value does not affect the trend of the results
which has been proved by the simulations, we use 100 s-1 in this work.
3.4 Species transport model
The species transport equation has the general form:
25
𝜕
𝜕𝑡(𝜌𝑌𝑖) + ∇ ∙ (𝜌𝑣 𝑌𝑖) = −∇ ∙ 𝐽𝑖 + 𝑅𝑖 + 𝑆𝑖 (32)
in which 𝑌𝑖 is the local mass fraction of the ith species, 𝑅𝑖 is the net rate of
production of species i by chemical reaction, and 𝑆𝑖 is the rate of creation by
addition from the dispersed phase plus any user-defined sources. 𝐽𝑖 is the diffusion
flux of species i, which arises due to gradient of concentration and temperature. The
Fick’s law is used to model the mass diffusion in this work, the temperature gradient
is ignored, under which the diffusion flux can be written as:
𝐽𝑖 = −𝜌𝐷𝑖∇𝑌𝑖 (33)
Here 𝐷𝑖 is the mass diffusion coefficient for species i in the mixture.
Eq. (32) needs to be tuned to solve the conservation equation for chemical
species in multiphase flows. For each phase k, the local mass fraction of each species,
𝑌𝑖𝑘, can be predicted through the solution of a convection-diffusion equation for the ith
species. Eq. (32) can be represented in the flowing form when applied to the current
case, which includes two species: water vapor and air in the gas phase, and ignores
the terms R and S.
𝜕
𝜕𝑡(𝜌𝑔𝛼𝑔𝑌𝑣
𝑔) + 𝛻 ∙ (𝜌𝑔𝛼𝑔𝑣 𝑔𝑌𝑣𝑔) = 𝛻 ∙ (𝜌𝑔𝛼𝑔𝐷𝑣,𝑎𝑖𝑟𝛻𝑌𝑣
𝑔) + (��𝑙→𝑔 − ��𝑔→𝑙) (34)
in which α𝑔 is the volume fraction of the gas phase, Y𝑣𝑔 is the mass fraction of the
vapor in the gas phase, 𝐷𝑣,𝑎𝑖𝑟 is a constant mass diffusion coefficient between
species of water vapor and air at saturation temperature, �� is a source term due to
the mass transfer between water vapor in gas phase and liquid phase.
26
3.5 Numerical simulation information
Numerical simulation method 3.5.1
The numerical solutions are obtained with the pressure-based finite volume
scheme using the commercial CFD software ANSYS 14.5 FLUENT. The terms in the
momentum, mass and energy equations are discretized using the second-order upwind
differencing scheme. Pressure-velocity coupling is achieved using the SIMPLE
algorithm. The geometric reconstruction interpolation scheme [43] is used for
interface calculations. The time step, ranging between 1×10⁻⁹ s and 5×10⁻⁸ s, is
variable to ensure the Courant number is smaller than 2. A mesh independent study
has been made and shown in Section 3.5.2. In this work, a medium grid with a
smallest cell size of 0.375 μm and cell number of 322,812 is used, with 8 mesh layers
along the pillar’s side.
Mesh independent study 3.5.2
To ensure the simulation results correct, the mesh independent study has been
done with different cell numbers as 95, 316 for a coarse mesh, 322, 812 for a medium
mesh, 635, 016 for a fine mesh. The mesh overview is shown in Fig. 3, in which the
left column demonstrates the grid of the whole domain, and the right column
illustrates the mesh layers of the pillars by hiding the water and vapor zones.
27
Fig. 3 Mesh overview
28
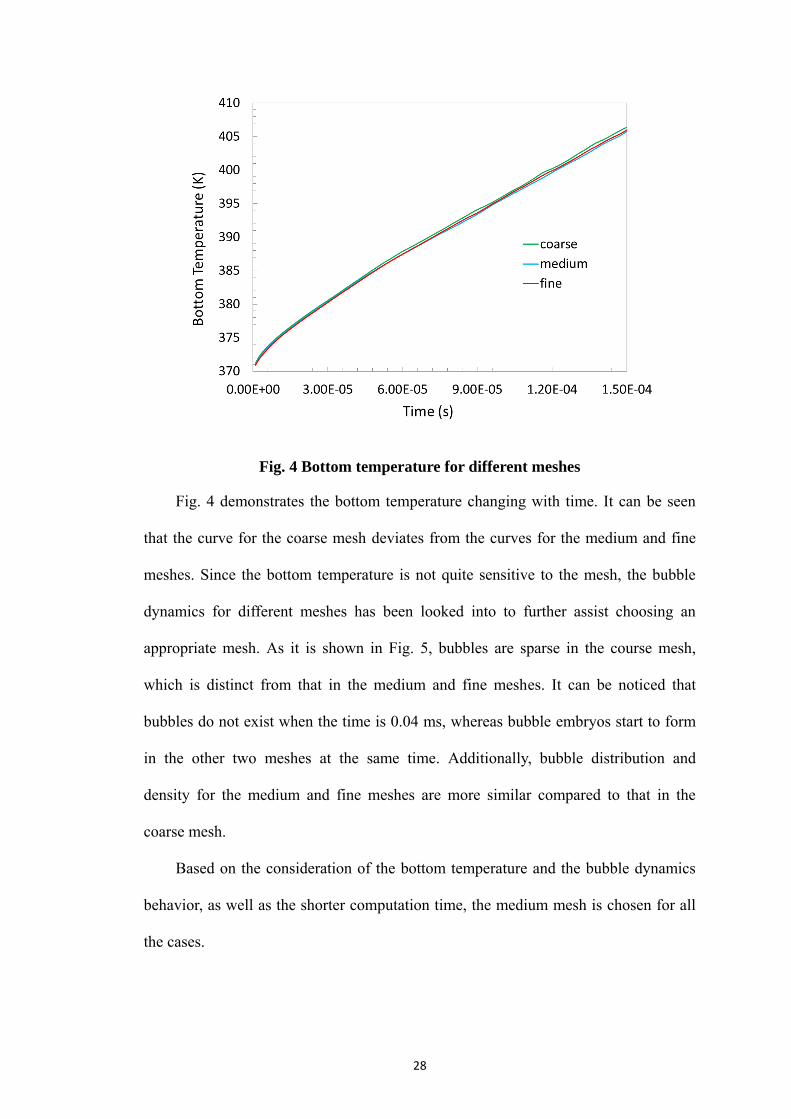
Fig. 4 Bottom temperature for different meshes
Fig. 4 demonstrates the bottom temperature changing with time. It can be seen
that the curve for the coarse mesh deviates from the curves for the medium and fine
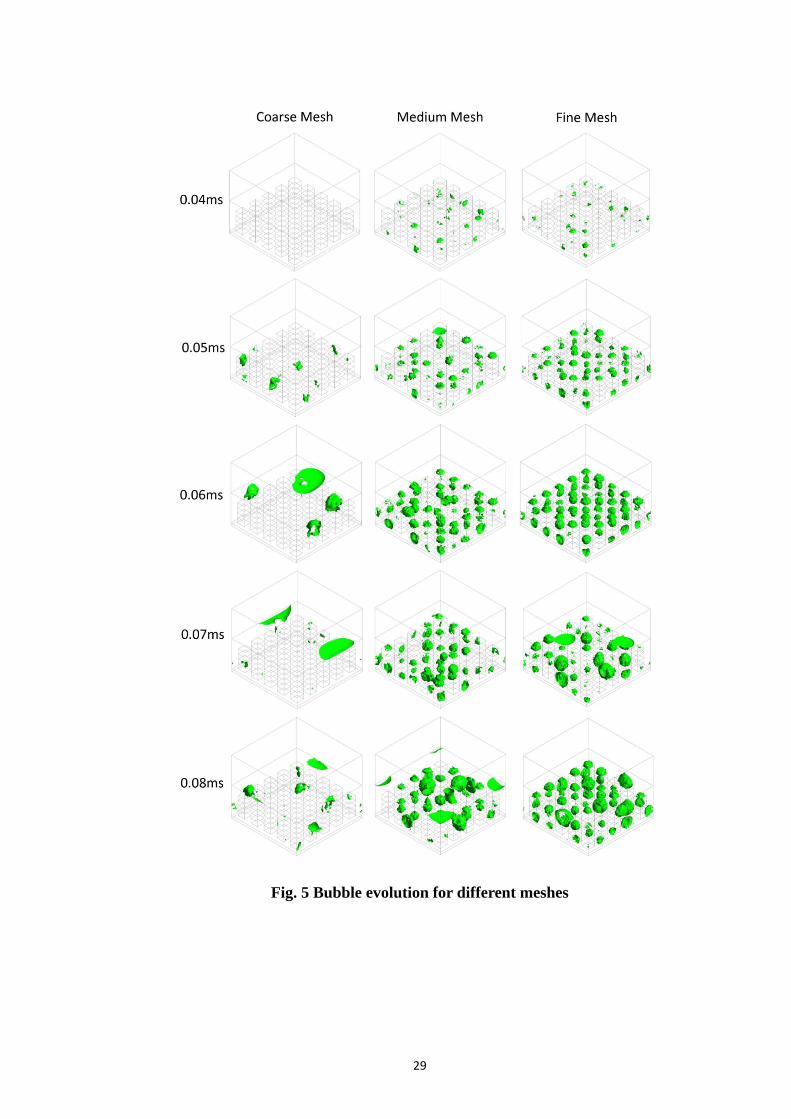
meshes. Since the bottom temperature is not quite sensitive to the mesh, the bubble
dynamics for different meshes has been looked into to further assist choosing an
appropriate mesh. As it is shown in Fig. 5, bubbles are sparse in the course mesh,
which is distinct from that in the medium and fine meshes. It can be noticed that
bubbles do not exist when the time is 0.04 ms, whereas bubble embryos start to form
in the other two meshes at the same time. Additionally, bubble distribution and
density for the medium and fine meshes are more similar compared to that in the
coarse mesh.
Based on the consideration of the bottom temperature and the bubble dynamics
behavior, as well as the shorter computation time, the medium mesh is chosen for all
the cases.
29
Fig. 5 Bubble evolution for different meshes

30
Chapter 4 Results and discussion
4.1 Structure effect and thermal performance
To investigate the pillar height’s effect on the thermal performance of the
micro-structures, we examine pillar height ranges from 3 μm to 9 μm, and utilize both
a hydrophilic flat surface and a patterned flat surface. The dimensions of the
computational domain are H = 30 μm, L = 30 μm and W= 30 μm. The thickness, Hs,
of the solid substrate is 5 μm. The liquid film thickness, Hl, is set to be 10 μm to
ensure the flooding condition. The remaining space is occupied by a vapor-air mixture,
with the height Hg = 15 μm. A constant heat flux of 700 W/cm2 is given to the bottom
surface. The corresponding initial temperature for the whole domain is set to 370 K.
The pillar array arrangement is set as 5 by 5, and the pillar cross-sectional area is
designed as 3 μm by 3 μm, correspondingly. The contact angle of the hydrophilic
substrate is set to be 5°, and 108° for the hydrophobic surface. The outlet of the
computational domain, located on the top of the computational domain, is defined as a
pressure outlet to allow free access for the gas phase mixture containing species of
both water vapor and air. The backflow gas species is defined as dry air at a
temperature of 370 K. The initial species of gas phase is defined as dry air. Fig. 6
displays the configurations of the micro-structures with different pillar heights and a
wholly hydrophilic flat surface.
It is easy to see in Fig. 7 that the flat surface with the wettability patterns has the
lowest heat transfer coefficient, rather than the hydrophilic flat surface. The
hydrophilic flat surface has a 25.6% higher value than the one with wettability
patterns, of which the corresponding value is 251 kW/m2 K. This could be attributed
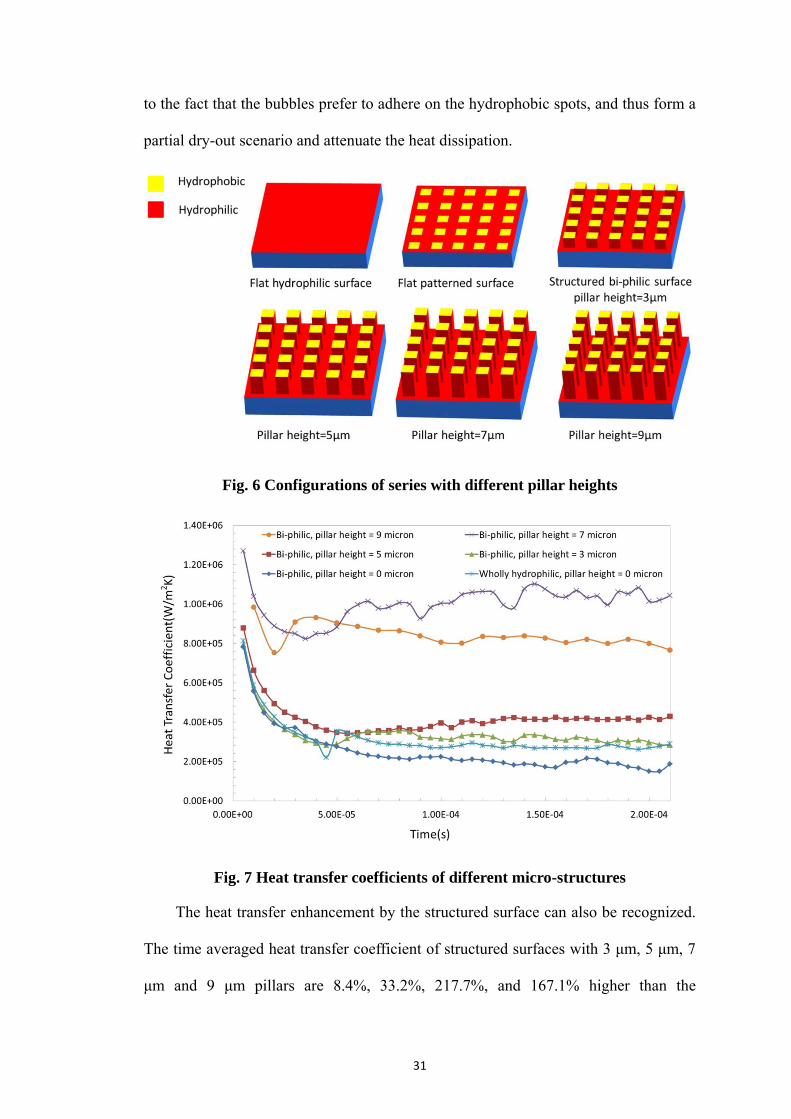
31
to the fact that the bubbles prefer to adhere on the hydrophobic spots, and thus form a
partial dry-out scenario and attenuate the heat dissipation.
Fig. 6 Configurations of series with different pillar heights
Fig. 7 Heat transfer coefficients of different micro-structures
The heat transfer enhancement by the structured surface can also be recognized.
The time averaged heat transfer coefficient of structured surfaces with 3 μm, 5 μm, 7
μm and 9 μm pillars are 8.4%, 33.2%, 217.7%, and 167.1% higher than the
32
hydrophilic flat surface, respectively.. Because of the excellent thermal dissipation
from solid to liquid, relatively smaller temperature gaps between the solid and liquid
can be achieved, thus, the heat transfer coefficient of the structured surfaces with 7
μm and 9 μm pillars are significantly higher than the others, revealing excellent heat
dissipation capacity. However, the averaged heat transfer coefficient does not increase
monotonously with the growth of pillar height. The most remarkable heat transfer
coefficient is obtained from the structure with 7 μm, instead of the 9 μm pillar
structure.
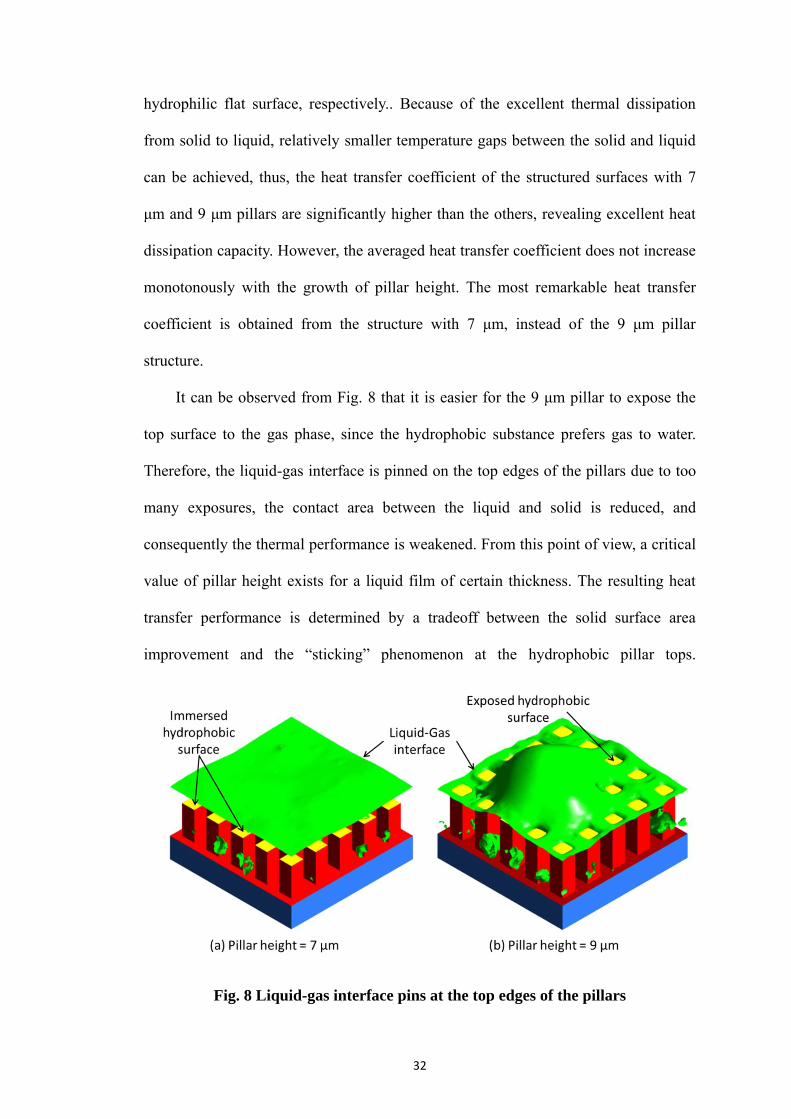
It can be observed from Fig. 8 that it is easier for the 9 μm pillar to expose the
top surface to the gas phase, since the hydrophobic substance prefers gas to water.
Therefore, the liquid-gas interface is pinned on the top edges of the pillars due to too
many exposures, the contact area between the liquid and solid is reduced, and
consequently the thermal performance is weakened. From this point of view, a critical
value of pillar height exists for a liquid film of certain thickness. The resulting heat
transfer performance is determined by a tradeoff between the solid surface area
improvement and the “sticking” phenomenon at the hydrophobic pillar tops.
Fig. 8 Liquid-gas interface pins at the top edges of the pillars
33
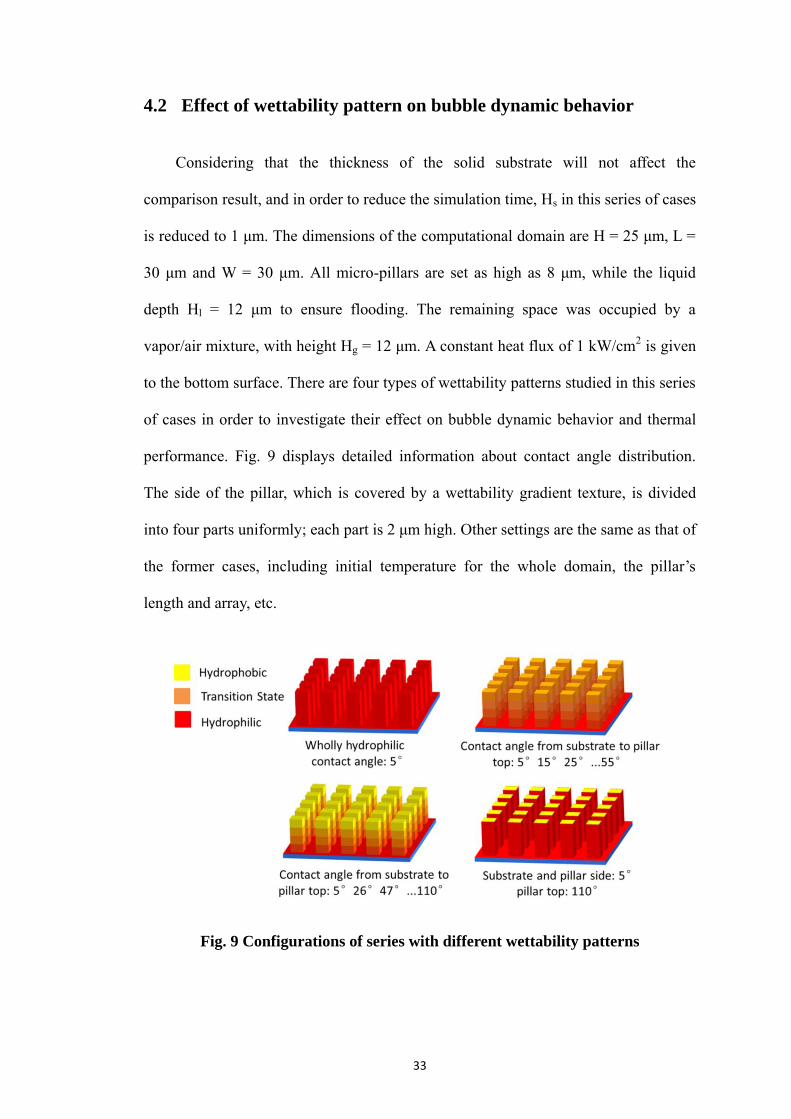
4.2 Effect of wettability pattern on bubble dynamic behavior
Considering that the thickness of the solid substrate will not affect the
comparison result, and in order to reduce the simulation time, Hs in this series of cases
is reduced to 1 μm. The dimensions of the computational domain are H = 25 μm, L =
30 μm and W = 30 μm. All micro-pillars are set as high as 8 μm, while the liquid
depth Hl = 12 μm to ensure flooding. The remaining space was occupied by a
vapor/air mixture, with height Hg = 12 μm. A constant heat flux of 1 kW/cm2 is given
to the bottom surface. There are four types of wettability patterns studied in this series
of cases in order to investigate their effect on bubble dynamic behavior and thermal
performance. Fig. 9 displays detailed information about contact angle distribution.
The side of the pillar, which is covered by a wettability gradient texture, is divided
into four parts uniformly; each part is 2 μm high. Other settings are the same as that of
the former cases, including initial temperature for the whole domain, the pillar’s
length and array, etc.
Fig. 9 Configurations of series with different wettability patterns
34
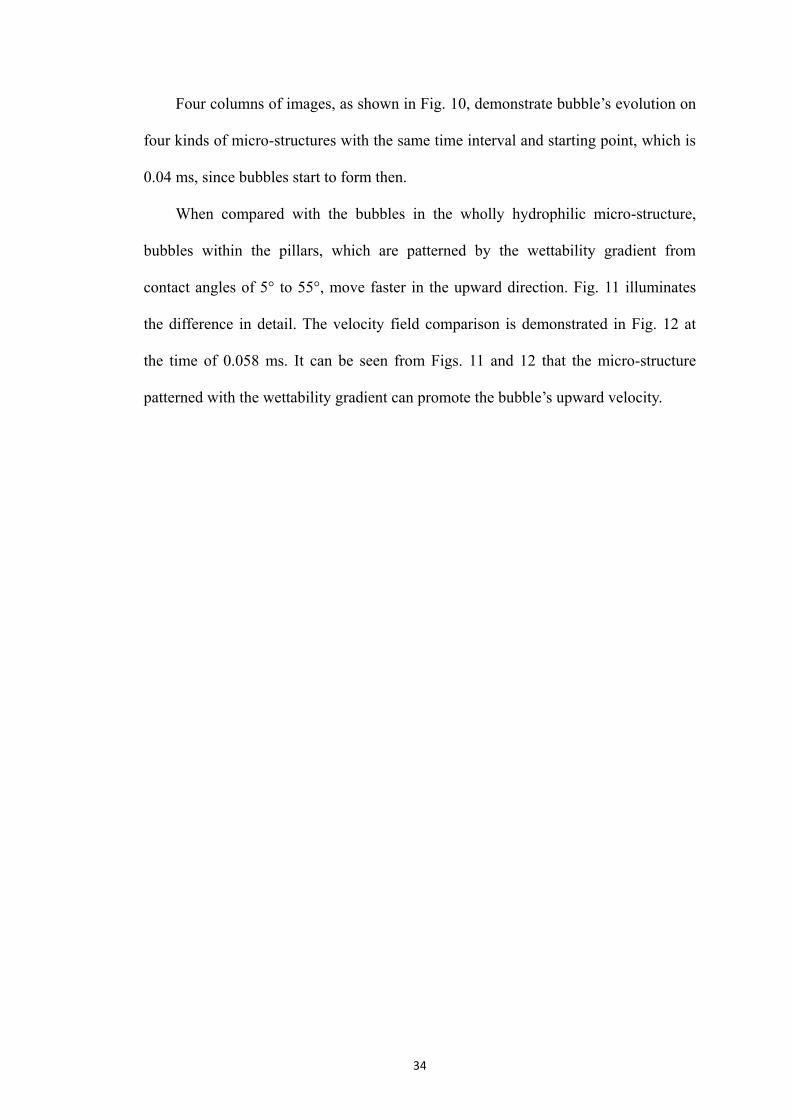
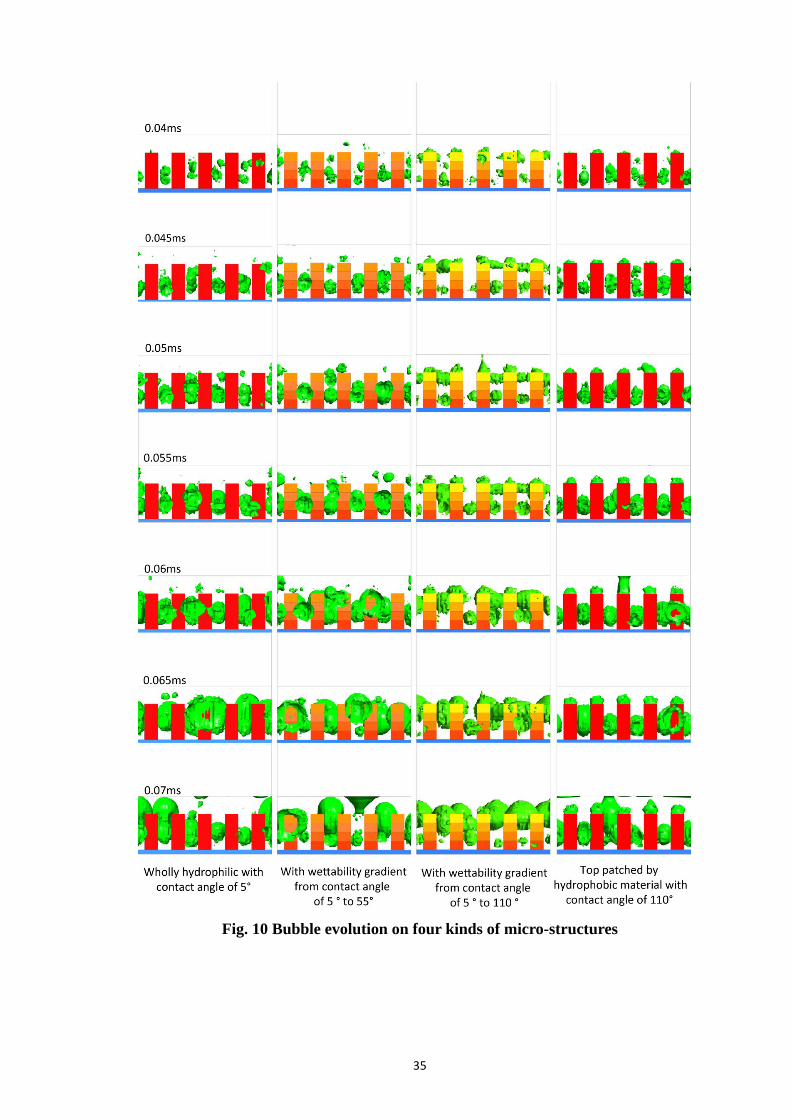
Four columns of images, as shown in Fig. 10, demonstrate bubble’s evolution on
four kinds of micro-structures with the same time interval and starting point, which is
0.04 ms, since bubbles start to form then.
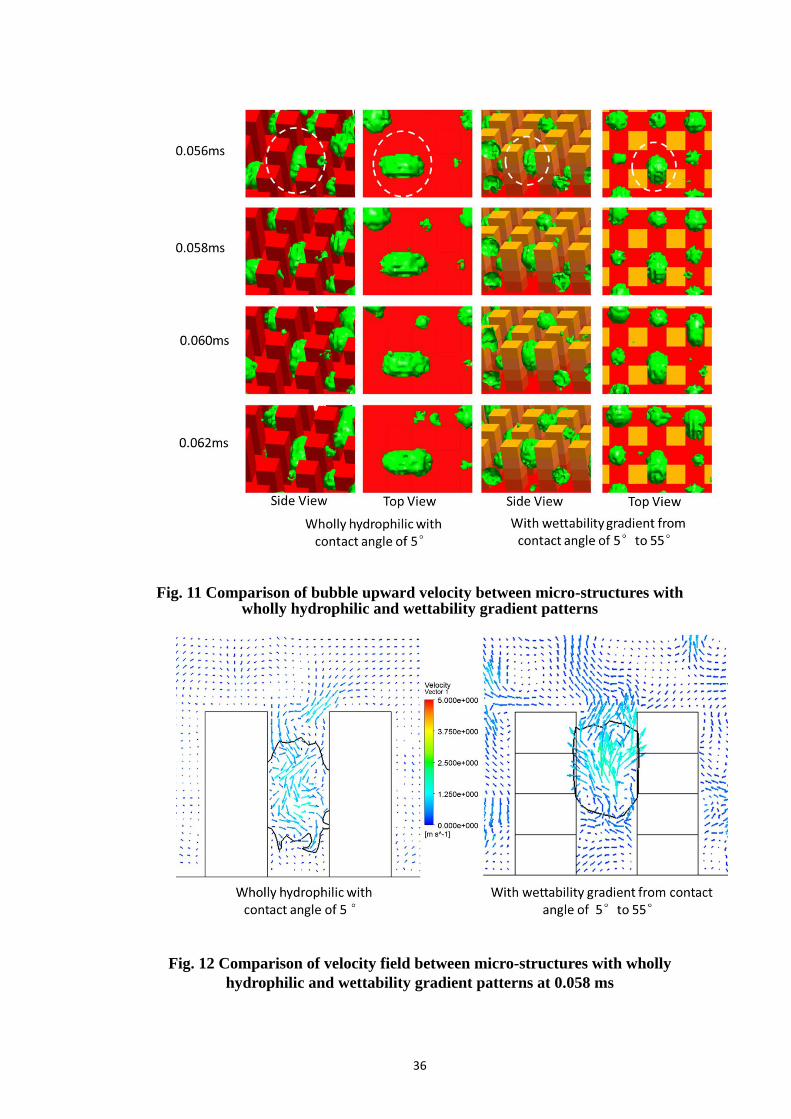
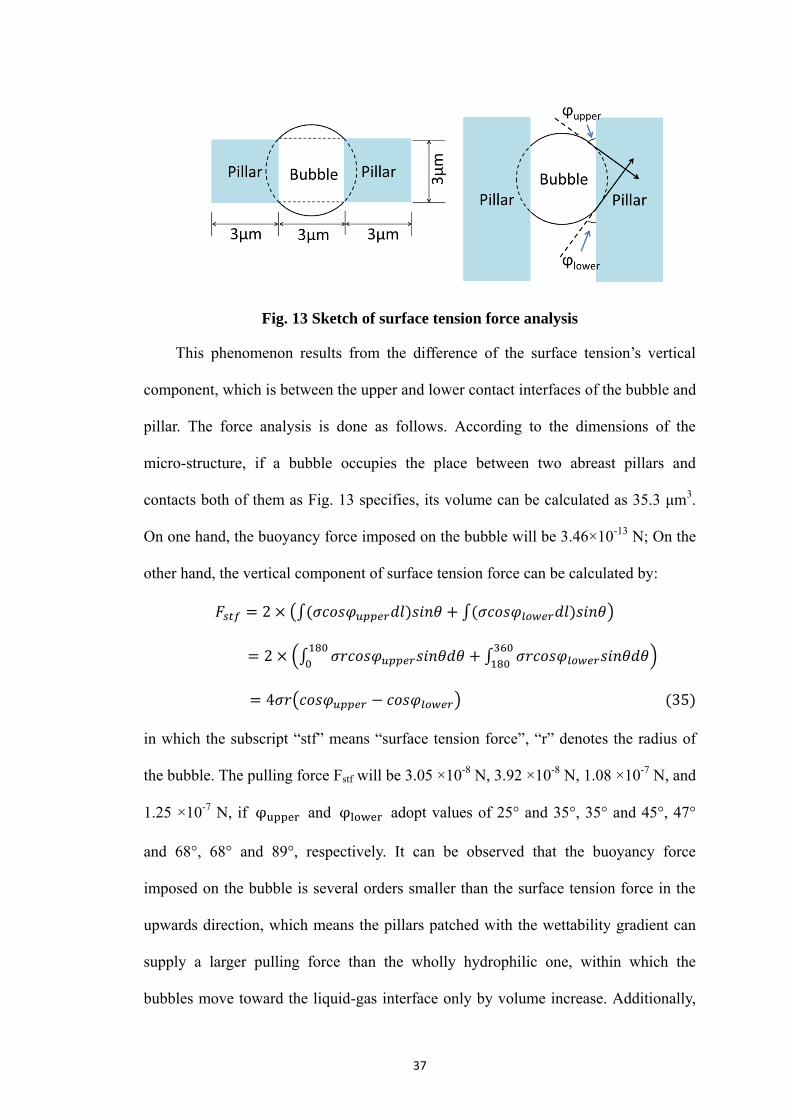
When compared with the bubbles in the wholly hydrophilic micro-structure,
bubbles within the pillars, which are patterned by the wettability gradient from
contact angles of 5° to 55°, move faster in the upward direction. Fig. 11 illuminates
the difference in detail. The velocity field comparison is demonstrated in Fig. 12 at
the time of 0.058 ms. It can be seen from Figs. 11 and 12 that the micro-structure
patterned with the wettability gradient can promote the bubble’s upward velocity.
35
Fig. 10 Bubble evolution on four kinds of micro-structures
36
Fig. 11 Comparison of bubble upward velocity between micro-structures with wholly hydrophilic and wettability gradient patterns
Fig. 12 Comparison of velocity field between micro-structures with wholly
hydrophilic and wettability gradient patterns at 0.058 ms
37
Fig. 13 Sketch of surface tension force analysis
This phenomenon results from the difference of the surface tension’s vertical
component, which is between the upper and lower contact interfaces of the bubble and
pillar. The force analysis is done as follows. According to the dimensions of the
micro-structure, if a bubble occupies the place between two abreast pillars and
contacts both of them as Fig. 13 specifies, its volume can be calculated as 35.3 μm3.
On one hand, the buoyancy force imposed on the bubble will be 3.46×10⁻¹³ N; On the
other hand, the vertical component of surface tension force can be calculated by:
𝐹𝑠𝑡𝑓 = 2 × (∫(𝜍𝑐𝑜𝑠𝜑𝑢𝑝𝑝𝑒𝑟𝑑𝑙)𝑠𝑖𝑛𝜃 + ∫(𝜍𝑐𝑜𝑠𝜑𝑙𝑜𝑤𝑒𝑟𝑑𝑙)𝑠𝑖𝑛𝜃)
= 2 × (∫ 𝜍𝑟𝑐𝑜𝑠𝜑𝑢𝑝𝑝𝑒𝑟𝑠𝑖𝑛𝜃𝑑𝜃180
0+ ∫ 𝜍𝑟𝑐𝑜𝑠𝜑𝑙𝑜𝑤𝑒𝑟𝑠𝑖𝑛𝜃𝑑𝜃
360
180)
= 4𝜍𝑟(𝑐𝑜𝑠𝜑𝑢𝑝𝑝𝑒𝑟 − 𝑐𝑜𝑠𝜑𝑙𝑜𝑤𝑒𝑟) (35)
in which the subscript “stf” means “surface tension force”, “r” denotes the radius of
the bubble. The pulling force Fstf will be 3.05 ×10⁻⁸ N, 3.92 ×10⁻⁸ N, 1.08 ×10⁻⁷ N, and
1.25 ×10⁻⁷ N, if φupper and φlower adopt values of 25° and 35°, 35° and 45°, 47°
and 68°, 68° and 89°, respectively. It can be observed that the buoyancy force
imposed on the bubble is several orders smaller than the surface tension force in the
upwards direction, which means the pillars patched with the wettability gradient can
supply a larger pulling force than the wholly hydrophilic one, within which the
bubbles move toward the liquid-gas interface only by volume increase. Additionally,
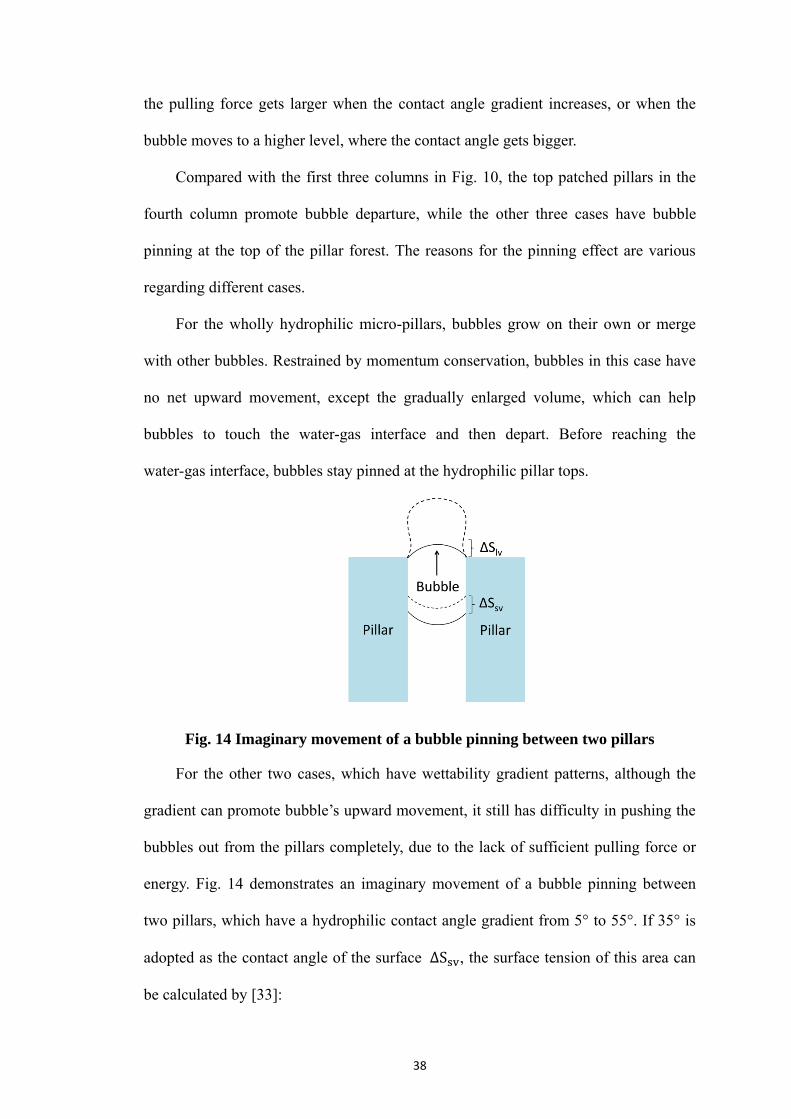
38
the pulling force gets larger when the contact angle gradient increases, or when the
bubble moves to a higher level, where the contact angle gets bigger.
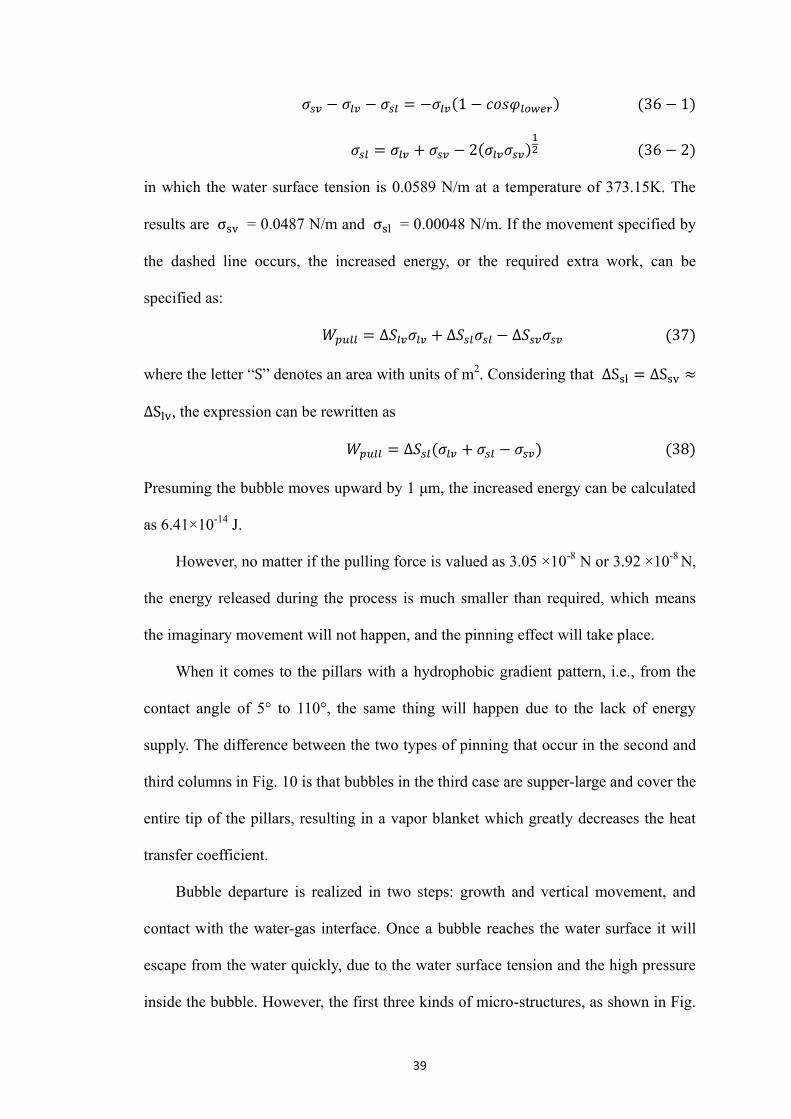
Compared with the first three columns in Fig. 10, the top patched pillars in the
fourth column promote bubble departure, while the other three cases have bubble
pinning at the top of the pillar forest. The reasons for the pinning effect are various
regarding different cases.
For the wholly hydrophilic micro-pillars, bubbles grow on their own or merge
with other bubbles. Restrained by momentum conservation, bubbles in this case have
no net upward movement, except the gradually enlarged volume, which can help
bubbles to touch the water-gas interface and then depart. Before reaching the
water-gas interface, bubbles stay pinned at the hydrophilic pillar tops.
Fig. 14 Imaginary movement of a bubble pinning between two pillars
For the other two cases, which have wettability gradient patterns, although the
gradient can promote bubble’s upward movement, it still has difficulty in pushing the
bubbles out from the pillars completely, due to the lack of sufficient pulling force or
energy. Fig. 14 demonstrates an imaginary movement of a bubble pinning between
two pillars, which have a hydrophilic contact angle gradient from 5° to 55°. If 35° is
adopted as the contact angle of the surface ∆Ssv, the surface tension of this area can
be calculated by [33]:
39
𝜍𝑠𝑣 − 𝜍𝑙𝑣 − 𝜍𝑠𝑙 = −𝜍𝑙𝑣(1 − 𝑐𝑜𝑠𝜑𝑙𝑜𝑤𝑒𝑟) (36 − 1)
𝜍𝑠𝑙 = 𝜍𝑙𝑣 + 𝜍𝑠𝑣 − 2(𝜍𝑙𝑣𝜍𝑠𝑣)12 (36 − 2)
in which the water surface tension is 0.0589 N/m at a temperature of 373.15K. The
results are σsv = 0.0487 N/m and σsl = 0.00048 N/m. If the movement specified by
the dashed line occurs, the increased energy, or the required extra work, can be
specified as:
𝑊𝑝𝑢𝑙𝑙 = ∆𝑆𝑙𝑣𝜍𝑙𝑣 + ∆𝑆𝑠𝑙𝜍𝑠𝑙 − ∆𝑆𝑠𝑣𝜍𝑠𝑣 (37)
where the letter “S” denotes an area with units of m2. Considering that ∆Ssl = ∆Ssv ≈
∆Slv, the expression can be rewritten as
𝑊𝑝𝑢𝑙𝑙 = ∆𝑆𝑠𝑙(𝜍𝑙𝑣 + 𝜍𝑠𝑙 − 𝜍𝑠𝑣) (38)
Presuming the bubble moves upward by 1 μm, the increased energy can be calculated
as 6.41×10⁻¹⁴ J.
However, no matter if the pulling force is valued as 3.05 ×10⁻⁸ N or 3.92 ×10⁻⁸ N,
the energy released during the process is much smaller than required, which means
the imaginary movement will not happen, and the pinning effect will take place.
When it comes to the pillars with a hydrophobic gradient pattern, i.e., from the
contact angle of 5° to 110°, the same thing will happen due to the lack of energy
supply. The difference between the two types of pinning that occur in the second and
third columns in Fig. 10 is that bubbles in the third case are supper-large and cover the
entire tip of the pillars, resulting in a vapor blanket which greatly decreases the heat
transfer coefficient.
Bubble departure is realized in two steps: growth and vertical movement, and
contact with the water-gas interface. Once a bubble reaches the water surface it will
escape from the water quickly, due to the water surface tension and the high pressure
inside the bubble. However, the first three kinds of micro-structures, as shown in Fig.

40
10, have the same problem, which is that bubbles pin at the pillar tops, and the only
way to expel the bubbles for the three cases is to allow the bubbles to grow until the
bubble size is large enough to reach the water surface. Although the second and third
micro-structures can promote vertical movement of the bubble, the assistance
disappears when bubbles reach the top of the pillar forest. This type of departure,
depending on the bubble’s isotropic expanding, is inefficient, whereas pillars patched
by hydrophobic material on the pillar tops, as shown in the fourth column in Fig. 10,
can dramatically promote the escape of bubbles. The pulling effect from the pinned
bubble is displayed in Fig. 15. It can be observed that the bubble can be easily pulled
up and completely escape with the help of the bubbles sitting on the pillar tops,
whereas the bubble in the micro-structure with the wettability gradient pattern has no
Fig. 15 Pulling effect of sit-on-top bubble
41
obvious change at the same time.
From Fig. 12 it can be seen that the surface appears serrated. This is caused by
four factors: first, there are phase changes which happen near the surface continuously
throughout time, and new born small bubbles merge with the large bubble, causing the
unsmooth surface; second, the reaction is fast and severe, such that the surface tension
has no time to achieve a smooth surface; third, the mesh is relatively course when the
Fig. 16 Evolution and comparison of velocity field between micro-structures with
wettability gradient patterns and hydrophobic patch on pillar tops. a, b, c: with
wettability gradient from contact angle of 5 ° to 55°, flow time are 0.058ms,
0.064ms, and 0.070ms, respectively; d: top patched by hydrophobic material with
contact angle of 110°
42
bubble is small; fourth, the 2-d cutting plane of the complex, 3-D, multiple bubble
interaction could make the interface look more uneven.
Fig. 16a to Fig. 16c demonstrate that the pulling assistance disappeared after the
bubble reached the pillar’s top level. Additionally, compared with Fig. 16d, it can be
seen that the upwards velocity of the case with the wettability gradient is smaller than
that of the case patched by hydrophobic material on the pillar’s top.
The promotion effect happens because the surface energy releases during the
bubble merging, and the released energy transforms into kinetic energy which helps
the bubble to contact the liquid-gas interface quickly. How the surface energy
decreases after merging is explained as follows. For two bubbles’ merging, assume the
radii of the two small bubbles are ra and rb. rab denotes the radius of the merged bubble.
Suppose the water vapor is ideal gas, which obeys
𝑝𝑉 = 𝑛𝑅𝑇 (39)
Since the mole numbers of the merged bubble should be the same as the sum of the
two small bubbles, it can be obtained that
𝑝𝑎𝑏𝑉𝑎𝑏 = 𝑛𝑎𝑏𝑅𝑇
= (𝑛𝑎 + 𝑛𝑏)𝑅𝑇
= 𝑝𝑎𝑉𝑎 + 𝑝𝑏𝑉𝑏 (40)
The relation between water pressure and bubble’s internal pressure can also be
obtained from the Young-Laplace equation
𝑝𝑎𝑏 = 𝑝𝑙 +2𝜍
𝑟𝑎𝑏 (41)
If the two bubbles are identical, this yields
𝑝𝑎 = 𝑝𝑏 = 𝑝𝑙 +2𝜍
𝑟𝑎 (42)
43
Substituting Eqs. (41) and (42), and the volume of the bubbles back into Eq. (40),
yields
4
3𝜋𝑟𝑎𝑏
3 (𝑝𝑙 +2𝜍
𝑟𝑎𝑏* = 2 (𝑝𝑙 +
2𝜍
𝑟𝑎*4
3𝜋𝑟𝑎
3 (43)
rab can be expressed by ra in a very complicated polynomial from this equation. If
ra is evaluated as 2×10⁻⁶ m, the surface energy difference between the two small
bubbles and the new large bubble can be calculated by
𝑊𝑚𝑒𝑟𝑔𝑒 = 𝜍(𝑆𝑎 + 𝑆𝑏 − 𝑆𝑎𝑏) (44)
After substituting all of the values into Eq. (44), the value of Wmerge can be
obtained as 1.271πσra2. This means the bubble will do work to the ambient
environment since the value is positive. This is easy to understand because substances
in nature prefer to stay in the form which possesses the lowest energy, and the ball
shape has the smallest surface area among all kinds of shapes with the same volume.
The released energy can be transformed to help the lower bubble to climb up with the
pillars’ reaction force. If the vertical distance that the bubbles’ center of gravity moves
is deemed as 2 μm, the vertical, average pulling forth imposed upon the bubble could
be estimated by
𝐹𝑚𝑒𝑟𝑔𝑒 =𝑊𝑚𝑒𝑟𝑔𝑒
𝑠 (45)
in which “s” denotes the moving distance. The average pulling force is approximately
4.7×10⁻⁷ N, calculated by Eq. (45). This is one order larger than the pulling force
induced by the wettability gradient we got, which means the bubbles sitting on the
pillars’ top have a more effective effort than the wettability gradient. This result can
also be validated in Fig. 16d.
It can be noticed in Fig. 10 that bubbles shown in the third and fourth column
start to form on the pillar tip from a very early stage. These bubbles contribute to the
44
effort to pull up bubbles in the lower level. However, since pillars in the fourth
column have a lower contact angle of 5° on the side, it is easier for bubbles to detach
from the hydrophilic surface than from the hydrophobic one for the case in the third
column, and avoid the pinning effect. This is another trade-off between the large
bubble pinning effect and the quick bubble expelling process.
4.3 Comparative studies for structure with different wettability
patterns
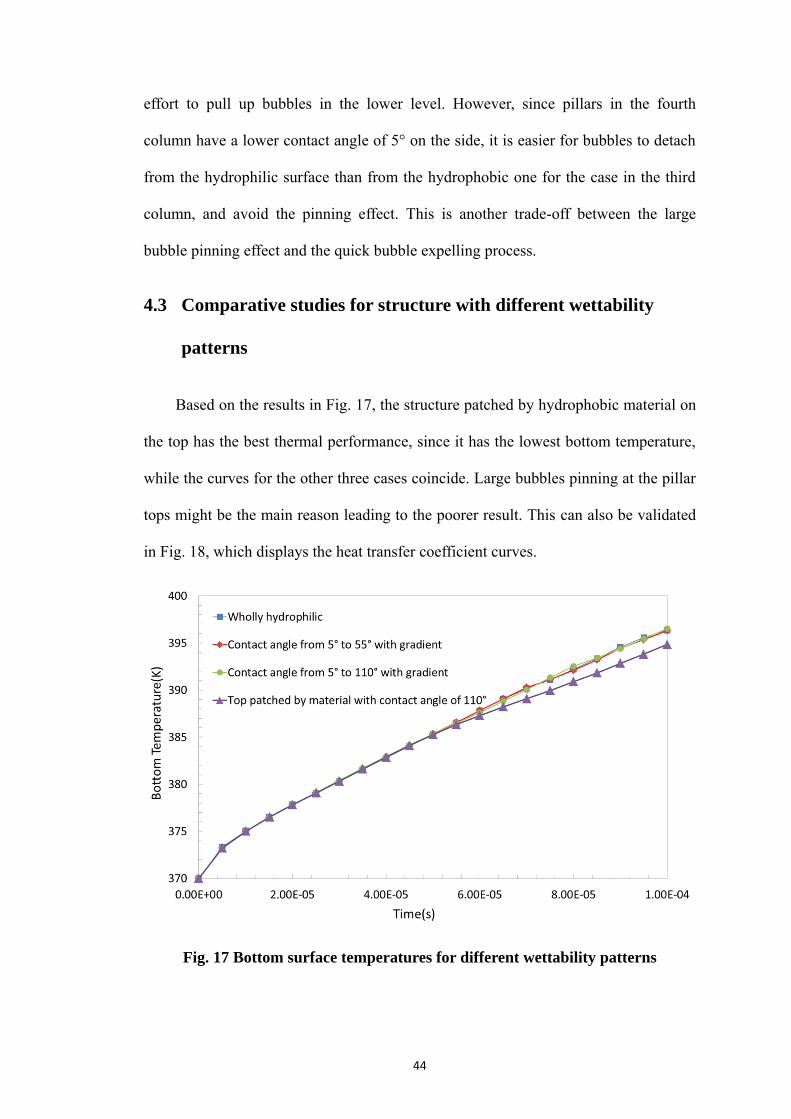
Based on the results in Fig. 17, the structure patched by hydrophobic material on
the top has the best thermal performance, since it has the lowest bottom temperature,
while the curves for the other three cases coincide. Large bubbles pinning at the pillar
tops might be the main reason leading to the poorer result. This can also be validated
in Fig. 18, which displays the heat transfer coefficient curves.
Fig. 17 Bottom surface temperatures for different wettability patterns
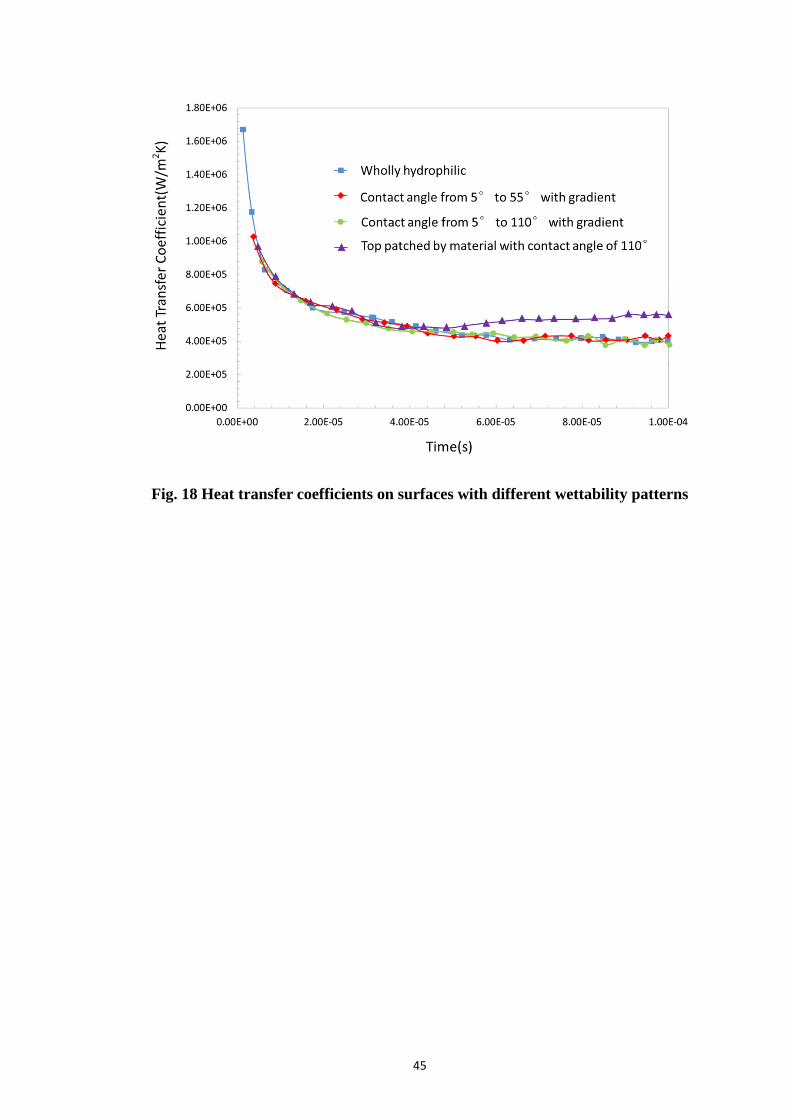
45
Fig. 18 Heat transfer coefficients on surfaces with different wettability patterns
46
Chapter 5 Conclusions
A transient 3-D Volume of Fluid model is used to investigate two phase cooling
on enhanced surfaces, which combines micro-pillars and different engineered
wettability patterns under flooding conditions. The simulation results shows that the
heat dissipation performance is improved with an increase in pillar height, since a
higher pillar enables liquid water to be heated faster and more uniformly. However,
the heat transfer coefficient is not monotonously improved, due to the pinning effect
on the pillar’s top edges. For the micro-structures patched with wettability gradient
patterns on the pillar sides, although the bubble’s upward movement can be promoted,
which can be seen from the visualized dynamics, insufficient pulling force and energy
results in large bubble pinning at the pillar tops, which forms a vapor blanket which
consequently decreases the heat transfer coefficient. However, for the pillars that have
hydrophobic material patched on the top, due to the favorable effect of hydrophobic
surfaces on vapor accumulation, bubbles can be formed on the pillar tops, which can
provide an effective pulling force to help more bubbles to depart from the pillar forest.
The pulling force is supplied by the surface energy released during the bubble
merging process. The simulation results, including heat source temperatures and heat
transfer coefficients, prove that only a patch of hydrophobic material on the pillar top
works best out of all of the cases.
Future work will focus on investigating refined micro-structures which can deal
with the trade-off between the large bubble pinning effect and the quick bubble
expelling process. Study over the micro-structure at different levels of dry-out will
also be performed.
47
Reference
[1] Bar-Cohen, A., Wang, P., and Rahim, E., 2007, "Thermal management of high heat
flux nanoelectronic chips," Microgravity Sci. Technol, 19(3-4), pp. 48-52.
[2] Bar-Cohen, A., and Wang, P., 2012, "Thermal Management of On-Chip Hot Spot,"
Journal of Heat Transfer, 134(5), pp. 051017-051017.
[3] Sabry, M. N., 2005, "Compact thermal models for internal convection,"
Components and Packaging Technologies, IEEE Transactions on, 28(1), pp. 58-64.
[4] Park, K. A., and Bergles, A. E., "Boiling heat transfer characteristics of simulated
microelectronic chips with detachable heat sinks," Proc. International Heat Transfer
Conference, p. 4.
[5] Honda, H., Wei, J. J., and Takamastu, H., 2001, "Enhanced Boiling of FC-72 on
Silicon Chips With Micro-Pin-Fins and Submicron-Scale Roughness," Journal of Heat
Transfer, 124(2), pp. 383-390.
[6] Bowers, M. B., and Mudawar, I., 1994, "High flux boiling in low flow rate, low
pressure drop mini-channel and micro-channel heat sinks," International Journal of
Heat and Mass Transfer, 37(2), pp. 321-332.
[7] Knight, R. W., Hall, D. J., Goodling, J. S., and Jaeger, R. C., 1992, "Heat sink
optimization with application to microchannels," Components, Hybrids, and
Manufacturing Technology, IEEE Transactions on, 15(5), pp. 832-842.
[8] Wadsworth, D. C., and Mudawar, I., 1992, "Enhancement of Single-Phase Heat
Transfer and Critical Heat Flux From an Ultra-High-Flux Simulated Microelectronic
Heat Source to a Rectangular Impinging Jet of Dielectric Liquid," Journal of Heat
Transfer, 114(3), pp. 764-768.
[9] Estes, K. A., and Mudawar, I., 1995, "Comparison of Two-Phase Electronic
Cooling Using Free Jets and Sprays," Journal of Electronic Packaging, 117(4), pp.
323-332.
48
[10] Hsieh, C.-C., and Yao, S.-C., 2006, "Evaporative heat transfer characteristics of a
water spray on micro-structured silicon surfaces," International Journal of Heat and
Mass Transfer, 49(5–6), pp. 962-974.
[11] Yang, J., Chow, L. C., and Pais, M. R., 1996, "Nucleate Boiling Heat Transfer in
Spray Cooling," Journal of Heat Transfer, 118(3), pp. 668-671.
[12] Kim, J., 2007, "Spray cooling heat transfer: The state of the art," International
Journal of Heat and Fluid Flow, 28(4), pp. 753-767.
[13] Horacek, B., Kiger, K. T., and Kim, J., 2005, "Single nozzle spray cooling heat
transfer mechanisms," International Journal of Heat and Mass Transfer, 48(8), pp.
1425-1438.
[14] Bostanci, H., Rini, D. P., Kizito, J. P., Singh, V., Seal, S., and Chow, L. C., 2012,
"High heat flux spray cooling with ammonia: Investigation of enhanced surfaces for
CHF," International Journal of Heat and Mass Transfer, 55(13–14), pp. 3849-3856.
[15] Cheng, J. T., and Chen, C. L., 2010, "Active thermal management of on-chip hot
spots using EWOD-driven droplet microfluidics," Exp Fluids, 49(6), pp. 1349-1357.
[16] Cheng, J. T., and Chen, C. L., 2010, "Adaptive Chip Cooling Using
Electrowetting on Coplanar Control Electrodes," Nanoscale and Microscale
Thermophysical Engineering, 14(2), pp. 63-74.
[17] Baird, E., and Mohseni, K., 2008, "Digitized Heat Transfer: A New Paradigm for
Thermal Management of Compact Micro Systems," Components and Packaging
Technologies, IEEE Transactions on, 31(1), pp. 143-151.
[18] Park, K. A., and Bergles, A. E., "Boiling heat transfer characteristics of simulated
microelectronic chips with detachable heat sinks," Proc. Heat Transfer 1986,
Proceedings of the Eighth International Heat Transfer Conference, Hemisphere Publ
Corp, pp. 2099-2104.
[19] Tuckerman, D. B., and Pease, R. F. W., 1981, "High-performance heat sinking for
VLSI," Electron Device Letters, IEEE, 2(5), pp. 126-129.
49
[20] Shen, J., Graber, C., Liburdy, J., Pence, D., and Narayanan, V., 2010,
"Simultaneous droplet impingement dynamics and heat transfer on nano-structured
surfaces," Experimental Thermal and Fluid Science, 34(4), pp. 496-503.
[21] Zhou, Z., Shi, J., Chen, H.-H., Schafer, S. R., and Chen, C.-L., 2014, "Two-phase
flow over flooded micro-pillar structures with engineered wettability pattern,"
International Journal of Heat and Mass Transfer, 71(0), pp. 593-605.
[22] Wang, X., Zhao, S., Wang, H., and Pan, T., 2012, "Bubble formation on
superhydrophobic-micropatterned copper surfaces," Applied Thermal Engineering,
35(0), pp. 112-119.
[23] Renkun, C., Ming-Chang, L., Vinod, S., Zhijie, W., Hyung Hee, C., and Arun, M.,
2009, "Nanowires for Enhanced Boiling Heat Transfer," Nano Letters, 9(2), pp.
548-553.
[24] Cao, X. L., Cheng, P., and Zhao, T. S., 2002, "Experimental study of evaporative
heat transfer in sintered copper bidispersed wick structures," Journal of
Thermophysics and Heat Transfer, 16(4), pp. 547-552.
[25] ćoso, D., Srinivasan, V., Ming-Chang, L., Je-Young, C., and Majumdar, A., 2012,
"Enhanced Heat Transfer in Biporous Wicks in the Thin Liquid Film Evaporation and
Boiling Regimes," Journal of Heat Transfer, 134(10), pp. 1-11.
[26] Betz, A. R., Xu, J., Qiu, H., and Attinger, D., 2010, "Do surfaces with mixed
hydrophilic and hydrophobic areas enhance pool boiling?," Applied Physics Letters,
97(14), p. 141909.
[27] Betz, A. R., Jenkins, J., Kim, C.-J. C., and Attinger, D., 2013, "Boiling heat
transfer on superhydrophilic, superhydrophobic, and superbiphilic surfaces,"
International Journal of Heat & Mass Transfer, 57(2), pp. 733-741.
[28] Yang, Z., Peng, X. F., and Ye, P., 2008, "Numerical and experimental
investigation of two phase flow during boiling in a coiled tube," International Journal
of Heat and Mass Transfer, 51(5–6), pp. 1003-1016.
50
[29] Fang, C., David, M., Rogacs, A., and Goodson, K., 2010, "Volume of Fluid
Simulation of Boiling Two-Phase Flow in a Vapor-Venting Microchannel," Frontiers
in Heat and Mass Transfer, 1(1).
[30] Wei, J.-h., Pan, L.-m., Chen, D.-q., Zhang, H., Xu, J.-j., and Huang, Y.-p., 2011,
"Numerical simulation of bubble behaviors in subcooled flow boiling under swing
motion," Nuclear Engineering and Design, 241(8), pp. 2898-2908.
[31] Schrage, R. W., 1953, A Theoretical Study of Interface Mass Transfer, Columbia
University Press, New York.
[32] Marek, R., and Straub, J., 2001, "Analysis of the evaporation coefficient and the
condensation coefficient of water," International Journal of Heat and Mass Transfer,
44(1), pp. 39-53.
[33] Carey, V. P., 1992, Liquid-vapor Phase-change Phenomena, Hemisphere
Publishing Corporation.
[34] Kucherov, R. Y., and Rikenglaz, L. E., 1960, "The problem of measuring the
condensation coefficient," Doklady Akad Nauk SSSR, 133(5), pp. 1130-1131.
[35] Lee, W. H., 1980, A pressure iteration scheme for two-phase flow modeling,
Hemisphere Publishing, Washington, DC.
[36] Youngs, D. L., 1982, "Time-dependent multi-material flow with large fluid
distortion," Numerical methods for fluid dynamics, 24, pp. 273-285.
[37] Brackbill, J. U., Kothe, D. B., and Zemach, C., 1992, "A continuum method for
modeling surface tension," Journal of Computational Physics, 100(2), pp. 335-354.
[38] Dhavaleswarapu, H. K., Murthy, J. Y., and Garimella, S. V., 2012, "Numerical
investigation of an evaporating meniscus in a channel," International Journal of Heat
and Mass Transfer, 55(4), pp. 915-924.
[39] Faghri, A., 1995, Heat Pipe Science and Technology, Taylor & Francis,
Washington DC.
51
[40] Tanasawa, I., 1991, "Advances in Condensation Heat Transfer," Advances in
Heat Transfer, T. F. I. James P. Hartnett, and I. C. Young, eds., Elsevier, pp. 55-139.
[41] Crowe, C. T., Schwarzkopf, J. D., Sommerfeld, M., and Tsuji, Y., 1998,
Multiphase Flows with Droplets and Particles, CRC press.
[42] Chen, F., Milnes, D., Anita, R., and Kenneth, G., 2010, "Volume of fluid
simulation of boiling two-phase flow in a vapor-venting microchannel," Heat Mass
Transfer, 1(1).
[43] Youngs, D., 1982, "Time-dependent multi-material flow with large fluid
distortion," Numerical methods for fluid dynamics, 24, pp. 273-285.