Flicker: How to Avoid It, Test for It, and Fix It · ~80 Hz – ~2500 Hz IEEE 1789-2015:...
21
May 9, 2018 1 Flicker: How to avoid it, test for it, and fix it Naomi Johnson Miller, FIES, FIALD, LC Pacific Northwest National Laboratory LightFair, DOE Booth, Chicago IL, May 2018
Transcript of Flicker: How to Avoid It, Test for It, and Fix It · ~80 Hz – ~2500 Hz IEEE 1789-2015:...

May 9, 2018 1
Flicker: How to avoid it, test for it, and fix it Naomi Johnson Miller, FIES, FIALD, LC Pacific Northwest National Laboratory LightFair, DOE Booth, Chicago IL, May 2018
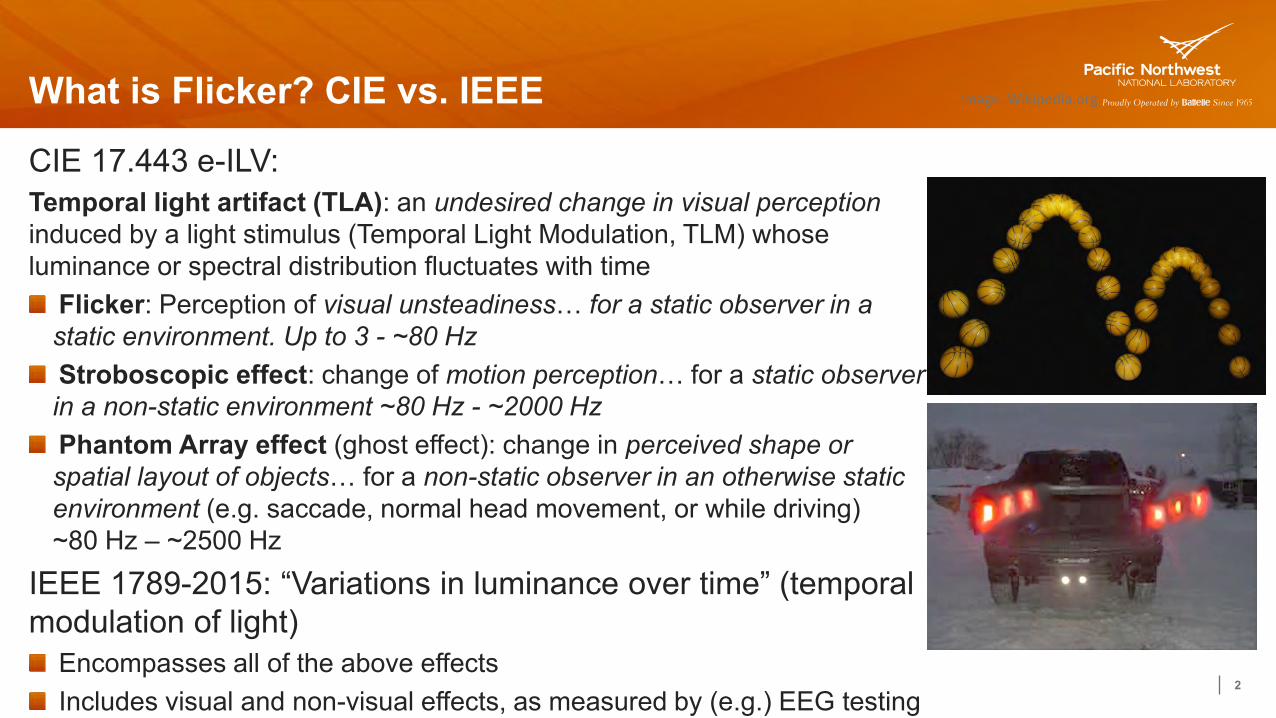
What is Flicker? CIE vs. IEEE
CIE 17.443 e-ILV: Temporal light artifact (TLA): an undesired change in visual perception induced by a light stimulus (Temporal Light Modulation, TLM) whose luminance or spectral distribution fluctuates with time
Flicker: Perception of visual unsteadiness… for a static observer in a static environment. Up to 3 - ~80 Hz Stroboscopic effect: change of motion perception… for a static observer in a non-static environment ~80 Hz - ~2000 Hz Phantom Array effect (ghost effect): change in perceived shape or spatial layout of objects… for a non-static observer in an otherwise static environment (e.g. saccade, normal head movement, or while driving) ~80 Hz – ~2500 Hz
IEEE 1789-2015: “Variations in luminance over time” (temporal modulation of light)
Encompasses all of the above effects Includes visual and non-visual effects, as measured by (e.g.) EEG testing
2
Image: Wikipedia.org
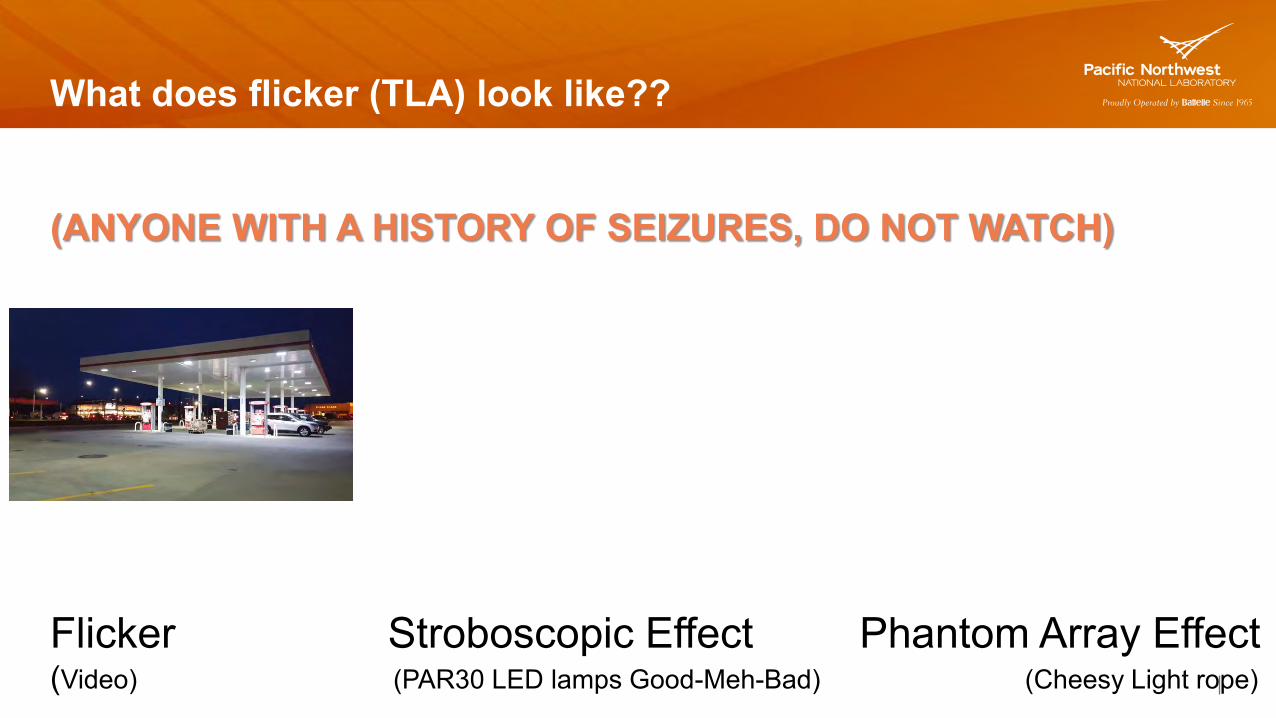
What does flicker (TLA) look like?? (ANYONE WITH A HISTORY OF SEIZURES, DO NOT WATCH) Flicker Stroboscopic Effect Phantom Array Effect (Video) (PAR30 LED lamps Good-Meh-Bad) (Cheesy Light rope)
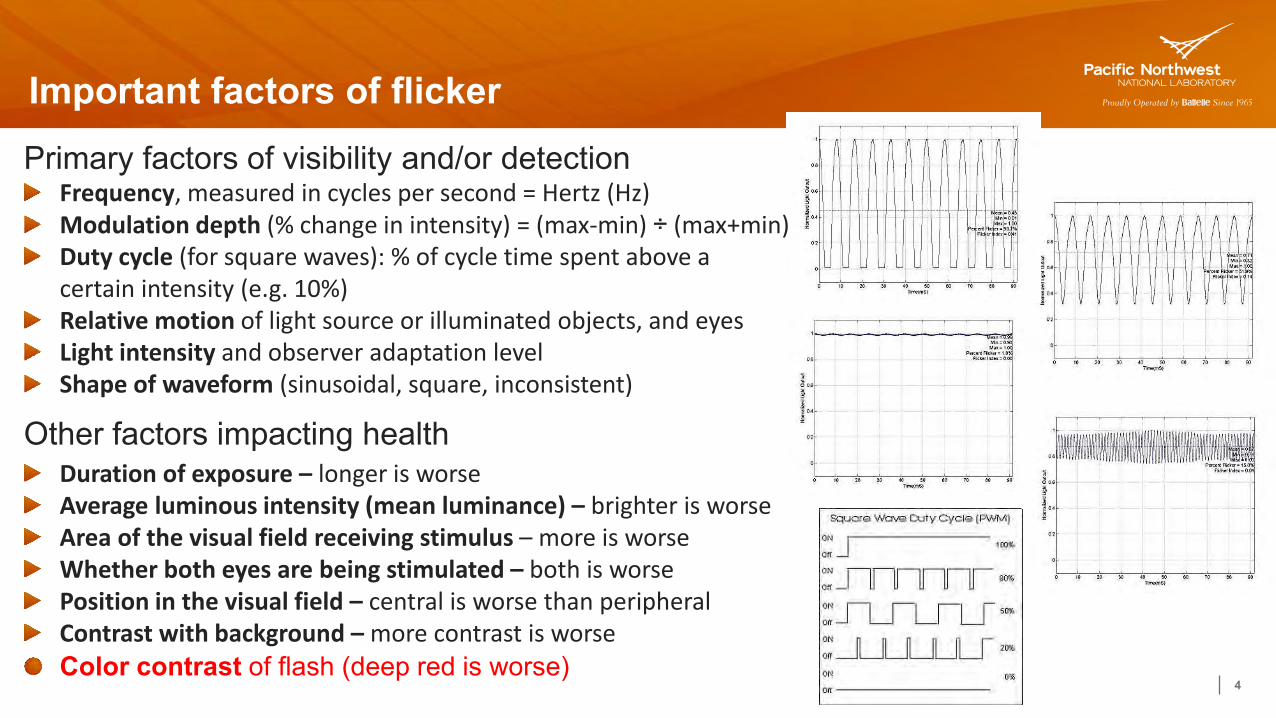
Important factors of flicker Primary factors of visibility and/or detection
Frequency, measured in cycles per second = Hertz (Hz) Modulation depth (% change in intensity) = (max-min) ÷ (max+min) Duty cycle (for square waves): % of cycle time spent above a certain intensity (e.g. 10%) Relative motion of light source or illuminated objects, and eyes Light intensity and observer adaptation level Shape of waveform (sinusoidal, square, inconsistent)
Other factors impacting health Duration of exposure – longer is worse Average luminous intensity (mean luminance) – brighter is worse Area of the visual field receiving stimulus – more is worse Whether both eyes are being stimulated – both is worse Position in the visual field – central is worse than peripheral Contrast with background – more contrast is worse
Color contrast of flash (deep red is worse) 4

Why do we care?
Photoepilepsy – flashing lights (and other repetitive patterns) stimulate epileptic seizures Stroboscopic effect – dangerous when working with rotating machinery Migraine or severe paroxysmal headache often associated with nausea and visual disturbances Increased repetitive behavior among persons with autism Asthenopia (eye strain), including fatigue, blurred vision, conventional headache, decreased performance on sight-related tasks, etc. Other: panic attacks, anxiety, increased heart rate, vertigo
Also: interference with machine vision and imaging devices (video & security cameras, etc.) 5
Health.com

Offices
Classrooms
Industrial spaces
Hospitals/clinics
General lighting Task lighting
Where do we care?
6
Video
conferencing
Rooms
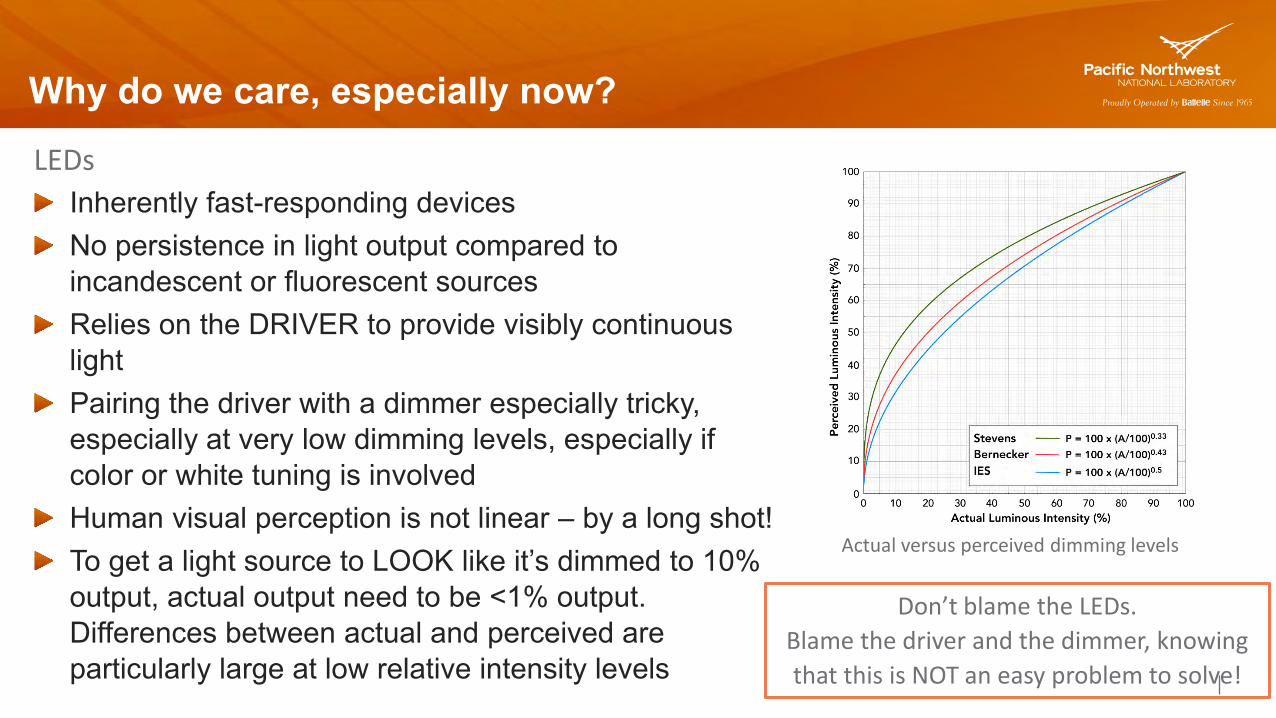
Why do we care, especially now? LEDs
Inherently fast-responding devices No persistence in light output compared to incandescent or fluorescent sources Relies on the DRIVER to provide visibly continuous light Pairing the driver with a dimmer especially tricky, especially at very low dimming levels, especially if color or white tuning is involved Human visual perception is not linear – by a long shot! To get a light source to LOOK like it’s dimmed to 10% output, actual output need to be <1% output. Differences between actual and perceived are particularly large at low relative intensity levels 7
Don’t blame the LEDs.
Blame the driver and the dimmer, knowing
that this is NOT an easy problem to solve!
Actual versus perceived dimming levels
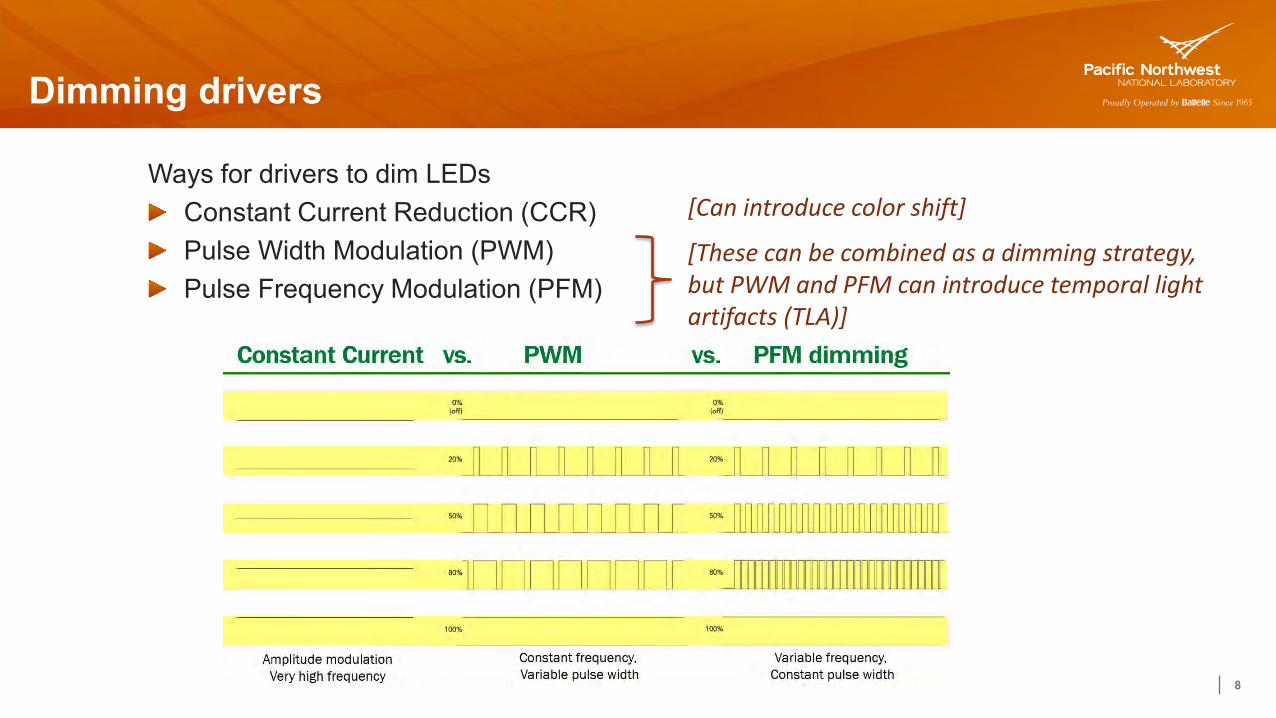
Dimming drivers
Ways for drivers to dim LEDs Constant Current Reduction (CCR) Pulse Width Modulation (PWM) Pulse Frequency Modulation (PFM)
8
[Can introduce color shift]
[These can be combined as a dimming strategy, but PWM and PFM can introduce temporal light artifacts (TLA)]
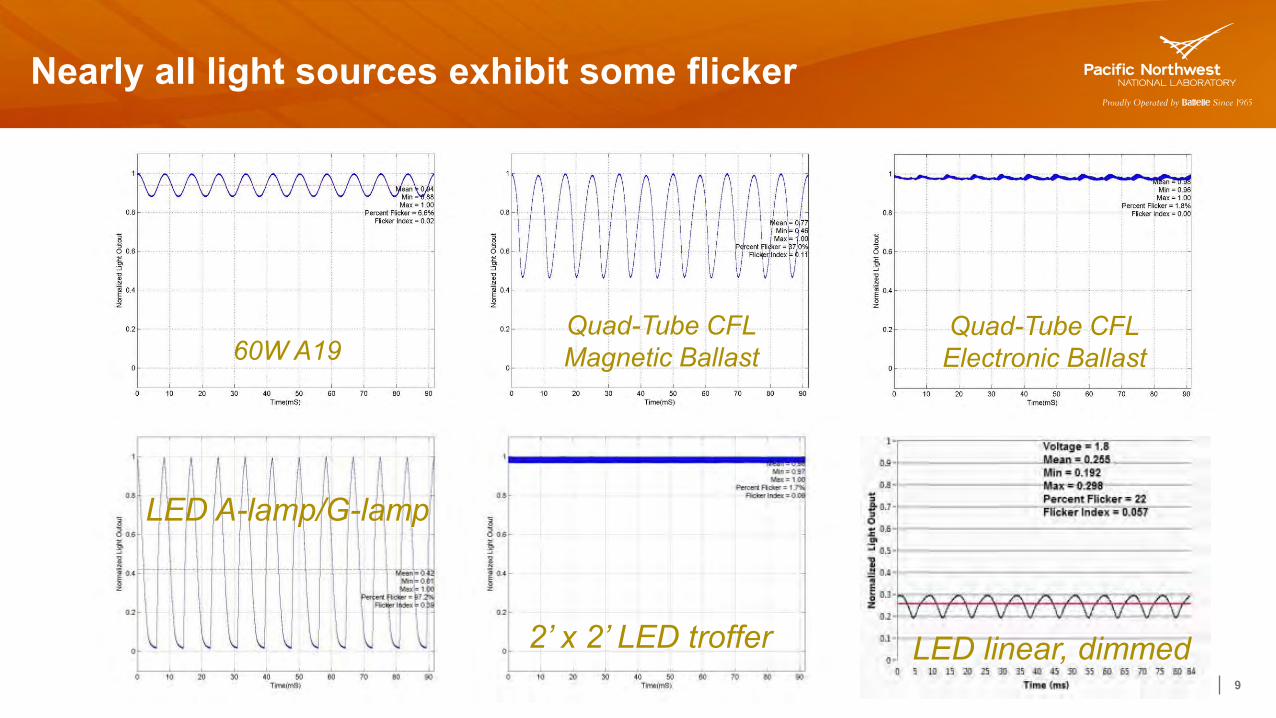
Nearly all light sources exhibit some flicker
9
60W A19 Quad-Tube CFL Magnetic Ballast
Quad-Tube CFL Electronic Ballast
LED A-lamp/G-lamp
2’ x 2’ LED troffer LED linear, dimmed
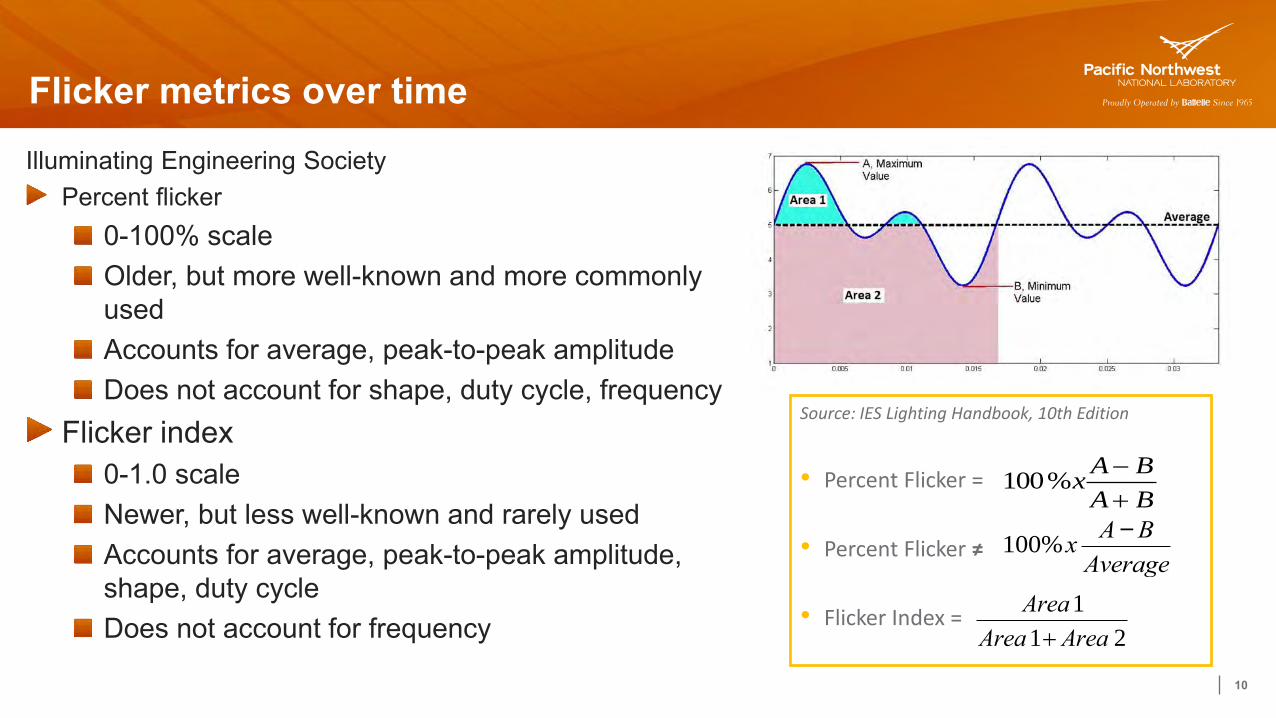
Flicker metrics over time Illuminating Engineering Society
Percent flicker 0-100% scale Older, but more well-known and more commonly used Accounts for average, peak-to-peak amplitude Does not account for shape, duty cycle, frequency
Flicker index 0-1.0 scale Newer, but less well-known and rarely used Accounts for average, peak-to-peak amplitude, shape, duty cycle Does not account for frequency
10
Source: IES Lighting Handbook, 10th Edition • Percent Flicker = • Percent Flicker ≠ • Flicker Index =
BA
BAx
%100
100%xA-B
Average
Area1
Area1+ Area 2

Flicker metrics over time (Thanks Jim Gaines & NEMA!)
11
IEC 61000-4-15 • “Flickermeter” – Functional and design specifications
IEC 61000-3-3 • “Limitation of voltage changes, voltage fluctuations and flicker” in
public electric supply systems, up to 80 Hz
• Complex; originally developed to quantify power line quality
Pst Limited to visible flicker up
to 80 Hz Values above 1.0
considered acceptable
LRC ASSIST Flicker Perception Metric (MP)
• Follows the IEC Flickermeter approach, but without the model of the
incandescent lamp.
• Based on response of 10 subjects
• Covers frequencies from 5 Hz to 80 Hz

Flicker metrics over time IEEE Standard P1789-2015 Methodology
Focused on health risks from flicker Plotted data from multiple studies based on risk level, probability of exposure, and severity of exposure Characterized data reliability (from opinion to solid data) Plotted % Flicker (modulation) and frequency for no effect level (green, factor of 0.03) and low risk level (yellow, factor of 0.08). Goal was simple metric, easy to calculate and understand BUT… Hard to evaluate complex waveforms, doesn’t account for wave shape, doesn’t account for low duty cycle (e.g., dimming). And, does conservative approach suit all applications? 12
Flicker metrics over time
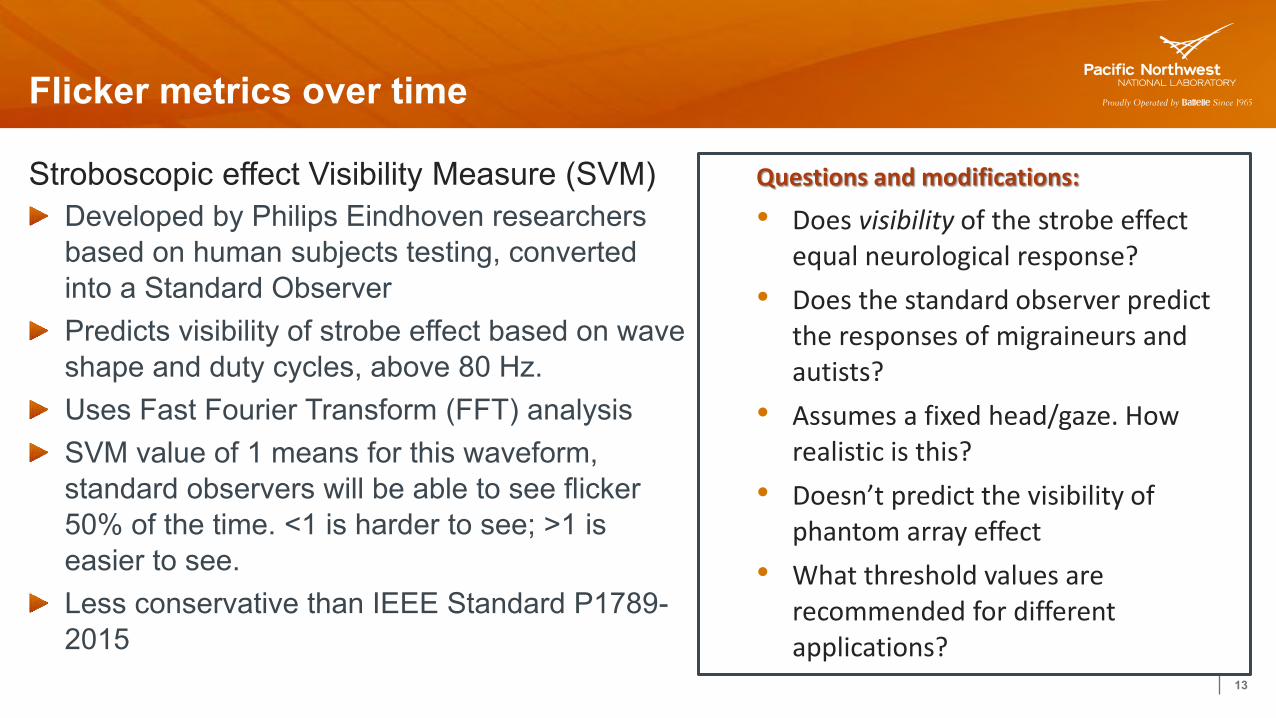
Stroboscopic effect Visibility Measure (SVM) Developed by Philips Eindhoven researchers based on human subjects testing, converted into a Standard Observer Predicts visibility of strobe effect based on wave shape and duty cycles, above 80 Hz. Uses Fast Fourier Transform (FFT) analysis SVM value of 1 means for this waveform, standard observers will be able to see flicker 50% of the time. <1 is harder to see; >1 is easier to see. Less conservative than IEEE Standard P1789-2015 13
Questions and modifications:
• Does visibility of the strobe effect equal neurological response?
• Does the standard observer predict the responses of migraineurs and autists?
• Assumes a fixed head/gaze. How realistic is this?
• Doesn’t predict the visibility of phantom array effect
• What threshold values are recommended for different applications?
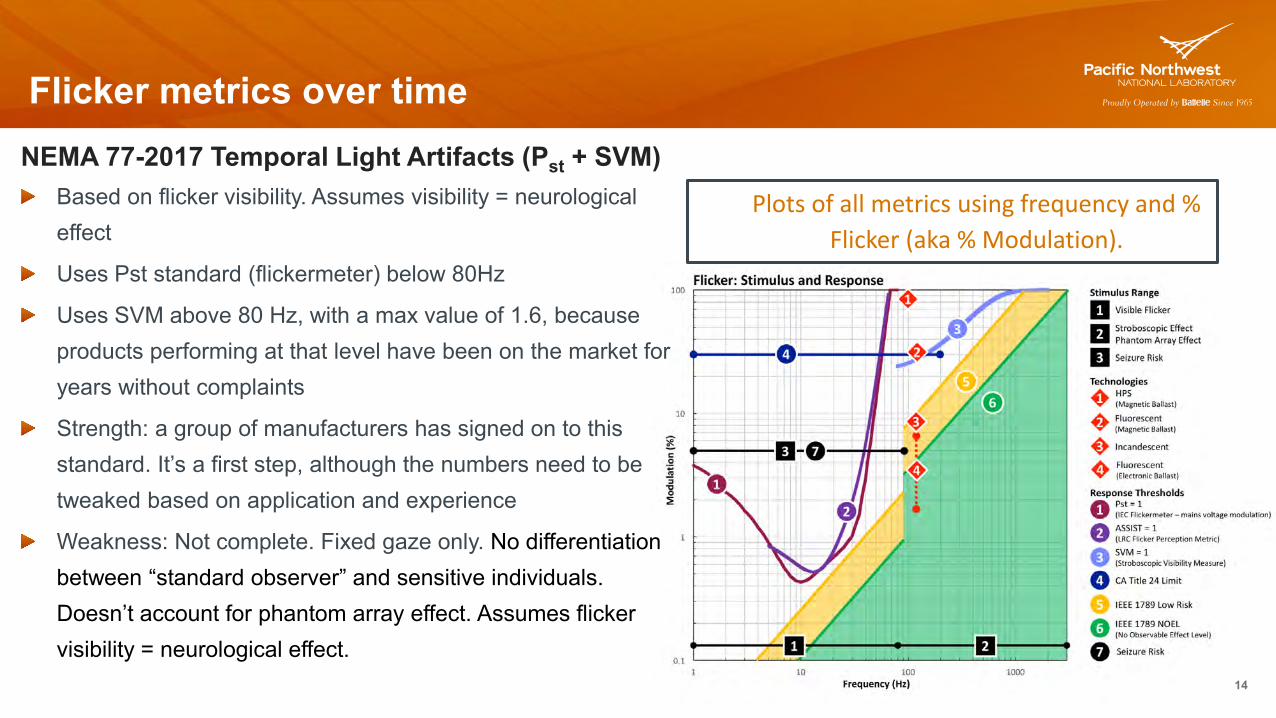
Flicker metrics over time NEMA 77-2017 Temporal Light Artifacts (Pst + SVM)
Based on flicker visibility. Assumes visibility = neurological effect
Uses Pst standard (flickermeter) below 80Hz
Uses SVM above 80 Hz, with a max value of 1.6, because products performing at that level have been on the market for years without complaints
Strength: a group of manufacturers has signed on to this standard. It’s a first step, although the numbers need to be tweaked based on application and experience
Weakness: Not complete. Fixed gaze only. No differentiation between “standard observer” and sensitive individuals. Doesn’t account for phantom array effect. Assumes flicker visibility = neurological effect.
14
Plots of all metrics using frequency and %
Flicker (aka % Modulation).

Flicker metrics over time
Phantom array effect (ghost effect) measure • Investigated by Wilkins and Roberts • No specific metric yet for phantom array effect • Is it the same effect as stroboscopic effect? Can the metric be
the same?
15
https://www.led-professional.com/resources-1/articles/lighting-with-leds-2013-more-than-just-illuminating-objects
What you can do, starting today Specifiers:
1. Insist on seeing an LED luminaire or lamp in operation before specifying it. See it in dimmed operation. Use the waving finger/waving wand test.
2. Buy a good quality hand-held flicker meter that measures AT LEAST up to 2000 Hz and learn to use it.
3. Become familiar with flicker metrics. Encourage manufacturers to publish flicker metrics on their cut sheets
4. Ask your clients about sensitivity to flicker
5. Decide which applications need careful attention to flicker
6. Write language into your specification, such as:
• “Dominant flicker frequency shall always be ≥ 100 Hz for any static dim level.”
• “As defined in the IEEE 1789-2015 standard, must remain in the ‘No Effect’ zone to at least 2% dim level, and in the ‘Low Risk’ zone to at least 0.5% dim level.”
7. If you suspect flicker in a sample or on a job site, take a cell phone and set it on SLO-MO video (240 frames per second). This slows down the flicker rate by a factor of 8, making it more visible. Film for 5 seconds. Play back the video on the phone. Flashing, stripes, or other artifacts may indicate flicker or strobe or phantom array effect. NO GUARANTEE, BUT IT’S A GOOD INDICATOR, AND IT’S FUN.
16
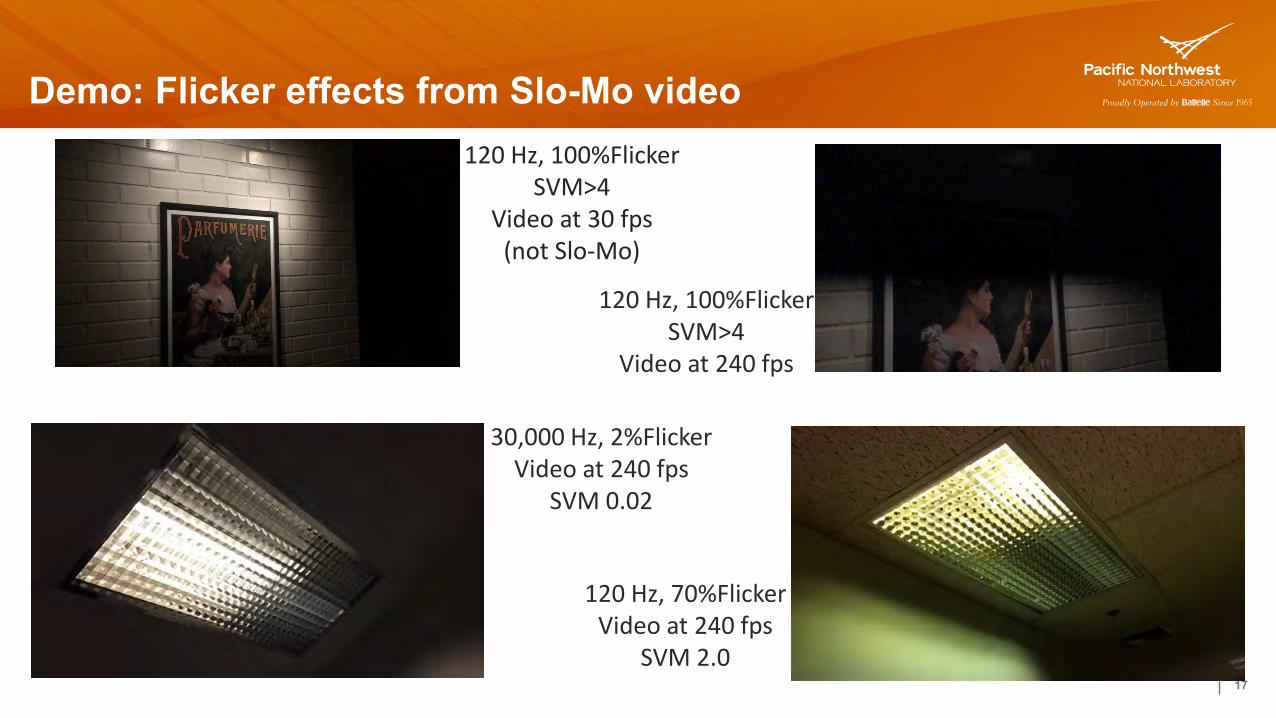
Demo: Flicker effects from Slo-Mo video 120 Hz, 100%Flicker
SVM>4 Video at 30 fps
(not Slo-Mo)
17
120 Hz, 100%Flicker SVM>4
Video at 240 fps
30,000 Hz, 2%Flicker Video at 240 fps
SVM 0.02
120 Hz, 70%Flicker Video at 240 fps
SVM 2.0
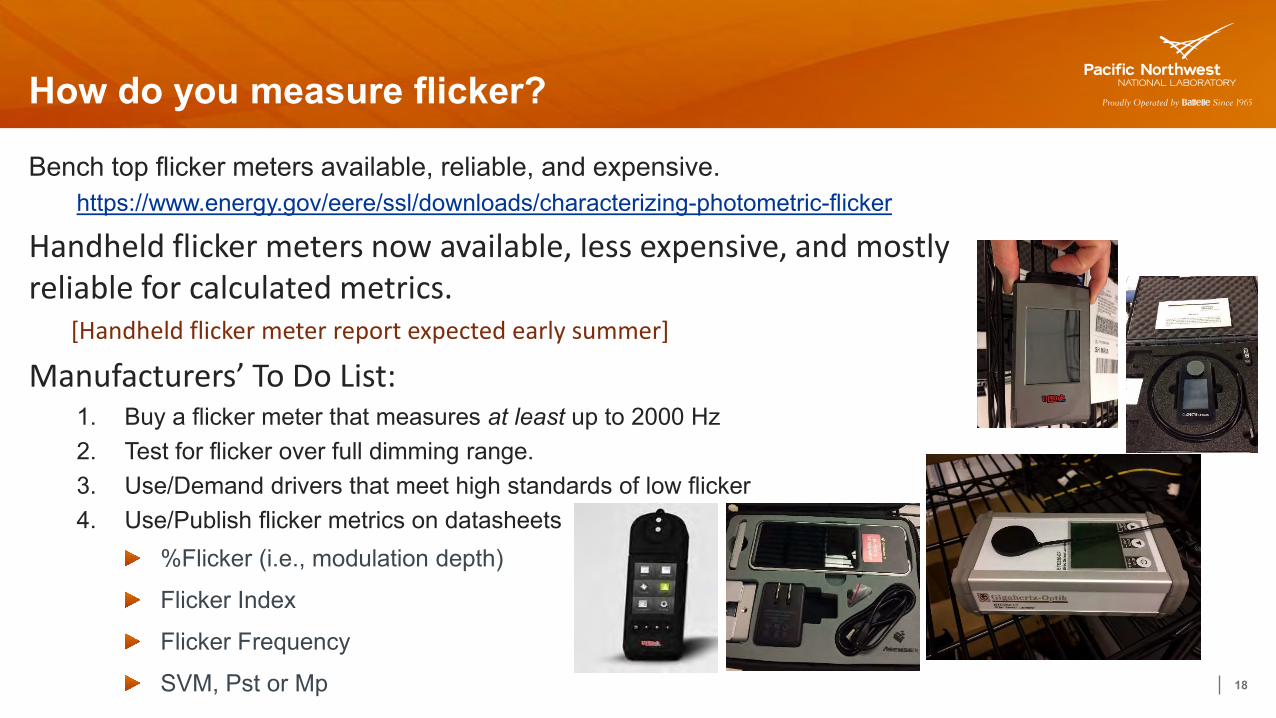
How do you measure flicker?
Bench top flicker meters available, reliable, and expensive. https://www.energy.gov/eere/ssl/downloads/characterizing-photometric-flicker
Handheld flicker meters now available, less expensive, and mostly reliable for calculated metrics.
[Handheld flicker meter report expected early summer]
Manufacturers’ To Do List: 1. Buy a flicker meter that measures at least up to 2000 Hz 2. Test for flicker over full dimming range. 3. Use/Demand drivers that meet high standards of low flicker 4. Use/Publish flicker metrics on datasheets
%Flicker (i.e., modulation depth)
Flicker Index
Flicker Frequency
SVM, Pst or Mp 18

How to FIX flicker in the field
• Call the luminaire manufacturer to plead for help. • Options include:
Change the driver. If it’s phase-cut dimming, change the dimmer. Last resort is change the luminaire, except for …
Move far away and change your cell phone number
https://martinevans.files.wordpress.com/2010/04/homer2.gif
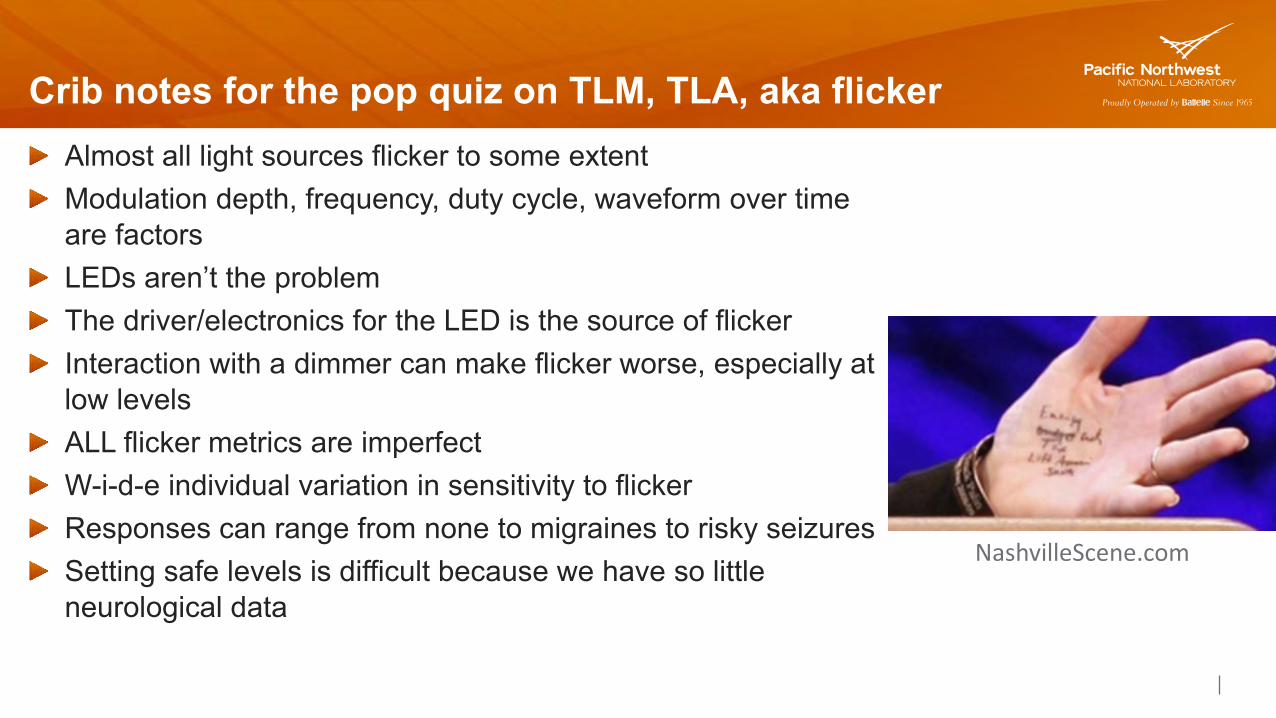
Crib notes for the pop quiz on TLM, TLA, aka flicker Almost all light sources flicker to some extent Modulation depth, frequency, duty cycle, waveform over time are factors LEDs aren’t the problem The driver/electronics for the LED is the source of flicker Interaction with a dimmer can make flicker worse, especially at low levels ALL flicker metrics are imperfect W-i-d-e individual variation in sensitivity to flicker Responses can range from none to migraines to risky seizures Setting safe levels is difficult because we have so little neurological data
NashvilleScene.com
Thank you for listening! Questions? Comments? Complaints?
Naomi Miller Senior Lighting Engineer
Pacific Northwest National Laboratory
Naomi . Miller @ PNNL . gov (503) 417-7571