Flexibility Business Case - Home | The Workplace … · 2016-07-06 · Information System)....
26
Flexibility Business Case Building your business case for flexible work through workforce metrics 1 2 3 4 6 7 8 9 5
Transcript of Flexibility Business Case - Home | The Workplace … · 2016-07-06 · Information System)....

Flexibility Business CaseBuilding your business case for flexible work through workforce metrics
1
2
3
4
6
7
8
9
5
Flexibility business case | www.wgea.gov.au
ContentsIntroduction 1
Steps to build your business case 2
Workforce Measures 4
Metric 1: Uptake and perceptions of flexible work 4
Metric 2: Attraction of employees 9
Metric 3: Retention of employees 11
Metric 4: Training investment 14
Metric 5: Productivity and engagement 15
Metric 6: Absenteeism 17
Metric 7: Employee wellbeing 18
Metric 8: Office space accommodation costs 19
Metric 9: Workforce composition 20
Areas of potential negative impact 22
Copyright and Disclaimer 23
Acknowledgements 23

Flexibility business case | www.wgea.gov.au 1
Building your business case for flexible work through workforce metrics
Flexibility in where, when and how work is done is increasingly recognised as a valuable way to attract and retain employees, with collective research increasingly showing that flexibility drives employee engagement and discretionary effort.
The Workplace Gender Equality Agency’s (WGEA) strategic approach to flexibility provides a roadmap for employers to make the required organisational changes to support flexible work. It specifies an imperative to build a business case to ensure board, executive and management teams make the required investment in time and capital to deliver the best outcomes.
This toolkit aims to help organisations identify the areas where flexibility could positively influence an organisation’s productivity and employee engagement, and provides advice on how to measure the business benefit for flexible working through workforce metrics.
In measuring the benefit of flexible working through workforce metrics, not all data will be available from the outset and organisations will need to focus on the areas where data is available. In addition, while this toolkit includes a comprehensive range of metrics to include in your business case, this list is not exhaustive and your organisation may find other measures to assess your organisation’s approach to flexibility.
Introduction
Specifically this toolkit aims to:
➡➡ Identify workforce metric categories and associated metrics to measure the benefits of flexible working
➡➡ Provide steps on building your business case for flexibility through workforce metrics
➡➡ Provide templates to collect and calculate workforce metrics.
This toolkit is encouraged to be used in conjunction with WGEA’s other flexibility toolkits available. These toolkits include:
➡➡ Building a flexibility strategy
➡➡ Executive briefing on flexibility
➡➡ Manager toolkit
➡➡ Employee toolkit
➡➡ Guidance on developing a flexible working arrangements policy.

Flexibility business case | www.wgea.gov.au 2
Steps to build your business case
A clear business case is an essential prerequisite for building commitment to a flexibility strategy that can lead to effective implementation and positively influence an organisation’s productivity and employee engagement.
Basic Flexibility
➡➡ A business case is established that clearly articulates the organisation’s likely return on investment in flexibility in a trial business area. The business case is compelling and demonstrates the contribution of flexibility to business performance, having looked at both costs and benefits.
➡➡ Measurement may include cost savings associated with floor space reduction and improvements in employee engagement.
Embedded flexibility
➡➡ A business case is established that clearly articulates the organisation’s likely return on investment in flexibility across the whole organisation. The business case is compelling and demonstrates the contribution of flexibility to business performance, having looked at both costs and benefits.
➡➡ Measurement may include cost savings associated with floor space reduction, improvements in employee engagement, productivity, client feedback, pulse surveys, reduction in staff turnover, and number of women in leadership roles and talent pipeline.
The aim of this document is to provide organisations with workforce measures to calculate and determine where flexibility can influence and improve business outcomes, utilising industry standard calculations to build a business case for flexible work.
The steps involved in building your organisation’s business case for flexibility through workforce metrics are outlined below:
Step 1: Select workforce measures to reviewTo begin select the workforce measures and associated metrics most relevant to your organisation that you would like to review and benchmark from the categories below.
➡➡ uptake and perceptions of flexible work
➡➡ attraction of employees
➡➡ employee retention
➡➡ training investment
➡➡ productivity and engagement
➡➡ absenteeism
➡➡ employee wellbeing
➡➡ office space accommodation costs
➡➡ workforce composition.
Details on workforce metrics listed in the above categories are included in this document.
Step 2: Collate dataCollate the data required for your selected workforce measures and associated metrics. Please note some data points may take time to collect and will need to be collected or developed over time for a specific reporting period, for example calendar year.
A sample employee questionnaire template and the list of workforce metric formulas covered in this document are available as part of this toolkit to assist with the data collection phase. The data required for the workforce formulas can often be extracted from your organisation’s HRIS (Human Resource Information System).

Flexibility business case | www.wgea.gov.au 3
Step 3: Analyse and review your workforce metricsOnce you have collected your workforce data the next step is to analyse the data to be able to calculate and determine how your organisation currently sits across a number of workforce metrics where flexible work can impact and improve business outcomes.
Compare your data against specific workforce metric benchmarks you may have for your organisation internally, and where possible externally against industry peers and competitors through workforce benchmark reports to identify if you have any issues in particular areas or in comparison to the rest of your industry. If you identify a problem, you may have a strong case for considering and implementing change to your organisation’s flexibility strategy based on organisation performance and in maintaining industry and competitive standards.
To assess metrics between functional areas, compare the results of employees or teams already engaged in Flexible Work Arrangements (FWAs) with those employees or teams not working flexibly. These results could provide evidence of opportunities for improvement in your organisation’s approach to flexibility. It is useful to note that workforce metric benchmark results are often linked to each other, for example, absenteeism can be linked to productivity, engagement and performance.
Continue to measure the specific impact of flexibility in your organisation over time by recalculating each relevant metric at a chosen point after commencing a flexible work program, for example six months to two years later.
If your organisation’s flexibility capability is limited, you may see negative affects following the introduction of flexibility.
The final section of this toolkit outlines the areas where flexibility is more likely to negatively impact your organisation if the required investments are not made to support the change.
4
5
6

Flexibility business case | www.wgea.gov.au 4
➡➡ Flexible hours of work: This is where an employee may vary start and finish times.
➡➡ Compressed working weeks: An employee may work the same number of weekly (or fortnightly or monthly) working hours, compressed into a shorter period.
➡➡ Time-in-lieu: An employee may work approved overtime and be compensated by time-in-lieu. This can include ‘flexitime’ arrangements where an employee can work extra time over several days or weeks and then reclaim those hours as time off.
➡➡ Telecommuting: An employee may work at a location other than the official place of work.
➡➡ Part-time work: A regular work pattern where an employee may work less than full-time and is paid on a pro-rata basis for that work.
➡➡ Job sharing: A full-time job role is divided into multiple job roles and undertaken by two or more employees paid on a pro-rata basis for their part of the job.
➡➡ Another arrangement with varied hours, patterns or locations of work, e.g. overtime.
Flexible Working Rate (FWR)1
The FWR is the percentage of total employees who have a FWA. Calculating the FWR helps determine the extent to which flexible working arrangements are prevalent within your organisation, as well as the potential impact and linkage to other metrics and measures. Flexible working arrangements are often seen as a desirable workplace offering and can be beneficial for both the employer and employee. A low level of uptake within an organisation offering flexible work may highlight the need to promote and role model flexibility to reap its benefits.
How do you measure FWR? Some organisations choose to formally document and record FWAs, which provides the most accurate and complete picture of calculating the FWR and the number of employees working flexibly through different flexible work arrangements that may be offered within an organisation.
However, maintaining records on how many employees are utilising FWAs can sometimes be considered a barrier with some FWAs evolving in an informal way and instead employers may rely on employee surveys and feedback at a point in time to measure FWR more informally through employee feedback. This can be done by asking which FWA best describes an employee’s usual work arrangement?
Metric 1
Uptake and perceptions of flexible work
In a tightly regulated industry faced with shrinking margins, few financial institutions can afford to boost compensation significantly. However, there’s one thing they can offer to help attract qualified candidates, as well as engage and retain top talent: flexibility.
PwC’s annual Global CEO Survey found that 59% of industry CEOs viewed a shortage of skilled workers as a threat to the growth of their organisation.
Price➡Waterhouse➡Coopers➡17th➡Annual➡Global➡CEO➡Survey:➡Fit➡for➡the➡Future➡2014
Total➡number➡of➡flexible➡employees➡under➡FWA➡
Average➡total➡number➡of➡employees➡during➡the➡reporting➡periodx➡100
1Adjusted version of ‘Flexible Work Hours Rate’ taken from the Victorian Public Service Commission , A Dictionary of People Metrics. Accessed 25 June, 2015. http://vpsc.vic.gov.au/wp-content/pdf-download.php?postID=4991
Once you have determined the number of employees undertaking flexible working arrangements either formally or informally or both calculate:➡

Flexibility business case | www.wgea.gov.au 5
Question Strongly➡disagree
Disagree Neither➡disagree➡➡nor➡agree
Agree Strongly➡➡agree
I have the flexibility I need to manage my work and non-work interests e.g. caring responsibilities, study, sporting interests etc.
Question Strongly➡disagree
Disagree Neither➡disagree➡➡nor➡agree
Agree Strongly➡➡agree
Senior managers genuinely support equality between women and men.
Our CEO genuinely supports equality between women and men.
Commitment to workplace gender equality
Commitment to workplace gender equality measures the overall support for gender equality in a workplace. This measure is linked to the level of flexible work satisfaction and support employees receive, particularly when reviewing flexibility by gender equality for females and males.
Flexible work satisfaction is a measure of employee satisfaction with their flexible working arrangements.
Assess responses from employees to the following question in an employee survey.
Collect employee responses to the following questions:
Flexible work satisfaction
Flexibility was the fifth ranked employment driver, with 45% rating it as highly important. Flexibility was the top-ranked driver for parents (50%). 18% indicated they had considered resigning in the past six months due to lack of flexibility.Diversity➡Council➡Australia,➡National➡Survey➡conducted➡2010
How➡do➡you➡measure➡it?
How➡do➡you➡measure➡it?
Employers may find it useful to measure FWR by certain job characteristics to understand which employee categories are utilising FWAs. Dimensions such as job function (e.g. marketing, operations), career level (e.g. executive, management), pay grade, performance rating, as well as gender can be used to assess and measure the FWR within your organisation and the extent to which flexible working positively influences your organisation.
Flexibility business case | www.wgea.gov.au 6
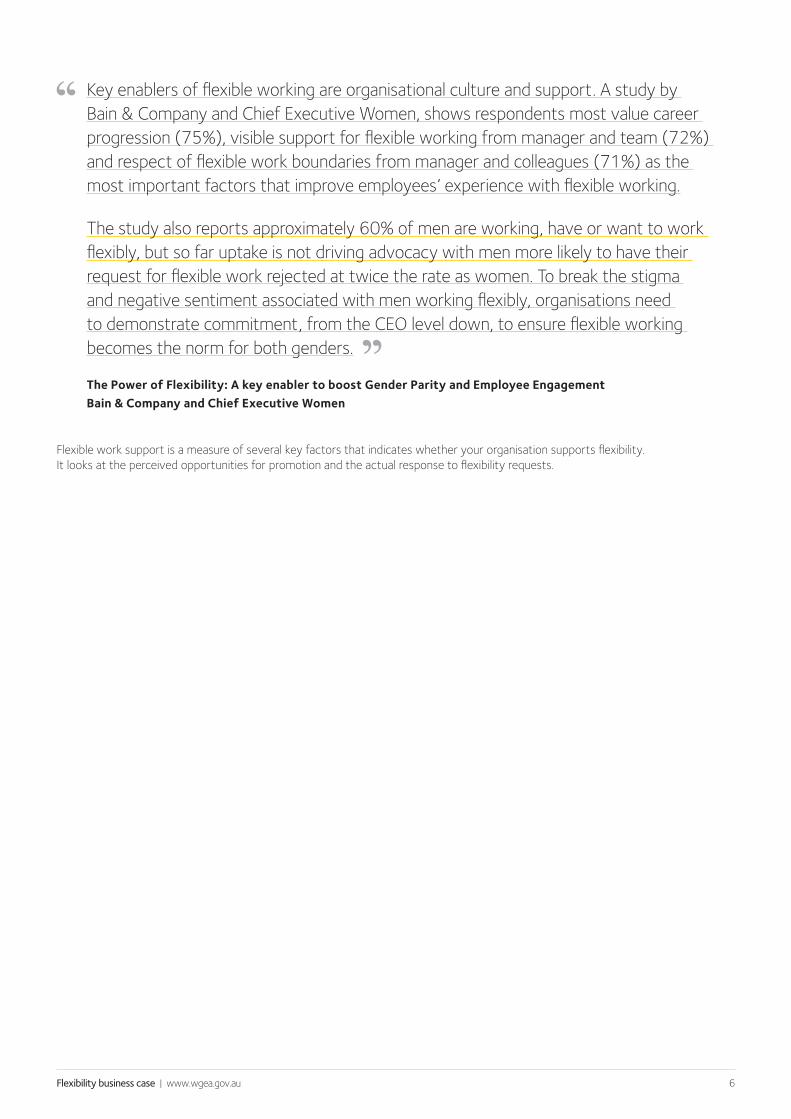
Flexible work support is a measure of several key factors that indicates whether your organisation supports flexibility. It looks at the perceived opportunities for promotion and the actual response to flexibility requests.
Key enablers of flexible working are organisational culture and support. A study by Bain & Company and Chief Executive Women, shows respondents most value career progression (75%), visible support for flexible working from manager and team (72%) and respect of flexible work boundaries from manager and colleagues (71%) as the most important factors that improve employees’ experience with flexible working.
The study also reports approximately 60% of men are working, have or want to work flexibly, but so far uptake is not driving advocacy with men more likely to have their request for flexible work rejected at twice the rate as women. To break the stigma and negative sentiment associated with men working flexibly, organisations need to demonstrate commitment, from the CEO level down, to ensure flexible working becomes the norm for both genders.
The➡Power➡of➡Flexibility:➡A➡key➡enabler➡to➡boost➡Gender➡Parity➡and➡Employee➡EngagementBain➡&➡Company➡and➡Chief➡Executive➡Women

Flexibility business case | www.wgea.gov.au 7
Question Strongly➡disagree
Disagree Neither➡disagree➡➡nor➡agree
Agree Strongly➡➡agree
I have the same opportunities for promotion as anyone else with my ability and experience.
My responsibilities outside of work restrict my opportunities for promotion.
It is difficult for me to adopt a flexible working arrangement because of a lack of support from my supervisor.
I am able to access ad hoc flexibility when my needs change on short notice.
Flexible work is actively encouraged in my work area.
If I worked flexibly, my commitment to the organisation would be questioned.
Men are actively encouraged to adopt flexible working arrangements in this organisation.
Being a part-time manager is an option in this organisation.
Analyse responses to the following questions in an employee survey and compare responses from those employees with a FWA to those not working flexibly.
How➡do➡you➡measure➡it?
Flexible work support

Flexibility business case | www.wgea.gov.au 8
Employee responses to the following questions could provide additional insight into how well supported employees feel when negotiating FWAs within your organisation.
Question
In the past 12 months have you asked for a change in your work arrangements in terms of flexibility, for example, number of hours, variation in core hours or days, location of workplace (i.e. work from home or a different office), for longer than a month.
Was your request:
If your request was partly granted, was this outcome:
Yes
Fully granted
I have not received a reply yet
No
Partly granted
Unsatisfactory for you
Prefer not to answer
Satisfactory for you
Prefer not to answer
Declined
Prefer not to answer
Manager quality index2
The manager quality index is a measure of an employee’s perception of the quality of their immediate manager and can be linked to their manager’s support of flexible working. Organisations often choose to measure manager quality using a combination of performance management tools and survey data.
My➡immediate➡supervisor/manager:
Strongly➡disagree
Disagree Neither➡disagree➡➡nor➡agree
Agree Strongly➡➡agree
Values differences in people.
Gives me feedback on my performance that I find helpful.
Has discussed my career development needs with me within the past 12 months.
Is supportive of flexible work practice and has discussed flexible working options with me.
Genuinely supports equality between women and men.
Use industry standard performance assessment tools such as HR Scorecard or 360-degree feedback. Alternatively, collect employee responses to the following questions and link this to flexible working practice.
How➡do➡you➡measure➡it?
2Victorian Public Service Commission (2015), A Dictionary of People Metrics. Accessed 25 June, 2015. http://vpsc.vic.gov.au/wp-content/pdf-download.php?postID=4991

Flexibility business case | www.wgea.gov.au 9
Metric 2
Attraction of employees
Flexibility is a highly desirable workforce benefit: more than three quarters of parents desire more flexibility in their jobs (Flexjobs 20133).
Of employees globally, 41% say flexibility is one of the most important factors they consider when evaluating a job opportunity and 43% value flexibility so greatly that they would prefer it over a pay rise.
UnifyCo,➡20145
4
Employment brand strength6
Employment brand strength is a measure of how attractive an organisation is to potential employees. Measuring the strength of your employment brand and comparing responses from employees on a FWA compared with those not working flexibly can indicate the extent to which flexibility is helping you build your organisation’s brand and reputation to attract employees positively.
Collecting employee responses to the following questions can provide a measure of employment brand strength. How➡do➡you➡measure➡it?
➡Question Strongly➡disagree
Disagree Neither➡disagree➡➡nor➡agree
Agree Strongly➡➡agree
I would recommend working in this organisation to my male friends.
I would recommend working in this organisation to my female friends.
3US News: Money (September 12, 2013). What working mums really want. Accessed 27 June 2015 http://money.usnews.com/money/blogs/outside-voices-careers/2013/09/12/what-working-moms-really-want
4Kelly Global Workforce Index 2013 Employee Engagement and Retention. Accessed 27 June, 2015. http://www.kellyocg.com/uploadedFiles/Content/Knowledge/Kelly_Global_Workforce_Index_Content/Employee_Engagement_and_Retention_2013_KGWI.pdf
5http://www.unify.com/us/news/2846D70A-ACA6-4146-9B00-955E6114038E/
6Victorian Public Service Commission (2015), A Dictionary of People Metrics. Accessed 25 June, 2015. http://vpsc.vic.gov.au/wp-content/pdf-download.php?postID=4991

Flexibility business case | www.wgea.gov.au 10
Organisation Net Promoter Score The Net Promoter Score (NPS) is often used by organisations as a marketing tool to provide consumer insights on market perspectives with customers divided into three categories Promoters, Passives and Detractors. A number of organisations are starting to use a variant of the NPS as a key performance indicator (KPI) measure on employee perception as an employee Net Promoter Score (eNPS). The eNPS is based on asking employees whether they would recommend an organisation as a good place to work and can be used to understand the perception of your organisation by employees and the impact flexible working arrangements can have.
In the Bain & Company and Chief Executive Women study20 a NPS was calculated based on respondents answering on a scale of 1-10 ‘How likely they would be to recommend their organisation as a place to work?’ and ‘How likely they would be to recommend their organisation as a place for women to progress to senior levels’?
The results in the Bain & Company study found organisations that reported a significantly higher NPS were organisations where flexible working is widely used with a 72 point difference between organisations with no flexible working arrangements (13 vs -59). However, it is important to note that organisations where flexible working is available but rarely used also received a negative NPS (negative 22). By actively encouraging flexible working arrangements and ensuring they are widely used, organisations could gain 35 advocacy points.
Bain➡&➡Company➡and➡Chief➡Executive➡Women➡Net➡Promoter➡Score➡(NPS)➡explained
The NPS grouped respondents into three categories: promoters, passives and detractors. NPS is calculated by subtracting the percentage of detractors from the percentage of promoters.
Promoters (score 9 or 10): People who feel that their lives have been enriched by their relationship with their organisation or leader. They behave like loyal employees, typically staying longer and talking the organisation up to their friends and colleagues.
Passives (score 7 or 8): People who are fairly satisfied employees, but not loyal ones. They rarely talk their company up, and when they do, it is likely to be qualified and unenthusiastic. If a better offer comes along, they are likely to defect.
Detractors (score of 0 to 6): Employees who feel their lives have been diminished by their association with their organisation or leader. They are dissatisfied and even dismayed by how they are treated. They frequently speak negatively about their organisation and are likely to leave as soon as they find something better.
20Bain & Company and Chief Executive Women (CEW) (2016), The Power of Flexibility: A Key Enabler to Boost Gender Parity and Employee Engagement. Accessed 4 February 2016. http://www.bain.com/publications/articles/the-power-of-flexibility.aspx

Flexibility business case | www.wgea.gov.au 11
Flexibility is highly desirable for many employees and an organisation’s ability to attract and retain employees who want access to flexible working arrangements may contribute to greater employee engagement and an organisation’s brand and reputation. Anecdotal reports indicate employees who need flexible working arrangements are often less likely to leave their employer if they are provided with desired flexibility as part of their workforce benefits. Flexibility can also help employees resolve issues outside of work, particularly carer responsibilities that may have otherwise hindered their ability to work. Although it is important to note that while flexible work was once only associated with care giving responsibilities, today employees want access to flexible work for a wider range of personal reasons including study and sport.
Outlined below are a number of ways to measure retention and turnover rates. Retention and turnover rates are complementary, but calculated differently because they measure different workforce metrics. Retention answers the question, ‘What percentage of all the employee who have walked through our doors are still here for a given period?’, while turnover metrics calculate the percentage of employees who have left an organisation over a given period.
Metric 3
Retention of employees
Canadian company Telus found 100% of its mobile and at-home workers were low-risk in regards to leaving the organisation.7
Flexible IT policies such as the ability to use technology to work from home or use social media play a major role in overall employee satisfaction and retention. Employees without access to flexible IT policies are less satisfied with their job. Only 62% of employees without access to flexible IT policies report feeling satisfied at work. Up to 83% of employees with access to flexible IT policies (such as social media access) report feeling satisfied at work.
Telus:➡New➡study➡demonstrates➡why➡Canadian➡businesses➡➡should➡embrace➡a➡flexible➡working➡program➡2014➡➡
Deloitte➡Access➡Economics;➡War➡for➡talent➡in➡the➡digital➡economy➡2013➡
Comparing both the retention and turnover rates of employees working flexibly to those not working flexibly will help organisations assess the impact flexible working has on their ability to retain employees. In addition, reviewing the retention and turnover rates by different employee categories (e.g. career level and gender) can help determine where flexible working may be impacting your organisation’s workforce.
7Telus. New study demonstrates why Canadian businesses should embrace a flexible working program. 15 September 2014. Accessed 27 June 2015 http://about.telus.com/community/english/news_centre/news_releases/blog/2014/09/15/new-study-demonstrates-why-canadian-businesses-should-embrace-a-flexible-working-program

Flexibility business case | www.wgea.gov.au 12
Retention rate8
The retention rate is the percentage of employees who continue to remain employed at an organisation during the period being measured (e.g. calendar year).
Employee retention index9
The employee retention index is a relative measure that determines the extent to which employees intend to leave an organisation.
How➡do➡you➡measure➡it?
Start➡of➡period➡headcount➡plus➡external➡hires➡minus➡terminations➡
Start➡of➡period➡headcount➡plus➡external➡hiresx➡100
Collect employee responses to the following questions: How➡do➡you➡measure➡it?
Question
Compared with a year ago, do you feel more or less loyal to this organisation?10
Do you intend to look for a job with another organisation within the next year?11
How long do you intend on working for this organisation?
More
Yes
0-6 months
2-5 years
Less
No
6 months to 1 year
As long as possible
No change
Not sure
1-2 years
Not sure
8Victorian Public Service Commission (2015), A Dictionary of People Metrics. Accessed 25 June, 2015. http://vpsc.vic.gov.au/wp-content/pdf-download.php?postID=499
9Victorian Public Service Commission (2015), A Dictionary of People Metrics. Accessed 25 June, 2015. http://vpsc.vic.gov.au/wp-content/pdf-download.php?postID=4991
10This question is modelled on one in the Kelly Global Workforce Index. Accessed 27 June 2015. http://www.kellyocg.com/uploadedFiles/7-KellyOCG/2-Knowledge/Workforce_Trends/Employee_Engagement_and_Retention_2013_KGWI.pdf
11Kelly Global Workforce Index 2013 Employee Engagement and Retention. Accessed 27 June, 2015. http://www.kellyocg.com/uploadedFiles/Content/Knowledge/Kelly_Global_Workforce_Index_Content/Employee_Engagement_and_Retention_2013_KGWI.pdf
Flexibility business case | www.wgea.gov.au 13
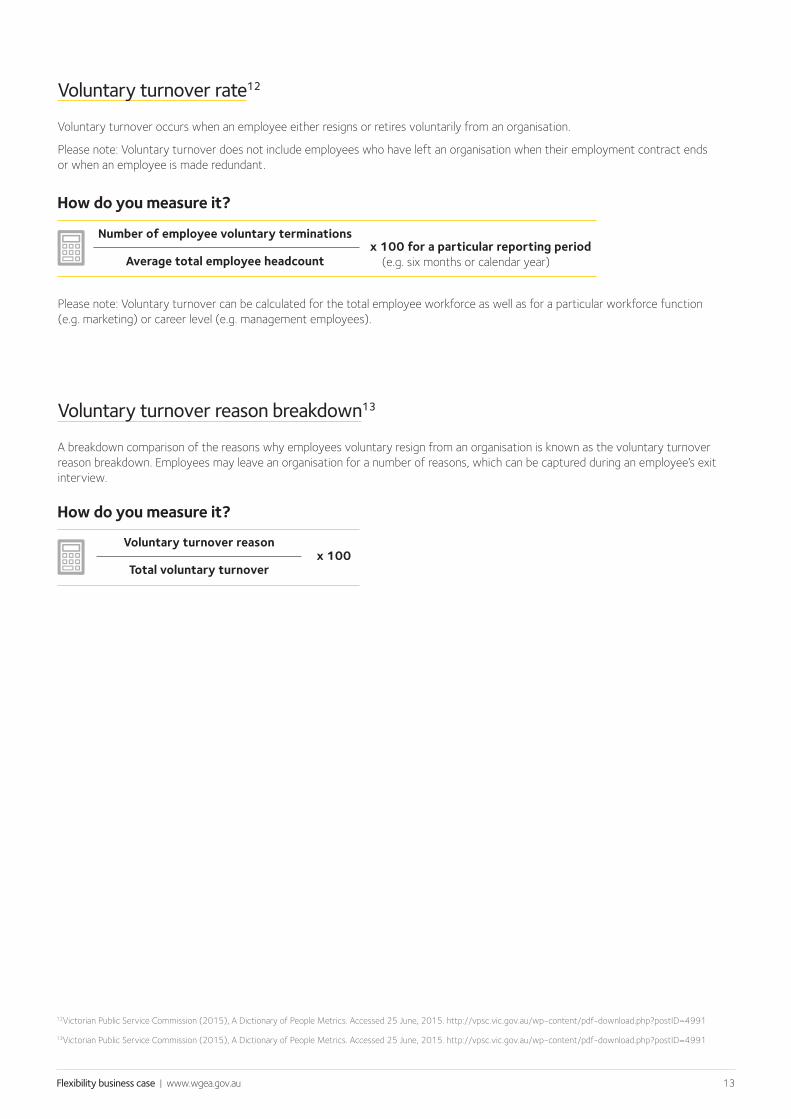
Voluntary turnover rate12
Voluntary turnover occurs when an employee either resigns or retires voluntarily from an organisation.
Please note: Voluntary turnover does not include employees who have left an organisation when their employment contract ends or when an employee is made redundant.
Voluntary turnover reason breakdown13
A breakdown comparison of the reasons why employees voluntary resign from an organisation is known as the voluntary turnover reason breakdown. Employees may leave an organisation for a number of reasons, which can be captured during an employee’s exit interview.
Please note: Voluntary turnover can be calculated for the total employee workforce as well as for a particular workforce function (e.g. marketing) or career level (e.g. management employees).
How➡do➡you➡measure➡it?
How➡do➡you➡measure➡it?
Number➡of➡employee➡voluntary➡terminations
Average➡total➡employee➡headcount➡
Voluntary➡turnover➡reason➡
Total➡voluntary➡turnover
x➡100➡for➡a➡particular➡reporting➡period➡➡➡➡➡➡(e.g. six months or calendar year)
x➡100
12Victorian Public Service Commission (2015), A Dictionary of People Metrics. Accessed 25 June, 2015. http://vpsc.vic.gov.au/wp-content/pdf-download.php?postID=4991
13Victorian Public Service Commission (2015), A Dictionary of People Metrics. Accessed 25 June, 2015. http://vpsc.vic.gov.au/wp-content/pdf-download.php?postID=4991

Flexibility business case | www.wgea.gov.au 14
Metrics on flexible work training are useful in assessing how much organisations are providing managers and employees to support flexible working arrangements, as well as managing return to work strategies from parental leave and unconscious bias training to improve flexibility for all employees within an organisation.
Understanding the prevalence of training in different areas and linking these to flexible work outcomes for employees and business outcomes can help determine if a relationship exists between other workforce flexibility measures and the training investment. Training investment in flexible work initiatives can also reinforce an organisation’s brand and employee perception of support towards flexible working arrangements.
Benchmarks on training investment and associated costs that an organisation can use include:
Metric 4
Training investment
Total➡training➡cost➡
Average➡number➡of➡employees➡for➡a➡selected➡reporting➡period
Total➡number➡of➡training➡hours➡
Average➡number➡of➡employees➡for➡a➡selected➡reporting➡period
Average➡number➡of➡employees➡provided➡with➡training➡
Average➡number➡of➡employees➡for➡a➡selected➡reporting➡period➡
➡➡ Training➡cost➡per➡employee➡
➡➡ Number➡of➡training➡hours➡per➡employee➡➡
➡➡ Percentage➡of➡employees➡provided➡with➡training➡➡➡
x➡100
In addition to reviewing the training investment metrics overall and across the employee population for an organisation, each of the training investment metrics can be analysed further by specific employee groups and career levels, as well as the type of training undertaken.
Flexibility business case | www.wgea.gov.au 15
A number of studies and anecdotal reports over the last few years have drawn a positive connection between flexible working and improved productivity and revenue generation. Flexibility can improve productivity through a range of factors, including increased employee engagement and performance.
Metric 5
Productivity and engagement
Australian insurance business Suncorp reported a range of improved measures in its commercial insurance claims area, where the majority of employees now work flexibly. These employees now demonstrate high levels of commitment and productivity, leading to high customer satisfaction ratings.14
At telecommunications company Nortel, nearly all flexible workers (94%) reported their productivity was up – and 65% of managers agreed with them. The average increase in productivity ranged from 15% to 20%.
72% of firms participating in a global study by Regus in 2012 said there was a direct link between flexible work practices and increased productivity.
Availability of flexible work options is an even more critical means to enable greater workforce participation for new parents. 22% of men and women reported the availability of flexible options was important in their choice to return to work as reported in the Bain & Company and Chief Executive Women study. Bolstering childcare options, in conjunction with flexible work options, could significantly help with employee retention and improve the overall productivity of Australia’s workforce.
Flexibility➡dividend:➡why➡supported➡employees➡increase➡customer➡satisfaction,➡2015➡
Flexibility➡UK,➡2015
Annabel➡Palmer,➡a➡New➡Approach➡to➡9-5,➡2014
The➡Power➡of➡Flexibility:➡A➡key➡enabler➡to➡boost➡Gender➡Parity➡and➡Employee➡EngagementBain➡&➡Company➡and➡Chief➡Executive➡Women,➡2016
14University of New South Wales Business School (2015). Flexibility dividend: why supported employees increase customer satisfaction. Accessed 29 June 2015 https://www.businessthink.unsw.edu.au/Pages/Flexibility-dividend-Why-supported-employees-increase-customer-satisfaction.aspx

Flexibility business case | www.wgea.gov.au 16
Employee engagement
Employee engagement can be influenced by a range of factors, including compensation and benefits, job fit, relationship with management and peers, alignment of business purpose, strategy and roles, and flexibility.
Analysing the engagement scores of those working flexibly with those not working flexibly will measure the impact flexibility has on engagement.
Due to this complexity, employee engagement survey providers are best placed to help measure engagement. However, a manager’s support and quality index has been identified as having a significant impact on engagement. In fact, a recent survey found 63% of employees say their direct manager has a significant impact on their satisfaction and engagement levels.15
Canadian firm Telus increased its engagement scores from 53% to 83% simply by introducing a flexible working program. In another example, Cranfield University found that flexible workers had higher levels of organisational commitment.
Women who work flexibly are equally, if not more, confident and committed to career progression than women who do not as reported in the Bain & Company and Chief Executive Women study. The report also indicates 53% of women currently using flex models aspire to be senior business leaders or executives, compared to 43% of women who have not used flex models.7
15Kelly Global Workforce Index 2013 Employee Engagement and Retention. Accessed 27 June, 2015. http://www.kellyocg.com/uploadedFiles/Content/Knowledge/Kelly_Global_Workforce_Index_Content/Employee_Engagement_and_Retention_2013_KGWI.pdf

Flexibility business case | www.wgea.gov.au 17
Unscheduled absence metrics indicates both lost time and productivity loss organisations experience due to sick leave, worker’s compensation and other miscellaneous reasons. Unscheduled absences can also be an indication of poor employee morale and can be linked to likely turnover in the near future.
Organisations with flexible working practices, particularly in relation to telecommuting, generally report a decline in absenteeism with a number of anecdotal reports outlining the link between reduced absenteeism and flexible working arrangements. One reason for this decline is that flexibility often gives employees the opportunity to adjust their work schedule or location to be able to manage absences due to caring responsibilities or other personal commitments.
Metric 6
Absenteeism
Unscheduled absence per employee16
Unscheduled absence per employee is the total days of workdays employees have been absent divided by the average number of employees for a selected reporting period, for example calendar year.
How➡do➡you➡measure➡it?
Total➡number➡of➡workdays➡employees➡have➡been➡absent➡➡
Average➡number➡of➡employees➡(Full➡Time➡Equivalent)➡for➡the➡reporting➡period
16Victorian Public Service Commission (2015), A Dictionary of People Metrics. Accessed 25 June, 2015. http://vpsc.vic.gov.au/wp-content/pdf-download.php?postID=4991

Flexibility business case | www.wgea.gov.au 18
Metric 7
Employee wellbeing
Work health and safety incident rate
The work health and safety incident rate is a measure of the rate of work health and safety incidents. Comparing the rate of incidents amongst flexible workers to those not working flexibly will provide an indication of the extent to which flexibility is contributing to a healthier and safer workforce.
Wellbeing index
The wellbeing index offers a comparison of employees’ wellbeing at work. Wellbeing is defined differently across organisations and often overlaps with metrics such as engagement. It is best to seek information from a range of sources to understand how to assess wellbeing in your organisation, such as the Australian Psychological Society and BlackDog Institute.
Flexibility helps employees manage their work and life commitments while enabling them to work in a way that better suits their lifestyle and schedule. This can lead to lower stress levels and improved health outcomes.
5
1 9

Flexibility business case | www.wgea.gov.au 19
Metric 8
Office space accommodation costs
One of the most documented benefits of flexible working for organisations is the potential to reduce office costs through flexible working arrangements such as working from home, particularly when organisations adopt Activity Based Working (ABW). In workplaces using ABW, individuals are not assigned desks, so fewer desks are needed. Some reports indicate ABW can typically reduce the amount of office space required by up to 30%, reducing recurrent occupancy costs. Studies have also shown clutter and paper usage in the workplace is significantly reduced through ABW arrangements.
In 2012, KPMG shifted to activity based working and created in-office ‘neighbourhoods’ for 80 staff in its Sydney building. Employees chose from ‘focused’ areas on the rim, comprising desks with high partitions, and more collaborative spaces, with sofas and the like, in the building’s centre. The reorganisation resulted in 82% of participants reporting the arrangement allowed them to better connect and collaborate with colleagues, and 75% felt their productivity either increased or remained consistent.
The reorganisation also slashed the amount of office space required per person by up to 35% and paper use by 65% (KPMG: activity-based workplace reorganization, Human Resource Media, AHRI Report http://www.hrmonline.com.au/section/featured/kpmg-activity-based-workplace-reorganisation)
However, it also important to note and consider that a number of anecdotal reports indicate that ABW has impacted and reduced employee satisfaction levels and ABW may not suit all organisations.
Accommodation cost per employee
Accommodation cost per employee is one of the common measures to be able to quantitatively assess an organisation’s expenditure to house an employee and in turn the business benefits for flexible and activity based working. amongst flexible workers to those not working flexibly will provide an indication of the extent to which flexibility is contributing to a healthier and safer workforce.
How➡do➡you➡measure➡it?
Total➡accommodation➡cost➡➡➡
Average➡number➡of➡employees➡(FTE)➡
Does working from home (WFH) work? Evidence from a Chinese experiment
We report the results of a ‘Working from Home’ experiment at Ctrip, a 16,000-employee, NASDAQ-listed Chinese travel agency. Call centre employees who volunteered for the work-from-home (WFH) experiment were randomly assigned to work either from home or in the office for nine months. Home working led to a 13% performance increase, of which 9% came from working more minutes per shift (fewer breaks and sick days) and 4% from more calls per minute (attributed to a quieter and more convenient working environment).
Home workers also reported improved work satisfaction, and their attrition rate halved. Due to the success of the experiment, Ctrip rolled out the WFH option to the whole firm and allowed the experimental employees to re-select between the home and office. Interestingly, more than half of them switched, which led to the gains from WFH almost doubling to 22%.Published➡by➡Oxford➡University➡Press➡201421
21Oxford Journals (2015), The Quarterly Journal of Economics, Does Working from Home Work? Evidence from a Chinese Experiment. Published on 26 February 2016. http://qje.oxfordjournals.org/content/early/2015/02/08/qje.qju032.abstract

Flexibility business case | www.wgea.gov.au 20
Metric 9
Workforce composition
Flexible work arrangements can give employees alternative employment and work opportunities to balance other commitments and provides options for people who find it difficult to work the conventional Monday to Friday, 9 to 5 working week. For example, a 2012 survey reported 60% of mature workers said they would work from home if it were available to them, delaying retirement by an average of 6.6 years17. The same survey found almost three quarters of people not in the labour force with family or carer responsibilities would do the same18. Flexibility could therefore result in a change in workforce composition among groups that otherwise have limited participation, such as people with carer responsibilities, mature age workers and people with disabilities.
Gender composition19
Gender composition is the breakdown of your workforce by gender.
Age breakdownAge staffing breakdown measures the distribution of headcount by age at the end of a selected reporting period.
How➡do➡you➡measure➡it?
How➡do➡you➡measure➡it?
End➡of➡selected➡reporting➡period➡headcount➡by➡gender➡➡➡➡
End➡of➡selected➡reporting➡period➡headcount➡
End➡of➡selected➡reporting➡period➡headcount➡by➡age➡➡➡➡
End➡of➡selected➡reporting➡period➡headcount➡➡
x➡100
x➡100
Workforce composition metrics allow organisations to monitor the workforce demographic profile to be able to determine gender ratios and whether an organisation has an ageing workforce. Such measures in turn can assist organisations to develop their flexible work strategies accordingly for maximum business and employee benefit. Each of the measures can be reviewed aggregately across the workforce as well as by different employee groups (e.g. career level, gender, age) and can help to determine where flexible working may be impacting your organisation’s workforce.
Employee workforce demographic metrics include:
17Deloitte Access Economics and Colmar Brunton (2012). Creating jobs through NBN-enabled telework.
18Deloitte Access Economics and Colmar Brunton (2012). Creating jobs through NBN-enabled telework.
19Victorian Public Service Commission (2015), A Dictionary of People Metrics. Accessed 25 June, 2015. http://vpsc.vic.gov.au/wp-content/pdf-download.php?postID=4991
Flexibility business case | www.wgea.gov.au 21
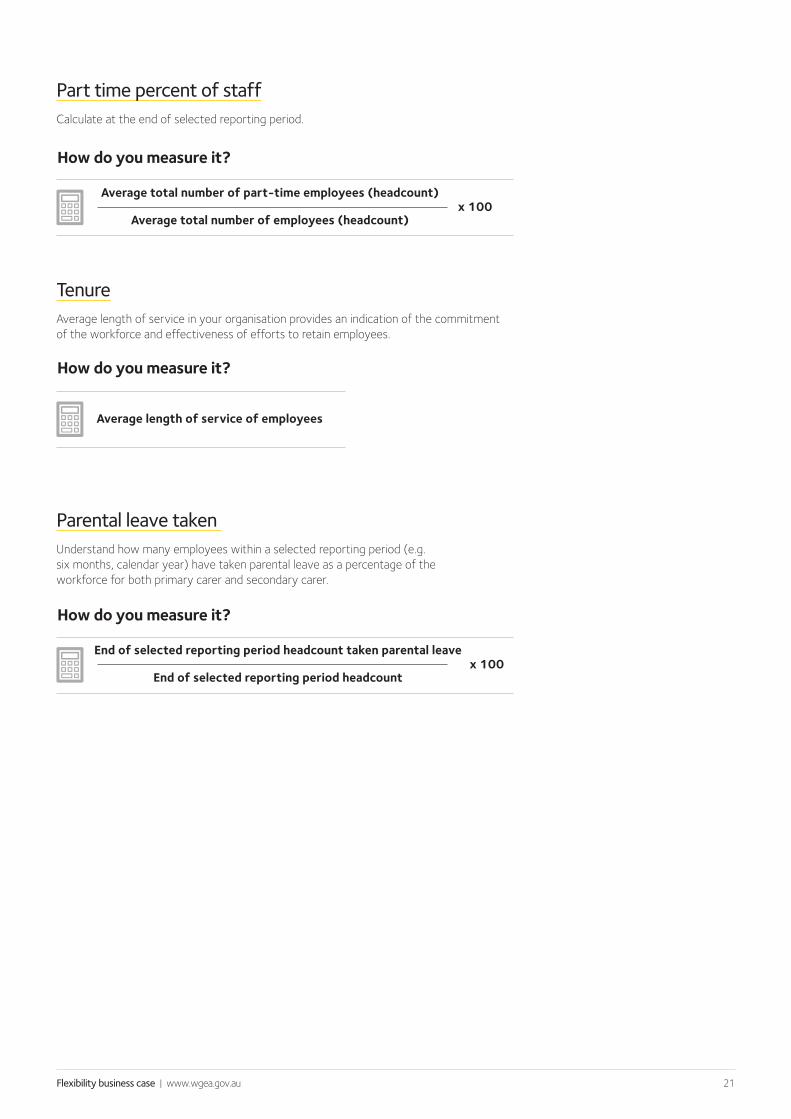
Part time percent of staffCalculate at the end of selected reporting period.
Parental leave taken Understand how many employees within a selected reporting period (e.g. six months, calendar year) have taken parental leave as a percentage of the workforce for both primary carer and secondary carer.
TenureAverage length of service in your organisation provides an indication of the commitment of the workforce and effectiveness of efforts to retain employees.
How➡do➡you➡measure➡it?
How➡do➡you➡measure➡it?
How➡do➡you➡measure➡it?
Average➡total➡number➡of➡part-time➡employees➡(headcount)➡➡➡➡
Average➡total➡number➡of➡employees➡(headcount)➡
End➡of➡selected➡reporting➡period➡headcount➡taken➡parental➡leave➡➡➡➡➡
End➡of➡selected➡reporting➡period➡headcount➡
Average➡length➡of➡service➡of➡employees
x➡100
x➡100

Flexibility business case | www.wgea.gov.au 22
Areas of potential negative impact
Employee attraction and retention
Flexibility will only help you attract and retain employees if the promise of flexible working translates into reality. Moreover, a flexible working strategy that creates a culture of work anywhere, everywhere and all the time can create unreasonable work intensification that prompts employees to leave. It is important to identify in an organsiation’s flexible work policy and strategy the extent of flexible work arrangements that are available and to communicate any limitations clearly to staff, for example, not all flexible work requests can be fully approved.
Promotion rate and performance evaluation scores
One of the often-reported risks of flexibility is reduced potential for advancement. Flexible workers talk about being ‘out of sight, out of mind’ or having their performance assessed more harshly because their efforts are not as visible. In addition, part-time employees are often seen as less committed to their career and so are overlooked for promotions. Breaking down the number of promotions and the performance scores by those working flexibly and those not will help you assess if this problem is occurring in your workplace.
Wellbeing
Flexibility helps employees manage their work and life commitments. As noted above, this increased control can lower stress.
Nonetheless, stress levels can rise if flexibility is poorly managed. For example, not redesigning part-time roles to allow the required work to be delivered in fewer hours, can lead to employees feeling over-worked and resentful and as such it is important to review flexible work requests together with the organisation structure and workforce plans.
Achieving positive results from a flexible working strategy requires a commitment from leadership and a new capability from management. As a result, some organisations may see negative impacts if the required investments – in manager capability and technology in particular – are not made.
This section provides key metrics that could be negatively impacted by poorly managed flexibility.
You can use the readiness assessment tool to discover your organisation’s current position on the flexibility journey.

Flexibility business case | www.wgea.gov.au 23
Copyright➡and➡Disclaimer➡
This toolkit is shared openly with the intent of promoting progress towards workplace gender equality. Ownership of the intellectual property within this toolkit rests with the Workplace Gender Equality Agency.
The ideas and recommendations contained within this toolkit are used or adopted entirely at the discretion and own risk of employers. The Workplace Gender Equality Agency cannot accept any responsibility or liability for outcomes resulting from the use of this toolkit, either directly or indirectly.
Acknowledgements➡
The Agency would like to acknowledge and thank Nina Sochon for her involvement in the development of this document.
1
3
9

For➡further➡advice➡➡and➡assistance,➡➡please➡contact:
Workplace Gender Equality Agency Level 7, 309 Kent Street Sydney NSW 2000
t: 02 9432 7000 or 1800 730 233
e: [email protected] www.wgea.gov.au
Advice and assistance