Flattening the earth - UNESCO
24
Multispectral Indices
Transcript of Flattening the earth - UNESCO
Multispectral Indices

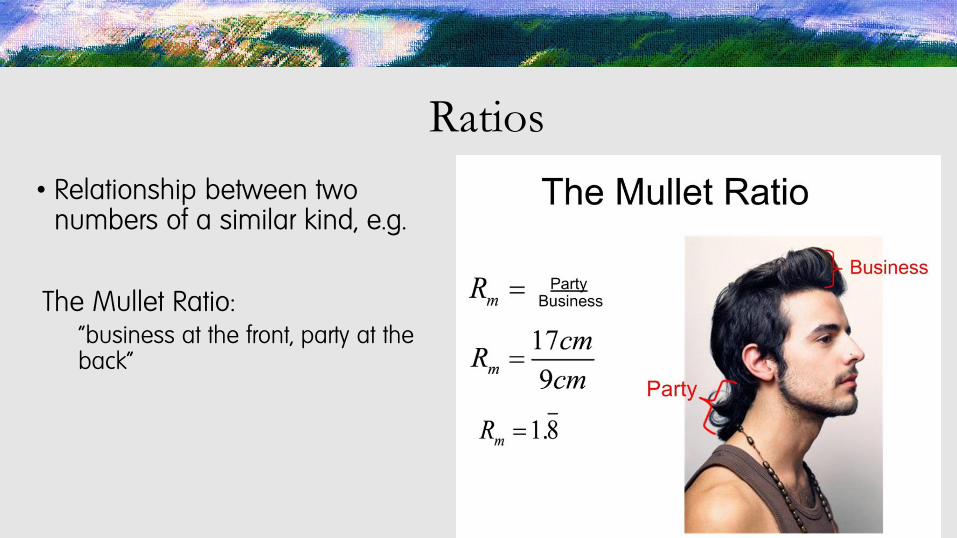
Ratios
• Relationship between two numbers of a similar kind, e.g.
The Mullet Ratio:“business at the front, party at the back”

RS Ratios
• compare the reflectance in two bands
• if you know the shape of the spectral signature of target features, ratios can help distinguish features
• not (usually) a method used in isolation – part of process • convergence of evidence
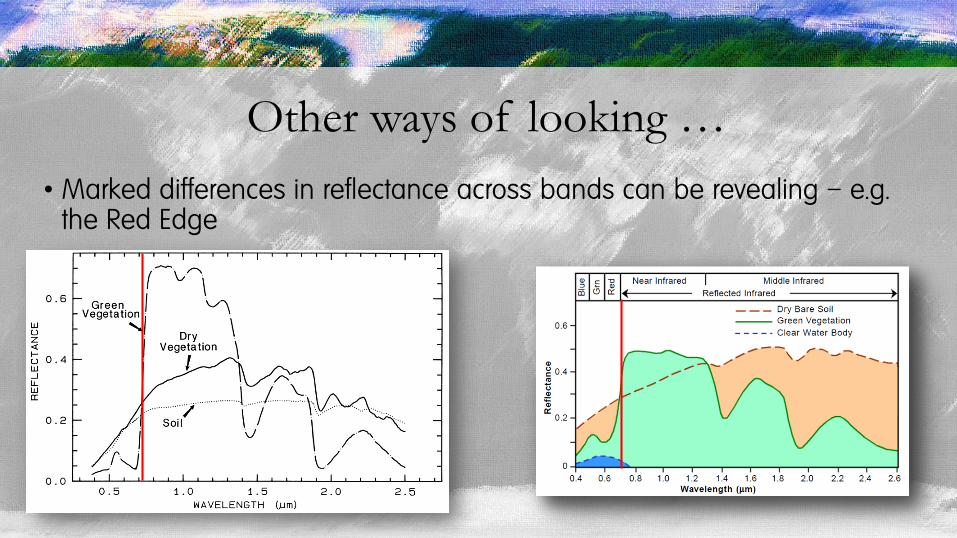
Other ways of looking …
• Marked differences in reflectance across bands can be revealing – e.g. the Red Edge
Th
e R
ed E
dge
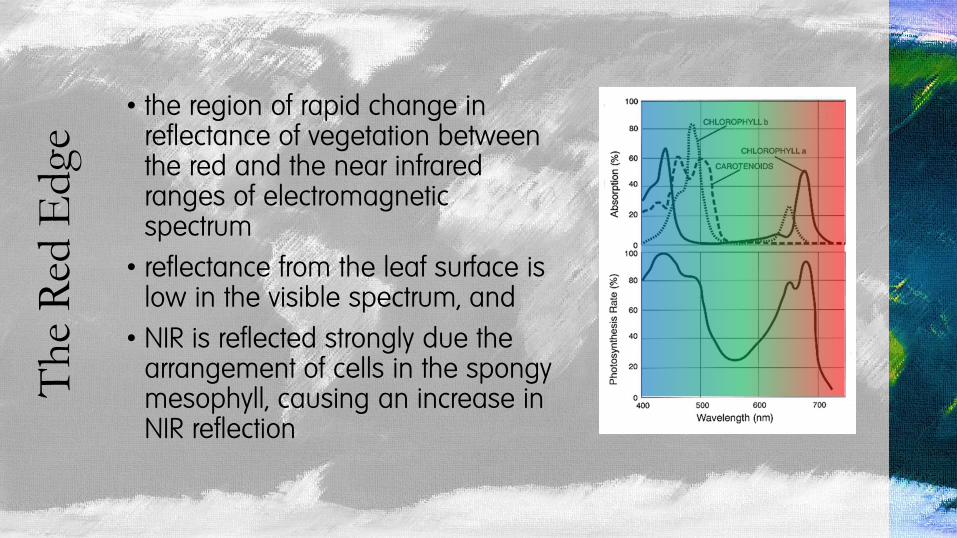
• the region of rapid change in reflectance of vegetation between the red and the near infrared ranges of electromagnetic spectrum
• reflectance from the leaf surface is low in the visible spectrum, and
• NIR is reflected strongly due the arrangement of cells in the spongy mesophyll, causing an increase in NIR reflection

Sen
sor
ban
ds
Veg
etat
ion
in
dic
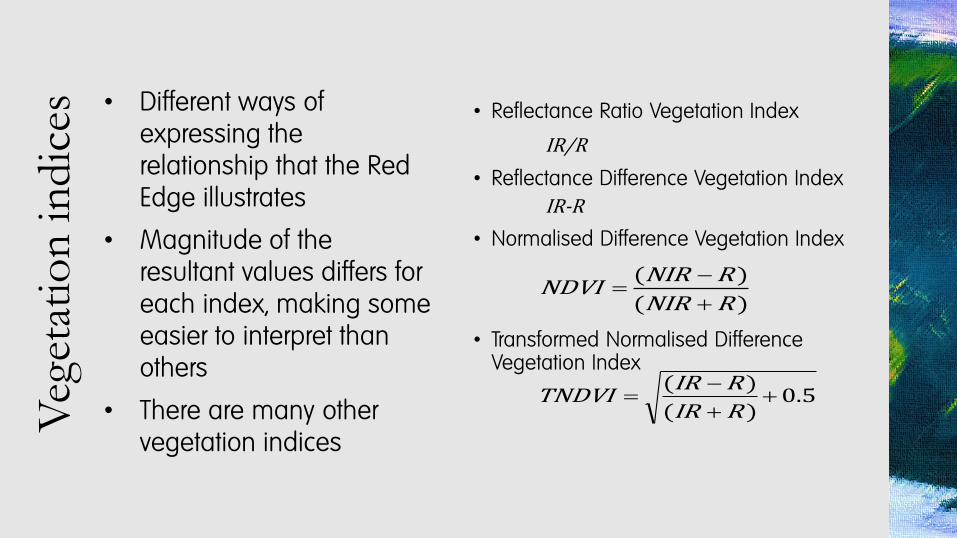
es • Reflectance Ratio Vegetation Index
IR/R
• Reflectance Difference Vegetation IndexIR-R
• Normalised Difference Vegetation Index
• Transformed Normalised Difference Vegetation Index
)(
)(
RNIR
RNIRNDVI
5.0)(
)(
RIR
RIRTNDVI
• Different ways of expressing the relationship that the Red Edge illustrates
• Magnitude of the resultant values differs for each index, making some easier to interpret than others
• There are many other vegetation indices
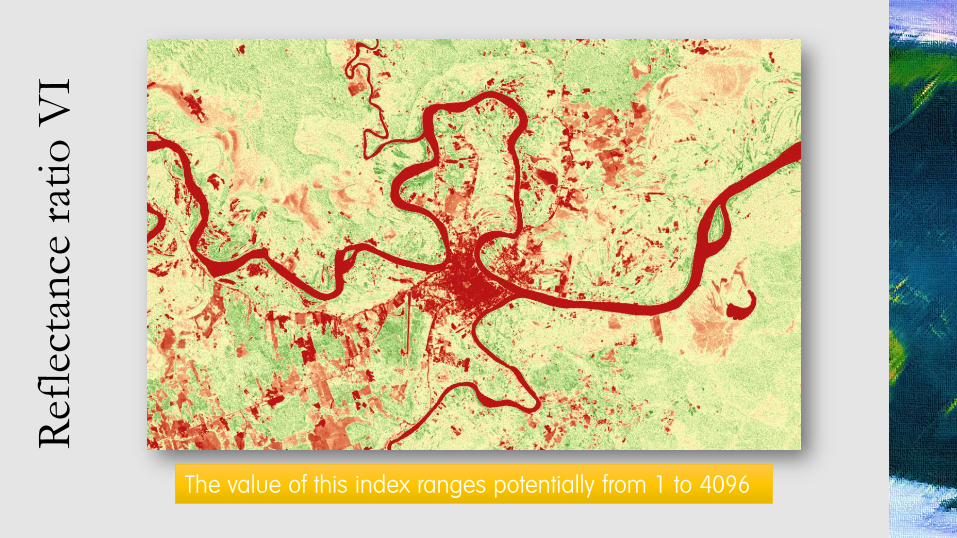
Ref
lect
ance
rat
io V
I
The value of this index ranges potentially from 1 to 4096
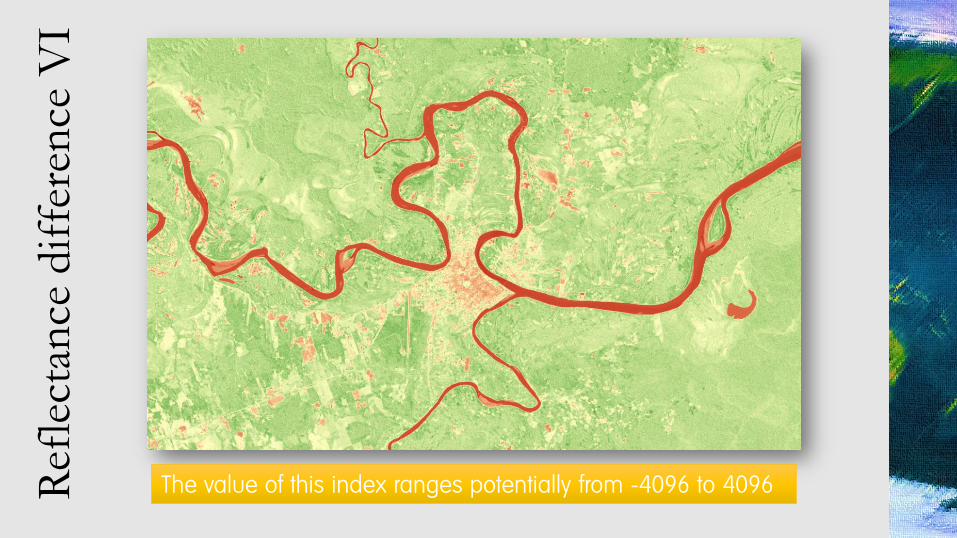
Ref
lect
ance
dif
fere
nce
VI
The value of this index ranges potentially from -4096 to 4096

No
rmal
ized
Dif
fere
nce
VI
The value of this index ranges potentially from -1 to 1
No
rmal
ized
Dif
fere
nce
VI
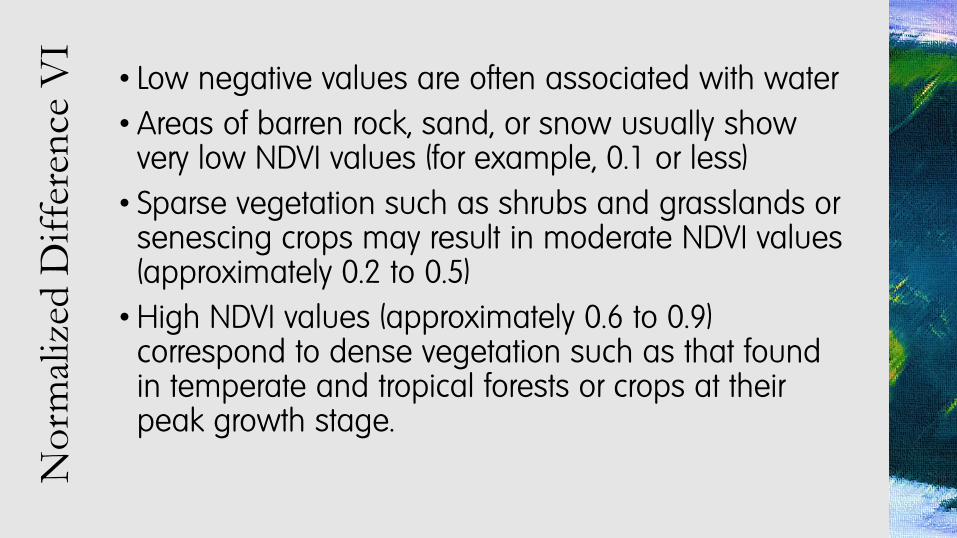
• Low negative values are often associated with water
• Areas of barren rock, sand, or snow usually show very low NDVI values (for example, 0.1 or less)
• Sparse vegetation such as shrubs and grasslands or senescing crops may result in moderate NDVI values (approximately 0.2 to 0.5)
• High NDVI values (approximately 0.6 to 0.9) correspond to dense vegetation such as that found in temperate and tropical forests or crops at their peak growth stage.
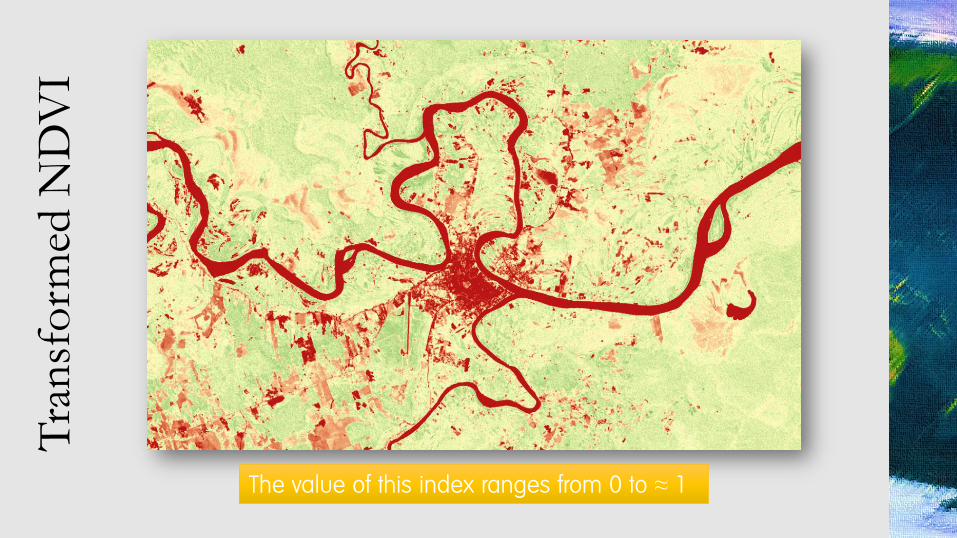
Tra
nsf
orm
ed N
DV
I
The value of this index ranges from 0 to ≈ 1
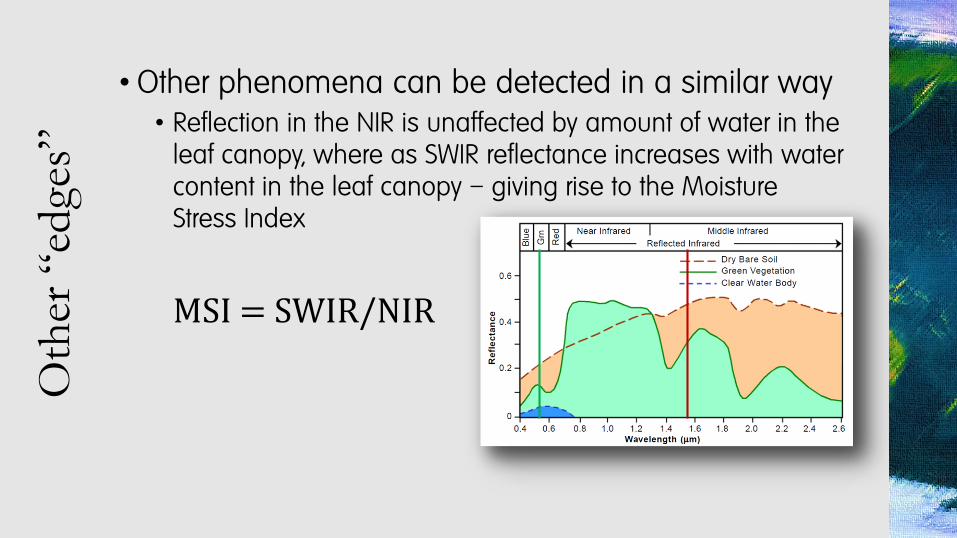
Oth
er “
edges
”• Other phenomena can be detected in a similar way
• Reflection in the NIR is unaffected by amount of water in the leaf canopy, where as SWIR reflectance increases with water content in the leaf canopy – giving rise to the Moisture Stress Index
MSI = SWIR/NIR

Mo
istu
re S
tres
s In
dex
The value of this index ranges from 0 to ≈ 1 (note the values are inverted)
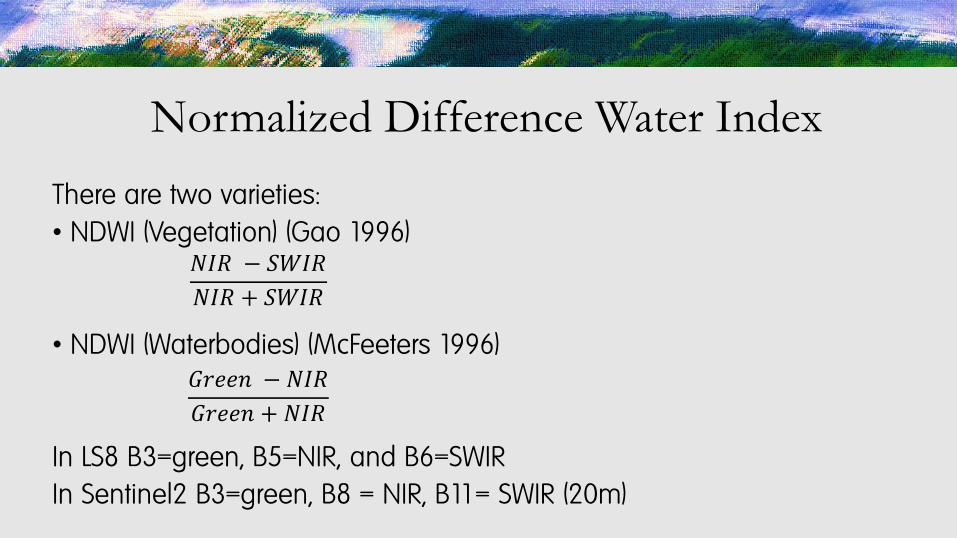
Normalized Difference Water Index
There are two varieties:• NDWI (Vegetation) (Gao 1996)
• NDWI (Waterbodies) (McFeeters 1996)
In LS8 B3=green, B5=NIR, and B6=SWIRIn Sentinel2 B3=green, B8 = NIR, B11= SWIR (20m)
𝐺𝑟𝑒𝑒𝑛 − 𝑁𝐼𝑅
𝐺𝑟𝑒𝑒𝑛 + 𝑁𝐼𝑅
𝑁𝐼𝑅 − 𝑆𝑊𝐼𝑅
𝑁𝐼𝑅 + 𝑆𝑊𝐼𝑅

ND
WI
(Veg
etat
ion
)
The value of this index ranges potentially from -1 to 1
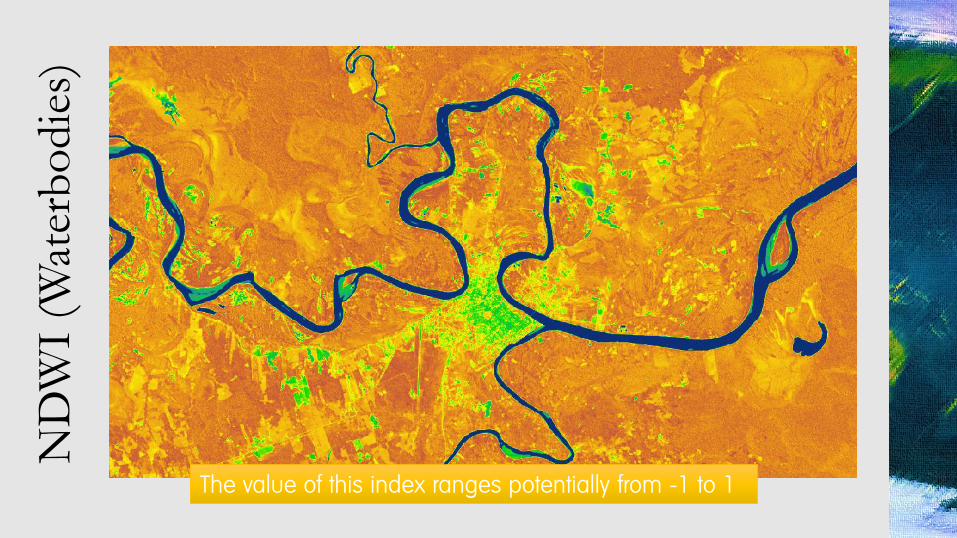
ND
WI
(Wat
erb
odie
s)
The value of this index ranges potentially from -1 to 1
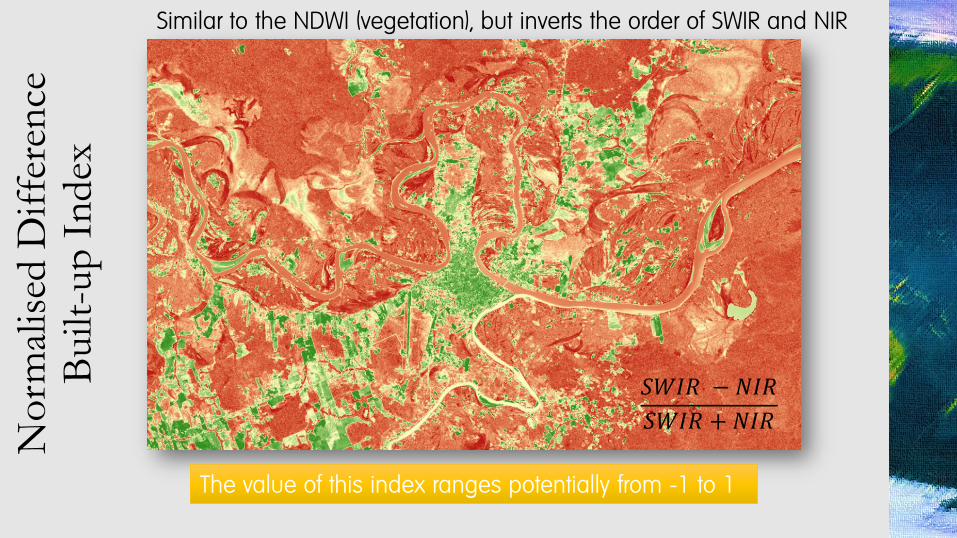
No
rmal
ised
Dif
fere
nce
B
uilt
-up
In
dex
The value of this index ranges potentially from -1 to 1
Similar to the NDWI (vegetation), but inverts the order of SWIR and NIR
𝑆𝑊𝐼𝑅 − 𝑁𝐼𝑅
𝑆𝑊𝐼𝑅 + 𝑁𝐼𝑅

En
han
ced
Built
-up
an
d
Bar
ren
nes
s In
dex
Extends the NDBuI, to include thermal infra-red data – based on the understanding that built-up areas reflect/emit more heat than vegetated areas
𝐸𝐵𝐵𝐼 =𝑆𝑊𝐼𝑅 − 𝑁𝐼𝑅
10 𝑆𝑊𝐼𝑅 + 𝑇𝐼𝑅
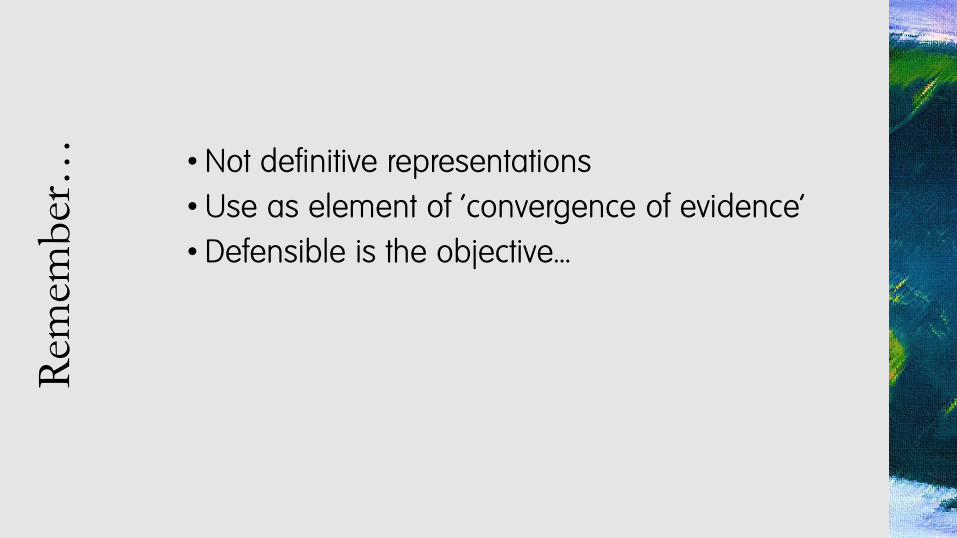
Rem
emb
er… • Not definitive representations
• Use as element of ‘convergence of evidence’
• Defensible is the objective…
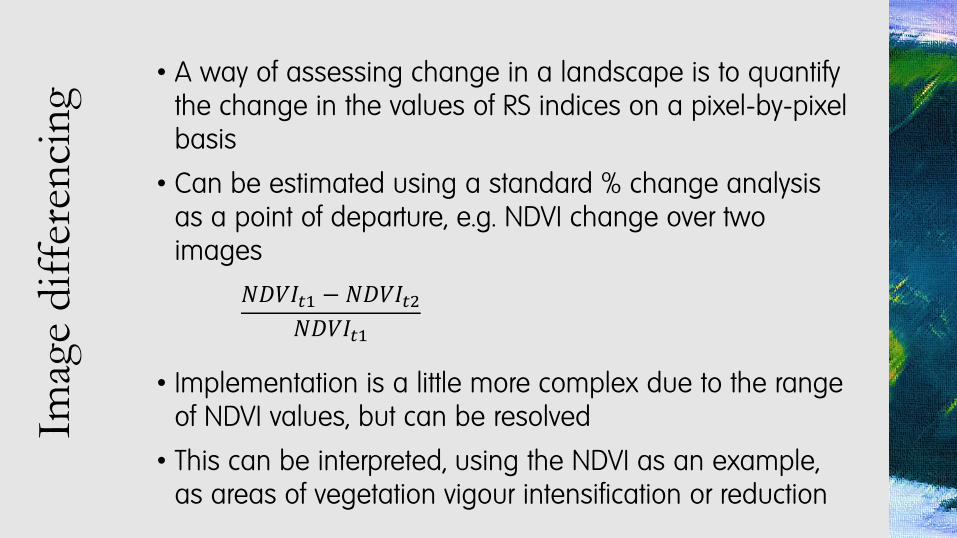
Imag
e dif
fere
nci
ng
• A way of assessing change in a landscape is to quantify the change in the values of RS indices on a pixel-by-pixel basis
• Can be estimated using a standard % change analysis as a point of departure, e.g. NDVI change over two images
• Implementation is a little more complex due to the range of NDVI values, but can be resolved
• This can be interpreted, using the NDVI as an example, as areas of vegetation vigour intensification or reduction
𝑁𝐷𝑉𝐼𝑡1 − 𝑁𝐷𝑉𝐼𝑡2𝑁𝐷𝑉𝐼𝑡1

Classify the result into 5 (or more) classes
First, decide on a change threshold you want to explore:
• +ve greater than the specified threshold
• +ve less than the specified threshold
• Unchanged
• -ve less than the specified threshold
• -ve greater than the specified threshold

Imag
e dif
fere
nci
ng