Flame Quenching Limits Of
59
ABSTRACT Title of Document: FLAME QUENCHING LIMITS OF HYDROGEN LEAKS Christopher W. Moran, Master of Science in Fire Protection Engineering, 2008 Directed By: Assistant Professor, Peter B. Sunderland, Department of Fire Protection Engineering This study examines flame quenching limits of hydrogen leaks in compression fittings and tube burners. Experimental work is presented. Measurements included ignition limits for leaking compression fittings on tubes of 3.16-12.66 mm in diameter and the ignition and quenching limits of tube burners with diameters of 0.15 – 0.56 mm. Minimum ignition flow rates of 0.028 mg/s for hydrogen, 0.378 mg/s for methane, and 0.336 mg/s for propane were found in the compression fitting experiments. The upstream pressure does not play a role in the ignition flowrate limit. The minimum quenching limits of hydrogen found in tube burners were 2.1 and 3.85 μg/s in oxygen and air, respectively. These correspond to heat release rates of 0.252 and 0.463 W, respectively, the former being the weakest observed flame ever.
-
Upload
nellai-ragul -
Category
Documents
-
view
193 -
download
1
description
FLAME
Transcript of Flame Quenching Limits Of

ABSTRACT
Title of Document: FLAME QUENCHING LIMITS OF
HYDROGEN LEAKS
Christopher W. Moran, Master of Science
in Fire Protection Engineering, 2008
Directed By: Assistant Professor, Peter B. Sunderland,
Department of Fire Protection Engineering
This study examines flame quenching limits of hydrogen leaks in compression
fittings and tube burners. Experimental work is presented. Measurements included
ignition limits for leaking compression fittings on tubes of 3.16-12.66 mm in diameter
and the ignition and quenching limits of tube burners with diameters of 0.15 –
0.56 mm. Minimum ignition flow rates of 0.028 mg/s for hydrogen, 0.378 mg/s for
methane, and 0.336 mg/s for propane were found in the compression fitting
experiments. The upstream pressure does not play a role in the ignition flowrate
limit. The minimum quenching limits of hydrogen found in tube burners were 2.1
and 3.85 µg/s in oxygen and air, respectively. These correspond to heat release rates
of 0.252 and 0.463 W, respectively, the former being the weakest observed flame
ever.
FLAME QUENCHING LIMITS OF HYDROGEN LEAKS
By
Christopher W. Moran
Thesis submitted to the Faculty of the Graduate School of the
University of Maryland, College Park, in partial fulfillment
of the requirements for the degree of
Master of Science
2008
Advisory Committee:
Assistant Professor Peter B. Sunderland, Chair
Professor Marino di Marzo
Associate Professor Arnaud Trouvé

© Copyright by
Christopher W. Moran
2008

ii
Acknowledgements
This work was supported by NIST (Grant 60NANB5D1209) under the
technical management of J. Yang. I also very much appreciate the support that was
offered me through the Clark School of Engineering Distinguished Graduate
Fellowship that allowed me to work and study here.
I would like to express my gratitude to my advisor Dr. Peter Sunderland, for
his guidance, support, and encouragement. Never before have I met a professor as
enthusiastic about teaching and helping his students. It has been my privilege.
I also thank Dr. James Milke, for guiding me through the program and
involving me in the department. His enthusiasm and guidance while I considered the
pursuit of this degree was invaluable.
I thank my advisory committee, Dr. Arnaud Trouvé and Dr. Marino di Marzo
for their time, input and help.
The faculty of the Department of Fire Protection Engineering has been
exceptional for their help and support. I would not have been able to get through my
years here without them.
I would also like to thank my colleagues, for their assistance, reminders, and
friendship. Specifically, Richard Axelbaum and Michael Butler of Washington
University were instrumental in the completion of this work. Beei-Huan Chao (of
University of Hawaii) assisted with the choked-flow calculations.
Lastly, I would like to thank my parents for their encouragement and support.
I never would have been able to have the college experience that I did without them.

iii
Table of Contents
Acknowledgements....................................................................................................... ii
List of Tables ............................................................................................................... iv
List of Figures ............................................................................................................... v
Chapter 1: Introduction ................................................................................................ 1
1.1 Hydrogen Chemistry........................................................................................... 1
1.2 Hydrogen Economy ............................................................................................ 2
1.3 Hydrogen Fire Safety.......................................................................................... 4
1.4 Objectives ........................................................................................................... 5
Chapter 2: Flame Quenching Limits of Leaky Compression Fittings ......................... 7
2.1 Experimental Background and Procedure .......................................................... 7
2.1.1 Experimental Introduction ........................................................................... 7
2.1.2 Fittings ....................................................................................................... 10
2.1.3 Flow System ............................................................................................... 13
2.1.4 Lab Safety................................................................................................... 14
2.1.5 Procedures ................................................................................................. 15
2.1.6 Sources of Error......................................................................................... 17
2.2 Results............................................................................................................... 18
2.2.1 Ignition Flowrate Limits ............................................................................ 19
2.2.2 Effects of Fitting Orientation ..................................................................... 24
2.2.3 Effects of Leak Type ................................................................................... 25
2.2.4 Effects of Tube Diameter ........................................................................... 26
Chapter 3: Weak Flames............................................................................................ 30
3.1 Experimental Background and Procedure ........................................................ 30
3.1.1 Experimental Introduction ......................................................................... 30
3.1.2 Burners....................................................................................................... 31
3.1.3 Flow System ............................................................................................... 32
3.1.4 Procedures ................................................................................................. 35
3.1.5 Sources of Error......................................................................................... 36
3.2 Results............................................................................................................... 37
3.2.1 Ignition Flowrate Limits ............................................................................ 38
3.2.2 Effects of Orientation on Ignition Flowrate Limits.................................... 39
3.2.3 Quenching Flowrate .................................................................................. 41
3.2.4 Weakest Flame Ever Observed .................................................................. 43
Chapter 4: Conclusions .............................................................................................. 46
4.1 Compression Fittings ........................................................................................ 46
4.2 Weak Flames..................................................................................................... 47
Appendix A: Fuel Properties ..................................................................................... 49
References................................................................................................................... 50

iv
List of Tables
Table 2.1. Compression Fitting Burner Summary ..................................................... 10
Table 2.2. Round Orifice Diameters .......................................................................... 23
Table 3.1. Tube Burner Summary.............................................................................. 32
Table 3.2. Volumetric Flowrates and Exit Velocities................................................ 34
Table 3.3. Ignition Flowrate Limits for Burner Heights and Oxygen Velocities. ..... 38
Table 3.4. Quencing Flowrates and Heat Release Rates. .......................................... 41
Table A.1. Fuel Properties ......................................................................................... 49

v
List of Figures
Fig. 2.1 Image of Fitting Assembly 11
Fig. 2.2 Image of Weak Flame on Platinum Burner 12
Fig. 2.3 Hydrogen Flow System Schematic 14
Fig. 2.4 Image of Fitting Assembly and Gas Collection Device 17
Fig. 2.5 Image of Flames on Burner 8L 19
Fig. 2.6 Image of Flames on Burner 4L 19
Fig. 2.7 Image of Flames on Burner 2L 19
Fig. 2.8 Plot of mfuel versus Upstream Pressure 21
Fig. 2.9 Plot of Vfuel versus Upstream Pressure 22
Fig. 2.10 Plot of Leak Diameter versus Upstream Pressure 24
Fig. 2.11 Plot of mfuel versus Orientation 25
Fig. 2.12 Plot of mfuel versus Leak Type 26
Fig. 2.13 Plot of mfuel versus Burner Diameter 27
Fig. 2.14 Image of Hydrogen Flames 28
Fig. 2.15 Image of Methane Flames 28
Fig. 2.16 Image of Propane Flames 29
Fig. 3.1 Image of Coflow Burner 33
Fig. 3.2 Hydrogen Flow System Schematic 34
Fig. 3.3 Oxygen Flow System Schematic 35
Fig. 3.4 Plot of mfuel versus Diameter 39
Fig. 3.5 Plot of mfuel versus Orientation 40
Fig. 3.6 Plot of Quenching mfuel versus Diameter 42
Fig. 3.7 Plot of Power versus Diameter 43
Fig. 3.8 Image of Weakest Flame 44
Fig. 3.9 Image of Weak Flame on Platinum Burner 45

1
Chapter 1: Introduction
1.1 Hydrogen Chemistry
Hydrogen is a very unusual fuel. It is the lightest fuel and has very wide flammability limits, 4-
75% by volume (Kanury, 1975). Hydrogen has the lowest quenching distance (0.51 mm), the
smallest ignition energy of any fuel in air (0.028 mJ), the lowest auto-ignition temperature of any
fuel ignited by a heated air jet (640 ºC), the highest laminar burning velocity of any fuel in air
(2.91 m/s), and the highest heat of combustion (119.9 MJ/kg) (Kanury, 1975). Hydrogen flames
are the dimmest of any fuel. Hydrogen also embrittles many metals more than any other fuel.
Despite these unusual aspects of hydrogen, it is attractive as an energy carrier. It can be
produced from water and electricity. It can power fuel cells or engines with only water vapor as
exhaust. Its combustion produces no carbon dioxide.
Hydrogen may not be any more intrinsically hazardous from a fire safety standpoint than
gasoline or diesel. However, over a century of experience with these traditional fuels in
widespread vehicle use has resulted in good fire safety records. Further research is necessary if
hydrogen vehicles are to be introduced with a similar safety record.
One of the most attractive aspects of using hydrogen as an alternative fuel source is that there are
no carbon products produced. No greenhouse gases are produced during the reaction. The lack
of carbon in the reaction eliminates the main source of radiation and visible light as compared to
hydrocarbon flames (Bregeon et al., 1978). This makes detecting hydrogen flames especially
difficult. The flames are also typically hotter than hydrocarbon flames as the adiabatic flame
temperature is approximately 2400 K (Turns, 2000).
Although hydrogen leaks can be extremely dangerous, there are aspects of hydrogen that are

2
safer than other combustible gases. Because hydrogen is so light, it rises at 20 m/s, much faster
than most combustible gases and 6 times faster than natural gas (DOE, 2007). Hydrogen also
diffuses 3.8 times faster than natural gas (DOE, 2007). This makes it more difficult for the gas
to collect and reach flammable concentrations in open spaces. If the gas is not contained, it
diffuses too quickly to reach explosive concentrations. It is much more likely that the hydrogen
leak would be ignited near the source and form a flame as opposed to forming an explosive
mixture.
Hydrogen can cause steel embrittlement and permeation leaks. While permeation leaks are
generally not flammable, they do present a challenge in the storage of hydrogen. Hydrogen's low
molecular weight motivates its storage at higher pressures (or liquification). Due to hydrogen's
low molecular weight, it has the highest volumetric leak propensity of any fuel.
1.2 Hydrogen Economy
As gasoline prices climb and concerns grow about the extensive release of greenhouse gases into
the atmosphere, hydrogen has emerged as one of the leading alternative fuel sources. Oil
currently supplies 33% of the world’s primary energy (Marban and Valdes-Solis, 2007).
Hydrogen as an energy carrier can help mitigate concerns about fossil fuel consumption
(Yamawaki et al., 2007). Some benefits of hydrogen are that it can be converted to electricity
with a high efficiency, its products of combustion are mainly water, it can be stored as liquid, gas
or solid, and it can be transported using pipelines, tankers or rail trucks over long distances
(Sherif et al., 2005). It is also projected that hydrogen can be produced efficiently using nuclear
sources or renewable methods such as wind (Von Jouanne et al., 2005). Hydrogen, however, is
also unique in that it has unusual fire hazards that must be taken into account before widespread

3
use of this fuel can be considered safe.
The United States government has experienced itself over the past few years to moving towards
a hydrogen fueled economy. In 2003, President Bush announced the Hydrogen Fuel Initiative to
accelerate the research and development of hydrogen for the use in transportation (DOE, 2007).
It was thought that widespread use of hydrogen could help reduce the dependence on foreign oil
as well as reduce pollutants. In 2005, the Energy Policy Act was created to reinforce
government support for hydrogen and alternative fuel technology (DOE, 2007). The Advanced
Energy Initiative was enacted in 2006 to again help accelerate research with the potential to
reduce near term oil use and advance activities under the Hydrogen Fuel Initiative (DOE, 2007).
Presently, however, there are few codes or standards to regulate the hydrogen transportation
industry. These codes and standards are currently being experienced.
Hydrogen is being considered as a fuel source for transportation purposes largely owing to its
lack of carbon emissions after combustion. Veziroglu and Babir (1992) argue that hydrogen is
one of the safest fuels owing to its high diffusivity and buoyancy. In case of a leak, hydrogen
will be released into the atmosphere as opposed to gasoline, which will pool and presents a
longer danger. Hydrogen also radiates much less heat as it does not produce carbon compounds.
This means that people are rarely burned by a hydrogen flame unless they are in the flame.
Lovins (2003) compares hydrogen to gasoline and natural gas as an energy source and states that
"a good fuel cell system is about 50-70% efficient, hydrogen to electricity, while a typical car
engine's efficiency from gasoline to output shaft averages only about 15-17%."
Bossel and Eliasson (2002) believe that the upstream energy costs of a hydrogen economy have
not been adequately assessed. The energy necessary to form hydrogen either through electrolysis
or the conversion of another gas does not make it efficient enough to use as an energy carrier.
4
They state that "the production, packaging, storage, transfer, and delivery of the gas are so
energy consuming that other solutions must be considered."
1.3 Hydrogen Fire Safety
Owing to its low molecular weight, hydrogen is often stored at high pressures. It is predicted that
hydrogen will need to be stored at up to 40 MPa to be an effective vehicle fuel (Takeno et al.,
2007). Hydrogen’s safety hazards resulted in a Department of Energy report (Cadwallader and
Herring, 1999) finding that hydrogen containment was the chief safety concern associated with
using hydrogen as a transportation fuel. One characteristic of hydrogen that makes it more prone
to risk is that it is easier to ignite than most other common fuels. The minimum ignition energy
for hydrogen is an order of magnitude lower than those for methane and propane (Ge and Sutton,
2006). This means that a small spark might be able to ignite a hydrogen leak, whereas the same
spark might not be able to ignite a methane or propane leak. It has also been noted that hydrogen
flames have weak luminosity (Cheng et al., 2005), hence a hydrogen leak sustaining a flame
would be difficult to detect by the human eye.
Swain and Swain (1992) did a comparison study of hydrogen, methane and propane fuel leakage
in a residential setting. Only pressures less than 0.965 bar (14 psi) were used in the study. In
their research, they found three times more hydrogen volume than methane would escape
through a leak. As relatively high leakage rates can lead to combustible fuel clouds, they
discovered that propane produces a cloud much faster than hydrogen or methane.
Hydrogen is odorless and colorless, which makes detecting hydrogen leaks extremely difficult.
Odorants are not used with hydrogen as no known odorant is light enough to diffuse as fast as
hydrogen and odorants poison fuel cells. Hydrogen is nontoxic although death can occur due to

5
asphyxiation if too much oxygen is displaced.
Hydrogen's unique fire hazards present a challenge to firefighters. Currently, firefighters are
taught to detect hydrogen flames with a straw broom. Thermal imaging firefighting cameras are
effective but not all departments have them. When near a possible hydrogen leak, firefighters
listen for leaking gas, look for heat shimmering, and use their detection methods. If a leak is
found, they are taught to stop the flow if possible. If they are unable to stop the flow, then the
flame is allowed to consume the gas supply if safe. Extinguishing the flame without stopping the
leak can result in an explosive mixture.
1.4 Objectives
Codes and standards are currently being experienced for hydrogen system fire safety. One issue
of interest is permissible leak rates. However, prior to the present work no measurements had
been performed to establish the maximum leak rate for nonflammable conditions.
Thus motivated, the objects of this work are:
1. Measure the minimum flowrates that are necessary to support flames from compression
fittings in air. Three different gases were used in the experiments; hydrogen, methane
and propane.
2. Identify the minimum ignition and quenching hydrogen flowrates possible for any choice
of burner and oxidizer. Determine whether this produces the weakest flame ever
observed.
The results of this work are expected to be helpful in the creation of the codes and standards
governing the safe use of hydrogen and in the field of micro-combustion. The data found during
these experiments gives the ignition flowrate limits for leaky compression fittings, which can be

6
used when deciding the minimum allowable leaks in a commercial application. Micro-
combustion is a growing field as electronics get smaller and batteries make up most of the device
weight. A lighter, more efficient (more environmentally friendly) power supply can be found
using micro-combustors (Federici, 2006).

7
Chapter 2: Flame Quenching Limits of Leaky Compression Fittings
2.1 Experimental Background and Procedure
As many high pressure systems are made with compression fittings, it is important to determine
the possible leakage scenarios and the ignition flowrate limits associated with these fittings.
Three different fuels were used to determine the ignition flowrate limits for a number of different
possible failure scenarios. The first, hydrogen, is being considered for use in alternative fuel
source applications but many of the dangers are still unknown. The second gas is methane. This
gas is commonly used as a fuel in many applications and its properties are better known. In
many cases, it is known as natural gas and is used to heat homes and power vehicles. Methane's
advantage over other hydrocarbons is that it produces less CO2 when combusted. The third gas
used is propane. Propane is most commonly used for cooking on grills and portable stoves. It is
also used in refrigeration and as an automotive fuel.
Although the main purpose of the experimentation was to find the flame quenching limits for
hydrogen, the same tests were also done on methane and propane to have a comparison of the
different fuels as they are used in many of the same applications.
2.1.1 Experimental Introduction
Quenching and blowoff limits bound the leak flowrates that can support combustion. Matta et al.
(2002) found that a propane flame is not able to exist when its predicted length is less than the
measured standoff distance. Experiments verified this analytical method of finding the
quenching flowrate by establishing a propane flame over a hypodermic, stainless steel tube and
decreasing the fuel flowrate until extinction. It was also found that the flowrate at quenching is
practically independent of the tube diameter. Work in this laboratory has extended this work to
hydrogen fuel and diverse burners (Butler et al., 2008).

8
There are three classifications for laminar jet flames: diffusion controlled flames (e.g., Burke and
Schuman, 1928), diffusion and momentum controlled flames (e.g., Roper et al., 1977) and micro
diffusion flames controlled by momentum and diffusion (e.g., Ban et al., 1994). Extensive
research has been done on the first two types, but only a limited amount has been done on micro
diffusion flames. Baker et al. (2002) devised a flame height expression for purely diffusion
controlled flames capable of accurately predicting micro-slot diffusion flame heights. Useful
parameters for characterizing dominant flame mechanisms were defined: a diffusion-buoyancy
and a diffusion-momentum parameter. This work extended the investigation of
Roper et al. (1977) to smaller slot sizes. Ban et al. (1994) investigated flames established on
circular burners with inner diameters of 0.15, 0.25, and 0.40 mm. The experiments worked to
verify the predicted flame shapes of laminar flames for three fuels: ethane, ethylene and
acetylene. The work found that buoyancy effects are negligible for small flames; nearly spherical
flames were established that were unaltered by rotating the burner. An in depth analysis of a
micro diffusion hydrogen flame was performed by Cheng et al. (2005); their numerical solution
for species was compared with experimental data. It was found that buoyancy effects were
insignificant. Nakamura et al. (2006) numerically studied methane micro diffusion flames on a
circular burner of diameter less than 1 mm. They found that small flames have the same, nearly
spherical structure as those in microgravity, citing weak buoyancy forces. Also, the existence of
a minimum flame size necessary for combustion was predicted.
Lee et al. (2003) conducted leak rate experiments on micro-machined orifices of different sizes
and shapes. They examined the differences in flowrates among square and elliptical slit orifices.
In almost every case, the flow was choked in the orifice, which caused large underestimates in
the flow using the helium signature test. Schefer et al. (2006) also presented equations to

9
calculate choked flow, as well as subsonic laminar and turbulent flows. They considered leaks
owing to pressure-driven convection and permeation through metals.
Research has been conducted on hydrogen interface leakage in national pipe thread (NPT)
fittings by Ge and Sutton (2006). They found that the best threaded fittings investigated leaked
hydrogen with leak rates of 1 µg/s. Leak rates under non-ideal conditions were far higher. Ge
and Sutton (2006) found that a larger tightening torque is not as important in sealing the threads
as the Teflon material and properties. The tests were run at a pressure drop of 70 bar. They
determined that two wraps of Teflon experiences had better performance than one wrap and the
Swagelok™ anaerobic pipe thread sealant out performed the Teflon.
Compression fittings are typically used with gases at high pressure. Compression fittings are a
reliable, easy to use method that allows fittings to be taken apart and attached with ease. A large
benefit of using compression fittings over NPT fittings is the lack of Teflon tape that is necessary
to prevent leakage. Any time an NPT fitting is taken apart, it must be cleaned and rewrapped
before it can be used again.
Swagelok has made available product test reports that give information on the leakage of their
fittings. Product test report (PTR) 396 shows for 144 samples of 6 and 12 mm fittings tested at
310 and 200 bar nitrogen, respectively, there were no detectable leaks found after 10 minutes. In
PTR-865, the fittings were tested again at 512 and 312 bar nitrogen, respectively, and leaked less
than one bubble per minute during the 10 minute test period. Leaks were detected by
submerging the fittings under water and watching for bubbles. Using hydrogen instead of
nitrogen would dramatically increase any leak rates.

10
2.1.2 Fittings
The compression fitting experiments were conducted using threes types of leaky fittings of three
different diameters. Each leaky fitting was made by attaching a steel tube to a Swagelok union
and capping the other end of the union. The leaks occurred at the connection between the steel
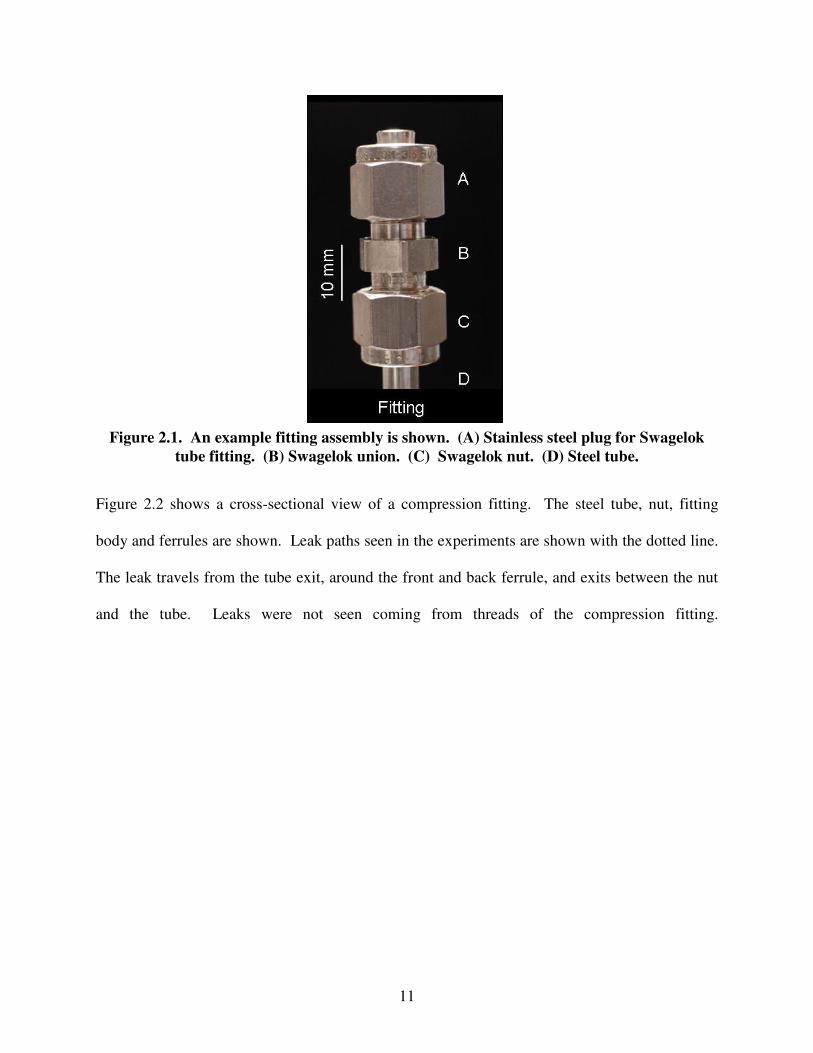
tube and the union. A sample leaky fitting can be seen in Fig. 2.1. Compression fittings with
outside tube diameters of 3.16, 6.33 and 12.66 mm were used. The leaks were caused using
three different methods: loosened, over-tightened, and scratched fittings. These methods were
chosen as possible leak modes that compression fittings used in commercial applications would
experience. All of the fittings used can be found in Table 2.1.
Table 2.1. Leaky fittings used in compression fitting experiments
Fitting Number Tube Diameter
in mm Description
Fitting 8L 1/8 3.16 Correctly made, then loosened
Fitting 4L 1/4 6.33 Correctly made, then loosened
Fitting 4T 1/4 6.33 Correctly made, then over-tightened
Fitting 4S 1/4 6.33 Correctly made, then scratched
Fitting 2L 1/2 12.66 Correctly made, then loosened
.
11
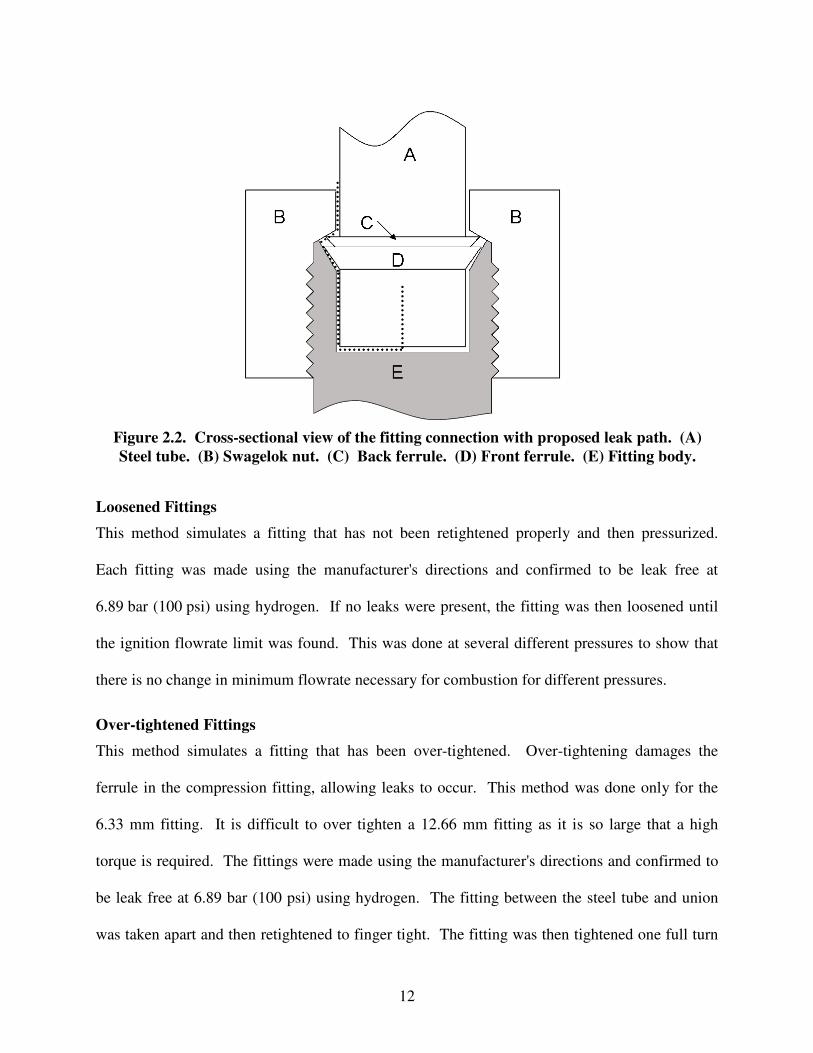
Figure 2.2 shows a cross-sectional view of a compression fitting. The steel tube, nut, fitting
body and ferrules are shown. Leak paths seen in the experiments are shown with the dotted line.
The leak travels from the tube exit, around the front and back ferrule, and exits between the nut
and the tube. Leaks were not seen coming from threads of the compression fitting.
Figure 2.1. An example fitting assembly is shown. (A) Stainless steel plug for Swagelok
tube fitting. (B) Swagelok union. (C) Swagelok nut. (D) Steel tube.
12
Loosened Fittings
This method simulates a fitting that has not been retightened properly and then pressurized.
Each fitting was made using the manufacturer's directions and confirmed to be leak free at
6.89 bar (100 psi) using hydrogen. If no leaks were present, the fitting was then loosened until
the ignition flowrate limit was found. This was done at several different pressures to show that
there is no change in minimum flowrate necessary for combustion for different pressures.
Over-tightened Fittings
This method simulates a fitting that has been over-tightened. Over-tightening damages the
ferrule in the compression fitting, allowing leaks to occur. This method was done only for the
6.33 mm fitting. It is difficult to over tighten a 12.66 mm fitting as it is so large that a high
torque is required. The fittings were made using the manufacturer's directions and confirmed to
be leak free at 6.89 bar (100 psi) using hydrogen. The fitting between the steel tube and union
was taken apart and then retightened to finger tight. The fitting was then tightened one full turn
Figure 2.2. Cross-sectional view of the fitting connection with proposed leak path. (A)
Steel tube. (B) Swagelok nut. (C) Back ferrule. (D) Front ferrule. (E) Fitting body.

13
(3/4 turn past manufacturer's instructions). The fitting was then taken apart again and tightened
until the ignition flowrate limit was found for several different pressures.
Scratched
This method simulates a ferrule being damaged by insertion into a fitting and was done only for
the 6.33 mm fitting. The fittings were made using the manufacturer's directions and confirmed
to be leak free at 6.89 bar (100 psi) using hydrogen. The ferrule on the steel tube was then
scratched using a small triangular file. The fitting was then reassembled properly and the
ignition flowrate limit was found by slowly tightening the fitting.
2.1.3 Flow System
Methane and propane were used in the experiments as well as hydrogen. Each test was
completed using all three fuels so that comparisons could be made. Hydrogen, methane, and
propane were tested in pressure ranges of 1-135 bar, 1-100 bar, and 1-7 bar, respectively.
Propane could not be tested at pressures higher than 7 bar as this is its vapor pressure at room
temperature.
The fuel flow system is shown in Fig. 2.3. For safety reasons, the flow was passed through a
filter and relief valve to keep the downstream pressure below 6.89 bar in the event of any failure
of the bottle pressure regulator. When experiments were done at pressures higher than this, the
filter and relief valve were temporarily taken out of the system. The upstream pressure was
controlled by a pressure regulator located just before the leaky fitting.

14
2.1.4 Lab Safety
Fire safety is one of the primary concerns with the use of hydrogen. Methane and propane
exhibit many normal characteristics of hydrocarbon flames, such as high radiant energy and
brightly visible flames. Hydrogen on the other hand does not have these characteristics. Larger
hydrogen flames can be seen in a dim room but flames near the quenching limit are not visible
even in a darkened room. Due to this, the following methods of flame detection were compiled
to allow for safe flame detection.
1. Hot Plume Check with Thermocouple: This is the safest method and the method that was
primarily used during these experiments. A thermocouple is slowly inserted above the
flame region to check for a change in temperature owing to the hot plume. This method
allows the researcher to get close to the flame region without burning. At the quenching
limits, temperature rises on the order of 15-50 ºC were observed. A Fluke 179 with
thermocouple probe was used to measure temperature. The thermocouple was a type K.
2. Thin Paper Check: This method involves slowly inserting a piece of paper into the flame
region and looking for ignition. This method works better for larger flames as small
Figure 2.3. Experimental setup of flow system.
A
F
C ED
G
B
L
K
J
I
H
A – Gas Cylinder
B – Valve
C – Pressure Regulator
D – Needle Valve
E – Filter
F – Relief Valve (6.89 bar)
G – Ball Valve
H – Pressure Regulator
I – Rubber Stopper
J – Leaky Fitting
K – Open Tube
L – Bubble Meter
A
F
C ED
G
B
L
K
J
I
H
A – Gas Cylinder
B – Valve
C – Pressure Regulator
D – Needle Valve
E – Filter
F – Relief Valve (6.89 bar)
G – Ball Valve
H – Pressure Regulator
I – Rubber Stopper
J – Leaky Fitting
K – Open Tube
L – Bubble Meter

15
drafts can extinguish the smaller flames. Also, this method should not be used when
combusting in a pure oxygen environment as any paper in the oxygen will burn violently.
As the automatic detection of hydrogen is difficult and there are no odorants available with
hydrogen, it was important to frequently check for leaks in the system. Excess hydrogen buildup
in an enclosed space can lead to an explosion. To prevent this, the lab was well ventilated so that
any hydrogen buildup would have been difficult. Also the flowrates used during the experiments
were so small that a potential explosive buildup was very unlikely.
2.1.5 Procedures
A Nikon D100 camera with a 50 mm lens was used to photograph the different experiments. In
most cases, extender rings were used to allow closer photographs of the experiments. The
camera was connected to a computer and controlled using the Nikon capture control software.
This allowed many camera settings to be controlled on the computer and direct transfer of
pictures from the camera.
Before each test, the system was pressurized and tested for leaks. This was done by squirting a
small amount of soap water on each fitting. If any bubbles were seen, the fitting was tightened
until the leak stopped. The only exception to this was the fitting between the steel tube and
union that was purposely made to leak. This detection method allowed for quick discovery of
leaks as well as being an accurate detector of small leaks.
To determine the minimum pressure and flow necessary for a sustained flame, the fitting was
tightened and the pressure was slowly raised until a flame occurred. The upstream pressure in
the system was controlled by the pressure regulator located before the fitting. Ignition of the fuel
was caused by a butane lighter held briefly to the fitting. It was considered to be a sustained

16
ignition if the flame lasted a minimum of 10 s. After a successful ignition of any flame, the steel
tube and fitting were allowed to cool to room temperature before the next test was attempted.
This kept the gas from being preheated in the fitting. Also, as the metal fitting heats, it expands,
causing the leak path to shrink and changing the minimum flowrate. Allowing the fitting to cool
between tests minimized these sources of error.
For each test, the fitting was imaged against a black background to make the flames more visible.
Flames for the propane and methane tests were visible to the naked eye and ignition was
determined visually. This was backed up by the use of a thermocouple to determine if a flame
was present. The hydrogen flames were too small and dim to be seen by eye and therefore only
the thermocouple was used to determine if a flame existed. The thermocouple was placed
slightly off and above the flaming region so that it would not interfere with the flame. When the
hydrogen gas ignited, an audible pop was heard that signaled ignition. In some cases however,
the fuel ignited but the flame was immediately extinguished. Several fitting orientations were
tested to see the effect fitting orientation had on the ignition flowrate limit. Flames were never
observed inside the fitting owing to the quenching limits of each fuel. Each test was repeated to
establish repeatability.
To measure the flowrate from the leaky fittings, an apparatus was built to capture the escaping
gas. This can be seen in Fig. 2.4. An open tube was created that fit over the leaky fitting
assembly and created an air tight seal that allowed the gas to be collected and sent to a bubble
meter. All flames were extinguished and the fittings were allowed to cool before any flow
measurements were taken. As the gas traveled to the bubble meter, it was bubbled through water
to give the gas 100% relative humidity. This was done so that partial humidification in the
bubble meter did not interfere with the results. A humidity adjustment of 2.645% was then made

17
when calculating the flowrate (Incropera, 2002). In the bubble meter, the time for the bubble to
travel 10 cc was clocked and recorded.
Equation 2.1 shows the conversion of gas volumetric flow to mass flow.
TR
pMWQM
u
97355.0= (2.1)
where M is the mass flowrate, Q is the volumetric flowrate, p is ambient pressure, MW is fuel
molecular weight, Ru is the universal gas constant, and T is ambient temperature. Measurements
for the laboratory temperature and pressure were measured when tests were run. Ambient
pressures were obtained online (www.weather.com).
2.1.6 Sources of Error
There is some uncertainty with each flow measurement. The volumetric flowrate was timed
using a stopwatch. Most flows were small enough that being slightly off would not affect the
measurement significantly. All flows were measured multiple times so that the results could be
Figure 2.4. The fitting assembly and the gas capture apparatus.

18
averaged and uncertainty lowered.
One issue in the lab was the inability to control the airflow. The ventilation in the lab space
caused air currents and it was not possible to close or turn off the air circulation system. A draft
curtain was deployed around the experiment to try to minimize these air currents. These air
currents were sometimes problematic when attempting to find the ignition limit flowrates. Care
was taken to limit the air currents around the experiments but it is possible that lower ignition
flowrates could be obtained in a more controlled environment.
2.2 Results
Figure 2.5 shows that the hydrogen flames at quenching are much smaller than the methane and
propane flames. The hydrogen flames were also much dimmer than the other flames.
Figures 2.5, 2.6 and 2.7 show images of hydrogen, methane, and propane flames on leaky
compression fittings in the vertical orientation for the different sized fittings. The images were
recorded slightly above the quenching limits. The hydrogen flame is significantly smaller than
the methane and propane flames in each figure. This is due to the smaller flowrate as hydrogen
has a lower quenching limit. The quenching distance of hydrogen is approximately a quarter of
the distance of methane and propane. This allows the flame to burn much closer to the metal.
As the fitting size increases, in can be seen that the flame size also increases.
The flames were isolated to one side of the fitting where the most damage to the ferrule occurred.
This is most evident in the hydrogen photo as the flame is much smaller. The photos below are
from the loosened fittings. These flowrates were slightly larger than those from the scratched
and over-tightened fittings. This could be seen from the increased flowrate in Fig. 2.12.

19
2.2.1 Ignition Flowrate Limits
Figure 2.8 shows the measured ignition flowrates for hydrogen, methane, and propane for the
vertical orientation. The minimum flowrate necessary for sustained ignition is plotted versus
pressure. For each fuel, the measurements at increased pressures are associated with an increase
Figure 2.5. Color images of Fitting 8L flames for each fuel. Each fuel is flowing at the
minimum flowrate possible for ignition. The camera settings for hydrogen were 20 s,
F1.4, ISO 1600. The camera settings for methane/propane were 1 s, F1.4, ISO 800.
Figure 2.7. Color images of Fitting 2L flames for each fuel. Each fuel is flowing at the
minimum flowrate possible for ignition. The camera settings for hydrogen were 20 s,
F1.4, ISO 1600. The camera settings for methane/propane were 1/10 s, F1.4, ISO 800.
Figure 2.6. Color images of Fitting 4L flames for each fuel. Each fuel is flowing at the
minimum flowrate possible for ignition. The camera settings for hydrogen were 20 s,
F1.4, ISO 1600. The camera settings for methane/propane were 1/10 s, F1.4, ISO 800.

20
in torque on the fitting. The upper limit on pressure for propane is lower than that of the other
gases because the vapor pressure of propane at room temperature is 9.1 bar (142 psia).
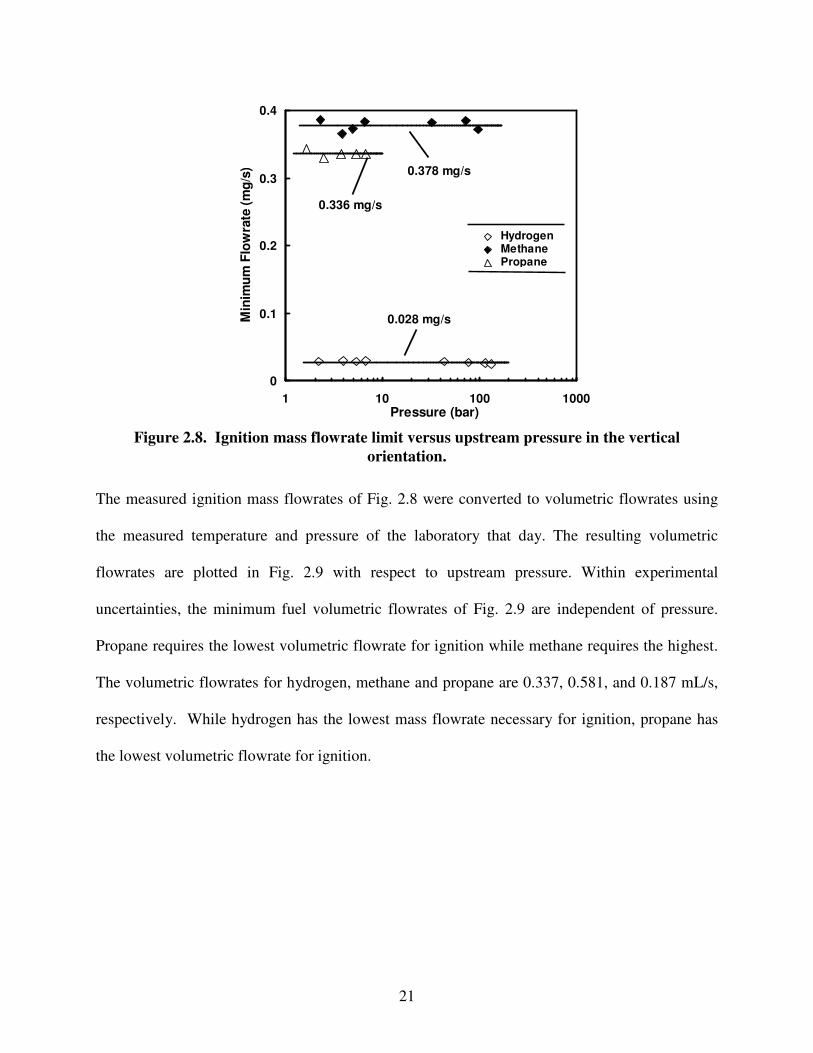
Within experimental uncertainties, the ignition limits of Fig. 2.8 are independent of pressure for
each fuel. This indicates that, as expected, at a fixed fuel mass flowrate the upstream pressure
has little or no effect on the velocity profile of the jet entering the surrounding air. The mean
hydrogen flowrate, 28 µg/s, is about an order of magnitude lower than for the other fuels owing
to its low quenching distance and low molecular weight. The mean methane and propane
flowrate limits were 378 and 336 µg/s, respectively. The quenching distance of hydrogen is
approximately one fourth that of methane and propane and its molecular weight is an order of
magnitude smaller than that of both propane and methane. This explains why the hydrogen
flowrate is an order of magnitude smaller than that of both methane and propane. Butler et al.
(2007, 2008) found the same behavior in their experiments using round burners. This is an
important finding in that it shows that the upstream pressure does not play a role in the ignition
flowrate limit.
21
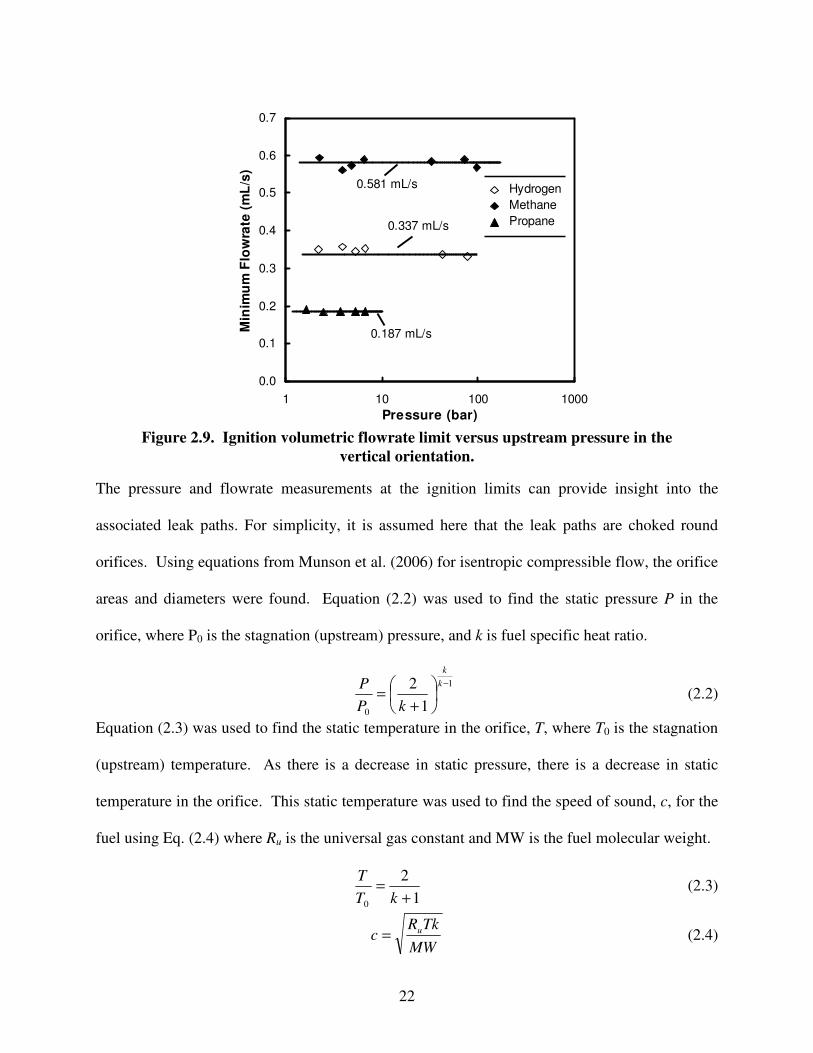
The measured ignition mass flowrates of Fig. 2.8 were converted to volumetric flowrates using
the measured temperature and pressure of the laboratory that day. The resulting volumetric
flowrates are plotted in Fig. 2.9 with respect to upstream pressure. Within experimental
uncertainties, the minimum fuel volumetric flowrates of Fig. 2.9 are independent of pressure.
Propane requires the lowest volumetric flowrate for ignition while methane requires the highest.
The volumetric flowrates for hydrogen, methane and propane are 0.337, 0.581, and 0.187 mL/s,
respectively. While hydrogen has the lowest mass flowrate necessary for ignition, propane has
the lowest volumetric flowrate for ignition.
Figure 2.8. Ignition mass flowrate limit versus upstream pressure in the vertical
orientation.
0
0.1
0.2
0.3
0.4
1 10 100 1000Pressure (bar)
Min
imu
m F
low
rate
(m
g/s
)HydrogenMethanePropanehmpLinear (h)Linear (m)Linear (p)
0.028 mg/s
0.378 mg/s
0.336 mg/s
22
The pressure and flowrate measurements at the ignition limits can provide insight into the
associated leak paths. For simplicity, it is assumed here that the leak paths are choked round
orifices. Using equations from Munson et al. (2006) for isentropic compressible flow, the orifice
areas and diameters were found. Equation (2.2) was used to find the static pressure P in the
orifice, where P0 is the stagnation (upstream) pressure, and k is fuel specific heat ratio.
1
0 1
2 −
+=
k
k
kP
P (2.2)
Equation (2.3) was used to find the static temperature in the orifice, T, where T0 is the stagnation
(upstream) temperature. As there is a decrease in static pressure, there is a decrease in static
temperature in the orifice. This static temperature was used to find the speed of sound, c, for the
fuel using Eq. (2.4) where Ru is the universal gas constant and MW is the fuel molecular weight.
1
2
0 +=
kT
T (2.3)
MW
TkRc u
= (2.4)
Figure 2.9. Ignition volumetric flowrate limit versus upstream pressure in the
vertical orientation.
0.0
0.1
0.2
0.3
0.4
0.5
0.6
0.7
1 10 100 1000
Pressure (bar)
Min
imu
m F
low
rate
(m
L/s
)
Hydrogen
Methane
Propane
H
M
P
Linear (M)
Linear (H)
Linear (P)
0.187 mL/s
0.337 mL/s
0.581 mL/s

23
After finding the static pressure and temperature in the orifice, the density of the fuel, ρ, can be
found using the ideal gas law using Eq. (2.5). The orifice area can be found from Eq. (2.6),
where M is fuel mass flowrate at the ignition limit. The minimum and maximum calculated leak
areas and leak diameters are given in Table 2.2.
TR
PMW
u
=ρ (2.5)
cAM ρ= (2.6)
Table 2.2. Round orifice diameters assuming choked flow
Fuel Upstream
Pressure (Bar)
Speed of
Sound (m/s)
Mass Flowrate
(mg/s)
Leak Area
(µm2)
Leak Diameter
(µm)
344.7 0.687 0.936 Hydrogen
4.14 1193.1 0.028
57.3 8.54
206.8 5.81 2.72 Methane
4.14 416.4 0.378
290.5 19.2
6.89 103.3 11.5 Propane
4.14 244.2 0.336
172.1 14.8
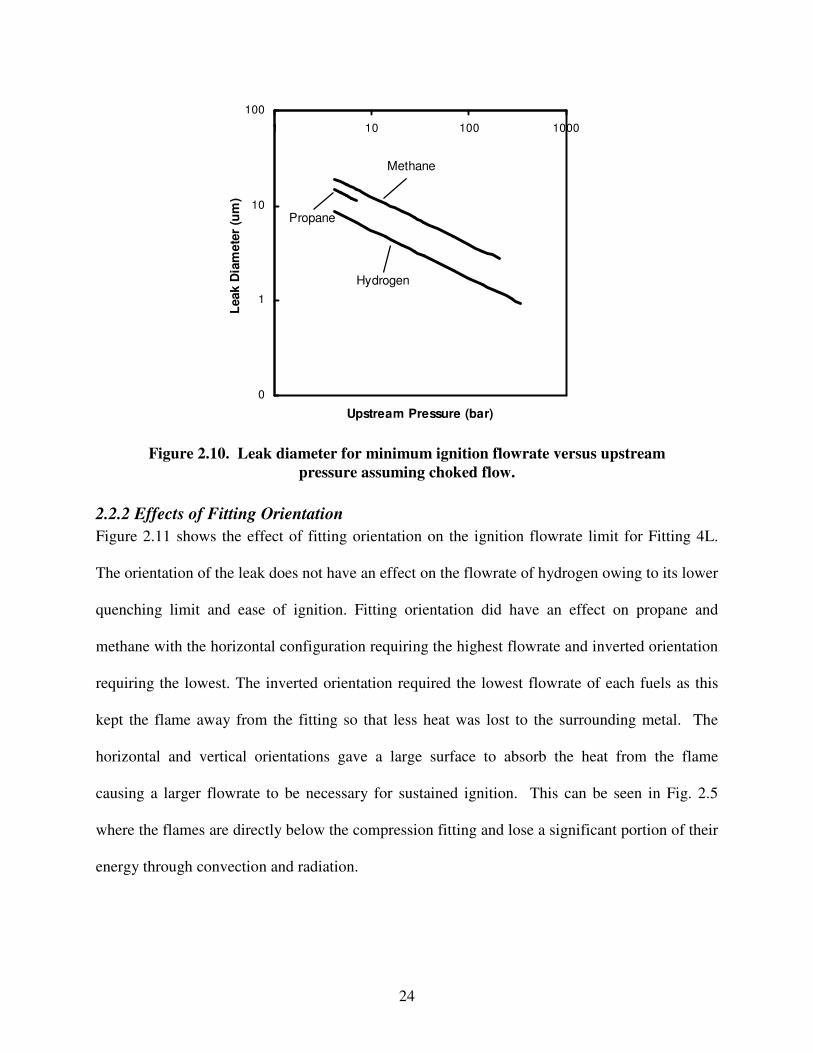
Figure 2.10 shows a plot of leak diameter for the minimum ignition flowrate versus the upstream
pressure assuming chocked flow. The diameter of the leak decreases sharply with an increase in
pressure. Hydrogen requires the smallest leak diameters to reach its minimum ignition flowrate
while methane requires the largest leak diameter. The curves in Fig. 2.10 span the typical ranges
of fuel pressures for vehicle tanks.
24
2.2.2 Effects of Fitting Orientation
Figure 2.11 shows the effect of fitting orientation on the ignition flowrate limit for Fitting 4L.
The orientation of the leak does not have an effect on the flowrate of hydrogen owing to its lower
quenching limit and ease of ignition. Fitting orientation did have an effect on propane and
methane with the horizontal configuration requiring the highest flowrate and inverted orientation
requiring the lowest. The inverted orientation required the lowest flowrate of each fuels as this
kept the flame away from the fitting so that less heat was lost to the surrounding metal. The
horizontal and vertical orientations gave a large surface to absorb the heat from the flame
causing a larger flowrate to be necessary for sustained ignition. This can be seen in Fig. 2.5
where the flames are directly below the compression fitting and lose a significant portion of their
energy through convection and radiation.
Figure 2.10. Leak diameter for minimum ignition flowrate versus upstream
pressure assuming choked flow.
0
1
10
100
1 10 100 1000
Upstream Pressure (bar)
Leak D
iam
ete
r (u
m)
Methane
Propane
Hydrogen

25
2.2.3 Effects of Leak Type
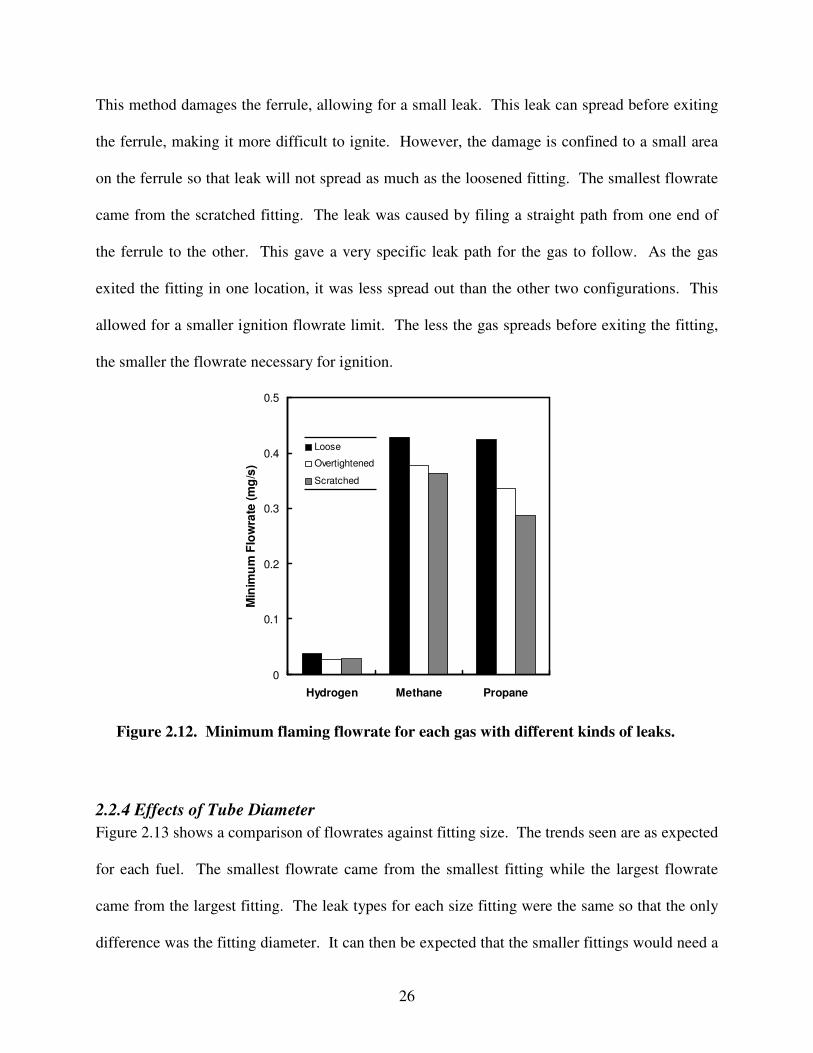
Figure 2.12 shows the effect of the different leaky fittings on the ignition flowrate limits. The
loosened fittings had the highest flowrate for ignition among the leakage configurations. The
flowrates for the loosened fittings had a 26% higher flowrate than the over-tightened
configuration. The flowrates for the over-tightened and scratched fittings were comparable for
hydrogen. Only a slight difference was found and this is within the experimental uncertainties.
Methane and propane followed the same trend with the loosened fitting having the highest
flowrate and the scratched fitting having the lowest.
The trends for the methane and propane ignition flowrates are as expected. In the loosened
fitting, there is no damage to the ferrule and therefore no easy leakage path for the gas. This
means that the gas exits over a wider area surrounding the tube so that a larger flowrate is
necessary to sustain the flame. The next higher flowrate was from the over-tightened fitting.
Figure 2.11. Minimum flaming flow rate for Fitting 4L in vertical, horizontal and
inverted orientations.
0
0.1
0.2
0.3
0.4
Hydrogen Methane Propane
Min
imu
m F
low
rate
(m
g/s
)
Vertical
Horizontal
Inverted
26
This method damages the ferrule, allowing for a small leak. This leak can spread before exiting
the ferrule, making it more difficult to ignite. However, the damage is confined to a small area
on the ferrule so that leak will not spread as much as the loosened fitting. The smallest flowrate
came from the scratched fitting. The leak was caused by filing a straight path from one end of
the ferrule to the other. This gave a very specific leak path for the gas to follow. As the gas
exited the fitting in one location, it was less spread out than the other two configurations. This
allowed for a smaller ignition flowrate limit. The less the gas spreads before exiting the fitting,
the smaller the flowrate necessary for ignition.
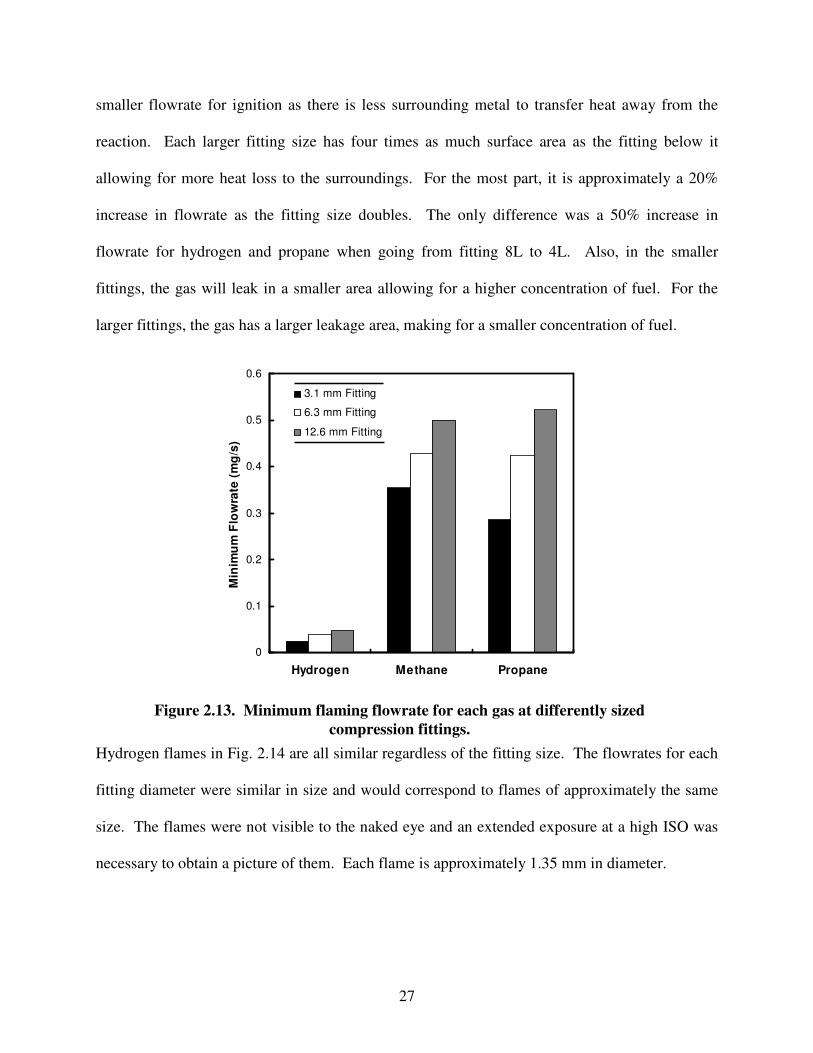
2.2.4 Effects of Tube Diameter
Figure 2.13 shows a comparison of flowrates against fitting size. The trends seen are as expected
for each fuel. The smallest flowrate came from the smallest fitting while the largest flowrate
came from the largest fitting. The leak types for each size fitting were the same so that the only
difference was the fitting diameter. It can then be expected that the smaller fittings would need a
Figure 2.12. Minimum flaming flowrate for each gas with different kinds of leaks.
0
0.1
0.2
0.3
0.4
0.5
Hydrogen Methane Propane
Min
imu
m F
low
rate
(m
g/s
)
Loose
Overtightened
Scratched
27
smaller flowrate for ignition as there is less surrounding metal to transfer heat away from the
reaction. Each larger fitting size has four times as much surface area as the fitting below it
allowing for more heat loss to the surroundings. For the most part, it is approximately a 20%
increase in flowrate as the fitting size doubles. The only difference was a 50% increase in
flowrate for hydrogen and propane when going from fitting 8L to 4L. Also, in the smaller
fittings, the gas will leak in a smaller area allowing for a higher concentration of fuel. For the
larger fittings, the gas has a larger leakage area, making for a smaller concentration of fuel.
Hydrogen flames in Fig. 2.14 are all similar regardless of the fitting size. The flowrates for each
fitting diameter were similar in size and would correspond to flames of approximately the same
size. The flames were not visible to the naked eye and an extended exposure at a high ISO was
necessary to obtain a picture of them. Each flame is approximately 1.35 mm in diameter.
Figure 2.13. Minimum flaming flowrate for each gas at differently sized
compression fittings.
0
0.1
0.2
0.3
0.4
0.5
0.6
Hydrogen Methane Propane
Min
imu
m F
low
rate
(m
g/s
)
3.1 mm Fitting
6.3 mm Fitting
12.6 mm Fitting

28
In Fig. 2.15 and 2.16 the methane and propane flames are all approximately the same size even
though Fig. 2.13 showed the flowrate increased with increasing fitting size. As the flame width
and height are the same, there could be an increase in flame depth that is not readily visible
through the image. The flowrates also are possibly not large enough that an increase in flame
size would be visible. Each flame is approximately 3.85 mm wide and 3.85 mm from the flame
tip to the base.
Figure 2.15. Color images of methane flames in vertical position for different sized
fittings. Each flame is at its minimum flowrate. The camera settings are 1/10 s, F1.4,
ISO 800.
Figure 2.14. Color images of hydrogen flames in vertical position for different sized
fittings. Each flame is at its minimum flowrate. The camera settings are 20 s, F1.4, ISO
1600.

29
Figure 2.16. Color images of propane flames in vertical position for different sized
fittings. Each flame is at its minimum flowrate. The camera settings are1/10 s, F1.4,
ISO 800.

30
Chapter 3: Weak Flames
3.1 Experimental Background and Procedure
Weak flames have an important role in the field of micro-combustors. These weak flames hold
the ability to replace electrical igniters. The ability to produce weak but stable flames can
increase the turndown ratio of micro-combustors. The weak flames are also important in
fundamental combustion models. If these simple flames can be modeled correctly, then the
results can be expanded to the extinction behavior of larger, more complex flames.
3.1.1 Experimental Introduction
Ronney et al. (1998) did experiments in microgravity using weak fuel pre-mixtures to produce
flame balls. A flame ball is a steady, spherical flame in a premixed gas. Fuel and oxygen diffuse
in while the combustion products and heat diffuse out. Ronney et al. (1998) found that the flame
balls released 1.0-1.8 W per ball. Later, flame balls with energy releases as low as 0.5 W were
recorded (Philips, 2003). At the time, they were the weakest flames ever recorded.
Butler et al. (2007, 2008) did experiments on curved wall, pinhole and tube burners measuring
quenching flowrates. They found that the lowest flowrates occurred for tube burners and had a
minimum for burners with an internal diameter of approximately 0.15 mm. They later showed
that tube burners in an inverted configuration allowed for the smallest necessary flow to sustain
combustion.
Hydrogen is being used in micro-electrical-mechanical systems (MEMS) that are found in many
commercial applications. Hydrogen is the fuel of choice for these systems owing to its high
heating value, rapid rate of vaporization, fast diffusion velocity, short reaction time, and high
flame speed (Yang et al., 2002). Yang et al. (2002) found that hydrogen fuels are 24 times more

31
powerful than state of the art lithium batteries of the same size. Hydrogen is also cheaper,
provides a more constant voltage, has no memory effect and instant recharge capability (Yang et
al., 2002). Zhang et al. (2006) also noted that the quenching distance of hydrogen is much
shorter than that of hydrocarbons and the combustion of hydrogen is more stable than other fuels.
Zhang et al. (2006) performed experiments where hydrogen was mixed with hydrocarbons to
lower the quenching distance and increase the flame speed of the mixture. They found that
hydrogen was able to ignite but that pure methane and ethane were not unless platinum was
present. The main issues when working with micro-combustion are the thermal and radical
quenching effects. The high surface-to-volume ratio of micro-combustion devices poses
challenges to researchers (Chen et al., 2007). These issues can be reduced or eliminated by
increasing the wall temperature or preventing heat losses to the wall (Fernandez-Pello, 2002).
As the increase of the surface-to-volume ratio of the combustor becomes a problem for gas-phase
combustion, it begins to favor catalytic combustion. This reaction is typically slower than a gas-
phase reaction and heat loss is still a problem, but the increase in surface area and lower
temperatures of the catalytic reaction may allow easier implementation (Fernandez-Pello, 2002).
These catalytic systems are typically easier to start, self-sustaining at leaner fuel/air ratios and
can be designed with no moving parts (Federici et al., 2006).
3.1.2 Burners
Experiments were performed to attempt to observe the weakest flame observed to date. Tube
burners were used as Butler et al. (2007, 2008) found that tube burners in the inverted position
allowed for the smallest flowrates with sustained combustion. The three burners used during the
experiment can be found in Table 3.1. Steel hypodermic tubes (Small Parts, Inc.) were obtained

32
with an inside diameter of 0.152 mm. Platinum hypodermic tubes (Goodfellow Cambridge
Limited) were obtained with an inside diameter of 0.16 mm. Graphite/polyimide ferrules (Small
Parts, Inc) were used to attach the steel and platinum tubes to a 3.16 mm Swagelok fitting. This
allowed for easy switching of burners as well as leak-proof connections. Each burner was tested
at 5.52 bar (80 psi) with hydrogen for leaks. The ferrules maximum operating pressure was
6.89 bar (100 psi). Soap water was placed along the connections to test for leaks.
Tests were run with an inverted burner (downward discharge) using air as an oxidizer as well as
pure oxygen. Burner SS56 was used during these tests. It was important to determine the
advantage of burning hydrogen in a pure oxygen environment over combustion in ambient air.
Table 3.1. Tube burners used during smallest flame tests. The steel tubes were 152 mm
in length and the platinum tube was 100 mm in length.
Name Material ID (mm) OD (mm)
SS56 Stainless Steel 304 0.559 1.57
SS15 Stainless Steel 316 0.152 0.305
PT16 Platinum (99.95% Pure) 0.16 0.4
3.1.3 Flow System
As oxygen was found to allow smaller flames, it was primarily used as the oxidizer in the weak
flame experiments. The oxygen used was 99.994% purity from Airgas. To provide a steady,
laminar flow of oxygen to the flame, it was supplied through a coflow burner. Oxygen was run
through a ceramic honeycomb in the coflow burner to make the flow laminar. Tests were run
with oxygen flowing at several velocities from the coflow burner to determine the velocity that
allowed for the minimum ignition and quenching limits. Velocities of 4.5, 9, and 18 cm/s were
used. The base value of 9 cm/s was taken from the literature (Santoro, 1987) and then halved
and doubled to find the most beneficial velocity.
33
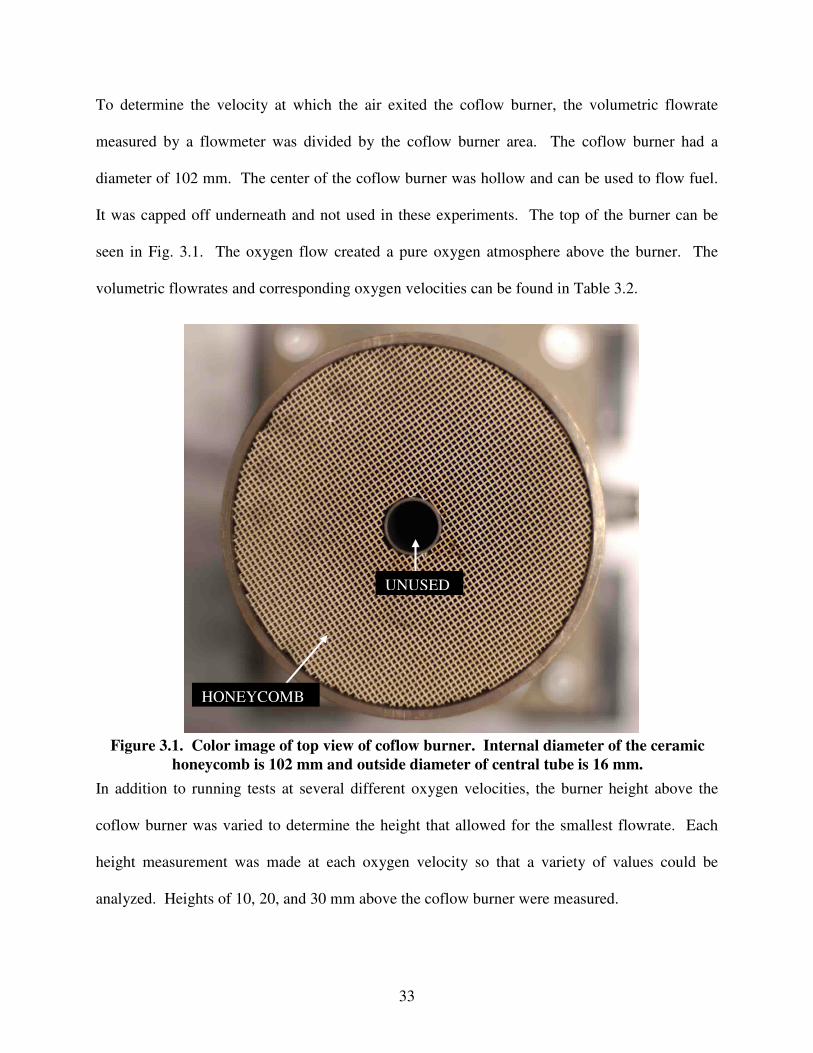
To determine the velocity at which the air exited the coflow burner, the volumetric flowrate
measured by a flowmeter was divided by the coflow burner area. The coflow burner had a
diameter of 102 mm. The center of the coflow burner was hollow and can be used to flow fuel.
It was capped off underneath and not used in these experiments. The top of the burner can be
seen in Fig. 3.1. The oxygen flow created a pure oxygen atmosphere above the burner. The
volumetric flowrates and corresponding oxygen velocities can be found in Table 3.2.
In addition to running tests at several different oxygen velocities, the burner height above the
coflow burner was varied to determine the height that allowed for the smallest flowrate. Each
height measurement was made at each oxygen velocity so that a variety of values could be
analyzed. Heights of 10, 20, and 30 mm above the coflow burner were measured.
Figure 3.1. Color image of top view of coflow burner. Internal diameter of the ceramic
honeycomb is 102 mm and outside diameter of central tube is 16 mm.
UNUSED
HONEYCOMB

34
Table 3.2. Volumetric flowrates and corresponding exit velocities of oxygen.
Volumetric Flowrate (m3/s) Oxygen Flow Velocity (m/s)
3.59E-4 0.045
7.17E-4 0.09
1.43E-3 0.18
The hydrogen flow system (Fig. 3.2) for the smallest flame experiments was almost identical to
the setup used in the compression fitting experiments. The main difference was that a very
sensitive needle valve with very low flow coefficient was placed before the burner to allow fine
changes in flow. This was critical with the small flowrates that were achieved. Experiments
were run at 2.76 bar (40 psi) into the flow valve. The oxygen system (Fig. 3.3) ran from the
pressure regulator on the tank, past a relief valve and through a flowmeter. The flowmeter was
used to determine the velocity of the oxygen exiting the coflow burner. The flowmeter used was
an Omega, model FL-2063-NV.
Figure 3.2. Experimental setup of hydrogen flow system.
A – Gas Cylinder
B – Valve
C – Pressure Regulator
D – Needle Valve
E – Filter
F – Relief Valve (6.89 bar)
G – Ball Valve
H – Pressure Regulator
I – Needle Valve
J – Rubber Stopper
K – Leaky Fitting
L – Open Tube
M – Bubble Meter
A
F
C ED
G
B
L
K
J
H
M
I
A – Gas Cylinder
B – Valve
C – Pressure Regulator
D – Needle Valve
E – Filter
F – Relief Valve (6.89 bar)
G – Ball Valve
H – Pressure Regulator
I – Needle Valve
J – Rubber Stopper
K – Leaky Fitting
L – Open Tube
M – Bubble Meter
A
F
C ED
G
B
L
K
J
H
M
I
A
F
C ED
G
B
L
K
J
H
M
I

35
3.1.4 Procedures
After the optimum height and coflow burner speeds were determined, tests were run using
burners SS15 and PT16. Care had to be taken when igniting the flame with the butane lighter as
the flame from the lighter could ignite the stainless steel in burner SS15 in the pure oxygen
atmosphere. The hydrogen flames were too small for a pop to be heard upon ignition as in the
compression fitting experiments. Ignition was determined by placing the thermocouple slightly
to the side and above the burner and looking for a temperature rise. If flames were sustained for
more than 10 s, the test was considered successful. The burners were photographed against a
black background with the lights off for image contrast. Photographs were taken of the weak
flames using the Nikon D100. Most pictures required extended exposure times.
The mass flowrate was found using the same method as the compression fitting experiments.
The gas exiting the burner was captured and run through a bubble meter where the volumetric
flowrate could be measured. Due to the extremely low flowrate, the gas was not bubbled
through water on the way to the bubble meter as in the compression fitting experiments. The
bubbling caused fluctuations in the measured volumetric flowrate. The power heat release rate
was found by multiplying the hydrogen mass flowrate by the lower heating value. The lower
Figure 3.3. Experimental setup of oxygen flow system.
A
DB
E
F
C
A – Gas Cylinder
B – Valve
C – Pressure Regulator
D – Needle Valve
E – Relief Valve (6.89 bar)
F – Ball Valve
G – Flowmeter
H – Coflow Burner
H
GA
DB
E
F
C
A – Gas Cylinder
B – Valve
C – Pressure Regulator
D – Needle Valve
E – Relief Valve (6.89 bar)
F – Ball Valve
G – Flowmeter
H – Coflow Burner
H
G

36
heating value was taken from literature as 119.9 kJ/g (Kanury, 1975).
It is expected that not all of the hydrogen flowing from the burner was combusted. This means
that the power measured by using the mass flowrate could be higher than the actual heat release
rate. However, as there was no means to verify this, the power measured is the power output as
if all the hydrogen were converted to water. Tests were repeated to show repeatability.
3.1.5 Sources of Error
The weak flame experiments were also susceptible to similar errors as the compression fitting
experiments concerning the airflow in the laboratory and timing of the volumetric flowrate. The
airflow in the laboratory was not a problem for the experiments in the oxygen environment as the
oxygen velocity negated the air currents. The airflow did still cause issues when combusting in
the ambient air. These sources of error were controlled and minimized as much as possible as
explained previously.
There are several potential sources of error during the experimental measuring of the gas
flowrates. The humidity of the lab is one potential source of error affecting the minimum
ignition and quenching flowrates of the fuels. It has been shown that that humidity has no
significant influence on the minimum ignition energy on a hydrogen-air mixture
(Ono et al., 2007), however this did not show the effect of humidity on ignition or quenching
flowrate limits. When measuring the flowrate for the compression fitting experiments, the gas
was bubbled through water so that the humidity of the gas would not affect the volumetric
flowrate measurement. This was not possible during the weak flame experiments as it caused
too many fluctuations during the measurement.
One issue that arose during the weak flame experiments was the ignition of the SS15 burners.
Several burners caught fire during the experiments and had to be replaced. This occurred while

37
trying to ignite the hydrogen exiting the burner in the pure oxygen environment. This was not a
problem when the burner was first introduced to the pure oxygen environment, but only after
extended periods of time in the oxygen. Ignition of the fuel occurred by a butane lighter, which
burns much hotter when it enters the pure oxygen atmosphere. If the lighter was brought too
close to the burner, there were instances where the burner ignited and was not extinguished until
both the hydrogen and oxygen flows were stopped. There were also several cases where the
burner would glow as if from the hydrogen combustion heating but would continue even after
the hydrogen flow was stopped. This made finding the ignition and quenching flowrate limits
difficult as it was not known whether only a flame existed or a flame with the metal reaction. It
is possible that the quenching flowrate for the stainless steel burner was lower owing to a
chemical reaction between the iron and oxygen. This would allow for a smaller hydrogen
flowrate to be found than would occur without metal oxidation. To avoid this, anytime a
measurement was taken, the flow was backed off afterwards to ensure that hydrogen combustion
was the only reaction taking place. The best method to avoid this was to frequently replace the
stainless steel burners. However, using the methods and tools available, it was impossible to tell
whether the measurements were only due to the flame or a combination of the flame and metal
oxidation on burner SS15. The platinum burner did not have this problem as it is a noble metal
and does not oxidize.
3.2 Results
Data collected from the weak flame experiments was used to investigate the ignition and
quenching limits of hydrogen in both air and oxygen. Hypodermic stainless steel and platinum
tubes were used to observe the weakest flames in the world to date.

38
3.2.1 Ignition Flowrate Limits
The oxygen versus air experiments (done with burner SS56) showed that a smaller quenching
flowrate can be obtained by flowing hydrogen into pure oxygen. It was found that combustion in
pure oxygen gave a 30% reduction in the minimum mass flowrate compared to air. The
hydrogen quenching limit in air was 5.64 µg/s while in oxygen it was 3.97 µg/s. This is expected
as burning in pure oxygen results in higher flame temperatures, which raises the reaction rate.
Table 3.3 shows the different ignition flowrate limits that were obtained at various burner heights
and oxygen velocities. For each oxygen velocity, the highest mass flowrate corresponded to the
highest burner height. This is likely due to air mixing in with the oxygen flow at this height,
especially at the weakest oxygen velocity. Diluting the oxygen flow would increase the
minimum fuel flowrate necessary for ignition.
Table 3.3. Burner height and oxygen velocity versus ignition flowrate limits of
hydrogen for Burner SS15.
Burner Height (mm)
Mass Flowrate
(µg/s)
Oxygen Velocity = 45 mm/s
10 5.28
20 5.15
30 6.37
Oxygen Velocity = 90 mm/s
10 5.18
20 5.05
30 5.33
Oxygen Velocity = 180 mm/s
10 4.85
20 5.02
30 5.12
Figure 3.4 shows the ignition flowrate limits of hydrogen found in both oxygen and air. Also
shown are the quenching limits of hydrogen in air found by Butler et al. (2007, 2008). As
expected, the ignition flowrate limits of hydrogen in air are larger than the quenching limits
found by Butler et al. (2007, 2008). A higher flowrate is necessary to have sustained ignition as
there is less preheating of the burner. The minimum ignition flowrate in air was 4.67 µg/s while

39
the quenching limit was 3.93 µg/s. As Fig. 3.4 shows, a 16% higher flowrate is necessary to
have sustained ignition than is needed at the quenching limit. The ignition flowrate limit of
hydrogen in pure oxygen was lower than the hydrogen quenching limit in air. As the flame
temperature is higher in oxygen, the reaction is faster allowing for the smaller flowrate. The
minimum ignition flowrate in oxygen was 2.7 µg/s. This is a 45% lower flowrate than the
quenching limit in air and 73% lower than the ignition flowrate limit in air.
3.2.2 Effects of Orientation on Ignition Flowrate Limits
Figure 3.5 shows the ignition flowrate limits in both oxygen and air for different tube burner
orientations. The initial hypothesis was that the lowest flowrate would occur when the burner
was facing upwards as there is less surrounding metal to take heat away from the reaction.
However, when the burner is facing downwards, a portion of the heat is being used to preheat the
unburned hydrogen. Thus this becomes a heat-recirculating burner, for which temperatures
Figure 3.4. Ignition flowrate limits of hydrogen in air and oxygen with burner in
vertically downward position. Butler et al (2007, 2008) data is the quenching limit in
air.
0
1
2
3
4
5
6
7
8
0 0.5 1 1.5 2 2.5
Burner ID (mm)
Min
imu
m I
gn
ita
ble
Flo
wra
te (µ
g/s
)
Oxygen
Air
Butler et al. (2008)
40
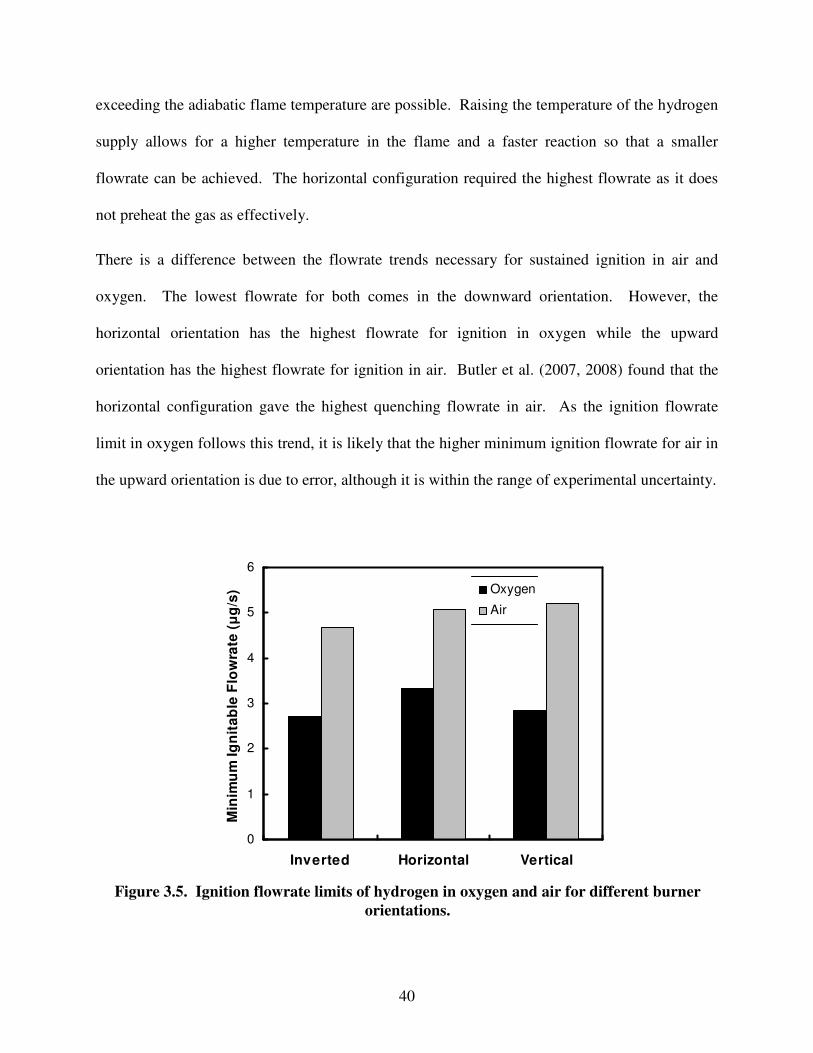
exceeding the adiabatic flame temperature are possible. Raising the temperature of the hydrogen
supply allows for a higher temperature in the flame and a faster reaction so that a smaller
flowrate can be achieved. The horizontal configuration required the highest flowrate as it does
not preheat the gas as effectively.
There is a difference between the flowrate trends necessary for sustained ignition in air and
oxygen. The lowest flowrate for both comes in the downward orientation. However, the
horizontal orientation has the highest flowrate for ignition in oxygen while the upward
orientation has the highest flowrate for ignition in air. Butler et al. (2007, 2008) found that the
horizontal configuration gave the highest quenching flowrate in air. As the ignition flowrate
limit in oxygen follows this trend, it is likely that the higher minimum ignition flowrate for air in
the upward orientation is due to error, although it is within the range of experimental uncertainty.
Figure 3.5. Ignition flowrate limits of hydrogen in oxygen and air for different burner
orientations.
0
1
2
3
4
5
6
Inverted Horizontal Vertical
Min
imu
m I
gn
ita
ble
Flo
wra
te (µ
g/s
) Oxygen
Air
41
3.2.3 Quenching Flowrate
The quenching flowrates for burners SS15 and PT16 can be found in Table 3.4. These were the
only two burners used when attempting to create the weakest, sustained flame. Butler et al.
(2007, 2008) found that the lowest quenching flowrate came from tube burners in the downward
configuration of approximately 0.15 mm internal diameter. From experimentation, minimum
quenching flowrates of 2.1 µg/s were found, which corresponds to a power output of 0.252 W.
Ronney et al. (1998) obtained a minimum power of approximately 1 W in his SOFBALL
experiments, later achieving a power of 0.5 W (Phillips, 2003). These were done in a
microgravity environment and recorded on video. Butler et al. (2007, 2008) found a minimum
heat release rate of 0.55 W in his tube burner quenching experiments. It can be seen that the
quenching limit in oxygen provided a flowrate approximately half that of Butler et al. (2007,
2008) found. This allowed for a heat release rate of 0.252 W, the weakest flame ever observed.
Table 3.4. Hydrogen quenching flowrates in oxygen and corresponding power output.
Burner Quenching Flowrate (µg/s) Power (W)
SS15 2.1 0.252
PT16 2.3 0.276
A slight difference in the measured flowrate for the platinum and stainless steel burner can be
seen. Although there is an 8 µm difference between the internal diameters of the burners, the
main reason that different flowrates were found is attributed to the properties of the burners.
Platinum and stainless steel 316 have thermal conductivities of 71.6 and 16.3 W/m-K,
respectively (Incropera, 2002). Platinum transfers the heat away from the burner tip much better
than stainless steel so that more heat is lost from the reaction region. There is a delicate balance
between the combustion heating and the heat loss to the surroundings. If the heat loss is too
great, the reaction rate will slow and the flame will extinguish.
42
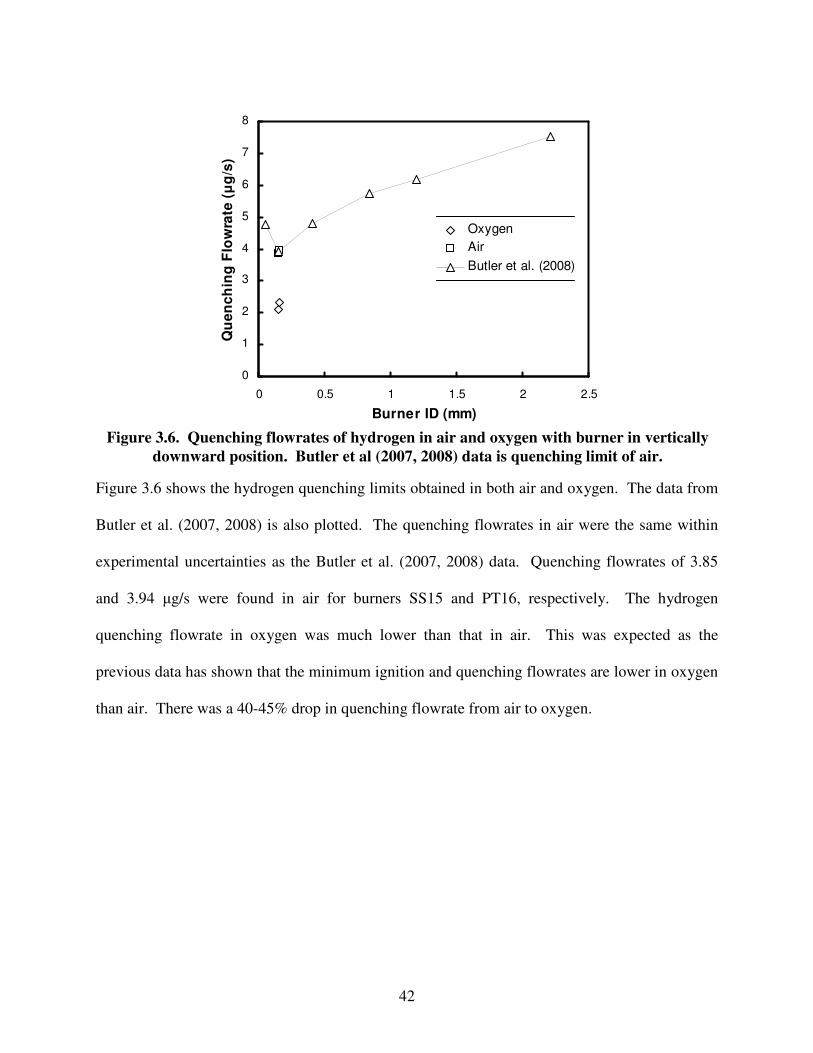
Figure 3.6 shows the hydrogen quenching limits obtained in both air and oxygen. The data from
Butler et al. (2007, 2008) is also plotted. The quenching flowrates in air were the same within
experimental uncertainties as the Butler et al. (2007, 2008) data. Quenching flowrates of 3.85
and 3.94 µg/s were found in air for burners SS15 and PT16, respectively. The hydrogen
quenching flowrate in oxygen was much lower than that in air. This was expected as the
previous data has shown that the minimum ignition and quenching flowrates are lower in oxygen
than air. There was a 40-45% drop in quenching flowrate from air to oxygen.
Figure 3.6. Quenching flowrates of hydrogen in air and oxygen with burner in vertically
downward position. Butler et al (2007, 2008) data is quenching limit of air.
0
1
2
3
4
5
6
7
8
0 0.5 1 1.5 2 2.5
Burner ID (mm)
Qu
en
ch
ing
Flo
wra
te (µ
g/s
)Oxygen
Air
Butler et al. (2008)

43
Figure 3.7 shows the effects of burner diameter on the heat release rate. The heat release rate is
directly proportional to the mass flowrate from Fig. 3.6. Butler et al. (2007, 2008) showed that
an increase in burner diameter causes the heat release rate to increase owing to an increase in
quenching flowrate. A minimum in terms of flowrate and power occurs at an approximate
internal diameter of 0.15 mm.
3.2.4 Weakest Flame Ever Observed
Representative quenching limit flames from burner SS15 can be seen in Fig. 3.8. These are
images of the world's weakest observed flame to date. The flame diameter is approximately that
of the burner for the H2/O2 reaction. A faint outline of the flame for the H2/air reaction is visible
beneath the burner. It is difficult to maintain the flame at the quenching limit in the H2/air
reaction due to the air currents in the laboratory. The H2/O2 reaction did not have this problem
as the oxygen velocity negated any airflow currents. The glowing in the H2/air reaction is
Figure 3.7. Heat release rate in air and oxygen with burner in vertically downward
position. Butler et al (2007, 2008) data is for air only.
0.0
0.1
0.2
0.3
0.4
0.5
0.6
0.7
0.8
0.9
1.0
0 0.5 1 1.5 2 2.5
Diameter (mm)
Po
we
r (W
)OxygenAirButler et al. (2008)

44
attributed to the higher flowrate exiting the burner.
Flames from the burner PT16 are shown in Fig. 3.9. These were taken just before the quenching
flowrate. The H2/O2 flame is approximately the same size as the internal diameter of the
platinum burner. The H2/air flame is slightly larger, which would correspond to the higher
quenching flowrate. A slight glow can be seen coming off the burner from the H2/O2 flame.
This could be due to a surface reaction on the burner or the heating of the burner due to the
flame.
Figure 3.8. Color image of world’s weakest flame using burner SS15 for hydrogen in
oxygen (left) and air (right). The H2/O2 flame has a power of 0.252 W while the H2/air
flame has a power of 0.463 W. The camera settings were 30 s, F2.8, ISO 800.

45
Figure 3.9. Color image of weak flame using burner PT16 for hydrogen in oxygen (left)
and air (right). The H2/O2 flame has a power of 0.276 W while the H2/air flame has a
power of 0.474 W. The camera settings were 30 s, F1.4, ISO 200.

46
Chapter 4: Conclusions This was a study of the ignition and quenching flowrates of hydrogen flames from compression
fittings and tube burners using both air and oxygen as oxidizers. Methane and propane were also
used as fuels in the compression fitting experiments to give a scale to the hydrogen limits and
find their ignition limits. This work is expected to be useful in the creation of hydrogen safety
codes and in the field of micro-combustors.
4.1 Compression Fittings
The minimum flowrates necessary for igniting and sustaining hydrogen, methane, and propane
flames on a leaky compression fitting is 0.028, 0.378, and 0.336 mg/s, respectively. This was
due to hydrogen's lower molecular weight and smaller quenching distance. It was found that the
ignition flowrate limit of each fuel was independent of upstream pressure for pressures of 1-100
bar (1-7 bar for propane).
The leaky fitting orientation has no statistically significant effect on the ignition flowrate limit of
hydrogen. Burner orientation did play a significant role in the minimum flowrate for propane
and methane. The lowest flowrate occurred with the burner in an inverted orientation and the
highest flowrate with the burner in a vertical orientation. Orientation had an effect due to the
amount of surrounding metal that the flames impinged upon. The less heat lost to the
surroundings, the lower the flowrate was.
For each fuel, the leaky fitting with the scratched ferrule had the lowest flowrate necessary for
sustained ignition. This burner had the straightest path for the fuel to flow before exiting the
fitting, which allowed for smaller flowrates. The burners with the loosened fittings had the
highest flowrate necessary for sustained ignition. There was a larger area for the fuel to spread
47
before exiting the fitting, which made for a higher flowrate to sustain ignition.
The ignition flowrate limit increased with increasing burner size. As the burners got larger, the
flames impinged on a wider, thicker surface. As more heat was drawn from the flame, a higher
flowrate was necessary for sustained ignition. Also, the flow was less concentrated at the fitting
exit for the larger burners, which made for larger flowrates.
In every case, the hydrogen flames were too small and dim to see with the naked eye. Photos of
the hydrogen flames required extended exposures at a high ISO. When the lighter was brought
near the burner, a pop typically signaled that ignition of the hydrogen had occurred. The
methane and propane limit flames were visible for every burner but did not omit a popping sound
upon ignition.
Applying a soap water solution is an effective way to check for hydrogen leaks at fittings. Leak
rates above the quenching limits produce visible bubbles in the solution.
4.2 Weak Flames
The weakest flames were obtained when the burner height above the coflow burner was 10 mm
with an oxygen velocity of 0.18 m/s. The optimal burner orientation was downwards. The
ignition and quenching flowrates were lower in a pure oxygen environment than in air. As in the
compression fitting experiments, the hydrogen flame was not visible to the naked eye and could
only be seen using extended exposures with the camera.
This study led to the discovery of the weakest flames observed to date. The weakest flame ever
recorded was found using a stainless steel burner with an internal diameter of 0.152 mm. A
quenching flowrate of 2.1 µg/s was found in a pure oxygen atmosphere. This corresponds to a
power output of 0.252 W, half the size of the previous weakest observed flame. In comparison, a

48
birthday candle flame produces 50 W. The platinum burner with an internal diameter of
0.16 mm gave a quenching flowrate of 2.3 µg/s, which corresponds to a power of 0.28 W. This
is slightly higher than that found with the stainless steel burner and could be the result of a lack
of surface reactions on the burner.
MEMS systems can benefit from these flames owing to the high turndown ratios and use of pilot
flames. These flames have such low flowrates that they can be used as pilot flames, removing
the need for electrical igniters. Using a weak hydrogen flame, especially in an oxygen
atmosphere, would allow these systems to be made even smaller.

49
Appendix A: Fuel Properties
Hydrogen
Molecular Weight 2.016 g/mol
Lower Heating Value 119.9 MJ/kg
Spontaneous Ignition Temperature 571.1 °C
Maximum Flame Speed 291.19 cm/s
Quenching Distance 0.51 mm
Specific Heat Ratio 1.41
Methane
Molecular Weight 16.04 g/mol
Lower Heating Value 50 MJ/kg
Spontaneous Ignition Temperature 632.2 °C
Maximum Flame Speed 37.71 cm/s
Quenching Distance 2.03 mm
Specific Heat Ratio 1.31
Propane
Molecular Weight 44.096 g/mol
Lower Heating Value 46.3 MJ/kg
Spontaneous Ignition Temperature 504.4 °C
Maximum Flame Speed 42.89 cm/s
Quenching Distance 1.78 mm
Specific Heat Ratio 1.15
Table A.1. Values obtained from Appendix C of SFPE Handbook (2002)

50
References
Baker J., Calvert M.E., Murphy D.W. Structure and dynamics of laminar jet micro-slot diffusion
flames. Journal of Heat Transfer 2002; 124:783-790.
Ban H., Venkatesh S., Saito K. Convection-diffusion controlled laminar micro flames.
Transactions of the ASME 1994;116:954-959.
Bossel, U.B., Eliasson, B. The Future of the Hydrogen Economy: Bright or Bleak?. Proc. Of
Fuel Cells World, Lucerne, Switzerland, July 2002.
Bregeon B., Gordon A.S., and Williams, F.A. Near-Limit Downward Propagation of Hydrogen
and Methane Flames in Oxygen-Nitrogen Mixtures. Combustion and Flame, 1978; 33:33-
45.
Burke S.P., Schuman T.E.W. Diffusion flames. Industrial and Engineering Chemical Research.
1928; 20:998-1004.
Butler M.S., Axelbaum R.L., Moran C.W., Sunderland P.B. Flame Quenching Limits of
Hydrogen Diffusion Flames, Eastern States Section of the Combustion Institute,
Charlottesville, 2007.
Butler M.S., Axelbaum R.L., Moran C.W., Sunderland P.B. Flame Quenching Limits of
Hydrogen Leaks, SAE World Congress, Detroit, SAE Paper 2008-01-0726, 2008.
Cadwallader L.C., Herring J.S. Safety issues with hydrogen as a vehicle fuel. Report
INEEL/EXT-99-00522 prepared for U.S. Department of Energy 1999.
Chao Y.C., Chen G.B., Hsu C.J., Leu T.S., Wu C.Y., Cheng T.S. Operational characteristics of
catalytic combustion in a platinum microtube. Combustion Science and Technology,
2004; 176:1755-1777.
Chen G.B., Chen C.P., Wu C.Y., Chao Y.C. Effects of catalytic walls on hydrogen/air
combustion inside a micro-tube. Applied Catalysis A: General, 2007; 332:89-97.
Cheng T.S., Chao Y-C., Wu C-Y., Li Y-H., Nakamura Y., Lee K-Y., Yuan T., Leu T.S.
Experimental and numerical investigation of microscale hydrogen diffusion flames.
Proceedings of the Combustion Institute, 2005; 30:2489-2497.
Federici J.A., Norton D.G., Bruggemann T., Voit K.W., Wetzel E.D., Vlachos D.G. Catalytic
microcombustors with integrated thermoelectric elements for portable power production.
Journal of Power Sources, 2006; 161:1469-1478.
Fernandez-Pello A.C. Micropower generation using combustion: issues and approaches.
Proceedings of the Combustion Institute, 2002; 29:883-899.

51
Ge X., Sutton W.H. Analysis and test of compressed hydrogen interface leakage by commercial
stainless steel (NPT) fittings. SAE International, 2006:35-47.
Incropera F.P., DeWitt D.P. Fundamentals of Heat and Mass Transfer. Hoboken, NJ: Wiley,
2002: 906-907.
Jacobson A.S., Epstein A.H. An informal survey of power MEMS. The International
Symposium on Micro-Mechanical Engineering, December 2003.
Jouanne A., Husain I., Wallace A., Yokochi A. Gone with the wind. IEEE Industry Applications
Magazine July/Aug 2005:12-19.
Kanury A.M. Introduction to Combustion Phenomena. New York, NY: Gordon and Breach,
1975: 130-131.
Lee I.D., Smith O.I., Karagozian A.R. Hydrogen and helium leak rates from micromachined
orifices. AIAA Journal, 2003; 41(3):457-463.
Lovins, A.B. Twenty Hydrogen Myths, Final Report. Rocky Mountain Institute Snowmass, CO,
2003.
Marban G., Valdes-Solis T. Towards the hydrogen economy? International Journal of Hydrogen
Energy 2007; 32:1625-1637.
Matta L.M., Neumeier Y., Lemon B., Zinn B.T. Characteristics of microscale diffusion flames.
Proceedings of the Combustion Institute, 2002; 29:933-938.
Munson B.R., Young D.F., Okiishi T.H. Fundamentals of Fluid Mechanics. Hoboken, NJ:
Wiley, 2006.
Nakamura Y., Yamashita H., Saito K. A numerical study on extinction behaviour of laminar
micro-diffusion flames. Combustion Theory and Modeling, 2006; 10(6):927-938.
Ono R., Nifuku M., Fujiwara S., Horiguchi S., Oda T. Minimum Ignition Energy of Hydrogen-
Air Mixtures: Effects of Humidity and Spark Duration. Journal of Electrostatics, 2007;
65(2):87-93.
Peterson, R.B. Small Packages. Mechanical Engineering Magazine 2001.
Phillips T. NASA, 2003. <http://spaceresearch.nasa.gov/general_info/31jan_kelly_lite.html>
Ronney P.D., Wu M.S., Pearlman H.G. Structure of Flame Balls at Low Lewis-Number
(SOFBALL): Preliminary Results from the STS-83 and STS-94 Space Flight
Experiments. Aerospace Sciences Meeting and Exhibit, Reno (1998).
Ronney P.D., Wu M.S., Pearlman H.G. Experimental study of flame balls in space: preliminary

52
results from STS-83. AIAA Journal, 1998; 36(8): 1361-1368.
Roper F.G. The prediction of laminar jet diffusion flame sizes: Part 1. Theoretical model.
Combustion and Flame, 1977; 29:219-226.
Santoro R.J., Yeh T.T., Horvath J.J., Semerjian H.G. The Transport and Growth of Soot
Particles in Laminar Diffusion Flames. Combustion Science and Technology, 1987;
53:89-115.
Schefer R.W., Houf W.G., San Marchi C., Chernicoff W.P., Englom L. Characterization of leaks
from compressed hydrogen dispensing systems and related components. International
Journal of Hydrogen Energy, 2006; 31:1247-1260.
Sherif S.A., Barbir F., Veziroglu T.N. Wind energy and the hydrogen economy - review of the
technology. Solar Energy, 2005; 78:647-660.
Swain M.R., Swain M.N. A Comparison of H2, CH4, and C3H8 Fuel Leakage in Residential
Settings. International Journal of Hydrogen Energy, 1992; 17:807-815.
Takeno K., Okabayashi K., Kouchi A., Nonaka T., Hashiguchi K., Chitose K. Dispersion and
explosion field tests for 40 MPa pressurized hydrogen. International Journal of Hydrogen
Energy, 2007; 32(13):2144-2153.
Turns, S.R., An Introduction to Combustion. McGraw-Hill, (2000).
U.S. Department of Energy, Hydrogen Program, Hydrogen and Our Energy Future, DOE/EE-
0320, U.S. Department of Energy 2007.
Veziroglu T.N., Babir F. Hydrogen: The Wonder Fuel. International Journal of Hydrogen
Energy, 1972; 17, 391-404.
Yang W.M., Chou S.K., Shu C., Li Z.W., Xue H. Combustion in micro-cylindrical combustors
with and without a backward facing step. Applied Thermal Engineering, 2002; 22:1777-
1787 (2002).
Yamawaki M., Nishihara T., Inagaki Y, Minato K., Oigawa H., Onuki K., Hino R., Ogawa M.
Application of nuclear energy for environmentally friendly hydrogen generation.
International Journal of Hydrogen Energy, 2007; 32:2719-2725.
Zhang Y., Zhou J., Yang W., Liu M., Cen K.. Effects of hydrogen addition on methane catalytic
combustion in a microtube. International Journal of Hydrogen Energy, 2006; 32:1286-
1293.