Flame ionization detection of hydrocyanic acid ; Analysis ...
132
AN ABSTRACT OF THE THESIS OF ROBERT RAYMOND CLAEYS for the Ph. D. (Name of student) in Chemistry (Analytical) (Major) (Degree) presented on January 29, 1968 (Date) Title: FLAME IONIZATION DETECTION OF HYDROCYANIC ACID, ANALYSIS OF TRACE AQUEOUS SOLUTIONS Abstract approved: Professor Harry Freund A gas chromatographic procedure was developed for the de- termination of nanogram quantities of hydrocyanic acid using a flame ionization detector. Excellent chromatograms were obtained on a porous polyaromatic polymer column (Porapak Q) at 60o C. The procedure was employed for the analysis of HCN in aqueous cyanide solutions. Solutions as low as 1μg /liter (ppb) HCN were analysed in five minutes after a 30 minute concentration period in which air is swept through the solution and HCN collected in a cold trap for gas chromatographic analysis. When interferences are encountered on the Porapak Q column preliminary separation is achieved on a 1,, 2,.3- tris(2- cyanoethoxy) propane (TCEP) on Chromosorb W col- umn. The HCN is trapped from the TCEP column effluent and re- injected on a Porapak Q column for analyses. The amount of chloro- form in chlorinated water was also determined by this procedure,
Transcript of Flame ionization detection of hydrocyanic acid ; Analysis ...

AN ABSTRACT OF THE THESIS OF
ROBERT RAYMOND CLAEYS for the Ph. D.
(Name of student)
in Chemistry (Analytical) (Major)
(Degree)
presented on January 29, 1968 (Date)
Title: FLAME IONIZATION DETECTION OF HYDROCYANIC
ACID, ANALYSIS OF TRACE AQUEOUS SOLUTIONS
Abstract approved: Professor Harry Freund
A gas chromatographic procedure was developed for the de-
termination of nanogram quantities of hydrocyanic acid using a
flame ionization detector. Excellent chromatograms were obtained
on a porous polyaromatic polymer column (Porapak Q) at 60o C. The
procedure was employed for the analysis of HCN in aqueous cyanide
solutions. Solutions as low as 1µg /liter (ppb) HCN were analysed
in five minutes after a 30 minute concentration period in which air
is swept through the solution and HCN collected in a cold trap for gas
chromatographic analysis. When interferences are encountered on
the Porapak Q column preliminary separation is achieved on a
1,, 2,.3- tris(2- cyanoethoxy) propane (TCEP) on Chromosorb W col-
umn. The HCN is trapped from the TCEP column effluent and re-
injected on a Porapak Q column for analyses. The amount of chloro-
form in chlorinated water was also determined by this procedure,

Deactivated diatomaceous earth supports and the fluoro-
carbon supports were evaluated for the determination of trace quan-
tities of HCN. These supports were either inefficient or adsorption
on the solid support caused severe tailing.
Several stationary phases were investigated. Best results
were obtained with Carbowax 1540 or 1, 2, 3-tris(2-cyanoethoxy)-
propane when Chromosorb W was used as a solid support.

Flame Ionization Detection of Hydrocyanic Acid Analysis of Trace Aqueous Solutions
by
Robert Raymond Claeys
A THESIS
submitted to
Oregon State University
in partial fulfillment of the requirements for the
degree of Doctor of Philosophy
June 1968

APPROVED:
Professor of Chemistry in charge of major
Head of Department of Chemistry
Dean of Graduate School
Date thesis is presented
Typed by Ruth Baines for Robert Raymond Claeys
E -

ACKNOWLEDGMENT
I wish to express my sincere gratitude to Dr. Harry Freund
for his advice and consultation during the investigations described
in this thesis. I also wish to thank the Department of Chemistry
for support in this investigation.

TABLE OF CONTENTS
Page
INTRODUCTION 1
Evaluation of Reported Analytical Methods for Cyanide Determination 2
Colorimetric Methods for Cyanide Ion Determinations 3
Electrochemical Methods 4
Evaluation of Gas Chromatographic Ionization Detectors 5
Beta Ionization Detectors 7
Photoionization Detectors 8
Electron Capture Detectors 9
Electron Mobility Detectors 10
Flame Ionization Detector 11
A STUDY OF FLAME PARAMETERS 14
Enhancing Flame Ionization Detector Sensitivity 15
Comparing the Sensitivity of F CN by Electron Capture and Flame Ionization Detection to Thermal Conductivity Detection 16
Experimental 16
Electron Capture Detection 16
Flame Ionization Detection 16
Results and Discussion 17
INVESTIGATION OF SOLID SUPPORTS 22
Diatomaceous Earth Supports 25
Column Preparation 28
Experimental 28
Results and Discussion 31
Chromatographic Column Comparisons 32
Experimental 32
Results and Discussion 32
Glass Bead Solid Support 33
Experimental 35
Results and Discussion 35
Table of Contents - Continued Page
Investigation of Fluorcarbon Polymers as Solid Supports 37
Experimental 38
Results and Discussion 39
Other Chromatographic Supports 41
TESTING HCN CONCENTRATION PROCEDURE FOR INTERFERING COMPOUNDS 44
Instrumental Modifications 44
Purifying the Air Sweep Gas 45
Testing Water Blanks 46
Mass Spectrographic Identification 47
Determination of the Chloroform Concentration in Chlorinated Water 50
Experimental 50 Results 50
Investigation of Stationary Phases for the Separation of HCN and CHC13 52
Experimental 3 52
Results 54
Testing a Tricresylphosphate Column 56
TWO COLUMN CHROMATOGRAPHIC SYSTEM 58
Two Columns in Series 58
Two Column Dual Oven Chromatographic System 6Z
Apparatus 62 Procedure 66 Experimental Procedure 66
Determining HCN Purity by Mass Spectrometry Using Two Column Dual Oven Chromatographic System 67
INVESTIGATION OF PORAPAK Q 71
Introduction 71
Two Column Chromatographic System with Porapak Q 74

Table of Contents - continued
Page
Analysis of Aqueous Solutions 76 Concentration Column 76
Investigation of Drying Agents 77
Effect of Air Flow Rate and Solution Temperature 82 Stability of HCN Solutions 82 Purification of Water 84 Preparation of Standard Solutions 85
Drying Agent 86 Operating Procedures 86
CONCLUSION 93
BIBLIOGRAPHY 95
APPENDIX 103
CHROMATOGRAPHIC BEHAVIOR OF THE STATIONARY PHASE NEAR ITS FREEZING POINT 103
Experimental 104 Results and Discussion 106
Column 1, Carbowax 20M 106
Column 2, Carbowax 1540 106
Column 3 Halocarbon 6 -00 109 Column 4 Cetyl Alcohol 109
Column 5, Ethylene Glycol Succinate 112 Column 6, Carbowax 1540 114
Conclusions 116
An Example of the Calculation of the Specific Retention Volume 119
Definitions and Experimental Data 119
Calculations 1 20

LIST OF TABLES
Table Page
1 Physical properties of some solid supports 26
2 Mass spectographic data of chloroform 49
3 Polarity of stationary phases 53
4 Mass spectrographic analysis of the HCN chromatographic peak 70
5 Experimental data of the columns investigated 73
6 Net retention volume data 73
7 Relative retention data of some possible water pollutants 75
8 Adsorption of HCN on drying agents 79
9 Determining equilibration volumes 81
10 Data for the construction of calibration curves for 0-20 µg/1 HCN solutions 90
11 Data for the construction of calibration curves for 20 -2000 µg/1 HCN solutions 91
1 2 Columns investigated 118
13 Theoretical plates per foot for benzene 118
14 Specific retention volumes at 80.0 o C 118

LIST OF FIGURES
Figure No, Page
1 Effect of hydrogen flow rate on detector response to HCN 19
2 Effect of air flow rate on detector response to HCN 19
3 Effect of carrier gas flow on flame ionization response to HCN 20
4 Chromatograms of decreasing sample size 26
5 Effect of sample size on retention volume 26
6 Effect of column diameter and particle size on HCN tailing 34
? Glass bead chromatographic column 36
8 A comparison of Chromosorb P, Fluoropak 80, and Teflon -6 solid supports 40
9 A comparison of Kel -F and Chromosorb P solid supports 42
10 Cold trap for mass spectrographic determination 48
11 Standardization curve for the determination of CHC13 in water 51
12 Two column switching apparatus 59
13 HCN chromatogram employing two column switching technique 61
14 Two column dual oven apparatus 63
15 HCN chromatogram employing two column, dual oven technique 68

List of Figures - continued
Figure No.
16
17
18
19
20
21
22
23
24
25
Effect of temperature on the distribution of HCN between air and water
Calibration curves
Chromatograms of HCN on Porapak Q
Specific retention volumes on column 1,
Carbowax 20M
Specific retention volumes on column 2,
Carbowax 1540
Specific retention volumes on column 3,
Halocarbon 6 -00
Specific retention volumes of column 4, c e tyl alcohol
Specific retention volumes on column 5, ethylene glycol s uc c ina to
Specific retention volumes on column 6,
Carbowax 1540
Peak profile for ethanol
Page
83
89
92
107
108
110
111
113
115
117
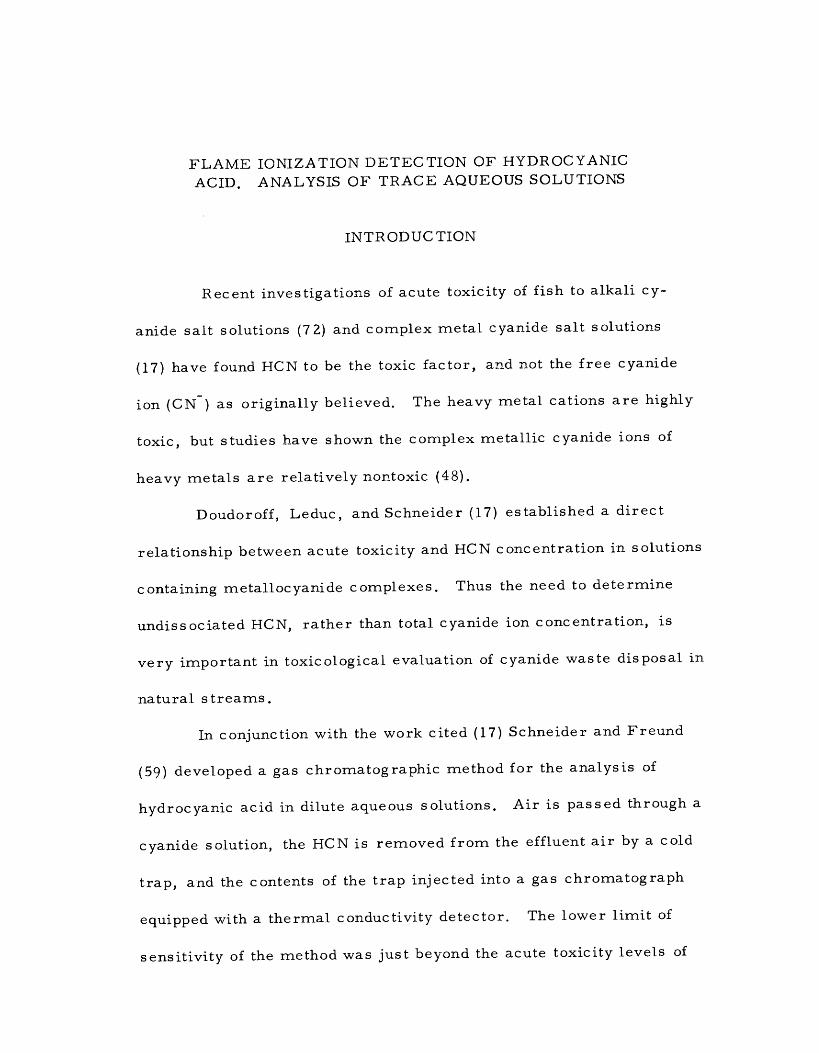
FLAME IONIZATION DETECTION OF HYDROCYANIC ACID, ANALYSIS OF TRACE AQUEOUS SOLUTIONS
INTRODUCTION
Recent investigations of acute toxicity of fish to alkali cy-
anide salt solutions (7 2) and complex metal cyanide salt solutions
(17) have found HCN to be the toxic factor, and not the free cyanide
ion (CN ) as originally believed. The heavy metal cations are highly
toxic, but studies have shown the complex metallic cyanide ions of
heavy metals are relatively nontoxic (48).
Doudoroff, Leduc, and Schneider (17) established a direct
relationship between acute toxicity and HCN concentration in solutions
containing metallocyanide complexes. Thus the need to determine
undissociated HCN, rather than total cyanide ion concentration, is
very important in toxicological evaluation of cyanide waste disposal in
natural streams.
In conjunction with the work cited (17) Schneider and Freund
(59) developed a gas chromatographic method for the analysis of
hydrocyanic acid in dilute aqueous solutions. Air is passed through a
cyanide solution, the HCN is removed from the effluent air by a cold
trap, and the contents of the trap injected into a gas chromatograph
equipped with a thermal conductivity detector. The lower limit of
sensitivity of the method was just beyond the acute toxicity levels of

2
the fish studied.
To study the effects of sublethal exposures of hydrocyanic acid
on fish and its aquatic environment, a more sensitive analytical meth-
od was needed. Tl. i s research was undertaken to develop more sen-
sitive detection methods for the analysis of aqueous hydrocyanic
acid solutions.
Evaluation of Reported Analytical Methods for Cyanide Determination
Any determination of HCN in polluted water must be made
without a significant change in the HCN H ++ CN equilibrium in the
solution. Removal of significant quantities of HCN from an alkali
cyanide solution would produce additional HCN, giving rise to an er-
roneous analysis. Any addition of reagents also must not influence
the HCN -CN equilibrium.
Schneider (58, p 2) has calculated the distribution constant of
HCN in equilibrium between air and water at low concentrations.
At ZOO C mg of HCN per liter of gas = approximately 3x10⁻³.. (1). mg of HCN per liter of solution
Passing 1 liter of air through 10 liters of solution would remove
0.03 % of the hydrocyanic acid from the solution. Thus the method of
Schneider and Freund (59) appeared to be a satisfactory and reason-
able approach as an initial concentration step for any detection
method.

3
Colorimetric Methods for Cyanide Lon Determination
Several sensitive colorimetric methods exist for the determin-
ation of cyanide ion concentrations. Hydrocyanic acid in the effluent
air from a cyanide solution could be trapped in a weak solution of
sodium hydroxide and the cyanide ion measured colorimetrically.
Snell and Snell (62, p 856 -868) list seven principal colori-
metric methods. The two most commonly used are the Aldridge (1)
and the Epstein (18) methods. In the Epstein method C N is convert-
ed to CNC1 by the addition of Chloramine T. The CNC1 forms a blue
dye on addition of pyridine containing i - phenyl -3- methyl -5- pyrazo-
lone and bispyrazolone. In the Aldridge method CN is converted to
CNBr with bromine water. The CNBr forms a red color on addition
of pyridine containing benzidine. The United States Food and Drug
Administration has adopted the Aldridge method as an official pro-
cedure (70) while "Standard Methods for the Examination of Water
and Waste Water ", 1960, (3, p 350 -358) elects to use the Epstein
procedure. The latter reports O. 5 fig cyanide ion sensitivity in 25 ml
of water with a 1 to 5 µg effective range and 1.7% coefficient of var-
iation; and a O. 1 µg sensitivity with an effective range of O. 2 to 2 µg,
and 3. 9 % coefficient of variation when the colored cyanide complex is
extracted from the 25 ml water s o.lution with 10 ml of organic solvent.
The minimum sensitivity was defined as amount of cyanide ion to
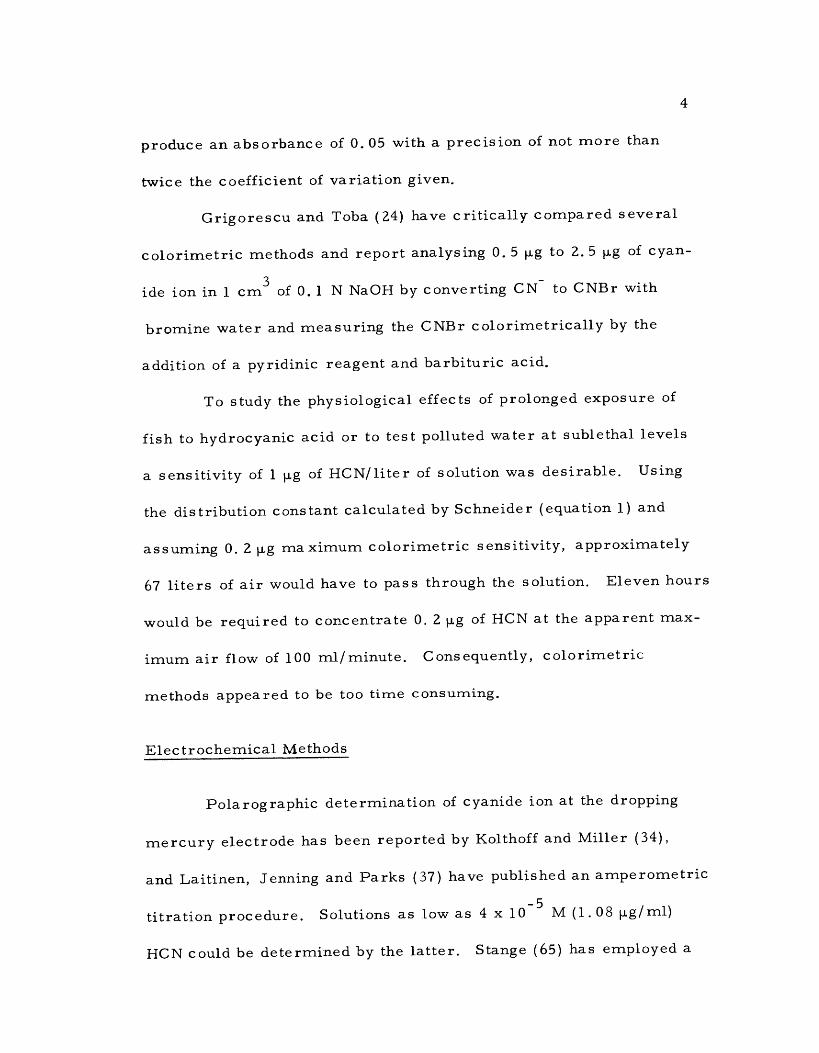
4
produce an absorbance of 0.05 with a precision of not more than
twice the coefficient of variation given.
Grigorescu and Toba (24) have critically compared several
colorimetric methods and report analysing 0.5µg to 2. 5 µg of cyan-
ide ion in 1 cm3 of 0.1 N NaOH by converting CN to CNBr with
bromine water and measuring the CNBr colorimetrically by the
addition of a pyridinic reagent and barbituric acid.
To study the physiological effects of prolonged exposure of
fish to hydrocyanic acid or to test polluted water at sublethal levels
a sensitivity of 1 µg of HCN /liter of solution was desirable. Using
the distribution constant calculated by Schneider (equation 1) and
assuming O. 2 µg maximum colorimetric sensitivity, approximately
67 liters of air would have to pass through the solution. Eleven hours
would be required to concentrate O. 2 µg of HCN at the apparent max-
imum air flow of 100 ml /minute. Consequently, colorimetric
methods appeared to be too time consuming.
Electrochemical Methods
Polarographic determination of cyanide ion at the dropping
mercury electrode has been reported by Kolthoff and Miller (34),
and Laitinen, Jenning and Parks (37) have published an amperometric
titration procedure. Solutions as low as 4 x 10 -5
M (1.08 µg/ m1)
HCN could be determined by the latter. Stange (65) has employed a

5
potentiometric procedure for the continuous monitoring of HCN in
industrial air effluents. The detection range of the cell was 1 x 10 -2
to 1 x 10 -5M HCN. All of the electrochemical methods reviewed
were nearly equal or less sensitive than colorimetric procedures, and
would be equally time consuming. Gas chromatographic analysis of
molecular HCN offered still an additional approach.
Evaluation of Gas Chromatographic Ionization Detectors
The method of Schneider (59) employed a thermal conductivity
thermistor bridge for the gas chromatographic detection of HCN.
The output signal from the bridge was amplified by a d. c. chopper -
stabilized operational amplifier with a gain of twenty. Greater sen-
sitivity might be obtained by ionization detectors; consequently an
evaluation of the existing ionization detectors was made.
Sternberg (63) has briefly reviewed detection devices for gas
chromatography. The author has separated highly sensitive devices
from normal sensitivity devices by distinguishing between those de-
tectors which measure a bulk property of a mixture of carrier gas and
sample and those which measure a specific property of the sample not
possessed by the carrier gas. Bulk property detectors include ther-
mal conductivity, gas density, dielectric constant, electron mobil-
ity and cross section detectors. With these detectors the response to
the property measured is not in general more than ten fold

6
discrimination between pure carrier gas and pure sample vapors.
Hence very fine measurement of the property is necessary for high
sensitivity. For instance, with very fine design nearly 1µg of pro-
pane can be detected by a thermal conductivity detector.
Some of the specific property detectors include hydrogen flame
ionization, beta ionization, photoionization, far ultraviolet adsorp-
tion, and electron capture detectors. It is this group of detectors
which appeared most promising for detecting trace amounts of HCN.
The same author also lists those detectors which are concen-
tration sensing devices and those which are rate of introduction
sensing devices. The concentration sensing devices include thermal
conductivity, gas density, electron mobility, and electron capture
detectors. The peak area (A) is proportional to the response factor
(K) and the quantity of sample (Q), and inversely proportional to the
flow rate (F) .
A - KQ F
(2)
where F is in units of ml/ min, Q in milligrams, K in mv/ mg/ ml,
and A in my -min. From equation 2 a decrease in the column flow will
result in an increase in the peak area. This is particularly important
in trace analysis where high sensitivities are needed.
The hydrogen flame and beta ionization detectors respond to
the rate of introduction of sample into the detector.
7
R = K'dn dt
(3)
where t represents time in seconds, n is the number of moles of
sample, K is the response factor (coulombs /mole), and R is the
response of the detector in ampheres. From equation 3 the response
increases as the rate of sample entering the detector increases.
Hence increasing the carrier gas flow will increase the response up
to some maxima.
Beta Ionization Detectors
Lovelock (43) first introduced this detector in 1958 using
argon carrier gas. The common term for this detector became the
argon ionization detector. Further improvements by Lovelock in-
volving a triode detector was later published (40). In this detector
radiation from a 10 me Sr90 source in a 400 V potential field
excites argon to its metastable state. The energy stored by the
metastable atoms (11.7 ev) is then transferred to the column
effluent vapors. Ionization occurs with all molecules whose ioni-
zation potential is equal to or less than 11.7. ev. The response is
related to the mass of substance introduced, and is generally inde-
pendent of the type of compound.
HCN has an ionization potential of 13.9 ev (49) and would
not be detected by an argon ionization detector. In theory helium
ß

8
and neon with a metastable excitation energy of 19.8 and 16.4 ev,
respectively, could be used in place of argon to detect all molecules.
Berry (8) has reported using helium with some success, but a very
elaborate helium purifying procedure was required. Lovelock (42)
in comparing ionization detectors notes little success has been
achieved with helium carrier gas in beta ionization detectors. Con-
sequently other ionization detectors were considered for HCN de-
tection. 1
Photoionization Detectors
With this detector the column effluent enters an ionization
chamber where ionization of the sample vapor is achieved by ultra-
violet light. The u. v. light is produced in the same chamber by a
glow discharge within a hollow cathode. The vapor ions formed are
collected at a cathode, and the current amplified by an electrometer.
The discharge can be maintained in a helium atmosphere at atmos-
pheric pressure if radiofrequency is supplied to the discharge (42).
1Since the completion of this work, Varian Aerograph (28) has re- ported using helium in a beta ionization detector. A molecular sieve trap at liquid nitrogen temperature is used to remove the impurities from the helium. The signal -to -noise ratio for methane was 55 times greater than a flame ionization detector. This promises to be an extremely sensitive detector for the detection of fixed gases and substances with high ionization potentials.

9
The detector has a low background current of 10 -10 amperes, an
ionization efficiency between a flame and an argon detector, and a
wide range of linearity.
Lovelock (42) found most organic and inorganic gases could
be detected. When commercial carrier gas is used the common con-
taminants absorb the more energetic photons; and the permanent
gases, water vapor, and some molecules with high ionization poten-
tials are not detected. Since HCN has a high ionization potential and
gas purity might be a serious problem, further considerations of
this detector were temporarily dropped.
ElectronCapture Detectors
Lovelock and Lispsky (44) reported a sensitive and selective
detector for the measurement of compounds having an affinity for
free electrons. A low energy beta radiation source (3H or 63Ni)
provides a source of electrons. The potential of the ion chamber
is just sufficient for the collection of all of the free electrons. When
an electron capturing compound enters the ion chamber the electron
current drops as a result of the lower mobility of the negative
molecular ion formed compared to that of a free electron. This de-
tector may be potentially sensitive to the detection of HCN, and
should be investigated.

10
Electron Mobility Detectors
This detector was developed for the analysis of permanent
gases (41). Because of its high ionization potential, HCN might
be detected as a permanent gas.
A collision between an electron and a noble gas atom in a low
electric field is essentially elastic, while the collision between an
electron and an organic molecule is inelastic. The direction of the
electron following elastic collisions is completely randomized by
the large number of collisions. Following inelastic collisions the
energy and velocity of the electron is reduced and tends to drift
in the direction of the electric field. Thus an increase in current
would result when the sample vapor from the column effluent enter-
ed the ion chamber.
Willis (69) used an argon detector for an ion chamber and ar-
gon contaminated with an ionizable gas as a column carrier gas.
As permanent gases from the column entered the detector a decrease
in ion current would occur.
Lovelock (41) employed an argon detector containing a tritium
source and pure monoatomic argon as a carrier gas. The tritium
source served as a cathode, and a pulse generator was connected
to the anode. The pulse duration was so adjusted that the electrons
did not have sufficient time to migrate to the anode. The presence

11
of traces of more complex gases (N2, CO, CH4) from the column
caused a lowering of the mean agitation velocity of the electrons,
and this resulted in an increase in their bulk drift velocity toward
the anode.
Smith and Fidiam (61) have described in detail a similar elec-
tron mobility detector for the detection of permanent gases. A
specially built pulse generator with a pulse -width and amplitude
constant to 0.1 % or better was required for low noise and good
baseline stability. The ultimate sensitivity of CO2 was 4 x 10 -10
gram /sec or O. 6 ppm in air. For a 30 second peak 12 nanograms
of CO2 could be detected. Hydrogen sulfide gave a negative peak
indicating electron capture is dominant. Propane and the olefins
gave anomolous responses.
Although this detector is very sensitive to permanent gases, it
is uncertain what the response might be to HCN. The technical
problems associated with building the detector and pulse generator
and the anomalous response to olefins temporarily discouraged
further investigation of this detector.
Flame Ionization Detector
Harley, Nel,and Pretorius (26) and McWilliam and Dewar (46)
were the first to develop a hydrogen flame ionization detector. Very
few ions are produced in a hydrogen -air or hydrogen- oxygen

12
flame; in the presence of organic carbon compounds a large increase
of ions is produced, resulting in a large signal -to -noise ratio. Two
different theories on the mechanism of ionization in a hydrogen
flame has gained wide acceptance. One explanation, the carbon -
aggregate hypothesis proposed by Stern and presented in several
books on flames (22, p 206; 39, p 299), suggests that each detected
species undergoes a series of reactions with the formation of carbon
as one of the products. Stern calculated a species with an ioniza-
tion potential of 5 ev was required to account for the high degree of
ionization. Since CO, CO2, OH, O, H2O, CH, and C2 all fall in
the 11 -16 range, solid graphite with a work function of 4 ev was
credited as the principal source of ions.
Calote (10) suggested that chemi- ionization not thermal ioni-
zation must be responsible for the high ion concentration. The
chemi - ionization theory holds that the energy released by strongly
exothermic chemical reactions is retained in the product molecules
and leads to ionization before thermal randonization of the enery
occurs. Further support of both hypotheses is given by Perkins
et al. (52) and Sternburg, Gallaway, and Jones (64).
Because of its high ionization potential and single carbon atom,
HCN was thought to be insensitive to flame ionization detection.
The flame ionization detector has been reported to be insensitive
to carbon monoxide, formic acid, formaldehyde, carbon disulfide
13
and cyanogen (CN2) (52). Sternburg, Gallaway, and Jones (64)
found acetonitrile (CH3 -C -N) to have an effective carbon number,
Nc, of 1.35 based on the value of 7.00 for n- heptane:
Peak area acetonitrile/ Moles of acetonitrile Nc = 7. 00 x - 1.35.. (4).
Peak area n- heptane/ Moles of n- heptane
If one gives a value of 0.35 for the -C=Ngroup HCN should be ap-
proximately 0. 35 times as sensitive as methane.
Condon (11, p 35) has reported 3. 3 x 10 -12 grams per second
or 0.002 ppm as the minimum detectable quantity of propane by
flame ionization detection. Assuming the sensitivity of methane to
be 1/3 that of propane and that HCN is 0.35 times as sensitive as
methane, the minimum detectable quantity of HCN would be:
3 x 10 -12 g /sec x 3 = 2.6 x 10 -11 g/ sec of HCN 0. 35
If a 30 second HCN peak is eluted from a chromatographic column,
the minimum detectable quantity would be 7. 8 x 10 -10 g or 0.78 ng
of HCN. For the analysis of 1 ug /liter solutions of HC N, c ollec tion
of one liter of air would require the detection of three nanograms of
HCN (equation 1). Thus the flame ionization detector appeared to
meet the required sensitivity for this investigation.

14
A STUDY OF FLAME PARAMETERS
The electrode design, irate relec trode distance, and the effects
of air, hydrogen and carrier gas flow on detector response have been
extensively studied by Desty, Geach and Goloup (14). They found
the shape of the electrodes was not critical to response. Sternberg,
Gallaway and Jones (64) have studied the mechanism of response of
flame ionization detectors using a Beckman GC -2 hydrogen flame
detector with a 0.016 inch ID jet, the same type of flame ionization
detector used in our laboratory. A continuous-flow gas sample in-
troduction system was employed to eliminate the need for a column
in investigating flame response. The detector response showed a
maximum at 30 ml /min hydrogen flow for heptane with a helium
carrier gas flow of 60 ml /min. Keeping the hydrogen and helium
flow constant the detector response increased with increasing air
flow, reaching 90 % of maximum response at 200 ml /min air flow.
The rate of mass input of heptane was also studied. The detector
response increased with increasing mass input, reaching a maxi-
mum at 60 ml /min helium flow. Only a small decrease in response
was evident above 60 ml /min helium flow.
The effect of the nature of carrier gas on response was also
investigated. Helium, argon, and nitrogen were compared. The
relative responses at maximum response parameters were I. 00
15
for helium, 1.16 for argon, and 1,03 for nitrogen. Addition of oxy-
gen to the carrier gas did not appreciably increase the detector sen-
sitivity.
Enrichment of air with oxygen was also studied (64). A two-
fold increase in sensitivity was obtained with a 50 % oxygen atmos-
phere using helium, argon, or nitrogen carrier gases. Instead of
addition of oxygen to air, oxygen and nitrogen could be mixed, omit-
ting the need for an air tank.
Enhancing Flame Ionization Detector Sensitivity
The placement of alkali salts in the upper combustion zone of
the flame has greatly increased the detection of phosphorus com-
pounds. Giuffrida (23) placed a spiral platinum wire coated with
alkali sulfate salts just above the flame. Coahran2 put sodium sul-
fate crystals in a ceramic cup which was placed on top of the jet tip.
Hartmann (27) made a small cesium bromide disk with molding pow-
der which sat on top of a quartz jet. The detection of phosphorus
compounds was increased by more than 1000 times. Karman (31)
increased the detection sensitivity of halide and phosphorus
2Coahran, D. R. Paper read at the Northwest Regional American Chemical Society Conference, Corvallis, Oregon. June 1965.
16
compounds by placing a platinum screen coated with sodium hydrox-
ide above the flame and detecting the increase ion formation by a
second flame ionization detector. Since both nitrogen and phosphorus
are in Group V of the periodical table, it may be possible to select-
ively increase the sensitivity of the flame ionization detector to HCN
and other nitrogen containing compounds.
Comparing the Sensitivity of HCN by Electron Capture and Flame Ionization Detection to Thermal Conductivity Detection
Experimental
Electron Capture Detection. An Aerograph 600 -B gas chro-
matograph equipped with a 250 me tritium foil electron capture de-
tector and a Beckman GC -2 gas chromatograph equipped with a
thermal conductivity detector were used to compare detector sen-
sitivities. A 3. 4 liter glass cylinder was vacuum filled with HCN
and 3.0 cm3 of theHCN -air mixture was injected into each instru-
ment. The peak areas from each instrument were compared.
Flame Ionization Detection. Optimum response parameters
were first established using a Beckman GC -gas chromatograph
equipped witha flame ionization and thermal conductivity detector
connected in series with the column. The signal from the flame
detector was fed into a Beckman electrometer with a maximum
current sensitivity of 5 x 10-13 amps / mv, i. e. , an input signal of
17
5 x 10 -13 amps will produce a one millivolt output signal. The elec-
trometer output signal was recorded on a 1.05 my? 1 second Brown
recorder. Iron- constantan thermocouple measurements of the in-
jection port column, and detector temperatures were also recorded
by the use of 100/1500 ohm voltage dividers. The inlet heater tape
was connected to a multitap transformer in the GC -2 circuitry by
means of a single pole, four positioned switch. This permitted heat-
ing the inlet port at column temperatures below 100o C.
A 3.4 liter glass cylinder filled with HCN and air served as
a sample source. The variation in response to air, hydrogen, and
nitrogen carrier gas flow rates was determined along with oxygen
enrichment of the air feeding the flame.
In testing flame sensitivity enhancement the sensitivity of
HCN was compared with and without the presence of inorganic salts
in the flame. A small 2. 6 mm OD x 1 . 6 mm ID x 3 mm long ceramic
insulator was placed on the jet tip, and crystals larger than 1.6 mm
were put into the ceramic cup. A small ball of platinum was also
tested.
Results and Discussion
Preliminary results indicated the electron capture detector
was not more than two to three times more sensitive to HCN than the
thermal conductivity detector. The thermal conductivity detector

18
sensitivity at 20 ml /min helium flow and 250 ma current was 40
my -ml /u.i of benzene (16), and the standing current of the electron
capture detector at 25 ml /min nitrogen flow was 6. 6 x 10 -12 amps
or 2. 20 millivolts. Both detectors are sensitive to water, which is
a disadvantage in the analysis of aqueous solutions of HCN.
In determining the optimum flame parameters small varia-
tions in sample quantities were corrected by the thermal conductiv-
ity response where the carrier gas flow was held constant. Figure 1
shows the variation in detector response to changes in the hydrogen
flow, keeping the air and carrier gas flow constant. Figure 2 shows
the variation in detector response with increasing air flow. The air
enters the detector chamber at the base of the detector and not
through the jet tip. Very high air flows may cause physical turbu-
lence and should be avoided.
A large increase in response was obtained with increasing
carrier gas flow (Figure 3). Optimum conditions were obtained
between 65 -85 ml /min. The flame blew out when the carrier gas
exceeded 125 ml /min. Figure 3 illustrates the effect of the rate of
mass input on the response of a flame ionization detector as discus-
sed previously.
An initial investigation of enriching the air with oxygen show-
ed a 1.5 to 2. 0 fold increase in HCN sensitivity, but the signal to
noise ratio was not significantly larger. This may have been a gas

Peak height (mv)
O. 6 S ft. x 1/8 in. OD 5% Amine 220, 15% Carbowax 20M on 60/80 HMDS
Chromosorb W
Column temperatures = 52°C
0. S Injection port temperature = 85°C
Fair = 310 ml /min F = 37 ml /min helium
a 0.4
0. 3
0.2
0s i
.-.
20 30 40
Hydrogen flow rate, ml /min
50
Figure 1. Effect of hydrogen flow rate on detector response to HCN.
0. 5
0. 4
0. 1
Conditions same as Figure 1
Hydrogen flow = 36.5 ml /min Carrier flow = 37 ml /min helium
60
100 200
Air flow rate, ml /min
300
Figure 2. Effect of air flow rate on detector response to HCN.
400
19
i: 0. 3
ro
x 0.2

100-
80
Conditions same as Figure 1
Hydrogen flow = 47.5 ml /min Air flow = 405 ml /min
--0 A
Peak height
Peak area
20
20 40 60 80
Helium carrier gas flow, ml /min
100
Figure 3. Effect of carrier gas flow on flame ionization response to HCN.
120
200
160
40
0.--, C \a
U ..- cd N
ca'
x ca a) a
60
40
0
ro
120
80

21
purity problem or a dirty detector problem. Further work may have
been fruitful.
The placement of platinum gauze in the flame caused a small
decrease in the sensitivity of HCN and a ten fold decrease in the
sensitivity of hexane. The platinum gauze probably cooled the flame
and reduced ion formation. The flame was easily extinguished by
flow fluctuations. A 50 to 100 fold decrease in the peak area of HCN
was observed when sodium hydroxide, sodium sulfate, calcium car-
bonate and ferrous sulfide were placed in the flame. Only a small
decrease in peak area was observed with sodium cyanide. No im-
provement was found with any of the salts studied.
Operating the flame detector at the optimum response con-
ditions described, the response to approximately 0. 5 mg of HCN was
1300 times greater at an attenuation of 1 0 x 10 -11 amps /mv than
the thermal conductivity detector at full sensitivity. The flame ioniz-
ation detector is also less sensitive to carrier gas flow fluctuations
and temperature changes than a thermal conductivity detector.

22
INVESTIGATION OF SOLID SUPPORTS
Hydrocyanic acid is a polar molecule with a dipole moment of
2.93 debye units compared to 1.84 for water. Polar molecules tend
to adsorb on the solid support and elute from the column with a tail-
ing edge. Adsorption on the solid support is a particularly difficult
problem with trace analysis. As the sample size becomes smaller a
greater fraction of molecules are adsorbed, resulting in longer re-
tention times and severe tailing. This effect is illustrated in
Figure 4.
Adsorption maybe caused by weak <_ n de Waals forces strong
hydrogen- bonding forces. Hydrogen -bonding is the most influential
in causing adsorption on the support. Tailing can also be caused by
other factors such as non -plug injection of the sample on the column.
However, if adsorption is occuring on the solid support in Figure 4,
then the data should follow the Freundlich or Langmuir isotherm
equation.
Freundlich Equation: Y = K P1 n
(2).
Y is ratio of the weight of adsorbate per unit weight of adsorbent,
K and N are constants, and P is the equilibrium pressure. If the
equilibrium vapor pressure (P) of a solute is proportional to the
sample size (.) and the retention volume of a solute is proportional
to the adsorption on the solid support, then we may substitute:
r

23
Time --->>
Figure 4. Chromatograms of decreasing sample size.
- Log X (ul)
Figure 5. Effect of sample size on retention volume.
bo
bo o

24
=kXl /n g
(3)
or Log V = Log k + 1/n log X (4) g
In plotting the logarithm of the retention volume of methanol and
ethanol against the logarithm of the sample size, Scholz and Brandt
(60) obtained a straight line similar to Figure 5.
The amount of peak tailing is very dependent on the polarity
of the stationary (liquid) phase and the solute being eluted through
the column. Polar stationary phases tend to hydrogen bond with the
hydroxyl groups on the surface of the support, thus deactivating the
support. Nonpolar stationary phases do not deactivate the solid sup-
port and extreme tailing occurs with the polar solutes. For example,
hexane is a nonpolar compound and does not adsorb on most solid
supports. Hence a polar or nonpolar stationary phase may be used
without peak tailing occuring. However, the polar ethanol molecule
can readily hydrogen -bond with the solid support. Severe tailing may
occur on a column containing a nonpolar stationary (SE -30). In sub-
stituting a polar stationary phase (Carbowax 20 M) the support is
deactivated, and moderately good ethanol peaks are obtained. Con-
sequently polar liquid phases must be used with active supports
for trace HCN analysis; with inactive solid supports, such as Teflon,
either polar or nonpolar liquid phases may be selected.
In selecting a suitable solid support for polar compound
analyses the general function of the support should be kept in mind.
V

25
Besides the requirement of a high surface area, the support must
(1) be inert to the compounds eluted, and (2) must have a strong af-
finity for the stationary (liquid) phase. These properties tend to be
contradictory, and a compromise is sought. Highly active porous
supports such as the diatomaceous supports, are easily wetted by
the liquid phase and thin films result; the inert fluorocarbon supports
are poorly wetted and an uneven distribution of the more polar liquid
phases may occur.
Diatomaceous Earth Supports
The first approach to the analysis of trace amounts of HCN was
the use of diatomaceous earth supports deactivated for polar com-
pound analysis. Ottenst i.n (50) has presented an excellent review
of supports used in gas chromatography. Some of the physical prop-
erties of the supports are listed in Table 1. Note for a given column
volume packed with Chromosorb P or W the surface area of the
Chromosorb P column is eight times larger than the Chromosorb W
column. Chromosorb P also is much less fragile than Chromosorb W,
whose particles tend to break up during column packing. Martin (47)
has measured the drop in surface areas as the concentration of
liquid phase is increased. The difference in effective surface area
between Chromosorb W and P becomes smaller as the liquid phase
concentration increases. Ettre (19) found the specific surface areas

26
Table 1. Physical properties of some solid supports
Support Mesh Packed density g/ cry .
Surface area m /g
Surface area m2/ cm3
Chromos orb Pb 40/60 0. 47 4. 0 1.87
Chromosorb Wb 40/60 0. 24 X1.0 0. 24
Glass beads 80/120 1 . 4 6a 0.36d 0. 5
Teflon -6 40/60 0.49e a 7 -8e 3. 4
O. 95 6. 7
Ke.i -F (3081) Full range 1. 35a 2 2c 3. 0
Fluoropak 80 Full range O. 69a 1. 3c 0.9
Porapak Q 50/80 0. 30a 50 15
bLaboratory measurement Ottenstein (50)
d Kirkland (32) Sawyer 8z Barr (57)
e Johns-Manville Bulletin FF 1 24

27
of the solid support did not influence the efficiency of the column if
the surface area was greater than 1 m2 /g. Thus adsorption proper-
ties may be more important to the gas chromatography of polar com-
pounds than surface area when comparing supports. Perrett and
Punnell (53) measured the surface concentration of hydroxyl groups
by measuring the quantity of ammonia released by the reaction of
hexamethyldisilizane (HMDS):
Si(CH3)3
OH OH
Si(CH3)3
O
-Si-O-Si-+ (CH ) Si- NH-S4(CH ) ----) Si=---- 0---- NH (surface) 3 3 (HMDS) 3 3 3
They report 4 x 10¹⁹ groups /m2 groups /m2 for brick or Chromosorb P and
2.5 x 10¹⁹ groups / mL for celite or Chromos rob W. This data sug-
gests that the major difference in adsorption of Chromosorb P or W
is not fundamental, but lies in the greater surface area /unit volume
of Chromosorb P.
The difference in density also results in a larger quantity of
liquid phase with Chromosorb P when columns of equal percent
liquid phase by weight are prepared. However, the film thickness
will be comparable because of the larger surface area of Chromosorb
P.
Several deactivation reagents have been used to react with
the hydroxyl groups on the support and reduce the amount of
I
Si. i

28
adsorption. Kirkland (33) has critically compared dimethyldichloro-
silane (DMCS), hexamethyldisilazane (HMDS), and trimethylch.loro-
silane (TMCS) treatment of diatomaceous earth supports, and ob-
tained best results with acid washed DMCS treated supports. With
silanization a decrease in surface area from 1.5 m 2 /gram to O. 8
2 m /gram was reported for Chromosorb W.
Column Preparation
Experimental. A detailed description of the column prepara-
tion is given here because of the wide variation in techniques which
exist in the literature. Chromosrb W is comparatively more frag-
ile than Chromosrb P, and should be handled with care.
In this work the support was size graded gently into small
mesh cuts (40/60, 60/80), and poured into a verticle glass column.
The material was then acetone washed and distilled water rinsed.
Two column volumes of concentrated HCI were then added to re-
move iron on the surface of the support which could complex with
HCN and any presence of sodium carbonate flux used in the prepara-
tion of Chromosorb W. Subsequently the support is washed with two
column volumes of distilled water, and transferred to a large beaker.
Distilled water is added under pressure to agitate the mixture. As
the coarse particles settle out, the fine particles are decanted. This
step is repeated until most of the fines are removed and the water

29
is neutral. The support is then vacuum dried in a petri dish overnight
at 1300 C.
To deactivate the solid support 20 m1 of DMCS was dissolved
in 200 ml of dry benzene,a:nd 150 cni of the dry acid washed support
was then added. The mixture was reflux for four hours under dry
conditions, 2 ml of isopropyl alcohol was then added, and the mixture
refluxed for an additional two hours. Excess absolute methanol was
added to destroy any unreactive DMCS and to react with any unreac-
tive chloride groups:
CH CH3 CH CH / / Si Si / \ / \.
OH CH CH O Cl O OCH3 I
i
\3/ I
CH3OH 1
Si---O---Si- -Si- --4 + ' Si -Si---O---Si > / \ Cl Cl
(support) (DMCS)
The support was packed into a glass column and washed with two col-
umn volumes of absolute methanol, and then dried in a petri dish in
an 1300 C oven. This procedure is a modification of those reported
by Perrett and Pernell (53) for HMDS silanization and that of Kirkland
for DMCS treatment of the support (33).
Three methods of coating the support were investigated.
Techniques in coating the solid support by rotary evaporation and
by steam bath evaporation were first investigated using a red dye,
4- nitro- o- phenylene dia , This compound is yellow when dissolved
\ \ 3

30
in acetone; hence the removal of the solvent can be followed visually.
"In- place" coating of the support was also investigated as
described by Averill (4). A 9 foot x 3/16 inch OD column (22. 3 cm-)
was filled with Chromosorb W. Two column volumes of an 8 % w/ v
solution of Carbowax 1540 in chloroform (3. 60 grams in 45 ml) was
passed through the column at a rate of 0. 3 ml /min or one drop per
10 seconds. The solution was collected at the end of the column, and
the liquid phase weighed after evaporation of the solvent. The column
was divided into two equal sections, and the HCN retention volume
of each half was compared.
Evaporation of the solvent on a steam bath was used in most
of our work. The stationary phase is first dissolved in a volume of
solvent equal to the solid support volume. The solid support is added
with stirring and allowed to stand for 10 to 30 minutes. The size of
beaker is selected to give a support depth of not more than one inch.
The beaker is rotated at a 45o angle and the particles on the sides
occasionally removed with a thin spatula. The support is poured into
a petri dish just as it becomes free flowing, and dried under va. ;,.
The aluminum tubing is first washed with concentrated nitric
acid to remove nichel on the surface. After rinsing the tubing is
washed with acetone and dried. The tubing is then filled with the
coated support in a vertical position with light tapping and with sot
vibration. After filling, the column is connected to a nitrogen

31
cylinder and 20 to 30 psig pressure is applied while gently vibrating
the column. Additional packing is generally required. A small glass -
wool plug is installed, being careful not to crush the packing. Since
glasswool is very adsorptive, fingers should always be washed just
prior to installation. The ratio of the coil diameter to the column
diameter should not be less than a factor of twenty.
Results and Discussion. In preparing gas chromatographic
columns vertical packing resulted in a more tightly packed column
than vacuum packing, especially with 1/8 inch OD columns over five
feet in length. The front of the column should always be connected
to a 20 to 30 psig gas cylinder for final packing.
With rotary evaporation of the solvent the solid support near
the neck of the flask was not coated, and the bottom of the flask
was colored when the support was coated with a red dye. The use
of a large flask with respect to the solid support volume and very slow
evaporation, 4 hours per 100 ml of solvent, is recommended. The
roatary evaporation method has the advantage of slow solvent remov-
al, and crushing of particles is avoided.
"In- place" coating of the support is time consuming and re-
sults in an uneven distribution of the liquid phase towards the front
of the column. Nearly 3/4 of the liquid phase was contained in the
first half and 1/4 in the second half of the column described. The
concentration of the stationary phase on the column was calculated

32
to be 14.7 % w/ w. Four column volumes of 4 % w/v solution may be
necessary to distribute the liquid phase more evenly through the
c olumn.
Steambath evaporation is fast, but the support can easily be
crushed by mixing. Where an exact predetermined concentration of
liquid phase is not critical the coating procedure of Parcher and
Urone (51) appears to be the most satisfactory.
Chromatographic Column Comparisons
Experimental. In selecting the most suitable solid support
for the analysis of HCN similar columns were prepared with 20%
Carbowax 20M on Chromosorb Pand W. Different column lengths and
diameters were tested to determine optimum column parameters.
Similar columns were also compared with and without DMCS treat-
ment of Chromosrb W.
Results and Discussion. When equal length columns of
Chromosorb P and W were compared, HCN tailing was reduced
slightly with Chromosorb W, but the resolution of the two columns
appeared to be comparable. Thus Chromosorb W was used in many
of the studies in this investigation.
In comparing the effect of silanization of the support on HCN
tailing, little improvement could be observed with a polar liquid
phase on acid washed Chromosorb W by DMCS treatment. The upper

33
chromatogram in Figure 6 shows the results obtained on the untreat-
ed Chromos orb W column.
The lower chromatogram in Figure 6 shows the combined
effect of a longer column with courser support and a larger column
diameter. Shorter columns with smaller diameters and a finer par-
ticle size packing are particularly desirable in trace analysis of
polar compounds. Adsorption is reduced owing to a smaller quan-
tity of support with smaller column diameters, and peak broadening
is diminished. Best results were obtained with a 60/80 mesh cut
support (250 to 177 microns) using 1/8 inch OD columns under 8
feet in length. With longer columns 3/16 inch OD tubing was re-
quired since inlet pressures were limited to 25 psig to avoid leaks
in a gas sampling valve used to introduce HCN samples.
Although suitable chromatograms could be obtained with
microgram quantities of HCN on a column as shown in the upper
chromatogram of Figure 6, smaller quantities eluted similar to the
broken curve in the same figure. Therefore other supports were
investigated.
Glass Bead Solid Support
Glass beads are similar to the diatomaceous earth supports
in their molecular constituents. Frederick, Miranda and Cooke (21)
found . glass beads much less adsorptive than Chromosorb P coated

0. 6
0. 4
o
a 0. 2
0
0.8
0.6
7 ft. x 1/8 in. OD 20% Carbowax 20M on 60/80 A. W. Chromosorb W
0 Co) , min temperature = 77 C
Flow rate 80 ml /min Sensitivity = 5 x 10
®10 amps /mv
2.8 gig HCN
2.5 5.0
Time (min) >
7. 5
9 ft. x 3/17 in. OD 15% Carbowax 20 M on 35/50 A. W. Chromosorb W
0 Column temperature = 83°C Flow rate = 80 ml/ min Sensitivity = 5 x 10¹⁰ amps /mv
^' 8 ug HCN
o. 2
0
2. 5 5. 0
Time (min) 7. 5
Figure 6. Effect of column diameter and particle size on HCN tailing.
10. 0
34
>
v
v
-
--
_ 1
m 0. 4
oC
CL
- i----

35
with low concentrations of nonpolar stationary phases. Optimum con-
ditions for 70/80 mesh glass beads were reported to be 0.16 % liquid
phase and 70 ml /min helium flow for 1/4 inch OD columns. In in-
vestigating glass bead columns Dewar and Mairer (15) found glass
beads to be inefficient because of adsorption and nonuniformity of the
stationary phase layer. Addition of 1. 25 % w/w Super -floss prevented
pockets of the liquid phase from forming between two glass beads in
contact with each other. They were able to obtain HETP values of
1 mm, which is comparable to efficient diatomaceous earth columns.
Experimental. In our investigation a 14 foot x 3/16 inch OD
aluminum column was filled with O. 2 % Carbowax 1540 on 80/1 20 mesh
glass beads. The column preparation described for diatomaceous
earth supports was also used for glass beads. A chromatogram ob-
tained with this column is shown in Figure 7 for 7 ug of HCN.
Results and Discussion. The HCN peak in Figure 7 shows
severe tailing. A chromatogram of chloroform and methylene
chloride shows the poor resolution obtained on this column. The
particles were tacky and did not pack well. A O. 1 % Carbowax
1540 on 80/1 20 mesh glass bead packing was nearly free flowing,
but the column efficiency remained poor. Silanization may have
reduced HCN adsorption, but poor column efficiencies discouraged
further research with this support.

Response (mv)
36
0. 7 14 ft. x 3/16 in. OD 0. 2% Carbowax 1540 on 80/120 glass beads
0. 6
0. S
0. 4
0. 2
0. 1
0
CHC13
ri
CH2C12
0 Column temperature = 59 C
Carrier gas flow rate = 15 ml /min Scavenger gas flow rate = 53 ml /min Sensitivity 5 x 10 -10 amps / my
2. 5
HCN (N 7 ug)
lI I I
5. 0 7. 5 5.0 2.5
Time (min)
Figure 7. Glass bead chromatographic column.
0. 3
I 1
0
m

37
Investigation of Fluorcarbon Polymers as Solid Supports
In contrast to active silicate supports the fluorocarbon poly-
mers are inert and are poorly wetted by most stationary phases.
Being inert, nonpolar stationary phases can be used for the separa-
tion of polar compounds without peak tailing occurring. For example,
Runge (56) used 5 % Aroclor 1232 and Kel -F Grade 1 oil on Haloport
F to separate HC1, (CN)2, HCN, and other reactive gases.
Kirkland (32, 33) has extensively compared Teflon 6, Kel -F,
and Fluoropak 80. The lowest HETP values were obtained with
Teflon -6; however the surface energy of Kel -F is 31 dynes per square
cm compared to 19 dynes per square cm for Teflon (33). Thinner
films should be obtained on Kel -F, especially with polar liquid phases
which do not wet the inert fluorocarbon polymers as well as nonpolar
liquid phases. In addition, Kel -F is much harder than Teflon and
easier to pack into a column.
The optimum stationary phase concentration reported in the
literature varies from 2 % to 20 %. Kirkland (32) found 15 -20
optimum for Teflon -6 and Kel -F and 2 -5 % for Fluoropak 80.
Bennett analysed water in organic solvents with a 5 % Carbowax
20M on Teflon column (7), while Kuwada used a 20 % Ucon oil 550X
on Fluoropak 80 for analysis of water in hydrazine (36). Hamlin
et al. (25) separated inorganic fluorine gases on a 50 % Kel -F oil

38
on Kel -F column. Landault and Guiochon found the optimum poly-
glycol 1500 concentration on teflon to be 20 % w/w (38), The latter
coated the Teflon support by adding the powder to a 5 % solution in
dichloromethane and evaporating the solvent at room temperature
with continuous mixing. The support was dried at 400 C and packed
grain by grain into horizontal 40 cm column sections, employing
vacuum and vibration. The total column length studied was 200 cm.
The authors selected 500 to 400 u (35 -42 mesh), aqua regia washed,
Haloport F (F & M Scientic Corp) for their support material.
HETP values of 2. 3 mm were obtained for 0.4 ul of methanol at
700 C. Other studies (50) on the efficiences of Teflon supports show
an optimum liquid phase concentration of 2 % with the number of
plates decreasing as the percent of liquid phase increased. Thus
considerable differences in the optimum liquid phase concentration
can be found in the literature.
Experimental
A 15 % w/w Carbowax 400 on 40/50 mesh Teflon -6 (Analabs
Inc. , Hamden, Connecticut) chromatographic support was prepared
as suggested by Kirkland (32), The Teflon powder was cooled to
00 C in a copper beaker, and shaken vigorously to put the powder in
a free flowing state. The Teflon powder was then added to a dichloro-
methane solution containing the stationary phase in an evaporation

39
dish. The solution volume was twice the volume of the support (60
ml of solution) . A stream of nitrogen was passed over the solution
while the Teflon powder was continuously turned over. Approximately
one hour was required to evaporate the solvent. The resulting pack-
ing was not free flowing, but more of a paste.
A 15 % w/w Carbowax 400 on 50/80 Kel -F powder (#6051
Applied Science Lab. , State College, Pa. ) chromatographic support
was prepared by the usual steam bath evaporation technique. Upon
complete removal of the solvent the packing was also a paste. The
procedure was repeated with 1, 2, 3-tris (2- cyanoethoxy) - propane, and
a paste was obtained again.
Attempts to coat the fluorocarbon supports were again re-
peated at lower concentrations. Three similar columns containing
Teflon -6, Fluoropak 80, and Chromosorb P were prepared. The
latter two supports were coated on a streambath,while Teflon -6 was
coated as described above. The results are shown in Figure 8.
Short one meter columns were also prepared, and the chromatograms
of a test mixture described by Kirkland (32) is shown in Figure 9.
Both the Kel -F and Chromosorb P supports were coated by evapora-
tion on a steam bath.
Results and Discussion
Teflon -6, Kef -F, and Fluoropak 80 all became tacky when the

1. 0
0
1.0
0
1. 0
0
40
5 ft. x 3/16 in,OD 15% Carbowax 400 on 40/60 Chromosorb P
T = 35oC c
P i
= 4.5 psig
Fa = 80 ml/ min
HETP = 4.32 mm ( CHC13 )
2. 5
1 ul CHC13
5.0 7. 5
3
HCN
5 ft. x 3/16 in. OD 15% Carbowax 400 on 20/30 Fluoropak 80
T = 34°C c
P. = 4. 5 psig i
Fa = 80 ml/ min
HET (CHC13) = 16.6 mm
10. 0
1 ul CHC13 HCN
lu
0 2.5 5.0 7.5
5 ft. x 3/16 in. OD 4% Carbowax 400 on 40/S0 Teflon-6
1 ul CHC1 3
10.0
T = 58oC c
HCN Fa = 6. 8 cm/sec
HETP( CHC13 ) = 130 mm
0 2. 5 5.0 Time (minutes)
7.5 10.0
Figure 8. A comparison of Chromosorb P, Fluoropak 80, and Teflon -6 solid supports.
n 1
'
1 0
ó 0. 5
0.5
0. 5
a
i i
a

41 _
liquid phase concentration exceeded 5 % w /w. HETP values for
chloroform were measured for each column. A smaller sample size
would have probably greatly improved column efficiency.
Because of the very poor results obtained with Teflon -6, a
shorter column containing Kel -F support was investigated, Figure 9.
Owing to the very poor column efficiencies obtained on Kel -F, an
identical column was packed in a Oo C room, adding the Kel -F sup-
port nearly grain by grain. No improvement in column efficiency was
obtained.
With 4 % stationary phase concentrations on Kel -F and
Fluoropak 80 nearly symmetrical HCN peaks were observed, but the
column efficiencies of these columns were much poorer than a sim-
ilar column containing Chromosorb W. Clearly the advantage of
inertness of the fluorocarbon polymers was offset by a reduction in
column efficiency; hence other supports were investigated.
Other Chromatographic Supports
Baum has investigated microporous polyethylene as a low
temperature support (6). Liquid phase concentrations up to 20 %
were employed without evidence of being tacky. Symmetrical peaks
with low molecular weight alcohols were obtained with satisfactory
column efficiency. However, the material was no longer commer-
cially available.

2.0 1 meter x 1/4 in. OD 10% Carbowax 400 on 50/80 Kel -F
2 ul of text mixture
T = 82°C 1. Acetone 13.6 w/w
F = 50 ml /min helium a
Attenuation: 1X
Filament current = 250 ma
HCN
2. Ethyl acetate 30.9
3. Water 22.9%
4. n- Butanol32.6%
3 &4
42
0
2. 0
0
1
-
2
4
Time (minutes)
12 16
1 meter x 1/8 in. OD 15% Carbowax 400 on 40/60 Chromosorb P
4
20
T = 60oC c
F = 40 m l /min helium a
Attenuation: 1X
Filament current = 250 ma
1 ul of test mixture in upper chromatogram
0 4 8
Time (minutes)
12 16 20
Figure 9. A comparison of Kel -F and Chromosorb P solid supports.
3
OC d
1.0

43
Tide has been used for the separation of alcohols and nitrogen
compounds. Porcaro and Johnson (54) separated primary amyl alco-
hols with Tide as the column packing, the approximately 20 % alkyl
aryl sulfonate serving as the liquid phase. HCN, being acidic, would
probably react with the sulfonate ions forming a sulfonic acid. In
addition, the carrier consists of sodium sulfate, chloride, phosphate,
and silicate (50). Some adsorption would probably occur on the
silicate material.
NaCl has the advantage of being free of silicate material which
is responsible for much of the adsorption of polar compounds. In this
work the maximum liquid phase concentration for 60/80 mesh sodium
chloride appeared to be approximately 0. 5 % w /w. Very poor column
efficiencies were obtained with NaCl. For trace analysis sharp peaks
are desirable for high sensitivity; consequently additional experimen-
tation with NaCl was discontinued.
In comparing the results obtained with the different solid
support materials investigated, only the diatomaceous earth supports
gave satisfactory column efficiencies to separate HCN from interfering
compounds and sharp peaks for the high sensitivity needed for trace
analysis. Peak tailing was minimized by DMCS deactivation of the
support and the use of polar stationary phases.

44
TESTING HCN CONCENTRATION PROCEDURE FOR INTERFERING COMPOUNDS
Instrumental Modifications
A 15 % Carbowax 1540 on Chromosorb W column was prepared
and installed in a Beckman GC -2 gas chromatograph equipped with a
flame ionization detector. Gas samples were injected onto the column
by a gas syringe to test the chromatographic system. Favorable noise
levels were obtained at a sensitivity setting of 1. 0 x 10 -11 amps /mv
after 32 hours of column conditioning at 1300 C (maximum tempera-
ture, 150o C) with the flame detector disconnected from the column.
In order to analyse the contents of the concentration columns
used to trap HCN from the effluent air of aqueous solutions (59), a
Perkin Elmer gas sampling valve was mounted initially on an indepen-
dent stand and connected to the Beckman GC-2 instrument with a min-
imum of 1/8 inch OD aluminum tubing. This produced severe tailing
owing to a lack of plug injection. The gas sampling valve was then
mounted in back of the instrument and the chromatographic column
connected directly to the gas sampling valve. The portion of the
column outside of the oven was wrapped with wet asbestos and a
thermocouple installed. After drying, nichrome wire was wrapped
around the asbestos covered column and the exposed wire covered with
wet asbestos. A Variac was connected to the nichrome wire to heat

45
the exposed portion of the column to the same temperature as the
oven. Considerable improvement in the column efficiency and the
peak profile of HCN was observed, pointing to the need to keep the
dead volume between the gas sampling valve and the front of the
column to a few cubic centimeters.
Purifying the Air Sweep Gas
The purity of the air sweep gas was determined by passing
5 liters of air through a concentration column at -780 C. The con-
tents of the concentration column w a s analysed and found to con-
tain many impurities. With the increased sensitivity of flame ioni-
zation detection a very clean air supply is required. High purity
grade air is recommended.
Addition of a molecular sieve trap to the air stream did not
remove the low molecular weight hydrocrabons. A 650 C chromic
acid gas scrubber followed by a base scrubber was also ineffective.
An Arthur H. Thomas type 5680 microcombustion furnace filled
with platinum gauze, copper oxide, 1 :1 copper oxide -lead chromate,
and silver wire was installed in the air stream in place of the gas
scrubbers. The platinum gauze and copper oxide were heated to
8500 C, and the 1:1 copper oxide -lead chromate and silver wire to
6500 C. Some impurities were still present. Best results were
obtained with a Hoskins Type FD-3034 combustion furnace with a

46
30 mm OD x 61 cm quart combustion tube filled with copper oxide and
platinized asbestos and heated to a bright red temperature. The large
diameter combustion tube permits longer contact time.
Testing Water Blanks
Several different natural water sources were analysed for
interfering compounds. First well water and then river water was
tested by trapping 10 liters of effluent air. Only traces of rapidly
eluting compounds were detected at a sensitivity of 5 x 10 -10
amps /mv. However chromatograms from the analyses of laboratory
tap and distilled water contained a large peak at nearly the same re-
tention volume as HCN.
The retention volumes of many of the common contaminates
found in river water (59) were compared with the retention volume of
HCN. Acrylonitrile and chloroform are the only compounds which
interfere with HCN on a 7 ft x 1/8 OD, 15 % Carbowax 20 M on
40/60 Chromosorb W chromatographic column at 71° C and 40 ml /min
carrier flow. Most of the compounds elute before HCN. Water and
H2S are eluted after HCN. The interfering peak found in the tap
water was trapped from the gas chromatographic effluent for positive
identification by mass spectrometry.

47
Mass Spectrographic Identification
Since the interfering compound represented only a very small
quantity of material, mass spectrometry offered the most conven-
ient and precise method of identification. Sufficient quantities would
have to be acquired by repeated collection of the effluent air from the
tap water and repeated collection of the interfering compound as it
eluted from a gas chromatographic column. A Kerns Excelo four way
valve (Kern Lab. Supply Comp., Los Angeles, Calif. ) was mounted on
the floor of the Beckman GC -2 chromatographic oven. The valve was
installed to switch the column effluent either to the flame detector or
a cold trap. The cold trap, shown in Figure 10, was connected to
the Excelo valve with a two foot x 1/8 inch OD aluminum tubing lead-
ing to the outside of the instrument. All glass to metal connections
were made with Swagelok fittings. Small sections of 6 mm tubing
were added to the ends of the Excelo valve so that 1/4 inch OD
ferrules would properly fit the glass. At the glass connection the
back ferrule was reversed and a Viton o -ring replaced the front
ferrule.
Approximately 20 liters of air were passed through 20
liters of tap water, and the effluent air trapped at -78° C. The cold
trap was then connected to the gas sampling valve, warmed to 70o C,
and the contents injected onto the chromatographic column. When

It
3-
1 'I 4.
2
if 1 r I
I t
I I
. I I
I
- , . .
Glass wool
#1 Stopcock
#2 Stopcock
15% Carbowax 1540
on 30/50 Chromosorb W
6 mm Pyrex
10/ 30.1
It
2
Fi gure 10. Cold trap for mass spectrographic determination.
Y
1-
1
49
the interfering compound was first detected by the flame detector the
Excelo valve was turned, and the column effluent trapped at -78o C
using a pint Dewar flask filled with dry ice and acetone. A total of
140 liters of air was collected.
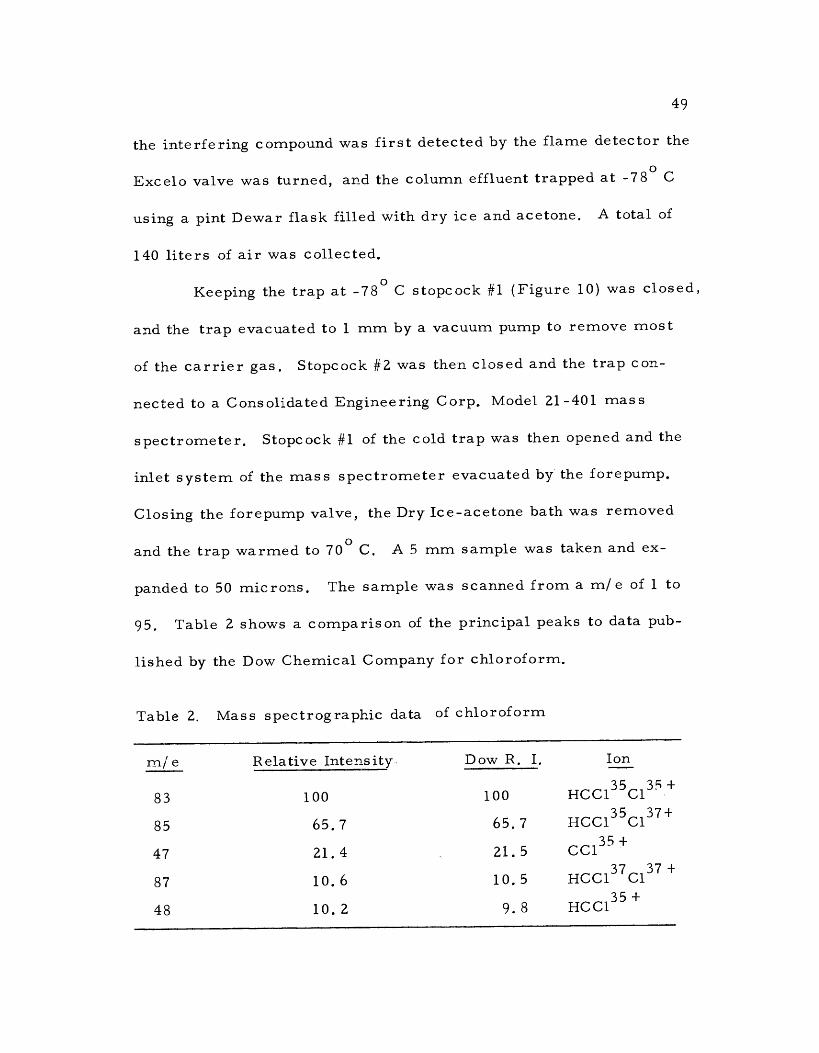
Keeping the trap at -78° C stopcock #1 (Figure 10) was closed,
and the trap evacuated to 1 mm by a vacuum pump to remove most
of the carrier gas. Stopcock #2 was then closed and the trap con-
nected to a Consolidated Engineering Corp, Model 21-401 mass
spectrometer. Stopcock #1 of the cold trap was then opened and the
inlet system of the mass spectrometer evacuated by the forepump.
Closing the forepump valve, the Dry Ice -acetone bath was removed
and the trap warmed to 70o C. A 5 mm sample was taken and ex-
panded to 50 microns, The sample was scanned from a m/e of 1 to
95. Table 2 shows a comparison of the principal peaks to data pub-
lished by the Dow Chemical Company for chloroform.
Table 2, Mass spectrographic data of chloroform
m/ e Relative Intensity. Dow R. I. Ion
83
85
100
65.7
100
65.7
HCC135C135 +
HCC135C137+
47 21,4 21.5 CC135+
87 10, 6 10. 5 HCC137C137 +
48 10. 2 9. 8 HCC135 +

50
Chloroform is a known impurity in chlorine production,and chlorinated
water should contain some chloroform.
Determination of the Chloroform Concentration in Chlorinated Water
Experimental
A 10 mg/ 1 stock solution of chloroform was prepared by ad-
ding 13. 43 ul reagent grade chloroform to 2. 00 liters of well water.
Twenty liter standard solutions of 10, 20, 30 and 40 ug /liter were
prepared by adding 20, 40, 50 and 80 ml aliquots, respectively, of
the 10 mg /liter stock solution to 18 liters of well water, and diluting
up to 20. 00 liters at 20.0 0 C. Two liters of air were trapped (59)
and injected onto a Carbowax 1540 column. The calibration curve
is shown in Figure 11. Twenty liters of laboratory tap and distilled
water were analysed in a similar manner.
Results
Both the tap and distilled water was found to contain 28 + 1
ug /liter of chloroform based on duplicate analyses. Duplicate
analyses of each standard solution illustrates the accuracy of this
technique for the measurement of trace quantities of certain organic
compounds in water.

Say E
M p
ajlt;
stQ
10
7.5
2.5
o 20. 0 1 solution. 20.0 C
2.00 1 of air Sensitivity = 5 x 10
-10 amps/my
10 20
ug CHC13 /liter of water
Figure 11. Standardization curve for the determination of CHC13 in water.
30 40

52
Investigation of Stationary Phases for the Separation of HCN and CHC13
Hydrocyanic acid and chloroform are not separated by Car-
bowax 1540 or 20M. This prompted a search for a different polar
stationary phase. A literature search revealed polyethylene glycol
polymers (Carbowaxes) were predominately used in the analysis of
HCN (9, 71). Isbell found either glyceryl triacetate or tributyrate
would separate HCN and cyanogen (30), while Schneider and Freund
used dinonylphthalate to separate HCN and water (59).
HCN and CHc13 are readily separated by the ester stationary phases,
but HCN adsorption on the solid support is much greater compared
to the more polar stationary phases. Hence a moderately polar
stationary phase was desired which prevented adsorption of HCN on the
solid support and separated HCN from CHC13,
Experimental
Two attempts were made to use a modified Carbowax station-
ary phase. In the first investigation 5 % Amine 220 was added to
a 10 % Carbowax 20M packing. The second modification was the
addition of 5 % phosphoric acid (85 %) to a 15 % Carbowax 20M
packing. In addition, several other stationary phases were examined
by the polarity mixture introduced by Averill (4). Table 3 lists
some of the stationary phases examined along with the relative

53
Table 3. Polarity of stationary phases
1st 2nd 3rd 4th Stationary Phase Elution Order
Classification (Polarity)
Relative Retention Time of CHC13
(HCN 1. 00)
1. Carbowax 400 C M (B E) strong 0. 82 at 35° C
2. Carbowax 1540 C M (B E) strong 0.97 at 71° C
3. 1, 2, 3-Tris C (B E) M moderate 1 . 1 2 at 37° C
( 2- c yanoethoxy) - propane
4. ß, (3'-Oxydipro- pionitrile C (B M) E strong 1.17at24°C
5. Dimer Acid C M (B E) strong 1.0at55°C
6. Tric res ylphos - phate C E ( M B) mild 2. 54 at 35° C
7. Tributyrin (E C) (M B) weak 4. 09 at 35° C
8. Didecylphthate E ( C M) B weak 3. 43 at 40° C
C - Cyclohexane B - Benzene M - Methyl Ethyl Keytone E - Ethanol

retention times of CHC13 to HCN.
Results
Amine 220 is a common name for 1 -hydroxyethyl- 2- hepta-
dec enylglyoxalidirie :
H2i -NH H C
2 \ /C -C H35
17 N CH2-CH2OH
54
The basic nature of this compound should retain HCN on the column,
allowing CHC13 to elute ahead of HCN. The addition of Amine 220
caused a small increase in tailing, and appeared to react with HCN.
Upon comparing equal quantities of HCN from C a rb owax 20M columns
with and without the addition of 5 %Amine 220, a 14 % loss in the peak
area of HCN resulted on the column containing Amine 220.
The addition of phosphoric acid reduced the retention volumes
of both HCN and CHC13 more than 50 %, with chloroform having a
relative retention volume of 0. 74 compared to 1. 00 for HCN. Al-
though chloroform and HCN were separated by this column, water
was not eluted. Since water is collected along with HCN in the con-
centration procedure, the continual injection of water vapor should
damage this column.

55
The addition of phosphoric acid also reduced the retention
volumes of acids, alcohols and mercaptans. Aldehydes were not
detected possibly owing to an acid catalyzed condensation reaction.
All basic compounds were not eluted from this column.
Unable to modify the Carbowax 20M stationary phase other
compounds were examined, as shown in Table 3. 1, 2, 3- Tris(2-
cyanoethoxy)- propane (45) was selected because of the excellent
separation of alcohols and polar compounds obtained by this station-
ary phase. (3, 3' - Oxydiproprionitrile is a strong polarity stationary
phase (12, p 110), whereas tricresylphosphate has been used as a
general purpose stationary phase (68). Dimer acid is a 36 carbon
dibasic acid (Empol 1022, Emery Industries, Los Angeles, Cali-
fornia). An acidic liquid phase is desirable in that potentially inter-
facing amines are not eluted,
The polarity of each of the above stationary phases was ex-
amined using the polarity mixture introduced by Averill (4), and
discussed by Ettre (20). The mixture is made up of cyclohexane
(b. p. 81.4° C), benzene (v. p. 80.1 0
C) ; methyl ethyl keytone
(b. p. 79. 6° C) and ethanol (b. p. 78. 5°C). All components have
nearly the same boiling point, but differ widely in polarity. Nonpolar
stationary phases have an ethanol, methyl ethyl keytone (MEK),
benzene, cyclohexane elution order, while polar stationary phases
tend to have the reverse elution order. Cyclohexane elutes before

56
benzene with slightly polar staionary phases. The order of elution,
the resolution between components, and the degree of tailing provide
a practical test of column performance. The elution order and the
separation is given in Table 3 for each of the stationary phases.
In comparing the relative retention times of HCN and CHC13
in Table 3 relatively long columns would be required to separate
HCN and CHC13 by the polar liquid phases. Carbowax 400 will
separate these two compounds (Figure 9), but a rather long column
would be required if chloroform was present in much larger quan-
tities than HCN. 1, 2, 3- Tris(2- cyanoethoxy)- propane gave superior
chromatograms of HCN, but did not resolve HCN from CHC13. The
mildly polar tricresylphosphate appeared to be the best compromise
between good separation of HCN and CHC13 and the least amount of
HCN tailing. The slightly polar esters readily separate HCN and
CHC13, but HCN adsorption was much greater.
Testing a Tricresylphosphate Column
Several solutions of varying concentrations of HCN were
analysed (59) using a 6 ft x 3/16 inch OD, 15 % tricresylphosphate
column. At concentrations below 0.1 mg of HCN per liter of solu-
tion and electrometer sensitivities of 5 x 10 -10 amp / my many con-
taminates were detected that were not observable at the lower sen-
sitivity settings. Some of the contaminates were traced to the

57
drying agent and the water. The drying agent was heated to 200° C
for 24 hours to remove residual organic compounds. Although most
of the impurities were removed by preheating the drying agent,
periodic contamination resulted in interfering peaks. Complete
separation of HCN on a single column appeared very difficult.

58
TWO COLUMN CHROMATOGRAPHIC SYSTEM
Two Columns in Series
Separation of HCN from a wide range of contaminants might
be better achieved by connectiong two columns in series instead
of using a single column. Merely placing two columns in series
would give a separation similar to a single mixed liquid phase column.
If a valve were installed in series between the two columns some of
the compounds could be vented into the atmosphere. Figure 12 shows
two columns connected in series with a 4 -way valve. A HCN sample
is injected onto column 1 by turning the gas sampling valve. As soon
as HCN has eluted from column 1 onto column 2, the Excelo valve is
turned; thus many compounds remaining on the first column are
eluted into the atmosphere. The HCN solute is eluted from column
2 by the alternate gas flow route. The function of column 3 is to
match the resistance to flow of column 1, preventing a large change
in the carrier gas flow in column 2 after turning the Excelo valve.
Two stationary phases of different polarity were selected for
columns 1 and 2. A mild polarity stationary phase was employed in
the first column. Phthalic acid was combined with didecylphthalate.
Addition of phthalic acid reduces HCN tailing and provides an acidic
stationary phase. The more popular terephthalic acid was not im-
mediately available. HCN is eluted rapidly on this column along

N2
3 ft. x 3/16 in,OD Chromosorb W column
Gas ksamplingf
valve II
Sample cold trap To variac
Column #3
Kerns Excelo 4 way valve
Column #1
Gas flow matching column
Column #2 s ,::'c::c,..; ;r:'C 's.i, ! : lá.` r. i .. _ .1. :J..
E-- Detector
5 ft. x 3/16 in,OD aluminum column 15% Carbowax 400 on 60/80 A. W. DMCS,
Chromosorb W
3 ft. x 3/16 in. OD aluminum column 10% Didecylphthalate, 5% Phthalic acid on 60/80, A. W.
DMCS, Chromosorb W
Beckman GC -2 oven
Figure 12. Two column switching apparatus.
1.
7
-------------- ---
I
- - J

60
with the low molecular weight gases, since compounds tend to elute
in the order of increasing vapor pressure with nonpolar stationary
phases. The higher molecular weight contaminates are eluted into
the atmosphere upon turning the Excelo valve. A strong polarity
stationary phase (Carbowax 400) retains the polar HCN solute on
the second column, separating it from the low molecular weight
contaminants.
The first column was connected directly to a gas sampling
valve as previously described (p 44). The Excelo valve was mounted
on an aluminum plate which was attached to the chromatographic oven
floor. Glass to metal connections were made with Swagelok fittings
and Viton o- rings. The Excelo valve had a tendency to leak at tem-
peratures above 50o C; thus the column temperature was adjusted to
30o C, and 3/16 inch OD columns replaced 1/8 inch columns to re-
duce the resistance to flow.
An O to 100 µg/ 1 calibration curve was prepared by analysing
standard solutions. The curve intersected the concentration axis
at -10 µg /1, indicating the presence of an impurity or an error in the
preparation of the standard solutions. No interferences were ever
observed by this technique, and the technique seemed very reliable.
The principal difficulty with this system was that the HCN
solute was not injected as a plug on to the second column, and a
broad eluting peak was obtained (Figure 13). Therefore, the length

0.4
0. 3
0. 1
0
I
20 liters of 94 ug HCN /liter (4 x 10 -7M) S liters of air collected Tc = 30 °C; Fa = 80 ml /min
HCN -11
Sensitivity = 3 x 10 amps /mv (1. 4 ug)
a, turned Excelo valve
a
0
16.4cm
I I I
5.0 10 20
Time (minutes) >
Figure 13. HCN chromatogram employing two column switching technique.
0.2 0 a á
c a
f
2
rn

62
of the first column was kept at a minimum. Because of the rather
broad HCN peak, the analytical precision of this technique was not as
good as expected. Favorable column efficiencies were obtained
with solutes which did not absorb on the solid support, indicating
HCN tailing was not caused by poor chromatographic conditions.
Owing to such a broad HCN peak the lowest measurable concentration
with the collection of 5 liters of air was 10 µg HCN /liter of solution.
Two Column Dual Oven Chromatographic System
Connecting two columns in series resulted in a broad chromat-
ographic peak with HCN because of the lack of plug injection onto the
second column. If two individual columns contained in separate
chromatographic ovens were used for analyses, the HCN solute would
be trapped from the column effluent of one column and injected onto
the second column as a plug. In this investigation two similar gas
chromatographic ovens were built, and a much improved HCN
chromatogram was obtained.
Apparatus
A flow diagram is shown in Figure 14. A cold trap contain-
ing a sample of HCN is attached to the gas sampling valve of the
first oven. After warming the cold trap, the contents are injected
onto column 1. A second cold trap is connected to the exit of

Gas Needle sampling
valve #1 valve 2nd oven
ilmoom
PA Needle
valve #3
ttur
110 LIMMISIMIk vac
Heater
Toggle valve #4
Column #2; 6 ft. x 3/16 in. OD
15% Carbowax 1540 on 60/80 mesh, DMCS, Chromosorb W
Detector oven
Needle valve #2
Beckman GC -2 Electrometer
1.0 my Recorder
Gas sampling
valve 1st ov,
Figure 14. Two column dual oven.
Column #1; 25 ft. x 3/16 in,OD 20% Didecylphthalate on 60/80 mesh, DMCS, Chromosorb W
1 1
'
JL
1- seater vac
I I

64
column l,to trap HCN just as it elutes from the column. The contents
of the second cold trap are injected onto column 2 in like manner.
The effluent of column 2 is analysed by a flame ionization detector.
Compounds which elute before and after HCN from column 1 are
eluted into the atmosphere.
The columns used for the two column dual oven technique and
the two column switching technique were similar. The first column
was lengthened to a 25 foot x 3/16 inch OD column filled with 20
didecylphthalate on 60/80 mesh, acid washed, DMCS treated Chromo-
sorb W.. The second column was a 6 foot x 3/16 inch OD column
containing 15 % Carbowax 1540 on 60/80 mesh, acid washed, DMCS
treated Chromsorb W.
A common nitrogen source was used for convenience. The
flow rates were adjusted with Nupro 2M needle valves (Nuclear
Products Co. , Cleveland, Ohio). A Perkin Elmer gas sampling
valve was mounted on the side of each oven. Each air bath oven
was constructed with 3/ 8 inch aluminum plate. The interior walls
and upper lid were insulated with 0.5 inches of A. P. Green high
temperature insulating cement (A. P. Green Fire Brick Company,
Missouri) and lined with an asbestos sheet. The outside dimensions
were 92 inches long x 91 inches high x 61 inches wide. To heat each
oven a hair dryer (Standard Products Corp. , Whitman, Mass. )
was rewired to control the voltage to the 80 ohm heating elements

65
by a Variac. The hair driers were made to blow warm air into one
side of the oven. A thermocouple was wrapped around the column
to indicate column temperature. An asbestos sheet was used to
deflect the air off the column. The maximum oven temperature was
90o C. All connections were made with Swagelok fittings (Crawford
Fitting Company, Solon, Ohio) .
Provisions were made to backflush the second column. In
backflushing valves numbers 3 and 4 are closed, while the gas
sampling valve and valve number 2 are opened (Figure 14).
The exit end of the column 1 is attached to the oven wall by
a bulkhead union. A union tee with 1/8 inch fittings is connected
to the outside bulkhead fitting. An 1/8 inch Swagelok cap is con-
nected to one fitting of the tee and serves as a valve by tightening
and loosening the cap. A cold trap is connected to the other tee
fitting.
A flame ionization detector was housed in a 52 inch OD x 5
inch long aluminum tube. Inside a 600 ml copper beaker was invert-
ed over a Beckman Flame Detector (Model 104000). A inch hole vc s
drilled through the lid and top of the beaker to allow the gases to es-
cape. A 32 ohm, 110 V heating tape was wrapped around the copper
beaker. Glass wool provided insulation between the copper beaker
and the aluminum pipe. The copper beaker, electrometer, and re-
corder were grounded to a common earth ground. The input cable

66
was silver soldered to the detector anode, and contact between the
jet tip and the 300 V source wire was periodically polished with
silver polish. The detector temperature inside the flame detector
was 110o C at 110 VAC without a flame; hence water condensation
and a possible loss of sensitivity was reduced.
Procedure
The temperature and flow rate of column 1 is adjusted to
35 0
C and 80.0 ml /min. The retention time of HCN is determined
by connecting the exit of column 1 to the flame detector with 0.020
inch ID stainless steel capillary tubing. A sample of HCN is inject-
ed onto the column from a cold trap connected to the gas sampling
valve. The cold trap will decrease the column flow; thus the trap is
kept in series with the carrier gas streamfor only 40 seconds. The
effluent of column 1 was trapped from 62 minutes to 112 minutes for
the analysis of HCN. The temperature and flow rate of column 2 is
adjusted to 60° C and 80.0 ml /min.
Experimental Results
Chromatograms of the two column dual oven technique showed
many additional peaks, attributed to impurities in the nitrogen car-
rier gas. These compounds were trapped out of the carrier gas along
with HCN. A pre- purified grade of nitrogen is required. A 850° C

67
microcombustion furnace (Type 5680, Arthur H. Thomas Co. ,
Philadelphia, Pa. ) filled with copper oxide was placed in the nitrogen
carrier gas stream at the cylinder to insure gas purity. Figure 15
shows a chromtogram of O. 6 kg of HCN. The column efficiency and
the reproducibility of analysis was greatly improved over the two
columns in series switching technique. In comparing Figures 13 and
15 note approximately the same peak height was obtained with less
than half the amount of HCN at a factor of five difference in sensi-
tivity.
A 0 to 1 kg /1 calibration curve intersected the concentration
axis at 0.07 µg /1, indicating a small loss of HCN by adsorption on
the solid support or in trapping. The trapping period was supposedly
more than sufficient for complete collection.
Although column 1 was lengthened to a 25 foot x 3/16 inch OD
column to separate HCN from interfering compounds, HCN was not
completely separated from all compounds as seen in Figure 15. Oc-
casional contamination was also observed. Thus the purity of the
HCN solute eluting from the second column was determined by mass
spectrographic analysis.
Determining HCN Purity by Mass Spectrometry Using Two Column Dual Oven Chromatographic System
Three liters of air were trapped from a 50 µg /.liter HCN solu-
tion,and the contents of the trap analysed by the two column dual

Response (mv)
68
0. 3
0. 2
0. 1
0
20 liters of 200 ug/liter HCN (7. 41 x 10-6M)
1 liter of air Tc 60 °C; F = 80 ml /min
c a
Sensitivity = 2. 5 x 10 10
amps /mv
0 2.5
Time (minutes)
5. 0
Figure 15. HCN chromatogram employing two column, dual oven
technique.
-
=

69 oven chromatographic system. The backflush system was discon-
nected,and a two foot x 1/8 inch OD aluminum tube was used to con-
nect the end of the second column to the cold trap described in Figure
10. About 80 % of the column effluent passed through the trap and
20 % through the flame detector. The same procedure as described
on page 49 was followed for removing the carrier gas from the trap.
Table 4 lists the chart units for each of the mass units ob-
tained above background. First the background chart divisions were
subtracted from the results obtained from the HCN sample. The
chart divisions contributed by HCN were subtracted from the sample
assuming the chart divisions at the m/e of 27 was solely contributed
by HCN. The relative m/e intensities were taken from the American
Petroleium Institute Spectra, Series 233. The chart divisions con-
tributed by the presence of air were subtracted assuming the chart
divisions at m/e of 32 were contributed by molecular oxygen. Final-
ly the chart divisions contributed by water were subtracted from the
remaining net divisions using the chart divisions at m/e of 18 as the
base peak for water. The remaining chart divisions at 2, 29, 30, 31
and 52 were not accounted for by the above procedure. The m/e
peak at 52 may indicate the presence of a trace of cyanogon (CN)2.
Cyanogen is not detectable by flame ionization detection (34), and
does not interfere. Small impurities appear to be present, but their
concentration is assumed to be small when comparing the chart
divisions of m/e of 27 to 29 or 30.

Table 4. Mass spectrographic analysis of the HCN chromatographic peak
m/e Sample
Divisions Background
Divisions Net
Divisions
Net Divisions after
HCN correction
Net Divisions after
Air correction
Net Divisions after
Water correction
2 40.5 3 37.5 36,5 36.5 34. 5
12 44 0 44 13 23 0 23 13.5 14.5 0 14.5 14 12 0 12 15 4 0 4
16 19 1 18 18 18 17 400 14.5 385 385 385 18 1815 69 1746 1746 1746 19 2 0 2 2 2
20 3 0 3 3
26 470 2 468 27 3140 2 3138 28 117 22 95 41
29 26 2 24 22 22 22 30 16 0 16 16 16 16
31 11 0 11 11 11 11
32 15 3 12 12 44 20.5 4 16.5 16.5 16.5 16.5* 52 17 1 16 16 16 16
* CO

71
INVESTIGATION OF PORAPAK Q
Introduction
O. H. Hollis has reported the use of porous polyaromatic
polymer beads for the gas chromatography of polar compounds (29).
Ethylvinylbenzene is crosslinked with divinylbenzene to give a porous
polymer of high surface area. See Table 1. Being free of silicates,
polar compounds should not adsorb on this material. Evaluation of
one of the polymers, Porapak Q, yielded excellent column efficiencies
with HCN and no tailing.
Porapak Q can be coated with at least 20 % liquid phase or can
be used without a liquid phase. It is stable up to 230° C. Its two dis-
advantages are its limited column capacity, 0.1µl of benzene for 3/16
inch OD columns, and its high retention of nonpolar compounds. For
trace analysis the limited column load characteristic does not pre-
sent a problem, and its high retention of nonpolar compounds is an
advantage in HCN analysis.
Averill's polarity mixture (4) was again used to characterize
the polarity of Porapak Q. A nonpolar elution order was obtained with
ethanol eluting rapidly, followed by methyl ethyl keytone, and later
cyclohexane and benzene eluting together. The retention volumes on
a similar column containing 10 % w/w Carbowax 400 on Porapak Q
were considerably reduced with cyclohexane eluting just behind

72
methyl ethyl keytone. Thus coating Porapak Q with a stationary
phase appeared to only modify the column characteristics. The ef-
fects of liquid films on Porapak Q were studied more comprehen-
sively in order to develop a satisfactory two column dual oven system.
Three 6 foot x 3/16 inch OD columns were prepared. Table 5
gives the contents of each. The column temperature was adjusted to
100o C and column flow rate to 40 ml /min. Relatively large columns
were selected so that small differences in retention volumes could be
measured. The retention volumes of the "polarity mixture" (4) were
exceedingly large at 100° C; consquently low boiling solutes differing
in polarity were selected. Table 6 gives the net retention volume for
each solute studied.
The net retention volumes, Vn (p 1 19), of Column B were cor-
rected to O. 259 g of liquid phase by multiplying the net retention vol-
umes by O. 259/0.803. With very polar compounds like methanol and
HCN addition of a polar liquid film to Porapak Q (Column C) gives an
additive effect, i. e. the net retention volume is the sum of the re-
tention of Porapak Q (Column A) plus the retention of the liquid phase
(Column B) . Pentane is not soluble in Carbowax 1540 and this polar
liquid film appears to prohibit the solute from diffusing into the
Fbrapak support. Hence a large drop in the net retention volume
occurs on Column C. On the other hand, dichloromethane is soluble
in Carbowax 1540; and only a small change occurs in the net retention
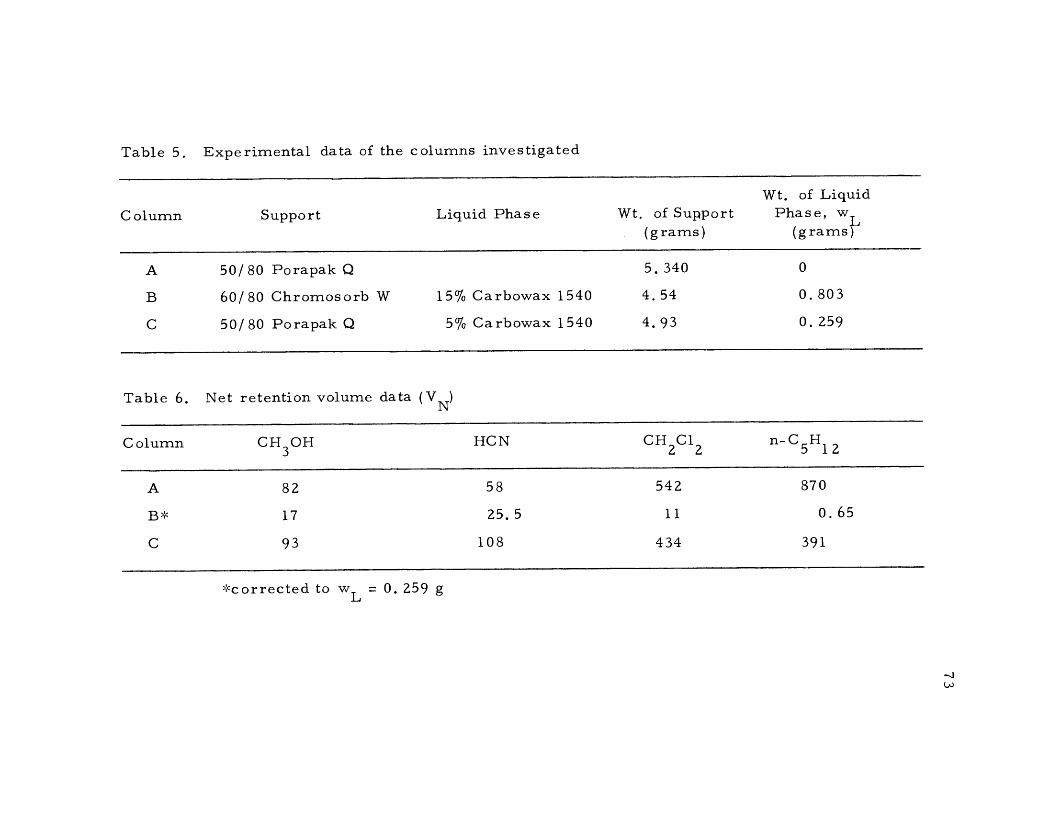
Table 5. Experimental data of the columns investigated
Column Support Liquid Phase Wt. of Support (grams)
Wt. of Liquid Phase, w
(grams
A
B
C
50/80 Porapak Q
60/80 Chromosorb W
50/80 Porapak Q
15% Carbowax 1540
5% Carbowax 1540
5. 340
4.54
4.93
0
0. 803
0. 259
Table 6. Net retention volume data (VN)
Column CH3OH HCN CH2C12 n-05H1 2
A 82 58 542 870
B* 17 25.5 11 0.65
C 93 108 434 391
*corrected to wL = 0. 259 g

74
volume. Addition of nonpolar liquid films generally reduce retention
volumes owing to the probable large decrease in surface area.
Two Column Chromatographic System with Porapak Q
Preliminary analyses of HCN solutions yielded chromatograms
similar to those shown in Figure 18 by direct injection on a Porapak
Q column. Attempts were made to eliminate some of the contaminates
by first injecting the HCN sample on a Chromosorb W column coated
with a mild polarity stationary phase (didecylphthalate or tributyrin),
trapping the HCN, and reinjecting on a Porapak Q column. Similar
chromatograms to those obtained by direct injection on Porapak Q
were obtained. However, many of the impurities were eliminated
when HCN was first separated from similar polar compounds on a
9 -foot x 3/16 inch OD 15 % 1, 2, 3- tris(2- cyanoethoxy)- propane on
Chromosorb W column. The 1, 2, 3- tris(2- cyanoethoxy) -propane
column is moderately polar in nature, whereas Porapak Q is non -
polar. Better separations were obtained with contrasting columns.
No interfering compounds were present when analyses of
river water was made directly on a Porapak Q column; however many
peaks were present. Table 7 gives the relative retention times of
many of the possible interferences found in polluted water (59) .
Most of the amines are eluted with differing degrees of tailing. No
interferences were found in this class of compounds. Propane was
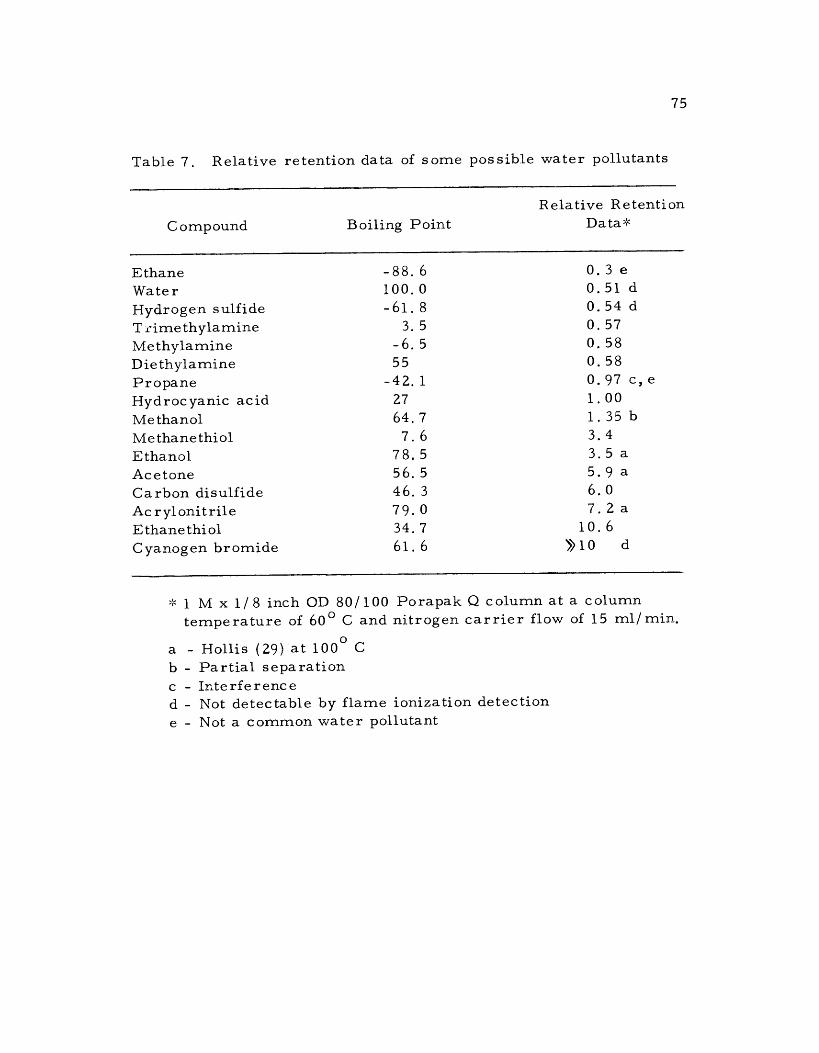
75
Table 7. Relative retention data of some possible water pollutants
Compound Boiling Point Relative Retention
Data*
Ethane Water
-88.6 100.0
0.3 e 0.51 d
Hydrogen sulfide -61.8 0.54 d
T i ime thylamine 3. 5 0.57 Methylamine -6.5 0.58 Diethylamine 55 0.58 Propane -42.1 0.97 c, e
Hydrocyanic acid 27 1.00 Methanol 64.7 1 . 35 b Methanethiol 7.6 3.4 Ethanol 78.5 3.5 a Acetone 56.5 5.9 a Carbon disulfide 46.3 6. 0
Acrylonitrile 79.0 7.2 a E thane thi of 34.7 10.6 C yanog en bromide 61.6 ))10 d
1 M x 1/8 inch OD 80/100 Porapak Q column at a column temperature of 60° C and nitrogen carrier flow of 15 ml /min.
a - Hollis (29) at 100° C
b - Partial separation c - Interference d - Not detectable by flame ionization detection e - Not a common water pollutant
' '

76
the only hydrocarbon tested which interferes with HCN, and methanol
is the only alcohol. Cyanogen chloride may be found in chlorinated
water containing cyanide ions, but this compound appears to be
insensitive to flame ionization detection. Acetaldehyde and acetic
acid are expected to have a relative retention volume to HCN of two
or greater. Formaldehyde and formic acid are also not detectable.
Compound A in Figure 19 has a relative retention time of 0.46
and tails similar to the amines; hence the compound may be methyl
amine. No compounds similar to compound B with a relative reten-
tion of 1.9 have been tested.
Analysis of Aqueous Solutions
Concentration Column
Schneider (58, p 25) has compiled the vapor pressure of solid
HCN (m. p. 260° K) between 140 and 2600 K. At Dry Ice -acetone tem-
perature, 195° K, solid HCN has a vapor pressure of O. 6 mm mer-
cury or 1. 3 mg of HCN /liter of air. Hence HCN could not be re-
moved from a stream of air by a simple glass bead trap at 1950 K.
However, the above author obtained excellent results in trapping HCN
with a short U -tube concentration column filled with di- n- buty.lphthal.-
ate on 40/ 60 mesh firebrick at Dry Ice -acetone temperatures.
In this work the concentration column was reduced in size,and

77
60/80 mesh Chromosorb W coated with 20 % didecylphthalate, Carbo-
wax 1540, or 1, 2, 3- tris(2- cyanoethoxy)- propane were substituted
for di- n- butylphthalate. Many liquid films could be used for trap-
ping HCN; however the material should be a liquid at 195° K, have a
low vapor pressure at 100 C when the trap is warmed, and be mod-
erately polar to retain HCN and deactivate the support material.
1, 2, 3- Tris(2- cyanoethoxy)- propane meets all three of these qualities,
but with the advent of Porapak Q this material replaced previously
used materials. Porapak Q has a high surface area and the retention
of solutes is very temperature dependent. It is very retentive at low
temperatures and nonabsorptive at high temperatures.
The efficiency of all packing materials were tested by con-
necting the trap of interest in front of and in series with the larger
di- n- butylphthalate trap described by Schneider (7, p 38). Even
Carbowax 1540 which is a solid at 195° K was 100 % efficient in trap-
ping HCN.
Investigation of Drying Agents
The sweep air becomes saturated with water upon passing
through an aqueous solution of HCN. The water vapor must be re-
moved from the air stream prior to trapping out HCN since the ice
formed will block passage of air through the cold trap. The water
vapor may be removed by a drying agent, but HCN tends to adsorb

78
on many of the commonly used drying materials. Adsorption can be
reduced by heating the drying agent, sacrificing drying efficiency.
Water condensed in the cold trap will flood the chromatographic
column; consequently an efficient drying agent is required.
The adsorption of HCN on drying agents was studied by gas-
solid chromatography. Two foot x 4 inch OD columns were filled
with 20/35 mesh drying materials (r..-.10 cc), and a fixed quantity of
HCN gas was injected onto each column at 62° C and 100 ml /min
nitrogen carrier flow. The results for each material investigated á.re
given in Table 8. Only the four absorbents listed were chemically
compatible and had sufficient capacity and efficiency for this inves-
tigation, and only calcium chloride and magnesium perchlorate proved
to be potentially useful. The more than 50 % loss of peak area and
excessive tailing indicates magnesium perchlorate adsorbs HCN at
this temperature.
The effect of water vapor is not taken into account with the
gas -solid chromatography study. Water should deactivate the adsor-
bent, permitting better recovery of HCN. In comparing CaC12 and
Mg(C104)2 as drying agents, analysis of aqueous solutions of HCN
gave identical results with either material after equilibrium was
established.
The volume of air passing through an aqueous solution of HCN
required to establish equilibrium with the drying agent depends on

79
Table 8. Adsorption of HCN on drying agents
Adsorbent Retention Time (Minutes)
Peak Area (cm )
Remarks
NaC1 0.15 Spike No adsorption
CaCl2 0. 70 7. 2 No tailing
Mg(C104) 2. 5 3. 0 Large tailing peak, loss of HCN
CaSO4* 25. 0 6. 1 Broad symmetrical peak
Silica Gel - No elution
*Drierite, Nonindicating

80
the concentration of HCN in the air and the temperature of the drying
agent. To determine equilibrium conditions successive one liter air
samples from a 1.8 mg /liter HCN solution were analysed. Table 9
shows the results for 2 grams of calcium chloride at 700 C and 95° C,
and 2 and 5 grams of magnesium perchlorate at 95° C. Two liters of
air were required to establish equilibrium using 2 grams of CaC12
and 4 liters of air for 2 grams of Mg(Cl04)2. With 5 grams of mag-
nesium perchlorate a slightly lower peak area was obtained for HCN,
and a larger volume of air was necessary to establish equilibrium.
At concentrations of 0.12 and 0. 01 mg of HCN /liter of solu-
tion equilibrium was obtained with 5 and 9 liters of air, respectively,
for 2 grams of Mg(C104) at 95 ° C. Approximately 10 liters of air
can be dried by 3 grams of calcium chloride at 70° C, and 20 liters
of air by 3 grams of magnesium perchlorate at 95° C before drying
efficiencies become unfavorable.
The equilibration volume for calcium chloride was much larg-
er than predicted from the gas -solid chromatography data. This may
be the result of adsorption on the glass walls of the concentration
apparatus. Reducing the size of the apparatus or substituting Teflon
tubing for glass may reduce the equilibrating volume.
Reproducible results can be obtained with either CaC12 or
Mg(C1O4)2 if collection is begun after 2 liters of air is passed through
the apparatus and new drying agent is used with each analysis. If

Table 9. Determining equilibration volumes
Volume of Air (liters)
Peak Area (cm2) at 2. 5 x 10 -10 amps / my CaC12, 70° C
(2 grams) CaC12, 95°C
(2 grams) Mg(C104)2, 4)2, 95° C Mg(C104)2, 95° C
(2 grams) (5 grams)
0.5 - 1.5 3. 8 4. 0
1.5 - 2.5 4. 2 4. 4 4. 3 3. 25
2. 5 - 3. 5 4.9 4. 8 4. 3 3. 5
3.5 - 4.5 4. 7 4. 8 4. 8 4. 0
4.5 -5.5 4. 7 4. 3
5.5 - 6.5 4.9 4. 6
6.5 - .7. 5 4. 5
7.5 - 8.5 4. 5

82
time permits collection may begin after equilibrium has been es-
tablished.
Effect of Air Flow Rate and Solution Temperature
Equilibrium conditions must be established between the air
and water before quantitative measurement is possible. Schneider
(58, p 19) found equilibrium established between flow rates of 25 to
125 ml /min. A similar study was made with a medium porosity glass
frit bubbler (58, p 35). The air volume was measured by water
displacement instead of flow rate. Equilibrium conditions were found
to exist at all flowrates (25 -85 ml /min), confirming previous results.
The effect of temperature is shown in Figure 16. A 2 % error would
occur from a one degree error in solution temperature.
Stability of HCN Solutions
The strongest stock solution, 0.1 M KCN, was found to decay
at a rate of 0.0005 M per day at 20o C (35, p 546). No loss of HCN
from a 2. 0 mg /liter (7. 4 x 10 -5M) solution buffered at a pH of 6. 5
was observed after seven days. A 20% loss of HCN was measured
after 14 days from a 1. 2 mg /liter standard solution; however the
solution was then stable to at least 23 days. Standard solutions as
low as 5. 0 µg /liter (2 x 10 -7 M) were found to be stable at least
seven days. Normally standard solutions were analysed as they were

7. 0
6. 0
3. 0
2. 00 mg /liter HCN solution 1. 00 liters of air Sensitivity = 1 x 10
-9 amps /mv
10 15 20
Temperature of HCN solution, oC
25
Figure 16. Effect of temperature on the distribution of HCN between air and
water.
30
83
5. 0
2 4. 0

84
prepared.
Purification of Water
Water used in the preparation of standards must be free of
metal ions which could complex with CN ions, and chlorine which
could form cyanogen chloride (C1CN). Standard solutions were com-
pared using base -permanganate distilled water and boiled ion-exchang-
ed water. The distilled water was prepared by a continuous tap water
fed five liter still (800 watts) to which a 100 ml aliquot of a base -
permanganate solution was added. This solution was prepared by ad-
ding 6. 3 g of potassium permanganate and 18.8 g of sodium hydrox-
ide to 300 ml of water, and diluting up to 500 ml. Chlorine is com-
pletely removed, but only 50 % of the chloroform is removed. The
ion - exchanged water was prepared by boiling distilled water in 4 liter
Erlenmeyer flasks to 3/4 volume while sweeping the water with nitro-
gen gas using medium porosity glass frits. The cooled water was then
passed through a Dowex 50W -X4 cation exchange resin in the sodium
form. No chlorine was detected colorimetrically (67). Analysis of
5 pg /liter standard HCN solutions with water prepared from the two
methods described gave comparable results, The boiling procedure
was much faster and was principally used in the prepration of the
standard solutions.

85
Preparation of Standard Solutions
All stock solutions were prepared at 20.0 o C following a di-
lution scheme which avoided pipetting small quantities of stock solu-
tion to prevent volitility losses. Once cleaned with ethanolic -base
and rinsed with 0.1 N HC1 and distilled water, all pipettes and
volumetric flasks were used only for its original purpose. Chromic
acid should not be used. The following dilution scheme was followed:
a. 0. 1 M 100 ml 0. O1 M
30, 60, 90, 120, 150 m10 to 2000 µg/1 1000 ml 20,000 ml
100m1 30-150 m1 b. 0.01 M )0. 001 M )0 to 200 µg /liter HCN range
1000 ml 20, 000 ml
100 ml 50 ml -4 6-150 m1 c. 0. 1 M 2000 ml 005 M 2000 ml 31 . 25 x 10 M 20,000 ml?
0 -20 µg /liter HCN Range
The 0. 1 M KCN stock solution was standardized with a 0. 05 M
AgNO3 solution (35, p 546, 547) using two 10 ml long stem burettes
to measure the KCN and AgNO3 solutions. The silver nitrate solu-
tion was standardized with sodium chloride by a standard gravimetric
procedure using scintered glass crucibles. Volumetric procedures
gave consistantly slightly lower results for the molarity of the
silver nitrate solution.

86
Drying Agent
The drying agent was size graded to 20 -35 mesh and dried at
200o C for 48 hours. About 1. 5 grams of drying agent was weighed
out and placed in the drying tube. Calcium chloride was heated to
70o C and magnesium perchlorate to 95o C.
Operating Procedures
The apparatus described by Schneider (59) was used to con-
centrate HCN with the addition of a Hoskins combustion furnace de-
scribed on page 45. To prepare standard solutions an appropriate
aliquot of KCN stock solution plus 100 m1 of buffer solution (59) is
added to approximately 18 liters of water. The solution is diluted to
20. 00 liters at 20.0 o
C and stirred for one hour with a glass propel-
ler. At the same time 1. 5 g of drying agent is added to the drying
tube and air passed through the apparatus, bypassing the standard
solution.
After suitable stirring, the concentration column is connected
to the apparatus and cooled to -78° C with Dryl.ce- acetone. A medium
porosity bubbler (59) is placed in the standard solution and connected
in series with the air stream. After the air flow is adjusted to 50
ml /min, the concentration column is then switched into the air stream
and the volume of air measured by water displacement using a 1 or 2
87
liter volumetric flask. The first sample of HCN, collected before
equilibrium is established, is used to test the gas chromatographic
operating conditions.
The gas chromatographic apparatus is shown in Figure 14 with
the first oven disconnected. A 5 -foot x 3/16 inch OD aluminum col-
umn is filled with 50/80 Porapak Q and conditioned at 90o C. The
column temperature is adjusted to 51° C, the nitrogen flow to 80 ml/
min, the detector hydrogen flow to 35 ml /min (8 psig), and the de-
tector air flow to 400 ml /min (13 psig).
After collecting two liters of air, the cold trap is removed
from the concentration board and connected to the gas sampling
valve. A dewar flask filled with 95° C water is used to warm the
trap. The recorder should be turned on while the trap is warming
to observe baseline stability. The content of the trap is then in-
jected on the column, and the gas sampling valve returned to its or-
iginal position after 40 seconds. The trap is then removed and a
vacuum applied for five minutes at 95o C to remove any remaining
compounds. After HCN has eluted from the column (tR = 5,3 min),
valves #3 and4 are closed and valve #2 and the gas sampling valve are
opened to backflush the column (Figure 14).
Calibration curves were prepared for three concentration
ranges; 0 -20 µg /.liter, 0 -200 p.g /liter, and 0 -2000 µg /liter HCN.
Two liters of air were trapped for the lowest concentration range

88
and one liter for the upper two concentration ranges. The results of
plotting peak area of HCN against the concentration of the standard
solution is shown in Figure 17. The two upper concentrations do not
intersect zero, indicating a small loss of HCN. The data for the
construction of the calibration curves is given in Tables 10 and 11.
A typical chromatogram at two different concentrations is
shown in Figure 18. No tailing of HCN was evident, even at the
lowest concentration. It is important that the contents of the cold
trap are injected on the column no longer than 40 seconds since
Compound A (Figure 18) is not injected as a plug and will tail into
the HCN elution area. Compounds A and B have not been identified,
but compound A may be methyl amine (p 64).
The minimum detectable quantity at a sensitivity of 5 x 10-12
amps /mv was 6 ng of HCN, while 15 ng of HCN or 6. 7 ng of carbon
was required to produce a 1 cm2 peak at the practical operating
range of 1.0x 10 -11 amps /mv. This compares to roughly 4. 4 ng of
benzene (4. 1 ng of carbon) to produce a 1 cm2 peak. The values for
HCN and benzene are only approximate, but it appears the sensitiv-
ity of flame ionization detection of HCN is within the expected value
for a single carbon molecule.
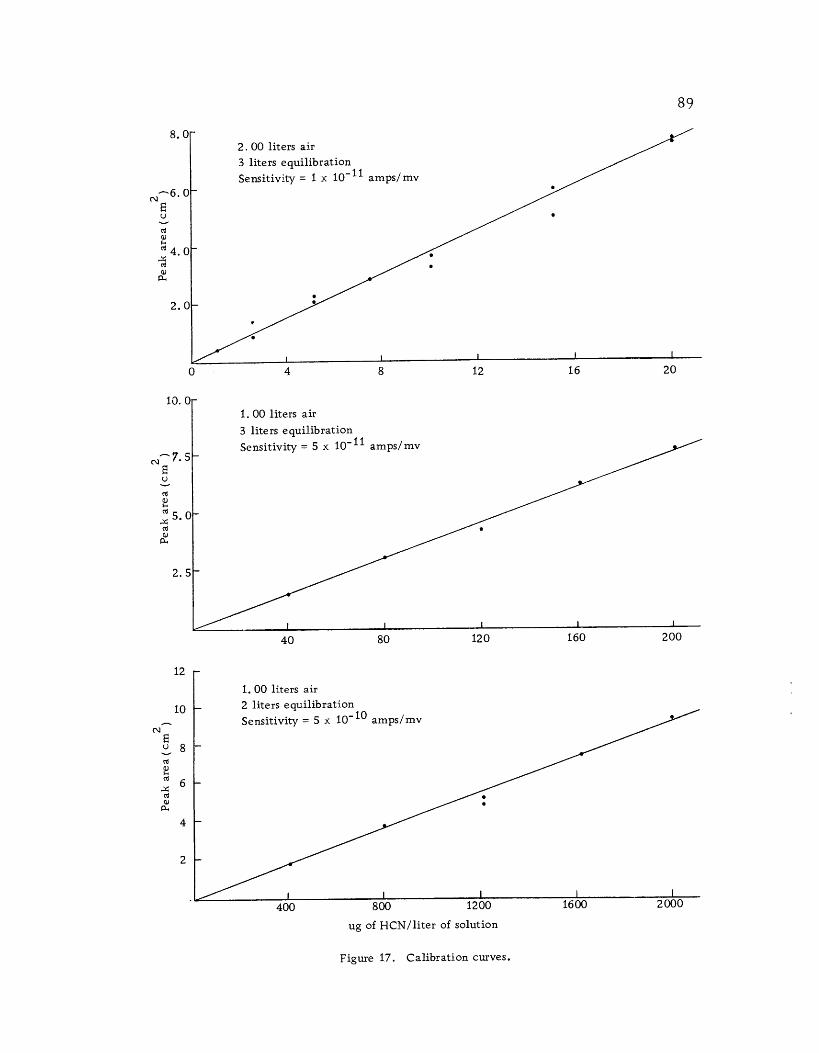
8.0 2. 00 liters air 3 liters equilibration Sensitivity = 1 x 10 -11 amps/mv
89
10.0
2. 5
12
10
4
2
1.00 liters air 3 liters equilibration Sensitivity = 5 x 10 -11 amps/mv
12 16 20
40 80 120 160 200
1. 00 liters air 2 liters equilibration Sensitivity = 5 x 10 -10 amps/mv
I I I I I
400 800 1200 1600 2000
ug of HCN/liter of solution
Figuré 17. Calibration curves.
2.0
4 8
I I I I I
4. ro
7.5
5.0
-
u 8
ro
6

Table 10. Data for the construction of calibration curves for 0 -20 µg /1 HCN solutions
Run No.
HCN Concentration
(µg /1)
Peak area (cm2) at 1 x 10 -11 amps / my for the increments of air trapped (liters)
1.0 -3.0 3.0-5.0 5.0-7.0 7.0-9.0 9. 0 -11. 0
1
2
3
4
0.99
0.99
2.47
2.47
0. 65
0.95
0. 40
0.45
1.15
0.80
5 4.94 2. 3 2. 3
6 4.94 2. 5 2. 0
7 7.41 3. 0
8 7.41 2. 7 2. 8
9 9.87 3. 25 3. 70 3.90 4.15
10 14.8 6. 0 5. 0
11 14.8 4. 2 6. 0
12 19.8 7. 7 7. 7
13 19.8 7.4 7. 6
1 . 5 g of Mg (C 104)2 drying agent at 95° C. ó *

Table 11. Data for the construction of calibration curves for 20-2000 µg /1 HCN solutions
Run No.
HCN concentration
.(µ g /1)
Peak area (cm2) at 5 x 10-11 amps /mv for the increments of air tapped* (liters)
..0-2. 0 2. 0- 3. 0 3 . 0- 4. 0 . 4. 0 -5. 0 5 . 0- 6. 0 .6. 0- 7. 0 7 . 0- 8. 0 9. 0- 10
14 39.4 1.25 0.8 1.4, 1.7 1.5
15 79. 1 3. 1 2..4 3. 3 3. 2
16 118. 5 3.7 4.2 4. 95 5. 3 5.1 4.3
17 158. 0 7. 0 6. 5 6.9 7.5
18 197.4 8..4 8. 0 8. 6 9. 2
19 394 17 19 19 12
20 790 38 39 39 40
21 1185 52 59 64 64 69
22 1185 47 59 66 69 66
23 1580 76 76 88 76 88
24 1974 96 95 106 104 110
1. 5 g of Mg(C1 04)2 drying agent at 95° C. *
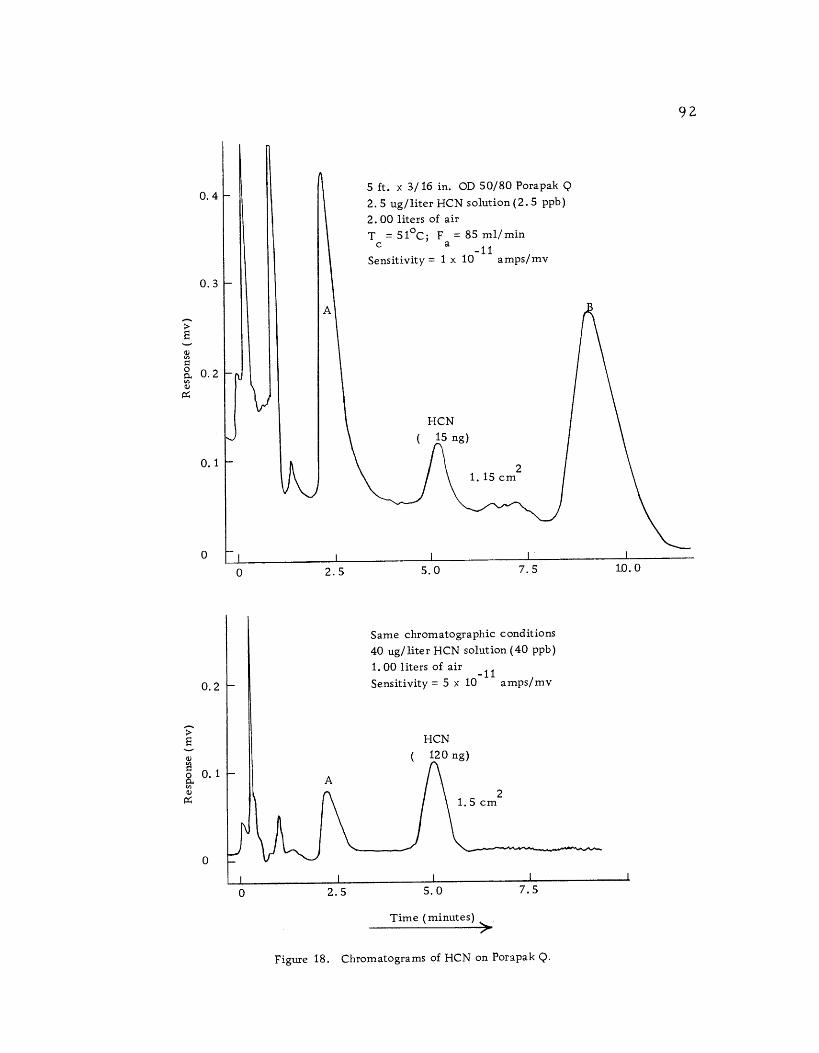
O. 4
O. 3
0. 1
0
0.2
0
A
92
5 ft. x 3/16 in. OD 50/80 Porapak Q
2. 5 ug /liter HCN solution (2. 5 ppb)
2.00 liters of air T = 51 °C; F = 85 ml /min T Tc a
_11 Sensitivity = 1 x 10 amps /mv
I i
0 2. 5 5. 0
A
2.5
7. S
Same chromatographic conditions 40 ug /liter HCN solution (40 ppb)
1.00 liters of air _11 Sensitivity = 5 x 10 amps /mv
HCN ( 120 ng)
1. S cm2
10.0
5.0 7.5
Time (minutes)
Figure 18. Chromatograms of HCN on Porapak Q.
r
ti
I I t t
0.2

93
CONCLUSION
The high sensitivity of the flame ionization detector has per-
mitted detection of nanogram quantities of HCN. Flame ionization
detection is approximately 100 times more sensitive than existing
colorimetric methods and thermal conductivity detectors. Solutions
as low as 1µg of HCN /liter of solution (1 ppb) may be analyzed
in five minutes after a 30 minute collection period. This should permit
detection of sublethal HCN concentrations in industrial waste water
or make possible physiological studies of prolonged exposures of HCN
to aquatic inhabitants.
The flame ionization detector is relatively insensitive to
small fluctuations in temperature and column flow rate, and is
rugged and dependable. Its insensitivity to water is a particular
advantage in the analysis of aqueous hydrocyanic acid solutions. A
large linear response range also adds to its versatility.
The high sensitivity of the flame detector imposes additional
contamination problems. The air, nitrogen, and hydrogen gases
must be free of organic compounds, as well as the drying agent and
glassware employed in the concentration of HCN. With the flame
ionization detector response being proportional to the number of
carbon atoms in a molecule, it may be several times more sensitive
to the impurities present than to the single carbon HCN molecule.

94
The high sensitivity of the flame detector increases the de-
mands on column separation. More efficient columns are necessary
to completely separate HCN from minor detectable contaminates.
Determination of nanograms quantities of polar compounds also re-
quires a column packing that is nearly completely inert. Excellent
results were obtained with Porapak Q. Other porous aromatic poly-
mers may be equally satisfactory.
The ultimate sensitivity of this method is limited by the capac-
ity of the drying agent and the concentration of interfering substances.
Generally five liters of air can be collected without excessive con-
tamination occuring. No attempts were made to determine concen-
trations below 1 µg of HCN/liter of solution.
The presence of HCN in industrial air may be more easily
determined by potentiometric methods similar to the one developed
by Strange (1 6) or by one of the many colorimetric methods. Although
these methods are less sensitive, large volumes of air may be rap-
idly collected. The analysis of polluted water for mercaptans,
amines, and other volatile carbon compounds may be carried out by
the method described for HCN analysis in aqueous solutions. Detect -
tion of possible chlorine- containing compounds in chlorinated water
may also be possible.

95
BIBLIOGRAPHY
1. Aldridge, W. N. The estimation of micro quantities of cyanide and thiocyanate. Analyst 70:474 -475. 1945.
2. Amell, A. R. , D. S, Lamprey and R. C. Schiek. Gas chromatographic separation of simple aliphatic amines. Analytical Chemistry 33:1805 -1806. 1961.
3. American Public Health Association, American Water Works Association and Water Pollution Control Federation. Standard methods for the examination of water and wastes, including bottom sediments and sludges. 11th ed. New York, 1960. 626p.
4. Averill, Warren. Columns with minimum liquid phase concen- tration for use in gas- liquid chromatography. In: Gas chromatography: Third International Symposium held unde r the auspices of the Instrument Society of America, June 13 -16, 1961. New York, Academic; 1962. P. 1 -6.
5. Averill Warren. In -place coating of the solid support for gas chromatography. Journal of Gas Chromatography 1:34 -35. 1963.
6. Baum E. H. Evaluation of microporous polyethylene as a low temperature gas chromatographic support. Journal of Gas Chromatography 1:13 -15. 1963.
7. Bennett, O. F. Water determination by gas chromatography. Analytical Chemistry 36 :684. 1964.
8. Berry, R. An ultra -sensitive ionization detector for perman- ent gas analysis. Nature 188:578 -579. 1960.
9. Borodulina, R. I. , P. Ya. Vertebnyi and I. A. Revel'skii. Chromatographic analysis of an aqueous solution of technical acrylonitrile and of a condensate containing acrylonitrile, acetonitrile, hydrocyanic acid and acrolein. Gazovaya Khromatografiya Akademiya Nauk SSSR, Trudy Vtoroi Vese- soyuznoi Konfenentsee. Moscow, 1962, p. 317 -321. 1964. (Abstracted in Chemical Abstracts 62:3894h. 1965)

96
10. Calcote, H. F. Mechanisms for the formation of ions in flames. Combustion and Flame 1:385-403. 1957.
11. Condon, R. D. , P. R. Scholly and W. Averill. Comparative data on two ionization detectors. In: Gas chromatography; Proceedings of the Third Symposium organized by the In- stitute of Petroleum, Edinburgh, June 8 -10, 1960. Washing- ton, D. C. , Butterworths, 1960. p 30 -45.
12. Dal Nogare, Stephen and Richard S. Juvet, Jr. Gas - liquid chromatography. New York, Wiley, 1962. 450 p.
13. Dennison, J. E. and Harry Freund. Separation and deter- mination of arsenic trichloride and stannic chloride by gas chromatography. Analytical Chemistry 37:1766 -1768. 1965.
14. Destry, D. H. , C. J. Geach and A. Goldup. An examination of the flame ionization detector using a diffusion dilution apparatus. In: Gas chromatography; Proceedings of the Third Symposium organized by the Institute of Petroleum, Edinburgh, June 8 -10, 1960. Washington, D. C. , Butterworths, 1960. p 46 -64.
15. Dewar, R. A. and V. E. Mairer. High efficiency glass col- umns for gas chromatography. Journal of Chromatography 11 :295 -300. 1963.
16. Dimbat Martin, P. E. Porter and F. H. Stross. Gas chro- matography. Apparatus requirements for quantitative appli- cation of gas-liquid partition chromatography. Analytical Chemistry 28 :290 -297. 1956.
17. Doudoroff, Peter, Gerard Leduc and Carl R. Schneider. Acute toxicity to fish of solutions containing complex metal cyanides in relation to concentrations of molecular hydro- cyanic acid. Transactions of the American Fisheries Soci- ety 95:6-22. 1966.
18. Epstein, Joseph. Estimation of microquantities of cyanide. Analytical Chemistry 19:272-275. 1947.
19. Ettre, L. S. The effect of the surface area on the separation in gas-liquid partition chromatography. Journal of Chroma- tography 4 :166 -169. 19 60 .

97
20. Ettre, L. S. Possibility of investigating and expressing collumn efficiencies. Journal of Gas Chromatography 1:36 -47. 1963.
21. Frederick, D. H. , et al. The use of lightly loaded columns in gas chromatography. Analytical Chemistry 34 :1521 -1526. 1962.
22. Gaydon, A. G. and H. G. Wo.lfhard. Flames, their structure, radiation, and temperature. London, Chapman and Hall, 1953. 383 p.
23. Giuffrida, L. A flame ionization detector highly selective and sensitive to phosphorus - a sodium thermionic detector. Journal of the Association of Official Analytical Chemists 47: 293 -300. 1964.
24. Grigorescu, I. and Gh. Toba. Determination of hydrocyanic acid in an industrial atmosphere. Revue de Chimie, Buchar- est 15:572 -574. 1964. (Abstracted in Chemical Abstracts 63:18927h. 1965).
25. Hamlin, A. G. , G. Iveson and T. R. Phillips. Analysis of volatile inorganic fluorides by gas - liquid chromatography. Analytical Chemistry 35:2037-2044. 1963.
26. Harley, J., W. Nel and V. Pretorius. Flame ionization detec- tor for gas chromatography. Nature 181:177. 1958.
27. Hartmann C. H. Aerograph phorphorus detector. Varian Aerograph Research Notes, Spring 1966, p 1-8.
28. Hartmann, C. H. and K. Thompson. Helium detector for ppb analysis of fixed gases. Varian Aerograph Research Notes, Spring 1967, p 1 -8.
29. Hollis, O. L. Separation of gaseous mixtures using porous polyaromatic polymer beads. Analytical Chemistry 38:309 -
316. 1966.
30. Isbell, R. E. Determination of hydrogen cyanide and cyanogen by gas chromatography. Analytical Chemistry 35 :255 -256. 1963.

98
31. Karmen A. Specific detection of halogens and phosphorus. Analytical Chemistry 36:1416 -1421. 1964.
32. Kirkland, J. J. Fluorine- containing polymers as solid supports in gas chromatography. Analytical Chemistry 35 :2003 -2009. 1963.
33. Kirkland, J. J. Some recent developments in column tech- nology. In: Gas chromatography, Fourth International Symposium held under the auspices of the Instrument Society of America, June 17 -21, 1963. New York Academic, 1963. p 77 -103.
34. Kolthoff, I. M. and C. S. Miller. Anodic waves involving electrooxidation of mercury at the dropping mercury elec- trode. Journal of the American Chemical Society 63:1405- 1411. 1941.
35. Kolthoff, I. M. and E. B. Sandell. Textbook of quantitative inorganic analysis. 3d ed. New York, Macmillan, 1952. 759 p.
36. Kuwada, D. M. Determination of water in hydrazine by gas chromatography. Journal of Gas Chromatography 1:11 -13. 1963.
37. Laitinen, H. A. , W. P. Jennings and T. D. Parks. Ampero- metric titration of cyanide with silver nitrate, using the ro- tating platinum electrode. Industrial Engineering Chemistry, Analytical ed. , 18:574 -575. 1946.
38. Landault, C. and G. Guiochon. The use of teflon as a support in gas - liquid chromatography. Application to the separation of strongly polar substances. Journal of Chromatography 9:133 -146. 1962.
39. Lewis, B. and G. von Elbe. Combustion, flames and explo- sions of gases. New York, Academic , 1951. 795p.
40. Lovelock J. E. Argon detectors. In: Gas chromatography; Proceedings of the Third Symposium organized by the In- stitute of Petroleum, Edinburgh, June 8 -10, 1960. Wash- ington, D. C. , Butterworths, 1960. p 16 -29.

99
41. Lovelock, J. E. An ionization detector for permanent gases. Nature 187 :49 -50. 1960.
42. Lovelock, J. E. Ionization methods for the analysis of gases and vapors. Analytical Chemistry 33 :162 -178. 1961.
43. Lovelock, J. E. A sensitive detector for gas chromatography. Journal of Chromatography 1:35 -46. 1958.
44. Lovelock, J. E. and S. R. Lipsky. Electron affinity spectros- copy - a new method for the identification of functional groups in chemical compounds separated by gas chromatography. Journal of the American Chemical Society 82:431-433. 1960.
45. McNair, H. M. and T. De Vries . 1, 2, 3- Trïs(2- cyanoethoxy) - propane as a stationary liquid for gas chromatography col- umns. Analytical Chemistry 33:806. 1961.
46. McWilliam, G. and R. A. Dewar. Flame ionization detector for gas chromatography. Nature 181:760. 1958.
47. Martin, R. L. Adsorption on the liquid phase in gas chroma- tography. Analytical Chemistry 33:347-352. 19 61.
48. Milne, D. Disposal of cyanides by complexation. Sewage and Industrial Wastes 22:1192 -1199. 1950.
49. Morrison, J. D. and A. J. C. Nicholson. Studies of ioniza- tion efficiency. Part 11. The ionization potentials of some organic molecules. The Journal of Chemical Physics 20: 1021 -1023. 1952.
50. Ottenstein, D. M. Column support material for use in gas chromatography. Journal of Gas Chromatography 1:11 -23. 1963.
51. Parcher, J. F. and Paul Urone. An improved solution coat- ing technique for gas chromatographic support. Journal of
Gas Chromatography 2 :184 -185. 1964.
52. Perkins G. et al. Response of the gas chromatographic flame ionization detector to different functional groups. In: Gas chromatography: Third International Symposium held under the auspices of the Instrument Society of America, June 13 -16, 1961. New York, Academic, 1962. p 269 - 285.

100
53. Perrett, R. H. and J. H. Purnell. A study of the reaction of hexamethyldisilazane with some common gas - liquid chromat- ographic solid supports and its effect on their adsorptive properties. Journal of Chromatography 7:455 -466. 1962.
54. Porcaro, P. J. , and V. D. Johnson. Primary amyl alcohols determined by gas chromatography. Analytical Chemistry 33:361-362. 1960.
55. Recommendations on nomenclature and presentation of data in gas chromatography. Pure and Applied Chemistry 8 :553- 562. 1964.
56. Runge, Henner. Gas chromatographische analyse anorgan- ischer case. Zeitschrift fur Analytische Chemie 189:111- 124. 1962.
57, Sawyer, D. T. and J. K. Barr. Evaluation of support mat- erials for use in gas chromatography. Analytical Chemistry 34:1518 -1520. 1962.
58. Schneider, C. R. Determination of low level hydrocyanic acid in solution using gas-liquid chromatography. Ph. D. thesis. Corvallis, Oregon State University, 1962. 121 numb. leaves.
59. Schneider, C. R. and Harry Freund. Determination of low level hydrocyanic acid in solution using gas - liquid chroma- tography. Analytical Chemistry 34:69 -74. 1962.
60. Scholz, R. G. and W. W. Brandt. The effect of solid supports on retention volumes. In: Gas chromatography; Third International Symposium held under the auspices of the Instrument Society of America, June 13 -16, 1961. New York, Academic, 1912. p 7 -26.
61. Smith, V. N. and J. F. Fidiam. Electron drift - velocity detector for gas chromatography. Analytical Chemistry 36:1739 -1744. 1964.
62. Snell, F. D. and C. T. Snell. Colorimetric methods of analysis; including some turbidimetric and neophelometric methods. Vol. 2. New York, Van Nostrand, 1948. 950 p.

101
63. Sternburg James C. Detection devices for gas chromatog- raphy. In: Gas chromatography: Fourth International Sym- posium held under the auspices of the Instrument Society of America June 17 -21, 1963. New York Academic, 1963. p 161 -191.
64. Sternberg, J. C. , W. S. Gallaway and D. T. Jones. The mechanism of response of flame ionization detectors. In: Gas chromatography: Third International Symposium held under the auspices of the Instrument Society of America, June 13 -16, 1961. New York, Academic, 1962. p 231-267.
65. Strange, John P. Potentiometric recorder for hydrogen sulfide and hydrogen cyanide. Analytical Chemistry 29: 1878 -1881. 1957.
66. Table 54: Values of the correction factor j of James and Martin used in gas chromatography. Journal of Chromatog- raphy 2:D33 -D45. 1959.
67. Webber, H. M. and Elizabeth A. Wheller. The adsorptio- metric determination of chlorine in water. Analyst 90: 372 -373. 1965.
68. Williams, Ian H. Gas chromatographic techniques for the identification of low concentrations of atmospheric pollutants. Analytical Chemistry 37:1723 -1732. 1965.
69. Willis, V. Analysis by gas chromatography of a 'pure' sample with an 'impure' carrier. Nature 183:1754. 1959.
70. Winkler, W. O. Report on cyanide residues in food. Jour- nal of the Association of Official Analytical Chemists 42: 552 -553. 1959.
71. Woolmington, K. G. Determination of hydrogen cyanide by gas chromatography. Journal of Applied Chemistry (London) 11:114. 1961.

102
72. Wuhrmann, K. and H. Woke r. Experimentelle untersuchun- gen ííber die ammoniak -and blausaurevergiftung. Schweizer- ische Zeirschrift für Hydrologie 11:210-244. 1948.
73. Urone, Paul, John Elvans Smith and Richard J. Katnik. Gas chromatography study of some chlorinated hydrocarbons. Analytical Chemistry 34:456 -480. 1962.

APPENDIX

103
CHROMATOGRAPHIC BEHAVIOR OF THE STATIONARY PHASE NEAR ITS FREEZING POINT
In an attempt to separate HCN and CHC13 on a Carbowax 20 M
column the relative retention times of the two compounds were deter-
mined at column temperatures between ambient and 100° C. Only
small changes in the relative retention times were observed, but the
absolute retention volume decreased 50 % as the column temperature
dropped below the freezing point of the stationary phase. This was
also observed by Urone (73). However no sharp decrease was found
in the retention volumes near the freezing point of Carbowax 1540.
Since additional information could not be found in the literature, the
effect of temperature on the specific retention volume above and
below the freezing point of five different stationary phases was inves-
tigated further.
The first two stationary phases investigated were Carbowax
1540 and 20 M. Carbowax 1540 is a polyethylene glycol polymer with
an average molecular weight of 1300 to 1600. Carbowax 20 M is
synthesized by joining glycol 6000 with a diepoxide. Both polymers
have a crystalline appearence, rather sharp melting points, and give
a polar elution order (Table 3).
Ethylene glycol succinate was also selected as a polar crys-
talline polymer. Halocarbon 6 -00 is a chlorotrifluoropolyethylene
polymer. It has a broad melting point, and is very viscous. Dennison

104
andFreund(13) have found this polymer useful as a stationary phase in
separating some metal halides. Cetyl alcohol (1 -hexadecanol) was
selected as a crystalline compound in contrast to polymeric stationary
phases. This compound has been used in the separation of aliphatic
amines (2).
The polarity of the stationary phase above and below its freez-
ing point was investigated using the "polarity mixture" previously de-
scribed(page 55). Changes in the column efficiencies were observed
as the column temperature passed through the melting point zone.
Since some columns gave very skewed peaks, peak profiles were com-
pared instead of calculating theoretical plates.
Experimental
The gas chromatograph was a modified Beckman GC -2 de-
scribed on page 16. Flow rates were measured by soap films in a mod-
ified 50 ml buret, Table 11 lists the columns investigated in this
study. Acid washed 40/60 mesh Chromosorb W was used in columns
1 through 5, and 60/80 mesh in column 6. In coating the solid support
for the first five columns the solvent was removed on a steam bath,
while a rotary evaporator was employed in the preparation of column
6. After filling the columns by verticle packing, the columns were
conditioned for 12 hours at the temperatures listed in Table 11.

105
All flow rates were corrected for the vapor pressure of the
water in the buret (12, p 77). Using the symbolism recommended
by the IUPAC (55), the column flow was adjusted to give a F ° flow
rate of 30f 2 ml /min at each column temperature, where F° = jF . c c
This was done to avoid any effects of changing carrier gas flow rates.
The j values were taken from a prepared table (66). The resulting
linear flow rate was approximately 6. 3 cm /sec. Ten microliters of
each component of the polarity mixture was analysed separately to
guarantee resolution.
The specific retention volumes, V , defined as the net reten- g
tion volume at 0 °C per gram of liquid phase were calculated from is o-
thermal chromatograms over a range of column temperatures.
An example is provided ón the last page. The column temperatures
were selected to place the freezing point of the stationary phase in
the center of the temperature range.
Results and Discussion
Graphs of the logarithm of the specific retention volume
against the reciprocal of the absolute column temperature were con-
structed for each component of the polarity mixture. From the
graphs the order of elution of each solute can be observed. Changes
in the peak profiles with temperature were also followed. The
results of each column are summarized below.
c

106
Column 1, Carbowax 20M
The plot of the log Vg vs 1/T is shown in Figure 19. The
specific retention volumes of both the nonpolar and polar sources
decrease abruptly as the column temperature approaches the freez-
ing point. Below the freezing point of Carbowax 20M the order of
elution of ethanol and benzene are reversed.
The column efficiency also decreases sharply as the column
temperature approaches the freezing point. Below the freezing
point the column efficiency improves again. The peak profile for
ethanol is given in Figure 25.
Column 2 Carbowax 1540
Figure 20 shows the results of plotting log Vg vs 1/T for a
Carbowax 1540 column. There is no discontinuity in the slope of the
plot at the freezing point. There is also no sudden loss in column
efficiency near the freezing zone, but rather a gradual asymmetric
peak is obtained with a leading edge common to low column tempera-
tures (Figure 25). The order of elution and the degree of separation
between cyclohexane and ethanol is typical of a polar stationary
phase.

3 -
2
1
Benzene
Ethanol
Methyl ethyl keytone
Cyclohex ane
,/ -' \ \ r / -'
\ ,-" / \ / - /i \ /' - / //// \\ -_ -/ '- \ - /
` - i /
107
0
27
o C
90 80 70 60 50 40 i i i
28 2I9 30
ó- 4 10 x Tc K
30
31 32 33
Figure 19. Specific retention volumes on column 1,Carbowax 20M.
/ /
/ ,
1
-
/ 7 7
/ / `\\ \

3
2
1
0
Benzene
Echanol Methyl ethyl keytone
Cyclohexane
oc
90 80 70 60 50 40 30
27 28 29 30 31 32 33
T°K x 104 c
Figure 20. Specific retention volumes on column 2, Carbowax 1540.
108
í/
../
...." ..."
..--'1,/'.-
.....°
..."'/ ....."
..../ ...."........./
..." ....' ......."...
....."'''
i / i .."../........../
/
i ..." i
....'...:.....,/
...''./.....00./
..." .....
i I I I i

109
Column 3 Halocarbon 6 -00
There is no sharp discontinuity in the log Vg vs 1/T plot for
the Halocarbon 6 -00 column as shown in Figure 21 . In the liquid state
a slightly polar elution order is obtained. As the column tempera-
ture approaches the freezing zone the elution order of cyclohexane
and MEK are reversed. Note cyclohexane now elutes between ethan-
ol and MEK.
Halocarbon 6 -00 is very viscous near its freezing zone. Be-
ing very viscous poor mass transfer effects result in broad peaks.
The number of theoretical plates (55) for benzene for each column
at the specified temperature is listed in Table 12. Halocarbon 6 -00
is considerably less efficient than the other stationary phases.
Before this column was conditioned ethanol and MEK eluted
as severe tailing peaks. After column conditioning only a small
amount to tailing was present. Figure 25 shows the peak asymmetry
for ethanol after column conditioning. The ethanol peak remains
skewed well below the measured melting range.
Column 4 Cetyl Alcohol
Cetyl alcohol shows a large discontinuity at its freezing point
(Figure 22). Ethanol is the last solute to elute below the freezing
point and the first to elute at higher temperatures while the other

Benzene
Ethanol
Methyl ethyl keytone
Cyclohexane
90 80 70
I 218 2
o C
60 50 40 30 1 1
30 311 3!3 ° x 104 Tc K
Figure 21. Specific retention volumes on column 3, Halocarbon 6 -00.
110
42

3
2
1
0
Benzene
Ethanol
Methyl ethyl keytone
Cyclohexane
111
o C
90 80 70 60 50 40 30
27
4 ' ' I
28 29 30 31 32 33
o 104 c
K
Figure 22. Specific retention volumes of column 4, cetyl alcohol.
---\ i/ / /
\\..--- / - \ \ / ,-, \
\ \
I
I
x
- - - -
\\,\

112
components of the polarity mixture keep their respective elution
order. Hydrogen bonding probably accounts for the change in the
ethanol elution order. As a liquid the hydroxyl group of cetyl alcohol
may hydrogen bond with the solid support leaving a less polar sta-
tionary phase than in the solid state.
As with Carbowax 20M the column efficiency improves as the
temperature drops further below the freezing point (Figure 25). No
tailing peaks due to adsorption are present with this slightly polar
stationary phase.
Column 5, Ethylene Glycol Succinate
Ethylene glycol succinate (EGS) is a polyester polymer. The reten-
tion times for the polarity mixture were too short for measurement
at 50° C; thus toluene (b. p. 110. 6° C), methyl isobutyl keytone
(b. p. 119° C), and n- butanol (b. p. 117.7° C) were substituted in
investigating this stationary phase. The log Vg vs 1/ T plot is given
in Figure 23, Accompaning the discontinuity is a small change in
the peak shapes of each solute at the freezing point, but the peaks do
not become highly skewed below the freezing point as in the case of
columns 1, 3, and 4. The order of elution and the degree of separa-
tion of n- butanol and methyl isobutyl keytone classifies EGS as a
polar stationary phase useful in separating alcohols and keytones.

3
2
1
0
- n- Butanol
Methyl isobutyl keytone
Toluene
113
/^
o C
- 140 130 120 110 100 90 80 70 60
I
1 I
i
I i 1
1
i i i I
24 25 26 27 28 29 30
1 T c oK
x 104
Figure 23. Specific retention volumes on column 5, ethylene glycol
succinate.
i r
/ / / i i
..... ......
I
- --
/

114
Column 6, Carbowax 1540
In view of the discontinuities found at the melting point of the
stationary phases investigated, the lack of discontinuity of Carbowax
1540 appeared to be unique. A new column with new packing was pre-
pared using rotary evaporation of the solvent and vacuum drying of
the coated support at 50o C. The specific retention volume is plotted
as a function of temperature in Figure 24.. Contrary to column 2,
column 6 shows a large discontinuity near the freezing zone similar to
Carbowax 20M. Column 6 has the same elution order as column 2
at 25°C and that of Carbowax 20M at 85o C.
Results similar to column 6 were obtained by "in place"
coating of the support (5). Repeated preparation of column packings
by steam bath removal of the solvent and final drying at different
temperatures indicate air oxidation of Carbowax 1540 can occur at
temperatures above 70o C. This may result in a higher melting
point. The column temperatures studied with column 2 may be below
the melting point of the oxidized stationary phase; hence no discon-
tinuity is observed.
Table 13 lists the specific retention volumes of each solute
of the polarity mixture at 80.0° C. Note the large retention volumes
for the cetyl alcohol column versus Halocarbon 6 -00.

3
2
. > ao
1
o
Benzene
Ethanol
Methyl ethyl keytone
Cyclohexane
115
i ---/
/ i / / / / ' /
o C
90 80 70 60 I I I 4
27 28 29 30
0K x 104 c
N
\ \
-..."-....,....
50 40 30 I i
{
31 32 33
Figure 24. Specific retention volumes on column 6, Carbowax 1540.
...------- ...,
../ -------.
I' / ,
N
- - - - - - -

116
Conclusions
Large discontinuites in the retention volumes of solutes may
be anticipated where distinct phase changes occur. Carbowax
1540 and 20M, ethylene glycol succinate, and cetyl alcohol have a
crystalline appearence as a solid and show large discontinuities in
their log Vg vs 1/ T plots. Halocarbon 6 -00 has a broad melting
range and only small changes in the specific retention volumes occur
at the melting zone.
Changes in the elution order may occur below the freezing
point. This may be used to an advantage in separating small impur-
ities from a major component where the loss in column efficiency
below the freezing point is not prohibitive.
Where large discontinuities exist at the freezing point the
column efficiency drops abruptly and the solute peak becomes highly
skewed. At temperatures well below the freezing point an improve-
ment in column efficiency is generally observed. With HCN the loss
of column efficiency below the freezing point of Carbowax 1540 or
20M was small.
Carbowax 1540 packing prepared by steam bath evaporation
coating procedure may be degraded at temperatures above 70o C.
Volatile solvents and low drying temperatures are recommended in
the preparation of Carbowax 1540 packings.
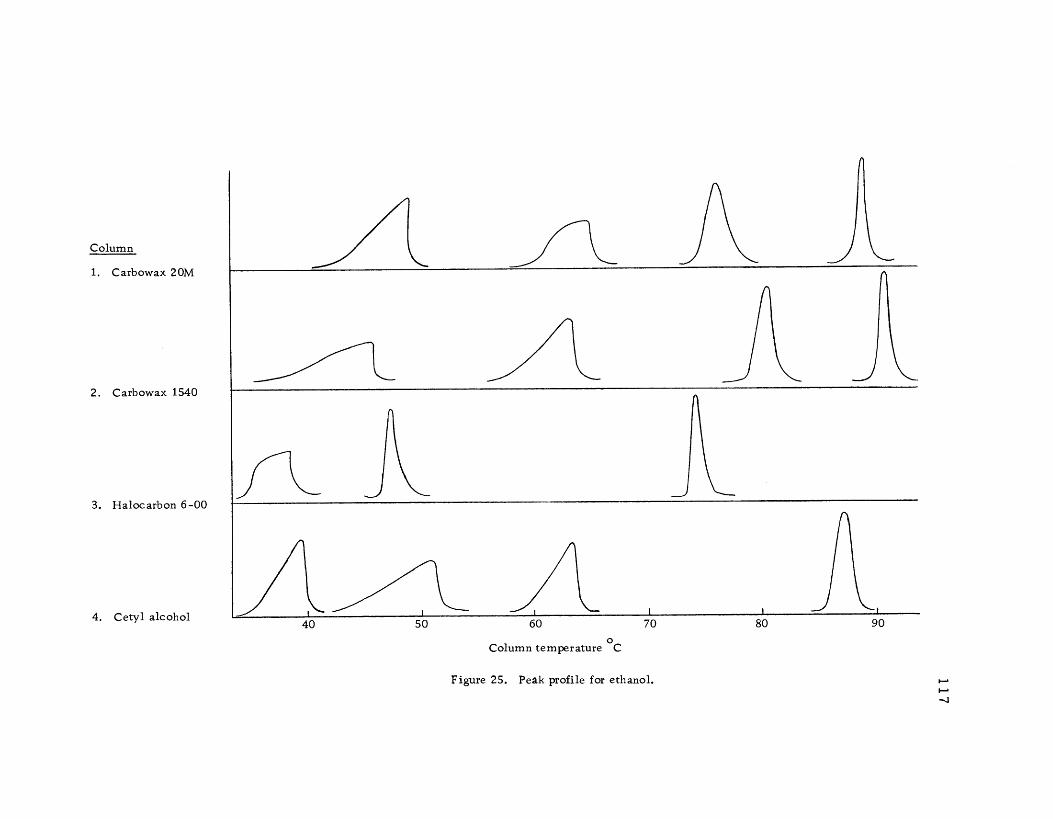
Column
1. Carbowax 20M
2. Carbowax 1540
3. Halocarbon 6 -00
4. Cetyl alcohol 40 50 60 70
o Column temperature C
Figure 25. Peak profile for ethanol.
80 90
fL J
J
1 i i

118
Table 12. Columns investigated
Column Length (feet)
% Stationary Phase WL (grams)
Melting Conditioning Point °C Temp. .°C
1 15.0 15 Carbowax 20M 2,.30 62 -63 190
2 15.0 15 Carbowax 1540 2. 37 45 -47.5 130
3 15.0 15 Halocarbon 6 -00 2. 31 57-60 130
4 15.0 15 Cetyl Alcohol 2.31 47-47.5 130
5 9.0 15 Ethylene glycol 1.32 99 -102 160 Succinate
6 6. 0 15 Carbowax 1540 0. 803 45 -47.5 130
Table 13. Theoretical plates per foot for benzene
Column Temperature ° C Theoretical Plates
1. Carbowax 20M 74.5 80
2. Carbowax 1540 82.5 88. 8
3. Halocarbon 6-00 74. 3 32. 9
4. Cetyl Alcohol 76. 6 87.7 6. Carbowax 1540 74.9 170
Table 14. Specific retention volumes at 80.0° C
Column Cyc.lohexane Benzene Methyl Ethyl Keytone Ethanol
1. Carbowax 20M 17. 2 85.5 59.6 65. 5
2. Carbowax 1540 9.9 65. 0 58. 5 85. 0
3. Halocarbon 6-00 19.9 26. 7 20.3 4. 1
4, Cetyl Alcohol 102 112 89. 5 84. 5
6. Carbowax 1540 16. 2 69.0 54.5 66. 0

119
An Example of the Calculation of the Specific Retention Volume
Definitions and Experimental Data
a. wL weight of the liquid phase = O. 803 grams
b. Ta = ambient temperature = 23. 8o C = 297o K
c Tc = column temperature = 87. 5°C = 360. 7o K
d. P. = inlet pressure = 12.5 psig = 27. 2 psi = 1406 mm
e. Po = outlet pressure = 758 mm
f. P = vapor pressure of water at ambient tempera- w
g j
ture = 22. 1 mm
gas compressibility correction factor =
(3/ 2) Po) 2 -1] / [(Pi/ Po) 3 -1]
h. tR solute = retention time from injection to the peak maximum = 2. 09 min.
i . tR air = retention time from injection to the peak maximum = O. 65 min.
j. F = uncorrected volumetric flow rate of the car - a rier gas measured at ambient temperature
and outlet pressure and corrected for the vapor pressure of water at ambient temper- ature.
k. F = volumetric flow rate of the carrier gas meas- ured at ambient temperature and outlet pres- sure and corrected for the vapor pressure of
water at ambient temperature.
1. Fc = volumetric flow rate of the carrier gas meas- ured at the outlet pressure and the temper- ature of the column
1
c
o
=

m. V =
1 20
retention volume of the solute (uncorrected) and adjusted to the column temperature =
Fc tR solute
n. VA - retention volume of the nonabsorbed solute (air) adjusted to the column temperature =
Fc tR air.
o. VR = adjusted retention volume of the solute =
VR - VA = Fc (tR solute - tRair)
P. VN = net retention volume = j VR
q. V g
= specific retention volume = VN 273. 2
wL Tc bK
Calculations
1. F = Fa (1 - pw ) = 39.73 (1 - 75'81) = 38.57 cc/min
o
2. F = F K 38.57 3 60-_? ) = 46.84 cc/min c Ta `'K ( 297. 0
3. J _ (3/2)[(1406/758)2 -1] /[(1406/758)3 - = 0.680
4 VR' = Fc (tR solute - tR air) = 46.84 (2.09 - 0.65)
= 67.45cc
5 VN - j VR' = (0. 680) (67.45) = 45. 86 cc
b. V VN . 273.2 45.86 273.2
g w_ T K 0.803 360.7 c
= 43. 3 cc
11
.
_ = =