Fixed Income Investor Review - Citibank · Disciplined asset budgeting and allocation ... Citibank,...
22
Fixed Income Investor Review July 23, 2008 Gary Crittenden, CFO Zion Shohet, Treasurer
Transcript of Fixed Income Investor Review - Citibank · Disciplined asset budgeting and allocation ... Citibank,...

Fixed Income Investor ReviewJuly 23, 2008
Gary Crittenden, CFOZion Shohet, Treasurer

1
Agenda
Citi Overview
Balance Sheet Management
Capital Markets & Funding
Q & A
Citi OverviewGary Crittenden, CFO

Balance Sheet Management and Capital Markets & FundingZion Shohet, Treasurer

4
Proactive Capital Issuances
($bn)
-15.2 Net Loss
9.3 Common*
11.7 Preferred
15.7 Convertible Preferred
7.5 Equity Units
5.5 ETruPS
$49.7 Capital Issuance since
3Q’07
3Q’07- 2Q’08 Net Losses
* Includes $4.4bn issued related to Nikko transaction

5
0
20
40
60
80
100
120
140
160
1Q06 2Q06 3Q06 4Q06 1Q07 2Q07 3Q07 4Q07 1Q08 2Q08
Stable Equity Metrics$bn
Tier 1
Shareholders’ Equity
Note: Total Equity includes Common Equity and preferred stock, but excludes the impact of $7.5 billion of convertible equity units which begin mandatory conversion into common shares on March 15th, 2010.

6
Disciplined asset budgeting and allocation
Focus on returns
Dynamic transfer pricing
Active reduction through
– Divestitures
– Asset sales
– Run-off
Active Asset Program
Core Assets
Legacy Assets

7
Asset Trends
(1) Preliminary.
1.88
2.02
2.22
2.36
2.19 2.202.10
4Q'06 1Q'07 2Q'07 3Q'07 4Q'07 1Q'08 2Q'08
25%$474B
(11)%$(257)B
(1)
($Tr)

8
Citi Capital Ratios
11.6% 11.7% 11.9% 11.7% 11.5% 11.2%10.6% 10.7%
11.2%
12.2%
8.3%7.9%
7.3% 7.1%7.7%
5.2% 4.8%4.4% 4.1% 4.0%
4.4%5.0%
8.7%8.6% 8.5% 8.6% 8.6%
5.2%5.2%5.2%
0%
1%2%
3%
4%5%
6%7%
8%
9%10%
11%
12%13%
14%
1Q'06 2Q'06 3Q'06 4Q'06 1Q'07 2Q'07 3Q'07 4Q'07 1Q'08 2Q'08
Total Capital Ratio Tier 1 Capital Ratio Leverage Ratio
--- Represents minimum for “well capitalized” bank holding company

9
INTEGRATEDFUNDING AND LIQUIDITY
MANAGEMENT
INTEGRATEDFUNDING AND LIQUIDITY
MANAGEMENT
Market Access Limits
Internal andExternal Triggers
Internal andExternal Triggers
ContingencyFunding
Plan
ContingencyFunding
Plan
Liquidity RatiosLiquidity Ratios
Liquidity Risk Management Tools

10
Liquidity HighlightsDiversified and stable deposit base– $804bn sourced globally as of 6/30/08; up $32bn YoY
Structural liquidity enhanced by recent deleveraging– Assets down $120bn YoY; structural liquidity of equity, long-term debt, and
deposits up $119bn YoY
Reduced bank unsecured wholesale borrowings– As of recently, net placer of interbank funds
Extended maturity profile of liabilities– Average maturity of long-term debt extended to 7.3 years
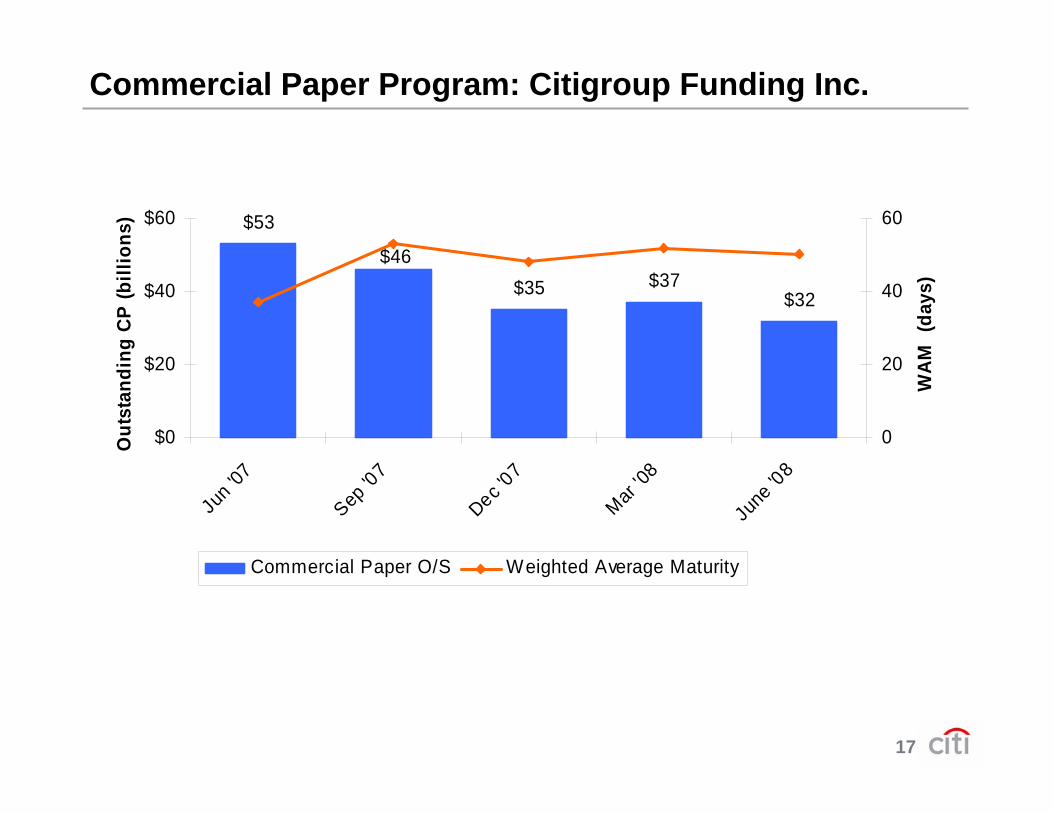
Smaller and extended CP program– Commercial paper outstanding has been reduced to $32bn, and weighted
average maturity extended to 50 days
Expanded cash and highly liquid securities – $65bn of cash and highly liquid securities (excluding unencumbered box) at the
holding company and broker dealer as of 6/30/08; up from $24bn at 12/31/07
11
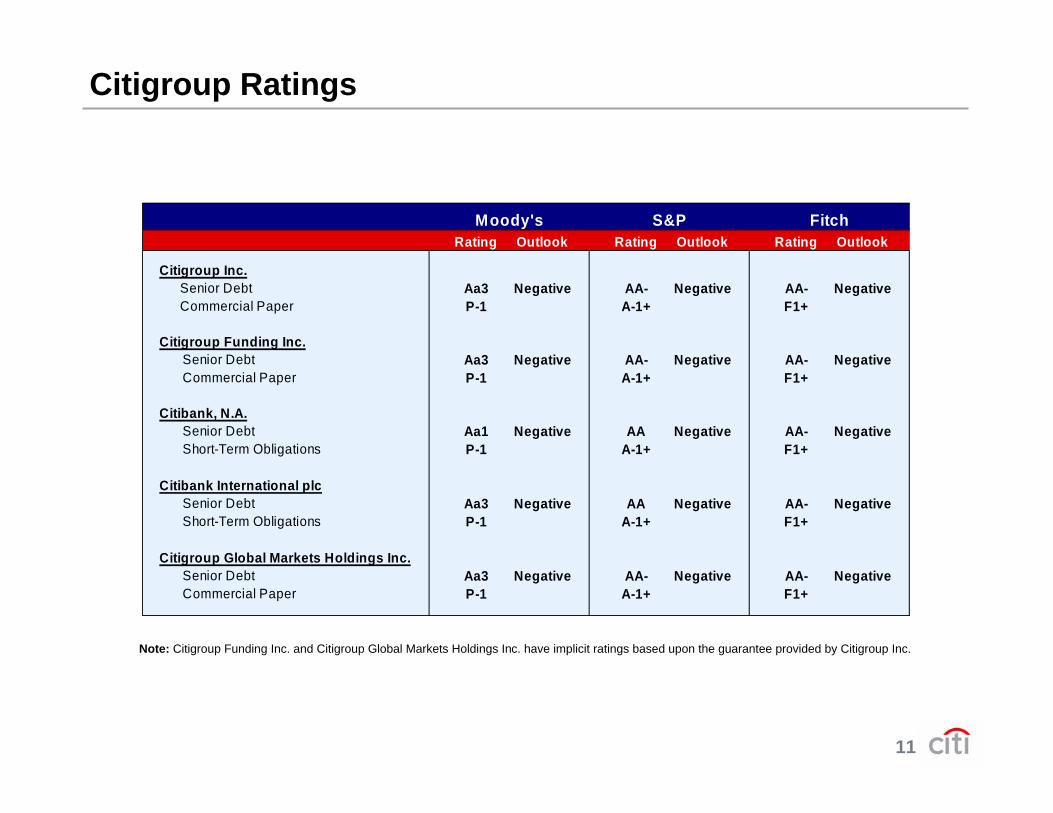
Citigroup Ratings
Rating Outlook Rating Outlook Rating Outlook
Citigroup Inc.Senior Debt Aa3 Negative AA- Negative AA- NegativeCommercial Paper P-1 A-1+ F1+
Citigroup Funding Inc.Senior Debt Aa3 Negative AA- Negative AA- NegativeCommercial Paper P-1 A-1+ F1+
Citibank, N.A.Senior Debt Aa1 Negative AA Negative AA- NegativeShort-Term Obligations P-1 A-1+ F1+
Citibank International plcSenior Debt Aa3 Negative AA Negative AA- NegativeShort-Term Obligations P-1 A-1+ F1+
Citigroup Global Markets Holdings Inc.Senior Debt Aa3 Negative AA- Negative AA- NegativeCommercial Paper P-1 A-1+ F1+
Citigroup Inc.Summary of Credit Ratings and Outlooks
Moody's S&P Fitch
Note: Citigroup Funding Inc. and Citigroup Global Markets Holdings Inc. have implicit ratings based upon the guarantee provided by Citigroup Inc.
12
Programmatic Approach to Funding
Diversified Funding
Robust Liquidity Management
Commitment to Franchises
Develop and Maintain Dialogue with Investors

13
$0
$5
$10
$15
$20
$25
$30
$35
$40
2002 2003 2004 2005 2006 2007 2008 YTD
USD Non-USD
$13.7
$22.8$23.9 $23.9
$29.6
$37.4
13% 22% 31% 35% 44% 48%
Global Franchises – Citigroup Inc.
(Billions)
Non-USD % of Total Outstandings
$70B $82B $97B $101B $122B $155B
$20.6
$171B
50%
Historical Issuance
CHF EUR JPY
CHF EUR GBP JPY
AUD CHFEUR GBP
SGD
AUD CADCHF EURGBP JPY
SGD
AUD CADCHF EURGBP HKDJPY SEKSGD THB
AUD CADCHF DKKEUR GBPHKD JPYNZD SEKSGD THB
EUR GBPJPY SGD
THB

14
Issuance Weighted Average Maturity– 2007: 8.6-years– YTD 2008: 10.9-years
Maturity Profile – Citigroup Inc.
4%
9%10%
9%
14%
9% 8%
3%4%
7%
5%
8%9%
0%
2%
4%
6%
8%
10%
12%
14%
16%
2H'0
8
2009
2010
2011
2012
2013
2014
2015
2016
2017
2018
2019
-202
8
2029
+
Distribution of Maturities
70 82 97 101 122 155 171
4.9
5.7
6.5 6.77.0
7.37.0
60
80
100
120
140
160
180
2002 2003 2004 2005 2006 2007 Current0
1
2
3
4
5
6
7
8
Total Outstandings ($B) and Remaining Life (yrs)

15
EUR15.9%
GBP14.9%
JPY14.3%
USD52.4%
SGD2.1%
THB0.4%
Larger transaction sizes– Feb: $2.5B 30-yr– Mar: EUR 2B 5-yr– Apr: $4.75B 5-yr– May: $3.0B 10-yr
4.83.6
2.51.2 1.8
3.5
1.5
0.2
1.6
$0.0
$2.0
$4.0
$6.0
$8.0
$10.0
1.5 Yr 3 Yr 5 Yr 10 Yr 15 Yr 20 Yr 30 Yr
non-USDUSD
2008 YTD Issuance Summary: Citigroup Inc.($B) By Tenor By Currency

16
EUR19.7%JPY
0.5%Other2.8%
SEK0.1%
GBP0.2%
USD76.8%
Raised $13.5B in 11 currencies: WAM: 3.3yrs, non-USD: 23.2%, structured: 46%
Diversification across products and markets– Distribution in 19 European countries– Product Innovation: Rate Structured, Inflation Linked, Equity Linked– Expansion of currencies (Scandinavia, Eastern Europe)
4.4
3.6
1.6
0.4 0.3 0.0
0.1
1.7
0.80.4
0.1
0.01
$0
$1
$2
$3
$4
$5
1 yr 2 yr 3-5 yr 6-10 yr 12-15 yr 18+ yr
non-USDUSD
2008 YTD Issuance Summary: Citigroup Funding Inc.($B) By Tenor By Currency
17
$53
$35 $37$32
$46
$0
$20
$40
$60
Jun '
07
Sep '0
7
Dec '07
Mar '08
June
'08
Out
stan
ding
CP
(bill
ions
)
0
20
40
60
WAM
(da
ys)
Commercial Paper O/S Weighted Average Maturity
Commercial Paper Program: Citigroup Funding Inc.
18
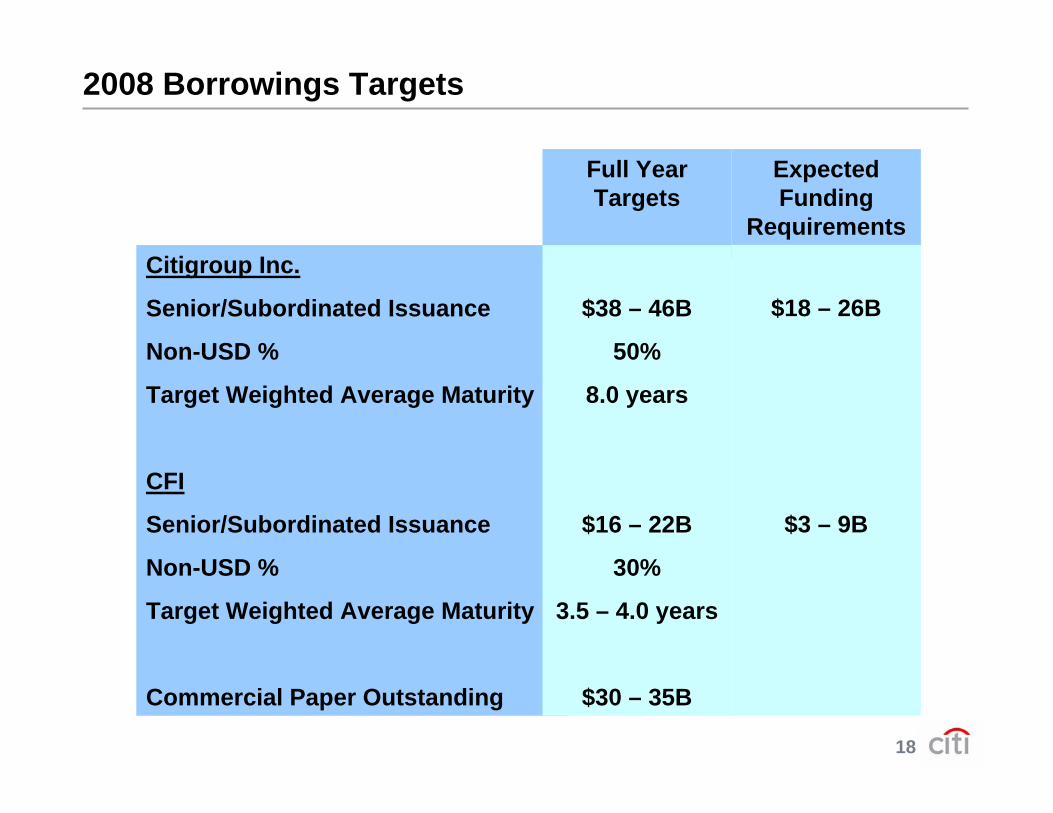
2008 Borrowings Targets
Expected Funding
Requirements
Full Year Targets
Citigroup Inc.
Senior/Subordinated Issuance
Non-USD %
Target Weighted Average Maturity
CFI
Senior/Subordinated Issuance
Non-USD %
Target Weighted Average Maturity
Commercial Paper Outstanding
$38 – 46B
50%
8.0 years
$16 – 22B
30%
3.5 – 4.0 years
$30 – 35B
$18 – 26B
$3 – 9B
19
Investor Connections
Fixed Income Investor Website– www.citigroup.com/citigroup/fixedincome
Information and Communications Resource for Fixed Income Investors
Contact us– [email protected]

20
Certain statements in this document are “forward-looking
statements” within the meaning of the Private Securities Litigation
Reform Act. These statements are based on management’s
current expectations and are subject to uncertainty and changes in
circumstances. Actual results may differ materially from those
included in these statements due to a variety of factors. More
information about these factors is contained in Citigroup’s filings
with the Securities and Exchange Commission.
Question and Answer SessionGary Crittenden, CFOZion Shohet, Treasurer


![[Citibank] Asset Based Finance Citibank(Bookos-z1.Org)](https://static.fdocuments.in/doc/165x107/55cf97e7550346d033945106/citibank-asset-based-finance-citibankbookos-z1org.jpg)