Fish Physiology, Toxicology, and Water Quality
155
Fish Physiology, Toxicology, and Water Quality Proceedings of the Eighth International Symposium Chongqing, China October 12-14, 2004 R E S E A R C H A N D D E V E L O P M E N T
Transcript of Fish Physiology, Toxicology, and Water Quality
Fish Physiology Toxicology and Water
Quality
Proceedings of the Eighth International Symposium
Chongqing China October 12-14 2004
R E S E A R C H A N D D E V E L O P M E N T
EPA600R-06062 June 2006
FISH PHYSIOLOGY TOXICOLOGY AND WATER QUALITY
Proceedings of the Eighth International Symposium Chongqing China
October 12-14 2004
Edited By
David Randall and Dung Yuk Man Mandy City University of Hong Kong
Published by
Ecosystems Research Division Athens Georgia 30605
US Environmental Protection Agency Office of Research and Development
Washington DC 20460
NOTICE
The views expressed in these Proceedings are those of the individual authors and do not necessarily reflect the views and policies of the US Environmental Protection Agency (EPA) Scientists in EPArsquos Office of Research and Development have authored or coauthored papers presented herein these papers have been reviewed in accordance with EPArsquos peer and administrative review policies and approved for presentation and publication Mention of trade names or commercial products does not constitute endorsement or recommendation for use by EPA
ii
ABSTRACT
Twenty-one participants from Europe North America and China convened in Chongqing China October 12-14 2005 for the Eighth International Symposium in Fish Physiology Toxicology and Water Quality The subject of the meeting was ldquoHypoxia in vertebrates Comparisons of terrestrial and aquatic vertebratesrdquo These Proceedings include 13 papers presented over the three day period and discuss the responses of fish reptiles and mammals to hypoxia These papers report on the responses of animals to hypoxia at the behavioural physiological and molecular levels Clearly hypoxia has wide ranging effects the responses are complex and there are many similarities in the responses of all vertebrates to hypoxia Organisms respond to hypoxia by reducing energy expenditure in particular inhibiting reproduction feeding and exercise That is animals only expend energy that is absolutely necessary for survival There is extensive reorganization of cellular machinery directed by hypoxia inducible factors (HIFs) proteins that increase during hypoxia and have a marked effect on the expression of many genes As a result anaerobic metabolism is up regulated and many aspects of aerobic metabolism are down regulated Many cells enter cell cycle arrest Thus organisms stop reproducing and growing during hypoxia and if the effects of hypoxia are severe development of eggs and larvae is compromised
iii
CONTENTS
Page
NOTICEii ABSTRACTiii ACKNOWLEDGEMENTS vi
Response of aquatic vertebrates to hypoxia DJ Randall CY Hung and WL Poon 1
Post-genomic approaches to the mechanisms of hypoxia response in the common carp Cyprinus Carpio
EJ Fraser AY Gracey and AR Cossins 11
Isolation and characterization of the VEGF-A gene of grass carp Gallant KL Chan Helen OL Mok Patrick KS Ng Minnie ML Wong and Richard YK Kong 19
Molecular studies of the HIF transcription factors of grass carp HW Law Richard YC Kong and Rudolf SS Wu 31
Gene expression profiling of raw 2647 cell survival and apoptosis under oxidative stress
CC Fong Y Zhang MS Wong CH Tzang WP Lai and M Yang 39
Extreme adaptations to hypoxia and anoxia in crucian carp Goumlran E Nilsson 53
Suppressive effects of hypoxia on male rat reproductive function Weigong Liao Yuqi Gao Mingchun Cai Jian Chen Yi Wu 59
Endocrine disrupting and teratogenic effects of hypoxia on fish and their ecological implications
Rudolf SS Wu Eva WH Shang and BS Zhou 75
Effects of hypoxia on lipid metabolism in teleosts Guido van den Thillart 87
The influence of oxygen shortage on the development of the cardiovascular system in Zebrafish
Bernd Pelster 107
A biocomputational tool to measure cardiac rhythms in zebrafish SH Cheng Eric PK Chan and Alex CC Lin 121
iv
Hypoxia in reptiles Tobias Wang and Nini Skovgaard 127
Bioaccumulation and enantioselective biotransformation of fipronil by rainbow trout (Oncorhynchus mykiss)
Brad J Konwick Aaron T Fisk Jimmy K Avants J MacArthur Long and Arthur W Garrison 139
v
ACKNOWLEDGEMENTS
The 8th Symposium was organized by Professor Gao Yuki of the Institute of High Altitude Medicine Third Military University Chongqing China and Professor David Randall of the Department of Biology and Chemistry City University of Hong Kong with the able help of Ms Mandy Dung Yuk Man also from Biology and Chemistry City University of Hong Kong The meeting was managed in Chongqing by the Third Military University who provided excellent meeting rooms for the Symposium Professor Gao and his associates were excellent hosts and showed us both the University and Chongqing Funding for the symposium was provided by the US Environmental Protection Agency and we were advised throughout by Dr George Bailey and Dr Rosemarie Russo of the Ecosystems Research Division US Environmental Protection Agency Athens Georgia Ms Dung Yuk Man assisted in the preparation of this document Finally I attribute the success of this symposium to the many people who came to Chongqing to present and discuss their work
David Randall Department of Biology and Chemistry City University of Hong Kong
vi
RESPONSE OF AQUATIC VERTEBRATES TO HYPOXIA
DJRandall1 CYHung and WLPoon
ABSTRACT
The major effect of hypoxia on the individual is to reduce exercise capacity Fish respond to hypoxia by inhibiting feeding and reproduction and moving to lower temperatures all of which lower energy expenditure Oxygen delivery is augmented by increasing both gill ventilation and hemoglobin content and oxygen affinity Aerobic metabolism is down-regulated whereas anaerobic metabolism is up-regulated Steroid metabolism is reduced Liver cells go into cell cycle arrest Genes associated with cell growth and aerobic metabolism are down regulated but genes associated with anaerobic metabolism are up-regulated Uncoupling proteins 2 amp 3 are up-regulated and may play a role in reducing mitochondrial activity during hypoxia Much of the response to hypoxia occurs in the first few hours and days There are many similarities between fish and mammalian responses to hypoxia presumably because they evolved in common aquatic vertebrate ancestors Cardiovascular responses have been somewhat modified in terrestrial vertebrates and organic phosphate levels in the red blood cell decrease rather than increase in fish exposed to hypoxia The relative role of temperature change starvation adenosine production and HIF-1 expression in metabolic depression is not clear in any vertebrate
INTRODUCTION
Hypoxia is a common feature of the aquatic environment Oxygen levels in the water depend on photosynthetic activity in the water exchange with the atmosphere usage by aquatic organisms and oxidation reactions in the water Photosynthesis requires light and therefore is restricted to surface waters and during daylight Nocturnal hypoxia is common in tropical lakes and lagoons Gas diffusion in water is slow and so hypoxia occurs at depth in unmixed waters There is a minimum oxygen layer in oceans blow the photosynthetic zone where a large number of organisms live on food dropping from above Hypoxia is also common beneath the ice on frozen lakes and ponds Although hypoxia is a natural and frequent event in the aquatic environment it has been exacerbated by human actions Eutrophication of waterways generally leads to hypoxia and many regions of the world where there are large human populations have increasing levels of hypoxia The movement of vertebrates onto land is relatively recent and much of vertebrate evolution occurred in water at lower oxygen levels than at present It is possible that terrestrial vertebrates living in an oxygen rich atmosphere have lost some of their capacity to survive hypoxia
EFFECTS OF INCREASING HYPOXIA ON AQUATIC VERTBRATES
Increasing aquatic hypoxia has led to changes in species composition some leave some die what is left are those more tolerant of hypoxia In general there is a reduction in species diversity and biomass (Diaz and Rosenberg 2001) Vertebrates respond to hypoxia by enhancing oxygen uptake down regulating energy expenditure and up-regulating anaerobic pathways Fish move to colder
1 Department of Biology and Chemistry City University of Hong Kong Kowloon Hong Kong SAR China 1
waters in response to aquatic hypoxia (Petersen and Steffensen 2003) and this fall in body temperature reduces energy metabolism In addition because oxygen is more soluble in colder waters this move may be associated with an increase in the oxygen content of water The reduction in temperature will also enhance oxygen uptake because of increased hemoglobin oxygen affinity
REDUCED FOOD INTAKE AND REPRODUCTION DURING HYPOXIA
Salmonids reduce food intake and stop growing when water oxygen saturation falls below 70 (Jobling 1994) Several studies in other fish have reported similar results for example cod exposed to hypoxia reduce food intake and growth (Chabot 2003) both in the laboratory and in the natural environment The mechanisms by which hypoxia inhibits food intake are largely unknown
Hypoxia is known to disrupt the endocrine systems in fish retarding gonadal development and reducing success in spawning fertilization and larval growth (Zhou et al 2001 Wu et al 2003) Reproductive success depends on multiple factors and control systems exist at several levels including the hypothalamic-pituitary axis steroid metabolism and modulation of steroid receptors Plasma steroid levels were low in hypoxic carp and gonad-somatic index (GSI) was reduced along with plasma testosterone levels (Zhou et al 2001) Hypoxia appears to have a marked inhibitory effect on breeding and spawning behaviour of carp (Wang et al unpublished data) Hypoxic (05-08mgL) exposure of zebrafish reduced egg production to only 9fish after the first day compared to 52fish in the control group The egg number in the hypoxia treated group continued to drop over time
In normoxia fertilized zebrafish eggs hatch between 48 and 60 hours post fertilization (PF) and 938 of the eggs hatched In hypoxia fertilized eggs did not hatch until 96 to 260 hours PF only 49 hatched and the rest died Fertilized eggs developing under hypoxia were pale indicating a lack of pigment Growth was retarded and there were many abnormalities Hypoxia exposure had little effect on the expression of the Aryl hydrocarbon Receptor Nuclear Translocator (Randall and Yang 2004) or the activity of the P450scc (CYP11A) the rate limiting enzyme controlling steroidogenesis via the conversion of cholesterol to pregnenolone (Yang unpublished data) Hypoxia increased vitellogenin gene expression in both zebrafish (Eva Shang unpublished data) and carp (CY Hung unpublished data) but surprisingly this was associated with a marked reduction in vitellogenin levels in the fish
OXYGEN DELIVERY DURING HYPOXIA
Most vertebrates maintain oxygen delivery during aquatic hypoxia by increasing ventilation and the diffusing capacity of the respiratory surface (Randall 1982) Fish skim the surface water which usually has more oxygen or may breathe air Hypoxia due to breath holding in birds and mammals is associated with a reduction in heart rate and cardiac output and blood flows preferentially to the brain and heart rather than to the skin gut and muscles Many fish however maintain cardiac output by increasing stroke volume to offset the decrease in heart rate The number of circulating red blood cells increases due to release from the spleen (within minuteshours) and due to increases erythropoietin levels (within daysweeks) Unlike mammals where increased organic phosphate levels decrease hemoglobin oxygen affinity during hypoxia in fish hemoglobin (Hb) oxygen affinity increases due to the combined effect of decreased organic phosphate (NTP) levels and reduced temperature as ffish move to colder water The increase Hb-O2 affinity facilitates oxygen uptake at the gills The decrease in NTPHb ratios associated with hypoxia are rapid enough to compensate for circadian oscillations in dissolved oxygen seen in lagoons and tropical lakes (Val 2000) Anaemia in fish results in an increase in NTPHb ratio facilitating oxygen unloading to tissues as seen in mammals (Val et al 2002)
2
All-major modulators of vertebrate Hb-O2 affinity including IPP GTP ATP 23DPG (in decreasing order of effect) and IP2 appeared during the radiation of fish (Val 2000) Thus un-like mammals RBC organic phosphates in fish decrease and Hb-O2 affinity increases during hypoxia whereas the response to anemia is similar to that seen in mammals (organic phosphates increase)
To enhance oxygen delivery during hypoxia hypoxia-inducible factor 1 (HIF-1) is stabilized resulting in an increase in erythropoietin heme oxygenase and transferrin to enhance red blood cell production in the mammals (Semenza 2000) In carp however heme oxygenase is down-regulated (Hung unpublished results) whereas in goby fish Gillichthys mirabilis a moderate-hypoxia tolerant species heme-oxygenase is up-regulated but expression of transferrin is suppressed (Gracey et al 2001) A variety of genes which may be independent of HIF-1 namely hemopexin precursor a heme-binding protein and haptoglobin alpha amp beta chains hemoglobin-binding molecules are all induced whereas ferritin was downregulated Hemoglobin alpha and beta chains remained unchanged during hypoxia in carp kidney whereas expression of myoglobin gene increased by about 3 fold during long term hypoxia exposure (Hung unpublished data)
MUSCLE OXYGEN LEVELS
A fish body consists of about 60-70 muscle made up of highly vascularized red oxidative slow twitch fibres and poorly vascularized white glycolytic fast twitch fibres The red muscle of a trout has a much higher oxygen tension than that of a rat as measured by an oxygen sensitive (Presens) micro-optode tip diameter lt10 microm into red muscle of intact trout (McKenzie et al 2004) and rat Interestingly the arterial and venous oxygen tensions of rat and trout are similar (Table 1) however muscle oxygen levels were below mixed venous levels in the human rat and dog whereas in trout muscle oxygen levels were midway between arterial and mixed venous levels that is fish muscle oxygen levels are higher than that of rat
Species Human Rat or Dog Trout PaO2 mmHg 100 100 PvO2 mmHg 40 40 Muscle mmHg 25-35 61
Table 1 Oxygen tensions in arterial (PaO2) and venous (PvO2) blood and in red muscle in humans rats dogs and trout (adapted from McKenzie et al 2004)
Many fish hemoglobins have a Root shift where reduced pH decreases Hb-O2 saturation even at very high O2 levels This Root shift is important in maintaining swimbladder inflation using very high levels of oxygen McKenzie et al (2004) suggest that the Root shift leads to the high muscle tissue oxygen levels they reported in trout They argue that as CO2 transfer is more rapid than oxygen transfer CO2 can enter capillary blood reduce RBC intracellular pH and drive oxygen from the hemoglobin raising PO2 in both blood and tissues (Root off shift) Subsequently deoxy-hemoglobin will bind protons raising pH causing oxygen binding to hemoglobin as the blood leaves the tissue capillaries (Root on shift) reducing PvO2 to levels below that in the tissues Thus fish tissue oxygen levels are much higher than that seen in terrestrial mammals This mechanism ameliorates the decrease in tissue oxygen levels during hypoxia (Figure 1) but the fish must maintain hemoglobin oxygen
3
saturation during hypoxia if this system is to work Thus this mechanism is coupled to the increased Hb-O2 affinity during hypoxia seen in fish
Mean pwO2 Mean paO2
Mean RM 140
120
100
80
60
40
pO2
(mm
Hg)
20 0 20 40 60 80 100 120 140 160
time (min)
Figure 1 The decrease in muscle pO2 is ameliorated and the bloodmuscle pO2 gradient is decreased during hypoxia in the rainbow trout (from McKenzie et al 2004) RM = muscle pO2 pwO2 = water pO2 paO2 = arterial blood pO2
METABOLIC ADJUSTMENTS TO HYPOXIA
Fish reduce energy expenditure by moving to a lower temperature reducing or stopping swimming activity feeding and reproduction As a result growth slows and eventually becomes zero or negative All of these factors reduce energy expenditure Adenosine levels are increased as in mammals protecting the animal against hypoxia and balancing energy usage and production (Bernier et al 1996 a b Nilsson 2002) Many studies have shown an up-regulation of anaerobic enzymes during hypoxia with increased glucose transport utilization of liver glycogen (muscle glycogen used during exercise) with increased lactate production Lactate accumulation is ameliorated in carp and goldfish by ethanol production from lactate (ref)
We hypothesized that programmed cell death (apoptosis) was one of the strategies that help common carp (Cyprinus Carpio L) survive hypoxia (05mgO2L) Although there were DNA nick ends shown by Terminal transferase mediated dUTP Nick End Labelling (TUNEL) staining in liver of carp exposed to hypoxia it appeared that there was no apoptosis because there was no change in caspase 3 activity assay (Figure 2) DNA fragmentation assay and anti-ssDNA staining (Figure 3) In addition there was no significant difference in the hepatosomatic index between 42-day hypoxic exposure in carp Subsequent Electron Microscope (EM) analysis also indicated no change in the level of apoptosis between control and hypoxic carp livers Results of an analysis using flow cytometry supported the absence of apoptosis The cell cycle inhibitor p27 which prevents cells from going into the S phase if there is DNA damage was up-regulated in the 4-day hypoxic samples showing a low
4
TUNEL signal and indicated that the liver cells were in cell cycle arrest Cell death activator CIDE-B was found to be down-regulated during hypoxia along with transmembrane 4 superfamily member 8 whereas the anti-apoptotic gene Bcl-2 was up-regulated during hypoxia (Figure 4) Thus the carp liver cells seem to be going into cell cycle arrest rather than apoptosis during hypoxia
casp
ase3
activ
ity (n
mol
mg
prot
einh
r)
400
350
300
250
200
150
100
050
000
normoxia 4 day-hypoxia
Figure 2 Caspase 3 activity of liver exposed to 4-day hypoxia (03mgO2L) and control No significant different between two groups Mean+SE with n=6
Figure 3 (A) Normoxia (B) 4-day hypoxia (05mgO2L) Apoptotic cells stained by both anti-ssDNA monoclonal antibody and DAPI (chromosome stain) were marked with There was no observable difference between groups
CHANGES IN GENE EXPRESSION DURING HYPOXIA
Changes in gene expression play a significant role in the response to hypoxia with the major changes occurring at the onset of hypoxia The following is a description of the changes in gene expression in the liver of carp subjected to 42 days hypoxia In general genes associated with aerobic metabolism and cell growth were down regulated but genes associated with anaerobic metabolism were up-regulated
5
Apoptosis regulator Bcl-2
Transmembrane 4 superfamily member 8 (Tetraspanin 5)
Cell death activator CIDE-B
Figure 4 Expression of apoptosis-related genes during hypoxia in carp (One-way ANOVA plt007)
Uncoupling proteins 2 amp 3 were up-regulated in hypoxia and may play a role in reducing mitochondrial activity during hypoxia (Hung unpublished data) In mammals hypoxia inducing factor (HIF-1α) levels increase due to decreased rates of degradation and results in the up-regulation of a large number of genes (gt40 in mammals) controlled by HIF-1 HIF-1α is a constitutively expressed gene but its protein is also rapidly degraded under normoxic conditions During hypoxia 26S proteosome complex degradation of HIF-1α is inhibited HIF-1α together with HIF-1β form a dimer that functions as a transcriptional factor (HIF-1) that up-regulates the gene expression of many target genes including VEGF erythropoietin and glucose-transporters (Semenza 2001) One crucial function of HIF-1 transcription complex is to increase oxygen delivery and enhance anaerobic respiration during hypoxia by turning on oxygen delivery and glycolytic gene expression HIF-1 expression was up-regulated at day 4 of hypoxia in carp and returned to control value thereafter even though hypoxia persisted until day 42 (Figure 5) A similar pattern of glycolytic gene expression was observed in common carp during hypoxia at day 4 (glyceraldehydes 3-phosphate dehydrogenase phosphoglycerate mutase 1 and 2 beta enolase fructose-bisphosphate aldolase A B and C hexokinase) but the expression remained higher (about 2-fold) than time 0 during prolonged exposure to hypoxia (Figure 6)
HIF-1a is translationally regulated during hypoxia in mammalian systems but it appears that HIF-1a expression also increases in fish during hypoxia (Gracey 2001 Hung unpublished data) The increase in carp HIF-1a expression could be driving the large increase in the expression of glycolytic genes at day 4 After 4 days of hypoxia carp might have become better adapted to hypoxia and shift to solely translation control of HIF1a as seen in mammals
6
Figure 5 Expression profiles of carp HIF1a during hypoxia exposure Day 4 is significantly different from all the time points (One-Way ANOVA plt005)
Fold Change
-6 -3 1 +3 +6
Figure 6 Expression profiles of some glycolytic genes during hypoxia in common carp Most genes are up-regulated especially at day 4
The increase of glycolytic genes at day 4 was accompanied by increase of glyconeogenic genes fructose-16-bisphosphatase and fructose-16-bisphosphatase isozyme 2 and genes involved in the phenylalanine catabolic pathway and the expressions remained slightly higher than time 0 throughout the exposure period Hepatic glycogen decreased rapidly at day 4 presumably as a result of increased anaerobic respiration At day 16 carp had replenished its liver glycogen content to pre-hypoxia exposure (day 0) (Figure 7) Unfortunately only one glycogen synthesis gene glycogenin is represented on our carp microarray and liver expression of this gene was too low to be detected In contrast to liver muscle glycogen remained unchanged during hypoxia indicating that liver but not muscle glycogen is the main substrate for anaerobic respiration during hypoxia (Figure 8)
7
800
d
b
bc
400
500
600
700μm
ol g-1
Liv
er
a300
200
100
0 0 5 10 15 20 25 30 35 40 45
Days after hypoxia
Figure 7 Hepatic glycogen levels of carp during hypoxia Data shown are presented as (Mean plusmn SE) One-way ANOVA plt005 a significantly different from Day 0 b significantly different from Day 4 c significantly different from Day 8 d significantly different from Day 16
40
35
μm
ol g-1
Mus
cle 30
25
20
15
10
5
0 0 5 10 15 20 25 30 35 40 45
Days after Hypoxia
Figure 9 Muscle glycogen level of carp during hypoxia Data shown are presented as (Mean plusmn SE) One-way ANOVA plt005 No significant change during hypoxia
SUMMARY
The major effect of hypoxia on the individual is to reduce exercise capacity Fish respond to hypoxia by inhibiting feeding and reproduction and moving to lower temperatures all of which lower energy expenditure Oxygen delivery is augmented by increasing both gill ventilation and hemoglobin content and oxygen affinity Aerobic metabolism is down-regulated whereas anaerobic metabolism is up-regulated Steroid metabolism is reduced Liver cells go into cell cycle arrest Cell growth and
8
aerobic metabolism genes are down regulated but genes associated with anaerobic metabolism are up-regulated Uncoupling proteins 2 amp 3 are up-regulated and may play a role in reducing mitochondrial activity during hypoxia Much of the response to hypoxia occurs in the first few hours and days Four days seemed to be critical for carp Cyprinus Carpio if they survived day 4 they continued to live under hypoxic conditions There are many similarities between fish and mammalian responses to hypoxia presumably the response evolved in vertebrate aquatic ancestors Cardiovascular responses have been somewhat modified in terrestrial vertebrates and organic phosphate levels in the red blood cell decrease rather than increase in fish The relative role of temperature change starvation adenosine production and HIF-1 expression in metabolic depression not clear in any vertebrate
Major effects of hypoxia on the individual is to reduce exercise capacity if prolonged there is reduced growth Finally there is reduced reproduction At the ecosystem level hypoxia results in reduced species diversity and biomass There is differential survival some species are much more tolerant of hypoxia
ACKNOWLEDGEMENTS
The work described in this paper was substantially supported by grants from the Research Grants council of the Hong Kong Special Administrative Region China Project CityU 109601M CityU 124402M and by the Areas of Excellence Scheme established under the University Grants Committee of the Hong Kong Special Administrative Region China (Project No AoEP-042004)
REFERENCES
Bernier NJ J Harris J Lessard and DJ Randall 1996a Adenosine receptor blockage and hypoxia-tolerance in rainbow trout and Pacific hagfish I Effects on anaerobic metabolism Journal of Experimental Biology 199 485-495
Bernier NJ J Fuentes and DJ Randall 1996b Adenosine receptor blockage and hypoxia-tolerance in rainbow trout and Pacific hagfish II Effects on plasma cathecholamines and erythrocytes Journal of Experimental Biology 199 497-507
Chabot D 2003 Chronic non-lethal levels of hypoxia limit distribution and growth of Atlantic cod (gadus morhua) in the northern gulf of St Lawrence Canada Proceedings of the Seventh International Symposium Tallinn Estonia May 12-15 2003 EPA Environmental Research Laboratory Athens Georgia USA (ed) R Gretchen and DW Michelle EPA600R-04049 pp 183-206
Diaz RJ and R Rosenberg 2001 Overview of anthropogenically-induced hypoxia effects on marine benthic fauna In Coastal Hypoxia Consequences for Living Resources and Ecosystems NN Rabalais and RE Turner (eds) American Geophysical Union Washington DC pp 129-146
Gracey AY JV Troll and GN Somero 2001 Hypoxia-Induced Gene Expression Profiling in the Euryoxic Fish Gillichthys mirabilis Proceedings of National Academy of Sciences of the United States of America 98 1993-1998
Jobling M 1994 Fish Bioenergetics Volume 13 1-44 Chapman and Hall London
9
McKenzie DJ S Wong DJ Randall S Egginton EW Taylor and AP Farrell 2004 The effects of sustained exercise and hypoxia upon oxygen tensions in the red muscle of rainbow trout J Exp Biol 207 3629-3637
Nilsson GE 2002 Adenosine ndash A Universal Promoter of Survival under hypoxic conditions Proceedings of the Sixth International Symposium La Paz BCS Mexico 22-26 January 2001 EPA Environmental Research Laboratory Athens Georgia USA (ed) RV Thruston EPA600R-02097 pp 1-10
Petersen MF and JF Steffensen 2003 Preferred temperature of juvenile Atlantic cod Gadus morhua with different haemoglobin genotypes at normoxia and moderate hypoxia Journal of Experimental Biology 206 359-364
Randall DJ 1982 The control of respiration and circulation in fish during exercise and hypoxia Journal of Experimental Biology 100 275-288
Randall DJ and HPYang 2004 The role of hypoxia starvation β-Naphthoflavone and the arylhydrocarbon receptor nuclear translocation in the inhibition of reproduction in fish Proceedings of the Seventh International Symposium Tallinn Estonia May 12-15 2003 EPA Environmental Research Laboratory Athens Georgia USA (ed) R Gretchen and DW Michelle EPA600R-04049 pp 253-261
Semenza GL 2000 HIF-1 mediator of physiological and pathophysiological responses to hypoxia Journal of Applied Physiology 88 1474-1480
Semenza GL 2001 Hypoxia-inducible factor 1 oxygen homeostasis and disease pathophysiology Trends in Molecular Medicine 7 345-350
Val AL 2000 Organic phosphates in the red blood cells of fish Comparative Biochemistry and Physiology 125 417-435
Val AL B Wicks and DJ Randall 2002 Anemia and polycythanemia affect levels of ATP and GTP in fish red blood cells Proceedings of the Sixth International Symposium La Paz BCS Mexico 22-26 January 2001 EPA Environmental Research Laboratory Athens Georgia USA (ed) RV Thruston EPA600R-02097 pp 11-20
Wu RSS BS Zhou DJ Randall NYS Woo and PKS Lam 2003 Aquatic hypoxia is an endocrine disruptor and impairs fish reproduction Environmental Science and Technology 37 1137-1141
Zhou BS RSS Wu DJ Randall and PKS Lam 2001 Bioenergetics and RNADNA ratios in the common carp (Cyprinus carpio) under hypoxia Journal of Comparative Physiology B 171 49-57
10
POST-GENOMIC APPROACHES TO THE MECHANISMS OF HYPOXIA RESPONSE IN
THE COMMON CARP CYPRINUS CARPIO
EJ Fraser2 AY Gracey and AR Cossins
ABSTRACT
Hypoxia is an important environmental stressor for many fish species particularly in freshwater where it interacts with thermal stress The cyprinid fish in general and the common carp (Cyprinus carpio) in particular are resilient to hypoxia and some species can withstand anoxia for long periods of time We have explored large-scale responses to hypoxia in the common carp and interactions between temperature and hypoxia using transcript screening techniques Fish were subjected at either 17oC or 30oC to progressive reduction in PO2 down to 08mg O2l where they were held for up to 8 days Replicate fish were removed on days 0 1 3 5 and 8 and tissues rapidly dissected and stored for subsequent extraction of RNA In reference-based dual label experiments RNA was hybridised to ~700 carp cDNA microarrays comprising 13349 separate carp probes which were obtained from a series of cDNA libraries enriched for hypoxia- and thermally-responsive genes The resulting large-scale data set including gt5 fold biological replication has been analysed using the GeneSpringGeNET package and interpreted using the annotated gene lists provided by the EST-Ferret We have defined extensive lists of genes from the 5 different tissues that respond to hypoxia and whose hypoxia response is affected by temperature of exposure These lists have been assessed using advanced statistical techniques to identify patterns in expression that relate to underpinning biological responses to single and combined stressors
INTRODUCTION
Terrestrial mammals experience high levels of environmental oxygen and their tissues consequently have a restricted ability to withstand prolonged hypoxia Vascular pathologies in humans can cause tissue hypoxia and the limited resistance to hypoxia is the cause of major clinical conditions (Michiels 2004) including cerebral ischemia (stroke) myocardial ischemia and tumour angiogenesis By contrast freshwater organisms inhabit an environment where oxygen levels routinely fluctuate
sometimes profoundly and survival demands a degree of resistance to hypoxia Some species such as salmonids are highly sensitive and short periods of hypoxia can be lethal while others can survive several months of extreme hypoxia (common carp) and even anoxia (goldfish crucian carp bitterling) (Nilsson et al 1993) These hypoxia-resistant fish typically respond to declining oxygen levels through a tissue-specific reorganisation of energy metabolism which preserves ATP levels and thereby prolongs survival time During the initial stages of hypoxia a down-regulation of metabolism and shutdown of nonessential cell functions occurs (Hochachka et al 1996 Smith et al 1996) As the duration of exposure increases anaerobic ATP-producing pathways are up regulated coupled to a mobilisation of stored glycogen and a down-regulation of oxygen-dependent pathways
The common carp survives long periods of hypoxia by metabolic depression (Zhou et al 2000) cardiac depression (Stecyk and Farrell 2002) and increased blood oxygen affinity (Weber and Lykkeboe 1978) amongst other responses However the data are fragmentary and in some cases
2 School of Biological Sciences University of Liverpool Biosciences Building Crown Street Liverpool L69 7ZB UK
11
contradictory and the broader tissue-specificity and integration of these various response mechanisms has not been fully defined Moreover hypoxia sensitivity and the underpinning response mechanisms may be substantially modified by temperature since hypoxia tolerance is better expressed in the cold To date the underpinning mechanisms have generally been identified by the conventional process of
hypothesis-experiment-deduction This is most elegantly developed at the level of candidate gene whose role is inferred through physiology though the breadth of the understanding is necessarily restricted to the limited number of genes that can be investigated simultaneously New technologies developed recently within the context of genomic science now provides the means of exploring the expression of many thousands of genes simultaneously by means of massively parallel DNA sensors laid in arrays on a solid surface such as glass slides These so-called lsquomicroarraysrsquo not only offer breadth of analysis but also allow open screening of responses as a means of discovering novel responses and novel genes We have recently deployed this technique to show that cold has profound effects on many thousands of transcripts Moreover we were able to identify core responses that exist in all tissues as well as tissue-specific responses (Gracey et al 2004)
Here we describe preliminary attempts to use the microarray technique to investigate the mechanism of response to deep hypoxia in multiple tissues of the common carp We explore responses in liver at two different temperatures to uncover responses at different levels of stress
METHODS
Common carp (Cyprinus carpio L) were obtained commercially and held for 2 months at either 17plusmn05degC or 30plusmn05degC in large 2000-liter aquaria For hypoxic exposure the fish were transferred to 1000-liter tanks and pre-conditioned for 2 weeks Immediately prior to hypoxic exposure (Day 0) 5 fish were removed killed and liver brain kidney heart skeletal white muscle gill and intestinal mucosa were rapidly dissected and frozen on dry ice After this sampling the oxygen level was rapidly decreased over a 3 hr period until the oxygen level was maintained at 08 mglO2 (10 normoxia) Five replicate fish were sampled on days 1 3 5 and 8
Due to the absence of genomic resources for the common carp we prepared 14 full length directionally cloned cDNA libraries These were normalised (Carcini et al 2000) subtracted (Diatchenko et al 1996) and serially subtracted yielding 13349 clones 12960 clones were end sequenced and 9461 of which resulted in high quality reads These were assembled by 2 passes of CAP-3 using an in-house informatics package ESTndashFerret yielding 6806 singletons or subgroups Clones were identified by BLAST homology searching and functionally annotated using the Gene Ontology and KEGG databases The resulting data is presented in carpBASE a MySQL database that is available at httplegrlivacuk
We used amplicons of these 13349 clones to fabricate a high-density carp cDNA microarray on glass slides with an in-house modification to the surface chemistry Fluorescence-labelled target from the tissue samples and a common reference cDNA was hybridised to the array using standard techniques (wwwmicroarrayorg) and the images quantified to provide data files Thus for each sampling time we collected data from 5 replicate animals each being measured twice in each dye combination to address problems of dye bias and provide a technical replicate Data was analysed using the GeneSpring package (Agilent)
12
RESULTS
We have conducted two hypoxia exposure experiments one at 17degC and the other at 30degC Each consisted of a rapid reduction in oxygen tension to a sustained low level with sampling of replicate specimens at regular intervals for an 8-day period Tissue was archived at ndash80degC for subsequent analysis With microarray experiments one of the major considerations is the sheer volume of data Using 5 time points each with 5 tissues analyzed and 5 replicates gives rise to 125 different RNA samples each of which was analyzed twice both for the tissue sample and a common reference sample used for normalization purposes Together these experiments required over 700 arrays resulting in ~19000000 data points Raw data files were first subjected to a quality control procedure to interrogate the concordance of the technical replicates and then a normalised ratio was calculated by combining the expression data for each pair of fluor-reversed slides (Fang et al 2003) Visualization of the data was performed using the GeneSpring data analysis package We have sequence characterised most of the probes on the carp microarray identified the genes by BLAST homology searching and annotated each identified gene using the Gene Ontology and KEGG systems (see supplementary information with Gracey et al (2004))
Discerning biologically meaningful information from such large multi-dimensional data sets is difficult We have used Principal Components Analysis (PCA) an exploratory multivariant statistical technique for simplifying complex data sets (Basilevesky 1994) and to provide an overview of the main patterns in the data PCA reduces high dimensionality to a manageable number that can be displayed on orthogonal axis The final number of variables will seek to include as much variance as the original data set whilst remaining mutually uncorrelated In essence PCA gives us an overview of what is happening with the data without having to consider single genes The other advantage of PCA is that because it investigates movement within statistical space no biological bias is ascribed to the interpretation
Figure 1 illustrates the utility of PCA using the data from skeletal muscle The 1st and 2nd
components of PCA are shown which together account for 80 of the total variance in gene expression There is a clearer separation between temperature than over time For both temperatures there is movement across the two components although the degree of movement is greater for the fish held at 30degC than 17degC Finally the pattern of movement over time is very similar for the two temperatures Thus regardless of the water temperature the muscle responds to hypoxia in a similar manner though the degree of response appears different between the two temperatures PCA can also reveal patterns between all the tissues to provide overviews of conserved and differentiated responses as illustrated for cold exposure in Gracey et al (2004)
13
Figure 1 Principal component analysis of expression profiles from epaxial skeletal muscle of the common carp Data is shown for the experiments conducted at 17 and 30degC and for 1 3 5 and 8 days of hypoxia exposure We show the first two components only accounting for 80 of the variance in the entire dataset
A second method of analysing the large-scale data was to group the expression profiles using a hierarchical clustering technique This generates groups of genes that share patterns of response across treatment space each of which might constitute a regulated response to the treatment These clusters generate lists of genes that can be characterised by profiling the gene ontologies Alternatively data relating to a specific biological process can be selected from the full dataset and analysed separately Figure 2 shows the profiles of genes for all of the enzymes involved in the glycolytic pathway which is an important anaerobic metabolism pathway with liver glycogen the principal energy reserve for fish under hypoxic conditions (Zhou et al 2000) The mean data for the 5 replicate specimens was expressed for each day relative to day 0 with red panels indicating increased expression relative to day 0 and green indicating reduced expression
The expression profiles were similar for both the 17degC and 30degC fish with the strongest induction noted for fructose bisphosphate aldolase A amp B Discrepancies between the two temperatures are seen with hexokinase pyruvate kinase and glucose phosphate isomerase where a decrease in expression is seen at 17degC for the first two whilst an increase is seen at 30degC For glucose phosphate isomerase the reverse is seen Earlier studies have demonstrated that alterations in enzyme kinetics may be an adaptation to hypoxia (Zhou et al 2000) Although we are not examining enzyme activity in this study the lack of increased expression of phosphfructokinase (a major regulatory
14
enzyme for glycolysis) in the liver support work in the muscle of the common carp where a reduction in phoshpofructokinase activity was found indicating a decrease in responsiveness to allosteric control (Zhou et al 2000)
It should be noted that for certain genes there are multiple probes included on the array This provides a specific problem with regard to data analysis and visualisation One option is to average the information across copies and display each gene as a single expression profile However it is clear from Figure 2 that there are differences in the expression profiles between some replicate probes These differences may simply reflect noise or experimental error however there is always the possibility that they represent functionally distinct isoforms of the gene The common carp is a tetraploid species and is widely thought to have undergone genome duplication which has resulted in many gene isoforms This information would be lost if the data were to be averaged
DISCUSSION
Vertebrate genomes contain in excess of 20000 genes with many more transcripts but the microarray technique allows a large fraction of these to be quantified simultaneously We have shown that even for non-sequenced organisms it is possible for single laboratories to provide the cDNA clone resources and sequence annotation to furnish a high-density microarray composed of many thousands of gene probes Generating such large datasets produces downstream problems of analysis visualisation and interpretation though techniques for this are rapidly maturing We show here that the PCA technique can give a broad overview of the relationship between samples treatments taking the entire expression profile into account and this reveals important conclusions about the main sources of variation in profiles We also show that highly detailed information can be mined using selected lists of gene probes In Figure 2 which is a relatively small cluster of only 60 genes from a well-characterised pathway a complicated pattern emerges with peak expression levels differing over time and contradictory patterns between the two temperatures These issues are being addressed with constant improvement in pattern finding algorithms and the public accessibility of all microarray data
15
0 1 3 5 8 0 1 3 5 8 Time (Days)
GLUCOSE 17degC 30degC
HEXOKINAS
GLUCOSE 6-PHOSPHAT
GLUCOSE PHOSPHATE ISOMERASE
FRUCTOSE 6-PHOSPHAT
PHOSPHOFRUCT O
FRUCTOSE 16BISPHOSPHATE
FRUCTOSE BISPHOSPHATE
DIHYDROXYACETON E
TRIOSE PHOSPHATE ISOMERASE
GLYCERALDEHYD E
GLYCERALDEHYDE PHOSPHATE DEHYDROGENASE
13-BISPHOSPHO GLYCERATE
PHOSPHOGLYCERATE
3-PHOSPHO GLYCERAT
PHOSPHOGLYCERATE
2-PHOSPHO GLYCERAT
ENOLASE
PHOSHPOENO L
PYRUVATE KINASE
PYRUVAT
Figure 2 Expression profiles for the genes comprising the glycolytic pathway in liver tissue The pathway is indicated to the right with chemical intermediates and corresponding genes located next to panels representing expression of replicate probes each being identified by BLAST as that gene Expression values were calculated relative to the time zero value and increased levels are indicated in red and decreasing values in green Yellow indicates no change
It is important to recognise that microarray data relates to amount of transcript for a particular gene relative to a specified standard Whilst it reveals patterns of response in transcript amounts this does not necessarily correlate to changes in protein level or activity since regulation can be achieved
16
by adjustment at many hierarchical levels of organisation Confirming transcript response needs analysis using an alternative technique such as RT-PCR but demonstrating that transcript regulation is biologically meaningful requires analysis at the level of protein amounts and enzyme function
Despite these hurdles the power of microarray technology is evident The ability to examine thousands of genes across many tissues simultaneously helps to build an idea of whole animal responses to specific stimuli As well as investigating specific genes of interest the opportunity for novel roles for known genes is always present Finally microarray allows scientist working on non-model species to start investigating changes at the transcript level
ACKNOWLEDGEMENTS
This project was funded by the Natural Environment Research Council (UK) We thank Gregor Govan Margaret Hughes and Weizhong Li for assistance in the aquarium genomics and bioinformatics labs respectively
REFERENCES
Basilevsky A 1994 Statistical Factor Analysis and Related Methods Theory and Applications John Wiley amp Sons New York NY
Carcinci P Y Shibatat NK Hayatsu Y Sugahara and K Shibata 2000 Normalization and subtraction of cap-trapper-selected cDNAs to prepare full-length cDNA libraries for rapid discovery of new genes Genome Research 10 1617-1630
Diatchenko L YFC Lau AP Campbell A Chenchik F Moqadam B Huang S Lukyanov K Lukyanov N Gurskaya ED Sverdlov and PD Siebert 1996 Suppression subtractive hybridization A method for generating differentially regulated of tissue-specific cDAN probes and libraries Proceedings of the National Academy of Sciences of the United States of America 93 6025-6030
Fang Y A Brass DC Hoyle A Hayes A Bashein SG Oliver D Waddington and M Rattray 2003 A model-based analysis of microarray experimental error and normalisation Nucleic Acids Research 31 96
Gracey AY EJ Fraser W Li Y Fang RR Taylor J Rogers A Brass and AR Cossins 2004 Coping with cold An integrative multitissue analysis of the transcriptome of a poikilothermic vertebrate Proceedings of the National Academy of Sciences of the United States of America 101 16970-16975
Hochachka P W LT Buck CJ Doll and S C Land 1996 Unifying theory of hypoxia tolerance Molecularmetabolic defense and rescue mechanisms for surviving oxygen lack Proceedings of the National Academy of Sciences of the United States of America 93 9493-9498
Michiels C 2004 Physiological and Pathological Responses to Hypoxia American Journal of Pathology 164 1875-1882
17
Nilsson GE P Rosen and D Johansson 1993 Anoxic depression of spontaneous locomotor activity in crucian carp quantified by a computerized imaging technique Journal of Experimental Biology 180 153-157
Smith RW DF Houlihan GE Nilsson and JG Brechin 1996 Tissue-specific changes in protein synthesis rates in vivo during anoxia in crucian carp American Journal of Physiology 271897-904
Stecyk JAW and AP Farrell 2002 Cardiorespiratory responses of the common carp (Cyprinus carpio) to severe hypoxia at three acclimation temperatures Journal of Experimental Biology 205 759-768
Weber RE and G Lykkeboe 1978 Respiratory adaptations in carp blood influences of hypoxia red cell organic phosphates divalent cations and CO2 on haemoglobin-oxygen affinity Journal of Comparative Physiology 128 127-137
Zhou BS RSS Wu DJ Randall PKS Lam YK Ip and SF Chew 2000 Metabolic adjustments in the common carp during prolonged hypoxia Journal of Fish Biology 57 1160-1171
18
ISOLATION AND CHARACTERIZATION OF THE VEGF-A GENE OF GRASS CARP
Gallant KL Chan Helen OL Mok Patrick K S Ng Minnie M L Wong and Richard Y C Kong3
ABSTRACT
Vertebrates respond to reduced oxygen concentrations (hypoxia) in many different ways at the systemic local and cellular levels For example adaptations at the systemic level include an increase in ventilation and oxygen-transport capacity by increased erythropoiesis and at the cellular level survival of the individual cell under hypoxia is mediated by induction of glycolytic enzymes to facilitate anaerobic ATP production Local adaptation to hypoxia in tissues is facilitated by the induction of vascular endothelial growth factor (VEGF) which stimulates angiogenesis (or neovascularization) to improve tissue oxygenation The VEGF family consists of 5 members VEGF-A VEGF-B VEGF-C VEGF-D and placental growth factor (PlGF) VEGF-A is the predominant mitogen and plays a critical physiological role both in normal vascular development and response to hypoxic stress In this report we describe the isolation and characterization of the gcVEGF-A gene from grass carp In addition we also demonstrate by RT-PCR the presence of four distinct gcVEGF-A splice variants minus gcVEGF-121 gcVEGF-145 gcVEGF-189 and gcVEGF-206 ndash which are differentially expressed in different fish tissues response to hypoxia
INTRODUCTION
Vascular endothelial growth factor (VEGF-A) is a key regulator of angiogenesis and vascular permeability and upregulated expression of the VEGF-A gene by hypoxia is due to both transcriptional activation by HIF-1 and stabilization of the normally labile VEGF mRNA by various RNA-binding proteins (Levy et al 1996) In vivo VEGF expression is associated with embryonic physiological and pathological blood vessel growth (Breier et al 1992 Shweiki et al 1993 Miller et al 1994) In the adult VEGF is an important angiogenicmitogenic factor in various estrogen target tissues such as the placenta (Pepe and Albrecht 1999) pituitary (Ochoa et al 2000) testis (Rudolfsson et al 2004) ovary and uterus (Charnock-Jones et al 2002) and normal breast tissue (Nakamura et al 1999) In vertebrates several different isoforms of the VEGF protein minus VEGF-121 VEGF-145 VEGF-165 VEGF-189 and VEGF-206 minus are generated via alternative splicing of the VEGF-A gene (Tischer et al 1991) and which differ in angiogenic properties (Kuumlsters et al 2003) Numerous studies have demonstrated that estrogens increase VEGF expression in rodent and human uterine tissues (Hyder et al 2000) rat mammary tumors (Nakamura et al 1996) and human breast cancer cells (Ruohola et al 1999) evidently via the binding of estrogen receptors (ERs) α and β to the estrogen-responsive elements (EREs) of the VEGF-A gene (Hyder et al 2000 Mueller et al 2000) Moreover several studies have shown that hypoxia induces proteasome-dependent degradation of the ERα protein (Stoner et al 2002) in a manner similar to the arylhydrocarbon receptor (AhR)-mediated degradation
Department of Biology and Chemistry City University of Hong Kong Tat Chee Avenue Kowloon Tong Hong Kong Special Administrative Region China
19
3
of ERα that is known to be associated with the anti-estrogenic activities of various AhR agonists (Wormke et al 2003) whereby proteasome-dependent degradation of ERα were accompanied by downregulated expression of estrogen-responsive genes Recent studies have shown that hypoxia not only causes reproductive impairment in the common carp via disruptive changes in endocrine function gonadal development gamete quality fertilization success and larval survivorship (Wu et al 2003) but sublethal levels of hypoxia can also produce teratogenic effects as well as delay embryonic development in the zebrafish (Shang and Wu 2004)
To date the molecular mechanisms by which VEGF proteins regulate reproductive functions in vertebrates are still poorly understood Based on information in mammalian systems on the effects of hypoxia on VEGF-A and the possible regulatory roles of the different VEGF-A isoforms in reproductive tissues it is conceivable that the suppressive effects of hypoxia on reproductive fitness in fish may be mediated by changes in the regulation and expression pattern of the VEGF-A mRNA andor proteins in gonadal tissues of fish Although various VEGF-A spliced variants have been cloned and characterized in zebrafish (Liang et al 2001 Gong et al 2004) VEGF expression in reproductive tissues of fish under normal physiological conditions or pathological expression of VEGF in response to sublethal levels of hypoxia have not been described Due to the diverse biological activities of VEGF isoforms and the capacity of VEGF to recruit pleiotropic signaling pathways in various cellular systems (Ferrara 2004) it is conceivable that a specific VEGF isoform or combinations of different isoforms may be enrolled in distinct physiological and pathological processes On this premise it is suggested that changes in VEGF expression (and splicing) patterns may play a role in hypoxia-induced endocrine disruption leading to reproductive impairment in fish As a first step to better understand the role of VEGF-A as a possible mediator of these functions in fish we have isolated and characterized the gcVEGF-A genomic gene and several gcVEGF-A spliced variants from the hypoxia-tolerant grass carp
MATERIALS AND METHODS Treatment of samples
Grass carp Ctenopharyngodon idellus weighing around 500g were obtained from a commercial hatchery and acclimated in 300 L fiberglass tanks with circulating filtered and well-aerated tap water at 20 ordmC for 1 week prior to experimentation Fish were fed daily with lettuce that amounted to asymp 1 of body weight Fish were then divided into two groups one group was reared under normoxia (70 plusmn 02 mg O2L) and the other under hypoxia (05 plusmn 03 mg O2L) in a continuous flow system described by Zhang et al (2003) The levels of dissolved oxygen were monitored continuously using an YSI Model 580 dissolved oxygen meter After the exposure period fish were anaesthetized by immersion in 2-phenoxyethanol (005 vv) for 5 min and killed by a blow to the head Tissues were then dissected out and snap-frozen in liquid nitrogen and stored at ndash80 ordmC
Reverse transcriptionndashpolymerase chain reaction
Total RNA was isolated using the TRIzol Reagent (Invitrogen USA) according to the manufacturerrsquos instructions One microgram of total RNA was annealed to Oligo (dT)12ndash18 primer at 65ordmC for 15 min and immediately chilled on ice First-strand complementary DNA was synthesized using a reverse transcription (RT) mixture (20 μl) containing 200 units of Superscript reverse transcriptase (Invitrogen USA) 01 M dithiothreitol 05 mM deoxynucleotide triphosphates (dNTPs) 10 units of ribonuclease inhibitor (Invitrogen USA) and 1x first-strand cDNA synthesis buffer and incubated for 1 h at 42ordmC Polymerase chain reaction (PCR) was performed in a PTC 200 Thermal
20
Cycler (MJ Research USA) using a PCR reaction mixture (50 μl) containing 5 μl of cDNA 1 μl of each primer 1x PCR reaction buffer 1 μl dNTPs and 03 μl Supertherm Taq polymerase The protocol included a 10-min preincubation at 94ordmC followed by 40 cycles of 1 min at 94ordmC (denaturation) 1 min at 60ordmC (primer annealing) and 1 min at 72ordmC (extension) PCR products (5 microl) were separated on 1 agarose gels using 100-bp DNA ladder as standard (Invitrogen USA) Gels were stained in 01 ethidium bromide and the DNA visualized using the GelDoc 1000 system (BioRad USA)
Total RNA (40μg) from fish tissues was reverse-transcribed using Supercript II RNase H- reverse transcriptase (Invitrogen) 450 ng of the total RT product (from each organ) were used as templates for PCR amplification and 28S-F and 28S-R primers were used to amplify the 28S rDNA (115 bp) from the same template for control The 30-cycle amplification profile consisted of 95degC for 30 s 63degC for 30 s and 63degC for 2 min
DNA sequencing and BLAST analysis
PCR products were cloned into pGEM-T (Promega) or pUC18 (Amersham Biosciences) vectors for DNA sequencing Plasmid DNA was purified using the Miniprep Concert kit (Invitrogen) and nucleotide sequences were determined in an automated DNA Sequencer (ABI 377 Applied Biosystems) using the BigDye cycle sequencing kit (Applied Biosystems) Homology searches were performed using the online BLAST programs at the National Center for Biotechnology Information (httpwwwncbinlmnih govBLAST)
Genome Walking
Genomic DNA of grass carp was extracted and digested separately with four different restriction enzymes (DraI EcoRV PvuII and StuI) Fully-digested DNA was purified by phenol chloroform and ligated to GenomeWalker adaptors (provided in the universal GenomeWalker kit Clontech) The amplification profile consisted of 7 cycles of 94degC for 25 s and 72degC for 3 min 32 cycles of 94degC for 25 s and 67degC for 3 min followed by a 10-min incubation at 67degC DNA products were cloned into pGEM-T Easy vector (Promega Corp USA) for DNA sequencing
Random Amplification of cDNA Ends (RACE) by PCR
The start and termination sites of gene transcripts were determined by 5prime-RACE (Roche) and 3prime-RACE PCR (3prime-RACE System Invitrogen) respectively according to the instructions provided in the kits Total RNA from the kidney of grass carp exposed to 4 h hypoxia was used as template for first-strand cDNA synthesis The amplification profile consisted of 94degC for 2 mins 35 cycles at 94degC for 30 s 62degC for 30 s and 72degC for 2 min followed by a 10-min incubation at 72degC DNA products were cloned into pGEM-T Easy vector (Promega) for sequencing
21
RESULTS AND DISCUSSION
In our laboratory a 355-bp VEGF-A cDNA fragment was previously obtained by Zhang (2002) from grass carp by reverse-transcription-PCR (RT-PCR) using VEGF-specific primers directed at conserved sequences derived from multiple alignment of VEGF-A genes from different sources Blast search showed that the DNA fragment shares high sequence identity with the VEGF-A gene of zebrafish (93) quail (84) chicken (84) and human (80) In an attempt to obtain the full length gcVEGF-A cDNA from grass carp Rapid Amplification of cDNA Ends (RACE)-PCR was performed to obtain additional sequences at the 5prime- and 3prime-ends of the 355-bp gcVEGF-A cDNA fragment (which is designated here as GV-1) However only 3prime-RACE successfully extended the sequence information at the 3prime-end of GV-1 Therefore nucleotide sequences at the 5rsquo-end of GV-1 were obtained by means of genome-walking Several primers were designed based on the GV-1 sequence for this purpose and were tested on DraI EcoRV PvuII and StuI ldquorestrictionrdquo genomic libraries prepared from grass carp genomic DNA according to instructions in the Genome-Walker kit (Clontech) Several PCR-amplified bands were obtained from the libraries but only the 1081-bp genomic fragment from the DraI library was found to contain VEGF-like sequences Computer analysis showed that a 197-bp exon that shares high sequence identity (85) with the exon 3 sequence of the mouse VEGF-A gene (accession number U41383) is contained in the genomic fragment To date all alternatively-spliced variants of the VEGF-A genes in vertebrates are known to contain sequences for exons 1-5 (Jin et al 2000 Mueller et al 2000 Gong et al 2004) On this premise primers based on the 197-bp ldquoexon 3rdquo sequence of the gcVEGF-A gene fragment were synthesized for 5prime-RACE
5prime- and 3prime-RACE of the gcVEGF-A cDNA
Two DNA fragments of 866 bp (VA2) and 1254 bp (VA1) were obtained by means of 3rsquo RACE (Figure 1) DNA sequencing and computer analysis showed that VA1 and VA2 each contains a polyadenylation site as well as 3rsquo-untranslated sequences that overlap with each other indicating that they encode for different gcVEGF-A transcripts with different polyadenylation sites Comparison of the VA1 and VA2 sequences from grass carp with the human VEGF-A isoforms indicated that VA1 and VA2 which lack both exon 6 and exon 7 sequences are likely derived from alternatively-spliced gcVEGF- since these exonic regions are known to be absent in mammalian VEGF-A121 isoforms (Jin et al 2000) However both VA1 and VA2 contain exon 8 sequences and the TGA stop codon In addition sequence analysis showed that a 675-bp and a 1081-bp 3prime-UTR is present in VA2 and VA1 respectively We next proceeded to carry out 5rsquo RACE and isolated a 362-bp 5prime-RACE product using gene-specific primers (data not shown) DNA sequencing of which confirmed the 5prime-RACE fragment contain exon 1-2 sequences of the gcVEGF-A gene and the ATG start codon Based on the collective sequence information of VA1 VA2 and the 5- and 3rsquo-RACE PCR products exon 1-8 sequences of the grass carp VEGF-A cDNA were assembled which corresponds to the gcVEGF-A206 isoform and the deduced amino acid sequence of which is shown in Figure 2
22
M 1 2
VA1 (1254 bp)
VA2 (866 bp)
Figure 1 3prime-RACE-PCR of grass carp VEGF-A M 100 bp ladder plus (Fermentus) lane 1 secondary RACE product and lane 2 primary RACE
product Total RNA from kidney of grass carp exposed to 4 h hypoxia was reverse transcribed into cDNA for RACE reactions After the ligation of an oligo d(T) adaptor primers 3rsquoVArace1 (1) and VAL1 (2) were used for PCR After 35 cycles of 94degC (30 s) 62degC (30 s) and 72degC (2 min) products were analyzed on 1 agarose
Deduced amino acid sequence of the gcVEGF-A206 isoform
The open reading frame of gcVEGF-A206 is 789 bp long and encodes a protein of 263 amino acids with a predicted molecular mass of 305 kDa and pI of 923 Similar to the mouse VEGF-A protein gcVEGF-A206 contains 8 highly-conserved cysteine residues six of these minus C (49) C (91) C (80) C (124) C (84) and C (126) minus are involved in intramolecular disulphide bonding while two minus C (74) and C (83) minus are involved in intermolecular disulphide bonding to facilitate VEGF-A dimerization All 8 cysteine residues are located in the peptide region encoded by exons 1 to 5 which are conserved in all vertebrate VEGF-A isoforms analyzed so far (Tischer et al 1991 Shima et al 1996)
23
M N F V V Y S I Q L F F A A P L H L S 19
Precursor
A V K A A H I P K E G G K S K N E V T P 39 U
59F F E V Y T K S A C K T R E L L V D I I
Q E Y P D E I E H T Y I P S C V V L M R times
C A G C C N D E A L E C V P T E T R N V times
T M E V M R V K Q R V S Q H N F Q L S F 119
99
79
T E H T K C E C R P K A E V K A K K E K 139
E P R V G R V K S R K R A R E G D T G D 159
L N A S A H L R S S R Y F A L S H W L Y 179
F R A V C L L F V I S L S L H L F V L I 199
F T L L A Q S P Q R R K Q P N H C E P C 219
S E R R K R L Y V Q D P L T C K C S C K 239
Y T Q L Q C K S R Q L E L N E R T C R C 259
E K P R 263
Figure 2 Deduced amino acid sequence of the grass carp VEGF-A206 isoform The grass carp VEGF-A206 deduced amino acid sequences are shown below The amino acid positions are indicated on the right The one-letter amino acid code is used and is as follows A alanine R arginine N asparagines D asparate C cysteine E glutamate Q glutamine G glycine H histidine I isoleucine L leucine K lysine M methionine F phenylalanine P Proline S serine T threonine W tryptophan Y tyrosine V valine stop codon Disulphide bridge sites (cysteine residues) are indicated by arrows Black arrows ( ) indicate sites for intra-chain disulphide linkages within each monomer open arrows (times) indicate sites for inter-chain disulphide linkages between monomers The glycosylation (asparagine N) site is indicated by an upright triangle (U) The precursor protein ofgcVEGF is boxed and labelled
The C-terminus of each isoform which is associated with VEGF-receptor binding may be different but the core protein structure including the conformation and dimerization domains are maintained
24
Detection and isolation of different gcVEGF-A isoforms by RT-PCR
In 1998 Liang et al (2001) reported two VEGF-A isoforms (VEGF-A121 and VEGF-A165) in zebrafish More recently several additional VEGF-A isoforms that show differential expression and distinct spatial distribution patterns were reported in the zebrafish (Gong et al 2004) To determine the number of VEGF-A isoforms that may potentially be expressed in grass carp total RNA from heart tissue of grass carp exposed to hypoxia for 4 h was used for reverse-transcription PCR (RT-PCR) with primers RTF1 and RTR1 These primers are directed at exon 3 and the 3prime-untranslated region (exon 8) of the gcVEGF-A206 cDNA respectively Four RT-PCR products (697 bp 829 bp 922 bp and 1055 bp in size) were obtained and were confirmed by DNA sequencing (and by sequence comparison to the different human VEGF-A isoforms) to encode four distinct gcVEGF-A isoforms which include gcVEGF-A121 gcVEGF-A145 gcVEGF-A189 and gcVEGF-A206 (Figure 3)
Genomic organization and promoter structure of the gcVEGF-A gene
Based on sequence information of the gcVEGF-A206 cDNA the number and size of introns in the gcVEGF-A gene were determined by PCR amplification of grass carp genomic DNA using primers directed at adjacent exons Numerous primer pairs were designed for this purpose and the genomic PCR products obtained from the different reactions (which ranged between ~100 bp to ~35 kb in size) were sequenced and assembled Computer analysis indicated that the gcVEGF-A gene spans ~ 13 kb of nucleotide sequence and consists of 8 exons and 7 introns (Figure 3) Thus it has a very similar structure to the VEGF-A genes of human mouse and zebrafish (Tischer et al 1991 Shima et al 1996 Gong et al 2004) By means of genome walking ca 2-kb of 5prime-flanking sequence upstream of the transcription start site was determined and analyzed by computer for putative transcription factor-binding sites Seven AP1 and HBS (HIF-binding sites) are located at various positions in the 2-kb stretch of 5prime-flanking sequence (data not shown) which may be involved in molecular responses to hypoxia as in the human VEGF-A gene (Salnikow et al 2002) Interestingly four estrogen-responsive elements (EREs) are detected at several sites in the gcVEGF-A gene minus two in the 5prime-flanking sequence one in the 5prime-UTR and one in the 3prime-UTR a feature very similar to those reported in the human and mouse VEGF-A genes (Hyder et al 2000 Mueller et al 2000) This observation suggests that gcVEGF-A expression in grass carp is possibly also regulated by estrogen or estrogen-like compounds in a manner similar to those in mammals (Ochoa et al 2000 Long et al 2001)
25
2
~13 kb
8Exon 1 2 3 4 5 6 7
ATG TGA
gcVEGF-A
438 675Size (bp) 4 gcVEGF 121 (VA2)
4
1 3 42 85
438 1081 gcVEGF 121 (VA1)
4
1 3 4 852
570
gcVEGF 165 1 3 4 8752
4 663
[AAAA]
[AAAA]
1081
[AAAA]
1081
gcVEGF 189
gcVEGF 206
[AAAA]
4 796 1081
[AAAA]
1 3 4 876A52
1 3 4 6A 6B52 87
Figure 3 Organization of grass carp VEGF-A gene The eight exons of the gcVEGF-A gene are shown as boxes Filled and open boxes indicate translated and untranslated regions respectively The position of the start (ATG) and stop (TAA) codons are indicated by inverted arrows (darr) The two putative polyadenylation sites (ATTAAA) are marked by upright arrows (uarr) The 5prime-untranslated region coding sequence and 3prime-untranslated region of each transcript are indicated
26
Concluding Remarks
VEGF-A is an important angiogenic molecule that not only stimulates new blood vessel formation but is also a potent regulator of vascular permeability (Dvorak et al 1995) In mammals numerous studies have demonstrated that steroid hormones control angiogenesis and vascular permeability both in vivo (Hyder et al 1996) and in primary cultures derived from the reproductive tract (Charnock-Jones et al 2002) These observations strongly suggest that VEGF-A may mediate certain actions of sex steroids and is likely to play a number of physiological and pathological roles in the regulation of reproductive functions While comparatively more information is available in mammalian systems on the potential regulatory roles of different VEGF-A isoforms in reproductive tissues similar information about the functions of VEGF-A in fish remains limited The isolation and characterization of different VEGF-A isoforms from the grass carp in this study will allow further investigations on the mechanisms by which sex steroids and their agonistsantagonists regulate VEGF-A expression and reproductive functions in fish
REFERENCES
Breier G U Albrecht S Sterrer and W Risau 1992 Expression of vascular endothelial growth factor during embryonic angiogenesis and endothelial cell differentiation Development 114 521-531
Charnock-Jones DS Y He and SK Smith 2002 Angiogenesis and vascular endothelial growth factor (VEGF) in reproduction New Angiotherapy 115-128
Dvorak HF LF Brown M Detmar and AM Dvorak 1995 Vascular permeability factorvascular endothelial growth factor microvascular hyperperbility and angiogenesis American Journal of Pathology 146 1029-1039
Dvorak HF 2002 Vascular permeability factorvascular endothelial growth factor a critical cytokine in tumor angiogenesis and a potential target for diagnosis and therapy Journal of Clinical Oncology 20 4368-4380
Ferrara N 2004 Vascular endothelial growth factor Basic science and clinical progress Endocrine Reviews 25 581-611
Gong B D Liang TG Chew and R Ge 2004 Characterization of the zebrafish vascular endothelial growth factor A gene comparison with vegf-A genes in mammals and Fugu Biochimica et Biophysica Acta 1676 33-40
Hyder S M Z Nawaz C Chiappetta and GM Stancel 2000 Detection of classical and atypical estrogen response elements in the untranslated regions of the rat VEGF gene Cancer Research 60 3183-3190
Hyder SM GM Stancel C Chiappetta L Murthy HL Boettger-Tong and S Makela 1996 Uterine expression of vascular endothelial growth factor is increased by estradiol and tamoxifen Cancer Research 56 3954-3960
27
Jin K L XO Mao T Nagayama PC Goldsmith and DA Greenberg 2000 Induction of vascular endothelial growth factor receptors and phosphatidylinositol 3-kinaseAkt signaling by global cerebral ischemia in the rat Neuroscience 99 577-585
Kuumlsters B MW Robert PW de Waal V Kiek C Maass A Heerschap JO Barentsz F Sweep DJ Ruiter and WPJ Leenders 2003 Differential effects of vascular endothelial growth factor A isoforms in a mouse brain metastasis model of human melanoma Cancer Research 63 5408-5413
Levy AP NS Levy and MA Goldberg 1996 Post-transcriptional regulation of vascular endothelial growth factor by hypoxia Journal of Biological Chemistry 271 2746-2753
Liang D JR Chang AJ Chin A Smith C Kelly ES Weinberg and RW Ge 2001 The role of vascular endothelial growth factor (VEGF) in vasculogenesis angiogenesis and hematopoiesis in zebrafish development Mechanisms of Development 108 29-43
Long X-H KA Burke RM Bigsby and KP Nephew 2001 Effects of the xenoestrogen bisphenol A on expression of vascular endothelial growth factor in the rat Experimental Biology and Medicine 226 477-483
Miller J W AP Adamis DT Shima PA DrsquoAmore RS Moulton MS OrsquoReilly J Folkman HF Dvorak LF Brown B Berse TK Yeo and KT Yeo 1994 Vascular endothelial growth factorvascular permeability factor is temporally and spatially correlated with ocular angiogenesis in a primate model American Journal of Pathology 145 574-584
Mueller M D et al 2000 Regulation of vascular endothelial growth factor (VEGF) gene transcription by estrogen receptors α and β Proceedings of the National Academy of Sciences USA 97 10972-10977
Pepe G and E Albrecht 1999 Regulation of functional differentiation of the placental villous syncytiotrophoblast by estrogen during primate pregnancy Steroids 64 624-627
Nakamura J A Savinvov Q Lu and A Brodie 1996 Estrogen regulates vascular endothelial growthpermeability factor expression in 712-dimethylbenz(a)anthracene-induced rat mammary tumors Endocrinology 137 5589-5596
Nakamura J Q Lu G Aberdeen E Albrecht and A Brodie 1999 The effect of estrogen on aromatase and vascular endothelial growth factor messenger ribonucleic acid in the normal non-human primate mammary gland Journal of Clinical Endocrinology and Metabolism 84 1432-1437
Ochoa A L et al 2000 Vascular endothelial growth factor in the rat pituitary differential distribution and regulation by estrogen Journal of Endocrinology 165 483-492
28
Rudolfsson S H P Wikstroem A Jonsson O Collin and A Bergh 2004 Hormonal regulation and functional role of vascular endothelial growth factor A in the rat testis Biology of Reproduction 70 340-347
Ruohola JK et al 1999 Vascular endothelial growth factors are differentially regulated by steroid hormones and antiestrogens in breast cancer cells Molecular and Cellular Endocrinology 149 29-40
Salnikow K T Kluz M Costa D Piquemal ZN Demidenko KP Xie and MV Blagosklonny 2002 The regulation of hypoxic genes by calcium involves c-JunAP-1 which cooperates with hypoxia-inducible factor 1 in response to hypoxia Molecular and Cellular Biology 22 1734-1741
Shang EHH and RSS Wu 2004 Aquatic hypoxia is a teratogen and affects embryonic development Environmental Science and Technology 38 4763-4767
Shima DT M Kuroki U Deutsch YS Ng AP Adamis and P DrsquoAmore 1996 The mouse gene for vascular endothelial growth factor Journal of Biological Chemistry 271 3877-3883
Shweiki D A Itin G Neufeld H Gitay-Goren and E Keshet 1993 Patterns of expression of vascular endothelial growth factor (VEGF) and VEGF receptors in mice suggest a role in hormonally regulated angiogenesis Journal of Clinical Investigation 91 2235-2243
Stoner M B Saville M Wormke D Dean R Burghardt and S Safe 2002 Hypoxia induces proteasome-dependent degradation of estrogen receptor α in ZR-75 breast cancer cells Molecular Endocrinology 16 2231-2242
Tischer E R Mitchell T Hartman M Silva D Gospodarowicz JC Fidddes and JA Abraham 1991 The human gene for vascular endothelial growth factor Multiple protein forms are encoded through alternative exon splicing Journal of Biological Chemistry 266 11947-11954
Wormke M M Stoner B Saville K Walker M Abdelrahim R Burghardt and S Safe 2003 The aryl hydrocarbon receptor mediates degradation of estrogen receptor α through activation of proteasomes Molecular and Cellular Biology 23 1843-1855
Wu RSS BS Zhou DJ Randall YS Norman and PKS Lam 2003 Aquatic hypoxia is an endocrine disruptor and impairs fish reproduction Environmental Science and Technology 37 1137-1141
Zhang Z P 2002 Molecular responses to hypoxia in the grass carp Ctenopharyngodon idellus PhD thesis City University of Hong Kong Hong Kong
Zhang ZP RSS Wu HOL Mok YL Wang WWKL Poon SH Cheng and RYC Kong 2003 Isolation characterization and expression analysis of a hypoxia-responsive glucose transporter gene from the grass carp Ctenopharyngodon idellus European Journal of Biochemistry 270 3010-3017
29
30
MOLECULAR STUDIES OF THE HIF TRANSCRIPTION FACTORS OF GRASS CARP
HW Law4 Richard YC Kong and Rudolf SS Wu
ABSTRACT
Widespread occurrence of aquatic hypoxia as a result of eutrophication and increasing organic pollution is a pressing global problem because of its adverse impact on aquatic life The hypoxia-inducible factor 1 (HIF-1) in vertebrates senses low oxygen levels and responds by switching on a number of genes such as EPO VEGF and GLUT to help the organism to adapt and survive So far three different HIF-α isoforms have been reported and implicated in diverse regulatory functions such as in oxygenenergy homeostasis apoptosis and reproduction Unlike mammals fish often have to contend with varying levels and periods of hypoxic stress in the aquatic environment and invariably respond by invoking a variety of protective responses (molecular physiological and behavioural) at sublethal levels of hypoxia However the type of responses that are initiated at various levels of hypoxia and how they are related to each other is not clear There is a paucity of information at the molecular level on HIF factors and their functional roles in fish In this report we describe the isolation of full-length cDNAs encoding three different HIF-α proteins minus gcHIF-1α gcHIF-2α and gcHIF-4α minus form the hypoxia-tolerant grass carp The basic features found in the gcHIF-αs and the pairwise comparison of the gcHIF-αs with other HIF-αs is also explained
INTRODUCTION
Aquatic hypoxia has been a pressing problem in recent decades because of its widespread occurrence and adverse impact on the aquatic environment Large scale hypoxiaanoxia events affecting thousands of km2 have been reported worldwide including North and South America Africa European seas Pacific and Indian Oceans and many coastal areas (Diaz and Rosenberg 1995 Wu 1999) Aquatic hypoxia is defined as dissolved oxygen (DO) levels between 0 mgl (anoxia) and 28 mgl (Diaz and Rosenberg 1995) Aquatic hypoxia is a natural phenomenon and is a consequence of anthropogenic activities for example eutrophication overstocking of fish and shellfish (Gundersen and Joslashrgensen 1990) Since oxygen availability in aquatic environments fluctuates greatly daily seasonally and spatially hypoxia has become one of the major environmental stresses that fish have to contend with in order to survive and they have evolved a variety of behavioral physiological and biochemical mechanisms to aid survival under hypoxia (Randall 1982 Storey 1988 Petersen and Petersen 1990) Hypoxia-inducible factor 1 (HIF-1) has been reported to be a master regulator of cellular and systemic oxygen homeostasis in mammals (Semenza 1999) and plays a crucial role in upregulating dozens of hypoxia-responsive genes at the transcriptional level to facilitate oxygen uptake or delivery and anaerobic energy production (Semenza 2000 Bracken et al 2003) More recently HIF-2 has been shown to play a more dominant role in erythropoiesis (Fine and Norman 2002) and angiogenesis (Takeda et al 2004) while HIF-3 appears to act as a negative regulator of HIF-mediated responses to hypoxia (Hara et al 2001)
To date there is a paucity of information at the molecular level on HIF factors and their functional
Department of Biology and Chemistry City University of Hong Kong Tat Chee Avenue Kowloon Hong Kong
31
4
roles in fish Although HIF-1α and HIF-2α have been reported respectively in rainbow trout (Soitamo et al 2001) and Atlantic killifish (Powell and Hahn 2002) the molecular mechanisms by which these factors regulate cellular and physiological responses to hypoxia andor other environmental stresses in fish have not been elucidated Unlike mammals fish often have to contend with varying levels and periods of hypoxic stress in the aquatic environment and already it is known that there is a wide range of chronic and protective responses to sublethal levels of hypoxia amongst different fish species Based on current knowledge about the HIF family of transcription factors in mammals it is conceivable that many of the hypoxic responses in fish are also likely to be mediated and regulated by HIF proteins It is of great interest to investigate the HIFs in fish to gain insights on the relationship between HIF functions and hypoxia tolerance in fish As a first step to investigate the mechanisms by which HIF proteins mediate different biological processes in the hypoxia-tolerant grass carp full-length cDNAs encoding different gcHIF-α and gcHIF-β (ARNT) proteins have been isolated in this study Here we report briefly the isolation and characterization of these basic helix loop helix (bHLH) proteins
MATERIALS AND METHODS
Experimental fish
Animal care and experiments were performed in accordance with the City University of Hong Kong animal care guidelines Grass carp Ctenopharyngodon idella with a weight of around 500 g were obtained from a commercial hatchery in Panyu Guangdong PRC and acclimatized in 400-L freshwater in fiberglass tanks with circulating filtered and well-aerated tap water at 20 degC for 1 week prior to experimentation
Hypoxic system for fish
A continuous flow system (modified from Zhou et al 2000) was set up for constant dissolved oxygen for hypoxia exposure of fish (Figure 1) The system consisted of a 400-L fiberglass holding tank an oxygen stripping column a filter unit a cylinder of compressed N2 gas and a dissolved oxygen meter Water in fish tank was pumped to filter unit composing of filtering wool and activated charcoal N2 was bubbled into the stripping column at the bottom while filtered water was applied at the top Deoxygenated water flew back to holding tank Dissolved oxygen was continuously monitored by an YSI Model 580 dissolved oxygen meter at DO 05plusmn03 mgL by controlling N2 flow rate to oxygen stripping column Control group was maintained at DO 70plusmn02 mgL in fiberglass holding tank with continuously filtered water Water was kept at 20plusmn1degC and the holding tanks were subjected to 12 L 12 D cycle
Cloning of HIF-α and ARNT cDNAs in grass carp
Grass carps were exposed to normoxia (DO 70plusmn02 mgL) and hypoxia (DO 05plusmn03 mgL) for 4 h After the exposure period fish were anesthetized and tissues were dissected out and snap-frozen in liquid nitrogen stored at minus80degC until ready to be processed Total RNA was isolated from the tissues by Trizol reagent (Invitrogen) according to the manufacturerrsquos instructions RNA concentration was determined by spectrophotometry using the GeneQuant II RNADNA Calculator (Amersham Biosciences) at λ260
32
N2 gas
O2 meter
Filter
Figure 1 Schematic diagram showing a continuous flow system for hypoxia exposure of grass carp Water in the fish holding tank is pumped and filtered through filtering wool and a bed of activated charcoal and gravel for removal of solid particles and ammonia waste Filtered water then passes through an oxygen stripping column where N2 gas is bubbled at the bottom through a gas stone in which efficiency of stripping is increased by opposite flow direction of N2 gas to water as well as enlarged contact surface area of the gas bubble and water on the engraved bio-balls Holding tank is replenished with the filtered and deoxygenated water in which a gentle current is created and dissolved oxygen is monitored at 05plusmn03 mgL by an YSI Model 580 dissolved oxygen meter and manual control of the N2 gas flow rate to the oxygen stripping column Water flow and gas flow are represented by solid line and broken line respectively while direction of flow is denoted by arrows
DNase I-treated total RNA from kidney of 4 h hypoxically stressed fish was used for reverse transcription First-strand cDNA was synthesized from 1 μg total RNA with Superscript II RNase H-
Reverse Transcriptase (GibcoBRL) using Oligo (dT)12-18 primer PCR amplifications were performed with 10 different combinations of degenerate forward and reverse primers Amplification products were analysed by agarose gel electrophoresis purified from gel and cloned into plasmid vectors for DNA sequencing To obtain the 5prime- and 3prime-ends of the grass carp HIF-α and ARNT cDNAs 5prime- and 3prime-RACE were performed using the Marathon cDNA Amplification Kit (Clontech) with modifications 5prime- and 3prime-RACE PCR products were cloned into plasmid vectors for DNA sequencing
Multiple alignment of nucleotide and deduced amino acid sequences of HIF-1α genes from selected organisms (Table 1) were performed by using Clustal W Conserved regions in the multiple sequence alignments were identified both manually and by the use of the BOXSHADE program PCR primers with a degeneracy of less than 100 were designed based on the conserved regions
33
Table 1 HIF-1α nucleotide and deduced protein sequences from selected organisms that were used for multiple sequence alignment
Species GenBank accession number Oncorhynchus mykiss AF304864 Danio rerio (unpublished sequence kindly provided by Dr SH
Cheng City University of Hong Kong) Homo sapiens NM_001530 Mus musculus NM_010431 Rattus norvegicus Y09507 Bos taurus AB018398 Gallus gallus AB013746 Xenopus laevis AJ277829
RESULTS AND DISCUSSION
Degenerate primers directed at highly- conserved regions of the HIF-1αs from different vertebrate species were used in reverse transcription-PCR on total RNA from hypoxic grass carp kidney Based on DNA sequence analysis partial cDNA clones encoding three distinct grass carp HIF-αs minus gcHIF-1α gcHIF-2α and gcHIF-4α minus were isolated Using primers directed at two conserved regions of the zebrafish ARNT2b cDNA (GenBank Accession number AF219988) partial gcARNT2b and gcARNT2c cDNAs were also cloned Since the three partial gcHIF-α cDNAs and the two partial gcARNT cDNAs are incomplete at the 5prime- and 3prime-ends gene-specific nested primers (GSP) were designed for 5prime- and 3prime-RACE PCR in order to obtain the full-length cDNAs The nucleotide sequence information derived by 5prime- and 3prime-RACE was assembled to produce the full-length cDNA sequences for gcHIF-1α gcHIF-2α gcHIF-4α gcARNT2b and gcARNT2c The authenticity of the individual cDNAs was confirmed by full-length reverse transcription-PCR
Characterization of the gcHIF-α cDNAs
Computer analysis showed that gcHIF-1α (3848 bp in length) contains a 5prime-untranslated (UT) region of 257 bp a 3prime-UT region of 1238 bp and an open reading frame (ORF) of 2325 bp which encodes for a protein of 774 amino acids The gcHIF-2α cDNA (3195 bp in length) contains 5prime- and 3prime-UT regions of 263 bp and 424 bp respectively and an ORF of 2508 bp which encodes for a protein of 835 amino acids The gcHIF-4α (2092 bp in size) contains a 5prime-UT region of 102 bp a 3prime-UT region of 29 bp and an ORF of 1932 bp which encodes for a protein of 643 amino acids
Pairwise comparison of gcHIF-1α with selected HIF-α cDNAs from the GenBank database (Table 2) revealed that gcHIF-1α shares high sequence identity at the protein and nucleotide levels with the HIF-1αs of rainbow trout (68 72) human (64 63) and cow (65 62) while only moderate sequence identity (52minus57 at the nucleotide level) with the HIF-2α and HIF-3α paralogs was observed Homology search showed that gcHIF-2α shares high sequence identity with the killifish (69 at DNA 62 at amino acid) mammalian (64minus65 at DNA 57 at amino acid) and avian (63 at DNA 58 at amino acid) HIF-2α cDNAs
34
Table 2 Percentage sequence identities of the ORFs of gcHIF-αs to known HIF-α isoforms in the GenBank database Identity scores were derived using the GAP program of GCG softwares ldquoaardquo represents identity at amino acid level ldquontrdquo represents identity at nucleotide level
GenBank Species Size gcHIF-1α gcHIF-2α Accessio (amino gcHIF-4
n No acid) α aa nt aa nt aa nt
AF20848 Homo sapiens 826 64 63 44 51 41 51 7
NM_0104 Mus musculus 836 64 63 40 52 41 49 31
Y09507 Rattus norvegicus 825 64 64 43 53 42 52 AB01839 Bos taurus 823 65 62 44 65 42 53
8 AB01374 Gallus gallus 811 65 65 45 52 47 51
6 AJ277829 Xenopus laevis 805 57 62 40 53 43 54 AF30486 Oncorhynchus 766 68 72 44 59 44 56
4 mykissAY45026 Ctenopharyngodo 774 10 100 53 57 47 55
9 n idella 0
BC05133 Homo sapiens 870 53 57 57 64 44 56 8
NM_0101 Mus musculus 874 52 57 56 64 45 55 37
AJ277828 Rattus norvegicus 874 52 57 56 64 43 51 AB01839 Bos taurus 870 53 57 57 65 45 57
9 AF12981 Gallus gallus 868 50 57 59 64 46 53
3 AF21298 Coturnix coturnix 870 50 56 58 63 46 53
9 AF40278 Fundulus 873 52 56 62 69 46 53
2 heteroclitus AY57752 Ctenopharyngodo 835 53 57 10 100 46 55
4 n idella 0
AB05406 Homo sapiens 667 45 52 43 54 44 54 HIF-3 7 α AF06019 Mus musculus 662 44 52 43 54 47 53
4 AJ277827 Rattus norvegicus 662 44 52 42 55 46 53
HIF-4 AY45027 Ctenopharyngodo 643 47 55 46 55 10 100 α 0 n idella 0
HIF-1α
HIF-2α
Interestingly exceptionally high sequence identity (93) was observed in a 32-bp nucleotide stretch (nucleotide 71minus102) in the 5prime-UT region of gcHIF-2α which is highly conserved in the corresponding positions of the quail and human HIF-2α cDNAs In contrast to gcHIF-1α and gcHIF-2α gcHIF-4α shares almost equal sequence identity at the protein level with the HIF-1α -2α and -3α isoforms from various animal species For example a 40minus44 identity to the HIF-1αs 45 identity to the HIF-2αs and 45 identity to the HIF-3αs were observed which strongly suggests that gcHIF-4α encodes for a novel HIF-α isoform in grass carp The full-length gcHIF-1α gcHIF-2α and gcHIF-4α cDNA sequences have been deposited in GenBank under accession numbers AY450269
35
14
AY577524 and AY450270 respectively
With reference to the deduced amino acid sequence of human HIF-1α the characteristic domains typical of HIF-α proteins are present in all three gcHIF-αs proteins which include the basic helix-loop-helix (bHLH) domain Per-Sim-ARNT (PAS) -A and -B domains PAS-associated C-terminal domain (PAC) oxygen dependent degradation (ODD) domain and the N- and C-terminal transactivation domains (N-TAD and C-TAD) (Figure 2) These domains are known to have a specialized function for example bHLH PAS-A and -B and PAC are required for dimerization with ARNT molecules and DNA binding to target genes (Jiang et al 1996) ODD senses cellular oxygen tension and controls HIF-α protein stability (Jiang et al 1997) and the N-TAD and C-TAD regions are for transcriptional activation of HIF target genes (Jiang et al 1997)
bHLH PAS PAC N-TAD C-TAD
16 71 91 145 236 287 300 351 522 576 726 774
ODDA B gcHIF-1α
70 91 145 237 288 301 352 492 538 797 835
ODDA B gcHIF-2α
13 68 90 144 231 282 295 346 468 518
ODDBA gcHIF-4α
Figure 2 Comparison of homologous domains between the gcHIF-1α -2α and -4α proteins Each horizontal bar represents a gcHIF-α protein and the amino acid positions demarcating each structural domain are shown accordingly in the diagram The structural domains are shaded and drawn to scale
As depicted in Figure 2 both gcHIF-1α and gcHIF-2α contain all of the above structural domains typical of HIF-α while gcHIF-4α lacks a discernible C-TAD region minus no significant similarity between the C-terminal region of the putative gcHIF-4α protein and the C-TAD region from the known HIF-1α and -2α proteins could be detected The structural region of gcHIF-4α that mediates transcriptional activation therefore remains to be elucidated
36
Characterization of the gcARNT cDNAs
Computer analysis revealed that the gcARNT2b cDNA contains a 5prime-UT region of 128 bp and an ORF of 2214 bp which encodes for a 737-amino acid protein while the gcARNT2c cDNA is an alternatively-spliced variant differing from gcARNT2b in that the former has a 45-bp deletion in the ORF (nucleotide 318minus362 of gcARNT2b) The 45-bp deleted region encodes for a 15-amino acid peptide YDDDQIPGDKERYAR in the N-terminal half of the protein The putative gcARNT2b and gcARNT2c proteins were compared with the ARNT sequences from different species (available in the GenBank) and amongst them the zebrafish ARNT2b (AF219988) and zebrafish ARNT2c (AF219989) proteins share the highest amino acid sequence identity with gcARNT2b (94) and gcARNT2c (96) respectively The gcARNT2b and gcARNT2c sequences have been deposited in GenBank under accession numbers AY596921 and AY596922 respectively
CONCLUSIONS
In this study the full-length cDNAs of gcHIF-1α gcHIF-2α and the novel isoform gcHIF-4α have been cloned The sequence similarity of the grass carp proteins to mammalian and avian HIF-αs was examined by computer and gcHIF-4α was found to be a novel isoform sharing almost equal sequence identity with the three types of HIF-α proteins (HIF-1α HIF-2α and HIF-3α) that have been reported thus far in mammals Our studies also indicated that gcARNT2b and the alternatively spliced variant gcARNT2c are present in grass carp It will be interesting to investigate the dimerization affinities between the different gcHIF-αs and gcARNTs and the transactivation capacity and biological functions of the different HIF proteins in fish
ACKNOWLEDGEMENT
Funding for this study was supported partially by a Strategic Grant (Project No 7001415) and a Central Earmarked Research Grant (Project No CityU109401M) from the Research Grants Council of Hong Kong Special Administrative Region Peoplersquos Republic of China SHWL was supported by a City University of Hong Kong studentship
REFERENCES
Bracken CP ML Whitelaw and DL Peet 2003 The hypoxia-inducible factors key transcriptional regulators of hypoxia responses Cellular and Molecular Life Science 60 1376minus1393
Diaz RJ and R Rosenberg 1995 Marine benthic hypoxia a review of its ecological effects and the behavioral responses of benthic macrofauna In Oceanography and Marine Biology an Annual Review Volume 33 Ansell AD Gibson RN and Barnes M (eds) UCL Press London 245minus303
Fine LG and JT Norman 2002 The breathing kidney Journal of the American Society of Nephrology 13 1974minus1976
37
Gundersen JK and BB Joslashrgensen 1990 Microstructure of diffusive boundary layers and the oxygen uptake of the sea floor Nature 345 604minus607
Hara S J Hamada C Kobayashi Y Kondo and N Imura 2001 Expression and characterization of hypoxia-inducible factor (HIF)-3α in human kidney suppression of HIF-mediated gene expression by HIF-3α Biochemical and Biophysical Research Communications 287 808minus813
Jiang B E Rue GL Wang R Roe and GL Semenza 1996 Dimerization DNA binding and transactivation properties of hypoxia-inducible factor 1 Journal of Biological Chemistry 271 17771minus17778
Jiang B JZ Zheng SW Leung R Roe and GL Semenza 1997 Transactivation and inhibitory domains of hypoxia-inducible factor 1α Journal of Biological Chemistry 272 19253minus19260
Petersen JK and GI Petersen 1990 Tolerance behavior and oxygen consumption in the sand goby Pomatoschistus minutus (Pallas) exposed to hypoxia Journal of Fish Biology 37 921minus933
Powell WH and ME Hahn 2000 The evolution of aryl hydrocarbon signaling proteins diversity of ARNT isoforms among fish species Marine and Environmental Research 50 39minus44
Randall DJ 1982 The control of respiration and circulation in fish during exercise and hypoxia Journal of Experimental Biology 100 275minus288
Semenza GL 1999 Regulation of mammalian O2 homeostasis by Hypoxia-inducible Factor 1 Annual Review Cell and Developmental Biology 15 551minus578
Soitamo AJ CMI Raringbergh M Gassmann L Sistonen and M Nikinmaa 2001 Characterization of a hypoxia-inducible factor (HIF-1α) from rainbow trout Accumulation of protein occurs at normal venous oxygen tension Journal of Biological Chemistry 276 19699minus19705
Storey KB 1988 Suspended animation the molecular basis of metabolic depression Canadian Journal of Zoology 66 124minus132
Takeda N K Maemura Y Imai T Harada D Kawanami T Nojiri I Manabe and R Nagai 2004 Endothelial PAS domin protein 1 gene promotes angiogenesis through the transactivation of both vascular endothelial growth factor and its receptor fetal liver tyrosine kinase 1 Circulation Research 95 146minus153
Wu RSS 1999 Eutrophication water borne pathogens and xenobiotic compounds environmental risks and challenges Marine Pollution Bulletin 39 11minus22
Zhou BS RSS Wu DJ Randall PKS Lam YK Ip and SF Chew 2000 Metabolic adjustments in the common carp during prolonged hypoxia Journal of Fish Biology 57 1160minus1171
38
GENE EXPRESSION PROFILING OF RAW2647 CELL SURVIVAL AND APOPTOSIS UNDER OXIDATIVE STRESS
C C Fong5 Y Zhang MS Wong CH Tzang WP Lai and M Yang
ABSTRACT
Organisms living in an aerobic environment are continuously exposed to reactive oxygen species (ROS) ROS can induce apoptosis of cells and cells also develop negative feedback mechanisms to limit ROS induced cell death In this study we used cDNA microarray to investigate the molecular mechanism of survival and apoptosis of RAW 2647 cells under ROS The cells were treated with H2O2 and cDNA microarray assay was carried out to produce gene expression profiles We found that H2O2 treatment up-regulated stress survival and apoptosis related genes and down regulated growth and cell cycle promoting genes Metabolism related genes showed special expression pattern under oxidative stress glycolysis and lipid synthesis related gene were down-regulated whereas the genes of lipid catabolism and protein synthesis were up-regulated We also identified several signaling pathways as ROS sensitive pathways including p53 Akt NF-κB ERK JNK p38 PKC and INF-r They played important roles in the process of apoptosis or cell survival
INTRODUCTION
Organisms living in an aerobic environment are continuously exposed to reactive oxygen species (ROS) ROS including superoxide anion hydrogen peroxide singlet oxygen and hydroxy radical can raise from normal metabolism and pathological processes such as stress heat irradiation hyperoxia and any increases in metabolism including exercise injury and even repair processes and in wide variety of human disease including tumor AIDs Parkinsonrsquos Huntingtonrsquos (Finkle et al 2000 Chandra et al 2000 Fehrenbach and Northoff 2001) The roles of ROS in living cells have been studied for many years Direct treatment of cells with oxidants such as hydrogen peroxide (H2O2) was thought to exclusively cause necrosis but more recent studies have shown that under certain situations ROS can act as signaling molecules to trigger apoptosis and apoptosis not the only responses of living cells to ROS To different levels of ROS the spectrum of response ranges from proliferation to growth arrest to senescence and to cell death In addition cells also develop negative feedback mechanisms that involve the regulated expression of survival genes to limit the ability of ROS in inducing cell death in order to survive under oxidative stress (Carmody and Cotter 2001 Nishikawa et al 2000)
To understand how ROS act as signal transduction molecules people have investigated the regulation of gene expression and signal transduction pathways under ROS exposure Many genes and signal transduction pathways have been identified as ROS sensitive genes and pathways (Allen and Tresini 2000 Flohe et al 1997) However previous studies have been limited in that only a small number of genes can be examined for their response to ROS in each experiment by using traditional molecular and cell biological methods If people want to address ROS sensitive signal pathways
Department of Biology and Chemistry City University of Hong Kong Tat Chee Avenue Kowloon Hong Kong
39 5
especially the relationships among these pathways they have to use various small pieces of data collecting from different experiments even in different cell models to make the big pictures However this may cause some biases
In current study we used cDNA microarray combined with traditional molecular and cell biological methods to investigate the molecular mechanism of survival and apoptosis in H2O2 treated RAW 2647 cells a mouse monocytic-macrophage like cell line In the present study a number of ROS sensitivity genes and signaling pathways related to apoptosis and cell survival were identified A partial cellular signaling web on how ROS trigger apoptosis in H2O2 treated RAW 2647 cells and how the cells survive under oxidative stress has been culminated through analysis of the data from current study and other peoplersquos reports The signaling web provided insight into the molecular mechanism of apoptosis induced by ROS and feedback mechanisms that involve in cell survival
MATERIAL AND METHODS
Cell culture and cell viability assay
RAW 2647 cells (ATCC VA) were cultured in Dulbeccorsquos modified Eaglersquos medium (DMEM) (GIBCO BRL Caithersburg MD) supplement with 10 fetal bovine For cell viability assay 1times 104 RAW 2647 cells seeded in a 96 well cell culture plates were treated with H2O2 in DMEM at various concentrations from 125 times 10-5 to 120 times 10-3 molL for 30 or 60 min then H2O2 medium was replaced with fresh medium and the cells were cultured for 5hr followed by SRB assay
Cell cycle analysis and assessment of apoptosis by flow cytometry
Flow cytometry was used to analyze cell cycle and apoptosis Cells were treated with H2O2 in DMEM at dose of 0 05 075 and 1 pmolcell for 1 hr After removing the H2O2 medium the cells were cultured in fresh medium for overnight The cells were then harvested and stained by hypotonic propidium iodide (Sigma St Louis MO) solution Stained cells were analyzed by EPICS Elite ESP flow cytometry (Coulter Electronic USA) at excitation 488emmision 600 nm Data were analyzed by cycle distribution software ModFit LT version 20 (Verity Software House USA)
cDNA microarray analysis
RAW2647 cells were treated with H2O2 in DMEM at dose 1 pmolcell for 1 hr then continuously cultured in fresh medium for 24 hr meanwhile untreated cells as control They were harvested at 1 4 8 12 and 24 hours after H2O2 treatment TRIZOL reagent (Life Technologies Gaithersburg MD) was added to extract total RNA from the cultures according to the manufacturers instruction
40 μg of total RNA from control or treated cells was reverse-transcripted to cDNA in the presence of SuperScript II reverse transcriptase (Life Technologies CA) During the reaction two distinct fluorescent dyes Cy3-dUTP and Cy5-dUTP (Amersham Pharmacia Biotech NJ) were incorporated into the cDNA for the control and treated sample respectively The purified cDNA sample was mixed with a hybridization solution and applied to a home-made microarray which
40
presented 1000 genes selected from a mouse clone set provided from NIA including cell proliferation or cycle apoptosis metabolism transcription and signal transduction related genes To ensure the reproducibility of the microarray results each experiment was repeated with newly extracted total RNA samples
Microarray images were scanned with a confocal laser scanner (ScanArray 4000 GSI Lumonics MA) and the results were analyzed using ScanAnalyze program (Michael Eisen Standford University) Genes showing a greater than 2-fold induction or repression after normalization (Cy5Cy3 ratios above 2 or below 05) were selected for further analysis The cutoff value of 2-fold is conventionally used by other investigators (Quackenbush 2001) Clustering analysis was carried out by using Cluster software offered by Elseinrsquo lab (Standford University California USA)
Western blot analysis of phosphorylated p53 Akt and JNK
The cells were lysed in Nonidet P-40 buffer supplemented with NaF Na3VO4 and protease inhibitors (RocheBoehringer Mannheim Indianapolis USA) and subjected to western blot analysis with primary antibodies p-p53 p-Akt or p-JNK(Santa Cruz Biotechnology Inc)
Electrophoretic mobility shift assay (EMSA)
Nuclear proteins were isolated using method provided by CellDeathde And gel shift assay system (Promega) was used to perform EMSA according to manufacturerrsquos instruction Briefly nuclear extracts were incubated with a [γ- 32P] labeled oligonucleotide probe which contains the specific recognition sequence for NF-κB After binding the samples were separated on a non-denaturating PAGE gel and the bands were detected by autoradiography
RESULTS
The analysis of cellular viability cell cycle and apoptosis in H2O2 treated RAW2647 cells
The toxic dose of H2O2 varies with both the density of the cells and the cell types studied therefore we first evaluated the effects of cells density dose and time exposure of H2O2 on our current used RAW2647 cells Figure1 summarized the RAW 2647 cells viability treated with H2O2 for 30 or 60 min ranging from 125 times 10-5 to 120 times 10-3 molL After 30 and 60 minutes exposure maximum ratio of cell death was 25 and 50 respectively The purpose of our experiments is to study the mechanism of apoptosis and cell survival in RAW 2647 cells treated with H2O2 30 of cell death and 70 of cell survive are optimal ratios and was chosen for studying gene expression profiles The result of cell viability showed that 30 cell death was induced when the 1000 cells in 01 ml of DMEM were treated with H2O2 for 1 hr at concentration 100 μM which is equal to 1 pmolcell H2O2
Furthermore RAW 2647 cells treated with various H2O2 concentrations were analyzed by flow cytometer and result of cell cycle distribution analysis were summarized in Table 1 It was found that sub-G1 cells that were destined to enter apoptosis increased proportionally with increasing H2O2
41
concentrations and the percentage of G0G1 phase increased with the increasing H2O2 concentration and reached peak at 10 pmolcell oppositely S phase reduced significantly The concentration of 1 pmolcell H2O2 also induced G2M arrest slightly
Surv
ival
rate
()
120
100
80
60
40
20
0
H2O2 30min H2O2 60min
0 200 400 600 800 1000 1200
Dose of H2O2 (μM)
Fig 1 Cell viability assay RAW2647 cells were exposed to H2O2 in various concentrations for 30 and 60 minutes Cell viability was determined using SRB assay The toxic effect of 60 min H2O2 treatment is stronger than 30 min and the percentage of death cells caused by H2O2 treatment was time- and dose-dependent Results were obtained from three independent experiments and expressed as mean+sd
H2O2 concentration (pmolcell)
Distribution of cell cycle () (mean + sd)
G0G1 S G2M Sub-G1 000 5111plusmn212 3650 plusmn 385 1239plusmn102 091plusmn000 050 6745plusmn023 2157plusmn212 1098plusmn011 667plusmn085 075 7879plusmn158 902+134 1218plusmn023 1962plusmn385 100 8251plusmn236 086+006 1663plusmn155 2845plusmn269
Table 1 Flow cytometry analysis of H2O2 treated RAW2647 cells (Results were obtained from three independent experiments and expressed as mean plusmn sd)
Gene expression profiles of RAW2647 cells treated with H2O2 and functional cluster analysis
After critical data analysis genes with a ratio of Cy5Cy3 gt20 or lt05 at least at one time point among five were selected as genes that can be regulated by H2O2 After critical data analysis 113 genes were identified as redox-sensitivity genes They were divided into eight clusters including cell survival apoptosis cell cycle and proliferation metabolism signaling transcription proteasomes and cell structure based on functional analysis A hierarchical clustering algorithm was used to determine
42
C
the numbers of genes expression pattern in each functional group and then K means analysis was applied to produce trend lines that represent the gene expression patterns in each group as summarized in Figure 2A to 2H respectively The genes that show coordinated fluctuations in gene expression across 5 time points might have same regulatory mechanism
Heat shock protein 40 (HSPF1) 12
8 12
Heat shock protein 75 (Hsp75) 08 105-kDa heat shock protein (Hsp105) 04
Heat shock protein 65 (Hsp65) 0 1 4 24 Heat shock protein 86 kDa 1 (Hsp86-1) -04 Gly96 (Ier3) -08
-12 Fibrogen
Expr
essi
on le
vel
A
12 08 Metallothionein-I (MT-1) 04 Metallothionein 1L (MT-1L) 0 1 4 8 12 24 Metallothionein I-F (MT-1F)
-04 Inhibitor of apoptosis protein 1 -08
Time point of H2O2 treatment (hr)
B
02
0 -02
-04 -06
12 08
04
0
Cathepsin B (Ctsb)Cathepsin L (Ctsl)Cathepsin Z precursor (Ctsz)Cathepsin D (CtsD)
1 4 8 12 24 Tollinterleukin-1 receptor 8 (TIR8) Interleukin-1 receptor-associated kinase 2 (IRAK2)
4 8 12 24
12 08 04 0
-04 Kininogen cellular apoptosis susceptibility protein
Cathepsin C (CtsC) Tis11d Programmed cell death 6 (Pdcd6)
1 4 8 12 24 129Sv cystatin C (cst3) Interleukin enhancer binding factor 1 (ILF1)
Transformed mouse 3T3 cell double minute 2 (Mdm2)Retinoblastoma 1 (Rb1)Cyclin ICyclin GCyclin-dependent kinase inhibitor 3 (CDKN3)Cyclin ania-6a
1
Son cell proliferation protein (Son) Cell division cycle 5 (Cdc5) Retinoblastoma binding protein 7 (Rbbp7) Cyclin-dependent kinase 4 (Cdk4) Cyclin D1 Telomerase binding protein p23
-04
04 Kinesin-like 5 Kinesin-like 6
40
1 8 12 24 Bub3 -04 Signaling molecule SPEC1 beta
ATPase H+ transporting lysosomal I (Atp6i)Nuclear mitotic apparatus protein 1 (NUMA1)-08
Nucleolar phosphoprotein p130 Cyclin B Cyclin A2 (Ccna2) Mitogen-responsive 96 kDa phosphoprotein p96 Proliferation related acidic leucine rich protein ( PAL31) Interferon-inducible protein 9-27
-12
43
Aldolase 1(Aldo1)Phospholipase c neighboring (Png)Eno1High density lipoprotein binding protein (HDLBP)
08
04 Lactate dehydrogenase 1 A (Ldh1) 0 1 4 8 12 24 Disulfide isomerase (ERp59
-04 Fatty acid desaturase 1 (FADS1) Fatty acid synthase (Fasn) -08 Triosephosphate isomerase (Tpi)Transketolase (Tkt)Methylenetetrahydrofolate dehydrogenase (Mthfd1)Dkc1
D Stearoyl-Coenzyme A desaturase 2 (Scd2)
12 Lipoprotein lipase (Lpl) Malate dehydrogenase soluble (Mor2 Elongation factor 1-alpha (EF 1-alpha) Medium-chain acyl-CoA dehydrogenase (Acadm)
08
Ca2+-independent phospholipase A2Small intestine apolipoprotein B (Apobec 1)
04
Low density lipoprotein receptor related protein (Lrp) 1 4 8 12 24 Adipose differentiation-related protein (Adrp)
-04 RPL31 TLS-associated protein TASR-2 Glycyl-tRNA synthetase (Gars) Paired basic amino acid cleaving enzyme (Furin)
0
12 Intracellular signaling protein (Trip6) 08 04
0 1 4 8 12 24
-12
08 E 04
0
-04 -08 -12
12 08 04
0 -04 -08
08
0
-08
-16 F
04 0
-04 -08 -12
08 04 0 8
1 4 12 24 Proteasome (prosome macropain) 26S subunit ATPase 3 (Psmc3) -04 Proteasome (prosome macropain) subunit beta type 2 (Psmb2) -08 Protease (prosome macropain) 28 subunit alpha (Psme1) G -12
12 Proteasome (prosome macropain) subunit alpha type 4 (Psma4) 08 Proteasome (prosome macropain) subunit alpha type 2 (Psma2) 04 Proteasome beta-subunit C5 (Psmb1)
0 8 12 24 Proteasome (prosome macropain) activator subunit 2 (PA28 beta) 1 4 -04
Mitogen-activated protein kinase 6 (Mapk6)Mitogen inducible gene mig-2 (Mig-2)Ras 21 activatorp97 ATPase pseudogene (Vcp)MyD88 mRNA induced by interleukin-6 (Myd88)Thymoma viral proto-oncogene (Akt)
81 4 12 24 MAP kinaseErk kinase (Mek2) Partial Prkar1a gene for cAMP-dependent protein kinase COP9 (constitutive photomorphogenic) subunit 7a (Cops7a) Clathrin adaptor protein large beta 1 Clathrin adaptor protein medium 1
JNK-binding protein 1 (Jnkbp1-pending)Interferon (alpha and beta) receptor (Ifnar)
1 4 8 12 24 Interferon gamma receptor 2 (Ifngr2) Protein kinase C substrate 80K-H (Prkcsh)
p53 cellular tumor antigen Transcription factor Sp3 (Sp3)
1 4 8 12 24 Interleukin enhancer binding factor 3 (Ilf3)Adaptor protein complex AP-2 mu1 (Ap2m1)CCAATenhancer binding protein (Cebp)Ctbp1Synaptotagmin 11 (Syt11)
8 C-fos
1 4 12 24 E74-like factor 1 (Elf1) synaptotagmin 4 (Syt4) Histone deacetylase 1 (Hdac1) Nuclear receptor co-repressor 1 (Ncor1)
Proteasome (prosome macropain) 26S subunit non-ATPase 1 (Psmd1) Proteasome (prosome macropain) 26S subunit non-ATPase 8 (Psmd8)
44
Coronin actin-binding protein 1A (Coro1a)
1 4 8 12 24 Coronin actin binding protein 1B (Coro1b) SWISNF related matrix associated actin dependent regulator (Smarcc1)
H
-16 -08
0 08 16
Fig 2 Clustering analysis 113 of ROS sensitive genes were divided into 8 groups according totheir functions Hierarchical clustering and K means were used to analyze expression patterns ofthese genes (A) Cell survival related genes (B) Apoptosis related genes (C) Cell cycle relatedgenes (D) Metabolism related genes (E) Signaling molecules (F) Transcription related genes (G)Proteasomses (H) Structural proteins
The change of molecular activity in certain early response molecules in H2O2 treated RAW2647 cell
From gene expression profiles it was found that the expression of some signaling pathway related genes such as Akt p53 and others was regulated by ROS in H2O2 treated RAW2647 cells In order to get more information about signaling pathways which might be regulated by ROS the molecular activity of some important signaling molecules in H2O2 treated RAW2647 cell were further investigated
H2O2 up regulates the nuclear NF-κB activity in RAW2647 cell
Electrophoretic mobility shift assays were used to assess activation of NF-κB in RAW2647 cells as described before Our studies revealed an increase in NF-κB activation in RAW2647 cells at 30 and 60min after H2O2 treatment NF-κB activation had attenuated to the level observed in controls after 2h (Figure 3)
H2O2 induces the phosphorylation of p53 Akt and JNK
p53 is a transcriptional factor and its transcriptional activation function requires post-translational modification of the p53 protein via phosphorylation acetylation or glycosylation In this study the level of the phosphorylated p53 protein was examined using an antibody that specifically recognizes the phosphorylated serine 15 residue of p53 Western blot analysis of cell lysates prepared from H2O2-treated RAW2647 cells demonstrated the phosphorylation of p53 was induced at about 15 min after H2O2 treatment (Figure 4a) Like p53 the activation function of Akt and JNK requires phosphorylation Figure 5b and c shows Akt and JNK activation by H2O2 After RAW2647 cells were treated by H2O2 at concentration 1 pmolcell phosphorylation of Akt was detected at 15min (Figure 4b) whereas JNK at 30 min peaked at 1h and attenuated after 2h (Figure 4c)
45
Fig 3 Typical image for EMSA binding assays of nuclear NF-κB in H2O2 treated RAW2647 cells (1 pmolcell) (A) Lane1 H2O2 treatment for 0 hr lane 2 H2O2 treatment for 05 hr lane 3 H2O2 treatment for 1hr lane 4 H2O2 treatment for 2hr The activity of NF-κB peaked at 1hr and attenuated at 2hr (B) The bar chart represents the relative intensity of the samples Results were obtained from three independent experiments and expressed as mean+sd
A P-p53
0 15 30 60
B P-AKT
P-JNK C
0 15 30 60
0 15 30 60 120
H2O2 treatment time (minute)
Fig 4 Western blot analysis of phosphorylated p53 Akt and JNK Phosphorylation of p53 (A) and Akt (B) was detected in RAW2647 cells after 15 min of H2O2 treatment Phosphorylated JNK peaked at 1hr then attenuated at 2hr in H2O2 treated RAW2647 cells (C)
46
DISCUSSION
The responses of 2647 under oxidative stress and the roles of ROS sensitive protein families and signal pathways in these responses
In our study the major responses of RAW 2647 cells under oxidative stress (1 pmolcell of H2O2) are arresting growth processing apoptosis and fighting back for cell survival The change of metabolism is involved in all of the responses According to our investigation and other peoplersquos reports several ROS sensitive protein families and signal pathways plays played important roles in the responses of cells to oxidative stress They are heat shock proteins metallothioneins cathepsins cytokine and proteasomes families and p53 Akt NF-κB ERK JNK p38 PKC and INF-r pathways
ROS sensitive protein families
The heat shock protein family involve in regulating the folding transport and degradation of other cellular proteins The general function of heat-shock proteins is protecting cells from various cellular stressors such as hypoxia oxygen radicals endotoxin infections and fever [Morimoto and Santoro 1998 Beere and Green 2001] Under oxidative stress HSPs protect cell from apoptosis through stabilizing intracellular protein structures and suppressing caspase activation [Finkel et al 2000]
Metallothioneins (MTs) are intracellular low molecular and cysteine-rich proteins They have unique structural characteristics to give potent metal-binding and redox capabilities A primary role has not been identified Different types of stress including heavy toxic metals reactive oxygen species can cause a rapid and robust induction of metallothioneins (MT)-I and II In vitro and in vivo evidence shows that MTs have an antioxidant function MTs may suppress apoptosis through inhibiting p38 MAPK activation (Kang et al 2000)
In eukaryotes the ubiquitinproteasomes play a pivotal role in non-lysosomal degradation of intracellular protein In the periods of oxidative stress protein oxidation is significantly increased and become a threat to cell survival Oxidative damaged proteins appear to be removed by proteasomes through selective proteolysis (Hershko and Ciechanover 1998 Grune et al 1997) The ROS sensitive sub-units of proteasomes identified in our research might play major roles in degradation of oxidized proteins
In current study it was found that a group of actin related genes were regulated by ROS Actin is the major constituent of the cytoskeleton of almost all the eukaryotic cells Evidences have indicated that oxidative stress can cause non-muscle mammalian cells to undergo remarkable changes in their morphology and in the structure of the actin cytoskeleton (Dalle-Donne et al 2001) In this study ROS did not change the gene expression of actin but regulated the gene expression pattern in a group of actin-related molecules such as coronin an actin-binding protein and play a role in regulating the organization of actin cytoskeletal network that mediates cell morphology and proliferation (Asano et al 2001)
Cellular signaling pathways regulated by ROS
In our investigation it was found that the activity and gene expression of p53 quickly increased after H2O2 treatment ROS are potent activators of p53 [Martindale and Holbrook 2002] p53 is activated through signaling pathways that induce phosphorylation of p53 protein in response to stress
47
(Sakaguchi et al 1998) and selectively activates a different subset of target genes to regulate different cellular processes including apoptosis growth arrest DNA repair or cell differentiation (Hupp et al 1992) In our investigation active p53 mediated efficient G1 arrest through down-regulation of cyclin D1 and Cdk4 because Cdk4 and associated cyclin D control the G 1 to S phase transition (Ohtsubo and Roberts 1993 Ekholm and Reed 2000) p53 may cause slight G2M arrest by the decrease in gene expression of cyclin A2 and cyclin B1 because progression through G2 and M is regulated by different CDKs and their associated cyclin A and B (Lewin 1990) Active p53 also triggers the activation of genes related to apoptosis and leads to apoptosis (El-Deiry 1998) However p53 was tightly regulated by other molecules such as Mdm2 and cyclin G1 [Chen 2002] Cyclin I might be also included Mdm2 is a cellular proto-oncogene and negative cellular regulator of p53 which can abrogate p53-mediated G1 arrest and apoptosis and also accelerate cell cycle progression by independent way of p53 degradation (Argentini et al 2000) Our results indicated the possibility that p53 Mdm2 and cyclin G1 form an auto-regulatory feedback loop in which p53 positively regulates Mdm2 and cyclin G1 levels whereas Mdm2 and cyclin G1 negatively regulates p53 levels and activity (Figure 5) The accumulation of Mdm2 and cyclin G1 could be critical for cell survival
The second ROS sensitive pathway is NF-κB pathway In our study the activity of NF-κB increased after RAW 2647 cells were treated by H2O2 (Figure 3) A wide range of signals including ROS can induce activation of NF-κB NF-κB has been shown to exert protective effects under various conditions However NF-κB activity has also been correlated with apoptosis and the activation of apoptosis-associated genes such as Fas ligand and p53 Investigations examining the influence of NF-κB on cell survival following oxidant injury have likewise produced mixed findings (Flohe et al 1997)
Gen
e ex
pres
sion
(rat
ion
of H
2O2
treat
ed C
ontro
l)
4
4 8 12 16 20 24
Time course of H2O2 treatment (hr)
Cyclin G
3
2 Mdm2
1
p53
0
Fig 5 The Gene expression patterns of p53 Mdm2 and cyclin G1 under H2O2 treatment
In our investigation Akt was activated and its expression was up-regulated by ROS Recent studies have demonstrated that Akt regulates cell survival at multiple sites including preventing release of cytochrome c from mitochondria and inactivating forkhead transcription factors which was known to induce expression of pro-apoptotic factors such as Fas ligand phosphorylated and inactivated Bad and caspase9 and activated IκB kinase which is a positive regulator of NF-κB and results in transcription of anti-apoptotic genes (Testa et al 2001)
48
Evidence shows that PKC pathway is involved in both cell survival and apoptotic functions during oxidative stress (Martindale 2002) In our study we found that the expression of PKC substrate 80K-H (Prkcsh) was up-regulated which may suggest that PKC signaling pathway was also involved in the cellular response to ROS but it is not clear what roles PKC signaling pathway plays
The change of metabolism in H2O2 treated RAW 2647 cells
Under oxidative stress regulation of metabolism patterns is important not only for apoptosis but also for cell survival In this study we found the genes related to glycolysis and lipid synthesis were gradually down-regulated whereas the genes related to lipid catabolism and protein synthesis were gradually up-regulated in H2O2 treated RAW 2647 cells (Figure 2D) It was reported that oxidative stress can block glycolysis and the stress-induced block of glycolysis is not the result of a passive oxidative damage but rather an active cell reaction programmed for cell self-defense (Colussi et al 2000) According to our results the block of glycolysis could be the consequence of the depletion of intracellular NAD pools or of the inactivation of the glycolytic enzymes or the down-regulation of the glycolysis related genes However both apoptosis and cell survival are energy spending processes If intracellular ATP concentration is too low cells will switch from apoptosis to necrosis (Leist et al 1997) Our result suggests that when glycolysis was blocked H2O2 treated RAW 2647 cells may continuously process apoptosis or promote survival by using fatty acid as main source of ATP through up-regulation of fatty acid catabolism related genes to stabilizing the levels of intracellular ATP Consistent with the report by others activation of phospholipases particularly phospholipase A2 (PLA2) plays important role by destabilizing lysosomal and mitochondrial membranes in H2O2 treated cells (Zhao et al 2001)
In conclusion this study might help to understand the molecular mechanism of apoptosis induced by oxidative stress and the feedback mechanisms that involve cell survival
ACKNOWLEDGEMENTS
The work described in this paper was supported by the Areas of Excellent Scheme established under the University Grant Committee of the Hong Kong SAR Government (Project No AOEP-042004)
REFERENCES
Allen RG and M Tresini 2000 Oxidative stress and gene regulation Free Radic Biol Med 28 463ndash499
Argentini M N Barboule and B Wasylyk 2000 The contribution of the RING finger domain of Mdm2 to cell cycle progression Oncogene 19 3849-3857
Asano S M Mishima and E Nishida 2001 Coronin forms a stable dimer through its C-terminal coiled coil region an implicated role in its localization to cell periphery Genes to Cells 6 225-235
Beere HM and DR Green 2001 Stress management - heat shock protein-70 and the regulation of apoptosis Trends Cell Biol 11 6-10
49
Carmody RJ and TG Cotter 2001 Signalling apoptosis a radical approach Redox Rep 6 77-90
Chandra J A Samali and S Orrenius 2000 Triggering and modulation of apoptosis by oxidative stress Free Radic Biol Med 29 323-333
Chen X 2002 Cyclin G a regulator of the p53-Mdm2 network Dev Cell 2 518-519
Colussi C MC Albertini S Coppola S Rovidati F Galli and L Ghibelli 2000 H2O2-induced block of glycolysis as an active ADP-ribosylation reaction protecting cells from apoptosis FASEB J 14 2266-2276
Dalle-Donne I R Rossi A Milzani P Di Simplicio and R Colombo 2001 The actin cytoskeleton response to oxidants from small heat shock protein phosphorylation to changes in the redox state of actin itself Free Radic Biol Med 31 1624-1632
Ekholm SV and SI Reed 2001 Regulation of G (1) cyclin-dependent kinases in the mammalian cell cycle CurrOpin Cell Biol12 676-684
El-Deiry W 1998 Regulation of p53 downstream genes Semin Cancer Biol 8 345ndash357
Fehrenbach E H Northoff 2001 Free radicals exercise apoptosis and heat shock proteins Exerc Immunol Rev 7 66-89
Finkel T and NJ Holbrook 2000 Oxidants oxidative stress and the biology of ageing Nature 408 239-247
Flohe L R Brigelius-Flohe C Saliou MG Traber L Packer 1997 Redox regulation of NF-kappa B activation Free Radic Biol Med 22 1115ndash1118
Grune T T Reinheckel and KJ Davies 1997 Degradation of oxidized proteins in mammalian cells FASEB J 11 526-534
Hershko A and A Ciechanover 1998 The ubiquitin system Annu Rev Biochem 67 425-479
Hupp TR DW Meek CA Midgley and DP Lane 1992 Regulation of the specific DNA binding function of p53 Cell 71 875ndash886
Kang YJ ZX Zhou GW Wang A Buridi and JB Klein 2000 Suppression by metallothionein of doxorubicin-induced cardiomyocyte apoptosis through inhibition of p38 mitogen-activated protein kinases J Biol Chem 275 13690-13698
Leist M B Single AF Castoldi S Kuhnle and P Nicotera 1997 Intracellular adenosine triphosphate (ATP) concentration a switch in the decision between apoptosis and necrosis J Exp Med 185 1481-1486
Lewin B 1990 Driving the cell cycle M phase kinase its partners and substrates Cell 61 743-752
50
Martindale JL and NJ Holbrook 2002 Cellular response to oxidative stress signaling for suicide and survival J Cell Physiol 192 1-15
Morimoto RI and MG Santoro 1998 Stress-inducible responses and heat shock proteins new pharmacologic targets for cytoprotection Nat Biotechnol 16 833-838
Nishikawa T D Edelstein XL Du S Yamagishi T Matsumura Y Kaneda MA Yorek D Beebe PJ Oates HP Hammes I Giardino and M Brownlee 2000 Normalizing mitochondrial superoxide production blocks three pathways of hyperglycaemic damage Nature 404 787-790
Ohtsubo M and JM Roberts 1993 Cyclin-dependent regulation of G1 in mammalian fibroblasts Science 259 1908-1912
Quackenbush J 2001 Computational analysis of microarray data Nature 2 418-427
Sakaguchi K JE Herrera S Saito T Miki M Bustin A Vassilev CW Anderson and E Appella 1998 DNA damage activates p53 through a phosphorylationndashacetylation cascade Genes Dev 12 2831ndash2841
Testa JR and A Bellacosa 2001 AKT plays a central role in tumorigenesis Proc Natl Acad Sci U S A 98 10983-10985
Torres M and HJ Forman 2003 Redox signaling and the MAP kinase pathways Biofactors 17 287-296
Zhao M UT Brunk JW Eaton 2001 Delayed oxidant-induced cell death involves activation of phospholipase A2 FEBS Lett 509 399-404
51
52
EXTREME ADAPTATIONS TO HYPOXIA AND ANOXIA IN CRUCIAN CARP
Goumlran E Nilsson6
ABSTRACT
The crucian carp has the capacity to survive anoxia for days at room temperature and several months at temperatures close to 0degC The extreme respiratory cardiovascular and neurobiological adaptations employed by the crucian carp to tolerate anoxia are discussed
INTRODUCTION
The rule among vertebrates is that anoxia is synonymous with rapid death To study animals that deviate from a rule has again and again proven very useful not only for the understanding of how such animals work but also for shedding light on the mechanisms behind the rule - in this case the mechanisms behind anoxic damage Anoxia related diseases are the most common causes of death in the industrialized world
Figure 1 Anoxic survival time in ldquonormalrdquo vertebrates and in anoxia tolerant vertebrates Note that cold blooded vertebrates in general are as sensitive to anoxia as mammals if temperature is taken into account and that the anoxia-tolerant vertebrates survive anoxia about 1000 times longer than other
Department of Molecular Biosciences University of Oslo POBox 1041 NO-0316 Oslo Norway
53
6
vertebrates In general metabolic rate falls sharply with body temperature and a main reason why anoxia tolerant vertebrates survive anoxia longer at cold temperatures is that their glycogen stores last longer For anoxia-intolerant vertebrates a main benefit of low temperature is that it slows down the loss of ATP and the onset of degenerative processes (from Lutz and Nilsson 2003)
Few vertebrates have the ability to live without oxygen (anoxia) The crucian carp (No karuss Lat Carassius carassius) a common fish in Northern Europe and some North American freshwater turtles (genera Trachemys and Chrysemys) are the best studied examples of anoxia tolerant vertebrates (Lutz et al 2003 Nilsson and Lutz 2004) (Figure 1) Both the crucian carp and the turtles have evolved their anoxia tolerance to allow overwintering in ice-covered lakes streams and ponds However there are some striking differences in their responses to anoxia reflected by the fact that the crucian carp survives anoxia in an active state still swimming around while anoxic turtles are virtually comatose (Nilsson 2001)
Respiratory adaptations
Figure 2 Scanning electron micrographs of crucian carp gill filaments before during and after exposure to hypoxia Note the appearance of lamellae during hypoxia Scale bar = 50 microm From Sollid et al (2003)
The crucian carp is so far the only adult vertebrate known to be able to reversibly adjust the morphology of the respiratory organ to match its oxygen needs (Sollid et al 2003) (Figure 2) When the crucian carp is exposed to hypoxia it starts remodeling its gills within days resulting in a 7-8 fold increase the respiratory surface area and thereby boosting the ability to take up oxygen In normoxic crucian carp Sollid et al (2003) found that a cell mass situated outside the gill epithelium is filling up the space between the gill lamellae (the respiratory units of fish) The mitotic and apoptotic activity in this interlamellar cell mass (ILCM) was found to vary with ambient oxygen levels Thus in normoxic water mitosis was dominating causing ILCM to fill up the interlamellar space while in hypoxic water apoptosis prevailed and the ILCM nearly disappeared exposing the respiratory epithelium to the water
Even if the crucian carp can survive without any oxygen this is costly as it involves releasing an energy rich hydrocarbon (ethanol - the exotic anaerobic end product of this genus) to the water resulting in a depletion of the glycogen stores Thus getting access to oxygen is highly desirable from an energetic point of view and this is obviously what it strives to do in hypoxia by remodeling its gills On the other hand in well oxygenated waters it can apparently get all the oxygen it needs without having protruding lamellae so here the ILCM may function to reduce water and ion fluxes between blood and water thereby reducing osmoregulatory costs
54
Circulatory adaptations
Figure 3 The unique performance of the crucian carp heart and circulatory system during 5 days of anoxia in vivo (from Stecyk et al 2004)
Although we knew that crucian carp remains active in anoxia (Nilsson et al 1993b) it was surprising to find that it actually maintain heart work (cardiac output cardiac power output and heart rate) in anoxia (Stecyk et al 2004) (Figure 3) Thus crucian carp kept anoxic for 5 days show no signs of reduced cardiac work autonomic nervous control is maintained and systemic vascular resistance is untypically reduced No other vertebrates even come close to such a cardiac performance in anoxia Their hearts either stop working almost immediately or in a few cases cope with anoxia by slowing down to a few beats a minute (like in anoxia tolerant turtles) in combination with widespread systemic vasoconstriction and blunted autonomic control This finding immediately poses some very basic questions that need experimental attention the most important being why and how Moreover it obviously makes the crucian carp heart an attractive and unique model for studying adaptive anoxia-defense mechanisms in cardiac tissue bearing in mind that anoxic or ischemic heart conditions are major killers in humans Our present hypothesis is that crucian carp need to maintain cardiac output to shuttle its main glycolytic substrates and products glucose lactate and ethanol It may for example be that the crucian carp has to maintain heart work in anoxia to avoid ethanol intoxication as ethanol is the major anaerobic end product in this species
The brain
Because of its high energy demands the brain is generally the most anoxia sensitive organ During anoxia the oxidative phosphorylation by the respiratory chain stops and glycolysis becomes the only available route for ATP production Since every molecule of glucose yields less than 110th of the ATP produced by oxidative phosphorylation the energy (ATP) demand of the mammalian brain can not be met by glycolysis alone and there is a rapid fall in cellular ATP levels causing a slow down and eventually a stop in the NaK pump activity Ion-homeostasis is therefore lost and ions start running down their
2+concentration gradients After one or a few minutes a general depolarization of the brain occurs and Castarts flooding the cells At about the same time there is a release of excitatory neurotransmitters
2+ 2+particularly glutamate which speeds up the Ca inflow The increased levels of intracellular Ca triggers an array of degenerative processes that soon leads to neuronal damage and death These degenerative processes involves the degradation of DNA proteins and the cell membrane itself and besides glutamate
2+and Ca the key players in these events include lytic enzymes free radicals and nitric oxide (NO)
There is a vast literature on the mechanisms involved in anoxic brain damage in mammals but we have found that the important events of this anoxic catastrophe are probably common to most vertebrate
55
brains as judged from our experiments with rainbow trout Thus during anoxia the rainbow trout brain looses its ion-homeostasis and depolarises virtually as fast as the mammalian brain (when temperature differences are taken into account) (Nilsson et al 1993a) Moreover there is a release of glutamate as well as other amino acids in the anoxic rainbow trout brain (Hylland et al 1995) Due to the extended time frame during which these events occur at the low body temperature (15degC) of the rainbow trout we could in fact show that the release of glutamate proceeds rather than precedes the loss of ion homeostasis - a matter that has been difficult to resolve in experiments with mammals
So how can crucian carp and freshwater turtles avoid brain damage during anoxia From the result we have obtained so far we can conclude that a key to anoxic survival is a continued ability to match ATP consumption with ATP production in the absence of oxygen thereby avoiding energy failure and consequent neuronal depolarization
The glycolytic ATP production is supported by extra large glucose (glycogen) stores Indeed the only factor that appears to limit the crucian carps survival time is anoxia is a complete depletion of its main glycogen store in the liver (Nilsson 1990) It is possible that the unique ability of the genus Carassius to produce ethanol as the major end product of anaerobic metabolism (Shoubridge and Hochachka 1980) is the key adaptation allowing the crucian carp to maintain physical activity during anoxia (Nilsson et al 1993b Lutz and Nilsson 1997 Nilsson 2001 Nilsson and Lutz 2004) The turtles lack the ability to produce ethanol in anoxia and have to cope with very high lactate levels In both crucian carp and turtles there is a redistribution of blood flow to direct the glucose available to anoxia sensitive organs like the brain changes in which adenosine appears to play another key role (Nilsson et al 1994 Hylland et al 1994)This is accomplished by a rapid temporary increase in the rate of anaerobic glycolysis followed by a depression of energy needs termed metabolic depression Using microcalorimetry we have been able to show that isolated brain slices of crucian carp depress their metabolic rate and maintains their ATP levels during anoxia (Johansson et al 1995)
One mechanism employed by the crucian carp and turtles for depressing energy use in brain is the suppression of neurotransmission caused by release inhibitory neuromodulators like adenosine (Nilsson 1991 Nilsson and Lutz 1992) and inhibitory neurotransmitters such as gamma-amino butyric acid (GABA) (Nilsson 1990 1992 Nilsson et al 1990 1991 Nilsson and Lutz 1991) In 1986 Peter Hochachka suggested in a review article in Science (Hochachka 1986) that anoxia tolerance could be accomplished by a down regulation of the ion channel density andor activity of the cell membrane and termed this hypothetical phenomenon channel arrest The rationale for the hypothesis is that the cost for ion pumping will go down drastically if the membrane becomes less permeable to ions - ion pumping being the main energy consumer in the brain (Ericinska and Silver 1989) There is now substantial evidence for ldquochannel arrestrdquo in turtles (Doll et al 1993 Nilsson and Lutz 2004) For example Bickler (1992) used iodoacetate to block glycolysis in turtle cortical brain slices and found that the rate of Ca2+ inflow into the cells decreased dramatically if the slices were pre incubated in anoxia clearly suggesting an anoxia induced down regulation of Ca2+ permeability of the neuronal membrane However similar experiments on the crucian carp indicate that there is now down regulation of ion permeability in the neuronal membranes (Johansson and Nilsson 1995 Nilsson 2001) In light of the continuous physical activity displayed by the crucian carp in anoxia it is tempting to suggest that a down regulation of neuronal ion channels is a much too drastic measure for saving energy The anoxic crucian carp is probably relying more on a fine tuned down regulation of brain activity initiated by inhibitory neurotransmitters and modulators such as GABA and adenosine (Nilsson 1991 1992 Hylland and Nilsson 1999)
56
REFERENCES
Bickler PE 1992 Cerebral anoxia tolerance in turtles regulation of intracellular calcium and pH American Journal of Physiology 263 1298-1302
Doll CJ PW Hochachka and PB Reiner 1993 Reduced ionic conductance in turtle brain American Journal of Physiology 265 929-933
Erecinska M and IA Silver 1989 ATP and brain function Journal of Cerebral Blood Flow and Metabolism 9 2-19
Hochachka PW 1986 Defense strategies against hypoxia and hypothermia Science 231 234-241
Hylland P GE Nilsson and PL Lutz 1994 Time course of anoxia induced increase in cerebral blood flow rate in turtles evidence for a role of adenosine Journal of Cerebral Blood Flow and Metabolism 14 877-881
Hylland P GE Nilsson and D Johansson 1995 Anoxic brain failure in an ectothermic vertebrate +
release of amino acids and K in rainbow trout thalamus American Journal of Physiology 269 1077-1084
Hylland P and GE Nilsson 1999 Extracellular levels of amino acid neurotransmitters during anoxia and forced energy deficiency in crucian carp brain Brain Research 823 49-58
Johansson D and GE Nilsson 1995 Roles of energy status KATP channels and channel arrest in fish +
brain K gradient dissipation during anoxia Journal of Experimental Biology 198 2575-2580
Johansson D GE Nilsson and E Toumlrnblom 1995 Effects of anoxia on energy metabolism in crucian carp brain slices studied with microcalorimetry Journal of Experimental Biology 198 853-859
Lutz PL and GE Nilsson 1997 Contrasting strategies for anoxic brain survival - glycolysis up or down Journal of Experimental Biology 200 411-419
Lutz PL GE Nilsson and H Prentice 2003 In The Brain Without Oxygen 3rd Ed Kluwer Academic Publishers
Nilsson GE 1990 Long term anoxia in crucian carp changes in the levels of amino acid and monoamine neurotransmitters in the brain catecholamines in chromaffin tissue and liver glycogen Journal of Experimental Biology 150 295-320
Nilsson GE 1991 The adenosine receptor blocker aminophylline increases anoxic ethanol production in crucian carp American Journal of Physiology 261 1057-1060
Nilsson GE 1992 Evidence for a role of GABA in metabolic depression during anoxia in crucian carp (Carassius carassius L) Journal of Experimental Biology 164 243-259
Nilsson GE AA Alfaro and PL Lutz 1990 Changes in turtle brain neurotransmitters and related substances during anoxia American Journal of Physiology 259 376-384
57
Nilsson GE PL Lutz and TL Jackson 1991 Neurotransmitters and anoxic survival of the brain a comparison between anoxia-tolerant and anoxia-intolerant vertebrates Physiological Zoology 64 638-652
Nilsson GE and PL Lutz 1991 Release of inhibitory neurotransmitters in response to anoxia in turtle brain American Journal of Physiology 261 32-37
Nilsson GE and PL Lutz 1992 Adenosine release in the anoxic turtle brain a possible mechanism for anoxic survival Journal of Experimental Biology 162 345-351
Nilsson GE M Peacuterez-Pinzoacuten K Dimberg and S Winberg 1993a Brain sensitivity to anoxia in fish as reflected by changes in extracellular potassium-ion activity American Journal of Physiology 264 250-253
Nilsson GE P Roseacuten and D Johansson 1993b Anoxic depression of spontaneous locomotor activity in crucian carp quantified by a computerized imaging technique Journal of Experimental Biology 180 153-162
Nilsson GE P Hylland and CO Loumlfman 1994 Anoxia and adenosine induce increased cerebral blood flow rate in crucian carp American Journal of Physiology 267 590-595
Nilsson GE 2001 Surviving anoxia with the brain turned on News in Physiology Science 16 218-221
Nilsson GE and PL Lutz 2004 Anoxia tolerant brains Journal of Cerebral Blood Flow and Metabolism 24 475-486
Shoubridge EA and PW Hochachka 1980 Ethanol novel end product in vertebrate anaerobic metabolism Science 209 308-309
Sollid J P De Angelis K Gundersen and GE Nilsson 2003 Hypoxia induces adaptive and reversible gross-morphological changes in crucian carp gills Journal of Experimental Biology 206 3667-3673
Stecyk JAW K-O Stensloslashkken AP Farrell and GE Nilsson 2004 Maintained cardiac pumping in anoxic crucian carp Science 306 77-77
58
Suppressive Effects of Hypoxia on Male Rat Reproductive Function
Weigong Liao Yuqi Gao7 Mingchun Cai Jian Chen Yi Wu
ABSTRACT
Our objectives were to explore the effects of hypobaric hypoxia on the male rat reproductive function Adult male Wistar rats were randomly divided into four groups control group raised at sea level 5d 15d and 30d hypoxic groups raised in a hypobaric chamber stimulating 5000 m altitude for 5 days 15 days and 30 days respectively The spermatozoa density was found to decrease in 15d and 30d hypoxic groups compared with the control group (Plt001) Motilities of epididymal caudal spermatozoa decreased approximately by 50 in all of the three hypoxic groups (Plt001 compared with control group) Morphologically abnormal spermatozoa increased by more than 50 in all three hypoxic groups (Plt001 compared with control group) The LPC-induced AR was suppressed by about 60 in all three hypoxic groups (Plt001 compared with control group) Acrosin protease activity decreased significantly after exposure to hypoxia for 5 15 and 30 days (Plt001 compared with control group) Exposure to hypobaric hypoxia significantly reduced the tetraploid cell populations (approximately 28) compared with the control group (Plt001) After exposure to hypoxia for 30d the ratio of haploid and diploid cell populations was reduced by 25 when compared with control group (Plt005) Proliferation index of 15d and 30d hypoxic groups was significantly lower than that of the control group (Plt005) The apoptosis of spermatocytes and spermatogonia increased after exposure to hypoxia for 5d 15d and 30d Hypoxia caused testicular interstitial edema occasional necrosis and degenerative changes in testicular germ cells Hypobaric hypoxia suppresses the spermatozoa quantity and quality as well as inhibiting the acrosome reaction and acrosin protease activity of rat spermatozoa Hypobaric hypoxia inhibits the spermatogenesis in testis by decreasing the number of tetraploid spermatogenic cells (primary spermatocytes) The apoptosis of primary spermatocytes and spermatogonia occurring under hypoxic conditions may contribute to the loss of tetraploid cell populations
INTRODUCTION
A large number of studies have revealed that hypoxia causes changes of respiration and circulation and the composition of the blood Studies on the changes in the reproductive system caused by hypoxia are limited High altitude resident fertility rate is not lower than populations at sea level However newcomers from low areas seem to have reduced fertility at high altitude Cattle and other animals from sea level fail to reproduce (Eckes 1976) Previous studies indicated that hypoxia decreased the production of seminal sperm and caused morphologic changes of the germinal epithelium in rat (Gosney 1984) monkey (Saxena 1995) mouse sheep and man (Donald 1981) Little is known about which stages of spermatogenesis are affected by hypoxia and how does hypoxia affect them These questions should be answered Further in the previous studies spermatogenesis was evaluated only by carrying out histological analyses of testicular tissues In contrast the use of flow cytometry facilitates rapid and accurate quantitation of large numbers of testicular germ cells and it is widely accepted as an effective method of assessing spermatogenesis (Spano and Evenson 1993)
The acrosome reaction (AR) was believed to be a prerequisite that enables the spermatozoa to penetrate the zona pellucida (ZP) and fertilize the egg Acrosin probably aids spermatozoa penetration
Department of Pathophysiology and High Altitude Physiology Institute of High Altitude Third Military Medical University ChongQing 400038 PR China
59
7
by limited proteolysis of ZP glycoproteins Acrosin protease activity has also been involved in dissolution of the acrosomal matrix and in a regulated release of acrosomal contents at the time of the acrosome reaction (Hardy et al 1991) But no work has addressed the effect of hypoxia on spermatozoa acrosome reaction and acrosin protease activity
The present investigation was undertaken therefore to evaluate the effects of hypoxia on the spermatogenesis in rat testis by flow cytometry histological examination and TUNEL immunohistochemistry Acrosome reaction and acrosin protease activity of sperm in rat were also studied
MATERIALS AND METHODS
Animals
Adult male Wistar rats were randomly divided into four groups control group 5d 15d and 30d hypoxic group Hypoxic groups were maintained in a hypobaric chamber stimulating altitude 5000m The animals had free access to food and water with a controlled light dark cycle (12 and 12 h of light and dark respectively)
Determination of motility and viability of spermatozoa
Right cauda epididymises were excised from each animal and minced in 5 ml prewarmed saline Epididymal caudal spermatozoa were obtained by filtering through a mesh Then a 05 ml aliquot was removed from the epididymal caudal spermatozoa suspension and mixed with 1 ml saline prewarmed at 37degC A drop of the mixture was loaded on a slide and examined with a phase contrast microscope for the number of spermatozoa with progressive motility The number of progressively motile spermatozoa and motile spermatozoa was determined by counting spermatozoa exhibiting forward motion and any motion in a population of 100 cells respectively The procedure must be completed within 10 minutes Viability of spermatozoa was expressed as percentage of motile spermatozoa
Determination of the density of spermatozoa
A 05 ml aliquot was removed from the filtered epididymal caudal spermatozoa suspension and diluted with 2 ml saline Subsequently each diluted spermatozoa sample was loaded onto a hemocytometer and allowed to equilibrate for a few minutes prior to counting Four squares per hemocytometer chamber were counted in duplicate using phase contrast microscopy at a magnification of 200times Spermatozoa density was calculated by the following formula total number of spermatozoa in the epididymal caudal extract right epididymal caudal weight Duplicate values were averaged
Determination of abnormal spermatozoa
To assess the percentage of morphologically abnormal spermatozoa spermatozoa smears were prepared on clean glass slides and dried Smears were fixed by formaldehyde for 5 minutes and stained by 2 eosin for 2 hours One thousand spermatozoa per animal were screened and classified into normal and abnormal types Abnormal types included blunt hook-head banana-head amorphous-head two-tail coiled-tail and folded-tail (Wyrobek and Bruce 1975 Briz et al 1996)
Acrosome reaction examination (Hsu et al 1999)
Spermatozoa suspension preparation after sacrificing animals the right epididymal cauda was dissected from each rat and slashed in 2 ml human tubule fluid (HTF)-albumin buffer (40 gL bovine serum albumin) prewarmed at 37degC Spermatozoa suspension was obtained by filtering through mesh
60
A 110 dilution of spermatozoa was prepared and an epididymal spermatozoa count was done by hemocytometer The concentration of spermatozoa was adjusted to 1times106 cellsml for the assay of CTC fluorescence
Induction of acrosome reaction After 3 h preincubation at 37degC 10 microl stock LPC (Sigma) solution (4 mM in DMSO) was added to 200 microl spermatozoa suspension so that the final concentrations of LPC were 200 microM After incubation for 2 h the spermatozoa were examined by the chlortetracycline fluorescence assay
CTC fluorescence assay After 5 h of incubation at 37degC aliquots of cauda epididymal spermatozoa were taken for the CTC fluorescence assay The CTC fluorescence assay was used to study the status of the acrosome reaction in rat spermatozoa CTC (Sigma) was prepared freshly at a concentration of 15 mM in 20 mM Tris buffer containing 130 mM NaCl and 5 mM L-cysteine The pH was adjusted to 78 and the solution was shielded from light at room temperature Of the spermatozoa suspension 50 microl were mixed with 50 microl CTC solution in an Eppendorf tube After 30 s 8 microl of 125 (wv) paraforamaldehyde in 05 mM Tris buffer (pH 74) were added After mixing by gentle eddying 50 microl of 022 mM 14-diazabicyclo[222]octane in glycerol was introduced and mixed with the spermatozoa suspension to retard fading of fluorescence Fluorescence patterns of spermatozoa were analyzed on an Olympus BX-60 microscope (Tokyo Japan) equipped with phase-contrast and fluorescence optics The excitation beam was passed through a band-pass filter of 400ndash410 nm A volume of 5 microl spermatozoa suspension was placed on a slide and covered with a 22 mm times22 mm cover slip In each sample a total of 200 cells was assessed and classified as lsquoacrosome-reacted spermatozoarsquo with dark heads except for the tip which retained some fluorescence and lsquoincapacitated spermatozoarsquo with uniform bright fluorescence over the entire head
Determination of acrosin Proteolytic activity
Acrosin proteolytic activity of spermatozoa was determined using a gelatin substrate film assay Gelatin substrate film slides were prepared on one side of glass slides with a 34 gelatin solution Film slides were fixed in 005 glutaraldehyde for 2 minutes washed by acetic acid-sodium barbiturate buffer twice and dried in air for at least 1 hour Subsequently film was stained with 05 Trypan Blue
After centrifugation at 1000 rpm for 5 minutes and resuspended in PBS epididymal spermatozoa were spread on the surface of gelatin-coated slides and incubated at 37degC for 7 hours to allow proteolysis of the gelatin by acrosin Positive spermatozoa showing a clear halo around the spermatozoa head were counted in a population of 100 cells
Histopathological examination
Light microscopy Testes were fixed in 10 formalin dehydrated and embedded in paraffin Sections were cut at 5
microm thicknesses and stained with hematoxylin and eosin for light microscope observation
Electron microscopy Testes were sliced and fixed in 3 glutaraldehyde Ultra-thin sections were stained in uranyl
acetate and lead citrate and observed in a Phillips TECNAI 10 transmission electron microscope (TEM)
61
Flow cytometry
The germ cells were released from seminiferous tubules in phosphate buffered saline (PBS) by mincing the testes with fine scissors and digesting the testes with Collagenase (Sigma) at 37degC for 30 minutes The suspension was filtered through a nylon mesh twice and fixed in 70 chilled ethanol The samples were stored at 4degC The germ cells were stained with ethidium bromide (Sigma) The tubes were kept in the dark at room temperature for 30 minutes before flow cytometry analysis
TUNEL immunohistochemistry
Immunohistochemical apoptotic detection (TUNEL assay) was performed on 10 formalin-fixed 5microm paraffin sections using In Situ Cell Death Detection Kit POD (Roche) according to the manufacturerrsquos instructions Germ cells were restained with hematoxylin The percentage of seminiferous tubules with TUNEL staining was determined (Yamamoto et al 2002)
Statistical analysis
Results were presented as mean plusmn SD All data were analyzed by one-way ANOVA Plt005 was considered statistically significant
RESULTS
Sperm density motility viability and abnormality
As shown in Table 1 spermatozoa density in cauda epididymis decreased significantly in hypoxic 15d group and 30d group (Plt001 compared with control group shown in Figure 1) Spermatozoa motility and viability in cauda epididymis were severely impaired in all of three hypoxic groups (Plt001 compared with control group shown in Figure 2 and 3) The number of morphologically abnormal spermatozoa increased significantly in hypoxic condition (Plt001 compared with control group shown in Figure 4) The main types of spermatozoa abnormality were coiled and folded tail
Sper
m d
ensi
ty(
times107 1
00 m
g ep
idid
ymal
tiss
ue) 4 00
3 00
2 00
1 00
0 00 Cont r ol H5d H15d H30d
Figure 1 Effect of hypoxia on sperm density ( Plt001 vs Control group Plt005vs Hypoxic 15d group
62
80
20
40
60
Sper
m m
otili
ty(
)
0 Cont r ol H5d H15d H30d
Figure 2 Effect of hypoxia on sperm motility ( Plt001 vs Control group Plt005 vs Hypoxic 5d group)
0
20
40
60
80
100
Sper
m v
iabi
lity
()
Cont r ol H5d H15d H30d
Figure 3 Effect of hypoxia on sperm viability ( Plt001 vs Control group)
63
40 5
30
0
4 Total
Blunt hook
3 Coiled folded tail
sper
m a
bnor
mal
ity (
)20
Banana head 2
10 Amorphous head
1 Two tail
0 Control H5d H15d H30d
Figure 4 Effect of hypoxia on sperm abnormality (Plt005 Plt001 vs Control group)
The acrosome reaction (AR)
LPC-induced AR was suppressed by about 60 in all three hypoxic groups (Plt001 compared with control group shown in Figure 5)
40 0
Cont r ol H5d H15d H30d
Perc
enta
ge o
f AR
()
30 0
20 0
10 0
0 0
Figure 5 Effect of hypoxia on the percentage of acrosome reaction in rats ( Plt001 vs Control group)
Acrosin activity The percentage of acrosin positive reaction spermatozoa decreased significantly in hypoxic groups
(Plt001 compared with control group shown in Figure 6)
64
100
80
60
40
20
0 Cont r ol H5d H15d H30d
Figure 6 Effect of hypoxia on the percentage of positive acrosin protease activity spermatozoa in rats (Plt001 vs Control group)
Histopathological examination
LM Hypoxia caused testicular interstitial congestion and edema Occasionally seminiferous tubule atrophy and germ cell depletion were observed after exposure to hypoxia for 30d (Shown in Figure 7)
Perc
enta
ge o
f pos
itive
acr
osin
pro
teas
eac
tivity
()
Figure 7 Representative photomicrographs of testes from control and hypoxic rats (original magnification 100X) (A) Control rat (B) 5d hypoxic cat (C)30d hypoxic rat
65
Lipid droplets were found in the Sertoli cells in hypoxic rats Degenerating spermatogonia with slight chromatin margination were observed in 15d and 30d hypoxic rats (Shown in Figure 8)
Figure 8 Electron micrograph of seminiferous tubules (A) 5d hypoxic rat showing lipid droplets in Sertoli cells 10000times (B) 15d hypoxic rat showing degenerating spermatogonia 4200times
Flow cytometry analysis
5d 15d and 30d hypobaric hypoxia exposure significantly reduced the tetraploid cell populations (approximately 28) compared with the control group (Shown in Figure 9)
Perc
enta
ge o
f 4C
cel
ls(
) 16
12
8
4
0 Cont r ol H5d H15d H30d
Figure 9 Effect of hypoxia on the tetraploid (4C) cell population (Plt001 vs Control group) 66
Diploid cell populations in hypoxia 30d group rats were significantly more than that in the control group rats (Shown in Figure 10)
15
Perc
enta
ge o
f 2C
cel
ls(
)
12
9
6
3
0 Cont r ol H5d H15d H30d
Figure 10 Effect of hypoxia on diploid (2C) cell population (Plt001 vs Control group)
12 0
1C2
C r
atio 9 0
6 0
3 0
0 0
Cont r ol H5d H15d H30d
Figure 11 Effect of hypoxia on the ratio of haploid (1C) to diploid (2C) cells in rat tastes (Plt001 vs Control group)
After exposed to hypoxia for 30d the ration of haploid and diploid cell population was reduced by 25 when compared with control group (Shown in Figure 11)
The ratio of tetraploid cells to diploid cells decreased significantly in rats exposed to hypoxia for 15d and 30d (Shown in Figure 12)
67
4C2
C ra
tio
2 0
1 5
1 0
0 5
0 0 cont r ol H5d H15d H30d
Figure 12 Effect of hypoxia on the ratio of 4C2C in testes (Plt001 vs Control group)
68
Proliferation index of 15d and 30d hypoxic groups was significantly lower than that of the control group (Shown in Figure 13) Relative percent of G0G1 cells in hypoxic 15d group and 30d group was more than control group (Plt001 shown in Figure 14)
PI(
)
70
60
50
40
30
20
Cont r ol H5d H15d H30d
Figure 13 Effect of hypoxia on proliferation index of germ cells in testes (Plt001 vs Control group)
Rel
ativ
e pe
rcen
t of G
0G
1 ce
lls (
)
60
40
20
0 Cont r ol H5d H15d H30d
Figure 14 Effect of hypoxia on relative percent of G0G1 cells in tests (Plt001 vs Control group)
69
TUNEL
The apoptosis of spermatogonia and spermatocytes increased after exposure to hypoxia for 5d 15d and 30d (Shown in Figure 15 16)
Figure 15 Immunohistochemical demonstration of apoptotic cells by the TUNEL method (magnification 200times) (A) Control rat (B) 5d hypoxic rat
cont ai ni ng mor e t han one posi t i ve cel l cont ai ni ng one posi t i ve cel l cont ai ni ng t wo posi t i ve cel l s
Cont r ol H5d H15d H30d
Figure 16 Effect of hypoxia on apoptosis of seminiferous germ cells (Plt005 Plt001 vs Control group)
0
5
10
15
20
25
30
perc
enta
ge o
f tub
ules
con
tain
ing
TU
NE
Lpo
sitiv
e ce
lls
cont ai ni ng mor e t han t hr ee posi t i ve cel l s
70
DISCUSSION
The density of spermatozoa in the cauda epididymis decreased in hypoxic 15d group and 30d group (Table 1) suggesting adverse effects of hypoxia on the spermatogenic process This was coincident with the results of previous researches which indicated that hypoxia changed the seminiferous epithelium and inhibited spermatogenesis in rats (Gosney 1984 Astakhov 1990) Previous studies have revealed that spermatozoa acquire motility and form tail abnormalities mainly in the epididymis (Axner et al 1999) Our study found motility and viability of spermatozoa in hypoxic rats was reduced significantly and spermatozoa with abnormal tails increased significantly after exposure to hypoxia for 5 days These results indicate that hypoxia suppressed the maturation of spermatozoa in the epididymis Since low spermatozoa number and motility and high rates of abnormal spermatozoa have negative correlations with fertility (Bostofte et al 1984) our findings indicate that hypoxia will decrease the fertility of male rats
Mammalian spermatozoa must undergo a preparation period known as capacitation to become capable of fertilizing oocytes This process was associated with the removal of cholesterol leading to an increase in membrane fluidity calcium influx and cAMP levels and changes in some enzymatic activities These biochemical modifications lead to a transient change in the pattern of spermatozoa motility called hyperactivation The preparation process ends with an exocytotic event called the acrosome reaction a prerequisite step for oocyte fertilization The membrane-perturbing properties of LPC have been useful to the study of capacitation LPC induces the acrosome reaction in capacitated but not in noncapacitated spermatozoa (Byrd and Wolf 1986) The effect of hypoxia on the acrosome reaction was not explored in previous studies Our study found acrosome reaction rate was suppressed by approximately 60 when exposed to hypoxia This indicates hypoxia inhibits acrosome reaction of spermatozoa (Figure 1)
Acrosin has function in spermatozoa penetration by limited proteolysis of ZP glycoproteins Acrosin protease activity has also been involved in dissolution of the acrosomal matrix and in a regulated release of acrosomal contents at the time of the acrosome reaction (Hardy et al 1991) Previous researches have not revealed the effect of hypoxia on acrosin protease activity In the present study we found that acrosin protease reaction rate decreased significantly when exposed to hypoxia (Figure 2) suggesting hypoxia suppressed the acrosin protease activity of spermatozoa Low acrosome reaction rate and acrosin protease activity in hypoxic conditions will decrease the opportunity for oocyte fertilization
In this study we found hypoxia caused testicular interstitial edema occasional atrophy of seminiferous tubules and germ cell depletion (Figure 3) We also found hypoxia caused more lipid droplets to be deposited in Sertoli cells and spermatogonia to degenerate with slight chromatin margination under electron microscopy (Figure 4) These changes of morphology in testes indicate hypoxia affects spermatogenesis in rats
Flow cytometry can provide a rapid way to investigate germinal epithelium integrity and to perform a quantitative analysis of spermatogenesis and has been used in many laboratories to examine spermatogenesis in men and animals (Spano and Evenson 1993 Dong et al 1999) The effect of spermatogenesis was evaluated only by morphological methods in previous studies (Astakhov 1990
71
Saxena 1995) In the present studies quantitative examination was done by flow cytometry Using this method we demonstrated that ratio of G0G1 phase cells in hypoxic 15d and 30d group significantly increased (Figure 10) It suggests that hypoxia is capable of inducing cell cycle arrest in G0G1 phase Proliferation index of 15d and 30d hypoxic rats decreased significantly (Figure 9) and the total spermatogenic transformation (1C2C cell ratio) dropped in 30d hypoxic rats (Figure 7) indicating hypoxia restrains spermatogenesis in rats Flow cytometry also provided convincing evidence that the suppressive effects of hypoxia on spermatogenesis were mainly caused by decreasing tetraploid spermatogenic cells This was supported by the observation that the ratio of tetraploid to diploid cells was lower in hypoxic rats and the proportions of tetraploid cells were decreased under hypoxic condition (Figure 5 8) which indicates the direct cytotoxic effect of hypoxia on the pachytene spermatocytes A similar early reduction in 4C population was observed in mice after administration of 2-methoxyacetic acid (Spano et al 1991) and teniposide (Jyothi et al 2001) Consequently after exposure to hypoxia 30d there was a compensatory increase in the relative percentage of 2C cells (Figure 6) Such an increase in relative percentage of 2C cells is due to the accumulation of surviving spermatogonia (Krishnamurthy et al 1998)
The TUNEL assay is a method for quantifying apoptosis in germ cells of rat testes Percentage of seminiferous tubules containing apoptotic germ cells increased in hypoxic conditions (Figure 12) The apoptotic germ cells were mainly primary spermatocytes and spermatogonia (Figure 11) The apoptosis of spermatogonia and primary spermatocytes may contribute to the loss of tetraploid cells
CONCLUSIONS
Hypobaric hypoxia suppresses spermatozoa density motility viability and increases the number of morphologically abnormal spermatozoa in rat Hypoxia also inhibits the acrosome reaction and acrosin activity of rat spermatozoa Hypobaric hypoxia inhibits spermatogenesis in rats by decreasing the tetraploid spermatogenic cells (primary spermatocytes) Apoptosis of primary spermatocytes and spermatogonia under hypoxic condition may contribute to the decrease in the tetraploid cell population
REFERENCES
Astakhov O B 1990 Dinamika morfometricheskikh pokazatelei semennikov u krys v khode adaptatsii k vysokogoriu Antarktidy i posleduiushchei deadaptatsii [Dynamics of morphometric indicators of rat testes during adaptation to high-altitude in the Antarctic regions with subsequent dysadaptation] Arkh Anat Gistol Embriol 99 17-9
Axner E C Linde Forsberg and S Einarsson 1999 Morphology and motility of spermatozoa from different regions of the epididymal duct in the domestic cat Theriogenology 52 767-78
Bostofte E J Serup and H Rebbe 1984 Interrelations among the characteristics of human semen and a new system for classification of male infertility Fertil Steril 41 95-102
Briz M S Bonet B Pinart and R Camps 1996 Sperm malformations throughout the boar epididymal duct Animal Reprod Sci 43 221-39
Byrd W and D P Wolf 1986 Acrosomal status in fresh and capacitated human ejaculated sperm Biol Reprod 34 859-69
72
Donald H 1981 Man at high altitude Churchill Livingstone
Dong Q H Li Y Yang M Huang and S Lei 1999 The effect of vasectomy on spermatogenesis and proliferation of rat spermatogenic cell Hua Xi Yi Ke Da Xue Xue Bao 30 417-9
Eckes L 1976 Hohenadaptation Teil IV Fertilitat und Fortpflanzung in grossen Hohen [Altitude adaptation IV Fertility and reproduction at high altitudes Gegenbaurs Morphol Jahrb 122 761-70
Gosney J R 1984 Effects of hypobaric hypoxia on the Leydig cell population of the testis of the rat J Endocrinol 103 59-62
Hardy D M M N Oda D S Friend and T T Huang Jr 1991 A mechanism for differential release of acrosomal enzymes during the acrosome reaction Biochem J 275 759-66
Hsu P C C C Hsu and Y L Guo 1999 Hydrogen peroxide induces premature acrosome reaction in rat sperm and reduces their penetration of the zona pellucida Toxicology 139 93-101
Jyothi P G C Jagetia and H Krishnamurthy 2001 Evaluation of teniposide (VM-26)-induced toxicity on mouse spermatogenesis by flow cytometry Toxicology 163 163-74
Krishnamurthy H G C Jagetia and P Jyothi 1998 Radioprotective effect of zinc aspartate on mouse spermatogenesis a flow cytometric evaluation Mutat Res 401 111-20
Saxena D K 1995 Effect of hypoxia by intermittent altitude exposure on semen characteristics and testicular morphology of male rhesus monkeys Int J Biometeorol 38 137-40
Spano M R Amendola C Bartoleschi S Emiliani E Cordelli J M Petit R Julien and M H Ratinaud 1991 Evaluation of 2-methoxyacetic acid toxicity on mouse germ cells by flow cytometry J Toxicol Environ Health 34 157-76
Spano M and D P Evenson 1993 Flow cytometric analysis for reproductive biology Biol Cell 78 53-62
Wyrobek A J and W R Bruce 1975 Chemical induction of sperm abnormalities in mice Proc Natl Acad Sci U S A 72 4425-9
73
74
ENDOCRINE DISRUPTING AND TERATOGENIC EFFECTS OF HYPOXIA ON FISH AND THEIR ECOLOGICAL IMPLICATIONS
Rudolf Wu8 Eva Shang and BS Zhou
ABSTRACT
Hypoxia occurs over thousands of km2 and poses a major threat to aquatic ecosystems Elimination of sensitive species population decline and changes in community have been reported worldwide We demonstrated that hypoxia is an endocrine disruptor and can lower the levels of testosterone and estradiol in adult carps (by 77-91) Disturbances of sex hormones retarded gonad development in both male and female carps leading to a decline in sperm motility decrease in fertilization success (from 994 to 555) hatching rate (from 988 to 172) and larval survival (from 937 to 464) Overall the survival of eggs to larvae decreased from 923 in the normoxic group to only 44 in the hypoxic group Experiment on zebrafish further demonstrated that hypoxia is a teratogen and can significantly increase malformation (by 774) during their embryonic development Disruption of apoptotic pattern was clearly evident at 24 hpf which may be a major cause of malformation Hypoxia can also delay embryonic development and upset the balance of testosterone and estradiol at very early developmental stages implicating that subsequent sexual development may also be affected Taken together our results imply that hypoxia may reduce species fitness and threaten the sustainability of natural fish populations over large areas on a global scale
INTRODUCTION
Hypoxia affects thousands of km2 of freshwater and marine waters worldwide and some coastal areas (eg Black Sea) have become permanently hypoxic anoxic (Jin 1994 Diaz and Rosenberg 1995 Smith et al 1999 Levin 2003) Helly and Levin (2004) estimated that the global area of permanent hypoxic shelf and bathyal sea floor are over one million km2 The severity frequency occurrence and spatial scale of aquatic hypoxia have increased in the last few decades and due to rapid human population growth and global warming the situation is likely to become worse in coming years (Wu 2002) Indeed hypoxia is now regarded as one of the most serious threats to aquatic populations and genetic diversity (Goldberg 1995 McIntyre 1995 Wu 1999 Gray et al 2002) and there is a pressing need to understand the functional consequences of oxygen depletion in aquatic ecosystems (Levin 2003)
In the course of evolution fish has developed various strategies to survive hypoxic conditions These include (1) enhanced capability to obtain oxygen from water by increasing the binding affinity of oxygen to haemoglobin increasing water flow over the gills a reduction of blood flow promotion of gill diffusing capacity or increasing the perfused number of gill lamellae (Randall 1982) (2) promoting anaerobic metabolism to compensate for a lack of oxygen (Dunn and Hochachka 1986) (3) change in enzyme activities and invoking metabolic depression (Hochachka 1997) Despite the numerous studies on the biochemical and physiological responses of fish to hypoxia the effects of hypoxia on fish reproduction and development remain very poorly known albeit reproductive success
Department of Biology and Chemistry City University of Hong Kong Kowloon Hong Kong SAR China
75 8
is one of the key Darwinian fitness traits in determining species survival
Reproductive success in fish depends on a number of inter-related factors namely gonad development reproductive behavior fecundity gamete quality fertilization success as well as larval hatchability and larval survival In fish all these important processes are regulated by sex steroid hormones (Fostier et al 1983 Tyler and Sumpter 1996 Kime 1998 McCormick 1998 1999) Thus disruption of any of these hormones may affect the reproductive process as a whole (Kime 1998) For example disturbance of the gonadal steroid hormone production will impair gonadal development and hence reproductive success (Kime 1998 Arcand-Hoy and Benson 1998) Effects of hypoxia on sex hormones gametogenesis fertilization success and reproductive hormones are virtually unknown
It is generally accepted that embryonic and larval development are much more sensitive to stress than adult stages (Rand 1995 Rolland et al 1995 Connell et al 1999) since normal histogenesis and organogenesis depend on a series of programmed highly intricate processes Disturbance of any of these processes is likely to result in malformation and birth defects which may ultimately affect the survival and fitness of adults Surprisingly effects of hypoxia on embryonic and larval development of fish remain virtually unknown
This paper presents scientific evidence to show that hypoxia is an endocrine disruptor and can disrupt the balance of sex hormones leading to severe reproductive impairments We also provide data to demonstrate that hypoxia is a teratogen and fish exposed to sub-lethal levels of hypoxia during their embryonic and larval development will result in a significantly higher percentage of malformation which may adversely affect species survival
Hypoxia is an endocrine disruptor
We compared serum levels of testosterone 17β-estradiol (using ELISA) gonadosomatic index gonadal histology spawning success sperm motility (using a CRISMAS image analysis system) fertilization success and larval hatchability of adult carp (Cyprinus carpio) reared under hypoxia (10plusmn02 mg O2 l-1) and normoxia (70plusmn02 mg O2 l-1) for 8 weeks and 12 weeks (Wu et al 2003)
Changes of sex hormomes
After 8 weeks of exposure to hypoxia serum testosterone levels were significantly reduced (-77) but estradiol (E2) levels increased significantly (+90) in male carps (plt0001) Serum testosterone concentrations showed a significant correlation with degrees of maturation of the testis (r=069) Serum estradiol and testosterone levels in female carp exposed to hypoxia for 8 weeks were reduced by 80 to 91 respectively (plt001) (Table 1)
76
Table 1 GSI and serum hormone levels (ng ml-1) of carp after exposure to normoxia (7 mg O2 l-1) hypoxia (1 mg O2 l-1) for 8 weeks
Male Female 70 mg O2 l-1 10 mg O2 l-1 70 mg O2 l-1 10 mg O2 l-1
GSI 1023plusmn088 426plusmn061 1851plusmn218 609plusmn281 Testosterone 983plusmn095 222plusmn072 823plusmn115 073plusmn031 Estradiol 0033plusmn0004 0063plusmn006 099plusmn035 019plusmn014
Mean plusmn SE n=7-11 Asterisk(s) indicate values significantly different from the normoxic control (t-test Plt005 Plt001 Plt0001)
GSI and gonadal histology
A significant decrease in the gonadosomatic index (GSI) was found in both male and female carps after 8 weeks of exposure to hypoxia (Table 1) Histological examination further showed a reduced number of spermatocysts (SPC) cells and smaller lobules but a larger number of spermatogonia (SPG) cells in hypoxic fish indicating gametogenesis was impaired by hypoxia (Plt0001 Figure1) Retardation of gonad development in female carp was exemplified by smaller gonads and less yolk in each egg (Plt0001 Figure 1)
SPG SPC SPD
Figure 1 Number of spermatogonia (SPG) spermatocytes (SPC) and spermatid (SPD) of the testes of C carpio upon exposure to 70 and 10 mg O2 l-1 for 8 weeks Values significantly different from the control are indicated by asterisks (N=7-11 Mean plusmn SD) ( Plt001 Plt0001)
00
25
50
75
100
No o
f Cys
tsL
obul
e
70 mgl-1
10 mgl-1
77
Sperm motility fertilization success hatching success and larval survivorship
A significant decrease in sperm motility was found in fish after exposure to hypoxia for 12 weeks (Table 2) indicating that sperm quality was impaired Percentage fertilization success was reduced from 994 in the normoxic group to 555 in the hypoxic group (Plt0001 Figure 2b) 988 fertilized eggs produced by the normoxic group hatched to fry while only 172 of fertilized egg produced by the hypoxic group hatched (Plt001 Figure 2b) 937 hatched larvae survived in the normoxic group while larval survival decreased to 464 in the hypoxic group 24h post-hatching (Plt0001 Figure 2b) Overall survival from eggs to larvae was 923 in the normoxic group but only 44 in the hypoxic group (Plt0001 Figure 2A)
Table 2 S perm motility of carp after exposure to normoxia (70 mg O2 l-1) and hypoxia (10 mg O2 l-1) for 12 weeks
70 mg O2 l-1 10 mg O2 l-1
VCL VSL VAP
7742plusmn1303 3883plusmn939 4796plusmn269
4625plusmn484 1065plusmn174 2112plusmn449
Mean plusmn SE N=6 The velocity is expressed as μm S-1 Asterisk indicates values significantly different from the control (t-test Plt005) (VCL mean curvilinear velocity VSL mean straight-line velocity VAP angular path velocity)
0
25
50
75
100
(A)
Surv
ival
0
20
40
60
80
100
120
Fertilization Hatching Larval survival
Per
cent
age
(B)
70 mg l-1 10 mg l-1
Eggs to larvae
Figure 2 (A) Percentage survival of eggs to larvae (B) Percentage of fertilization hatching rate and larval survivorship of C carpio upon exposure to 70 and 1 mg O2 l-1 for 12 weeks Values significantly different from the control are indicated by asterisks (N=6 Mean+SD) ( Plt001 Plt0001)
78
The above results provide clear evidence that hypoxia disrupts endocrine function reduces GSI gametogenesis and maturation of gonads quality of gametes fertilization hatching and larval survival
In male fish testosterone plays an important role in stimulating and maintaining spermatogenesis (Kime 1998 Fostier 1983) Estradiol normally occurs only in trace amounts in male fish albeit ineffective in regulating spermatogenesis (Kime 1998) higher levels of estradiol can inhibit spermatogenesis (Billard 1981) Thus both low levels of testosterone and high levels of estradiol may have contributed to the reduction in spermatogenesis in male hypoxic fish
Sperm motility is indicative of sperm quality and also a major factor determining successful fertilization and quality of fish larvae (Evans 1998 Kime 1998 1999) Time to spawning egg size egg viability fertilization success time to hatching and larval survivorship have all been regarded as important attributes leading to reproductive success (Fahraeligus-Van Ree 1997 Arcand-Hoy 1998) Fertilization success and the proportion of normally developing embryos and larvae depend upon the quality of the eggs and sperm (Moodie 1989) Factors influencing the maternal levels of testosterone can have a major impact on larval survivorship (Moodie 1989) It is clear from our results that fish exposed to hypoxia produce inferior quality gametes and offspring which in turn probably accounted for the observed low hatching success and high larval mortality
The above evidence showed that hypoxia reduces the overall reproductive success of fish by disturbing endocrine functions which in turn affect gametogenesis sexual maturity gamete quality fecundity fertilization success hatching development as well as viability of larvae The impairment of fish reproduction by hypoxic stress may be an important mechanism accounting for the population decline and changes of fish species composition observed in hypoxic environments
Hypoxia is a teratogen
We compared development of zebrafish embryos exposed to normoxia (58 mgL) and hypoxia (08 mgL) at time interval (24 48 72 96 120 and 168hpf) (Shang and Wu 2004) Developmental stages were classified according to Kimmel et al (1995) and embryos displaying noticeable external abnormalities such as spinal deformity and cardiac deformities were considered as malformed embryos Embryos were sampled from the hypoxic and normoxic group at 24hpf when significant extent of apoptosis occurs and stained by Acridine Orange (Cole and Ross 2001) Total number of apoptotic cells was counted and compared
Development was clearly delayed when zebrafish embryos were exposed to hypoxia Embryos exposed to 05 mg O2 L-1 required twice as long for them to develop to the same developmental stages as their normoxic counterpart (Figure 3) Besides embryos exposed to hypoxia developed lost synchronization in their development with their tails developed much faster than the head
79
58 mg O2 L-1 24 hpf 58 mg O2 L-1 48 hpf
05 mg O2 L-1 24 hpf 05 mg O2 L-1 59 hpf
Figure 3 A comparison of zebrafish development under hypoxia (05mg O2 L-1) and normoxia (58 mg O2 L-1)
After 168 hpf percentage of malformation (ie spinal deformity and altered axial curvature) in the hypoxic group (183 plusmn 231) was significantly higher than that of the control (103 plusmn 115 Studentrsquos t-test Plt001) (Figure 4) Under hypoxia many embryos failed to develop their vascular systems after several days and died
80
0
5
10
15
20
25 M
alfo
rmat
ion
()
58mg 08mg
O2L-1
O2L-1
48 72 96 120 168Time (hpf)
Figure 4 Percentage malformation in zebrafish embryos during different developmental stages (48 72 96 120 168 hpf) upon exposure to 58 mg O2 L-1 (Normoxia) and 08 mg O2 L-1 (Hypoxia) Values significantly different from the normoxic control are indicated by asterisks (N=5 Mean plusmn SD) (t-test plt005 plt001)
Sex Hormones
At 48hpf testosterone levels in hypoxic embryos showed a significant increase from 256 plusmn 056 to 344 plusmn 42 pg mL-1 (Plt001) while estradiol was significantly reduced from 80 plusmn 14 to 24 plusmn 01 pg mL-1 (Plt0001) (Figure 5A)
A reversed pattern was observed at 120hpf testosterone in hypoxic embryos was significantly reduced from 361 plusmn 143 to 273 plusmn 275 pg mL-1 (Plt001) while estradiol was significantly increased from 461 plusmn 128 to 125 plusmn 410 pg mL-1 (Plt005) (Figure 5B)
A
0
10
20
30
40
50
Con
cent
ratio
n (p
gm
l) 5 8mg 08mg
O2L-1
O2L-1
Testosterone Estradiol 48hpf
81
B
0
10
20
30
40 C
once
ntra
tion
(pg
ml)
5 8mg 08mg
O2L-1
O2L-1
Testosterone Estradiol120hpf
Figure 5 Testosterone and estradiol (pgmL) in zebrafish embryos at 48 hpf (A) and 120 hpf (B) upon exposure to 58 mg O2l (Normoxia) and 08mg O2l (Hypoxia) Values significantly different from the normoxic control are indicated by asterisks (N=4 Mean plusmn SD) (t-test plt005 plt001 plt0001)
Apoptosis
Compared with the normoxic control number of apoptotic cells in the tail of hypoxic embryos were significantly reduced (-637 plt001) In contrast a significantly higher percentage (+116 plt005) of apoptotic cells was found in the brain of hypoxic embryos as compared with control embryos (Figure 6) The above observations clearly indicated that the apoptotic pattern in zebrafish embryos was altered by hypoxia
0
30
60
90
120
150
Apo
ptot
ic c
ells
58mg 08mg
O2L-1
O2L-1
Head Tail
Figure 6 Number of apoptotic cells at 24 hpf in zebrafish embryos upon exposure to 58 mg O2 L-1
(Normoxia) and 08 mg O2 L-1 (Hypoxia) Values significantly different from the control are indicated by asterisks (N=10 Mean plusmn SD) (t-test plt005 plt001)
82
Ecological implications and significance
Endocrine disruption by chemical pollutants has been related to the decline in many fish reptile bird and wildlife populations (Colborn 1993 Tyler et al 1998) and has therefore become a major environmental concern in the last decade For example tributyl tin has caused imposex in female whelks leading to a male biased sex ratio and hence extinction of natural populations worldwide ranging from the North Sea to New Zealand (Ten 1994) The present study documents for the first time that hypoxia can also cause endocrine disruption in fish The facts that (a) hypoxia occurs over one million km2 globally (Levin 2003) imply that endocrine disruption caused by hypoxia may be a wide spread phenomenon and the problem of endocrine disruption caused by hypoxia is potentially much more serious than that caused by any known anthropogenic chemicals Since the modulating sex hormones are highly conservative hypoxia induced endocrine disruption observed in carp and zebrafish may possibly also occur in other fish species or animal groups
Our results also provided for the first time clear evidence that hypoxia does not only affect adults but also embryonic and larval development of fish Indeed the fact that a higher percentage of malformed fish is often found in polluted water (Au 2004) where hypoxia frequently occur lend further support to our laboratory findings These developmental impairments and malformation at the earlier stages of life cycle may subsequently reduce the fitness and chance of survival of individuals in natural populations
In conclusion hypoxia could significantly impair fish reproduction through a significant decrease in GSI retardation of gonad development disruption in reproductive hormones lowering of sperm quality and fertilization ability These impairments at various stages culminated in a reduction in hatching rate and survivorship of the larvae Hypoxia also affects embryonic development of fish leading to malformation Taken together these findings may form a scientific basis for interpreting andor predicting population decline and changes of fish species composition in hypoxic environments
ACKNOWLEDGEMENT
The work described in this paper was supported by the Central Allocation Grant Scheme of the Research Grants Council of the Hong Kong Special Administrative Region China (CityU 203C) and a grant from the Area of Excellence Scheme (Project No AoEP-0404)
REFERENCES
Arcand-Hoy LD and WH Benson 1998 Fish reproduction An ecologically relevant indicator of endocrine disruption Environmental Toxicology and Chemistry (Annual Review) 17 49-57
Au DWT 2004 The application of histo-cytopathological biomarkers in marine pollution monitoring A review Marine Pollution Bulletin 48 817-834
Billard R B Breton and M Richard 1981 On the inhibitory effect of some steroids on spermatogenesis in adult rainbow trout Salmo gairdneri Canadian Journal of Zoology 59 1479-1487
83
Colborn T F S Vom Saal and A M Soto 1993 Developmental effects of endocrine disrupting chemicals in wildlife and humans Environmental Health Perspectives 101 378-384
Cole LK and LS Ross 2001 Apoptosis in the developing zebrafish Developmental Biology 240 123-153
Connell DW PKS Lam BR Richardson and RSS Wu 1999 In Ecotoxicology Blackwell Science UK pp50-77
Diaz R J and R Rosenberg 1995 Marine benthic hypoxia a review its ecological effects and the behavioural responses of benthic marcofauna Oceanography and Marine Biology Annulal Review) 33 245-303
Dunn JF and PW Hochachka 1986 Metabolic responses of the trout (Salmo gairdneri) to acute environmental hypoxia Journal of Experimental Biology 123 229-242
Evans J P and AJ Geffen 1998 Male characteristics sperm traits and reproductive success in winter-spawning Celtic Sea Atlantic herring Clupea harengus Marine Biology 132 179-186
Fahraeligus-Van Ree and GE JF Payne 1997 Effects of toxaphene on reproduction of fish Chemosphere 34 855-867
Fostier A B Jalabert B Billard B Breton and Y Zohar 1983 In Fish Physiology WS Hoar DJ Randall EM Donaldson Eds Academic Press New York pp 277-346
Goldberg ED 1995 Emerging problems in the coastal zone for the twenty-first century Marine Pollution Bulletin 31 152-158
Gray JS 2002 The species diversity of marine soft sediments Marine Ecology-Progress Series 244 285-297
Helly JJ and LA Levin 2004 Global distribution of naturally occurring marine hypoxia on continental margins Deep-Sea Research I 51 1159-1168
Hochachka PW 1997 Oxygen-A key regulatory metabolite in metabolic defense against hypoxia American Zoology 37 595-603
Jin XC 1994 An analysis of lake eutrophication in China In Inland Waters of Tropical Asia and Australia Conservation and Management Dudgeon D and PKS Lam (eds) pp 207-211
Kime DE 1998 In Endocrine disruption in fish Kluwer-Acad Press
Kime DE and JP Nash 1999 Gamete viability as an indicator of reproductive endocrine disruption in fish Science of the Total Environment 233 123-129
Kimmel CB WW Ballard SR Kimmel B Ullmann and TF Schilling 1995 Stages of embryonic development of zebrafish Developmental Dynamics 203 253-310
84
Levin LA 2003 Oxygen minimum zone benthos adaptation and community response to hypoxia Oceanography and Marine Biology an Annual Review 41 1-45
McCormick MI 1998 Behaviorally induced maternal stress in a fish influences progeny quality by a hormonal mechanism Ecology 79 1873-1883
McCormick MI 1999 Experimental test of the effect of maternal hormones on Larval quality of a coral reef fish Oecologia 118 412-422
McIntyre AD 1995 Human impact on the oceans The 1990s and beyond Marine Pollution Bulletin 31 147-151
Moodie GEE NL Loadman MD Wiegand and JA Mathias 1989 Influence of egg characteristics on survival growth and feeding in larval walleye (Stizostedion vitreum) Canadian Journal of Fisheries and Aquatic Sciences 46 516-521
Rand GM 1995 Fundamentals of aquatic toxicology Effects environmental fate and risk assessment 2nd edition Taylor and Francis Washington DC USA
Randall DJ 1982 The control of respiration and circulation in fish during exercise and hypoxia Journal of Experimental Biology 100 275-288
Rolland RM M Gilbertson and RE Peterson (Eds) 1995 Chemically induced alterations in functional development and reproduction of fishes Proceedings from a session at the Wingspread Conference Center 21-23 July 1995 Racine WL SETAC Press Pensacola FL USA
Shing EHH and RSS Wu 2004 Aquatic hypoxia in a teratogen and affects fish embryonic development Environmental Science and Technology 38 4763-4767
Smith VH GD Tilman and JC Nekola 1999 Eutrophication impacts of excess nutrient inputs on freshwater marine and terrestrial ecosystems Environmental Pollution 100 179-196
Ten Hallers-Tjabbes CC JF Kemp and JP Boon 1994 Imposex in whelks (Buccinum undatum) from the open North Sea relation to shipping traffic intensities Marine Pollution Bulletin 28 311ndash313
Tyler CR and JP Sumpter 1996 Oocyte growth and development in teleosts Reviews in Fish Biology and Fisheries 6 287-318
Tyler CR S Jobling and JP Sumpter 1998 Endocrine disruption in wildlife a critical review of the evidence Critical Review Toxicology 28319-361
Wu RSS 1999 Eutrophication trace organics and water-borne pathogens pressing problems and challenge Marine Pollution Bulletin 39 11-22
Wu RSS 2002 Hypoxia from molecular responses to ecosystem responses Marine Pollution Bulletin 45 35-45
85
Wu R S S BS Zhou DJ Randall NYS Woo and PKS Lam 2003 Aquatic hypoxia is an endocrine disruptor and impairs fish reproduction Environmental Science and Technology 37 1137-1141
86
EFFECTS OF HYPOXIA ON LIPID METABOLISM IN TELEOSTS
Guido van den Thillart9
ABSTRACT
Hypoxia is a naturally occurring phenomenon for fishes So a protection mechanism can be expected particularly with respect to lipid catabolism By measuring the lactate response it is possible to determine whether a teleost is able to survive and even to adapt to a certain oxygen level It is hypothesized that recovery will occur at oxygen levels above the critical oxygen level (PO2)crit reflected by a transient lactate increase In contrast continuous lactate accumulation occurs at oxygen levels below the (PO2)crit which will be lethal in case of prolonged exposure Results from cannulated common carp and rainbow trout exposed to stepwise decreasing oxygen levels show that both individual and inter-specific differences in lactate response occur during exposure to hypoxia Both in carp and trout a strong correlation exists between changes in lactate and both catecholamine levels
Hypoxia increases the levels of catecholamines which in mammals activate lipolysis The oxidation of the released fatty acids however is impaired at low oxygen levels Thus plasma and tissue free fatty acids accumulate in (mammalian) tissues under hypoxia which ultimately leads to death There are no indications however that this type of tissue damage develops also in fishes We observed a strong negative correlation between the level of noradrenaline and the level of plasma free fatty acids in fish during chronic hypoxia exposure The fact that noradrenaline levels remain elevated when the hypoxic condition persists suggests that this hormone has a controlling function Infusion studies with specific α- and β- agonists and antagonists demonstrate that there are β1-adrenoceptors that inhibit lipolysis In-vitro studies with adipocytes isolated from several fish species confirmed these results There is also evidence that this is mediated by the inhibition of hormone sensitive lipase Thus we can conclude that in fishes the down-regulation of plasma FFA levels under hypoxia is controlled by catecholamines As fatty acid cannot be oxidized under hypoxia this downregulation may be a protection mechanism in fish against fatty acid intoxication
INTRODUCTION
Over the last two decades the hormonal regulation of carbohydrate metabolism in fish especially in liver has received increasing attention It has been demonstrated that the mobilization of glucose from the liver is stimulated by hormones such as catecholamines cortisol and glucagon (Janssens and Waterman 1988 Danulat and Mommsen 1990 Puviani et al 1990 Brighenti et al 1991) in particular during stress conditions such as hypoxia (Wright et al 1989) In contrast little information is available on the regulation of lipid metabolism in teleost fish Several reviews on fish lipid metabolism have been published showing a restricted knowledge compared to the mammalian situation (Greene and Selivonchick 1987 Hendersen and Tocher 1987 Sheridan 1988) In mammals two types of stress responses are described ie coping and non-coping (Bohus et al 1987) These responses are related to the prevelance of cortisol vs catecholamine release in the circulation More recently Van Raaij et al (1996a) have demonstrated these two responses in hypoxic trout The non-coping group showed a
Institute of Biology section Integrative Zoology University of Leiden Van der Klaauw Laboratories Kaiserstraat 63 PO Box 9516 2300 RA Leiden The Netherlands
87
9
surge of catecholamines and high lactic acid levels This group did not survive the hypoxic conditions whereas the coping group with higher cortisol levels and lower catecholamine levels did This suggests that animals under stress may show opposing responses with respect to behaviour hormones and metabolites In mammals epinephrine levels increase in response to a psycho-physiological disturbance while norepinephrine increase is related to exercise stress (Scheurink et al 1989 Bohus et al 1987) Increased norepinephrine levels are often due to sympathetic overflow from postganglionic adrenergic nerve terminals In mammals catecholamines have a strong lipolytic action (Lafontan and Berlan 1993) which is connected to an increased energy requirement Hypoxia causes a surge of catecholamines in all vertebrates Under such conditions a consistent activation of lipolysis is observed in mammals due to the high release of catecholamines (Prinzen et al 1984 Prasad et al 1991) The effect of hypoxia on lipolysis in fish is however not clear and the available results are conflicting (see review Van den Thillart et al 2002) Considering the strong lipolytic character of catecholamines in mammals a reduction of lipolysis during hypoxia is a puzzling phenomenon and strongly suggests a different regulatory mechanism in fish The role of catecholamines in fish is summarized in a several recent reviews (Randall and Perry 1992 Wendelaar Bonga 1997 Reid et al 1988) describing the control of catecholamines release the effects of catecholamines on the cardiovascular system and on the ion transport mechanisms The effect of catecholamines on metabolism has been reviewed recently by Fabbri et al (1998) This review is mainly focused on glucose metabolism and signal transduction mechanisms With respect to lipid metabolism in fish reviews have been published by Sheridan (1988 1994) and Van den Thillart et al 2002)
Hypoxia can be a regularly occurring phenomenon for many teleost fishes under natural circumstances These fish species have developed adaptations which enable them to survive different hypoxic situations (Van den Thillart 1982) Adaptations may include adjustments in the oxyshygen-carrying capacityaffinity (Perry and Wood 1989 Boutilier et al 1988) a diminution of the oxygen consumption rate by a reduction in locomotor activity (Lomholt and Johansen 1979 Van den Thillart et al 1994) or even a depression of the overall energy metabolism (Van Ginneken et al 1997) However generally these adaptations occur with a certain delay before reaching the required levels and therefore mostly they are not sufficient to meet the energy demands at the onset of the hypoxia exposhysure which is then connected with a certain level of stress To compensate energy imbalance all activate anaerobic glycolysis resulting in accumulation of lactic acid (Joslashrgensen and Mustafa 1980 Dunn and Hochachka 1986 1987 Dalla Via et al 1994) and consequently in metabolic acidosis (Boutilier et al 1988 Van Raaij et al 1996a) Since low pH inhibits physiological processes and can even cause cell damage andor cell death (Van den Thillart and Van Waarde 1985) anaerobic metashybolism can only be maintained for a short period For survival of long-term hypoxia it is important for the animal to obtain a new balance in oxygen extraction and oxygen consumption which must allow aerobic recovery from earlier anaerobic stimulation In this case the lactate level may rise first and drop later due to recovery Below a certain critical oxygen level ((PO2)crit) no recovery will be possible resulting in a continuous accumulation of lactic acid Therefore monitoring plasma lactate during hypoxia will tell us whether the animal is able to recover at that level Recently it has been demonstrashyted (Van Raaij et al 1996b) that with respect to behaviour in rainbow trout two opposite coping strateshygies can be distinguished during deep hypoxia A passive coping strategy of wait and see reflected by a quiet behaviour and an active coping strategy characterized by a large amount of burst type activity Plasma lactate levels were 4-5 fold higher in the active animals suggesting that the anaerobic threshold was reached almost immediately in the active fish while it could be postponed in quiet animals In general oxygen restriction is experienced as a stressful condition resulting in the release of adrenaline noradrenaline (Boutilier et al 1988 Randall and Perry 1992 Van Raaij et al 1996c) and cortisol (White and Fletcher 1989 Van Raaij et al 1996c)
88
MATERIAL AND METHODS
Experimental protocol for cannulation experiments
The experiments were performed in a recirculation system with a total volume of 965 L The water of this system was kept at a temperature of 200 plusmn 05 degC for carp and 150 plusmn 05 degC for trout It was air saturated at a normoxic level of 80-90 air saturation (AS 155-175 kPa PO2) and pumped through flow-chambers at a rate of 08-10 l min-1 Before the start of the experiment three fish were captured and placed individually into the flow-chambers with dimensions 55x10x18cm (carp) or 55x8x14cm (trout) Each experimental chamber was closed with a gas-tight perspex lid which was partially darkened over the head of the fish in order to block visual perception During the experimental period the fish were deprived of food
After three days of acclimation the dorsal aorta was cannulated according to a modification of the method of Soivio et al (1975) as described by Van Dijk et al (1993) with a poly-ethylene (PE 50) catheter (Rubber Hilversum The Netherlands) filled with saline containing 200 IU ml-1 heparin (Sigma St Louis USA) After surgery the fish was placed into the flow-chamber and allowed to recover for two days before the experiments were carried out This careful 5-day pre-experimental protocol has been shown to minimize the amount of stress associated with handling anesthesia and surgery (Van Raaij et al 1996c) Each day the cannulae were flushed with heparinized saline (200 IU ml-1) and filled with a viscose solution of poly-vinyl-pyrrolidon (Merck FRG 1 g PVP ml-1 saline) containing 500 IU ml-1 heparin Using this procedure the diffusion of heparin into the circulation is negligible
Before the experiments were started two control blood samples were taken within 30 minutes (between 0800 and 0900 am) for measurement of the initial values of metabolites and stress hormones Directly after the second blood sample carp were exposed to a controlled linear PO2 decline from 80 AS to 30 AS which was reached in 2 hours Thereafter the PO2 was stepwise decreased further depending on the experiment Trout experienced a PO2 decline from 80 AS to 40 AS (over 2 hours) after which the PO2 was stepwise decreased further depending on the experiment After the hypoxia exposure the water was rapidly re-aerated again and the cannulae were removed Blood samples and analyses were carried out as described earlier (Van Raaij et al 1996c)
Isolation and incubation protocol for adipocytes
Tilapias were killed by a sharp blow on the head followed by spinal transection at the cervical level Samples of abdominal adipose tissue were removed rapidly from the gastro-intestinal tract without connective tissue obtaining portions of 8-10 g (fish-1) and placed immediately into a Petri dish with Krebs-Henseleit buffer (in mmol l-1 1175 NaCl 56 KCl 118 MgSO4 252 CaCl2 128 NaH2PO4 250 NaHCO3 and 55 D-glucose) pregassed with 5 CO2 in O2 pH 74 The portions of adipose tissue were chopped obtaining slices of 1 mm2 Cells were isolated by incubation in a water shaking bath in a Teflon vessel containing 20 ml of Krebs-Henseleit buffer per portion with the addition of 1 bovine serum albushymin BSA (Fraction V Sigma St Louis USA) and collagenase 130 U ml-1 (type II Sigma St Louis USA) at 25degC under an atmosphere of 5 CO2 in O2 pH 74 After 15 hour the suspensions of adipocytes were filtered through a nylon cloth and washed three times with Krebs-Henseleit buffer (1 BSA) In a water shaking bath equilibrated at 5 CO2 in O2 portions of 100 μl adipocyte-suspension (approximately 3x10⁵ cells) were incubated in Teflon vessels for 5 h at 25degC in a total volume of 3 ml Krebs-Henseleit buffer with or without (controls) the addition of an adrenoceptor (ant)agonist and
89
containing 2 bovine serum albumin Control measurements were performed in triplicate and experimental measurements in duplicate When both an agonist and antagonist were used the adipocytes were pre-incubated with the antagonist 15 minutes before the agonist was added The incubation period was terminated by adding the content of each vessel to 3 ml of extraction medium (1-propanol n-heptane 1N H2SO4 = 40201) The tubes were mixed for 60 seconds and centrifuged for 5 minutes at 2000 rpm in a Hettich RotixaKS centrifuge From the upper layer 400 μl was used for FFA-determination (Vianen et al 2002)
RESULTS AND DISCUSSION
Response of cannulated carp and trout to stepwise decreasing oxygen levels
Cannulated common carp (Cyprinus carpio) and rainbow trout (Oncorhynchus mykiss) were exposed to stepwise decreasing oxygen levels and during each oxygen level plasma lactate and stress hormones were measured repeatedly It was hypothesized that at oxygen values (just) above the (PO2)crit activation of the anaerobic metabolism will be followed by aerobic recovery In contrast continuous accumulation of lactate will be observed during oxygen levels below the (PO2)crit associated with strong increases in circulating stress hormone levels
Changes in lactate levels in cannualted carp and trout is shown in figure 1 Exposure of carp to 30 AS (58 kPa PO2) caused activation of the anaerobic glycolysis in 2 out of 6 animals However after 1-2 hours at 30 AS the lactate levels declined in these animals indicating that the anaerobic activation was temporal and that 30 AS is above the (PO2)crit During 15 AS (29 kPa PO2) all animals showed an increase in plasma lactate In two fish (fish II and III) lactate levels stabilized during this period indicating an oxygen level just above (PO2)crit In contrast there was a continuous accumulation of plasma lactate in the other fish indicating that more lactate was produced than oxidized For these fish 15 AS is below (PO2)crit and will be lethal in case of prolonged exposure Exposure to 8 AS resulted in all carp in continuous lactate accumulation revealing an oxygen level below the (PO2)crit So the results demonstrate that for carp 15 AS (29 kPa PO2) is close to the critical oxygen level Exposure of trout to 40 AS (79 kPa PO2) two out of five animals showed a moderate but persistent increase of blood [lactate] while there was no change in plasma [lactate] in the other fish From this observation it can be concluded that for the latter group 40 AS is above the (PO2)crit whereas for the animals showing the permanent increase in lactate levels 40 AS is already too severe During 35 AS (69 kPa O2) the individual variation in lactate response became more pronounced between surviving (fish 1 and 4) and non-surviving trout (fish 2 3 and 5) Nevertheless the lactate accumulation was continuous in all trout indicating that 35 AS is below (PO2)crit It is obvious that the switch to continuous lactate accumulation occurs in carp at lower oxygen levels than in trout One of the main reasons explaining this difference is the fact that carp hemoglobin has a higher affinity for oxygen than trout hemoglobin (Jones et al 1970) While in trout half-maximal Hb-O2 saturation (P50) values range from 15-25 mmHg (Boutilier et al 1988 Perry and Reid 1994) P50 values in carp range from 1-8 mmHg (Itazawa and Takeda 1978 Wurm and Albers 1989 Glass et al 1990) which means that at reduced oxygen levels carp is able to extract more oxygen from the environshyment than trout
90
mm
olL
mm
olL
mm
olL
mm
olL
mm
olL
mm
olL
Time (hours)-2 0 2 4 6 8 10 12
02468
1012141618
80 PO2 30 15 8decline
VI
V
IV
III
III
Carp
Time (hours)-2 0 2 4 6 8 10 12
0
2
4
6
8
10
12
14
16
1880 PO2 40 35 30
decline
2 53
4
1
Trout
Time (hours)-2 0 2 4 6 8 10 12
02468
1012141618
80 PO2 30 15 8decline
VI
V
IV
III
III
Time (hours)-2 0 2 4 6 8 10 12
0
2
4
6
8
10
12
14
16
1880 PO2 40 35 30
decline
2 53
4
1
-2 0 2 4 6 8 10 12 0 2 4 6 8
10 12 14 16 18
80 PO2 30 15 8 decline
VI
V
IV
III
II I
Carp
Time (hours)
-2 0 2 4 6 8 10 12 0
2
4
6
8
10
12
14
16
18 80 PO2 40 35 30
decline
2 5 3
4
1
Trout
Time (hours) Figure 1 Individual plasma lactate levels are displayed for common carp and trout during stepwise
hypoxia The oxygen concentration in the water was reduced over a period of two hours from 80 AS (155 kPa PO2) to subsequently 30 15 and 8 AS each level for three hours The PO2 decline for trout was from 80AS to subsequently 40 35 and 30 AS All values at t ge 5 frac12 h for carp and at t ge 2 frac12 h for trout were significantly different (Plt005) from those at normoxia (t= -05 and 0 h) Data from Vianen 1999
To minimize the amount of stress associated with the experimental conditions carp and trout were acclimated to the experimental well-aerated flow-chambers for three days before they were cannulated After surgery the fish were allowed to recover for 36-48 hours The fish displayed a quiet behaviour before the stepwise hypoxia was induced which is reflected by low initial levels of catecholamines both in carp and trout (about 004 ngml adrenaline and about 03 ngml noradrenaline) These levels are similar to values observed by Van Raaij et al (1996c) in carp and trout which were obtained under identical experimental conditions In fish the resting values for plasma adrenaline are usually between 005 and 15 ngml and for noradrenaline between 004 and 25 ngml (Randall and Perry 1992 Thomas and Perry 1992) and thus the concentrations observed in this study are among the lowest reported in
91
2 0
4 2 0
ut oTr
I
Ca pr
fish The initial values of plasma cortisol are comparable with resting concentrations in cannulated fish observed by other investigators (Eros and Milligan 1996 Van der Boon et al 1991 Van Raaij et al 1996c) Changes in noradrenaline levels in cannulated carp and trout is shown in figure 2 Changes in adrenaline levels (not shown) were less dramatic significant changes occurred later at the lower PO2 levels ADR and NA remained at low levels (lt 5 ngml) in quiet reacting trout while in the active non-surviving trout higher values were measured for both ADR (5-15 fold) and NA (2-10 fold) These results support the idea that the neuroendocrine activition in fish resembles the stress coping strategies observed in higher vertebrates (Van Raaij et al 1996b)
909090808080707070
606060505050404040303030202020101010
80 PO 2 30880 PO 2 300 PO 2 30 151155 888
VVV
CaCarprpVIVIVI
IVIVIVII
IIIIII
IIIIIIIII
ng m
lng
ng
ml
ml
-2-2-2000
000 222 444 666 888 111000 111222TiTiTimememe (((hhhourouroursss)))
909090888000 PPPOOO 222 444000 333555 333000
808080
707070 666
606060444
ng
ng
ng m mm
lll 222
505050 00000 22 444
404040 333
303030 TrTroouutt202020
101010 222 555 111
000444
---222 00 22 44 666 888 111000 111222Time (hours)TiTime (hours)me (hours)
Figure 2 Individual concentrations of noradrenaline levels are shown for common carp and trout during stepwise hypoxia Details as in figure 1 Data from Vianen 1999
Comparing figure 1 with figure 2 it follows that the individuals with the highest plasma lactate levels are associated with the highest plasma NA levels and vice versa This positive coupling was tested for significance with a nonparametric ranking test and resulted both in case of a two-tailed and a one-tailed test in a significant (Plt005) correlation between these compounds Similarly in trout especially the marked increase in plasma lactate in the non-surviving trout is accompanied by strong elevations in both ADR and NA In this fish species a significant correlation was found between the lactate and ADR levels The correlation between the lactate concentration and catecholamine levels provides strong indications that these stress hormones play in fish an important regulatory function in the activation of anaerobic metabolism during hypoxia
92
Response of cannulated carp and trout to chronic hypoxia
For chronic hypoxia the animals were exposed to oxygen levels above the critical PO2 From the stepwise hypoxia exposure data on lactate and noradrenaline it is obvious that PO2 for carp and trout of respectively 30 and 40 should be above lethal This is because in most fish under these conditions recovery could be observed The 40AS levels proved however lethal for some trout This is likely due to the fact that trout can be extremely active during escape reactions after which recovery becomes impossible In figure 3 plasma FFA levels of carp and trout are shown over a hypoxia period of 48h Both in carp and trout exposure to chronic hypoxia resulted in markedly decreased plasma FFA levels stabilizing around new steady state levels during the whole hypoxia period (Figure 3) With respect to carp a reduction in plasma [FFA] from circa 05 mmol l-1 to 01-04 mmol l-1 has been earlier observed during an exposure of several hours to deep hypoxia (Farkas 1967 ab Mazeaud 1973 Van Raaij et al 1996a) These data however show that FFA levels in carp can fall to much lower levels (about 005 mmol l-1) when exposed to a longer period (48 hours) In contrast to previous publications (Mazeaud 1973 Plisetskaya 1980 Van Raaij et al 1996a) we observed with rainbow trout also a marked reduction of plasma [FFA] during hypoxia
The continuously reduced FFA levels were accompanied with significant amounts of both adrenaline and noradrenaline in carp and trout during prolonged hypoxia (Figure 4) With respect to adrenaline there was a transient increase (factor 12) in carp at the beginning of the hypoxia period while in HT-trout a similar transient increase was observed after 24 hours In contrast both in carp and trout NE levels remarkably increased (by about factor 35) remaining at these elevated levels during the whole hypoxia period The permanently increased NE levels are in contrast to the transient changes observed with catecholamines so far (Perry and Reid 1994 Van Raaij et al 1996a) and suggest an important regulatory function for NE during prolonged hypoxia Van Raaij et al (1995) have demonstrated that stress-free infusion of NE in carp resulted in a reduction of FFA levels providing strong indications that NE is responsible for the FFA reduction during hypoxia It was hypothesized by the same authors that the NE-induced reduction of plasma [FFA] is due to a reduction of lipolytic rates most probable in the adipose tissue Indeed recent experiments with isolated adipocytes showed that the release of FFA decreases dose-dependently during exposure to increasing concentrations of NE which surprisingly is mediated through stimulation of β-adrenoceptors (Vianen et al 2002) This is in sharp contrast to the mammalian situation where both noradrenaline and adrenaline are known to be potent activators of lipolysis via β-stimulation (Scheurink et al 1989 Connacher et al 1991 Germack et al 1997 Mills 2000) Thus the chronically increased NE levels were correlated with the chronically reduced FFA levels in both carp and trout This suggests that noradrenaline has an important function in controlling lipid catabolism in fish
93
Time (hours) -2 0 2 4 6 8 10 12 24 36 48
mm
olL
00
01
02
03
04
05
06
ampampampamp
80 20
ampampamp ampamp
Time (hours) -2 0 2 4 6 8 10 1224 36 48
mm
olL
-04
-03
-02
-01
00
01
02
amp ampamp
80 40
amp
Carp
Trout
Time (hours)-2 0 2 4 6 8 10 1224 36 48
mm
olL
00
01
02
03
04
05
06
ampampampamp
80 20
ampampampampamp
Time (hours)-2 0 2 4 6 8 10 1224 36 48
mm
olL
00
01
02
03
04
05
06
ampampampamp
80 20
ampampampampamp
Time (hours)-2 0 2 4 6 8 10 1224 36
Ti48
mm
olL
-04
-03
-02
-01
00
01
02
ampampamp
80 40
amp
me (hours)-2 0 2 4 6 8 10 1224 36 48
mm
olL
-04
-03
-02
-01
00
01
02
ampampamp
80 40
amp
Carp
Trout
Figure 3 Plasma concentrations of free fatty acids (FFA) in common carp and trout during normoxia (n=7 open circles) and prolonged hypoxia (n=8 closed circles) For carp the oxygen concentration in the water decreased over a period of 220 h from 80 air saturation to 20 AS for trout it was reduced to 40 AS Values are expressed as mean plusmn SEM significant differences (Plt005) with normoxic carp are indicated by a single asterisk () with the initial value (t= 0 h) by a double asterisk () and both by the amp sign Data from Vianen 1999
94
Time (hours) -2 0 2 4 6 8 10 12 24 36 48
ng m
l
0
2
4
6
8
10
12
14
16 80 20
amp
ampamp ampamp
amp ampamp
amp
Time (hours) -2 0 2 4 6 8 10 12 24 36 48
ng m
l
0
2
4
6
8
10
12
14
16 80 40
amp ampampampamp
amp
amp
amp
amp
amp amp
ampamp
amp
Carp
Trout
Time (hours)-2 0 2 4 6 8 10 1224 36 48
ng m
l
0
2
4
6
8
10
12
14
1680 20
amp
ampampampamp
ampampamp
amp
Time (hours)-2 0 2 4 6 8 10 1224 36 48
ng m
l
0
2
4
6
8
10
12
14
1680 20
amp
ampampampamp
ampampamp
amp
Time (hours)-2 0 2 4 6 8 10 12 24 36 48
ng m
l
Ti
0
2
4
6
8
10
12
14
1680 40
amp ampampampamp
amp
amp
amp
amp
ampamp
ampamp
amp
me (hours)-2 0 2 4 6 8 10 12 24 36 48
ng m
l
0
2
4
6
8
10
12
14
1680 40
amp ampampampamp
amp
amp
amp
amp
ampamp
ampamp
amp
Carp
Trout
Carp
Trout
Figure 4 Plasma concentrations of noradrenaline in carp and rainbow trout during normoxia (n=6 open circles) and prolonged hypoxia (n=9) Four trout were hypoxia sensitive (open triangles) Values are expressed as means plusmn SEM Details as in Figure 3 Data from Vianen 1999
Adrenergic control of lipid metabolism in-vivo studies
To determine the receptor type we carried out infusion experiments with cannulated carp using different salines (Van den Thillart et al 2001) In the first series we tested the involvement of α2-adrenoceptors The animals were infused for 15h with noradrenaline noradrenaline + yohimbine (α2-antagonist) and clonidine (α2- agonist) Upon infusion with noradrenaline plasma glucose levels began to rise and FFA levels fell reaching +60 for glucose and -50 for FFA at about 2h after the onset When the animals were pretreated with yohimbine the glucose response did not differ but the decline of FFA was retarded Thus during infusion with noradrenaline FFA only decreased by about 10 The same inhibition as without yohimbine was reached after five hours suggesting that the effect of yohimbine diminishes in a few hours Infusion with the α2-agonist clonidine however resulted in a transient 10 decline of plasma FFA independent of the applied concentration This would suggest that α2-adrenoceptors are indirectly involved possibly via an effect on tissue perfusion Infusion of isoproterenol (non-selective β-agonist) according to the same protocol as with noradrenaline (Van den
95
Thillart et al 2001) showed a similar stimulation of glucose release but inhibition of FFA release of the same magnitude and speed as with noradrenaline This unexpected result suggests that the direct inhibitory action of noradrenaline on lipolysis is mediated by β-adrenoceptors and not via α2-adrenoceptors To determine the type of β-adrenoceptor involved we applied ICI-118551 (β2-antagonist) or atenolol (β1-antagonist) in combination with isoproterenol The strong increase of plasma glucose by isoproterenol appeared to be attenuated by both antagonists in the same way the peak value was about 10 lower and the control levels were reached three hours earlier six instead of nine hours after the onset of infusion This suggests that β-receptor stimulation of glycogenolysis (in the liver) is mediated by both β1- and β2-adrenoceptors A different picture was observed with plasma FFA levels the decline of plasma FFA by isoproterenol was more pronounced in the presence of ICI-118551 while the administration of atenolol even caused an increase of plasma FFA levels (Figure 2) This result suggests that there are two opposite actions on FFA release The stronger decline after pretreatment with ICI-118551 reveals an inhibitory action of β1-adrenoceptors presumably located on cell membranes of adipose tissues The opposite effect of atenolol showing an increase of plasma FFA by isoproterenol suggests that β2-adrenoceptors (possibly located on liver cells) may stimulate lipolysis
Adrenergic control of lipid metabolism in-vitro studies
The difficulty with using whole fish is that catecholamines may alter the levels of other circulating hormones and that catecholamine turnover in the circulation is rapid Furthermore the responses of the different fat storing tissues including the liver may be different This problem is prevented when using isolated fat or liver tissue or isolated adipocytes and hepatocytes Migliorini et al (1992) investigated lipolysis in adipose tissue slices of fish toad and snake Remarkably basal rates were much lower than those of mammals Catecholamines had however no effect on lipolysis in fish and toad adipose tissue Adrenaline decreased lipolysis in snake adipose tissue while glucagon had a clear lipolytic effect on snake both in-vivo and in-vitro The release of FFA from all adipose preparations was stimulated by cAMP xanthine derivatives and phosphodiesterase-inhibitors Lipolysis was also stimulated by fluoride and forskolin which also increased cAMP levels These results suggesting that lipolysis is mediated via phosphorylation of a lipase did not support Farkas idea that lipase is not regulated by cAMP (Farkas 1969b)
The advantage of working with isolated cells instead of chopped adipose tissue is that the influence of damaged cells is negligible and that reproducible incubations from the same source can be made to study concentration dependent effects of different agonists and antagonists To verify the hypothesis that β-adrenoceptor stimulation leads to inhibition of lipolysis in adipose tissue we carried out experiments with isolated adipocytes from tilapia (Oreochromis mossambicus) mesenteric fat tissue (Vianen et al 2002) The paper of Vianen et al (2002) was the first to show in-vitro lipolysis in isolated fish adipocytes Zhou et al (1996) described the histology and size range of Atlantic salmon adipocytes Christiansen et al (1985) describing glucose uptake studies pointed to the fragility of adipocytes isolated from trout adipose tissue Their adipocytes could not be incubated much longer than 4 minutes The procedure of Vianen et al however allows incubations for 5 hours in some cases overnight incubations were even performed A general draw-back of working with lipolysis in fish adipose tissue appears the large variability in FFA release The basal lipolytic rates in teleost fish range from 2-1500 nmolesh106 cells In catfish (Clarias (Clarias gariepinus) trout and seabream the basal lipolytic rates were about 650 130 and 2 nmolh106 cells respectively (Van Heeswijk Van den Thillart and Vianen unpublished results) whereas in tilapia values of about 1500 nmolesh106 cells were found (Vianen et al 2002) The values are dependent on age season nutritional condition and
96
also on the level of maturation Basal lipolytic rates observed in mammals range between 50-150 nmolh106 cells Published rates are 65-100 nmolh106 cells for rat (Hollenga et al 1991 Germack et al 1997) 150 nmolh106 cells for sheep (Cochrane and Rogers 1990) 150 nmolh106 cells for pig (Mills 2000) and 65 nmolh106 cells for human (Hollenga et al1991) These rates are relatively low compared with the values obtained from fish adipocytes especially in view of the higher incubation temperature (37degC) with mammalian adipocytes On the other hand β-receptor stimulation in mammals leads to a strong increase of lipolysis reaching maximum rates of 2000-40000 nmolh106
cells (Hollenga et al1991 Mills 2000 Germack et al 1997) which are 10-100 fold higher than those observed with teleosts
The paper of Vianen et al (2002) confirmed that noradrenaline reduces the FFA release of adipocytes dose-dependently which became significant at concentrations of ge1μM Co-incubation of noradrenaline with phentolamine (α12-antagonist) showed no effect indicating that no α-adrenoceptor is involved On the other hand co-incubation with timolol (β12-antagonist) showed that the anti-lipolytic effect of noradrenaline was caused by β-adrenoceptor stimulation in sharp contrast to the situation in mammals (Galitzky et al 1995 Mills 2000) We also found evidence for inhibitory β3-adrenoceptors which are activated at concentrations of isoproterenol ge10 μM and by the selective β3-adrenoceptor agonist BRL 35135 (Vianen et al 2002) A possible function for those receptors is a safety valve at high catecholamine concentrations that are found during hypoxia lipolyic activity becomes arrested This finding was the first report of a functional β3-adrenoceptors in fish Thus far no reports are known of an inhibitory β3-adrenoceptor Nickerson et al (2003) cloned β-adrenoceptor genes of trout and found that two were homologous with mammalian β3-adrenoceptors In a detailed study they showed two subtypes in trout a β3-a and a β3-b form The first expressed predominantly in gill and heart and the latter exclusively in erythrocytes Binding studies suggested that the β3-adrenoceptor in erythrocytes is involved in sodiumproton exchange the function of this adrenoceptor in the other tissues remains to be resolved With respect to the β-adrenoceptors on adipocyte membranes we could confirm with trout catfish and sea bream the inhibitory effect on lipolysis (van Heeswijk Van den Thillart Vianen unpublished results) This suggests a general mechanism in teleost fish
Contrary to the observations by Migliorini et al (1992) with fat tissue from the adult male tigerfish (Hoplias malabaricus) exposure of tilapia adipocytes to increasing concentrations of isobutyl-methylxanthine (IBMX) and forskolin resulted in a marked reduction of FFA-release (Vianen and Van den Thillart unpublished results) These results suggest a cAMP-dependent inhibition of TG lipase activity which is the opposite from the transduction mechanism in mammals The observation that Migliorini et al (1992) found an increase in lipolytic activity may be due to the (very) high concentrations of IBMX and forskolin which were applied 10 and 01 mM respectively So fish adipocytes have β-adrenoceptors which upon activation reduce lipolysis via a cAMP mediated mechanism Liver slices of coho salmon incubated in vitro (Sheridan 1987) release fatty acids upon stimulation by 1 μM noradrenaline but not by adrenaline Also isoproterenol (β-receptor agonist) stimulated FFA release The lipolysis occurred at a 3 to 1 ratio of FFA and glycerol respectively The effects of noradrenaline and isoproterenol could be blocked by propranolol (β-receptor antagonist) but not by phentolamine (α-receptor antagonist) prazosin (α1- receptor antagonist) and yohimbine (α1-receptor antagonist) This shows that lipolysis in the salmon liver is activated through β-adrenoceptors In a recent study with trout hepatocytes (van Heeswijk et al unpublished) we could demonstrate that lipolysis is activated by β2-adrenoceptors
97
CONCLUSIONS
There is overwhelming evidence that lipid mobilization is differently organized in fishes compared to mammals In general it appears that lipolysis in mammals is strongly activated by catecholamines via β-adrenoceptors (figure 5) while in fishes lipolysis is mostly inhibited In mammals some inhibition may occur via α2-adrenoceptors The basal lipolytic rates in fish are sometimes barely measurable which may compromise the effect of controlling hormones This pattern is related to the changing needs for storage and mobilization in fishes lipids are stored in different locations and mobilized differentially for maturation migration and long periods of starvation The fat storage near and in red muscle forms a very short transport route to the muscle This obscures FFA turnover measurements The FFA concentrations per se do not provide an indication about lipolysis However assuming a fast response on catecholamine release the fall in oxidation capacity due to oxygen shortage will be slower than the inhibition on HSL Thus this will in general lead to a lowering of the plasma FFA levels
The oxygen content of water is some 30 times lower than that of air in addition oxygen diffusion rates in water are much lower than those in air (800 times) and this makes water-breathers very sensitive to changes in oxygen content Actually water can become hypoxic or even anoxic in a few hours under certain conditions Since hypoxia is a generally occurring phenomenon it may be expected that fish are better adapted to hypoxia than mammals Between fish species the tolerance to hypoxia varies greatly and some species have developed unorthodox metabolic pathways and behaviour in order to survive extreme hypoxicanoxic conditions (Van den Thillart and van Waarde 1985) During normoxic conditions lipids and amino acids are the major fuels for the energy metabolism in teleost fish whereas carbohydrates become important during anaerobic conditions such as burst activity and hypoxia (Van den Thillart and van Raaij 1995) In mammals ischemia and severe hypoxia results in membrane damage This damage is mainly caused by the accumulation of amphiphiles such as fatty acids and the intermediates of β-oxidation Fatty acids are amphipatic molecules and are known to destabilize biomembranes (Hoekstra and Golovina 2002 Katz and Messineo 1981 Huumltter and Sobol 1992) The flux through β-oxidation is high particularly in mammalian heart muscle during normoxic conditions (Van der Vusse et al 1983) Due to inhibition of the lipid oxidation fatty acids and their metabolites will accumulate rapidly (Moore 1985) In addition hypoxia gives always rise to a massive release of catecholamines In mammals these hormones cause a strong activation of lipolysis Thus the combination of catecholamine-induced lipolysis and strongly reduced capacity to oxidize fatty acids results in a fast and major accumulation of fatty acids and intermediates of the β-oxidation Severe ischemia and hypoxia may lead to a marked depletion of the phosphorylation potential resulting in ion rearrangements in particular in Ca++-influx (Weiss et al 1992 Kidooka et al 1987) Increased Ca++-influx results in turn in activation of phospholipases and consequently in membrane leakage (Hochachka 1985 Kidooka et al 1987 Prasad et al 1991) The above processes ultimately lead to cell damage and to leakage of intracellular enzymes (such as LDH and CK) into the circulation While hypoxia in mammals is considered as a pathological condition this is not the case for (water-breathing) fishes Actually hypoxiaanoxia induced membrane damage does not occur in fish even after near lethal exposures (Van Raaij et al 1994a) So obviously fish including salmonids are better protected against hypoxia than most mammals Since hypoxic conditions are common for water-breathers it is assumed that catecholamine induced inhibition of lipolysis is a strategy by which fishes are able to prevent accumulation of amphipatic molecules and hence membrane damage
In fish we observed low lipolytic rates combined with inhibiting effect of catecholamines on lipolysis in adipose tissue The transduction mechanism of inhibition appears to be cAMP dependent and mediated via activation of β1- and possibly also β3- adrenoceptors From in-vivo measurements in carp it appears that β2- adrenoceptor activation results in activation of lipolysis in the liver (Van den
98
Thillart et al 2001) Activation of lipolyis in trout liver (Sheridan 1987) and inhibition of lipolysis in tilapia adipocytes (Vianen et al 2002) via β-adrenoceptors has been described These opposite effects may explain the variable results obtained in the past Further research focused on the expression of HSL in the different fat depots and the hormone sensitivity of these depots for lipolysis should be the next step in resolving the problems related to the regulation of lipolysis in fish
Figure 5 Model showing the action of α2- and β-adrenoceptors on the membrane bound adenylate cyclase The α2-adrenoceptors bind to inhibiting G-proteins and the β-adrenoceptors to stimulating G-proteins The interaction between the two adrenoceptors determines the activity of TG-lipase
REGULATION OF LIPOLYSISREGULATION OF LIPOLYSIS
ADRADR
β
GS AC+
ATP cAMP PKA+
Fat cell membrane
Gi
-α2
NA
β
GSAC+
ATP cAMP PKA+
Fat cellmembrane
Gi
-α2
NA
TG LIPASETG LIPASE
MAMMALIANMAMMALIAN
SYSTSY EMSTEM TG GLYCEROLTG GLYCEROLFFAFFA
99
REFERENCES
Bohus B RF Benus DS Fokkema JM Koolhaas C Nayakas GA van Oortmerssen AJA Prins AJH de Ruiter AJW Scheurink and AB Steffens 1987 Neuroendocrine states and behavioral and physiological stress responses Progress in Brain Research 72 57-70
Boutilier RG G Dobson U Hoeger and DJ Randall 1988 Acute exposure to graded levels of hypoxia in rainbow trout (Salmo gairdneri) metabolic and respiratory adaptations Respiratory Physiology 71 69-82
Brighenti L AC Puviani MC Gaviolo E Fabbri and C Ottolenghi 1991 Interaction of salmon glucagon glucagon-like peptide and epinephrine in the stimulation of phosphorylase a activity in fish isolated hepatocytes General and Comparative Endocrinology 82 131-139
Christiansen DC L Skarstein and L Klungsoslashyr 1985 Uptake studies in adipocytes isolated from rainbow trout (Salmo gairdnerii) A comparison with adipocytes from rat and cat Comparative Biochemistry and Physiology 82A 201-205
Cochrane W and MP Rogers 1990 Sensitivity of freshly isolated ovine adipocytes to inhibition of lipolysis by insulin Comparative Biochemistry and Physiology 96B 331-333
Connacher AA WM Bennet RT Jung DM Bier CCT Smith CM Scrimgeour MJ Rennie 1991 Effect of epinephrine infusion on fatty acid and glucose turnover in lean and obese human subjects in the post-absorptive and fed states Clinical Science 81 635-644
Dalla Via J G Van den Thillart O Cattani and A De Zwaan 1994 Influence of long-term hypoxia exposure on the energy metabolism of Solea solea II Intermediary metabolism in blood liver and muscle Marine Ecology Progress Series 111 17-27
Danulat E and TP Mommsen 1990 Norepinephrine A potent activator of glycogenolysis and gluconeogenesis in rockfish hepatocytes General and Comparative Endocrinology 78 12-22
Dunn JF and PW Hochachka 1986 Metabolic responses of trout (Salmo gairdneri) to acute environmental hypoxia Journal of Experimental Biology 123 229-242
Dunn JF and PW Hochachka 1987 Turnover rates of glucose and lactate in rainbow trout during acute hypoxia Canadian Journal of Zoology 65 1144-1148
Eros SK and CL Milligan 1996 The effect of cortisol on recovery from exhaustive exercise in rainbow trout (Oncorhynchus mykiss) Potential mechanisms of action Physiology Zoology 69 1196-1214
Fabbri E A Capuzzo and TW Moon 1998 The role of circulating catecholamines in the regulation of fish metabolism An overview Comparative Biochemistry and Physiology C 120 177-192
Farkas T 1967a The effect of catecholamines and adrenocorticotropic hormone on blood and adipocyte tissue FFA levels in the fish Cyprinus carpio L Progress in Biochemistry Pharmacology 3 314-319
100
Farkas T 1967b Examinations of fat metabolism in freshwater fishes The sympathetic nervous system and mobilisation of fatty acids Annual Inst Biology Hungarian Academy of Science 34 129-138
Farkas T 1969b Effects of agents modifying the level of 3-5-adenosine monophosphate in adipose tissue on mobilization of fats in fish and frogs Annual Inst Biology Hungarian Academy of Science 36 163-171
Galitzky J C Carpene A Bousquet-Melou M Berlan and M Lafontan 1995 Differential activation of beta(1)- beta(2)- and beta(3)-adrenoceptors by catecholamines in white and brown adipocytes Fundamental Clinical Pharmacology 9 324-331
Germack R AB Starzec R Vassy and GY Perret 1997 β-Adrenoceptor subtype expression and function in rat white adipocytes Br Journal of Pharmacology 120 201-210
Glass ML NA Andersen M Kruhoffer EM Williams and N Heisler 1990 Combined effects of environmental PO2 and temperature on ventilation and blood gases in the carp (Cyprinus carpio L) Journal of Experimental Biology 148 1-17
Greene DHS and DP Selivonchick 1987 Lipid metabolism in fish Progress in Lipid Research 26 53-85
Henderson RJ and DR Tocher 1987 The lipid composition and biochemistry of freshwater fish Progress in Lipid Research 26 281-347
Hochachka PW 1985 Assessing metabolic strategies for surviving O2-lack role of metabolic arrest coupled with channel arrest Molecular Physiology 8 331-350
Hoekstra FA and EA Golovina 2002 The role of amphiphiles Comparative Biochemistry and Physiology A 131 527-533
Hollenga Ch M Haas JT Deinum and J Zaagsma 1991 Differences in functional cyclic AMP compartments mediating lipolysis by isoprenaline and BRL 37344 in four adipocyte types European Journal of Pharmacology 200 325-330
Huumltter JF and S Sobol 1992 Role of fatty acid metabolites in the development of myocardial ischemic damage International Journal of Biochemistry 24 399-403
Itazawa Y and T Takeda 1978 Gas exchange in the carp gills in normoxic and hypoxic conditions Respiratory Physiology 35 263-269
Janssens PA and J Waterman 1988 Hormonal regulation of gluconeogenesis and glycogenolysis in carp (Cyprinus carpio) liver slices cultured in vitro Comparative Biochemistry and Physiology 91A 451-455
Jones DR DJ Randall and GM Jarman 1970 A graphical analysis of oxygen transfer in fish Respiratory Physiology 10 285-298
101
Joslashrgensen JB and T Mustafa 1980 The effect of hypoxia on carbohydrate metabolism in flounder (Platichthys flesus L) I Utilization of glycogen and accumulation of glycolytic end products in various tissues Comparative Biochemistry and Physiology 67B 243-248
Katz AM and FC Messineo 1981 Lipid-membrane interactions and the pathogenesis of ischemic damage in the myocardium Circulation Research 48 1-12
Kidooka M M Matsuda and J Handa 1987 Effect of calcium antagonist and agonist on free fatty acid liberation in the ischemic brain of rats Surgical Neurology 28 41-45
Lafontan M and M Berlan 1993 Fat cell adrenergic receptors and the control of white and brown cell function Journal of Lipid Research 34 1057-1083
Lomholt JP and K Johansen 1979 Hypoxia acclimation in carp How it affects O2 uptake ventilatishyon and O2 extraction from water Physiological Zoology 52 38-50
Mazeaud F 1973 Recherches sur la regulation des acides gras libres plasmatiques et de la glycemie chez les poissons Thesis Paris
Migliorini RJ Lima-Verde JS Machado CR Cardona GMP Garofalo MAR and Kettelhut IC 1992 Control of adipose tissue lipolysis in ectotherm vertebrates American Journal of Physiology 263 R857-862
Mills S 2000 Beta-adrenergic receptor subtypes mediating lipolysis in porcine adipocytes Studies with BRL-37344 a putative β3-adrenergic agonist Comparative Biochemistry and Physiology 126C 11-20
Moore K 1985 Fatty acid oxidation in ischaemic heart Molecular Physiology 8 549-565
Nickerson JG SG Dugan G Drouin SF Perry TW Moon 2003 Activity of the unique beta-adrenergic Na+H+ exchanger in trout erythrocytes is controlled by a novel beta3-AR subtype American Journal of Physiology 285 R526-535
Perry SF and CM Wood 1989 Control and coordination of gas transfer in fishes Canadian Journal of Zoology 67 2961-2970
Perry SF and S G Reid 1994 The effects of acclimation temperature on the dynamics of catecholamine release during acute hypoxia in the rainbow trout Oncorhynchus mykiss Journal of Experimental Biology 186 289-307
Plisetskaya E 1980 Fatty acid levels in the blood of cyclostomes and fish Environmental Biology of Fishery 5 273-290
Prasad MR LM Popescu II Moraru X Liu S Maity RM Engelman and DK Das 1991 Role of phospholipases A2 and C in myocardial ischemic reperfusion injury American Journal of Physiology 29 H877-883
102
Prinzen FW GJ Van der Vusse T Arts THM Roemen W Coumans and RS Reneman 1984 Accumulation of non-esterified fatty acids in ischemic myocardium American Journal of Physiology 247 H264-272
Puviani AC C Ottolenghi ME Gaviolli E Fabbri and L Brighenti 1990 Action of glucagon and glucagon-like peptide on glycogen metabolism of trout isolated hepatocytes Comparative Biochemistry and Physiology 96B 387-391
Randall DJ and SF Perry 1992 Catecholamines In Fish Physiology vol XIIB (ed DJ Randall and WS Hoar) pp 255-300
Reid SG NJ Bernier and SF Perry 1988 The adrenergic stress response in fish control of catecholamine storage and release Comparative Biochemistry and Physiology C 120 1-27
Scheurink AJW AB Steffens H Bouritius GH Dreteler R Bruntink R Remie and J Zaagsma 1989 Sympathoadrenal influence on glucose FFA and insulin levels in exercising rats American Journal of Physiology 256 R161-168
Sheridan MA 1987 Effects of epinephrine and norepinephrine on lipid mobilization from coho salmon liver incubated in vitro Endocrinology 120 2234-2239
Sheridan MA 1988 Lipid dynamics in fish aspects of absorption transportation deposition and mobilization Comparative Biochemistry and Physiology 90B 697-690
Sheridan MA 1994 Mini Review Regulation of lipid metabolism in poikilothermic vertebrates Comparative Biochemistry and Physiology 107B 495-508
Sheridan MA and NA Muir 1988 Effects of epinephrine and norepinephrine on glucose release from chinook salmon (Oncorhynchus tshawytscha) liver incubated in vitro Journal of Experimental Zoology 248 155-159
Soivio A K Nyholm and K Westman 1975 A technique for repeated sampling of blood of individual resting fish Journal of Experimental Biology 63 207-217
Thomas S and SF Perry 1992 Control and consequences of adrenergic activation of red blood cell Na+H+ exchange on blood oxygen and carbon dioxide transport in fish Journal of Experimental Zoology 263 160-175
Van den Thillart G 1982 Adaptations of fish energy metabolism to hypoxia and anoxia Molecular Physiology 2L 49-61
Van den Thillart G and A van Waarde 1985 Teleosts in hypoxia aspects of anaerobic metabolism Molecular Physiology 8 393-411
Van den Thillart G J Dalla Via G Vitali and P Cortesi 1994 Influence of long-term hypoxia exposure on the energy metabolism of Solea solea I Critical O2 levels for aerobic and anaerobic metabolism Marine Ecology Progress Series 104 109-117
103
Van den Thillart G and M van Raaij 1995 Endogenous fuels non-invasive versus invasive approaches In Biochemistry and molecular biology of fishes Vol 4 pp 33-63 Edited by Hochachka amp Mommsen Academic Press New York NY
Van den Thillart GEEJM GJ Vianen M Campos-Ponze H Lelieveld M Nieveen M van Raaij A Steffens and J Zaagsma 2001 Differential role of adrenoceptors in the control of plasma glucose and fatty acids in carp Cyprinus carpio (L) American Journal of Physiology 281 R615-624
Van den Thillart G GJ Vianen and J Zaagsma 2002 Adrenergic regulation of lipid mobilization in fishes a possible role in hypoxia survival Fish Physiology and Biochemistry 27 189-204
Van der Boon J GEEJM Van den Thillart and ADF Addink 1991 The effects of cortisol administration on intermediary metabolism in teleost fish Comparative Biochemistry and Physiology 100A 47-53
Van der Vusse GJ THM Roemen W Flameng and RS Reneman 1983 Serum myocardium gradients of non-esterified fatty acids in dog rat and man Biochimica et Biophysica Acta 752 362-370
Van Dijk PLM GEEJM Van den Thillart PHM Balm and SE Wendelaar Bonga 1993 The influence of gradual water acidification on the acidbase status and plasma hormone levels in carp Journal of Fish Biology 42 661-671
Van Ginneken VJT ADF Addink GEEJM Van den Thillart F KOumlrner L Noldus and M Buma 1997 Metabolic rate and level of activity determined in tilapia (Oreochromis mossambicus Peters) by direct and indirect calorimetry and videomonitoring Thermochimica Acta 291 1-13
Van Raaij MTM E Bakker MC Nieveen H Zirkzee and GEEJM van den Thillart 1994a Energy status and free fatty acid patterns in tissues of common carp (Cyprinus carpio L) and rainbow trout (Oncorhynchus mykiss L) during severe oxygen restriction Comparative Biochemistry and Physiology 109A 755-767
Van Raaij MTM GEEJM van den Thillart M Hallemeesch PHM Balm and AB Steffens 1995 The effect of arterially infused adrenaline noradrenaline and insulin on plasma hormones and the levels of glucose and free fatty acids in common carp (Cyprinus carpio L) American Journal of Physiology 268 R1163-1170
Van Raaij MTM DSS Pit PHM Balm AB Steffens and GEEJM van den Thillart 1996a Behavioral strategy and the physiological stress response in rainbow trout exposed to severe hypoxia Hormones and Behavior 30 85-92
Van Raaij MTM GJ Vianen and GEEJM Van den Thillart 1996b Blood gas parameters and the responses of erythrocytes in carp exposed to deep hypoxia and subsequent recovery Journal of Comparative Physiology 166B 453-460
104
Van Raaij MTM GEEJM Van den Thillart GJ Vianen DSS Pit PHM Balm and AB Steffens 1996c Substrate mobilization and hormonal changes in rainbow trout (Oncorhynchus mykiss L) and common carp (Cyprinus carpio L) during deep hypoxia and subsequent recovery Journal of Comparative Physiology 166B 443-452
Vianen GJ 1999 Hormonal control of energy metabolism in teleost fish during hypoxia Thesis Leiden
Vianen GJ PP Obels GEEJM van den Thillart and J Zaagsma 2002 β-Adrenoceptors mediate inhibition of lipolysis in adipocytes of tilapia (Oreochromis mossambicus) American Journal of Physiology 282 E318-325
Weiss JN N Venkatesh and ST Lamp 1992 ATP sensitive K+-channels and cellular K+ loss in hypoxic and ischemic mammalian ventricle Journal of Physiology 447 649-673
Wendelaar Bonga SE 1997 The stress response in fish Physiological Reviews 77 591-625
White A and TCFletcher 1989 The effect of physical disturbance hypoxia and stress hormones on serum components of the plaice Pleuronectus platessa Comparative Biochemistry and Physiology 93A 455-461
Wright PA SF Perry and TW Moon 1989 Regulation of hepatic gluconeogenesis and glycogenolysis by catecholamines in rainbow trout during environmental hypoxia Journal of Experimental Biology 147 169-188
Wurm TH and C Albers 1989 Interaction of allosteric effectors (ATP CO2 H+) modulating oxygen affinity of the hemoglobin in the carp (Cyprinus carpio) in vitro Journal of Comparative Physiology 159B 255-261
Zhou S RG Ackman and C Morrison 1996 Adipocyte and lipid distribution in the muscle tissue of Atlantic salmon (Salmo salar) Canadian Journal of Fisheries and Aquatic Science 53 326-332
105
106
THE INFLUENCE OF OXYGEN SHORTAGE ON THE DEVELOPMENT OF THE CARDIOVASCULAR SYSTEM IN ZEBRAFISH
Bernd Pelster10
ABSTRACT
Oxygen shortage typically elicits characteristic adaptations in the cardio - respiratory systems and in cellular metabolism as well documented in adult vertebrates Even embryonic and larval stages of fish for example respond to hypoxia Oxygen shortage can be the result of a reduced oxygen availability in the environment (= general environmental hypoxia) but it can also be the consequence of an increased oxygen demand in certain tissues exceeding the capacity of oxygen supply to the particular tissue (= functional locally restricted hypoxia)
In early embryonic stages of the zebrafish Danio rerio severe environmental hypoxia may cause developmental arrest Chronic exposure to mild hypoxia (PO2 = 10 kPa) however provoked an increase in heart rate as well as cardiac output at about hatching time or shortly thereafter A reduced hemoglobin oxygen-carrying capacity in the blood of zebrafish however did not induce any change in cardiac activity until 12-14 dpf Beyond 7 dpf animals raised under chronic hypoxia showed a significantly elevated red cell concentration in their blood and a redistribution of blood away from the gut to the segmental muscle tissue in the trunk region was observed A comparison of the vascular bed of various organs revealed no obvious differences in hypoxic animals compared to normoxic animals
Functional hypoxia achieved by chronic exposure of zebrafish larvae to a constant water current inducing an increase in swimming activity did not cause any adaptations in cardiac activity until 32 dpf Nevertheless critical PO2 in trained animals was reduced indicating an improvement of the oxygen transport system in these larvae In the muscle tissue an increase in mitochondrial density especially in red and intermediate muscle cells was observed At 32 dpf an increase in capillary density of the segmental muscle tissue as well as of the tail fin was detected in trained larvae and this correlated with an enhanced expression of VEGF in muscle tissue at this stage In gills and in the head region a stimulation of VEGF expression was already detectable at 15 dpf in trained animals
Taken together these results indicate that at about hatching time receptors are present which sense hypoxic conditions and this information can be used to stimulate convective oxygen transport in order to compensate for a reduction in bulk oxygen diffusion in the face of a reduced oxygen gradient between environmental water and tissues Erythropoiesis can be stimulated a few days after hatching The first modification of angiogenesis was detected at 32 dpf in trained fish VEGF expression suggests however that gill development might respond even earlier to the lack of oxygen
INTRODUCTION
In vertebrate embryos the heart is the first functional organ and with the onset of cardiac activity blood flow is observed very early in development Given the notion that the unfailing beat of the heart is necessary for life this observation may at first glance not be surprising The convective flow of blood through the circulation provides the ceaseless transport of the respiratory gases and nutrients
Institute for Zoology and Limnology and Center for Molecular Biosciences University of Innsbruck Austria 107
10
required by metabolism the waste products produced by metabolism and the hormonal cues that regulate metabolism and many other physiological functions This role of the circulation clearly is indisputable in adult vertebrates Within recent years many studies provided striking examples of the inaccuracy of this perspective with respect to the embryonic cardiovascular system Compelling evidence on many fronts revealed that the convective flow of blood generated by the early embryonic vertebrate heart is simply not required for transport of oxygen nutrients metabolic wastes or hormones all of which can be achieved entirely by diffusion (Burggren 2004 Pelster 2002 Territo and Altimiras 2001) In fact fish amphibian and even bird embryos lacking a functional heart can survive and develop for several days after fertilization
Thus the often expressed view that embryonic physiology merely is the physiology of adult animals but conducted on a smaller physical scale must be rejected The fact that in early developmental stages blood flow is not required for nutrient and respiratory gas transport implies that the coupling between metabolic activity of tissues and cardiac activity is not yet established during early development (Pelster 2002) This may be related to the observation that the autonomic nervous system gains control over the cardiovascular system only quite late during development in spite of the fact that histochemistry and neurophysiological experiments revealed that adrenergic and cholinergic receptors are present in cardiac muscle cells and in the central vascular system much earlier than the sympathetic or parasympathetic innervation is completed (Holeton 1971 Pappano 1977 Protas and Leontieva 1992) In these early stages cardiac activity and peripheral resistance obviously can be adjusted by various hormones (Fritsche 1997 Fritsche et al 2000 Kloberg and Fritsche 2002)
If in early developmental stages of fish and amphibians the cardiovascular system is not required for gas and nutrient supply to the tissues and is controlled in a different way as in adult animals the question arises how the embryos and larvae respond to changes in the environmental oxygen availability Do they notice environmental hypoxia Under hypoxic conditions when a reduced oxygen partial pressure gradient across the skin impairs cutaneous oxygen uptake convective oxygen transport maybe required in order to supply the tissues sufficiently
Conditions with a reduced oxygen availability can be achieved in several ways First of all environmental PO2 can drop resulting in a decrease in the PO2 gradient between the environment and the internal blood and tissues Second if the blood contributes to the oxygen supply to tissues a reduced oxygen supply can be achieved by reducing the oxygen carrying capacity of the blood ie by reducing the oxygen carrying capacity of the hemoglobin (hypoxemia) Thirdly the lack of oxygen can be achieved by increasing the oxygen demand of the tissues By stimulating muscular activity for example an increase in ATP turn over is induced which requires an additional supply with oxygen in order to generate ATP via the aerobic metabolism Chronic muscular activity thus may bring the oxygen transport pathway to its limits and cause oxygen shortage (= functional hypoxia)
Within recent years the effect of all three conditions has been tested in a couple of larval stages and in this study I would like to summarize our current knowledge about the influence of oxygen shortage on the development of the cardiovascular system in lower vertebrates especially in fish
108
THE EFFECT OF ENVIRONMENTAL HYPOXIA
Cardiac Activity
One possibility to test the capability of the cardiovascular system to cope with the lack of oxygen during development is to expose animals to varied environmental PO2 values (Fritsche and Burggren 1996 Orlando and Pinder 1995) Soon after fertilization fish eggs are surprisingly resistant towards a lack of oxygen Embryos of the Arctic charr (Salvelinus alpinus) exposed to anoxia for 8 hours at about 80 of embryonic development show a remarkable metabolic depression Metabolic activity assessed by measuring oxygen consumption as well as heat production is reduced to a few percent of control values and heart rate decreased by about 90 (Pelster 1999) Zebrafish embryos survive 24 hours of anoxia in a status of suspended animation in which cardiac activity ceases and mitotic activity of the blastomeres is arrested (Padilla and Roth 2001) The ability to survive anoxic conditions is restricted to very early stages however If the zebrafish embryos are exposed to anoxic conditions at about 30 h after fertilization less than 10 of the embryos were able to survive A significant decrease in heart rate and in cardiac output has been reported for very early stages of amphibians during periods of oxygen deficiency (Fritsche and Burggren 1996 Orlando and Pinder 1995 Pelster 1999) This decrease in activity has been attributed to a direct effect of the lack of oxygen on the metabolism of cardiomyocytes and it does not appear to be a controlled response which involves hormonal or neuronal activity (Orlando and Pinder 1995)
In Xenopus larvae a coordinated stimulation of cardiac activity in order to enhance convective oxygen transport during periods of hypoxia was only observed in later developmental stages (Orlando and Pinder 1995) In contrast to anoxia hypoxic conditions provoked a minor but significant tachycardia in salmonid larvae (Holeton 1971 McDonald and McMahon 1977) If the direct effect of hypoxia on cardiac muscle cells is a reduction in activity an increase in heart rate under these conditions must be due to an external stimulation which can only be explained as a coordinated response
In order to identify the point in development when cardiac activity becomes responsive to hypoxia and in order to question the importance of diffusional oxygen supply through the skin versus convective oxygen transport in the blood we raised zebrafish under normoxic and hypoxic conditions (PO2 = 10kPa prepared by equilibrating water with a mixture of air and N2 T = 28oC) We used zebrafish larvae because the small body size should facilitate diffusional oxygen transport and render convectional oxygen transport less important even in later developmental stages The results revealed that even in the small zebrafish larvae cardiac activity becomes responsive to environmental hypoxia already at about the time of hatching (Jacob et al 2002) In hypoxic incubated animals heart rate started to increase significantly compared to control animals at 4 dpf (Figure 1A) and cardiac output was significantly elevated at 34 and 5 dpf (Figure 1B) The comparison of systolic and end-diastolic ventricular volume revealed a significantly increased diastolic volume at 3 and 4 dpf but this increase did not persist on 5dpf The increase in cardiac output can only be explained as a coordinated response The reduction in water PO2 is detected by the animal and this information is used to stimulate cardiac activity
109
Figure 1 Heart rate (A) and cardiac output (B) in zebrafish larvae raised under normoxia (PO2 = 20 kPa) and under chronic hypoxia (PO2 = 10 kPa) at a temperature of 28oC n = 12 for 2 and 5 dpf 3 dpf n = 18 4 dpf n = 16 significantly different from controls (p lt 005) (Modified after (Jacob et al 2002))
The positive response to hypoxia in zebrafish is observed even earlier than in Xenopus larvae which is significantly larger than zebrafish Xenopus raised under normoxia (PO2 = 21 kPa) hypoxia (PO2 = 11 kPa) or under hyperoxia (PO2 = 35 kPa) until Nieuwkoop-Faber stage 51 showed no difference in oxygen uptake and in cardiac activity (Territo and Altimiras 1998 Territo and Burggren 1998) Thus fish larvae may respond to environmental hypoxia at an earlier stage than amphibian larvae Alternatively a PO2 of 11 kPa may not have been low enough to elicit a coordinated response in Xenopus larvae This explanation does not appear very likely however because for our experiments we used a similar PO2 of 10 kPa and this was very close to the lower threshold which permitted a complete development of zebrafish larvae without significantly increasing the rate of mortality
Blood Distribution
A redistribution of blood in response to different metabolic demands represents a well established physiological adaptation in many species While in zebrafish larvae raised under chronic hypoxia (10 kPa PO2) until 7 dpf no changes in blood distribution could be detected at 12 and 15 dpf blood perfusion was significantly higher in the muscle tissue of hypoxic animals than in control animals (Figure 2) In turn perfusion of the gut was significantly lower in hypoxic 12 dpf animals Brain perfusion was not affected by hypoxia (Schwerte et al 2003) Thus at 12 dpf under hypoxic conditions blood was shifted from the gut to the muscles in the tail region The so-called red-layer of muscle has been implicated in the uptake of oxygen in early larvae and at about the time of hatching (El-Fiky and Wieser 1988) Possibly blood is redistributed towards the muscle tissue in order to enhance oxygen uptake through the body surface under hypoxic conditions
110
Figure 2 Typical changes in erythrocyte cell count in zebrafish raised under control conditions (B D) and under chronic hypoxia (PO2 = 10 kPa AC) Red cell count per minute is given in false colors according to the calibration bat on the right side (From (Schwerte et al 2003) with permission)
Tissue Vascularization
In zebrafish larvae exposed to hypoxia no significant changes in the vascular bed were observed (Schwerte et al 2003) There appeared to be quite a high interindividual variation in the expression of small blood vessels like the parachordal vessels running longitudinally along the myoseptum or the caudal vascular tree but the overall morphometric analysis did not show significant differences between control and hypoxic animals Compared with the development of amphibians such as Xenopus or Rana or the development of salmonid larvae zebrafish development is very rapid and it could be that a rearrangement of the vascular bed is only possible in later developmental stages In a number of other vertebrates a stimulation of angiogenesis by hypoxic incubation has been demonstrated (Yue and Tomanek 1999) demonstrated that coronary vessels from cultured 6 day old quail embryo grow faster under hypoxic conditions while hyperoxia induced a delayed angiogenesis Chorioallantoic membrane capillarization of chicken embryos has been shown to increase during hypoxia (Dusseau and Hutchins 1988 Hudlicka et al 1992) In larval amphibians aquatic hypoxia stimulates growth of respiratory surfaces and enhances the transition from gill respiration to lung respiration (Burggren and Mwalukoma 1983) The lack in the angiogenetic response in hypoxic zebrafish is in line with the current concept of blood vessel formation in this species Weinstein and coworkers proposed that the initial wiring of blood vessels follows a fixed pattern and thus is largely based on the genetic information leaving little or no room for adaptations to environmental influences (Isogai et al 2003 Weinstein 1999) On the other hand molecular signals involved in the formation of blood vessels have been identified in early embryonic stages The molecular mechanisms which lead to the extremely regular pattern in the zebrafish trunk have been shown by (Childs et al 2002) and VEGF up- and down regulation seems to be involved in this process Whole mount in situ hybridization of zebrafish embryos indicated strong expression of VEGF already at 18 hours post fertilization (Gong et al 2004 Liang et al 1998 Liang et al 2001 Tan et al 2001 Weinstein 1999)
111
Red Cell Concentration
In mammals hypoxia usually causes an increase in oxygen transport capacity of the blood ie an increase in the number of circulating erythrocytes and in hemoglobin concentration Similar observations have been reported for embryos of the turtle Pseudemys nelsoni (Kam 1993) while in chicken embryos during early development a stimulation of red cell production was not observed (Baumann and Meuer 1992) In zebrafish larvae hypoxia increased red blood cell concentration larvae during the second week after fertilization while no effect was observed until 7dpf (Schwerte et al 2003) Until 7 dpf the concentration of red cells remained fairly constant in normoxic as well as in hypoxic animals The first presumptive proerythroblast-like cells can be detected in the zebrafish by the end of the first day (20 hpf) and this primitive cohort of cells originates in the intermediate cell mass (IMC) (Weinstein et al 1996) By tracing transfused fluorescence labeled blood cells into 15 day old host embryos these authors concluded that this first cohort of primitive red cells provides the embryo with all or nearly all red blood cells for at least 4 days A population of new larger and more adult appearing erythrocytes becomes predominant by 10 dpf The constant concentration of red cells observed in zebrafish until 7 dpf is in line with these results The elevated red cell concentration in 12 dpf larvae appears to be due to a hypoxic stimulation of erythropoiesis in zebrafish larvae as observed in fetal mammals (Richardson and Bocking 1998) for example or in embryos of the turtle Pseudemys nelsoni (Kam 1993) In this case the production of the second population of cells primarily observed at 10 dpf would have been stimulated by hypoxia
INFLUENCE OF A REDUCTION IN THE OXYGEN CARRYING CAPACITY (HYPOXEMIA)
A reduction in the oxygen carrying capacity of the blood can be achieved by impairing the oxygen binding of the hemoglobin Zebrafish have been incubated in an atmosphere containing CO and also in the presence of phenylhydrazine which oxidizes hemoglobin and thus reduces its oxygen binding capacity Zebrafish raised until 4 or 5 dpf under these conditions have a similar oxygen consumption compared to control animals (Pelster and Burggren 1996) Measurements of whole body lactate content did not provide any indication for a switch to anaerobic metabolism in the animals with a reduced oxygen carrying capacity until 12 dpf (Jacob et al 2002) Similar results have been reported for Xenopus larvae raised under chronic CO exposure until Nieuwkoop Faber stage 54 (Territo and Altimiras 1998 Territo and Burggren 1998)
A comparison of heart rate in zebrafish raised with a reduced oxygen carrying capacity with animals raised under control conditions overall revealed no significant differences until 15 dpf (Jacob et al 2002) At 15 dpf animals raised in the presence of phenylhydrazine had a reduced heart rate while heart rate of animals raised in the presence of CO was not different from controls Stroke volume was also hardly affected and accordingly cardiac output was hardly influenced except for the phenylhydrazin group at 15 dpf where deleterious effects of the drug increased the mortality of the larvae Thus hypoxemia did not stimulate cardiac activity until about two weeks after fertilization
112
HYPOXIA VERSUS HYPOXEMIA
Comparing the effect of hypoxemia on cardiac activity of zebrafish larvae with the effect of hypoxia it is apparent that hypoxemia does not stimulate cardiac activity but hypoxia does Under hypoxemia the PO2 gradient between the environmental water and the tissues is not different from normoxic conditions and thus bulk oxygen diffusion is sufficient to meet the oxygen requirements of the tissues Under hypoxia however the diffusion gradient of oxygen is reduced and even in the small zebrafish larvae (body weight less than 1 mg) this induces an increase in convective oxygen transport in order to compensate for the reduction in oxygen diffusion This clearly demonstrates that in zebrafish larvae at hatching time the afferent nervous system is able to sense hypoxic conditions Furthermore central control units are active and bring about a coordinated response to environmental perturbations (like oxygen deficiency) either by direct stimulation of the heart or by stimulation of hormone secreting cells like the chromaffin cells The secreted hormone in turn could then activate cardiac activity
An obvious conclusion from these considerations is that convective oxygen transport is not necessary in zebrafish larvae until about two weeks after fertilization if the PO2 gradient through the skin is normal If this gradient is reduced due to a decrease in environmental PO2 cardiac activity can be stimulated at about half a day or a day after hatching This appears to be even earlier than in the larger salmonid or Xenopus larvae where the hypoxic stimulation was not observed before 1 day after hatching or even later Thus the time in development at which a coordinated response of the ventricle becomes possible is not only governed by body mass Interesting and not yet completely explained is the observation of Territo and Altimiras (Territo and Altimiras 1998) that stroke volume and cardiac output are significantly enhanced in Xenopus laevis under chronic exposure to CO but not under hypoxia This is in clear contrast to the results reported for zebrafish larvae and the increase in cardiac output was only observed in very early stages of Xenopus not in later stages with a significantly larger body mass Territo and Altimiras concluded that the increase in cardiac output observed in embryonic stages was intrinsic in nature and did not significantly improve oxygen uptake In fact aerobic metabolism was similar in all experimental groups
THE INFLUENCE OF CHRONIC SWIMMING ACTIVITY
Hypoxic conditions can also result from an increased metabolic activity This is possible for example during periods of exercise where the increased activity of myosin ATPase significantly stimulates oxygen consumption of the muscle cells Swim training leads to a modification of growth rate and of food conversion efficiency in adult fish (Christiansen and Jobling 1990 Wieser et al 1988) To assess possible influences of chronic swimming activity on metabolism and growth of zebrafish larvae were trained in a swim tunnel system for about 15h every day at a water velocity of 5 blsec (Bagatto et al 2001) The training protocol had no influence on growth of the larvae although yolk absorption was significantly faster in animals exposed to a constant water current
An exciting observation was that compared to control animals free swimming larvae after 11 days of training between 21 dpf and 32 dpf had a higher MO2 at rest and a significantly lower rate of oxygen consumption in the swim tunnel at any given water velocity The higher rate of oxygen consumption at rest may be attributable to an increased activity level at rest The reduction in MO2 during activity however clearly shows that the efficiency of muscular contraction andor the efficiency of energy conversion have been improved in trained animals Furthermore training enhanced survival of larvae during exposure to low oxygen partial pressures (Bagatto et al 2001)
113
Exposure of early larval stages of zebrafish to a constant water current therefore induced physiological adaptations resulting in an enhanced swimming efficiency and in an increased tolerance towards hypoxia
A typical adaptation to endurance training is the so-called sports heart Cardiac activity of trained zebrafish larvae however showed no difference compared to untrained control animals in terms of heart rate stroke volume and cardiac output (Pelster et al 2003) Erythropoiesis was also not stimulated in trained animals Significant adaptations have been found at the tissue level In animals trained between 9 and 15 dpf and also in animals trained between 21 and 32 dpf mitochondrial density of red and intermediate muscle tissue was increased In adult fish like rainbow trout and Danube bleak sustained swim training can induce an increase in the aerobic capacity even in white muscle fibres (Davie et al 1986 Saumlnger and Poumltscher 2001) In zebrafish mitochondrial density of white muscle fibres of endurance and interval trained animals appeared to be higher as in untrained animals but this difference was not significant (Pelster et al 2003) It could well be that during this early stage of zebrafish development it is mainly the red and intermediate muscle portion recruited for the endurance swimming activity In mammals endurance exercise may even induce a fibre type transition in white muscle cells (Pette and Staron 2001) Such an adaptational change in white muscle fibres would enable the fish to use the more profitable aerobic pathways for energy production prevent local fatigue and enhance the removal of metabolic end products like lactate
In the older larvae total length of the tail fin blood vessels as well as the vascularization index of the axial tail muscle increased significantly after 11 days of continuous or interval swim training suggesting an improvement in the blood supply to the muscle cells (Figure 3) In larvae trained between 9 and 15 dpf angiogenesis was not enhanced (Pelster et al 2003) As in the older zebrafish larvae in adult rainbow trout (Davie et al 1986) and also in some cyprinid species like Chalcalburnus chalcoides mento Chondrostoma nasus and Leuciscus cephalus endurance exercise training has been shown to induce a significant increase in muscle capillarity (Saumlnger 1992 Saumlnger and Poumltscher 2001) These results indicate that angiogenesis is stimulated in fish during exercise training but this effect is not observed in very early developmental stages ie within the first two weeks of development in the zebrafish This is again in line with the idea that in the earliest developmental stages the wiring of blood vessels a fixed pattern and leaves little or no room for adaptations to environmental factors (Isogai et al 2003 Weinstein 1999) On the other hand if in zebrafish convective oxygen transport is not required to supply oxygen to the tissues until about two weeks after hatching it could also be that at this stage of development a modification of the vascular bed is not yet necessary
Perspectives The observation that the circulatory system of embryonic and early larval stages is not working in order to supply the tissue with oxygen and nutrients can be attributed to the small size of the larvae This implies however that the early larval circulatory system is not controlled the same way as the adult circulatory system Nevertheless recent data indicate that early developmental stages can sense their environment and via hormonal control cardiovascular activity can modified in response to environmental information In addition the patterning of the cardiovascular system can be influenced by environmental parameters Accordingly functional development is not only controlled by genetic information but it appears to be responsive to environmental input Thus studying development in the light of genetic and environmental constituents appears to be a promising task
114
Figure 3 A Capillary length measured in the tail fin in control animals and in interval or continuously trained animals N = 9 B Vascularization index determined in the axial muscle tissue caudal from the anus in control and in interval or continuously trained animals N = 10 Scale bars 250 m indicates significant differences between trained and control animals (plt005) (modified after Pelster et al 2003)
115
ACKNOWLEDGEMENT
The study was financially supported by the Fonds zur Foumlrderung der wissenschaftlichen Forschung (FWF P12571-BIO P14976-BIO)
REFERENCES
Bagatto B B Pelster and WW Burggren 2001 Growth and metabolism of larval zebrafish effects of swim training Journal of Experimental Biology 204 4335-4343
Baumann R and HJ Meuer 1992 Blood oxygen transport in early avian embryo Physiological Reviews 72 941-965
Burggren WW 2004 What is the purpose of the embryonic heart beat or How facts can ultimately prevail over physiological dogma Physiological and Biochemical Zoology 77 333-345
Burggren WW and A Mwalukoma 1983 Respiration during chronic hypoxia and hyperoxia in larval and adult bullfrogs (Rana catesbeiana) I Morphological responses of lungs skin and gills Journal of Experimental Biology 105 191-203
Childs S JN Chen DM Garrity and MC Fishman 2002 Patterning of angiogenesis in the zebrafish embryo Development 129 973-982
Christiansen JS and M Jobling 1990 The behaviour and the relationship between food intake and growth of juvenile Arctic charr Salvelinus alpinus L subjected to sustained exercise Canadian Journal of Zoology 68 2185-2191
Davie PS RMG Wells and V Tetens 1986 Effects of sustained swimming on rainbow trout muscle structure blood oxygen transport and lactate dehydrogenase isozymes evidence for increased aerobic capacity of white muscle Journal of Experimental Zoology 237 159-171
Dusseau JW and PM Hutchins 1988 Hypoxia-induced angiogenesis in chick chorioallantoic membranes a role for adenosine Respiration Physiology 71 33-44
El-Fiky N and W Wieser 1988 Life styles and patterns of development of gills and muscles in larval cyprinids (Cyprinidae Teleostei) Journal of Fish Biology 33 135-145
Fritsche R 1997 Ontogeny of cardiovascular control in amphibians American Zoologist 37 23-30
Fritsche R and WW Burggren 1996 Development of cardiovascular responses to hypoxia in larvae of the frog Xenopus laevis American Journal of Physiology 271 R912-917
Fritsche R T Schwerte and B Pelster 2000 Nitric oxide and vascular reactivity in developing zebrafish Danio rerio American Journal of Physiology 279 R2200-R2207
Gong B D Liang TG Chew and R Ge 2004 Characterization of the zebrafish vascular endothelial growth factor A gene comparison with vegf-A genes in mammals and Fugu Biochimica et Biophysica Acta 1676 33-40
116
Holeton GF 1971 Respiratory and circulatory responses of rainbow trout larvae to carbon monoxide and to hypoxia Journal of Experimental Biology 55 683-694
Hudlicka O M Brown and S Egginton 1992 Angiogenesis in skeletal and cardiac muscle Physiological Reviews 72 369-417
Isogi S ND Lawson S Torrealday M Horiguchi and BM Weinstein 2003 Angiogenic network formation in the developing vertebrate trunk Development 1305281-5290
Jacob E M Drexel T Schwerte and B Pelster 2002 The influence of hypoxia and of hypoxemia on the development of cardiac activity in zebrafish larvae American Journal of Physiology 283 R911-R917
Kam YC 1993 Physiological effects of hypoxia on metabolism and growth of turtle embryos Respiration Physiology 92 127-138
Kloberg AJ and R Fritsche 2002 Catecholamines are present in larval Xenopus laevis A potential source for cardiac control Journal of Experimental Zoology 292 293-303
Liang D JR Chang AJ Chin A Smith C Kelly ES Weinberg and R Ge 2001 The role of vascular endothelial growth factor (VEGF) in vasculogenesis angiogenesis and hematopoiesis in zebrafish development Mechanisms of Development 108 29-43
Liang D X Xu AJ Chin NV Balasubramaniyan MA Teo TJ Lam ES Weinberg and R Ge 1998 Cloning and characterization of vascular endothelial growth factor (VEFG) from zebrafish Danio rerio Biochemica Biophysica Acta 139714-20
McDonald DG and BR McMahon 1977 Respiratory development in Arctic char Salvelinus alpinus under conditions of normoxia and chronic hypoxia Canadian Journal of Zoology 55 1461-1467
Orlando K and AW Pinder 1995 Larval cardiorespiratory ontogeny and allometry in Xenopus laevis Physiological Zoology 68 63-75
Padilla PA and MB Roth 2001 Oxygen deprivation causes suspended animation in the zebrafish embryo Proceedings of the National Academy of Science USA 987331-7335
Pappano AJ 1977 Ontogenetic development of autonomic neuroeffector transmission and transmitter reactivity in embryonic and fetal hearts Pharmacological Reviews 29 3-33
Pelster B 1999 Environmental influences on the development of the cardiac system in fish and amphibians Comparative Biochemistry and Physiology PtA 124 407-412
Pelster B 2002 Developmental plasticity in the cardiovascular system of fish with special reference to the zebra fish Comparative Biochemistry and Physiology 133A 547-553
117
Pelster B and WW Burggren 1996 Disruption of haemoglobin oxygen transport does not impact oxygen- dependent physiological processes in developing embryos of zebrafish (Danio rerio) Circulation Research 79 358-362
Pelster B AM Saumlnger M Siegele and T Schwerte 2003 Influence of swim training on cardiac activity tissue capillarization and mitochondrial density in muscle tissue of zebrafish larvae American Journal of Physiology 285 R339-R347
Pette D and RS Staron 2001 Transitions of muscle fiber phenotypic plasticity Histochemistry and Cell Biology 115 359-372
Protas LL and GR Leontieva 1992 Ontogeny of cholinergic and adrenergic mechanisms in the frog (Rana temporaria) heartr American Journal of Physiology 262 R150-R161
Richardson BS and AD Bocking 1998 Metabolic and Circulatory Adaptations to Chronic Hypoxia in the Fetus Comparative Biochemistry and Physiology 119A 717-723
Saumlnger AM 1992 Effects of training on axial muscle of two cyprinid species Chondrostoma nasus (L) and Leuciscus cephalus (L) Journal of Fish Biology 40 637-646
Saumlnger AM and U Poumltscher 2001 Endurance exercise training affects fast white axial muscle in the cyprinid species Chalcalburnus chalcoides mento (Agassiz 1832) Cyprinidae Teleostei Basic and Applied Myology 10 297-300
Schwerte T D Uumlberbacher and B Pelster 2003 Non-invasive imaging of blood cell concentration and blood distribution in hypoxic incubated zebrafish in vivo (Danio rerio) Journal of Experimental Biology 206 1299-1307
Tan DC RM Kini SD Jois DK Lim L Xin and R Ge 2001 A small peptide derived from Flt-1 (VEGFR-1) functions as an angiogenic inhibitor FEBS Letters 494 150-156
Territo PR and J Altimiras 1998 The ontogeny of cardio-respiratory function under chronically altered gas compositions in Xenopus laevis Respiration Physiology 111 311-323
Territo PR and J Altimiras 2001 Morphometry and estimated bulk oxygen diffusion in larvae of Xenopus laevis under chronic carbon monoxide exposure Journal of Comparative Physiology B 171 145-153
Territo PR and WW Burggren 1998 Cardio-respiratory ontogeny during chronic carbon monoxide exposure in the clawed frog Xenopus laevis Journal of Experimental Biology 201 1461-1472
Weinstein BM 1999 What guides early embryonic blood vessel formation Developmental Dynamics 215 2-11
Weinstein BM AF Schier S Abdelilah J Malicki L Solnica-Krezel DL Stemple DY Stainier F Zwartkruis W Driever and MC Fishman 1996 Hematopoietic mutations in the zebrafish Development 123 303-309
118
Wieser W H Forstner N Medgyesy and S Hinterleitner 1988 To switch or not to switch partioning of energy between growth and activity in larval cyprinids (Cyprinidae Teleostei) Functional Ecology 2 499-507
Yue X and R J Tomanek 1999 Stimulation of coronary vasculogenesisangiogenesis by hypoxia in cultured embryonic hearts Developmental Dynamics 216 28-36
119
120
A BIOCOMPUTATIONAL TOOL TO MEASURE CARDIAC RHYTHMS IN ZEBRAFISH
Shuk Han Cheng11 Eric Po Kwok Chan and Alex Chun Chi Lin
ABSTRACT
The zebrafish embryo has become one of the popular vertebrate model organisms for developmental toxicology research The transparent embryo becomes a viable model for providing assessment of cardiovascular functions However the most commonly used measurement tool for heart beat rate is simple visual examination In our laboratory we have developed a prototypical biocomputational tool to quantify the cardiac function of heart beat Heart beat pattern was digitally recorded and the images were assessed by digital motion analysis in the caudal blood vessels whereby the flow of blood cells was measured The software gave an indication of heart beat rates which were correlated positively with the heart beat rates measured by visual observation Using the insecticide carbaryl we demonstrated that this toxicant elicited irregular heart beat This perturbation of cardiovascular function is previously unreported as carbaryl is thought to be a rather safe insecticide for humans and animals Our biocomputational technique can be readily adapted to screen for toxic effects of other physical and chemical toxicants in this test system
INTRODUCTION
The developing fish embryos and larvae are often used in toxicity testing due to their high sensitivity towards toxicants Increasingly developmental toxicity has been incorporated in risk assessment procedures Detailed understanding on how toxicants affect physiological and developmental processes in embryonic fish serves as a foundation for assessment of fitness and survival Notwithstanding there is still a paucity of data on anatomical malformations and physiological impairment of internal organs caused by exposure to toxicants
The transparent zebrafish embryo is an ideal model for studying cardiovascular toxicity of chemicals (reviewed in Schwerte and Fristsche 2003) For example polycyclic aromatic hydrocarbons induced bradycardia and arrhythmias characteristic of atrioventricular conduction block in zebrafish embryos (Incardona JP et al 2004) Apart from morphological description of the cardiovascular system and measurements of heart rates the assessment of heartbeat rhythm is also of paramount importance in cardiovascular physiology Irregular heartbeat rhythm caused by side-effects of non-cardiac drugs is often related with sudden death in human However assessment of the regularity of heartbeat rhythm is not readily available in these zebrafish embryos
We report here the prototype of a non-invasive method to measure regularity of heartbeat The method involves two separate steps namely image analysis using digital motion analysis of caudal blood flow and the power spectral analysis of image data Digital motion analysis was developed by Schwerte and Pelster (2000) in which movement of blood cells was analyzed by image subtraction between 2 video frames (figure 1A) In this image subtraction pixels in each frame were separated in
Department of Biology and Chemistry City University of Hong Kong Tat Chee Avenue Kowloon Hong Kong
121 11
2 categories The first category included static pixels which were located in the non-moving area where no intensity change occurred between 2 video frames The second category included dynamic pixels which were located in the moving area where intensity change occurred between 2 video frames Since the time interval between 2 video frames was constant the amount of dynamic pixels was larger
if the object moved faster (figure 1B and figure 1C)
A
B
C
Figure 1 (A) Image subtraction of 2 video frames (B amp C) Schematic diagram illustrates the amount of dynamic pixels obtained if object is moved slowly (B) or quickly (C)
Based on this idea a pilot program was developed to perform image subtraction in video sequence recording caudal blood flow in 48-hpf zebrafish embryos Instead of summing up the dynamic pixels as described in the original methodology (Schwerte and Pelster 2000) the amount of dynamic pixels of each video frame was treated as a sequence of data in a time series Plotting of the time series data of dynamic pixels from control embryo showed a waveform correlation (figure 2A) This effect was similar to the direct observation of pulsatile blood cell movements under a microscope We performed power spectral analysis on the waveform pattern of dynamic pixels in order to extract frequency specific characteristics from the data set comprising the dynamic pixels The power spectrum of waveform represented in figure 2A actually consisted of 3 peaks (figure 2B) suggesting the existence of 3 basic frequency components in this time series data of dynamic pixels Since the second and the third frequency component were the higher integer multiples of the first frequency component they were considered as the harmonics of the first frequency component (Stefanovska and Bracic 1999) In this preliminary study power spectra of control embryos (n=6) were analyzed (figure 3A) It consisted of 3 frequency components and the second and the third component were the exact multiples of the first frequency (figure 3A) Conversion of the units of major frequency values from per second to per minute resulted in values correlating directly to measurements of heart rates being counted visually from video recordings of heart chamber beating (figure 3B) This pilot experiment showed that the
122
power spectral analysis gave us an direct indication of the heart beat rate
A
B
Figure 2 Percentage of dynamic pixel (A) and its corresponding power spectrum (B) of a control embryo
We then perturbed the experimental system with the addition of carbaryl a carbamate insecticide to the fish embryo culture Carbaryl was considered a low toxicity insecticide for both human and other vertebrates However previous studies showed that carbaryl induced ultrastructural changes in the heart (Tos-Luty et al 2001) and caused reduced heart rate (Kossakowski 1987) In a preliminary experiment to demonstrate the application of our method an embryo exposed to 10 ppm of carbaryl for 48 hours was analyzed The waveform of dynamic pixels appeared to be similar to those obtained from control embryos (figure 4A) However using power spectrum of the carbaryl-treated embryo we could not identify any peak corresponding to a specific frequency component (figure 4B) Therefore this preliminary experiment suggested that carbaryl disturbed the regularity of heartbeat resulting in the heart beating in a random manner in this carbaryl-treated embryo
123
A
B
Figure 3 (A) Power spectra of six control embryos (B) Correlation of heart rate determined by power spectral analysis and direct visual counting in heart
A
B
Figure 4 Percentage of dynamic pixels (A) and its corresponding power spectrum (B) of a carbaryl-treated embryo
In summary our preliminary results showed that our method was able to measure heart rate digitally as compared to the conventional visual method In addition this method can demonstrate the regularity of heartbeat and identify irregular beatings in zebrafish embryos However it still requires
124
a large sample size in order to investigate the correlation between irregular heartbeats and absence of frequency component peak in power spectrum after toxicant treatments Furthermore we need to identify parameters of the power spectrum which are necessary for the quantification of heartbeat rhythms
REFERENCES
Incardona JP TK Collier and NL Scholz 2004 Defects in cardiac function precede morphological abnormalities in fish embryos exposed to polycyclic aromatic hydrocarbons Toxicol Appl Pharmacol 196191-205
Kossakowski S 1987 Electrocardiogram of rabbits experimentally intoxicated with carbaryl Polskie Archiwum Weterynaryjne (Warszawa) 2715-28
Schwerte T and R Fritsche 2003 Understanding cardiovascular physiology in zebrafish and Xenopus larvae the use of microtechniques Comparative Biochemistry and Physiology A Molecular Integrated Physiology 135131-145
Schwerte T and B Pelster 2000 Digital motion analysis as a tool for analyzing the shape and performance of the circulatory system in transparent animals Journal of Experimental Biology 2031659-1669
Stefanovska A and M Bracic 1999 Physics of the human cardiovascular system Contemporary Physics 40 31-55
Tos-Luty S D Przebirowska J Latuszynska and M Tokarska-Rodak 2001 Histological and ultrastructural studies of rats exposed to carbaryl Annual Agric Environ Med 8137-44
125
126
HYPOXIA IN REPTILES
Tobias Wang12 and Nini Skovgaard
ABSTRACT
Reptiles are amongst the most hypoxia and anoxia-tolerant vertebrates and some species such as turtles are therefore favored organisms for studies on metabolic adaptations to oxygen lack Although reptiles are unlikely to experience hypoxic environments they are often hypoxic at the tissue level due to large cardiac shunts and prolonged periods of breath-hold Here we briefly review some of the physiological responses to hypoxia with particular emphasis on local responses in the pulmonary circulation Hypoxic pulmonary vasoconstriction is more prevalent in species with anatomically complex lungs and is particularly expressed in species that also have a functionally divided heart where increased pulmonary vascular resistance does not affect the cardiac shunt flow We also review the metabolic responses to hypoxia and argue that the hypoxic conditions created by intracardiac shunts and breath-hold may serve to downregulate metabolism thorough direct effects of low oxygen levels on cellular metabolism
INTRODUCTION
Reptiles and other air-breathing animals are at least in comparison with aquatic animals unlikely to experience severe hypoxic environments unless when inhabiting or entering high altitude High altitude is normally associated with low environmental temperatures which rather than low oxygen levels is likely to be a limiting factor for the distribution of reptiles However reptiles exhibit a number of anatomical physiological and behavioural traits that results in low oxygen levels of lung gases and arterial blood In particular they have undivided hearts so arterial and venous blood is mixed within the ventricle leading to low oxygen levels in the blood Also many species exhibit prolonged periods of breath hold where lung PO2 and arterial oxygen levels can decline to very low values Many reptiles therefore routinely experience hypoxia at the tissue level Furthermore reptiles are rather tolerant to oxygen lack and species such as freshwater turtles are amongst the most anoxia-tolerant vertebrates Many studies therefore have been performed on the anoxia and hypoxia-tolerance of reptiles with an aim to understand basic mechanisms common to all vertebrates
Reptiles are ectohermic vertebrates with a relatively low metabolism compared to endothermic vertebrates Because of the low metabolism reptiles are characterized by much lower rates of pulmonary ventilation and many species breathe episodically with long-lasting periods of breath holds The different taxonomic groups of reptiles vary substantially with regards to heart morphology and lung structure (Farrell et al 1998 Hicks 1998 Perry 1989 1998) and it is likely that studies on the effects of hypoxia in reptiles with diverse cardiac and pulmonary morphologies can provide insight into the evolution of physiological responses to hypoxia amongst air-breathing vertebrates
In terms of evolutionary studies reptiles represent a phylogenetically important group because endothermic birds and mammals evolved independently from reptilian ancestors (Page 2000 Fig 1)
12 Department of Zoophysiology Building 131 University of Aarhus 8000 Aarhus C Denmark
127
The evolution of endothermy was associated with an approximate ten-fold rise in resting and maximal rates of oxygen consumption (eg Bennett and Ruben 1979) This transition placed great demands on the circulatory and respiratory systems (Taylor and Weibel 1981) requiring higher resting and maximal heart rates to match the increased need for oxygen delivery and elevated blood pressure to secure adequate perfusion pressure for the higher capillary density (Burggren et al 1997 Lillywhite et al 1999) In the pulmonary circulation higher structural complexity allowed for smaller gas exchange units and increased surface area which together with a thinner blood-gas barrier increased the pulmonary diffusive capacity for O2 (Perry 1990 West 2003) The very thin blood-gas barrier in endothermic vertebrates required a complete cardiac division and separation of the pulmonary and systemic circulations to allow for low pulmonary pressure to protect the respiratory epithelium from a high vascular pressure (West 2003) The higher complexity however also increased the possibilities for ventilation-to-perfusion in homogeneities (Piiper 1992 Powell and Hopkins 2004) These cardio-respiratory changes certainly enabled a substantial rise in oxygen transport from air to the metabolising tissue which allows for increased exercise stamina but the higher metabolic rate also leads to an increased reliance on oxidative metabolic pathways and made the endothermic animals more susceptible to hypoxia This sensitivity to hypoxia is perhaps best illustrated by the intolerance to ischemia and hypoxia which characterizes the heart and brain of mammals where few minutes of ischemia can lead to irreversible brain damage and persisting depressions of cardiac contractility
Fish Amphibians Mammals Turtles Lizards Snakes Crocodiles Birds
Reptilian ancestors
Figure 1 The phylogenetic relations between vertebrates Endothermic birds and mammals evolved independently from reptilian ancestors and the four groups of extant reptiles (turtles lizards snakes and crocodiles) therefore constitute an important group for comparative studies on the evolution of physiological responses to hypoxia
Here we review the physiological and metabolic responses to hypoxia in reptiles and compare these responses to the endothermic mammals and birds Rather than providing a detailed review on all aspects of the hypoxic responses we will place emphasis on the pulmonary circulation and the possible effects of the internal hypoxia that can be caused by prolonged breath hold and cardiac shunts
128
THE REPTILIAN HEART AND ITS EFFECT ON ARTERIAL OXYGEN LEVELS
In most non-crocodilian reptiles the ventricle is anatomically and functionally undivided and blood pressures are therefore equal in systemic and pulmonary circulations (eg Hicks 1998 Fig 2B) This allows for cardiac shunting of blood flow where systemic (right-to-left R-L) or pulmonary (left-to-right L-R) circulation is by passed In species where the ventricle is undivided the heart basically functions as a single pressure source and blood flow distribution between pulmonary and systemic circulations is primarily determined by pulmonary and systemic vascular resistances respectively Thus when pulmonary vascular resistance is low a L-R shunt will prevail whilst large R-L shunts exist when pulmonary vascular resistance is high This relationship between vascular resistances and blood flow distribution is illustrated in Figure 2A which shows that turtles exhibit large R-L shunts (ie a low QpulQsys) when pulmonary vascular resistance is high relative to systemic vascular resistance (ie a low RpulRsys) and vice versa
3 40
30
Qpu
lQsy
s 2
1 net left-to-right cardiac shunt
net right-to-left cardiac shunt bloo
d pr
essu
re(c
m H
2O)
20
10
1 sec 0 0
0 1 2 3 4
RpulRsys
Figure 2 A The distribution of blood flows between the systemic and pulmonary circulations in anaesthetized turtles where the cardiac shunt pattern is expressed as QpulQsys Qpul pulmonary blood flow Qsys systemic blood flow Rpul pulmonary vascular resistance Rsys systemic vascular resistance (modified from Crossley et al 1998) B Simultaneous recording of systemic and pulmonary blood pressures (in blue and red respectively) in an anaesthetized turtle Note that systolic pressures are similar in the two circulatory systems whereas diastolic pressures are lower in the pulmonary circulation due to the lower resistance
It is well established that virtually all reptiles regulate pulmonary vascular resistance through constriction or dilatation of smooth muscle surrounding the common pulmonary artery close to where it emerges from the ventricle This smooth muscle is innervated by the vagus nerve and increased vagal activity leads to a constriction of the pulmonary artery which can be blocked with atropine Reptiles therefore are able to regulate their cardiac shunt pattern and it is now well established that the low heart rate that is characteristic during breath hold and diving is attended by large R-L cardiac shunts where most of the blood recirculates within the systemic circulation without being oxygenated In contrast during pulmonary ventilation pulmonary vascular resistance is greatly reduced and
129
pulmonary blood flow increases markedly which in some cases is associated with L-R shunts
There are a few reptiles where the ventricle is functionally divided so that pulmonary blood pressures are much lower than systemic blood pressures This deviation from the normal reptilian pattern of low systemic and pulmonary blood pressures has only been described in varanid lizards and pythons and these two groups have blood pressures that resemble those of mammals (Burggren and Johansen 1982 Wang et al 2002 2003) The functional division of the ventricle allows for high systemic blood pressures whilst protecting the lungs by having low pulmonary blood pressures and has often been linked to the high metabolic rates and exercise stamina of varanid lizards A similar teleological reasoning is not obvious for pythons but it is possible that the functional division of their hearts is related to the high metabolic rates that these animals have during incubation of the eggs (Wang et al 2003)
The cardiac right-to-left shunt has pronounced effects on arterial blood gas composition and oxygen transport During a right-to-left shunt oxygen poor venous blood bypasses the lungs and consequently does not become oxygenated and is shunted directly back into the systemic circulation The oxygen concentration of arterial blood therefore becomes the weighed average of the oxygen concentrations in the blood returning from the lungs and that of the blood which is shunted away from the pulmonary circulation Formally this can be described by the shunt equation
[O2]a = (Qpul x [O2]pv + QR-L x [O2])( Qpul + QR-L)
where [O2]a [O2]pv and [O2]sv are the oxygen concentration in arterial blood the pulmonary vein and the systemic venous blood respectively while Qpul Qsys and QR-L are pulmonary systemic and shunt blood flows respectively Arterial oxygen concentration and thereby the arterial partial pressure of oxygen are reduced according to the magnitude of the shunt flow but also according to venous oxygen concentrations The effects of cardiac shunting has been measured in several species (see Burggren et al 1979 White et al 1989 Wang et al 1998)
A number of recent studies show that resting undisturbed reptiles normally exhibit large cardiac right-to-left shunts (eg White et al 1989 Wang et al 1996a Wang et al 1998 Krosniunas and Hicks 2003) However when metabolic rate is elevated due to muscular exercise increased temperature or digestion the R-L shunt is reduced (Wang et al 1997 Krosniunas and Hicks 2003) Thus it seems that reptiles regulate oxygen delivery by altering the cardiac shunt according to metabolic demand (Wang et al 1997 Wang et al 2001)
PHYSIOLOGICAL RESPONSES TO HYPOXIA
When exposed to hypoxia animals can increase the transport of oxygen through the ventilatory and cardiovascular systems to maintain oxygen delivery at a sufficiently high level that allows metabolism to be maintained at the normoxic value Reptiles certainly do exhibit both increases in ventilation and heart rate in response to hypoxia but it is also becoming clear that many reptiles in common with other vertebrates respond by decreasing metabolism which reduces the demand on oxygen transport The physiological responses to hypoxia are elicited through stimulation of oxygen sensitive chemoreceptors which seem to be located rather diffusively within the systemic arterial arches but there is also some evidence for receptors on the pulmonary artery In this case hypoxic responses may also be elicited through reductions in venous oxygen levels
130
EFFECTS OF HYPOXIA ON CARDIAC SHUNT PATTERNS
During exposure to hypoxia it is clearly advantageous for oxygen transport to reduce or eliminate the cardiac R-L shunt A reduction in cardiac shunt has indeed been documented in hypoxic turtles (Wang et al 1997) This reduction can at least in part be ascribed to the rise in ventilation which due to the tight interaction between ventilation and cardiac shunt patterns reduces the periods of R-L shunt that are associated with breath hold Thus it remains to be established whether the cardiac shunt pattern is directly affected by stimulation of oxygen sensitive chemoreceptors or merely a consequence of increased ventilation However when arterial oxygen concentration is reduced through reductions in blood haemoglobin concentration or exposure to carbon monoxide there are large reductions in the cardiac R-L shunt which certainly is beneficial for oxygen transport The receptors that are responsible for these responses remain to be characterized (Wang et al 1997)
THE REPTLIAN LUNG AND THE DIRECT EFFECT OF HYPOXIA
The reptilian lung is structurally rather simple compared to that of mammals and birds Thus in most snakes and lizards the lungs merely consist of large air sacs with few subdivisions and the area for gas exchange is therefore very limited compared to mammals and birds (Luchtel and Kardong 1981 Hlastala et al 1985 Maina 1989) On the other hand the lungs of turtles varanid lizards and crocodiles are more complex and compartmentalized increasing the surface area and the capacity for oxygen diffusion (Perry 1983 1989 1998)
A great number of studies have shown that reptiles increase ventilation when exposed to hypoxia and the rise in overall ventilation is mainly accomplished through an increased breathing frequency while tidal volume only increases in some cases (Milsom 1991)
Low oxygen levels in the lungs of birds and mammals cause constriction of the pulmonary vasculature elevating resistance to pulmonary blood flow and increasing pulmonary blood pressure (Euler and Liljestrand 1946 Motley et al 1947 Faraci et al 1984) This response hypoxic pulmonary vasoconstriction (HPV) diverts pulmonary blood flow from poorly ventilated and hypoxic areas of the lung to more well-ventilated parts HPV is considered important for local matching of ventilation to blood perfusion improving pulmonary gas exchange and maintaining systemic arterial PO2 (Euler and Liljestrand 1946 Dawson 1984 Brimioulle et al 1996) The primary site of HPV is the precapillary muscular pulmonary arteries (Weir and Archer 1995) HPV is detrimental during exposure to hypoxic gases where the entire pulmonary circulation becomes hypoxic and increases pulmonary arterial pressure
HPV is a locally mediated response that persists in isolated perfused lungs with no neurohumoral influences and also occurs in isolated rings of pulmonary vascular smooth musculature (Fishman 1976 McMurty et al 1978 Robertson et al 1995) HPV reflects an inherent property of the pulmonary vascular smooth muscle and is likely to be mediated by inhibition of one or several different types of K+-channels whilst various endothelium-derived vasoactive compounds act as modulators (Ward and Robertson 1995 Weir and Archer 1995 Loacutepez-Barneo et al 2004 Ward et al 2004) In contrast the systemic circulation of most vertebrates responds to hypoxia by vasodilatation (Detar 1980 Crossley et al 1998 Shimizu et al 2000 Smith et al 2001)
The breathing pattern of many reptiles particularly aquatic species is characterized by ventilatory episodes of one or several breaths interspersed between non-ventilatory periods of varying
131
length (Milsom 1991) During non-ventilatory periods lung and blood PO2 decrease as the oxygen stores are exhausted (eg Burggren and Shelton 1979) In species with an undivided ventricle blood flow distribution between pulmonary and systemic circulations is primarily determined by pulmonary and systemic vascular resistances (Hicks 1998 Crossley et al 1998) so HPV would induce a pulmonary by pass of blood flow (right-to-left cardiac shunt) and reduce the ability to exploit the pulmonary oxygen reserve during breath hold In animals with a divided heart such as caimans HPV during breath hold will nevertheless cause pulmonary hypertension that may disturb pulmonary fluid balance (Welling et al 1997)
We have recently shown that hypoxia causes a reversible constriction of the pulmonary vasculature in turtles varanids and caimans (Crossley et al 1998 Skovgaard et al 2005) These three species possess complex multicameral lungs and it is likely that HPV would aid to secure VQ homogeneity There is no response to hypoxia in rattlesnakes (Skovgaard et al 2005) which is consistent with the view that species with structurally simple lungs rely less on local responses for proper VQ matching However tegu lizards that also have simple unicameral lungs do exhibit HPV (Skovgaard et al 2005) albeit at a lower hypoxic threshold than varanids and caimans Thus while the data support our general hypothesis that HPV is more pronounced in species with complex lungs and divided hearts it is also clear that other components are involved HPV evolved to improve the VQ matching however in species with a poorly divided ventricle this benefit is counterbalanced by the fact that HPV impairs the ability to increase pulmonary blood flow during non-ventilatory periods The apparent blunted HPV in turtles compared to caimans may therefore ensure that pulmonary blood flow can be increased during for instance submergence (Crossley et al 1998)
REDUCTIONS IN METABOLISM DURING HYPOXIA a DECREASE IN PREFERRED BODY TEMPERATURE ANDOR REDUCTIONS IN BASAL METABOLIC
RATE
Most of the physiological responses during hypoxia such as the increased ventilation and elevated cardiac output serve to enhance oxygen transport ensuring an adequate oxygen delivery to maintain normal oxygen consumption However reptiles can also utilise an opposite or alternative strategy where they reduce metabolism and therefore the need for oxygen during hypoxia (see Hicks and Wang 2004) This metabolic depression reduces energy demand and therefore lessens the demands on the cardio-respiratory system limits utilization of substrate reserves and reduces the accumulation of toxic metabolites A reduction in metabolism during hypoxia is not limited to reptiles and has been extensively documented in newborn mammals and birds (eg Mortola and Frappell 2000 Mortola 2004) Also diving birds and mammals appear to reduce metabolic rate when diving (Butler 2004) and it is becoming increasingly clear that metabolic rate is more plastic than previously thought
There are two strategies to reduce metabolism during periods of limited oxygen availability Firstly animals can utilise a behavioural reduction of the preferred body temperature that through the direct effect of temperature on biochemical processes (the so-called ldquoQ10 effectrdquo or the ldquoArhenius effectrdquo) decreases the rate of metabolic processes Assuming a Q10 of ~ 25 for oxygen consumption aerobic demands decrease by approximately 11 per degree C reduction of body temperature Second at a constant body temperature animals can reduce ATP demands which reduce basal metabolic rate As a corollary mechanism reptiles and other animals can reduce physical activity during hypoxia which obviously reduces oxygen usage
132
Ectothermic animals such as reptiles generate a limited amount of heat through metabolism and rely on the environment to maintain body temperature and use behavioural mechanisms such as basking andor shuttling between sun and shade to achieve the preferred body temperature By these mechanisms reptiles regulate body temperature within a rather narrow range that is determined by a thermal set-point within the central nervous system (Cabanac 1975 Steiner and Branco 2002) The mechanism by which hypoxia lowers this set-point remains obscure (Wood 1991 Steiner and Branco 2002) but a reduction in the preferred body temperature has been documented in teleost fish amphibians reptiles mammals and birds (eg Bryan et al 1984 Hicks and Wood 1985) and even appears to be a universal response amongst all animals (Wood 1991 Malvin and Wood 1992) Apart from low oxygen levels in the inspired air anemia can also cause a reduction in body temperature as shown in lizards (Hicks and Wood 1985) and a reduction of the preferred body temperature is also a common response to fasting and starvation where the reduction on metabolism may prolong the period that animals can tolerate being without food
A reduction in metabolism during hypoxia can be accomplished through an actual depression of cellular metabolism at unchanged temperature This metabolic depression has been studied extensively during complete lack of oxygen ie anoxia and it is particularly very anoxia-tolerant species such as freshwater turtles that can survive for many months without oxygen Thus using calorimetric measurements Jackson and Schmidt-Nielsen (1966) showed that heat production of turtles decreases approximately ten-fold within hours after being exposed to anoxia A number of subsequent studies on individual organs such as brain heart and liver have shown that the metabolic depression during anoxia is a regulated response that involves reductions in active membrane transport and membrane permeability as well as a down-regulation of various synthetic pathways such as protein synthesis (Nilsson et al 1991 Buck et al 1993a Buck et al 1993c Land et al 1993 Hochachka et al 1996 1997 2001 Lutz and Kabler 1997) The depression of metabolism obviously extends the period of survival during anoxia but does not prevent the accumulation of lactate and anoxia is invariably associated with a progressive development of a metabolic acidosis
While much attention has been paid to describing and understanding the suppression of metabolism during anoxia fewer studies have been devoted to understanding how hypoxia affects metabolism In turtles exposed to progressive levels of hypoxia there was a lowering of their metabolic rate This response was most pronounced at higher temperatures where metabolism is elevated It is not easy to interpret these results because the turtles did increase ventilation in response to hypoxia and the decline in oxygen consumption may reflect an inability to deliver sufficient oxygen to the metabolising tissues To circumvent some of these uncertainties Hicks and Wang (1999) investigated the effects of progressive hypoxia on oxygen consumption in anaesthetized turtles while making simultaneous measurements of blood flows as well as arterial and venous blood gases The turtles were artificially ventilated so the levels of hypoxia could be controlled for precise control of inspired gases Hypoxia and the attending fall in arterial and venous PO2 and O2 content was associated with significant reductions in VO2 (up to 73 of the normoxic value) which was fully reversible upon return to normoxia As with the previous study on recovered turtles (Glass et al 1983) the reduction in VO2 could either result from an inability of the cardiopulmonary system to supply sufficient oxygen to the tissues or by an actual down regulation of metabolism ie a reduction of ATP demand To distinguish between these two possibilities the metabolic uncoupler 23-dintrophenol (DNP) was infused during hypoxia to determine whether a higher VO2 could be stimulated (Hicks and Wang 1999) The infusion of DNP did indeed increase VO2 of the hypoxic turtles while arterial and venous blood O2 levels remained low and without affecting cardiac output Furthermore there was no observable rise of plasma lactate or potassium levels It was concluded that the reduction of VO2 during hypoxia reflects
133
an actual reduction in the rate of ATP turnover Similar results have been obtained on rats (Saiki et al 1997) and hypoxic hepatocytes from turtles (Buck et al 1993b)
As discussed above most reptiles normally have a pronounced right-to-left cardiac shunt which leads to a reduction in systemic arterial PO2 and oxygen concentration (eg Shelton and Burggren 1976 Wang et al 1997) Given the rather distinct reduction of oxygen uptake during hypoxia that was observed in the anaesthetized turtles it seems possible that the low arterial oxygen levels which are common during breath hold and diving could trigger fast and reversible metabolic down-regulations (Hicks and Wang 2004) Pulmonary blood flow and the cardiac shunt pattern of most reptiles are regulated by a vagal innervation on smooth muscles within the wall of the pulmonary artery (eg Milsom et al 1977 Wang et al 2001) To mimic these responses Platzack et al (2001) electrically stimulated the vagus nerve of anaesthetized turtles and induced a reduction in heart rate and an increase in the R-L cardiac shunt that occurs normally in diving turtles Under these conditions the lowering of arterial oxygen levels was attended by a decrease in oxygen uptake which further strengthens the possibility of cardiac right-to-left shunt being able to affect aerobic metabolism
Some species experience hypoxia at altitude and aquatic species experience reductions in lung and blood PO2 during breath-holds associated with prolonged diving In contrast to mammals and birds many reptiles also routinely experience varying levels of hypoxemia resulting from their unique cardiac morphology in which the undivided ventricle allows for admixture of systemic venous blood (right-to-left or R-L cardiac shunt) with subsequent reductions in arterial PO2 (Shelton and Burggren 1976 Burggren et al 1979 White et al 1989 Wang et al 1996a Hicks 1998) Because the amount of systemic venous admixture can be regulated reptiles have the ability to alter arterial PO2 independently of lung PO2 This ability may represent a mechanism of regulating metabolism through modulation of oxygen supply to the tissue (Wang et al 1996b Wang et al 1997 Wang et al 2001)
ACKNOWLEDGEMENTS
Supported by the Danish Research Council
REFERENCES
Bennett AF and JA Ruben 1979 Endothermy and activity in vertebrates Science 206 649-654
Brimioulle S P Lejeune and R Naeije 1996 Effects of hypoxic pulmonary vasoconstriction on pulmonary gas exchange Journal of Applied Physiology 81 1535-1543
Bryan JD LG Hill and WH Niell 1984 Interdependence of acute temperature preference and respiration in the plains minnow Transactions of the American Fisheries Societies 113 557-562
Buck LT and PW Hochachka 1993a Anoxic suppression of Na(+)-K(+)-ATPase and constant membrane potential in hepatocytes support for channel arrest American Journal of Physiology 265 R1020-1025
Buck LT PW Hochachka A Schon and E Gnaiger 1993b Microcalorimetric measurement of reversible metabolic suppression induced by anoxia in isolated hepatocytes American Journal of Physiology 265 R1014-1019
134
Buck LT SC Land and PW Hochachka 1993c Anoxia-tolerant hepatocytes model system for study of reversible metabolic suppression American Journal of Physiology 265 R49-56
Burggren W A Farrel and H Lillywhite 1997 Vertebrate cardiovascular systems In Dantzler WH (Ed) Handbook of physiology Sec 13 Comparative physiology vol 1 American Physiological Society Oxford New York pp 215-308
Burggren WW and K Johansen 1982 Ventricular haemodynamics in the monitor lizard Varanus exanthematicus pulmonary and systemic pressure separation Journal of Experimental Biology 96 343-354
Burggren WW and G Shelton 1979 Gas exchange and transport during intermittent breathing in Chelonian reptiles Journal of Experimental Biology 82 75-92
Butler PJ 2004 Metabolic regulation in diving birds and mammals Respiratory Physiology and Neurobiology 141297-315
Cabanac M 1975 Temperature regulation Annual Review of Physiology 37 415-439
Crossley DA T Wang and J Altimiras 1998 Hypoxia elicits pulmonary vasoconstriction in anaesthetized turtles Journal of Experimental Biology 201 3367-3375
Dawson CA 1984 Role of pulmonary vasomotion in physiology of the lung Physiological Review 64 544-616
Detar R 1980 Mechanisms of physiological hypoxia-induced depression of vascular smooth muscle contraction American Journal of Physiology 238 H761-H769
Euler USV and G Liljestrand 1946 Observations on the pulmonary arterial blood pressure in the cat Acta Physiologica Scandinavica 12 301-320
Faraci FM DL Kilgore and MR Fedde 1984 Attenuated pulmonary pressor response to hypoxia in bar-headed geese American Journal of Physiology 247 R402-R403
Farrell AP AK Gamperl and ETB Francis 1998 Comparative aspects of heart morphology In Gans C Gaunt AS (Eds) Biology of Reptilia vol 19 (Morphology) Society for the study of amphibians and reptiles Ithaca New York pp 375-424
Fishman AP 1976 Hypoxia on the pulmonary circulation How and where it acts Circulation Research 38 221-231
Glass M L RG Boutilier and N Heisler 1983 Ventilatory control of arterial PO2 in the turtle Chrysemys picta bellii effects of temperature and hypoxia Journal of Comparative Physiology B 151145-153
Hicks JW 1998 Cardiac Shunting in Reptiles Mechanisms Regulation and Physiological Function In Gans C Gaunt AS (Eds) Biology of the Reptilia vol 19 (Morphology G) Society for the Study of Amphibians and Reptiles Ithaca NY pp 425-483
Hicks JW and T Wang 1999 Hypoxic hypometabolism in the anesthetized turtle Trachemys scripta American Journal of Physiology 277 R18-23
Hicks JW and T Wang 1996 Functional role of cardiac shunts in reptiles Journal of Experimental Zoology 275 204-216
Hicks JW and T Wang 2004 Hypometabolism in reptiles behavioural and physiological mechanisms that reduce aerobic demands Respiratory Physiology and Neurobiology 141 261-271 2004
135
Hicks JW and SC Wood 1985 Temperature regulation in lizards effects of hypoxia American Journal of Physiology 248 R595-R600
Hlastala MP TA Standaert DJ Pierson and DL Luchtel 1985 The Matching of Ventilation and Perfusion in the Lung of the Tegu Lizard Tupinambis nigropunctatus Respiration Physiolology 60 277-294
Hochachka PW and PL Lutz 2001 Mechanism origin and evolution of anoxia tolerance in animals Comparative Biochemistry and Physiology 130B 435-459
Hochachka PW SC Land and LT Buck 1997 Oxygen sensing and signal transduction in metabolic defense against hypoxia lessons from vertebrate facultative anaerobes Comparative Biochemistry and Physiology 118A 23-29
Hochachka PW LT BuckCJ Doll and SC Land 1996 Unifying theory of hypoxia tolerance molecularmetabolic defense and rescue mechanisms for surviving oxygen lack Proceedings of the National Academy of Sciences USA 93 9493-9498
Jackson D C and K Schmidt-Nielsen 1966 Heat production during diving in the fresh water turtle Pseudemys scripta Journal of Cellular Physiology 67 225-232
Krosniunas E and JW Hicks 2003 Cardiac Output and Shunt during Voluntary Activity at Different Temperatures in the Turtle Trachemys scripta Physiological and Biochemical Zoology 76 679-694
Land SC LT Buck and PW Hochachka 1993 Response of protein synthesis to anoxia and recovery in anoxia-tolerant hepatocytes American Journal of Physiology 265 R41-48
Lillywhite HB KC Zippel and AP Farrell 1999 Resting and maximal heart rates in ectothermic vertebrates Comparative Biochemistry and Physiology 124A 369-382
Loacutepez-Barneo J R del Toro KL Levitsky MD Chiara and P Ortega-Saacuteenz 2004 Regulation of oxygen sensing by ion channels Journal of Applied Physiology 96 1187-1195
Luchtel DL and KV Kardong 1981 Ultrastructure of the lung of the rattlesnake Crotalus viridis oreganos Journal of Morphology 169 29-47
Lutz PL and S Kabler 1997 Release of adenosine and ATP in the brain of the freshwater turtle (Trachemys scripta) during long-term anoxia Brain Research 769 281-286
Maina JN 1989 The morphology of the lung of the black mamba Dendroaspis polylepis (Reptilia Ophidia Elapidae) A scanning and transmission electron microscopic study Journal of Anatomy 167 31-46
Malvin GM and SC Wood 1992 Behavioral hypothermia and survival of hypoxic protozoans Paramecium caudatum Science 255 1423-1425
McMurtry IF BW Hookway and BW Roos 1978 Red blood cells but not platelets prolong vascular reactivity of isolated rat lungs American Journal of Physiology 234 H186-H191
Milsom WK 1991 Intermittent breathing in reptiles Annual Review of Physiology 53 87-105
Milsom WK BL Langille and DR Jones 1977 Vagal control of pulmonary vascular resistance in the turtle Chrysemys scripta Canadian Journal of Zoology 55 359-367
Mortola JP 2004 Implications of hypoxic hypometabolism during mammalian ontogenesis Respiratory Physiology and Neurobiology 141 345-356
136
Mortola J P and K Labbe 2005 Oxygen consumption of the chicken embryo interaction between temperature and oxygenation Respiratory Physiology and Neurobiology 146 97-106
Mortola J P and PB Frappell 2000 Ventilatory responses to changes in temperature in mammals and other vertebrates Annual Review of Physiology 62 847-874
Motley HL A Cournand L Werko A Himmelstein and D Dresdale 1947 The influence of short periods of induced acute anoxia upon pulmonary artery pressures in man American Journal of Physiology 150 315-320
Nilsson GE and PL Lutz 1991 Release of inhibitory neurotransmitters in response to anoxia in turtle brain American Journal of Physiology 261 R32-37
Page RDM 2000 Extracting species trees from complex gene trees Reconciled trees and vertebrate phylogeny Molecular Phylogenetics and Evolution 14 89-106
Perry SP 1998 Lungs Comparative anatomy functional morphology and evolution In Gans C Gaunt AS (Eds) Biology of Reptilia vol 19 (Morphology) Society for the study of amphibians and reptiles Ithaca New York pp 1-92
Perry SF 1990 Recent advances and trends in the comparative morphometry of vertebrate gas exchange organs In Boutilier RG (Ed) Advances in Comparative and Environmental Physiology vol6 Springer-Verlag Berlin pp 45-71
Perry SF 1989 Mainstreams in the evolution of vertebrate respiratory structures In King AS McMelland J (Eds) Form and function in birds vol 4 Academic Press London pp 1-67
Perry SF 1983 Reptilian lungs Functional anatomy and evolution Advances in Anatomy Embryology and Cellular Biology 79 1-81
Piiper J 1992 Diffusion-perfusion inhomogeneity and alveolar-arterial O2 diffusion limitation ndash theory Respiration Physiology 87 349-356
Platzack B and JW Hicks 2001 Reductions in systemic oxygen delivery induce a hypometabolic state in the turtle Trachemys scripta American Journal of Physiology 281 R1295-1301
Powell FL and SR Hopkins 2004 Comparative physiology of lung complexity Implications for gas exchange News in Physiological Sciences 19 55-60
Robertson TP PI Aaronson and JPT Ward 1995 Hypoxic intracellular Ca2+ in pulmonary arteries evidence for PCK-independent Ca2+ sentization American Journal of Physiology 268 H301-307
Saiki C and JP Mortola 1997 Effect of 24-dinitrophenol on the hypometabolic response to hypoxia of conscious adult rats Journal of Applied Physiology 83 537-542
Shelton G and WW Burggren 1976 Cardiovascular dynamics of the chelonia during apnoea and lung ventilation Journal of Experimental Biology 64 323-343
Shimizu S PS Bowman G Thorne III and RJ Paul 2000 Effects of hypoxia on isometric force intracellular Ca2+ pH and energetics in porcine coronary artery Circulation Research 86 862-870
Smith MP MJ Russell JT Wincko and KR Olson 2001 Effects of hypoxia on isolated vessels and perfused gills of rainbow trout Comparative Biochemistry and Physiology 130A 171-181
137
Skovgaard N AS Abe DV Andrade and T Wang 2005 Hypoxic pulmonary vasoconstriction in reptiles A comparative study American Journal of Physiology (in review)
Steiner AA and LG Branco 2002 Hypoxia-induced anapyrexia implications and putative mediators Annual Review of Physiology 64 263-288
Taylor CR and ER Weibel 1981 Design of the mammalian respiratory system I Problem and strategy Respiration Physiology 44 1-10
Wang T J Altimiras W Klein and M Axelsson 2003 Ventricular haemodynamics in Python molurus separation of pulmonary and systemic pressures Journal of Experimental Biology 206 4241-4245
Wang T J Altimiras and M Axelsson 2002 Intracardiac flow separation in an in situ perfused heart from Burmese python Python molurus Journal of Experimental Biology 205 2715-2723
Wang T S Warburton A Abe and T Taylor 2001 Vagal control of heart rate and cardiac shunts in reptiles Relation to metabolic state Experimental Physiology 86 777-784
Wang T AS Abe and ML Glass 1998 Effects of temperature on lung and blood gases in the South American rattlesnake Crotalus durissus terrificus Comparative Biochemistry and Physiology 121A 7-11
Wang T EH Krosniunas and JW Hicks 1997 The role of cardiac shunts in the regulation of arterial blood gases American Zoologist 37 12-22
Wang T and JW Hicks 1996a Cardiorespiratory synchrony in turtles Journal of Experimental Biology 199 1791-1800
Wang T and JW Hicks 1996b The interaction of pulmonary ventilation and the right-left shunt on arterial oxygen levels Journal of Experimental Biology 199 1435-1446
Ward JPT VA Snetkov and PI Aaronson 2004 Calcium mitochondria and oxygen sensing in the pulmonary circulation Cell Calcium 36 209-220
Ward JPT and TP Robertson 1995 The role of endothelium in hypoxic pulmonary vasoconstriction Experimental Physiology 80 793-801
Weir EK and SL Archer 1995 The mechanism of acute hypoxic pulmonary vasoconstriction the tale of two channels FASEB Journal 9 183-189
Welling K-LK M Sander JB Ravn B Larsen U Abildgaard and O Amtorp 1997 Effect of alveolar hypoxia on segmental pulmonary vascular resistance and lung fluid balance in dogs Acta Physiologica Scandinanavica 161 177-186
West JB 2003 Thoughts on the pulmonary blood-gas barrier American Journal of Physiology 285 L501-L513
White FN JW Hicks and A Ishimatsu 1989 Relationship between respiratory state and intracardiac shunts in turtles American Journal of Physiology 256 R240-R247
Wood SC 1991 Interactions between hypoxia and hypothermia Annual Review of Physiology 53 71-85
138
BIOACCUMULATION AND ENANTIOSELECTIVE BIOTRANSFORMATION OF FIPRONIL BY RAINBOW TROUT (ONCORHYNCHUS MYKISS)
Brad J Konwick Aaron T Fisk Jimmy K Avants J MacArthur Long13 Arthur W Garrison
ABSTRACT
Dietary accumulation and enantioselective biotransformation was determined for rainbow trout (Oncorhynchus mykiss) exposed to fipronil a widely used chiral pesticide Measurement of the fish carcass tissue (whole fish minus GI tract and liver) showed a rapid accumulation of fipronil at microgram per gram concentrations during the 32 day uptake phase The low biomagnification factor (005) and short depuration half-life (058 d) determined for fipronil indicated a rapid clearance of this compound by the fish thus fipronil would not be expected to biomagnify in the food chain Changes in enantiomer fractions (EFs) over the course of the study indicated that depuration was due to biotransformation with preferential metabolism of the (+) enantiomer of fipronil Formation of the metabolite fipronil sulfone detected in the fish carcass validated the observation of biotransformation indicated by chiral analysis Fipronil sulfone was more persistent than fipronil in fish with a depuration half-life of 236 d thus making this compound a possible tracer of fipronil exposure
INTRODUCTION
Fipronil is a phenylpyrazole-class insecticide first approved in 1996 for use on a number of crops in the US Typical fipronil applications include rice culture turf grass management and residential pest control (US EPA 1997 US EPA 1996) Fipronil has been recognized as a disrupter of γ-aminobutyric acid (GABA) gated chloride channels in nerve cells leading to hyper-excitation and eventual mortality (Gant et al 1998) This toxicity is much greater in invertebrates than in mammalians due to their different GABA receptor binding affinities (Hainzl et al 1998) While fipronil is effective in insect control at comparable potencies to organophosphorous (OP) and carbamate insecticides its use is expected to increase relative to other classes of pesticides because of developing species resistance to OP insecticides and fipronilrsquos commercial availability (Hosie et al 1995) Fipronil applications can impact aquatic environments at low concentrations (US EPA 2001 US EPA 1997) thus there is potential for adverse effects on non-target species In addition fipronilrsquos degradation products which are similar in potency to fipronil (Schlenk et al 2001) and more environmentally persistent (Walse et al 2004 US EPA 1997) may lead to long-term effects on non-target species
To assess the potential risk of contaminants such as current-use pesticides (eg fipronil) it is important to understand their environmental accumulation in aquatic biota Typically the bioaccumulation potential for most current-use pesticides is considered minimal because of their low octanol-water partition coefficients (log Kow) a good predictor of bioaccumulation However fiponilrsquos log Kow (401) (US EPA 1996) is in the range of some persistent chemicals (eg α-HCH
US Environmental Protection Agency National Exposure Research Laboratory Athens GA
139
13
β-HCH) thus indicating the potential for bioaccumulation in aquatic biota On the other hand current-use pesticides are readily metabolized by cytochrome P450 isozymes due to the presence of structural groups that are susceptible to biotransformation reactions Biotransformation is a key component of a fishrsquos or any species elimination pathway for contaminants making them more water soluble and excretable Ultimately elimination rate (eg via biotransformation) is what determines the potential for a chemical to bioaccumulate and cause adverse effects in organisms (Borga et al 2004) Unfortunately methods to assess biotransformation are limited especially for fish which are believed to have little biotransformation ability This is inferred from fish having lower concentrations and activities of cytochrome P450s compared to mammals and birds (Stegeman and Kloeppper-Sams 1987 Kleinow et al 1987) Also when modeling contaminant movement through food webs biotransformation in fish is assumed to be negligible (Thomann 1989)
Investigations focusing on chiral analysis have been used recently to study the biotransformation dynamics of contaminants Approximately 25 of current-use pesticides are chiral (Williams 1996) in addition to many legacy pesticides (eg chlordanes some DDT isomers) and some polychlorinated biphenyls (PCBs) (Kaiser 1974) Chiral compounds exist as two non-superimposable mirror image forms called enantiomers which are designated as (+) and (-) based on their rotation of plane-polarized light The manufacture of chiral chemicals results in a mixture designated as racemic (plusmn) which contains 50 of each enantiomer and is the form in which they are typically applied and released into the environment Enantiomers have identical physical-chemical properties (Garrison et al 1996) however the relative abundances of enantiomers can change after being subjected to metabolic processes (eg enzyme mediated receptors biochemical reactions) due to the different spatial orientation of the enantiomers (Wong et al 2002) Thus changes in the enantiomer fractions (EF) of chiral contaminants within species can serve as a tracer for biotransformation The observation of non-racemic residues using chiral analysis has previously shown the ability of fish (Wong et al 2002) cetaceans (Hoekstra et al 2002) and birds (Fisk et al 2001) to bioaccumulate and biotransform chiral organochlorine (OC) contaminants enantioselectively Determining the biotransformation potential of OC contaminants due to their environmental persistence has been the focus of most chiral studies However chiral analysis of current-use pesticides in biota can achieve these same goals yet has not received much attention
In this paper we report the dietary accumulation and biotransformation of racemic fipronil in juvenile rainbow trout (Oncorhynchus mykiss) Rainbow trout was chosen as the test species because of its widespread species distribution and extensive knowledge regarding its bioaccumulation and physiology Dietary exposure was used because it is the major contributor in food chain transfer especially for hydrophobic contaminants and higher trophic organisms (Fisk et al 1998) To our knowledge this is the first experiment to determine the toxicokinetics of fipronil in fish via dietary exposure or its chiral biotransformation in any species
MATERIALS AND METHODS
Chemicals and Food Preparation
Fipronil was obtained from ChemService (West Chester PA 98 pure) All solvents (Ultra Resi-Analyzedreg) were obtained from JT Baker (Phillipsburg NJ) A stock solution of fipronil in methanol (1000 μgmL) was diluted in hexane (1100) and mixed with the commercial trout food (Zeigler Gardner PA) to give a nominal concentration of 10 μgg in the feed the solvent was then slowly evaporated to dryness in a rotary evaporator Control food was treated in an identical manner
140
but without addition of the target compound The food was air dried for 48 hours and then stored in amber jars at 4degC The trout food consisted of 38 protein 14 lipid and 3 fiber The concentrations of fipronil were determined in spiked and control food using the same technique described below to determine concentrations in rainbow trout tissue (Table 1)
Table 1 Concentrations (μgg wet wt) and Enantiomeric Fractions (EFs) of Fipronil (mean plusmn SE) in Control and Treated Food (n = 3)
Compound Control food Treated food
Cfood EF Cfood EF
Fipronil ND - 768 plusmn 018 0497 plusmn 0001
ND = Not Detected
Experiments
Juvenile rainbow trout (initial weights 10 plusmn 05 g mean plusmn SE) were collected from Lake Burton Fish Hatchery (GA) and randomly assigned to one of two 800 gallon fiberglass aquaria (45 fish per tank) with recirculating carbon-dechlorinated tap water chilled (Frigid Units Toledo OH) to 12degC Fish were maintained with a 12 h light 12 h dark photoperiod One tank of fish was exposed to the fipronil treated food whereas the other tank served as a control Fish were exposed to the spiked food for 32 days (uptake) followed by 96 days of clean food (depuration) The daily rate of feeding was 15 of the mean weight of the rainbow trout corrected for weight gain after each sampling day All food was consumed within ~ 5 minutes of feeding Three fish each were randomly sampled from the fipronil treatment and control treatment on days 0 2 4 8 16 and 32 of the uptake phase and days 34 36 40 48 64 and 128 of the depuration phase Sampled fish were separated into liver gastrointestinal (GI) tract (including stomach and contents spleen pyloric caeca intestines and adipose tissue associated with these organs) and carcass (whole fish minus GI tract and liver) The GI tract was removed so as to not measure the target analyte that remained in undigested food Only carcass results were used in calculating bioaccumulation parameters and enantiomer fractions
Chemical Analysis
Carcass samples were weighed stored frozen at -8degC and then freeze-dried For analysis samples were homogenizedextracted in dichloromethane (DCM) hexane (11) using a polytron (PowerGen 125 Fisher Scientific) The whole fish carcass was homogenized except for the last sampling day on which only 10-12 g of carcass fillet was extracted due to the large size of the fish Polychlorinated biphenyl 65 was added to samples as a surrogate recovery standard just before extraction Samples were extracted twice the extracts were then combined and evaporated to 10 ml One ml of the extract was used to determine lipids gravimetrically The remaining extract was then evaporated to 2 ml and applied to a gel permeation chromatography (GPC) column to remove lipids The GPC columns (inner diameter 295 mm length 400 mm reservoir 500 ml) were packed with 60 g (dry weight) of 200-400 mesh Bio-Beadsreg S-X3 (Bio-Rad Laboratories Hercules CA) The column was eluted with 340 ml of DCM hexane (11) the first 140 ml contained the lipids and was discarded The next 200 ml eluate contained the target analyte and was rotary evaporated to 1 ml before analysis
Analysis of the extracts for fipronil was by chiral capillary gas chromatography with mass spectrometric detection using a Hewlett-Packard 6890 GC with a 5973 mass selective detector The
141
column was a BGB 172 (BGB Analytik AG Anwil Switzerland) containing a chiral phase composed of 20 tert-butyldimethylsilylated-β-cyclodextrin The column was 30 m long 025 mm ID and of 025 μm film thickness GC conditions were column temperature 150 to 220o at a rate of 15omin injection splitless at 250o carrier gas helium at a flow rate of 15 mLmin Fipronil was detected and measured using selected ion monitoring of ions 367 and 369 electron voltage was 70 eV This BGB column resolved the enantiomers of fipronil to baseline Calculation of concentrations of fipronil in the fish extracts was based on the sum of GC areas of both enantiomers compared to the sum of GC areas of both enantiomers of a fipronil standard run on the same day Typically 3 fipronil standards were analyzed with a batch of 10 fish samples Fipronil concentrations were corrected for each extract sample by comparison to the recovery of the surrogate standard (PCB 65) which had been added in known amount to each whole fish carcass before extraction recovery of the surrogate standard ranged from 35 to 77
To assess biotransformation enantiomeric fractions (EFs) for fipronil were calculated from concentration data using
EF = (+) [(+) + (-)]
where (+) and (-) are concentrations of the individual fipronil enantiomers Using pure fipronil enantiomers it was observed that the (+)-enantiomer eluted first from the BGB 172 column under these analytical conditions EFs of the standard sample of fipronil used for spiking the fish food was racemic (050 plusmn 001) (n = 4) as was the fipronil in the food residues (Table 1)
Data analysis
Growth rates were determined by fitting all fish weight data to an exponential model (ln fish weight = a + bt where a is a constant b is the growth rate and t is time in days) As growth dilution can cause differences in concentration between individual fish all concentrations were corrected for growth by multiplying the fish concentrations by a factor of (1 + bt) where b is the growth rate Depuration rate (kd) constants were determined by fitting the depuration data to a first order decay curve (ln concentration = a + kdt where a is a constant and t is time in days) Half-life (t12) values were calculated using ln 2kd Equilibrium biomagnification factors (BMFeq) were predicted from the equation
BMF = CfishCfood
where Cfish is the average fipronil concentration at steady state in the fish and Cfood is the average concentration in the food normalized to lipid content Steady state was assumed when a significant increase in fish concentrations was not observed over three consecutive time intervals and did not increase thereafter Because we did not use a replicate for each treatment (only one aquarium) pseudoreplication was addressed by using average concentration values of the three replicate fish taken at each time to determine all rate constants Statistical differences for tested parameters between treatments were analyzed using the t-test (α = 005)
142
RESULTS AND DISCUSSION
Fish Health and Growth
Exposure to fipronil did not appear to influence the health of rainbow trout There was no mortality and coloration and behavior of the fipronil exposed fish were consistent with control fish The growth rate of fipronil exposed fish was 0015 d-1 (Figure 1) and was similar to that of control fish 0017 d-1
Fish
Wet
Wei
ght
(g)
10
100
y = 0015x + 267 p lt 00001
0 20 40 60 80 100 120
Day
Figure 1 Growth rate (0015 d-1) of fipronil exposed fish weight is natural log r2 = 078
Bioaccumulation parameters
Figure 2 shows the uptake and elimination of fipronil over time After two days fipronil was detected in fish exposed to the spiked food and accumulated rapidly during the uptake phase at concentrations ranging from 16 to 37 μgg lipid in carcass tissue reaching steady state starting on day eight Fipronil was rapidly eliminated from fish and was not detected after day 34 of depuration The calculated depuration half-life of fipronil in fish was 058 d indicating the rapid clearance of this compound The low equilibrium BMF of 005 indicated that fipronil will not biomagnify in the food chain at higher trophic levels due again to its rapid clearance There are no similar studies with which to compare our bioaccumulation values for fipronil in fish however invertebrates either fed or exposed in aqueous solution to fipronil indicated a high accumulation potential (Chaton et al 2002 Chaton et al 2001) Similar studies investigating the toxicokinetics of fipronil at lower trophic levels
143
would determine whether this compound is transferable to higher trophic species such as rainbow trout The dietary exposure regimen used in this study involved a high exposure concentration to rainbow
trout with no observable effects yet concentrations obtained in fish carcass tissue reached a level 100 fold above the LC50 of 246 μgL determined for this species (US EPA 1996) This resistance in toxicity may be explained by fipronil not efficiently reaching the target site (ie GABA receptor) through dietary exposure because of sequestration in fat reserves where fipronil is likely to accumulate This sequestration combined with a high-rate of detoxification by metabolism for rainbow trout may lead to a tolerance for elevated fipronil concentrations It should be noted that fipronil was not detected in control fish carcass throughout the study as a result of not being detected in control food
Day
2 4 8 16
32 34 36 40
48
64
Con
cent
ratio
n (u
gg
lipid
)
005
1
5 8
Enantiom
eric Fraction (EF)
040
045
050
055
060
Fipronil Concentration Fipronil EF
depuration
ND
uptake
Figure 2 Dietary accumulation and depuration curve for fipronil in rainbow trout Fipronil was not detected (ND) after day 36 with a depuration half-life of 058 d Each circle represents the mean concentration plusmn SE of three fish Each square represents the mean EF plusmn SE of three fish
Enantiomer Fractions
Calculated enantiomeric fractions (EFs) showed that relative abundance of fipronil enantiomers changed quickly over time in this study (Figure 2) After two days the (-) enantiomer is more prominent indicating a greater enantioselective biotransformation rate of the (+) enantiomer This EF trend continued throughout the uptake phase of the experiment before a possible slight increase in EF during the depuration phase The non-racemic residues found here are a strong indication of metabolism over time and can serve as a tracer of exposure time For example if native fish were collected and their EFs were determined this value could give an indication of when initial exposure to fipronil had occurred and likewise how long before complete elimination of this compound was likely
144
The changes in EFs are most likely due to biotransformation by the rainbow trout Enantioselective uptake of fipronil is unlikely because the transfer from GI tract into the body through mixed micelle vesicles is a passive transport process for hydrophobic compounds and is not considered to be enantioselective (Drouillard and Norstrom 2000 Landoni et al 1997) Likewise elimination of fipronil such as excretion through feces is considered a passive process and not expected to be stereospecific (Thomann 1989) Similarly elimination through the gills is not enantioselective involving passive partitioning between the gill surface and water (Thomann 1989) The observed EFs suggest that enantioselective metabolism started early during the uptake phase of the experiment and proceeded in such a way that residues were non-racemic until complete biotransformation of fipronil
Day
2 4 8 16
32 34 36
40
48
64
Con
cent
ratio
n (u
gg
lipid
)
0 05
1
5 8
F ipronil Sulfone m etabolite
uptake depuration
ND
Figure 3 Concentrations of fipronil and fipronil sulfone a metabolite of fipronil in rainbow trout Fipronil sulfone was not detected (ND) after day 64 with a depuration half-life of 236 d Each data point represents the mean concentration plusmn SE of three fish
The detection of fipronil metabolites in exposed fish would confirm that biotransformation was occurring Analysis for its known metabolite from rat studies the oxidation product fipronil sulfone indicated the presence of this compound within fish carcass tissue (Figure 3) It was detected concurrently with the parent compound starting on day two and at higher concentrations than fipronil throughout the study Because both compounds were detected in fish throughout the study it is important to note that any effects most likely at the neuro-cellular level may be enhanced by both compounds having the same mode of action From this data we were able to establish a depuration half-life of 236 days for fipronil sulfone To our knowledge no further biotransformation pathways have been identified for fipronil sulfone apparently this compound was excreted by the fish as is It should be noted that very low concentrations of fipronil sulfone were detected in the food exposed to
145
rainbow trout a result of its presence in the standard used to spike the food However concentrations of fipronil sulfone detected in food were approximately 40 times lower than fipronil The BMF of 48 for fipronil sulfone calculated from our fish food and fish tissue concentrations is unlikely for this low log Kow compound (368) (Walse et al 2004) that is similar in persistence to fipronil which has a calculated BMF of 005 A BMF of this magnitude means fipronil sulfone would biomagnify to the extent of some of the higher chlorinated PCBs which is clearly not the case due to its rapid elimination Therefore the high concentrations of fipronil sulfone found in our exposed fish are the direct result of
biotransformation of fipronil and do not come from the spiked food This study is the first to our knowledge to show the formation of fipronil sulfone by fish with direct implications for using this compound as a tracer of exposure to fipronil
CONCLUSIONS
This study shows that the use of chiral compounds can provide insight into biotransformation processes Through measurement of EFs we were able to demonstrate the biological metabolism of fipronil by fish which could not have been observed with traditional achiral analysis Formation and detection of fipronil sulfone a metabolite of fipronil in the fish was further proof of metabolic transformation Measurements of the EF of chiral compounds may indicate time of initial exposure an important component in risk assessment of these chemicals
DISCLAIMER
This paper has been reviewed in accordance with the US Environmental Protection Agencys peer and administrative review policies and approved for presentation and publication Mention of trade names or commercial products does not constitute endorsement or recommendation for use
REFERENCES
Borga K AT Fisk PF Hoekstra and DCG Muir 2004 Biological and chemical factors of importance in the bioaccumulation and trophic transfer of persistent organochlorine contaminants in arctic marine food webs Environmental Toxicology and Chemistry 23 2367-2385
Chaton PF P Ravanel M Tissut and JC Meyran 2002 Toxicity and bioaccumulation of fipronil in the nontarget arthropodan fauna associated with subalpine mosquito breeding sites Ecotoxicology and Environmental Safety 52 8-12
Chaton PF P Ravanel JC Meyran and M Tissut 2001 The toxicological effects and bioaccumulation of fipronil in larvae of the mosquito Aedes aegypti in aqueous medium Pesticide Biochemistry and Physiology 69 183-188
Drouillard KG and RJ Norstrom 2000 Dietary absorption efficiencies and toxicokinetics of polychlorinated biphenyls in ring doves following exposure to arochlorreg mixtures Environmental Toxicology and Chemistry 19 2707ndash2714
146
Fisk AT J Moisey KA Hobson NJ Karnovsky and RJ Norstrom 2001 Chlordane components and metabolites in seven species of Arctic seabirds from the northwater polynya relationships with stable isotopes of nitrogen and enantiomeric fractions of chiral components Environmental Pollution 113 225-238
Fisk AT RJ Norstrom CD Cymbalisty and DCG Muir 1998 Dietary accumulation and depuration of hydrophobic organochlorines bioaccumulation parameters and their relationship with the octanolwater partition coefficient Environmental Toxicology and Chemistry 17 951-961
Gant DB AE Chalmers MA Wolff HB Hoffman and DF Bushey 1998 Fipronil action at the GABA receptor Reviews in Toxicology 2 147-156
Garrison AW P Schmitt D Martens and A Kettrup 1996 Enantiomeric selectivity in the environmental degradation of dichlorprop as determined by high-performance capillary electrophoresis Environmental Science and Technology 30 2449-2455
Hainzl D LM Cole and JE Casida 1998 Mechanisms for selective toxicity of fipronil insecticide and its sulfone metabolite and desulfinyl photoproduct Chemical Resources Toxicology 11 1529-1535
Hoekstra PF CS Wong TM OrsquoHara KR Solomon SA Mabury and DCG Muir 2002 Enantiomer-specific accumulation of PCB atropisomers in the bowhead whale (Balaena
mysticetus) Environmental Science and Technology 36 1419-1425
Hosie AM HA Baylis SD Buckingham and DB Sattelle 1995 Actions of the insecticide fipronil on dieldrin sensitive and resistant GABA receptors of Drosophila melanogaster British Journal of Pharmacology 115 909-912
Kaiser KLE 1974 On the optical activity of polychlorinated biphenyls Environmental Pollution 7 93-101
Kleinow KM MJ Melancon and JJLech 1987 Biotransformation and induction implications for toxicity bioaccumulation and monitoring of environmental xenobiotics in fish Environmental Health Perspectives 71 105-119
Landoni MF AL Soraci P Delatour and P Lees 1997 Enantioselective behaviour of drugs used in domestic animals a review Journal of Veterinary Pharmacology and Therapeutics 20 1-16
Schlenk D DB Huggett J Allgood E Bennett J Rimoldi AB Beeler D Block AW Holder R Hovinga and P Bedient 2001 Toxicity of fipronil and its degradation products to Procambarus sp Field and laboratory studies Archives of Environmental Contamination and Toxicology 41 325-332
Stegeman JJ and PJ Kloepper-Sams 1987 Cytochrome P-450 isozymes and monooxygenase activity in aquatic animals Environmental Health Perspectives 71 87-95
147
Thomann RV 1989 Bioaccumulation model of organic chemical distribution in aquatic food chains Environmental Science and Technology 23 699-707
U S Environmental Protection Agency 2001 Fipronil environmental fate and ecological effects assessment and characterization for a Section 3 for broadcast treatment with granular product to control turf insects and fire ants (addendum) Environmental Fate and Effects Division Office of Pesticide Programs Washington DC USA
U S Environmental Protection Agency 1997 Environmental fate and effects Section 3 registration decision for fipronil Use on rice seed D235912 Environmental Fate and Effects Division Office of Pesticide Programs Washington DC USA
U S Environmental Protection Agency 1996 New pesticide fact sheet EPA 737-F-96-005 Office of Pesticide Programs Washington DC USA
Walse SS SL Morgan L Kong and JL Ferry 2004 Role of dissolved organic matter nitrate and bicarbonate in the photolysis of aqueous fipronil Environmental Science and Technology 38 3908-3915
Walse SS PL Pennington GI Scott and JL Ferry 2004 The fate of fipronil in modular estuarine mesocosms Journal of Environmental Monitoring 6 58-64
Williams A 1996 Opportunities for chiral agrochemicals Pesticide Science 46 3-9
Wong CS F Lau M Clark SA Mabury and DCG Muir 2002 Rainbow trout (Oncorhynchus mykiss) ban eliminate chiral organochlorine compounds enantioselectively Environmental Science and Technology 36 1257-1262
148

ABSTRACT
Twenty-one participants from Europe North America and China convened in Chongqing China October 12-14 2005 for the Eighth International Symposium in Fish Physiology Toxicology and Water Quality The subject of the meeting was ldquoHypoxia in vertebrates Comparisons of terrestrial and aquatic vertebratesrdquo These Proceedings include 13 papers presented over the three day period and discuss the responses of fish reptiles and mammals to hypoxia These papers report on the responses of animals to hypoxia at the behavioural physiological and molecular levels Clearly hypoxia has wide ranging effects the responses are complex and there are many similarities in the responses of all vertebrates to hypoxia Organisms respond to hypoxia by reducing energy expenditure in particular inhibiting reproduction feeding and exercise That is animals only expend energy that is absolutely necessary for survival There is extensive reorganization of cellular machinery directed by hypoxia inducible factors (HIFs) proteins that increase during hypoxia and have a marked effect on the expression of many genes As a result anaerobic metabolism is up regulated and many aspects of aerobic metabolism are down regulated Many cells enter cell cycle arrest Thus organisms stop reproducing and growing during hypoxia and if the effects of hypoxia are severe development of eggs and larvae is compromised
iii
CONTENTS
Page
NOTICEii ABSTRACTiii ACKNOWLEDGEMENTS vi
Response of aquatic vertebrates to hypoxia DJ Randall CY Hung and WL Poon 1
Post-genomic approaches to the mechanisms of hypoxia response in the common carp Cyprinus Carpio
EJ Fraser AY Gracey and AR Cossins 11
Isolation and characterization of the VEGF-A gene of grass carp Gallant KL Chan Helen OL Mok Patrick KS Ng Minnie ML Wong and Richard YK Kong 19
Molecular studies of the HIF transcription factors of grass carp HW Law Richard YC Kong and Rudolf SS Wu 31
Gene expression profiling of raw 2647 cell survival and apoptosis under oxidative stress
CC Fong Y Zhang MS Wong CH Tzang WP Lai and M Yang 39
Extreme adaptations to hypoxia and anoxia in crucian carp Goumlran E Nilsson 53
Suppressive effects of hypoxia on male rat reproductive function Weigong Liao Yuqi Gao Mingchun Cai Jian Chen Yi Wu 59
Endocrine disrupting and teratogenic effects of hypoxia on fish and their ecological implications
Rudolf SS Wu Eva WH Shang and BS Zhou 75
Effects of hypoxia on lipid metabolism in teleosts Guido van den Thillart 87
The influence of oxygen shortage on the development of the cardiovascular system in Zebrafish
Bernd Pelster 107
A biocomputational tool to measure cardiac rhythms in zebrafish SH Cheng Eric PK Chan and Alex CC Lin 121
iv
Hypoxia in reptiles Tobias Wang and Nini Skovgaard 127
Bioaccumulation and enantioselective biotransformation of fipronil by rainbow trout (Oncorhynchus mykiss)
Brad J Konwick Aaron T Fisk Jimmy K Avants J MacArthur Long and Arthur W Garrison 139
v
ACKNOWLEDGEMENTS
The 8th Symposium was organized by Professor Gao Yuki of the Institute of High Altitude Medicine Third Military University Chongqing China and Professor David Randall of the Department of Biology and Chemistry City University of Hong Kong with the able help of Ms Mandy Dung Yuk Man also from Biology and Chemistry City University of Hong Kong The meeting was managed in Chongqing by the Third Military University who provided excellent meeting rooms for the Symposium Professor Gao and his associates were excellent hosts and showed us both the University and Chongqing Funding for the symposium was provided by the US Environmental Protection Agency and we were advised throughout by Dr George Bailey and Dr Rosemarie Russo of the Ecosystems Research Division US Environmental Protection Agency Athens Georgia Ms Dung Yuk Man assisted in the preparation of this document Finally I attribute the success of this symposium to the many people who came to Chongqing to present and discuss their work
David Randall Department of Biology and Chemistry City University of Hong Kong
vi
RESPONSE OF AQUATIC VERTEBRATES TO HYPOXIA
DJRandall1 CYHung and WLPoon
ABSTRACT
The major effect of hypoxia on the individual is to reduce exercise capacity Fish respond to hypoxia by inhibiting feeding and reproduction and moving to lower temperatures all of which lower energy expenditure Oxygen delivery is augmented by increasing both gill ventilation and hemoglobin content and oxygen affinity Aerobic metabolism is down-regulated whereas anaerobic metabolism is up-regulated Steroid metabolism is reduced Liver cells go into cell cycle arrest Genes associated with cell growth and aerobic metabolism are down regulated but genes associated with anaerobic metabolism are up-regulated Uncoupling proteins 2 amp 3 are up-regulated and may play a role in reducing mitochondrial activity during hypoxia Much of the response to hypoxia occurs in the first few hours and days There are many similarities between fish and mammalian responses to hypoxia presumably because they evolved in common aquatic vertebrate ancestors Cardiovascular responses have been somewhat modified in terrestrial vertebrates and organic phosphate levels in the red blood cell decrease rather than increase in fish exposed to hypoxia The relative role of temperature change starvation adenosine production and HIF-1 expression in metabolic depression is not clear in any vertebrate
INTRODUCTION
Hypoxia is a common feature of the aquatic environment Oxygen levels in the water depend on photosynthetic activity in the water exchange with the atmosphere usage by aquatic organisms and oxidation reactions in the water Photosynthesis requires light and therefore is restricted to surface waters and during daylight Nocturnal hypoxia is common in tropical lakes and lagoons Gas diffusion in water is slow and so hypoxia occurs at depth in unmixed waters There is a minimum oxygen layer in oceans blow the photosynthetic zone where a large number of organisms live on food dropping from above Hypoxia is also common beneath the ice on frozen lakes and ponds Although hypoxia is a natural and frequent event in the aquatic environment it has been exacerbated by human actions Eutrophication of waterways generally leads to hypoxia and many regions of the world where there are large human populations have increasing levels of hypoxia The movement of vertebrates onto land is relatively recent and much of vertebrate evolution occurred in water at lower oxygen levels than at present It is possible that terrestrial vertebrates living in an oxygen rich atmosphere have lost some of their capacity to survive hypoxia
EFFECTS OF INCREASING HYPOXIA ON AQUATIC VERTBRATES
Increasing aquatic hypoxia has led to changes in species composition some leave some die what is left are those more tolerant of hypoxia In general there is a reduction in species diversity and biomass (Diaz and Rosenberg 2001) Vertebrates respond to hypoxia by enhancing oxygen uptake down regulating energy expenditure and up-regulating anaerobic pathways Fish move to colder
1 Department of Biology and Chemistry City University of Hong Kong Kowloon Hong Kong SAR China 1
waters in response to aquatic hypoxia (Petersen and Steffensen 2003) and this fall in body temperature reduces energy metabolism In addition because oxygen is more soluble in colder waters this move may be associated with an increase in the oxygen content of water The reduction in temperature will also enhance oxygen uptake because of increased hemoglobin oxygen affinity
REDUCED FOOD INTAKE AND REPRODUCTION DURING HYPOXIA
Salmonids reduce food intake and stop growing when water oxygen saturation falls below 70 (Jobling 1994) Several studies in other fish have reported similar results for example cod exposed to hypoxia reduce food intake and growth (Chabot 2003) both in the laboratory and in the natural environment The mechanisms by which hypoxia inhibits food intake are largely unknown
Hypoxia is known to disrupt the endocrine systems in fish retarding gonadal development and reducing success in spawning fertilization and larval growth (Zhou et al 2001 Wu et al 2003) Reproductive success depends on multiple factors and control systems exist at several levels including the hypothalamic-pituitary axis steroid metabolism and modulation of steroid receptors Plasma steroid levels were low in hypoxic carp and gonad-somatic index (GSI) was reduced along with plasma testosterone levels (Zhou et al 2001) Hypoxia appears to have a marked inhibitory effect on breeding and spawning behaviour of carp (Wang et al unpublished data) Hypoxic (05-08mgL) exposure of zebrafish reduced egg production to only 9fish after the first day compared to 52fish in the control group The egg number in the hypoxia treated group continued to drop over time
In normoxia fertilized zebrafish eggs hatch between 48 and 60 hours post fertilization (PF) and 938 of the eggs hatched In hypoxia fertilized eggs did not hatch until 96 to 260 hours PF only 49 hatched and the rest died Fertilized eggs developing under hypoxia were pale indicating a lack of pigment Growth was retarded and there were many abnormalities Hypoxia exposure had little effect on the expression of the Aryl hydrocarbon Receptor Nuclear Translocator (Randall and Yang 2004) or the activity of the P450scc (CYP11A) the rate limiting enzyme controlling steroidogenesis via the conversion of cholesterol to pregnenolone (Yang unpublished data) Hypoxia increased vitellogenin gene expression in both zebrafish (Eva Shang unpublished data) and carp (CY Hung unpublished data) but surprisingly this was associated with a marked reduction in vitellogenin levels in the fish
OXYGEN DELIVERY DURING HYPOXIA
Most vertebrates maintain oxygen delivery during aquatic hypoxia by increasing ventilation and the diffusing capacity of the respiratory surface (Randall 1982) Fish skim the surface water which usually has more oxygen or may breathe air Hypoxia due to breath holding in birds and mammals is associated with a reduction in heart rate and cardiac output and blood flows preferentially to the brain and heart rather than to the skin gut and muscles Many fish however maintain cardiac output by increasing stroke volume to offset the decrease in heart rate The number of circulating red blood cells increases due to release from the spleen (within minuteshours) and due to increases erythropoietin levels (within daysweeks) Unlike mammals where increased organic phosphate levels decrease hemoglobin oxygen affinity during hypoxia in fish hemoglobin (Hb) oxygen affinity increases due to the combined effect of decreased organic phosphate (NTP) levels and reduced temperature as ffish move to colder water The increase Hb-O2 affinity facilitates oxygen uptake at the gills The decrease in NTPHb ratios associated with hypoxia are rapid enough to compensate for circadian oscillations in dissolved oxygen seen in lagoons and tropical lakes (Val 2000) Anaemia in fish results in an increase in NTPHb ratio facilitating oxygen unloading to tissues as seen in mammals (Val et al 2002)
2
All-major modulators of vertebrate Hb-O2 affinity including IPP GTP ATP 23DPG (in decreasing order of effect) and IP2 appeared during the radiation of fish (Val 2000) Thus un-like mammals RBC organic phosphates in fish decrease and Hb-O2 affinity increases during hypoxia whereas the response to anemia is similar to that seen in mammals (organic phosphates increase)
To enhance oxygen delivery during hypoxia hypoxia-inducible factor 1 (HIF-1) is stabilized resulting in an increase in erythropoietin heme oxygenase and transferrin to enhance red blood cell production in the mammals (Semenza 2000) In carp however heme oxygenase is down-regulated (Hung unpublished results) whereas in goby fish Gillichthys mirabilis a moderate-hypoxia tolerant species heme-oxygenase is up-regulated but expression of transferrin is suppressed (Gracey et al 2001) A variety of genes which may be independent of HIF-1 namely hemopexin precursor a heme-binding protein and haptoglobin alpha amp beta chains hemoglobin-binding molecules are all induced whereas ferritin was downregulated Hemoglobin alpha and beta chains remained unchanged during hypoxia in carp kidney whereas expression of myoglobin gene increased by about 3 fold during long term hypoxia exposure (Hung unpublished data)
MUSCLE OXYGEN LEVELS
A fish body consists of about 60-70 muscle made up of highly vascularized red oxidative slow twitch fibres and poorly vascularized white glycolytic fast twitch fibres The red muscle of a trout has a much higher oxygen tension than that of a rat as measured by an oxygen sensitive (Presens) micro-optode tip diameter lt10 microm into red muscle of intact trout (McKenzie et al 2004) and rat Interestingly the arterial and venous oxygen tensions of rat and trout are similar (Table 1) however muscle oxygen levels were below mixed venous levels in the human rat and dog whereas in trout muscle oxygen levels were midway between arterial and mixed venous levels that is fish muscle oxygen levels are higher than that of rat
Species Human Rat or Dog Trout PaO2 mmHg 100 100 PvO2 mmHg 40 40 Muscle mmHg 25-35 61
Table 1 Oxygen tensions in arterial (PaO2) and venous (PvO2) blood and in red muscle in humans rats dogs and trout (adapted from McKenzie et al 2004)
Many fish hemoglobins have a Root shift where reduced pH decreases Hb-O2 saturation even at very high O2 levels This Root shift is important in maintaining swimbladder inflation using very high levels of oxygen McKenzie et al (2004) suggest that the Root shift leads to the high muscle tissue oxygen levels they reported in trout They argue that as CO2 transfer is more rapid than oxygen transfer CO2 can enter capillary blood reduce RBC intracellular pH and drive oxygen from the hemoglobin raising PO2 in both blood and tissues (Root off shift) Subsequently deoxy-hemoglobin will bind protons raising pH causing oxygen binding to hemoglobin as the blood leaves the tissue capillaries (Root on shift) reducing PvO2 to levels below that in the tissues Thus fish tissue oxygen levels are much higher than that seen in terrestrial mammals This mechanism ameliorates the decrease in tissue oxygen levels during hypoxia (Figure 1) but the fish must maintain hemoglobin oxygen
3
saturation during hypoxia if this system is to work Thus this mechanism is coupled to the increased Hb-O2 affinity during hypoxia seen in fish
Mean pwO2 Mean paO2
Mean RM 140
120
100
80
60
40
pO2
(mm
Hg)
20 0 20 40 60 80 100 120 140 160
time (min)
Figure 1 The decrease in muscle pO2 is ameliorated and the bloodmuscle pO2 gradient is decreased during hypoxia in the rainbow trout (from McKenzie et al 2004) RM = muscle pO2 pwO2 = water pO2 paO2 = arterial blood pO2
METABOLIC ADJUSTMENTS TO HYPOXIA
Fish reduce energy expenditure by moving to a lower temperature reducing or stopping swimming activity feeding and reproduction As a result growth slows and eventually becomes zero or negative All of these factors reduce energy expenditure Adenosine levels are increased as in mammals protecting the animal against hypoxia and balancing energy usage and production (Bernier et al 1996 a b Nilsson 2002) Many studies have shown an up-regulation of anaerobic enzymes during hypoxia with increased glucose transport utilization of liver glycogen (muscle glycogen used during exercise) with increased lactate production Lactate accumulation is ameliorated in carp and goldfish by ethanol production from lactate (ref)
We hypothesized that programmed cell death (apoptosis) was one of the strategies that help common carp (Cyprinus Carpio L) survive hypoxia (05mgO2L) Although there were DNA nick ends shown by Terminal transferase mediated dUTP Nick End Labelling (TUNEL) staining in liver of carp exposed to hypoxia it appeared that there was no apoptosis because there was no change in caspase 3 activity assay (Figure 2) DNA fragmentation assay and anti-ssDNA staining (Figure 3) In addition there was no significant difference in the hepatosomatic index between 42-day hypoxic exposure in carp Subsequent Electron Microscope (EM) analysis also indicated no change in the level of apoptosis between control and hypoxic carp livers Results of an analysis using flow cytometry supported the absence of apoptosis The cell cycle inhibitor p27 which prevents cells from going into the S phase if there is DNA damage was up-regulated in the 4-day hypoxic samples showing a low
4
TUNEL signal and indicated that the liver cells were in cell cycle arrest Cell death activator CIDE-B was found to be down-regulated during hypoxia along with transmembrane 4 superfamily member 8 whereas the anti-apoptotic gene Bcl-2 was up-regulated during hypoxia (Figure 4) Thus the carp liver cells seem to be going into cell cycle arrest rather than apoptosis during hypoxia
casp
ase3
activ
ity (n
mol
mg
prot
einh
r)
400
350
300
250
200
150
100
050
000
normoxia 4 day-hypoxia
Figure 2 Caspase 3 activity of liver exposed to 4-day hypoxia (03mgO2L) and control No significant different between two groups Mean+SE with n=6
Figure 3 (A) Normoxia (B) 4-day hypoxia (05mgO2L) Apoptotic cells stained by both anti-ssDNA monoclonal antibody and DAPI (chromosome stain) were marked with There was no observable difference between groups
CHANGES IN GENE EXPRESSION DURING HYPOXIA
Changes in gene expression play a significant role in the response to hypoxia with the major changes occurring at the onset of hypoxia The following is a description of the changes in gene expression in the liver of carp subjected to 42 days hypoxia In general genes associated with aerobic metabolism and cell growth were down regulated but genes associated with anaerobic metabolism were up-regulated
5
Apoptosis regulator Bcl-2
Transmembrane 4 superfamily member 8 (Tetraspanin 5)
Cell death activator CIDE-B
Figure 4 Expression of apoptosis-related genes during hypoxia in carp (One-way ANOVA plt007)
Uncoupling proteins 2 amp 3 were up-regulated in hypoxia and may play a role in reducing mitochondrial activity during hypoxia (Hung unpublished data) In mammals hypoxia inducing factor (HIF-1α) levels increase due to decreased rates of degradation and results in the up-regulation of a large number of genes (gt40 in mammals) controlled by HIF-1 HIF-1α is a constitutively expressed gene but its protein is also rapidly degraded under normoxic conditions During hypoxia 26S proteosome complex degradation of HIF-1α is inhibited HIF-1α together with HIF-1β form a dimer that functions as a transcriptional factor (HIF-1) that up-regulates the gene expression of many target genes including VEGF erythropoietin and glucose-transporters (Semenza 2001) One crucial function of HIF-1 transcription complex is to increase oxygen delivery and enhance anaerobic respiration during hypoxia by turning on oxygen delivery and glycolytic gene expression HIF-1 expression was up-regulated at day 4 of hypoxia in carp and returned to control value thereafter even though hypoxia persisted until day 42 (Figure 5) A similar pattern of glycolytic gene expression was observed in common carp during hypoxia at day 4 (glyceraldehydes 3-phosphate dehydrogenase phosphoglycerate mutase 1 and 2 beta enolase fructose-bisphosphate aldolase A B and C hexokinase) but the expression remained higher (about 2-fold) than time 0 during prolonged exposure to hypoxia (Figure 6)
HIF-1a is translationally regulated during hypoxia in mammalian systems but it appears that HIF-1a expression also increases in fish during hypoxia (Gracey 2001 Hung unpublished data) The increase in carp HIF-1a expression could be driving the large increase in the expression of glycolytic genes at day 4 After 4 days of hypoxia carp might have become better adapted to hypoxia and shift to solely translation control of HIF1a as seen in mammals
6
Figure 5 Expression profiles of carp HIF1a during hypoxia exposure Day 4 is significantly different from all the time points (One-Way ANOVA plt005)
Fold Change
-6 -3 1 +3 +6
Figure 6 Expression profiles of some glycolytic genes during hypoxia in common carp Most genes are up-regulated especially at day 4
The increase of glycolytic genes at day 4 was accompanied by increase of glyconeogenic genes fructose-16-bisphosphatase and fructose-16-bisphosphatase isozyme 2 and genes involved in the phenylalanine catabolic pathway and the expressions remained slightly higher than time 0 throughout the exposure period Hepatic glycogen decreased rapidly at day 4 presumably as a result of increased anaerobic respiration At day 16 carp had replenished its liver glycogen content to pre-hypoxia exposure (day 0) (Figure 7) Unfortunately only one glycogen synthesis gene glycogenin is represented on our carp microarray and liver expression of this gene was too low to be detected In contrast to liver muscle glycogen remained unchanged during hypoxia indicating that liver but not muscle glycogen is the main substrate for anaerobic respiration during hypoxia (Figure 8)
7
800
d
b
bc
400
500
600
700μm
ol g-1
Liv
er
a300
200
100
0 0 5 10 15 20 25 30 35 40 45
Days after hypoxia
Figure 7 Hepatic glycogen levels of carp during hypoxia Data shown are presented as (Mean plusmn SE) One-way ANOVA plt005 a significantly different from Day 0 b significantly different from Day 4 c significantly different from Day 8 d significantly different from Day 16
40
35
μm
ol g-1
Mus
cle 30
25
20
15
10
5
0 0 5 10 15 20 25 30 35 40 45
Days after Hypoxia
Figure 9 Muscle glycogen level of carp during hypoxia Data shown are presented as (Mean plusmn SE) One-way ANOVA plt005 No significant change during hypoxia
SUMMARY
The major effect of hypoxia on the individual is to reduce exercise capacity Fish respond to hypoxia by inhibiting feeding and reproduction and moving to lower temperatures all of which lower energy expenditure Oxygen delivery is augmented by increasing both gill ventilation and hemoglobin content and oxygen affinity Aerobic metabolism is down-regulated whereas anaerobic metabolism is up-regulated Steroid metabolism is reduced Liver cells go into cell cycle arrest Cell growth and
8
aerobic metabolism genes are down regulated but genes associated with anaerobic metabolism are up-regulated Uncoupling proteins 2 amp 3 are up-regulated and may play a role in reducing mitochondrial activity during hypoxia Much of the response to hypoxia occurs in the first few hours and days Four days seemed to be critical for carp Cyprinus Carpio if they survived day 4 they continued to live under hypoxic conditions There are many similarities between fish and mammalian responses to hypoxia presumably the response evolved in vertebrate aquatic ancestors Cardiovascular responses have been somewhat modified in terrestrial vertebrates and organic phosphate levels in the red blood cell decrease rather than increase in fish The relative role of temperature change starvation adenosine production and HIF-1 expression in metabolic depression not clear in any vertebrate
Major effects of hypoxia on the individual is to reduce exercise capacity if prolonged there is reduced growth Finally there is reduced reproduction At the ecosystem level hypoxia results in reduced species diversity and biomass There is differential survival some species are much more tolerant of hypoxia
ACKNOWLEDGEMENTS
The work described in this paper was substantially supported by grants from the Research Grants council of the Hong Kong Special Administrative Region China Project CityU 109601M CityU 124402M and by the Areas of Excellence Scheme established under the University Grants Committee of the Hong Kong Special Administrative Region China (Project No AoEP-042004)
REFERENCES
Bernier NJ J Harris J Lessard and DJ Randall 1996a Adenosine receptor blockage and hypoxia-tolerance in rainbow trout and Pacific hagfish I Effects on anaerobic metabolism Journal of Experimental Biology 199 485-495
Bernier NJ J Fuentes and DJ Randall 1996b Adenosine receptor blockage and hypoxia-tolerance in rainbow trout and Pacific hagfish II Effects on plasma cathecholamines and erythrocytes Journal of Experimental Biology 199 497-507
Chabot D 2003 Chronic non-lethal levels of hypoxia limit distribution and growth of Atlantic cod (gadus morhua) in the northern gulf of St Lawrence Canada Proceedings of the Seventh International Symposium Tallinn Estonia May 12-15 2003 EPA Environmental Research Laboratory Athens Georgia USA (ed) R Gretchen and DW Michelle EPA600R-04049 pp 183-206
Diaz RJ and R Rosenberg 2001 Overview of anthropogenically-induced hypoxia effects on marine benthic fauna In Coastal Hypoxia Consequences for Living Resources and Ecosystems NN Rabalais and RE Turner (eds) American Geophysical Union Washington DC pp 129-146
Gracey AY JV Troll and GN Somero 2001 Hypoxia-Induced Gene Expression Profiling in the Euryoxic Fish Gillichthys mirabilis Proceedings of National Academy of Sciences of the United States of America 98 1993-1998
Jobling M 1994 Fish Bioenergetics Volume 13 1-44 Chapman and Hall London
9
McKenzie DJ S Wong DJ Randall S Egginton EW Taylor and AP Farrell 2004 The effects of sustained exercise and hypoxia upon oxygen tensions in the red muscle of rainbow trout J Exp Biol 207 3629-3637
Nilsson GE 2002 Adenosine ndash A Universal Promoter of Survival under hypoxic conditions Proceedings of the Sixth International Symposium La Paz BCS Mexico 22-26 January 2001 EPA Environmental Research Laboratory Athens Georgia USA (ed) RV Thruston EPA600R-02097 pp 1-10
Petersen MF and JF Steffensen 2003 Preferred temperature of juvenile Atlantic cod Gadus morhua with different haemoglobin genotypes at normoxia and moderate hypoxia Journal of Experimental Biology 206 359-364
Randall DJ 1982 The control of respiration and circulation in fish during exercise and hypoxia Journal of Experimental Biology 100 275-288
Randall DJ and HPYang 2004 The role of hypoxia starvation β-Naphthoflavone and the arylhydrocarbon receptor nuclear translocation in the inhibition of reproduction in fish Proceedings of the Seventh International Symposium Tallinn Estonia May 12-15 2003 EPA Environmental Research Laboratory Athens Georgia USA (ed) R Gretchen and DW Michelle EPA600R-04049 pp 253-261
Semenza GL 2000 HIF-1 mediator of physiological and pathophysiological responses to hypoxia Journal of Applied Physiology 88 1474-1480
Semenza GL 2001 Hypoxia-inducible factor 1 oxygen homeostasis and disease pathophysiology Trends in Molecular Medicine 7 345-350
Val AL 2000 Organic phosphates in the red blood cells of fish Comparative Biochemistry and Physiology 125 417-435
Val AL B Wicks and DJ Randall 2002 Anemia and polycythanemia affect levels of ATP and GTP in fish red blood cells Proceedings of the Sixth International Symposium La Paz BCS Mexico 22-26 January 2001 EPA Environmental Research Laboratory Athens Georgia USA (ed) RV Thruston EPA600R-02097 pp 11-20
Wu RSS BS Zhou DJ Randall NYS Woo and PKS Lam 2003 Aquatic hypoxia is an endocrine disruptor and impairs fish reproduction Environmental Science and Technology 37 1137-1141
Zhou BS RSS Wu DJ Randall and PKS Lam 2001 Bioenergetics and RNADNA ratios in the common carp (Cyprinus carpio) under hypoxia Journal of Comparative Physiology B 171 49-57
10
POST-GENOMIC APPROACHES TO THE MECHANISMS OF HYPOXIA RESPONSE IN
THE COMMON CARP CYPRINUS CARPIO
EJ Fraser2 AY Gracey and AR Cossins
ABSTRACT
Hypoxia is an important environmental stressor for many fish species particularly in freshwater where it interacts with thermal stress The cyprinid fish in general and the common carp (Cyprinus carpio) in particular are resilient to hypoxia and some species can withstand anoxia for long periods of time We have explored large-scale responses to hypoxia in the common carp and interactions between temperature and hypoxia using transcript screening techniques Fish were subjected at either 17oC or 30oC to progressive reduction in PO2 down to 08mg O2l where they were held for up to 8 days Replicate fish were removed on days 0 1 3 5 and 8 and tissues rapidly dissected and stored for subsequent extraction of RNA In reference-based dual label experiments RNA was hybridised to ~700 carp cDNA microarrays comprising 13349 separate carp probes which were obtained from a series of cDNA libraries enriched for hypoxia- and thermally-responsive genes The resulting large-scale data set including gt5 fold biological replication has been analysed using the GeneSpringGeNET package and interpreted using the annotated gene lists provided by the EST-Ferret We have defined extensive lists of genes from the 5 different tissues that respond to hypoxia and whose hypoxia response is affected by temperature of exposure These lists have been assessed using advanced statistical techniques to identify patterns in expression that relate to underpinning biological responses to single and combined stressors
INTRODUCTION
Terrestrial mammals experience high levels of environmental oxygen and their tissues consequently have a restricted ability to withstand prolonged hypoxia Vascular pathologies in humans can cause tissue hypoxia and the limited resistance to hypoxia is the cause of major clinical conditions (Michiels 2004) including cerebral ischemia (stroke) myocardial ischemia and tumour angiogenesis By contrast freshwater organisms inhabit an environment where oxygen levels routinely fluctuate
sometimes profoundly and survival demands a degree of resistance to hypoxia Some species such as salmonids are highly sensitive and short periods of hypoxia can be lethal while others can survive several months of extreme hypoxia (common carp) and even anoxia (goldfish crucian carp bitterling) (Nilsson et al 1993) These hypoxia-resistant fish typically respond to declining oxygen levels through a tissue-specific reorganisation of energy metabolism which preserves ATP levels and thereby prolongs survival time During the initial stages of hypoxia a down-regulation of metabolism and shutdown of nonessential cell functions occurs (Hochachka et al 1996 Smith et al 1996) As the duration of exposure increases anaerobic ATP-producing pathways are up regulated coupled to a mobilisation of stored glycogen and a down-regulation of oxygen-dependent pathways
The common carp survives long periods of hypoxia by metabolic depression (Zhou et al 2000) cardiac depression (Stecyk and Farrell 2002) and increased blood oxygen affinity (Weber and Lykkeboe 1978) amongst other responses However the data are fragmentary and in some cases
2 School of Biological Sciences University of Liverpool Biosciences Building Crown Street Liverpool L69 7ZB UK
11
contradictory and the broader tissue-specificity and integration of these various response mechanisms has not been fully defined Moreover hypoxia sensitivity and the underpinning response mechanisms may be substantially modified by temperature since hypoxia tolerance is better expressed in the cold To date the underpinning mechanisms have generally been identified by the conventional process of
hypothesis-experiment-deduction This is most elegantly developed at the level of candidate gene whose role is inferred through physiology though the breadth of the understanding is necessarily restricted to the limited number of genes that can be investigated simultaneously New technologies developed recently within the context of genomic science now provides the means of exploring the expression of many thousands of genes simultaneously by means of massively parallel DNA sensors laid in arrays on a solid surface such as glass slides These so-called lsquomicroarraysrsquo not only offer breadth of analysis but also allow open screening of responses as a means of discovering novel responses and novel genes We have recently deployed this technique to show that cold has profound effects on many thousands of transcripts Moreover we were able to identify core responses that exist in all tissues as well as tissue-specific responses (Gracey et al 2004)
Here we describe preliminary attempts to use the microarray technique to investigate the mechanism of response to deep hypoxia in multiple tissues of the common carp We explore responses in liver at two different temperatures to uncover responses at different levels of stress
METHODS
Common carp (Cyprinus carpio L) were obtained commercially and held for 2 months at either 17plusmn05degC or 30plusmn05degC in large 2000-liter aquaria For hypoxic exposure the fish were transferred to 1000-liter tanks and pre-conditioned for 2 weeks Immediately prior to hypoxic exposure (Day 0) 5 fish were removed killed and liver brain kidney heart skeletal white muscle gill and intestinal mucosa were rapidly dissected and frozen on dry ice After this sampling the oxygen level was rapidly decreased over a 3 hr period until the oxygen level was maintained at 08 mglO2 (10 normoxia) Five replicate fish were sampled on days 1 3 5 and 8
Due to the absence of genomic resources for the common carp we prepared 14 full length directionally cloned cDNA libraries These were normalised (Carcini et al 2000) subtracted (Diatchenko et al 1996) and serially subtracted yielding 13349 clones 12960 clones were end sequenced and 9461 of which resulted in high quality reads These were assembled by 2 passes of CAP-3 using an in-house informatics package ESTndashFerret yielding 6806 singletons or subgroups Clones were identified by BLAST homology searching and functionally annotated using the Gene Ontology and KEGG databases The resulting data is presented in carpBASE a MySQL database that is available at httplegrlivacuk
We used amplicons of these 13349 clones to fabricate a high-density carp cDNA microarray on glass slides with an in-house modification to the surface chemistry Fluorescence-labelled target from the tissue samples and a common reference cDNA was hybridised to the array using standard techniques (wwwmicroarrayorg) and the images quantified to provide data files Thus for each sampling time we collected data from 5 replicate animals each being measured twice in each dye combination to address problems of dye bias and provide a technical replicate Data was analysed using the GeneSpring package (Agilent)
12
RESULTS
We have conducted two hypoxia exposure experiments one at 17degC and the other at 30degC Each consisted of a rapid reduction in oxygen tension to a sustained low level with sampling of replicate specimens at regular intervals for an 8-day period Tissue was archived at ndash80degC for subsequent analysis With microarray experiments one of the major considerations is the sheer volume of data Using 5 time points each with 5 tissues analyzed and 5 replicates gives rise to 125 different RNA samples each of which was analyzed twice both for the tissue sample and a common reference sample used for normalization purposes Together these experiments required over 700 arrays resulting in ~19000000 data points Raw data files were first subjected to a quality control procedure to interrogate the concordance of the technical replicates and then a normalised ratio was calculated by combining the expression data for each pair of fluor-reversed slides (Fang et al 2003) Visualization of the data was performed using the GeneSpring data analysis package We have sequence characterised most of the probes on the carp microarray identified the genes by BLAST homology searching and annotated each identified gene using the Gene Ontology and KEGG systems (see supplementary information with Gracey et al (2004))
Discerning biologically meaningful information from such large multi-dimensional data sets is difficult We have used Principal Components Analysis (PCA) an exploratory multivariant statistical technique for simplifying complex data sets (Basilevesky 1994) and to provide an overview of the main patterns in the data PCA reduces high dimensionality to a manageable number that can be displayed on orthogonal axis The final number of variables will seek to include as much variance as the original data set whilst remaining mutually uncorrelated In essence PCA gives us an overview of what is happening with the data without having to consider single genes The other advantage of PCA is that because it investigates movement within statistical space no biological bias is ascribed to the interpretation
Figure 1 illustrates the utility of PCA using the data from skeletal muscle The 1st and 2nd
components of PCA are shown which together account for 80 of the total variance in gene expression There is a clearer separation between temperature than over time For both temperatures there is movement across the two components although the degree of movement is greater for the fish held at 30degC than 17degC Finally the pattern of movement over time is very similar for the two temperatures Thus regardless of the water temperature the muscle responds to hypoxia in a similar manner though the degree of response appears different between the two temperatures PCA can also reveal patterns between all the tissues to provide overviews of conserved and differentiated responses as illustrated for cold exposure in Gracey et al (2004)
13
Figure 1 Principal component analysis of expression profiles from epaxial skeletal muscle of the common carp Data is shown for the experiments conducted at 17 and 30degC and for 1 3 5 and 8 days of hypoxia exposure We show the first two components only accounting for 80 of the variance in the entire dataset
A second method of analysing the large-scale data was to group the expression profiles using a hierarchical clustering technique This generates groups of genes that share patterns of response across treatment space each of which might constitute a regulated response to the treatment These clusters generate lists of genes that can be characterised by profiling the gene ontologies Alternatively data relating to a specific biological process can be selected from the full dataset and analysed separately Figure 2 shows the profiles of genes for all of the enzymes involved in the glycolytic pathway which is an important anaerobic metabolism pathway with liver glycogen the principal energy reserve for fish under hypoxic conditions (Zhou et al 2000) The mean data for the 5 replicate specimens was expressed for each day relative to day 0 with red panels indicating increased expression relative to day 0 and green indicating reduced expression
The expression profiles were similar for both the 17degC and 30degC fish with the strongest induction noted for fructose bisphosphate aldolase A amp B Discrepancies between the two temperatures are seen with hexokinase pyruvate kinase and glucose phosphate isomerase where a decrease in expression is seen at 17degC for the first two whilst an increase is seen at 30degC For glucose phosphate isomerase the reverse is seen Earlier studies have demonstrated that alterations in enzyme kinetics may be an adaptation to hypoxia (Zhou et al 2000) Although we are not examining enzyme activity in this study the lack of increased expression of phosphfructokinase (a major regulatory
14
enzyme for glycolysis) in the liver support work in the muscle of the common carp where a reduction in phoshpofructokinase activity was found indicating a decrease in responsiveness to allosteric control (Zhou et al 2000)
It should be noted that for certain genes there are multiple probes included on the array This provides a specific problem with regard to data analysis and visualisation One option is to average the information across copies and display each gene as a single expression profile However it is clear from Figure 2 that there are differences in the expression profiles between some replicate probes These differences may simply reflect noise or experimental error however there is always the possibility that they represent functionally distinct isoforms of the gene The common carp is a tetraploid species and is widely thought to have undergone genome duplication which has resulted in many gene isoforms This information would be lost if the data were to be averaged
DISCUSSION
Vertebrate genomes contain in excess of 20000 genes with many more transcripts but the microarray technique allows a large fraction of these to be quantified simultaneously We have shown that even for non-sequenced organisms it is possible for single laboratories to provide the cDNA clone resources and sequence annotation to furnish a high-density microarray composed of many thousands of gene probes Generating such large datasets produces downstream problems of analysis visualisation and interpretation though techniques for this are rapidly maturing We show here that the PCA technique can give a broad overview of the relationship between samples treatments taking the entire expression profile into account and this reveals important conclusions about the main sources of variation in profiles We also show that highly detailed information can be mined using selected lists of gene probes In Figure 2 which is a relatively small cluster of only 60 genes from a well-characterised pathway a complicated pattern emerges with peak expression levels differing over time and contradictory patterns between the two temperatures These issues are being addressed with constant improvement in pattern finding algorithms and the public accessibility of all microarray data
15
0 1 3 5 8 0 1 3 5 8 Time (Days)
GLUCOSE 17degC 30degC
HEXOKINAS
GLUCOSE 6-PHOSPHAT
GLUCOSE PHOSPHATE ISOMERASE
FRUCTOSE 6-PHOSPHAT
PHOSPHOFRUCT O
FRUCTOSE 16BISPHOSPHATE
FRUCTOSE BISPHOSPHATE
DIHYDROXYACETON E
TRIOSE PHOSPHATE ISOMERASE
GLYCERALDEHYD E
GLYCERALDEHYDE PHOSPHATE DEHYDROGENASE
13-BISPHOSPHO GLYCERATE
PHOSPHOGLYCERATE
3-PHOSPHO GLYCERAT
PHOSPHOGLYCERATE
2-PHOSPHO GLYCERAT
ENOLASE
PHOSHPOENO L
PYRUVATE KINASE
PYRUVAT
Figure 2 Expression profiles for the genes comprising the glycolytic pathway in liver tissue The pathway is indicated to the right with chemical intermediates and corresponding genes located next to panels representing expression of replicate probes each being identified by BLAST as that gene Expression values were calculated relative to the time zero value and increased levels are indicated in red and decreasing values in green Yellow indicates no change
It is important to recognise that microarray data relates to amount of transcript for a particular gene relative to a specified standard Whilst it reveals patterns of response in transcript amounts this does not necessarily correlate to changes in protein level or activity since regulation can be achieved
16
by adjustment at many hierarchical levels of organisation Confirming transcript response needs analysis using an alternative technique such as RT-PCR but demonstrating that transcript regulation is biologically meaningful requires analysis at the level of protein amounts and enzyme function
Despite these hurdles the power of microarray technology is evident The ability to examine thousands of genes across many tissues simultaneously helps to build an idea of whole animal responses to specific stimuli As well as investigating specific genes of interest the opportunity for novel roles for known genes is always present Finally microarray allows scientist working on non-model species to start investigating changes at the transcript level
ACKNOWLEDGEMENTS
This project was funded by the Natural Environment Research Council (UK) We thank Gregor Govan Margaret Hughes and Weizhong Li for assistance in the aquarium genomics and bioinformatics labs respectively
REFERENCES
Basilevsky A 1994 Statistical Factor Analysis and Related Methods Theory and Applications John Wiley amp Sons New York NY
Carcinci P Y Shibatat NK Hayatsu Y Sugahara and K Shibata 2000 Normalization and subtraction of cap-trapper-selected cDNAs to prepare full-length cDNA libraries for rapid discovery of new genes Genome Research 10 1617-1630
Diatchenko L YFC Lau AP Campbell A Chenchik F Moqadam B Huang S Lukyanov K Lukyanov N Gurskaya ED Sverdlov and PD Siebert 1996 Suppression subtractive hybridization A method for generating differentially regulated of tissue-specific cDAN probes and libraries Proceedings of the National Academy of Sciences of the United States of America 93 6025-6030
Fang Y A Brass DC Hoyle A Hayes A Bashein SG Oliver D Waddington and M Rattray 2003 A model-based analysis of microarray experimental error and normalisation Nucleic Acids Research 31 96
Gracey AY EJ Fraser W Li Y Fang RR Taylor J Rogers A Brass and AR Cossins 2004 Coping with cold An integrative multitissue analysis of the transcriptome of a poikilothermic vertebrate Proceedings of the National Academy of Sciences of the United States of America 101 16970-16975
Hochachka P W LT Buck CJ Doll and S C Land 1996 Unifying theory of hypoxia tolerance Molecularmetabolic defense and rescue mechanisms for surviving oxygen lack Proceedings of the National Academy of Sciences of the United States of America 93 9493-9498
Michiels C 2004 Physiological and Pathological Responses to Hypoxia American Journal of Pathology 164 1875-1882
17
Nilsson GE P Rosen and D Johansson 1993 Anoxic depression of spontaneous locomotor activity in crucian carp quantified by a computerized imaging technique Journal of Experimental Biology 180 153-157
Smith RW DF Houlihan GE Nilsson and JG Brechin 1996 Tissue-specific changes in protein synthesis rates in vivo during anoxia in crucian carp American Journal of Physiology 271897-904
Stecyk JAW and AP Farrell 2002 Cardiorespiratory responses of the common carp (Cyprinus carpio) to severe hypoxia at three acclimation temperatures Journal of Experimental Biology 205 759-768
Weber RE and G Lykkeboe 1978 Respiratory adaptations in carp blood influences of hypoxia red cell organic phosphates divalent cations and CO2 on haemoglobin-oxygen affinity Journal of Comparative Physiology 128 127-137
Zhou BS RSS Wu DJ Randall PKS Lam YK Ip and SF Chew 2000 Metabolic adjustments in the common carp during prolonged hypoxia Journal of Fish Biology 57 1160-1171
18
ISOLATION AND CHARACTERIZATION OF THE VEGF-A GENE OF GRASS CARP
Gallant KL Chan Helen OL Mok Patrick K S Ng Minnie M L Wong and Richard Y C Kong3
ABSTRACT
Vertebrates respond to reduced oxygen concentrations (hypoxia) in many different ways at the systemic local and cellular levels For example adaptations at the systemic level include an increase in ventilation and oxygen-transport capacity by increased erythropoiesis and at the cellular level survival of the individual cell under hypoxia is mediated by induction of glycolytic enzymes to facilitate anaerobic ATP production Local adaptation to hypoxia in tissues is facilitated by the induction of vascular endothelial growth factor (VEGF) which stimulates angiogenesis (or neovascularization) to improve tissue oxygenation The VEGF family consists of 5 members VEGF-A VEGF-B VEGF-C VEGF-D and placental growth factor (PlGF) VEGF-A is the predominant mitogen and plays a critical physiological role both in normal vascular development and response to hypoxic stress In this report we describe the isolation and characterization of the gcVEGF-A gene from grass carp In addition we also demonstrate by RT-PCR the presence of four distinct gcVEGF-A splice variants minus gcVEGF-121 gcVEGF-145 gcVEGF-189 and gcVEGF-206 ndash which are differentially expressed in different fish tissues response to hypoxia
INTRODUCTION
Vascular endothelial growth factor (VEGF-A) is a key regulator of angiogenesis and vascular permeability and upregulated expression of the VEGF-A gene by hypoxia is due to both transcriptional activation by HIF-1 and stabilization of the normally labile VEGF mRNA by various RNA-binding proteins (Levy et al 1996) In vivo VEGF expression is associated with embryonic physiological and pathological blood vessel growth (Breier et al 1992 Shweiki et al 1993 Miller et al 1994) In the adult VEGF is an important angiogenicmitogenic factor in various estrogen target tissues such as the placenta (Pepe and Albrecht 1999) pituitary (Ochoa et al 2000) testis (Rudolfsson et al 2004) ovary and uterus (Charnock-Jones et al 2002) and normal breast tissue (Nakamura et al 1999) In vertebrates several different isoforms of the VEGF protein minus VEGF-121 VEGF-145 VEGF-165 VEGF-189 and VEGF-206 minus are generated via alternative splicing of the VEGF-A gene (Tischer et al 1991) and which differ in angiogenic properties (Kuumlsters et al 2003) Numerous studies have demonstrated that estrogens increase VEGF expression in rodent and human uterine tissues (Hyder et al 2000) rat mammary tumors (Nakamura et al 1996) and human breast cancer cells (Ruohola et al 1999) evidently via the binding of estrogen receptors (ERs) α and β to the estrogen-responsive elements (EREs) of the VEGF-A gene (Hyder et al 2000 Mueller et al 2000) Moreover several studies have shown that hypoxia induces proteasome-dependent degradation of the ERα protein (Stoner et al 2002) in a manner similar to the arylhydrocarbon receptor (AhR)-mediated degradation
Department of Biology and Chemistry City University of Hong Kong Tat Chee Avenue Kowloon Tong Hong Kong Special Administrative Region China
19
3
of ERα that is known to be associated with the anti-estrogenic activities of various AhR agonists (Wormke et al 2003) whereby proteasome-dependent degradation of ERα were accompanied by downregulated expression of estrogen-responsive genes Recent studies have shown that hypoxia not only causes reproductive impairment in the common carp via disruptive changes in endocrine function gonadal development gamete quality fertilization success and larval survivorship (Wu et al 2003) but sublethal levels of hypoxia can also produce teratogenic effects as well as delay embryonic development in the zebrafish (Shang and Wu 2004)
To date the molecular mechanisms by which VEGF proteins regulate reproductive functions in vertebrates are still poorly understood Based on information in mammalian systems on the effects of hypoxia on VEGF-A and the possible regulatory roles of the different VEGF-A isoforms in reproductive tissues it is conceivable that the suppressive effects of hypoxia on reproductive fitness in fish may be mediated by changes in the regulation and expression pattern of the VEGF-A mRNA andor proteins in gonadal tissues of fish Although various VEGF-A spliced variants have been cloned and characterized in zebrafish (Liang et al 2001 Gong et al 2004) VEGF expression in reproductive tissues of fish under normal physiological conditions or pathological expression of VEGF in response to sublethal levels of hypoxia have not been described Due to the diverse biological activities of VEGF isoforms and the capacity of VEGF to recruit pleiotropic signaling pathways in various cellular systems (Ferrara 2004) it is conceivable that a specific VEGF isoform or combinations of different isoforms may be enrolled in distinct physiological and pathological processes On this premise it is suggested that changes in VEGF expression (and splicing) patterns may play a role in hypoxia-induced endocrine disruption leading to reproductive impairment in fish As a first step to better understand the role of VEGF-A as a possible mediator of these functions in fish we have isolated and characterized the gcVEGF-A genomic gene and several gcVEGF-A spliced variants from the hypoxia-tolerant grass carp
MATERIALS AND METHODS Treatment of samples
Grass carp Ctenopharyngodon idellus weighing around 500g were obtained from a commercial hatchery and acclimated in 300 L fiberglass tanks with circulating filtered and well-aerated tap water at 20 ordmC for 1 week prior to experimentation Fish were fed daily with lettuce that amounted to asymp 1 of body weight Fish were then divided into two groups one group was reared under normoxia (70 plusmn 02 mg O2L) and the other under hypoxia (05 plusmn 03 mg O2L) in a continuous flow system described by Zhang et al (2003) The levels of dissolved oxygen were monitored continuously using an YSI Model 580 dissolved oxygen meter After the exposure period fish were anaesthetized by immersion in 2-phenoxyethanol (005 vv) for 5 min and killed by a blow to the head Tissues were then dissected out and snap-frozen in liquid nitrogen and stored at ndash80 ordmC
Reverse transcriptionndashpolymerase chain reaction
Total RNA was isolated using the TRIzol Reagent (Invitrogen USA) according to the manufacturerrsquos instructions One microgram of total RNA was annealed to Oligo (dT)12ndash18 primer at 65ordmC for 15 min and immediately chilled on ice First-strand complementary DNA was synthesized using a reverse transcription (RT) mixture (20 μl) containing 200 units of Superscript reverse transcriptase (Invitrogen USA) 01 M dithiothreitol 05 mM deoxynucleotide triphosphates (dNTPs) 10 units of ribonuclease inhibitor (Invitrogen USA) and 1x first-strand cDNA synthesis buffer and incubated for 1 h at 42ordmC Polymerase chain reaction (PCR) was performed in a PTC 200 Thermal
20
Cycler (MJ Research USA) using a PCR reaction mixture (50 μl) containing 5 μl of cDNA 1 μl of each primer 1x PCR reaction buffer 1 μl dNTPs and 03 μl Supertherm Taq polymerase The protocol included a 10-min preincubation at 94ordmC followed by 40 cycles of 1 min at 94ordmC (denaturation) 1 min at 60ordmC (primer annealing) and 1 min at 72ordmC (extension) PCR products (5 microl) were separated on 1 agarose gels using 100-bp DNA ladder as standard (Invitrogen USA) Gels were stained in 01 ethidium bromide and the DNA visualized using the GelDoc 1000 system (BioRad USA)
Total RNA (40μg) from fish tissues was reverse-transcribed using Supercript II RNase H- reverse transcriptase (Invitrogen) 450 ng of the total RT product (from each organ) were used as templates for PCR amplification and 28S-F and 28S-R primers were used to amplify the 28S rDNA (115 bp) from the same template for control The 30-cycle amplification profile consisted of 95degC for 30 s 63degC for 30 s and 63degC for 2 min
DNA sequencing and BLAST analysis
PCR products were cloned into pGEM-T (Promega) or pUC18 (Amersham Biosciences) vectors for DNA sequencing Plasmid DNA was purified using the Miniprep Concert kit (Invitrogen) and nucleotide sequences were determined in an automated DNA Sequencer (ABI 377 Applied Biosystems) using the BigDye cycle sequencing kit (Applied Biosystems) Homology searches were performed using the online BLAST programs at the National Center for Biotechnology Information (httpwwwncbinlmnih govBLAST)
Genome Walking
Genomic DNA of grass carp was extracted and digested separately with four different restriction enzymes (DraI EcoRV PvuII and StuI) Fully-digested DNA was purified by phenol chloroform and ligated to GenomeWalker adaptors (provided in the universal GenomeWalker kit Clontech) The amplification profile consisted of 7 cycles of 94degC for 25 s and 72degC for 3 min 32 cycles of 94degC for 25 s and 67degC for 3 min followed by a 10-min incubation at 67degC DNA products were cloned into pGEM-T Easy vector (Promega Corp USA) for DNA sequencing
Random Amplification of cDNA Ends (RACE) by PCR
The start and termination sites of gene transcripts were determined by 5prime-RACE (Roche) and 3prime-RACE PCR (3prime-RACE System Invitrogen) respectively according to the instructions provided in the kits Total RNA from the kidney of grass carp exposed to 4 h hypoxia was used as template for first-strand cDNA synthesis The amplification profile consisted of 94degC for 2 mins 35 cycles at 94degC for 30 s 62degC for 30 s and 72degC for 2 min followed by a 10-min incubation at 72degC DNA products were cloned into pGEM-T Easy vector (Promega) for sequencing
21
RESULTS AND DISCUSSION
In our laboratory a 355-bp VEGF-A cDNA fragment was previously obtained by Zhang (2002) from grass carp by reverse-transcription-PCR (RT-PCR) using VEGF-specific primers directed at conserved sequences derived from multiple alignment of VEGF-A genes from different sources Blast search showed that the DNA fragment shares high sequence identity with the VEGF-A gene of zebrafish (93) quail (84) chicken (84) and human (80) In an attempt to obtain the full length gcVEGF-A cDNA from grass carp Rapid Amplification of cDNA Ends (RACE)-PCR was performed to obtain additional sequences at the 5prime- and 3prime-ends of the 355-bp gcVEGF-A cDNA fragment (which is designated here as GV-1) However only 3prime-RACE successfully extended the sequence information at the 3prime-end of GV-1 Therefore nucleotide sequences at the 5rsquo-end of GV-1 were obtained by means of genome-walking Several primers were designed based on the GV-1 sequence for this purpose and were tested on DraI EcoRV PvuII and StuI ldquorestrictionrdquo genomic libraries prepared from grass carp genomic DNA according to instructions in the Genome-Walker kit (Clontech) Several PCR-amplified bands were obtained from the libraries but only the 1081-bp genomic fragment from the DraI library was found to contain VEGF-like sequences Computer analysis showed that a 197-bp exon that shares high sequence identity (85) with the exon 3 sequence of the mouse VEGF-A gene (accession number U41383) is contained in the genomic fragment To date all alternatively-spliced variants of the VEGF-A genes in vertebrates are known to contain sequences for exons 1-5 (Jin et al 2000 Mueller et al 2000 Gong et al 2004) On this premise primers based on the 197-bp ldquoexon 3rdquo sequence of the gcVEGF-A gene fragment were synthesized for 5prime-RACE
5prime- and 3prime-RACE of the gcVEGF-A cDNA
Two DNA fragments of 866 bp (VA2) and 1254 bp (VA1) were obtained by means of 3rsquo RACE (Figure 1) DNA sequencing and computer analysis showed that VA1 and VA2 each contains a polyadenylation site as well as 3rsquo-untranslated sequences that overlap with each other indicating that they encode for different gcVEGF-A transcripts with different polyadenylation sites Comparison of the VA1 and VA2 sequences from grass carp with the human VEGF-A isoforms indicated that VA1 and VA2 which lack both exon 6 and exon 7 sequences are likely derived from alternatively-spliced gcVEGF- since these exonic regions are known to be absent in mammalian VEGF-A121 isoforms (Jin et al 2000) However both VA1 and VA2 contain exon 8 sequences and the TGA stop codon In addition sequence analysis showed that a 675-bp and a 1081-bp 3prime-UTR is present in VA2 and VA1 respectively We next proceeded to carry out 5rsquo RACE and isolated a 362-bp 5prime-RACE product using gene-specific primers (data not shown) DNA sequencing of which confirmed the 5prime-RACE fragment contain exon 1-2 sequences of the gcVEGF-A gene and the ATG start codon Based on the collective sequence information of VA1 VA2 and the 5- and 3rsquo-RACE PCR products exon 1-8 sequences of the grass carp VEGF-A cDNA were assembled which corresponds to the gcVEGF-A206 isoform and the deduced amino acid sequence of which is shown in Figure 2
22
M 1 2
VA1 (1254 bp)
VA2 (866 bp)
Figure 1 3prime-RACE-PCR of grass carp VEGF-A M 100 bp ladder plus (Fermentus) lane 1 secondary RACE product and lane 2 primary RACE
product Total RNA from kidney of grass carp exposed to 4 h hypoxia was reverse transcribed into cDNA for RACE reactions After the ligation of an oligo d(T) adaptor primers 3rsquoVArace1 (1) and VAL1 (2) were used for PCR After 35 cycles of 94degC (30 s) 62degC (30 s) and 72degC (2 min) products were analyzed on 1 agarose
Deduced amino acid sequence of the gcVEGF-A206 isoform
The open reading frame of gcVEGF-A206 is 789 bp long and encodes a protein of 263 amino acids with a predicted molecular mass of 305 kDa and pI of 923 Similar to the mouse VEGF-A protein gcVEGF-A206 contains 8 highly-conserved cysteine residues six of these minus C (49) C (91) C (80) C (124) C (84) and C (126) minus are involved in intramolecular disulphide bonding while two minus C (74) and C (83) minus are involved in intermolecular disulphide bonding to facilitate VEGF-A dimerization All 8 cysteine residues are located in the peptide region encoded by exons 1 to 5 which are conserved in all vertebrate VEGF-A isoforms analyzed so far (Tischer et al 1991 Shima et al 1996)
23
M N F V V Y S I Q L F F A A P L H L S 19
Precursor
A V K A A H I P K E G G K S K N E V T P 39 U
59F F E V Y T K S A C K T R E L L V D I I
Q E Y P D E I E H T Y I P S C V V L M R times
C A G C C N D E A L E C V P T E T R N V times
T M E V M R V K Q R V S Q H N F Q L S F 119
99
79
T E H T K C E C R P K A E V K A K K E K 139
E P R V G R V K S R K R A R E G D T G D 159
L N A S A H L R S S R Y F A L S H W L Y 179
F R A V C L L F V I S L S L H L F V L I 199
F T L L A Q S P Q R R K Q P N H C E P C 219
S E R R K R L Y V Q D P L T C K C S C K 239
Y T Q L Q C K S R Q L E L N E R T C R C 259
E K P R 263
Figure 2 Deduced amino acid sequence of the grass carp VEGF-A206 isoform The grass carp VEGF-A206 deduced amino acid sequences are shown below The amino acid positions are indicated on the right The one-letter amino acid code is used and is as follows A alanine R arginine N asparagines D asparate C cysteine E glutamate Q glutamine G glycine H histidine I isoleucine L leucine K lysine M methionine F phenylalanine P Proline S serine T threonine W tryptophan Y tyrosine V valine stop codon Disulphide bridge sites (cysteine residues) are indicated by arrows Black arrows ( ) indicate sites for intra-chain disulphide linkages within each monomer open arrows (times) indicate sites for inter-chain disulphide linkages between monomers The glycosylation (asparagine N) site is indicated by an upright triangle (U) The precursor protein ofgcVEGF is boxed and labelled
The C-terminus of each isoform which is associated with VEGF-receptor binding may be different but the core protein structure including the conformation and dimerization domains are maintained
24
Detection and isolation of different gcVEGF-A isoforms by RT-PCR
In 1998 Liang et al (2001) reported two VEGF-A isoforms (VEGF-A121 and VEGF-A165) in zebrafish More recently several additional VEGF-A isoforms that show differential expression and distinct spatial distribution patterns were reported in the zebrafish (Gong et al 2004) To determine the number of VEGF-A isoforms that may potentially be expressed in grass carp total RNA from heart tissue of grass carp exposed to hypoxia for 4 h was used for reverse-transcription PCR (RT-PCR) with primers RTF1 and RTR1 These primers are directed at exon 3 and the 3prime-untranslated region (exon 8) of the gcVEGF-A206 cDNA respectively Four RT-PCR products (697 bp 829 bp 922 bp and 1055 bp in size) were obtained and were confirmed by DNA sequencing (and by sequence comparison to the different human VEGF-A isoforms) to encode four distinct gcVEGF-A isoforms which include gcVEGF-A121 gcVEGF-A145 gcVEGF-A189 and gcVEGF-A206 (Figure 3)
Genomic organization and promoter structure of the gcVEGF-A gene
Based on sequence information of the gcVEGF-A206 cDNA the number and size of introns in the gcVEGF-A gene were determined by PCR amplification of grass carp genomic DNA using primers directed at adjacent exons Numerous primer pairs were designed for this purpose and the genomic PCR products obtained from the different reactions (which ranged between ~100 bp to ~35 kb in size) were sequenced and assembled Computer analysis indicated that the gcVEGF-A gene spans ~ 13 kb of nucleotide sequence and consists of 8 exons and 7 introns (Figure 3) Thus it has a very similar structure to the VEGF-A genes of human mouse and zebrafish (Tischer et al 1991 Shima et al 1996 Gong et al 2004) By means of genome walking ca 2-kb of 5prime-flanking sequence upstream of the transcription start site was determined and analyzed by computer for putative transcription factor-binding sites Seven AP1 and HBS (HIF-binding sites) are located at various positions in the 2-kb stretch of 5prime-flanking sequence (data not shown) which may be involved in molecular responses to hypoxia as in the human VEGF-A gene (Salnikow et al 2002) Interestingly four estrogen-responsive elements (EREs) are detected at several sites in the gcVEGF-A gene minus two in the 5prime-flanking sequence one in the 5prime-UTR and one in the 3prime-UTR a feature very similar to those reported in the human and mouse VEGF-A genes (Hyder et al 2000 Mueller et al 2000) This observation suggests that gcVEGF-A expression in grass carp is possibly also regulated by estrogen or estrogen-like compounds in a manner similar to those in mammals (Ochoa et al 2000 Long et al 2001)
25
2
~13 kb
8Exon 1 2 3 4 5 6 7
ATG TGA
gcVEGF-A
438 675Size (bp) 4 gcVEGF 121 (VA2)
4
1 3 42 85
438 1081 gcVEGF 121 (VA1)
4
1 3 4 852
570
gcVEGF 165 1 3 4 8752
4 663
[AAAA]
[AAAA]
1081
[AAAA]
1081
gcVEGF 189
gcVEGF 206
[AAAA]
4 796 1081
[AAAA]
1 3 4 876A52
1 3 4 6A 6B52 87
Figure 3 Organization of grass carp VEGF-A gene The eight exons of the gcVEGF-A gene are shown as boxes Filled and open boxes indicate translated and untranslated regions respectively The position of the start (ATG) and stop (TAA) codons are indicated by inverted arrows (darr) The two putative polyadenylation sites (ATTAAA) are marked by upright arrows (uarr) The 5prime-untranslated region coding sequence and 3prime-untranslated region of each transcript are indicated
26
Concluding Remarks
VEGF-A is an important angiogenic molecule that not only stimulates new blood vessel formation but is also a potent regulator of vascular permeability (Dvorak et al 1995) In mammals numerous studies have demonstrated that steroid hormones control angiogenesis and vascular permeability both in vivo (Hyder et al 1996) and in primary cultures derived from the reproductive tract (Charnock-Jones et al 2002) These observations strongly suggest that VEGF-A may mediate certain actions of sex steroids and is likely to play a number of physiological and pathological roles in the regulation of reproductive functions While comparatively more information is available in mammalian systems on the potential regulatory roles of different VEGF-A isoforms in reproductive tissues similar information about the functions of VEGF-A in fish remains limited The isolation and characterization of different VEGF-A isoforms from the grass carp in this study will allow further investigations on the mechanisms by which sex steroids and their agonistsantagonists regulate VEGF-A expression and reproductive functions in fish
REFERENCES
Breier G U Albrecht S Sterrer and W Risau 1992 Expression of vascular endothelial growth factor during embryonic angiogenesis and endothelial cell differentiation Development 114 521-531
Charnock-Jones DS Y He and SK Smith 2002 Angiogenesis and vascular endothelial growth factor (VEGF) in reproduction New Angiotherapy 115-128
Dvorak HF LF Brown M Detmar and AM Dvorak 1995 Vascular permeability factorvascular endothelial growth factor microvascular hyperperbility and angiogenesis American Journal of Pathology 146 1029-1039
Dvorak HF 2002 Vascular permeability factorvascular endothelial growth factor a critical cytokine in tumor angiogenesis and a potential target for diagnosis and therapy Journal of Clinical Oncology 20 4368-4380
Ferrara N 2004 Vascular endothelial growth factor Basic science and clinical progress Endocrine Reviews 25 581-611
Gong B D Liang TG Chew and R Ge 2004 Characterization of the zebrafish vascular endothelial growth factor A gene comparison with vegf-A genes in mammals and Fugu Biochimica et Biophysica Acta 1676 33-40
Hyder S M Z Nawaz C Chiappetta and GM Stancel 2000 Detection of classical and atypical estrogen response elements in the untranslated regions of the rat VEGF gene Cancer Research 60 3183-3190
Hyder SM GM Stancel C Chiappetta L Murthy HL Boettger-Tong and S Makela 1996 Uterine expression of vascular endothelial growth factor is increased by estradiol and tamoxifen Cancer Research 56 3954-3960
27
Jin K L XO Mao T Nagayama PC Goldsmith and DA Greenberg 2000 Induction of vascular endothelial growth factor receptors and phosphatidylinositol 3-kinaseAkt signaling by global cerebral ischemia in the rat Neuroscience 99 577-585
Kuumlsters B MW Robert PW de Waal V Kiek C Maass A Heerschap JO Barentsz F Sweep DJ Ruiter and WPJ Leenders 2003 Differential effects of vascular endothelial growth factor A isoforms in a mouse brain metastasis model of human melanoma Cancer Research 63 5408-5413
Levy AP NS Levy and MA Goldberg 1996 Post-transcriptional regulation of vascular endothelial growth factor by hypoxia Journal of Biological Chemistry 271 2746-2753
Liang D JR Chang AJ Chin A Smith C Kelly ES Weinberg and RW Ge 2001 The role of vascular endothelial growth factor (VEGF) in vasculogenesis angiogenesis and hematopoiesis in zebrafish development Mechanisms of Development 108 29-43
Long X-H KA Burke RM Bigsby and KP Nephew 2001 Effects of the xenoestrogen bisphenol A on expression of vascular endothelial growth factor in the rat Experimental Biology and Medicine 226 477-483
Miller J W AP Adamis DT Shima PA DrsquoAmore RS Moulton MS OrsquoReilly J Folkman HF Dvorak LF Brown B Berse TK Yeo and KT Yeo 1994 Vascular endothelial growth factorvascular permeability factor is temporally and spatially correlated with ocular angiogenesis in a primate model American Journal of Pathology 145 574-584
Mueller M D et al 2000 Regulation of vascular endothelial growth factor (VEGF) gene transcription by estrogen receptors α and β Proceedings of the National Academy of Sciences USA 97 10972-10977
Pepe G and E Albrecht 1999 Regulation of functional differentiation of the placental villous syncytiotrophoblast by estrogen during primate pregnancy Steroids 64 624-627
Nakamura J A Savinvov Q Lu and A Brodie 1996 Estrogen regulates vascular endothelial growthpermeability factor expression in 712-dimethylbenz(a)anthracene-induced rat mammary tumors Endocrinology 137 5589-5596
Nakamura J Q Lu G Aberdeen E Albrecht and A Brodie 1999 The effect of estrogen on aromatase and vascular endothelial growth factor messenger ribonucleic acid in the normal non-human primate mammary gland Journal of Clinical Endocrinology and Metabolism 84 1432-1437
Ochoa A L et al 2000 Vascular endothelial growth factor in the rat pituitary differential distribution and regulation by estrogen Journal of Endocrinology 165 483-492
28
Rudolfsson S H P Wikstroem A Jonsson O Collin and A Bergh 2004 Hormonal regulation and functional role of vascular endothelial growth factor A in the rat testis Biology of Reproduction 70 340-347
Ruohola JK et al 1999 Vascular endothelial growth factors are differentially regulated by steroid hormones and antiestrogens in breast cancer cells Molecular and Cellular Endocrinology 149 29-40
Salnikow K T Kluz M Costa D Piquemal ZN Demidenko KP Xie and MV Blagosklonny 2002 The regulation of hypoxic genes by calcium involves c-JunAP-1 which cooperates with hypoxia-inducible factor 1 in response to hypoxia Molecular and Cellular Biology 22 1734-1741
Shang EHH and RSS Wu 2004 Aquatic hypoxia is a teratogen and affects embryonic development Environmental Science and Technology 38 4763-4767
Shima DT M Kuroki U Deutsch YS Ng AP Adamis and P DrsquoAmore 1996 The mouse gene for vascular endothelial growth factor Journal of Biological Chemistry 271 3877-3883
Shweiki D A Itin G Neufeld H Gitay-Goren and E Keshet 1993 Patterns of expression of vascular endothelial growth factor (VEGF) and VEGF receptors in mice suggest a role in hormonally regulated angiogenesis Journal of Clinical Investigation 91 2235-2243
Stoner M B Saville M Wormke D Dean R Burghardt and S Safe 2002 Hypoxia induces proteasome-dependent degradation of estrogen receptor α in ZR-75 breast cancer cells Molecular Endocrinology 16 2231-2242
Tischer E R Mitchell T Hartman M Silva D Gospodarowicz JC Fidddes and JA Abraham 1991 The human gene for vascular endothelial growth factor Multiple protein forms are encoded through alternative exon splicing Journal of Biological Chemistry 266 11947-11954
Wormke M M Stoner B Saville K Walker M Abdelrahim R Burghardt and S Safe 2003 The aryl hydrocarbon receptor mediates degradation of estrogen receptor α through activation of proteasomes Molecular and Cellular Biology 23 1843-1855
Wu RSS BS Zhou DJ Randall YS Norman and PKS Lam 2003 Aquatic hypoxia is an endocrine disruptor and impairs fish reproduction Environmental Science and Technology 37 1137-1141
Zhang Z P 2002 Molecular responses to hypoxia in the grass carp Ctenopharyngodon idellus PhD thesis City University of Hong Kong Hong Kong
Zhang ZP RSS Wu HOL Mok YL Wang WWKL Poon SH Cheng and RYC Kong 2003 Isolation characterization and expression analysis of a hypoxia-responsive glucose transporter gene from the grass carp Ctenopharyngodon idellus European Journal of Biochemistry 270 3010-3017
29
30
MOLECULAR STUDIES OF THE HIF TRANSCRIPTION FACTORS OF GRASS CARP
HW Law4 Richard YC Kong and Rudolf SS Wu
ABSTRACT
Widespread occurrence of aquatic hypoxia as a result of eutrophication and increasing organic pollution is a pressing global problem because of its adverse impact on aquatic life The hypoxia-inducible factor 1 (HIF-1) in vertebrates senses low oxygen levels and responds by switching on a number of genes such as EPO VEGF and GLUT to help the organism to adapt and survive So far three different HIF-α isoforms have been reported and implicated in diverse regulatory functions such as in oxygenenergy homeostasis apoptosis and reproduction Unlike mammals fish often have to contend with varying levels and periods of hypoxic stress in the aquatic environment and invariably respond by invoking a variety of protective responses (molecular physiological and behavioural) at sublethal levels of hypoxia However the type of responses that are initiated at various levels of hypoxia and how they are related to each other is not clear There is a paucity of information at the molecular level on HIF factors and their functional roles in fish In this report we describe the isolation of full-length cDNAs encoding three different HIF-α proteins minus gcHIF-1α gcHIF-2α and gcHIF-4α minus form the hypoxia-tolerant grass carp The basic features found in the gcHIF-αs and the pairwise comparison of the gcHIF-αs with other HIF-αs is also explained
INTRODUCTION
Aquatic hypoxia has been a pressing problem in recent decades because of its widespread occurrence and adverse impact on the aquatic environment Large scale hypoxiaanoxia events affecting thousands of km2 have been reported worldwide including North and South America Africa European seas Pacific and Indian Oceans and many coastal areas (Diaz and Rosenberg 1995 Wu 1999) Aquatic hypoxia is defined as dissolved oxygen (DO) levels between 0 mgl (anoxia) and 28 mgl (Diaz and Rosenberg 1995) Aquatic hypoxia is a natural phenomenon and is a consequence of anthropogenic activities for example eutrophication overstocking of fish and shellfish (Gundersen and Joslashrgensen 1990) Since oxygen availability in aquatic environments fluctuates greatly daily seasonally and spatially hypoxia has become one of the major environmental stresses that fish have to contend with in order to survive and they have evolved a variety of behavioral physiological and biochemical mechanisms to aid survival under hypoxia (Randall 1982 Storey 1988 Petersen and Petersen 1990) Hypoxia-inducible factor 1 (HIF-1) has been reported to be a master regulator of cellular and systemic oxygen homeostasis in mammals (Semenza 1999) and plays a crucial role in upregulating dozens of hypoxia-responsive genes at the transcriptional level to facilitate oxygen uptake or delivery and anaerobic energy production (Semenza 2000 Bracken et al 2003) More recently HIF-2 has been shown to play a more dominant role in erythropoiesis (Fine and Norman 2002) and angiogenesis (Takeda et al 2004) while HIF-3 appears to act as a negative regulator of HIF-mediated responses to hypoxia (Hara et al 2001)
To date there is a paucity of information at the molecular level on HIF factors and their functional
Department of Biology and Chemistry City University of Hong Kong Tat Chee Avenue Kowloon Hong Kong
31
4
roles in fish Although HIF-1α and HIF-2α have been reported respectively in rainbow trout (Soitamo et al 2001) and Atlantic killifish (Powell and Hahn 2002) the molecular mechanisms by which these factors regulate cellular and physiological responses to hypoxia andor other environmental stresses in fish have not been elucidated Unlike mammals fish often have to contend with varying levels and periods of hypoxic stress in the aquatic environment and already it is known that there is a wide range of chronic and protective responses to sublethal levels of hypoxia amongst different fish species Based on current knowledge about the HIF family of transcription factors in mammals it is conceivable that many of the hypoxic responses in fish are also likely to be mediated and regulated by HIF proteins It is of great interest to investigate the HIFs in fish to gain insights on the relationship between HIF functions and hypoxia tolerance in fish As a first step to investigate the mechanisms by which HIF proteins mediate different biological processes in the hypoxia-tolerant grass carp full-length cDNAs encoding different gcHIF-α and gcHIF-β (ARNT) proteins have been isolated in this study Here we report briefly the isolation and characterization of these basic helix loop helix (bHLH) proteins
MATERIALS AND METHODS
Experimental fish
Animal care and experiments were performed in accordance with the City University of Hong Kong animal care guidelines Grass carp Ctenopharyngodon idella with a weight of around 500 g were obtained from a commercial hatchery in Panyu Guangdong PRC and acclimatized in 400-L freshwater in fiberglass tanks with circulating filtered and well-aerated tap water at 20 degC for 1 week prior to experimentation
Hypoxic system for fish
A continuous flow system (modified from Zhou et al 2000) was set up for constant dissolved oxygen for hypoxia exposure of fish (Figure 1) The system consisted of a 400-L fiberglass holding tank an oxygen stripping column a filter unit a cylinder of compressed N2 gas and a dissolved oxygen meter Water in fish tank was pumped to filter unit composing of filtering wool and activated charcoal N2 was bubbled into the stripping column at the bottom while filtered water was applied at the top Deoxygenated water flew back to holding tank Dissolved oxygen was continuously monitored by an YSI Model 580 dissolved oxygen meter at DO 05plusmn03 mgL by controlling N2 flow rate to oxygen stripping column Control group was maintained at DO 70plusmn02 mgL in fiberglass holding tank with continuously filtered water Water was kept at 20plusmn1degC and the holding tanks were subjected to 12 L 12 D cycle
Cloning of HIF-α and ARNT cDNAs in grass carp
Grass carps were exposed to normoxia (DO 70plusmn02 mgL) and hypoxia (DO 05plusmn03 mgL) for 4 h After the exposure period fish were anesthetized and tissues were dissected out and snap-frozen in liquid nitrogen stored at minus80degC until ready to be processed Total RNA was isolated from the tissues by Trizol reagent (Invitrogen) according to the manufacturerrsquos instructions RNA concentration was determined by spectrophotometry using the GeneQuant II RNADNA Calculator (Amersham Biosciences) at λ260
32
N2 gas
O2 meter
Filter
Figure 1 Schematic diagram showing a continuous flow system for hypoxia exposure of grass carp Water in the fish holding tank is pumped and filtered through filtering wool and a bed of activated charcoal and gravel for removal of solid particles and ammonia waste Filtered water then passes through an oxygen stripping column where N2 gas is bubbled at the bottom through a gas stone in which efficiency of stripping is increased by opposite flow direction of N2 gas to water as well as enlarged contact surface area of the gas bubble and water on the engraved bio-balls Holding tank is replenished with the filtered and deoxygenated water in which a gentle current is created and dissolved oxygen is monitored at 05plusmn03 mgL by an YSI Model 580 dissolved oxygen meter and manual control of the N2 gas flow rate to the oxygen stripping column Water flow and gas flow are represented by solid line and broken line respectively while direction of flow is denoted by arrows
DNase I-treated total RNA from kidney of 4 h hypoxically stressed fish was used for reverse transcription First-strand cDNA was synthesized from 1 μg total RNA with Superscript II RNase H-
Reverse Transcriptase (GibcoBRL) using Oligo (dT)12-18 primer PCR amplifications were performed with 10 different combinations of degenerate forward and reverse primers Amplification products were analysed by agarose gel electrophoresis purified from gel and cloned into plasmid vectors for DNA sequencing To obtain the 5prime- and 3prime-ends of the grass carp HIF-α and ARNT cDNAs 5prime- and 3prime-RACE were performed using the Marathon cDNA Amplification Kit (Clontech) with modifications 5prime- and 3prime-RACE PCR products were cloned into plasmid vectors for DNA sequencing
Multiple alignment of nucleotide and deduced amino acid sequences of HIF-1α genes from selected organisms (Table 1) were performed by using Clustal W Conserved regions in the multiple sequence alignments were identified both manually and by the use of the BOXSHADE program PCR primers with a degeneracy of less than 100 were designed based on the conserved regions
33
Table 1 HIF-1α nucleotide and deduced protein sequences from selected organisms that were used for multiple sequence alignment
Species GenBank accession number Oncorhynchus mykiss AF304864 Danio rerio (unpublished sequence kindly provided by Dr SH
Cheng City University of Hong Kong) Homo sapiens NM_001530 Mus musculus NM_010431 Rattus norvegicus Y09507 Bos taurus AB018398 Gallus gallus AB013746 Xenopus laevis AJ277829
RESULTS AND DISCUSSION
Degenerate primers directed at highly- conserved regions of the HIF-1αs from different vertebrate species were used in reverse transcription-PCR on total RNA from hypoxic grass carp kidney Based on DNA sequence analysis partial cDNA clones encoding three distinct grass carp HIF-αs minus gcHIF-1α gcHIF-2α and gcHIF-4α minus were isolated Using primers directed at two conserved regions of the zebrafish ARNT2b cDNA (GenBank Accession number AF219988) partial gcARNT2b and gcARNT2c cDNAs were also cloned Since the three partial gcHIF-α cDNAs and the two partial gcARNT cDNAs are incomplete at the 5prime- and 3prime-ends gene-specific nested primers (GSP) were designed for 5prime- and 3prime-RACE PCR in order to obtain the full-length cDNAs The nucleotide sequence information derived by 5prime- and 3prime-RACE was assembled to produce the full-length cDNA sequences for gcHIF-1α gcHIF-2α gcHIF-4α gcARNT2b and gcARNT2c The authenticity of the individual cDNAs was confirmed by full-length reverse transcription-PCR
Characterization of the gcHIF-α cDNAs
Computer analysis showed that gcHIF-1α (3848 bp in length) contains a 5prime-untranslated (UT) region of 257 bp a 3prime-UT region of 1238 bp and an open reading frame (ORF) of 2325 bp which encodes for a protein of 774 amino acids The gcHIF-2α cDNA (3195 bp in length) contains 5prime- and 3prime-UT regions of 263 bp and 424 bp respectively and an ORF of 2508 bp which encodes for a protein of 835 amino acids The gcHIF-4α (2092 bp in size) contains a 5prime-UT region of 102 bp a 3prime-UT region of 29 bp and an ORF of 1932 bp which encodes for a protein of 643 amino acids
Pairwise comparison of gcHIF-1α with selected HIF-α cDNAs from the GenBank database (Table 2) revealed that gcHIF-1α shares high sequence identity at the protein and nucleotide levels with the HIF-1αs of rainbow trout (68 72) human (64 63) and cow (65 62) while only moderate sequence identity (52minus57 at the nucleotide level) with the HIF-2α and HIF-3α paralogs was observed Homology search showed that gcHIF-2α shares high sequence identity with the killifish (69 at DNA 62 at amino acid) mammalian (64minus65 at DNA 57 at amino acid) and avian (63 at DNA 58 at amino acid) HIF-2α cDNAs
34
Table 2 Percentage sequence identities of the ORFs of gcHIF-αs to known HIF-α isoforms in the GenBank database Identity scores were derived using the GAP program of GCG softwares ldquoaardquo represents identity at amino acid level ldquontrdquo represents identity at nucleotide level
GenBank Species Size gcHIF-1α gcHIF-2α Accessio (amino gcHIF-4
n No acid) α aa nt aa nt aa nt
AF20848 Homo sapiens 826 64 63 44 51 41 51 7
NM_0104 Mus musculus 836 64 63 40 52 41 49 31
Y09507 Rattus norvegicus 825 64 64 43 53 42 52 AB01839 Bos taurus 823 65 62 44 65 42 53
8 AB01374 Gallus gallus 811 65 65 45 52 47 51
6 AJ277829 Xenopus laevis 805 57 62 40 53 43 54 AF30486 Oncorhynchus 766 68 72 44 59 44 56
4 mykissAY45026 Ctenopharyngodo 774 10 100 53 57 47 55
9 n idella 0
BC05133 Homo sapiens 870 53 57 57 64 44 56 8
NM_0101 Mus musculus 874 52 57 56 64 45 55 37
AJ277828 Rattus norvegicus 874 52 57 56 64 43 51 AB01839 Bos taurus 870 53 57 57 65 45 57
9 AF12981 Gallus gallus 868 50 57 59 64 46 53
3 AF21298 Coturnix coturnix 870 50 56 58 63 46 53
9 AF40278 Fundulus 873 52 56 62 69 46 53
2 heteroclitus AY57752 Ctenopharyngodo 835 53 57 10 100 46 55
4 n idella 0
AB05406 Homo sapiens 667 45 52 43 54 44 54 HIF-3 7 α AF06019 Mus musculus 662 44 52 43 54 47 53
4 AJ277827 Rattus norvegicus 662 44 52 42 55 46 53
HIF-4 AY45027 Ctenopharyngodo 643 47 55 46 55 10 100 α 0 n idella 0
HIF-1α
HIF-2α
Interestingly exceptionally high sequence identity (93) was observed in a 32-bp nucleotide stretch (nucleotide 71minus102) in the 5prime-UT region of gcHIF-2α which is highly conserved in the corresponding positions of the quail and human HIF-2α cDNAs In contrast to gcHIF-1α and gcHIF-2α gcHIF-4α shares almost equal sequence identity at the protein level with the HIF-1α -2α and -3α isoforms from various animal species For example a 40minus44 identity to the HIF-1αs 45 identity to the HIF-2αs and 45 identity to the HIF-3αs were observed which strongly suggests that gcHIF-4α encodes for a novel HIF-α isoform in grass carp The full-length gcHIF-1α gcHIF-2α and gcHIF-4α cDNA sequences have been deposited in GenBank under accession numbers AY450269
35
14
AY577524 and AY450270 respectively
With reference to the deduced amino acid sequence of human HIF-1α the characteristic domains typical of HIF-α proteins are present in all three gcHIF-αs proteins which include the basic helix-loop-helix (bHLH) domain Per-Sim-ARNT (PAS) -A and -B domains PAS-associated C-terminal domain (PAC) oxygen dependent degradation (ODD) domain and the N- and C-terminal transactivation domains (N-TAD and C-TAD) (Figure 2) These domains are known to have a specialized function for example bHLH PAS-A and -B and PAC are required for dimerization with ARNT molecules and DNA binding to target genes (Jiang et al 1996) ODD senses cellular oxygen tension and controls HIF-α protein stability (Jiang et al 1997) and the N-TAD and C-TAD regions are for transcriptional activation of HIF target genes (Jiang et al 1997)
bHLH PAS PAC N-TAD C-TAD
16 71 91 145 236 287 300 351 522 576 726 774
ODDA B gcHIF-1α
70 91 145 237 288 301 352 492 538 797 835
ODDA B gcHIF-2α
13 68 90 144 231 282 295 346 468 518
ODDBA gcHIF-4α
Figure 2 Comparison of homologous domains between the gcHIF-1α -2α and -4α proteins Each horizontal bar represents a gcHIF-α protein and the amino acid positions demarcating each structural domain are shown accordingly in the diagram The structural domains are shaded and drawn to scale
As depicted in Figure 2 both gcHIF-1α and gcHIF-2α contain all of the above structural domains typical of HIF-α while gcHIF-4α lacks a discernible C-TAD region minus no significant similarity between the C-terminal region of the putative gcHIF-4α protein and the C-TAD region from the known HIF-1α and -2α proteins could be detected The structural region of gcHIF-4α that mediates transcriptional activation therefore remains to be elucidated
36
Characterization of the gcARNT cDNAs
Computer analysis revealed that the gcARNT2b cDNA contains a 5prime-UT region of 128 bp and an ORF of 2214 bp which encodes for a 737-amino acid protein while the gcARNT2c cDNA is an alternatively-spliced variant differing from gcARNT2b in that the former has a 45-bp deletion in the ORF (nucleotide 318minus362 of gcARNT2b) The 45-bp deleted region encodes for a 15-amino acid peptide YDDDQIPGDKERYAR in the N-terminal half of the protein The putative gcARNT2b and gcARNT2c proteins were compared with the ARNT sequences from different species (available in the GenBank) and amongst them the zebrafish ARNT2b (AF219988) and zebrafish ARNT2c (AF219989) proteins share the highest amino acid sequence identity with gcARNT2b (94) and gcARNT2c (96) respectively The gcARNT2b and gcARNT2c sequences have been deposited in GenBank under accession numbers AY596921 and AY596922 respectively
CONCLUSIONS
In this study the full-length cDNAs of gcHIF-1α gcHIF-2α and the novel isoform gcHIF-4α have been cloned The sequence similarity of the grass carp proteins to mammalian and avian HIF-αs was examined by computer and gcHIF-4α was found to be a novel isoform sharing almost equal sequence identity with the three types of HIF-α proteins (HIF-1α HIF-2α and HIF-3α) that have been reported thus far in mammals Our studies also indicated that gcARNT2b and the alternatively spliced variant gcARNT2c are present in grass carp It will be interesting to investigate the dimerization affinities between the different gcHIF-αs and gcARNTs and the transactivation capacity and biological functions of the different HIF proteins in fish
ACKNOWLEDGEMENT
Funding for this study was supported partially by a Strategic Grant (Project No 7001415) and a Central Earmarked Research Grant (Project No CityU109401M) from the Research Grants Council of Hong Kong Special Administrative Region Peoplersquos Republic of China SHWL was supported by a City University of Hong Kong studentship
REFERENCES
Bracken CP ML Whitelaw and DL Peet 2003 The hypoxia-inducible factors key transcriptional regulators of hypoxia responses Cellular and Molecular Life Science 60 1376minus1393
Diaz RJ and R Rosenberg 1995 Marine benthic hypoxia a review of its ecological effects and the behavioral responses of benthic macrofauna In Oceanography and Marine Biology an Annual Review Volume 33 Ansell AD Gibson RN and Barnes M (eds) UCL Press London 245minus303
Fine LG and JT Norman 2002 The breathing kidney Journal of the American Society of Nephrology 13 1974minus1976
37
Gundersen JK and BB Joslashrgensen 1990 Microstructure of diffusive boundary layers and the oxygen uptake of the sea floor Nature 345 604minus607
Hara S J Hamada C Kobayashi Y Kondo and N Imura 2001 Expression and characterization of hypoxia-inducible factor (HIF)-3α in human kidney suppression of HIF-mediated gene expression by HIF-3α Biochemical and Biophysical Research Communications 287 808minus813
Jiang B E Rue GL Wang R Roe and GL Semenza 1996 Dimerization DNA binding and transactivation properties of hypoxia-inducible factor 1 Journal of Biological Chemistry 271 17771minus17778
Jiang B JZ Zheng SW Leung R Roe and GL Semenza 1997 Transactivation and inhibitory domains of hypoxia-inducible factor 1α Journal of Biological Chemistry 272 19253minus19260
Petersen JK and GI Petersen 1990 Tolerance behavior and oxygen consumption in the sand goby Pomatoschistus minutus (Pallas) exposed to hypoxia Journal of Fish Biology 37 921minus933
Powell WH and ME Hahn 2000 The evolution of aryl hydrocarbon signaling proteins diversity of ARNT isoforms among fish species Marine and Environmental Research 50 39minus44
Randall DJ 1982 The control of respiration and circulation in fish during exercise and hypoxia Journal of Experimental Biology 100 275minus288
Semenza GL 1999 Regulation of mammalian O2 homeostasis by Hypoxia-inducible Factor 1 Annual Review Cell and Developmental Biology 15 551minus578
Soitamo AJ CMI Raringbergh M Gassmann L Sistonen and M Nikinmaa 2001 Characterization of a hypoxia-inducible factor (HIF-1α) from rainbow trout Accumulation of protein occurs at normal venous oxygen tension Journal of Biological Chemistry 276 19699minus19705
Storey KB 1988 Suspended animation the molecular basis of metabolic depression Canadian Journal of Zoology 66 124minus132
Takeda N K Maemura Y Imai T Harada D Kawanami T Nojiri I Manabe and R Nagai 2004 Endothelial PAS domin protein 1 gene promotes angiogenesis through the transactivation of both vascular endothelial growth factor and its receptor fetal liver tyrosine kinase 1 Circulation Research 95 146minus153
Wu RSS 1999 Eutrophication water borne pathogens and xenobiotic compounds environmental risks and challenges Marine Pollution Bulletin 39 11minus22
Zhou BS RSS Wu DJ Randall PKS Lam YK Ip and SF Chew 2000 Metabolic adjustments in the common carp during prolonged hypoxia Journal of Fish Biology 57 1160minus1171
38
GENE EXPRESSION PROFILING OF RAW2647 CELL SURVIVAL AND APOPTOSIS UNDER OXIDATIVE STRESS
C C Fong5 Y Zhang MS Wong CH Tzang WP Lai and M Yang
ABSTRACT
Organisms living in an aerobic environment are continuously exposed to reactive oxygen species (ROS) ROS can induce apoptosis of cells and cells also develop negative feedback mechanisms to limit ROS induced cell death In this study we used cDNA microarray to investigate the molecular mechanism of survival and apoptosis of RAW 2647 cells under ROS The cells were treated with H2O2 and cDNA microarray assay was carried out to produce gene expression profiles We found that H2O2 treatment up-regulated stress survival and apoptosis related genes and down regulated growth and cell cycle promoting genes Metabolism related genes showed special expression pattern under oxidative stress glycolysis and lipid synthesis related gene were down-regulated whereas the genes of lipid catabolism and protein synthesis were up-regulated We also identified several signaling pathways as ROS sensitive pathways including p53 Akt NF-κB ERK JNK p38 PKC and INF-r They played important roles in the process of apoptosis or cell survival
INTRODUCTION
Organisms living in an aerobic environment are continuously exposed to reactive oxygen species (ROS) ROS including superoxide anion hydrogen peroxide singlet oxygen and hydroxy radical can raise from normal metabolism and pathological processes such as stress heat irradiation hyperoxia and any increases in metabolism including exercise injury and even repair processes and in wide variety of human disease including tumor AIDs Parkinsonrsquos Huntingtonrsquos (Finkle et al 2000 Chandra et al 2000 Fehrenbach and Northoff 2001) The roles of ROS in living cells have been studied for many years Direct treatment of cells with oxidants such as hydrogen peroxide (H2O2) was thought to exclusively cause necrosis but more recent studies have shown that under certain situations ROS can act as signaling molecules to trigger apoptosis and apoptosis not the only responses of living cells to ROS To different levels of ROS the spectrum of response ranges from proliferation to growth arrest to senescence and to cell death In addition cells also develop negative feedback mechanisms that involve the regulated expression of survival genes to limit the ability of ROS in inducing cell death in order to survive under oxidative stress (Carmody and Cotter 2001 Nishikawa et al 2000)
To understand how ROS act as signal transduction molecules people have investigated the regulation of gene expression and signal transduction pathways under ROS exposure Many genes and signal transduction pathways have been identified as ROS sensitive genes and pathways (Allen and Tresini 2000 Flohe et al 1997) However previous studies have been limited in that only a small number of genes can be examined for their response to ROS in each experiment by using traditional molecular and cell biological methods If people want to address ROS sensitive signal pathways
Department of Biology and Chemistry City University of Hong Kong Tat Chee Avenue Kowloon Hong Kong
39 5
especially the relationships among these pathways they have to use various small pieces of data collecting from different experiments even in different cell models to make the big pictures However this may cause some biases
In current study we used cDNA microarray combined with traditional molecular and cell biological methods to investigate the molecular mechanism of survival and apoptosis in H2O2 treated RAW 2647 cells a mouse monocytic-macrophage like cell line In the present study a number of ROS sensitivity genes and signaling pathways related to apoptosis and cell survival were identified A partial cellular signaling web on how ROS trigger apoptosis in H2O2 treated RAW 2647 cells and how the cells survive under oxidative stress has been culminated through analysis of the data from current study and other peoplersquos reports The signaling web provided insight into the molecular mechanism of apoptosis induced by ROS and feedback mechanisms that involve in cell survival
MATERIAL AND METHODS
Cell culture and cell viability assay
RAW 2647 cells (ATCC VA) were cultured in Dulbeccorsquos modified Eaglersquos medium (DMEM) (GIBCO BRL Caithersburg MD) supplement with 10 fetal bovine For cell viability assay 1times 104 RAW 2647 cells seeded in a 96 well cell culture plates were treated with H2O2 in DMEM at various concentrations from 125 times 10-5 to 120 times 10-3 molL for 30 or 60 min then H2O2 medium was replaced with fresh medium and the cells were cultured for 5hr followed by SRB assay
Cell cycle analysis and assessment of apoptosis by flow cytometry
Flow cytometry was used to analyze cell cycle and apoptosis Cells were treated with H2O2 in DMEM at dose of 0 05 075 and 1 pmolcell for 1 hr After removing the H2O2 medium the cells were cultured in fresh medium for overnight The cells were then harvested and stained by hypotonic propidium iodide (Sigma St Louis MO) solution Stained cells were analyzed by EPICS Elite ESP flow cytometry (Coulter Electronic USA) at excitation 488emmision 600 nm Data were analyzed by cycle distribution software ModFit LT version 20 (Verity Software House USA)
cDNA microarray analysis
RAW2647 cells were treated with H2O2 in DMEM at dose 1 pmolcell for 1 hr then continuously cultured in fresh medium for 24 hr meanwhile untreated cells as control They were harvested at 1 4 8 12 and 24 hours after H2O2 treatment TRIZOL reagent (Life Technologies Gaithersburg MD) was added to extract total RNA from the cultures according to the manufacturers instruction
40 μg of total RNA from control or treated cells was reverse-transcripted to cDNA in the presence of SuperScript II reverse transcriptase (Life Technologies CA) During the reaction two distinct fluorescent dyes Cy3-dUTP and Cy5-dUTP (Amersham Pharmacia Biotech NJ) were incorporated into the cDNA for the control and treated sample respectively The purified cDNA sample was mixed with a hybridization solution and applied to a home-made microarray which
40
presented 1000 genes selected from a mouse clone set provided from NIA including cell proliferation or cycle apoptosis metabolism transcription and signal transduction related genes To ensure the reproducibility of the microarray results each experiment was repeated with newly extracted total RNA samples
Microarray images were scanned with a confocal laser scanner (ScanArray 4000 GSI Lumonics MA) and the results were analyzed using ScanAnalyze program (Michael Eisen Standford University) Genes showing a greater than 2-fold induction or repression after normalization (Cy5Cy3 ratios above 2 or below 05) were selected for further analysis The cutoff value of 2-fold is conventionally used by other investigators (Quackenbush 2001) Clustering analysis was carried out by using Cluster software offered by Elseinrsquo lab (Standford University California USA)
Western blot analysis of phosphorylated p53 Akt and JNK
The cells were lysed in Nonidet P-40 buffer supplemented with NaF Na3VO4 and protease inhibitors (RocheBoehringer Mannheim Indianapolis USA) and subjected to western blot analysis with primary antibodies p-p53 p-Akt or p-JNK(Santa Cruz Biotechnology Inc)
Electrophoretic mobility shift assay (EMSA)
Nuclear proteins were isolated using method provided by CellDeathde And gel shift assay system (Promega) was used to perform EMSA according to manufacturerrsquos instruction Briefly nuclear extracts were incubated with a [γ- 32P] labeled oligonucleotide probe which contains the specific recognition sequence for NF-κB After binding the samples were separated on a non-denaturating PAGE gel and the bands were detected by autoradiography
RESULTS
The analysis of cellular viability cell cycle and apoptosis in H2O2 treated RAW2647 cells
The toxic dose of H2O2 varies with both the density of the cells and the cell types studied therefore we first evaluated the effects of cells density dose and time exposure of H2O2 on our current used RAW2647 cells Figure1 summarized the RAW 2647 cells viability treated with H2O2 for 30 or 60 min ranging from 125 times 10-5 to 120 times 10-3 molL After 30 and 60 minutes exposure maximum ratio of cell death was 25 and 50 respectively The purpose of our experiments is to study the mechanism of apoptosis and cell survival in RAW 2647 cells treated with H2O2 30 of cell death and 70 of cell survive are optimal ratios and was chosen for studying gene expression profiles The result of cell viability showed that 30 cell death was induced when the 1000 cells in 01 ml of DMEM were treated with H2O2 for 1 hr at concentration 100 μM which is equal to 1 pmolcell H2O2
Furthermore RAW 2647 cells treated with various H2O2 concentrations were analyzed by flow cytometer and result of cell cycle distribution analysis were summarized in Table 1 It was found that sub-G1 cells that were destined to enter apoptosis increased proportionally with increasing H2O2
41
concentrations and the percentage of G0G1 phase increased with the increasing H2O2 concentration and reached peak at 10 pmolcell oppositely S phase reduced significantly The concentration of 1 pmolcell H2O2 also induced G2M arrest slightly
Surv
ival
rate
()
120
100
80
60
40
20
0
H2O2 30min H2O2 60min
0 200 400 600 800 1000 1200
Dose of H2O2 (μM)
Fig 1 Cell viability assay RAW2647 cells were exposed to H2O2 in various concentrations for 30 and 60 minutes Cell viability was determined using SRB assay The toxic effect of 60 min H2O2 treatment is stronger than 30 min and the percentage of death cells caused by H2O2 treatment was time- and dose-dependent Results were obtained from three independent experiments and expressed as mean+sd
H2O2 concentration (pmolcell)
Distribution of cell cycle () (mean + sd)
G0G1 S G2M Sub-G1 000 5111plusmn212 3650 plusmn 385 1239plusmn102 091plusmn000 050 6745plusmn023 2157plusmn212 1098plusmn011 667plusmn085 075 7879plusmn158 902+134 1218plusmn023 1962plusmn385 100 8251plusmn236 086+006 1663plusmn155 2845plusmn269
Table 1 Flow cytometry analysis of H2O2 treated RAW2647 cells (Results were obtained from three independent experiments and expressed as mean plusmn sd)
Gene expression profiles of RAW2647 cells treated with H2O2 and functional cluster analysis
After critical data analysis genes with a ratio of Cy5Cy3 gt20 or lt05 at least at one time point among five were selected as genes that can be regulated by H2O2 After critical data analysis 113 genes were identified as redox-sensitivity genes They were divided into eight clusters including cell survival apoptosis cell cycle and proliferation metabolism signaling transcription proteasomes and cell structure based on functional analysis A hierarchical clustering algorithm was used to determine
42
C
the numbers of genes expression pattern in each functional group and then K means analysis was applied to produce trend lines that represent the gene expression patterns in each group as summarized in Figure 2A to 2H respectively The genes that show coordinated fluctuations in gene expression across 5 time points might have same regulatory mechanism
Heat shock protein 40 (HSPF1) 12
8 12
Heat shock protein 75 (Hsp75) 08 105-kDa heat shock protein (Hsp105) 04
Heat shock protein 65 (Hsp65) 0 1 4 24 Heat shock protein 86 kDa 1 (Hsp86-1) -04 Gly96 (Ier3) -08
-12 Fibrogen
Expr
essi
on le
vel
A
12 08 Metallothionein-I (MT-1) 04 Metallothionein 1L (MT-1L) 0 1 4 8 12 24 Metallothionein I-F (MT-1F)
-04 Inhibitor of apoptosis protein 1 -08
Time point of H2O2 treatment (hr)
B
02
0 -02
-04 -06
12 08
04
0
Cathepsin B (Ctsb)Cathepsin L (Ctsl)Cathepsin Z precursor (Ctsz)Cathepsin D (CtsD)
1 4 8 12 24 Tollinterleukin-1 receptor 8 (TIR8) Interleukin-1 receptor-associated kinase 2 (IRAK2)
4 8 12 24
12 08 04 0
-04 Kininogen cellular apoptosis susceptibility protein
Cathepsin C (CtsC) Tis11d Programmed cell death 6 (Pdcd6)
1 4 8 12 24 129Sv cystatin C (cst3) Interleukin enhancer binding factor 1 (ILF1)
Transformed mouse 3T3 cell double minute 2 (Mdm2)Retinoblastoma 1 (Rb1)Cyclin ICyclin GCyclin-dependent kinase inhibitor 3 (CDKN3)Cyclin ania-6a
1
Son cell proliferation protein (Son) Cell division cycle 5 (Cdc5) Retinoblastoma binding protein 7 (Rbbp7) Cyclin-dependent kinase 4 (Cdk4) Cyclin D1 Telomerase binding protein p23
-04
04 Kinesin-like 5 Kinesin-like 6
40
1 8 12 24 Bub3 -04 Signaling molecule SPEC1 beta
ATPase H+ transporting lysosomal I (Atp6i)Nuclear mitotic apparatus protein 1 (NUMA1)-08
Nucleolar phosphoprotein p130 Cyclin B Cyclin A2 (Ccna2) Mitogen-responsive 96 kDa phosphoprotein p96 Proliferation related acidic leucine rich protein ( PAL31) Interferon-inducible protein 9-27
-12
43
Aldolase 1(Aldo1)Phospholipase c neighboring (Png)Eno1High density lipoprotein binding protein (HDLBP)
08
04 Lactate dehydrogenase 1 A (Ldh1) 0 1 4 8 12 24 Disulfide isomerase (ERp59
-04 Fatty acid desaturase 1 (FADS1) Fatty acid synthase (Fasn) -08 Triosephosphate isomerase (Tpi)Transketolase (Tkt)Methylenetetrahydrofolate dehydrogenase (Mthfd1)Dkc1
D Stearoyl-Coenzyme A desaturase 2 (Scd2)
12 Lipoprotein lipase (Lpl) Malate dehydrogenase soluble (Mor2 Elongation factor 1-alpha (EF 1-alpha) Medium-chain acyl-CoA dehydrogenase (Acadm)
08
Ca2+-independent phospholipase A2Small intestine apolipoprotein B (Apobec 1)
04
Low density lipoprotein receptor related protein (Lrp) 1 4 8 12 24 Adipose differentiation-related protein (Adrp)
-04 RPL31 TLS-associated protein TASR-2 Glycyl-tRNA synthetase (Gars) Paired basic amino acid cleaving enzyme (Furin)
0
12 Intracellular signaling protein (Trip6) 08 04
0 1 4 8 12 24
-12
08 E 04
0
-04 -08 -12
12 08 04
0 -04 -08
08
0
-08
-16 F
04 0
-04 -08 -12
08 04 0 8
1 4 12 24 Proteasome (prosome macropain) 26S subunit ATPase 3 (Psmc3) -04 Proteasome (prosome macropain) subunit beta type 2 (Psmb2) -08 Protease (prosome macropain) 28 subunit alpha (Psme1) G -12
12 Proteasome (prosome macropain) subunit alpha type 4 (Psma4) 08 Proteasome (prosome macropain) subunit alpha type 2 (Psma2) 04 Proteasome beta-subunit C5 (Psmb1)
0 8 12 24 Proteasome (prosome macropain) activator subunit 2 (PA28 beta) 1 4 -04
Mitogen-activated protein kinase 6 (Mapk6)Mitogen inducible gene mig-2 (Mig-2)Ras 21 activatorp97 ATPase pseudogene (Vcp)MyD88 mRNA induced by interleukin-6 (Myd88)Thymoma viral proto-oncogene (Akt)
81 4 12 24 MAP kinaseErk kinase (Mek2) Partial Prkar1a gene for cAMP-dependent protein kinase COP9 (constitutive photomorphogenic) subunit 7a (Cops7a) Clathrin adaptor protein large beta 1 Clathrin adaptor protein medium 1
JNK-binding protein 1 (Jnkbp1-pending)Interferon (alpha and beta) receptor (Ifnar)
1 4 8 12 24 Interferon gamma receptor 2 (Ifngr2) Protein kinase C substrate 80K-H (Prkcsh)
p53 cellular tumor antigen Transcription factor Sp3 (Sp3)
1 4 8 12 24 Interleukin enhancer binding factor 3 (Ilf3)Adaptor protein complex AP-2 mu1 (Ap2m1)CCAATenhancer binding protein (Cebp)Ctbp1Synaptotagmin 11 (Syt11)
8 C-fos
1 4 12 24 E74-like factor 1 (Elf1) synaptotagmin 4 (Syt4) Histone deacetylase 1 (Hdac1) Nuclear receptor co-repressor 1 (Ncor1)
Proteasome (prosome macropain) 26S subunit non-ATPase 1 (Psmd1) Proteasome (prosome macropain) 26S subunit non-ATPase 8 (Psmd8)
44
Coronin actin-binding protein 1A (Coro1a)
1 4 8 12 24 Coronin actin binding protein 1B (Coro1b) SWISNF related matrix associated actin dependent regulator (Smarcc1)
H
-16 -08
0 08 16
Fig 2 Clustering analysis 113 of ROS sensitive genes were divided into 8 groups according totheir functions Hierarchical clustering and K means were used to analyze expression patterns ofthese genes (A) Cell survival related genes (B) Apoptosis related genes (C) Cell cycle relatedgenes (D) Metabolism related genes (E) Signaling molecules (F) Transcription related genes (G)Proteasomses (H) Structural proteins
The change of molecular activity in certain early response molecules in H2O2 treated RAW2647 cell
From gene expression profiles it was found that the expression of some signaling pathway related genes such as Akt p53 and others was regulated by ROS in H2O2 treated RAW2647 cells In order to get more information about signaling pathways which might be regulated by ROS the molecular activity of some important signaling molecules in H2O2 treated RAW2647 cell were further investigated
H2O2 up regulates the nuclear NF-κB activity in RAW2647 cell
Electrophoretic mobility shift assays were used to assess activation of NF-κB in RAW2647 cells as described before Our studies revealed an increase in NF-κB activation in RAW2647 cells at 30 and 60min after H2O2 treatment NF-κB activation had attenuated to the level observed in controls after 2h (Figure 3)
H2O2 induces the phosphorylation of p53 Akt and JNK
p53 is a transcriptional factor and its transcriptional activation function requires post-translational modification of the p53 protein via phosphorylation acetylation or glycosylation In this study the level of the phosphorylated p53 protein was examined using an antibody that specifically recognizes the phosphorylated serine 15 residue of p53 Western blot analysis of cell lysates prepared from H2O2-treated RAW2647 cells demonstrated the phosphorylation of p53 was induced at about 15 min after H2O2 treatment (Figure 4a) Like p53 the activation function of Akt and JNK requires phosphorylation Figure 5b and c shows Akt and JNK activation by H2O2 After RAW2647 cells were treated by H2O2 at concentration 1 pmolcell phosphorylation of Akt was detected at 15min (Figure 4b) whereas JNK at 30 min peaked at 1h and attenuated after 2h (Figure 4c)
45
Fig 3 Typical image for EMSA binding assays of nuclear NF-κB in H2O2 treated RAW2647 cells (1 pmolcell) (A) Lane1 H2O2 treatment for 0 hr lane 2 H2O2 treatment for 05 hr lane 3 H2O2 treatment for 1hr lane 4 H2O2 treatment for 2hr The activity of NF-κB peaked at 1hr and attenuated at 2hr (B) The bar chart represents the relative intensity of the samples Results were obtained from three independent experiments and expressed as mean+sd
A P-p53
0 15 30 60
B P-AKT
P-JNK C
0 15 30 60
0 15 30 60 120
H2O2 treatment time (minute)
Fig 4 Western blot analysis of phosphorylated p53 Akt and JNK Phosphorylation of p53 (A) and Akt (B) was detected in RAW2647 cells after 15 min of H2O2 treatment Phosphorylated JNK peaked at 1hr then attenuated at 2hr in H2O2 treated RAW2647 cells (C)
46
DISCUSSION
The responses of 2647 under oxidative stress and the roles of ROS sensitive protein families and signal pathways in these responses
In our study the major responses of RAW 2647 cells under oxidative stress (1 pmolcell of H2O2) are arresting growth processing apoptosis and fighting back for cell survival The change of metabolism is involved in all of the responses According to our investigation and other peoplersquos reports several ROS sensitive protein families and signal pathways plays played important roles in the responses of cells to oxidative stress They are heat shock proteins metallothioneins cathepsins cytokine and proteasomes families and p53 Akt NF-κB ERK JNK p38 PKC and INF-r pathways
ROS sensitive protein families
The heat shock protein family involve in regulating the folding transport and degradation of other cellular proteins The general function of heat-shock proteins is protecting cells from various cellular stressors such as hypoxia oxygen radicals endotoxin infections and fever [Morimoto and Santoro 1998 Beere and Green 2001] Under oxidative stress HSPs protect cell from apoptosis through stabilizing intracellular protein structures and suppressing caspase activation [Finkel et al 2000]
Metallothioneins (MTs) are intracellular low molecular and cysteine-rich proteins They have unique structural characteristics to give potent metal-binding and redox capabilities A primary role has not been identified Different types of stress including heavy toxic metals reactive oxygen species can cause a rapid and robust induction of metallothioneins (MT)-I and II In vitro and in vivo evidence shows that MTs have an antioxidant function MTs may suppress apoptosis through inhibiting p38 MAPK activation (Kang et al 2000)
In eukaryotes the ubiquitinproteasomes play a pivotal role in non-lysosomal degradation of intracellular protein In the periods of oxidative stress protein oxidation is significantly increased and become a threat to cell survival Oxidative damaged proteins appear to be removed by proteasomes through selective proteolysis (Hershko and Ciechanover 1998 Grune et al 1997) The ROS sensitive sub-units of proteasomes identified in our research might play major roles in degradation of oxidized proteins
In current study it was found that a group of actin related genes were regulated by ROS Actin is the major constituent of the cytoskeleton of almost all the eukaryotic cells Evidences have indicated that oxidative stress can cause non-muscle mammalian cells to undergo remarkable changes in their morphology and in the structure of the actin cytoskeleton (Dalle-Donne et al 2001) In this study ROS did not change the gene expression of actin but regulated the gene expression pattern in a group of actin-related molecules such as coronin an actin-binding protein and play a role in regulating the organization of actin cytoskeletal network that mediates cell morphology and proliferation (Asano et al 2001)
Cellular signaling pathways regulated by ROS
In our investigation it was found that the activity and gene expression of p53 quickly increased after H2O2 treatment ROS are potent activators of p53 [Martindale and Holbrook 2002] p53 is activated through signaling pathways that induce phosphorylation of p53 protein in response to stress
47
(Sakaguchi et al 1998) and selectively activates a different subset of target genes to regulate different cellular processes including apoptosis growth arrest DNA repair or cell differentiation (Hupp et al 1992) In our investigation active p53 mediated efficient G1 arrest through down-regulation of cyclin D1 and Cdk4 because Cdk4 and associated cyclin D control the G 1 to S phase transition (Ohtsubo and Roberts 1993 Ekholm and Reed 2000) p53 may cause slight G2M arrest by the decrease in gene expression of cyclin A2 and cyclin B1 because progression through G2 and M is regulated by different CDKs and their associated cyclin A and B (Lewin 1990) Active p53 also triggers the activation of genes related to apoptosis and leads to apoptosis (El-Deiry 1998) However p53 was tightly regulated by other molecules such as Mdm2 and cyclin G1 [Chen 2002] Cyclin I might be also included Mdm2 is a cellular proto-oncogene and negative cellular regulator of p53 which can abrogate p53-mediated G1 arrest and apoptosis and also accelerate cell cycle progression by independent way of p53 degradation (Argentini et al 2000) Our results indicated the possibility that p53 Mdm2 and cyclin G1 form an auto-regulatory feedback loop in which p53 positively regulates Mdm2 and cyclin G1 levels whereas Mdm2 and cyclin G1 negatively regulates p53 levels and activity (Figure 5) The accumulation of Mdm2 and cyclin G1 could be critical for cell survival
The second ROS sensitive pathway is NF-κB pathway In our study the activity of NF-κB increased after RAW 2647 cells were treated by H2O2 (Figure 3) A wide range of signals including ROS can induce activation of NF-κB NF-κB has been shown to exert protective effects under various conditions However NF-κB activity has also been correlated with apoptosis and the activation of apoptosis-associated genes such as Fas ligand and p53 Investigations examining the influence of NF-κB on cell survival following oxidant injury have likewise produced mixed findings (Flohe et al 1997)
Gen
e ex
pres
sion
(rat
ion
of H
2O2
treat
ed C
ontro
l)
4
4 8 12 16 20 24
Time course of H2O2 treatment (hr)
Cyclin G
3
2 Mdm2
1
p53
0
Fig 5 The Gene expression patterns of p53 Mdm2 and cyclin G1 under H2O2 treatment
In our investigation Akt was activated and its expression was up-regulated by ROS Recent studies have demonstrated that Akt regulates cell survival at multiple sites including preventing release of cytochrome c from mitochondria and inactivating forkhead transcription factors which was known to induce expression of pro-apoptotic factors such as Fas ligand phosphorylated and inactivated Bad and caspase9 and activated IκB kinase which is a positive regulator of NF-κB and results in transcription of anti-apoptotic genes (Testa et al 2001)
48
Evidence shows that PKC pathway is involved in both cell survival and apoptotic functions during oxidative stress (Martindale 2002) In our study we found that the expression of PKC substrate 80K-H (Prkcsh) was up-regulated which may suggest that PKC signaling pathway was also involved in the cellular response to ROS but it is not clear what roles PKC signaling pathway plays
The change of metabolism in H2O2 treated RAW 2647 cells
Under oxidative stress regulation of metabolism patterns is important not only for apoptosis but also for cell survival In this study we found the genes related to glycolysis and lipid synthesis were gradually down-regulated whereas the genes related to lipid catabolism and protein synthesis were gradually up-regulated in H2O2 treated RAW 2647 cells (Figure 2D) It was reported that oxidative stress can block glycolysis and the stress-induced block of glycolysis is not the result of a passive oxidative damage but rather an active cell reaction programmed for cell self-defense (Colussi et al 2000) According to our results the block of glycolysis could be the consequence of the depletion of intracellular NAD pools or of the inactivation of the glycolytic enzymes or the down-regulation of the glycolysis related genes However both apoptosis and cell survival are energy spending processes If intracellular ATP concentration is too low cells will switch from apoptosis to necrosis (Leist et al 1997) Our result suggests that when glycolysis was blocked H2O2 treated RAW 2647 cells may continuously process apoptosis or promote survival by using fatty acid as main source of ATP through up-regulation of fatty acid catabolism related genes to stabilizing the levels of intracellular ATP Consistent with the report by others activation of phospholipases particularly phospholipase A2 (PLA2) plays important role by destabilizing lysosomal and mitochondrial membranes in H2O2 treated cells (Zhao et al 2001)
In conclusion this study might help to understand the molecular mechanism of apoptosis induced by oxidative stress and the feedback mechanisms that involve cell survival
ACKNOWLEDGEMENTS
The work described in this paper was supported by the Areas of Excellent Scheme established under the University Grant Committee of the Hong Kong SAR Government (Project No AOEP-042004)
REFERENCES
Allen RG and M Tresini 2000 Oxidative stress and gene regulation Free Radic Biol Med 28 463ndash499
Argentini M N Barboule and B Wasylyk 2000 The contribution of the RING finger domain of Mdm2 to cell cycle progression Oncogene 19 3849-3857
Asano S M Mishima and E Nishida 2001 Coronin forms a stable dimer through its C-terminal coiled coil region an implicated role in its localization to cell periphery Genes to Cells 6 225-235
Beere HM and DR Green 2001 Stress management - heat shock protein-70 and the regulation of apoptosis Trends Cell Biol 11 6-10
49
Carmody RJ and TG Cotter 2001 Signalling apoptosis a radical approach Redox Rep 6 77-90
Chandra J A Samali and S Orrenius 2000 Triggering and modulation of apoptosis by oxidative stress Free Radic Biol Med 29 323-333
Chen X 2002 Cyclin G a regulator of the p53-Mdm2 network Dev Cell 2 518-519
Colussi C MC Albertini S Coppola S Rovidati F Galli and L Ghibelli 2000 H2O2-induced block of glycolysis as an active ADP-ribosylation reaction protecting cells from apoptosis FASEB J 14 2266-2276
Dalle-Donne I R Rossi A Milzani P Di Simplicio and R Colombo 2001 The actin cytoskeleton response to oxidants from small heat shock protein phosphorylation to changes in the redox state of actin itself Free Radic Biol Med 31 1624-1632
Ekholm SV and SI Reed 2001 Regulation of G (1) cyclin-dependent kinases in the mammalian cell cycle CurrOpin Cell Biol12 676-684
El-Deiry W 1998 Regulation of p53 downstream genes Semin Cancer Biol 8 345ndash357
Fehrenbach E H Northoff 2001 Free radicals exercise apoptosis and heat shock proteins Exerc Immunol Rev 7 66-89
Finkel T and NJ Holbrook 2000 Oxidants oxidative stress and the biology of ageing Nature 408 239-247
Flohe L R Brigelius-Flohe C Saliou MG Traber L Packer 1997 Redox regulation of NF-kappa B activation Free Radic Biol Med 22 1115ndash1118
Grune T T Reinheckel and KJ Davies 1997 Degradation of oxidized proteins in mammalian cells FASEB J 11 526-534
Hershko A and A Ciechanover 1998 The ubiquitin system Annu Rev Biochem 67 425-479
Hupp TR DW Meek CA Midgley and DP Lane 1992 Regulation of the specific DNA binding function of p53 Cell 71 875ndash886
Kang YJ ZX Zhou GW Wang A Buridi and JB Klein 2000 Suppression by metallothionein of doxorubicin-induced cardiomyocyte apoptosis through inhibition of p38 mitogen-activated protein kinases J Biol Chem 275 13690-13698
Leist M B Single AF Castoldi S Kuhnle and P Nicotera 1997 Intracellular adenosine triphosphate (ATP) concentration a switch in the decision between apoptosis and necrosis J Exp Med 185 1481-1486
Lewin B 1990 Driving the cell cycle M phase kinase its partners and substrates Cell 61 743-752
50
Martindale JL and NJ Holbrook 2002 Cellular response to oxidative stress signaling for suicide and survival J Cell Physiol 192 1-15
Morimoto RI and MG Santoro 1998 Stress-inducible responses and heat shock proteins new pharmacologic targets for cytoprotection Nat Biotechnol 16 833-838
Nishikawa T D Edelstein XL Du S Yamagishi T Matsumura Y Kaneda MA Yorek D Beebe PJ Oates HP Hammes I Giardino and M Brownlee 2000 Normalizing mitochondrial superoxide production blocks three pathways of hyperglycaemic damage Nature 404 787-790
Ohtsubo M and JM Roberts 1993 Cyclin-dependent regulation of G1 in mammalian fibroblasts Science 259 1908-1912
Quackenbush J 2001 Computational analysis of microarray data Nature 2 418-427
Sakaguchi K JE Herrera S Saito T Miki M Bustin A Vassilev CW Anderson and E Appella 1998 DNA damage activates p53 through a phosphorylationndashacetylation cascade Genes Dev 12 2831ndash2841
Testa JR and A Bellacosa 2001 AKT plays a central role in tumorigenesis Proc Natl Acad Sci U S A 98 10983-10985
Torres M and HJ Forman 2003 Redox signaling and the MAP kinase pathways Biofactors 17 287-296
Zhao M UT Brunk JW Eaton 2001 Delayed oxidant-induced cell death involves activation of phospholipase A2 FEBS Lett 509 399-404
51
52
EXTREME ADAPTATIONS TO HYPOXIA AND ANOXIA IN CRUCIAN CARP
Goumlran E Nilsson6
ABSTRACT
The crucian carp has the capacity to survive anoxia for days at room temperature and several months at temperatures close to 0degC The extreme respiratory cardiovascular and neurobiological adaptations employed by the crucian carp to tolerate anoxia are discussed
INTRODUCTION
The rule among vertebrates is that anoxia is synonymous with rapid death To study animals that deviate from a rule has again and again proven very useful not only for the understanding of how such animals work but also for shedding light on the mechanisms behind the rule - in this case the mechanisms behind anoxic damage Anoxia related diseases are the most common causes of death in the industrialized world
Figure 1 Anoxic survival time in ldquonormalrdquo vertebrates and in anoxia tolerant vertebrates Note that cold blooded vertebrates in general are as sensitive to anoxia as mammals if temperature is taken into account and that the anoxia-tolerant vertebrates survive anoxia about 1000 times longer than other
Department of Molecular Biosciences University of Oslo POBox 1041 NO-0316 Oslo Norway
53
6
vertebrates In general metabolic rate falls sharply with body temperature and a main reason why anoxia tolerant vertebrates survive anoxia longer at cold temperatures is that their glycogen stores last longer For anoxia-intolerant vertebrates a main benefit of low temperature is that it slows down the loss of ATP and the onset of degenerative processes (from Lutz and Nilsson 2003)
Few vertebrates have the ability to live without oxygen (anoxia) The crucian carp (No karuss Lat Carassius carassius) a common fish in Northern Europe and some North American freshwater turtles (genera Trachemys and Chrysemys) are the best studied examples of anoxia tolerant vertebrates (Lutz et al 2003 Nilsson and Lutz 2004) (Figure 1) Both the crucian carp and the turtles have evolved their anoxia tolerance to allow overwintering in ice-covered lakes streams and ponds However there are some striking differences in their responses to anoxia reflected by the fact that the crucian carp survives anoxia in an active state still swimming around while anoxic turtles are virtually comatose (Nilsson 2001)
Respiratory adaptations
Figure 2 Scanning electron micrographs of crucian carp gill filaments before during and after exposure to hypoxia Note the appearance of lamellae during hypoxia Scale bar = 50 microm From Sollid et al (2003)
The crucian carp is so far the only adult vertebrate known to be able to reversibly adjust the morphology of the respiratory organ to match its oxygen needs (Sollid et al 2003) (Figure 2) When the crucian carp is exposed to hypoxia it starts remodeling its gills within days resulting in a 7-8 fold increase the respiratory surface area and thereby boosting the ability to take up oxygen In normoxic crucian carp Sollid et al (2003) found that a cell mass situated outside the gill epithelium is filling up the space between the gill lamellae (the respiratory units of fish) The mitotic and apoptotic activity in this interlamellar cell mass (ILCM) was found to vary with ambient oxygen levels Thus in normoxic water mitosis was dominating causing ILCM to fill up the interlamellar space while in hypoxic water apoptosis prevailed and the ILCM nearly disappeared exposing the respiratory epithelium to the water
Even if the crucian carp can survive without any oxygen this is costly as it involves releasing an energy rich hydrocarbon (ethanol - the exotic anaerobic end product of this genus) to the water resulting in a depletion of the glycogen stores Thus getting access to oxygen is highly desirable from an energetic point of view and this is obviously what it strives to do in hypoxia by remodeling its gills On the other hand in well oxygenated waters it can apparently get all the oxygen it needs without having protruding lamellae so here the ILCM may function to reduce water and ion fluxes between blood and water thereby reducing osmoregulatory costs
54
Circulatory adaptations
Figure 3 The unique performance of the crucian carp heart and circulatory system during 5 days of anoxia in vivo (from Stecyk et al 2004)
Although we knew that crucian carp remains active in anoxia (Nilsson et al 1993b) it was surprising to find that it actually maintain heart work (cardiac output cardiac power output and heart rate) in anoxia (Stecyk et al 2004) (Figure 3) Thus crucian carp kept anoxic for 5 days show no signs of reduced cardiac work autonomic nervous control is maintained and systemic vascular resistance is untypically reduced No other vertebrates even come close to such a cardiac performance in anoxia Their hearts either stop working almost immediately or in a few cases cope with anoxia by slowing down to a few beats a minute (like in anoxia tolerant turtles) in combination with widespread systemic vasoconstriction and blunted autonomic control This finding immediately poses some very basic questions that need experimental attention the most important being why and how Moreover it obviously makes the crucian carp heart an attractive and unique model for studying adaptive anoxia-defense mechanisms in cardiac tissue bearing in mind that anoxic or ischemic heart conditions are major killers in humans Our present hypothesis is that crucian carp need to maintain cardiac output to shuttle its main glycolytic substrates and products glucose lactate and ethanol It may for example be that the crucian carp has to maintain heart work in anoxia to avoid ethanol intoxication as ethanol is the major anaerobic end product in this species
The brain
Because of its high energy demands the brain is generally the most anoxia sensitive organ During anoxia the oxidative phosphorylation by the respiratory chain stops and glycolysis becomes the only available route for ATP production Since every molecule of glucose yields less than 110th of the ATP produced by oxidative phosphorylation the energy (ATP) demand of the mammalian brain can not be met by glycolysis alone and there is a rapid fall in cellular ATP levels causing a slow down and eventually a stop in the NaK pump activity Ion-homeostasis is therefore lost and ions start running down their
2+concentration gradients After one or a few minutes a general depolarization of the brain occurs and Castarts flooding the cells At about the same time there is a release of excitatory neurotransmitters
2+ 2+particularly glutamate which speeds up the Ca inflow The increased levels of intracellular Ca triggers an array of degenerative processes that soon leads to neuronal damage and death These degenerative processes involves the degradation of DNA proteins and the cell membrane itself and besides glutamate
2+and Ca the key players in these events include lytic enzymes free radicals and nitric oxide (NO)
There is a vast literature on the mechanisms involved in anoxic brain damage in mammals but we have found that the important events of this anoxic catastrophe are probably common to most vertebrate
55
brains as judged from our experiments with rainbow trout Thus during anoxia the rainbow trout brain looses its ion-homeostasis and depolarises virtually as fast as the mammalian brain (when temperature differences are taken into account) (Nilsson et al 1993a) Moreover there is a release of glutamate as well as other amino acids in the anoxic rainbow trout brain (Hylland et al 1995) Due to the extended time frame during which these events occur at the low body temperature (15degC) of the rainbow trout we could in fact show that the release of glutamate proceeds rather than precedes the loss of ion homeostasis - a matter that has been difficult to resolve in experiments with mammals
So how can crucian carp and freshwater turtles avoid brain damage during anoxia From the result we have obtained so far we can conclude that a key to anoxic survival is a continued ability to match ATP consumption with ATP production in the absence of oxygen thereby avoiding energy failure and consequent neuronal depolarization
The glycolytic ATP production is supported by extra large glucose (glycogen) stores Indeed the only factor that appears to limit the crucian carps survival time is anoxia is a complete depletion of its main glycogen store in the liver (Nilsson 1990) It is possible that the unique ability of the genus Carassius to produce ethanol as the major end product of anaerobic metabolism (Shoubridge and Hochachka 1980) is the key adaptation allowing the crucian carp to maintain physical activity during anoxia (Nilsson et al 1993b Lutz and Nilsson 1997 Nilsson 2001 Nilsson and Lutz 2004) The turtles lack the ability to produce ethanol in anoxia and have to cope with very high lactate levels In both crucian carp and turtles there is a redistribution of blood flow to direct the glucose available to anoxia sensitive organs like the brain changes in which adenosine appears to play another key role (Nilsson et al 1994 Hylland et al 1994)This is accomplished by a rapid temporary increase in the rate of anaerobic glycolysis followed by a depression of energy needs termed metabolic depression Using microcalorimetry we have been able to show that isolated brain slices of crucian carp depress their metabolic rate and maintains their ATP levels during anoxia (Johansson et al 1995)
One mechanism employed by the crucian carp and turtles for depressing energy use in brain is the suppression of neurotransmission caused by release inhibitory neuromodulators like adenosine (Nilsson 1991 Nilsson and Lutz 1992) and inhibitory neurotransmitters such as gamma-amino butyric acid (GABA) (Nilsson 1990 1992 Nilsson et al 1990 1991 Nilsson and Lutz 1991) In 1986 Peter Hochachka suggested in a review article in Science (Hochachka 1986) that anoxia tolerance could be accomplished by a down regulation of the ion channel density andor activity of the cell membrane and termed this hypothetical phenomenon channel arrest The rationale for the hypothesis is that the cost for ion pumping will go down drastically if the membrane becomes less permeable to ions - ion pumping being the main energy consumer in the brain (Ericinska and Silver 1989) There is now substantial evidence for ldquochannel arrestrdquo in turtles (Doll et al 1993 Nilsson and Lutz 2004) For example Bickler (1992) used iodoacetate to block glycolysis in turtle cortical brain slices and found that the rate of Ca2+ inflow into the cells decreased dramatically if the slices were pre incubated in anoxia clearly suggesting an anoxia induced down regulation of Ca2+ permeability of the neuronal membrane However similar experiments on the crucian carp indicate that there is now down regulation of ion permeability in the neuronal membranes (Johansson and Nilsson 1995 Nilsson 2001) In light of the continuous physical activity displayed by the crucian carp in anoxia it is tempting to suggest that a down regulation of neuronal ion channels is a much too drastic measure for saving energy The anoxic crucian carp is probably relying more on a fine tuned down regulation of brain activity initiated by inhibitory neurotransmitters and modulators such as GABA and adenosine (Nilsson 1991 1992 Hylland and Nilsson 1999)
56
REFERENCES
Bickler PE 1992 Cerebral anoxia tolerance in turtles regulation of intracellular calcium and pH American Journal of Physiology 263 1298-1302
Doll CJ PW Hochachka and PB Reiner 1993 Reduced ionic conductance in turtle brain American Journal of Physiology 265 929-933
Erecinska M and IA Silver 1989 ATP and brain function Journal of Cerebral Blood Flow and Metabolism 9 2-19
Hochachka PW 1986 Defense strategies against hypoxia and hypothermia Science 231 234-241
Hylland P GE Nilsson and PL Lutz 1994 Time course of anoxia induced increase in cerebral blood flow rate in turtles evidence for a role of adenosine Journal of Cerebral Blood Flow and Metabolism 14 877-881
Hylland P GE Nilsson and D Johansson 1995 Anoxic brain failure in an ectothermic vertebrate +
release of amino acids and K in rainbow trout thalamus American Journal of Physiology 269 1077-1084
Hylland P and GE Nilsson 1999 Extracellular levels of amino acid neurotransmitters during anoxia and forced energy deficiency in crucian carp brain Brain Research 823 49-58
Johansson D and GE Nilsson 1995 Roles of energy status KATP channels and channel arrest in fish +
brain K gradient dissipation during anoxia Journal of Experimental Biology 198 2575-2580
Johansson D GE Nilsson and E Toumlrnblom 1995 Effects of anoxia on energy metabolism in crucian carp brain slices studied with microcalorimetry Journal of Experimental Biology 198 853-859
Lutz PL and GE Nilsson 1997 Contrasting strategies for anoxic brain survival - glycolysis up or down Journal of Experimental Biology 200 411-419
Lutz PL GE Nilsson and H Prentice 2003 In The Brain Without Oxygen 3rd Ed Kluwer Academic Publishers
Nilsson GE 1990 Long term anoxia in crucian carp changes in the levels of amino acid and monoamine neurotransmitters in the brain catecholamines in chromaffin tissue and liver glycogen Journal of Experimental Biology 150 295-320
Nilsson GE 1991 The adenosine receptor blocker aminophylline increases anoxic ethanol production in crucian carp American Journal of Physiology 261 1057-1060
Nilsson GE 1992 Evidence for a role of GABA in metabolic depression during anoxia in crucian carp (Carassius carassius L) Journal of Experimental Biology 164 243-259
Nilsson GE AA Alfaro and PL Lutz 1990 Changes in turtle brain neurotransmitters and related substances during anoxia American Journal of Physiology 259 376-384
57
Nilsson GE PL Lutz and TL Jackson 1991 Neurotransmitters and anoxic survival of the brain a comparison between anoxia-tolerant and anoxia-intolerant vertebrates Physiological Zoology 64 638-652
Nilsson GE and PL Lutz 1991 Release of inhibitory neurotransmitters in response to anoxia in turtle brain American Journal of Physiology 261 32-37
Nilsson GE and PL Lutz 1992 Adenosine release in the anoxic turtle brain a possible mechanism for anoxic survival Journal of Experimental Biology 162 345-351
Nilsson GE M Peacuterez-Pinzoacuten K Dimberg and S Winberg 1993a Brain sensitivity to anoxia in fish as reflected by changes in extracellular potassium-ion activity American Journal of Physiology 264 250-253
Nilsson GE P Roseacuten and D Johansson 1993b Anoxic depression of spontaneous locomotor activity in crucian carp quantified by a computerized imaging technique Journal of Experimental Biology 180 153-162
Nilsson GE P Hylland and CO Loumlfman 1994 Anoxia and adenosine induce increased cerebral blood flow rate in crucian carp American Journal of Physiology 267 590-595
Nilsson GE 2001 Surviving anoxia with the brain turned on News in Physiology Science 16 218-221
Nilsson GE and PL Lutz 2004 Anoxia tolerant brains Journal of Cerebral Blood Flow and Metabolism 24 475-486
Shoubridge EA and PW Hochachka 1980 Ethanol novel end product in vertebrate anaerobic metabolism Science 209 308-309
Sollid J P De Angelis K Gundersen and GE Nilsson 2003 Hypoxia induces adaptive and reversible gross-morphological changes in crucian carp gills Journal of Experimental Biology 206 3667-3673
Stecyk JAW K-O Stensloslashkken AP Farrell and GE Nilsson 2004 Maintained cardiac pumping in anoxic crucian carp Science 306 77-77
58
Suppressive Effects of Hypoxia on Male Rat Reproductive Function
Weigong Liao Yuqi Gao7 Mingchun Cai Jian Chen Yi Wu
ABSTRACT
Our objectives were to explore the effects of hypobaric hypoxia on the male rat reproductive function Adult male Wistar rats were randomly divided into four groups control group raised at sea level 5d 15d and 30d hypoxic groups raised in a hypobaric chamber stimulating 5000 m altitude for 5 days 15 days and 30 days respectively The spermatozoa density was found to decrease in 15d and 30d hypoxic groups compared with the control group (Plt001) Motilities of epididymal caudal spermatozoa decreased approximately by 50 in all of the three hypoxic groups (Plt001 compared with control group) Morphologically abnormal spermatozoa increased by more than 50 in all three hypoxic groups (Plt001 compared with control group) The LPC-induced AR was suppressed by about 60 in all three hypoxic groups (Plt001 compared with control group) Acrosin protease activity decreased significantly after exposure to hypoxia for 5 15 and 30 days (Plt001 compared with control group) Exposure to hypobaric hypoxia significantly reduced the tetraploid cell populations (approximately 28) compared with the control group (Plt001) After exposure to hypoxia for 30d the ratio of haploid and diploid cell populations was reduced by 25 when compared with control group (Plt005) Proliferation index of 15d and 30d hypoxic groups was significantly lower than that of the control group (Plt005) The apoptosis of spermatocytes and spermatogonia increased after exposure to hypoxia for 5d 15d and 30d Hypoxia caused testicular interstitial edema occasional necrosis and degenerative changes in testicular germ cells Hypobaric hypoxia suppresses the spermatozoa quantity and quality as well as inhibiting the acrosome reaction and acrosin protease activity of rat spermatozoa Hypobaric hypoxia inhibits the spermatogenesis in testis by decreasing the number of tetraploid spermatogenic cells (primary spermatocytes) The apoptosis of primary spermatocytes and spermatogonia occurring under hypoxic conditions may contribute to the loss of tetraploid cell populations
INTRODUCTION
A large number of studies have revealed that hypoxia causes changes of respiration and circulation and the composition of the blood Studies on the changes in the reproductive system caused by hypoxia are limited High altitude resident fertility rate is not lower than populations at sea level However newcomers from low areas seem to have reduced fertility at high altitude Cattle and other animals from sea level fail to reproduce (Eckes 1976) Previous studies indicated that hypoxia decreased the production of seminal sperm and caused morphologic changes of the germinal epithelium in rat (Gosney 1984) monkey (Saxena 1995) mouse sheep and man (Donald 1981) Little is known about which stages of spermatogenesis are affected by hypoxia and how does hypoxia affect them These questions should be answered Further in the previous studies spermatogenesis was evaluated only by carrying out histological analyses of testicular tissues In contrast the use of flow cytometry facilitates rapid and accurate quantitation of large numbers of testicular germ cells and it is widely accepted as an effective method of assessing spermatogenesis (Spano and Evenson 1993)
The acrosome reaction (AR) was believed to be a prerequisite that enables the spermatozoa to penetrate the zona pellucida (ZP) and fertilize the egg Acrosin probably aids spermatozoa penetration
Department of Pathophysiology and High Altitude Physiology Institute of High Altitude Third Military Medical University ChongQing 400038 PR China
59
7
by limited proteolysis of ZP glycoproteins Acrosin protease activity has also been involved in dissolution of the acrosomal matrix and in a regulated release of acrosomal contents at the time of the acrosome reaction (Hardy et al 1991) But no work has addressed the effect of hypoxia on spermatozoa acrosome reaction and acrosin protease activity
The present investigation was undertaken therefore to evaluate the effects of hypoxia on the spermatogenesis in rat testis by flow cytometry histological examination and TUNEL immunohistochemistry Acrosome reaction and acrosin protease activity of sperm in rat were also studied
MATERIALS AND METHODS
Animals
Adult male Wistar rats were randomly divided into four groups control group 5d 15d and 30d hypoxic group Hypoxic groups were maintained in a hypobaric chamber stimulating altitude 5000m The animals had free access to food and water with a controlled light dark cycle (12 and 12 h of light and dark respectively)
Determination of motility and viability of spermatozoa
Right cauda epididymises were excised from each animal and minced in 5 ml prewarmed saline Epididymal caudal spermatozoa were obtained by filtering through a mesh Then a 05 ml aliquot was removed from the epididymal caudal spermatozoa suspension and mixed with 1 ml saline prewarmed at 37degC A drop of the mixture was loaded on a slide and examined with a phase contrast microscope for the number of spermatozoa with progressive motility The number of progressively motile spermatozoa and motile spermatozoa was determined by counting spermatozoa exhibiting forward motion and any motion in a population of 100 cells respectively The procedure must be completed within 10 minutes Viability of spermatozoa was expressed as percentage of motile spermatozoa
Determination of the density of spermatozoa
A 05 ml aliquot was removed from the filtered epididymal caudal spermatozoa suspension and diluted with 2 ml saline Subsequently each diluted spermatozoa sample was loaded onto a hemocytometer and allowed to equilibrate for a few minutes prior to counting Four squares per hemocytometer chamber were counted in duplicate using phase contrast microscopy at a magnification of 200times Spermatozoa density was calculated by the following formula total number of spermatozoa in the epididymal caudal extract right epididymal caudal weight Duplicate values were averaged
Determination of abnormal spermatozoa
To assess the percentage of morphologically abnormal spermatozoa spermatozoa smears were prepared on clean glass slides and dried Smears were fixed by formaldehyde for 5 minutes and stained by 2 eosin for 2 hours One thousand spermatozoa per animal were screened and classified into normal and abnormal types Abnormal types included blunt hook-head banana-head amorphous-head two-tail coiled-tail and folded-tail (Wyrobek and Bruce 1975 Briz et al 1996)
Acrosome reaction examination (Hsu et al 1999)
Spermatozoa suspension preparation after sacrificing animals the right epididymal cauda was dissected from each rat and slashed in 2 ml human tubule fluid (HTF)-albumin buffer (40 gL bovine serum albumin) prewarmed at 37degC Spermatozoa suspension was obtained by filtering through mesh
60
A 110 dilution of spermatozoa was prepared and an epididymal spermatozoa count was done by hemocytometer The concentration of spermatozoa was adjusted to 1times106 cellsml for the assay of CTC fluorescence
Induction of acrosome reaction After 3 h preincubation at 37degC 10 microl stock LPC (Sigma) solution (4 mM in DMSO) was added to 200 microl spermatozoa suspension so that the final concentrations of LPC were 200 microM After incubation for 2 h the spermatozoa were examined by the chlortetracycline fluorescence assay
CTC fluorescence assay After 5 h of incubation at 37degC aliquots of cauda epididymal spermatozoa were taken for the CTC fluorescence assay The CTC fluorescence assay was used to study the status of the acrosome reaction in rat spermatozoa CTC (Sigma) was prepared freshly at a concentration of 15 mM in 20 mM Tris buffer containing 130 mM NaCl and 5 mM L-cysteine The pH was adjusted to 78 and the solution was shielded from light at room temperature Of the spermatozoa suspension 50 microl were mixed with 50 microl CTC solution in an Eppendorf tube After 30 s 8 microl of 125 (wv) paraforamaldehyde in 05 mM Tris buffer (pH 74) were added After mixing by gentle eddying 50 microl of 022 mM 14-diazabicyclo[222]octane in glycerol was introduced and mixed with the spermatozoa suspension to retard fading of fluorescence Fluorescence patterns of spermatozoa were analyzed on an Olympus BX-60 microscope (Tokyo Japan) equipped with phase-contrast and fluorescence optics The excitation beam was passed through a band-pass filter of 400ndash410 nm A volume of 5 microl spermatozoa suspension was placed on a slide and covered with a 22 mm times22 mm cover slip In each sample a total of 200 cells was assessed and classified as lsquoacrosome-reacted spermatozoarsquo with dark heads except for the tip which retained some fluorescence and lsquoincapacitated spermatozoarsquo with uniform bright fluorescence over the entire head
Determination of acrosin Proteolytic activity
Acrosin proteolytic activity of spermatozoa was determined using a gelatin substrate film assay Gelatin substrate film slides were prepared on one side of glass slides with a 34 gelatin solution Film slides were fixed in 005 glutaraldehyde for 2 minutes washed by acetic acid-sodium barbiturate buffer twice and dried in air for at least 1 hour Subsequently film was stained with 05 Trypan Blue
After centrifugation at 1000 rpm for 5 minutes and resuspended in PBS epididymal spermatozoa were spread on the surface of gelatin-coated slides and incubated at 37degC for 7 hours to allow proteolysis of the gelatin by acrosin Positive spermatozoa showing a clear halo around the spermatozoa head were counted in a population of 100 cells
Histopathological examination
Light microscopy Testes were fixed in 10 formalin dehydrated and embedded in paraffin Sections were cut at 5
microm thicknesses and stained with hematoxylin and eosin for light microscope observation
Electron microscopy Testes were sliced and fixed in 3 glutaraldehyde Ultra-thin sections were stained in uranyl
acetate and lead citrate and observed in a Phillips TECNAI 10 transmission electron microscope (TEM)
61
Flow cytometry
The germ cells were released from seminiferous tubules in phosphate buffered saline (PBS) by mincing the testes with fine scissors and digesting the testes with Collagenase (Sigma) at 37degC for 30 minutes The suspension was filtered through a nylon mesh twice and fixed in 70 chilled ethanol The samples were stored at 4degC The germ cells were stained with ethidium bromide (Sigma) The tubes were kept in the dark at room temperature for 30 minutes before flow cytometry analysis
TUNEL immunohistochemistry
Immunohistochemical apoptotic detection (TUNEL assay) was performed on 10 formalin-fixed 5microm paraffin sections using In Situ Cell Death Detection Kit POD (Roche) according to the manufacturerrsquos instructions Germ cells were restained with hematoxylin The percentage of seminiferous tubules with TUNEL staining was determined (Yamamoto et al 2002)
Statistical analysis
Results were presented as mean plusmn SD All data were analyzed by one-way ANOVA Plt005 was considered statistically significant
RESULTS
Sperm density motility viability and abnormality
As shown in Table 1 spermatozoa density in cauda epididymis decreased significantly in hypoxic 15d group and 30d group (Plt001 compared with control group shown in Figure 1) Spermatozoa motility and viability in cauda epididymis were severely impaired in all of three hypoxic groups (Plt001 compared with control group shown in Figure 2 and 3) The number of morphologically abnormal spermatozoa increased significantly in hypoxic condition (Plt001 compared with control group shown in Figure 4) The main types of spermatozoa abnormality were coiled and folded tail
Sper
m d
ensi
ty(
times107 1
00 m
g ep
idid
ymal
tiss
ue) 4 00
3 00
2 00
1 00
0 00 Cont r ol H5d H15d H30d
Figure 1 Effect of hypoxia on sperm density ( Plt001 vs Control group Plt005vs Hypoxic 15d group
62
80
20
40
60
Sper
m m
otili
ty(
)
0 Cont r ol H5d H15d H30d
Figure 2 Effect of hypoxia on sperm motility ( Plt001 vs Control group Plt005 vs Hypoxic 5d group)
0
20
40
60
80
100
Sper
m v
iabi
lity
()
Cont r ol H5d H15d H30d
Figure 3 Effect of hypoxia on sperm viability ( Plt001 vs Control group)
63
40 5
30
0
4 Total
Blunt hook
3 Coiled folded tail
sper
m a
bnor
mal
ity (
)20
Banana head 2
10 Amorphous head
1 Two tail
0 Control H5d H15d H30d
Figure 4 Effect of hypoxia on sperm abnormality (Plt005 Plt001 vs Control group)
The acrosome reaction (AR)
LPC-induced AR was suppressed by about 60 in all three hypoxic groups (Plt001 compared with control group shown in Figure 5)
40 0
Cont r ol H5d H15d H30d
Perc
enta
ge o
f AR
()
30 0
20 0
10 0
0 0
Figure 5 Effect of hypoxia on the percentage of acrosome reaction in rats ( Plt001 vs Control group)
Acrosin activity The percentage of acrosin positive reaction spermatozoa decreased significantly in hypoxic groups
(Plt001 compared with control group shown in Figure 6)
64
100
80
60
40
20
0 Cont r ol H5d H15d H30d
Figure 6 Effect of hypoxia on the percentage of positive acrosin protease activity spermatozoa in rats (Plt001 vs Control group)
Histopathological examination
LM Hypoxia caused testicular interstitial congestion and edema Occasionally seminiferous tubule atrophy and germ cell depletion were observed after exposure to hypoxia for 30d (Shown in Figure 7)
Perc
enta
ge o
f pos
itive
acr
osin
pro
teas
eac
tivity
()
Figure 7 Representative photomicrographs of testes from control and hypoxic rats (original magnification 100X) (A) Control rat (B) 5d hypoxic cat (C)30d hypoxic rat
65
Lipid droplets were found in the Sertoli cells in hypoxic rats Degenerating spermatogonia with slight chromatin margination were observed in 15d and 30d hypoxic rats (Shown in Figure 8)
Figure 8 Electron micrograph of seminiferous tubules (A) 5d hypoxic rat showing lipid droplets in Sertoli cells 10000times (B) 15d hypoxic rat showing degenerating spermatogonia 4200times
Flow cytometry analysis
5d 15d and 30d hypobaric hypoxia exposure significantly reduced the tetraploid cell populations (approximately 28) compared with the control group (Shown in Figure 9)
Perc
enta
ge o
f 4C
cel
ls(
) 16
12
8
4
0 Cont r ol H5d H15d H30d
Figure 9 Effect of hypoxia on the tetraploid (4C) cell population (Plt001 vs Control group) 66
Diploid cell populations in hypoxia 30d group rats were significantly more than that in the control group rats (Shown in Figure 10)
15
Perc
enta
ge o
f 2C
cel
ls(
)
12
9
6
3
0 Cont r ol H5d H15d H30d
Figure 10 Effect of hypoxia on diploid (2C) cell population (Plt001 vs Control group)
12 0
1C2
C r
atio 9 0
6 0
3 0
0 0
Cont r ol H5d H15d H30d
Figure 11 Effect of hypoxia on the ratio of haploid (1C) to diploid (2C) cells in rat tastes (Plt001 vs Control group)
After exposed to hypoxia for 30d the ration of haploid and diploid cell population was reduced by 25 when compared with control group (Shown in Figure 11)
The ratio of tetraploid cells to diploid cells decreased significantly in rats exposed to hypoxia for 15d and 30d (Shown in Figure 12)
67
4C2
C ra
tio
2 0
1 5
1 0
0 5
0 0 cont r ol H5d H15d H30d
Figure 12 Effect of hypoxia on the ratio of 4C2C in testes (Plt001 vs Control group)
68
Proliferation index of 15d and 30d hypoxic groups was significantly lower than that of the control group (Shown in Figure 13) Relative percent of G0G1 cells in hypoxic 15d group and 30d group was more than control group (Plt001 shown in Figure 14)
PI(
)
70
60
50
40
30
20
Cont r ol H5d H15d H30d
Figure 13 Effect of hypoxia on proliferation index of germ cells in testes (Plt001 vs Control group)
Rel
ativ
e pe
rcen
t of G
0G
1 ce
lls (
)
60
40
20
0 Cont r ol H5d H15d H30d
Figure 14 Effect of hypoxia on relative percent of G0G1 cells in tests (Plt001 vs Control group)
69
TUNEL
The apoptosis of spermatogonia and spermatocytes increased after exposure to hypoxia for 5d 15d and 30d (Shown in Figure 15 16)
Figure 15 Immunohistochemical demonstration of apoptotic cells by the TUNEL method (magnification 200times) (A) Control rat (B) 5d hypoxic rat
cont ai ni ng mor e t han one posi t i ve cel l cont ai ni ng one posi t i ve cel l cont ai ni ng t wo posi t i ve cel l s
Cont r ol H5d H15d H30d
Figure 16 Effect of hypoxia on apoptosis of seminiferous germ cells (Plt005 Plt001 vs Control group)
0
5
10
15
20
25
30
perc
enta
ge o
f tub
ules
con
tain
ing
TU
NE
Lpo
sitiv
e ce
lls
cont ai ni ng mor e t han t hr ee posi t i ve cel l s
70
DISCUSSION
The density of spermatozoa in the cauda epididymis decreased in hypoxic 15d group and 30d group (Table 1) suggesting adverse effects of hypoxia on the spermatogenic process This was coincident with the results of previous researches which indicated that hypoxia changed the seminiferous epithelium and inhibited spermatogenesis in rats (Gosney 1984 Astakhov 1990) Previous studies have revealed that spermatozoa acquire motility and form tail abnormalities mainly in the epididymis (Axner et al 1999) Our study found motility and viability of spermatozoa in hypoxic rats was reduced significantly and spermatozoa with abnormal tails increased significantly after exposure to hypoxia for 5 days These results indicate that hypoxia suppressed the maturation of spermatozoa in the epididymis Since low spermatozoa number and motility and high rates of abnormal spermatozoa have negative correlations with fertility (Bostofte et al 1984) our findings indicate that hypoxia will decrease the fertility of male rats
Mammalian spermatozoa must undergo a preparation period known as capacitation to become capable of fertilizing oocytes This process was associated with the removal of cholesterol leading to an increase in membrane fluidity calcium influx and cAMP levels and changes in some enzymatic activities These biochemical modifications lead to a transient change in the pattern of spermatozoa motility called hyperactivation The preparation process ends with an exocytotic event called the acrosome reaction a prerequisite step for oocyte fertilization The membrane-perturbing properties of LPC have been useful to the study of capacitation LPC induces the acrosome reaction in capacitated but not in noncapacitated spermatozoa (Byrd and Wolf 1986) The effect of hypoxia on the acrosome reaction was not explored in previous studies Our study found acrosome reaction rate was suppressed by approximately 60 when exposed to hypoxia This indicates hypoxia inhibits acrosome reaction of spermatozoa (Figure 1)
Acrosin has function in spermatozoa penetration by limited proteolysis of ZP glycoproteins Acrosin protease activity has also been involved in dissolution of the acrosomal matrix and in a regulated release of acrosomal contents at the time of the acrosome reaction (Hardy et al 1991) Previous researches have not revealed the effect of hypoxia on acrosin protease activity In the present study we found that acrosin protease reaction rate decreased significantly when exposed to hypoxia (Figure 2) suggesting hypoxia suppressed the acrosin protease activity of spermatozoa Low acrosome reaction rate and acrosin protease activity in hypoxic conditions will decrease the opportunity for oocyte fertilization
In this study we found hypoxia caused testicular interstitial edema occasional atrophy of seminiferous tubules and germ cell depletion (Figure 3) We also found hypoxia caused more lipid droplets to be deposited in Sertoli cells and spermatogonia to degenerate with slight chromatin margination under electron microscopy (Figure 4) These changes of morphology in testes indicate hypoxia affects spermatogenesis in rats
Flow cytometry can provide a rapid way to investigate germinal epithelium integrity and to perform a quantitative analysis of spermatogenesis and has been used in many laboratories to examine spermatogenesis in men and animals (Spano and Evenson 1993 Dong et al 1999) The effect of spermatogenesis was evaluated only by morphological methods in previous studies (Astakhov 1990
71
Saxena 1995) In the present studies quantitative examination was done by flow cytometry Using this method we demonstrated that ratio of G0G1 phase cells in hypoxic 15d and 30d group significantly increased (Figure 10) It suggests that hypoxia is capable of inducing cell cycle arrest in G0G1 phase Proliferation index of 15d and 30d hypoxic rats decreased significantly (Figure 9) and the total spermatogenic transformation (1C2C cell ratio) dropped in 30d hypoxic rats (Figure 7) indicating hypoxia restrains spermatogenesis in rats Flow cytometry also provided convincing evidence that the suppressive effects of hypoxia on spermatogenesis were mainly caused by decreasing tetraploid spermatogenic cells This was supported by the observation that the ratio of tetraploid to diploid cells was lower in hypoxic rats and the proportions of tetraploid cells were decreased under hypoxic condition (Figure 5 8) which indicates the direct cytotoxic effect of hypoxia on the pachytene spermatocytes A similar early reduction in 4C population was observed in mice after administration of 2-methoxyacetic acid (Spano et al 1991) and teniposide (Jyothi et al 2001) Consequently after exposure to hypoxia 30d there was a compensatory increase in the relative percentage of 2C cells (Figure 6) Such an increase in relative percentage of 2C cells is due to the accumulation of surviving spermatogonia (Krishnamurthy et al 1998)
The TUNEL assay is a method for quantifying apoptosis in germ cells of rat testes Percentage of seminiferous tubules containing apoptotic germ cells increased in hypoxic conditions (Figure 12) The apoptotic germ cells were mainly primary spermatocytes and spermatogonia (Figure 11) The apoptosis of spermatogonia and primary spermatocytes may contribute to the loss of tetraploid cells
CONCLUSIONS
Hypobaric hypoxia suppresses spermatozoa density motility viability and increases the number of morphologically abnormal spermatozoa in rat Hypoxia also inhibits the acrosome reaction and acrosin activity of rat spermatozoa Hypobaric hypoxia inhibits spermatogenesis in rats by decreasing the tetraploid spermatogenic cells (primary spermatocytes) Apoptosis of primary spermatocytes and spermatogonia under hypoxic condition may contribute to the decrease in the tetraploid cell population
REFERENCES
Astakhov O B 1990 Dinamika morfometricheskikh pokazatelei semennikov u krys v khode adaptatsii k vysokogoriu Antarktidy i posleduiushchei deadaptatsii [Dynamics of morphometric indicators of rat testes during adaptation to high-altitude in the Antarctic regions with subsequent dysadaptation] Arkh Anat Gistol Embriol 99 17-9
Axner E C Linde Forsberg and S Einarsson 1999 Morphology and motility of spermatozoa from different regions of the epididymal duct in the domestic cat Theriogenology 52 767-78
Bostofte E J Serup and H Rebbe 1984 Interrelations among the characteristics of human semen and a new system for classification of male infertility Fertil Steril 41 95-102
Briz M S Bonet B Pinart and R Camps 1996 Sperm malformations throughout the boar epididymal duct Animal Reprod Sci 43 221-39
Byrd W and D P Wolf 1986 Acrosomal status in fresh and capacitated human ejaculated sperm Biol Reprod 34 859-69
72
Donald H 1981 Man at high altitude Churchill Livingstone
Dong Q H Li Y Yang M Huang and S Lei 1999 The effect of vasectomy on spermatogenesis and proliferation of rat spermatogenic cell Hua Xi Yi Ke Da Xue Xue Bao 30 417-9
Eckes L 1976 Hohenadaptation Teil IV Fertilitat und Fortpflanzung in grossen Hohen [Altitude adaptation IV Fertility and reproduction at high altitudes Gegenbaurs Morphol Jahrb 122 761-70
Gosney J R 1984 Effects of hypobaric hypoxia on the Leydig cell population of the testis of the rat J Endocrinol 103 59-62
Hardy D M M N Oda D S Friend and T T Huang Jr 1991 A mechanism for differential release of acrosomal enzymes during the acrosome reaction Biochem J 275 759-66
Hsu P C C C Hsu and Y L Guo 1999 Hydrogen peroxide induces premature acrosome reaction in rat sperm and reduces their penetration of the zona pellucida Toxicology 139 93-101
Jyothi P G C Jagetia and H Krishnamurthy 2001 Evaluation of teniposide (VM-26)-induced toxicity on mouse spermatogenesis by flow cytometry Toxicology 163 163-74
Krishnamurthy H G C Jagetia and P Jyothi 1998 Radioprotective effect of zinc aspartate on mouse spermatogenesis a flow cytometric evaluation Mutat Res 401 111-20
Saxena D K 1995 Effect of hypoxia by intermittent altitude exposure on semen characteristics and testicular morphology of male rhesus monkeys Int J Biometeorol 38 137-40
Spano M R Amendola C Bartoleschi S Emiliani E Cordelli J M Petit R Julien and M H Ratinaud 1991 Evaluation of 2-methoxyacetic acid toxicity on mouse germ cells by flow cytometry J Toxicol Environ Health 34 157-76
Spano M and D P Evenson 1993 Flow cytometric analysis for reproductive biology Biol Cell 78 53-62
Wyrobek A J and W R Bruce 1975 Chemical induction of sperm abnormalities in mice Proc Natl Acad Sci U S A 72 4425-9
73
74
ENDOCRINE DISRUPTING AND TERATOGENIC EFFECTS OF HYPOXIA ON FISH AND THEIR ECOLOGICAL IMPLICATIONS
Rudolf Wu8 Eva Shang and BS Zhou
ABSTRACT
Hypoxia occurs over thousands of km2 and poses a major threat to aquatic ecosystems Elimination of sensitive species population decline and changes in community have been reported worldwide We demonstrated that hypoxia is an endocrine disruptor and can lower the levels of testosterone and estradiol in adult carps (by 77-91) Disturbances of sex hormones retarded gonad development in both male and female carps leading to a decline in sperm motility decrease in fertilization success (from 994 to 555) hatching rate (from 988 to 172) and larval survival (from 937 to 464) Overall the survival of eggs to larvae decreased from 923 in the normoxic group to only 44 in the hypoxic group Experiment on zebrafish further demonstrated that hypoxia is a teratogen and can significantly increase malformation (by 774) during their embryonic development Disruption of apoptotic pattern was clearly evident at 24 hpf which may be a major cause of malformation Hypoxia can also delay embryonic development and upset the balance of testosterone and estradiol at very early developmental stages implicating that subsequent sexual development may also be affected Taken together our results imply that hypoxia may reduce species fitness and threaten the sustainability of natural fish populations over large areas on a global scale
INTRODUCTION
Hypoxia affects thousands of km2 of freshwater and marine waters worldwide and some coastal areas (eg Black Sea) have become permanently hypoxic anoxic (Jin 1994 Diaz and Rosenberg 1995 Smith et al 1999 Levin 2003) Helly and Levin (2004) estimated that the global area of permanent hypoxic shelf and bathyal sea floor are over one million km2 The severity frequency occurrence and spatial scale of aquatic hypoxia have increased in the last few decades and due to rapid human population growth and global warming the situation is likely to become worse in coming years (Wu 2002) Indeed hypoxia is now regarded as one of the most serious threats to aquatic populations and genetic diversity (Goldberg 1995 McIntyre 1995 Wu 1999 Gray et al 2002) and there is a pressing need to understand the functional consequences of oxygen depletion in aquatic ecosystems (Levin 2003)
In the course of evolution fish has developed various strategies to survive hypoxic conditions These include (1) enhanced capability to obtain oxygen from water by increasing the binding affinity of oxygen to haemoglobin increasing water flow over the gills a reduction of blood flow promotion of gill diffusing capacity or increasing the perfused number of gill lamellae (Randall 1982) (2) promoting anaerobic metabolism to compensate for a lack of oxygen (Dunn and Hochachka 1986) (3) change in enzyme activities and invoking metabolic depression (Hochachka 1997) Despite the numerous studies on the biochemical and physiological responses of fish to hypoxia the effects of hypoxia on fish reproduction and development remain very poorly known albeit reproductive success
Department of Biology and Chemistry City University of Hong Kong Kowloon Hong Kong SAR China
75 8
is one of the key Darwinian fitness traits in determining species survival
Reproductive success in fish depends on a number of inter-related factors namely gonad development reproductive behavior fecundity gamete quality fertilization success as well as larval hatchability and larval survival In fish all these important processes are regulated by sex steroid hormones (Fostier et al 1983 Tyler and Sumpter 1996 Kime 1998 McCormick 1998 1999) Thus disruption of any of these hormones may affect the reproductive process as a whole (Kime 1998) For example disturbance of the gonadal steroid hormone production will impair gonadal development and hence reproductive success (Kime 1998 Arcand-Hoy and Benson 1998) Effects of hypoxia on sex hormones gametogenesis fertilization success and reproductive hormones are virtually unknown
It is generally accepted that embryonic and larval development are much more sensitive to stress than adult stages (Rand 1995 Rolland et al 1995 Connell et al 1999) since normal histogenesis and organogenesis depend on a series of programmed highly intricate processes Disturbance of any of these processes is likely to result in malformation and birth defects which may ultimately affect the survival and fitness of adults Surprisingly effects of hypoxia on embryonic and larval development of fish remain virtually unknown
This paper presents scientific evidence to show that hypoxia is an endocrine disruptor and can disrupt the balance of sex hormones leading to severe reproductive impairments We also provide data to demonstrate that hypoxia is a teratogen and fish exposed to sub-lethal levels of hypoxia during their embryonic and larval development will result in a significantly higher percentage of malformation which may adversely affect species survival
Hypoxia is an endocrine disruptor
We compared serum levels of testosterone 17β-estradiol (using ELISA) gonadosomatic index gonadal histology spawning success sperm motility (using a CRISMAS image analysis system) fertilization success and larval hatchability of adult carp (Cyprinus carpio) reared under hypoxia (10plusmn02 mg O2 l-1) and normoxia (70plusmn02 mg O2 l-1) for 8 weeks and 12 weeks (Wu et al 2003)
Changes of sex hormomes
After 8 weeks of exposure to hypoxia serum testosterone levels were significantly reduced (-77) but estradiol (E2) levels increased significantly (+90) in male carps (plt0001) Serum testosterone concentrations showed a significant correlation with degrees of maturation of the testis (r=069) Serum estradiol and testosterone levels in female carp exposed to hypoxia for 8 weeks were reduced by 80 to 91 respectively (plt001) (Table 1)
76
Table 1 GSI and serum hormone levels (ng ml-1) of carp after exposure to normoxia (7 mg O2 l-1) hypoxia (1 mg O2 l-1) for 8 weeks
Male Female 70 mg O2 l-1 10 mg O2 l-1 70 mg O2 l-1 10 mg O2 l-1
GSI 1023plusmn088 426plusmn061 1851plusmn218 609plusmn281 Testosterone 983plusmn095 222plusmn072 823plusmn115 073plusmn031 Estradiol 0033plusmn0004 0063plusmn006 099plusmn035 019plusmn014
Mean plusmn SE n=7-11 Asterisk(s) indicate values significantly different from the normoxic control (t-test Plt005 Plt001 Plt0001)
GSI and gonadal histology
A significant decrease in the gonadosomatic index (GSI) was found in both male and female carps after 8 weeks of exposure to hypoxia (Table 1) Histological examination further showed a reduced number of spermatocysts (SPC) cells and smaller lobules but a larger number of spermatogonia (SPG) cells in hypoxic fish indicating gametogenesis was impaired by hypoxia (Plt0001 Figure1) Retardation of gonad development in female carp was exemplified by smaller gonads and less yolk in each egg (Plt0001 Figure 1)
SPG SPC SPD
Figure 1 Number of spermatogonia (SPG) spermatocytes (SPC) and spermatid (SPD) of the testes of C carpio upon exposure to 70 and 10 mg O2 l-1 for 8 weeks Values significantly different from the control are indicated by asterisks (N=7-11 Mean plusmn SD) ( Plt001 Plt0001)
00
25
50
75
100
No o
f Cys
tsL
obul
e
70 mgl-1
10 mgl-1
77
Sperm motility fertilization success hatching success and larval survivorship
A significant decrease in sperm motility was found in fish after exposure to hypoxia for 12 weeks (Table 2) indicating that sperm quality was impaired Percentage fertilization success was reduced from 994 in the normoxic group to 555 in the hypoxic group (Plt0001 Figure 2b) 988 fertilized eggs produced by the normoxic group hatched to fry while only 172 of fertilized egg produced by the hypoxic group hatched (Plt001 Figure 2b) 937 hatched larvae survived in the normoxic group while larval survival decreased to 464 in the hypoxic group 24h post-hatching (Plt0001 Figure 2b) Overall survival from eggs to larvae was 923 in the normoxic group but only 44 in the hypoxic group (Plt0001 Figure 2A)
Table 2 S perm motility of carp after exposure to normoxia (70 mg O2 l-1) and hypoxia (10 mg O2 l-1) for 12 weeks
70 mg O2 l-1 10 mg O2 l-1
VCL VSL VAP
7742plusmn1303 3883plusmn939 4796plusmn269
4625plusmn484 1065plusmn174 2112plusmn449
Mean plusmn SE N=6 The velocity is expressed as μm S-1 Asterisk indicates values significantly different from the control (t-test Plt005) (VCL mean curvilinear velocity VSL mean straight-line velocity VAP angular path velocity)
0
25
50
75
100
(A)
Surv
ival
0
20
40
60
80
100
120
Fertilization Hatching Larval survival
Per
cent
age
(B)
70 mg l-1 10 mg l-1
Eggs to larvae
Figure 2 (A) Percentage survival of eggs to larvae (B) Percentage of fertilization hatching rate and larval survivorship of C carpio upon exposure to 70 and 1 mg O2 l-1 for 12 weeks Values significantly different from the control are indicated by asterisks (N=6 Mean+SD) ( Plt001 Plt0001)
78
The above results provide clear evidence that hypoxia disrupts endocrine function reduces GSI gametogenesis and maturation of gonads quality of gametes fertilization hatching and larval survival
In male fish testosterone plays an important role in stimulating and maintaining spermatogenesis (Kime 1998 Fostier 1983) Estradiol normally occurs only in trace amounts in male fish albeit ineffective in regulating spermatogenesis (Kime 1998) higher levels of estradiol can inhibit spermatogenesis (Billard 1981) Thus both low levels of testosterone and high levels of estradiol may have contributed to the reduction in spermatogenesis in male hypoxic fish
Sperm motility is indicative of sperm quality and also a major factor determining successful fertilization and quality of fish larvae (Evans 1998 Kime 1998 1999) Time to spawning egg size egg viability fertilization success time to hatching and larval survivorship have all been regarded as important attributes leading to reproductive success (Fahraeligus-Van Ree 1997 Arcand-Hoy 1998) Fertilization success and the proportion of normally developing embryos and larvae depend upon the quality of the eggs and sperm (Moodie 1989) Factors influencing the maternal levels of testosterone can have a major impact on larval survivorship (Moodie 1989) It is clear from our results that fish exposed to hypoxia produce inferior quality gametes and offspring which in turn probably accounted for the observed low hatching success and high larval mortality
The above evidence showed that hypoxia reduces the overall reproductive success of fish by disturbing endocrine functions which in turn affect gametogenesis sexual maturity gamete quality fecundity fertilization success hatching development as well as viability of larvae The impairment of fish reproduction by hypoxic stress may be an important mechanism accounting for the population decline and changes of fish species composition observed in hypoxic environments
Hypoxia is a teratogen
We compared development of zebrafish embryos exposed to normoxia (58 mgL) and hypoxia (08 mgL) at time interval (24 48 72 96 120 and 168hpf) (Shang and Wu 2004) Developmental stages were classified according to Kimmel et al (1995) and embryos displaying noticeable external abnormalities such as spinal deformity and cardiac deformities were considered as malformed embryos Embryos were sampled from the hypoxic and normoxic group at 24hpf when significant extent of apoptosis occurs and stained by Acridine Orange (Cole and Ross 2001) Total number of apoptotic cells was counted and compared
Development was clearly delayed when zebrafish embryos were exposed to hypoxia Embryos exposed to 05 mg O2 L-1 required twice as long for them to develop to the same developmental stages as their normoxic counterpart (Figure 3) Besides embryos exposed to hypoxia developed lost synchronization in their development with their tails developed much faster than the head
79
58 mg O2 L-1 24 hpf 58 mg O2 L-1 48 hpf
05 mg O2 L-1 24 hpf 05 mg O2 L-1 59 hpf
Figure 3 A comparison of zebrafish development under hypoxia (05mg O2 L-1) and normoxia (58 mg O2 L-1)
After 168 hpf percentage of malformation (ie spinal deformity and altered axial curvature) in the hypoxic group (183 plusmn 231) was significantly higher than that of the control (103 plusmn 115 Studentrsquos t-test Plt001) (Figure 4) Under hypoxia many embryos failed to develop their vascular systems after several days and died
80
0
5
10
15
20
25 M
alfo
rmat
ion
()
58mg 08mg
O2L-1
O2L-1
48 72 96 120 168Time (hpf)
Figure 4 Percentage malformation in zebrafish embryos during different developmental stages (48 72 96 120 168 hpf) upon exposure to 58 mg O2 L-1 (Normoxia) and 08 mg O2 L-1 (Hypoxia) Values significantly different from the normoxic control are indicated by asterisks (N=5 Mean plusmn SD) (t-test plt005 plt001)
Sex Hormones
At 48hpf testosterone levels in hypoxic embryos showed a significant increase from 256 plusmn 056 to 344 plusmn 42 pg mL-1 (Plt001) while estradiol was significantly reduced from 80 plusmn 14 to 24 plusmn 01 pg mL-1 (Plt0001) (Figure 5A)
A reversed pattern was observed at 120hpf testosterone in hypoxic embryos was significantly reduced from 361 plusmn 143 to 273 plusmn 275 pg mL-1 (Plt001) while estradiol was significantly increased from 461 plusmn 128 to 125 plusmn 410 pg mL-1 (Plt005) (Figure 5B)
A
0
10
20
30
40
50
Con
cent
ratio
n (p
gm
l) 5 8mg 08mg
O2L-1
O2L-1
Testosterone Estradiol 48hpf
81
B
0
10
20
30
40 C
once
ntra
tion
(pg
ml)
5 8mg 08mg
O2L-1
O2L-1
Testosterone Estradiol120hpf
Figure 5 Testosterone and estradiol (pgmL) in zebrafish embryos at 48 hpf (A) and 120 hpf (B) upon exposure to 58 mg O2l (Normoxia) and 08mg O2l (Hypoxia) Values significantly different from the normoxic control are indicated by asterisks (N=4 Mean plusmn SD) (t-test plt005 plt001 plt0001)
Apoptosis
Compared with the normoxic control number of apoptotic cells in the tail of hypoxic embryos were significantly reduced (-637 plt001) In contrast a significantly higher percentage (+116 plt005) of apoptotic cells was found in the brain of hypoxic embryos as compared with control embryos (Figure 6) The above observations clearly indicated that the apoptotic pattern in zebrafish embryos was altered by hypoxia
0
30
60
90
120
150
Apo
ptot
ic c
ells
58mg 08mg
O2L-1
O2L-1
Head Tail
Figure 6 Number of apoptotic cells at 24 hpf in zebrafish embryos upon exposure to 58 mg O2 L-1
(Normoxia) and 08 mg O2 L-1 (Hypoxia) Values significantly different from the control are indicated by asterisks (N=10 Mean plusmn SD) (t-test plt005 plt001)
82
Ecological implications and significance
Endocrine disruption by chemical pollutants has been related to the decline in many fish reptile bird and wildlife populations (Colborn 1993 Tyler et al 1998) and has therefore become a major environmental concern in the last decade For example tributyl tin has caused imposex in female whelks leading to a male biased sex ratio and hence extinction of natural populations worldwide ranging from the North Sea to New Zealand (Ten 1994) The present study documents for the first time that hypoxia can also cause endocrine disruption in fish The facts that (a) hypoxia occurs over one million km2 globally (Levin 2003) imply that endocrine disruption caused by hypoxia may be a wide spread phenomenon and the problem of endocrine disruption caused by hypoxia is potentially much more serious than that caused by any known anthropogenic chemicals Since the modulating sex hormones are highly conservative hypoxia induced endocrine disruption observed in carp and zebrafish may possibly also occur in other fish species or animal groups
Our results also provided for the first time clear evidence that hypoxia does not only affect adults but also embryonic and larval development of fish Indeed the fact that a higher percentage of malformed fish is often found in polluted water (Au 2004) where hypoxia frequently occur lend further support to our laboratory findings These developmental impairments and malformation at the earlier stages of life cycle may subsequently reduce the fitness and chance of survival of individuals in natural populations
In conclusion hypoxia could significantly impair fish reproduction through a significant decrease in GSI retardation of gonad development disruption in reproductive hormones lowering of sperm quality and fertilization ability These impairments at various stages culminated in a reduction in hatching rate and survivorship of the larvae Hypoxia also affects embryonic development of fish leading to malformation Taken together these findings may form a scientific basis for interpreting andor predicting population decline and changes of fish species composition in hypoxic environments
ACKNOWLEDGEMENT
The work described in this paper was supported by the Central Allocation Grant Scheme of the Research Grants Council of the Hong Kong Special Administrative Region China (CityU 203C) and a grant from the Area of Excellence Scheme (Project No AoEP-0404)
REFERENCES
Arcand-Hoy LD and WH Benson 1998 Fish reproduction An ecologically relevant indicator of endocrine disruption Environmental Toxicology and Chemistry (Annual Review) 17 49-57
Au DWT 2004 The application of histo-cytopathological biomarkers in marine pollution monitoring A review Marine Pollution Bulletin 48 817-834
Billard R B Breton and M Richard 1981 On the inhibitory effect of some steroids on spermatogenesis in adult rainbow trout Salmo gairdneri Canadian Journal of Zoology 59 1479-1487
83
Colborn T F S Vom Saal and A M Soto 1993 Developmental effects of endocrine disrupting chemicals in wildlife and humans Environmental Health Perspectives 101 378-384
Cole LK and LS Ross 2001 Apoptosis in the developing zebrafish Developmental Biology 240 123-153
Connell DW PKS Lam BR Richardson and RSS Wu 1999 In Ecotoxicology Blackwell Science UK pp50-77
Diaz R J and R Rosenberg 1995 Marine benthic hypoxia a review its ecological effects and the behavioural responses of benthic marcofauna Oceanography and Marine Biology Annulal Review) 33 245-303
Dunn JF and PW Hochachka 1986 Metabolic responses of the trout (Salmo gairdneri) to acute environmental hypoxia Journal of Experimental Biology 123 229-242
Evans J P and AJ Geffen 1998 Male characteristics sperm traits and reproductive success in winter-spawning Celtic Sea Atlantic herring Clupea harengus Marine Biology 132 179-186
Fahraeligus-Van Ree and GE JF Payne 1997 Effects of toxaphene on reproduction of fish Chemosphere 34 855-867
Fostier A B Jalabert B Billard B Breton and Y Zohar 1983 In Fish Physiology WS Hoar DJ Randall EM Donaldson Eds Academic Press New York pp 277-346
Goldberg ED 1995 Emerging problems in the coastal zone for the twenty-first century Marine Pollution Bulletin 31 152-158
Gray JS 2002 The species diversity of marine soft sediments Marine Ecology-Progress Series 244 285-297
Helly JJ and LA Levin 2004 Global distribution of naturally occurring marine hypoxia on continental margins Deep-Sea Research I 51 1159-1168
Hochachka PW 1997 Oxygen-A key regulatory metabolite in metabolic defense against hypoxia American Zoology 37 595-603
Jin XC 1994 An analysis of lake eutrophication in China In Inland Waters of Tropical Asia and Australia Conservation and Management Dudgeon D and PKS Lam (eds) pp 207-211
Kime DE 1998 In Endocrine disruption in fish Kluwer-Acad Press
Kime DE and JP Nash 1999 Gamete viability as an indicator of reproductive endocrine disruption in fish Science of the Total Environment 233 123-129
Kimmel CB WW Ballard SR Kimmel B Ullmann and TF Schilling 1995 Stages of embryonic development of zebrafish Developmental Dynamics 203 253-310
84
Levin LA 2003 Oxygen minimum zone benthos adaptation and community response to hypoxia Oceanography and Marine Biology an Annual Review 41 1-45
McCormick MI 1998 Behaviorally induced maternal stress in a fish influences progeny quality by a hormonal mechanism Ecology 79 1873-1883
McCormick MI 1999 Experimental test of the effect of maternal hormones on Larval quality of a coral reef fish Oecologia 118 412-422
McIntyre AD 1995 Human impact on the oceans The 1990s and beyond Marine Pollution Bulletin 31 147-151
Moodie GEE NL Loadman MD Wiegand and JA Mathias 1989 Influence of egg characteristics on survival growth and feeding in larval walleye (Stizostedion vitreum) Canadian Journal of Fisheries and Aquatic Sciences 46 516-521
Rand GM 1995 Fundamentals of aquatic toxicology Effects environmental fate and risk assessment 2nd edition Taylor and Francis Washington DC USA
Randall DJ 1982 The control of respiration and circulation in fish during exercise and hypoxia Journal of Experimental Biology 100 275-288
Rolland RM M Gilbertson and RE Peterson (Eds) 1995 Chemically induced alterations in functional development and reproduction of fishes Proceedings from a session at the Wingspread Conference Center 21-23 July 1995 Racine WL SETAC Press Pensacola FL USA
Shing EHH and RSS Wu 2004 Aquatic hypoxia in a teratogen and affects fish embryonic development Environmental Science and Technology 38 4763-4767
Smith VH GD Tilman and JC Nekola 1999 Eutrophication impacts of excess nutrient inputs on freshwater marine and terrestrial ecosystems Environmental Pollution 100 179-196
Ten Hallers-Tjabbes CC JF Kemp and JP Boon 1994 Imposex in whelks (Buccinum undatum) from the open North Sea relation to shipping traffic intensities Marine Pollution Bulletin 28 311ndash313
Tyler CR and JP Sumpter 1996 Oocyte growth and development in teleosts Reviews in Fish Biology and Fisheries 6 287-318
Tyler CR S Jobling and JP Sumpter 1998 Endocrine disruption in wildlife a critical review of the evidence Critical Review Toxicology 28319-361
Wu RSS 1999 Eutrophication trace organics and water-borne pathogens pressing problems and challenge Marine Pollution Bulletin 39 11-22
Wu RSS 2002 Hypoxia from molecular responses to ecosystem responses Marine Pollution Bulletin 45 35-45
85
Wu R S S BS Zhou DJ Randall NYS Woo and PKS Lam 2003 Aquatic hypoxia is an endocrine disruptor and impairs fish reproduction Environmental Science and Technology 37 1137-1141
86
EFFECTS OF HYPOXIA ON LIPID METABOLISM IN TELEOSTS
Guido van den Thillart9
ABSTRACT
Hypoxia is a naturally occurring phenomenon for fishes So a protection mechanism can be expected particularly with respect to lipid catabolism By measuring the lactate response it is possible to determine whether a teleost is able to survive and even to adapt to a certain oxygen level It is hypothesized that recovery will occur at oxygen levels above the critical oxygen level (PO2)crit reflected by a transient lactate increase In contrast continuous lactate accumulation occurs at oxygen levels below the (PO2)crit which will be lethal in case of prolonged exposure Results from cannulated common carp and rainbow trout exposed to stepwise decreasing oxygen levels show that both individual and inter-specific differences in lactate response occur during exposure to hypoxia Both in carp and trout a strong correlation exists between changes in lactate and both catecholamine levels
Hypoxia increases the levels of catecholamines which in mammals activate lipolysis The oxidation of the released fatty acids however is impaired at low oxygen levels Thus plasma and tissue free fatty acids accumulate in (mammalian) tissues under hypoxia which ultimately leads to death There are no indications however that this type of tissue damage develops also in fishes We observed a strong negative correlation between the level of noradrenaline and the level of plasma free fatty acids in fish during chronic hypoxia exposure The fact that noradrenaline levels remain elevated when the hypoxic condition persists suggests that this hormone has a controlling function Infusion studies with specific α- and β- agonists and antagonists demonstrate that there are β1-adrenoceptors that inhibit lipolysis In-vitro studies with adipocytes isolated from several fish species confirmed these results There is also evidence that this is mediated by the inhibition of hormone sensitive lipase Thus we can conclude that in fishes the down-regulation of plasma FFA levels under hypoxia is controlled by catecholamines As fatty acid cannot be oxidized under hypoxia this downregulation may be a protection mechanism in fish against fatty acid intoxication
INTRODUCTION
Over the last two decades the hormonal regulation of carbohydrate metabolism in fish especially in liver has received increasing attention It has been demonstrated that the mobilization of glucose from the liver is stimulated by hormones such as catecholamines cortisol and glucagon (Janssens and Waterman 1988 Danulat and Mommsen 1990 Puviani et al 1990 Brighenti et al 1991) in particular during stress conditions such as hypoxia (Wright et al 1989) In contrast little information is available on the regulation of lipid metabolism in teleost fish Several reviews on fish lipid metabolism have been published showing a restricted knowledge compared to the mammalian situation (Greene and Selivonchick 1987 Hendersen and Tocher 1987 Sheridan 1988) In mammals two types of stress responses are described ie coping and non-coping (Bohus et al 1987) These responses are related to the prevelance of cortisol vs catecholamine release in the circulation More recently Van Raaij et al (1996a) have demonstrated these two responses in hypoxic trout The non-coping group showed a
Institute of Biology section Integrative Zoology University of Leiden Van der Klaauw Laboratories Kaiserstraat 63 PO Box 9516 2300 RA Leiden The Netherlands
87
9
surge of catecholamines and high lactic acid levels This group did not survive the hypoxic conditions whereas the coping group with higher cortisol levels and lower catecholamine levels did This suggests that animals under stress may show opposing responses with respect to behaviour hormones and metabolites In mammals epinephrine levels increase in response to a psycho-physiological disturbance while norepinephrine increase is related to exercise stress (Scheurink et al 1989 Bohus et al 1987) Increased norepinephrine levels are often due to sympathetic overflow from postganglionic adrenergic nerve terminals In mammals catecholamines have a strong lipolytic action (Lafontan and Berlan 1993) which is connected to an increased energy requirement Hypoxia causes a surge of catecholamines in all vertebrates Under such conditions a consistent activation of lipolysis is observed in mammals due to the high release of catecholamines (Prinzen et al 1984 Prasad et al 1991) The effect of hypoxia on lipolysis in fish is however not clear and the available results are conflicting (see review Van den Thillart et al 2002) Considering the strong lipolytic character of catecholamines in mammals a reduction of lipolysis during hypoxia is a puzzling phenomenon and strongly suggests a different regulatory mechanism in fish The role of catecholamines in fish is summarized in a several recent reviews (Randall and Perry 1992 Wendelaar Bonga 1997 Reid et al 1988) describing the control of catecholamines release the effects of catecholamines on the cardiovascular system and on the ion transport mechanisms The effect of catecholamines on metabolism has been reviewed recently by Fabbri et al (1998) This review is mainly focused on glucose metabolism and signal transduction mechanisms With respect to lipid metabolism in fish reviews have been published by Sheridan (1988 1994) and Van den Thillart et al 2002)
Hypoxia can be a regularly occurring phenomenon for many teleost fishes under natural circumstances These fish species have developed adaptations which enable them to survive different hypoxic situations (Van den Thillart 1982) Adaptations may include adjustments in the oxyshygen-carrying capacityaffinity (Perry and Wood 1989 Boutilier et al 1988) a diminution of the oxygen consumption rate by a reduction in locomotor activity (Lomholt and Johansen 1979 Van den Thillart et al 1994) or even a depression of the overall energy metabolism (Van Ginneken et al 1997) However generally these adaptations occur with a certain delay before reaching the required levels and therefore mostly they are not sufficient to meet the energy demands at the onset of the hypoxia exposhysure which is then connected with a certain level of stress To compensate energy imbalance all activate anaerobic glycolysis resulting in accumulation of lactic acid (Joslashrgensen and Mustafa 1980 Dunn and Hochachka 1986 1987 Dalla Via et al 1994) and consequently in metabolic acidosis (Boutilier et al 1988 Van Raaij et al 1996a) Since low pH inhibits physiological processes and can even cause cell damage andor cell death (Van den Thillart and Van Waarde 1985) anaerobic metashybolism can only be maintained for a short period For survival of long-term hypoxia it is important for the animal to obtain a new balance in oxygen extraction and oxygen consumption which must allow aerobic recovery from earlier anaerobic stimulation In this case the lactate level may rise first and drop later due to recovery Below a certain critical oxygen level ((PO2)crit) no recovery will be possible resulting in a continuous accumulation of lactic acid Therefore monitoring plasma lactate during hypoxia will tell us whether the animal is able to recover at that level Recently it has been demonstrashyted (Van Raaij et al 1996b) that with respect to behaviour in rainbow trout two opposite coping strateshygies can be distinguished during deep hypoxia A passive coping strategy of wait and see reflected by a quiet behaviour and an active coping strategy characterized by a large amount of burst type activity Plasma lactate levels were 4-5 fold higher in the active animals suggesting that the anaerobic threshold was reached almost immediately in the active fish while it could be postponed in quiet animals In general oxygen restriction is experienced as a stressful condition resulting in the release of adrenaline noradrenaline (Boutilier et al 1988 Randall and Perry 1992 Van Raaij et al 1996c) and cortisol (White and Fletcher 1989 Van Raaij et al 1996c)
88
MATERIAL AND METHODS
Experimental protocol for cannulation experiments
The experiments were performed in a recirculation system with a total volume of 965 L The water of this system was kept at a temperature of 200 plusmn 05 degC for carp and 150 plusmn 05 degC for trout It was air saturated at a normoxic level of 80-90 air saturation (AS 155-175 kPa PO2) and pumped through flow-chambers at a rate of 08-10 l min-1 Before the start of the experiment three fish were captured and placed individually into the flow-chambers with dimensions 55x10x18cm (carp) or 55x8x14cm (trout) Each experimental chamber was closed with a gas-tight perspex lid which was partially darkened over the head of the fish in order to block visual perception During the experimental period the fish were deprived of food
After three days of acclimation the dorsal aorta was cannulated according to a modification of the method of Soivio et al (1975) as described by Van Dijk et al (1993) with a poly-ethylene (PE 50) catheter (Rubber Hilversum The Netherlands) filled with saline containing 200 IU ml-1 heparin (Sigma St Louis USA) After surgery the fish was placed into the flow-chamber and allowed to recover for two days before the experiments were carried out This careful 5-day pre-experimental protocol has been shown to minimize the amount of stress associated with handling anesthesia and surgery (Van Raaij et al 1996c) Each day the cannulae were flushed with heparinized saline (200 IU ml-1) and filled with a viscose solution of poly-vinyl-pyrrolidon (Merck FRG 1 g PVP ml-1 saline) containing 500 IU ml-1 heparin Using this procedure the diffusion of heparin into the circulation is negligible
Before the experiments were started two control blood samples were taken within 30 minutes (between 0800 and 0900 am) for measurement of the initial values of metabolites and stress hormones Directly after the second blood sample carp were exposed to a controlled linear PO2 decline from 80 AS to 30 AS which was reached in 2 hours Thereafter the PO2 was stepwise decreased further depending on the experiment Trout experienced a PO2 decline from 80 AS to 40 AS (over 2 hours) after which the PO2 was stepwise decreased further depending on the experiment After the hypoxia exposure the water was rapidly re-aerated again and the cannulae were removed Blood samples and analyses were carried out as described earlier (Van Raaij et al 1996c)
Isolation and incubation protocol for adipocytes
Tilapias were killed by a sharp blow on the head followed by spinal transection at the cervical level Samples of abdominal adipose tissue were removed rapidly from the gastro-intestinal tract without connective tissue obtaining portions of 8-10 g (fish-1) and placed immediately into a Petri dish with Krebs-Henseleit buffer (in mmol l-1 1175 NaCl 56 KCl 118 MgSO4 252 CaCl2 128 NaH2PO4 250 NaHCO3 and 55 D-glucose) pregassed with 5 CO2 in O2 pH 74 The portions of adipose tissue were chopped obtaining slices of 1 mm2 Cells were isolated by incubation in a water shaking bath in a Teflon vessel containing 20 ml of Krebs-Henseleit buffer per portion with the addition of 1 bovine serum albushymin BSA (Fraction V Sigma St Louis USA) and collagenase 130 U ml-1 (type II Sigma St Louis USA) at 25degC under an atmosphere of 5 CO2 in O2 pH 74 After 15 hour the suspensions of adipocytes were filtered through a nylon cloth and washed three times with Krebs-Henseleit buffer (1 BSA) In a water shaking bath equilibrated at 5 CO2 in O2 portions of 100 μl adipocyte-suspension (approximately 3x10⁵ cells) were incubated in Teflon vessels for 5 h at 25degC in a total volume of 3 ml Krebs-Henseleit buffer with or without (controls) the addition of an adrenoceptor (ant)agonist and
89
containing 2 bovine serum albumin Control measurements were performed in triplicate and experimental measurements in duplicate When both an agonist and antagonist were used the adipocytes were pre-incubated with the antagonist 15 minutes before the agonist was added The incubation period was terminated by adding the content of each vessel to 3 ml of extraction medium (1-propanol n-heptane 1N H2SO4 = 40201) The tubes were mixed for 60 seconds and centrifuged for 5 minutes at 2000 rpm in a Hettich RotixaKS centrifuge From the upper layer 400 μl was used for FFA-determination (Vianen et al 2002)
RESULTS AND DISCUSSION
Response of cannulated carp and trout to stepwise decreasing oxygen levels
Cannulated common carp (Cyprinus carpio) and rainbow trout (Oncorhynchus mykiss) were exposed to stepwise decreasing oxygen levels and during each oxygen level plasma lactate and stress hormones were measured repeatedly It was hypothesized that at oxygen values (just) above the (PO2)crit activation of the anaerobic metabolism will be followed by aerobic recovery In contrast continuous accumulation of lactate will be observed during oxygen levels below the (PO2)crit associated with strong increases in circulating stress hormone levels
Changes in lactate levels in cannualted carp and trout is shown in figure 1 Exposure of carp to 30 AS (58 kPa PO2) caused activation of the anaerobic glycolysis in 2 out of 6 animals However after 1-2 hours at 30 AS the lactate levels declined in these animals indicating that the anaerobic activation was temporal and that 30 AS is above the (PO2)crit During 15 AS (29 kPa PO2) all animals showed an increase in plasma lactate In two fish (fish II and III) lactate levels stabilized during this period indicating an oxygen level just above (PO2)crit In contrast there was a continuous accumulation of plasma lactate in the other fish indicating that more lactate was produced than oxidized For these fish 15 AS is below (PO2)crit and will be lethal in case of prolonged exposure Exposure to 8 AS resulted in all carp in continuous lactate accumulation revealing an oxygen level below the (PO2)crit So the results demonstrate that for carp 15 AS (29 kPa PO2) is close to the critical oxygen level Exposure of trout to 40 AS (79 kPa PO2) two out of five animals showed a moderate but persistent increase of blood [lactate] while there was no change in plasma [lactate] in the other fish From this observation it can be concluded that for the latter group 40 AS is above the (PO2)crit whereas for the animals showing the permanent increase in lactate levels 40 AS is already too severe During 35 AS (69 kPa O2) the individual variation in lactate response became more pronounced between surviving (fish 1 and 4) and non-surviving trout (fish 2 3 and 5) Nevertheless the lactate accumulation was continuous in all trout indicating that 35 AS is below (PO2)crit It is obvious that the switch to continuous lactate accumulation occurs in carp at lower oxygen levels than in trout One of the main reasons explaining this difference is the fact that carp hemoglobin has a higher affinity for oxygen than trout hemoglobin (Jones et al 1970) While in trout half-maximal Hb-O2 saturation (P50) values range from 15-25 mmHg (Boutilier et al 1988 Perry and Reid 1994) P50 values in carp range from 1-8 mmHg (Itazawa and Takeda 1978 Wurm and Albers 1989 Glass et al 1990) which means that at reduced oxygen levels carp is able to extract more oxygen from the environshyment than trout
90
mm
olL
mm
olL
mm
olL
mm
olL
mm
olL
mm
olL
Time (hours)-2 0 2 4 6 8 10 12
02468
1012141618
80 PO2 30 15 8decline
VI
V
IV
III
III
Carp
Time (hours)-2 0 2 4 6 8 10 12
0
2
4
6
8
10
12
14
16
1880 PO2 40 35 30
decline
2 53
4
1
Trout
Time (hours)-2 0 2 4 6 8 10 12
02468
1012141618
80 PO2 30 15 8decline
VI
V
IV
III
III
Time (hours)-2 0 2 4 6 8 10 12
0
2
4
6
8
10
12
14
16
1880 PO2 40 35 30
decline
2 53
4
1
-2 0 2 4 6 8 10 12 0 2 4 6 8
10 12 14 16 18
80 PO2 30 15 8 decline
VI
V
IV
III
II I
Carp
Time (hours)
-2 0 2 4 6 8 10 12 0
2
4
6
8
10
12
14
16
18 80 PO2 40 35 30
decline
2 5 3
4
1
Trout
Time (hours) Figure 1 Individual plasma lactate levels are displayed for common carp and trout during stepwise
hypoxia The oxygen concentration in the water was reduced over a period of two hours from 80 AS (155 kPa PO2) to subsequently 30 15 and 8 AS each level for three hours The PO2 decline for trout was from 80AS to subsequently 40 35 and 30 AS All values at t ge 5 frac12 h for carp and at t ge 2 frac12 h for trout were significantly different (Plt005) from those at normoxia (t= -05 and 0 h) Data from Vianen 1999
To minimize the amount of stress associated with the experimental conditions carp and trout were acclimated to the experimental well-aerated flow-chambers for three days before they were cannulated After surgery the fish were allowed to recover for 36-48 hours The fish displayed a quiet behaviour before the stepwise hypoxia was induced which is reflected by low initial levels of catecholamines both in carp and trout (about 004 ngml adrenaline and about 03 ngml noradrenaline) These levels are similar to values observed by Van Raaij et al (1996c) in carp and trout which were obtained under identical experimental conditions In fish the resting values for plasma adrenaline are usually between 005 and 15 ngml and for noradrenaline between 004 and 25 ngml (Randall and Perry 1992 Thomas and Perry 1992) and thus the concentrations observed in this study are among the lowest reported in
91
2 0
4 2 0
ut oTr
I
Ca pr
fish The initial values of plasma cortisol are comparable with resting concentrations in cannulated fish observed by other investigators (Eros and Milligan 1996 Van der Boon et al 1991 Van Raaij et al 1996c) Changes in noradrenaline levels in cannulated carp and trout is shown in figure 2 Changes in adrenaline levels (not shown) were less dramatic significant changes occurred later at the lower PO2 levels ADR and NA remained at low levels (lt 5 ngml) in quiet reacting trout while in the active non-surviving trout higher values were measured for both ADR (5-15 fold) and NA (2-10 fold) These results support the idea that the neuroendocrine activition in fish resembles the stress coping strategies observed in higher vertebrates (Van Raaij et al 1996b)
909090808080707070
606060505050404040303030202020101010
80 PO 2 30880 PO 2 300 PO 2 30 151155 888
VVV
CaCarprpVIVIVI
IVIVIVII
IIIIII
IIIIIIIII
ng m
lng
ng
ml
ml
-2-2-2000
000 222 444 666 888 111000 111222TiTiTimememe (((hhhourouroursss)))
909090888000 PPPOOO 222 444000 333555 333000
808080
707070 666
606060444
ng
ng
ng m mm
lll 222
505050 00000 22 444
404040 333
303030 TrTroouutt202020
101010 222 555 111
000444
---222 00 22 44 666 888 111000 111222Time (hours)TiTime (hours)me (hours)
Figure 2 Individual concentrations of noradrenaline levels are shown for common carp and trout during stepwise hypoxia Details as in figure 1 Data from Vianen 1999
Comparing figure 1 with figure 2 it follows that the individuals with the highest plasma lactate levels are associated with the highest plasma NA levels and vice versa This positive coupling was tested for significance with a nonparametric ranking test and resulted both in case of a two-tailed and a one-tailed test in a significant (Plt005) correlation between these compounds Similarly in trout especially the marked increase in plasma lactate in the non-surviving trout is accompanied by strong elevations in both ADR and NA In this fish species a significant correlation was found between the lactate and ADR levels The correlation between the lactate concentration and catecholamine levels provides strong indications that these stress hormones play in fish an important regulatory function in the activation of anaerobic metabolism during hypoxia
92
Response of cannulated carp and trout to chronic hypoxia
For chronic hypoxia the animals were exposed to oxygen levels above the critical PO2 From the stepwise hypoxia exposure data on lactate and noradrenaline it is obvious that PO2 for carp and trout of respectively 30 and 40 should be above lethal This is because in most fish under these conditions recovery could be observed The 40AS levels proved however lethal for some trout This is likely due to the fact that trout can be extremely active during escape reactions after which recovery becomes impossible In figure 3 plasma FFA levels of carp and trout are shown over a hypoxia period of 48h Both in carp and trout exposure to chronic hypoxia resulted in markedly decreased plasma FFA levels stabilizing around new steady state levels during the whole hypoxia period (Figure 3) With respect to carp a reduction in plasma [FFA] from circa 05 mmol l-1 to 01-04 mmol l-1 has been earlier observed during an exposure of several hours to deep hypoxia (Farkas 1967 ab Mazeaud 1973 Van Raaij et al 1996a) These data however show that FFA levels in carp can fall to much lower levels (about 005 mmol l-1) when exposed to a longer period (48 hours) In contrast to previous publications (Mazeaud 1973 Plisetskaya 1980 Van Raaij et al 1996a) we observed with rainbow trout also a marked reduction of plasma [FFA] during hypoxia
The continuously reduced FFA levels were accompanied with significant amounts of both adrenaline and noradrenaline in carp and trout during prolonged hypoxia (Figure 4) With respect to adrenaline there was a transient increase (factor 12) in carp at the beginning of the hypoxia period while in HT-trout a similar transient increase was observed after 24 hours In contrast both in carp and trout NE levels remarkably increased (by about factor 35) remaining at these elevated levels during the whole hypoxia period The permanently increased NE levels are in contrast to the transient changes observed with catecholamines so far (Perry and Reid 1994 Van Raaij et al 1996a) and suggest an important regulatory function for NE during prolonged hypoxia Van Raaij et al (1995) have demonstrated that stress-free infusion of NE in carp resulted in a reduction of FFA levels providing strong indications that NE is responsible for the FFA reduction during hypoxia It was hypothesized by the same authors that the NE-induced reduction of plasma [FFA] is due to a reduction of lipolytic rates most probable in the adipose tissue Indeed recent experiments with isolated adipocytes showed that the release of FFA decreases dose-dependently during exposure to increasing concentrations of NE which surprisingly is mediated through stimulation of β-adrenoceptors (Vianen et al 2002) This is in sharp contrast to the mammalian situation where both noradrenaline and adrenaline are known to be potent activators of lipolysis via β-stimulation (Scheurink et al 1989 Connacher et al 1991 Germack et al 1997 Mills 2000) Thus the chronically increased NE levels were correlated with the chronically reduced FFA levels in both carp and trout This suggests that noradrenaline has an important function in controlling lipid catabolism in fish
93
Time (hours) -2 0 2 4 6 8 10 12 24 36 48
mm
olL
00
01
02
03
04
05
06
ampampampamp
80 20
ampampamp ampamp
Time (hours) -2 0 2 4 6 8 10 1224 36 48
mm
olL
-04
-03
-02
-01
00
01
02
amp ampamp
80 40
amp
Carp
Trout
Time (hours)-2 0 2 4 6 8 10 1224 36 48
mm
olL
00
01
02
03
04
05
06
ampampampamp
80 20
ampampampampamp
Time (hours)-2 0 2 4 6 8 10 1224 36 48
mm
olL
00
01
02
03
04
05
06
ampampampamp
80 20
ampampampampamp
Time (hours)-2 0 2 4 6 8 10 1224 36
Ti48
mm
olL
-04
-03
-02
-01
00
01
02
ampampamp
80 40
amp
me (hours)-2 0 2 4 6 8 10 1224 36 48
mm
olL
-04
-03
-02
-01
00
01
02
ampampamp
80 40
amp
Carp
Trout
Figure 3 Plasma concentrations of free fatty acids (FFA) in common carp and trout during normoxia (n=7 open circles) and prolonged hypoxia (n=8 closed circles) For carp the oxygen concentration in the water decreased over a period of 220 h from 80 air saturation to 20 AS for trout it was reduced to 40 AS Values are expressed as mean plusmn SEM significant differences (Plt005) with normoxic carp are indicated by a single asterisk () with the initial value (t= 0 h) by a double asterisk () and both by the amp sign Data from Vianen 1999
94
Time (hours) -2 0 2 4 6 8 10 12 24 36 48
ng m
l
0
2
4
6
8
10
12
14
16 80 20
amp
ampamp ampamp
amp ampamp
amp
Time (hours) -2 0 2 4 6 8 10 12 24 36 48
ng m
l
0
2
4
6
8
10
12
14
16 80 40
amp ampampampamp
amp
amp
amp
amp
amp amp
ampamp
amp
Carp
Trout
Time (hours)-2 0 2 4 6 8 10 1224 36 48
ng m
l
0
2
4
6
8
10
12
14
1680 20
amp
ampampampamp
ampampamp
amp
Time (hours)-2 0 2 4 6 8 10 1224 36 48
ng m
l
0
2
4
6
8
10
12
14
1680 20
amp
ampampampamp
ampampamp
amp
Time (hours)-2 0 2 4 6 8 10 12 24 36 48
ng m
l
Ti
0
2
4
6
8
10
12
14
1680 40
amp ampampampamp
amp
amp
amp
amp
ampamp
ampamp
amp
me (hours)-2 0 2 4 6 8 10 12 24 36 48
ng m
l
0
2
4
6
8
10
12
14
1680 40
amp ampampampamp
amp
amp
amp
amp
ampamp
ampamp
amp
Carp
Trout
Carp
Trout
Figure 4 Plasma concentrations of noradrenaline in carp and rainbow trout during normoxia (n=6 open circles) and prolonged hypoxia (n=9) Four trout were hypoxia sensitive (open triangles) Values are expressed as means plusmn SEM Details as in Figure 3 Data from Vianen 1999
Adrenergic control of lipid metabolism in-vivo studies
To determine the receptor type we carried out infusion experiments with cannulated carp using different salines (Van den Thillart et al 2001) In the first series we tested the involvement of α2-adrenoceptors The animals were infused for 15h with noradrenaline noradrenaline + yohimbine (α2-antagonist) and clonidine (α2- agonist) Upon infusion with noradrenaline plasma glucose levels began to rise and FFA levels fell reaching +60 for glucose and -50 for FFA at about 2h after the onset When the animals were pretreated with yohimbine the glucose response did not differ but the decline of FFA was retarded Thus during infusion with noradrenaline FFA only decreased by about 10 The same inhibition as without yohimbine was reached after five hours suggesting that the effect of yohimbine diminishes in a few hours Infusion with the α2-agonist clonidine however resulted in a transient 10 decline of plasma FFA independent of the applied concentration This would suggest that α2-adrenoceptors are indirectly involved possibly via an effect on tissue perfusion Infusion of isoproterenol (non-selective β-agonist) according to the same protocol as with noradrenaline (Van den
95
Thillart et al 2001) showed a similar stimulation of glucose release but inhibition of FFA release of the same magnitude and speed as with noradrenaline This unexpected result suggests that the direct inhibitory action of noradrenaline on lipolysis is mediated by β-adrenoceptors and not via α2-adrenoceptors To determine the type of β-adrenoceptor involved we applied ICI-118551 (β2-antagonist) or atenolol (β1-antagonist) in combination with isoproterenol The strong increase of plasma glucose by isoproterenol appeared to be attenuated by both antagonists in the same way the peak value was about 10 lower and the control levels were reached three hours earlier six instead of nine hours after the onset of infusion This suggests that β-receptor stimulation of glycogenolysis (in the liver) is mediated by both β1- and β2-adrenoceptors A different picture was observed with plasma FFA levels the decline of plasma FFA by isoproterenol was more pronounced in the presence of ICI-118551 while the administration of atenolol even caused an increase of plasma FFA levels (Figure 2) This result suggests that there are two opposite actions on FFA release The stronger decline after pretreatment with ICI-118551 reveals an inhibitory action of β1-adrenoceptors presumably located on cell membranes of adipose tissues The opposite effect of atenolol showing an increase of plasma FFA by isoproterenol suggests that β2-adrenoceptors (possibly located on liver cells) may stimulate lipolysis
Adrenergic control of lipid metabolism in-vitro studies
The difficulty with using whole fish is that catecholamines may alter the levels of other circulating hormones and that catecholamine turnover in the circulation is rapid Furthermore the responses of the different fat storing tissues including the liver may be different This problem is prevented when using isolated fat or liver tissue or isolated adipocytes and hepatocytes Migliorini et al (1992) investigated lipolysis in adipose tissue slices of fish toad and snake Remarkably basal rates were much lower than those of mammals Catecholamines had however no effect on lipolysis in fish and toad adipose tissue Adrenaline decreased lipolysis in snake adipose tissue while glucagon had a clear lipolytic effect on snake both in-vivo and in-vitro The release of FFA from all adipose preparations was stimulated by cAMP xanthine derivatives and phosphodiesterase-inhibitors Lipolysis was also stimulated by fluoride and forskolin which also increased cAMP levels These results suggesting that lipolysis is mediated via phosphorylation of a lipase did not support Farkas idea that lipase is not regulated by cAMP (Farkas 1969b)
The advantage of working with isolated cells instead of chopped adipose tissue is that the influence of damaged cells is negligible and that reproducible incubations from the same source can be made to study concentration dependent effects of different agonists and antagonists To verify the hypothesis that β-adrenoceptor stimulation leads to inhibition of lipolysis in adipose tissue we carried out experiments with isolated adipocytes from tilapia (Oreochromis mossambicus) mesenteric fat tissue (Vianen et al 2002) The paper of Vianen et al (2002) was the first to show in-vitro lipolysis in isolated fish adipocytes Zhou et al (1996) described the histology and size range of Atlantic salmon adipocytes Christiansen et al (1985) describing glucose uptake studies pointed to the fragility of adipocytes isolated from trout adipose tissue Their adipocytes could not be incubated much longer than 4 minutes The procedure of Vianen et al however allows incubations for 5 hours in some cases overnight incubations were even performed A general draw-back of working with lipolysis in fish adipose tissue appears the large variability in FFA release The basal lipolytic rates in teleost fish range from 2-1500 nmolesh106 cells In catfish (Clarias (Clarias gariepinus) trout and seabream the basal lipolytic rates were about 650 130 and 2 nmolh106 cells respectively (Van Heeswijk Van den Thillart and Vianen unpublished results) whereas in tilapia values of about 1500 nmolesh106 cells were found (Vianen et al 2002) The values are dependent on age season nutritional condition and
96
also on the level of maturation Basal lipolytic rates observed in mammals range between 50-150 nmolh106 cells Published rates are 65-100 nmolh106 cells for rat (Hollenga et al 1991 Germack et al 1997) 150 nmolh106 cells for sheep (Cochrane and Rogers 1990) 150 nmolh106 cells for pig (Mills 2000) and 65 nmolh106 cells for human (Hollenga et al1991) These rates are relatively low compared with the values obtained from fish adipocytes especially in view of the higher incubation temperature (37degC) with mammalian adipocytes On the other hand β-receptor stimulation in mammals leads to a strong increase of lipolysis reaching maximum rates of 2000-40000 nmolh106
cells (Hollenga et al1991 Mills 2000 Germack et al 1997) which are 10-100 fold higher than those observed with teleosts
The paper of Vianen et al (2002) confirmed that noradrenaline reduces the FFA release of adipocytes dose-dependently which became significant at concentrations of ge1μM Co-incubation of noradrenaline with phentolamine (α12-antagonist) showed no effect indicating that no α-adrenoceptor is involved On the other hand co-incubation with timolol (β12-antagonist) showed that the anti-lipolytic effect of noradrenaline was caused by β-adrenoceptor stimulation in sharp contrast to the situation in mammals (Galitzky et al 1995 Mills 2000) We also found evidence for inhibitory β3-adrenoceptors which are activated at concentrations of isoproterenol ge10 μM and by the selective β3-adrenoceptor agonist BRL 35135 (Vianen et al 2002) A possible function for those receptors is a safety valve at high catecholamine concentrations that are found during hypoxia lipolyic activity becomes arrested This finding was the first report of a functional β3-adrenoceptors in fish Thus far no reports are known of an inhibitory β3-adrenoceptor Nickerson et al (2003) cloned β-adrenoceptor genes of trout and found that two were homologous with mammalian β3-adrenoceptors In a detailed study they showed two subtypes in trout a β3-a and a β3-b form The first expressed predominantly in gill and heart and the latter exclusively in erythrocytes Binding studies suggested that the β3-adrenoceptor in erythrocytes is involved in sodiumproton exchange the function of this adrenoceptor in the other tissues remains to be resolved With respect to the β-adrenoceptors on adipocyte membranes we could confirm with trout catfish and sea bream the inhibitory effect on lipolysis (van Heeswijk Van den Thillart Vianen unpublished results) This suggests a general mechanism in teleost fish
Contrary to the observations by Migliorini et al (1992) with fat tissue from the adult male tigerfish (Hoplias malabaricus) exposure of tilapia adipocytes to increasing concentrations of isobutyl-methylxanthine (IBMX) and forskolin resulted in a marked reduction of FFA-release (Vianen and Van den Thillart unpublished results) These results suggest a cAMP-dependent inhibition of TG lipase activity which is the opposite from the transduction mechanism in mammals The observation that Migliorini et al (1992) found an increase in lipolytic activity may be due to the (very) high concentrations of IBMX and forskolin which were applied 10 and 01 mM respectively So fish adipocytes have β-adrenoceptors which upon activation reduce lipolysis via a cAMP mediated mechanism Liver slices of coho salmon incubated in vitro (Sheridan 1987) release fatty acids upon stimulation by 1 μM noradrenaline but not by adrenaline Also isoproterenol (β-receptor agonist) stimulated FFA release The lipolysis occurred at a 3 to 1 ratio of FFA and glycerol respectively The effects of noradrenaline and isoproterenol could be blocked by propranolol (β-receptor antagonist) but not by phentolamine (α-receptor antagonist) prazosin (α1- receptor antagonist) and yohimbine (α1-receptor antagonist) This shows that lipolysis in the salmon liver is activated through β-adrenoceptors In a recent study with trout hepatocytes (van Heeswijk et al unpublished) we could demonstrate that lipolysis is activated by β2-adrenoceptors
97
CONCLUSIONS
There is overwhelming evidence that lipid mobilization is differently organized in fishes compared to mammals In general it appears that lipolysis in mammals is strongly activated by catecholamines via β-adrenoceptors (figure 5) while in fishes lipolysis is mostly inhibited In mammals some inhibition may occur via α2-adrenoceptors The basal lipolytic rates in fish are sometimes barely measurable which may compromise the effect of controlling hormones This pattern is related to the changing needs for storage and mobilization in fishes lipids are stored in different locations and mobilized differentially for maturation migration and long periods of starvation The fat storage near and in red muscle forms a very short transport route to the muscle This obscures FFA turnover measurements The FFA concentrations per se do not provide an indication about lipolysis However assuming a fast response on catecholamine release the fall in oxidation capacity due to oxygen shortage will be slower than the inhibition on HSL Thus this will in general lead to a lowering of the plasma FFA levels
The oxygen content of water is some 30 times lower than that of air in addition oxygen diffusion rates in water are much lower than those in air (800 times) and this makes water-breathers very sensitive to changes in oxygen content Actually water can become hypoxic or even anoxic in a few hours under certain conditions Since hypoxia is a generally occurring phenomenon it may be expected that fish are better adapted to hypoxia than mammals Between fish species the tolerance to hypoxia varies greatly and some species have developed unorthodox metabolic pathways and behaviour in order to survive extreme hypoxicanoxic conditions (Van den Thillart and van Waarde 1985) During normoxic conditions lipids and amino acids are the major fuels for the energy metabolism in teleost fish whereas carbohydrates become important during anaerobic conditions such as burst activity and hypoxia (Van den Thillart and van Raaij 1995) In mammals ischemia and severe hypoxia results in membrane damage This damage is mainly caused by the accumulation of amphiphiles such as fatty acids and the intermediates of β-oxidation Fatty acids are amphipatic molecules and are known to destabilize biomembranes (Hoekstra and Golovina 2002 Katz and Messineo 1981 Huumltter and Sobol 1992) The flux through β-oxidation is high particularly in mammalian heart muscle during normoxic conditions (Van der Vusse et al 1983) Due to inhibition of the lipid oxidation fatty acids and their metabolites will accumulate rapidly (Moore 1985) In addition hypoxia gives always rise to a massive release of catecholamines In mammals these hormones cause a strong activation of lipolysis Thus the combination of catecholamine-induced lipolysis and strongly reduced capacity to oxidize fatty acids results in a fast and major accumulation of fatty acids and intermediates of the β-oxidation Severe ischemia and hypoxia may lead to a marked depletion of the phosphorylation potential resulting in ion rearrangements in particular in Ca++-influx (Weiss et al 1992 Kidooka et al 1987) Increased Ca++-influx results in turn in activation of phospholipases and consequently in membrane leakage (Hochachka 1985 Kidooka et al 1987 Prasad et al 1991) The above processes ultimately lead to cell damage and to leakage of intracellular enzymes (such as LDH and CK) into the circulation While hypoxia in mammals is considered as a pathological condition this is not the case for (water-breathing) fishes Actually hypoxiaanoxia induced membrane damage does not occur in fish even after near lethal exposures (Van Raaij et al 1994a) So obviously fish including salmonids are better protected against hypoxia than most mammals Since hypoxic conditions are common for water-breathers it is assumed that catecholamine induced inhibition of lipolysis is a strategy by which fishes are able to prevent accumulation of amphipatic molecules and hence membrane damage
In fish we observed low lipolytic rates combined with inhibiting effect of catecholamines on lipolysis in adipose tissue The transduction mechanism of inhibition appears to be cAMP dependent and mediated via activation of β1- and possibly also β3- adrenoceptors From in-vivo measurements in carp it appears that β2- adrenoceptor activation results in activation of lipolysis in the liver (Van den
98
Thillart et al 2001) Activation of lipolyis in trout liver (Sheridan 1987) and inhibition of lipolysis in tilapia adipocytes (Vianen et al 2002) via β-adrenoceptors has been described These opposite effects may explain the variable results obtained in the past Further research focused on the expression of HSL in the different fat depots and the hormone sensitivity of these depots for lipolysis should be the next step in resolving the problems related to the regulation of lipolysis in fish
Figure 5 Model showing the action of α2- and β-adrenoceptors on the membrane bound adenylate cyclase The α2-adrenoceptors bind to inhibiting G-proteins and the β-adrenoceptors to stimulating G-proteins The interaction between the two adrenoceptors determines the activity of TG-lipase
REGULATION OF LIPOLYSISREGULATION OF LIPOLYSIS
ADRADR
β
GS AC+
ATP cAMP PKA+
Fat cell membrane
Gi
-α2
NA
β
GSAC+
ATP cAMP PKA+
Fat cellmembrane
Gi
-α2
NA
TG LIPASETG LIPASE
MAMMALIANMAMMALIAN
SYSTSY EMSTEM TG GLYCEROLTG GLYCEROLFFAFFA
99
REFERENCES
Bohus B RF Benus DS Fokkema JM Koolhaas C Nayakas GA van Oortmerssen AJA Prins AJH de Ruiter AJW Scheurink and AB Steffens 1987 Neuroendocrine states and behavioral and physiological stress responses Progress in Brain Research 72 57-70
Boutilier RG G Dobson U Hoeger and DJ Randall 1988 Acute exposure to graded levels of hypoxia in rainbow trout (Salmo gairdneri) metabolic and respiratory adaptations Respiratory Physiology 71 69-82
Brighenti L AC Puviani MC Gaviolo E Fabbri and C Ottolenghi 1991 Interaction of salmon glucagon glucagon-like peptide and epinephrine in the stimulation of phosphorylase a activity in fish isolated hepatocytes General and Comparative Endocrinology 82 131-139
Christiansen DC L Skarstein and L Klungsoslashyr 1985 Uptake studies in adipocytes isolated from rainbow trout (Salmo gairdnerii) A comparison with adipocytes from rat and cat Comparative Biochemistry and Physiology 82A 201-205
Cochrane W and MP Rogers 1990 Sensitivity of freshly isolated ovine adipocytes to inhibition of lipolysis by insulin Comparative Biochemistry and Physiology 96B 331-333
Connacher AA WM Bennet RT Jung DM Bier CCT Smith CM Scrimgeour MJ Rennie 1991 Effect of epinephrine infusion on fatty acid and glucose turnover in lean and obese human subjects in the post-absorptive and fed states Clinical Science 81 635-644
Dalla Via J G Van den Thillart O Cattani and A De Zwaan 1994 Influence of long-term hypoxia exposure on the energy metabolism of Solea solea II Intermediary metabolism in blood liver and muscle Marine Ecology Progress Series 111 17-27
Danulat E and TP Mommsen 1990 Norepinephrine A potent activator of glycogenolysis and gluconeogenesis in rockfish hepatocytes General and Comparative Endocrinology 78 12-22
Dunn JF and PW Hochachka 1986 Metabolic responses of trout (Salmo gairdneri) to acute environmental hypoxia Journal of Experimental Biology 123 229-242
Dunn JF and PW Hochachka 1987 Turnover rates of glucose and lactate in rainbow trout during acute hypoxia Canadian Journal of Zoology 65 1144-1148
Eros SK and CL Milligan 1996 The effect of cortisol on recovery from exhaustive exercise in rainbow trout (Oncorhynchus mykiss) Potential mechanisms of action Physiology Zoology 69 1196-1214
Fabbri E A Capuzzo and TW Moon 1998 The role of circulating catecholamines in the regulation of fish metabolism An overview Comparative Biochemistry and Physiology C 120 177-192
Farkas T 1967a The effect of catecholamines and adrenocorticotropic hormone on blood and adipocyte tissue FFA levels in the fish Cyprinus carpio L Progress in Biochemistry Pharmacology 3 314-319
100
Farkas T 1967b Examinations of fat metabolism in freshwater fishes The sympathetic nervous system and mobilisation of fatty acids Annual Inst Biology Hungarian Academy of Science 34 129-138
Farkas T 1969b Effects of agents modifying the level of 3-5-adenosine monophosphate in adipose tissue on mobilization of fats in fish and frogs Annual Inst Biology Hungarian Academy of Science 36 163-171
Galitzky J C Carpene A Bousquet-Melou M Berlan and M Lafontan 1995 Differential activation of beta(1)- beta(2)- and beta(3)-adrenoceptors by catecholamines in white and brown adipocytes Fundamental Clinical Pharmacology 9 324-331
Germack R AB Starzec R Vassy and GY Perret 1997 β-Adrenoceptor subtype expression and function in rat white adipocytes Br Journal of Pharmacology 120 201-210
Glass ML NA Andersen M Kruhoffer EM Williams and N Heisler 1990 Combined effects of environmental PO2 and temperature on ventilation and blood gases in the carp (Cyprinus carpio L) Journal of Experimental Biology 148 1-17
Greene DHS and DP Selivonchick 1987 Lipid metabolism in fish Progress in Lipid Research 26 53-85
Henderson RJ and DR Tocher 1987 The lipid composition and biochemistry of freshwater fish Progress in Lipid Research 26 281-347
Hochachka PW 1985 Assessing metabolic strategies for surviving O2-lack role of metabolic arrest coupled with channel arrest Molecular Physiology 8 331-350
Hoekstra FA and EA Golovina 2002 The role of amphiphiles Comparative Biochemistry and Physiology A 131 527-533
Hollenga Ch M Haas JT Deinum and J Zaagsma 1991 Differences in functional cyclic AMP compartments mediating lipolysis by isoprenaline and BRL 37344 in four adipocyte types European Journal of Pharmacology 200 325-330
Huumltter JF and S Sobol 1992 Role of fatty acid metabolites in the development of myocardial ischemic damage International Journal of Biochemistry 24 399-403
Itazawa Y and T Takeda 1978 Gas exchange in the carp gills in normoxic and hypoxic conditions Respiratory Physiology 35 263-269
Janssens PA and J Waterman 1988 Hormonal regulation of gluconeogenesis and glycogenolysis in carp (Cyprinus carpio) liver slices cultured in vitro Comparative Biochemistry and Physiology 91A 451-455
Jones DR DJ Randall and GM Jarman 1970 A graphical analysis of oxygen transfer in fish Respiratory Physiology 10 285-298
101
Joslashrgensen JB and T Mustafa 1980 The effect of hypoxia on carbohydrate metabolism in flounder (Platichthys flesus L) I Utilization of glycogen and accumulation of glycolytic end products in various tissues Comparative Biochemistry and Physiology 67B 243-248
Katz AM and FC Messineo 1981 Lipid-membrane interactions and the pathogenesis of ischemic damage in the myocardium Circulation Research 48 1-12
Kidooka M M Matsuda and J Handa 1987 Effect of calcium antagonist and agonist on free fatty acid liberation in the ischemic brain of rats Surgical Neurology 28 41-45
Lafontan M and M Berlan 1993 Fat cell adrenergic receptors and the control of white and brown cell function Journal of Lipid Research 34 1057-1083
Lomholt JP and K Johansen 1979 Hypoxia acclimation in carp How it affects O2 uptake ventilatishyon and O2 extraction from water Physiological Zoology 52 38-50
Mazeaud F 1973 Recherches sur la regulation des acides gras libres plasmatiques et de la glycemie chez les poissons Thesis Paris
Migliorini RJ Lima-Verde JS Machado CR Cardona GMP Garofalo MAR and Kettelhut IC 1992 Control of adipose tissue lipolysis in ectotherm vertebrates American Journal of Physiology 263 R857-862
Mills S 2000 Beta-adrenergic receptor subtypes mediating lipolysis in porcine adipocytes Studies with BRL-37344 a putative β3-adrenergic agonist Comparative Biochemistry and Physiology 126C 11-20
Moore K 1985 Fatty acid oxidation in ischaemic heart Molecular Physiology 8 549-565
Nickerson JG SG Dugan G Drouin SF Perry TW Moon 2003 Activity of the unique beta-adrenergic Na+H+ exchanger in trout erythrocytes is controlled by a novel beta3-AR subtype American Journal of Physiology 285 R526-535
Perry SF and CM Wood 1989 Control and coordination of gas transfer in fishes Canadian Journal of Zoology 67 2961-2970
Perry SF and S G Reid 1994 The effects of acclimation temperature on the dynamics of catecholamine release during acute hypoxia in the rainbow trout Oncorhynchus mykiss Journal of Experimental Biology 186 289-307
Plisetskaya E 1980 Fatty acid levels in the blood of cyclostomes and fish Environmental Biology of Fishery 5 273-290
Prasad MR LM Popescu II Moraru X Liu S Maity RM Engelman and DK Das 1991 Role of phospholipases A2 and C in myocardial ischemic reperfusion injury American Journal of Physiology 29 H877-883
102
Prinzen FW GJ Van der Vusse T Arts THM Roemen W Coumans and RS Reneman 1984 Accumulation of non-esterified fatty acids in ischemic myocardium American Journal of Physiology 247 H264-272
Puviani AC C Ottolenghi ME Gaviolli E Fabbri and L Brighenti 1990 Action of glucagon and glucagon-like peptide on glycogen metabolism of trout isolated hepatocytes Comparative Biochemistry and Physiology 96B 387-391
Randall DJ and SF Perry 1992 Catecholamines In Fish Physiology vol XIIB (ed DJ Randall and WS Hoar) pp 255-300
Reid SG NJ Bernier and SF Perry 1988 The adrenergic stress response in fish control of catecholamine storage and release Comparative Biochemistry and Physiology C 120 1-27
Scheurink AJW AB Steffens H Bouritius GH Dreteler R Bruntink R Remie and J Zaagsma 1989 Sympathoadrenal influence on glucose FFA and insulin levels in exercising rats American Journal of Physiology 256 R161-168
Sheridan MA 1987 Effects of epinephrine and norepinephrine on lipid mobilization from coho salmon liver incubated in vitro Endocrinology 120 2234-2239
Sheridan MA 1988 Lipid dynamics in fish aspects of absorption transportation deposition and mobilization Comparative Biochemistry and Physiology 90B 697-690
Sheridan MA 1994 Mini Review Regulation of lipid metabolism in poikilothermic vertebrates Comparative Biochemistry and Physiology 107B 495-508
Sheridan MA and NA Muir 1988 Effects of epinephrine and norepinephrine on glucose release from chinook salmon (Oncorhynchus tshawytscha) liver incubated in vitro Journal of Experimental Zoology 248 155-159
Soivio A K Nyholm and K Westman 1975 A technique for repeated sampling of blood of individual resting fish Journal of Experimental Biology 63 207-217
Thomas S and SF Perry 1992 Control and consequences of adrenergic activation of red blood cell Na+H+ exchange on blood oxygen and carbon dioxide transport in fish Journal of Experimental Zoology 263 160-175
Van den Thillart G 1982 Adaptations of fish energy metabolism to hypoxia and anoxia Molecular Physiology 2L 49-61
Van den Thillart G and A van Waarde 1985 Teleosts in hypoxia aspects of anaerobic metabolism Molecular Physiology 8 393-411
Van den Thillart G J Dalla Via G Vitali and P Cortesi 1994 Influence of long-term hypoxia exposure on the energy metabolism of Solea solea I Critical O2 levels for aerobic and anaerobic metabolism Marine Ecology Progress Series 104 109-117
103
Van den Thillart G and M van Raaij 1995 Endogenous fuels non-invasive versus invasive approaches In Biochemistry and molecular biology of fishes Vol 4 pp 33-63 Edited by Hochachka amp Mommsen Academic Press New York NY
Van den Thillart GEEJM GJ Vianen M Campos-Ponze H Lelieveld M Nieveen M van Raaij A Steffens and J Zaagsma 2001 Differential role of adrenoceptors in the control of plasma glucose and fatty acids in carp Cyprinus carpio (L) American Journal of Physiology 281 R615-624
Van den Thillart G GJ Vianen and J Zaagsma 2002 Adrenergic regulation of lipid mobilization in fishes a possible role in hypoxia survival Fish Physiology and Biochemistry 27 189-204
Van der Boon J GEEJM Van den Thillart and ADF Addink 1991 The effects of cortisol administration on intermediary metabolism in teleost fish Comparative Biochemistry and Physiology 100A 47-53
Van der Vusse GJ THM Roemen W Flameng and RS Reneman 1983 Serum myocardium gradients of non-esterified fatty acids in dog rat and man Biochimica et Biophysica Acta 752 362-370
Van Dijk PLM GEEJM Van den Thillart PHM Balm and SE Wendelaar Bonga 1993 The influence of gradual water acidification on the acidbase status and plasma hormone levels in carp Journal of Fish Biology 42 661-671
Van Ginneken VJT ADF Addink GEEJM Van den Thillart F KOumlrner L Noldus and M Buma 1997 Metabolic rate and level of activity determined in tilapia (Oreochromis mossambicus Peters) by direct and indirect calorimetry and videomonitoring Thermochimica Acta 291 1-13
Van Raaij MTM E Bakker MC Nieveen H Zirkzee and GEEJM van den Thillart 1994a Energy status and free fatty acid patterns in tissues of common carp (Cyprinus carpio L) and rainbow trout (Oncorhynchus mykiss L) during severe oxygen restriction Comparative Biochemistry and Physiology 109A 755-767
Van Raaij MTM GEEJM van den Thillart M Hallemeesch PHM Balm and AB Steffens 1995 The effect of arterially infused adrenaline noradrenaline and insulin on plasma hormones and the levels of glucose and free fatty acids in common carp (Cyprinus carpio L) American Journal of Physiology 268 R1163-1170
Van Raaij MTM DSS Pit PHM Balm AB Steffens and GEEJM van den Thillart 1996a Behavioral strategy and the physiological stress response in rainbow trout exposed to severe hypoxia Hormones and Behavior 30 85-92
Van Raaij MTM GJ Vianen and GEEJM Van den Thillart 1996b Blood gas parameters and the responses of erythrocytes in carp exposed to deep hypoxia and subsequent recovery Journal of Comparative Physiology 166B 453-460
104
Van Raaij MTM GEEJM Van den Thillart GJ Vianen DSS Pit PHM Balm and AB Steffens 1996c Substrate mobilization and hormonal changes in rainbow trout (Oncorhynchus mykiss L) and common carp (Cyprinus carpio L) during deep hypoxia and subsequent recovery Journal of Comparative Physiology 166B 443-452
Vianen GJ 1999 Hormonal control of energy metabolism in teleost fish during hypoxia Thesis Leiden
Vianen GJ PP Obels GEEJM van den Thillart and J Zaagsma 2002 β-Adrenoceptors mediate inhibition of lipolysis in adipocytes of tilapia (Oreochromis mossambicus) American Journal of Physiology 282 E318-325
Weiss JN N Venkatesh and ST Lamp 1992 ATP sensitive K+-channels and cellular K+ loss in hypoxic and ischemic mammalian ventricle Journal of Physiology 447 649-673
Wendelaar Bonga SE 1997 The stress response in fish Physiological Reviews 77 591-625
White A and TCFletcher 1989 The effect of physical disturbance hypoxia and stress hormones on serum components of the plaice Pleuronectus platessa Comparative Biochemistry and Physiology 93A 455-461
Wright PA SF Perry and TW Moon 1989 Regulation of hepatic gluconeogenesis and glycogenolysis by catecholamines in rainbow trout during environmental hypoxia Journal of Experimental Biology 147 169-188
Wurm TH and C Albers 1989 Interaction of allosteric effectors (ATP CO2 H+) modulating oxygen affinity of the hemoglobin in the carp (Cyprinus carpio) in vitro Journal of Comparative Physiology 159B 255-261
Zhou S RG Ackman and C Morrison 1996 Adipocyte and lipid distribution in the muscle tissue of Atlantic salmon (Salmo salar) Canadian Journal of Fisheries and Aquatic Science 53 326-332
105
106
THE INFLUENCE OF OXYGEN SHORTAGE ON THE DEVELOPMENT OF THE CARDIOVASCULAR SYSTEM IN ZEBRAFISH
Bernd Pelster10
ABSTRACT
Oxygen shortage typically elicits characteristic adaptations in the cardio - respiratory systems and in cellular metabolism as well documented in adult vertebrates Even embryonic and larval stages of fish for example respond to hypoxia Oxygen shortage can be the result of a reduced oxygen availability in the environment (= general environmental hypoxia) but it can also be the consequence of an increased oxygen demand in certain tissues exceeding the capacity of oxygen supply to the particular tissue (= functional locally restricted hypoxia)
In early embryonic stages of the zebrafish Danio rerio severe environmental hypoxia may cause developmental arrest Chronic exposure to mild hypoxia (PO2 = 10 kPa) however provoked an increase in heart rate as well as cardiac output at about hatching time or shortly thereafter A reduced hemoglobin oxygen-carrying capacity in the blood of zebrafish however did not induce any change in cardiac activity until 12-14 dpf Beyond 7 dpf animals raised under chronic hypoxia showed a significantly elevated red cell concentration in their blood and a redistribution of blood away from the gut to the segmental muscle tissue in the trunk region was observed A comparison of the vascular bed of various organs revealed no obvious differences in hypoxic animals compared to normoxic animals
Functional hypoxia achieved by chronic exposure of zebrafish larvae to a constant water current inducing an increase in swimming activity did not cause any adaptations in cardiac activity until 32 dpf Nevertheless critical PO2 in trained animals was reduced indicating an improvement of the oxygen transport system in these larvae In the muscle tissue an increase in mitochondrial density especially in red and intermediate muscle cells was observed At 32 dpf an increase in capillary density of the segmental muscle tissue as well as of the tail fin was detected in trained larvae and this correlated with an enhanced expression of VEGF in muscle tissue at this stage In gills and in the head region a stimulation of VEGF expression was already detectable at 15 dpf in trained animals
Taken together these results indicate that at about hatching time receptors are present which sense hypoxic conditions and this information can be used to stimulate convective oxygen transport in order to compensate for a reduction in bulk oxygen diffusion in the face of a reduced oxygen gradient between environmental water and tissues Erythropoiesis can be stimulated a few days after hatching The first modification of angiogenesis was detected at 32 dpf in trained fish VEGF expression suggests however that gill development might respond even earlier to the lack of oxygen
INTRODUCTION
In vertebrate embryos the heart is the first functional organ and with the onset of cardiac activity blood flow is observed very early in development Given the notion that the unfailing beat of the heart is necessary for life this observation may at first glance not be surprising The convective flow of blood through the circulation provides the ceaseless transport of the respiratory gases and nutrients
Institute for Zoology and Limnology and Center for Molecular Biosciences University of Innsbruck Austria 107
10
required by metabolism the waste products produced by metabolism and the hormonal cues that regulate metabolism and many other physiological functions This role of the circulation clearly is indisputable in adult vertebrates Within recent years many studies provided striking examples of the inaccuracy of this perspective with respect to the embryonic cardiovascular system Compelling evidence on many fronts revealed that the convective flow of blood generated by the early embryonic vertebrate heart is simply not required for transport of oxygen nutrients metabolic wastes or hormones all of which can be achieved entirely by diffusion (Burggren 2004 Pelster 2002 Territo and Altimiras 2001) In fact fish amphibian and even bird embryos lacking a functional heart can survive and develop for several days after fertilization
Thus the often expressed view that embryonic physiology merely is the physiology of adult animals but conducted on a smaller physical scale must be rejected The fact that in early developmental stages blood flow is not required for nutrient and respiratory gas transport implies that the coupling between metabolic activity of tissues and cardiac activity is not yet established during early development (Pelster 2002) This may be related to the observation that the autonomic nervous system gains control over the cardiovascular system only quite late during development in spite of the fact that histochemistry and neurophysiological experiments revealed that adrenergic and cholinergic receptors are present in cardiac muscle cells and in the central vascular system much earlier than the sympathetic or parasympathetic innervation is completed (Holeton 1971 Pappano 1977 Protas and Leontieva 1992) In these early stages cardiac activity and peripheral resistance obviously can be adjusted by various hormones (Fritsche 1997 Fritsche et al 2000 Kloberg and Fritsche 2002)
If in early developmental stages of fish and amphibians the cardiovascular system is not required for gas and nutrient supply to the tissues and is controlled in a different way as in adult animals the question arises how the embryos and larvae respond to changes in the environmental oxygen availability Do they notice environmental hypoxia Under hypoxic conditions when a reduced oxygen partial pressure gradient across the skin impairs cutaneous oxygen uptake convective oxygen transport maybe required in order to supply the tissues sufficiently
Conditions with a reduced oxygen availability can be achieved in several ways First of all environmental PO2 can drop resulting in a decrease in the PO2 gradient between the environment and the internal blood and tissues Second if the blood contributes to the oxygen supply to tissues a reduced oxygen supply can be achieved by reducing the oxygen carrying capacity of the blood ie by reducing the oxygen carrying capacity of the hemoglobin (hypoxemia) Thirdly the lack of oxygen can be achieved by increasing the oxygen demand of the tissues By stimulating muscular activity for example an increase in ATP turn over is induced which requires an additional supply with oxygen in order to generate ATP via the aerobic metabolism Chronic muscular activity thus may bring the oxygen transport pathway to its limits and cause oxygen shortage (= functional hypoxia)
Within recent years the effect of all three conditions has been tested in a couple of larval stages and in this study I would like to summarize our current knowledge about the influence of oxygen shortage on the development of the cardiovascular system in lower vertebrates especially in fish
108
THE EFFECT OF ENVIRONMENTAL HYPOXIA
Cardiac Activity
One possibility to test the capability of the cardiovascular system to cope with the lack of oxygen during development is to expose animals to varied environmental PO2 values (Fritsche and Burggren 1996 Orlando and Pinder 1995) Soon after fertilization fish eggs are surprisingly resistant towards a lack of oxygen Embryos of the Arctic charr (Salvelinus alpinus) exposed to anoxia for 8 hours at about 80 of embryonic development show a remarkable metabolic depression Metabolic activity assessed by measuring oxygen consumption as well as heat production is reduced to a few percent of control values and heart rate decreased by about 90 (Pelster 1999) Zebrafish embryos survive 24 hours of anoxia in a status of suspended animation in which cardiac activity ceases and mitotic activity of the blastomeres is arrested (Padilla and Roth 2001) The ability to survive anoxic conditions is restricted to very early stages however If the zebrafish embryos are exposed to anoxic conditions at about 30 h after fertilization less than 10 of the embryos were able to survive A significant decrease in heart rate and in cardiac output has been reported for very early stages of amphibians during periods of oxygen deficiency (Fritsche and Burggren 1996 Orlando and Pinder 1995 Pelster 1999) This decrease in activity has been attributed to a direct effect of the lack of oxygen on the metabolism of cardiomyocytes and it does not appear to be a controlled response which involves hormonal or neuronal activity (Orlando and Pinder 1995)
In Xenopus larvae a coordinated stimulation of cardiac activity in order to enhance convective oxygen transport during periods of hypoxia was only observed in later developmental stages (Orlando and Pinder 1995) In contrast to anoxia hypoxic conditions provoked a minor but significant tachycardia in salmonid larvae (Holeton 1971 McDonald and McMahon 1977) If the direct effect of hypoxia on cardiac muscle cells is a reduction in activity an increase in heart rate under these conditions must be due to an external stimulation which can only be explained as a coordinated response
In order to identify the point in development when cardiac activity becomes responsive to hypoxia and in order to question the importance of diffusional oxygen supply through the skin versus convective oxygen transport in the blood we raised zebrafish under normoxic and hypoxic conditions (PO2 = 10kPa prepared by equilibrating water with a mixture of air and N2 T = 28oC) We used zebrafish larvae because the small body size should facilitate diffusional oxygen transport and render convectional oxygen transport less important even in later developmental stages The results revealed that even in the small zebrafish larvae cardiac activity becomes responsive to environmental hypoxia already at about the time of hatching (Jacob et al 2002) In hypoxic incubated animals heart rate started to increase significantly compared to control animals at 4 dpf (Figure 1A) and cardiac output was significantly elevated at 34 and 5 dpf (Figure 1B) The comparison of systolic and end-diastolic ventricular volume revealed a significantly increased diastolic volume at 3 and 4 dpf but this increase did not persist on 5dpf The increase in cardiac output can only be explained as a coordinated response The reduction in water PO2 is detected by the animal and this information is used to stimulate cardiac activity
109
Figure 1 Heart rate (A) and cardiac output (B) in zebrafish larvae raised under normoxia (PO2 = 20 kPa) and under chronic hypoxia (PO2 = 10 kPa) at a temperature of 28oC n = 12 for 2 and 5 dpf 3 dpf n = 18 4 dpf n = 16 significantly different from controls (p lt 005) (Modified after (Jacob et al 2002))
The positive response to hypoxia in zebrafish is observed even earlier than in Xenopus larvae which is significantly larger than zebrafish Xenopus raised under normoxia (PO2 = 21 kPa) hypoxia (PO2 = 11 kPa) or under hyperoxia (PO2 = 35 kPa) until Nieuwkoop-Faber stage 51 showed no difference in oxygen uptake and in cardiac activity (Territo and Altimiras 1998 Territo and Burggren 1998) Thus fish larvae may respond to environmental hypoxia at an earlier stage than amphibian larvae Alternatively a PO2 of 11 kPa may not have been low enough to elicit a coordinated response in Xenopus larvae This explanation does not appear very likely however because for our experiments we used a similar PO2 of 10 kPa and this was very close to the lower threshold which permitted a complete development of zebrafish larvae without significantly increasing the rate of mortality
Blood Distribution
A redistribution of blood in response to different metabolic demands represents a well established physiological adaptation in many species While in zebrafish larvae raised under chronic hypoxia (10 kPa PO2) until 7 dpf no changes in blood distribution could be detected at 12 and 15 dpf blood perfusion was significantly higher in the muscle tissue of hypoxic animals than in control animals (Figure 2) In turn perfusion of the gut was significantly lower in hypoxic 12 dpf animals Brain perfusion was not affected by hypoxia (Schwerte et al 2003) Thus at 12 dpf under hypoxic conditions blood was shifted from the gut to the muscles in the tail region The so-called red-layer of muscle has been implicated in the uptake of oxygen in early larvae and at about the time of hatching (El-Fiky and Wieser 1988) Possibly blood is redistributed towards the muscle tissue in order to enhance oxygen uptake through the body surface under hypoxic conditions
110
Figure 2 Typical changes in erythrocyte cell count in zebrafish raised under control conditions (B D) and under chronic hypoxia (PO2 = 10 kPa AC) Red cell count per minute is given in false colors according to the calibration bat on the right side (From (Schwerte et al 2003) with permission)
Tissue Vascularization
In zebrafish larvae exposed to hypoxia no significant changes in the vascular bed were observed (Schwerte et al 2003) There appeared to be quite a high interindividual variation in the expression of small blood vessels like the parachordal vessels running longitudinally along the myoseptum or the caudal vascular tree but the overall morphometric analysis did not show significant differences between control and hypoxic animals Compared with the development of amphibians such as Xenopus or Rana or the development of salmonid larvae zebrafish development is very rapid and it could be that a rearrangement of the vascular bed is only possible in later developmental stages In a number of other vertebrates a stimulation of angiogenesis by hypoxic incubation has been demonstrated (Yue and Tomanek 1999) demonstrated that coronary vessels from cultured 6 day old quail embryo grow faster under hypoxic conditions while hyperoxia induced a delayed angiogenesis Chorioallantoic membrane capillarization of chicken embryos has been shown to increase during hypoxia (Dusseau and Hutchins 1988 Hudlicka et al 1992) In larval amphibians aquatic hypoxia stimulates growth of respiratory surfaces and enhances the transition from gill respiration to lung respiration (Burggren and Mwalukoma 1983) The lack in the angiogenetic response in hypoxic zebrafish is in line with the current concept of blood vessel formation in this species Weinstein and coworkers proposed that the initial wiring of blood vessels follows a fixed pattern and thus is largely based on the genetic information leaving little or no room for adaptations to environmental influences (Isogai et al 2003 Weinstein 1999) On the other hand molecular signals involved in the formation of blood vessels have been identified in early embryonic stages The molecular mechanisms which lead to the extremely regular pattern in the zebrafish trunk have been shown by (Childs et al 2002) and VEGF up- and down regulation seems to be involved in this process Whole mount in situ hybridization of zebrafish embryos indicated strong expression of VEGF already at 18 hours post fertilization (Gong et al 2004 Liang et al 1998 Liang et al 2001 Tan et al 2001 Weinstein 1999)
111
Red Cell Concentration
In mammals hypoxia usually causes an increase in oxygen transport capacity of the blood ie an increase in the number of circulating erythrocytes and in hemoglobin concentration Similar observations have been reported for embryos of the turtle Pseudemys nelsoni (Kam 1993) while in chicken embryos during early development a stimulation of red cell production was not observed (Baumann and Meuer 1992) In zebrafish larvae hypoxia increased red blood cell concentration larvae during the second week after fertilization while no effect was observed until 7dpf (Schwerte et al 2003) Until 7 dpf the concentration of red cells remained fairly constant in normoxic as well as in hypoxic animals The first presumptive proerythroblast-like cells can be detected in the zebrafish by the end of the first day (20 hpf) and this primitive cohort of cells originates in the intermediate cell mass (IMC) (Weinstein et al 1996) By tracing transfused fluorescence labeled blood cells into 15 day old host embryos these authors concluded that this first cohort of primitive red cells provides the embryo with all or nearly all red blood cells for at least 4 days A population of new larger and more adult appearing erythrocytes becomes predominant by 10 dpf The constant concentration of red cells observed in zebrafish until 7 dpf is in line with these results The elevated red cell concentration in 12 dpf larvae appears to be due to a hypoxic stimulation of erythropoiesis in zebrafish larvae as observed in fetal mammals (Richardson and Bocking 1998) for example or in embryos of the turtle Pseudemys nelsoni (Kam 1993) In this case the production of the second population of cells primarily observed at 10 dpf would have been stimulated by hypoxia
INFLUENCE OF A REDUCTION IN THE OXYGEN CARRYING CAPACITY (HYPOXEMIA)
A reduction in the oxygen carrying capacity of the blood can be achieved by impairing the oxygen binding of the hemoglobin Zebrafish have been incubated in an atmosphere containing CO and also in the presence of phenylhydrazine which oxidizes hemoglobin and thus reduces its oxygen binding capacity Zebrafish raised until 4 or 5 dpf under these conditions have a similar oxygen consumption compared to control animals (Pelster and Burggren 1996) Measurements of whole body lactate content did not provide any indication for a switch to anaerobic metabolism in the animals with a reduced oxygen carrying capacity until 12 dpf (Jacob et al 2002) Similar results have been reported for Xenopus larvae raised under chronic CO exposure until Nieuwkoop Faber stage 54 (Territo and Altimiras 1998 Territo and Burggren 1998)
A comparison of heart rate in zebrafish raised with a reduced oxygen carrying capacity with animals raised under control conditions overall revealed no significant differences until 15 dpf (Jacob et al 2002) At 15 dpf animals raised in the presence of phenylhydrazine had a reduced heart rate while heart rate of animals raised in the presence of CO was not different from controls Stroke volume was also hardly affected and accordingly cardiac output was hardly influenced except for the phenylhydrazin group at 15 dpf where deleterious effects of the drug increased the mortality of the larvae Thus hypoxemia did not stimulate cardiac activity until about two weeks after fertilization
112
HYPOXIA VERSUS HYPOXEMIA
Comparing the effect of hypoxemia on cardiac activity of zebrafish larvae with the effect of hypoxia it is apparent that hypoxemia does not stimulate cardiac activity but hypoxia does Under hypoxemia the PO2 gradient between the environmental water and the tissues is not different from normoxic conditions and thus bulk oxygen diffusion is sufficient to meet the oxygen requirements of the tissues Under hypoxia however the diffusion gradient of oxygen is reduced and even in the small zebrafish larvae (body weight less than 1 mg) this induces an increase in convective oxygen transport in order to compensate for the reduction in oxygen diffusion This clearly demonstrates that in zebrafish larvae at hatching time the afferent nervous system is able to sense hypoxic conditions Furthermore central control units are active and bring about a coordinated response to environmental perturbations (like oxygen deficiency) either by direct stimulation of the heart or by stimulation of hormone secreting cells like the chromaffin cells The secreted hormone in turn could then activate cardiac activity
An obvious conclusion from these considerations is that convective oxygen transport is not necessary in zebrafish larvae until about two weeks after fertilization if the PO2 gradient through the skin is normal If this gradient is reduced due to a decrease in environmental PO2 cardiac activity can be stimulated at about half a day or a day after hatching This appears to be even earlier than in the larger salmonid or Xenopus larvae where the hypoxic stimulation was not observed before 1 day after hatching or even later Thus the time in development at which a coordinated response of the ventricle becomes possible is not only governed by body mass Interesting and not yet completely explained is the observation of Territo and Altimiras (Territo and Altimiras 1998) that stroke volume and cardiac output are significantly enhanced in Xenopus laevis under chronic exposure to CO but not under hypoxia This is in clear contrast to the results reported for zebrafish larvae and the increase in cardiac output was only observed in very early stages of Xenopus not in later stages with a significantly larger body mass Territo and Altimiras concluded that the increase in cardiac output observed in embryonic stages was intrinsic in nature and did not significantly improve oxygen uptake In fact aerobic metabolism was similar in all experimental groups
THE INFLUENCE OF CHRONIC SWIMMING ACTIVITY
Hypoxic conditions can also result from an increased metabolic activity This is possible for example during periods of exercise where the increased activity of myosin ATPase significantly stimulates oxygen consumption of the muscle cells Swim training leads to a modification of growth rate and of food conversion efficiency in adult fish (Christiansen and Jobling 1990 Wieser et al 1988) To assess possible influences of chronic swimming activity on metabolism and growth of zebrafish larvae were trained in a swim tunnel system for about 15h every day at a water velocity of 5 blsec (Bagatto et al 2001) The training protocol had no influence on growth of the larvae although yolk absorption was significantly faster in animals exposed to a constant water current
An exciting observation was that compared to control animals free swimming larvae after 11 days of training between 21 dpf and 32 dpf had a higher MO2 at rest and a significantly lower rate of oxygen consumption in the swim tunnel at any given water velocity The higher rate of oxygen consumption at rest may be attributable to an increased activity level at rest The reduction in MO2 during activity however clearly shows that the efficiency of muscular contraction andor the efficiency of energy conversion have been improved in trained animals Furthermore training enhanced survival of larvae during exposure to low oxygen partial pressures (Bagatto et al 2001)
113
Exposure of early larval stages of zebrafish to a constant water current therefore induced physiological adaptations resulting in an enhanced swimming efficiency and in an increased tolerance towards hypoxia
A typical adaptation to endurance training is the so-called sports heart Cardiac activity of trained zebrafish larvae however showed no difference compared to untrained control animals in terms of heart rate stroke volume and cardiac output (Pelster et al 2003) Erythropoiesis was also not stimulated in trained animals Significant adaptations have been found at the tissue level In animals trained between 9 and 15 dpf and also in animals trained between 21 and 32 dpf mitochondrial density of red and intermediate muscle tissue was increased In adult fish like rainbow trout and Danube bleak sustained swim training can induce an increase in the aerobic capacity even in white muscle fibres (Davie et al 1986 Saumlnger and Poumltscher 2001) In zebrafish mitochondrial density of white muscle fibres of endurance and interval trained animals appeared to be higher as in untrained animals but this difference was not significant (Pelster et al 2003) It could well be that during this early stage of zebrafish development it is mainly the red and intermediate muscle portion recruited for the endurance swimming activity In mammals endurance exercise may even induce a fibre type transition in white muscle cells (Pette and Staron 2001) Such an adaptational change in white muscle fibres would enable the fish to use the more profitable aerobic pathways for energy production prevent local fatigue and enhance the removal of metabolic end products like lactate
In the older larvae total length of the tail fin blood vessels as well as the vascularization index of the axial tail muscle increased significantly after 11 days of continuous or interval swim training suggesting an improvement in the blood supply to the muscle cells (Figure 3) In larvae trained between 9 and 15 dpf angiogenesis was not enhanced (Pelster et al 2003) As in the older zebrafish larvae in adult rainbow trout (Davie et al 1986) and also in some cyprinid species like Chalcalburnus chalcoides mento Chondrostoma nasus and Leuciscus cephalus endurance exercise training has been shown to induce a significant increase in muscle capillarity (Saumlnger 1992 Saumlnger and Poumltscher 2001) These results indicate that angiogenesis is stimulated in fish during exercise training but this effect is not observed in very early developmental stages ie within the first two weeks of development in the zebrafish This is again in line with the idea that in the earliest developmental stages the wiring of blood vessels a fixed pattern and leaves little or no room for adaptations to environmental factors (Isogai et al 2003 Weinstein 1999) On the other hand if in zebrafish convective oxygen transport is not required to supply oxygen to the tissues until about two weeks after hatching it could also be that at this stage of development a modification of the vascular bed is not yet necessary
Perspectives The observation that the circulatory system of embryonic and early larval stages is not working in order to supply the tissue with oxygen and nutrients can be attributed to the small size of the larvae This implies however that the early larval circulatory system is not controlled the same way as the adult circulatory system Nevertheless recent data indicate that early developmental stages can sense their environment and via hormonal control cardiovascular activity can modified in response to environmental information In addition the patterning of the cardiovascular system can be influenced by environmental parameters Accordingly functional development is not only controlled by genetic information but it appears to be responsive to environmental input Thus studying development in the light of genetic and environmental constituents appears to be a promising task
114
Figure 3 A Capillary length measured in the tail fin in control animals and in interval or continuously trained animals N = 9 B Vascularization index determined in the axial muscle tissue caudal from the anus in control and in interval or continuously trained animals N = 10 Scale bars 250 m indicates significant differences between trained and control animals (plt005) (modified after Pelster et al 2003)
115
ACKNOWLEDGEMENT
The study was financially supported by the Fonds zur Foumlrderung der wissenschaftlichen Forschung (FWF P12571-BIO P14976-BIO)
REFERENCES
Bagatto B B Pelster and WW Burggren 2001 Growth and metabolism of larval zebrafish effects of swim training Journal of Experimental Biology 204 4335-4343
Baumann R and HJ Meuer 1992 Blood oxygen transport in early avian embryo Physiological Reviews 72 941-965
Burggren WW 2004 What is the purpose of the embryonic heart beat or How facts can ultimately prevail over physiological dogma Physiological and Biochemical Zoology 77 333-345
Burggren WW and A Mwalukoma 1983 Respiration during chronic hypoxia and hyperoxia in larval and adult bullfrogs (Rana catesbeiana) I Morphological responses of lungs skin and gills Journal of Experimental Biology 105 191-203
Childs S JN Chen DM Garrity and MC Fishman 2002 Patterning of angiogenesis in the zebrafish embryo Development 129 973-982
Christiansen JS and M Jobling 1990 The behaviour and the relationship between food intake and growth of juvenile Arctic charr Salvelinus alpinus L subjected to sustained exercise Canadian Journal of Zoology 68 2185-2191
Davie PS RMG Wells and V Tetens 1986 Effects of sustained swimming on rainbow trout muscle structure blood oxygen transport and lactate dehydrogenase isozymes evidence for increased aerobic capacity of white muscle Journal of Experimental Zoology 237 159-171
Dusseau JW and PM Hutchins 1988 Hypoxia-induced angiogenesis in chick chorioallantoic membranes a role for adenosine Respiration Physiology 71 33-44
El-Fiky N and W Wieser 1988 Life styles and patterns of development of gills and muscles in larval cyprinids (Cyprinidae Teleostei) Journal of Fish Biology 33 135-145
Fritsche R 1997 Ontogeny of cardiovascular control in amphibians American Zoologist 37 23-30
Fritsche R and WW Burggren 1996 Development of cardiovascular responses to hypoxia in larvae of the frog Xenopus laevis American Journal of Physiology 271 R912-917
Fritsche R T Schwerte and B Pelster 2000 Nitric oxide and vascular reactivity in developing zebrafish Danio rerio American Journal of Physiology 279 R2200-R2207
Gong B D Liang TG Chew and R Ge 2004 Characterization of the zebrafish vascular endothelial growth factor A gene comparison with vegf-A genes in mammals and Fugu Biochimica et Biophysica Acta 1676 33-40
116
Holeton GF 1971 Respiratory and circulatory responses of rainbow trout larvae to carbon monoxide and to hypoxia Journal of Experimental Biology 55 683-694
Hudlicka O M Brown and S Egginton 1992 Angiogenesis in skeletal and cardiac muscle Physiological Reviews 72 369-417
Isogi S ND Lawson S Torrealday M Horiguchi and BM Weinstein 2003 Angiogenic network formation in the developing vertebrate trunk Development 1305281-5290
Jacob E M Drexel T Schwerte and B Pelster 2002 The influence of hypoxia and of hypoxemia on the development of cardiac activity in zebrafish larvae American Journal of Physiology 283 R911-R917
Kam YC 1993 Physiological effects of hypoxia on metabolism and growth of turtle embryos Respiration Physiology 92 127-138
Kloberg AJ and R Fritsche 2002 Catecholamines are present in larval Xenopus laevis A potential source for cardiac control Journal of Experimental Zoology 292 293-303
Liang D JR Chang AJ Chin A Smith C Kelly ES Weinberg and R Ge 2001 The role of vascular endothelial growth factor (VEGF) in vasculogenesis angiogenesis and hematopoiesis in zebrafish development Mechanisms of Development 108 29-43
Liang D X Xu AJ Chin NV Balasubramaniyan MA Teo TJ Lam ES Weinberg and R Ge 1998 Cloning and characterization of vascular endothelial growth factor (VEFG) from zebrafish Danio rerio Biochemica Biophysica Acta 139714-20
McDonald DG and BR McMahon 1977 Respiratory development in Arctic char Salvelinus alpinus under conditions of normoxia and chronic hypoxia Canadian Journal of Zoology 55 1461-1467
Orlando K and AW Pinder 1995 Larval cardiorespiratory ontogeny and allometry in Xenopus laevis Physiological Zoology 68 63-75
Padilla PA and MB Roth 2001 Oxygen deprivation causes suspended animation in the zebrafish embryo Proceedings of the National Academy of Science USA 987331-7335
Pappano AJ 1977 Ontogenetic development of autonomic neuroeffector transmission and transmitter reactivity in embryonic and fetal hearts Pharmacological Reviews 29 3-33
Pelster B 1999 Environmental influences on the development of the cardiac system in fish and amphibians Comparative Biochemistry and Physiology PtA 124 407-412
Pelster B 2002 Developmental plasticity in the cardiovascular system of fish with special reference to the zebra fish Comparative Biochemistry and Physiology 133A 547-553
117
Pelster B and WW Burggren 1996 Disruption of haemoglobin oxygen transport does not impact oxygen- dependent physiological processes in developing embryos of zebrafish (Danio rerio) Circulation Research 79 358-362
Pelster B AM Saumlnger M Siegele and T Schwerte 2003 Influence of swim training on cardiac activity tissue capillarization and mitochondrial density in muscle tissue of zebrafish larvae American Journal of Physiology 285 R339-R347
Pette D and RS Staron 2001 Transitions of muscle fiber phenotypic plasticity Histochemistry and Cell Biology 115 359-372
Protas LL and GR Leontieva 1992 Ontogeny of cholinergic and adrenergic mechanisms in the frog (Rana temporaria) heartr American Journal of Physiology 262 R150-R161
Richardson BS and AD Bocking 1998 Metabolic and Circulatory Adaptations to Chronic Hypoxia in the Fetus Comparative Biochemistry and Physiology 119A 717-723
Saumlnger AM 1992 Effects of training on axial muscle of two cyprinid species Chondrostoma nasus (L) and Leuciscus cephalus (L) Journal of Fish Biology 40 637-646
Saumlnger AM and U Poumltscher 2001 Endurance exercise training affects fast white axial muscle in the cyprinid species Chalcalburnus chalcoides mento (Agassiz 1832) Cyprinidae Teleostei Basic and Applied Myology 10 297-300
Schwerte T D Uumlberbacher and B Pelster 2003 Non-invasive imaging of blood cell concentration and blood distribution in hypoxic incubated zebrafish in vivo (Danio rerio) Journal of Experimental Biology 206 1299-1307
Tan DC RM Kini SD Jois DK Lim L Xin and R Ge 2001 A small peptide derived from Flt-1 (VEGFR-1) functions as an angiogenic inhibitor FEBS Letters 494 150-156
Territo PR and J Altimiras 1998 The ontogeny of cardio-respiratory function under chronically altered gas compositions in Xenopus laevis Respiration Physiology 111 311-323
Territo PR and J Altimiras 2001 Morphometry and estimated bulk oxygen diffusion in larvae of Xenopus laevis under chronic carbon monoxide exposure Journal of Comparative Physiology B 171 145-153
Territo PR and WW Burggren 1998 Cardio-respiratory ontogeny during chronic carbon monoxide exposure in the clawed frog Xenopus laevis Journal of Experimental Biology 201 1461-1472
Weinstein BM 1999 What guides early embryonic blood vessel formation Developmental Dynamics 215 2-11
Weinstein BM AF Schier S Abdelilah J Malicki L Solnica-Krezel DL Stemple DY Stainier F Zwartkruis W Driever and MC Fishman 1996 Hematopoietic mutations in the zebrafish Development 123 303-309
118
Wieser W H Forstner N Medgyesy and S Hinterleitner 1988 To switch or not to switch partioning of energy between growth and activity in larval cyprinids (Cyprinidae Teleostei) Functional Ecology 2 499-507
Yue X and R J Tomanek 1999 Stimulation of coronary vasculogenesisangiogenesis by hypoxia in cultured embryonic hearts Developmental Dynamics 216 28-36
119
120
A BIOCOMPUTATIONAL TOOL TO MEASURE CARDIAC RHYTHMS IN ZEBRAFISH
Shuk Han Cheng11 Eric Po Kwok Chan and Alex Chun Chi Lin
ABSTRACT
The zebrafish embryo has become one of the popular vertebrate model organisms for developmental toxicology research The transparent embryo becomes a viable model for providing assessment of cardiovascular functions However the most commonly used measurement tool for heart beat rate is simple visual examination In our laboratory we have developed a prototypical biocomputational tool to quantify the cardiac function of heart beat Heart beat pattern was digitally recorded and the images were assessed by digital motion analysis in the caudal blood vessels whereby the flow of blood cells was measured The software gave an indication of heart beat rates which were correlated positively with the heart beat rates measured by visual observation Using the insecticide carbaryl we demonstrated that this toxicant elicited irregular heart beat This perturbation of cardiovascular function is previously unreported as carbaryl is thought to be a rather safe insecticide for humans and animals Our biocomputational technique can be readily adapted to screen for toxic effects of other physical and chemical toxicants in this test system
INTRODUCTION
The developing fish embryos and larvae are often used in toxicity testing due to their high sensitivity towards toxicants Increasingly developmental toxicity has been incorporated in risk assessment procedures Detailed understanding on how toxicants affect physiological and developmental processes in embryonic fish serves as a foundation for assessment of fitness and survival Notwithstanding there is still a paucity of data on anatomical malformations and physiological impairment of internal organs caused by exposure to toxicants
The transparent zebrafish embryo is an ideal model for studying cardiovascular toxicity of chemicals (reviewed in Schwerte and Fristsche 2003) For example polycyclic aromatic hydrocarbons induced bradycardia and arrhythmias characteristic of atrioventricular conduction block in zebrafish embryos (Incardona JP et al 2004) Apart from morphological description of the cardiovascular system and measurements of heart rates the assessment of heartbeat rhythm is also of paramount importance in cardiovascular physiology Irregular heartbeat rhythm caused by side-effects of non-cardiac drugs is often related with sudden death in human However assessment of the regularity of heartbeat rhythm is not readily available in these zebrafish embryos
We report here the prototype of a non-invasive method to measure regularity of heartbeat The method involves two separate steps namely image analysis using digital motion analysis of caudal blood flow and the power spectral analysis of image data Digital motion analysis was developed by Schwerte and Pelster (2000) in which movement of blood cells was analyzed by image subtraction between 2 video frames (figure 1A) In this image subtraction pixels in each frame were separated in
Department of Biology and Chemistry City University of Hong Kong Tat Chee Avenue Kowloon Hong Kong
121 11
2 categories The first category included static pixels which were located in the non-moving area where no intensity change occurred between 2 video frames The second category included dynamic pixels which were located in the moving area where intensity change occurred between 2 video frames Since the time interval between 2 video frames was constant the amount of dynamic pixels was larger
if the object moved faster (figure 1B and figure 1C)
A
B
C
Figure 1 (A) Image subtraction of 2 video frames (B amp C) Schematic diagram illustrates the amount of dynamic pixels obtained if object is moved slowly (B) or quickly (C)
Based on this idea a pilot program was developed to perform image subtraction in video sequence recording caudal blood flow in 48-hpf zebrafish embryos Instead of summing up the dynamic pixels as described in the original methodology (Schwerte and Pelster 2000) the amount of dynamic pixels of each video frame was treated as a sequence of data in a time series Plotting of the time series data of dynamic pixels from control embryo showed a waveform correlation (figure 2A) This effect was similar to the direct observation of pulsatile blood cell movements under a microscope We performed power spectral analysis on the waveform pattern of dynamic pixels in order to extract frequency specific characteristics from the data set comprising the dynamic pixels The power spectrum of waveform represented in figure 2A actually consisted of 3 peaks (figure 2B) suggesting the existence of 3 basic frequency components in this time series data of dynamic pixels Since the second and the third frequency component were the higher integer multiples of the first frequency component they were considered as the harmonics of the first frequency component (Stefanovska and Bracic 1999) In this preliminary study power spectra of control embryos (n=6) were analyzed (figure 3A) It consisted of 3 frequency components and the second and the third component were the exact multiples of the first frequency (figure 3A) Conversion of the units of major frequency values from per second to per minute resulted in values correlating directly to measurements of heart rates being counted visually from video recordings of heart chamber beating (figure 3B) This pilot experiment showed that the
122
power spectral analysis gave us an direct indication of the heart beat rate
A
B
Figure 2 Percentage of dynamic pixel (A) and its corresponding power spectrum (B) of a control embryo
We then perturbed the experimental system with the addition of carbaryl a carbamate insecticide to the fish embryo culture Carbaryl was considered a low toxicity insecticide for both human and other vertebrates However previous studies showed that carbaryl induced ultrastructural changes in the heart (Tos-Luty et al 2001) and caused reduced heart rate (Kossakowski 1987) In a preliminary experiment to demonstrate the application of our method an embryo exposed to 10 ppm of carbaryl for 48 hours was analyzed The waveform of dynamic pixels appeared to be similar to those obtained from control embryos (figure 4A) However using power spectrum of the carbaryl-treated embryo we could not identify any peak corresponding to a specific frequency component (figure 4B) Therefore this preliminary experiment suggested that carbaryl disturbed the regularity of heartbeat resulting in the heart beating in a random manner in this carbaryl-treated embryo
123
A
B
Figure 3 (A) Power spectra of six control embryos (B) Correlation of heart rate determined by power spectral analysis and direct visual counting in heart
A
B
Figure 4 Percentage of dynamic pixels (A) and its corresponding power spectrum (B) of a carbaryl-treated embryo
In summary our preliminary results showed that our method was able to measure heart rate digitally as compared to the conventional visual method In addition this method can demonstrate the regularity of heartbeat and identify irregular beatings in zebrafish embryos However it still requires
124
a large sample size in order to investigate the correlation between irregular heartbeats and absence of frequency component peak in power spectrum after toxicant treatments Furthermore we need to identify parameters of the power spectrum which are necessary for the quantification of heartbeat rhythms
REFERENCES
Incardona JP TK Collier and NL Scholz 2004 Defects in cardiac function precede morphological abnormalities in fish embryos exposed to polycyclic aromatic hydrocarbons Toxicol Appl Pharmacol 196191-205
Kossakowski S 1987 Electrocardiogram of rabbits experimentally intoxicated with carbaryl Polskie Archiwum Weterynaryjne (Warszawa) 2715-28
Schwerte T and R Fritsche 2003 Understanding cardiovascular physiology in zebrafish and Xenopus larvae the use of microtechniques Comparative Biochemistry and Physiology A Molecular Integrated Physiology 135131-145
Schwerte T and B Pelster 2000 Digital motion analysis as a tool for analyzing the shape and performance of the circulatory system in transparent animals Journal of Experimental Biology 2031659-1669
Stefanovska A and M Bracic 1999 Physics of the human cardiovascular system Contemporary Physics 40 31-55
Tos-Luty S D Przebirowska J Latuszynska and M Tokarska-Rodak 2001 Histological and ultrastructural studies of rats exposed to carbaryl Annual Agric Environ Med 8137-44
125
126
HYPOXIA IN REPTILES
Tobias Wang12 and Nini Skovgaard
ABSTRACT
Reptiles are amongst the most hypoxia and anoxia-tolerant vertebrates and some species such as turtles are therefore favored organisms for studies on metabolic adaptations to oxygen lack Although reptiles are unlikely to experience hypoxic environments they are often hypoxic at the tissue level due to large cardiac shunts and prolonged periods of breath-hold Here we briefly review some of the physiological responses to hypoxia with particular emphasis on local responses in the pulmonary circulation Hypoxic pulmonary vasoconstriction is more prevalent in species with anatomically complex lungs and is particularly expressed in species that also have a functionally divided heart where increased pulmonary vascular resistance does not affect the cardiac shunt flow We also review the metabolic responses to hypoxia and argue that the hypoxic conditions created by intracardiac shunts and breath-hold may serve to downregulate metabolism thorough direct effects of low oxygen levels on cellular metabolism
INTRODUCTION
Reptiles and other air-breathing animals are at least in comparison with aquatic animals unlikely to experience severe hypoxic environments unless when inhabiting or entering high altitude High altitude is normally associated with low environmental temperatures which rather than low oxygen levels is likely to be a limiting factor for the distribution of reptiles However reptiles exhibit a number of anatomical physiological and behavioural traits that results in low oxygen levels of lung gases and arterial blood In particular they have undivided hearts so arterial and venous blood is mixed within the ventricle leading to low oxygen levels in the blood Also many species exhibit prolonged periods of breath hold where lung PO2 and arterial oxygen levels can decline to very low values Many reptiles therefore routinely experience hypoxia at the tissue level Furthermore reptiles are rather tolerant to oxygen lack and species such as freshwater turtles are amongst the most anoxia-tolerant vertebrates Many studies therefore have been performed on the anoxia and hypoxia-tolerance of reptiles with an aim to understand basic mechanisms common to all vertebrates
Reptiles are ectohermic vertebrates with a relatively low metabolism compared to endothermic vertebrates Because of the low metabolism reptiles are characterized by much lower rates of pulmonary ventilation and many species breathe episodically with long-lasting periods of breath holds The different taxonomic groups of reptiles vary substantially with regards to heart morphology and lung structure (Farrell et al 1998 Hicks 1998 Perry 1989 1998) and it is likely that studies on the effects of hypoxia in reptiles with diverse cardiac and pulmonary morphologies can provide insight into the evolution of physiological responses to hypoxia amongst air-breathing vertebrates
In terms of evolutionary studies reptiles represent a phylogenetically important group because endothermic birds and mammals evolved independently from reptilian ancestors (Page 2000 Fig 1)
12 Department of Zoophysiology Building 131 University of Aarhus 8000 Aarhus C Denmark
127
The evolution of endothermy was associated with an approximate ten-fold rise in resting and maximal rates of oxygen consumption (eg Bennett and Ruben 1979) This transition placed great demands on the circulatory and respiratory systems (Taylor and Weibel 1981) requiring higher resting and maximal heart rates to match the increased need for oxygen delivery and elevated blood pressure to secure adequate perfusion pressure for the higher capillary density (Burggren et al 1997 Lillywhite et al 1999) In the pulmonary circulation higher structural complexity allowed for smaller gas exchange units and increased surface area which together with a thinner blood-gas barrier increased the pulmonary diffusive capacity for O2 (Perry 1990 West 2003) The very thin blood-gas barrier in endothermic vertebrates required a complete cardiac division and separation of the pulmonary and systemic circulations to allow for low pulmonary pressure to protect the respiratory epithelium from a high vascular pressure (West 2003) The higher complexity however also increased the possibilities for ventilation-to-perfusion in homogeneities (Piiper 1992 Powell and Hopkins 2004) These cardio-respiratory changes certainly enabled a substantial rise in oxygen transport from air to the metabolising tissue which allows for increased exercise stamina but the higher metabolic rate also leads to an increased reliance on oxidative metabolic pathways and made the endothermic animals more susceptible to hypoxia This sensitivity to hypoxia is perhaps best illustrated by the intolerance to ischemia and hypoxia which characterizes the heart and brain of mammals where few minutes of ischemia can lead to irreversible brain damage and persisting depressions of cardiac contractility
Fish Amphibians Mammals Turtles Lizards Snakes Crocodiles Birds
Reptilian ancestors
Figure 1 The phylogenetic relations between vertebrates Endothermic birds and mammals evolved independently from reptilian ancestors and the four groups of extant reptiles (turtles lizards snakes and crocodiles) therefore constitute an important group for comparative studies on the evolution of physiological responses to hypoxia
Here we review the physiological and metabolic responses to hypoxia in reptiles and compare these responses to the endothermic mammals and birds Rather than providing a detailed review on all aspects of the hypoxic responses we will place emphasis on the pulmonary circulation and the possible effects of the internal hypoxia that can be caused by prolonged breath hold and cardiac shunts
128
THE REPTILIAN HEART AND ITS EFFECT ON ARTERIAL OXYGEN LEVELS
In most non-crocodilian reptiles the ventricle is anatomically and functionally undivided and blood pressures are therefore equal in systemic and pulmonary circulations (eg Hicks 1998 Fig 2B) This allows for cardiac shunting of blood flow where systemic (right-to-left R-L) or pulmonary (left-to-right L-R) circulation is by passed In species where the ventricle is undivided the heart basically functions as a single pressure source and blood flow distribution between pulmonary and systemic circulations is primarily determined by pulmonary and systemic vascular resistances respectively Thus when pulmonary vascular resistance is low a L-R shunt will prevail whilst large R-L shunts exist when pulmonary vascular resistance is high This relationship between vascular resistances and blood flow distribution is illustrated in Figure 2A which shows that turtles exhibit large R-L shunts (ie a low QpulQsys) when pulmonary vascular resistance is high relative to systemic vascular resistance (ie a low RpulRsys) and vice versa
3 40
30
Qpu
lQsy
s 2
1 net left-to-right cardiac shunt
net right-to-left cardiac shunt bloo
d pr
essu
re(c
m H
2O)
20
10
1 sec 0 0
0 1 2 3 4
RpulRsys
Figure 2 A The distribution of blood flows between the systemic and pulmonary circulations in anaesthetized turtles where the cardiac shunt pattern is expressed as QpulQsys Qpul pulmonary blood flow Qsys systemic blood flow Rpul pulmonary vascular resistance Rsys systemic vascular resistance (modified from Crossley et al 1998) B Simultaneous recording of systemic and pulmonary blood pressures (in blue and red respectively) in an anaesthetized turtle Note that systolic pressures are similar in the two circulatory systems whereas diastolic pressures are lower in the pulmonary circulation due to the lower resistance
It is well established that virtually all reptiles regulate pulmonary vascular resistance through constriction or dilatation of smooth muscle surrounding the common pulmonary artery close to where it emerges from the ventricle This smooth muscle is innervated by the vagus nerve and increased vagal activity leads to a constriction of the pulmonary artery which can be blocked with atropine Reptiles therefore are able to regulate their cardiac shunt pattern and it is now well established that the low heart rate that is characteristic during breath hold and diving is attended by large R-L cardiac shunts where most of the blood recirculates within the systemic circulation without being oxygenated In contrast during pulmonary ventilation pulmonary vascular resistance is greatly reduced and
129
pulmonary blood flow increases markedly which in some cases is associated with L-R shunts
There are a few reptiles where the ventricle is functionally divided so that pulmonary blood pressures are much lower than systemic blood pressures This deviation from the normal reptilian pattern of low systemic and pulmonary blood pressures has only been described in varanid lizards and pythons and these two groups have blood pressures that resemble those of mammals (Burggren and Johansen 1982 Wang et al 2002 2003) The functional division of the ventricle allows for high systemic blood pressures whilst protecting the lungs by having low pulmonary blood pressures and has often been linked to the high metabolic rates and exercise stamina of varanid lizards A similar teleological reasoning is not obvious for pythons but it is possible that the functional division of their hearts is related to the high metabolic rates that these animals have during incubation of the eggs (Wang et al 2003)
The cardiac right-to-left shunt has pronounced effects on arterial blood gas composition and oxygen transport During a right-to-left shunt oxygen poor venous blood bypasses the lungs and consequently does not become oxygenated and is shunted directly back into the systemic circulation The oxygen concentration of arterial blood therefore becomes the weighed average of the oxygen concentrations in the blood returning from the lungs and that of the blood which is shunted away from the pulmonary circulation Formally this can be described by the shunt equation
[O2]a = (Qpul x [O2]pv + QR-L x [O2])( Qpul + QR-L)
where [O2]a [O2]pv and [O2]sv are the oxygen concentration in arterial blood the pulmonary vein and the systemic venous blood respectively while Qpul Qsys and QR-L are pulmonary systemic and shunt blood flows respectively Arterial oxygen concentration and thereby the arterial partial pressure of oxygen are reduced according to the magnitude of the shunt flow but also according to venous oxygen concentrations The effects of cardiac shunting has been measured in several species (see Burggren et al 1979 White et al 1989 Wang et al 1998)
A number of recent studies show that resting undisturbed reptiles normally exhibit large cardiac right-to-left shunts (eg White et al 1989 Wang et al 1996a Wang et al 1998 Krosniunas and Hicks 2003) However when metabolic rate is elevated due to muscular exercise increased temperature or digestion the R-L shunt is reduced (Wang et al 1997 Krosniunas and Hicks 2003) Thus it seems that reptiles regulate oxygen delivery by altering the cardiac shunt according to metabolic demand (Wang et al 1997 Wang et al 2001)
PHYSIOLOGICAL RESPONSES TO HYPOXIA
When exposed to hypoxia animals can increase the transport of oxygen through the ventilatory and cardiovascular systems to maintain oxygen delivery at a sufficiently high level that allows metabolism to be maintained at the normoxic value Reptiles certainly do exhibit both increases in ventilation and heart rate in response to hypoxia but it is also becoming clear that many reptiles in common with other vertebrates respond by decreasing metabolism which reduces the demand on oxygen transport The physiological responses to hypoxia are elicited through stimulation of oxygen sensitive chemoreceptors which seem to be located rather diffusively within the systemic arterial arches but there is also some evidence for receptors on the pulmonary artery In this case hypoxic responses may also be elicited through reductions in venous oxygen levels
130
EFFECTS OF HYPOXIA ON CARDIAC SHUNT PATTERNS
During exposure to hypoxia it is clearly advantageous for oxygen transport to reduce or eliminate the cardiac R-L shunt A reduction in cardiac shunt has indeed been documented in hypoxic turtles (Wang et al 1997) This reduction can at least in part be ascribed to the rise in ventilation which due to the tight interaction between ventilation and cardiac shunt patterns reduces the periods of R-L shunt that are associated with breath hold Thus it remains to be established whether the cardiac shunt pattern is directly affected by stimulation of oxygen sensitive chemoreceptors or merely a consequence of increased ventilation However when arterial oxygen concentration is reduced through reductions in blood haemoglobin concentration or exposure to carbon monoxide there are large reductions in the cardiac R-L shunt which certainly is beneficial for oxygen transport The receptors that are responsible for these responses remain to be characterized (Wang et al 1997)
THE REPTLIAN LUNG AND THE DIRECT EFFECT OF HYPOXIA
The reptilian lung is structurally rather simple compared to that of mammals and birds Thus in most snakes and lizards the lungs merely consist of large air sacs with few subdivisions and the area for gas exchange is therefore very limited compared to mammals and birds (Luchtel and Kardong 1981 Hlastala et al 1985 Maina 1989) On the other hand the lungs of turtles varanid lizards and crocodiles are more complex and compartmentalized increasing the surface area and the capacity for oxygen diffusion (Perry 1983 1989 1998)
A great number of studies have shown that reptiles increase ventilation when exposed to hypoxia and the rise in overall ventilation is mainly accomplished through an increased breathing frequency while tidal volume only increases in some cases (Milsom 1991)
Low oxygen levels in the lungs of birds and mammals cause constriction of the pulmonary vasculature elevating resistance to pulmonary blood flow and increasing pulmonary blood pressure (Euler and Liljestrand 1946 Motley et al 1947 Faraci et al 1984) This response hypoxic pulmonary vasoconstriction (HPV) diverts pulmonary blood flow from poorly ventilated and hypoxic areas of the lung to more well-ventilated parts HPV is considered important for local matching of ventilation to blood perfusion improving pulmonary gas exchange and maintaining systemic arterial PO2 (Euler and Liljestrand 1946 Dawson 1984 Brimioulle et al 1996) The primary site of HPV is the precapillary muscular pulmonary arteries (Weir and Archer 1995) HPV is detrimental during exposure to hypoxic gases where the entire pulmonary circulation becomes hypoxic and increases pulmonary arterial pressure
HPV is a locally mediated response that persists in isolated perfused lungs with no neurohumoral influences and also occurs in isolated rings of pulmonary vascular smooth musculature (Fishman 1976 McMurty et al 1978 Robertson et al 1995) HPV reflects an inherent property of the pulmonary vascular smooth muscle and is likely to be mediated by inhibition of one or several different types of K+-channels whilst various endothelium-derived vasoactive compounds act as modulators (Ward and Robertson 1995 Weir and Archer 1995 Loacutepez-Barneo et al 2004 Ward et al 2004) In contrast the systemic circulation of most vertebrates responds to hypoxia by vasodilatation (Detar 1980 Crossley et al 1998 Shimizu et al 2000 Smith et al 2001)
The breathing pattern of many reptiles particularly aquatic species is characterized by ventilatory episodes of one or several breaths interspersed between non-ventilatory periods of varying
131
length (Milsom 1991) During non-ventilatory periods lung and blood PO2 decrease as the oxygen stores are exhausted (eg Burggren and Shelton 1979) In species with an undivided ventricle blood flow distribution between pulmonary and systemic circulations is primarily determined by pulmonary and systemic vascular resistances (Hicks 1998 Crossley et al 1998) so HPV would induce a pulmonary by pass of blood flow (right-to-left cardiac shunt) and reduce the ability to exploit the pulmonary oxygen reserve during breath hold In animals with a divided heart such as caimans HPV during breath hold will nevertheless cause pulmonary hypertension that may disturb pulmonary fluid balance (Welling et al 1997)
We have recently shown that hypoxia causes a reversible constriction of the pulmonary vasculature in turtles varanids and caimans (Crossley et al 1998 Skovgaard et al 2005) These three species possess complex multicameral lungs and it is likely that HPV would aid to secure VQ homogeneity There is no response to hypoxia in rattlesnakes (Skovgaard et al 2005) which is consistent with the view that species with structurally simple lungs rely less on local responses for proper VQ matching However tegu lizards that also have simple unicameral lungs do exhibit HPV (Skovgaard et al 2005) albeit at a lower hypoxic threshold than varanids and caimans Thus while the data support our general hypothesis that HPV is more pronounced in species with complex lungs and divided hearts it is also clear that other components are involved HPV evolved to improve the VQ matching however in species with a poorly divided ventricle this benefit is counterbalanced by the fact that HPV impairs the ability to increase pulmonary blood flow during non-ventilatory periods The apparent blunted HPV in turtles compared to caimans may therefore ensure that pulmonary blood flow can be increased during for instance submergence (Crossley et al 1998)
REDUCTIONS IN METABOLISM DURING HYPOXIA a DECREASE IN PREFERRED BODY TEMPERATURE ANDOR REDUCTIONS IN BASAL METABOLIC
RATE
Most of the physiological responses during hypoxia such as the increased ventilation and elevated cardiac output serve to enhance oxygen transport ensuring an adequate oxygen delivery to maintain normal oxygen consumption However reptiles can also utilise an opposite or alternative strategy where they reduce metabolism and therefore the need for oxygen during hypoxia (see Hicks and Wang 2004) This metabolic depression reduces energy demand and therefore lessens the demands on the cardio-respiratory system limits utilization of substrate reserves and reduces the accumulation of toxic metabolites A reduction in metabolism during hypoxia is not limited to reptiles and has been extensively documented in newborn mammals and birds (eg Mortola and Frappell 2000 Mortola 2004) Also diving birds and mammals appear to reduce metabolic rate when diving (Butler 2004) and it is becoming increasingly clear that metabolic rate is more plastic than previously thought
There are two strategies to reduce metabolism during periods of limited oxygen availability Firstly animals can utilise a behavioural reduction of the preferred body temperature that through the direct effect of temperature on biochemical processes (the so-called ldquoQ10 effectrdquo or the ldquoArhenius effectrdquo) decreases the rate of metabolic processes Assuming a Q10 of ~ 25 for oxygen consumption aerobic demands decrease by approximately 11 per degree C reduction of body temperature Second at a constant body temperature animals can reduce ATP demands which reduce basal metabolic rate As a corollary mechanism reptiles and other animals can reduce physical activity during hypoxia which obviously reduces oxygen usage
132
Ectothermic animals such as reptiles generate a limited amount of heat through metabolism and rely on the environment to maintain body temperature and use behavioural mechanisms such as basking andor shuttling between sun and shade to achieve the preferred body temperature By these mechanisms reptiles regulate body temperature within a rather narrow range that is determined by a thermal set-point within the central nervous system (Cabanac 1975 Steiner and Branco 2002) The mechanism by which hypoxia lowers this set-point remains obscure (Wood 1991 Steiner and Branco 2002) but a reduction in the preferred body temperature has been documented in teleost fish amphibians reptiles mammals and birds (eg Bryan et al 1984 Hicks and Wood 1985) and even appears to be a universal response amongst all animals (Wood 1991 Malvin and Wood 1992) Apart from low oxygen levels in the inspired air anemia can also cause a reduction in body temperature as shown in lizards (Hicks and Wood 1985) and a reduction of the preferred body temperature is also a common response to fasting and starvation where the reduction on metabolism may prolong the period that animals can tolerate being without food
A reduction in metabolism during hypoxia can be accomplished through an actual depression of cellular metabolism at unchanged temperature This metabolic depression has been studied extensively during complete lack of oxygen ie anoxia and it is particularly very anoxia-tolerant species such as freshwater turtles that can survive for many months without oxygen Thus using calorimetric measurements Jackson and Schmidt-Nielsen (1966) showed that heat production of turtles decreases approximately ten-fold within hours after being exposed to anoxia A number of subsequent studies on individual organs such as brain heart and liver have shown that the metabolic depression during anoxia is a regulated response that involves reductions in active membrane transport and membrane permeability as well as a down-regulation of various synthetic pathways such as protein synthesis (Nilsson et al 1991 Buck et al 1993a Buck et al 1993c Land et al 1993 Hochachka et al 1996 1997 2001 Lutz and Kabler 1997) The depression of metabolism obviously extends the period of survival during anoxia but does not prevent the accumulation of lactate and anoxia is invariably associated with a progressive development of a metabolic acidosis
While much attention has been paid to describing and understanding the suppression of metabolism during anoxia fewer studies have been devoted to understanding how hypoxia affects metabolism In turtles exposed to progressive levels of hypoxia there was a lowering of their metabolic rate This response was most pronounced at higher temperatures where metabolism is elevated It is not easy to interpret these results because the turtles did increase ventilation in response to hypoxia and the decline in oxygen consumption may reflect an inability to deliver sufficient oxygen to the metabolising tissues To circumvent some of these uncertainties Hicks and Wang (1999) investigated the effects of progressive hypoxia on oxygen consumption in anaesthetized turtles while making simultaneous measurements of blood flows as well as arterial and venous blood gases The turtles were artificially ventilated so the levels of hypoxia could be controlled for precise control of inspired gases Hypoxia and the attending fall in arterial and venous PO2 and O2 content was associated with significant reductions in VO2 (up to 73 of the normoxic value) which was fully reversible upon return to normoxia As with the previous study on recovered turtles (Glass et al 1983) the reduction in VO2 could either result from an inability of the cardiopulmonary system to supply sufficient oxygen to the tissues or by an actual down regulation of metabolism ie a reduction of ATP demand To distinguish between these two possibilities the metabolic uncoupler 23-dintrophenol (DNP) was infused during hypoxia to determine whether a higher VO2 could be stimulated (Hicks and Wang 1999) The infusion of DNP did indeed increase VO2 of the hypoxic turtles while arterial and venous blood O2 levels remained low and without affecting cardiac output Furthermore there was no observable rise of plasma lactate or potassium levels It was concluded that the reduction of VO2 during hypoxia reflects
133
an actual reduction in the rate of ATP turnover Similar results have been obtained on rats (Saiki et al 1997) and hypoxic hepatocytes from turtles (Buck et al 1993b)
As discussed above most reptiles normally have a pronounced right-to-left cardiac shunt which leads to a reduction in systemic arterial PO2 and oxygen concentration (eg Shelton and Burggren 1976 Wang et al 1997) Given the rather distinct reduction of oxygen uptake during hypoxia that was observed in the anaesthetized turtles it seems possible that the low arterial oxygen levels which are common during breath hold and diving could trigger fast and reversible metabolic down-regulations (Hicks and Wang 2004) Pulmonary blood flow and the cardiac shunt pattern of most reptiles are regulated by a vagal innervation on smooth muscles within the wall of the pulmonary artery (eg Milsom et al 1977 Wang et al 2001) To mimic these responses Platzack et al (2001) electrically stimulated the vagus nerve of anaesthetized turtles and induced a reduction in heart rate and an increase in the R-L cardiac shunt that occurs normally in diving turtles Under these conditions the lowering of arterial oxygen levels was attended by a decrease in oxygen uptake which further strengthens the possibility of cardiac right-to-left shunt being able to affect aerobic metabolism
Some species experience hypoxia at altitude and aquatic species experience reductions in lung and blood PO2 during breath-holds associated with prolonged diving In contrast to mammals and birds many reptiles also routinely experience varying levels of hypoxemia resulting from their unique cardiac morphology in which the undivided ventricle allows for admixture of systemic venous blood (right-to-left or R-L cardiac shunt) with subsequent reductions in arterial PO2 (Shelton and Burggren 1976 Burggren et al 1979 White et al 1989 Wang et al 1996a Hicks 1998) Because the amount of systemic venous admixture can be regulated reptiles have the ability to alter arterial PO2 independently of lung PO2 This ability may represent a mechanism of regulating metabolism through modulation of oxygen supply to the tissue (Wang et al 1996b Wang et al 1997 Wang et al 2001)
ACKNOWLEDGEMENTS
Supported by the Danish Research Council
REFERENCES
Bennett AF and JA Ruben 1979 Endothermy and activity in vertebrates Science 206 649-654
Brimioulle S P Lejeune and R Naeije 1996 Effects of hypoxic pulmonary vasoconstriction on pulmonary gas exchange Journal of Applied Physiology 81 1535-1543
Bryan JD LG Hill and WH Niell 1984 Interdependence of acute temperature preference and respiration in the plains minnow Transactions of the American Fisheries Societies 113 557-562
Buck LT and PW Hochachka 1993a Anoxic suppression of Na(+)-K(+)-ATPase and constant membrane potential in hepatocytes support for channel arrest American Journal of Physiology 265 R1020-1025
Buck LT PW Hochachka A Schon and E Gnaiger 1993b Microcalorimetric measurement of reversible metabolic suppression induced by anoxia in isolated hepatocytes American Journal of Physiology 265 R1014-1019
134
Buck LT SC Land and PW Hochachka 1993c Anoxia-tolerant hepatocytes model system for study of reversible metabolic suppression American Journal of Physiology 265 R49-56
Burggren W A Farrel and H Lillywhite 1997 Vertebrate cardiovascular systems In Dantzler WH (Ed) Handbook of physiology Sec 13 Comparative physiology vol 1 American Physiological Society Oxford New York pp 215-308
Burggren WW and K Johansen 1982 Ventricular haemodynamics in the monitor lizard Varanus exanthematicus pulmonary and systemic pressure separation Journal of Experimental Biology 96 343-354
Burggren WW and G Shelton 1979 Gas exchange and transport during intermittent breathing in Chelonian reptiles Journal of Experimental Biology 82 75-92
Butler PJ 2004 Metabolic regulation in diving birds and mammals Respiratory Physiology and Neurobiology 141297-315
Cabanac M 1975 Temperature regulation Annual Review of Physiology 37 415-439
Crossley DA T Wang and J Altimiras 1998 Hypoxia elicits pulmonary vasoconstriction in anaesthetized turtles Journal of Experimental Biology 201 3367-3375
Dawson CA 1984 Role of pulmonary vasomotion in physiology of the lung Physiological Review 64 544-616
Detar R 1980 Mechanisms of physiological hypoxia-induced depression of vascular smooth muscle contraction American Journal of Physiology 238 H761-H769
Euler USV and G Liljestrand 1946 Observations on the pulmonary arterial blood pressure in the cat Acta Physiologica Scandinavica 12 301-320
Faraci FM DL Kilgore and MR Fedde 1984 Attenuated pulmonary pressor response to hypoxia in bar-headed geese American Journal of Physiology 247 R402-R403
Farrell AP AK Gamperl and ETB Francis 1998 Comparative aspects of heart morphology In Gans C Gaunt AS (Eds) Biology of Reptilia vol 19 (Morphology) Society for the study of amphibians and reptiles Ithaca New York pp 375-424
Fishman AP 1976 Hypoxia on the pulmonary circulation How and where it acts Circulation Research 38 221-231
Glass M L RG Boutilier and N Heisler 1983 Ventilatory control of arterial PO2 in the turtle Chrysemys picta bellii effects of temperature and hypoxia Journal of Comparative Physiology B 151145-153
Hicks JW 1998 Cardiac Shunting in Reptiles Mechanisms Regulation and Physiological Function In Gans C Gaunt AS (Eds) Biology of the Reptilia vol 19 (Morphology G) Society for the Study of Amphibians and Reptiles Ithaca NY pp 425-483
Hicks JW and T Wang 1999 Hypoxic hypometabolism in the anesthetized turtle Trachemys scripta American Journal of Physiology 277 R18-23
Hicks JW and T Wang 1996 Functional role of cardiac shunts in reptiles Journal of Experimental Zoology 275 204-216
Hicks JW and T Wang 2004 Hypometabolism in reptiles behavioural and physiological mechanisms that reduce aerobic demands Respiratory Physiology and Neurobiology 141 261-271 2004
135
Hicks JW and SC Wood 1985 Temperature regulation in lizards effects of hypoxia American Journal of Physiology 248 R595-R600
Hlastala MP TA Standaert DJ Pierson and DL Luchtel 1985 The Matching of Ventilation and Perfusion in the Lung of the Tegu Lizard Tupinambis nigropunctatus Respiration Physiolology 60 277-294
Hochachka PW and PL Lutz 2001 Mechanism origin and evolution of anoxia tolerance in animals Comparative Biochemistry and Physiology 130B 435-459
Hochachka PW SC Land and LT Buck 1997 Oxygen sensing and signal transduction in metabolic defense against hypoxia lessons from vertebrate facultative anaerobes Comparative Biochemistry and Physiology 118A 23-29
Hochachka PW LT BuckCJ Doll and SC Land 1996 Unifying theory of hypoxia tolerance molecularmetabolic defense and rescue mechanisms for surviving oxygen lack Proceedings of the National Academy of Sciences USA 93 9493-9498
Jackson D C and K Schmidt-Nielsen 1966 Heat production during diving in the fresh water turtle Pseudemys scripta Journal of Cellular Physiology 67 225-232
Krosniunas E and JW Hicks 2003 Cardiac Output and Shunt during Voluntary Activity at Different Temperatures in the Turtle Trachemys scripta Physiological and Biochemical Zoology 76 679-694
Land SC LT Buck and PW Hochachka 1993 Response of protein synthesis to anoxia and recovery in anoxia-tolerant hepatocytes American Journal of Physiology 265 R41-48
Lillywhite HB KC Zippel and AP Farrell 1999 Resting and maximal heart rates in ectothermic vertebrates Comparative Biochemistry and Physiology 124A 369-382
Loacutepez-Barneo J R del Toro KL Levitsky MD Chiara and P Ortega-Saacuteenz 2004 Regulation of oxygen sensing by ion channels Journal of Applied Physiology 96 1187-1195
Luchtel DL and KV Kardong 1981 Ultrastructure of the lung of the rattlesnake Crotalus viridis oreganos Journal of Morphology 169 29-47
Lutz PL and S Kabler 1997 Release of adenosine and ATP in the brain of the freshwater turtle (Trachemys scripta) during long-term anoxia Brain Research 769 281-286
Maina JN 1989 The morphology of the lung of the black mamba Dendroaspis polylepis (Reptilia Ophidia Elapidae) A scanning and transmission electron microscopic study Journal of Anatomy 167 31-46
Malvin GM and SC Wood 1992 Behavioral hypothermia and survival of hypoxic protozoans Paramecium caudatum Science 255 1423-1425
McMurtry IF BW Hookway and BW Roos 1978 Red blood cells but not platelets prolong vascular reactivity of isolated rat lungs American Journal of Physiology 234 H186-H191
Milsom WK 1991 Intermittent breathing in reptiles Annual Review of Physiology 53 87-105
Milsom WK BL Langille and DR Jones 1977 Vagal control of pulmonary vascular resistance in the turtle Chrysemys scripta Canadian Journal of Zoology 55 359-367
Mortola JP 2004 Implications of hypoxic hypometabolism during mammalian ontogenesis Respiratory Physiology and Neurobiology 141 345-356
136
Mortola J P and K Labbe 2005 Oxygen consumption of the chicken embryo interaction between temperature and oxygenation Respiratory Physiology and Neurobiology 146 97-106
Mortola J P and PB Frappell 2000 Ventilatory responses to changes in temperature in mammals and other vertebrates Annual Review of Physiology 62 847-874
Motley HL A Cournand L Werko A Himmelstein and D Dresdale 1947 The influence of short periods of induced acute anoxia upon pulmonary artery pressures in man American Journal of Physiology 150 315-320
Nilsson GE and PL Lutz 1991 Release of inhibitory neurotransmitters in response to anoxia in turtle brain American Journal of Physiology 261 R32-37
Page RDM 2000 Extracting species trees from complex gene trees Reconciled trees and vertebrate phylogeny Molecular Phylogenetics and Evolution 14 89-106
Perry SP 1998 Lungs Comparative anatomy functional morphology and evolution In Gans C Gaunt AS (Eds) Biology of Reptilia vol 19 (Morphology) Society for the study of amphibians and reptiles Ithaca New York pp 1-92
Perry SF 1990 Recent advances and trends in the comparative morphometry of vertebrate gas exchange organs In Boutilier RG (Ed) Advances in Comparative and Environmental Physiology vol6 Springer-Verlag Berlin pp 45-71
Perry SF 1989 Mainstreams in the evolution of vertebrate respiratory structures In King AS McMelland J (Eds) Form and function in birds vol 4 Academic Press London pp 1-67
Perry SF 1983 Reptilian lungs Functional anatomy and evolution Advances in Anatomy Embryology and Cellular Biology 79 1-81
Piiper J 1992 Diffusion-perfusion inhomogeneity and alveolar-arterial O2 diffusion limitation ndash theory Respiration Physiology 87 349-356
Platzack B and JW Hicks 2001 Reductions in systemic oxygen delivery induce a hypometabolic state in the turtle Trachemys scripta American Journal of Physiology 281 R1295-1301
Powell FL and SR Hopkins 2004 Comparative physiology of lung complexity Implications for gas exchange News in Physiological Sciences 19 55-60
Robertson TP PI Aaronson and JPT Ward 1995 Hypoxic intracellular Ca2+ in pulmonary arteries evidence for PCK-independent Ca2+ sentization American Journal of Physiology 268 H301-307
Saiki C and JP Mortola 1997 Effect of 24-dinitrophenol on the hypometabolic response to hypoxia of conscious adult rats Journal of Applied Physiology 83 537-542
Shelton G and WW Burggren 1976 Cardiovascular dynamics of the chelonia during apnoea and lung ventilation Journal of Experimental Biology 64 323-343
Shimizu S PS Bowman G Thorne III and RJ Paul 2000 Effects of hypoxia on isometric force intracellular Ca2+ pH and energetics in porcine coronary artery Circulation Research 86 862-870
Smith MP MJ Russell JT Wincko and KR Olson 2001 Effects of hypoxia on isolated vessels and perfused gills of rainbow trout Comparative Biochemistry and Physiology 130A 171-181
137
Skovgaard N AS Abe DV Andrade and T Wang 2005 Hypoxic pulmonary vasoconstriction in reptiles A comparative study American Journal of Physiology (in review)
Steiner AA and LG Branco 2002 Hypoxia-induced anapyrexia implications and putative mediators Annual Review of Physiology 64 263-288
Taylor CR and ER Weibel 1981 Design of the mammalian respiratory system I Problem and strategy Respiration Physiology 44 1-10
Wang T J Altimiras W Klein and M Axelsson 2003 Ventricular haemodynamics in Python molurus separation of pulmonary and systemic pressures Journal of Experimental Biology 206 4241-4245
Wang T J Altimiras and M Axelsson 2002 Intracardiac flow separation in an in situ perfused heart from Burmese python Python molurus Journal of Experimental Biology 205 2715-2723
Wang T S Warburton A Abe and T Taylor 2001 Vagal control of heart rate and cardiac shunts in reptiles Relation to metabolic state Experimental Physiology 86 777-784
Wang T AS Abe and ML Glass 1998 Effects of temperature on lung and blood gases in the South American rattlesnake Crotalus durissus terrificus Comparative Biochemistry and Physiology 121A 7-11
Wang T EH Krosniunas and JW Hicks 1997 The role of cardiac shunts in the regulation of arterial blood gases American Zoologist 37 12-22
Wang T and JW Hicks 1996a Cardiorespiratory synchrony in turtles Journal of Experimental Biology 199 1791-1800
Wang T and JW Hicks 1996b The interaction of pulmonary ventilation and the right-left shunt on arterial oxygen levels Journal of Experimental Biology 199 1435-1446
Ward JPT VA Snetkov and PI Aaronson 2004 Calcium mitochondria and oxygen sensing in the pulmonary circulation Cell Calcium 36 209-220
Ward JPT and TP Robertson 1995 The role of endothelium in hypoxic pulmonary vasoconstriction Experimental Physiology 80 793-801
Weir EK and SL Archer 1995 The mechanism of acute hypoxic pulmonary vasoconstriction the tale of two channels FASEB Journal 9 183-189
Welling K-LK M Sander JB Ravn B Larsen U Abildgaard and O Amtorp 1997 Effect of alveolar hypoxia on segmental pulmonary vascular resistance and lung fluid balance in dogs Acta Physiologica Scandinanavica 161 177-186
West JB 2003 Thoughts on the pulmonary blood-gas barrier American Journal of Physiology 285 L501-L513
White FN JW Hicks and A Ishimatsu 1989 Relationship between respiratory state and intracardiac shunts in turtles American Journal of Physiology 256 R240-R247
Wood SC 1991 Interactions between hypoxia and hypothermia Annual Review of Physiology 53 71-85
138
BIOACCUMULATION AND ENANTIOSELECTIVE BIOTRANSFORMATION OF FIPRONIL BY RAINBOW TROUT (ONCORHYNCHUS MYKISS)
Brad J Konwick Aaron T Fisk Jimmy K Avants J MacArthur Long13 Arthur W Garrison
ABSTRACT
Dietary accumulation and enantioselective biotransformation was determined for rainbow trout (Oncorhynchus mykiss) exposed to fipronil a widely used chiral pesticide Measurement of the fish carcass tissue (whole fish minus GI tract and liver) showed a rapid accumulation of fipronil at microgram per gram concentrations during the 32 day uptake phase The low biomagnification factor (005) and short depuration half-life (058 d) determined for fipronil indicated a rapid clearance of this compound by the fish thus fipronil would not be expected to biomagnify in the food chain Changes in enantiomer fractions (EFs) over the course of the study indicated that depuration was due to biotransformation with preferential metabolism of the (+) enantiomer of fipronil Formation of the metabolite fipronil sulfone detected in the fish carcass validated the observation of biotransformation indicated by chiral analysis Fipronil sulfone was more persistent than fipronil in fish with a depuration half-life of 236 d thus making this compound a possible tracer of fipronil exposure
INTRODUCTION
Fipronil is a phenylpyrazole-class insecticide first approved in 1996 for use on a number of crops in the US Typical fipronil applications include rice culture turf grass management and residential pest control (US EPA 1997 US EPA 1996) Fipronil has been recognized as a disrupter of γ-aminobutyric acid (GABA) gated chloride channels in nerve cells leading to hyper-excitation and eventual mortality (Gant et al 1998) This toxicity is much greater in invertebrates than in mammalians due to their different GABA receptor binding affinities (Hainzl et al 1998) While fipronil is effective in insect control at comparable potencies to organophosphorous (OP) and carbamate insecticides its use is expected to increase relative to other classes of pesticides because of developing species resistance to OP insecticides and fipronilrsquos commercial availability (Hosie et al 1995) Fipronil applications can impact aquatic environments at low concentrations (US EPA 2001 US EPA 1997) thus there is potential for adverse effects on non-target species In addition fipronilrsquos degradation products which are similar in potency to fipronil (Schlenk et al 2001) and more environmentally persistent (Walse et al 2004 US EPA 1997) may lead to long-term effects on non-target species
To assess the potential risk of contaminants such as current-use pesticides (eg fipronil) it is important to understand their environmental accumulation in aquatic biota Typically the bioaccumulation potential for most current-use pesticides is considered minimal because of their low octanol-water partition coefficients (log Kow) a good predictor of bioaccumulation However fiponilrsquos log Kow (401) (US EPA 1996) is in the range of some persistent chemicals (eg α-HCH
US Environmental Protection Agency National Exposure Research Laboratory Athens GA
139
13
β-HCH) thus indicating the potential for bioaccumulation in aquatic biota On the other hand current-use pesticides are readily metabolized by cytochrome P450 isozymes due to the presence of structural groups that are susceptible to biotransformation reactions Biotransformation is a key component of a fishrsquos or any species elimination pathway for contaminants making them more water soluble and excretable Ultimately elimination rate (eg via biotransformation) is what determines the potential for a chemical to bioaccumulate and cause adverse effects in organisms (Borga et al 2004) Unfortunately methods to assess biotransformation are limited especially for fish which are believed to have little biotransformation ability This is inferred from fish having lower concentrations and activities of cytochrome P450s compared to mammals and birds (Stegeman and Kloeppper-Sams 1987 Kleinow et al 1987) Also when modeling contaminant movement through food webs biotransformation in fish is assumed to be negligible (Thomann 1989)
Investigations focusing on chiral analysis have been used recently to study the biotransformation dynamics of contaminants Approximately 25 of current-use pesticides are chiral (Williams 1996) in addition to many legacy pesticides (eg chlordanes some DDT isomers) and some polychlorinated biphenyls (PCBs) (Kaiser 1974) Chiral compounds exist as two non-superimposable mirror image forms called enantiomers which are designated as (+) and (-) based on their rotation of plane-polarized light The manufacture of chiral chemicals results in a mixture designated as racemic (plusmn) which contains 50 of each enantiomer and is the form in which they are typically applied and released into the environment Enantiomers have identical physical-chemical properties (Garrison et al 1996) however the relative abundances of enantiomers can change after being subjected to metabolic processes (eg enzyme mediated receptors biochemical reactions) due to the different spatial orientation of the enantiomers (Wong et al 2002) Thus changes in the enantiomer fractions (EF) of chiral contaminants within species can serve as a tracer for biotransformation The observation of non-racemic residues using chiral analysis has previously shown the ability of fish (Wong et al 2002) cetaceans (Hoekstra et al 2002) and birds (Fisk et al 2001) to bioaccumulate and biotransform chiral organochlorine (OC) contaminants enantioselectively Determining the biotransformation potential of OC contaminants due to their environmental persistence has been the focus of most chiral studies However chiral analysis of current-use pesticides in biota can achieve these same goals yet has not received much attention
In this paper we report the dietary accumulation and biotransformation of racemic fipronil in juvenile rainbow trout (Oncorhynchus mykiss) Rainbow trout was chosen as the test species because of its widespread species distribution and extensive knowledge regarding its bioaccumulation and physiology Dietary exposure was used because it is the major contributor in food chain transfer especially for hydrophobic contaminants and higher trophic organisms (Fisk et al 1998) To our knowledge this is the first experiment to determine the toxicokinetics of fipronil in fish via dietary exposure or its chiral biotransformation in any species
MATERIALS AND METHODS
Chemicals and Food Preparation
Fipronil was obtained from ChemService (West Chester PA 98 pure) All solvents (Ultra Resi-Analyzedreg) were obtained from JT Baker (Phillipsburg NJ) A stock solution of fipronil in methanol (1000 μgmL) was diluted in hexane (1100) and mixed with the commercial trout food (Zeigler Gardner PA) to give a nominal concentration of 10 μgg in the feed the solvent was then slowly evaporated to dryness in a rotary evaporator Control food was treated in an identical manner
140
but without addition of the target compound The food was air dried for 48 hours and then stored in amber jars at 4degC The trout food consisted of 38 protein 14 lipid and 3 fiber The concentrations of fipronil were determined in spiked and control food using the same technique described below to determine concentrations in rainbow trout tissue (Table 1)
Table 1 Concentrations (μgg wet wt) and Enantiomeric Fractions (EFs) of Fipronil (mean plusmn SE) in Control and Treated Food (n = 3)
Compound Control food Treated food
Cfood EF Cfood EF
Fipronil ND - 768 plusmn 018 0497 plusmn 0001
ND = Not Detected
Experiments
Juvenile rainbow trout (initial weights 10 plusmn 05 g mean plusmn SE) were collected from Lake Burton Fish Hatchery (GA) and randomly assigned to one of two 800 gallon fiberglass aquaria (45 fish per tank) with recirculating carbon-dechlorinated tap water chilled (Frigid Units Toledo OH) to 12degC Fish were maintained with a 12 h light 12 h dark photoperiod One tank of fish was exposed to the fipronil treated food whereas the other tank served as a control Fish were exposed to the spiked food for 32 days (uptake) followed by 96 days of clean food (depuration) The daily rate of feeding was 15 of the mean weight of the rainbow trout corrected for weight gain after each sampling day All food was consumed within ~ 5 minutes of feeding Three fish each were randomly sampled from the fipronil treatment and control treatment on days 0 2 4 8 16 and 32 of the uptake phase and days 34 36 40 48 64 and 128 of the depuration phase Sampled fish were separated into liver gastrointestinal (GI) tract (including stomach and contents spleen pyloric caeca intestines and adipose tissue associated with these organs) and carcass (whole fish minus GI tract and liver) The GI tract was removed so as to not measure the target analyte that remained in undigested food Only carcass results were used in calculating bioaccumulation parameters and enantiomer fractions
Chemical Analysis
Carcass samples were weighed stored frozen at -8degC and then freeze-dried For analysis samples were homogenizedextracted in dichloromethane (DCM) hexane (11) using a polytron (PowerGen 125 Fisher Scientific) The whole fish carcass was homogenized except for the last sampling day on which only 10-12 g of carcass fillet was extracted due to the large size of the fish Polychlorinated biphenyl 65 was added to samples as a surrogate recovery standard just before extraction Samples were extracted twice the extracts were then combined and evaporated to 10 ml One ml of the extract was used to determine lipids gravimetrically The remaining extract was then evaporated to 2 ml and applied to a gel permeation chromatography (GPC) column to remove lipids The GPC columns (inner diameter 295 mm length 400 mm reservoir 500 ml) were packed with 60 g (dry weight) of 200-400 mesh Bio-Beadsreg S-X3 (Bio-Rad Laboratories Hercules CA) The column was eluted with 340 ml of DCM hexane (11) the first 140 ml contained the lipids and was discarded The next 200 ml eluate contained the target analyte and was rotary evaporated to 1 ml before analysis
Analysis of the extracts for fipronil was by chiral capillary gas chromatography with mass spectrometric detection using a Hewlett-Packard 6890 GC with a 5973 mass selective detector The
141
column was a BGB 172 (BGB Analytik AG Anwil Switzerland) containing a chiral phase composed of 20 tert-butyldimethylsilylated-β-cyclodextrin The column was 30 m long 025 mm ID and of 025 μm film thickness GC conditions were column temperature 150 to 220o at a rate of 15omin injection splitless at 250o carrier gas helium at a flow rate of 15 mLmin Fipronil was detected and measured using selected ion monitoring of ions 367 and 369 electron voltage was 70 eV This BGB column resolved the enantiomers of fipronil to baseline Calculation of concentrations of fipronil in the fish extracts was based on the sum of GC areas of both enantiomers compared to the sum of GC areas of both enantiomers of a fipronil standard run on the same day Typically 3 fipronil standards were analyzed with a batch of 10 fish samples Fipronil concentrations were corrected for each extract sample by comparison to the recovery of the surrogate standard (PCB 65) which had been added in known amount to each whole fish carcass before extraction recovery of the surrogate standard ranged from 35 to 77
To assess biotransformation enantiomeric fractions (EFs) for fipronil were calculated from concentration data using
EF = (+) [(+) + (-)]
where (+) and (-) are concentrations of the individual fipronil enantiomers Using pure fipronil enantiomers it was observed that the (+)-enantiomer eluted first from the BGB 172 column under these analytical conditions EFs of the standard sample of fipronil used for spiking the fish food was racemic (050 plusmn 001) (n = 4) as was the fipronil in the food residues (Table 1)
Data analysis
Growth rates were determined by fitting all fish weight data to an exponential model (ln fish weight = a + bt where a is a constant b is the growth rate and t is time in days) As growth dilution can cause differences in concentration between individual fish all concentrations were corrected for growth by multiplying the fish concentrations by a factor of (1 + bt) where b is the growth rate Depuration rate (kd) constants were determined by fitting the depuration data to a first order decay curve (ln concentration = a + kdt where a is a constant and t is time in days) Half-life (t12) values were calculated using ln 2kd Equilibrium biomagnification factors (BMFeq) were predicted from the equation
BMF = CfishCfood
where Cfish is the average fipronil concentration at steady state in the fish and Cfood is the average concentration in the food normalized to lipid content Steady state was assumed when a significant increase in fish concentrations was not observed over three consecutive time intervals and did not increase thereafter Because we did not use a replicate for each treatment (only one aquarium) pseudoreplication was addressed by using average concentration values of the three replicate fish taken at each time to determine all rate constants Statistical differences for tested parameters between treatments were analyzed using the t-test (α = 005)
142
RESULTS AND DISCUSSION
Fish Health and Growth
Exposure to fipronil did not appear to influence the health of rainbow trout There was no mortality and coloration and behavior of the fipronil exposed fish were consistent with control fish The growth rate of fipronil exposed fish was 0015 d-1 (Figure 1) and was similar to that of control fish 0017 d-1
Fish
Wet
Wei
ght
(g)
10
100
y = 0015x + 267 p lt 00001
0 20 40 60 80 100 120
Day
Figure 1 Growth rate (0015 d-1) of fipronil exposed fish weight is natural log r2 = 078
Bioaccumulation parameters
Figure 2 shows the uptake and elimination of fipronil over time After two days fipronil was detected in fish exposed to the spiked food and accumulated rapidly during the uptake phase at concentrations ranging from 16 to 37 μgg lipid in carcass tissue reaching steady state starting on day eight Fipronil was rapidly eliminated from fish and was not detected after day 34 of depuration The calculated depuration half-life of fipronil in fish was 058 d indicating the rapid clearance of this compound The low equilibrium BMF of 005 indicated that fipronil will not biomagnify in the food chain at higher trophic levels due again to its rapid clearance There are no similar studies with which to compare our bioaccumulation values for fipronil in fish however invertebrates either fed or exposed in aqueous solution to fipronil indicated a high accumulation potential (Chaton et al 2002 Chaton et al 2001) Similar studies investigating the toxicokinetics of fipronil at lower trophic levels
143
would determine whether this compound is transferable to higher trophic species such as rainbow trout The dietary exposure regimen used in this study involved a high exposure concentration to rainbow
trout with no observable effects yet concentrations obtained in fish carcass tissue reached a level 100 fold above the LC50 of 246 μgL determined for this species (US EPA 1996) This resistance in toxicity may be explained by fipronil not efficiently reaching the target site (ie GABA receptor) through dietary exposure because of sequestration in fat reserves where fipronil is likely to accumulate This sequestration combined with a high-rate of detoxification by metabolism for rainbow trout may lead to a tolerance for elevated fipronil concentrations It should be noted that fipronil was not detected in control fish carcass throughout the study as a result of not being detected in control food
Day
2 4 8 16
32 34 36 40
48
64
Con
cent
ratio
n (u
gg
lipid
)
005
1
5 8
Enantiom
eric Fraction (EF)
040
045
050
055
060
Fipronil Concentration Fipronil EF
depuration
ND
uptake
Figure 2 Dietary accumulation and depuration curve for fipronil in rainbow trout Fipronil was not detected (ND) after day 36 with a depuration half-life of 058 d Each circle represents the mean concentration plusmn SE of three fish Each square represents the mean EF plusmn SE of three fish
Enantiomer Fractions
Calculated enantiomeric fractions (EFs) showed that relative abundance of fipronil enantiomers changed quickly over time in this study (Figure 2) After two days the (-) enantiomer is more prominent indicating a greater enantioselective biotransformation rate of the (+) enantiomer This EF trend continued throughout the uptake phase of the experiment before a possible slight increase in EF during the depuration phase The non-racemic residues found here are a strong indication of metabolism over time and can serve as a tracer of exposure time For example if native fish were collected and their EFs were determined this value could give an indication of when initial exposure to fipronil had occurred and likewise how long before complete elimination of this compound was likely
144
The changes in EFs are most likely due to biotransformation by the rainbow trout Enantioselective uptake of fipronil is unlikely because the transfer from GI tract into the body through mixed micelle vesicles is a passive transport process for hydrophobic compounds and is not considered to be enantioselective (Drouillard and Norstrom 2000 Landoni et al 1997) Likewise elimination of fipronil such as excretion through feces is considered a passive process and not expected to be stereospecific (Thomann 1989) Similarly elimination through the gills is not enantioselective involving passive partitioning between the gill surface and water (Thomann 1989) The observed EFs suggest that enantioselective metabolism started early during the uptake phase of the experiment and proceeded in such a way that residues were non-racemic until complete biotransformation of fipronil
Day
2 4 8 16
32 34 36
40
48
64
Con
cent
ratio
n (u
gg
lipid
)
0 05
1
5 8
F ipronil Sulfone m etabolite
uptake depuration
ND
Figure 3 Concentrations of fipronil and fipronil sulfone a metabolite of fipronil in rainbow trout Fipronil sulfone was not detected (ND) after day 64 with a depuration half-life of 236 d Each data point represents the mean concentration plusmn SE of three fish
The detection of fipronil metabolites in exposed fish would confirm that biotransformation was occurring Analysis for its known metabolite from rat studies the oxidation product fipronil sulfone indicated the presence of this compound within fish carcass tissue (Figure 3) It was detected concurrently with the parent compound starting on day two and at higher concentrations than fipronil throughout the study Because both compounds were detected in fish throughout the study it is important to note that any effects most likely at the neuro-cellular level may be enhanced by both compounds having the same mode of action From this data we were able to establish a depuration half-life of 236 days for fipronil sulfone To our knowledge no further biotransformation pathways have been identified for fipronil sulfone apparently this compound was excreted by the fish as is It should be noted that very low concentrations of fipronil sulfone were detected in the food exposed to
145
rainbow trout a result of its presence in the standard used to spike the food However concentrations of fipronil sulfone detected in food were approximately 40 times lower than fipronil The BMF of 48 for fipronil sulfone calculated from our fish food and fish tissue concentrations is unlikely for this low log Kow compound (368) (Walse et al 2004) that is similar in persistence to fipronil which has a calculated BMF of 005 A BMF of this magnitude means fipronil sulfone would biomagnify to the extent of some of the higher chlorinated PCBs which is clearly not the case due to its rapid elimination Therefore the high concentrations of fipronil sulfone found in our exposed fish are the direct result of
biotransformation of fipronil and do not come from the spiked food This study is the first to our knowledge to show the formation of fipronil sulfone by fish with direct implications for using this compound as a tracer of exposure to fipronil
CONCLUSIONS
This study shows that the use of chiral compounds can provide insight into biotransformation processes Through measurement of EFs we were able to demonstrate the biological metabolism of fipronil by fish which could not have been observed with traditional achiral analysis Formation and detection of fipronil sulfone a metabolite of fipronil in the fish was further proof of metabolic transformation Measurements of the EF of chiral compounds may indicate time of initial exposure an important component in risk assessment of these chemicals
DISCLAIMER
This paper has been reviewed in accordance with the US Environmental Protection Agencys peer and administrative review policies and approved for presentation and publication Mention of trade names or commercial products does not constitute endorsement or recommendation for use
REFERENCES
Borga K AT Fisk PF Hoekstra and DCG Muir 2004 Biological and chemical factors of importance in the bioaccumulation and trophic transfer of persistent organochlorine contaminants in arctic marine food webs Environmental Toxicology and Chemistry 23 2367-2385
Chaton PF P Ravanel M Tissut and JC Meyran 2002 Toxicity and bioaccumulation of fipronil in the nontarget arthropodan fauna associated with subalpine mosquito breeding sites Ecotoxicology and Environmental Safety 52 8-12
Chaton PF P Ravanel JC Meyran and M Tissut 2001 The toxicological effects and bioaccumulation of fipronil in larvae of the mosquito Aedes aegypti in aqueous medium Pesticide Biochemistry and Physiology 69 183-188
Drouillard KG and RJ Norstrom 2000 Dietary absorption efficiencies and toxicokinetics of polychlorinated biphenyls in ring doves following exposure to arochlorreg mixtures Environmental Toxicology and Chemistry 19 2707ndash2714
146
Fisk AT J Moisey KA Hobson NJ Karnovsky and RJ Norstrom 2001 Chlordane components and metabolites in seven species of Arctic seabirds from the northwater polynya relationships with stable isotopes of nitrogen and enantiomeric fractions of chiral components Environmental Pollution 113 225-238
Fisk AT RJ Norstrom CD Cymbalisty and DCG Muir 1998 Dietary accumulation and depuration of hydrophobic organochlorines bioaccumulation parameters and their relationship with the octanolwater partition coefficient Environmental Toxicology and Chemistry 17 951-961
Gant DB AE Chalmers MA Wolff HB Hoffman and DF Bushey 1998 Fipronil action at the GABA receptor Reviews in Toxicology 2 147-156
Garrison AW P Schmitt D Martens and A Kettrup 1996 Enantiomeric selectivity in the environmental degradation of dichlorprop as determined by high-performance capillary electrophoresis Environmental Science and Technology 30 2449-2455
Hainzl D LM Cole and JE Casida 1998 Mechanisms for selective toxicity of fipronil insecticide and its sulfone metabolite and desulfinyl photoproduct Chemical Resources Toxicology 11 1529-1535
Hoekstra PF CS Wong TM OrsquoHara KR Solomon SA Mabury and DCG Muir 2002 Enantiomer-specific accumulation of PCB atropisomers in the bowhead whale (Balaena
mysticetus) Environmental Science and Technology 36 1419-1425
Hosie AM HA Baylis SD Buckingham and DB Sattelle 1995 Actions of the insecticide fipronil on dieldrin sensitive and resistant GABA receptors of Drosophila melanogaster British Journal of Pharmacology 115 909-912
Kaiser KLE 1974 On the optical activity of polychlorinated biphenyls Environmental Pollution 7 93-101
Kleinow KM MJ Melancon and JJLech 1987 Biotransformation and induction implications for toxicity bioaccumulation and monitoring of environmental xenobiotics in fish Environmental Health Perspectives 71 105-119
Landoni MF AL Soraci P Delatour and P Lees 1997 Enantioselective behaviour of drugs used in domestic animals a review Journal of Veterinary Pharmacology and Therapeutics 20 1-16
Schlenk D DB Huggett J Allgood E Bennett J Rimoldi AB Beeler D Block AW Holder R Hovinga and P Bedient 2001 Toxicity of fipronil and its degradation products to Procambarus sp Field and laboratory studies Archives of Environmental Contamination and Toxicology 41 325-332
Stegeman JJ and PJ Kloepper-Sams 1987 Cytochrome P-450 isozymes and monooxygenase activity in aquatic animals Environmental Health Perspectives 71 87-95
147
Thomann RV 1989 Bioaccumulation model of organic chemical distribution in aquatic food chains Environmental Science and Technology 23 699-707
U S Environmental Protection Agency 2001 Fipronil environmental fate and ecological effects assessment and characterization for a Section 3 for broadcast treatment with granular product to control turf insects and fire ants (addendum) Environmental Fate and Effects Division Office of Pesticide Programs Washington DC USA
U S Environmental Protection Agency 1997 Environmental fate and effects Section 3 registration decision for fipronil Use on rice seed D235912 Environmental Fate and Effects Division Office of Pesticide Programs Washington DC USA
U S Environmental Protection Agency 1996 New pesticide fact sheet EPA 737-F-96-005 Office of Pesticide Programs Washington DC USA
Walse SS SL Morgan L Kong and JL Ferry 2004 Role of dissolved organic matter nitrate and bicarbonate in the photolysis of aqueous fipronil Environmental Science and Technology 38 3908-3915
Walse SS PL Pennington GI Scott and JL Ferry 2004 The fate of fipronil in modular estuarine mesocosms Journal of Environmental Monitoring 6 58-64
Williams A 1996 Opportunities for chiral agrochemicals Pesticide Science 46 3-9
Wong CS F Lau M Clark SA Mabury and DCG Muir 2002 Rainbow trout (Oncorhynchus mykiss) ban eliminate chiral organochlorine compounds enantioselectively Environmental Science and Technology 36 1257-1262
148


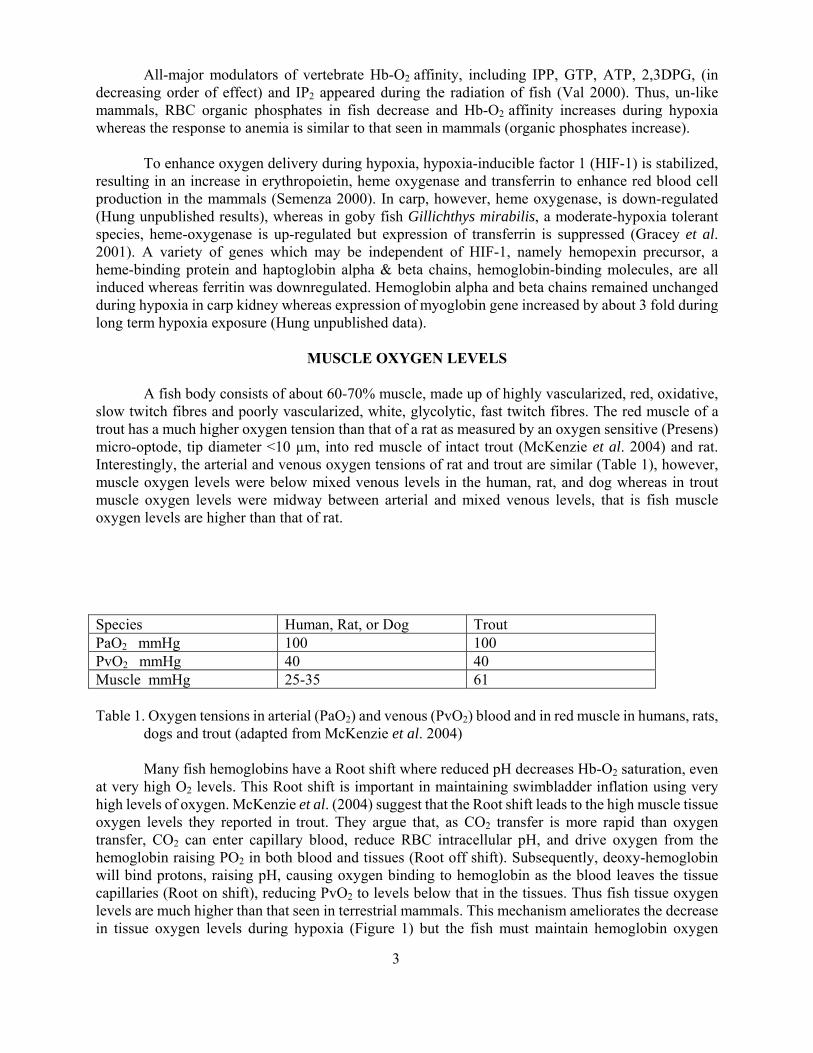
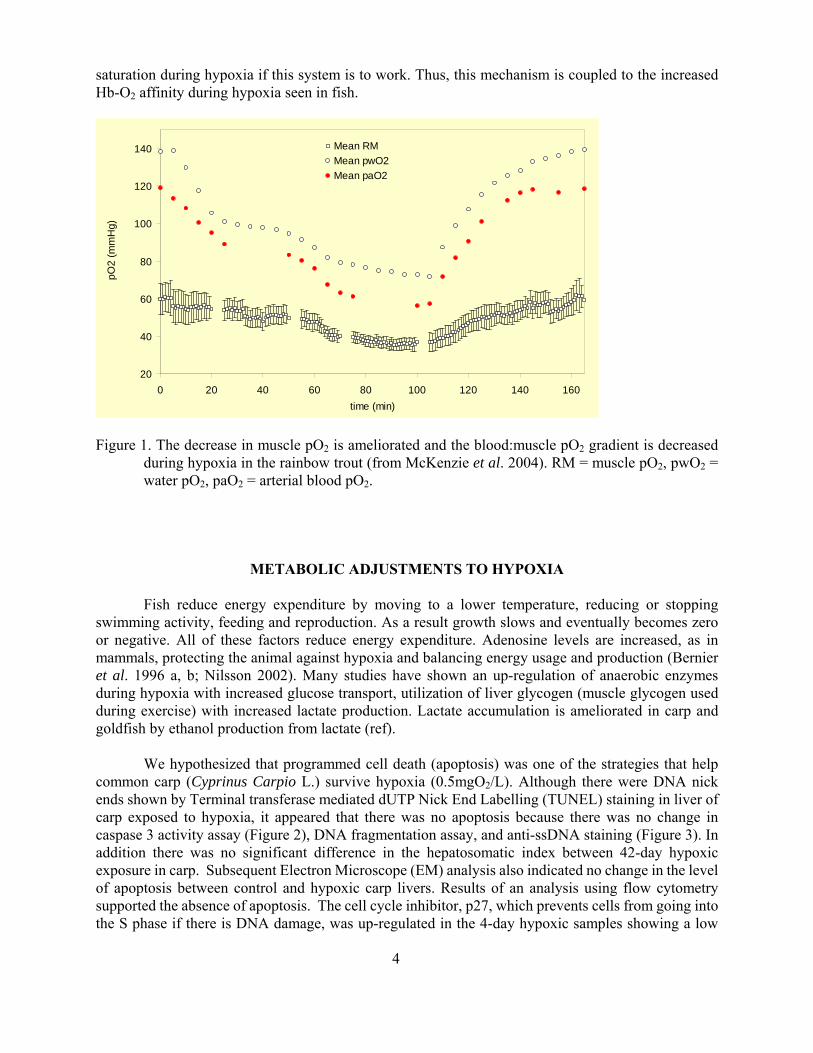
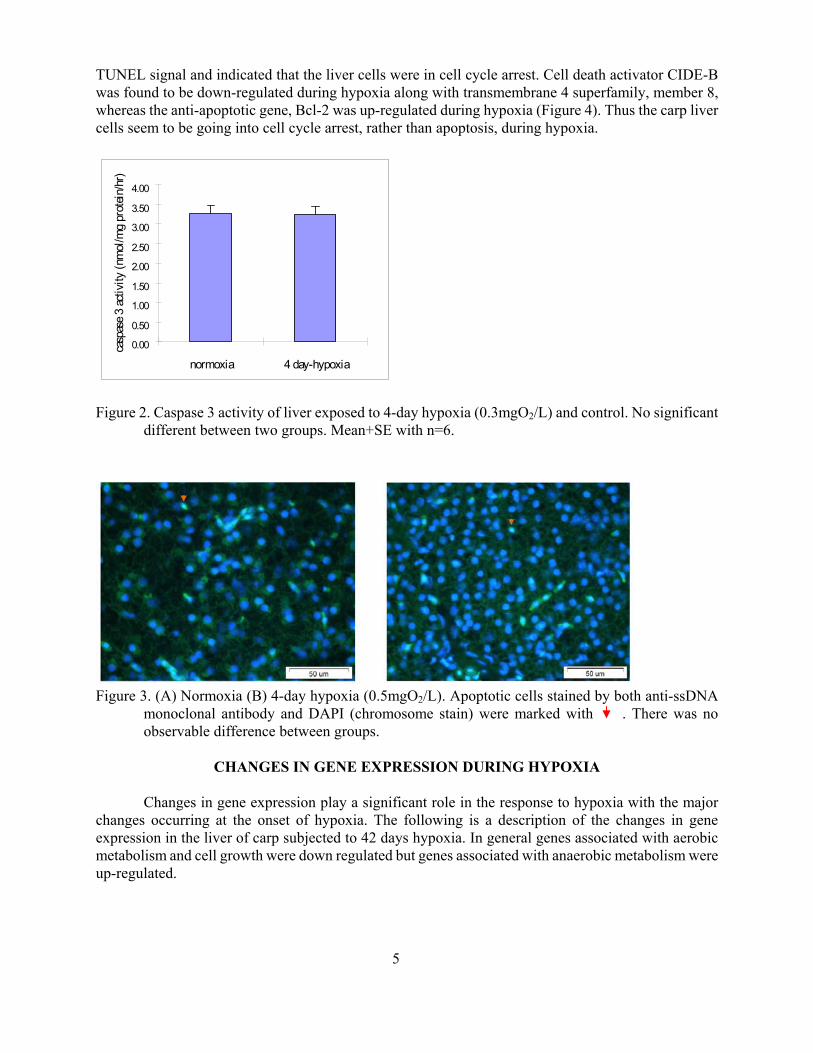
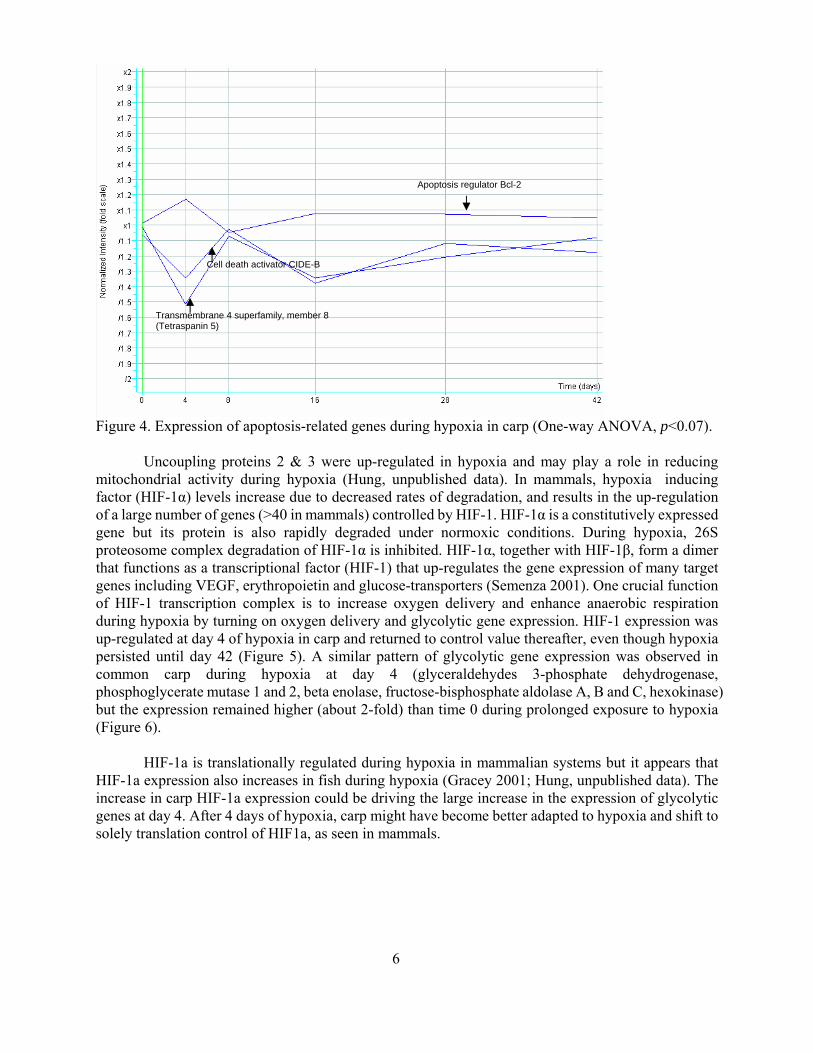


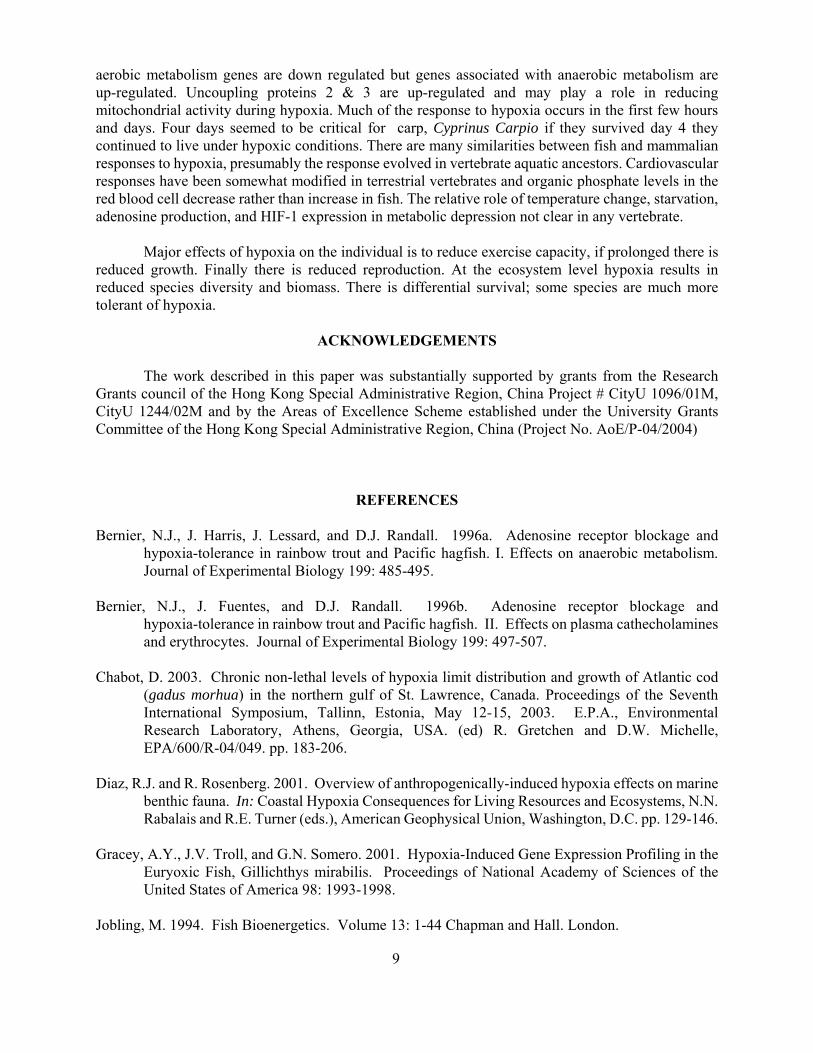

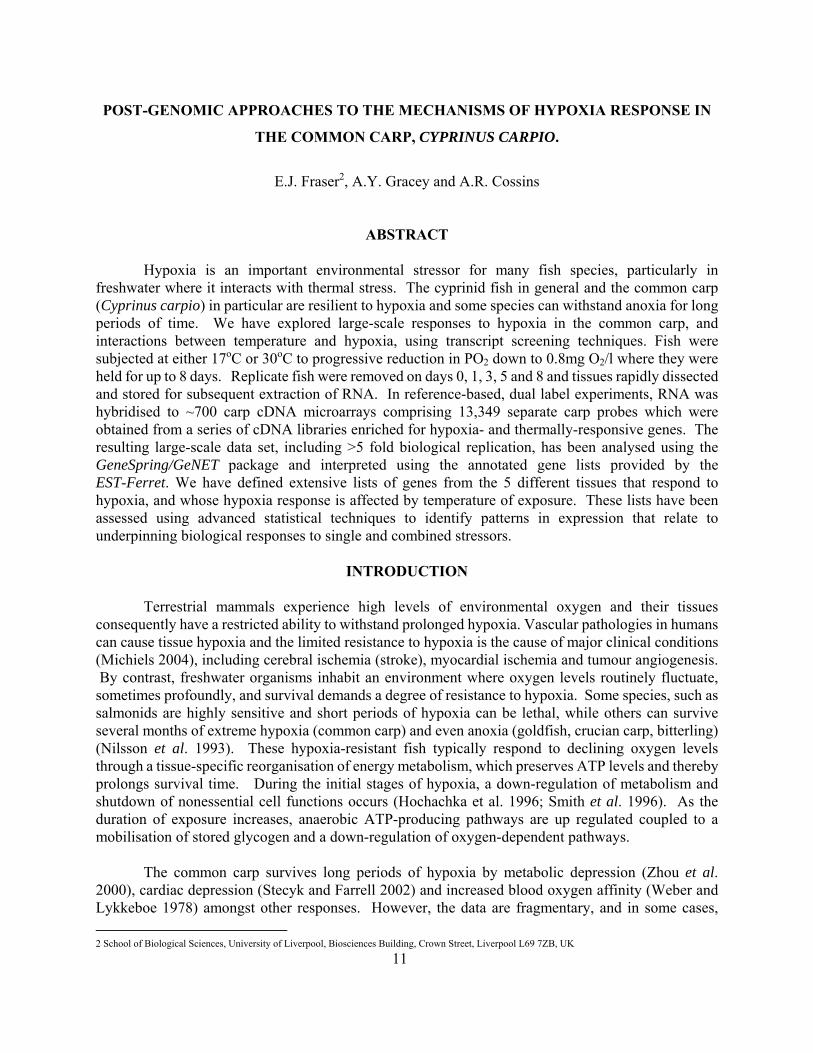


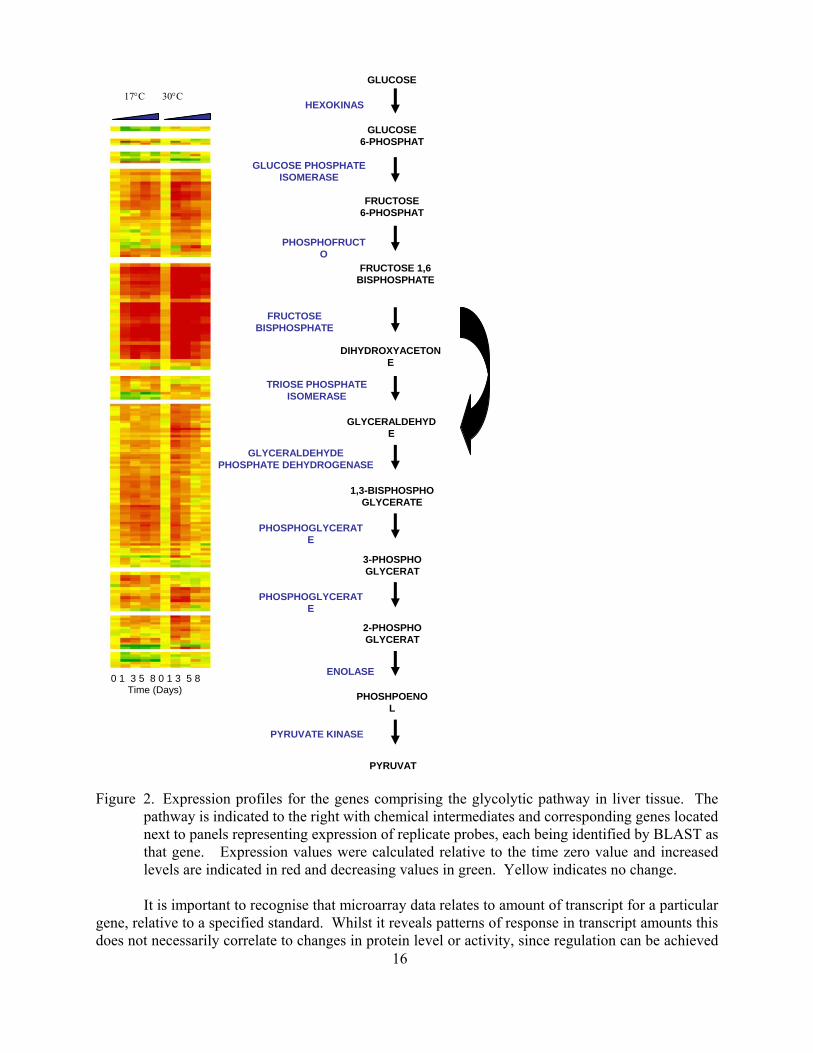


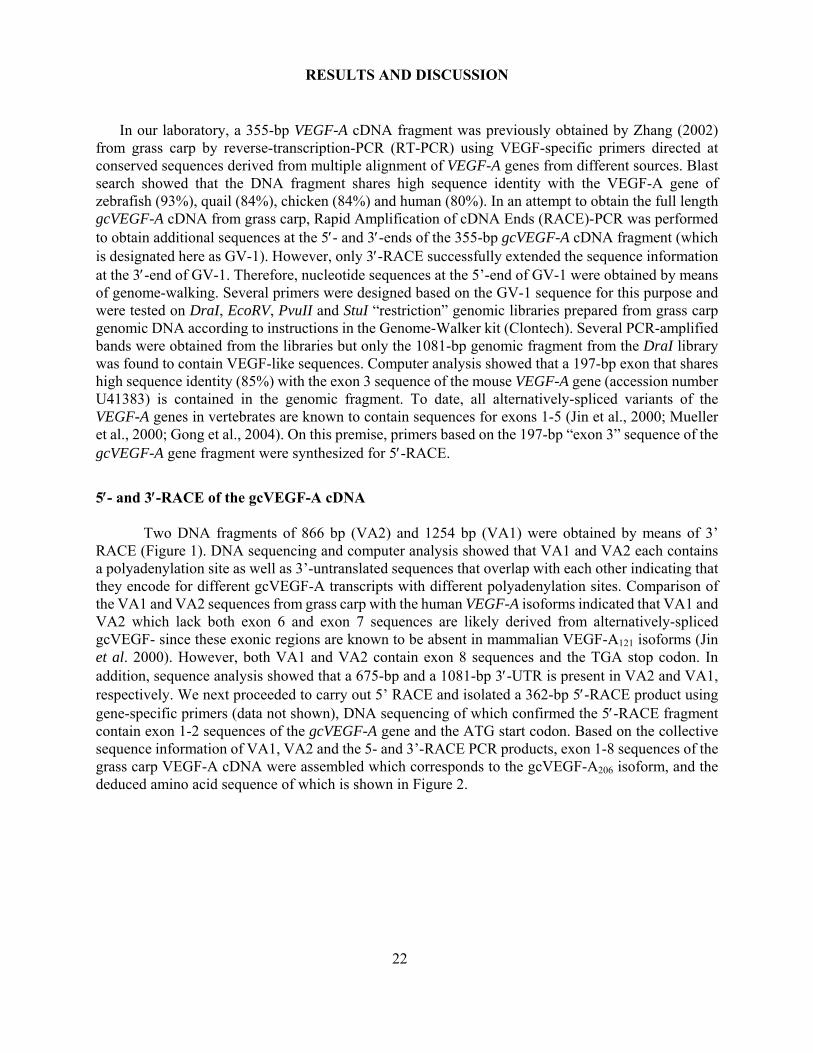
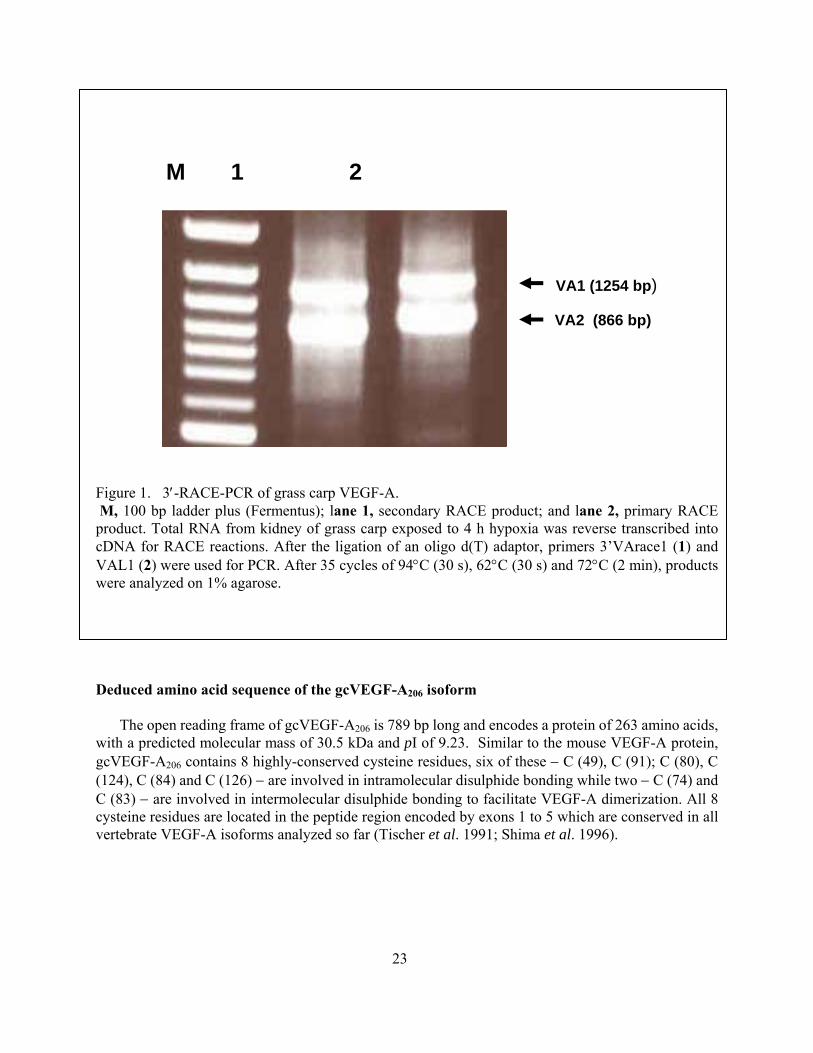


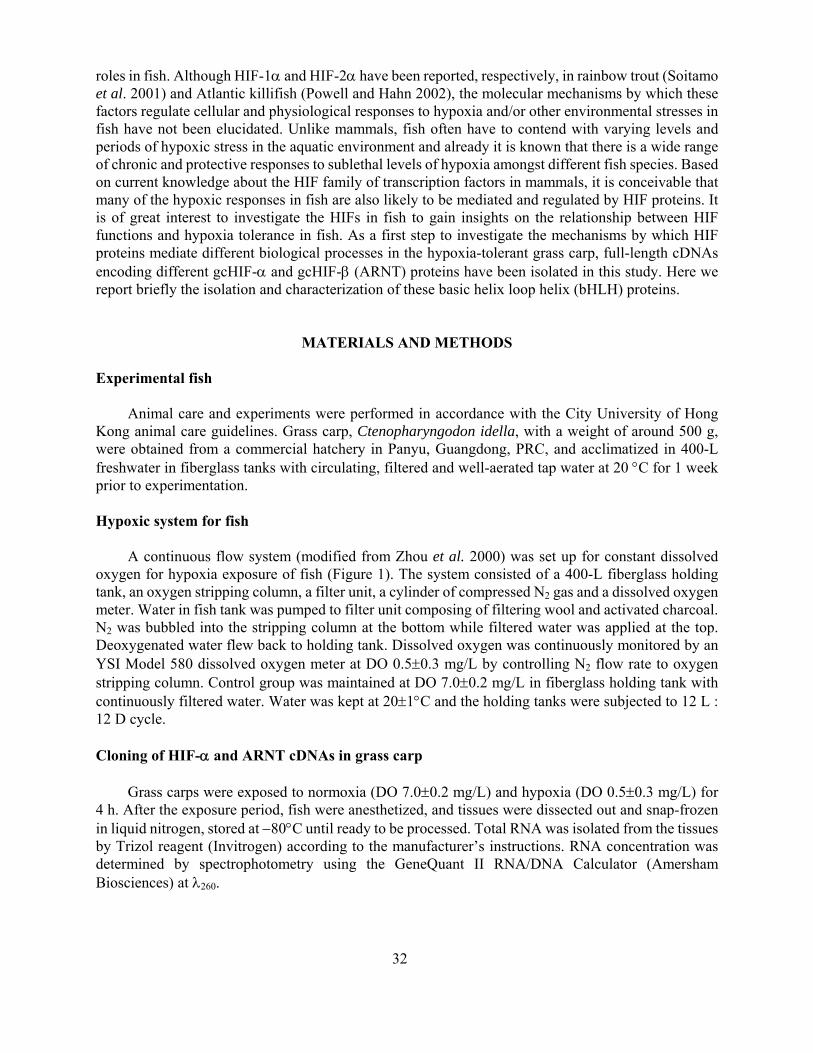
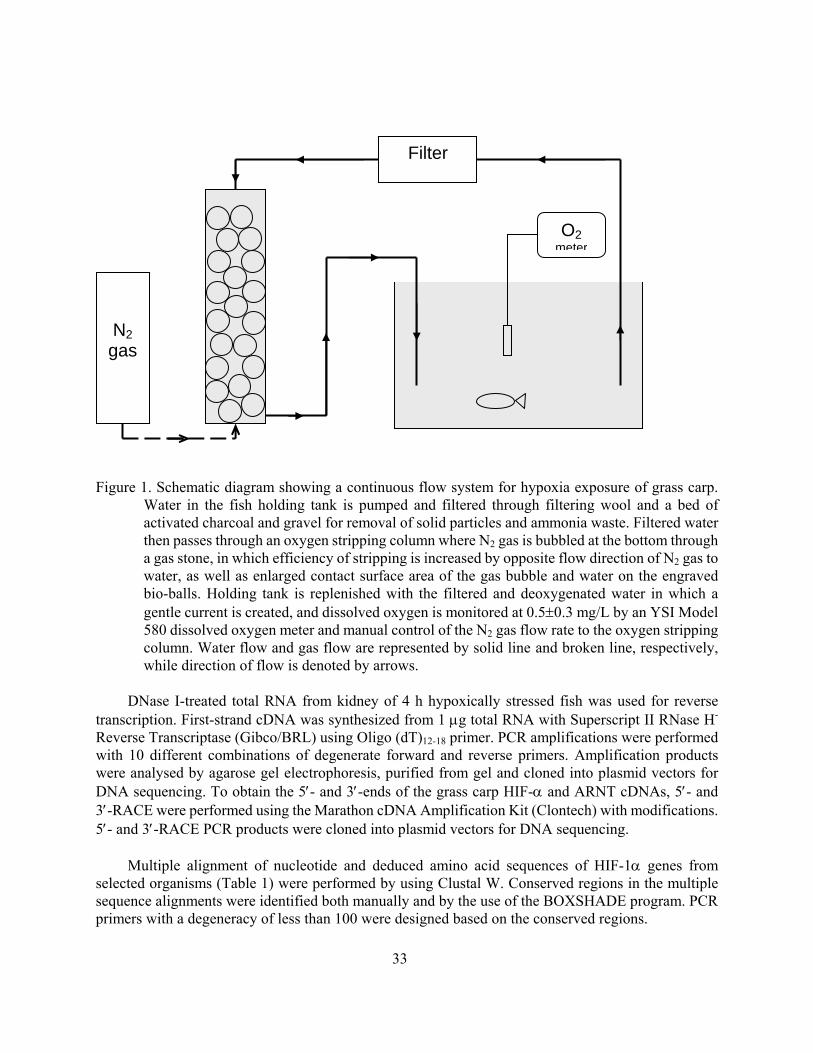


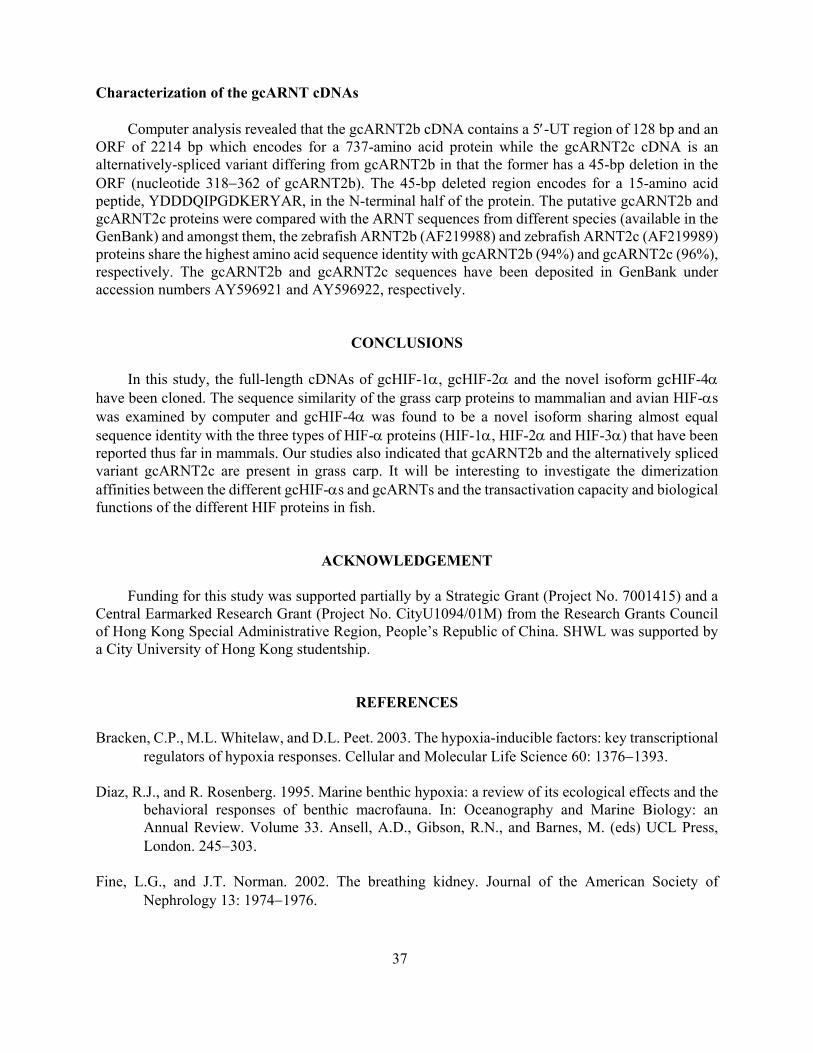


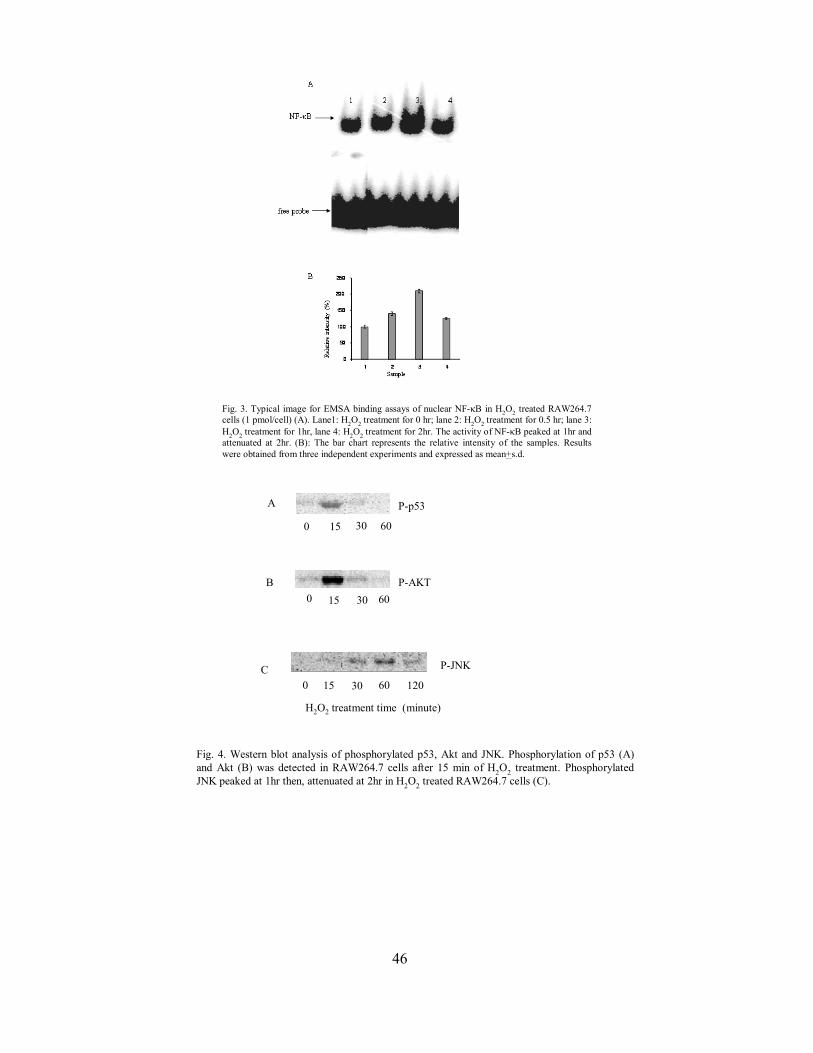

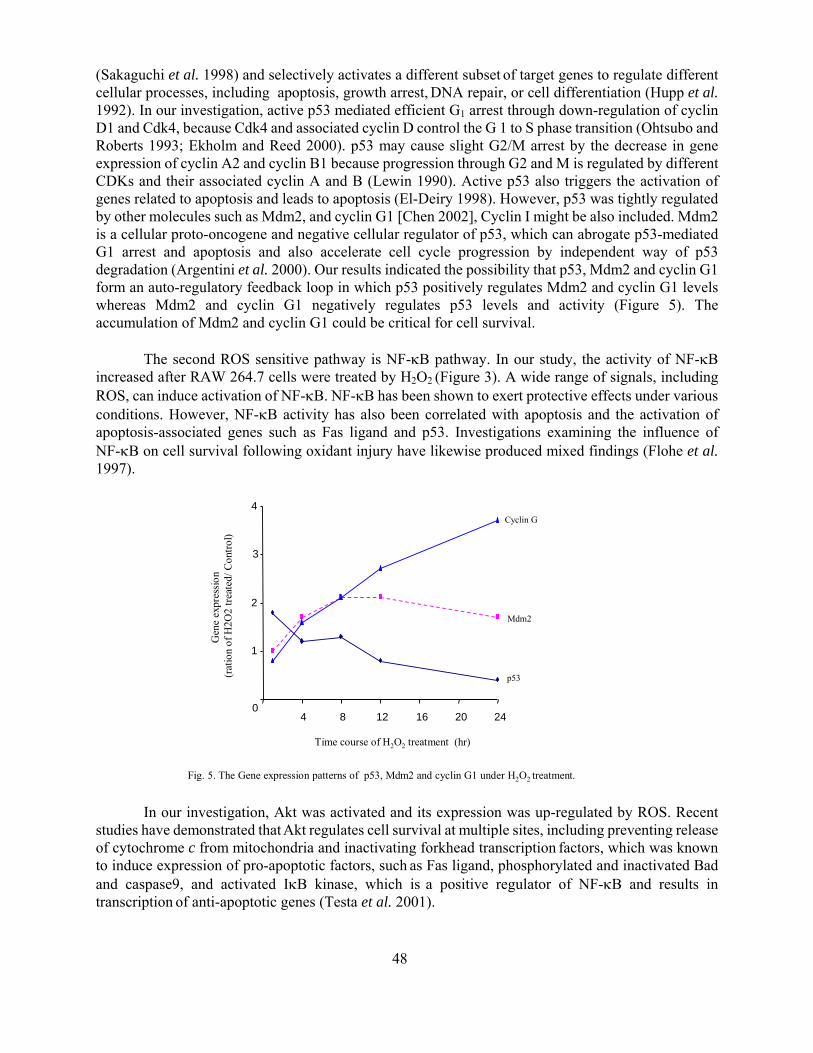


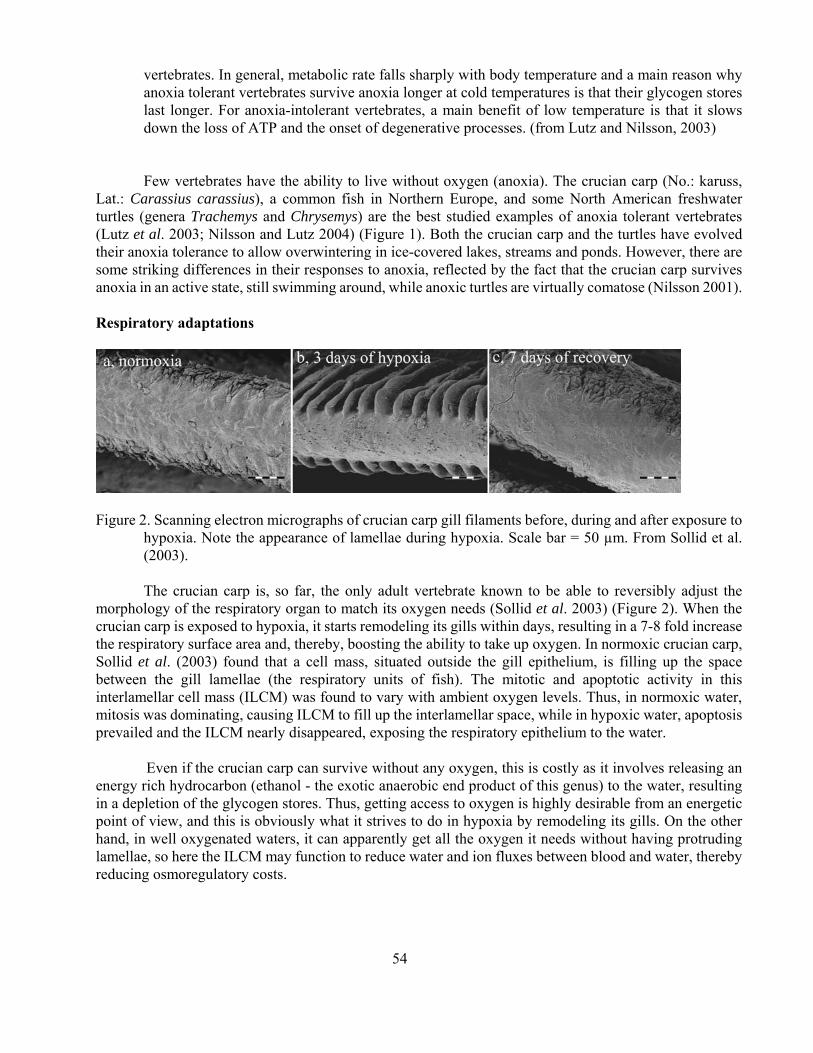
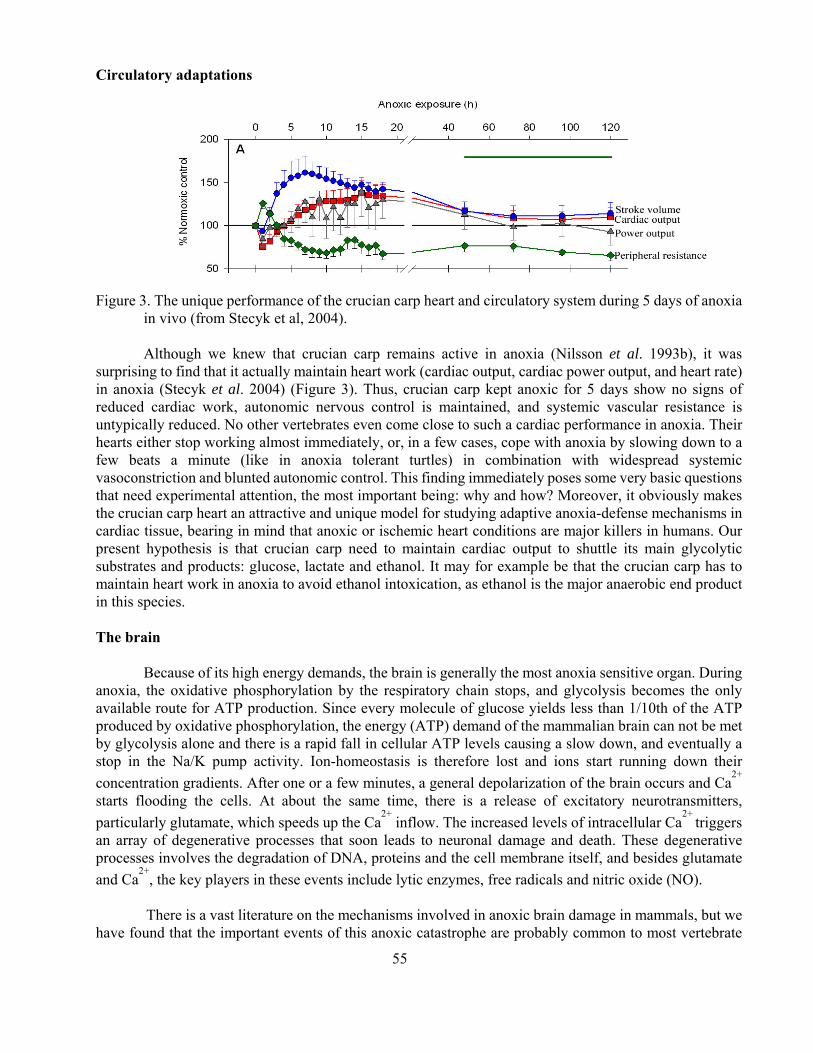


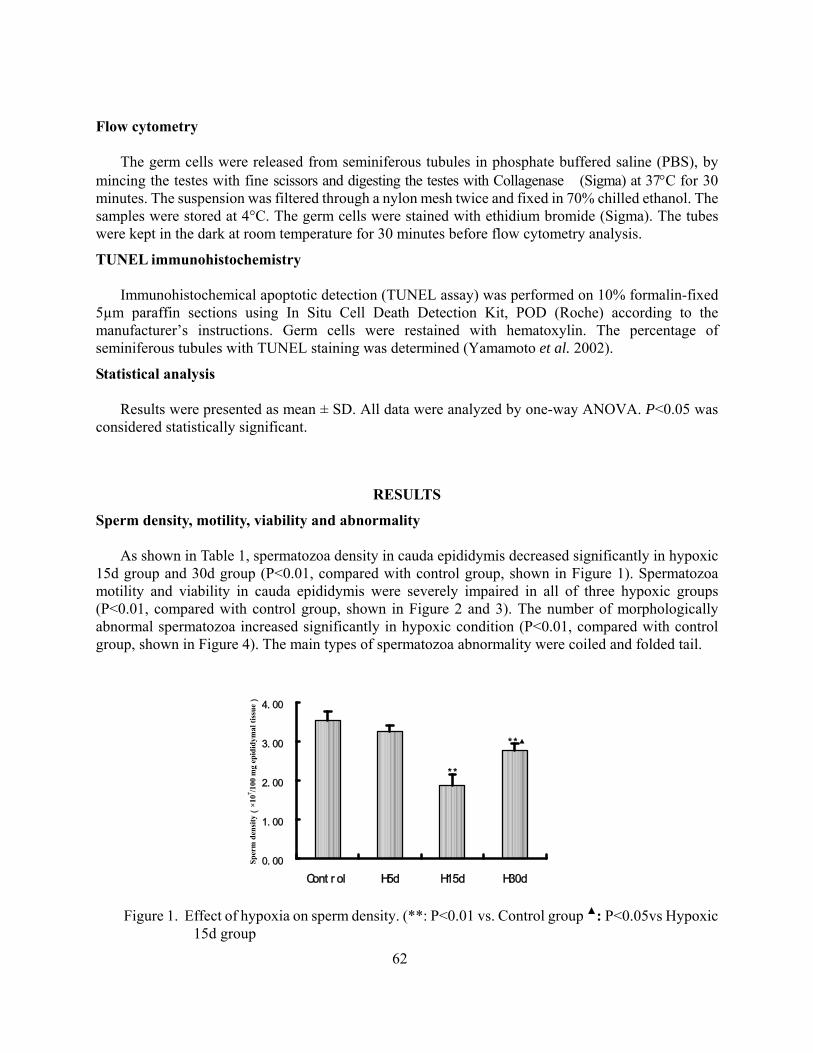

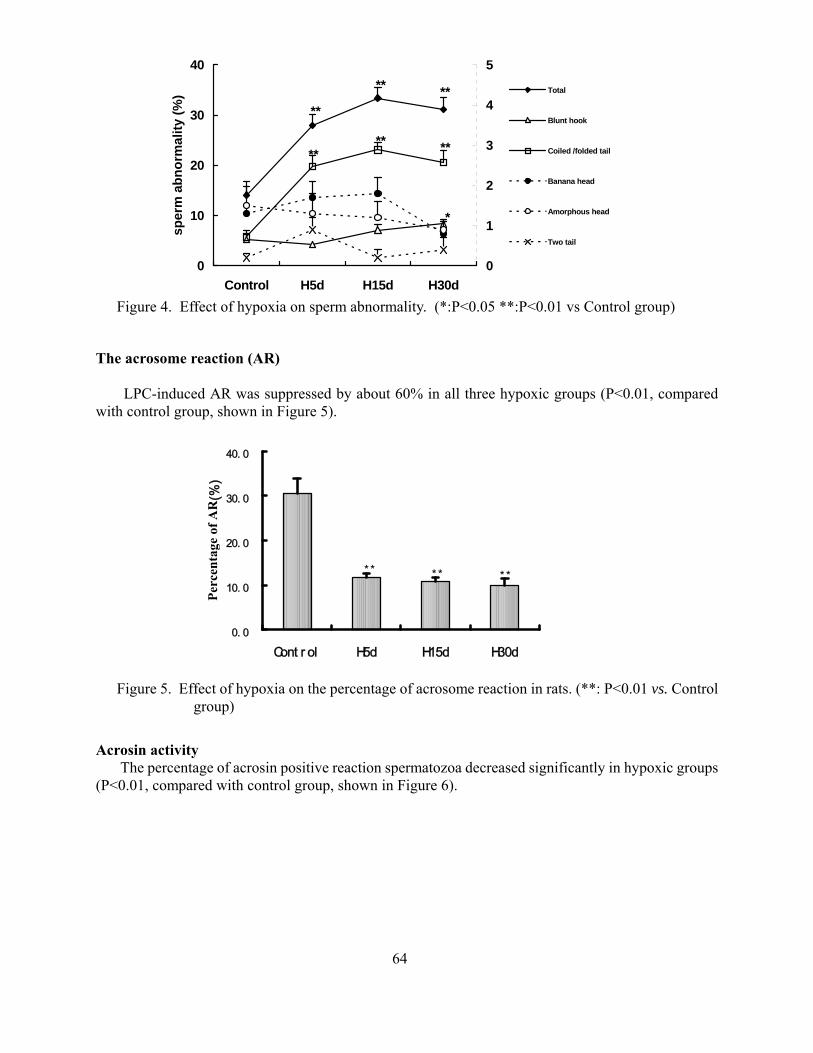
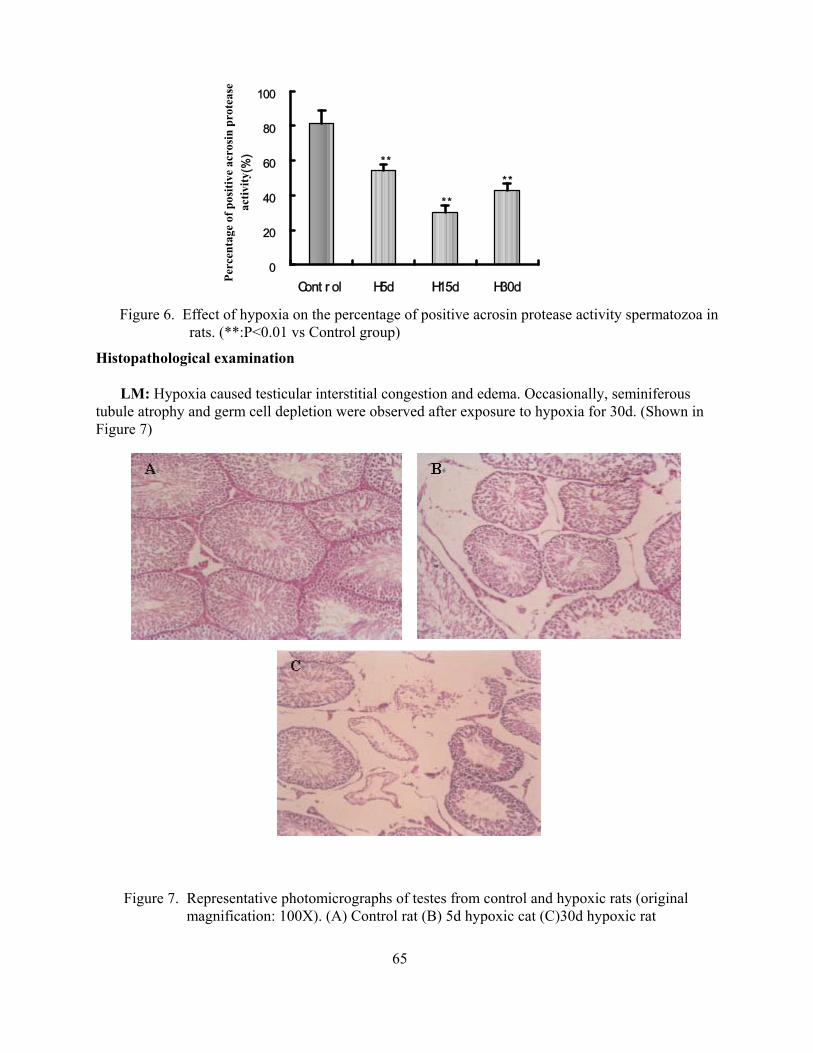
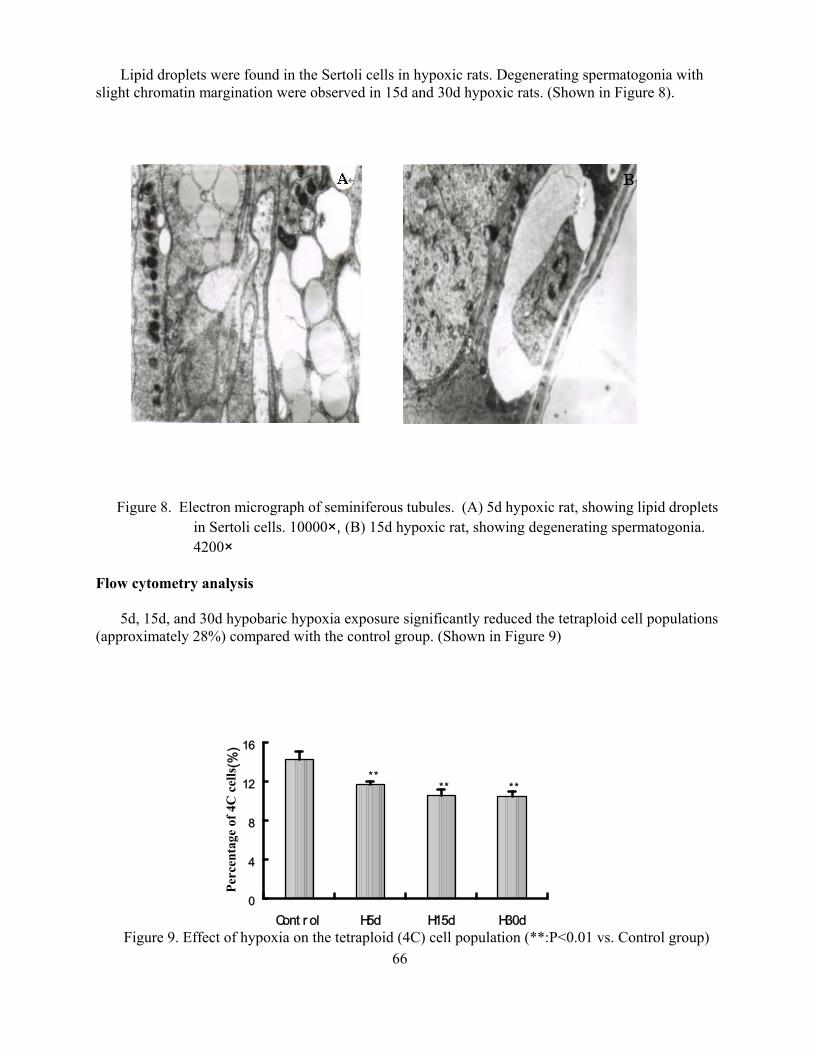

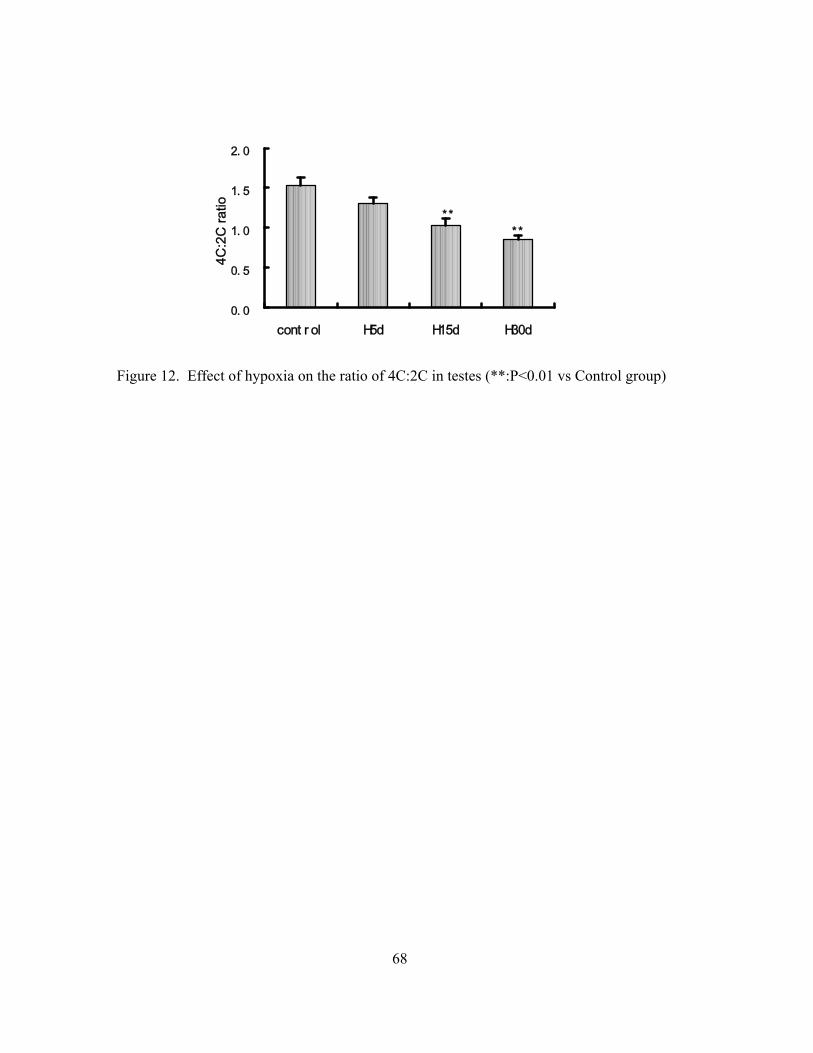


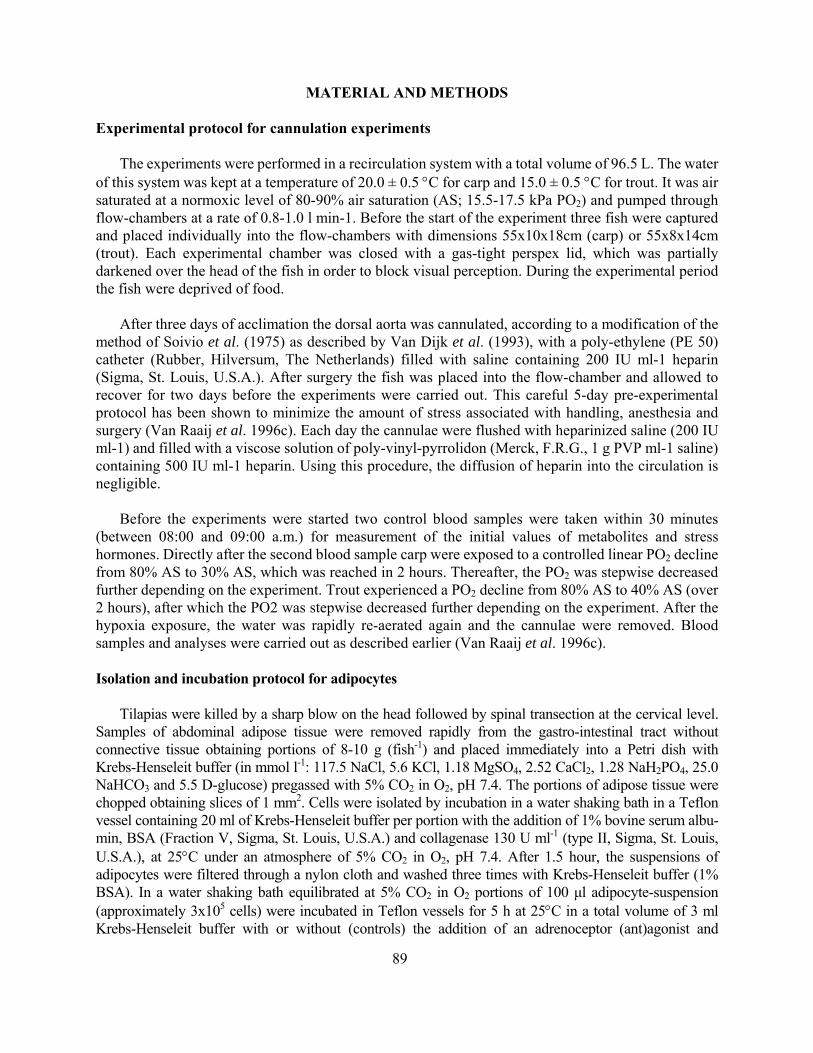


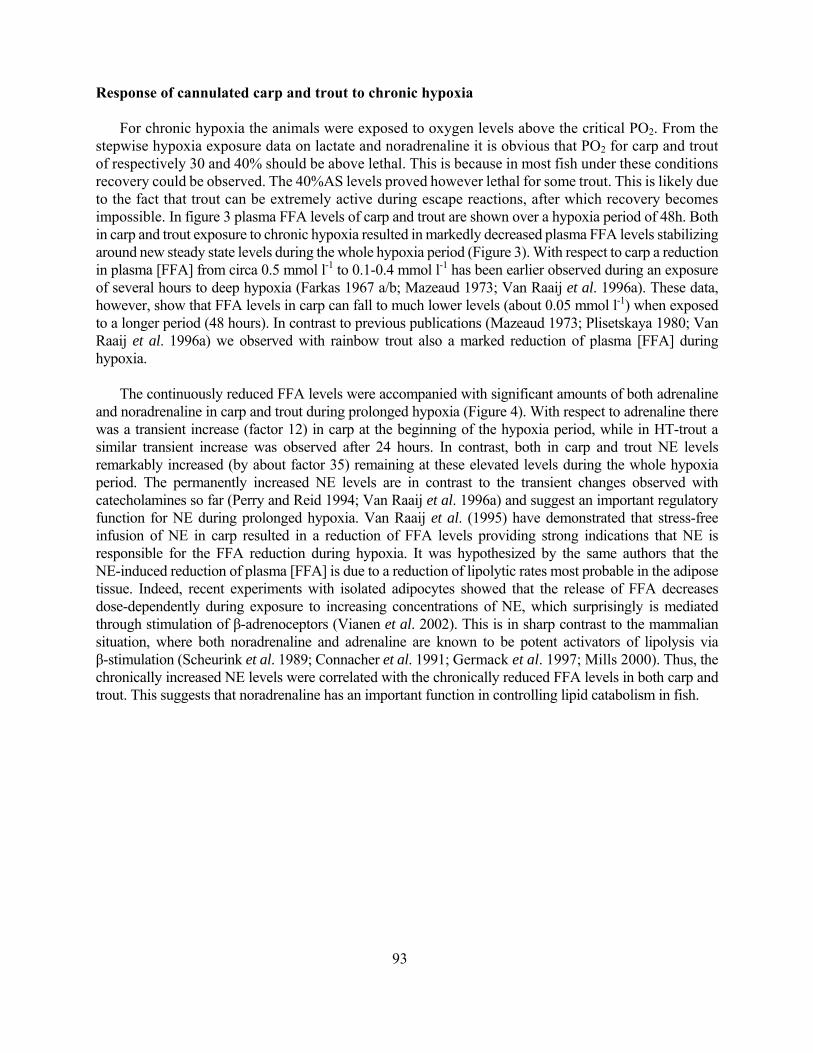
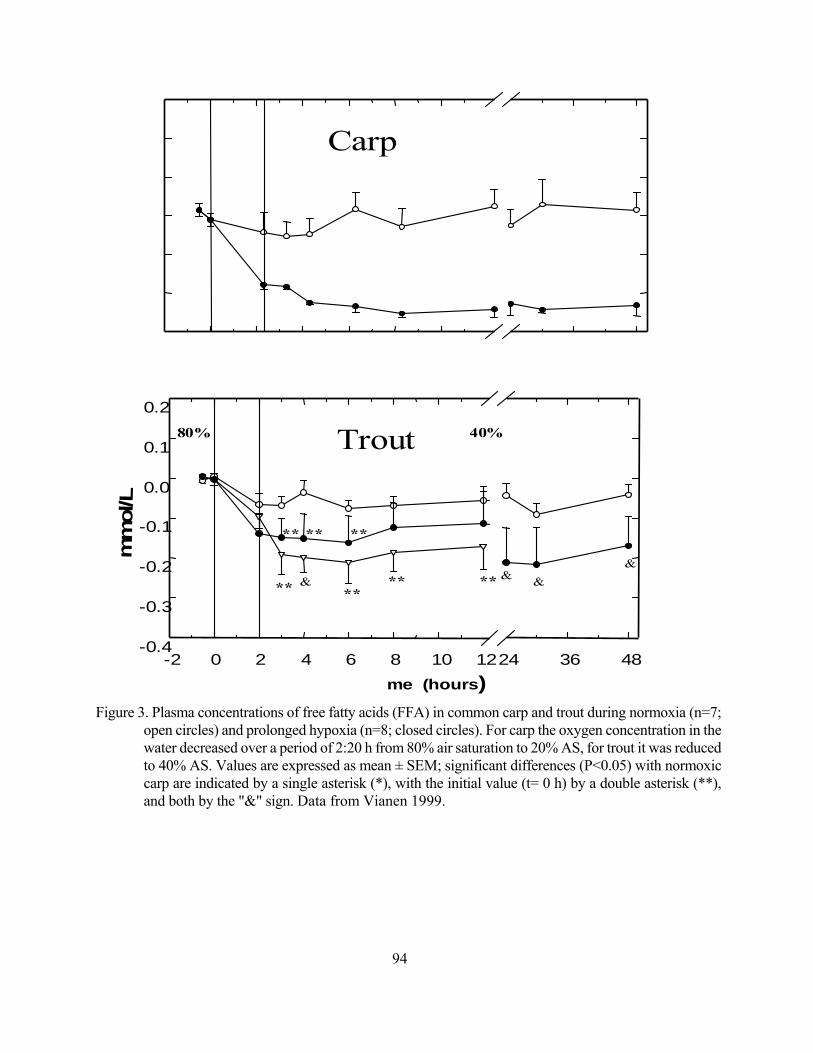
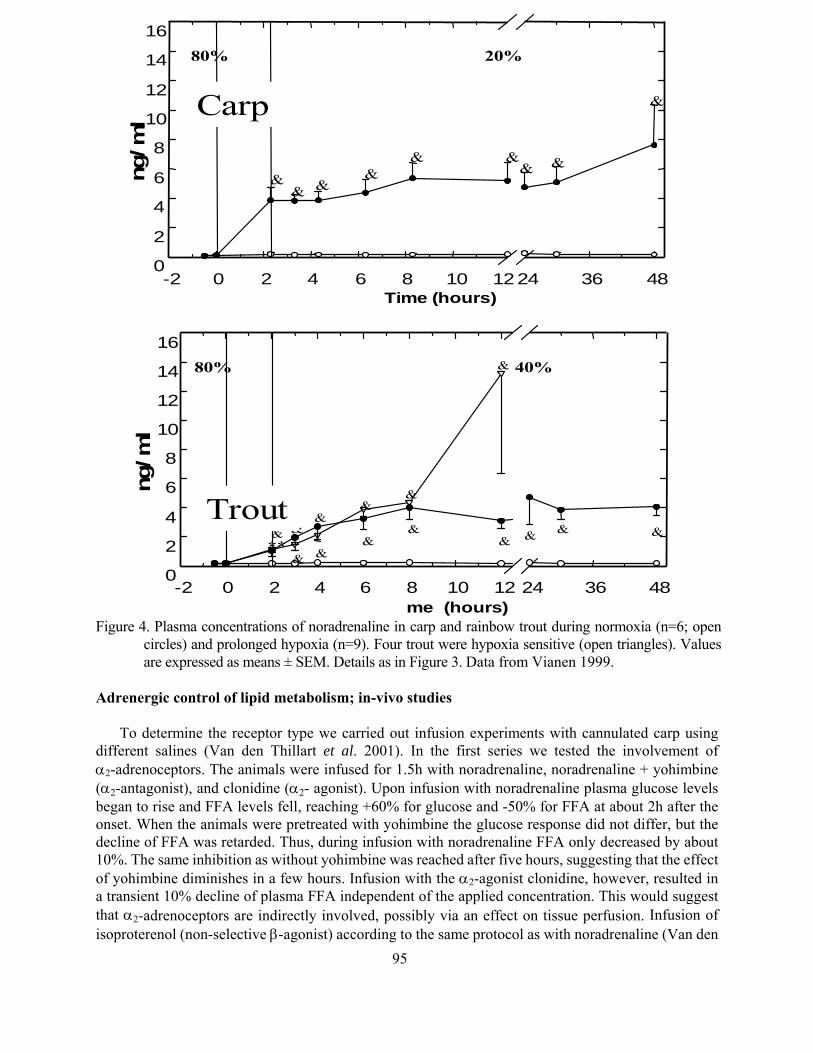

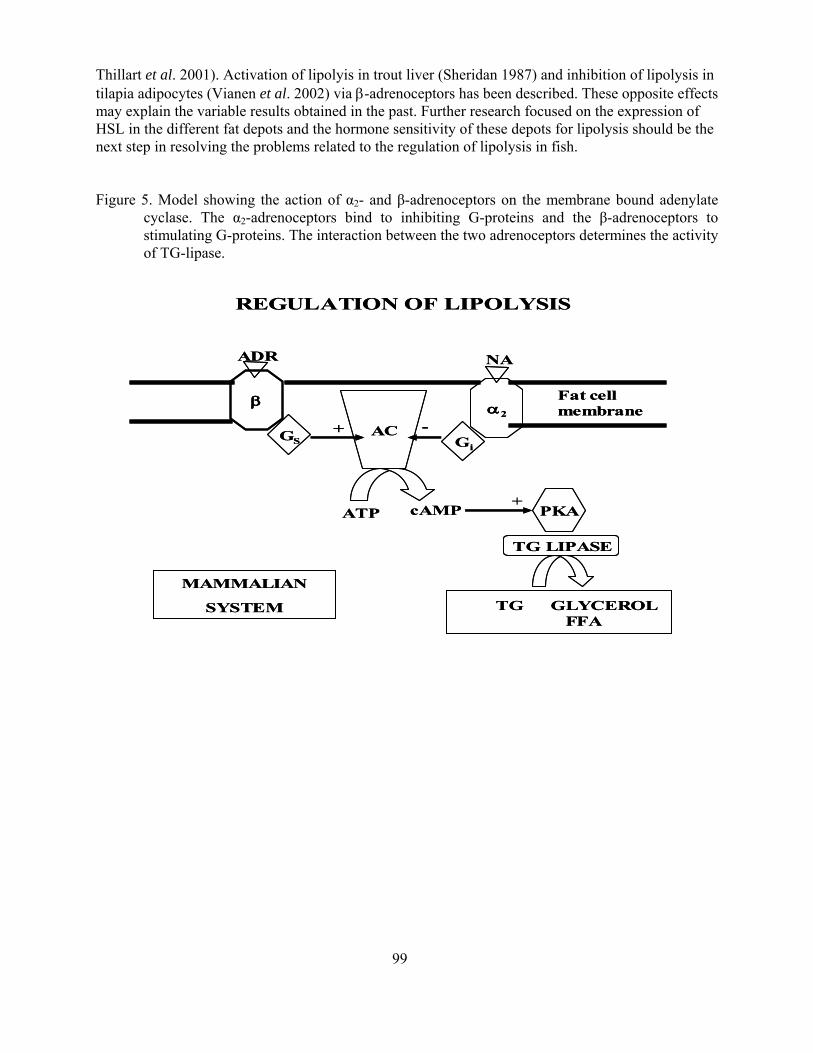


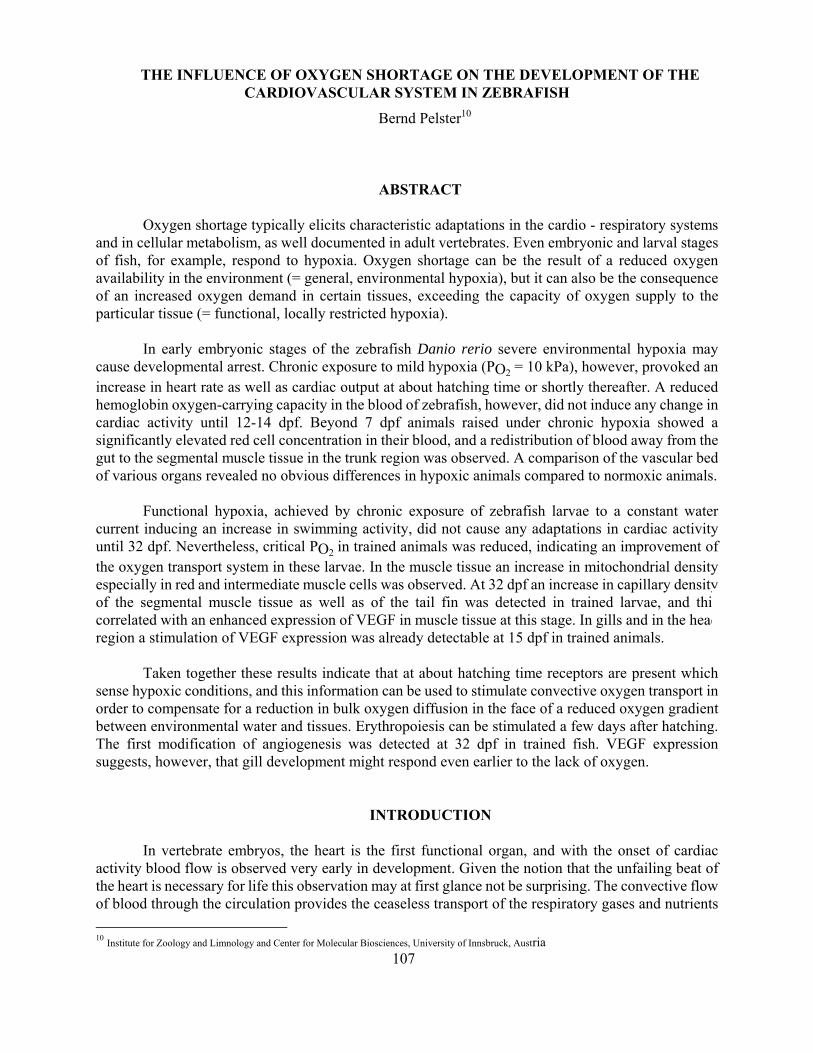


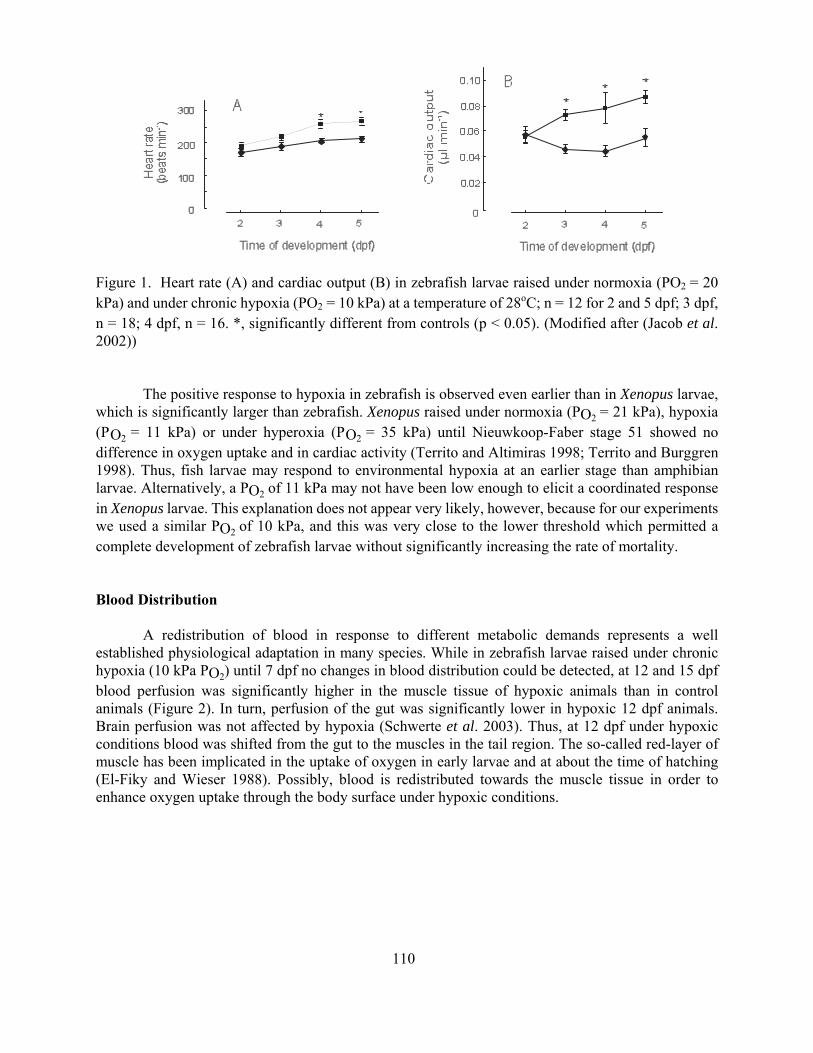


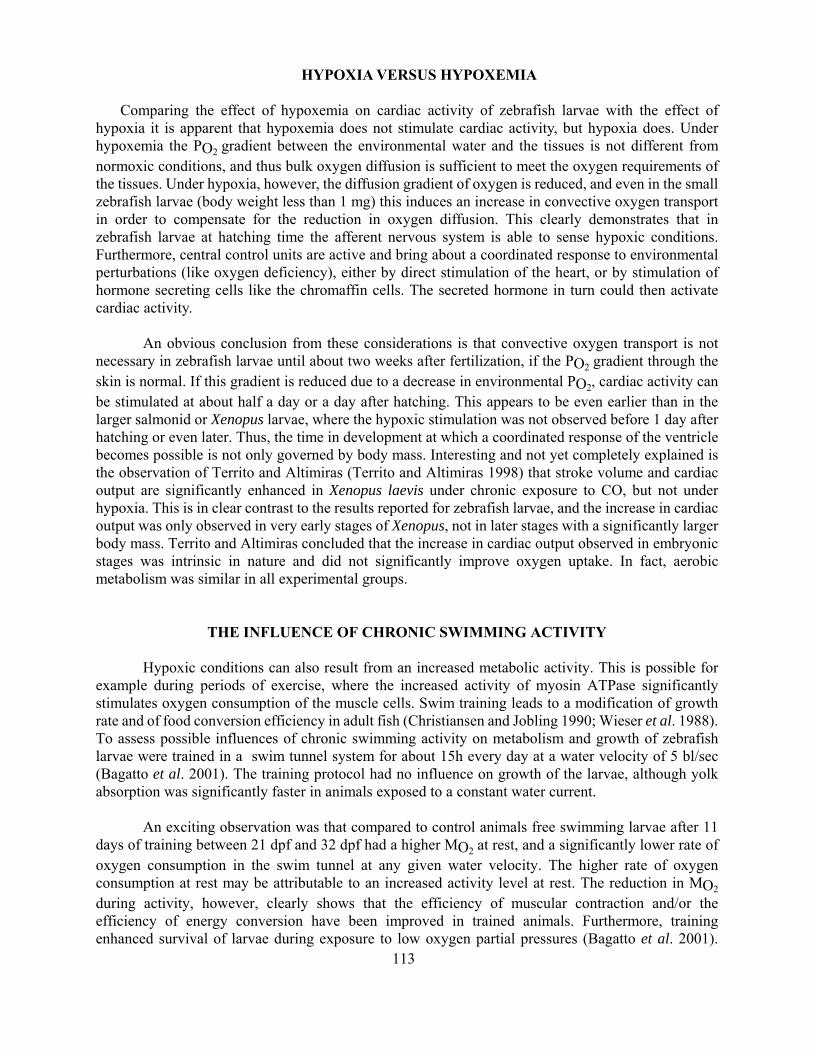

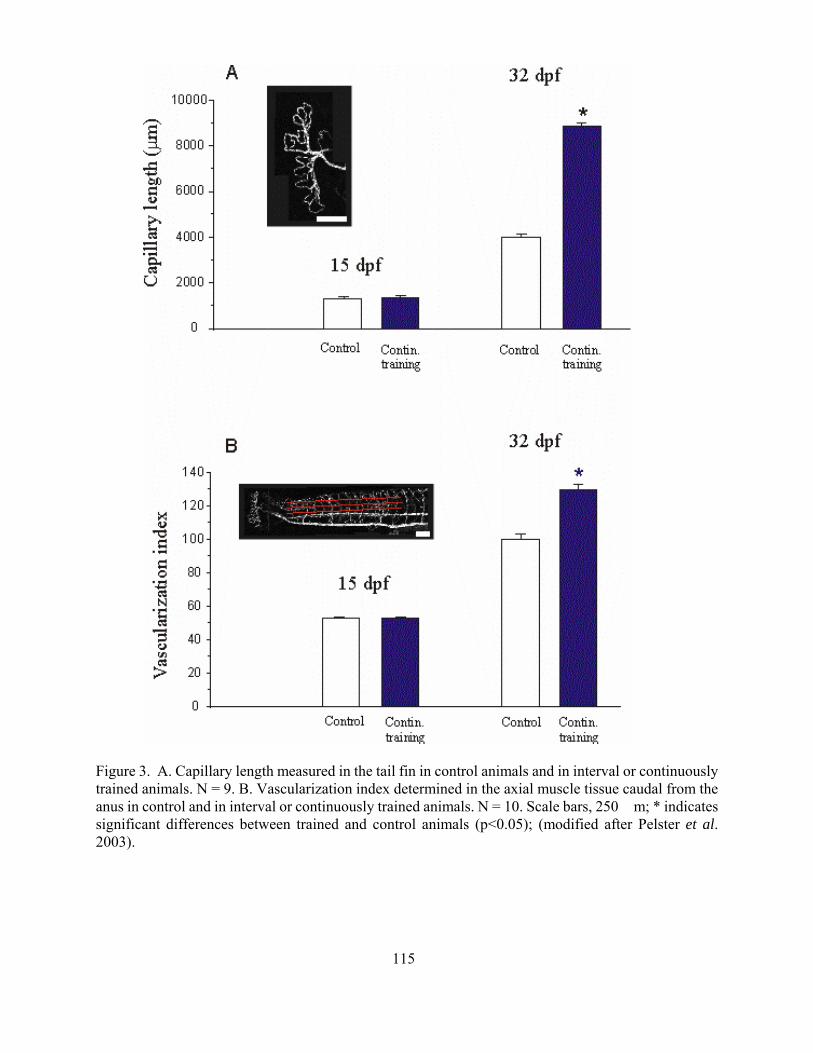


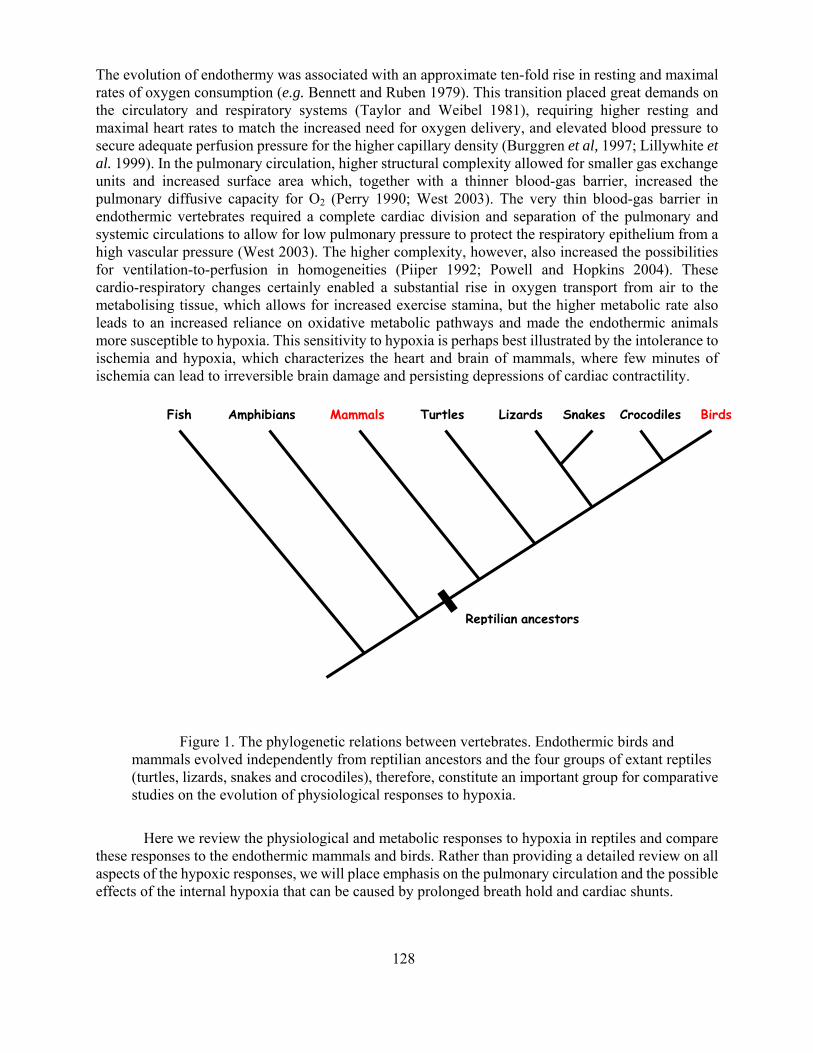


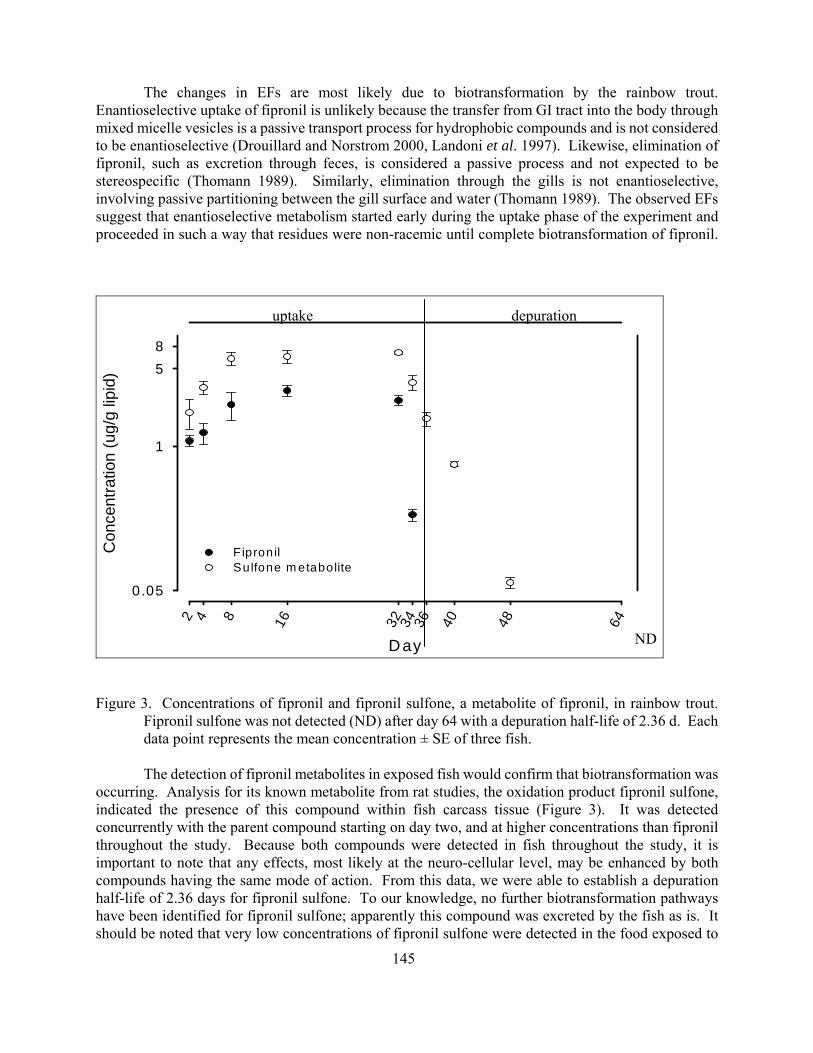


![[Toxicology] toxicology introduction](https://static.fdocuments.in/doc/165x107/55c46616bb61ebb3478b4643/toxicology-toxicology-introduction.jpg)