
First step towards development of Distributed thermal ...838991/FULLTEXT01.pdf · percent (EIA,...
37
First step towards development of Distributed thermal response test using heating cables Seyed Mazyar Hosseini Moghaddam Joakim Holmberg Bårman Supervisor: José Acuña MJ153x Examensarbete i Energi och miljö, grundnivå Stockholm 2015
Transcript of First step towards development of Distributed thermal ...838991/FULLTEXT01.pdf · percent (EIA,...
First step towards development of
Distributed thermal response test
using heating cables
Seyed Mazyar Hosseini Moghaddam
Joakim Holmberg Bårman
Supervisor: José Acuña
MJ153x Examensarbete i Energi och miljö, grundnivå
Stockholm 2015

1
PrefaceA significant amount of research has been done in the development of Distributed Thermal Response
Tests (DTRT). This thesis lays the initial step in developing a procedure for DTRT using heating cables.
This would not have been possible without the help of many people. We want to thank everyone
who helped us in the process. First, our supervisor, Dr. José Acuña, who continuously supported us,
he laid solid foundation for this DTRT development and guided us through it. Appreciation to Axzel
Sequera, from ASEQ LLC, whose consultation and funding was contributory to this research. Very
special thanks to Dr. Nathaniel Taylor who helped us a lot with his extensive knowledge in the field of
electrical engineering. We also want to acknowledge the technicians at KTH ITM lab Karl Åke Lundin
and Benny Sjöberg who helped us with all the technical problems and installations.
AbstractA Distributed Thermal Response Test is a method to determine ground properties such as thermal
conductivity. Knowing the thermal properties of the ground is essential for designing and installing
ground source heat pump and BTES systems. Knowing more accurate thermal properties can
increase the efficiency of heat pumps by up to 20%, thus, contributing to energy efficiency and
ultimately to sustainable development. This study introduces a convenient method for thermal
response tests using heating cables as the single heat source. Once this new method is developed, it
will make the implementation of DTRT techniques more versatile and inexpensive compared to the
conventional DTRT, and it will create incentive for more investments in geothermal heat pump
systems.
This project is experimental in nature, hence, different equipment were tested and analyzed in order
to find those that best suit this application. Several equipment such as certain types of heating cables
have been tested and proven to be not optimal and some others, such as the selected power
regulator, have resulted to be more adequate. The overall design initially proposed at the beginning
of this study has been analyzed, modified and improved, and recommendations are given for future
development. In conclusion, many obstacles have been overcome from the development process of
DTRT with heating cables. A functional DTRT unit that uses heating cables has been built, however, it
remains a challenge to improve the design in order to make it suitable for all potential borehole
depths and various test requirements.

2
Sammanfattning
DTRT (”Fördelat ” termiskt responstest) är en metod som används för att beräkna markens termiska
egenskaper såsom förmågan att leda värme. De termiska egenskaperna är av stor vikt när
bergvärmepumpar ska installeras och speciellt för system med flera bergvärmepumpar som t.ex
BTES. Om dessa egenskaper kan uppmättas med god noggrannhet kan det bidra till att ansenligt öka
verkningsgraden för bergvärmepumpar jämfört med om testet inte genomförts, vilket då bidrar till
högre energieffektivitet och hållbar utveckling.
Detta projekt ämnar att skapa en ny, enklare metod för att utföra att ett termiskt responstest med
hjälp utav värmekablar. När denna metod är fullt utvecklad kommer framtida test bli mer flexibla och
kan utföras till en lägre kostnad jämfört med konventionella DTRT test. Vilket kommer skapa
incitament för att investera i bergvärmepumps applikationer i framtiden. Projektet är experimentellt
betonat och en ansenlig mängd tid har lagts på att finna rätt utrustning som passar syftet att finna en
ny design för DTRT. Några av de ursprungliga ideerna har förkastats då de visade sig inte uppfylla
våra syften, såsom värmekablarna. Däremot var effektregulatorn mer adekvat. Den icke adekvata
utrustningen har analyserats och förslag till framtida utveckling ges. Sammanfattningsvis har en del
hinder överkommits i utvecklingsprocessen för att realisera DTRT via värmekablar, men arbete
återstår och designen bör utvecklas separat för olika borrhål, speciellt kabellängden är av essens.

3
Nomenclature Temperature coefficient [‐]
Conductivity [S/m]
Thermal conductivity of ground [W/(m K)]
A Cross‐section area of conductors [mm3]
COP Coefficient of performance [‐]
I Current [A]
L Length of the borehole [m]
P Power dissipated from heating cable per meter [W/m]
Pfar Power dissipated from far end of heating cable per meter [W/m]
Pfeed Power dissipated from feeding end of heating cable per meter [W/m]
R Electrical resistance [Ω]
T0 Initial conductor temperature [oC]
T Current conductor temperature [oC]
V Voltage [V]
Vfar Voltage at far end of the heating cables [V]

4
TableofContentsPreface ..................................................................................................................................................... 1
Abstract ................................................................................................................................................... 1
Sammanfattning ...................................................................................................................................... 2
Nomenclature .......................................................................................................................................... 3
1 Background and Introduction ............................................................................................................... 6
1.1 Energy situation ............................................................................................................................. 6
1.2 Heat pumps ................................................................................................................................... 6
1.3 Background & history of geothermal heat pumps ........................................................................ 8
1.4 Thermal Response Test ................................................................................................................. 9
1.5 How is TRT done? ........................................................................................................................ 11
1.5.1 Thermal conductivity ............................................................................................................ 11
1.6 Distributed thermal response test .............................................................................................. 11
1.7 The new improved DTRT ............................................................................................................. 11
1.8 Aim............................................................................................................................................... 12
1.9 Objective ...................................................................................................................................... 12
2 Methodology ...................................................................................................................................... 13
3 Design of DTRT with heating cable ..................................................................................................... 13
3.1 Power regulator ........................................................................................................................... 13
3.2 Heating cables ............................................................................................................................. 15
3.3 Optical fiber cable ....................................................................................................................... 16
4 Setup ................................................................................................................................................... 17
4.1 Connection &Termination ........................................................................................................... 17
4.2 Water tightening ......................................................................................................................... 18
4.3 EPack installation ......................................................................................................................... 19
4.4 Water tank and cylinder test ....................................................................................................... 23
5 Results ................................................................................................................................................ 25
5.1 A temperature‐time graph and a power‐time graph .................................................................. 25
5.2 Heating Cable Performance ........................................................................................................ 25
6 Discussion ........................................................................................................................................... 27
6.1 Single copper cable resistors ....................................................................................................... 28
6.2 Three‐Phase power source .......................................................................................................... 29
6.2.1Three phase to single cable ................................................................................................... 30
6.2.2 Normal .................................................................................................................................. 30

5
6.2.3 Three core cable ................................................................................................................... 30
6.2.4 Delta connection .................................................................................................................. 30
6.3 Regulating the power .................................................................................................................. 31
6.4 Heat isolation .............................................................................................................................. 31
6.5 Future work ................................................................................................................................. 31
7 Reflections about Sustainable Development related to this project ................................................. 32
8 Conclusions ........................................................................................................................................ 33
Bibliography ........................................................................................................................................... 35

6
1BackgroundandIntroduction
1.1EnergysituationThe world’s energy demand will continue to rise; by 2040 the total energy use could increase by 56
percent (EIA, 2013). When thinking about this energy rise, associations often link to electricity
generation and the use of fuel for transportation. One aspect which is often overlooked is the need
for heating and cooling. Estimations show that this post is equivalent to 40‐50 percent of the total
energy need where renewables only supply a minor part of this need, about 2‐3 percent (Seybotha K,
2008). Evidently the need for sustainable heating and cooling applications is urgent, given the current
climate and energy long term crisis.
One powerful solution to meet this energy demand is geothermal heat pumps. The energy source of
geothermal heat pumps is a little counterintuitive, it comes primarily from the sun’s energy stored in
the ground and not the heat from the earth itself (Geoenergin i samhället, 2012). In other words this
counts as a renewable energy source, as long as the extraction of energy and the supply from the sun
stays in balance.
An ordinary geothermal heat pump without the ability to recharge the ground with energy is called a
passive system. An active system on the other hand is characterized by its ability to recharge the
rocky foundation with heat or to store cooling. This could be applied for geothermal heat pumps
which may reverse the workflow and be used for cooling purposes. Meaning that excess heat during
the summer can be pumped back into the borehole and thereby maintain the ground temperature.
A larger scale example of this is Borehole Thermal Energy Storage (BTES). The principle is the same as
usual geothermal heat pumps but with higher interaction and usage of the ground’s thermal storage
capacity. Development of high temperature storages is in progress which will be able to seasonally
store thermal energy in the ground, and also interact with the existing heating network systems. This
can be referred as district heating where a central power plant (burning either fossil fuel or biomass)
distributes space and water heating for residential and commercial buildings. District heating and
BTES thermal storage can also utilize energy from industries (such as steel, paper etc) that have large
amounts of waste heat. (Geoenergin i samhället, 2012)
Both of these systems, passive and active, are in a sense blind without knowing the thermal
properties of the ground, especially the thermal conductivity. If the properties are not known, the
heat pump system may not work efficiently, leading to unnecessary energy consumption and
unsustainable use of energy, or it may simply be undersized and incapable of meeting the heating or
cooling loads required. A method to allow these systems to have “eyes” is to introduce a thermal
response test and make use of the information it provides. This study looks at a new method of
conducting thermal response tests.
1.2HeatpumpsThe idea behind heat pumps is transporting heat from a heating source (in this case the ground) to a
warmer medium where heat is desired, such as the air in a building. The advantage of a heat pump is
that the total energy that is delivered is greater than the energy that is used to transport the heat.
A heat pump is basically made of four main components: evaporator, compressor, condenser, and
expansion valve. Heat is supplied to the evaporator from the heat source by a closed water
circulating system. The water enters the evaporator where heat is exchanged from the water to the

7
refrigerant, but the fluids do not directly mix. Since the refrigerant is a substance which has a low
boiling point and the pressure is low within this section, the refrigerant is evaporated, thus gaining
enthalpy. In the compressor, the gaseous refrigerant is pressurized and its temperature increases. It
is then transported to the condenser where it changes into liquid phase again. A heat exchanger is
present here, as in the evaporator, from which a closed circuit water or air stream extracts the
energy from the condensed refrigerant. This is the way the residential building is receiving its heat
supply. The liquid refrigerant now returns to the evaporator via an expansion valve, which regulates
the stream into the evaporator. This is because a slight overheat of the refrigerant is preferred.
Figure 1 shows a simple configuration of heat pump. (Björk E, 2013)
The amount of heat gained by a heat pump is often described by the coefficient of performance or
COP. For example if a heat pump has COP of 3, 1 kWh of electricity is needed for delivering 3kWh of
heat, thereby gaining 2kWh of total energy. This is shown in the Equation 1 below:
(1.1)
Qout is the heat extracted from the source and E is the electricity applied to the heat pump which is
used to run the compressor and pumps. However the compressor and pumps are not ideal and there
will always be energy losses. Therefore the theoretical boundary for ideal heat pumps is set by
Carnot’s cycle as shown in Equation 2. It can be seen that the performance is dependent on the
temperature lift, in other words, the difference between the warm and cold mediums.
(1.2)
One can conclude that geothermal heat pumps will have a relatively consistent performance
compared to other heat pumps since the ground temperature is almost constant. (Geoenergin i
samhället, 2012). The highest COP compared to other heat pump applications will occur during
winter when ground temperature will be higher than the ambient air. This will make geothermal heat
pumps an ideal heating system for winter.
Figure 1. Heat pump configuration (Oregon state university, 2008)

8
1.3Background&historyofgeothermalheatpumpsThe principle behind heat pumps has a long history which stretches back to the fathers of
thermodynamics. As the laws of thermodynamics were beginning to take shape, the idea of the heat
pump was born and Lord Kelvin introduced the concept of heat pumps as early in 1852 (IGSHPA,
2014). In 1912 the use of the ground as a heat source was introduced but it wasn’t until the late
1940s that the concept was patented and later introduced to the market (Geoenergin i samhället,
2012).
From the fifties until the beginning of the seventies heat pump technology was at a standstill (Zogg
M, 2008). Low oil prices created energy abundance; consumption of energy was not of greater
economic concern thus the need for heat pump technology was not a priority. However in warmer
countries refrigeration was still needed which is essentially a heat pump with reversed workflow and
this kept the know how during that period.
In 1973 the first oil crisis struck the world. Energy abundance was no longer taken for granted.
Economic recession was imminent and the need for new energy sources was induced in society. A
renewed interest for heat pumps began to take place where geothermal was early promoted and in
1974 a 70 meter long borehole was drilled in Austria. In 1981 oil prices dipped again and once again
the need was declined, however research within geothermal energy continued. During the nineties a
rebirth for heat pumps in general happened, environmental awareness was one of the reasons for
this.
In Sweden higher oil prices and taxation of carbon dioxide has led to a steep decrease in oil
consumption for heating purposes, specifically with over 90 percent from 1990 to 2013
(Energimyndigheten, 2015). The oil heating systems were mostly replaced with district heating and
heat pumps. A rapid increase in heat pumps sales occurred during the nineties but it has now
reached an almost constant level. The trend points toward a shift from closed circulation systems
(geothermal included) to more air‐air driven heat pumps. Until 2004 closed circulation system units
were predominant and this has now shifted to air‐air units (Energimyndigheten, 2015).
The worldwide geothermal energy gain from heat pumps is around 38 TWh but statistical data is
insufficient, so this figure is probably greater. 11 TWh is coming from Sweden with around one
million heat pumps installed today. Sweden is also the largest geothermal energy user per capita.
There are quite a few countries that utilize this technique today. These countries are Sweden,
Switzerland, USA and to some extent Germany and France but the interest is growing and many
countries around the world are beginning to implement this technique (Geoenergin i samhället,
2012) (Reddy B, 2012).
Geothermal heat pumps are somehow unique because of the fact that the source temperature is
almost constant and converges towards the average annual temperature. This makes operation
smoother achieving a higher life expectancy and outstanding peak demand capabilities during winter
conditions. Compared to air sourced heat pumps, they also save more energy in operation but they
are more expensive as drilling is required and depend on land conditions for installation
(Energimyndigheten_2, 2010) (Park, 2011). If the installation expenses are not an issue, much can be

9
gained in the long term as the borehole has at least the same life expectancy as the real estate itself
(Geoenergin i samhället, 2012).
Hopefully the ongoing progress of DTRT will play a part in making geothermal heat pumps more
widespread in the world. The development of this technology could be one puzzle‐part contributing
to sustainable development as a whole.
1.4ThermalResponseTestOne of the most important steps before designing a geothermal heat pump system is to conduct a
field test of the site’s ground thermal properties. This is necessary to design the borehole(s) for the
heat pump with the right geometry as well as identifying and quantifying the potential suitability of
geothermal heat pumps for the specific geology, weather conditions and required loads. In the end,
this process optimizes the use of geothermal heat pumps to make them work as efficiently as
possible and maximize the coefficient of performance (COP).
In order to optimize and predict the thermal performance of ground‐source energy systems, such as
GSHP (Ground Sourced Heat Pumps) and BTES (Borehole Thermal Energy Storage), a Thermal
Response Test (TRT) is recommended. General information about the rock types present at the site
could give an indication of the expected thermal performance but does not provide enough
information for a detailed design. The preferred choice to obtain the performance characteristics of
the soil is an in‐situ test, which would provide information such as the presence of ground water
flow, a geothermal profile and so forth.
TRT is in fact a quite new technique. The first paper suggesting mobile TRT equipment was presented
by Mogensen at an international conference in Stockholm, which discussed subsurface energy
storage in 1983 (Nordell, 2011). However it was not until the middle of the nineteen nineties that a
fully developed Thermal Response Test was implemented. TRT was independently constructed in
Sweden and the USA. The so called “TED” project was the first Thermal Response Test ever to be
developed in Luleå University of Technology in Sweden. The inventors were Eklöf and Gehlin in 1996
when they wrote their MSc Thesis, shortly after a similar apparatus was constructed at Oklahoma
State University in 1998. Both devices were based on Morgensens original concept except that a
heater was used instead of a chiller (Nordell, 2011).
From that point, the TRT technology spread at a fast pace to other countries in Europe, Asia, North
America, South America and Africa. TRT is now used in about 40 countries. In the USA, several
commercial units have been constructed; some of these units are compact enough to fit into small
shipping containers. In Netherlands, a larger TRT unit has been introduced, which is fit for sea
shipping containers (Gehlin, 2002).
At first, TRT units were mainly transported using trailers hauled by cars. Since then many types of TRT
units have been designed and built. The dominant dimension today has shrunken to portable boxes,
control and logging is sometimes in a separate box.

10
Although TRT has been more widespread and commercialized in some specific cases, TRT is still
mostly subject to research and development. Only 23
percent of the statistically verified TRT equipment is used
only for commercial purposes (Nordell, 2011).
Figure 4. Average TRT set up (Gehlin, 2002)
Figure 3. TRT application in different sectors (Nordell, 2011)
Figure 2. Share of different types of TRT in the world (Nordell, 2011)
11
1.5HowisTRTdone?Thermal response test is an experimental in situ method for measuring the thermal properties of a
borehole. In this method a fluid (usually water) is circulated in a borehole while a constant amount of
heat is being injected or extracted from it. The outlet temperature of the fluid is recorded constantly
and analyzed by mathematical models. This model gives information about the thermal conductivity
of the ground surrounding the test borehole.
1.5.1ThermalconductivityIn research done by Signhild Gehlin (Gehlin, 2002), an infinite line source model has been used to
find the thermal conductivity of the ground. The equation for the temperature field as a function of
radius (r) and time (t) around a line source with constant heat injection rate (q) can be used to find
the thermal conductivity of the ground.
∆ , Where (1.3)
λ is the thermal conductivity and ρc is the heat capacity of the surrounding medium. This formula can
be simplified when the value of u is too large:
ln
40,5772 (1.4)
Thereby one can measure the thermal conductivity of the ground. A more detailed description of this
analogy is given in the Signhild Gehlins thesis, Thermal response test method and development
(2002).
1.6DistributedthermalresponsetestThe conventional TRT method records only the inlet and outlet temperature of the water injected to
the borehole. This method could only measure the average thermal conductivity of the ground.
Distributed Thermal Response Test (DTRT) is a new TRT method introduced by José Acuña (2010). In
this method the thermal conductivity is measured discretely at many locations along the full depth of
the borehole. This is done by using a fiber optic cable which measures the temperatures along its full
length, typically every 2m along the cable. The data from the fiber optic cable is then used to find the
thermal conductivity at each measuring point. A complete description of DTRT is given in José
Acuña’s thesis, Distributed Thermal Response Test ‐ New insights on U‐pipe and Coaxial heat
exchangers in groundwater‐filled boreholes (2013).
1.7ThenewimprovedDTRTThis study is an attempt to develop a new method for DTRT using heating cables. The conventional
TRT test and the more advanced DTRT test are carried out by pumping and circulating water in a
borehole. This method has some disadvantages, for example, pipes need to be securely connected
between test equipment and the borehole, and it takes energy to pump water into the borehole. At
the same time, the equipment used for this method is somewhat bulky, requiring significant space
for storage and additional efforts and costs for transportation.

12
The new DTRT method uses heating cables for introducing heat into the borehole. Heating cables will
be submerged down the borehole. By controlling the current (I) and voltage (V) that is supplied to
this cable, the amount of heating power (q) injected to the borehole per length unit can be
calculated.
∗ (1.5)
At the same time, a fiber optic cable, attached to the heating cable will be submerged in the
borehole. This fiber cable records the temperature profile along the borehole depth. The
combination of heating and fiber optic cable provides enough data for the user to calculate the
thermal conductivity.
The advantage of this new method is that it uses much smaller equipment compared to the
conventional method, making it easier to store, transport and install. It is a less costly alternative
since there is no need to spend energy in pumping the water and lastly, it is a faster method since
there is no need to set a pipe in the borehole. A combination of these factors will ease the thermal
response test process and provide a more suitable alternative for the market.
1.8AimUsing heating cables for distributed thermal response test is a relatively new method and it has not
fully developed yet. The main goal of this project is to research how a heating cable DTRT can be
conducted. Since this is a novel and new‐laid idea, there was no certain end point to this research
and given the time frame the attempt is to develop this method as far as possible.
The results will hopefully lead to a more widespread use of TRT, if this method is proven to be
appropriate, less costly and more flexible. The new DTRT would create more incentive to invest in
geothermal heat pumps resulting in a more resource efficient energy‐system and thereby contribute
to sustainable development.
1.9ObjectiveThe main purpose of this project is to design an installation capable of performing a DTRT test using a
heating cable. The objectives can be divided into three categories:
Literature survey about latest work on TRTs with heating cables
Comparing different heating cables techniques while considering cost‐efficiency.
Preparing a laboratory set up for testing and validation of heating cables. Although a full
development requires actual tests done in a borehole, the focus here is testing the device in
a smaller scale at the KTH‐laboratory.
This report is centered on the technical aspects of the new DTRT method and evaluating their
performance. Firstly, it is needed to find the proper devices and right configuration that fits DTRT
best. Knowing what equipment should be used is the main part of this research. This equipment
includes both main devices that are needed for a DTRT such as the heating cable and also smaller
equipment that must be fixed for a test, such as water proofing materials. All of this equipment will
be presented in a rigorous way, with the heating cables, fiber optic cables and power regulator in
detail.

13
2MethodologyThis is a research and development project and has been carried out based on a literature study,
consultation with experts and experiments. The literature is mostly from others that have worked
with geothermal heat pumps and previous types of thermal response test. To find the right
equipment for the experiments and how they should be carried out, consultation has been taken
from specialist in various fields, specifically, heat transfer and electrical engineering. To be able to
fully develop the new DTRT, several experiments must be conducted in order to test the new
method. The experiments done in this report are just the initial step in the development process.
3DesignofDTRTwithheatingcableThere are three main pieces of equipment used for a thermal response test. These are the power
regulator, the heating cable and the fiber optic temperature sensor. A simple configuration is shown
in the Figure 5. As it is shown, the power regulator supplies the heating cables with certain amount
energy. This energy will be dispersed into the earth in the form of heat, meanwhile the fiber optic
sensors measure the changing temperature along the depth of the borehole. The reasoning behind
the selection of each of the equipment is explained in this section.
3.1PowerregulatorAs mentioned in the introduction, one of the main requirements for a thermal response test is that a
constant amount of heat must be supplied to the heating cables over a period of time. Today, the
requirement in the market is 40‐70 watt per meter over a period of 48‐72 hours (Ashrae, 2011).
Although a response test could be done with 20W/m if necessary (Acuña J. , 2015), but in the new
DTRT it is tried to follow the market requirement.
The power that is supplied to the cable will vary with the length of the cable. For example, if the
cable is ten meters long, and 70 W/m is supplied, then the regulator has to provide 700 W (70 W/m *
10 meters). But if the cable is 300 meters long, then the power source must provide at least 12,000
Figure 5. Schematic diagram of DTRT with heating cables.

14
W (40 W/m * 300 meters). This means that the power regulator should at least work in the range of
700 W to 12,000 W to cover borehole depths from 10 to 300 meters.
There are several factors which make it difficult to provide a constant power over time. First is the
inrush through the cables which is the maximum current through the cable when it is first turned on
due to the low resistance in the beginning of the experiment. Inrush applies to more or less all kinds
of cables. The other factor is the increase of the resistance of the cables with rising temperatures.
Therefore the regulator that is used must be able to control these factors and several others so that
the power output would remain constant.
In the conventional method (using a pump and water heater), a voltage regulator was used to control
the power. Based on Ohm’s law simple power relation P=VI, by controlling voltage and assuming that
the current remains constant, the power could be controlled. But since the new method involves a
changing electrical resistance of the cable (due to its temperature sensibility) it is not appropriate to
assume that the current will remain constant. Hence, a power regulator is necessary to adjust the
power output based on the changing electrical resistance of the heating cable.
The unit that is chosen for the experiments is EPack power controller manufactured by Eurotherm.
The Epack can have nominal load current from 1 to 100 amps and receive up to 500 volts. This means
that with 230 V electricity and 100 A current, it can deliver up to 23 kW, which is much more than is
required for a TRT. The regulator is relatively easy to use, it works with single phase electricity and
can be controlled by either PC or straight from its front panel. For a more precise data logging,
additional software can also be bought.
Figure 6. Epack power controller
15
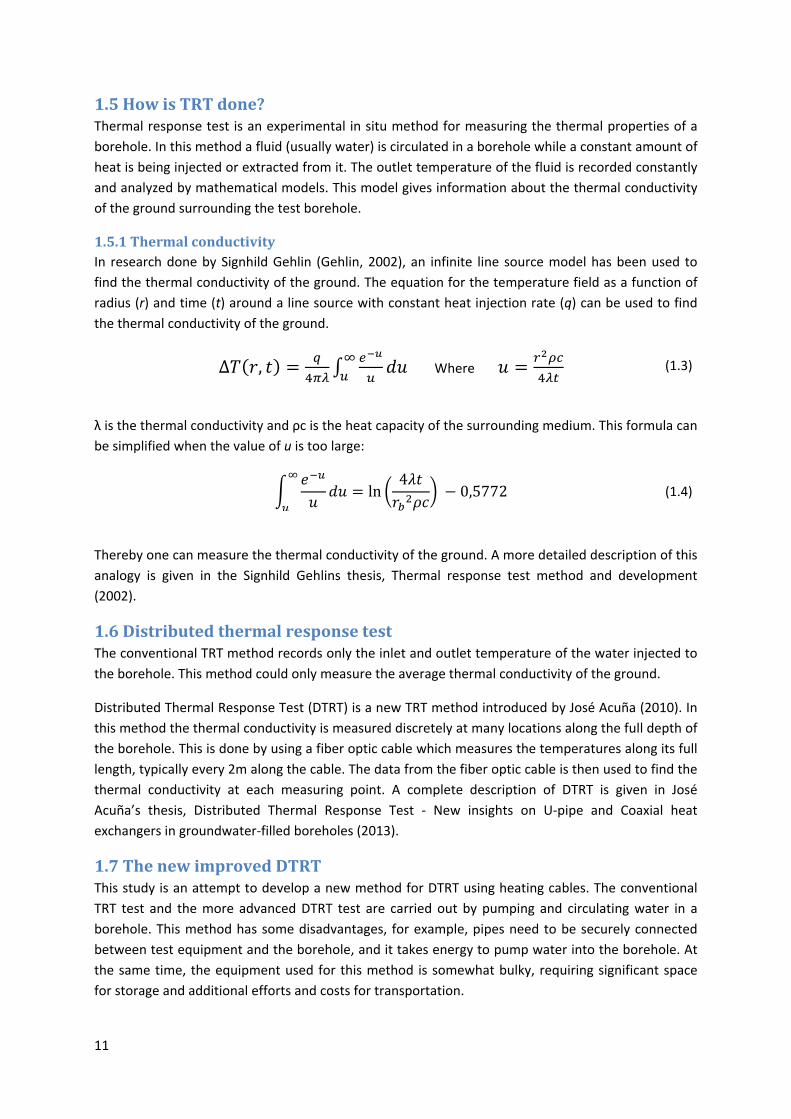
3.2HeatingcablesThe basic requirements for the heating cables are two things: Power output and exposure
temperature. The cables should capable of delivering at least 40 W/m as it was explained above in
Section 3.1. They should also be able to function without damage at temperatures of at least 200 oC.
Since the heating cables will be submerged in a water‐filled borehole, the surface temperature of the
cables will not be that high. But the parts of the cable that are above the water surface have a high
chance of overheating. Therefore a minimum of 200 oC should be reasonable to start an experiment.
The heating cables chosen for this project are presented in the table 1:
Table 1. Properties of selected heating cables
Cable type Max power output per meter (m)
Max. exposure temperature (oC)
Zone length (cm)
Conductors cross section
(mm2)
Price (SEK/m)
Thermon HPT (Power limiting)
60 260 61 3.3 450
Protherm PHT (Constant wattage)
70 285 56 2.5 400
Both of these two cables have a similar geometry. As shown in Figure 7, the cables consist of two
main copper conductors, a resistor or heating element, earth cable and high temperature‐resistant
insulation in between them. The two conductors are connected to each other by the resistor once
every zone length. In other words, it can be seen as a series of parallel connections between the two
conductors through the resistors. It is these parallel resistors that convert electric current into heat.
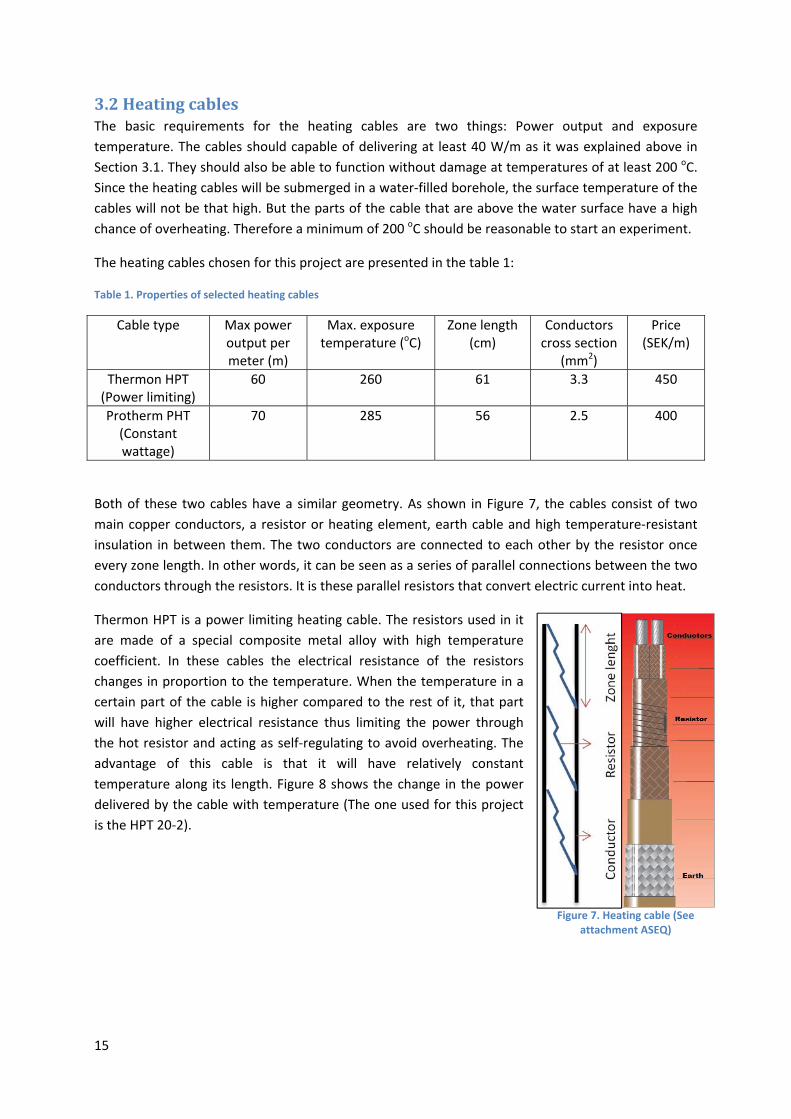
Thermon HPT is a power limiting heating cable. The resistors used in it
are made of a special composite metal alloy with high temperature
coefficient. In these cables the electrical resistance of the resistors
changes in proportion to the temperature. When the temperature in a
certain part of the cable is higher compared to the rest of it, that part
will have higher electrical resistance thus limiting the power through
the hot resistor and acting as self‐regulating to avoid overheating. The
advantage of this cable is that it will have relatively constant
temperature along its length. Figure 8 shows the change in the power
delivered by the cable with temperature (The one used for this project
is the HPT 20‐2).
Figure 7. Heating cable (See attachment ASEQ)
16
The Protherm PHT cable is a constant wattage heater. The heating element in the Protherm cable is
made of nichrome which has a very low temperature coefficient (0.004). As the name constant
wattage suggests, these cables are designed to simply deliver the same power regardless of the
temperature around them. Protherm also has a relatively higher power output and temperature
threshold compared to Thermon HPT. This cable presents a hazard that must be mitigated, that is,
the potential for overheating at cable locations where heat transfer is low. This includes sections of
cable not submerged in water.
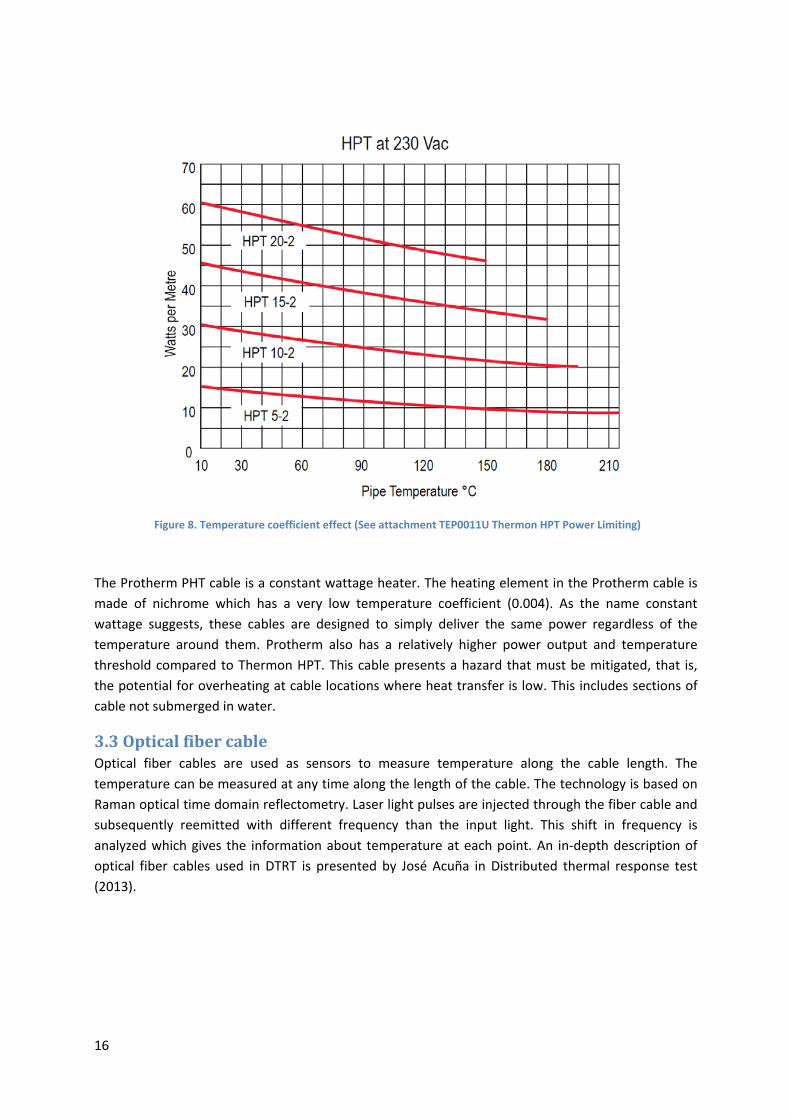
3.3OpticalfibercableOptical fiber cables are used as sensors to measure temperature along the cable length. The
temperature can be measured at any time along the length of the cable. The technology is based on
Raman optical time domain reflectometry. Laser light pulses are injected through the fiber cable and
subsequently reemitted with different frequency than the input light. This shift in frequency is
analyzed which gives the information about temperature at each point. An in‐depth description of
optical fiber cables used in DTRT is presented by José Acuña in Distributed thermal response test
(2013).
Figure 8. Temperature coefficient effect (See attachment TEP0011U Thermon HPT Power Limiting)

17
In DTRT with heating cables, the fiber optic sensors will be attached to the heating cable to read the
temperature at each length over time. The cables used in this experiment have a resolution of two
meters, that is, the cable can sense the temperature at every other meter. If the experiment proves
to be successful, the fiber cables can then be put together in one with the heating cable in order to
make for a more practical installation.
4SetupIn this section all the steps that have been completed for the experiments are explained.
4.1Connection&Termination
Connecting the cables to regulator required termination on both sides of them. This was done with
the UTK344 200 termination equipment (see attachment user guide UTK344 200). The termination
includes neutral, phase and earth conductors. The earth is important for user safety and to prevent
any equipment damage.
The manual attachment UTK344 200 shows the step by step instructions for both sides of the cable,
and it’s manageable with just a snap‐off knife. The final results of termination are shown in figures 10
(Feeding end) and 11 (far end).
Figure 9. Optical fiber cable
18
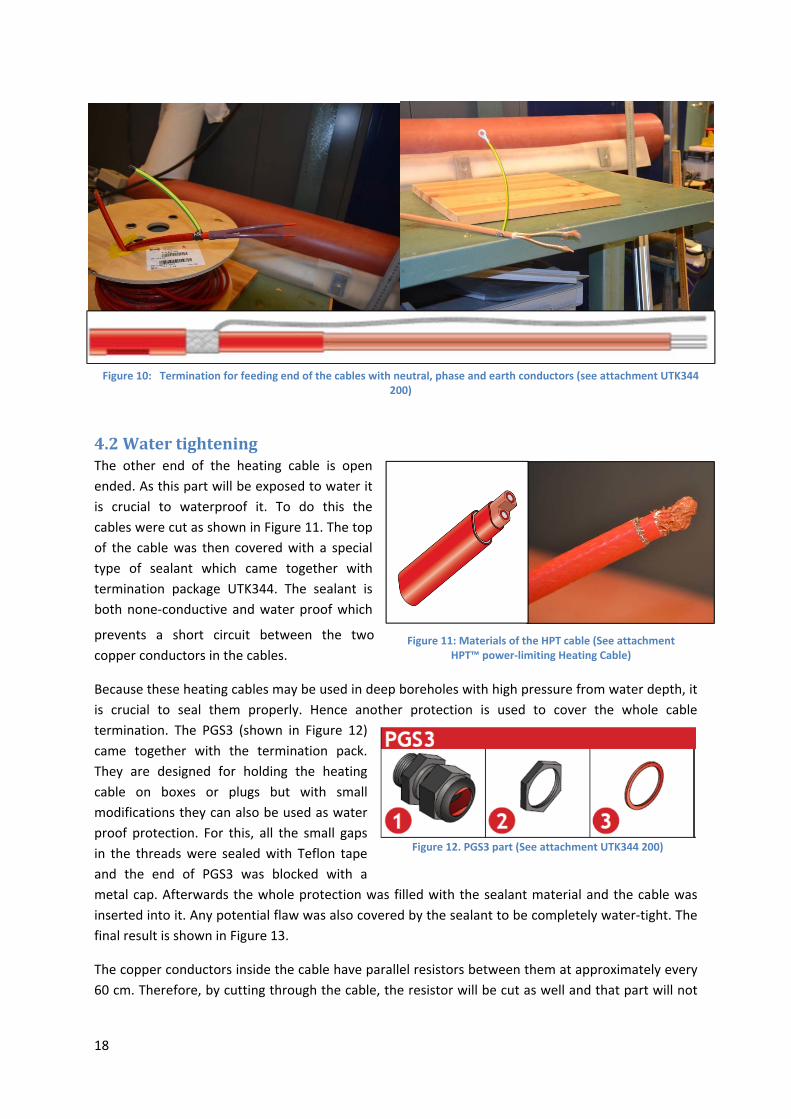
Figure 10: Termination for feeding end of the cables with neutral, phase and earth conductors (see attachment UTK344 200)
4.2WatertighteningThe other end of the heating cable is open
ended. As this part will be exposed to water it
is crucial to waterproof it. To do this the
cables were cut as shown in Figure 11. The top
of the cable was then covered with a special
type of sealant which came together with
termination package UTK344. The sealant is
both none‐conductive and water proof which
prevents a short circuit between the two
copper conductors in the cables.
Because these heating cables may be used in deep boreholes with high pressure from water depth, it
is crucial to seal them properly. Hence another protection is used to cover the whole cable
termination. The PGS3 (shown in Figure 12)
came together with the termination pack.
They are designed for holding the heating
cable on boxes or plugs but with small
modifications they can also be used as water
proof protection. For this, all the small gaps
in the threads were sealed with Teflon tape
and the end of PGS3 was blocked with a
metal cap. Afterwards the whole protection was filled with the sealant material and the cable was
inserted into it. Any potential flaw was also covered by the sealant to be completely water‐tight. The
final result is shown in Figure 13.
The copper conductors inside the cable have parallel resistors between them at approximately every
60 cm. Therefore, by cutting through the cable, the resistor will be cut as well and that part will not
Figure 11: Materials of the HPT cable (See attachment HPT™ power‐limiting Heating Cable)
Figure 12. PGS3 part (See attachment UTK344 200)
19
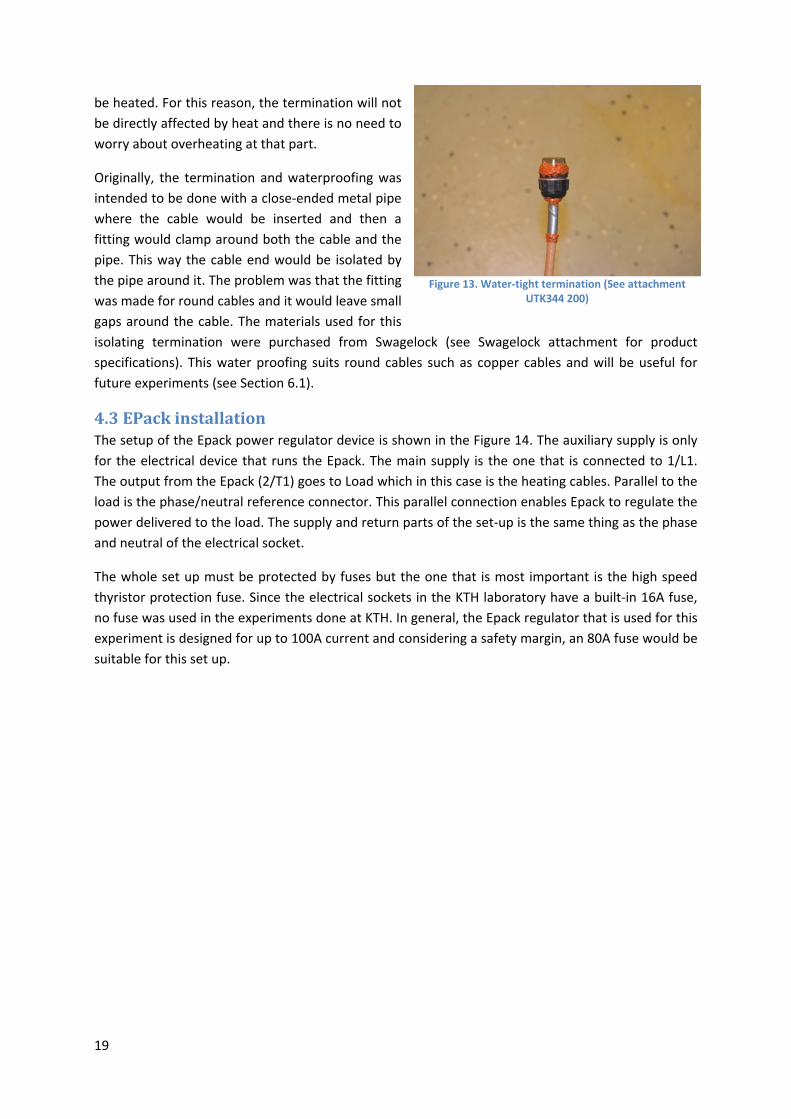
be heated. For this reason, the termination will not
be directly affected by heat and there is no need to
worry about overheating at that part.
Originally, the termination and waterproofing was
intended to be done with a close‐ended metal pipe
where the cable would be inserted and then a
fitting would clamp around both the cable and the
pipe. This way the cable end would be isolated by
the pipe around it. The problem was that the fitting
was made for round cables and it would leave small
gaps around the cable. The materials used for this
isolating termination were purchased from Swagelock (see Swagelock attachment for product
specifications). This water proofing suits round cables such as copper cables and will be useful for
future experiments (see Section 6.1).
4.3EPackinstallationThe setup of the Epack power regulator device is shown in the Figure 14. The auxiliary supply is only
for the electrical device that runs the Epack. The main supply is the one that is connected to 1/L1.
The output from the Epack (2/T1) goes to Load which in this case is the heating cables. Parallel to the
load is the phase/neutral reference connector. This parallel connection enables Epack to regulate the
power delivered to the load. The supply and return parts of the set‐up is the same thing as the phase
and neutral of the electrical socket.
The whole set up must be protected by fuses but the one that is most important is the high speed
thyristor protection fuse. Since the electrical sockets in the KTH laboratory have a built‐in 16A fuse,
no fuse was used in the experiments done at KTH. In general, the Epack regulator that is used for this
experiment is designed for up to 100A current and considering a safety margin, an 80A fuse would be
suitable for this set up.
Figure 13. Water‐tight termination (See attachment UTK344 200)

20
The heating cables were connected to the rest of the devices through copper cables with negligible
resistance. This enabled the set up to be more flexible and prevent overheating. The heating cables
could be simply put in the water rather than being directly connected to Epack and heating up the air
where it is not needed.
Figure 15 below shows the completed setup.
Figure 14. Coupling overview for EPack (See attachment EPack User Guide)

21
Using the Epack power regulator requires installation with the right conditions. The parameters that
need to be selected on the Epack to run the experiment were discussed with the manufacturing
company (schneider‐electric, 2015) and are presented here:
V nominal is the voltage delivered to the Epack from the power source. This was chosen to
be 230 V as it is the standard voltage difference of electrical supply in KTH laboratory.
I nominal is the current delivered to the heating cable and depends on the experiment. For
example if the cable is 10 m long and the required power is 70 W/m, total required power
would be 700W. Based on a simple electrical relation the I nominal would be:
700230
3 (4.1)
It is clear that the nominal current should be less or equal than the total current that can be
delivered from the power supply.
Firing mode determines how the thyristor inside the Epack would regulate the power. A
thyristor works by shutting the electricity on and off to achieve the desired power. For this
experiment ‘burst variable firing mode’ was chosen. This type of firing mode uses a minimum
period for on and off times but can also increase the on and off time to achieve the constant
power. This is the preferred mode for heating cables. A simple analogy of how it works is
shown in Figure 16 below:
Figure 15. Epack connections. 1 The light brown (1/L1) cable connected to the top of the device is phase from thepower source. 2 The dark blue cable (2/T1) goes to the heating cable. 3 The thin black cable at the bottom of thepicture is neutral coming back from heating cable. 4 The light blue cable goes back to power source neutral. 5 The redcable is the phase/neutral reference connector (N/L2). 6 The two thin blue and brown cables are the auxiliary powersupply.

22
It should be noted that other types of firing modes can also be used for the heating cable as
well.
Control mode was chose as power mode since it is the power that must be regulated. In this
case the feedback is directly proportional to the total power delivered to the heating cables.
I limit is enabled to have a threshold limit.
I2 transfer function is disabled as it is not needed for this case. I2 transfer function uses
current as feedback parameter for controlling. This can be helpful if a cable has high inrush,
thus it must have controlled current until the cable is warmed up. Then the transfer function
will automatically shift to power and work normally.
Transformer is not used and Epack is directly connected to the load.
Load type is Resistive.
Analogue input function: set as none and all the changes are made directly from the front
panel of the Epack. It would have been needed if the device was controlled by a computer.
Digital input 1 function is on ‘firing
enable’ so that the power module
thyristor would operate. (This also
requires a short circuit connection
between the 0V and DI1 pin of I/O
connector on the device. The
connection is shown in Figure 17.
Digital input 2 function is selected as
‘alarm acknowledge’ which enables
alarm acknowledgement from the front panel.
Link speed depends on the type of communication link which was not used in this test. This
was set on auto negotiation.
IP mode can be chosen as fixed or DHCP, but neither are used here.
IP address is used only for fixed IP mode.
Subnet mask is used only for fixed IP mode.
After following all the steps above, the Epack power controller is ready run. The set point of the
device can be chosen from 0 to 100% depending on what power is needed for the experiment. When
Epack is running, it shows the exact power that is being delivered while allowing the user to see the
fluctuation of the power. It is important to know the exact power at each time for the thermal
conductivity measurements. More fluctuations would mean to more uncertainty in the calculations.
Figure 16 Example of Firing mode of EPack power controller (See attachment EPack User Guide)
Figure 17. I/O connection

23
4.4WatertankandcylindertestA small scale test was designed to check the selected devices before an actual DTRT is done. The test
setup was arranged using a water tank and two submerged cylinders. The cables will be tested
separately with the following objectives:
To make sure that the heating cables can operate over a period of one to two days. This
includes making sure that the water tightening that was made is not compromised.
Demonstrate that the Epack power controller is able to deliver a constant power over the
entire test.
Observe and measure the heat dissipation from the heating cables over the duration of the
experiment.
The water tank test will be carried out in the ITM lab at KTH University. It is designed to be a
simulation of an actual DTRT test. A 1.2x1.0x0.85 m tank filled with water was chosen for the
experiment. The Heating cables and the fiber optic sensor will be submerged in the water as shown
in Figure 18. The two cylinders are one meter long and 20 cm in diameter. To attach the cables to the
cylinders, small holes were made on the cylinders and cables were joined to them using plastic cable
ties. The heating cables used for this test are 10 m long Protherm PHT and 30 m of Thermon HPT.
As explained in Section 4, fiber optics cables will be attached to the heating cables. Given the two‐
meter resolution of the fiber sensors, measurements will happen at every two meters. This
resolution is enough for a long borehole, for example a 100 m borehole will have 50 measuring
points. But since the cables that are used in the water tank experiment are only 10 and 30 meters,
attaching fiber cables to the heating cables would provide only 5 and 15 measuring points,
respectively. To obtain a better measurement of the temperature distribution along the cables, the
fiber cables were wrapped around the cylinders in the way that is shown in Figure 18. The
circumference of cylinder is about 0.63 m, which means there will be roughly one measuring point
for every 3 loops (3 x 0.63 m ≈ 2 m). Using this arrangement, more measurements will be available,
which will allow for a more extensive analysis of the temperature distribution.
The configuration with the heating cables wrapped around the cylinders was considered appropriate
due to essentially three reasons. First, to make sure that the heating cables don’t overlap. If two
heating cables are in contact with each other, there would be a higher chance for overheating and
meltdown in the cables. To prevent this, the heating cables are attached to the cylinder maintaining
Figure 18. Water tank with cylinders test setup

24
a certain distance from each other. The second reason is to make the configurations somewhat
similar to that of an actual borehole DTRT. In the thermal response tests performed in boreholes, the
heating cables would be positioned vertically. Since the vertical configuration of the heating cables
would affect the temperature distribution along the cable by natural convection, the use of vertical
cylinders in the simulated test will provide a representation of this effect. The third reason is to test
the heat dissipation along the heating cable. Since the cable is made of parallel resistors, it is likely
that the resistors closer to the feeding end of the cable will have higher current going through them.
This will lead to higher heat dissipation in the beginning of the cable. Investigating this using a single
cylinder would be harder since water circulation will affect the temperature distribution. Therefore,
it would be difficult to quantify what portion of a change in temperature measured at the top of one
cylinder is caused by the adjacent heating
cable versus the convective heat
transferred from below.
Using the two cylinder configuration as
shown in Figure 19 makes it easier to tell
whether there is an imbalance in power
delivered from the cable. Even though
water will affect the temperature
distribution, the difference in the cylinders
set up will greaten the difference. As it is
shown in the graph, the heating cable starts
from the top of one cylinder and ends at
the top of the other cylinder. In such an
arrangement, the power on one cylinder
would be reducing from top to bottom and
from bottom to top on the other one. Thus
power dissipation will be the major factor in
temperature distribution and effects of the
natural convection will be minimized. Using
this configuration, one can easily tell if the
power dissipation is different just by
comparing the temperature distribution for
the two cylinders. More explanation on how
the heat is dispersed along the heating cables is presented in Section 5.2.
Figure 19. Cylinder configuration

25
5Results
5.1Atemperature‐timegraphandapower‐timegraphDue to the short time available for this thesis, the water tank experiment has been postponed to the
next phase of the project. It is recommended to conduct the tests as described in this report, and
compare the temperature distribution along the two cylinders. In addition, it is recommended to
calculate the power delivered by each one of the zones of the heating cable, and validate the results
by recording the temperature variation at the same locations.
5.2HeatingCablePerformanceIn the tests prepared here, the cables used had relatively short
lengths. As mentioned before, a borehole can be up to 300 m long
and this can be problematic for both of these heating cables. As
explained in the Section 3.2, HPT and PHT cables are made of several
parallel connections between the two main copper conductors,
those connections are formed by the resistors. If the cables are long,
more resistors will be generating heat, thus, drawing more power.
On the other hand, the copper conductors will also have a higher
electrical resistance and will affect the power delivered along the
cable by reducing the power delivered to the resistors and by acting
as heaters themselves.
For example if a 300 m Thermon HPT cable is used, the power drop
along the cable can be estimated by the following calculation:
Thermon HPT has two main copper conductors with 3.3 mm2 cross‐
section area (A). The average conductivity of copper is 6*107 S/m.
The electrical resistance of the copper conductors per meter would
be:
σ
1
3.3 10 6 100.0051 Ω/ (5.1)
Where L is the length, A is the cross‐section area and σ is the electrical conductivity. If the power (P)
that is intended to be used in the TRT is 50 W/m with a 230V voltage supply, then the requirement
would be:
∗ 50 ∗ 300230
65.2 (5.2)
The power dissipation in the copper conductors per meter due to current at the feeding end of the
cable would be:
∗ ∗ 2 42.9 / (5.3)
Figure 20. Heating cable with parallel resistor
26
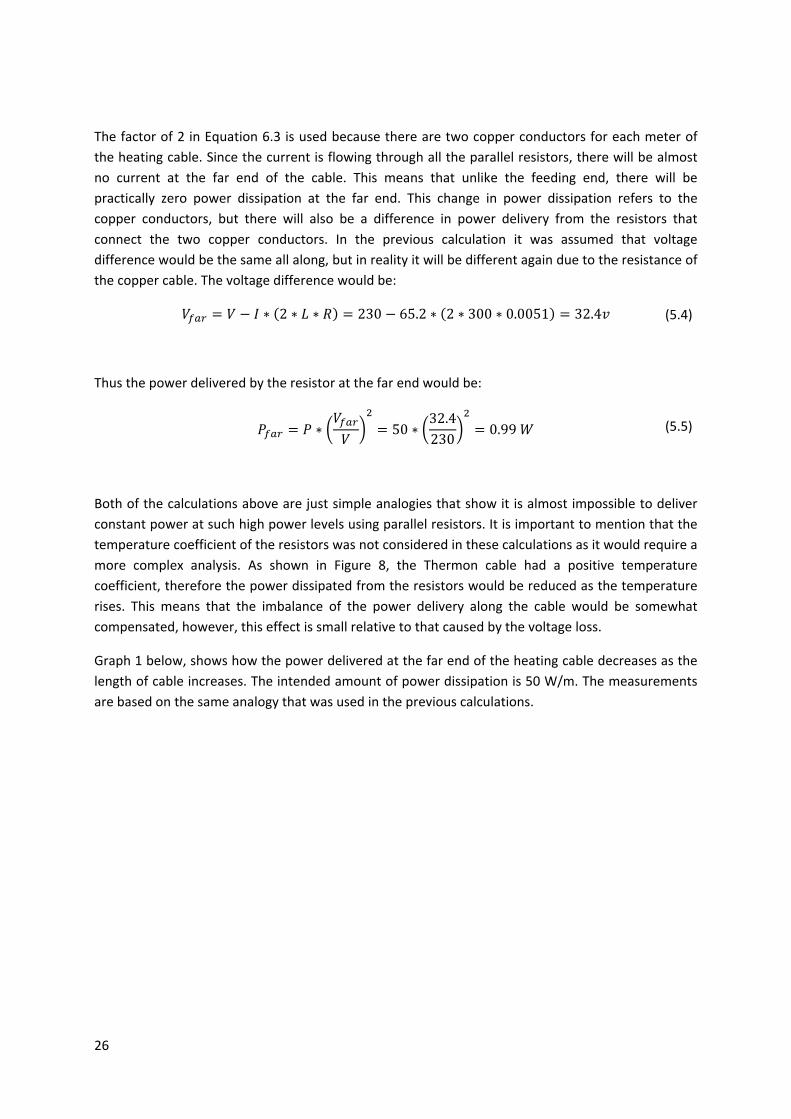
The factor of 2 in Equation 6.3 is used because there are two copper conductors for each meter of
the heating cable. Since the current is flowing through all the parallel resistors, there will be almost
no current at the far end of the cable. This means that unlike the feeding end, there will be
practically zero power dissipation at the far end. This change in power dissipation refers to the
copper conductors, but there will also be a difference in power delivery from the resistors that
connect the two copper conductors. In the previous calculation it was assumed that voltage
difference would be the same all along, but in reality it will be different again due to the resistance of
the copper cable. The voltage difference would be:
∗ 2 ∗ ∗ 230 65.2 ∗ 2 ∗ 300 ∗ 0.0051 32.4 (5.4)
Thus the power delivered by the resistor at the far end would be:
∗ 50 ∗
32.4230
0.99 (5.5)
Both of the calculations above are just simple analogies that show it is almost impossible to deliver
constant power at such high power levels using parallel resistors. It is important to mention that the
temperature coefficient of the resistors was not considered in these calculations as it would require a
more complex analysis. As shown in Figure 8, the Thermon cable had a positive temperature
coefficient, therefore the power dissipated from the resistors would be reduced as the temperature
rises. This means that the imbalance of the power delivery along the cable would be somewhat
compensated, however, this effect is small relative to that caused by the voltage loss.
Graph 1 below, shows how the power delivered at the far end of the heating cable decreases as the
length of cable increases. The intended amount of power dissipation is 50 W/m. The measurements
are based on the same analogy that was used in the previous calculations.

27
Graph 1. Heat dissipated at far end for each length
Graph 1 shows that the Thermon HPT cable has a more balanced power distribution compared to the
Protherm PHT. This is due to the thicker conductors used in Thermon cables which reduces the
resistance of the conductors and allows the current to go through the resistors more evenly. Overall,
graph 1 demonstrates that heating cables with parallel conductors are absolutely not suitable for
delivering power for deep boreholes. One can argue that due to the
contribution of the positive temperature coefficient and power limiting
features of the Thermon cable, this could even out the power
distribution to some extent, but given the range of temperatures likely
to exist, this effect will definitely not be enough.
6DiscussionThe findings in this project are just the initial steps in a lengthy process.
There are several things that must be done in order to further improve
this new DTRT method and make it ready to be introduced to the
market. First, it was shown that the Protherm PHT and Thermon HPT
heating cables have uneven power dissipation and can only be good
options for short boreholes up to 100 meters, or other applications
that do not require longer lengths. In this section, some of the
problems for development of DTRT and suggestions for overcoming
them are discussed.
0
10
20
30
40
50
0 50 100 150 200 250 300
Power delivered at far end (W/m
)
Lenght of the heating cable (m)
Thermon HPT
Protherm PHT
Figure 21. Single copper cable resistor configuration

28
6.1SinglecoppercableresistorsAs it was shown earlier, neither the Thermon nor the Protherm cables would be appropriate for
boreholes longer than 100 m. In order to deliver the required power, which was 40‐70 W/m, simple
copper cables could be used. Copper is a good electricity conductor, but a long copper cable with
relatively thin cross‐section area could have enough resistance to be used as a resistive heater. The
calculation below shows an example of how a copper cable could deliver the desired power.
If the borehole is 300 m deep with 50 W/m needed to perform a TRT, the required current is given
by:
∗ 50 ∗ 300230
65.2 (6.1)
The total resistance of the copper cable has to be:
23065.2
3.53 Ω (6.2)
The cross‐section area of the copper cable (as shown in the Figure 21) that can deliver the 50 W/m
would be:
2 ∗∗ σ
2 ∗ 3003.53 ∗ 6 ∗ 10
2.83 (6.3)
To have even a better precision, the temperature coefficient of the copper should also be considered
in the measurements. To determine the change in the resistance of the cables, the average
temperature of the copper cables must be measured first. This can be done by almost the same
process as the water tank and cylinder experiment, but with the fiber optic sensors attached to the
copper cable. With this arrangement, the average temperature of a copper cable under a TRT test
could be approximated. It should be noted that doing the water tank experiment with copper cables
would need much longer cable and probably a larger tank. After knowing the average temperature,
the measurements would be more accurate. For example, if the copper cable’s temperature is equal
to 100 oC, the cross‐sectional area with the exact required resistance would be:
1
3.531 0.004 100 20
2.67Ω (6.4)
→
2 ∗∗ σ
2 ∗ 3002.67 ∗ 6 ∗ 10
3.74 (6.5)

29
The same analogy can be used to find resistance and cross‐section area needed for other borehole
lengths as well. Graph 2 below, shows the copper cable cross‐sectional area that can be used for
different borehole lengths.
Graph 2. Required cross section area of copper cable vs. borehole length.
One slight problem here is that copper cables thinner than 0.75 mm2 are not common and very hard
to find in the market. Therefore as one can see from Graph 2 above, copper cables can not cover the
range below 150 meters of depth. One solution for that would be looking for other types of
conductors such as copper alloys or nickel‐chrome with higher resistance. Another solution would be
using a longer copper cable and folding it upon itself. This way the resistance would increase because
of the increase in the length of the cable. For example the resistance
needed for a 100 meter borehole based on the calculations above
would be 10.6 ohms which is achieved with 0.42 mm2 cross‐sectional
area. But if the cable length is doubled, the required cross‐section
would be 0.84 mm2.
Using the right cable with the right resistance would make power
control much easier for the regulator. Because cables are normally
produced in standards sizes (0.75, 1.0, 1.5, 2.5 etc. mm2), the power
per meter can be changed in order to match the right cable size. This
will not be a problem given the open range of 40‐70 W/m required for
a thermal response test.
6.2Three‐PhasepowersourceAlthough using a single copper cable for heating would be simple,
finding a power source that can deliver up to 65 amps is very difficult.
Usually power sources above 20 A are only available for industrial
0
0,5
1
1,5
2
2,5
3
3,5
4
60 100 140 180 220 260 300
Cab
le cross section area(mm
2)
Axis Title
Figure 22. Double length copper cable.

30
applications. One can find 63A current electricity in an industrial place but even then using it requires
special permission and regulations. Otherwise most of the power sources at higher levels are 3‐
phase. Therefore it is not possible to use the same set‐up for several tests with different borehole
length and power requirement. In order to develop a complete DTRT method with heating cables, it
is recommended to investigate solutions for each borehole length range separately (for example up
to 100m, 100‐200m, 200‐300m).
During this phase of the project, it was not possible to practically test different options available for
3‐phase. The following are some of the options that are suggested for future improvements to
develop the new response test method using three sources (Taylor, 2015).
6.2.1ThreephasetosinglecableIn this case the three phases would be combined into one single phase source
with three times as much power through a transformer
as it is shown in Figure 23. The advantage of this
method would be that only one cable is being used and
installation would be simple. On the other hand finding
a transformer to convert a 3‐phase into single‐phase
might have its own challenges.
6.2.2NormalAs it is shown in Figure 24, there are three sets of cables
simply connected between phases and neutral. The
advantage of this configuration is that the power is
divided between three cables. The disadvantage is that
cables need to be thinner thus probably not suitable for
shorter boreholes.
6.2.3ThreecorecableOne option is to use a thick cable with three separate
copper wires inside. Each of the three copper wires is
connected to one phase as shown in the Figure 25.
This method is slightly more complex because the
three phases should be set up in a way that they
balance each other. If it is done correctly, there would
be no voltage at the bottom of the cable. The biggest
advantage of this configuration is that a three core
cable is easy to find in the market and everything can
fit nicely in one large insulated cable.
6.2.4DeltaconnectionDelta connection is a unique type of connection that
enables higher voltage difference in each resistor;
therefore a thinner cable can be used. This is more
suitable for longer boreholes.
Figure 23. Combining Three‐phase into one.
Figure 24. Three normal phases.
Figure 25. Three core cable.
Figure 26. Delta connection.

31
6.3RegulatingthepowerThe power delivered to the heating cables will never be absolutely constant. This can be caused by
several reasons such as fluctuations of the frequency and voltage delivered from the power source or
the change in the electrical resistance of the cables. To minimize the effect of the power fluctuations
on the measurements, it will be better to log the power delivered overtime as well. Doing so would
reduce the uncertainties by using the mean power delivered over time. If the power fluctuations are
too big, the TRT would have to be re‐done with new conditions, such as a different cable size.
Logging data from the Epack power controller requires a connection to a computer plus a software
license that must be purchased from the company.
One advantage of using a copper cable as a resistor is its low temperature coefficient (0.4%), in other
words, the resistance would not change that much during a response test. Looking at the previous
DTRT that has been done with the conventional method, the borehole temperature rises from
approximately 10 oC to 20 oC (Acuña J. , 2015). Therefore even if the copper cable temperature
increases by 10 oC, the resistance would only change by 4%. This makes the power regulation much
easier. One can even consider conducting the test without a power regulator if the change is not
significant.
Regulating the power for the 3‐phase options will be slightly different compared to single‐phase.
Ideally, all three phases should be regulated which can be done by using three single regulators such
as the Epack or using one 3‐phase regulator. The easier and cheaper way for controlling a multi‐
phase power is by using a main power meter and one Epack unit. Using this technique, one can look
at the total power delivered to all of the cables from the power meter and regulate just one of the
cables to balance the total power. Considering the little change in copper cables resistance during a
TRT, using one regulator should be acceptable in most practical cases.
6.4HeatisolationOne factor that must be considered in the choices made for the heating cables is the maximum
temperature that the insulation can handle. There are cables with silicone rubber insulation in the
market that are heat resistant up to 180 oC. With more investigation, even more enduring cables
could possibly be found. But to make sure that they can handle high heat, the cables must be tested
as well. Thin cables should be specifically tested since they will have higher heat density inside them,
especially in open air conditions since it is likely that some part of the heating cable will be above
water level and exposed to ambient air.
Today, a silicon rubber insulated cable costs around 30‐60 SEK/m depending on the cable size (MBS
RC models_ Magnus Svensson, 2014). This is relatively cheap and much more economically viable
compared to the Thermon and Protherm options that were discussed before. The low cable cost is
very critical if one chooses to use a 3‐phase model with several cables going up and down along the
borehole.
6.5FutureworkThere is a lot left in the developing process of the heating cable DTRT technique. As discussed earlier
the design of DTRT can be very different depending on the borehole length, thus it is recommended
that each borehole size be analyzed separately. There was not enough time to analyze each model
separately in this project and the water tank experiment remained undone as well. It is evident that

32
in the future the designs have to be tested both in smaller lab scale and in an actual borehole. The
tests must be repeated until the most reliable and cost efficient design is made so it can be
introduced to the market.
7ReflectionsaboutSustainableDevelopmentrelatedtothisprojectThis new technique for DTRT is still in its cradle. What consequences it will have when (and if) it is
ready for the market (both for ground coupled heat pumps and as a contributor to sustainable
development) is still unknown and hard to predict with certainty. Especially if wider geographical and
long‐term perspectives are taken into consideration. Because the new DTRT method hasn’t been fully
examined, it gives room for speculations and inaccuracies in estimations. A smaller investigation of a
specific site at given timeframes could possibly be a subject for a new thesis study, where the
increased efficiency can be measured.
To analyze the effect of DTRT the estimation made in José Acuña’s Licentiate thesis (Acuña J. , 2010)
is used. A DTRT could increase the coefficient of performance for ground coupled heat pumps with
10‐20 %. Estimations show that a wide implementation of this technique is able to save electricity in
the quantities between 0.2 to 0.4 TWh per year in Sweden. Compared with the total electricity
demand per year which reached 142 TWh during 2012 (Energimyndigheten_3, 2013) it is clear that it
is a significant amount for a single improvement. This thesis aims to explore the first step of a new
DTRT method using heating cables, thus one can assume that this response test has at least the same
potential for optimizing ground coupled heat pumps, but at a lower cost and with greater flexibility
which is one of the main aspects of sustainable development.
This technique has elements of eco efficiency and minimization of resource usage as well as cleaner
services which are key elements in the Glavics pyramid regarding sustainable development. (Glavics
pyramid is an approach which analyzes smaller elements involved in sustainable development made
by Peter Glavic (Glavic P, 2007)). As heat pumps use electricity in operation, they require natural
resources utilized for power generation. But the amount of resources needed is less (as it is
explained by the COP factor); heat pumps ensure that the heat gained is greater than the input
electricity. This transforms non‐combustible forms of energy sources like hydro, nuclear, solar and
wind into potential heat providers. But the sustainability aspect of these sources depends on how
they are utilized and how the electricity is generated.
For example from an ecological point of view, changing the heating system from pipeline‐delivered
natural gas to geothermal heat pump is not necessarily a good idea. One of the main aspects of
ecological sustainable development is reducing carbon emission. In that case using a geothermal
heat pump depends on the source of electricity and how efficient that power generation is. If a fossil
fuel power plant is used for electricity generation, the net CO2 emission would be the same. For
instance, the electricity system in the USA delivers on average 33 % of the total energy burnt in fossil
fuels for residential electricity purposes (Straube, 2009). Meaning that if you have a geothermal heat
pump with an average COP of 3 the environmental benefit cancels out. As natural gas which can be
used for heating purposes can be combusted directly where the heat is needed with an efficiency of
around 92 %. (Straube, 2009) But if the source of electricity is free from carbon‐dioxide (although
assuming that all sources has some environmental impact) or if the house is heated with electrical
heaters using geothermal heat pumps will be advantageous from an ecological point of view.

33
From a social perspective heat pumps, including geothermal ones, provide increasing energy
independence giving customers more power over their own energy cost and usage. Assuming that
customers can afford the initial investment, geothermal heat pumps will reduce their dependence on
large energy companies.
If this new DTRT methodology reaches the global market in the future, it will increase the economic
incentives to use ground coupled heat pumps. Another incentive may be estimating how much
emissions from fossil fuels can be prevented could be relevant since fossil fuels are the dominant
energy source in the world.
Think of a hypothetic scenario where Sweden is still dependent on oil for heating purposes (as during
the 1970s (Energimyndigheten_3, 2013)) and geothermal heat pumps are used to the same extent as
today for residential heating. This new DTRT would enhance the performance for geothermal heat
pumps and results in 0.3 TWh electricity saving (either from adjustment or probably when new
installations happen).
A heat power plant that runs on distillate oil emits 0.76 kg of CO2 per kWh (EIA_2, 2013). If this was
used for electrical generation 0.3 TWh is equal to 3*108 kWh, equivalently this would emit
approximately 0.23 million tons of CO2. As a comparison in 2012, Sweden’s greenhouse gas
emissions totaled 58.3 million tons of CO2 equivalents (Swedish institute, 2014).
The hypothetical oil burning scenario would therefore save roughly a 250‐part of the total emissions
because of the improvements of geothermal heat pumps. These figures are very simplified and
somewhat idealized for carbon reduction potential. But one can get an overall feeling of how carbon
dioxide emissions can be cut with just the enhancement of geothermal heat pumps thanks to a more
flexible and cost efficient TRT. Fossil fuels also emit health and environmental hazardous particles
which impact both human health and the environment. World Health Organization has estimated
that air pollution costs 1.6 trillion dollars a year in Europe, which is almost a tenth of the total GDP
budget in EU (WHO, 2015). Every action to reduce the use of fossil fuels is therefore of economic
importance as well.
The potential increase in COP gives greater incentives to invest in geothermal heat pumps, which
reinforces the third pillar of sustainable development. Without some level of profitability the other
two pillars (Ecology and social aspect) will not happen, especially in this case where geothermal heat
pump systems are quite capital intensive. The profitability is dependent on geothermal properties of
the specific area as well as the price for other types of heating options, such as pure electrical
heating (high electricity prices favors an investment), district heating, or local combustion of biofuels
or fossil fuels such as natural gas.
It is clear that the advancement of TRT is tightly coupled with geothermal heat pumps. To get an
overall picture of how important geothermal heat pumps are and why one should invest in TRT, a
brief review over the history and today’s situation of geothermal heat pumps is given.
8ConclusionsOverall this project lays a good foundation for development of distributed thermal response test
using heating cables. A basic design has been made and some equipment that will optimize the

34
design has been selected. The heating cables that were initially tested weren’t the best option for a
DTRT because of both high price and uneven heat dissipation. In addition, although an actual test
has not been carried out, the chosen power regulator seems to effectively fit the design
requirements.
Literature study shows that there has been some previous work on DTRT with heating cables. Results
from Jasmine Raymond’s publication, A novel thermal response test using heating cables (Raymond,
Robert, Rene, & Gosselin, 2010), shows how he performed a small scale DTRT with short length cable
and separate temperature sensors at different points. In another one of Raymond’s experiments he
injects 1 kW heat separately in ten sections along a borehole to prevent high power consumption
(Raymond , Lamarche, & Malo, Field demonstration of a first thermal response test with a low power
source, 2015). The advantage of the DTRT designed in this project compared to Raymond’s versions
is that power is dissipated all along a long borehole and not just at short lengths. Use of fiber optic
cables will give much better temperature profile along the borehole compared to other type of
sensors. Ultimately use of single heating cables plus a fiber optic makes it easier to commercialize
DTRT by using a single long cable that includes all parts
The design of DTRT depends on many factors. The most important one is the depth of the borehole
but there are other critical factors such as the amount of power required per meter, acceptable
amount of fluctuation and uncertainty in the power supply. At the same time, the design should be
as simple as possible so that the test can be done easily while minimizing its cost. Given all of these
factors, it is difficult to develop a DTRT that suits all of the conditions without a tradeoff. It is
recommended that the development process should be done separately for different borehole
depths, or ranges of depths, and if one proves to be successful then it can be further researched in an
attempt to satisfy a broader set of requirements.

35
BibliographyAcuña, J. (2010). Improvements of U‐pipe Borehole Heat Exchangers. KTH School of Industrial
Engineering and Management.
Acuña, J. (2015, April). (J. H. Mazyar Moghaddam, Interviewer)
Ashrae. (2011). Geothermal energy. In ASHRAE Handbook‐HVAC Applications (p. 13).
Björk E, A. J. (2013). Bergvärme på djupet. Stockholm: Erik Björk KTH & Sebastian Widin US‐Ab.
EIA. (2013). EIA projects world energy consumption will increase 56% by 2040. EIA.
EIA_2. (2013). How much carbon dioxide is produced per kilowatthour when generating electricity
with fossil fuels?
Energimyndigheten. (2015). Värmepumparnas roll på uppvärmningsmarknaden. Stockholm.
Energimyndigheten_2. (2010). Välj rätt värmepump. Energimyndigheten.
Energimyndigheten_3. (2013). Energiläget 2013.
Gehlin, S. (2002). Thermal Reponse Test: Method Devlopment and Evaluation. Luleå: LTU.
Geoenergin i samhället, B. J. (2012). GEOTEC & Svensk Geoenergi.
Glavic P, L. R. (2007). Review of sustainability terms and their definitions. ScienceDirect.
IGSHPA. (2014, Mars). What is IGSHPA? Retrieved Mars 15, 2015, from International ground source
heat pump assiociation: http://www.igshpa.okstate.edu/about/
Kharseh, M. (2010, August 19). Staff page Mohamad Kharseh. Retrieved Mars 10, 2015, from LTU.se:
http://www.ltu.se/staff/k/khamoh‐1.13627
MBS RC models_ Magnus Svensson. (2014). kablar‐el. Retrieved May 4, 2015, from http://www.mbs‐
rcmodels.se/: http://www.mbs‐rcmodels.se/kablar‐el/
Nordell, B. (2011). TRT State of the Art. Luleå: IEA.
Oregon state university. (2008). Absorption Refrigeration. Retrieved April 17, 2015, from
oregonstate.edu:
https://web.engr.oregonstate.edu/~narayavi/absorption%20refrigeration.html
Park, A. Y. (2011). Ground, air and water source heat pumps. Yorkshire Dales National Park Authority.
Raymond , J., Lamarche, L., & Malo, M. (2015). Field demonstration of a first thermal response test
with a low power source. Applied energy, 30‐39.
Raymond, J., Robert, Rene, T., & Gosselin, L. (2010). A novel thermal response test using heating
cable. World Geothermla congress. Bali, Indonesia.
Reddy B, J. S. (2012). Geothermal heat pump systems: Status review and comparison with other
heating options. Sciencedirect.

36
schneider‐electric, T. M.‐J. (2015, March). +46 40384525. (J. H. Mazyar Moghaddam, Interviewer)
Seybotha K, B. L. (2008). Recognising the potential for renewable energy heating and cooling.
Sciencedirect.
Straube, J. (2009, May 2). Building Science Digests_What are heat pumps?
Swedish institute. (2014, March 25). Sweden.se. Retrieved May 2, 2015, from
https://sweden.se/nature/environmental‐policy/
Taylor, N. (2015, April). (M. M. Joakim Holmberg, Interviewer)
WHO. (2015, April 28). Air pollution costs European economies US$ 1.6 trillion a year in diseases and
deaths, new WHO study says. Retrieved May 3, 2015, from World health organisation :
http://www.euro.who.int/en/media‐centre/sections/press‐releases/2015/air‐pollution‐
costs‐european‐economies‐us$‐1.6‐trillion‐a‐year‐in‐diseases‐and‐deaths,‐new‐who‐study‐
says
Zogg M. (2008, May 22). History of Heat Pumps Swiss Contributions and International Milestones .
Retrieved April 2, 2015, from Zogg‐engineering: http://www.zogg‐
engineering.ch/publi/iea_hpc08_zogg.pdf