
First Quarter 2019 · Royal Bank of Canada First Quarter 2019 3 Selected financial and other...
67
First Quarter 2019 Royal Bank of Canada Royal Bank of Canada first quarter 2019 results All amounts are in Canadian dollars and are based on financial statements prepared in compliance with International Accounting Standard 34 Interim Financial Reporting, unless otherwise noted. Net Income $3.2 Billion Continued earnings growth of 5% YoY Diluted EPS (1) $2.15 Solid 7% growth YoY ROE (2) 16.7% Balanced capital deployment CET1 Ratio 11.4% Strong capital ratio TORONTO, February 22, 2019 — Royal Bank of Canada (RY on TSX and NYSE) today reported net income of $3,172 million for the quarter ended January 31, 2019, up $160 million or 5% from the prior year, with solid diluted EPS (1) growth of 7%. Results reflect solid underlying earnings growth in Personal & Commercial Banking and Insurance. Challenging market conditions impacted several business segments in the first quarter of 2019 contributing to results being flat in Wealth Management and lower results in Capital Markets and Investor & Treasury Services. Our results also reflect an increase due to foreign exchange translation and the write-down of net deferred tax assets in the prior year related to the U.S. Tax Reform. Compared to last quarter, net income was down $78 million with higher earnings in Wealth Management, Personal & Commercial Banking, and Investor & Treasury Services. These were more than offset by lower earnings in Insurance, and Capital Markets due to challenging market conditions. Results this quarter also reflect investments in client-facing staff and technology initiatives, as well as higher provisions for credit losses (PCL), with a total PCL ratio on loans of 34 basis points (bps). PCL on impaired loans ratio of 28 bps was up 8 bps compared to last quarter, largely due to higher provisions related to one account in Capital Markets. Our capital position remained strong, with a Common Equity Tier 1 (CET1) ratio of 11.4%. In addition, today we announced an increase to our quarterly dividend of $0.04 or 4% to $1.02 per share. “Our strategy and unwavering focus on delivering value for our clients and shareholders continues to underpin our ability to consistently deliver solid results, even against a challenging market backdrop. In addition to delivering earnings of $3.2 billion, we are pleased to increase our quarterly dividend by 4% today. We remain focused on prudently managing our risks and balancing our investments for long-term growth as we transform the client journey.” – Dave McKay, RBC President and Chief Executive Officer Q1 2019 Compared to Q1 2018 • Net income of $3,172 million • Diluted EPS (1) of $2.15 • ROE (2) of 16.7% • CET1 ratio of 11.4% ↑ 5% ↑ 7% ↓ 70 bps ↑ 40 bps Q1 2019 Compared to Q4 2018 • Net income of $3,172 million • Diluted EPS (1) of $2.15 • ROE (2) of 16.7% • CET1 ratio of 11.4% ↓ 2% ↓ 2% ↓ 90 bps ↓ 10 bps (1) Earnings per share (EPS). (2) Return on Equity (ROE). This measure does not have a standardized meaning under GAAP. For further information, refer to the Key performance and non-GAAP measures section of this Q1 2019 Report to Shareholders. Table of contents 1 First quarter highlights 2 Management’s Discussion and Analysis 2 Caution regarding forward-looking statements 2 Overview and outlook 2 About Royal Bank of Canada 3 Selected financial and other highlights 4 Economic, market and regulatory review and outlook 5 Financial performance 5 Overview 9 Business segment results 9 How we measure and report our business segments 9 Key performance and non-GAAP measures 11 Personal & Commercial Banking 12 Wealth Management 14 Insurance 15 Investor & Treasury Services 16 Capital Markets 17 Corporate Support 18 Quarterly results and trend analysis 19 Financial condition 19 Condensed balance sheets 20 Off-balance sheet arrangements 21 Risk management 21 Credit risk 27 Market risk 31 Liquidity and funding risk 38 Capital management 42 Capital, liquidity, and other regulatory developments 43 Accounting and control matters 43 Summary of accounting policies and estimates 43 Change in accounting policies and disclosures 43 Controls and procedures 43 Related party transactions 44 Enhanced Disclosure Task Force recommendations index 45 Interim Condensed Consolidated Financial Statements (unaudited) 50 Notes to the Interim Condensed Consolidated Financial Statements (unaudited) 67 Shareholder Information
-
Upload
dangkhuong -
Category
Documents
-
view
213 -
download
0
Transcript of First Quarter 2019 · Royal Bank of Canada First Quarter 2019 3 Selected financial and other...

First Quarter 2019
Royal Bank of Canada
Royal Bank of Canada first quarter 2019 results
All amounts are in Canadian dollars and are based on financial statements prepared in compliance with International Accounting Standard 34 InterimFinancial Reporting, unless otherwise noted.
Net Income
$3.2 BillionContinued earnings growth
of 5% YoY
Diluted EPS(1)
$2.15Solid 7% growth
YoY
ROE(2)
16.7%Balanced capital
deployment
CET1 Ratio
11.4%Strong capital ratio
TORONTO, February 22, 2019 — Royal Bank of Canada (RY on TSX and NYSE) today reported net income of $3,172 million for the quarter endedJanuary 31, 2019, up $160 million or 5% from the prior year, with solid diluted EPS(1) growth of 7%. Results reflect solid underlying earnings growth inPersonal & Commercial Banking and Insurance. Challenging market conditions impacted several business segments in the first quarter of 2019contributing to results being flat in Wealth Management and lower results in Capital Markets and Investor & Treasury Services. Our results also reflectan increase due to foreign exchange translation and the write-down of net deferred tax assets in the prior year related to the U.S. Tax Reform.
Compared to last quarter, net income was down $78 million with higher earnings in Wealth Management, Personal & Commercial Banking, andInvestor & Treasury Services. These were more than offset by lower earnings in Insurance, and Capital Markets due to challenging market conditions.
Results this quarter also reflect investments in client-facing staff and technology initiatives, as well as higher provisions for credit losses (PCL), with atotal PCL ratio on loans of 34 basis points (bps). PCL on impaired loans ratio of 28 bps was up 8 bps compared to last quarter, largely due to higherprovisions related to one account in Capital Markets. Our capital position remained strong, with a Common Equity Tier 1 (CET1) ratio of 11.4%. Inaddition, today we announced an increase to our quarterly dividend of $0.04 or 4% to $1.02 per share.
“Our strategy and unwavering focus on delivering value for our clients and shareholders continues to underpin our ability to consistently deliversolid results, even against a challenging market backdrop. In addition to delivering earnings of $3.2 billion, we are pleased to increase ourquarterly dividend by 4% today. We remain focused on prudently managing our risks and balancing our investments for long-term growth as wetransform the client journey.”
– Dave McKay, RBC President and Chief Executive Officer
Q1 2019Compared toQ1 2018
• Net income of $3,172 million• Diluted EPS(1) of $2.15• ROE(2) of 16.7%• CET1 ratio of 11.4%
↑ 5%↑ 7%↓ 70 bps↑ 40 bps
Q1 2019Compared toQ4 2018
• Net income of $3,172 million• Diluted EPS(1) of $2.15• ROE(2) of 16.7%• CET1 ratio of 11.4%
↓ 2%↓ 2%↓ 90 bps↓ 10 bps
(1) Earnings per share (EPS).(2) Return on Equity (ROE). This measure does not have a standardized meaning under GAAP. For further information, refer to the Key performance and
non-GAAP measures section of this Q1 2019 Report to Shareholders.
Table of contents
1 First quarter highlights2 Management’s Discussion and Analysis2 Caution regarding forward-looking statements2 Overview and outlook
2 About Royal Bank of Canada3 Selected financial and other highlights4 Economic, market and regulatory review
and outlook5 Financial performance
5 Overview9 Business segment results
9 How we measure and report our businesssegments
9 Key performance and non-GAAP measures11 Personal & Commercial Banking
12 Wealth Management14 Insurance15 Investor & Treasury Services16 Capital Markets17 Corporate Support
18 Quarterly results and trend analysis19 Financial condition
19 Condensed balance sheets20 Off-balance sheet arrangements
21 Risk management21 Credit risk27 Market risk31 Liquidity and funding risk
38 Capital management42 Capital, liquidity, and other regulatory
developments
43 Accounting and control matters43 Summary of accounting policies and
estimates43 Change in accounting policies and
disclosures43 Controls and procedures
43 Related party transactions44 Enhanced Disclosure Task Force
recommendations index45 Interim Condensed Consolidated Financial
Statements (unaudited)50 Notes to the Interim Condensed Consolidated
Financial Statements (unaudited)67 Shareholder Information

2 Royal Bank of Canada First Quarter 2019
Management’s Discussion and Analysis
Management’s Discussion and Analysis (MD&A) is provided to enable a reader to assess our results of operations and financialcondition for the three month period ended or as at January 31, 2019, compared to the corresponding period in the prior fiscal yearand the three month period ended October 31, 2018. This MD&A should be read in conjunction with our unaudited InterimCondensed Consolidated Financial Statements for the quarter ended January 31, 2019 (Condensed Financial Statements) and relatednotes and our 2018 Annual Report. This MD&A is dated February 21, 2019. All amounts are in Canadian dollars, unless otherwisespecified, and are based on financial statements prepared in accordance with International Financial Reporting Standards (IFRS) asissued by the International Accounting Standards Board (IASB), unless otherwise noted.
Additional information about us, including our 2018 Annual Information Form, is available free of charge on our website at rbc.com/investorrelations, on the Canadian Securities Administrators’ website at sedar.com and on the EDGAR section of the United States(U.S.) Securities and Exchange Commission’s (SEC) website at sec.gov.
Information contained in or otherwise accessible through the websites mentioned does not form part of this report. All references inthis report to websites are inactive textual references and are for your information only.
Caution regarding forward-looking statements
From time to time, we make written or oral forward-looking statements within the meaning of certain securities laws, including the“safe harbour” provisions of the United States Private Securities Litigation Reform Act of 1995 and any applicable Canadian securitieslegislation. We may make forward-looking statements in this Q1 2019 Report to Shareholders, in other filings with Canadianregulators or the SEC, in other reports to shareholders, and in other communications. Forward-looking statements in this documentinclude, but are not limited to, statements relating to our financial performance objectives, vision and strategic goals, the Economic,market, and regulatory review and outlook for Canadian, U.S., European and global economies, the regulatory environment in whichwe operate, and the risk environment including our liquidity and funding risk, and includes our President and Chief Executive Officer’sstatements. The forward-looking information contained in this document is presented for the purpose of assisting the holders of oursecurities and financial analysts in understanding our financial position and results of operations as at and for the periods ended onthe dates presented, as well as our financial performance objectives, vision and strategic goals, and may not be appropriate for otherpurposes. Forward-looking statements are typically identified by words such as “believe”, “expect”, “foresee”, “forecast”,“anticipate”, “intend”, “estimate”, “goal”, “plan” and “project” and similar expressions of future or conditional verbs such as “will”,“may”, “should”, “could” or “would”.
By their very nature, forward-looking statements require us to make assumptions and are subject to inherent risks anduncertainties, which give rise to the possibility that our predictions, forecasts, projections, expectations or conclusions will not proveto be accurate, that our assumptions may not be correct and that our financial performance objectives, vision and strategic goals willnot be achieved. We caution readers not to place undue reliance on these statements as a number of risk factors could cause ouractual results to differ materially from the expectations expressed in such forward-looking statements. These factors – many of whichare beyond our control and the effects of which can be difficult to predict – include: credit, market, liquidity and funding, insurance,operational, regulatory compliance, strategic, reputation, legal and regulatory environment, competitive and systemic risks and otherrisks discussed in the risk sections of our 2018 Annual Report and the Risk management section of this Q1 2019 Report toShareholders; including global uncertainty, Canadian housing and household indebtedness, information technology and cyber risk,regulatory changes, digital disruption and innovation, data and third party related risks, climate change, the business and economicconditions in the geographic regions in which we operate, the effects of changes in government fiscal, monetary and other policies,tax risk and transparency, and environmental and social risk.
We caution that the foregoing list of risk factors is not exhaustive and other factors could also adversely affect our results. Whenrelying on our forward-looking statements to make decisions with respect to us, investors and others should carefully consider theforegoing factors and other uncertainties and potential events. Material economic assumptions underlying the forward-lookingstatements contained in this Q1 2019 Report to Shareholders are set out in the Economic, market and regulatory review and outlooksection and for each business segment under the Strategic priorities and Outlook headings in our 2018 Annual Report, as updated bythe Economic, market and regulatory review and outlook section of this Q1 2019 Report to Shareholders. Except as required by law,we do not undertake to update any forward-looking statement, whether written or oral, that may be made from time to time by us or onour behalf.
Additional information about these and other factors can be found in the risk sections of our 2018 Annual Report and the Riskmanagement section of this Q1 2019 Report to Shareholders.
Overview and outlook
About Royal Bank of Canada
Royal Bank of Canada is a global financial institution with a purpose-driven, principles-led approach to delivering leadingperformance. Our success comes from the 84,000+ employees who bring our vision, values and strategy to life so we can help ourclients thrive and communities prosper. As Canada’s biggest bank, and one of the largest in the world based on market capitalization,we have a diversified business model with a focus on innovation and providing exceptional experiences to our 16 million clients inCanada, the U.S. and 33 other countries. Learn more at rbc.com.

Royal Bank of Canada First Quarter 2019 3
Selected financial and other highlights
As at or for the three months ended For the three months ended
(Millions of Canadian dollars, except per share, number of and percentage amounts)
January 31
2019October 31
2018January 31
2018Q1 2019 vs.
Q4 2018Q1 2019 vs.
Q1 2018Total revenue $ 11,589 $ 10,669 $ 10,828 $ 920 $ 761Provision for credit losses (PCL) 514 353 334 161 180Insurance policyholder benefits, claims and acquisition
expense (PBCAE) 1,225 494 836 731 389Non-interest expense 5,912 5,882 5,611 30 301Income before income taxes 3,938 3,940 4,047 (2) (109)
Net income $ 3,172 $ 3,250 $ 3,012 $ (78) $ 160Segments – net income
Personal & Commercial Banking $ 1,571 $ 1,538 $ 1,521 $ 33 $ 50Wealth Management 597 553 597 44 –Insurance 166 318 127 (152) 39Investor & Treasury Services 161 155 219 6 (58)Capital Markets 653 666 748 (13) (95)Corporate Support 24 20 (200) 4 224
Net income $ 3,172 $ 3,250 $ 3,012 $ (78) $ 160Selected information
Earnings per share (EPS) – basic $ 2.15 $ 2.21 $ 2.02 $ (0.06) $ 0.13– diluted 2.15 2.20 2.01 (0.05) 0.14
Return on common equity (ROE) (1) (2) 16.7% 17.6% 17.4% (90) bps (70) bpsAverage common equity (1) $ 73,550 $ 71,700 $ 66,850 $ 1,850 $ 6,700Net interest margin (NIM) – on average earning assets (1) 1.62% 1.67% 1.65% (5) bps (3) bpsPCL on loans as a % of average net loans and acceptances 0.34% 0.23% 0.24% 11 bps 10 bpsPCL on impaired loans as a % of average net loans and
acceptances 0.28% 0.20% 0.23% 8 bps 5 bpsGross impaired loans (GIL) as a % of loans and acceptances 0.46% 0.37% 0.45% 9 bps 1 bpsLiquidity coverage ratio (LCR) (3) 128% 123% 122% 500 bps 600 bps
Capital ratios and Leverage ratio (4)
Common Equity Tier 1 (CET1) ratio 11.4% 11.5% 11.0% (10) bps 40 bpsTier 1 capital ratio 12.7% 12.8% 12.4% (10) bps 30 bpsTotal capital ratio 14.5% 14.6% 14.4% (10) bps 10 bpsLeverage ratio 4.3% 4.4% 4.2% (10) bps 10 bps
Selected balance sheet and other information (5)
Total assets $ 1,366,207 $ 1,334,734 $ 1,276,275 $ 31,473 $ 89,932Securities, net of applicable allowance 235,832 222,866 222,262 12,966 13,570Loans, net of allowance for loan losses 589,820 576,818 538,044 13,002 51,776Derivative related assets 84,816 94,039 105,512 (9,223) (20,696)Deposits 852,564 837,046 800,020 15,518 52,544Common equity 74,147 73,552 66,430 595 7,717Total capital risk-weighted assets 508,512 496,459 466,758 12,053 41,754Assets under management (AUM) 688,000 671,000 656,700 17,000 31,300Assets under administration (AUA) (6) 5,363,900 5,533,700 5,653,500 (169,800) (289,600)
Common share informationShares outstanding (000s) – average basic 1,437,074 1,440,207 1,451,781 (3,133) (14,707)
– average diluted 1,443,195 1,446,514 1,458,714 (3,319) (15,519)– end of period (7) 1,435,073 1,438,794 1,443,915 (3,721) (8,842)
Dividends declared per common share $ 0.98 $ 0.98 $ 0.91 $ – $ 0.07Dividend yield (8) 4.1% 3.8% 3.5% 30 bps 60 bpsCommon share price (RY on TSX) (9) $ 100.02 $ 95.92 $ 105.32 $ 4.10 $ (5.30)Market capitalization (TSX) (9) 143,536 138,009 152,089 5,527 (8,553)
Business information (number of)Employees (full-time equivalent) (FTE) 82,108 81,870 78,648 238 3,460Bank branches 1,334 1,333 1,368 1 (34)Automated teller machines (ATMs) 4,568 4,537 4,660 31 (92)
Period average US$ equivalent of C$1.00 (10) $ 0.749 $ 0.767 $ 0.794 $ (0.018) $ (0.045)Period-end US$ equivalent of C$1.00 $ 0.761 $ 0.760 $ 0.813 $ 0.001 $ (0.052)(1) Average amounts are calculated using methods intended to approximate the average of the daily balances for the period. This includes Average common equity used in the calculation of ROE. For
further details, refer to the Key performance and non-GAAP measures section.(2) These measures may not have a standardized meaning under generally accepted accounting principles (GAAP) and may not be comparable to similar measures disclosed by other financial
institutions. For further details, refer to the Key performance and non-GAAP measures section.(3) LCR is the average for the three months ended for each respective period and is calculated in accordance with OSFI’s Liquidity Adequacy Requirements (LAR) guideline. For further details, refer to the
Liquidity and funding risk section.(4) The Leverage ratio is a regulatory measure under the Basel III framework. For further details, refer to the Capital management section.(5) Represents period-end spot balances.(6) AUA includes $16.6 billion and $8.5 billion (October 31, 2018 – $16.7 billion and $9.6 billion; January 31, 2018 – $18.2 billion and $9.1 billion) of securitized residential mortgages and credit card
loans, respectively.(7) Effective Q4 2018, Common shares outstanding includes the impact of treasury shares. Comparative amounts have been adjusted to conform with this presentation.(8) Defined as dividends per common share divided by the average of the high and low share price in the relevant period.(9) Based on TSX closing market price at period-end.(10) Average amounts are calculated using month-end spot rates for the period.

4 Royal Bank of Canada First Quarter 2019
Economic, market and regulatory review and outlook – data as at February 21, 2019
The predictions and forecasts in this section are based on information and assumptions from sources we consider reliable. If thisinformation or these assumptions are not accurate, actual economic outcomes may differ materially from the outlook presented in thissection.
Economic and market review and outlookCanadaThe Canadian economy is estimated to have grown by 1.1%1 during the last calendar quarter of 2018, which is down from a 2.0%1
increase in the previous calendar quarter. The slowdown partially reflected a pullback in the Canadian energy sector, while consumerspending and housing activity remained soft. Some local housing markets have yet to fully stabilize following a decline in resales incalendar 2018. Despite slower GDP growth toward the end of last year, job growth has remained strong. The unemployment rate roseto 5.8% in January 2019 as more Canadians looked for work, but that rate remains close to historical lows. The Bank of Canada (BoC)held its overnight rate steady at 1.75% in January and struck a fairly balanced tone in light of the slowdown. We expect a return tonear 2% growth later this year with non-energy exports and business investment offsetting a slowdown in consumer spending andhousing.
U.S.Overall growth in the U.S. economy is estimated to have slowed to 2.5%1 in the fourth calendar quarter of 2018, down from the 3.4%1
increase in the previous calendar quarter. Two months of healthy consumer spending in the last calendar quarter was capped off byan unexpected decline in December’s retail sales. Manufacturing output increased at a solid rate in the last calendar quarter of 2018despite indicators pointing to slower growth. The labour market remained strong toward the end of calendar 2018 and wagescontinued to rise. We expect the U.S. economy will continue to grow at a solid pace throughout calendar 2019 despite recentsoftening in sentiment indicators. Equity markets rebounded in January following sharp declines during the last calendar quarter in2018. The Federal Reserve (Fed) also expects sustained economic expansion and low unemployment, but has emphasized a morepatient approach to setting monetary policy amid growing risks to the outlook. Those include signs of slowing global growth,persistent uncertainty over trade policy, some sustained tightening in financial conditions and a government shutdown that willimpact growth in the current calendar quarter.
EuropeThe Euro area’s growth was stagnant in the fourth calendar quarter of 2018 with GDP growth remaining at 0.2%. Some temporaryfactors, including production issues in the German auto sector and labour disruptions in France, were behind the loss of momentum,and export growth was hampered by a slowdown in some emerging market economies. In the U.K., rising uncertainty over Brexit waslikely a significant factor to its loss of growth momentum, adversely impacting business sentiment and investment. Labour markets inthe Euro area and the U.K. continued to improve toward the end of the calendar year, however, recent indicators point to a slowdownin hiring activity. We expect growth within the Euro area and the U.K. to remain soft over the first half of 2019 as geopoliticaluncertainty persists.
Financial marketsEquity markets were under downward pressure toward the end of the last calendar year due to concerns about rising interest rates,geopolitical tensions and slowing global growth. Both the S&P 500 Index and the S&P/TSX Composite experienced double-digitdeclines in the fourth calendar quarter of 2018. However, the indices partially rebounded in January. Key foreign indices experiencedsimilar movements. Flattening in the U.S. yield curve may have also contributed to the increase in market volatility as investors worrythe end of the business cycle is drawing closer.
Regulatory environmentWe continue to monitor and prepare for regulatory developments and changes in a manner that seeks to ensure compliance with newrequirements while mitigating any adverse business or financial impacts. Such impacts could result from new or amended laws orregulations and the expectations of those who enforce them. A high level summary of the key regulatory changes that have thepotential to increase our costs, impact our profitability, and increase the complexity of our operations are disclosed in the Legal andregulatory environment risk section of our 2018 Annual Report, as updated below.
Global UncertaintyTrade policy remains a risk to the global economic outlook, including the ratification of the Canada-United States-Mexico Agreement(CUSMA), the outcome of the Brexit negotiations, and tensions between the U.S. and China. While Canada, the U.S., and Mexico havesuccessfully renegotiated the North American Free Trade Agreement, the new CUSMA deal has yet to be ratified and could facechallenges in a divided U.S. Congress. The outcome of the Brexit negotiations and its resulting impact on global trade also remainsuncertain. Although tension remains between the U.S. and China, trade discussions are ongoing between the two countries, and theremay be a further extension on when the U.S. will increase tariffs on Chinese imports, which is currently set at March 1, 2019. Theseongoing concerns have contributed to the International Monetary Fund further lowering its 2019 global growth projections in January,with the possibility for additional downgrades in the event of further escalation in trade tensions.
Consumer ProtectionThe Canadian federal government has focused its attention on issues relating to consumer protection and the sales practices ofbanks. While the government’s proposed legislative changes to consumer protection provisions applicable to banks was approved onDecember 13, 2018, the government remains in the early stages of developing a regulatory framework to support the new provisions.
1 Annualized rate

Royal Bank of Canada First Quarter 2019 5
PrivacyLegislative developments in data privacy are being closely monitored following the enactment of the General Data ProtectionRegulation (GDPR). Data privacy risks remain a key focus, and European data protection authorities have issued the first significantfines to certain non-financial services entities in January 2019.
London Interbank Offered Rate (LIBOR)LIBOR is the most widely referenced benchmark interest rate across the globe for derivatives, bonds, loans and other floating rateinstruments; however, there is a regulator-led push to transition the market from LIBOR to alternative risk-free, or nearly risk-free,rates that are based on actual overnight transactions. In addition to the U.S. and U.K., regulators internationally, including the Bank ofCanada, have warned the market they will need to be prepared for LIBOR to be discontinued at the end of 2021. Derivatives, floatingrate notes and other financial contracts whose terms extend beyond 2021, and that refer to LIBOR as the reference rate, will beimpacted. At this time, local jurisdictions are evaluating the potential impacts and solutions for replacement benchmark rates.
Other Regulatory Initiatives Impacting Financial Services in CanadaOn January 11, 2019, the federal government released a consultation paper on the merits of open banking. The government will alsobe holding roundtables and anticipates that the Advisory Committee on this issue will provide a report to the Minister of Financefollowing the completion of its work.
United States Regulatory InitiativesPolicymakers continue to consider reforms to various U.S. regulations, certain of which may, if implemented, result in reducedcomplexity of the U.S. regulatory framework and lower compliance costs. The Fed is expected to release a proposal in March 2019 totailor its enhanced prudential standards applicable to foreign bank organizations.
United States Tax ReformRegulations implementing and/or clarifying certain aspects of the U.S. Tax Cuts and Jobs Act legislation (U.S. Tax Reform) are beingreleased on a rolling basis. In December 2018, the U.S. Treasury released proposed regulations clarifying some of the rules forcalculating a Base Erosion Anti-Abuse Tax (BEAT) as well as proposed regulations relating to deductions on certain cross-borderinterest and royalty payments (the Anti-Hybrid rules). We are currently reviewing the impact of these proposed regulations.
U.K. and European Regulatory ReformThe U.K. remains in negotiations with regards to its exit from the European Union, scheduled to take place on March 29, 2019. Untilthe date of its exit or, if there is a transition period, until the period expires, the U.K. will continue to remain an EU Member State,subject to all EU legislation. Other forthcoming regulatory initiatives include the transaction reporting of securities financingtransactions, which is expected to take effect in the first calendar quarter of 2020, extended from its previous effective date of the firstcalendar quarter of 2019.
For a discussion on risk factors resulting from these and other regulatory developments which may affect our business and financialresults, refer to the Risk management – Top and emerging risks and Legal and regulatory environment risk sections of our 2018Annual Report and the Capital, liquidity and other regulatory developments section of this Q1 2019 Report to Shareholders. For furtherdetails on our framework and activities to manage risks, refer to the risk and Capital management sections of our 2018 Annual Reportand the Risk management and Capital management sections of this Q1 2019 Report to Shareholders.
Financial performance
Overview
Q1 2019 vs. Q1 2018Net income of $3,172 million was up $160 million or 5% from a year ago. Diluted earnings per share (EPS) of $ 2.15 was up $0.14 or7% and return on common equity (ROE) of 16.7% was down 70 bps from 17.4% last year. Our Common Equity Tier 1 (CET1) ratio of11.4% was up 40 bps from a year ago.
Our results reflected solid earnings growth in Personal & Commercial Banking and Insurance, and consistent earnings in WealthManagement, partially offset by lower results in Capital Markets and Investor & Treasury Services. Our results also reflect an increasedue to foreign exchange translation and the impact in the prior year of the U.S. Tax Reform which resulted in the write-down of netdeferred tax assets.
Personal & Commercial Banking earnings were up mainly due to volume growth and higher spreads. These factors were partiallyoffset by higher staff and technology related costs, higher provision for credit losses (PCL) and a gain relating to the reorganization ofInterac in the prior year. The current year also included a write-down of deferred tax assets resulting from a change in the corporate taxrate in Barbados.
Insurance results increased primarily reflecting favourable life retrocession contract renegotiations and lower claims costs.Wealth Management results remained unchanged from a year ago as higher net interest income and an increase in average
fee-based client assets were offset by higher costs related to business growth, increases in PCL and regulatory costs, and lowertransaction volumes. A favourable accounting adjustment related to Canadian Wealth Management in the current period was largelyoffset by the impact of a favourable accounting adjustment related to City National in the prior period.
Capital Markets results were down primarily due to higher PCL and lower revenue in Corporate and Investment Banking. Thesefactors were partially offset by a lower effective tax rate reflecting changes in earnings mix and the impact of foreign exchangetranslation.

6 Royal Bank of Canada First Quarter 2019
Investor & Treasury Services earnings decreased primarily due to lower funding and liquidity revenue, higher costs in support ofbusiness growth, and lower revenue from our asset services business. These factors were partially offset by improved client depositmargins.
Corporate Support net income was $24 million in the current quarter, largely reflecting net favourable tax adjustments. Net losswas $200 million in the prior year, largely due to the impact of the U.S. Tax Reform of $178 million which was mainly related to thewrite-down of net deferred tax assets.
For further details on our business segment results and CET1 ratio, refer to the Business segment results and Capitalmanagement sections, respectively.
Q1 2019 vs. Q4 2018Net income of $3,172 million was down $78 million or 2% from the prior quarter. Diluted EPS of $ 2.15 was down $0.05 or 2% andROE of 16.7% was down 90 bps. Our CET1 ratio of 11.4%, was down 10 bps.
Our results reflected lower earnings in Insurance and Capital Markets, partially offset by higher earnings in Wealth Management,Personal & Commercial Banking, and Investor & Treasury Services.
Insurance earnings were down as the prior period included annual actuarial assumption updates, higher favourable investment-related experience, and higher favourable life retrocession contract renegotiations.
Capital Markets earnings decreased primarily due to lower revenue in Corporate and Investment Banking and higher PCL. Thesefactors were partially offset by higher revenue in Global Markets and a lower effective tax rate reflecting changes in earnings mix.
Wealth Management earnings were up primarily reflecting an increase in net interest income, a favourable accounting adjustmentrelated to Canadian Wealth Management in the current period, and the change in fair value of seed capital investments. These factorswere partially offset by higher costs in support of business growth, and lower fee-based revenue resulting from challenging marketconditions throughout the earlier part of Q1 2019.
Personal & Commercial Banking results were up reflecting volume growth, seasonally lower marketing costs, and lowerprofessional fees. These factors were partially offset by higher staff-related costs and an increase in PCL. The current year alsoincluded a write-down of deferred tax assets resulting from a change in the corporate tax rate in Barbados.
Investor & Treasury Services earnings increased primarily due to higher funding and liquidity revenue, lower technology costs,and improved client deposit margins. These factors were partially offset by annual regulatory costs in the current period.
Impact of foreign currency translationThe following table reflects the estimated impact of foreign currency translation on key income statement items:
For the three months ended
(Millions of Canadian dollars, except per share amounts)
Q1 2019 vs.Q1 2018
Q1 2019 vs.Q4 2018
Increase (decrease):Total revenue $ 186 $ 86PCL 8 3PBCAE – –Non-interest expense 115 57Income taxes 7 3Net income 56 23
Impact on EPSBasic $ 0.04 $ 0.02Diluted 0.04 0.02
The relevant average exchange rates that impact our business are shown in the following table:
(Average foreign currency equivalent of C$1.00) (1)
For the three months ended
January 31
2019October 31
2018January 31
2018
U.S. dollar 0.749 0.767 0.794British pound 0.582 0.593 0.578Euro 0.656 0.666 0.656(1) Average amounts are calculated using month-end spot rates for the period.

Royal Bank of Canada First Quarter 2019 7
Total revenue
For the three months ended
(Millions of Canadian dollars)
January 31
2019October 31
2018January 31
2018
Interest and dividend income $ 10,149 $ 8,990 $ 7,540Interest expense 5,265 4,261 3,095
Net interest income $ 4,884 $ 4,729 $ 4,445NIM 1.62% 1.67% 1.65%
Insurance premiums, investment and fee income $ 1,579 $ 1,039 $ 1,144Trading revenue 358 123 318Investment management and custodial fees 1,450 1,387 1,325Mutual fund revenue 873 896 885Securities brokerage commissions 342 349 355Service charges 468 459 440Underwriting and other advisory fees 345 514 541Foreign exchange revenue, other than trading 249 267 281Card service revenue 282 264 257Credit fees 315 371 328Net gains on investment securities 46 33 39Share of profit in joint ventures and associates 15 8 25Other 383 230 445
Non-interest income $ 6,705 $ 5,940 $ 6,383
Total revenue $ 11,589 $ 10,669 $ 10,828
Additional informationTotal trading revenue
Net interest income $ 601 $ 548 $ 550Non-interest income 358 123 318
Total trading revenue $ 959 $ 671 $ 868
Q1 2019 vs. Q1 2018Total revenue increased $761 million or 7% from last year, mainly due to higher net interest income, insurance premiums, investmentand fee income (Insurance revenue), and investment management and custodial fees. These factors were partially offset by lowerunderwriting and advisory fees. In addition, the impact of foreign exchange translation increased total revenue by $186 million.
Net interest income increased $439 million or 10%, largely due to the impact from higher interest rates and volume growth inCanadian Banking and Wealth Management. Higher trading revenue, primarily in commodities and equities, and higher lendingrevenue in Capital Markets also contributed to the increase. Net interest income was also impacted by lower funding and liquidityrevenue, which was largely offset by the related gains on non-trading derivatives in Other revenue.
NIM was down 3 bps compared to last year, due to changes in average earning asset mix with volume growth primarily in reverserepos, and lower funding and liquidity revenue. These factors were partially offset by improved spreads on deposits in CanadianBanking and Wealth Management, reflecting higher interest rates. The impact associated with lower funding and liquidity revenue waslargely offset by the related gains on non-trading derivatives in Other revenue.
Insurance revenue increased $435 million or 38%, mainly reflecting the change in fair value of investments backing ourpolicyholder liabilities and higher group annuity sales, both of which are largely offset in PBCAE. Business growth in longevityreinsurance, and favourable life retrocession contract renegotiations also contributed to the increase.
Investment management and custodial fees increased $125 million or 9%, mainly due to a favourable accounting adjustment inWealth Management in the current period and higher average fee-based client assets reflecting net sales.
Underwriting and other advisory fees decreased $196 million or 36%, largely due to lower equity and debt origination primarily inNorth America.
Q1 2019 vs. Q4 2018Total revenue increased $920 million or 9% from the prior quarter, primarily due to the change in fair value of investments backing ourpolicyholder liabilities, which is largely offset in PBCAE, higher equity and fixed income trading revenue, primarily in North America,and the impact from volume growth and higher interest rates in Canadian Banking and Wealth Management. These factors werepartially offset by lower equity and debt origination, primarily in North America. In addition, the impact of foreign exchange translationincreased total revenue by $86 million.
Provision for credit lossesQ1 2019 vs. Q1 2018Total PCL in Q1 2019 was $514 million.
PCL on loans of $516 million increased $182 million, or 54% from the prior year, mainly due to higher provisions in CapitalMarkets, Personal & Commercial Banking and Wealth Management. PCL ratio on loans of 34 bps increased 10 bps.

8 Royal Bank of Canada First Quarter 2019
Q1 2019 vs. Q4 2018Total PCL increased $161 million from the prior quarter.
PCL on loans of $516 million increased $183 million, or 55% from the prior quarter, mainly due to higher provisions in CapitalMarkets and Personal & Commercial Banking. PCL ratio on loans increased 11 bps.
For further details on PCL, refer to Credit quality performance in the Credit risk section.
Insurance policyholder benefits, claims and acquisition expense (PBCAE)Q1 2019 vs. Q1 2018PBCAE increased $389 million or 47% from a year ago, primarily due to the change in fair value of investments backing ourpolicyholder liabilities and higher group annuity sales, both of which are largely offset in revenue, and growth in longevityreinsurance. These factors were partially offset by favourable life retrocession contract renegotiations, and lower claims costs mainlydue to lower claims volumes in our life retrocession and international life portfolios.
Q1 2019 vs. Q4 2018PBCAE increased $731 million from the prior quarter, mainly due to the change in fair value of investments backing our policyholderliabilities, which is largely offset in revenue, business growth, and lower favourable investment-related experience. The prior quarterincluded favourable annual actuarial assumption updates and higher favourable life retrocession contract renegotiations. Thesefactors were partially offset by lower group annuity sales, which is largely offset in revenue.
Non-interest expense
For the three months ended
(Millions of Canadian dollars, except percentage amounts)
January 31
2019October 31
2018January 31
2018
Salaries $ 1,608 $ 1,575 $ 1,466Variable compensation 1,388 1,433 1,384Benefits and retention compensation 492 402 480Share-based compensation 155 19 172
Human resources $ 3,643 $ 3,429 $ 3,502Equipment 431 419 372Occupancy 397 400 379Communications 240 316 224Professional fees 305 418 281Amortization of other intangibles 290 279 261Other 606 621 592
Non-interest expense $ 5,912 $ 5,882 $ 5,611Efficiency ratio (1) 51.0% 55.1% 51.8%Efficiency ratio adjusted (2) 52.1% 53.4% 51.9%
(1) Efficiency ratio is calculated as Non-interest expense divided by Total revenue.(2) Measures have been adjusted by excluding the change in fair value of investments backing our policyholder liabilities. These are non-GAAP measures. For further
details, refer to the Key performance and non-GAAP measures section.
Q1 2019 vs. Q1 2018Non-interest expense increased $301 million or 5%, largely due to the impact of foreign exchange translation, increased costs insupport of business growth and higher staff-related costs. Increased technology and related costs, including digital initiatives, andhigher regulatory costs also contributed to the increase. These factors were partially offset by the change in the fair value of our U.S.share-based compensation plans, which was largely offset in Other revenue.
Our efficiency ratio of 51.0% decreased 80 bps from 51.8% last year. Excluding the change in fair value of investments backingour policyholder liabilities, our efficiency ratio of 52.1% increased 20 bps from 51.9% last year, primarily due to increased costs insupport of business growth and higher staff-related costs, increased technology and related costs, including digital initiatives, andhigher regulatory costs. These factors were largely offset by revenue growth across most business segments.
Q1 2019 vs. Q4 2018Non-interest expense increased $30 million or 1%, largely due to increased costs in support of business growth and higher staff-related costs, and the impact of foreign exchange translation. These factors were largely offset by seasonally lower marketing costsand lower professional fees.
Our efficiency ratio of 51.0% decreased 410 bps from 55.1% last quarter. Excluding the change in fair value of investmentsbacking our policyholder liabilities, our efficiency ratio of 52.1% decreased 130 bps from 53.4% last quarter, primarily due to higherrevenue across all business segments, seasonally lower marketing costs and lower professional fees. These factors were partiallyoffset by increased costs in support of business growth and higher staff-related costs.
Efficiency ratio excluding the change in fair value of investments backing our policyholder liabilities is a non-GAAP measure. Forfurther details, including a reconciliation, refer to the Key performance and non-GAAP measures section.

Royal Bank of Canada First Quarter 2019 9
Income taxes
For the three months ended
(Millions of Canadian dollars, except percentage amounts)
January 31
2019October 31
2018January 31
2018
Income taxes $ 766 $ 690 $ 1,035
Income before income taxes $ 3,938 $ 3,940 $ 4,047Canadian statutory income tax rate (1) 26.5% 26.5% 26.5%
Lower average tax rate applicable to subsidiaries (2) (5.1)% (6.3)% (3.2)%Tax-exempt income from securities (1.8)% (1.9)% (1.6)%Tax rate change (3) 0.5% –% 3.6%Other (0.6)% (0.8)% 0.3%
Effective income tax rate 19.5% 17.5% 25.6%
(1) Blended Federal and Provincial statutory income tax rate.(2) As the reduced tax rates from the U.S. Tax Reform were effective on January 1, 2018, the Lower average tax rate applicable to subsidiaries for the three months ended
October 31, 2018 and January 31, 2018 reflects the fiscal 2018 blended rate for U.S. subsidiaries.(3) In Q1 2018, the tax rate change is primarily related to the impact of the U.S. Tax Reform.
Q1 2019 vs. Q1 2018Income tax expense decreased $269 million or 26% from last year, primarily due to the impact of the U.S. Tax Reform which resultedin the write-down of net deferred tax assets in the prior year, and changes in earnings mix. These factors were partially offset by awrite-down of deferred tax assets resulting from a change in the corporate tax rate in Barbados in the current period.
The effective income tax rate of 19.5% decreased 610 bps, mainly due to impact of the U.S. Tax Reform in the prior year, higherincome from lower tax rate jurisdictions, and net favourable tax adjustments in the current quarter. These factors were partially offsetby a write-down of deferred tax assets resulting from a change in the corporate tax rate in Barbados in the current period.
Q1 2019 vs. Q4 2018Income tax expense increased $76 million or 11% from last quarter, and the effective income tax rate of 19.5% increased 200 bps,primarily due to lower net favourable tax adjustments and a write-down of deferred tax assets resulting from a change in the corporatetax rate in Barbados in the current period.
Business segment results
How we measure and report our business segments
The key methodologies and assumptions used in our management reporting framework are periodically reviewed by management toensure they remain valid. They remain unchanged from October 31, 2018.
For further details on our key methodologies and assumptions used in our management reporting framework, refer to the How wemeasure and report our business segments section of our 2018 Annual Report.
Key performance and non-GAAP measures
Performance measures
Return on common equityWe measure and evaluate the performance of our consolidated operations and each business segment using a number of financialmetrics, such as net income and ROE. We use ROE, at both the consolidated and business segment levels, as a measure of return ontotal capital invested in our business. Management views the business segment ROE measure as a useful measure for supportinginvestment and resource allocation decisions because it adjusts for certain items that may affect comparability between businesssegments and certain competitors. ROE does not have a standardized meaning under GAAP and may not be comparable to similarmeasures disclosed by other financial institutions. For further details, refer to the Key performance and non-GAAP measures section ofour 2018 Annual Report.
The following table provides a summary of our ROE calculations:
For the three months ended
January 31
2019October 31
2018January 31
2018
(Millions of Canadian dollars, except percentage amounts)
Personal &Commercial
BankingWealth
Management Insurance
Investor &TreasuryServices
CapitalMarkets
CorporateSupport Total Total Total
Net income available to common shareholders $ 1,546 $ 583 $ 164 $ 157 $ 630 $ 16 $ 3,096 $ 3,176 $ 2,929Total average common equity (1) (2) 23,050 14,050 1,900 3,600 23,150 7,800 73,550 71,700 66,850
ROE (3) 26.6% 16.4% 34.7% 17.3% 10.8% n.m. 16.7% 17.6% 17.4%
(1) Total average common equity represents rounded figures.(2) The amounts for the segments are referred to as attributed capital.(3) ROE is based on actual balances of average common equity before rounding.n.m. not meaningful
10 Royal Bank of Canada First Quarter 2019
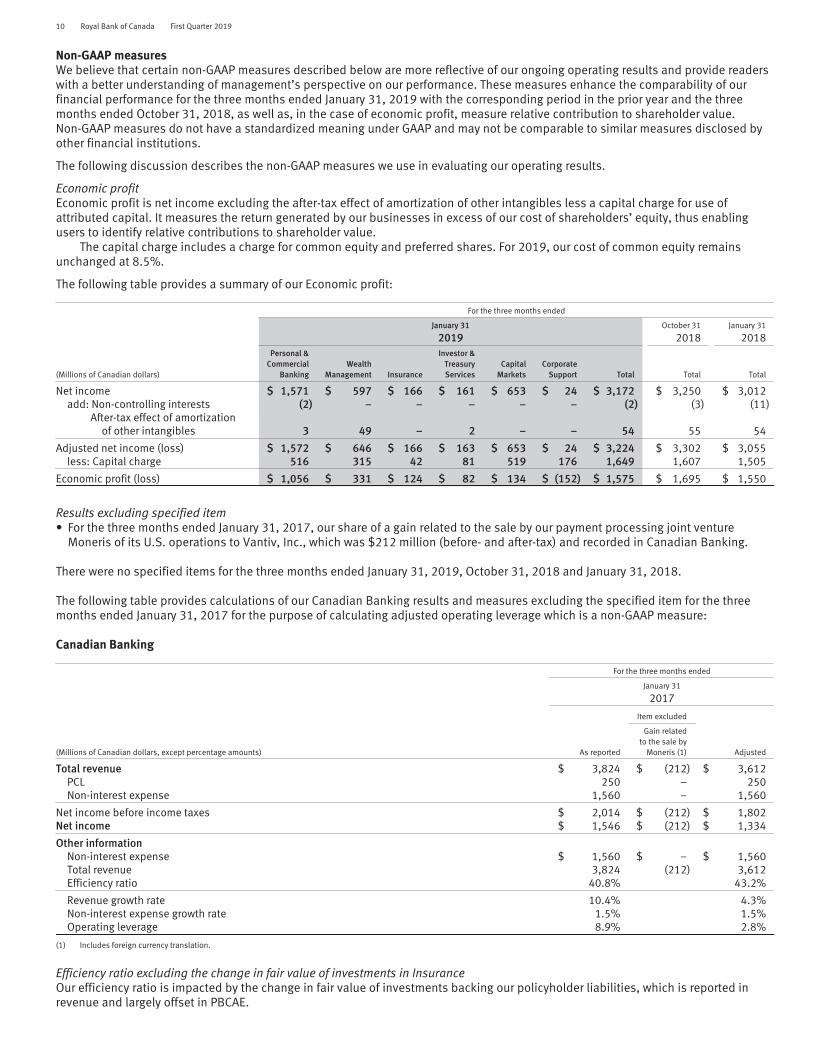
Non-GAAP measuresWe believe that certain non-GAAP measures described below are more reflective of our ongoing operating results and provide readerswith a better understanding of management’s perspective on our performance. These measures enhance the comparability of ourfinancial performance for the three months ended January 31, 2019 with the corresponding period in the prior year and the threemonths ended October 31, 2018, as well as, in the case of economic profit, measure relative contribution to shareholder value.Non-GAAP measures do not have a standardized meaning under GAAP and may not be comparable to similar measures disclosed byother financial institutions.
The following discussion describes the non-GAAP measures we use in evaluating our operating results.
Economic profitEconomic profit is net income excluding the after-tax effect of amortization of other intangibles less a capital charge for use ofattributed capital. It measures the return generated by our businesses in excess of our cost of shareholders’ equity, thus enablingusers to identify relative contributions to shareholder value.
The capital charge includes a charge for common equity and preferred shares. For 2019, our cost of common equity remainsunchanged at 8.5%.
The following table provides a summary of our Economic profit:
For the three months ended
January 31
2019October 31
2018January 31
2018
(Millions of Canadian dollars)
Personal &Commercial
BankingWealth
Management Insurance
Investor &TreasuryServices
CapitalMarkets
CorporateSupport Total Total Total
Net income $ 1,571 $ 597 $ 166 $ 161 $ 653 $ 24 $ 3,172 $ 3,250 $ 3,012add: Non-controlling interests (2) – – – – – (2) (3) (11)
After-tax effect of amortizationof other intangibles 3 49 – 2 – – 54 55 54
Adjusted net income (loss) $ 1,572 $ 646 $ 166 $ 163 $ 653 $ 24 $ 3,224 $ 3,302 $ 3,055less: Capital charge 516 315 42 81 519 176 1,649 1,607 1,505
Economic profit (loss) $ 1,056 $ 331 $ 124 $ 82 $ 134 $ (152) $ 1,575 $ 1,695 $ 1,550
Results excluding specified item• For the three months ended January 31, 2017, our share of a gain related to the sale by our payment processing joint venture
Moneris of its U.S. operations to Vantiv, Inc., which was $212 million (before- and after-tax) and recorded in Canadian Banking.
There were no specified items for the three months ended January 31, 2019, October 31, 2018 and January 31, 2018.
The following table provides calculations of our Canadian Banking results and measures excluding the specified item for the threemonths ended January 31, 2017 for the purpose of calculating adjusted operating leverage which is a non-GAAP measure:
Canadian Banking
For the three months ended
January 31
2017
Item excluded
(Millions of Canadian dollars, except percentage amounts) As reported
Gain relatedto the sale by
Moneris (1) Adjusted
Total revenue $ 3,824 $ (212) $ 3,612PCL 250 – 250Non-interest expense 1,560 – 1,560
Net income before income taxes $ 2,014 $ (212) $ 1,802Net income $ 1,546 $ (212) $ 1,334
Other informationNon-interest expense $ 1,560 $ – $ 1,560Total revenue 3,824 (212) 3,612Efficiency ratio 40.8% 43.2%
Revenue growth rate 10.4% 4.3%Non-interest expense growth rate 1.5% 1.5%Operating leverage 8.9% 2.8%
(1) Includes foreign currency translation.
Efficiency ratio excluding the change in fair value of investments in InsuranceOur efficiency ratio is impacted by the change in fair value of investments backing our policyholder liabilities, which is reported inrevenue and largely offset in PBCAE.

Royal Bank of Canada First Quarter 2019 11
The following table provides calculations of our consolidated efficiency ratio excluding the change in fair value of investments backingour policyholder liabilities:
For the three months ended
January 31
2019October 31
2018January 31
2018Item excluded Item excluded Item excluded
Change in fair value of Change in fair value of Change in fair value of(Millions of Canadian dollars, investments backing investments backing investments backingexcept percentage amounts) As reported policyholder liabilities Adjusted As reported policyholder liabilities Adjusted As reported policyholder liabilities Adjusted
Total revenue $ 11,589 $ (247) $ 11,342 $ 10,669 $ 342 $ 11,011 $ 10,828 $ (26) $ 10,802Non-interest expense 5,912 – 5,912 5,882 – 5,882 5,611 – 5,611
Efficiency ratio 51.0% 52.1% 55.1% 53.4% 51.8% 51.9%
Personal & Commercial Banking
As at or for the three months ended
(Millions of Canadian dollars, except percentage amounts and as otherwise noted)
January 31
2019October 31
2018January 31
2018Net interest income $ 3,134 $ 3,067 $ 2,856Non-interest income 1,284 1,297 1,309
Total revenue 4,418 4,364 4,165PCL on performing assets 35 25 41PCL on impaired assets 313 292 276
PCL 348 317 317Non-interest expense 1,915 1,987 1,801
Income before income taxes 2,155 2,060 2,047Net income $ 1,571 $ 1,538 $ 1,521Revenue by business
Canadian Banking $ 4,170 $ 4,132 $ 3,927Caribbean & U.S. Banking 248 232 238
Selected balance sheet and other informationROE 26.6% 26.7% 28.6%NIM 2.84% 2.82% 2.73%Efficiency ratio 43.3% 45.5% 43.2%Operating leverage (0.2)% 2.5% 0.4%Effective income tax rate 27.1% 25.3% 25.7%Average total earning assets, net $ 437,100 $ 431,500 $ 415,600Average loans and acceptances, net 438,100 432,200 416,000Average deposits 382,200 368,700 357,000AUA (1) 268,500 266,500 270,800Average AUA 264,000 274,900 268,500PCL on impaired loans as a % of average net loans and acceptances 0.28% 0.25% 0.26%
Other selected information – Canadian BankingNet income $ 1,544 $ 1,463 $ 1,480NIM 2.79% 2.77% 2.68%Efficiency ratio 41.6% 43.8% 41.5%Operating leverage (0.2)% 2.3% (1.7)%Operating leverage adjusted (2) n.a. n.a. 4.3%Effective income tax rate 26.3% 25.8% 25.9%
(1) AUA represents period-end spot balances and includes securitized residential mortgages and credit card loans as at January 31, 2019 of $16.6 billion and $8.5 billion, respectively (October 31,2018 – $16.7 billion and $9.6 billion; January 31, 2018 – $18.2 billion and $9.1 billion).
(2) This is a non-GAAP measure. Q1 2018 operating leverage of (1.7)% in Canadian Banking was impacted by our share of the gain related to the sale of the U.S. operations of Moneris of $212 million(before- and after-tax) in Q1 2017, which was a specified item. For further details, including a reconciliation, refer to the Key performance and non-GAAP measures section. Q1 2018 revenue andexpense growth rates in Canadian Banking were 2.7% and 4.4%, respectively. Excluding our share of the gain as noted above, Q1 2018 adjusted revenue growth rate was 8.7%.
n.a. not applicable
Financial performanceQ1 2019 vs. Q1 2018Net income increased $50 million or 3% from last year, mainly due to volume growth and higher spreads. These factors were partiallyoffset by higher staff and technology related costs, higher PCL and a gain relating to the reorganization of Interac in the prior year. Thecurrent year also included a write-down of deferred tax assets resulting from a change in the corporate tax rate in Barbados.
Total revenue increased $253 million or 6%.Canadian Banking revenue increased $243 million or 6% compared to last year, largely reflecting average volume growth of 5% in
loans and 7% in deposits and improved spreads. These factors were partially offset by a gain relating to the reorganization of Interacin the prior year.
Caribbean & U.S. Banking revenue increased $10 million or 4% compared to last year, due to the impact of foreign exchangetranslation.
Net interest margin was up 11 bps, mainly due to improved spreads on deposits in Canadian Banking, reflecting higher interestrates, partially offset by the impact of competitive pricing pressures.
PCL increased $31 million or 10%, driving an increase of 2 bps on the PCL on impaired loans ratio. For further details, refer toCredit quality performance in the Credit risk section.
Non-interest expense increased $114 million or 6%, primarily attributable to higher staff-related costs, an increase in technologyand related costs, including digital initiatives, and higher marketing costs.

12 Royal Bank of Canada First Quarter 2019
Q1 2019 vs. Q4 2018Net income increased $33 million or 2% from last quarter, reflecting volume growth, lower marketing costs, and lower professionalfees. These factors were partially offset by higher staff-related costs and an increase in PCL. The current year also included a write-down of deferred tax assets resulting from a change in the corporate tax rate in Barbados.
Total revenue increased $54 million or 1% from last quarter, mainly driven by average volume growth of 1% in loans and 4% indeposits in Canadian Banking and higher purchase volumes resulting in higher card service revenue. These factors were partiallyoffset by lower average balances driving lower mutual fund distribution fees.
Net interest margin was up 2 bps largely due to improved spreads on deposits in Canadian Banking, partially offset by the impactof competitive pricing pressures.
PCL increased $31 million or 10%, mainly due to higher PCL on impaired loans, partially offset by provisions taken in the priorquarter on the restructuring of Barbados securities. PCL on impaired loans ratio increased 3 bps. For further details, refer to Creditquality performance in the Credit risk section.
Non-interest expense decreased $72 million or 4%, largely reflecting seasonally lower marketing costs, and lower professionalfees. These factors were partially offset by higher staff-related costs.
Wealth Management
As at or for the three months ended
(Millions of Canadian dollars, except number of and percentage amounts and as otherwise noted)
January 31
2019October 31
2018January 31
2018
Net interest income $ 744 $ 679 $ 612Non-interest income
Fee-based revenue 1,714 1,662 1,589Transaction and other revenue 490 399 582
Total revenue 2,948 2,740 2,783PCL on performing assets 15 (3) (7)PCL on impaired assets 11 7 5
PCL 26 4 (2)Non-interest expense 2,164 2,061 2,011
Income before income taxes 758 675 774Net income $ 597 $ 553 $ 597
Revenue by businessCanadian Wealth Management $ 842 $ 796 $ 749U.S. Wealth Management (including City National) 1,471 1,345 1,384
U.S. Wealth Management (including City National) (US$ millions) 1,103 1,031 1,100Global Asset Management 543 513 556International Wealth Management 92 86 94
Selected balance sheet and other informationROE 16.4% 15.9% 17.3%NIM 3.67% 3.49% 3.27%Pre-tax margin (1) 25.7% 24.6% 27.8%Number of advisors (2) 5,119 5,042 4,901Average total earning assets, net $ 80,500 $ 77,100 $ 74,300Average loans and acceptances, net 61,200 57,800 52,500Average deposits 94,300 91,800 92,600AUA (3) 981,400 970,500 938,800
U.S. Wealth Management (including City National) (3) 496,500 483,000 453,000U.S. Wealth Management (including City National) (US$ millions) (3) 378,000 367,100 368,100
AUM (3) 682,000 664,900 651,000Average AUA 986,800 988,900 938,600Average AUM (4) 675,100 679,900 648,400PCL on impaired loans as a % of average net loans and acceptances 0.07% 0.04% 0.04%
For the three months ended
Estimated impact of U.S. dollar, British pound and Euro translation on key income statement items(Millions of Canadian dollars, except percentage amounts and as otherwise noted)
Q1 2019 vs.Q1 2018
Q1 2019 vs.Q4 2018
Increase (decrease):Total revenue $ 83 $ 36PCL 2 1Non-interest expense 64 28Net income 14 6
Percentage change in average U.S. dollar equivalent of C$1.00 (6)% (2)%Percentage change in average British pound equivalent of C$1.00 1% (2)%Percentage change in average Euro equivalent of C$1.00 –% (1)%
(1) Pre-tax margin is defined as Income before income taxes divided by Total revenue.(2) Represents client-facing advisors across all our Wealth Management businesses.(3) Represents period-end spot balances.(4) Amounts have been revised from those previously presented.

Royal Bank of Canada First Quarter 2019 13
Financial performanceQ1 2019 vs. Q1 2018Net income remained unchanged from a year ago as higher net interest income and an increase in average fee-based client assetswere offset by higher costs related to business growth, increases in PCL and regulatory costs, and lower transaction volumes. Afavourable accounting adjustment related to Canadian Wealth Management in the current period was largely offset by the impact of afavourable accounting adjustment related to City National in the prior period.
Total revenue increased $165 million or 6%.Canadian Wealth Management revenue increased $93 million or 12%, primarily due to a favourable accounting adjustment,
higher average fee-based client assets reflecting net sales despite challenging market conditions, and an increase in net interestincome attributable to higher interest rates. These factors were partially offset by lower transaction volumes.
U.S. Wealth Management (including City National) revenue increased $87 million or 6%. In U.S. dollars, revenue remainedrelatively unchanged from the prior year. An increase in net interest income due to volume growth and higher interest rates, andhigher average fee-based client assets reflecting net sales despite challenging market conditions, were offset by the change in the fairvalue of the hedges related to our U.S. share-based compensation plans, which was largely offset in non-interest expense, afavourable accounting adjustment related to City National in the prior period, and lower transaction volumes.
Global Asset Management revenue decreased $13 million or 2%, reflecting challenging market conditions in the current quarterthat resulted in lower performance fees.
PCL increased $28 million, largely reflecting an increase in PCL on performing assets in U.S. Wealth Management (including CityNational), primarily driven by unfavourable changes in certain near-term macroeconomic variables. PCL on impaired loans ratioincreased 3 bps. For further details, refer to Credit quality performance in the Credit risk section.
Non-interest expense increased $153 million or 8%, mainly due to the impact of foreign exchange translation, and increasedcosts in support of business growth largely reflecting higher staff-related costs. Higher variable compensation, including the impact ofthe accounting adjustment in Canadian Wealth Management, and higher regulatory costs also contributed to the increase. Thesefactors were partially offset by the change in the fair value of our U.S. share-based compensation plans, which was largely offset inrevenue.
Q1 2019 vs. Q4 2018Net income increased $44 million or 8%, primarily reflecting an increase in net interest income, a favourable accounting adjustmentrelated to Canadian Wealth Management in the current period, and the change in fair value of seed capital investments. These factorswere partially offset by higher costs in support of business growth, and lower fee-based revenue resulting from challenging marketconditions throughout the earlier part of Q1 2019.
Total revenue increased $208 million or 8%, mainly due to the impact of a favourable accounting adjustment related to CanadianWealth Management, the change in the fair value of the hedges related to our U.S. share-based compensation plans, which waslargely offset in non-interest expense, and higher net interest income due to volume growth and higher interest rates. The impact offoreign exchange translation and the change in fair value of seed capital investments also contributed to the increase. These factorswere partially offset by lower fee-based revenue resulting from challenging market conditions throughout the earlier part of Q1 2019.
PCL increased $22 million, primarily reflecting higher PCL on performing assets in U.S. Wealth Management (including CityNational), driven by unfavourable changes in certain near-term macroeconomic variables. PCL on impaired loans ratio increased3 bps. For further details, refer to Credit quality performance in the Credit risk section.
Non-interest expense increased $103 million or 5%, primarily reflecting increased costs in support of business growth mainly dueto higher staff-related costs, the change in the fair value of our U.S. share-based compensation plans, which was largely offset inrevenue, and the impact of foreign exchange translation. Higher variable compensation due to an accounting adjustment in CanadianWealth Management also contributed to the increase.

14 Royal Bank of Canada First Quarter 2019
Insurance
As at or for the three months ended
(Millions of Canadian dollars, except percentage amounts and as otherwise noted)
January 31
2019October 31
2018January 31
2018
Non-interest incomeNet earned premiums $ 1,162 $ 1,222 $ 939Investment income (1) 381 (230) 166Fee income 36 47 39
Total revenue 1,579 1,039 1,144Insurance policyholder benefits and claims (1) 1,129 416 768Insurance policyholder acquisition expense 96 78 68Non-interest expense 154 159 142
Income before income taxes 200 386 166Net income $ 166 $ 318 $ 127
Revenue by businessCanadian Insurance $ 1,039 $ 536 $ 621International Insurance 540 503 523
Selected balances and other informationROE 34.7% 57.2% 28.2%Premiums and deposits (2) $ 1,314 $ 1,374 $ 1,095Fair value changes on investments backing policyholder liabilities (1) 247 (342) 26
(1) Investment income can experience volatility arising from fluctuation of assets designated as fair value through profit and loss (FVTPL). The investments which support actuarial liabilities arepredominantly fixed income assets designated as FVTPL. Consequently, changes in the fair values of these assets are recorded in the Consolidated Statements of Income and are largely offset bychanges in the fair value of the actuarial liabilities, the impact of which is reflected in Insurance policyholder benefits, claims and acquisition expense.
(2) Premiums and deposits include premiums on risk-based insurance and annuity products, and individual and group segregated fund deposits, consistent with insurance industry practices.
Financial performanceQ1 2019 vs. Q1 2018Net income increased $39 million or 31% from a year ago, primarily reflecting favourable life retrocession contract renegotiations andlower claims costs.
Total revenue increased $435 million or 38%.Canadian Insurance revenue increased $418 million or 67%, mainly due to the change in fair value of investments backing our
policyholder liabilities and higher group annuity sales, both of which are largely offset in PBCAE, as indicated below.International Insurance revenue increased $17 million or 3%, mainly due to business growth in longevity reinsurance, and
favourable life retrocession contract renegotiations. These factors were partially offset by the change in fair value of investmentsbacking our policyholder liabilities, which is largely offset in PBCAE, as indicated below.
PBCAE increased $389 million or 47%, primarily due to the change in fair value of investments backing our policyholderliabilities, and business growth. These factors were partially offset by favourable life retrocession contract renegotiations, and lowerclaims costs mainly due to lower claims volumes in our life retrocession and international life portfolios.
Non-interest expense increased $12 million or 8%, largely reflecting higher regulatory costs and an increase in costs to supportsales and client service activities.
Q1 2019 vs. Q4 2018Net income decreased $152 million or 48%, as the prior period included annual actuarial assumption updates, higher favourableinvestment-related experience, and higher favourable life retrocession contract renegotiations.
Total revenue increased $540 million or 52%, mainly reflecting the change in fair value of investments backing our policyholderliabilities, which is largely offset in PBCAE, as indicated below, and business growth in both Canadian and International Insurance.These factors were partially offset by lower group annuity sales, which is largely offset in PBCAE, as indicated below.
PBCAE increased $731 million, mainly due to the change in fair value of investments backing our policyholder liabilities,business growth, and lower favourable investment-related experience. The prior quarter included favourable annual actuarialassumption updates and higher favourable life retrocession contract renegotiations. These factors were partially offset by lower groupannuity sales.
Non-interest expense decreased $5 million or 3%, mainly reflecting lower staff and marketing-related costs.

Royal Bank of Canada First Quarter 2019 15
Investor & Treasury Services
(Millions of Canadian dollars, except percentage amounts and as otherwise noted)
As at or for the three months ended
January 31
2019October 31
2018January 31
2018
Net interest income $ (31) $ 19 $ 128Non-interest income 662 605 548
Total revenue 631 624 676Non-interest expense 418 421 389
Net income before income taxes 213 203 287Net income $ 161 $ 155 $ 219
Selected balance sheet and other informationROE 17.3% 19.2% 26.9%Average deposits $ 171,900 $ 163,600 $ 155,300
Average client deposits 59,200 59,200 56,900Average wholesale funding deposits 112,700 104,400 98,400
AUA (1) 4,100,900 4,283,100 4,431,800Average AUA 4,191,300 4,295,200 4,439,300
(1) Represents period-end spot balances.
Q1 2019 vs. Q1 2018Net income decreased $58 million or 26%, primarily due to lower funding and liquidity revenue, higher costs in support of businessgrowth, and lower revenue from our asset services business. These factors were partially offset by improved client deposit margins.
Total revenue decreased $45 million or 7%, mainly due to lower funding and liquidity revenue driven by gains from thedisposition of certain securities in the prior year and the impact of reduced money market opportunities in the current year. Lowerrevenue from our asset services business due to challenging market conditions and lower client activity also contributed to thedecrease. These factors were partially offset by improved client deposit margins.
Non-interest expense increased $29 million or 7%, largely driven by higher costs in support of business growth mainly reflectingstaff-related costs and increased investment in technology initiatives, as well as higher regulatory costs.
Q1 2019 vs. Q4 2018Net income increased $6 million or 4%, primarily due to higher funding and liquidity revenue, lower technology costs, and improvedclient deposit margins. These factors were partially offset by annual regulatory costs.
Total revenue increased $7 million or 1%, mainly due to higher funding and liquidity revenue driven by capitalizing on moneymarket opportunities in the quarter and improved client deposit margins. These factors were partially offset by gains from thedisposition of certain securities in the prior quarter.
Non-interest expense decreased $3 million or 1%, largely driven by lower technology costs and decreased staff-related costs,partially offset by annual regulatory costs in the current period.

16 Royal Bank of Canada First Quarter 2019
Capital Markets
As at or for the three months ended
(Millions of Canadian dollars, except percentage amounts and as otherwise noted)
January 31
2019October 31
2018January 31
2018
Net interest income (1) $ 1,006 $ 947 $ 866Non-interest income (1) 1,092 1,109 1,309
Total revenue (1) 2,098 2,056 2,175PCL on performing assets 38 17 (25)PCL on impaired assets 102 15 45
PCL 140 32 20Non-interest expense 1,230 1,244 1,214
Net income before income taxes 728 780 941Net income $ 653 $ 666 $ 748
Revenue by businessCorporate and Investment Banking $ 927 $ 1,087 $ 994Global Markets 1,227 1,035 1,221Other (56) (66) (40)
Selected balance sheet and other informationROE 10.8% 11.8% 14.7%Average total assets $ 643,700 $ 591,700 $ 570,200Average trading securities 102,100 88,000 100,800Average loans and acceptances, net 98,400 90,700 81,400Average deposits 79,000 74,600 64,900PCL on impaired loans as a % of average net loans and acceptances 0.41% 0.07% 0.22%
For the three months ended
Estimated impact of U.S. dollar, British pound and Euro translation on key income statement items(Millions of Canadian dollars, except percentage amounts and as otherwise noted)
Q1 2019 vs.Q1 2018
Q1 2019 vs.Q4 2018
Increase (decrease):Total revenue $ 80 $ 36Non-interest expense 38 20Net income 30 13
Percentage change in average U.S. dollar equivalent of C$1.00 (6)% (2)%Percentage change in average British pound equivalent of C$1.00 1% (2)%Percentage change in average Euro equivalent of C$1.00 –% (1)%(1) The taxable equivalent basis (teb) adjustment for the three months ended January 31, 2019 was $107 million (October 31, 2018 – $142 million; January 31, 2018 – $92 million). For further
discussion, refer to the How we measure and report our business segments section of our 2018 Annual Report.
Q1 2019 vs. Q1 2018Net income decreased $95 million or 13%, primarily due to higher PCL and lower revenue in Corporate and Investment Banking. Thesefactors were partially offset by a lower effective tax rate reflecting changes in earnings mix and the impact of foreign exchangetranslation.
Total revenue decreased $77 million or 4%.Corporate and Investment Banking revenue decreased $67 million or 7%, mainly driven by lower equity and debt origination
primarily in North America due to challenging market conditions and lower issuance activity. These factors were partially offset by theimpact of foreign exchange translation and higher lending revenue.
Global Markets revenue remained relatively flat. Higher equity trading revenue largely in the U.S. and the impact of foreignexchange translation were largely offset by lower fixed income trading revenue across all regions and lower equity and debtorigination, primarily in North America, due to challenging market conditions throughout the earlier part of Q1 2019 driving lowerclient activity.
Other revenue decreased $16 million largely reflecting gains in our legacy U.S. portfolios in the prior year.PCL increased $120 million, mainly due to higher PCL on performing assets, primarily driven by unfavourable changes in certain
near-term macroeconomic variables. Higher PCL on impaired loans also contributed to the increase with the PCL on impaired loansratio increasing 19 bps, primarily due to a provision taken on one account in the utilities sector. For further details, refer to Creditquality performance in the Credit risk section.
Non-interest expense increased $16 million or 1%, mainly due to the impact of foreign exchange translation and increasedtechnology and related costs. These factors were partially offset by lower compensation on decreased results.
Q1 2019 vs. Q4 2018Net income decreased $13 million or 2%, primarily due to lower revenue in Corporate and Investment Banking and higher PCL. Thesefactors were partially offset by higher revenue in Global Markets and a lower effective tax rate reflecting changes in earnings mix.
Total revenue increased $42 million or 2%, mainly due to higher equity, fixed income and foreign exchange trading revenue. Theimpact of foreign exchange translation also contributed to the increase. These factors were partially offset by lower debt and equityorigination, primarily in North America due to challenging market conditions throughout the earlier part of Q1 2019, decreased loansyndication activity primarily in North America and lower municipal banking activity.
PCL increased $108 million, primarily due to higher PCL on impaired loans. PCL on impaired loans ratio increased 34 bps,primarily due to a provision taken on one account in the utilities sector. For further details, refer to Credit quality performance in theCredit risk section.
Royal Bank of Canada First Quarter 2019 17
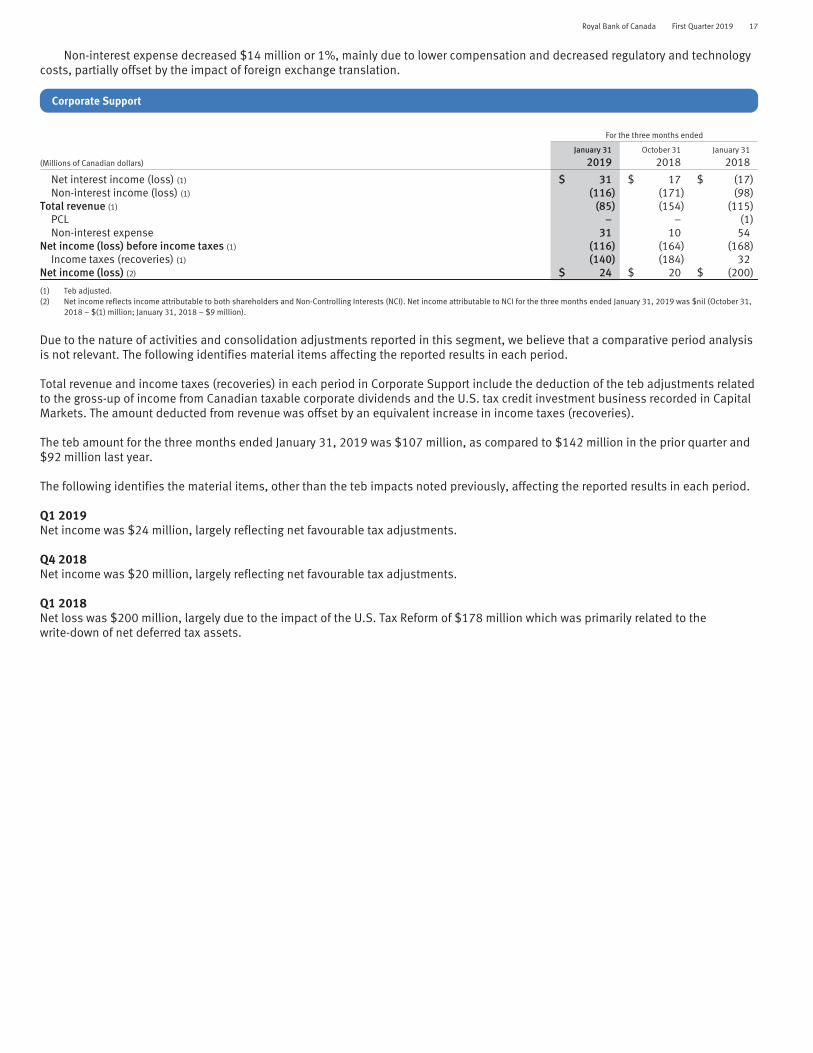
Non-interest expense decreased $14 million or 1%, mainly due to lower compensation and decreased regulatory and technologycosts, partially offset by the impact of foreign exchange translation.
Corporate Support
For the three months ended
(Millions of Canadian dollars)
January 31
2019October 31
2018January 31
2018
Net interest income (loss) (1) $ 31 $ 17 $ (17)Non-interest income (loss) (1) (116) (171) (98)
Total revenue (1) (85) (154) (115)PCL – – (1)Non-interest expense 31 10 54
Net income (loss) before income taxes (1) (116) (164) (168)Income taxes (recoveries) (1) (140) (184) 32
Net income (loss) (2) $ 24 $ 20 $ (200)
(1) Teb adjusted.(2) Net income reflects income attributable to both shareholders and Non-Controlling Interests (NCI). Net income attributable to NCI for the three months ended January 31, 2019 was $nil (October 31,
2018 – $(1) million; January 31, 2018 – $9 million).
Due to the nature of activities and consolidation adjustments reported in this segment, we believe that a comparative period analysisis not relevant. The following identifies material items affecting the reported results in each period.
Total revenue and income taxes (recoveries) in each period in Corporate Support include the deduction of the teb adjustments relatedto the gross-up of income from Canadian taxable corporate dividends and the U.S. tax credit investment business recorded in CapitalMarkets. The amount deducted from revenue was offset by an equivalent increase in income taxes (recoveries).
The teb amount for the three months ended January 31, 2019 was $107 million, as compared to $142 million in the prior quarter and$92 million last year.
The following identifies the material items, other than the teb impacts noted previously, affecting the reported results in each period.
Q1 2019Net income was $24 million, largely reflecting net favourable tax adjustments.
Q4 2018Net income was $20 million, largely reflecting net favourable tax adjustments.
Q1 2018Net loss was $200 million, largely due to the impact of the U.S. Tax Reform of $178 million which was primarily related to thewrite-down of net deferred tax assets.

18 Royal Bank of Canada First Quarter 2019
Quarterly results and trend analysis
Our quarterly results are impacted by a number of trends and recurring factors, which include seasonality of certain businesses,general economic and market conditions, and fluctuations in the Canadian dollar relative to other currencies. The following tablesummarizes our results for the last eight quarters (the period):
Quarterly results (1)
2019 2018 2017
(Millions of Canadian dollars, except per share and percentage amounts) Q1 Q4 Q3 Q2 Q1 Q4 Q3 Q2
Personal & Commercial Banking $ 4,418 $ 4,364 $ 4,284 $ 4,103 $ 4,165 $ 4,019 $ 3,970 $ 3,798Wealth Management 2,948 2,740 2,798 2,605 2,783 2,562 2,547 2,481Insurance 1,579 1,039 1,290 806 1,144 1,612 1,009 1,448Investor & Treasury Services 631 624 620 671 676 602 594 608Capital Markets (2) 2,098 2,056 2,157 2,010 2,175 1,954 2,040 2,117Corporate Support (2) (85) (154) (124) (141) (115) (226) (72) (40)
Total revenue $ 11,589 $ 10,669 $ 11,025 $ 10,054 $ 10,828 $ 10,523 $ 10,088 $ 10,412PCL (3) 514 353 346 274 334 234 320 302PBCAE 1,225 494 925 421 836 1,137 643 1,090Non-interest expense 5,912 5,882 5,858 5,482 5,611 5,611 5,537 5,331
Net income before income taxes $ 3,938 $ 3,940 $ 3,896 $ 3,877 $ 4,047 $ 3,541 $ 3,588 $ 3,689Income taxes 766 690 787 817 1,035 704 792 880
Net income $ 3,172 $ 3,250 $ 3,109 $ 3,060 $ 3,012 $ 2,837 $ 2,796 $ 2,809
EPS – basic $ 2.15 $ 2.21 $ 2.10 $ 2.06 $ 2.02 $ 1.89 $ 1.86 $ 1.86– diluted 2.15 2.20 2.10 2.06 2.01 1.88 1.85 1.85
Segments – net income (loss)Personal & Commercial Banking $ 1,571 $ 1,538 $ 1,510 $ 1,459 $ 1,521 $ 1,404 $ 1,399 $ 1,360Wealth Management 597 553 578 537 597 491 486 431Insurance 166 318 158 172 127 265 161 166Investor & Treasury Services 161 155 155 212 219 156 178 193Capital Markets 653 666 698 665 748 584 611 668Corporate Support 24 20 10 15 (200) (63) (39) (9)
Net income $ 3,172 $ 3,250 $ 3,109 $ 3,060 $ 3,012 $ 2,837 $ 2,796 $ 2,809
Effective income tax rate 19.5% 17.5% 20.2% 21.1% 25.6% 19.9% 22.1% 23.9%Period average US$ equivalent of C$1.00 $ 0.749 $ 0.767 $ 0.767 $ 0.778 $ 0.794 $ 0.792 $ 0.770 $ 0.746
(1) Fluctuations in the Canadian dollar relative to other foreign currencies have affected our consolidated results over the period.(2) Teb adjusted. For further discussion, refer to the How we measure and report our business segments section of our 2018 Annual Report.(3) Effective November 1, 2017, we adopted IFRS 9, Financial Instruments. Under IFRS 9, PCL relates primarily to loans, acceptances, and commitments, and also applies to all financial assets except for
those classified or designated as FVTPL and equity securities designated as fair value through other comprehensive income (FVOCI). Prior to the adoption of IFRS 9, PCL related only to loans,acceptances, and commitments. PCL on loans, acceptances, and commitments is comprised of PCL on impaired loans (Stage 3 PCL under IFRS 9 and PCL on impaired loans under IAS 39) and PCL onperforming loans (Stage 1 and Stage 2 PCL under IFRS 9 and PCL on loans not yet identified as impaired under IAS 39).
SeasonalitySeasonal factors may impact our results in certain quarters. The first quarter has historically been stronger for our Capital Marketsbusinesses. The second quarter has fewer days than the other quarters, which generally results in a decrease in net interest incomeand certain expense items. The third and fourth quarters include the summer months which results in lower client activity and maynegatively impact the results of our Capital Markets’ brokerage business and our Wealth Management’s investment managementbusiness.
Trend analysisEarnings have generally trended upward over the period. However, results in the first quarter of 2019 were impacted by challengingmarket conditions throughout the earlier part of the quarter. Quarterly earnings are also affected by foreign currency translation.
Personal & Commercial Banking revenue has benefitted from solid volume growth, higher spreads since the latter half of 2017,and higher fee-based revenue.
Wealth Management revenue has generally trended upwards primarily due to growth in average fee-based client assets whichbenefitted from net sales and market appreciation, and the impact of higher interest rates and volume growth driving higher netinterest income since the first half of 2017. The change in the fair value of the hedges related to our U.S. share-based compensationplans, which is largely offset in Non-interest expense, also contributed to fluctuations in revenue over the period.
Insurance revenue fluctuated over the period, primarily due to the impact of changes in the fair value of investments backing ourpolicyholder liabilities. Since 2017, revenues have generally benefitted from the impact of new group annuity and restructuredinternational life contracts, which are largely offset in PBCAE. We have also benefitted from business growth in Canadian andInternational Insurance throughout 2018 and the first quarter of 2019.
Investor & Treasury Services revenue is impacted by fluctuations in market conditions and client activity. Revenue generallyremained stable throughout the period, with the first half of 2018 trending higher due to generally higher market volatility, growth inclient deposits, and increased client activity from our asset services business, combined with an increase in funding & liquidityperformance, generally experienced in the first quarter of each year, driven by higher spreads and money market opportunities.

Royal Bank of Canada First Quarter 2019 19
Capital Markets revenue is influenced, to a large extent, by market conditions and activity in the fixed income and equity tradingbusiness, with the first quarter results generally stronger than the remaining quarters. The second quarter of 2018 experienced lowerequity originations driven by lower market activity, decreased fixed income trading across all regions, and lower equity tradingrevenue in the U.S. The decline experienced in the fourth quarter of 2018 largely resulted from lower fixed income trading revenue,primarily in North America. The first quarter of 2019 experienced higher equity and fixed income trading revenue, which was partiallyoffset by lower debt and equity origination primarily in North America.
PCL saw a general improvement in 2017 due to lower provisions and higher recoveries in our Capital Markets and CanadianBanking portfolios and lower provisions on impaired assets for the majority of 2018. On November 1, 2017, we adopted IFRS 9, whichresulted in the introduction of PCL on performing financial assets. PCL on performing assets has fluctuated over the period as it isimpacted by macroeconomic conditions and volume growth. The fourth quarter of 2018 was also impacted by the restructuring ofportfolios in Barbados. The first quarter of 2019 was impacted by a higher provision for impaired loans in Capital Markets taken onone account.
PBCAE has fluctuated quarterly as it includes the changes to the fair value of investments backing our policyholder liabilities, theimpact of group annuity sales and restructured international life contracts, all of which are largely offset in Revenue. PBCAE has alsoincreased due to business growth, and has been impacted by investment-related experience, and claims volumes over the period. Theresults are impacted by actuarial adjustments, which generally occur in the fourth quarter of each year.
While we continue to focus on efficiency management activities, Non-interest expense has generally trended upwards over theperiod. Growth in Non-interest expense over the period mainly reflects higher costs in support of business growth and our ongoinginvestments in technology and related costs, including digital initiatives. The increase in Non-interest expense in 2017 and 2018mainly reflected higher variable compensation on improved results in Wealth Management and Capital Markets. The third quarter of2017 was also impacted by higher severance costs. Fiscal 2018 was impacted by higher regulatory costs, and the decrease over thesecond and fourth quarter of 2018 mainly reflects the change in the fair value of our U.S. share-based compensation plans, which waslargely offset in Revenue. The increase in the first quarter of 2019 also reflected the impact of foreign exchange translation and thechange in the fair value of our U.S. share-based compensation plans, which was largely offset in Revenue, partially offset byseasonally lower marketing costs and lower professional fees.
Our effective income tax rate has fluctuated over the period, mostly due to varying levels of income reported in jurisdictions withdifferent tax rates, as well as fluctuating levels of income from tax-advantaged sources and various levels of tax adjustments. The firstquarter of 2018 was adversely impacted by the U.S. Tax Reform, which resulted in the write-down of net deferred tax assets, however,this was more than offset during 2018 by the ongoing lower corporate tax rate. Our effective income tax rate has generally beenimpacted over the period by net favourable tax adjustments and changes to the earnings mix.
Financial condition
Condensed balance sheets
As at
(Millions of Canadian dollars)
January 31
2019October 31
2018
AssetsCash and due from banks $ 40,033 $ 30,209Interest-bearing deposits with banks 38,653 36,471Securities, net of applicable allowance (1) 235,832 222,866Assets purchased under reverse repurchase agreements and securities borrowed 297,660 294,602Loans
Retail 401,767 399,452Wholesale 191,114 180,278
Allowance for loan losses (3,061) (2,912)Other – Derivatives 84,816 94,039
– Other (2) 79,393 79,729
Total assets $ 1,366,207 $ 1,334,734
LiabilitiesDeposits $ 852,564 $ 837,046Other – Derivatives 81,766 90,238
– Other (2) 341,972 318,364Subordinated debentures 9,255 9,131
Total liabilities 1,285,557 1,254,779
Equity attributable to shareholders 80,553 79,861Non-controlling interests 97 94
Total equity 80,650 79,955
Total liabilities and equity $ 1,366,207 $ 1,334,734
(1) Securities are comprised of Trading and Investment securities.(2) Other – Other assets and liabilities include Segregated fund net assets and liabilities, respectively.

20 Royal Bank of Canada First Quarter 2019
Q1 2019 vs. Q4 2018Total assets increased $31 billion or 2% from last quarter. Foreign exchange translation decreased total assets by $6 billion.
Cash and due from banks was up $10 billion, mainly due to higher deposits with central banks, reflecting short-term cashmanagement activities.
Interest-bearing deposits with banks increased $2 billion or 6%, primarily due to higher deposits with central banks, reflectingour cash management activities.
Securities, net of applicable allowance, were up $13 billion or 6%, largely due to higher government debt trading securities.Assets purchased under reverse repurchase agreements (reverse repos) and securities borrowed increased $3 billion or 1%,
mainly attributable to increased client activities, partially offset by higher financial netting.Loans were up $13 billion or 2%, largely due to volume growth, which led to higher wholesale loans and residential mortgages.Derivative assets were down $9 billion or 10%, primarily attributable to the impact of foreign exchange translation on foreign
exchange contracts.Total liabilities increased $31 billion or 2%. Foreign exchange translation decreased total liabilities by $6 billion.Deposits increased $16 billion or 2%, mainly as a result of higher retail deposits, driven by increased client activity and higher
issuances of fixed-term notes due to funding requirements.Derivative liabilities were down $8 billion or 9%, primarily attributable to the impact of foreign exchange translation on foreign
exchange contracts.Other liabilities increased $24 billion or 7%, mainly attributable to higher obligations related to repurchase agreements due to
increased client activities and funding requirements, partially offset by higher financial netting.Total equity increased $1 billion or 1%.
Off-balance sheet arrangements
In the normal course of business, we engage in a variety of financial transactions that, for accounting purposes, are not recorded onour Consolidated Balance Sheets. Off-balance sheet transactions are generally undertaken for risk, capital and funding managementpurposes which benefit us and our clients. These include transactions with structured entities and may also include the issuance ofguarantees. These transactions give rise to, among other risks, varying degrees of market, credit, and liquidity and funding risk, whichare discussed in the Risk management section of this Q1 2019 Report to Shareholders. Our significant off-balance sheet transactionsinclude those described on pages 47 to 49 of our 2018 Annual Report.

Royal Bank of Canada First Quarter 2019 21
Risk management
Credit risk
Credit risk exposure by portfolio, sector and geographyThe following table presents our credit risk exposures under the Basel regulatory defined classes and reflects exposures at default(EAD). The classification of our sectors aligns with our view of credit risk by industry. Beginning in Q1 2019 we have prospectivelyimplemented the standardized approach for measuring counterparty credit risk (SA-CCR) under the Capital Adequacy Requirements(CAR) guidelines which primarily impacted on-balance sheet cash collateral and derivatives exposures.
As at
January 31
2019October 31
2018 (1)
Credit risk Counterparty credit risk (2)
On-balance sheetamount
Off-balance sheet amount (3) Repo-styletransactions Derivatives
Totalexposure
Totalexposure(Millions of Canadian dollars) Undrawn Other (4)
RetailResidential secured (5) $ 300,348 $ 61,224 $ – $ – $ – $ 361,572 $ 358,395Qualifying revolving (6) 25,025 70,202 – – – 95,227 89,840Other retail 55,704 14,084 71 – – 69,859 66,915
Total retail $ 381,077 $ 145,510 $ 71 $ – $ – $ 526,658 $ 515,150
WholesaleAgriculture $ 8,799 $ 1,723 $ 39 $ – $ 64 $ 10,625 $ 10,358Automotive 9,898 7,053 359 – 1,215 18,525 16,220Banking 40,633 1,788 531 51,701 19,528 114,181 128,858Consumer discretionary 16,770 7,810 611 – 522 25,713 24,592Consumer staples 5,174 6,490 513 – 1,036 13,213 12,167Oil & gas 6,868 10,784 1,440 – 1,370 20,462 20,090Financial services 24,140 22,173 2,903 109,330 15,998 174,544 191,133Financing products 1,351 1,389 358 167 1,017 4,282 3,214Forest products 1,455 743 89 – 40 2,327 2,185Governments 119,675 5,962 1,514 8,638 6,711 142,500 136,214Industrial products 6,976 7,803 694 – 719 16,192 17,111Information technology 6,387 5,948 191 – 4,031 16,557 12,155Investments 15,870 1,046 389 13 176 17,494 17,670Mining & metals 1,537 4,130 914 – 158 6,739 6,473Public works & infrastructure 1,932 1,799 424 – 171 4,326 4,275Real estates & related 56,858 11,259 1,373 – 661 70,151 68,045Other services 25,314 11,332 918 1 1,091 38,656 37,774Telecom & media 6,832 11,822 259 – 1,221 20,134 21,741Transportation 5,691 5,857 2,272 – 1,517 15,337 14,916Utilities 10,274 18,735 3,900 – 3,059 35,968 35,097Other sectors 2,699 293 1 11 16,652 19,656 14,259
Total wholesale $ 375,133 $ 145,939 $ 19,692 $ 169,861 $ 76,957 $ 787,582 $ 794,547
Total exposure (7) $ 756,210 $ 291,449 $ 19,763 $ 169,861 $ 76,957 $ 1,314,240 $ 1,309,697
By geography (8)
Canada $ 522,082 $ 211,263 $ 9,956 $ 75,296 $ 32,521 $ 851,118 $ 833,074U.S. 146,940 59,663 8,520 39,788 17,781 272,692 273,652Europe 57,051 18,162 1,151 49,862 22,251 148,477 162,254Other International 30,137 2,361 136 4,915 4,404 41,953 40,717
Total exposure (7) $ 756,210 $ 291,449 $ 19,763 $ 169,861 $ 76,957 $ 1,314,240 $ 1,309,697
(1) Amounts previously reflected gross credit risk exposures.(2) Counterparty credit risk EAD reflects exposure amounts after netting. Collateral is included in EAD for repo-style transactions to the extent allowed by regulatory guidelines.(3) EAD for undrawn credit commitments and other off-balance sheet amounts are reported after the application of credit conversion factors.(4) Includes other off-balance sheet exposures such as letters of credit and guarantees.(5) Includes residential mortgages and home equity lines of credit.(6) Includes credit cards, unsecured lines of credit and overdraft protection products.(7) Excludes securitization, banking book equities and other assets not subject to the standardized or Internal Ratings Based Approach.(8) Geographic profile is based on the country of residence of the borrower.
Q1 2019 vs. Q4 2018Total credit risk exposure increased $5 billion from the prior quarter, primarily due to growth in loans and acceptances, higherdeposits with central banks, and higher undrawn retail exposures, largely offset by decreases related to cash collateral andderivatives due to the adoption of SA-CCR in Q1 2019.
Retail exposure increased $12 billion or 2%, largely driven by growth in the qualifying revolving and residential securedportfolios.
Wholesale exposure decreased $7 billion or 1%, primarily due to the adoption of SA-CCR as noted above, and lower undrawnexposures partially offset by growth in loans and acceptances in the governments and other sectors.

22 Royal Bank of Canada First Quarter 2019
The geographic mix of our credit risk exposure increased in Canada and decreased in Europe. Our exposure in Canada, the U.S.,Europe and Other International was 65%, 21%, 11% and 3%, respectively (October 31, 2018 – 64%, 21%, 12% and 3%,respectively). The increase in Canada was largely driven by business growth in loans and acceptances. The decrease in Europe wasdriven by the reduction of cash collateral and derivatives both due to the adoption of SA-CCR as noted above.
Net European exposure by country, asset type and client type (1) (2)
As at
January 31
2019October 31
2018Asset type Client type
(Millions of Canadian dollars)Loans
Outstanding Securities (3)Repo-style
transactions Derivatives Financials Sovereign Corporate Total Total
U.K. $ 8,405 $ 22,688 $ 333 $ 1,361 $ 13,424 $ 11,558 $ 7,805 $ 32,787 $ 20,078Germany 1,671 5,962 – 253 3,777 2,311 1,798 7,886 9,417France 700 10,121 8 432 1,152 9,200 909 11,261 10,668
Total U.K., Germany, France $ 10,776 $ 38,771 $ 341 $ 2,046 $ 18,353 $ 23,069 $ 10,512 $ 51,934 $ 40,163
Ireland $ 795 $ 29 $ 327 $ 23 $ 408 $ 4 $ 762 $ 1,174 $ 931Italy 83 167 – 19 118 63 88 269 677Portugal – 12 32 – 33 – 11 44 33Spain 669 186 – 17 144 1 727 872 1,443
Total peripheral $ 1,547 $ 394 $ 359 $ 59 $ 703 $ 68 $ 1,588 $ 2,359 $ 3,084
Luxembourg (4) $ 1,875 $ 7,953 $ 242 $ 51 $ 1,516 $ 7,544 $ 1,061 $ 10,121 $ 9,000Netherlands (4) 593 1,038 45 176 1,015 4 833 1,852 2,815Norway 184 1,796 54 40 1,640 221 213 2,074 1,871Sweden 224 3,593 46 9 2,334 1,295 243 3,872 4,308Switzerland 451 5,537 140 114 515 5,258 469 6,242 6,835Other 1,506 1,793 141 239 1,225 832 1,622 3,679 3,795
Total other Europe $ 4,833 $ 21,710 $ 668 $ 629 $ 8,245 $ 15,154 $ 4,441 $ 27,840 $ 28,624
Net exposure to Europe (5) $ 17,156 $ 60,875 $ 1,368 $ 2,734 $ 27,301 $ 38,291 $ 16,541 $ 82,133 $ 71,871
(1) Geographic profile is based on country of risk, which reflects our assessment of the geographic risk associated with a given exposure. Typically, this is the residence of the borrower.(2) Exposures are calculated on a fair value basis and net of collateral, which includes $114.8 billion against repo-style transactions (October 31, 2018 – $111.1 billion) and $10.7 billion against
derivatives (October 31, 2018 – $11.6 billion).(3) Securities include $13.9 billion of trading securities (October 31, 2018 – $16.2 billion), $33.7 billion of deposits (October 31, 2018 – $23.3 billion), and $13.3 billion of securities carried at FVOCI
(October 31, 2018 – $12.5 billion).(4) Excludes $1.8 billion (October 31, 2018 – $2.5 billion) of exposures to supranational agencies.(5) Reflects $1.5 billion of mitigation through credit default swaps, which are largely used to hedge single name exposures and market risk (October 31, 2018 – $1.2 billion).
Q1 2019 vs. Q4 2018Net credit risk exposure to Europe increased $10 billion from last quarter, primarily driven by an increase in deposits with centralbanks. Our net exposure to peripheral Europe, which includes Ireland, Italy, Portugal and Spain, decreased $725 million during thequarter to $2.4 billion.
Our European corporate loan book is managed on a global basis with underwriting standards reflecting the same approach to theuse of our balance sheet as we have applied in both Canada and the U.S. PCL on loans taken on this portfolio was not material thisquarter. The gross impaired loans ratio of this loan book was 10 bps, unchanged from last quarter.

Royal Bank of Canada First Quarter 2019 23
Residential mortgages and home equity lines of credit (insured vs. uninsured)Residential mortgages and home equity lines of credit are secured by residential properties. The following table presents a breakdownby geographic region:
As at January 31, 2019
Residential mortgagesHome equitylines of credit
(Millions of Canadian dollars, exceptpercentage amounts) Insured (1) Uninsured Total Total
Region (2)
CanadaAtlantic provinces $ 7,575 54% $ 6,579 46% $ 14,154 $ 1,900Quebec 12,777 40 19,387 60 32,164 3,644Ontario 37,802 32 80,570 68 118,372 16,613Alberta 20,490 55 17,010 45 37,500 6,619Saskatchewan and Manitoba 8,950 51 8,593 49 17,543 2,475B.C. and territories 15,274 31 33,946 69 49,220 8,302
Total Canada (3) $ 102,868 38% $ 166,085 62% $ 268,953 $ 39,553U.S. (4) 1 – 14,212 100 14,213 1,937Other International (4) 7 – 3,139 100 3,146 1,443Total International $ 8 –% $ 17,351 100% $ 17,359 $ 3,380
Total $ 102,876 36% $ 183,436 64% $ 286,312 $ 42,933
As at October 31, 2018
Residential mortgagesHome equitylines of credit
(Millions of Canadian dollars, exceptpercentage amounts) Insured (1) Uninsured Total Total
Region (2)
CanadaAtlantic provinces $ 7,616 54% $ 6,398 46% $ 14,014 $ 1,926Quebec 13,045 41 18,911 59 31,956 3,730Ontario 38,708 33 77,649 67 116,357 16,811Alberta 20,615 55 16,738 45 37,353 6,706Saskatchewan and Manitoba 9,007 51 8,503 49 17,510 2,534B.C. and territories 15,452 32 33,189 68 48,641 8,436
Total Canada (3) $ 104,443 39% $ 161,388 61% $ 265,831 $ 40,143U.S. (4) 1 – 13,492 100 13,493 2,099Other International (4) 7 – 3,140 100 3,147 1,513
Total International $ 8 –% $ 16,632 100% $ 16,640 $ 3,612
Total $ 104,451 37% $ 178,020 63% $ 282,471 $ 43,755(1) Insured residential mortgages are mortgages whereby our exposure to default is mitigated by insurance through the Canada Mortgage and Housing
Corporation (CMHC) or other private mortgage default insurers.(2) Region is based upon address of the property mortgaged. The Atlantic provinces are comprised of Newfoundland and Labrador, Prince Edward Island,
Nova Scotia and New Brunswick, and B.C. and territories are comprised of British Columbia, Nunavut, Northwest Territories and Yukon.(3) Total consolidated residential mortgages in Canada of $269 billion (October 31, 2018 – $266 billion) was largely comprised of $246 billion (October 31,
2018 – $243 billion) of residential mortgages and $7 billion (October 31, 2018 – $7 billion) of mortgages with commercial clients, of which $4 billion(October 31, 2018 – $4 billion) are insured mortgages, both in Canadian Banking, and $16 billion (October 31, 2018 – $16 billion) of residentialmortgages in Capital Markets held for securitization purposes.
(4) Home equity lines of credit include term loans collateralized by residential mortgages.
Home equity lines of credit are uninsured and reported within the personal loan category. As at January 31, 2019, home equity lines ofcredit in Canadian Banking were $39 billion (October 31, 2018 – $40 billion). Approximately 98% of these home equity lines of credit(October 31, 2018 – 98%) are secured by a first lien on real estate, and 7% (October 31, 2018 – 7%) of the total Homeline clients paythe scheduled interest payment only.

24 Royal Bank of Canada First Quarter 2019
Residential mortgages portfolio by amortization periodThe following table provides a summary of the percentage of residential mortgages that fall within the remaining amortizationperiods based upon current customer payment amounts, which incorporate payments larger than the minimum contractualamount and/or higher frequency of payments:
As at
January 31
2019October 31
2018
CanadaU.S. and otherInternational Total Canada
U.S. and otherInternational Total
Amortization period≤ 25 years 70% 39% 69% 70% 40% 68%> 25 years ≤ 30 years 23 61 25 23 60 25> 30 years ≤ 35 years 5 – 4 5 – 5> 35 years 2 – 2 2 – 2
Total 100% 100% 100% 100% 100% 100%
Average loan-to-value (LTV) ratio for newly originated and acquired uninsured residential mortgages and Homeline productsThe following table provides a summary of our average LTV ratio for newly originated and acquired uninsured residential mortgagesand homeline products by geographic region:
For the three months ended
January 31
2019October 31
2018Uninsured Uninsured
Residentialmortgages (1)
Homelineproducts (2)
Residentialmortgages (1)
Homelineproducts (2)
Region (3)
Atlantic provinces 74% 74% 72% 74%Quebec 71 73 71 73Ontario 70 67 70 67Alberta 72 71 73 71Saskatchewan and Manitoba 74 74 74 74B.C. and territories 66 64 67 64U.S. 74 n.m. 69 n.m.Other International 71 n.m. 66 n.m.
Average of newly originated and acquired for the period (4), (5) 70% 68% 70% 68%Total Canadian Banking residential mortgages portfolio (6) 56% 50% 55% 49%(1) Residential mortgages exclude residential mortgages within the Homeline products.(2) Homeline products are comprised of both residential mortgages and home equity lines of credit.(3) Region is based upon address of the property mortgaged. The Atlantic provinces are comprised of Newfoundland and Labrador, Prince Edward Island, Nova Scotia and
New Brunswick, and B.C. and territories are comprised of British Columbia, Nunavut, Northwest Territories and Yukon.(4) The average LTV ratio for newly originated and acquired uninsured residential mortgages and Homeline products is calculated on a weighted basis by mortgage
amounts at origination.(5) For newly originated mortgages and Homeline products, LTV is calculated based on the total facility amount for the residential mortgage and Homeline product divided
by the value of the related residential property.(6) Weighted by mortgage balances and adjusted for property values based on the Teranet – National Bank National Composite House Price Index.n.m. not meaningful
We employ a risk-based approach to property valuation. Property valuation methods include automated valuation models (AVM) andappraisals. An AVM is a tool that estimates the value of a property by reference to market data including sales of comparableproperties and price trends specific to the Metropolitan Statistical Area in which the property being valued is located. Using a risk-based approach, we also employ appraisals which can include drive-by or full on-site appraisals.
We continue to actively manage our entire mortgage portfolio and to perform stress testing based on a combination of increasingunemployment, rising interest rates and a downturn in real estate markets.

Royal Bank of Canada First Quarter 2019 25
Credit quality performanceThe following credit quality performance tables and analysis provide information on loans, which represents loans, acceptances andcommitments, and other financial assets.
Provision for (recovery of) credit lossFor the three months ended
(Millions of Canadian dollars, except percentage amounts)
January 31
2019October 31
2018January 31
2018Personal & Commercial Banking $ 347 $ 297 $ 312Wealth Management 26 4 (2)Capital Markets 143 32 25Corporate Support and other – – (1)
PCL – Loans $ 516 $ 333 $ 334PCL – Other financial assets (2) 20 –Total PCL $ 514 $ 353 $ 334
Retail $ 33 $ 26 $ 20Wholesale 60 18 (11)
PCL on performing loans $ 93 $ 44 $ 9Retail $ 269 $ 248 $ 245Wholesale 154 41 80
PCL on impaired loans $ 423 $ 289 $ 325PCL – Loans $ 516 $ 333 $ 334PCL ratio – Loans (1) 0.34% 0.23% 0.24%PCL on impaired loans ratio (2) 0.28% 0.20% 0.23%
Additional information by geographyCanada (3)
Residential mortgages $ 10 $ 17 $ 10Personal 121 121 113Credit cards 116 115 107Small business 5 6 7Retail 252 259 237Wholesale 41 22 34PCL on impaired loans $ 293 $ 281 $ 271
U.S. (3)
Retail $ 2 $ 1 $ 1Wholesale 110 34 22PCL on impaired loans $ 112 $ 35 $ 23
Other International (3)
Retail $ 15 $ (12) $ 7Wholesale 3 (15) 24PCL on impaired loans $ 18 $ (27) $ 31
PCL on impaired loans $ 423 $ 289 $ 325
(1) PCL ratio – Loans is calculated using PCL on Loans as a percentage of average net loans and acceptances.(2) PCL on impaired loans ratio is calculated using PCL on impaired loans as a percentage of average net loans and acceptances.(3) Geographic information is based on residence of borrower.
Q1 2019 vs. Q1 2018Total PCL was $514 million. PCL on loans of $516 million increased $182 million, or 54% from the prior year, mainly due to higherprovisions in Capital Markets, Personal & Commercial Banking and Wealth Management. The PCL ratio on loans of 34 bps increased10 bps.
PCL on performing loans of $93 million, compared to $9 million in the prior year, driven by unfavourable changes in certainnear-term macroeconomic variables, largely impacting Capital Markets and Wealth Management.
PCL on impaired loans of $423 million was $98 million higher than the prior year, mainly due to increased provisions in CapitalMarkets and Personal & Commercial Banking.
PCL on loans in Personal & Commercial Banking increased $35 million, reflecting higher provisions on impaired loans across mostportfolios.
PCL on loans in Wealth Management increased $28 million, primarily reflecting higher provisions on performing loans in U.S.Wealth Management (including City National) as described above.
PCL on loans in Capital Markets increased $118 million, largely driven by higher provisions on performing loans as describedabove. Higher provisions on impaired loans also contributed to the increase, mainly driven by one account in the utilities sector.
Q1 2019 vs. Q4 2018PCL on loans of $516 million increased $183 million, or 55% from the prior quarter, mainly due to higher provisions in Capital Marketsand Personal & Commercial Banking. The PCL ratio on loans of 34 bps increased 11 bps.
PCL on performing loans of $93 million, compared to $44 million in the prior quarter, was driven by unfavourable changes incertain near-term macroeconomic variables, largely impacting Capital Markets and Wealth Management.

26 Royal Bank of Canada First Quarter 2019
PCL on impaired loans of $423 million increased $134 million from the prior quarter, mainly due to higher provisions in CapitalMarkets and Personal & Commercial Banking.
PCL on loans in Personal & Commercial Banking increased $50 million, primarily reflecting higher provisions on impaired loans in theCaribbean Banking and Canadian Business Banking portfolios.
PCL on loans in Wealth Management increased $22 million, primarily reflecting an increase in provisions on performing loans inU.S. Wealth Management (including City National) as described above.
PCL on loans in Capital Markets increased $111 million, largely driven by a provision on impaired loans taken on one account inthe utilities sector. Higher PCL on performing loans also contributed to the increase.
Gross impaired loans
As at
(Millions of Canadian dollars, except percentage amounts)
January 31
2019October 31
2018January 31
2018
Personal & Commercial Banking $ 1,653 $ 1,605 $ 1,713Wealth Management 223 203 273Capital Markets 906 375 541Corporate Support and other – – –
Total GIL $ 2,782 $ 2,183 $ 2,527
Canada (1)
Retail $ 749 $ 723 $ 715Wholesale 407 396 518
GIL $ 1,156 $ 1,119 $ 1,233
U.S. (1)
Retail $ 30 $ 23 $ 39Wholesale 949 401 386
GIL $ 979 $ 424 $ 425
Other International (1)
Retail $ 331 $ 327 $ 327Wholesale 316 313 542
GIL $ 647 $ 640 $ 869
Total GIL $ 2,782 $ 2,183 $ 2,527
Impaired loans, beginning balance $ 2,183 $ 2,321 $ 2,576Classified as impaired during the period (new impaired) (2) 1,133 553 694Net repayments (2) (99) (107) (126)Amounts written off (377) (382) (321)Other (2), (3) (58) (202) (296)
Impaired loans, balance at end of period $ 2,782 $ 2,183 $ 2,527
GIL ratio (4)
Total GIL ratio 0.46% 0.37% 0.45%Personal & Commercial Banking 0.37% 0.37% 0.41%
Canadian Banking 0.26% 0.26% 0.29%Caribbean Banking 6.54% 6.36% 6.44%
Wealth Management 0.37% 0.34% 0.52%Capital Markets 0.90% 0.41% 0.67%
(1) Geographic information is based on residence of borrower.(2) Certain GIL movements for Canadian Banking retail and wholesale portfolios are generally allocated to new impaired, as return to performing status, Net repayments, sold, and exchange and other
movements amounts are not reasonably determinable. Certain GIL movements for Caribbean Banking retail and wholesale portfolios are generally allocated to Net repayments and new impaired, asreturn to performing status, sold, and exchange and other movements amounts are not reasonably determinable.
(3) Includes return to performing status during the period, recoveries of loans and advances previously written off, sold, and exchange and other movements.(4) GIL as a % of related loans and acceptances.
Q1 2019 vs. Q1 2018Total GIL of $2,782 million increased $255 million or 10% from the prior year, and the total GIL ratio of 46 bps increased 1 bp, mainlyreflecting higher impaired loans in Capital Markets, partially offset by lower impaired loans in Personal & Commercial Banking andWealth Management.
GIL in Personal & Commercial Banking decreased $60 million or 4%, primarily due to lower impaired loans in our CanadianBusiness Banking portfolios, partially offset by higher impaired loans in our Canadian Personal Banking and Caribbean Bankingportfolios.
GIL in Wealth Management decreased $50 million or 18%, largely reflecting lower impaired loans in International WealthManagement and U.S. Wealth Management (including City National) due to repayments.
GIL in Capital Markets increased $365 million or 67%, mainly due to one account in the utilities sector. Movements in othersectors also contributed to the change.
Q1 2019 vs. Q4 2018Total GIL increased $599 million or 27% from the prior quarter, and the total GIL ratio of 46 bps increased 9 bps.
GIL in Personal & Commercial Banking increased $48 million or 3%, largely due to higher impaired loans in our Canadian Bankingportfolios.

Royal Bank of Canada First Quarter 2019 27
GIL in Wealth Management increased $20 million or 10%, mainly reflecting higher impaired loans in U.S. Wealth Management(including City National).
GIL in Capital Markets increased $531 million, mainly due to one account in the utilities sector.
Allowance for credit losses (ACL)
As at
(Millions of Canadian dollars)
January 31
2019October 31
2018January 31
2018
Personal & Commercial Banking $ 2,604 $ 2,536 $ 2,426Wealth Management 202 202 218Capital Markets 464 347 350Corporate Support and other 3 3 1
ACL on loans $ 3,273 $ 3,088 $ 2,995ACL on other financial assets 69 71 103
Total ACL $ 3,342 $ 3,159 $ 3,098
ACL on loans is comprised of:ACL on performing loans $ 2,478 $ 2,388 $ 2,242ACL on impaired loans 795 700 753
Retail $ 1,785 $ 1,753 $ 1,643Wholesale 693 635 599
ACL on performing loans $ 2,478 $ 2,388 $ 2,242
Additional information by geography
Canada (1)
Retail $ 176 $ 168 $ 153Wholesale 111 92 140
ACL on impaired loans $ 287 $ 260 $ 293
U.S. (1)
Retail $ 2 $ 1 $ 1Wholesale 226 164 135
ACL on impaired loans $ 228 $ 165 $ 136
Other International (1)
Retail $ 169 $ 166 $ 157Wholesale 111 109 167
ACL on impaired loans $ 280 $ 275 $ 324
ACL on impaired loans $ 795 $ 700 $ 753
(1) Geographic information is based on residence of borrower.
Q1 2019 vs. Q1 2018Total ACL of $3,342 million increased $244 million or 8% from the prior year, reflecting an increase of $278 million in ACL on loans,partially offset by a decrease of $34 million in ACL on other financial assets.
ACL on performing loans of $2,478 million increased $236 million from the prior year, driven by unfavourable changes in certainnear-term macroeconomic variables and volume growth, primarily impacting Personal & Commercial Banking. Capital Markets alsocontributed to the increase.
ACL on impaired loans of $795 million increased $42 million from the prior year, primarily due to higher ACL in Capital Markets,partially offset by lower ACL in Wealth Management.
ACL on other financial assets decreased $34 million, primarily due to the restructuring of Barbados securities in the prior year.
Q1 2019 vs. Q4 2018Total ACL of $3,342 million increased $183 million or 6% from the prior quarter, reflecting an increase of $185 million in ACL on loans.
ACL on performing loans of $2,478 million was $90 million higher than the prior quarter, reflecting increased ACL in CapitalMarkets and Personal & Commercial Banking, driven by unfavourable changes in certain near-term macroeconomic variables.
ACL on impaired loans of $795 million increased $95 million from the prior quarter, primarily due to higher ACL in CapitalMarkets.
For further details, refer to Note 5 of our Condensed Financial Statements.
Market risk
Market risk is defined to be the impact of market prices upon our financial condition. This includes potential gains or losses due tochanges in market determined variables such as interest rates, credit spreads, equity prices, commodity prices, foreign exchangerates and implied volatilities. There have been no material changes to our Market Risk Framework from the framework described in our2018 Annual Report. We continue to manage the controls and governance procedures that ensure that our market risk exposure is

28 Royal Bank of Canada First Quarter 2019
consistent with risk appetite constraints set by the Board of Directors. These controls include limits on probabilistic measures ofpotential loss in trading positions, such as Value-at-Risk (VaR) and Stressed Value-at-Risk (SVaR).
Market risk controls are also in place to manage structural interest rate risk (SIRR) arising from traditional banking products.Factors contributing to SIRR include the mismatch between future asset and liability repricing dates, relative changes in asset andliability rates, and product features that could affect the expected timing of cash flows, such as options to pre-pay loans or redeemterm deposits prior to contractual maturity. To monitor and control SIRR, we assess two primary financial metrics, Net Interest Income(NII) risk and Economic Value of Equity (EVE) risk, under a range of market shocks and scenarios. For further details of our approach tothe management of market risk, refer to the Market risk section of our 2018 Annual Report. There has been no material change to theSIRR measurement methodology, controls, or limits from those described in our 2018 Annual Report.
Market risk measures – FVTPL positions
VaR and SVaRThe following table presents our Market risk VaR and Market risk SVaR figures.
January 31, 2019 October 31, 2018 January 31, 2018
For thethree months ended
As at
For thethree months ended
As at
For thethree months ended
(Millions of Canadian dollars) As at Average High Low Average Average
Equity $ 20 $ 22 $ 30 $ 14 $ 34 $ 16 $ 15 $ 16Foreign exchange 4 6 13 3 12 5 3 3Commodities 2 3 4 2 2 2 1 2Interest rate (1) 14 16 19 12 15 15 12 17Credit specific (2) 5 5 5 5 5 5 5 5Diversification (3) (15) (18) n.m. n.m. (29) (19) (14) (18)
Market risk VaR $ 30 $ 34 $ 45 $ 27 $ 39 $ 24 $ 22 $ 25
Market risk Stressed VaR $ 113 $ 123 $ 161 $ 79 $ 91 $ 72 $ 84 $ 81
(1) General credit spread risk and funding spread risk associated with uncollateralized derivatives are included under interest rate VaR.(2) Credit specific risk captures issuer-specific credit spread volatility.(3) Market risk VaR is less than the sum of the individual risk factor VaR results due to portfolio diversification.n.m. not meaningful
Q1 2019 vs. Q1 2018Average market risk VaR of $34 million increased $9 million from the prior year, primarily reflecting increased equity markets volatilityimpacting the historical window used to calculate VaR and the impact of foreign exchange translation.
Average SVaR of $123 million increased $42 million from the prior year, mainly due to growth in our fixed income portfolios andequity markets volatility. The impact of foreign exchange translation also contributed to the increase.
Q1 2019 vs. Q4 2018Average market risk VaR of $34 million increased $10 million and average SVaR of $123 million increased $51 million from the priorquarter, mainly due to growth in our fixed income portfolios and equity markets volatility. The impact of foreign exchange translationalso contributed to the increase.
The following chart displays a bar graph of our daily trading profit and loss and a line graph of our daily market risk VaR. We incurredno net trading losses in the three months ended January 31, 2019 and October 31, 2018.
-60
-40
-20
0
20
40
60
Trading Revenue Market Risk VaR
Feb 1, 2
018
Apr 30, 2
018
Jul 3
1, 2018
Oct 31, 2
018
Jan 31, 2019
Trading revenue and VaR (Millions of Canadian dollars)

Royal Bank of Canada First Quarter 2019 29
Market risk measures for other FVTPL positions – Assets and liabilities of RBC InsuranceWe offer a range of insurance products to clients and hold investments to meet the future obligations to policyholders. Theinvestments which support actuarial liabilities are predominantly fixed income assets designated as FVTPL. Consequently, changes inthe fair values of these assets are recorded in investment income within Total revenue in the Consolidated Statements of Income andare largely offset by changes in the fair value of the actuarial liabilities, the impact of which is reflected in Insurance policyholderbenefits, claims and acquisition expense. As at January 31, 2019, we had liabilities with respect to insurance obligations of $10.5billion, up from $10.0 billion in the prior quarter, and assets of $8.6 billion in support of the liabilities, up from $8.1 billion lastquarter.
Market risk measures – Structural Interest Rate SensitivitiesThe following table shows the potential before-tax impact of an immediate and sustained 100 bps increase or decrease in interestrates on projected 12-month NII and EVE for our structural balance sheet, assuming no subsequent hedging. Rate floors are appliedwithin the declining rates scenarios, with floor levels set based on rate changes experienced globally. Interest rate risk measuresare based upon interest rate exposures at a specific time and continuously change as a result of business activities andmanagement actions.
January 31
2019October 31
2018January 31
2018EVE risk NII risk (1)
(Millions of Canadian dollars)
Canadiandollar
impact
U.S.dollar
impact (2) Total
Canadiandollar
impact
U.S.dollar
impact (2) Total EVE risk NII risk (1) EVE risk NII risk (1)
Before-tax impact of:100bps increase in rates $ (976) $ (43) $ (1,019) $ 360 $ 127 $ 487 $ (1,140) $ 505 $ (1,224) $ 458100bps decrease in rates 877 (328) 549 (468) (149) (617) 755 (582) 809 (578)
(1) Represents the 12-month NII exposure to an instantaneous and sustained shift in interest rates.(2) Represents the impact on the SIRR portfolios held in our City National and U.S. banking operations.
As at January 31, 2019, an immediate and sustained -100 bps shock would have had a negative impact to our NII of $617 million, upfrom $582 million last quarter. An immediate and sustained +100 bps shock at the end of January 31, 2019 would have had anegative impact to the Bank’s EVE of $1,019 million, down from $1,140 million reported last quarter. The quarter-over-quarterincrease in NII risk was mainly attributed to interest rate changes and deposit growth. During the first quarter of 2019, NII and EVErisks remained well within approved limits.
Market risk measures for other material non-trading portfolios
Investment securities carried at FVOCIWe held $51.9 billion of investment securities carried at FVOCI as at January 31, 2019 compared to $48.5 billion in the prior quarter.We hold debt securities carried at FVOCI primarily as investments, as well as to manage liquidity risk and hedge interest rate risk inour non-trading banking balance sheet. As at January 31, 2019, our portfolio of investment securities carried at FVOCI is interest ratesensitive and would impact OCI by a pre-tax change in value of $7 million as measured by the change in the value of the securitiesfor a one basis point parallel increase in yields. The portfolio also exposes us to credit spread risk of a pre-tax change in value of$21 million, as measured by the change in value for a one basis point widening of credit spreads. The value of the investmentsecurities carried at FVOCI included in our SIRR measure as at January 31, 2019 was $6.0 billion, down from $7.1 billion in the priorquarter. Our investment securities carried at FVOCI also include equity exposures of $0.5 billion as at January 31, 2019 compared to$0.4 billion last quarter.
Derivatives related to non-trading activityDerivatives are also used to hedge market risk exposures unrelated to our trading activity. In aggregate, derivative assets notrelated to trading activity of $2.5 billion as at January 31, 2019 were down from $2.8 billion last quarter, and derivative liabilitiesof $2.1 billion as at January 31, 2019 were down from $2.9 billion last quarter.
Non-trading derivatives in hedge accounting relationshipsThe derivative assets and liabilities described above include derivative assets in a designated hedge accounting relationship of$1.0 billion as at January 31, 2019, down from $1.5 billion as at October 31, 2018, and derivative liabilities of $1.6 billion as atJanuary 31, 2019, down from $2.1 billion last quarter. These derivative assets and liabilities are included in our SIRR measure andother internal non-trading market risk measures. We use interest rate swaps to manage our investment securities and SIRR. To theextent these swaps are considered effective, changes in their fair value are recognized in Other comprehensive income. The interestrate risk for the swaps designated as cash flow hedges, measured as the change in the fair value of the derivatives for a one basispoint parallel increase in yields, was $7 million as of January 31, 2019, unchanged from $7 million as of October 31, 2018.
Interest rate swaps are also used to hedge changes in the fair value of certain fixed-rate instruments. Changes in fair value of thehedged instruments that are related to interest rate movements and the corresponding interest rate swaps are reflected in theConsolidated Statement of Income.
We also use foreign exchange derivatives to manage our exposure to equity investments in subsidiaries that are denominated inforeign currencies, particularly the U.S. dollar, British pound, and Euro. Changes in the fair value of these hedges and the cumulativetranslation adjustment related to our structural foreign exchange risk are reported in other comprehensive income.
Other non-trading derivativesDerivatives, including interest rate swaps and foreign exchange derivatives, that are not in designated hedge accounting relationshipsare used to manage other non-trading exposures. Changes in the fair value of these derivatives are reflected in the ConsolidatedStatement of Income. Derivative assets of $1.5 billion as at January 31, 2019 were up from $1.3 billion as at October 31, 2018, andderivative liabilities of $0.5 billion as at January 31, 2019 were down from $0.8 billion last quarter.

30 Royal Bank of Canada First Quarter 2019
Non-trading foreign exchange rate riskForeign exchange rate risk is the potential adverse impact on earnings and economic value due to changes in foreign currency rates.Our revenue, expenses and income denominated in currencies other than the Canadian dollar are subject to fluctuations as a result ofchanges in the value of the average Canadian dollar relative to the average value of those currencies. Our most significant exposure isto the U.S. dollar, due to our operations in the U.S. and other activities conducted in U.S. dollars. Other significant exposures are tothe British pound and the Euro, due to our activities conducted internationally in these currencies. A strengthening or weakening ofthe Canadian dollar compared to the U.S. dollar, British pound and the Euro could reduce or increase, as applicable, the translatedvalue of our foreign currency denominated revenue, expenses and income and could have a significant effect on the results of ouroperations. We are also exposed to foreign exchange rate risk arising from our investments in foreign operations. For unhedged equityinvestments, when the Canadian dollar appreciates against other currencies, the unrealized translation losses on net foreigninvestments decreases our shareholders’ equity through the other components of equity and decreases the translated value of theRisk-weighted Assets (RWA) of the foreign currency-denominated asset. The reverse is true when the Canadian dollar depreciatesagainst other currencies. Consequently, we consider these impacts in selecting an appropriate level of our investments in foreignoperations to be hedged.
Linkage of market risk to selected balance sheet itemsThe following table provides the linkages between selected balance sheet items with positions included in our trading market risk andnon-trading market risk disclosures, which illustrates how we manage market risk for our assets and liabilities through different riskmeasures:
As at January 31, 2019
Market risk measure
(Millions of Canadian dollars)Balance sheet
amount Traded risk (1)Non-traded
risk (2)Non-traded risk
primary risk sensitivity
Assets subject to market riskCash and due from banks $ 40,033 $ – $ 40,033 Interest rateInterest-bearing deposits with banks 38,653 22,859 15,794 Interest rateSecurities
Trading 138,173 129,595 8,578 Interest rate, credit spreadInvestment, net of applicable allowance 97,659 – 97,659 Interest rate, credit spread, equity
Assets purchased under reverse repurchase agreementsand securities borrowed 297,660 223,953 73,707 Interest rate
LoansRetail 401,767 7,112 394,655 Interest rateWholesale 191,114 8,778 182,336 Interest rateAllowance for loan losses (3,061) – (3,061) Interest rate
Segregated fund net assets 1,443 – 1,443 Interest rateDerivatives 84,816 82,307 2,509 Interest rate, foreign exchangeOther assets 71,692 2,439 69,253 Interest rateAssets not subject to market risk (3) 6,258
Total assets $ 1,366,207 $ 477,043 $ 882,906
Liabilities subject to market riskDeposits $ 852,564 $ 96,229 $ 756,335 Interest rateSegregated fund liabilities 1,443 – 1,443 Interest rateOther
Obligations related to securities sold short 33,242 33,242 –Obligations related to assets sold under repurchase
agreements and securities loaned 224,529 218,297 6,232 Interest rateDerivatives 81,766 79,647 2,119 Interest rate, foreign exchangeOther liabilities 78,383 7,887 70,496 Interest rate
Subordinated debentures 9,255 – 9,255 Interest rateLiabilities not subject to market risk (4) 4,375
Total liabilities $ 1,285,557 $ 435,302 $ 845,880
Total equity $ 80,650
Total liabilities and equity $ 1,366,207
(1) Traded risk includes positions that are classified or designated as FVTPL and positions whose revaluation gains and losses are reported in revenue. Market risk measures of VaR and SVaR and stresstesting are used as risk controls for traded risk.
(2) Non-traded risk includes positions used in the management of the SIRR and other non-trading portfolios. Other material non-trading portfolios include positions from RBC Insurance and investmentsecurities, net of applicable allowance, not included in SIRR.
(3) Assets not subject to market risk include $6,258 million of physical and other assets.(4) Liabilities not subject to market risk include $4,375 million of payroll related and other liabilities.

Royal Bank of Canada First Quarter 2019 31
As at October 31, 2018
Market risk measure
(Millions of Canadian dollars)Balance sheet
amount Traded risk (1)Non-traded
risk (2)Non-traded risk
primary risk sensitivity
Assets subject to market riskCash and due from banks $ 30,209 $ – $ 30,209 Interest rateInterest-bearing deposits with banks 36,471 20,277 16,194 Interest rateSecurities
Trading 128,258 120,163 8,095 Interest rate, credit spreadInvestment, net of applicable allowance 94,608 – 94,608 Interest rate, credit spread, equity
Assets purchased under reverse repurchase agreementsand securities borrowed 294,602 219,108 75,494 Interest rate
LoansRetail 399,452 4,307 395,145 Interest rateWholesale 180,278 9,128 171,150 Interest rateAllowance for loan losses (2,912) – (2,912) Interest rate
Segregated fund net assets 1,368 – 1,368 Interest rateDerivatives 94,039 91,275 2,764 Interest rate, foreign exchangeOther assets 71,655 2,259 69,396 Interest rateAssets not subject to market risk (3) 6,706
Total assets $ 1,334,734 $ 466,517 $ 861,511
Liabilities subject to market riskDeposits $ 837,046 $ 82,281 $ 754,765 Interest rateSegregated fund liabilities 1,368 – 1,368 Interest rateOther
Obligations related to securities sold short 32,247 32,247 –Obligations related to assets sold under repurchase
agreements and securities loaned 206,814 201,839 4,975 Interest rateDerivatives 90,238 87,352 2,886 Interest rate, foreign exchangeOther liabilities 72,116 7,661 64,455 Interest rate
Subordinated debentures 9,131 – 9,131 Interest rateLiabilities not subject to market risk (4) 5,819
Total liabilities $ 1,254,779 $ 411,380 $ 837,580
Total equity $ 79,955
Total liabilities and equity $ 1,334,734
(1) Traded risk includes positions that are classified or designated as FVTPL and positions whose revaluation gains and losses are reported in revenue. Market risk measures of VaR and SVaR and stresstesting are used as risk controls for traded risk.
(2) Non-traded risk includes positions used in the management of the SIRR and other non-trading portfolios. Other material non-trading portfolios include positions from RBC Insurance and investmentsecurities, net of applicable allowance, not included in SIRR.
(3) Assets not subject to market risk include $6,706 million of physical and other assets.(4) Liabilities not subject to market risk include $5,819 million of payroll related and other liabilities.
Liquidity and funding risk
Liquidity and funding risk (liquidity risk) is the risk that we may be unable to generate sufficient cash or its equivalents in a timely andcost-effective manner to meet our commitments as they come due. Liquidity risk arises from mismatches in the timing and value ofon-balance sheet and off-balance sheet cash flows.
Our Liquidity Risk Management Framework (LRMF) is designed to ensure that we have sufficient liquidity to satisfy current andprospective commitments in both normal and stressed conditions. There have been no material changes to our LRMF as described inour 2018 Annual Report.
We continue to maintain liquidity and funding that is appropriate for the execution of our strategy. Liquidity risk remains wellwithin our risk appetite.
Liquidity reserveOur liquidity reserve consists of available unencumbered liquid assets as well as uncommitted and undrawn central bank borrowingfacilities that could be accessed under extraordinary circumstances subject to satisfying certain preconditions as set by variousCentral Banks (e.g., BoC, the Fed, Bank of England, and Bank of France).
To varying degrees, unencumbered liquid assets represent a ready source of funding. Unencumbered assets are the differencebetween total and encumbered assets from both on- and off-balance sheet sources. Encumbered assets, in turn, are not considered asource of liquidity in measures of liquidity risk.
Although unused wholesale funding capacity, which is regularly assessed, could be another potential source of liquidity tomitigate stressed conditions, it is excluded in the determination of our liquidity reserve.

32 Royal Bank of Canada First Quarter 2019
As at January 31, 2019
(Millions of Canadian dollars)Bank-ownedliquid assets
Securitiesreceived as
collateral fromsecuritiesfinancing
derivativetransactions
Total liquidassets
Encumberedliquid assets
Unencumberedliquid assets
Cash and due from banks $ 40,033 $ – $ 40,033 $ 2,585 $ 37,448Interest-bearing deposits with banks 38,653 – 38,653 328 38,325Securities issued or guaranteed by sovereigns, central banks or
multilateral development banks (1) 196,493 277,661 474,154 329,626 144,528Other securities 79,484 120,017 199,501 84,522 114,979Undrawn credit lines granted by central banks (2) 10,722 – 10,722 – 10,722Other assets eligible as collateral for discount (3) 95,157 – 95,157 – 95,157Other liquid assets (4) 18,498 – 18,498 18,137 361
Total liquid assets $ 479,040 $ 397,678 $ 876,718 $ 435,198 $ 441,520
As at October 31, 2018
(Millions of Canadian dollars)Bank-ownedliquid assets
Securitiesreceived as
collateral fromsecuritiesfinancing
derivativetransactions
Total liquidassets
Encumberedliquid assets
Unencumberedliquid assets
Cash and due from banks $ 30,209 $ – $ 30,209 $ 2,573 $ 27,636Interest-bearing deposits with banks 36,471 – 36,471 366 36,105Securities issued or guaranteed by sovereigns, central banks or
multilateral development banks (1) 188,911 261,119 450,030 297,681 152,349Other securities 78,090 126,209 204,299 84,589 119,710Undrawn credit lines granted by central banks (2) 9,988 – 9,988 – 9,988Other assets eligible as collateral for discount (3) 99,120 – 99,120 – 99,120Other liquid assets (4) 19,758 – 19,758 19,406 352
Total liquid assets $ 462,547 $ 387,328 $ 849,875 $ 404,615 $ 445,260
As at
(Millions of Canadian dollars)
January 31
2019October 31
2018
Royal Bank of Canada $ 201,440 $ 219,197Foreign branches 81,969 73,015Subsidiaries 158,111 153,048
Total unencumbered liquid assets $ 441,520 $ 445,260
(1) Includes liquid securities issued by provincial governments and U.S. government-sponsored entities working under U.S. Federal government’s conservatorship (e.g., Federal National MortgageAssociation and Federal Home Loan Mortgage Corporation).
(2) Includes loans that qualify as eligible collateral for the discount window facility available to us at the Federal Reserve Bank of New York (FRBNY). Amounts are face value and would be subject tocollateral margin requirements applied by the FRBNY to determine collateral value/borrowing capacity. Access to the discount window borrowing program is conditional on meeting requirements setby the FRBNY and borrowings are typically expected to be infrequent and due to uncommon occurrences requiring temporary accommodation.
(3) Represents our unencumbered Canadian dollar non-mortgage loan book (at face value) that could, subject to satisfying conditions precedent to borrowing and application of prescribed collateralmargin requirements, be pledged to the BoC for advances under its Emergency Lending Assistance (ELA) program. ELA is not considered a source of available liquidity in our normal liquidity riskprofile but could in extraordinary circumstances, where normal market liquidity is seriously impaired, allow us and other banks to monetize assets eligible as collateral to meet requirements andmitigate further market liquidity disruption. The balance also includes our unencumbered mortgage loans that qualify as eligible collateral at Federal Home Loan Bank (FHLB).
(4) Encumbered liquid assets amount represents cash collateral and margin deposit amounts pledged related to OTC and exchange-traded derivative transactions.
The liquidity reserve is typically most affected by routine flows of client banking activity where liquid asset portfolios adjust to thechange in cash balances, and additionally from capital markets activities where business strategies and client flows may also affectthe addition or subtraction of liquid assets in the overall calculation of the liquidity reserve. Corporate Treasury also affects liquidityreserves through the management of funding issuances where reserves absorb timing mismatches between debt issuances anddeployment into business activities.
Q1 2019 vs. Q4 2018Total liquid assets increased $27 billion or 3%, primarily due to an increase in on-balance sheet securities and securities received ascollateral under reverse repurchase agreements and collateral swap transactions, and higher deposits with central banks, reflectingshort-term cash management activities. However, the increase in collateral received was offset with a corresponding increase incollateral pledged under encumbered liquid assets due to repurchase transactions and collateral swap transactions.
Asset encumbranceThe table below provides a summary of cash, securities and other assets, distinguishing between those that are encumbered oravailable for sale or use as collateral in secured funding transactions. Other assets, such as mortgages and credit card receivables,can also be monetized, albeit over longer timeframes than those required for marketable securities. As at January 31, 2019, ourUnencumbered assets available as collateral comprised 29% of total assets (October 31, 2018 – 29%).

Royal Bank of Canada First Quarter 2019 33
Asset encumbrance
As at
January 31
2019October 31
2018Encumbered Unencumbered Encumbered Unencumbered
(Millions of Canadian dollars)Pledged as
collateral Other (1)Available as
collateral (2) Other (3) TotalPledged as
collateral Other (1)Available ascollateral (2) Other (3) Total
Cash and due from banks $ – $ 2,585 $ 37,448 $ – $ 40,033 $ – $ 2,573 $ 27,636 $ – $ 30,209Interest-bearing deposits
with banks – 328 38,325 – 38,653 – 366 36,105 – 36,471Securities
Trading 40,659 – 94,912 2,602 138,173 40,640 – 84,270 3,348 128,258Investment, net of
applicable allowance 14,047 – 83,550 62 97,659 12,195 – 82,351 62 94,608Assets purchased under
reverse repurchaseagreements andsecurities borrowed (4) 379,112 22,633 35,373 9,041 446,159 348,597 22,188 53,590 5,722 430,097
LoansRetail
Mortgage securities 30,494 – 37,069 – 67,563 34,286 – 36,234 – 70,520Mortgage loans 44,961 – 14,400 159,388 218,749 36,959 – 17,784 157,208 211,951Non-mortgage loans 9,251 – 58,701 47,503 115,455 8,553 – 59,611 48,817 116,981
Wholesale – – 33,302 157,812 191,114 – – 32,478 147,800 180,278Allowance for loan losses – – – (3,061) (3,061) – – – (2,912) (2,912)Segregated fund net assets – – – 1,443 1,443 – – – 1,368 1,368Other – Derivatives – – – 84,816 84,816 – – – 94,039 94,039
– Others (5) 18,137 – 361 59,452 77,950 19,406 – 352 58,603 78,361
Total assets $ 536,661 $ 25,546 $ 433,441 $ 519,058 $1,514,706 $ 500,636 $ 25,127 $ 430,411 $ 514,055 $ 1,470,229
(1) Includes assets restricted from use to generate secured funding due to legal or other constraints.(2) Includes loans that could be used to collateralize central bank advances. Our unencumbered Canadian dollar non-mortgage loan book (at face value) could, subject to satisfying conditions for
borrowing and application of prescribed collateral margin requirements, be pledged to the BoC for advances under its ELA program. It also includes our unencumbered mortgage loans that qualifyas eligible collateral at FHLB. We also lodge loans that qualify as eligible collateral for the discount window facility available to us at the FRBNY. ELA and other central bank facilities are notconsidered sources of available liquidity in our normal liquidity risk profile. However, banks could monetize assets meeting collateral criteria during periods of extraordinary and severe disruption tomarket-wide liquidity.
(3) Other unencumbered assets are not subject to any restrictions on their use to secure funding or as collateral but would not be considered readily available since they may not be acceptable atcentral banks or for other lending programs.
(4) Includes bank-owned liquid assets and securities received as collateral from off-balance sheet securities financing, derivative transactions, and margin lending. Includes $22.6 billion (October 31,2018 – $22.2 billion) of collateral received through reverse repurchase transactions that cannot be rehypothecated in its current legal form.
(5) The Pledged as collateral amount represents cash collateral and margin deposit amounts pledged related to OTC and exchange-traded derivative transactions.
FundingFunding strategyCore funding, comprising capital, longer-term wholesale liabilities and a diversified pool of personal and, to a lesser extent,commercial and institutional deposits, is the foundation of our structural liquidity position.
Deposit and funding profileAs at January 31, 2019, relationship-based deposits, which are the primary source of funding for retail loans and mortgages, were$551 billion or 49% of our total funding (October 31, 2018 – $545 billion or 50%). The remaining portion is comprised of short- andlong-term wholesale funding.
Funding for highly liquid assets consists primarily of short-term wholesale funding that reflects the monetization period of thoseassets. Long-term wholesale funding is used mostly to fund less liquid wholesale assets and to support liquidity asset buffers.
For further details on our wholesale funding, refer to the Composition of wholesale funding tables below.
Long-term debt issuanceOur wholesale funding activities are well-diversified by geography, investor segment, instrument, currency, structure and maturity. Wemaintain an ongoing presence in different funding markets, which allows us to continuously monitor market developments andtrends, identify opportunities and risks, and take appropriate and timely actions. We operate longer-term debt issuance registeredprograms. The following table summarizes these programs with their authorized limits by geography.
Programs by geography
Canada U.S. Europe/Asia
• Canadian Shelf Program – $25 billion • SEC Shelf Program – US$40 billion • European Debt Issuance Program – US$40 billion
• Global Covered Bond Program – €32 billion
• Japanese Issuance Programs – ¥1 trillion

34 Royal Bank of Canada First Quarter 2019
We also raise long-term funding using Canadian Deposit Notes, Canadian National Housing Act MBS, Canada Mortgage Bonds, creditcard receivable-backed securities, Kangaroo Bonds (issued in the Australian domestic market by foreign firms) and YankeeCertificates of Deposit (issued in the U.S. domestic market by foreign firms). We continuously evaluate opportunities to expand intonew markets and untapped investor segments since diversification expands our wholesale funding flexibility, minimizes fundingconcentration and dependency, and generally reduces financing costs. As presented in the following charts, our current long-termdebt profile is well-diversified by both currency and product. Maintaining competitive credit ratings is also critical to cost-effectivefunding.
Long-term debt(1) – funding mix by currency of issuance($137 billion as at January 31, 2019)
Euro18%
Other10%
Canadian dollar34%
U.S. dollar38%
Long-term debt(1) – funding mix by product($137 billion as at January 31, 2019)
Cardssecuritization
7%
Covered Bonds29%
MBS/CMB (2)
13%
Unsecured funding51%
(1) Based on original term to maturity greater than 1 year (1) Based on original term to maturity greater than 1 year(2) Mortgage-backed securities and Canada Mortgage Bonds
The following table provides our composition of wholesale funding based on remaining term to maturity:
Composition of wholesale funding (1)
(Millions of Canadian dollars)
As at January 31, 2019
Less than 1month
1 to 3months
3 to 6months
6 to 12months
Less than 1year sub-total
1 yearto 2 years
2 years andgreater Total
Deposits from banks (2) $ 4,141 $ 29 $ 709 $ – $ 4,879 $ – $ – $ 4,879Certificates of deposit and commercial paper 5,461 16,769 16,232 15,804 54,266 66 131 54,463Asset-backed commercial paper (3) 2,029 3,160 6,183 4,702 16,074 – – 16,074Senior unsecured medium-term notes (4) 121 7,400 6,180 4,282 17,983 25,540 31,213 74,736Senior unsecured structured notes (5) 65 275 450 1,759 2,549 1,511 5,514 9,574Mortgage securitization – 527 513 1,109 2,149 3,660 11,597 17,406Covered bonds/asset-backed securities (6) 1,313 3,338 1,503 3,932 10,086 12,167 26,836 49,089Subordinated liabilities – – 1,000 2,095 3,095 2,499 3,798 9,392Other (7) 9,373 2,810 3,189 1,855 17,227 157 9,065 26,449
Total $ 22,503 $ 34,308 $ 35,959 $ 35,538 $ 128,308 $ 45,600 $ 88,154 $ 262,062
Of which:– Secured $ 11,764 $ 8,945 $ 10,169 $ 10,794 $ 41,672 $ 15,827 $ 38,433 $ 95,932– Unsecured 10,739 25,363 25,790 24,744 86,636 29,773 49,721 166,130
(Millions of Canadian dollars)
As at October 31, 2018
Less than 1month
1 to 3months
3 to 6months
6 to 12months
Less than 1year sub-total
1 yearto 2 years
2 years andgreater Total
Deposits from banks (2) $ 4,507 $ 10 $ 42 $ – $ 4,559 $ – $ – $ 4,559Certificates of deposit and commercial paper 3,658 9,000 20,994 14,926 48,578 197 132 48,907Asset-backed commercial paper (3) 1,908 2,581 5,877 6,197 16,563 – – 16,563Senior unsecured medium-term notes (4) 122 6,132 7,424 8,090 21,768 23,125 33,513 78,406Senior unsecured structured notes (5) 185 215 353 693 1,446 2,603 5,608 9,657Mortgage securitization – 2,473 527 1,099 4,099 3,027 12,193 19,319Covered bonds/asset-backed securities (6) – 21 4,641 5,409 10,071 8,581 26,861 45,513Subordinated liabilities – – – 1,103 1,103 2,993 5,301 9,397Other (7) 7,639 1,658 419 1,189 10,905 4 9,122 20,031
Total $ 18,019 $ 22,090 $ 40,277 $ 38,706 $ 119,092 $ 40,530 $ 92,730 $ 252,352
Of which:– Secured $ 8,292 $ 5,666 $ 11,045 $ 12,706 $ 37,709 $ 11,608 $ 39,054 $ 88,371– Unsecured 9,727 16,424 29,232 26,000 81,383 28,922 53,676 163,981
(1) Excludes bankers’ acceptances and repos.(2) Excludes deposits associated with services we provide to banks (e.g., custody, cash management).(3) Only includes consolidated liabilities, including our collateralized commercial paper program.(4) Includes deposit notes.(5) Includes notes where the payout is tied to movements in foreign exchange, commodities and equities.(6) Includes credit card and mortgage loans.(7) Includes tender option bonds (secured) of $8,240 million (October 31, 2018 – $6,978 million), bearer deposit notes (unsecured) of $4,176 million (October 31, 2018 – $4,084 million), other long-
term structured deposits (unsecured) of $8,910 million (October 31, 2018 – $8,969 million), and FHLB advances (secured) of $5,123 million (October 31, 2018 – $nil).

Royal Bank of Canada First Quarter 2019 35
Credit ratingsOur ability to access unsecured funding markets and to engage in certain collateralized business activities on a cost-effective basisare primarily dependent upon maintaining competitive credit ratings. Credit ratings and outlooks provided by rating agencies reflecttheir views and methodologies. Ratings are subject to change, based on a number of factors including, but not limited to, our financialstrength, competitive position, liquidity and other factors not completely within our control.
The following table presents our major credit ratings (1):
Credit ratings
As at February 21, 2019
Short-termdebt
Legacy seniorlong-term debt (2)
Senior long-term debt (3) Outlook
Moody’s (4) P-1 Aa2 A2 stableStandard & Poor’s (5) A-1+ AA- A stableFitch Ratings (6) F1+ AA AA stableDBRS (7) R-1(high) AA AA (low) positive
(1) Credit ratings are not recommendations to purchase, sell or hold a financial obligation inasmuch as they do not comment on marketprice or suitability for a particular investor. Ratings are determined by the rating agencies based on criteria established from time to timeby them, and are subject to revision or withdrawal at any time by the rating organization.
(2) Includes senior long-term debt issued prior to September 23, 2018 and senior long-term debt issued on or after September 23, 2018which is excluded from the Canadian Bank Recapitalization (Bail-in) regime.
(3) Includes senior long-term debt issued on or after September 23, 2018 which is subject to conversion under the Bail-in regime.(4) On July 16, 2018, Moody’s upgraded our legacy senior long-term debt rating two notches and revised our outlook to stable from
negative. On July 16, 2018, Moody’s also announced our rating for senior long-term debt of A2.(5) On June 27, 2018, S&P revised our outlook to stable from negative. On August 16, 2018, S&P announced our rating for senior long-term
debt of A.(6) On June 21, 2018, Fitch Ratings announced that our rating for senior long-term debt will be the same as our legacy senior long-term debt,
as they did not expect any immediate rating changes as a result of the Bail-in regime. On October 22, 2018, Fitch Ratings affirmed ourratings with a stable outlook.
(7) On June 26, 2018, DBRS revised our outlook to positive from stable. On April 19, 2018, DBRS announced our rating for senior long-termdebt of AA (low).
Additional contractual obligations for rating downgradesWe are required to deliver collateral to certain counterparties in the event of a downgrade to our current credit rating. The followingtable provides the additional collateral obligations required at the reporting date in the event of a one-, two- or three-notchdowngrade to our credit ratings. These additional collateral obligations are incremental requirements for each successive downgradeand do not represent the cumulative impact of multiple downgrades. The amounts reported change periodically as a result of severalfactors, including the transfer of trading activity to centrally cleared financial market infrastructures and exchanges, the expiration oftransactions with downgrade triggers, the imposition of internal limitations on new agreements to exclude downgrade triggers, as wellas normal course mark-to-market of positions with collateralized counterparties moving from a negative to a positive position. There isno outstanding senior debt issued in the market that contains rating triggers that would lead to early prepayment of principal.
Additional contractual obligations for rating downgrades
As at
January 31
2019October 31
2018
(Millions of Canadian dollars)One-notch
downgradeTwo-notch
downgradeThree-notchdowngrade
One-notchdowngrade
Two-notchdowngrade
Three-notchdowngrade
Contractual derivatives funding or margin requirements $ 179 $ 63 $ 150 $ 125 $ 45 $ 191Other contractual funding or margin requirements (1) 185 176 – 185 176 –
(1) Includes Guaranteed Investment Certificates (GICs) issued by our municipal markets business out of New York.
Liquidity Coverage Ratio (LCR)The LCR is a Basel III metric that measures the sufficiency of high-quality liquid assets (HQLA) available to meet liquidity needs over a30-day period in an acute stress scenario. The Basel Committee on Banking Supervision (BCBS) and OSFI regulatory minimumcoverage level for LCR is currently 100%.
OSFI requires Canadian banks to disclose the LCR using the standard Basel disclosure template and calculated using the averageof daily LCR positions during the quarter.

36 Royal Bank of Canada First Quarter 2019
Liquidity coverage ratio common disclosure template (1)
For the three months ended
January 31
2019October 31
2018
(Millions of Canadian dollars, except percentage amounts)Total unweighted
value (average) (2)Total weightedvalue (average)
Total unweightedvalue (average) (2)
Total weightedvalue (average)
High-quality liquid assetsTotal high-quality liquid assets (HQLA) n.a. $ 221,751 n.a. $ 212,818
Cash outflowsRetail deposits and deposits from small business customers, of which: $ 257,222 19,754 $ 252,514 19,398
Stable deposits (3) 85,262 2,558 83,611 2,508Less stable deposits 171,960 17,196 168,903 16,890
Unsecured wholesale funding, of which: 291,119 132,359 285,140 129,249Operational deposits (all counterparties) and deposits in networks of cooperative
banks (4) 127,648 30,410 126,889 30,276Non-operational deposits 141,227 79,705 136,572 77,294Unsecured debt 22,244 22,244 21,679 21,679
Secured wholesale funding n.a. 33,728 n.a. 29,837Additional requirements, of which: 269,708 80,563 260,417 79,668
Outflows related to derivative exposures and other collateral requirements 64,633 44,379 61,154 42,867Outflows related to loss of funding on debt products 4,532 4,532 6,232 6,232Credit and liquidity facilities 200,543 31,652 193,031 30,569
Other contractual funding obligations (5) 19,966 19,966 26,811 26,811Other contingent funding obligations (6) 427,209 7,601 420,344 7,557
Total cash outflows n.a. $ 293,971 n.a. $ 292,520
Cash inflowsSecured lending (e.g., reverse repos) $ 279,932 $ 54,853 $ 233,784 $ 49,183Inflows from fully performing exposures 13,697 9,631 14,345 10,156Other cash inflows 56,739 56,739 59,683 59,683
Total cash inflows n.a. $ 121,223 n.a. $ 119,022
Total adjustedvalue
Total adjustedvalue
Total HQLA $ 221,751 $ 212,818Total net cash outflows 172,748 173,498
Liquidity coverage ratio 128% 123%
(1) The LCR is calculated in accordance with OSFI’s LAR guideline, which, in turn, reflects liquidity-related requirements issued by the BCBS. The LCR for the quarter ended January 31, 2019 is calculatedas an average of 62 daily positions.
(2) With the exception of other contingent funding obligations, unweighted inflow and outflow amounts are items maturing or callable in 30 days or less. Other contingent funding obligations alsoinclude debt securities with remaining maturity greater than 30 days.
(3) As defined by the BCBS, stable deposits from retail and small business customers are deposits that are insured and are either held in transactional accounts or the bank has an establishedrelationship with the client making the withdrawal unlikely.
(4) Operational deposits from customers other than retail and small and medium-sized enterprises (SMEs), are deposits which clients need to keep with the bank in order to facilitate their access andability to use payment and settlement systems primarily for clearing, custody and cash management activities.
(5) Other contractual funding obligations primarily include outflows from unsettled securities trades and outflows from obligations related to securities sold short.(6) Other contingent funding obligations include outflows related to other off-balance sheet facilities that carry low LCR runoff factors (0% – 5%).n.a. not applicable
We manage our LCR position within a target range that reflects our liquidity risk tolerance and takes into account business mix, assetcomposition and funding capabilities. The range is subject to periodic review in light of changes to internal requirements and externaldevelopments.
We maintain HQLAs in major currencies with dependable market depth and breadth. Our treasury management practices ensurethat the levels of HQLA are actively managed to meet target LCR objectives. Our Level 1 assets, as calculated according to OSFI LARand the BCBS LCR requirements, represent 84% of total HQLA. These assets consist of cash, placements with central banks and highlyrated securities issued or guaranteed by governments, central banks and supranational entities.
LCR captures cash flows from on- and off-balance sheet activities that are either expected or could potentially occur within 30days in an acute stress scenario. Cash outflows result from the application of withdrawal and non-renewal factors to demand and termdeposits, differentiated by client type (wholesale, retail and small- and medium-sized enterprises). Cash outflows also arise frombusiness activities that create contingent funding and collateral requirements, such as repo funding, derivatives, short sales ofsecurities and the extension of credit and liquidity commitments to clients. Cash inflows arise primarily from maturing secured loans,interbank loans and non-HQLA securities.
LCR does not reflect any market funding capacity that we believe would be available in a stress situation. All maturing wholesaledebt is assigned 100% outflow in the LCR calculation.
Q1 2019 vs. Q4 2018The average LCR for the quarter ended January 31, 2019 was 128%, which translates into a surplus of approximately $49 billion,compared to 123% in the prior quarter. The increase in the LCR surplus from the previous quarter is primarily due to a change infunding and business mix.

Royal Bank of Canada First Quarter 2019 37
Contractual maturities of financial assets, financial liabilities and off-balance sheet itemsThe following tables provide remaining contractual maturity profiles of all our assets, liabilities, and off-balance sheet items at theircarrying value (e.g., amortized cost or fair value) at the balance sheet date. Off-balance sheet items are allocated based on the expirydate of the contract.
Details of contractual maturities and commitments to extend funds are a source of information for the management of liquidityrisk. Among other purposes, these details form a basis for modelling a behavioural balance sheet with effective maturities to calculateliquidity risk measures. For further details, refer to the Risk measurement section within the Liquidity and funding risk section of our2018 Annual Report.
As at January 31, 2019
(Millions of Canadian dollars)Less than 1
month1 to 3
months3 to 6
months6 to 9
months9 to 12
months1 year
to 2 years2 years
to 5 years5 years
and greater
With nospecific
maturity Total
AssetsCash and deposits with banks $ 76,344 $ 3 $ – $ – $ – $ – $ – $ – $ 2,339 $ 78,686Securities
Trading (1) 96,872 19 53 – 21 50 70 7,411 33,677 138,173Investment, net of applicable
allowance 1,868 3,935 3,110 2,556 2,530 13,199 29,140 40,827 494 97,659Assets purchased under reverse
repurchase agreements and securitiesborrowed 179,266 64,013 21,311 10,609 13,659 610 – – 8,192 297,660
Loans, net of applicable allowance 20,699 16,596 26,144 23,958 27,730 124,862 215,764 47,888 86,179 589,820Other
Customers’ liability under acceptances 11,152 5,605 17 – 2 5 – – (31) 16,750Derivatives 5,056 6,624 4,549 2,586 4,634 9,269 16,174 35,920 4 84,816Other financial assets 23,621 1,139 682 60 197 117 243 1,765 2,148 29,972
Total financial assets $ 414,878 $ 97,934 $ 55,866 $ 39,769 $ 48,773 $ 148,112 $ 261,391 $ 133,811 $ 133,002 $ 1,333,536Other non-financial assets 2,129 1,300 416 493 627 1,142 1,291 1,402 23,871 32,671
Total assets $ 417,007 $ 99,234 $ 56,282 $ 40,262 $ 49,400 $ 149,254 $ 262,682 $ 135,213 $ 156,873 $ 1,366,207
Liabilities and equityDeposits (2)
Unsecured borrowing $ 51,080 $ 46,688 $ 39,785 $ 36,807 $ 30,939 $ 38,178 $ 53,336 $ 14,950 $ 437,877 $ 749,640Secured borrowing 3,608 6,400 7,080 6,053 2,659 9,648 21,529 5,961 – 62,938Covered bonds – 2,599 1,509 3,004 – 11,988 17,331 3,555 – 39,986
OtherAcceptances 11,149 5,605 16 2 – 6 – – 3 16,781Obligations related to securities sold
short 33,242 – – – – – – – – 33,242Obligations related to assets sold
under repurchase agreements andsecurities loaned 183,875 29,749 2,892 159 – 496 – – 7,358 224,529
Derivatives 5,450 6,902 4,535 3,041 3,811 7,960 14,816 35,244 7 81,766Other financial liabilities 27,942 2,000 2,543 1,435 371 162 588 6,894 810 42,745
Subordinated debentures – – – 102 – – 317 8,836 – 9,255
Total financial liabilities $ 316,346 $ 99,943 $ 58,360 $ 50,603 $ 37,780 $ 68,438 $ 107,917 $ 75,440 $ 446,055 $ 1,260,882Other non-financial liabilities 1,156 847 191 902 1,957 643 768 10,043 8,168 24,675Equity – – – – – – – – 80,650 80,650
Total liabilities and equity $ 317,502 $100,790 $ 58,551 $ 51,505 $ 39,737 $ 69,081 $ 108,685 $ 85,483 $ 534,873 $ 1,366,207
Off-balance sheet itemsFinancial guarantees $ 291 $ 1,450 $ 2,598 $ 1,933 $ 3,074 $ 1,506 $ 4,764 $ 713 $ 51 $ 16,380Lease commitments 66 131 200 199 191 724 1,558 2,820 – 5,889Commitments to extend credit 1,372 5,036 8,245 10,037 15,554 35,718 172,094 14,821 209 263,086Other credit-related commitments 574 1,047 1,477 1,098 1,425 494 699 114 102,298 109,226Other commitments 23 – – – – – – – 527 550
Total off-balance sheet items $ 2,326 $ 7,664 $ 12,520 $ 13,267 $ 20,244 $ 38,442 $ 179,115 $ 18,468 $ 103,085 $ 395,131
(1) Trading debt securities classified as FVTPL have been included in the less than 1 month category as there is no expectation to hold these assets to their contractual maturity.(2) A major portion of relationship-based deposits are repayable on demand or at short notice on a contractual basis while, in practice, these customer balances form a core base for our operations and
liquidity needs, as explained in the preceding Deposit and funding profile section.

38 Royal Bank of Canada First Quarter 2019
As at October 31, 2018
(Millions of Canadian dollars)Less than 1
month1 to 3
months3 to 6
months6 to 9
months9 to 12
months1 year
to 2 years2 years
to 5 years5 years
and greater
With nospecific
maturity Total
AssetsCash and deposits with banks $ 64,201 $ 2 $ – $ – $ – $ – $ – $ – $ 2,477 $ 66,680Securities
Trading (1) 86,551 20 22 16 1 52 72 6,982 34,542 128,258Investment, net of applicable
allowance 3,529 6,855 1,419 2,593 2,399 12,989 25,061 39,396 367 94,608Assets purchased under reverse
repurchase agreements and securitiesborrowed 168,810 66,854 28,828 10,298 11,692 552 – – 7,568 294,602
Loans, net of applicable allowance 22,534 14,967 21,079 26,753 25,271 122,687 211,768 44,191 87,568 576,818Other
Customers’ liability under acceptances 10,774 4,788 94 1 – 5 – – (21) 15,641Derivatives 6,070 10,179 4,930 4,032 3,030 11,130 18,067 36,581 20 94,039Other financial assets 25,670 873 938 78 157 112 231 1,758 2,120 31,937
Total financial assets $ 388,139 $ 104,538 $ 57,310 $ 43,771 $ 42,550 $ 147,527 $ 255,199 $ 128,908 $ 134,641 $ 1,302,583Other non-financial assets 1,809 1,268 590 364 559 971 1,352 1,125 24,113 32,151
Total assets $ 389,948 $ 105,806 $ 57,900 $ 44,135 $ 43,109 $ 148,498 $ 256,551 $ 130,033 $ 158,754 $ 1,334,734
Liabilities and equityDeposits (2)
Unsecured borrowing $ 46,793 $ 33,849 $ 47,209 $ 30,511 $ 36,116 $ 34,641 $ 50,792 $ 15,693 $ 440,246 $ 735,850Secured borrowing 2,340 6,571 9,321 5,433 4,232 7,135 23,388 5,902 – 64,322Covered bonds – – 2,579 1,499 2,982 10,022 16,360 3,432 – 36,874
OtherAcceptances 10,775 4,787 94 1 – 5 – – – 15,662Obligations related to securities sold
short 32,247 – – – – – – – – 32,247Obligations related to assets sold
under repurchase agreements andsecurities loaned 146,205 44,248 9,030 91 – – – – 7,240 206,814
Derivatives 5,998 8,585 4,650 4,176 3,311 9,808 17,205 36,496 9 90,238Other financial liabilities 27,414 1,003 582 233 414 154 522 6,784 733 37,839
Subordinated debentures – – – – 103 – 318 8,710 – 9,131
Total financial liabilities $ 271,772 $ 99,043 $ 73,465 $ 41,944 $ 47,158 $ 61,765 $ 108,585 $ 77,017 $ 448,228 $ 1,228,977Other non-financial liabilities 992 5,095 346 183 157 765 868 9,449 7,947 25,802Equity – – – – – – – – 79,955 79,955
Total liabilities and equity $ 272,764 $ 104,138 $ 73,811 $ 42,127 $ 47,315 $ 62,530 $ 109,453 $ 86,466 $ 536,130 $ 1,334,734
Off-balance sheet itemsFinancial guarantees $ 532 $ 2,026 $ 1,647 $ 2,696 $ 1,337 $ 1,910 $ 4,179 $ 1,125 $ 50 $ 15,502Lease commitments 66 131 194 199 194 695 1,517 2,814 – 5,810Commitments to extend credit 4,122 3,417 8,736 9,667 11,406 33,030 168,071 23,899 269 262,617Other credit-related commitments 577 795 1,586 1,498 1,324 478 680 148 107,499 114,585Other commitments 141 – – – – – – – 556 697
Total off-balance sheet items $ 5,438 $ 6,369 $ 12,163 $ 14,060 $ 14,261 $ 36,113 $ 174,447 $ 27,986 $ 108,374 $ 399,211
(1) Trading debt securities classified as FVTPL have been included in the less than 1 month category as there is no expectation to hold these assets to their contractual maturity.(2) A major portion of relationship-based deposits are repayable on demand or at short notice on a contractual basis while, in practice, these customer balances form a core base for our operations and
liquidity needs, as explained in the preceding Deposit and funding profile section.
Capital management
We continue to manage our capital in accordance with our Capital Management Framework as described in our 2018 Annual Report. Inaddition, we continue to monitor and prepare for new regulatory capital developments, including the BCBS Basel III reforms, in orderto ensure timely and accurate compliance with these requirements. For additional details on new regulatory developments that relateto our Capital Management Framework, refer to the Capital, liquidity and other regulatory developments section of this Q1 2019Report to Shareholders.
OSFI expects Canadian banks to meet the Basel III targets for CET1, Tier 1 and Total capital ratios. Effective January 1, 2014, OSFIallowed Canadian banks to phase in the Basel III Credit Valuation Adjustment (CVA) risk capital charge over a five-year period endingDecember 31, 2018. As of January 1, 2019, the CVA scalars were fully phased-in for each tier of capital, resulting in all tiers of capitalhaving the same risk weighted assets value. In fiscal 2018, the CVA scalars were 80%, 83% and 86% for CET1, Tier 1 and Totalcapital, respectively.
The Financial Stability Board (FSB) has designated us as a Global Systemically Important Bank (G-SIB). This designation requiresus to maintain a higher loss absorbency requirement (common equity as a percentage of risk-weighted assets) of 1%. As the DomesticSystemically Important Bank (D-SIB) requirement is equivalent to the G-SIB requirement of 1% of RWA, the G-SIB designation had nofurther impact to the loss absorbency requirements on our CET1 ratio. We provide our G-SIB assessment indicators below.
On April 18, 2018, OSFI released its final guideline on Total Loss Absorbing Capacity (TLAC), which applies to Canadian D-SIBs aspart of the Federal Government’s Bail-in Regime. The guideline is consistent with the TLAC standard released on November 9, 2015, bythe FSB for institutions designated as G-SIBs, but tailored to the Canadian context. The TLAC requirement is intended to address thesufficiency of a systemically important banks loss absorbing capacity in supporting its recapitalization in the event of its failure. TLACis defined as the aggregate of Tier 1 capital, Tier 2 capital, and other TLAC instruments, which allow conversion in whole or in part intocommon shares under the Canada Deposit Insurance Corporation (CDIC) Act and meet all of the eligibility criteria under the guideline.

Royal Bank of Canada First Quarter 2019 39
TLAC requirements established two minimum standards, which are required to be met effective November 1, 2021: the risk-basedTLAC ratio, which builds on the risk-based capital ratios described in the Capital Adequacy Requirements (CAR) guideline, and theTLAC leverage ratio, which builds on the leverage ratio described in OSFI’s Leverage Requirements guideline. The risk-based TLAC ratiois defined as TLAC divided by Total risk-weighted assets (RWA) while the TLAC leverage ratio is defined as TLAC divided by theLeverage ratio exposure. OSFI has provided notification requiring systemically important banks to maintain a minimum TLAC ratio of23.25%, which includes the revised Domestic Stability Buffer (DSB) as noted below, and a TLAC leverage ratio of 6.75%. We beganissuing bail-in eligible debt in the fourth quarter of 2018 and this has contributed to improving our TLAC ratio. We expect our TLACratio to improve through normal course refinancing of maturing unsecured term debt.
Effective November 1, 2018, we are required to adopt OSFI’s revisions to the CAR guidelines relating to the securitizationframework and the standardized approach for measuring counterparty credit risk (SA-CCR).
For further details on regulatory developments, refer to the Capital, liquidity and other regulatory developments section of thisQ1 2019 Report to Shareholders.
The following table provides a summary of OSFI’s current regulatory target ratios under Basel III and Pillar 2 requirements. We are incompliance with all current capital and leverage requirements imposed by OSFI:
Basel IIICapital ratiosand leverage
OSFI regulatory target requirements for large banks under Basel III RBCcapital and
leverageratios as atJanuary 31,
2019
DomesticStabilityBuffer (3)
Minimum includingCapital Buffers,
D-SIB/G-SIBsurcharge and
Domestic StabilityBuffer
Minimum CapitalBuffers (1)
Minimumincluding
CapitalBuffers
D-SIB/G-SIBSurcharge (2)
Minimum includingCapital Buffers and
D-SIB/G-SIBsurcharge (2)
Common Equity Tier 1 > 4.5% 2.5% > 7.0% 1.0% > 8.0% 11.4% 1.5% > 9.5%Tier 1 capital > 6.0% 2.5% > 8.5% 1.0% > 9.5% 12.7% 1.5% > 11.0%Total capital > 8.0% 2.5% > 10.5% 1.0% > 11.5% 14.5% 1.5% > 13.0%Leverage ratio > 3.0% n.a. > 3.0% n.a. > 3.0% 4.3% n.a. > 3.0%
(1) The capital buffers include the capital conservation buffer and the countercyclical capital buffer as prescribed by OSFI.(2) A capital surcharge, equal to the higher of our D-SIB surcharge and the BCBS’s G-SIB surcharge, is applicable to risk-weighted capital.(3) Effective June 20, 2018, OSFI required the public disclosure of their Pillar 2 DSB. Effective April 30, 2019, OSFI has raised the level for the DSB to 1.75% of RWA.n.a. not applicable
The following table provides details on our regulatory capital, RWA, and capital and leverage ratios. Our capital position remainsstrong and our capital and leverage ratios remain well above OSFI regulatory targets.
As at
(Millions of Canadian dollars, except percentage amounts and as otherwise noted)
January 31
2019October 31
2018January 31
2018
Capital (1)
CET1 capital $ 57,963 $ 57,001 $ 51,145Tier 1 capital 64,341 63,279 57,925Total capital 73,758 72,494 66,984
Risk-weighted Assets (RWA) used in calculation of capital ratios (1), (2)
CET1 capital RWA $ 508,512 $ 495,528 $ 466,758Tier 1 capital RWA 508,512 495,993 466,758Total capital RWA 508,512 496,459 466,758
Total capital RWA consisting of: (1)
Credit risk $ 410,003 $ 401,534 $ 375,260Market risk 34,862 32,209 30,100Operational risk 63,647 62,716 60,119Regulatory floor adjustment (3) – – 1,279
Total capital RWA $ 508,512 $ 496,459 $ 466,758
Capital ratios and Leverage ratio (1)
CET1 ratio 11.4% 11.5% 11.0%Tier 1 capital ratio 12.7% 12.8% 12.4%Total capital ratio 14.5% 14.6% 14.4%Leverage ratio 4.3% 4.4% 4.2%Leverage ratio exposure (billions) $ 1,501.8 $ 1,450.8 $ 1,363.9
(1) Capital, RWA, and capital ratios are calculated using OSFI’s Capital Adequacy Requirements based on the Basel III framework. The Leverage ratio is calculated using OSFI LeverageRequirements Guideline based on the Basel III framework.
(2) In fiscal 2018, amounts included CVA scalars of 80%, 83% and 86%, respectively.(3) Since the introduction of Basel II in 2008, OSFI has prescribed a capital floor requirement for institutions that use the advanced internal ratings-based (AIRB) approach for credit risk.
Effective February 1, 2018, the minimum capital floor will be required if the capital requirement under the Basel III Standards, as specified by OSFI, is less than 75% of the RWA basedon the standardized Basel II approach. Prior to February 1, 2018, the threshold was 90% of the capital requirements as calculated under Basel I.

40 Royal Bank of Canada First Quarter 2019
Q1 2019 vs. Q4 2018
Continuity of CET1 ratio (Basel III)
11.5%
34 bps
(9) bps
(18) bps
(7) bps(4) bps (6) bps
11.4%
October 31, 2018 (1) Internalcapital
generation (2)
Higher RWA(excluding regulatory
changes and FX)
Regulatory changes Share repurchases Net FX impact Other January 31, 2019 (1)
(1) Represents rounded figures.(2) Internal capital generation of $1.7 billion which represents Net income available to shareholders, less common and preferred shares dividends.
Our CET1 ratio was 11.4%, down 10 bps from last quarter, mainly reflecting higher RWA due to business growth, regulatory changesrelating to the phase-out of the CVA scalars and revisions to the CAR guidelines, as noted previously, and share repurchases, partiallyoffset by internal capital generation.
CET1 capital RWA increased $13 billion, driven by business growth in wholesale and retail lending, and market risk portfolios.The impact of regulatory changes in the current quarter also contributed to the increase.
Our Tier 1 capital ratio of 12.7% was down 10 bps, reflecting the factors noted above under the CET1 ratio. Tier 1 capital ratio wasalso favourably impacted by net preferred share issuances.
Our Total capital ratio of 14.5% was down 10 bps, reflecting the factors noted above under the Tier 1 ratio.Our Leverage ratio of 4.3% was down 10 bps from last quarter, primarily due to growth in leverage ratio exposures, mainly in
loans and securities, regulatory changes, and share repurchases, partially offset by internal capital generation.
Selected capital management activityThe following table provides our selected capital management activity:
For the three months endedJanuary 31, 2019
(Millions of Canadian dollars, except number of shares)Issuance or
redemption dateNumber of
shares (000s) Amount
Tier 1 capitalCommon shares activity
Issued in connection with share-based compensation plans (1) 159 $ 11Purchased for cancellation (3,684) (45)
Issuance of preferred shares, Series BO (2) November 2, 2018 14,000 350Redemption of preferred shares, Series AD (2) November 24, 2018 (10,000) (250)
(1) Amounts include cash received for stock options exercised during the period and includes fair value adjustments to stock options.(2) For further details, refer to Note 9 of our Condensed Financial Statements.
On February 23, 2018, we announced a normal course issuer bid (NCIB) to purchase up to 30 million of our common shares. The NCIBcommenced on February 27, 2018 and will continue until February 26, 2019 or such earlier date as we complete the repurchase of allshares permitted under the bid. We determine the amount and timing of the purchases under the NCIB, subject to prior consultationwith OSFI. Purchases may be made through the TSX, the NYSE and other designated exchanges and alternative Canadian tradingsystems. The price paid for repurchased shares is at the prevailing market price at the time of acquisition.
For the three-months ended January 31, 2019, the total number of common shares repurchased and cancelled under our NCIBprogram was approximately 3.7 million. The total cost of the shares repurchased was $348 million.
Since the inception of the current NCIB, the total number of common shares repurchased and cancelled under our NCIB programwas approximately 9.7 million, at a cost of approximately $947 million.
On November 2, 2018, we issued 14 million Non-Cumulative 5-Year Rate Reset Preferred Shares Series BO at a price of $25 pershare.
On November 24, 2018, we redeemed all 10 million Non-Cumulative First Preferred Shares Series AD at a price of $25 per share.
We have also announced our intention to redeem all 2.4 million Non-Cumulative Floating Rate First Preferred Shares Series AK, all13.6 million Non-Cumulative 5-Year Rate Reset First Preferred Shares Series AJ, and all 12 million Non-Cumulative 5-Year Rate ResetFirst Preferred Shares Series AL, on February 24, 2019. The shares will be redeemed at a price of $25 per share.

Royal Bank of Canada First Quarter 2019 41
Selected share data
As at January 31, 2019
(Millions of Canadian dollars, except number of shares and as otherwise noted)Number of
shares (000s) Amount
Dividendsdeclared per
share
Common shares issued (1) 1,435,505 $ 17,601 $ 0.98Treasury shares – common shares (432) (36)
Common shares outstanding 1,435,073 $ 17,565
Stock options and awardsOutstanding 9,435Exercisable 4,589
First preferred shares issuedNon-cumulative Series W (2) 12,000 $ 300 $ 0.31Non-cumulative Series AA 12,000 300 0.28Non-cumulative Series AC 8,000 200 0.29Non-cumulative Series AE 10,000 250 0.28Non-cumulative Series AF 8,000 200 0.28Non-cumulative Series AG 10,000 250 0.28Non-cumulative Series AJ (3) 13,579 339 0.22Non-cumulative Series AK (3) 2,421 61 0.23Non-cumulative Series AL (3) 12,000 300 0.27Non-cumulative Series AZ (3), (4) 20,000 500 0.25Non-cumulative Series BB (3), (4) 20,000 500 0.24Non-cumulative Series BD (3), (4) 24,000 600 0.23Non-cumulative Series BF (3), (4) 12,000 300 0.23Non-cumulative Series BH (4) 6,000 150 0.31Non-cumulative Series BI (4) 6,000 150 0.31Non-cumulative Series BJ (4) 6,000 150 0.33Non-cumulative Series BK (3), (4) 29,000 725 0.34Non-cumulative Series BM (3), (4) 30,000 750 0.34Non-cumulative Series BO (3), (4) 14,000 350 0.37Non-cumulative Series C-2 (5) 20 31 US$ 16.88
Preferred shares issued 255,020 $ 6,406Treasury shares – preferred shares (6) 7 –
Preferred shares outstanding 255,027 $ 6,406
DividendsCommon $ 1,407Preferred 74
(1) For further details about our capital management activity, refer to Note 9 of our Condensed Financial Statements.(2) Effective February 24, 2010, we have the right to convert these shares into common shares at our option, subject to certain restrictions.(3) Dividend rate will reset every five years.(4) Non-viable contingent capital (NVCC) instruments.(5) Represents 815,400 depositary shares relating to preferred shares Series C-2. Each depositary share represents one-fortieth interest in a
share of Series C-2.(6) Positive amounts represent a short position in treasury shares.
As at February 15, 2019, the number of outstanding common shares were 1,435,383,084, net of treasury shares held of 207,046 andthe number of stock options and awards were 9,347,472.
NVCC provisions require the conversion of the capital instrument into a variable number of common shares in the event that OSFIdeems a bank to be non-viable or a federal or provincial government in Canada publicly announces that a bank has accepted oragreed to accept a capital injection. If a NVCC trigger event were to occur, our NVCC capital instruments, which are the preferredshares Series AZ, preferred shares Series BB, preferred shares Series BD, preferred shares Series BF, preferred shares Series BH,preferred shares Series BI, preferred shares Series BJ, preferred shares Series BK, preferred shares Series BM, preferred shares SeriesBO, subordinated debentures due on July 17, 2024, subordinated debentures due on September 29, 2026, subordinated debenturesdue on June 4, 2025, subordinated debentures due on January 20, 2026 and subordinated debentures due on January 27, 2026,would be converted into RBC common shares pursuant to an automatic conversion formula with a conversion price based on thegreater of: (i) a contractual floor price of $5.00, and (ii) the current market price of our common shares at the time of the trigger event(10-day weighted average). Based on a floor price of $5.00 and including an estimate for accrued dividends and interest, these NVCCcapital instruments would convert into a maximum of 2,820 million RBC common shares, in aggregate, which would represent adilution impact of 66.28% based on the number of RBC common shares outstanding as at January 31, 2019.

42 Royal Bank of Canada First Quarter 2019
Global systemically important banks (G-SIBs) 12 assessment indicators (1)
The BCBS and FSB use 12 indicators in the assessment methodology for determining the systemic importance of large global banks.As noted previously, we are designated as a G-SIB. The following table provides the 12 indicators used in the G-SIB assessment:
As at
(Millions of Canadian dollars)
October 31
2018October 31
2017
Cross-jurisdictional activity (2)
Cross-jurisdictional claims $ 612,292 $ 507,554Cross-jurisdictional liabilities 441,686 337,153
Size (3)
Total exposures as defined for use in the Basel III leverage ratio 1,467,438 1,331,641Interconnectedness (4)
Intra-financial system assets 126,112 144,688Intra-financial system liabilities 140,979 130,724Securities outstanding 353,591 351,781
Substitutability/financial institution infrastructure (5)
Payment activity 42,917,581 37,964,746Assets under custody 4,262,294 4,061,111Underwritten transactions in debt and equity markets 245,992 235,431
Complexity (6)
Notional amount of over-the-counter derivatives 17,467,923 12,937,404Trading and investment securities (7) (8) 55,855 53,781Level 3 assets 2,549 3,574
(1) The G-SIBs indicators are prepared based on the methodology prescribed in BCBS guidelines published in July 2013 and instructionsprovided by BCBS in January 2019. The indicators are based on regulatory scope of consolidation, which excludes RBC Insurancesubsidiaries. For our 2018 standalone G-SIB disclosure, please refer to our Regulatory Disclosures at rbc.com/investorrelations/.
(2) Represents a bank’s level of interaction outside its domestic jurisdiction.(3) Represents the total on- and off- balance sheet exposures of the bank determined as per the Basel III leverage ratio rules before regulatory
adjustments.(4) Represents transactions with other financial institutions.(5) Represents the extent to which the bank’s services could be substituted by other institutions.(6) Includes the level of complexity and volume of a bank’s trading activities represented through derivatives, trading securities,
investment securities and level 3 assets.(7) Effective November 1, 2017, investment securities represent debt and equity securities at FVOCI and debt securities at
amortized cost, net of the applicable allowance, under IFRS 9. Prior to November 1, 2017, investment securitiesrepresented available-for-sale securities and held-to-maturity securities, under IAS 39.
(8) Amounts have been revised from those previously presented.
Q4 2018 vs. Q4 2017During 2018, notional amounts for over-the-counter derivatives increased mainly due to higher trading activity on interest rate swapsand forward rate agreements. Total exposures as defined for use in the Basel III leverage ratio increased due to client activity in ourassets purchased under reverse repurchase agreements and securities borrowed, and volume growth in loans (net of allowance forloan losses). Other movements from the prior year primarily reflect normal changes in business activity and the impact of foreigncurrency translation.
Capital, liquidity, and other regulatory developments
Pillar 3 disclosure requirementsIn December 2018, the BCBS issued its third and final phase of the Pillar 3 disclosure requirements, Pillar 3 disclosure requirements –updated framework. This phase incorporates revisions and additions to the Pillar 3 framework arising from the finalization of theBasel III reforms in December 2017, such as additional disclosure requirements comparing RWA as determined by banks’ internalmodels against results based on the standardized approach, and new disclosure requirements on asset encumbrance and capitaldistribution constraints. The phase three requirements, together with the phase one and two disclosure requirements released inJanuary 2015 and March 2017, respectively, complete the Pillar 3 framework.
The phase one requirements were effective for us in the fourth quarter of 2018. At this time, OSFI has not yet released theimplementation date for the BCBS phase two and three disclosure requirements. We expect consultations to begin in mid-2019.
Minimum Capital Requirements for Market RiskOn January 19, 2019, the BCBS released its final standards on the Minimum capital requirement for market risk, which replaces anearlier version published in January 2016. The revisions refined the standardized approach framework, clarified the scope ofexposures subject to market risk capital requirements, revised the assessment process for evaluating the adequacy of internal riskmanagement models, and revised the requirements for identifying risk factors eligible for internal modelling. The BCBS expectsmember jurisdictions to implement these revisions by 2022. OSFI has not yet released their final guidance and expectedimplementation date.
Domestic Stability BufferIn December 2018, OSFI announced that the DSB will be increased from 1.5% to 1.75% of total RWA, effective April 30, 2019. Thischange arose from OSFI’s semi-annual review of the DSB, based on its ongoing monitoring of federally regulated financial institutionsas well as system-wide and industry developments. We do not anticipate any challenges in meeting this requirement by the effectivedate.
For a discussion on risk factors resulting from these and other regulatory developments which may affect our business and financialresults, refer to the Risk management – Top and emerging risks and Legal and regulatory environment risk sections of our 2018

Royal Bank of Canada First Quarter 2019 43
Annual Report and the Economic, market and regulatory review and outlook section of this Q1 2019 Report to Shareholders. Forfurther details on our framework and activities to manage risks, refer to the risk and Capital management sections of our 2018 AnnualReport and the Risk management and Capital management sections of this Q1 2019 Report to Shareholders.
Accounting and control matters
Summary of accounting policies and estimates
Our Condensed Financial Statements are presented in compliance with International Accounting Standard (IAS) 34 Interim FinancialReporting. Our significant accounting policies are described in Note 2 of our audited 2018 Annual Consolidated Financial Statementsand our Q1 2019 Condensed Financial Statements.
Changes in accounting policies and disclosures
Changes in accounting policiesDuring the first quarter, we adopted IFRS 15 Revenue from Contracts with Customers (IFRS 15). As permitted by the transitionprovisions of IFRS 15, we elected not to restate comparative period results; accordingly, all comparative period information prior toNovember 1, 2018 is presented in accordance with our previous accounting policies, as described in our 2018 Annual Report. As aresult of the adoption of IFRS 15, we adjusted our opening retained earnings as at November 1, 2018 to align the recognition ofcertain fees with the transfer of the performance obligations. Refer to Note 2 of our Condensed Financial Statements for details ofthese changes.
Future changes in accounting policies and disclosuresFuture changes in accounting policies and disclosures that are not yet effective for us are described in Note 2 of our audited 2018Annual Consolidated Financial Statements.
Controls and procedures
Disclosure controls and proceduresAs of January 31, 2019, management evaluated, under the supervision of and with the participation of the President and ChiefExecutive Officer and the Chief Financial Officer, the effectiveness of our disclosure controls and procedures as defined under rulesadopted by the U.S. SEC. Based on that evaluation, the President and Chief Executive Officer and the Chief Financial Officer concludedthat our disclosure controls and procedures were effective as of January 31, 2019.
Internal control over financial reportingNo changes were made in our internal control over financial reporting during the quarter ended January 31, 2019 that have materiallyaffected, or are reasonably likely to materially affect, our internal control over financial reporting.
Related party transactions
In the ordinary course of business, we provide normal banking services and operational services, and enter into other transactionswith associated and other related corporations, including our joint venture entities, on terms similar to those offered to non-relatedparties. We grant loans to directors, officers and other employees at rates normally accorded to preferred clients. In addition, we offerdeferred share and other plans to non-employee directors, executives and certain other key employees. For further information, referto Notes 11 and 26 of our audited 2018 Annual Consolidated Financial Statements.

44 Royal Bank of Canada First Quarter 2019
EDTF recommendations index
We aim to present transparent, high-quality risk disclosures by providing disclosures in our 2018 Annual Report, Q1 2019 Report toShareholders (RTS), Supplementary Financial Information package (SFI), and Pillar 3 Report, in accordance with recommendationsfrom the Financial Stability Board’s (FSB) Enhanced Disclosure Task Force (EDTF). Information within the SFI and Pillar 3 Report is notand should not be considered incorporated by reference into our Q1 2019 Report to Shareholders.
The following index summarizes our disclosure by EDTF recommendation:
Location of disclosure
Type of Risk Recommendation DisclosureRTS
pageAnnual
Report pageSFI
page
General
1 Table of contents for EDTF risk disclosure 44 112 12 Define risk terminology and measures 50, 52-55
213-214–
3 Top and emerging risks 50-51 –4 New regulatory ratios 38-39 91-93 –
Risk governance, riskmanagement andbusiness model
5 Risk management organization 50, 52-55 –6 Risk culture 52-55 –7 Risk in the context of our business activities 98 –8 Stress testing 53-54, 67 –
Capital adequacy andrisk-weightedassets (RWA)
9 Minimum Basel III capital ratios and Domesticsystemically important bank surcharge
39 91-93 –
10 Composition of capital and reconciliation of theaccounting balance sheet to the regulatorybalance sheet
– 20-23
11 Flow statement of the movements in regulatorycapital
– 24
12 Capital strategic planning 90-93 –13 RWA by business segments – 2614 Analysis of capital requirement, and related
measurement model information56-59 25,*
15 RWA credit risk and related risk measurements – *16 Movement of risk-weighted assets by risk type – 2617 Basel back-testing 53, 56-57 40
Liquidity 18 Quantitative and qualitative analysis of our liquidityreserve
31-32 73-75,79-80
–
Funding
19 Encumbered and unencumbered assets by balancesheet category, and contractual obligations forrating downgrades
32-33,35 75,78 –
20 Maturity analysis of consolidated total assets,liabilities and off-balance sheet commitmentsanalyzed by remaining contractual maturity at thebalance sheet date
37-38 80-81 –
21 Sources of funding and funding strategy 33-34 75-77 –
Market risk
22 Relationship between the market risk measures fortrading and non-trading portfolios and the balancesheet
30-31 71-72 –
23 Decomposition of market risk factors 27-30 67-70 –24 Market risk validation and back-testing 67 –25 Primary risk management techniques beyond
reported risk measures and parameters67-70 –
Credit risk
26 Bank’s credit risk profileQuantitative summary of aggregate credit risk
exposures that reconciles to the balance sheet
21-2758-61
56-66,159-165106-111
29-40,*
*27 Policies for identifying impaired loans 57-59,
101-102,123-126,128-129
–
28 Reconciliation of the opening and closing balancesof impaired loans and impairment allowancesduring the year
– 31,36
29 Quantification of gross notional exposure for OTCderivatives or exchange-traded derivatives
60 42
30 Credit risk mitigation, including collateral held for allsources of credit risk
59 39
Other 31 Other risk types 83-90 –32 Publicly known risk events 86-87,
202-203–
* These disclosure requirements are satisfied or partially satisfied by disclosures provided in our Pillar 3 Report for the quarter ended January 31, 2019 and for the year ended October 31, 2018.

Royal Bank of Canada First Quarter 2019 45
Interim Condensed Consolidated Financial Statements (unaudited)
Interim Condensed Consolidated Balance Sheets (unaudited)
As at
(Millions of Canadian dollars)
January 31
2019October 31
2018
AssetsCash and due from banks $ 40,033 $ 30,209
Interest-bearing deposits with banks 38,653 36,471
SecuritiesTrading 138,173 128,258Investment, net of applicable allowance (Note 4) 97,659 94,608
235,832 222,866
Assets purchased under reverse repurchase agreements and securities borrowed 297,660 294,602
Loans (Note 5)
Retail 401,767 399,452Wholesale 191,114 180,278
592,881 579,730Allowance for loan losses (Note 5) (3,061) (2,912)
589,820 576,818
Segregated fund net assets 1,443 1,368
OtherCustomers’ liability under acceptances 16,750 15,641Derivatives 84,816 94,039Premises and equipment 2,918 2,832Goodwill 11,149 11,137Other intangibles 4,711 4,687Other assets 42,422 44,064
162,766 172,400
Total assets $ 1,366,207 $ 1,334,734
Liabilities and equityDeposits (Note 6)
Personal $ 280,171 $ 270,154Business and government 540,234 534,371Bank 32,159 32,521
852,564 837,046
Segregated fund net liabilities 1,443 1,368
OtherAcceptances 16,781 15,662Obligations related to securities sold short 33,242 32,247Obligations related to assets sold under repurchase agreements and securities loaned 224,529 206,814Derivatives 81,766 90,238Insurance claims and policy benefit liabilities 10,512 10,000Other liabilities 55,465 52,273
422,295 407,234
Subordinated debentures 9,255 9,131
Total liabilities 1,285,557 1,254,779
Equity attributable to shareholdersPreferred shares (Note 9) 6,406 6,309Common shares (Note 9) 17,565 17,617Retained earnings 52,208 51,112Other components of equity 4,374 4,823
80,553 79,861Non-controlling interests 97 94
Total equity 80,650 79,955
Total liabilities and equity $ 1,366,207 $ 1,334,734
The accompanying notes are an integral part of these Interim Condensed Consolidated Financial Statements.
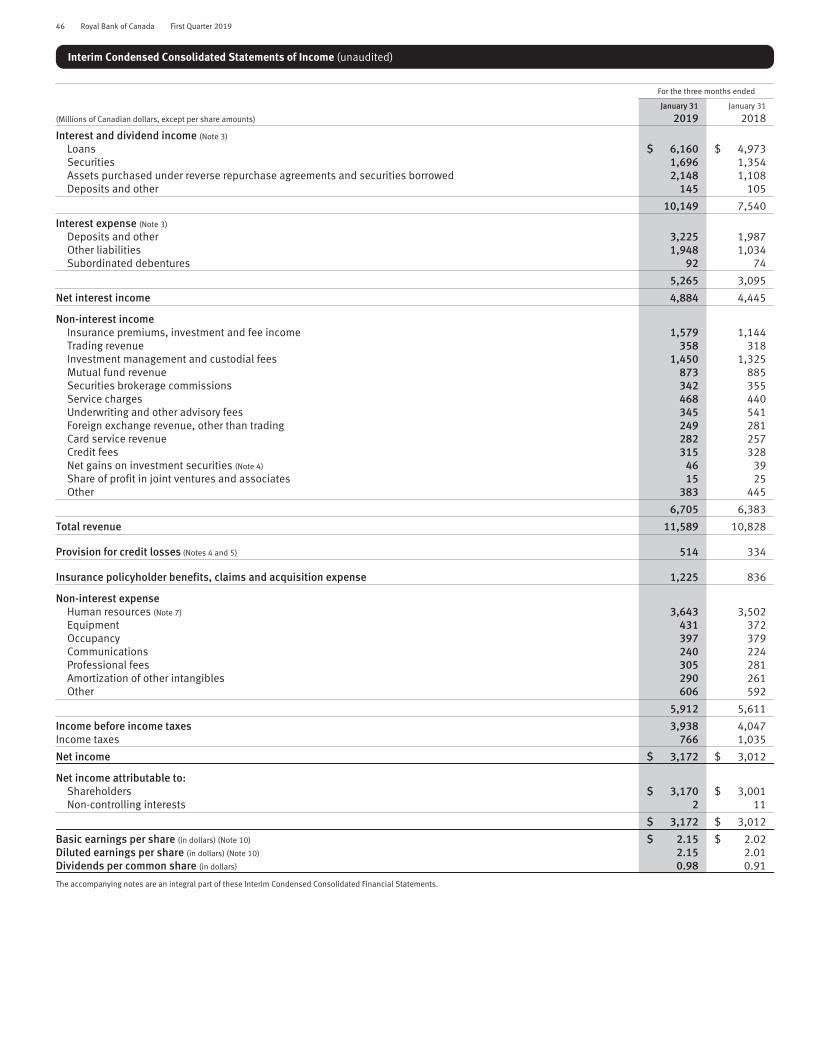
46 Royal Bank of Canada First Quarter 2019
Interim Condensed Consolidated Statements of Income (unaudited)
For the three months ended
January 31 January 31
(Millions of Canadian dollars, except per share amounts) 2019 2018
Interest and dividend income (Note 3)
Loans $ 6,160 $ 4,973Securities 1,696 1,354Assets purchased under reverse repurchase agreements and securities borrowed 2,148 1,108Deposits and other 145 105
10,149 7,540
Interest expense (Note 3)
Deposits and other 3,225 1,987Other liabilities 1,948 1,034Subordinated debentures 92 74
5,265 3,095
Net interest income 4,884 4,445
Non-interest incomeInsurance premiums, investment and fee income 1,579 1,144Trading revenue 358 318Investment management and custodial fees 1,450 1,325Mutual fund revenue 873 885Securities brokerage commissions 342 355Service charges 468 440Underwriting and other advisory fees 345 541Foreign exchange revenue, other than trading 249 281Card service revenue 282 257Credit fees 315 328Net gains on investment securities (Note 4) 46 39Share of profit in joint ventures and associates 15 25Other 383 445
6,705 6,383
Total revenue 11,589 10,828
Provision for credit losses (Notes 4 and 5) 514 334
Insurance policyholder benefits, claims and acquisition expense 1,225 836
Non-interest expenseHuman resources (Note 7) 3,643 3,502Equipment 431 372Occupancy 397 379Communications 240 224Professional fees 305 281Amortization of other intangibles 290 261Other 606 592
5,912 5,611
Income before income taxes 3,938 4,047Income taxes 766 1,035
Net income $ 3,172 $ 3,012
Net income attributable to:Shareholders $ 3,170 $ 3,001Non-controlling interests 2 11
$ 3,172 $ 3,012
Basic earnings per share (in dollars) (Note 10) $ 2.15 $ 2.02Diluted earnings per share (in dollars) (Note 10) 2.15 2.01Dividends per common share (in dollars) 0.98 0.91
The accompanying notes are an integral part of these Interim Condensed Consolidated Financial Statements.

Royal Bank of Canada First Quarter 2019 47
Interim Condensed Consolidated Statements of Comprehensive Income (unaudited)
For the three months ended
(Millions of Canadian dollars)
January 31
2019January 31
2018
Net income $ 3,172 $ 3,012
Other comprehensive income (loss), net of taxesItems that will be reclassified subsequently to income:
Net change in unrealized gains (losses) on debt securities and loans at fair value through other comprehensiveincomeNet unrealized gains (losses) on debt securities and loans at fair value through other comprehensive income (1) (24)Provision for credit losses recognized in income (1) 15Reclassification of net losses (gains) on debt securities and loans at fair value through other comprehensive
income to income (29) (28)
(31) (37)
Foreign currency translation adjustmentsUnrealized foreign currency translation gains (losses) 35 (2,006)Net foreign currency translation gains (losses) from hedging activities (66) 658Reclassification of losses (gains) on foreign currency translation to income 2 –Reclassification of losses (gains) on net investment hedging activities to income 2 –
(27) (1,348)
Net change in cash flow hedgesNet gains (losses) on derivatives designated as cash flow hedges (316) 424Reclassification of losses (gains) on derivatives designated as cash flow hedges to income (74) (153)
(390) 271
Items that will not be reclassified subsequently to income:Remeasurements of employee benefit plans (Note 7) (394) 49Net fair value change due to credit risk on financial liabilities designated as at fair value through profit or loss 163 (18)Net gains (losses) on equity securities designated at fair value through other comprehensive income 7 (2)
(224) 29
Total other comprehensive income (loss), net of taxes (672) (1,085)
Total comprehensive income (loss) $ 2,500 $ 1,927
Total comprehensive income attributable to:Shareholders $ 2,497 $ 1,919Non-controlling interests 3 8
$ 2,500 $ 1,927
The income tax effect on the Interim Condensed Consolidated Statements of Comprehensive Income is shown in the table below.
For the three months ended
(Millions of Canadian dollars)
January 31
2019January 31
2018
Income taxes on other comprehensive incomeNet unrealized gains (losses) on debt securities and loans at fair value through other comprehensive income $ (4) $ 42Provision for credit losses recognized in income – (4)Reclassification of net losses (gains) on debt securities and loans at fair value through other comprehensive income
to income (17) (15)Unrealized foreign currency translation gains (losses) 1 (5)Net foreign currency translation gains (losses) from hedging activities (24) 219Reclassification of losses (gains) on net investment hedging activities to income 1 –Net gains (losses) on derivatives designated as cash flow hedges (113) 183Reclassification of losses (gains) on derivatives designated as cash flow hedges to income (27) (86)Remeasurements of employee benefit plans (125) 20Net fair value change due to credit risk on financial liabilities designated as at fair value through profit or loss 59 (7)Net gains (losses) on equity securities designated at fair value through other comprehensive income (1) (1)
Total income tax expenses (recoveries) $ (250) $ 346
The accompanying notes are an integral part of these Interim Condensed Consolidated Financial Statements.

48 Royal Bank of Canada First Quarter 2019
Inte
rim
Cond
ense
dCo
nsol
idat
edS
tate
men
tsof
Chan
ges
inEq
uity
(una
udit
ed)
Fort
heth
ree
mon
ths
ende
dJa
nuar
y31
,201
9
Oth
erco
mpo
nent
sof
equi
ty
(Mill
ions
ofCa
nadi
ando
llars
)Pr
efer
red
shar
esCo
mm
onsh
ares
Trea
sury
shar
es–
pref
erre
d
Trea
sury
shar
es–
com
mon
Reta
ined
earn
ings
Avai
labl
e-fo
r-sa
lese
curi
ties
FVO
CIse
curi
ties
and
loan
s
Fore
ign
curr
ency
tran
slat
ion
Cash
flow
hedg
es
Tota
loth
erco
mpo
nent
sof
equi
ty
Equi
tyat
trib
utab
leto
shar
ehol
ders
Non
-con
trol
ling
inte
rest
sTo
tal
equi
ty
Bala
nce
atbe
ginn
ing
ofpe
riod
$6,
306
$17
,635
$3
$(1
8)$
51,1
12$
(12)
$4,
147
$68
8$
4,82
3$
79,8
61$
94$
79,9
55Tr
ansi
tion
adju
stm
ent (
Not
e2)
––
––
(70)
––
––
(70)
–(7
0)
Adju
sted
bala
nce
atbe
ginn
ing
ofpe
riod
$6,
306
$17
,635
$3
$(1
8)$
51,0
42$
(12)
$4,
147
$68
8$
4,82
3$
79,7
91$
94$
79,8
85Ch
ange
sin
equi
tyIs
sues
ofsh
are
capi
tal
350
11–
––
––
––
361
–36
1Co
mm
onsh
ares
purc
hase
dfo
rcan
cella
tion
–(4
5)–
–(3
03)
––
––
(348
)–
(348
)Re
dem
ptio
nof
pref
erre
dsh
ares
(250
)–
––
––
––
(250
)–
(250
)S
ales
oftr
easu
rysh
ares
––
821,
529
––
––
–1,
611
–1,
611
Purc
hase
sof
trea
sury
shar
es–
–(8
5)(1
,547
)–
––
––
(1,6
32)
–(1
,632
)S
hare
-bas
edco
mpe
nsat
ion
awar
ds–
––
–2
––
––
2–
2D
ivid
ends
onco
mm
onsh
ares
––
––
(1,4
07)
––
––
(1,4
07)
–(1
,407
)D
ivid
ends
onpr
efer
red
shar
esan
dot
her
––
––
(74)
––
––
(74)
–(7
4)O
ther
––
––
2–
––
–2
–2
Net
inco
me
––
––
3,17
0–
––
–3,
170
23,
172
Tota
loth
erco
mpr
ehen
sive
inco
me
(los
s),n
etof
taxe
s–
––
–(2
24)
(31)
(28)
(390
)(4
49)
(673
)1
(672
)
Bala
nce
aten
dof
peri
od$
6,40
6$
17,6
01$
–$
(36)
$52
,208
$(4
3)$
4,11
9$
298
$4,
374
$80
,553
$97
$80
,650
Fort
heth
ree
mon
ths
ende
dJa
nuar
y31
,201
8
Oth
erco
mpo
nent
sof
equi
ty
(Mill
ions
ofCa
nadi
ando
llars
)Pr
efer
red
shar
esCo
mm
onsh
ares
Trea
sury
shar
es–
pref
erre
d
Trea
sury
shar
es–
com
mon
Reta
ined
earn
ings
Ava
ilabl
e-fo
r-sa
lese
curi
ties
FVO
CIse
curi
ties
and
loan
s
Fore
ign
curr
ency
tran
slat
ion
Cash
flow
hedg
es
Tota
loth
erco
mpo
nent
sof
equi
ty
Equi
tyat
trib
utab
leto
shar
ehol
ders
Non
-con
trol
ling
inte
rest
sTo
tal
equi
ty
Bala
nce
atbe
ginn
ing
ofpe
riod
$6,
413
$17
,730
$–
$(2
7)$
45,3
59$
378
$3,
545
$43
1$
4,35
4$
73,8
29$
599
$74
,428
Tran
siti
onad
just
men
t–
––
–(5
58)
(378
)$
299
––
(79)
(637
)–
(637
)
Adju
sted
bala
nce
atbe
ginn
ing
ofpe
riod
$6,
413
$17
,730
$–
$(2
7)$
44,8
01$
–$
299
$3,
545
$43
1$
4,27
5$
73,1
92$
599
$73
,791
Chan
ges
ineq
uity
Issu
esof
shar
eca
pita
l–
30–
––
––
––
30–
30Co
mm
onsh
ares
purc
hase
dfo
rcan
cella
tion
–(1
13)
––
(810
)–
––
–(9
23)
–(9
23)
Rede
mpt
ion
ofpr
efer
red
shar
es(1
07)
––
–2
––
––
(105
)–
(105
)S
ales
oftr
easu
rysh
ares
––
691,
425
––
––
–1,
494
–1,
494
Purc
hase
sof
trea
sury
shar
es–
–(6
9)(1
,405
)–
––
––
(1,4
74)
–(1
,474
)S
hare
-bas
edco
mpe
nsat
ion
awar
ds–
––
–(3
)–
––
–(3
)–
(3)
Div
iden
dson
com
mon
shar
es–
––
–(1
,319
)–
––
–(1
,319
)–
(1,3
19)
Div
iden
dson
pref
erre
dsh
ares
and
othe
r–
––
–(7
2)–
––
–(7
2)(1
8)(9
0)O
ther
––
––
135
(138
)–
–(1
38)
(3)
(1)
(4)
Net
inco
me
––
––
3,00
1–
––
–3,
001
113,
012
Tota
loth
erco
mpr
ehen
sive
inco
me
(los
s),n
etof
taxe
s–
––
–29
(37)
(1,3
45)
271
(1,1
11)
(1,0
82)
(3)
(1,0
85)
Bala
nce
aten
dof
peri
od$
6,30
6$
17,6
47$
–$
(7)
$45
,764
$12
4$
2,20
0$
702
$3,
026
$72
,736
$58
8$
73,3
24
The
acco
mpa
nyin
gno
tes
are
anin
tegr
alpa
rtof
thes
eIn
teri
mCo
nden
sed
Cons
olid
ated
Fina
ncia
lSta
tem
ents
.

Royal Bank of Canada First Quarter 2019 49
Interim Condensed Consolidated Statements of Cash Flows (unaudited)
For the three months ended
(Millions of Canadian dollars)
January 31
2019January 31
2018
Cash flows from operating activitiesNet income $ 3,172 $ 3,012Adjustments for non-cash items and others
Provision for credit losses 514 334Depreciation 150 135Deferred income taxes (162) 271Amortization and impairment of other intangibles 293 261Net changes in investments in joint ventures and associates (15) (22)Losses (Gains) on investment securities (49) (43)
Adjustments for net changes in operating assets and liabilitiesInsurance claims and policy benefit liabilities 512 195Net change in accrued interest receivable and payable 86 (132)Current income taxes (159) (1,970)Derivative assets 9,223 (10,489)Derivative liabilities (8,472) 12,092Trading securities (9,915) 1,194Loans, net of securitizations (13,151) (3,579)Assets purchased under reverse repurchase agreements and securities borrowed (3,058) (38,789)Deposits, net of securitizations 15,518 10,414Obligations related to assets sold under repurchase agreements and securities loaned 17,715 40,235Obligations related to securities sold short 995 396Brokers and dealers receivable and payable (478) (166)Other (1,492) 1,225
Net cash from (used in) operating activities 11,227 14,574
Cash flows from investing activitiesChange in interest-bearing deposits with banks (2,182) (4,607)Proceeds from sale of investment securities 3,285 5,217Proceeds from maturity of investment securities 15,019 7,132Purchases of investment securities (20,668) (13,342)Net acquisitions of premises and equipment and other intangibles (561) (357)
Net cash from (used in) investing activities (5,107) (5,957)
Cash flows from financing activitiesIssue of common shares 9 23Common shares purchased for cancellation (348) (923)Issue of preferred shares 350 –Redemption of preferred shares (250) (105)Sales of treasury shares 1,611 1,494Purchases of treasury shares (1,632) (1,474)Dividends paid (1,483) (1,396)Dividends/distributions paid to non-controlling interests – (18)Change in short-term borrowings of subsidiaries 4,860 (1)
Net cash from (used in) financing activities 3,117 (2,400)
Effect of exchange rate changes on cash and due from banks 587 (136)
Net change in cash and due from banks 9,824 6,081Cash and due from banks at beginning of period (1) 30,209 28,407
Cash and due from banks at end of period (1) $ 40,033 $ 34,488
Cash flows from operating activities include:Amount of interest paid $ 4,748 $ 3,001Amount of interest received 9,660 7,255Amount of dividends received 493 410Amount of income taxes paid 791 3,118
(1) We are required to maintain balances with central banks and other regulatory authorities. The total balances were $2.3 billion as at January 31, 2019 (October 31, 2018 – $2.4 billion; January 31,2018 – $2.5 billion; October 31, 2017 – $2.3 billion).
The accompanying notes are an integral part of these Interim Condensed Consolidated Financial Statements.

50 Royal Bank of Canada First Quarter 2019
Note 1 General information
Our unaudited Interim Condensed Consolidated Financial Statements (Condensed Financial Statements) are presented in compliancewith International Accounting Standard (IAS) 34 Interim Financial Reporting. The Condensed Financial Statements do not include allthe information and disclosures required in the annual financial statements and should be read in conjunction with our audited 2018Annual Consolidated Financial Statements and the accompanying notes included on pages 113 to 211 in our 2018 Annual Report.Tabular information is stated in millions of Canadian dollars, except per share amounts and percentages. On February 21, 2019, theBoard of Directors authorized the Condensed Financial Statements for issue.
Note 2 Summary of significant accounting policies, estimates and judgments
Except as indicated below, the Condensed Financial Statements have been prepared using the same accounting policies andmethods used in preparation of our audited 2018 Annual Consolidated Financial Statements. Our significant accounting policies andfuture changes in accounting policies and disclosures that are not yet effective for us are described in Note 2 of our audited 2018Annual Consolidated Financial Statements.
Changes in accounting policiesDuring the first quarter, we adopted IFRS 15 Revenue from Contracts with Customers (IFRS 15). As permitted by the transitionprovisions of IFRS 15, we elected not to restate comparative period results; accordingly, all comparative period information ispresented in accordance with our previous accounting policies, as described in our 2018 Annual Report. As a result of the adoption ofIFRS 15, we reduced our opening retained earnings by $70 million, on an after tax basis as at November 1, 2018 (the date of initialapplication), to align the recognition of certain fees with the transfer of the performance obligations.
Commissions and feesCommission and fees primarily relate to Investment management and custodial fees, Mutual fund revenue, Securities brokeragecommissions, Services charges, Underwriting and other advisory fees, Card service revenue and Credit fees, and are recognized basedon the applicable service contracts with customers.
Investment management and custodial fees and Mutual fund revenue are generally calculated as a percentage of daily orperiod-end net asset values based on the terms of the contract with customers and are received monthly, quarterly, semi-annually orannually, depending on the terms of the contract. Investment management and custodial fees are generally derived from assets undermanagement (AUM) when our clients solicit the investment capabilities of an investment manager or from assets underadministration (AUA) where the investment strategy is directed by the client or a designated third party manager. Mutual fund revenueis derived from the daily net asset value (NAV) of the mutual funds. Investment management and custodial fees and Mutual fundrevenue are recognized over time when the service is provided to the customer provided that it is highly probable that a significantreversal in the amount of revenue recognized will not occur.
Commissions earned on Securities brokerage services and Service charges that are related to the provision of specific transactiontype services are recognized when the service is fulfilled. Where services are provided over time, revenue is recognized as the servicesare provided.
Underwriting and other advisory fees primarily relate to underwriting of new issuances of debt or equity and various advisoryservices. Underwriting fees are generally expressed as a percentage of the funds raised through issuance and are recognized whenthe service has been completed. Advisory fees vary depending on the scope and type of engagement and can be fixed in nature orcontingent on a future event. Advisory fees are recognized over the period in which the service is provided and are recognized only tothe extent that it is highly probable that a significant reversal in the amount of revenue will not occur.
Card service revenue primarily includes interchange revenue and annual card fees. Interchange revenue is calculated as a fixedpercentage of the transaction amount and recognized when the card transaction is settled. Annual card fees are fixed fees and arerecognized over a twelve month period.
Credit fees are primarily earned for arranging syndicated loans and making credit available on undrawn facilities. The timing ofthe recognition of credit fees varies based on the nature of the services provided.
When service fees and other costs are incurred in relation to commissions and fees earned, we record these costs on a grossbasis in either Non-interest expense – Other or Non-interest expense – Human resources based on our assessment of whether wehave primary responsibility to fulfill the contract with the customer and have discretion in establishing the price for the commissionsand fees earned, which may require judgment.

Royal Bank of Canada First Quarter 2019 51
Note 3 Fair value of financial instruments
Carrying value and fair value of financial instrumentsThe following tables provide a comparison of the carrying and fair values for each classification of financial instruments. Embeddedderivatives are presented on a combined basis with the host contracts. Refer to Note 2 and Note 3 of our audited 2018 AnnualConsolidated Financial Statements for a description of the valuation techniques and inputs used in the fair value measurement of ourfinancial instruments. There have been no significant changes to our determination of fair value during the quarter.
As at January 31, 2019
Carrying value and fair value Carrying value Fair value
(Millions of Canadian dollars)
Financialinstrumentsclassified as
FVTPL
Financialinstruments
designated asFVTPL
Financialinstrumentsclassified as
FVOCI
Financialinstruments
designated asFVOCI
Financialinstrumentsmeasured at
amortized cost
Financialinstrumentsmeasured at
amortized cost
Totalcarryingamount Total fair value
Financial assetsInterest-bearing deposits with banks $ – $ 22,856 $ – $ – $ 15,797 $ 15,797 $ 38,653 $ 38,653
SecuritiesTrading 130,542 7,631 – – – – 138,173 138,173Investment, net of applicable
allowance – – 51,366 529 45,764 45,546 97,659 97,441
130,542 7,631 51,366 529 45,764 45,546 235,832 235,614
Assets purchased under reverserepurchase agreements and securitiesborrowed 223,953 – – – 73,707 73,707 297,660 297,660
Loans, net of applicable allowanceRetail 118 194 95 – 399,325 397,339 399,732 397,746Wholesale 6,671 1,643 463 – 181,311 179,595 190,088 188,372
6,789 1,837 558 – 580,636 576,934 589,820 586,118
OtherDerivatives 84,816 – – – – – 84,816 84,816Other assets (1) 1,350 – – – 45,372 45,372 46,722 46,722
Financial liabilitiesDeposits
Personal $ 146 $ 15,088 $ 264,937 $ 264,491 $ 280,171 $ 279,725Business and government (2) 12 110,561 429,661 430,314 540,234 540,887Bank (3) – 5,942 26,217 26,256 32,159 32,198
158 131,591 720,815 721,061 852,564 852,810
OtherObligations related to securities
sold short 33,242 – – – 33,242 33,242Obligations related to assets sold
under repurchase agreements andsecurities loaned – 218,297 6,232 6,234 224,529 224,531
Derivatives 81,766 – – – 81,766 81,766Other liabilities (4) (1,113) 23 60,616 60,578 59,526 59,488
Subordinated debentures – – 9,255 9,416 9,255 9,416

52 Royal Bank of Canada First Quarter 2019
Note 3 Fair value of financial instruments (continued)
As at October 31, 2018
Carrying value and fair value Carrying value Fair value
(Millions of Canadian dollars)
Financialinstrumentsclassified as
FVTPL
Financialinstruments
designated asFVTPL
Financialinstrumentsclassified as
FVOCI
Financialinstruments
designated asFVOCI
Financialinstrumentsmeasured at
amortized cost
Financialinstrumentsmeasured at
amortized cost
Totalcarryingamount Total fair value
Financial assetsInterest-bearing deposits with banks $ – $ 20,274 $ – $ – $ 16,197 $ 16,197 $ 36,471 $ 36,471
SecuritiesTrading 121,031 7,227 – – – – 128,258 128,258Investment, net of applicable
allowance – – 48,093 406 46,109 45,367 94,608 93,866
121,031 7,227 48,093 406 46,109 45,367 222,866 222,124
Assets purchased under reverserepurchase agreements and securitiesborrowed 219,108 – – – 75,494 75,490 294,602 294,598
Loans, net of applicable allowanceRetail 69 190 94 – 397,102 394,051 397,455 394,404Wholesale 7,129 1,540 458 – 170,236 168,087 179,363 177,214
7,198 1,730 552 – 567,338 562,138 576,818 571,618
OtherDerivatives 94,039 – – – – – 94,039 94,039Other assets (1) 1,373 – – – 46,205 46,205 47,578 47,578
Financial liabilitiesDeposits
Personal $ 150 $ 14,602 $ 255,402 $ 255,115 $ 270,154 $ 269,867Business and government (2) (11) 103,446 430,936 431,158 534,371 534,593Bank (3) – 7,072 25,449 25,462 32,521 32,534
139 125,120 711,787 711,735 837,046 836,994
OtherObligations related to securities
sold short 32,247 – – – 32,247 32,247Obligations related to assets sold
under repurchase agreements andsecurities loaned – 201,839 4,975 4,976 206,814 206,815
Derivatives 90,238 – – – 90,238 90,238Other liabilities (4) (1,434) 18 54,917 54,880 53,501 53,464
Subordinated debentures – – 9,131 9,319 9,131 9,319
(1) Includes Customers’ liability under acceptances and financial instruments recognized in Other assets.(2) Business and government deposits include deposits from regulated deposit-taking institutions other than banks.(3) Bank deposits refer to deposits from regulated banks and central banks.(4) Includes Acceptances and financial instruments recognized in Other liabilities.
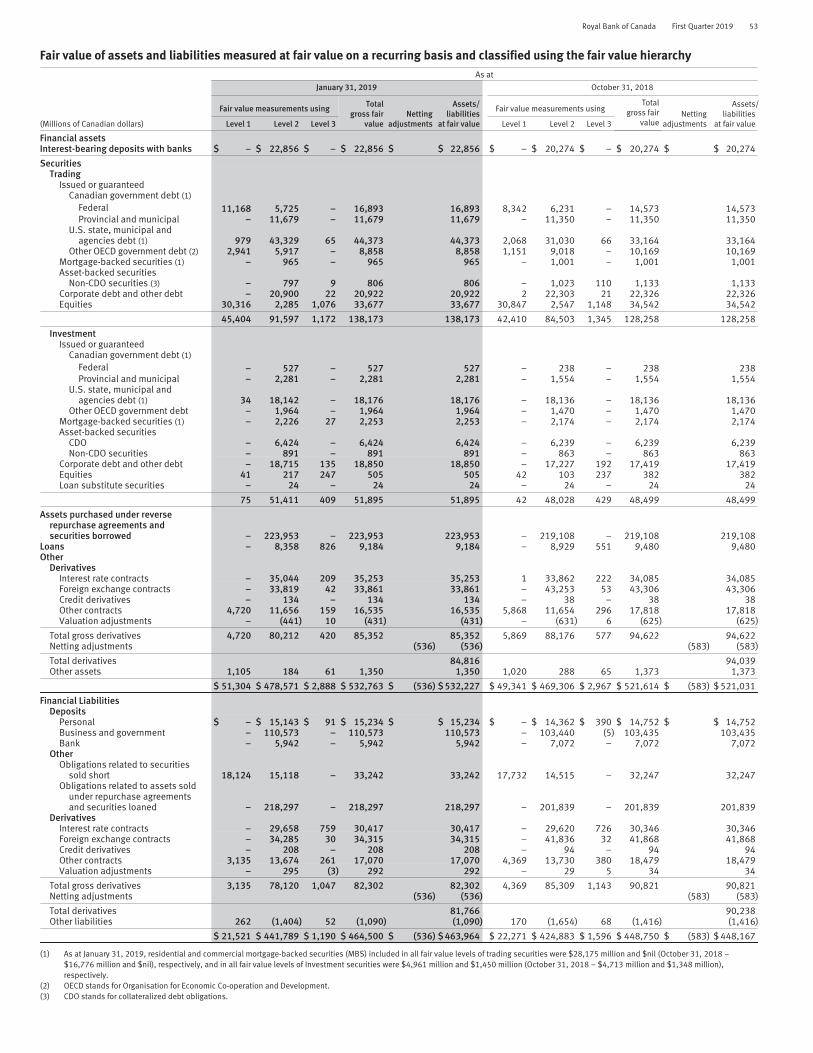
Royal Bank of Canada First Quarter 2019 53
Fair value of assets and liabilities measured at fair value on a recurring basis and classified using the fair value hierarchyAs at
January 31, 2019 October 31, 2018
Fair value measurements using Totalgross fair
valueNetting
adjustments
Assets/liabilities
at fair value
Fair value measurements usingTotal
gross fairvalue
Nettingadjustments
Assets/liabilities
at fair value(Millions of Canadian dollars) Level 1 Level 2 Level 3 Level 1 Level 2 Level 3
Financial assetsInterest-bearing deposits with banks $ – $ 22,856 $ – $ 22,856 $ $ 22,856 $ – $ 20,274 $ – $ 20,274 $ $ 20,274
SecuritiesTrading
Issued or guaranteedCanadian government debt (1)
Federal 11,168 5,725 – 16,893 16,893 8,342 6,231 – 14,573 14,573Provincial and municipal – 11,679 – 11,679 11,679 – 11,350 – 11,350 11,350
U.S. state, municipal andagencies debt (1) 979 43,329 65 44,373 44,373 2,068 31,030 66 33,164 33,164
Other OECD government debt (2) 2,941 5,917 – 8,858 8,858 1,151 9,018 – 10,169 10,169Mortgage-backed securities (1) – 965 – 965 965 – 1,001 – 1,001 1,001Asset-backed securities
Non-CDO securities (3) – 797 9 806 806 – 1,023 110 1,133 1,133Corporate debt and other debt – 20,900 22 20,922 20,922 2 22,303 21 22,326 22,326Equities 30,316 2,285 1,076 33,677 33,677 30,847 2,547 1,148 34,542 34,542
45,404 91,597 1,172 138,173 138,173 42,410 84,503 1,345 128,258 128,258
InvestmentIssued or guaranteed
Canadian government debt (1)
Federal – 527 – 527 527 – 238 – 238 238Provincial and municipal – 2,281 – 2,281 2,281 – 1,554 – 1,554 1,554
U.S. state, municipal andagencies debt (1) 34 18,142 – 18,176 18,176 – 18,136 – 18,136 18,136
Other OECD government debt – 1,964 – 1,964 1,964 – 1,470 – 1,470 1,470Mortgage-backed securities (1) – 2,226 27 2,253 2,253 – 2,174 – 2,174 2,174Asset-backed securities
CDO – 6,424 – 6,424 6,424 – 6,239 – 6,239 6,239Non-CDO securities – 891 – 891 891 – 863 – 863 863
Corporate debt and other debt – 18,715 135 18,850 18,850 – 17,227 192 17,419 17,419Equities 41 217 247 505 505 42 103 237 382 382Loan substitute securities – 24 – 24 24 – 24 – 24 24
75 51,411 409 51,895 51,895 42 48,028 429 48,499 48,499
Assets purchased under reverserepurchase agreements andsecurities borrowed – 223,953 – 223,953 223,953 – 219,108 – 219,108 219,108
Loans – 8,358 826 9,184 9,184 – 8,929 551 9,480 9,480Other
DerivativesInterest rate contracts – 35,044 209 35,253 35,253 1 33,862 222 34,085 34,085Foreign exchange contracts – 33,819 42 33,861 33,861 – 43,253 53 43,306 43,306Credit derivatives – 134 – 134 134 – 38 – 38 38Other contracts 4,720 11,656 159 16,535 16,535 5,868 11,654 296 17,818 17,818Valuation adjustments – (441) 10 (431) (431) – (631) 6 (625) (625)
Total gross derivatives 4,720 80,212 420 85,352 85,352 5,869 88,176 577 94,622 94,622Netting adjustments (536) (536) (583) (583)
Total derivatives 84,816 94,039Other assets 1,105 184 61 1,350 1,350 1,020 288 65 1,373 1,373
$ 51,304 $ 478,571 $ 2,888 $ 532,763 $ (536) $ 532,227 $ 49,341 $ 469,306 $ 2,967 $ 521,614 $ (583) $ 521,031
Financial LiabilitiesDeposits
Personal $ – $ 15,143 $ 91 $ 15,234 $ $ 15,234 $ – $ 14,362 $ 390 $ 14,752 $ $ 14,752Business and government – 110,573 – 110,573 110,573 – 103,440 (5) 103,435 103,435Bank – 5,942 – 5,942 5,942 – 7,072 – 7,072 7,072
OtherObligations related to securities
sold short 18,124 15,118 – 33,242 33,242 17,732 14,515 – 32,247 32,247Obligations related to assets sold
under repurchase agreementsand securities loaned – 218,297 – 218,297 218,297 – 201,839 – 201,839 201,839
DerivativesInterest rate contracts – 29,658 759 30,417 30,417 – 29,620 726 30,346 30,346Foreign exchange contracts – 34,285 30 34,315 34,315 – 41,836 32 41,868 41,868Credit derivatives – 208 – 208 208 – 94 – 94 94Other contracts 3,135 13,674 261 17,070 17,070 4,369 13,730 380 18,479 18,479Valuation adjustments – 295 (3) 292 292 – 29 5 34 34
Total gross derivatives 3,135 78,120 1,047 82,302 82,302 4,369 85,309 1,143 90,821 90,821Netting adjustments (536) (536) (583) (583)
Total derivatives 81,766 90,238Other liabilities 262 (1,404) 52 (1,090) (1,090) 170 (1,654) 68 (1,416) (1,416)
$ 21,521 $ 441,789 $ 1,190 $ 464,500 $ (536) $ 463,964 $ 22,271 $ 424,883 $ 1,596 $ 448,750 $ (583) $ 448,167
(1) As at January 31, 2019, residential and commercial mortgage-backed securities (MBS) included in all fair value levels of trading securities were $28,175 million and $nil (October 31, 2018 –$16,776 million and $nil), respectively, and in all fair value levels of Investment securities were $4,961 million and $1,450 million (October 31, 2018 – $4,713 million and $1,348 million),respectively.
(2) OECD stands for Organisation for Economic Co-operation and Development.(3) CDO stands for collateralized debt obligations.

54 Royal Bank of Canada First Quarter 2019
Note 3 Fair value of financial instruments (continued)
Quantitative information about fair value measurements using significant unobservable inputs (Level 3 Instruments)A financial instrument is classified as Level 3 in the fair value hierarchy if one or more of its unobservable inputs may significantlyaffect the measurement of its fair value. In preparing the financial statements, appropriate levels for these unobservable inputparameters are chosen so that they are consistent with prevailing market evidence or management judgment. Due to theunobservable nature of the prices or rates, there may be uncertainty about the valuation of these Level 3 financial instruments.
During the three months ended January 31, 2019, there were no significant changes made to the valuation techniques and rangesand weighted averages of unobservable inputs used in the determination of fair value of Level 3 financial instruments. As atJanuary 31, 2019, the impacts of adjusting one or more of the unobservable inputs by reasonably possible alternative assumptionsdid not change significantly from the impacts disclosed in our 2018 Annual Consolidated Financial Statements.
Changes in fair value measurement for instruments measured on a recurring basis and categorized in Level 3
For the three months ended January 31, 2019
(Millions of Canadian dollars)
Fair valueat beginning
of period
Totalrealized/
unrealizedgains (losses)
includedin earnings
Totalunrealized
gains (losses)included in
OCI (1)
Purchasesof assets/issuances
of liabilities
Sales ofassets/
settlementsof liabilities
and other (2)
Transfersinto
Level 3
Transfersout of
Level 3
Fair valueat end of
period
Changes inunrealized gains(losses) included
in earnings forassets and
liabilities forpositions still held
AssetsSecurities
TradingIssued or guaranteed
U.S. state, municipal andagencies debt $ 66 $ (1) $ – $ – $ – $ – $ – $ 65 $ –
Asset-backed securitiesNon-CDO securities 110 15 – – (116) – – 9 1
Corporate debt and other debt 21 1 – – – – – 22 –Equities 1,148 (18) – 80 (143) 9 – 1,076 (5)
1,345 (3) – 80 (259) 9 – 1,172 (4)
InvestmentMortgage-backed securities – – – 27 – – – 27 n.a.Corporate debt and other debt 192 (3) 2 – (56) – – 135 n.a.Equities 237 – 10 – – – – 247 n.a.Loan substitute securities – – – – – – – – n.a.
429 (3) 12 27 (56) – – 409 n.a.
Loans 551 17 1 264 (2) – (5) 826 16Other
Net derivative balances (3)
Interest rate contracts (504) (68) – – 40 2 (20) (550) (6)Foreign exchange contracts 21 (7) 6 2 – (1) (9) 12 (1)Credit derivatives – – – – – – – – –Other contracts (84) 45 – (9) (23) (17) (14) (102) 60Valuation adjustments 1 – – – 12 – – 13 –
Other assets 65 – – – (4) – – 61 –
$ 1,824 $ (19) $ 19 $ 364 $ (292) $ (7) $ (48) $ 1,841 $ 65
LiabilitiesDeposits
Personal $ (390) $ (30) $ (1) $ (9) $ 5 $ (18) $ 352 $ (91) $ 2Business and government 5 – – – – – (5) – –
OtherOther liabilities (68) – – – 16 – – (52) 1
$ (453) $ (30) $ (1) $ (9) $ 21 $ (18) $ 347 $ (143) $ 3

Royal Bank of Canada First Quarter 2019 55
For the three months ended January 31, 2018
(Millions of Canadian dollars)
Fair valueat beginning
of period
Totalrealized/
unrealizedgains (losses)
includedin earnings
Totalunrealized
gains (losses)included in
OCI (1)
Purchasesof assets/issuances
of liabilities
Sales ofassets/
settlementsof liabilities
and other (2)
Transfersinto
Level 3
Transfersout of
Level 3
Fair valueat end of
period
Changes inunrealized gains
(losses) includedin earnings for
assets andliabilities for
positions still held
AssetsSecurities
TradingIssued or guaranteed
U.S. state, municipal andagencies debt $ 508 $ 4 $ (13) $ – $ (312) $ – $ – $ 187 $ (5)
Asset-backed securitiesNon-CDO securities 196 12 (6) – (6) – – 196 10
Corporate debt and other debt 30 (1) – – – – – 29 (1)Equities 923 (68) (21) 179 (40) 4 (2) 975 (43)
1,657 (53) (40) 179 (358) 4 (2) 1,387 (39)
InvestmentMortgage-backed securities – – – – – – – – n.a.Corporate debt and other debt 29 (5) 4 – – – – 28 n.a.Equities 217 – 26 – 3 – – 246 n.a.Loan substitute securities 3 – – – – – – 3 n.a.
249 (5) 30 – 3 – – 277 n.a.
Loans 477 (1) (1) 50 (4) – – 521 (1)Other
Net derivative balances (3)
Interest rate contracts (455) 45 – 27 1 – (130) (512) 46Foreign exchange contracts 21 6 1 – 4 1 – 33 4Credit derivatives – – – – – – – – –Other contracts (181) 53 6 (30) (2) (34) 31 (157) 24Valuation adjustments (16) – – – 5 – – (11) –
Other assets – – – – – – – – –
$ 1,752 $ 45 $ (4) $ 226 $ (351) $ (29) $ (101) $ 1,538 $ 34
LiabilitiesDeposits
Personal $ (465) $ (31) $ 4 $ (149) $ 22 $ (52) $ 117 $ (554) $ (24)Business and government – – – – – – – – –
OtherOther liabilities (24) (1) 1 (5) 1 – – (28) –
$ (489) $ (32) $ 5 $ (154) $ 23 $ (52) $ 117 $ (582) $ (24)
(1) These amounts include the foreign currency translation gains or losses arising on consolidation of foreign subsidiaries relating to the Level 3 instruments, where applicable. The unrealized gains onInvestment securities recognized in OCI were $11 million for the three months ended January 31, 2019 (January 31, 2018 – gains of $32 million), excluding the translation gains or losses arising onconsolidation.
(2) Other includes amortization of premiums or discounts recognized in net income.(3) Net derivatives as at January 31, 2019 included derivative assets of $420 million (January 31, 2018 – $485 million) and derivative liabilities of $1,047 million (January 31, 2018 – $1,132 million).n.a. not applicable
Transfers between fair value hierarchy levels for instruments carried at fair value on a recurring basisTransfers between Level 1 and 2 are dependent on whether fair value is obtained on the basis of quoted market prices in activemarkets (Level 1).
During the three months ended January 31, 2019, transfers out of Level 1 to Level 2 included Trading U.S. state, municipal andagencies debt and Obligations related to securities sold short of $497 million and $172 million, respectively.
During the three months ended January 31, 2019 there were no transfers out of Level 2 to Level 1.Transfers between Level 2 and Level 3 are primarily due to either a change in the market observability for an input, or a change in
an unobservable input’s significance to a financial instrument’s fair value.During the three months ended January 31, 2019, significant transfers out of Level 3 to Level 2 include:• $8 million of OTC equity options in Other contracts, comprised of $203 million of derivative related assets and $195 million of
derivative related liabilities, due to a change in the market observability of inputs.• $352 million of Personal deposits, due to changes in the significance of the unobservable inputs and market observability of
inputs used to calculate fair values.

56 Royal Bank of Canada First Quarter 2019
Note 3 Fair value of financial instruments (continued)
Net interest income from financial instrumentsInterest and dividend income arising from financial assets and financial liabilities and the associated costs of funding are reported inNet interest income.
For the three months ended
(Millions of Canadian dollars)
January 31
2019January 31
2018
Interest income and dividend income (1), (2)
Financial instruments measured at fair value through profit or loss $ 2,794 $ 1,644Financial instruments measured at fair value through other comprehensive income 272 152Financial instruments measured at amortized cost 7,083 5,744
10,149 7,540
Interest expense (1)
Financial instruments measured at fair value through profit or loss $ 2,730 $ 1,410Financial instruments measured at amortized cost 2,535 1,685
5,265 3,095
Net interest income $ 4,884 $ 4,445
(1) Excludes the following amounts related to our insurance operations and included in Insurance premiums, investment and fee income in the Consolidated Statements of Income: Interest income of$129 million (January 31, 2018 – $124 million), and Interest expense of $1 million (January 31, 2018 – $2 million).
(2) Includes dividend income for the three months ended January 31, 2019 of $437 million (January 31, 2018 – $367 million), which is presented in Interest and dividend income in the CondensedConsolidated Statements of Income.
Note 4 Securities
Unrealized gains and losses on securities at FVOCI (1) (2)
As at
January 31, 2019 October 31, 2018
(Millions of Canadian dollars)
Cost/Amortized
cost
Grossunrealized
gains
Grossunrealized
losses Fair value
Cost/Amortized
cost
Grossunrealized
gains
Grossunrealized
losses Fair value
Issued or guaranteedCanadian government debt
Federal (3) $ 529 $ – $ (2) $ 527 $ 244 $ – $ (6) $ 238Provincial and municipal 2,282 10 (11) 2,281 1,578 2 (26) 1,554
U.S. state, municipal and agencies debt (3) 18,086 180 (90) 18,176 18,000 285 (149) 18,136Other OECD government debt 1,964 1 (1) 1,964 1,469 2 (1) 1,470
Mortgage-backed securities (3) 2,275 1 (23) 2,253 2,176 1 (3) 2,174Asset-backed securities
CDO 6,468 1 (45) 6,424 6,248 1 (10) 6,239Non-CDO securities 887 5 (1) 891 856 9 (2) 863
Corporate debt and other debt 18,856 26 (32) 18,850 17,439 22 (42) 17,419Equities 312 195 (2) 505 197 186 (1) 382Loan substitute securities 25 – (1) 24 25 – (1) 24
$ 51,684 $ 419 $ (208) $ 51,895 $ 48,232 $ 508 $ (241) $ 48,499
(1) Excludes $45,764 million of held-to-collect securities as at January 31, 2019 that are carried at amortized cost, net of allowance for credit losses (October 31, 2018 – $46,109 million).(2) Gross unrealized gains and losses includes $9 million of allowance for credit losses on debt securities at FVOCI as at January 31, 2019 (October 31, 2018 – $11 million) recognized in income and
Other components of equity.(3) The majority of the MBS are residential. Cost/Amortized cost, gross unrealized gains, gross unrealized losses and fair value related to commercial MBS are $1,467 million, $nil, $17 million and
$1,450 million, respectively as at January 31, 2019 (October 31, 2018 – $1,442 million, $nil, $6 million and $1,436 million, respectively).
Allowance for credit losses on investment securitiesThe following tables reconcile the opening and closing allowance for debt securities at FVOCI and amortized cost by stage. Reconcilingitems include the following:
• Transfers between stages, which are presumed to occur before any corresponding remeasurement of the allowance.• Purchases and originations, which reflect the allowance related to assets newly recognized during the period, including those
assets that were derecognized following a modification of terms.• Derecognitions and maturities, which reflect the allowance related to assets derecognized during the period without a credit
loss being incurred, including those assets that were derecognized following a modification of terms.• Remeasurements, which comprise the impact of changes in model inputs or assumptions, including changes in forward-
looking macroeconomic conditions; partial repayments; changes in the measurement following a transfer between stages; andunwinding of the time value discount due to the passage of time.

Royal Bank of Canada First Quarter 2019 57
Allowance for credit losses – securities at FVOCI (1)
For the three months ended
January 31, 2019 January 31, 2018
Performing Impaired Performing Impaired
(Millions of Canadian dollars) Stage 1 Stage 2 Stage 3 (2) Total Stage 1 Stage 2 Stage 3 Total
Balance at beginning of period $ 4 $ 7 $ – $ 11 $ 3 $ 22 $ – $ 25Provision for credit losses
Transfers in (out) to Stage 1 – – – – – – – –Transfers in (out) to Stage 2 – – – – – – – –Purchases and originations 2 – – 2 34 – – 34Derecognitions and maturities (1) (7) – (8) – (17) – (17)Remeasurements 1 – 3 4 – 2 – 2
Exchange rate and other – – – – – (2) – (2)
Balance at end of period $ 6 $ – $ 3 $ 9 $ 37 $ 5 $ – $ 42
(1) Expected credit losses on debt securities at FVOCI are not separately recognized on the balance sheet as the related securities are recorded at fair value. The cumulative amount of credit lossesrecognized in income is presented in Other components of equity.
(2) Stage 3 includes $3 million of allowance for credit losses on purchased credit impaired securities.
Allowance for credit losses – securities at amortized costFor the three months ended
January 31, 2019 January 31, 2018
Performing Impaired Performing Impaired
(Millions of Canadian dollars) Stage 1 Stage 2 Stage 3 Total Stage 1 Stage 2 Stage 3 Total
Balance at beginning of period $ 6 $ 32 $ – $ 38 $ 9 $ 45 $ – $ 54Provision for credit losses
Transfers in (out) to Stage 1 – – – – 3 (3) – –Transfers in (out) to Stage 2 – – – – (7) 7 – –Purchases and originations 1 – – 1 1 – – 1Derecognitions and maturities – – – – (1) (9) – (10)Remeasurements (1) (2) – (3) (1) (2) – (3)
Exchange rate and other – – – – – (3) – (3)
Balance at end of period $ 6 $ 30 $ – $ 36 $ 4 $ 35 $ – $ 39
Credit risk exposure by internal risk ratingThe following table presents the fair value of debt securities at FVOCI and gross carrying amount of securities at amortized cost. Riskratings are based on internal ratings as at the reporting date as outlined in the internal ratings maps in the Credit risk section of our2018 Annual Report.
As at
January 31, 2019 October 31, 2018
Performing Impaired Performing Impaired
(Millions of Canadian dollars) Stage 1 Stage 2 Stage 3 (1) Total Stage 1 Stage 2 Stage 3 (1) Total
Investment securitiesSecurities at FVOCIInvestment grade $ 50,640 $ 3 $ – $ 50,643 $ 46,956 $ 479 $ – $ 47,435Non-investment grade 594 1 – 595 500 33 – 533Impaired – – 127 127 – – 125 125
$ 51,234 $ 4 $ 127 $ 51,365 $ 47,456 $ 512 $ 125 $ 48,093Items not subject to impairment (2) 530 406
$ 51,895 $ 48,499
Securities at amortized costInvestment grade $ 44,454 $ 112 $ – $ 44,566 $ 44,958 $ 119 $ – $ 45,077Non-investment grade 549 685 – 1,234 367 703 – 1,070Impaired – – – – – – – –
$ 45,003 $ 797 $ – $ 45,800 $ 45,325 $ 822 $ – $ 46,147Allowance for credit losses 6 30 – 36 6 32 – 38
Amortized cost $ 44,997 $ 767 $ – $ 45,764 $ 45,319 $ 790 $ – $ 46,109
(1) Includes $127 million of purchased credit impaired securities (October 31, 2018 – $125 million).(2) Investment securities at FVOCI not subject to impairment represent equity securities designated as FVOCI.

58 Royal Bank of Canada First Quarter 2019
Note 5 Loans and allowance for credit losses
Allowance for credit lossesFor the three months ended
January 31, 2019 January 31, 2018
(Millions of Canadian dollars)
Balance atbeginning of
period
Provisionfor credit
lossesNet
write-offs
Exchangerate andother (1)
Balance atend of period
Balance atbeginning of
period
Provisionfor credit
lossesNet
write-offs
Exchangerate andother (1)
Balance atend of period
RetailResidential mortgages $ 382 $ 33 $ (4) $ (2) $ 409 $ 378 $ 13 $ (13) $ (15) $ 363Personal 895 123 (113) (13) 892 826 145 (102) (8) 861Credit cards 760 140 (120) – 780 693 98 (110) (1) 680Small business 51 6 (5) (1) 51 49 9 (7) (1) 50
Wholesale 979 204 (61) (12) 1,110 1,010 72 (18) (39) 1,025Customers’ liability under
acceptances 21 10 – – 31 20 (3) – (1) 16
$ 3,088 $ 516 $ (303) $ (28) $ 3,273 $ 2,976 $ 334 $ (250) $ (65) $ 2,995
Presented as:Allowance for loan losses $ 2,912 $ 3,061 $ 2,749 $ 2,776Other liabilities – Provisions 154 180 207 202Customers’ liability under
acceptances 21 31 20 16Other components of equity 1 1 – 1
(1) Includes interest income on impaired loans of $21 million for the three months ended January 31, 2019 (January 31, 2018 – $17 million).
The following table reconciles the opening and closing allowance for loans and commitments, by stage, for each major productcategory.
Reconciling items include the following:• Transfers between stages, which are presumed to occur before any corresponding remeasurements of the allowance.• Purchases and originations, which reflect the allowance related to assets newly recognized during the period, including those
assets that were derecognized following a modification of terms.• Derecognitions and maturities, which reflect the allowance related to assets derecognized during the period without a credit
loss being incurred, including those assets that were derecognized following a modification of terms.• Remeasurements, which comprise the impact of changes in model inputs or assumptions, including changes in forward-
looking macroeconomic conditions; partial repayments and additional draws on existing facilities; changes in themeasurement following a transfer between stages; and unwinding of the time value discount due to the passage of time inStage 1 and Stage 2.

Royal Bank of Canada First Quarter 2019 59
Allowance for credit losses – Retail and wholesale loansFor the three months ended
January 31, 2019 January 31, 2018
Performing Impaired Performing Impaired
(Millions of Canadian dollars) Stage 1 Stage 2 Stage 3 Total Stage 1 Stage 2 Stage 3 Total
Residential mortgagesBalance at beginning of period $ 142 $ 64 $ 176 $ 382 $ 140 $ 65 $ 173 $ 378Provision for credit losses
Transfers in (out) to Stage 1 8 (8) – – 22 (22) – –Transfers in (out) to Stage 2 (3) 4 (1) – (5) 5 – –Transfers in (out) to Stage 3 (1) (8) 9 – – (3) 3 –Purchases and originations 13 – – 13 16 – – 16Derecognitions and maturities (3) (2) – (5) (3) (3) – (6)Remeasurements (18) 30 13 25 (36) 27 12 3
Write-offs – – (5) (5) – – (14) (14)Recoveries – – 1 1 – – 1 1Exchange rate and other – (1) (1) (2) (4) (2) (9) (15)
Balance at end of period $ 138 $ 79 $ 192 $ 409 $ 130 $ 67 $ 166 $ 363
PersonalBalance at beginning of period $ 242 $ 512 $ 141 $ 895 $ 278 $ 427 $ 121 $ 826Provision for credit losses
Transfers in (out) to Stage 1 132 (132) – – 204 (204) – –Transfers in (out) to Stage 2 (23) 23 – – (42) 42 – –Transfers in (out) to Stage 3 – (44) 44 – – (43) 43 –Purchases and originations 23 – – 23 26 2 – 28Derecognitions and maturities (7) (30) – (37) (9) (35) – (44)Remeasurements (132) 190 79 137 (180) 271 70 161
Write-offs – – (144) (144) – – (129) (129)Recoveries – – 31 31 – – 27 27Exchange rate and other – – (13) (13) (2) (1) (5) (8)
Balance at end of period $ 235 $ 519 $ 138 $ 892 $ 275 $ 459 $ 127 $ 861
Credit cardsBalance at beginning of period $ 161 $ 599 $ – $ 760 $ 251 $ 442 $ – $ 693Provision for credit losses
Transfers in (out) to Stage 1 110 (110) – – 228 (228) – –Transfers in (out) to Stage 2 (19) 19 – – (40) 40 – –Transfers in (out) to Stage 3 – (80) 80 – – (37) 37 –Purchases and originations 1 – – 1 3 1 – 4Derecognitions and maturities (1) (6) – (7) (4) (30) – (34)Remeasurements (84) 190 40 146 (224) 279 73 128
Write-offs – – (153) (153) – – (142) (142)Recoveries – – 33 33 – – 32 32Exchange rate and other – – – – (2) 1 – (1)
Balance at end of period $ 168 $ 612 $ – $ 780 $ 212 $ 468 $ – $ 680
Small businessBalance at beginning of period $ 17 $ 16 $ 18 $ 51 $ 15 $ 15 $ 19 $ 49Provision for credit losses
Transfers in (out) to Stage 1 5 (5) – – 8 (8) – –Transfers in (out) to Stage 2 (1) 1 – – (2) 2 – –Transfers in (out) to Stage 3 – (3) 3 – – (3) 3 –Purchases and originations 3 – – 3 3 – – 3Derecognitions and maturities (1) (2) – (3) (1) (2) – (3)Remeasurements (7) 11 2 6 (7) 12 4 9
Write-offs – – (7) (7) – – (9) (9)Recoveries – – 2 2 – – 2 2Exchange rate and other – – (1) (1) 1 (1) (1) (1)
Balance at end of period $ 16 $ 18 $ 17 $ 51 $ 17 $ 15 $ 18 $ 50
WholesaleBalance at beginning of period $ 274 $ 340 $ 365 $ 979 $ 251 $ 352 $ 407 $ 1,010Provision for credit losses
Transfers in (out) to Stage 1 24 (24) – – 58 (58) – –Transfers in (out) to Stage 2 (9) 11 (2) – (35) 35 – –Transfers in (out) to Stage 3 (1) (16) 17 – – (6) 6 –Purchases and originations 68 10 – 78 52 8 – 60Derecognitions and maturities (43) (43) – (86) (41) (52) – (93)Remeasurements (11) 84 139 212 (32) 63 74 105
Write-offs – – (68) (68) – – (27) (27)Recoveries – – 7 7 – – 9 9Exchange rate and other (1) (1) (10) (12) (4) (8) (27) (39)
Balance at end of period $ 301 $ 361 $ 448 $ 1,110 $ 249 $ 334 $ 442 $ 1,025

60 Royal Bank of Canada First Quarter 2019
Note 5 Loans and allowance for credit losses (continued)
Credit risk exposure by internal risk ratingThe following table presents the gross carrying amount of loans measured at amortized cost, and the full contractual amount ofundrawn loan commitments subject to the impairment requirements of IFRS 9. Risk ratings are based on internal ratings as at thereporting date as outlined in the internal ratings maps for Wholesale and Retail facilities in the Credit risk section of our 2018 AnnualReport.
As at
January 31, 2019 October 31, 2018
(Millions of Canadian dollars) Stage 1 Stage 2 Stage 3 Total Stage 1 Stage 2 Stage 3 Total
RetailLoans outstanding – Residential
mortgagesLow risk $ 224,589 $ 4,523 $ – $ 229,112 $ 222,026 $ 3,688 $ – $ 225,714Medium risk 13,229 1,455 – 14,684 13,681 1,369 – 15,050High risk 2,559 2,836 – 5,395 2,577 2,897 – 5,474Not rated 35,451 604 – 36,055 34,670 578 – 35,248Impaired – – 754 754 – – 726 726
275,828 9,418 754 286,000 272,954 8,532 726 282,212
Items not subject to impairment (1) 312 259
Total 286,312 282,471
Loans outstanding – PersonalLow risk $ 70,837 $ 1,383 $ – $ 72,220 $ 71,763 $ 1,256 $ – $ 73,019Medium risk 6,002 2,107 – 8,109 6,124 1,925 – 8,049High risk 945 1,641 – 2,586 998 1,672 – 2,670Not rated 8,041 70 – 8,111 8,595 64 – 8,659Impaired – – 310 310 – – 303 303
Total 85,825 5,201 310 91,336 87,480 4,917 303 92,700
Loans outstanding – Credit cardsLow risk $ 13,030 $ 102 $ – $ 13,132 $ 13,185 $ 100 $ – $ 13,285Medium risk 2,124 1,621 – 3,745 2,234 1,632 – 3,866High risk 131 1,293 – 1,424 139 1,331 – 1,470Not rated 833 31 – 864 764 30 – 794
Total 16,118 3,047 – 19,165 16,322 3,093 – 19,415
Loans outstanding – Small businessLow risk $ 2,147 $ 29 $ – $ 2,176 $ 2,004 $ 46 $ – $ 2,050Medium risk 2,180 99 – 2,279 2,230 102 – 2,332High risk 88 188 – 276 95 178 – 273Not rated 176 1 – 177 166 1 – 167Impaired – – 46 46 – – 44 44
Total 4,591 317 46 4,954 4,495 327 44 4,866
Undrawn loan commitments – RetailLow risk $ 186,385 $ 1,474 $ – $ 187,859 $ 182,426 $ 1,270 $ – $ 183,696Medium risk 9,791 244 – 10,035 10,794 239 – 11,033High risk 3,745 158 – 3,903 3,740 166 – 3,906Not rated 2,473 36 – 2,509 2,584 35 – 2,619
Total 202,394 1,912 – 204,306 199,544 1,710 – 201,254
WholesaleLoans outstandingInvestment grade $ 52,494 $ 201 $ – $ 52,695 $ 46,869 $ 324 $ – $ 47,193Non-investment grade 109,104 12,015 – 121,119 106,027 10,190 – 116,217Not rated 6,928 411 – 7,339 6,692 411 – 7,103Impaired – – 1,647 1,647 – – 1,096 1,096
168,526 12,627 1,647 182,800 159,588 10,925 1,096 171,609
Items not subject to impairment (1) 8,314 8,669
Total 191,114 180,278
Undrawn loan commitments –Wholesale
Investment grade $ 227,610 $ 2 $ – $ 227,612 $ 222,970 $ 93 $ – $ 223,063Non-investment grade 90,067 8,110 – 98,177 88,828 7,069 – 95,897Not rated 4,764 – – 4,764 4,291 – – 4,291
Total 322,441 8,112 – 330,553 316,089 7,162 – 323,251
(1) Retail loans outstanding – Residential mortgages and Wholesale loans outstanding items not subject to impairment are loans held at FVTPL.

Royal Bank of Canada First Quarter 2019 61
Loans past due but not impaired (1)
As at
January 31, 2019 October 31, 2018
(Millions of Canadian dollars) 1 to 29 days 30 to 89 days90 days
and greater Total 1 to 29 days 30 to 89 days90 days
and greater Total
Retail $ 2,992 $ 1,403 $ 174 $ 4,569 $ 2,995 $ 1,402 $ 179 $ 4,576Wholesale 1,562 485 – 2,047 1,246 468 – 1,714
$ 4,554 $ 1,888 $ 174 $ 6,616 $ 4,241 $ 1,870 $ 179 $ 6,290
(1) Amounts presented may include loans past due as a result of administrative processes, such as mortgage loans on which payments are restrained pending payout due to sale or refinancing. Pastdue loans arising from administrative processes are not representative of the borrowers’ ability to meet their payment obligations.
Note 6 Deposits
As at
January 31, 2019 October 31, 2018
(Millions of Canadian dollars) Demand (1) Notice (2) Term (3) Total Demand (1) Notice (2) Term (3) Total
Personal $ 138,660 $ 49,566 $ 91,945 $ 280,171 $ 135,101 $ 48,873 $ 86,180 $ 270,154Business and government 233,044 8,416 298,774 540,234 238,617 8,606 287,148 534,371Bank 8,019 172 23,968 32,159 8,750 299 23,472 32,521
$ 379,723 $ 58,154 $ 414,687 $ 852,564 $ 382,468 $ 57,778 $ 396,800 $ 837,046
Non-interest-bearing (4)
Canada $ 88,807 $ 5,058 $ – $ 93,865 $ 88,119 $ 5,086 $ – $ 93,205United States 30,411 – – 30,411 34,098 – – 34,098Europe (5) 582 – – 582 564 – – 564Other International 5,595 5 – 5,600 5,495 5 – 5,500
Interest-bearing (4)
Canada 215,335 15,229 311,520 542,084 213,747 15,112 292,641 521,500United States 2,510 33,430 63,170 99,110 2,478 33,099 67,211 102,788Europe (5) 31,089 1,168 27,597 59,854 32,930 1,412 26,598 60,940Other International 5,394 3,264 12,400 21,058 5,037 3,064 10,350 18,451
$ 379,723 $ 58,154 $ 414,687 $ 852,564 $ 382,468 $ 57,778 $ 396,800 $ 837,046
(1) Demand deposits are deposits for which we do not have the right to require notice of withdrawal, which includes both savings and chequing accounts.(2) Notice deposits are deposits for which we can legally require notice of withdrawal. These deposits are primarily savings accounts.(3) Term deposits are deposits payable on a fixed date, and include term deposits, guaranteed investment certificates and similar instruments.(4) The geographical splits of the deposits are based on the point of origin of the deposits and where the revenue is recognized. As at January 31, 2019, deposits denominated in U.S. dollars, British
pounds, Euro and other foreign currencies were $315 billion, $21 billion, $42 billion and $32 billion, respectively (October 31, 2018 – $309 billion, $20 billion, $38 billion and $32 billion,respectively).
(5) Europe includes the United Kingdom, Luxembourg, the Channel Islands, France and Italy.

62 Royal Bank of Canada First Quarter 2019
Note 6 Deposits (continued)
Contractual maturities of term depositsAs at
(Millions of Canadian dollars)
January 31
2019October 31
2018
Within 1 year:less than 3 months $ 110,375 $ 89,5533 to 6 months 48,374 59,1096 to 12 months 79,462 80,773
1 to 2 years 59,814 51,7982 to 3 years 42,381 45,5503 to 4 years 26,131 21,1274 to 5 years 23,684 23,863Over 5 years 24,466 25,027
$ 414,687 $ 396,800
Aggregate amount of term deposits in denominations of one hundred thousand dollars or more (1) $ 378,000 $ 362,000(1) Amounts have been revised from those previously presented.
Note 7 Employee benefits – Pension and other post-employment benefits
We offer a number of defined benefit and defined contribution plans which provide pension and post-employment benefits to eligibleemployees. The following tables present the composition of our pension and other post-employment benefit expense and the effectsof remeasurements recorded in other comprehensive income.
Pension and other post-employment benefit expenseFor the three months ended
Pension plans Other post-employment benefit plans
(Millions of Canadian dollars)
January 31
2019January 31
2018January 31
2019January 31
2018
Current service costs $ 74 $ 89 $ 10 $ 10Net interest expense (income) (5) 2 16 16Remeasurements of other long term benefits – – 2 –Administrative expense 4 4 – –
Defined benefit pension expense $ 73 $ 95 $ 28 $ 26Defined contribution pension expense 61 52 – –
$ 134 $ 147 $ 28 $ 26
Pension and other post-employment benefit remeasurements (1)
For the three months ended
Defined benefit pension plans Other post-employment benefit plans
(Millions of Canadian dollars)
January 31
2019January 31
2018January 31
2019January 31
2018
Actuarial (gains) losses:Changes in financial assumptions $ 607 $ 18 $ 57 $ –Experience adjustments – – (1) (2)
Return on plan assets (excluding interest based on discount rate) (144) (85) – –
$ 463 $ (67) $ 56 $ (2)
(1) Market based assumptions, including Changes in financial assumptions and Return on plan assets, are reviewed on a quarterly basis. All other assumptions are updated during our annual review ofplan assumptions.

Royal Bank of Canada First Quarter 2019 63
Note 8 Income taxes
Tax examinations and assessmentsDuring the first quarter, we received reassessments from the Canada Revenue Agency (CRA) in respect of the 2013 and 2012 taxationyears which disallowed dividend deductions resulting in additional income taxes as the tax deductibility of certain dividends wasdenied on the basis that they were part of a “dividend rental arrangement”. The reassessments are consistent with the previouslyreceived proposal letters as described in Note 22 of our 2018 Annual Consolidated Financial Statements. We are confident that ourtax filing position was appropriate and intend to defend ourselves vigorously.
Note 9 Significant capital and funding transactions
Preferred sharesOn November 2, 2018, we issued 14 million Non-Cumulative 5-Year Rate Reset First Preferred Shares Series BO at a price of$25 per share, for total gross proceeds of $350 million. For the initial five year period to the earliest redemption date of February 24,2024, the Series BO Preferred Shares pay quarterly cash dividends, if declared, at a rate of 4.8% per annum. The dividend rate willreset on the earliest redemption date and every fifth year thereafter at a rate equal to the 5-year Government of Canada bond yieldplus a premium of 2.38%. Holders have the option to convert their shares into Non-Cumulative Floating Rate First Preferred Shares,Series BP, subject to certain conditions, on the earliest redemption date and every fifth year thereafter at a rate equal to the 3-monthGovernment of Canada Treasury Bill yield plus 2.38%. Subject to the consent of OSFI and the requirements of the Bank Act (Canada),we may redeem the Series BO Preferred Shares in whole or in part at a price per share of $25 on the earliest redemption date andevery fifth year thereafter. The Series BO Preferred Shares include NVCC provisions which are necessary for the shares to qualify asTier 1 regulatory capital.
On November 24, 2018, we redeemed all 10 million Non-Cumulative First Preferred Shares Series AD at a price of $25 per share.
Common shares issued (1)
For the three months ended
January 31, 2019 January 31, 2018
(Millions of Canadian dollars, except number of shares)
Number ofshares
(thousands) Amount
Number ofshares
(thousands) Amount
Issued in connection with share-based compensation plans (2) 159 $ 11 464 $ 30Purchased for cancellation (3) (3,684) (45) (9,297) (113)
(3,525) $ (34) (8,833) $ (83)
(1) The requirements of our dividend reinvestment plan (DRIP) are satisfied through either open market share purchases or shares issued from treasury. During the three months ended January 31,2019 and January 31, 2018, our DRIP’s requirements were satisfied through open market share purchases.
(2) Amounts include cash received for stock options exercised during the period and the fair value adjustment to stock options.(3) During the three months ended January 31, 2019, we purchased for cancellation common shares at a total fair value of $348 million (average cost of $94.40 per share), with a book value of
$45 million (book value of $12.25 per share). During the three months ended January 31, 2018, we purchased for cancellation common shares at a total fair value of $923 million (average cost of$99.29 per share), with a book value of $113 million (book value of $12.25 per share).

64 Royal Bank of Canada First Quarter 2019
Note 10 Earnings per share
For the three months ended
(Millions of Canadian dollars, except share and per share amounts)
January 31
2019January 31
2018
Basic earnings per shareNet income $ 3,172 $ 3,012Preferred share dividends (74) (72)Net income attributable to non-controlling interest (2) (11)
Net income available to common shareholders 3,096 2,929
Weighted average number of common shares (in thousands) 1,437,074 1,451,781Basic earnings per share (in dollars) $ 2.15 $ 2.02
Diluted earnings per shareNet income available to common shareholders $ 3,096 $ 2,929Dilutive impact of exchangeable shares 4 4
Net income available to common shareholders including dilutive impact of exchangeable shares 3,100 2,933
Weighted average number of common shares (in thousands) 1,437,074 1,451,781Stock options (1) 2,033 3,069Issuable under other share-based compensation plans 737 751Exchangeable shares (2) 3,351 3,113
Average number of diluted common shares (in thousands) 1,443,195 1,458,714Diluted earnings per share (in dollars) $ 2.15 $ 2.01
(1) The dilutive effect of stock options was calculated using the treasury stock method. When the exercise price of options outstanding is greater than the average market price of our common shares,the options are excluded from the calculation of diluted earnings per share. For the three months ended January 31, 2019, 1,364,706 outstanding options with an average price of $99.73 wereexcluded from the calculation of diluted earnings per share. For the three months ended January 31, 2018, no outstanding options were excluded from the calculation of diluted earnings per share.
(2) Includes exchangeable preferred shares.
Note 11 Legal and regulatory matters
We are a large global institution that is subject to many different complex legal and regulatory requirements that continue to evolve.As a result, we are and have been subject to a variety of legal proceedings, including civil claims and lawsuits, regulatoryexaminations, investigations, audits and requests for information by various governmental regulatory agencies and law enforcementauthorities in various jurisdictions. Some of these matters may involve novel legal theories and interpretations and may be advancedunder criminal as well as civil statutes, and some proceedings could result in the imposition of civil, regulatory enforcement orcriminal penalties. We review the status of all proceedings on an ongoing basis and will exercise judgment in resolving them in suchmanner as we believe to be in our best interest. This is an area of significant judgment and uncertainty and the extent of our financialand other exposure to these proceedings after taking into account current accruals could be material to our results of operations inany particular period.
Our significant legal proceedings and regulatory matters are those disclosed in our audited 2018 Annual Consolidated FinancialStatements as updated below:
Interchange fees litigationThe trial in the Watson proceeding has been rescheduled from October 14, 2019 to October 19, 2020.

Royal Bank of Canada First Quarter 2019 65
Note 12 Results by business segment
For the three months ended January 31, 2019
(Millions of Canadian dollars)
Personal &Commercial
BankingWealth
Management Insurance
Investor &TreasuryServices
CapitalMarkets (1)
CorporateSupport (1) Total
Net interest income (2) $ 3,134 $ 744 $ – $ (31) $ 1,006 $ 31 $ 4,884Non-interest income 1,284 2,204 1,579 662 1,092 (116) 6,705
Total revenue 4,418 2,948 1,579 631 2,098 (85) 11,589Provision for credit losses 348 26 – – 140 – 514Insurance policyholder benefits, claims and
acquisition expense – – 1,225 – – – 1,225Non-interest expense 1,915 2,164 154 418 1,230 31 5,912
Net income (loss) before income taxes 2,155 758 200 213 728 (116) 3,938Income taxes (recoveries) 584 161 34 52 75 (140) 766
Net income $ 1,571 $ 597 $ 166 $ 161 $ 653 $ 24 $ 3,172
Non-interest expense includes:Depreciation and amortization $ 153 $ 147 $ 11 $ 34 $ 95 $ – $ 440
For the three months ended January 31, 2018
(Millions of Canadian dollars)
Personal &Commercial
BankingWealth
Management Insurance
Investor &TreasuryServices
CapitalMarkets (1)
CorporateSupport (1) Total
Net interest income (2) $ 2,856 $ 612 $ – $ 128 $ 866 $ (17) $ 4,445Non-interest income 1,309 2,171 1,144 548 1,309 (98) 6,383
Total revenue 4,165 2,783 1,144 676 2,175 (115) 10,828Provision for credit losses 317 (2) – – 20 (1) 334Insurance policyholder benefits, claims and
acquisition expense – – 836 – – – 836Non-interest expense 1,801 2,011 142 389 1,214 54 5,611
Net income (loss) before income taxes 2,047 774 166 287 941 (168) 4,047Income taxes (recoveries) 526 177 39 68 193 32 1,035
Net income $ 1,521 $ 597 $ 127 $ 219 $ 748 $ (200) $ 3,012
Non-interest expense includes:Depreciation and amortization $ 140 $ 130 $ 9 $ 30 $ 87 $ – $ 396
(1) Taxable equivalent basis.(2) Interest revenue is reported net of interest expense as we rely primarily on net interest income as a performance measure.
Total assets and total liabilities by business segmentAs at January 31, 2019
(Millions of Canadian dollars)
Personal &Commercial
BankingWealth
Management Insurance
Investor &TreasuryServices
CapitalMarkets
CorporateSupport Total
Total assets $ 458,817 $ 93,905 $ 16,787 $ 148,670 $ 604,422 $ 43,606 $ 1,366,207Total liabilities $ 458,826 $ 94,050 $ 16,826 $ 148,658 $ 604,438 $ (37,241) $ 1,285,557
As at October 31, 2018
(Millions of Canadian dollars)
Personal &Commercial
BankingWealth
Management Insurance
Investor &TreasuryServices
CapitalMarkets
CorporateSupport Total
Total assets $ 453,879 $ 93,063 $ 16,210 $ 136,030 $ 590,950 $ 44,602 $ 1,334,734Total liabilities $ 453,878 $ 93,162 $ 16,289 $ 135,944 $ 590,582 $ (35,076) $ 1,254,779

66 Royal Bank of Canada First Quarter 2019
Note 13 Capital management
Regulatory capital and capital ratiosOSFI formally establishes risk-based capital and leverage targets for deposit-taking institutions in Canada. During the first quarter of2019, we complied with all capital and leverage requirements, including the domestic stability buffer, imposed by OSFI.
As at
(Millions of Canadian dollars, except Capital ratios and leverage ratios)
January 31
2019October 31
2018
Capital (1)
CET1 capital $ 57,963 $ 57,001Tier 1 capital 64,341 63,279Total capital 73,758 72,494
Risk-weighted Assets (RWA) used in calculation of capital ratios (1) (2)
CET1 capital RWA 508,512 495,528Tier 1 capital RWA 508,512 495,993Total capital RWA 508,512 496,459
Total capital RWA consisting of: (1)
Credit risk 410,003 401,534Market risk 34,862 32,209Operational risk 63,647 62,716
Total Capital RWA $ 508,512 $ 496,459
Capital ratios and Leverage ratios (1)
CET1 ratio 11.4% 11.5%Tier 1 capital ratio 12.7% 12.8%Total capital ratio 14.5% 14.6%Leverage ratio 4.3% 4.4%Leverage ratio exposure (billions) $ 1,501.8 $ 1,450.8
(1) Capital, RWA, and capital ratios are calculated using OSFI Capital Adequacy Requirements based on the Basel III framework. The leverage ratio is calculated using OSFI Leverage RequirementsGuideline based on the Basel III framework.
(2) In fiscal 2018, amounts included CVA scalars of 80%, 83% and 86%, respectively.

Royal Bank of Canada First Quarter 2019 67
Shareholder Information
Corporate headquartersStreet address:Royal Bank of Canada200 Bay StreetToronto, Ontario M5J 2J5CanadaTel: 1-888-212-5533
Mailing address:P.O. Box 1Royal Bank PlazaToronto, Ontario M5J 2J5Canadawebsite: rbc.com
Transfer Agent and RegistrarMain Agent:Computershare Trust Company ofCanada1500 Robert-Bourassa Blvd.Suite 700Montreal, Quebec H3A 3S8CanadaTel: 1-866-586-7635 (Canada andthe U.S.) or 514-982-7555(International)Fax: 514-982-7580website: computershare.com/rbc
Co-Transfer Agent (U.S.):Computershare Trust Company, N.A.250 Royall StreetCanton, Massachusetts 02021
Valuation day priceFor Canadian income tax purposes,Royal Bank of Canada’s commonstock was quoted at $29.52 per shareon the Valuation Day (December 22,1971). This is equivalent to $7.38per share after adjusting for thetwo-for-one stock split of March 1981and the two-for-one stock split ofFebruary 1990. The one-for-one stockdividends in October 2000 andApril 2006 did not affect theValuation Day amount for ourcommon shares.
Shareholder contactsFor dividend information, changein share registration or address,lost stock certificates, tax forms,estate transfers or dividendreinvestment, please contact:Computershare Trust Companyof Canada100 University Avenue, 8th FloorToronto, Ontario M5J 2Y1Canada
Tel: 1-866-586-7635 (Canada andthe U.S.) or 514-982-7555(International)Fax: 1-888-453-0330 (Canada andthe U.S.) or 416-263-9394(International)
Direct deposit serviceShareholders in Canada and theU.S. may have their RBC commonshare dividends deposited directlyto their bank account by electronicfunds transfer. To arrange for thisservice, please contact our TransferAgent and Registrar, ComputershareTrust Company of Canada.
Eligible dividend designationFor purposes of the Income Tax Act(Canada) and any correspondingprovincial and territorial taxlegislation, all dividends (anddeemed dividends) paid by RBC toCanadian residents on both itscommon and preferred shares, aredesignated as “eligible dividends”,unless stated otherwise.
Common share repurchasesWe are engaged in a Normal CourseIssuer Bid (NCIB) which allows usto repurchase for cancellation, upto 30 million common sharesduring the period spanning fromFebruary 27, 2018 to February 26,2019, when the bid expires, orsuch earlier date as we maycomplete the purchases pursuantto our Notice of Intention filed withthe Toronto Stock Exchange.
We determine the amount andtiming of the purchases under theNCIB, subject to prior consultationwith the Office of theSuperintendent of FinancialInstitutions Canada.
A copy of our Notice of Intention tofile a NCIB may be obtained,without charge, by contacting ourCorporate Secretary at our Torontomailing address.
2019 Quarterly earnings releasedatesFirst quarter February 22Second quarter May 23Third quarter August 21Fourth quarter December 4
2019 Annual MeetingThe Annual Meeting of CommonShareholders will be held onThursday, April 4, 2019, at9:30 a.m. (Atlantic Time) at theHalifax Convention Centre,1650 Argyle Street, Halifax,Nova Scotia, Canada.
U.S.A.
Co-Transfer Agent (U.K.):Computershare Investor Services PLCSecurities Services – RegistrarsP.O. Box 82, The Pavilions,Bridgwater Road,Bristol BS99 6ZZU.K.
Stock exchange listings(Symbol: RY)
Common shares are listed on:Canada – Toronto StockExchange (TSX)U.S. – New York Stock Exchange(NYSE)Switzerland – Swiss Exchange(SIX)
All preferred shares are listed onthe TSX with the exception of theseries C-2. The related depositoryshares of the series C-2 preferredshares are listed on the NYSE.
email: [email protected]
For other shareholder inquiries,please contact:Shareholder RelationsRoyal Bank of Canada200 Bay StreetSouth TowerToronto, Ontario M5J 2J5CanadaTel: 416-955-7806
Financial analysts, portfoliomanagers, institutionalinvestorsFor financial information inquiries,please contact:Investor RelationsRoyal Bank of Canada155 Wellington Street WestToronto, Ontario M5V 3K7CanadaTel: 416-955-7802
or visit our website atrbc.com/investorrelations
Dividend dates for 2019Subject to approval by the Board of Directors
Recorddates
Paymentdates
Common and preferred sharesseries W, AA, AC, AE, AF, AG, AZ, BB,BD, BF, BH, BI, BJ, BK, BM and BO
January 24April 25July 25October 24
February 22May 24August 23November 22
Preferred shares series AJ,AKand AL
January 24 February 22
Preferred shares series C-2(US$)
January 28April 26July 26October 28
February 7May 7August 7November 7
GovernanceSummaries of the significant ways in which corporate governance practicesfollowed by RBC differ from corporate governance practices required to befollowed by U.S. domestic companies under the NYSE listing standards areavailable on our website at rbc.com/governance.
Information contained in or otherwise accessible through the websites mentioned in this report to shareholders does not form a part of this report. All references to websites are inactive textual referencesand are for your information only.
Trademarks used in this report include the LION & GLOBE Symbol, ROYAL BANK OF CANADA, RBC and RBC INSURANCE which are trademarks of Royal Bank of Canada used by Royal Bank of Canada and/orby its subsidiaries under license. All other trademarks mentioned in this report, which are not the property of Royal Bank of Canada, are owned by their respective holders.


![Form 6K for the quarter and nine months ended December 31, 2015 [Company Update]](https://static.fdocuments.in/doc/165x107/577ca4f21a28abea748b54ef/form-6k-for-the-quarter-and-nine-months-ended-december-31-2015-company-update.jpg)

![Investors' brief for the 3rd quarter & nine months ended Dec 31, 2014 [Company Update]](https://static.fdocuments.in/doc/165x107/577cb4a01a28aba7118c95c0/investors-brief-for-the-3rd-quarter-nine-months-ended-dec-31-2014-company.jpg)