
First Quarter (Jan-Mar) 2009 Analyst Presentation · Medan, Surabaya, WorldWorld ... ----2.4 2.4...
28
First Quarter (Jan-Mar) 2009 Results 28 May 2009 First Quarter (Jan-Mar) 2009 Results 28 May 2009 Leading The Competition Leading The Competition
Transcript of First Quarter (Jan-Mar) 2009 Analyst Presentation · Medan, Surabaya, WorldWorld ... ----2.4 2.4...
First Quarter (Jan-Mar) 2009 Results
28 May 2009
First Quarter (Jan-Mar) 2009 Results
28 May 2009
Leading The CompetitionLeading The Competition
DisclaimerDisclaimerDisclaimerDisclaimer
Information contained in our presentation is intended solely for your reference. Such information is subject to change without notice, its accuracy is not guaranteed and it may not contain all material information concerning the Company. Neither we nor our advisors make any representationregarding, and assumes no responsibility or liability for, the accuracy or completeness of, or any errors or omissions in, any information contained herein.
In addition, the information may contain projections and forward-looking statements that reflect the company’s current views with respect to future events and financial performance. These views are based on current assumptions which are subject to various risks factors and which may change over time. No assurance can be given that future events will occur, that projections will be achieved, or that the company’s assumptions are correct. Actual results may differ materially from those projected.
This presentation can be distributed without any consent of the Company as this is a publicly available announcement.
1
Key Highlights for First Quarter Key Highlights for First Quarter Key Highlights for First Quarter Key Highlights for First Quarter
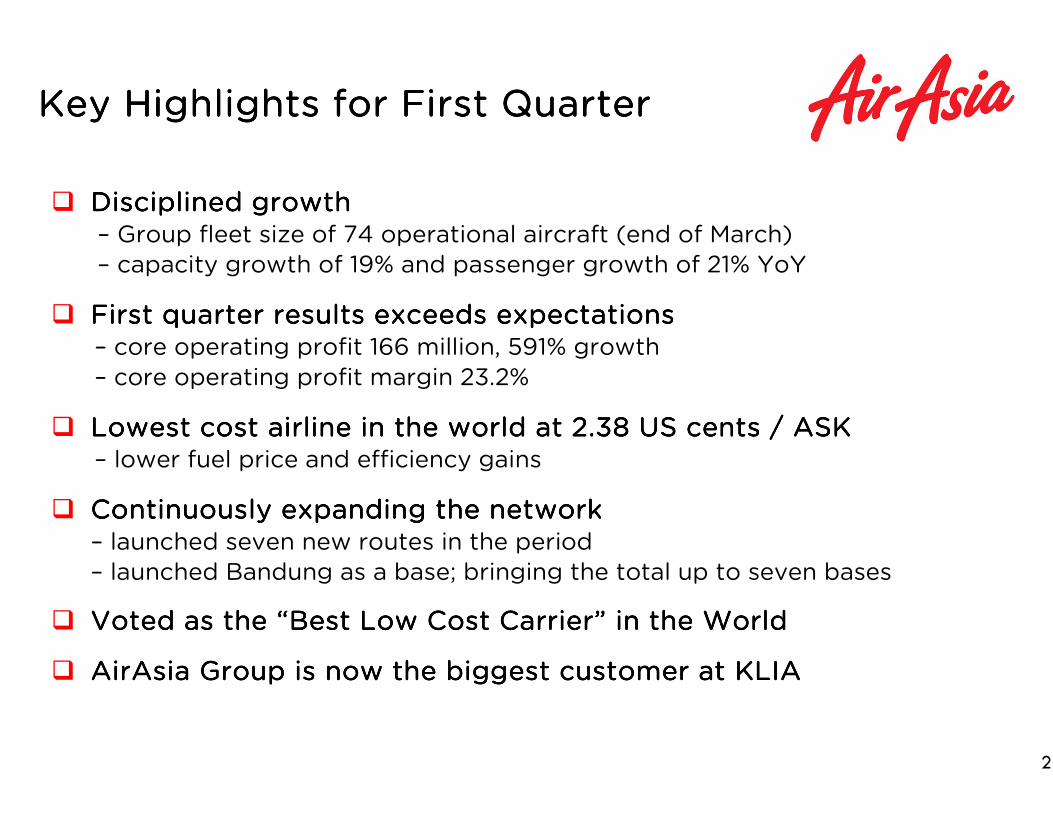
� Disciplined growth Disciplined growth Disciplined growth Disciplined growth – Group fleet size of 74 operational aircraft (end of March)
– capacity growth of 19% and passenger growth of 21% YoY
� First quarter results exceeds expectations First quarter results exceeds expectations First quarter results exceeds expectations First quarter results exceeds expectations – core operating profit 166 million, 591% growth
– core operating profit margin 23.2%
� Lowest cost airline in the world at 2.38 US cents / ASK Lowest cost airline in the world at 2.38 US cents / ASK Lowest cost airline in the world at 2.38 US cents / ASK Lowest cost airline in the world at 2.38 US cents / ASK – lower fuel price and efficiency gains
� Continuously expanding the network Continuously expanding the network Continuously expanding the network Continuously expanding the network – launched seven new routes in the period
– launched Bandung as a base; bringing the total up to seven bases
� Voted as the Voted as the Voted as the Voted as the ““““Best Low Cost CarrierBest Low Cost CarrierBest Low Cost CarrierBest Low Cost Carrier”””” in the World in the World in the World in the World
� AirAsia Group is now the biggest customer at KLIA AirAsia Group is now the biggest customer at KLIA AirAsia Group is now the biggest customer at KLIA AirAsia Group is now the biggest customer at KLIA
2

The Best Kept Secret on the The Best Kept Secret on the The Best Kept Secret on the The Best Kept Secret on the Balance Sheet Balance Sheet Balance Sheet Balance Sheet
1041041041042008200820082008
656565652006200620062006
757575752007200720072007
525252522005200520052005
116116116116
26262626
11111111
6666
# Routes # Routes # Routes # Routes ServedServedServedServed
2002200220022002
2004200420042004
NOWNOWNOWNOW
2003200320032003
PeriodPeriodPeriodPeriod
Bali – Perth
Latest RouteLatest RouteLatest RouteLatest Route
Upcoming RoutesUpcoming RoutesUpcoming RoutesUpcoming Routes
KL – Colombo Bangkok – Taipei
���� 42 unique routes42 unique routes42 unique routes42 unique routes
3
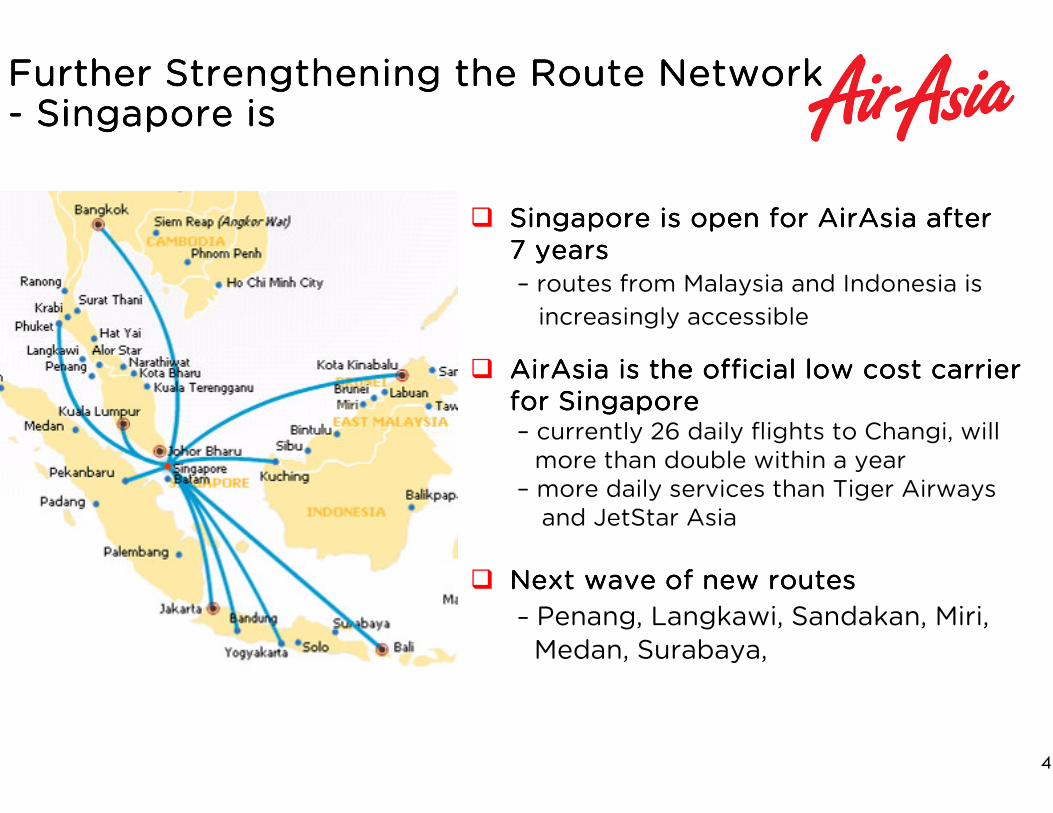
Further Strengthening the Route NetworkFurther Strengthening the Route NetworkFurther Strengthening the Route NetworkFurther Strengthening the Route Network---- Singapore is Singapore is Singapore is Singapore is
4
� Singapore is open for AirAsia after Singapore is open for AirAsia after Singapore is open for AirAsia after Singapore is open for AirAsia after 7 years 7 years 7 years 7 years – routes from Malaysia and Indonesia is
increasingly accessible
� AirAsia is the official low cost carrier AirAsia is the official low cost carrier AirAsia is the official low cost carrier AirAsia is the official low cost carrier for Singapore for Singapore for Singapore for Singapore – currently 26 daily flights to Changi, will more than double within a year
– more daily services than Tiger Airways and JetStar Asia
� Next wave of new routes Next wave of new routes Next wave of new routes Next wave of new routes
– Penang, Langkawi, Sandakan, Miri,
Medan, Surabaya,
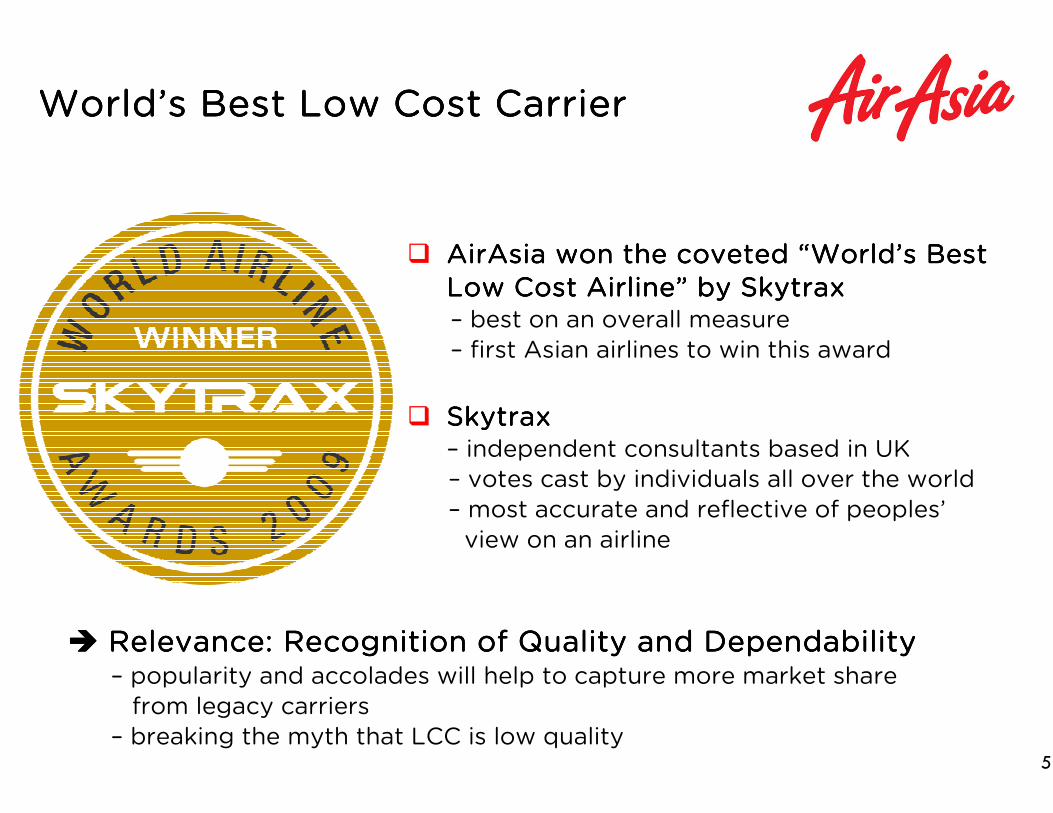
WorldWorldWorldWorld’’’’s Best Low Cost Carrier s Best Low Cost Carrier s Best Low Cost Carrier s Best Low Cost Carrier
� AirAsia won the coveted AirAsia won the coveted AirAsia won the coveted AirAsia won the coveted ““““WorldWorldWorldWorld’’’’s Best s Best s Best s Best Low Cost AirlineLow Cost AirlineLow Cost AirlineLow Cost Airline”””” by by by by SkytraxSkytraxSkytraxSkytrax– best on an overall measure
– first Asian airlines to win this award
� SkytraxSkytraxSkytraxSkytrax– independent consultants based in UK
– votes cast by individuals all over the world
– most accurate and reflective of peoples’
view on an airline
5
���� Relevance: Recognition of Quality and DependabilityRelevance: Recognition of Quality and DependabilityRelevance: Recognition of Quality and DependabilityRelevance: Recognition of Quality and Dependability– popularity and accolades will help to capture more market share
from legacy carriers
– breaking the myth that LCC is low quality

AirAsia is the Market Leader at KLIA AirAsia is the Market Leader at KLIA AirAsia is the Market Leader at KLIA AirAsia is the Market Leader at KLIA
6%
12%15%
20%
27%30%
37%
44%
2002 2003 2004 2005 2006 2007 2008 2009F
6
AirAsia Group Market Share at KLIA AirAsia Group Market Share at KLIA AirAsia Group Market Share at KLIA AirAsia Group Market Share at KLIA
� AirAsia Group has the most number of passengers at KLIAAirAsia Group has the most number of passengers at KLIAAirAsia Group has the most number of passengers at KLIAAirAsia Group has the most number of passengers at KLIA- Group’s market share in the first quarter was 44%
- AirAsia Group is the ONLYONLYONLYONLY airline that is growing meaningfully at KLIA
- Assuming AirAsia did not grow; KLIA traffic would have declinedby 7% in the first quarter
���� RELEVANCE: Better negotiating power with airports RELEVANCE: Better negotiating power with airports RELEVANCE: Better negotiating power with airports RELEVANCE: Better negotiating power with airports
Source: MAHB, Company data
Result CommentaryResult CommentaryResult CommentaryResult Commentary
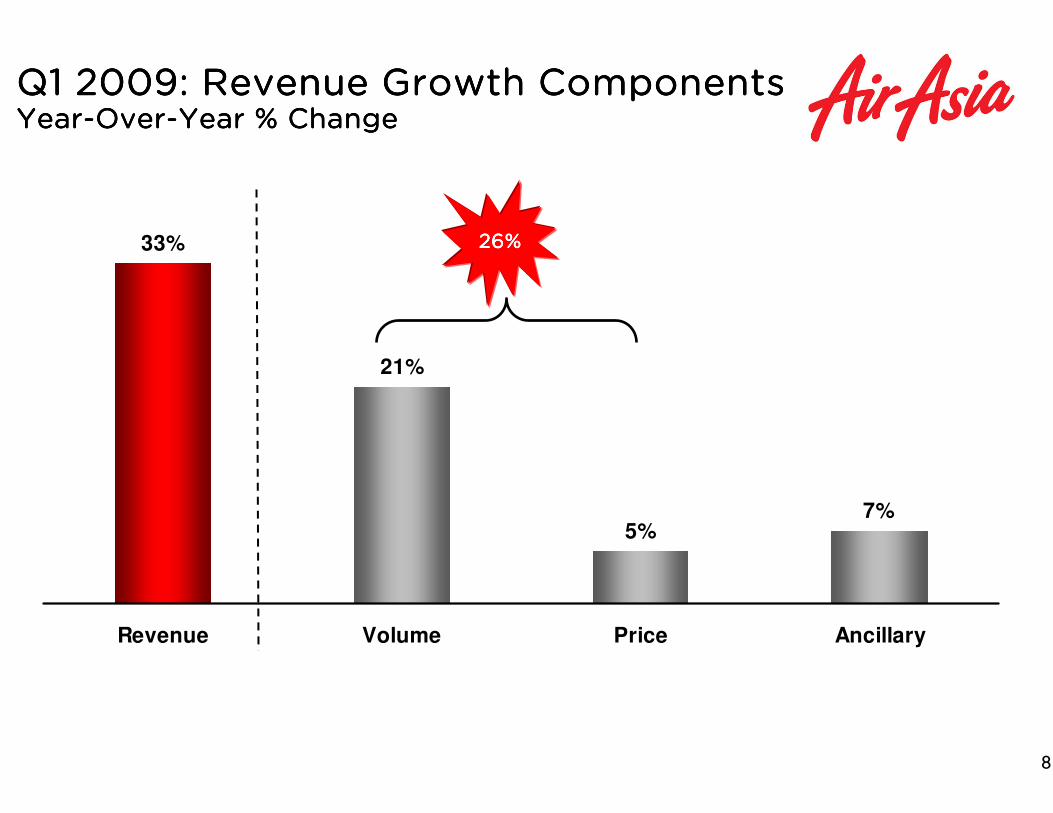
Q1 2009: Revenue Growth ComponentsQ1 2009: Revenue Growth ComponentsQ1 2009: Revenue Growth ComponentsQ1 2009: Revenue Growth ComponentsYearYearYearYear----OverOverOverOver----Year % ChangeYear % ChangeYear % ChangeYear % Change
33%
21%
5%7%
Revenue Volume Price Ancillary
26%26%26%26%
8

LCC Thrives During Economic HardshipLCC Thrives During Economic HardshipLCC Thrives During Economic HardshipLCC Thrives During Economic HardshipPassenger Carried
3,147,609
2,611,556
Q1-2008 Q1-2009
Load Factor
69.7%
72.1%
Q1-2008 Q1-2009
Average Fare (RM)
198
189
Q1-2008 Q1-2009 9
21%21%21%21%
5%5%5%5%
----2.4 2.4 2.4 2.4 pptpptpptppt
� Robust passenger growth continuesRobust passenger growth continuesRobust passenger growth continuesRobust passenger growth continues
– 21% passenger growth
– more people switching to AirAsia
– prevalent down trading is opening new
markets for AirAsia
� Load factor holding up well Load factor holding up well Load factor holding up well Load factor holding up well
– 2.4 percentage points drop from same
period last year
– due to significant capacity addition of
19% year on year
� Average fare up by 5% Average fare up by 5% Average fare up by 5% Average fare up by 5%
– effective yield management
– competitors have not significantly
reduced fares and fuel surcharge
– ability to gap up fares
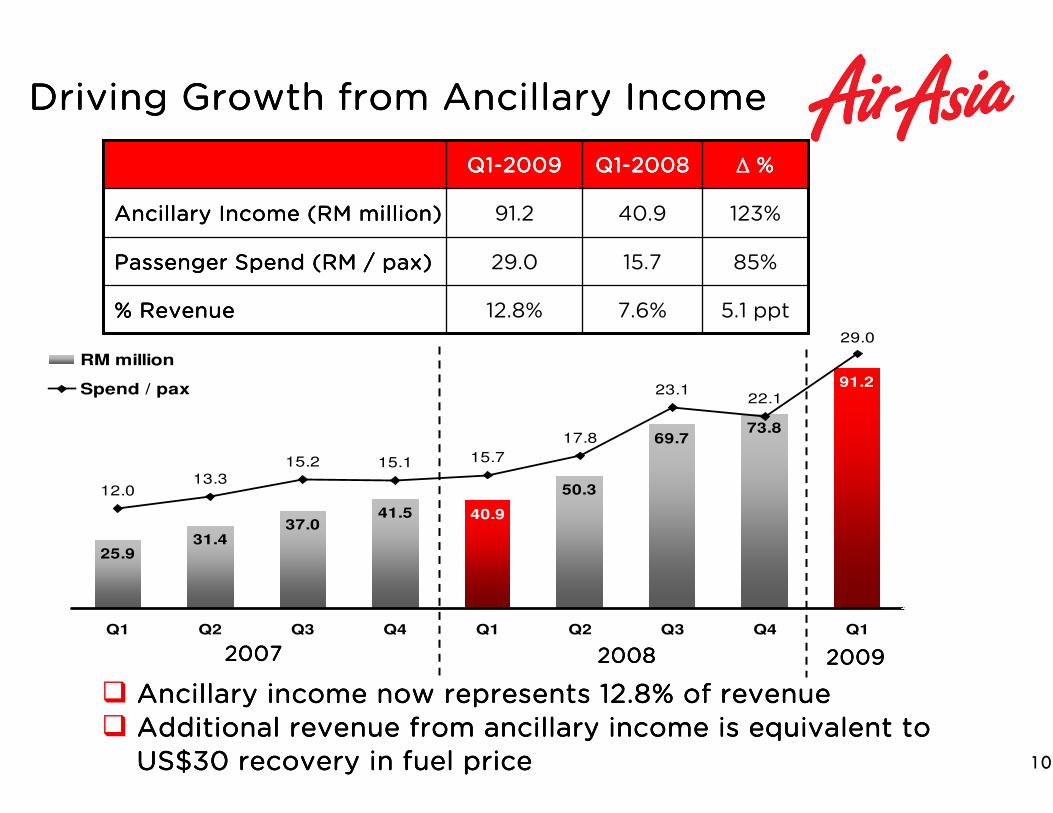
Driving Growth from Ancillary Income Driving Growth from Ancillary Income Driving Growth from Ancillary Income Driving Growth from Ancillary Income
� Ancillary income now represents 12.8% of revenue Ancillary income now represents 12.8% of revenue Ancillary income now represents 12.8% of revenue Ancillary income now represents 12.8% of revenue
� Additional revenue from ancillary income is equivalent to Additional revenue from ancillary income is equivalent to Additional revenue from ancillary income is equivalent to Additional revenue from ancillary income is equivalent to
US$30 recovery in fuel price US$30 recovery in fuel price US$30 recovery in fuel price US$30 recovery in fuel price
5.1 ppt7.6%12.8%% Revenue% Revenue% Revenue% Revenue
85%15.729.0Passenger Spend (RM / Passenger Spend (RM / Passenger Spend (RM / Passenger Spend (RM / paxpaxpaxpax))))
123%40.991.2Ancillary Income (RM million)Ancillary Income (RM million)Ancillary Income (RM million)Ancillary Income (RM million)
∆∆∆∆ %%%%Q1Q1Q1Q1----2008200820082008Q1Q1Q1Q1----2009200920092009
10
25.931.4
37.0
50.3
69.7
40.9
91.2
73.8
41.5
12.013.3
15.2 15.1 15.7
17.8
23.122.1
29.0
0
10
20
30
40
50
60
70
80
90
100
Q1 Q2 Q3 Q4 Q1 Q2 Q3 Q4 Q1
1.0
2.0
3.0
4.0
5.0
6.0
7.0
8.0
9.0
10.0
11.0
12.0
13.0
14.0
15.0
16.0
17.0
18.0
19.0
20.0
21.0
22.0
23.0
24.0
25.0
26.0
27.0
28.0
29.0
30.0
RM million
Spend / pax
2007200720072007 2008200820082008 2009200920092009
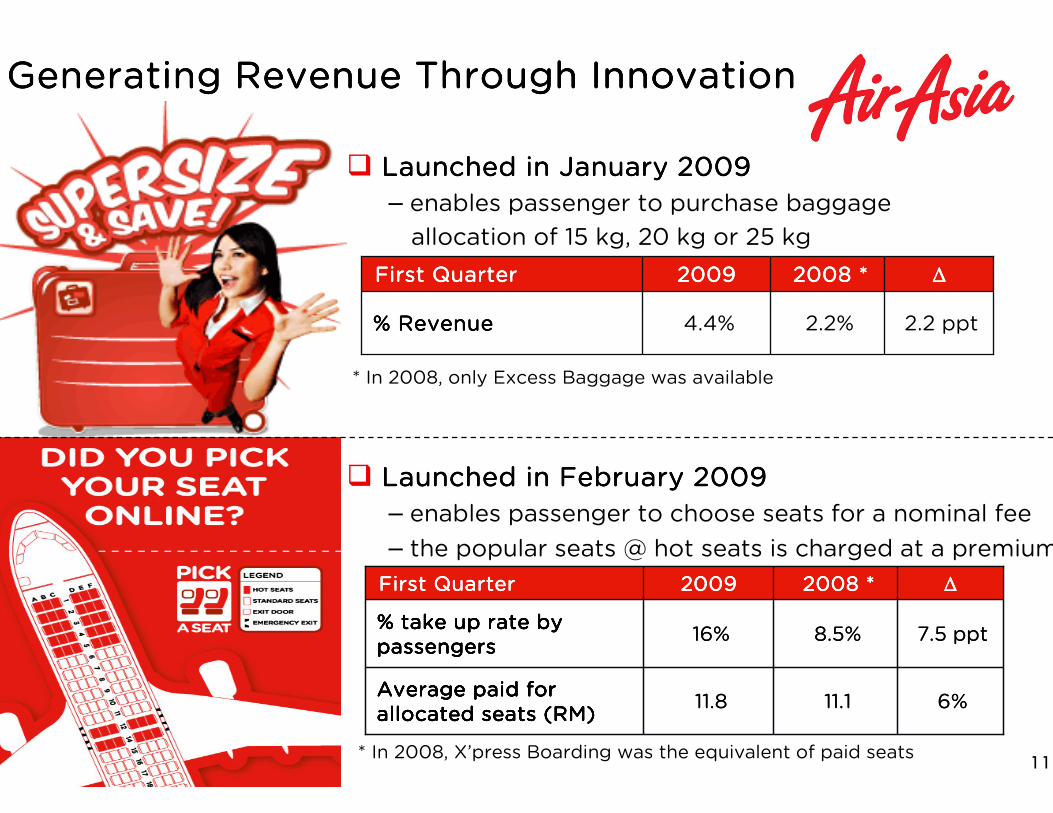
Generating Revenue Through InnovationGenerating Revenue Through InnovationGenerating Revenue Through InnovationGenerating Revenue Through Innovation
� Launched in January 2009 Launched in January 2009 Launched in January 2009 Launched in January 2009
– enables passenger to purchase baggage
allocation of 15 kg, 20 kg or 25 kg
* In 2008, only Excess Baggage was available
� Launched in February 2009Launched in February 2009Launched in February 2009Launched in February 2009
– enables passenger to choose seats for a nominal fee
– the popular seats @ hot seats is charged at a premium
* In 2008, X’press Boarding was the equivalent of paid seats 11
4.4%
2009 2009 2009 2009
2.2%
2008 * 2008 * 2008 * 2008 *
2.2 ppt
∆∆∆∆
% Revenue % Revenue % Revenue % Revenue
First QuarterFirst QuarterFirst QuarterFirst Quarter
11.8
16%
2009 2009 2009 2009
11.1
8.5%
2008 * 2008 * 2008 * 2008 *
7.5 ppt% take up rate by % take up rate by % take up rate by % take up rate by passengers passengers passengers passengers
6%
∆∆∆∆
Average paid for Average paid for Average paid for Average paid for allocated seats (RM)allocated seats (RM)allocated seats (RM)allocated seats (RM)
First QuarterFirst QuarterFirst QuarterFirst Quarter

Capturing new Markets: Capturing new Markets: Capturing new Markets: Capturing new Markets: Corporate Account Corporate Account Corporate Account Corporate Account
� Companies are trading down Companies are trading down Companies are trading down Companies are trading down
– part of cost cutting exercise
– make use of AirAsia’s attributes
(routes, frequencies, reliability)
� Many blue chip companies have signed upMany blue chip companies have signed upMany blue chip companies have signed upMany blue chip companies have signed up
12
No more business No more business No more business No more business class. AirAsia is class. AirAsia is class. AirAsia is class. AirAsia is the one for methe one for methe one for methe one for me
Source: Investment Banker
Seats Sold to Corporate Clients
4,927
13,421
38,115
26,058
2006 2007 2008 Q1-2009
172%
184%
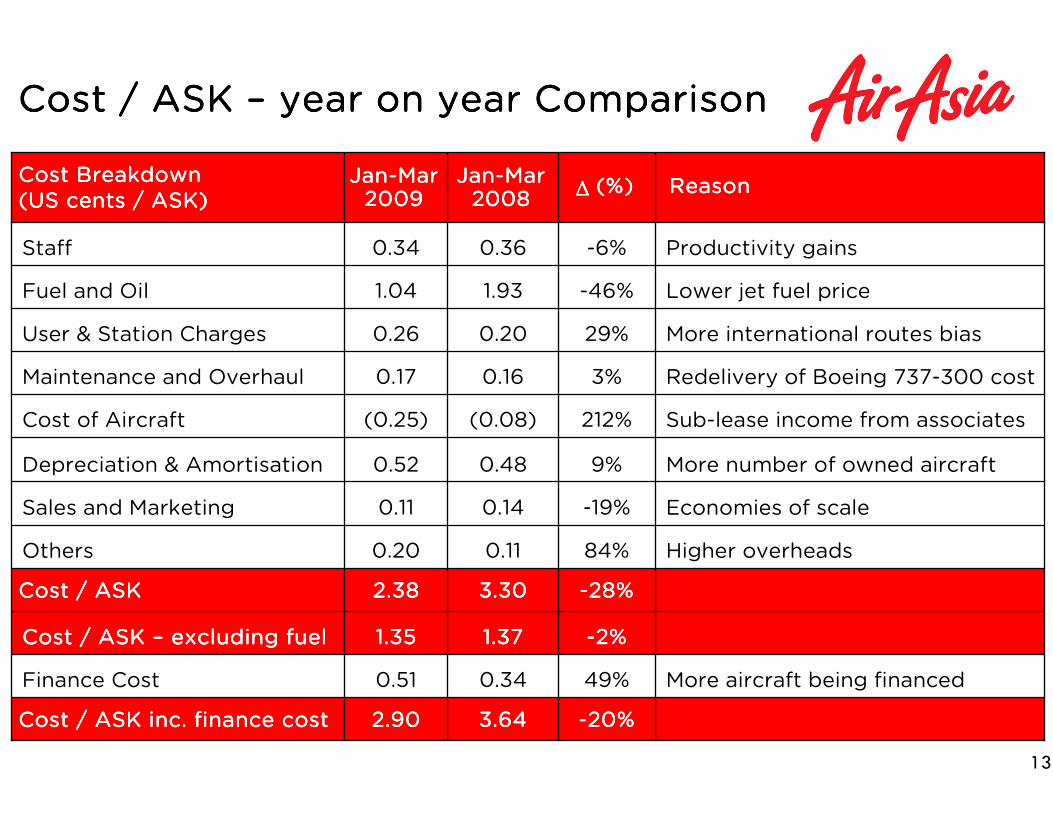
Cost / ASK Cost / ASK Cost / ASK Cost / ASK –––– year on year Comparisonyear on year Comparisonyear on year Comparisonyear on year Comparison
----2%2%2%2%1.371.371.371.371.351.351.351.35Cost / ASK Cost / ASK Cost / ASK Cost / ASK –––– excluding fuel excluding fuel excluding fuel excluding fuel
Higher overheads 84%0.110.20Others
----28%28%28%28%3.303.303.303.302.382.382.382.38Cost / ASK Cost / ASK Cost / ASK Cost / ASK
More aircraft being financed 49%0.34 0.51 Finance Cost
Economies of scale-19%0.140.11Sales and Marketing
----20%20%20%20%3.64 3.64 3.64 3.64 2.90 2.90 2.90 2.90 Cost / ASK inc. finance costCost / ASK inc. finance costCost / ASK inc. finance costCost / ASK inc. finance cost
More number of owned aircraft 9%0.480.52Depreciation & Amortisation
Sub-lease income from associates212%(0.08)(0.25)Cost of Aircraft
Redelivery of Boeing 737-300 cost3%0.160.17Maintenance and Overhaul
More international routes bias 29%0.200.26User & Station Charges
Lower jet fuel price -46%1.931.04Fuel and Oil
Productivity gains-6%0.360.34Staff
Reason Reason Reason Reason ∆∆∆∆ (%)(%)(%)(%)JanJanJanJan----Mar Mar Mar Mar 2008200820082008
JanJanJanJan----Mar Mar Mar Mar 2009200920092009
Cost Breakdown Cost Breakdown Cost Breakdown Cost Breakdown (US cents / ASK)(US cents / ASK)(US cents / ASK)(US cents / ASK)
13

Superior Profits with Expanding MarginsSuperior Profits with Expanding MarginsSuperior Profits with Expanding MarginsSuperior Profits with Expanding Margins
EBITDAR44.1%
24.1%
Q1-2008 Q1-2009
Net Profit
28.4%30.1%
Q1-2008 Q2-2009
PROFIT MARGINS PROFIT MARGINS PROFIT MARGINS PROFIT MARGINS EBITDAR
315
129
Q1-2008 Q1-2009
Net Profit
203161
Q1-2008 Q2-2009 14
PROFIT (RM million)PROFIT (RM million)PROFIT (RM million)PROFIT (RM million)
144%144%144%144%
26%26%26%26%
20.0 20.0 20.0 20.0 pptpptpptppt
(1.7) (1.7) (1.7) (1.7) pptpptpptppt
Core Operating Profit
23.2%
4.5%
Q1-2008 Q2-2009
Core Operating Profit
166
24
Q1-2008 Q2-2009
591%591%591%591% 18.8 18.8 18.8 18.8 pptpptpptppt

Associate UpdatesAssociate UpdatesAssociate UpdatesAssociate Updates---- its all about the Airbus its all about the Airbus its all about the Airbus its all about the Airbus
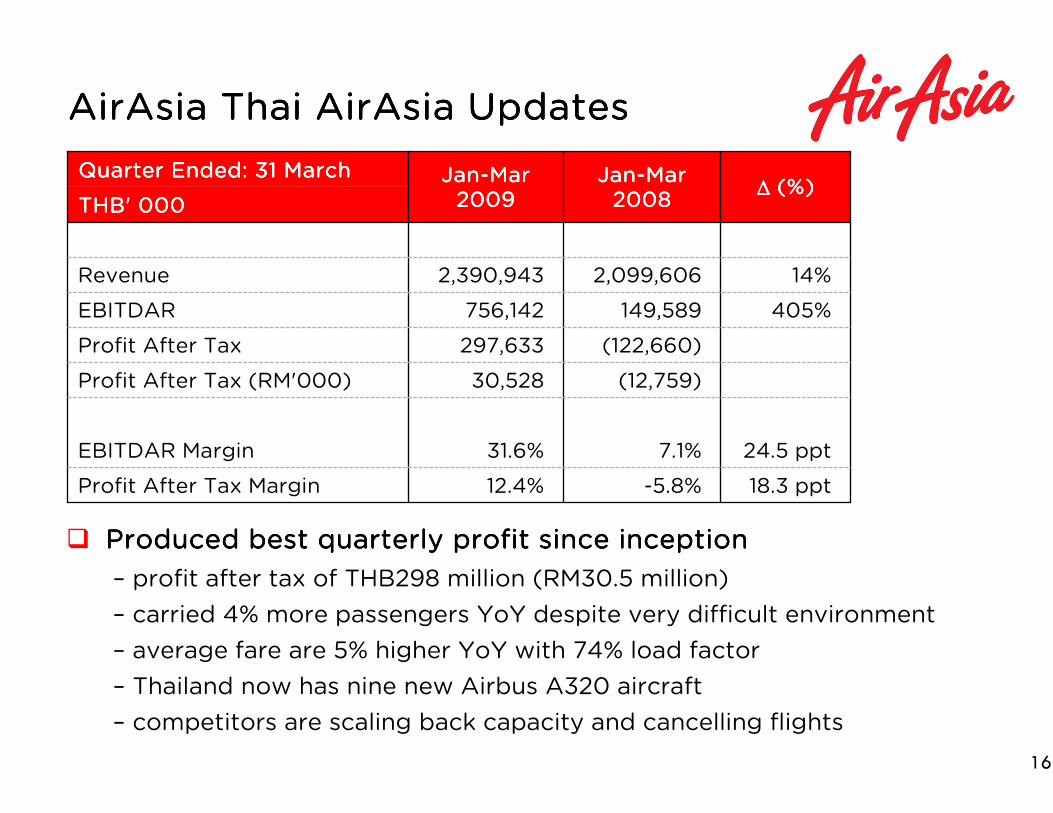
AirAsia Thai AirAsia Updates AirAsia Thai AirAsia Updates AirAsia Thai AirAsia Updates AirAsia Thai AirAsia Updates
� Produced best quarterly profit since inception Produced best quarterly profit since inception Produced best quarterly profit since inception Produced best quarterly profit since inception
– profit after tax of THB298 million (RM30.5 million)
– carried 4% more passengers YoY despite very difficult environment
– average fare are 5% higher YoY with 74% load factor
– Thailand now has nine new Airbus A320 aircraft
– competitors are scaling back capacity and cancelling flights
16
18.3 ppt-5.8%12.4%Profit After Tax Margin
24.5 ppt7.1%31.6%EBITDAR Margin
(12,759)30,528 Profit After Tax (RM'000)
(122,660)297,633 Profit After Tax
405%149,589 756,142 EBITDAR
14%2,099,606 2,390,943Revenue
THB' 000THB' 000THB' 000THB' 000∆∆∆∆ (%)(%)(%)(%)
JanJanJanJan----Mar Mar Mar Mar 2008200820082008
JanJanJanJan----Mar Mar Mar Mar 2009200920092009
Quarter Ended: 31 March Quarter Ended: 31 March Quarter Ended: 31 March Quarter Ended: 31 March
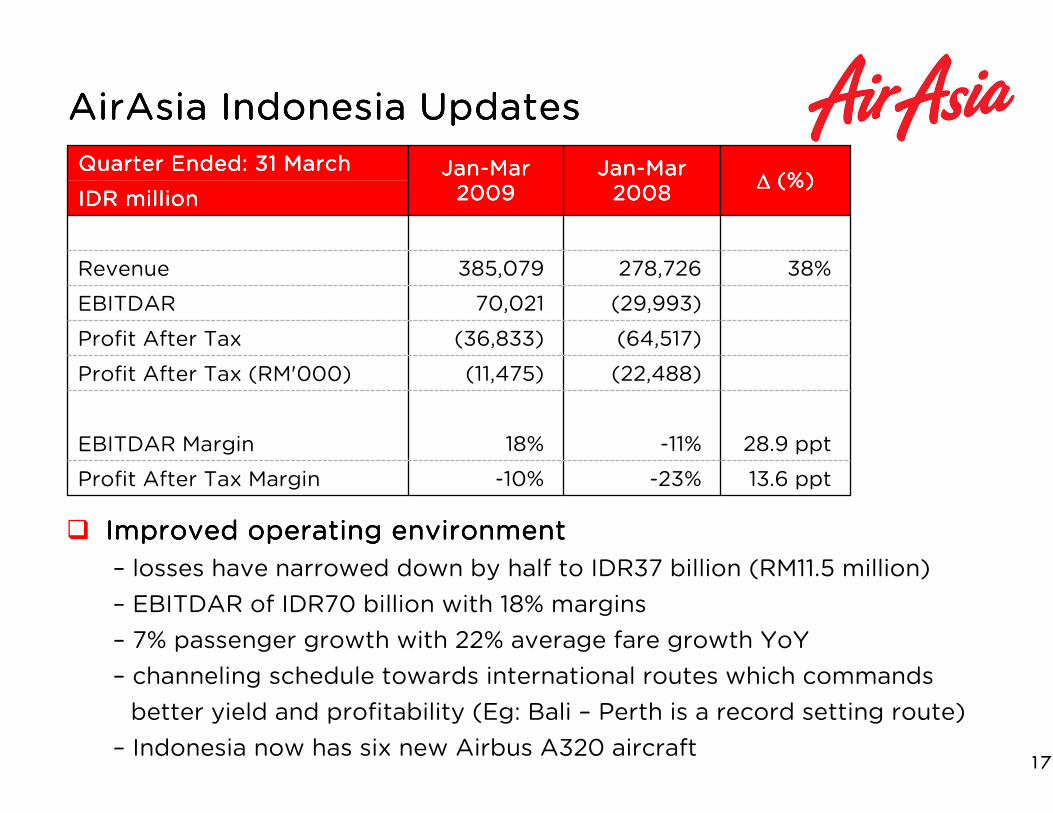
AirAsia Indonesia Updates AirAsia Indonesia Updates AirAsia Indonesia Updates AirAsia Indonesia Updates
� Improved operating environment Improved operating environment Improved operating environment Improved operating environment
– losses have narrowed down by half to IDR37 billion (RM11.5 million)
– EBITDAR of IDR70 billion with 18% margins
– 7% passenger growth with 22% average fare growth YoY
– channeling schedule towards international routes which commands
better yield and profitability (Eg: Bali – Perth is a record setting route)
– Indonesia now has six new Airbus A320 aircraft 17
13.6 ppt-23%-10%Profit After Tax Margin
28.9 ppt-11%18%EBITDAR Margin
(22,488)(11,475)Profit After Tax (RM'000)
(64,517)(36,833)Profit After Tax
(29,993)70,021 EBITDAR
38%278,726 385,079 Revenue
IDR millionIDR millionIDR millionIDR million∆∆∆∆ (%)(%)(%)(%)
JanJanJanJan----Mar Mar Mar Mar 2008200820082008
JanJanJanJan----Mar Mar Mar Mar 2009200920092009
Quarter Ended: 31 March Quarter Ended: 31 March Quarter Ended: 31 March Quarter Ended: 31 March
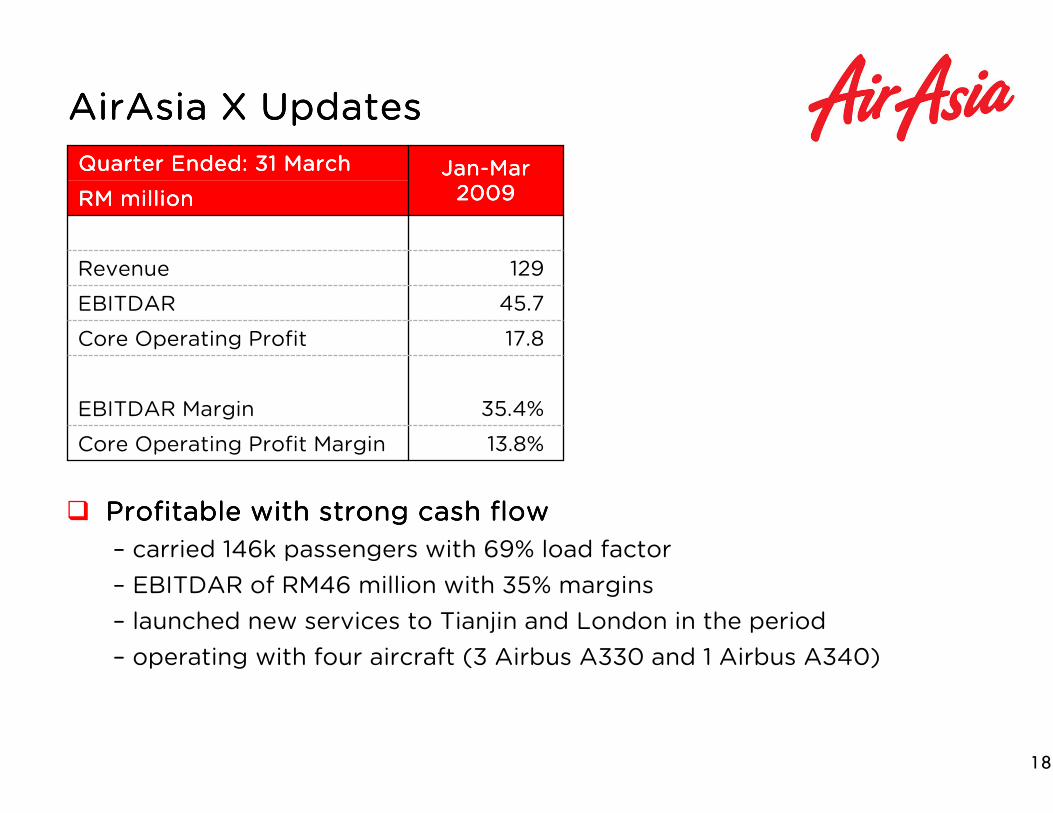
AirAsia X Updates AirAsia X Updates AirAsia X Updates AirAsia X Updates
� Profitable with strong cash flow Profitable with strong cash flow Profitable with strong cash flow Profitable with strong cash flow
– carried 146k passengers with 69% load factor
– EBITDAR of RM46 million with 35% margins
– launched new services to Tianjin and London in the period
– operating with four aircraft (3 Airbus A330 and 1 Airbus A340)
18
13.8%Core Operating Profit Margin
35.4%EBITDAR Margin
17.8Core Operating Profit
45.7EBITDAR
129Revenue
RM millionRM millionRM millionRM million
JanJanJanJan----Mar Mar Mar Mar 2009200920092009
Quarter Ended: 31 March Quarter Ended: 31 March Quarter Ended: 31 March Quarter Ended: 31 March
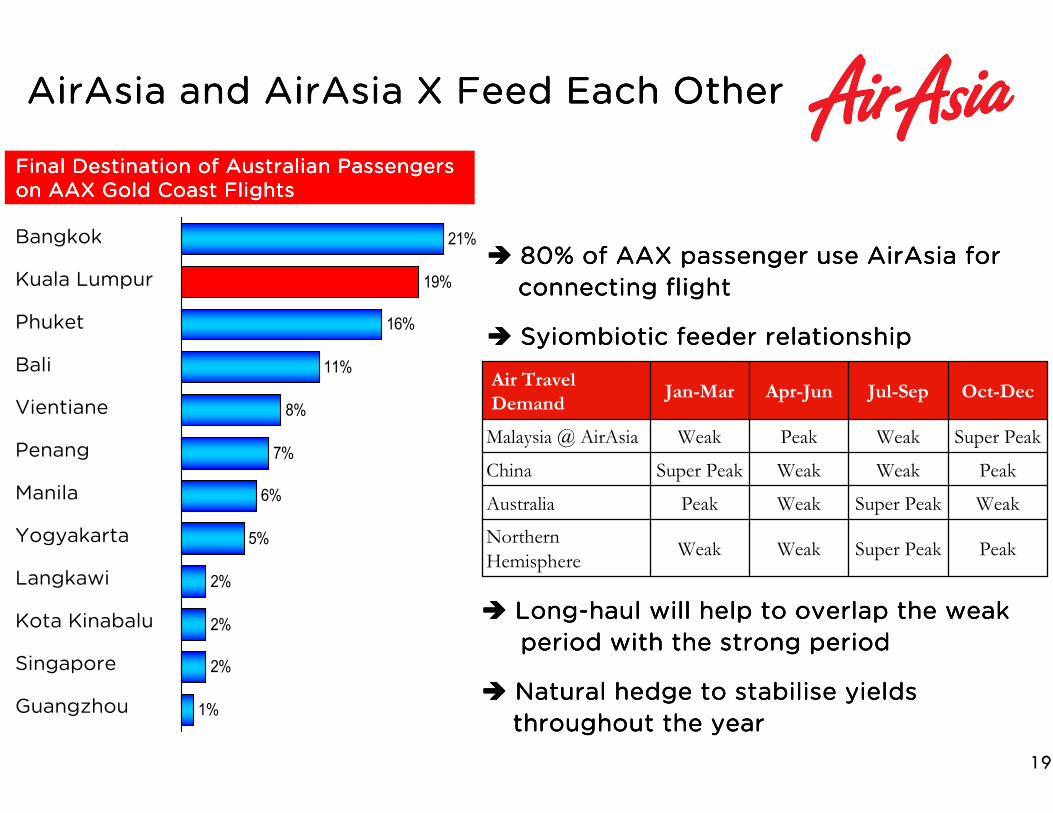
AirAsia and AirAsia X Feed Each OtherAirAsia and AirAsia X Feed Each OtherAirAsia and AirAsia X Feed Each OtherAirAsia and AirAsia X Feed Each Other
Final Destination of Australian Passengers Final Destination of Australian Passengers Final Destination of Australian Passengers Final Destination of Australian Passengers on AAX Gold Coast Flights on AAX Gold Coast Flights on AAX Gold Coast Flights on AAX Gold Coast Flights
21%
19%
16%
11%
8%
7%
6%
5%
2%
2%
2%
1%
Bangkok
Kuala Lumpur
Phuket
Bali
Vientiane
Penang
Manila
Yogyakarta
Langkawi
Kota Kinabalu
Singapore
Guangzhou
19
PeakSuper PeakWeakWeakNorthern
Hemisphere
WeakSuper PeakWeakPeakAustralia
PeakWeakWeakSuper PeakChina
Super PeakWeakPeakWeakMalaysia @ AirAsia
Oct-DecJul-SepApr-JunJan-MarAir Travel
Demand
���� LongLongLongLong----haul haul haul haul will help to overlap the weak will help to overlap the weak will help to overlap the weak will help to overlap the weak
period with the strong period period with the strong period period with the strong period period with the strong period
���� Natural hedge to Natural hedge to Natural hedge to Natural hedge to stabilisestabilisestabilisestabilise yields yields yields yields
throughout the yearthroughout the yearthroughout the yearthroughout the year
���� 80% of AAX passenger use AirAsia for 80% of AAX passenger use AirAsia for 80% of AAX passenger use AirAsia for 80% of AAX passenger use AirAsia for
connecting flight connecting flight connecting flight connecting flight
���� Syiombiotic feeder relationship Syiombiotic feeder relationship Syiombiotic feeder relationship Syiombiotic feeder relationship

Outlook Outlook Outlook Outlook
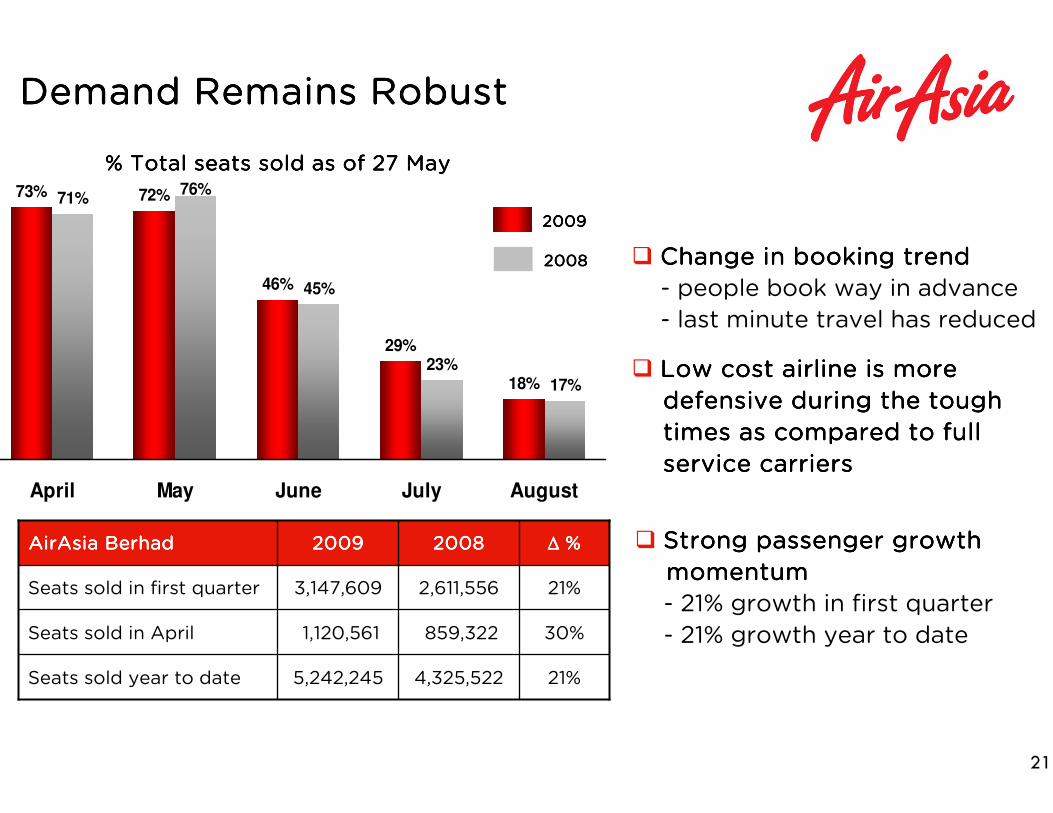
Demand Remains RobustDemand Remains RobustDemand Remains RobustDemand Remains Robust
73% 72%
46%
29%
18%
71%76%
45%
23%
17%
April May June July August
21
% Total seats sold as of 27 May% Total seats sold as of 27 May% Total seats sold as of 27 May% Total seats sold as of 27 May
2009200920092009
2008200820082008
21%2,611,5563,147,609 Seats sold in first quarter
30%859,322 1,120,561 Seats sold in April
21%4,325,5225,242,245Seats sold year to date
∆∆∆∆ %%%%20082008200820082009200920092009AirAsia AirAsia AirAsia AirAsia BerhadBerhadBerhadBerhad
� Change in booking trend Change in booking trend Change in booking trend Change in booking trend
- people book way in advance
- last minute travel has reduced
� Low cost airline is more Low cost airline is more Low cost airline is more Low cost airline is more
defensive during the tough defensive during the tough defensive during the tough defensive during the tough
times as compared to full times as compared to full times as compared to full times as compared to full
service carriers service carriers service carriers service carriers
� Strong passenger growth Strong passenger growth Strong passenger growth Strong passenger growth
momentum momentum momentum momentum
- 21% growth in first quarter
- 21% growth year to date
Summary Summary Summary Summary
� Reaffirming Guidance for full year 2009Reaffirming Guidance for full year 2009Reaffirming Guidance for full year 2009Reaffirming Guidance for full year 2009
– passenger growth of 15%-20%
– lower operating cost with stable yields
� Challenging market, but positive for LCCChallenging market, but positive for LCCChallenging market, but positive for LCCChallenging market, but positive for LCC– LCC is the best suited airline to maneuver challenging economic times
– more people switching to LCC as first choice of travel
– passengers looking for value, LCC is the best value proposition
� Ancillary Income Ancillary Income Ancillary Income Ancillary Income –––– the best defense against high fuel price the best defense against high fuel price the best defense against high fuel price the best defense against high fuel price – new products and services provide huge upside
– more marketing to enhance the take up rates
� Most comprehensive route network in Asia Most comprehensive route network in Asia Most comprehensive route network in Asia Most comprehensive route network in Asia – new routes are enjoying strong support
– competitors are slowing, we are continuing to expand the network
22
AppendixAppendixAppendixAppendixAppendixAppendixAppendixAppendix
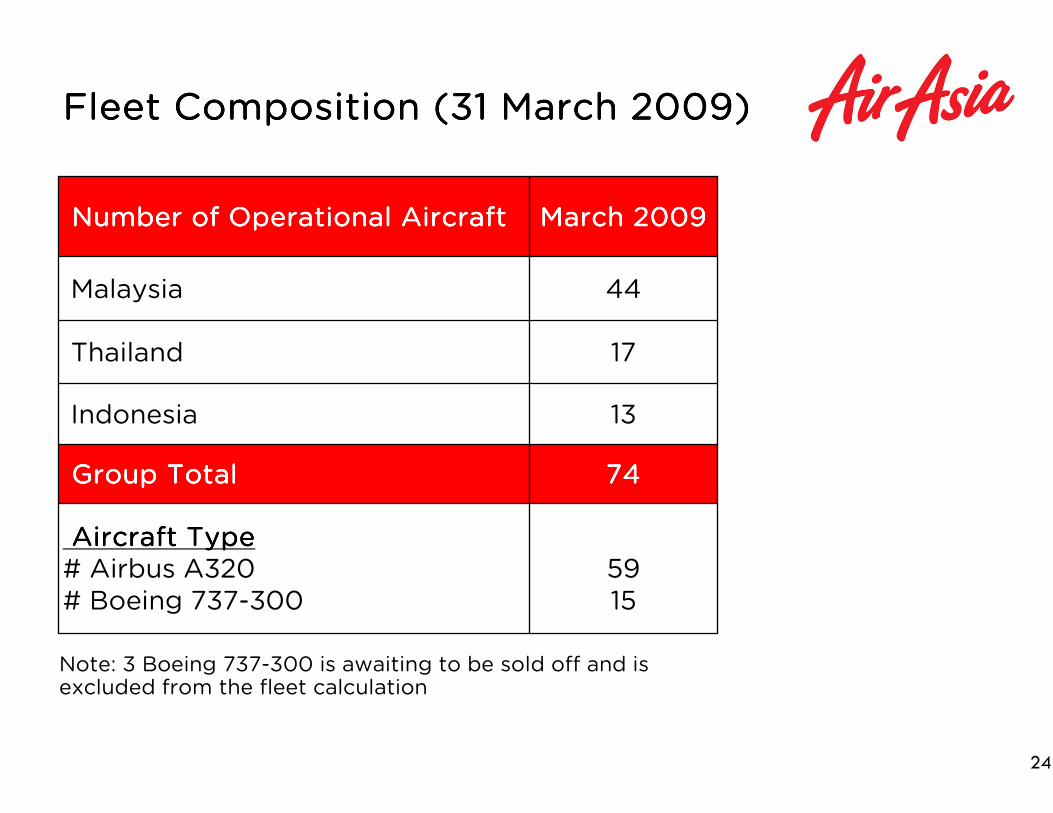
Fleet Composition (31 March 2009)Fleet Composition (31 March 2009)Fleet Composition (31 March 2009)Fleet Composition (31 March 2009)
5915
74747474
13
17
44
March 2009March 2009March 2009March 2009
Aircraft TypeAircraft TypeAircraft TypeAircraft Type# Airbus A320# Boeing 737-300
Group TotalGroup TotalGroup TotalGroup Total
Indonesia
Thailand
Malaysia
Number of Operational Aircraft Number of Operational Aircraft Number of Operational Aircraft Number of Operational Aircraft
24
Note: 3 Boeing 737-300 is awaiting to be sold off and is excluded from the fleet calculation
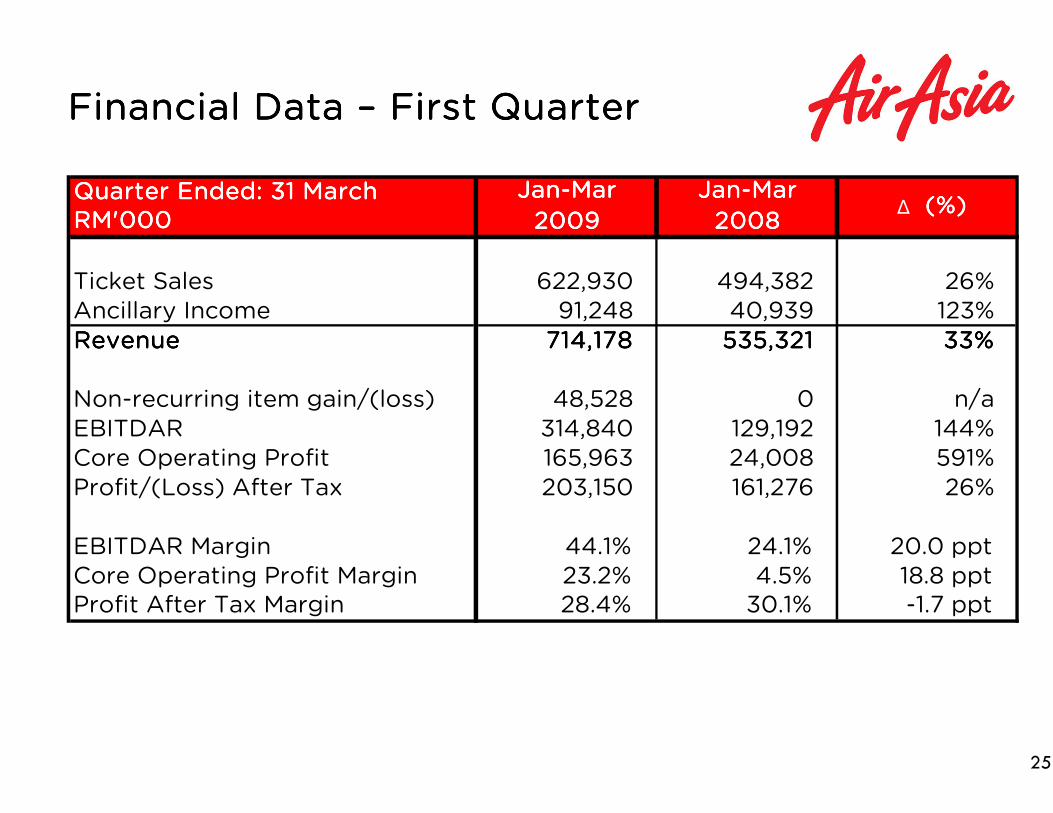
Financial Data Financial Data Financial Data Financial Data –––– First Quarter First Quarter First Quarter First Quarter
25
Quarter Ended: 31 MarchQuarter Ended: 31 MarchQuarter Ended: 31 MarchQuarter Ended: 31 MarchRM'000RM'000RM'000RM'000
Ticket Sales 622,930 494,382 26%Ancillary Income 91,248 40,939 123%RevenueRevenueRevenueRevenue 714,178714,178714,178714,178 535,321535,321535,321535,321 33%33%33%33%
Non-recurring item gain/(loss) 48,528 0 n/aEBITDAR 314,840 129,192 144%Core Operating Profit 165,963 24,008 591%Profit/(Loss) After Tax 203,150 161,276 26%
EBITDAR Margin 44.1% 24.1% 20.0 pptCore Operating Profit Margin 23.2% 4.5% 18.8 pptProfit After Tax Margin 28.4% 30.1% -1.7 ppt
∆ (%)(%)(%)(%)Jan-Mar Jan-Mar Jan-Mar Jan-Mar
2009200920092009
Jan-Mar Jan-Mar Jan-Mar Jan-Mar
2008200820082008

Operating Data Operating Data Operating Data Operating Data –––– First Quarter First Quarter First Quarter First Quarter
26
Passengers Carried 3,147,609 2,611,556 21%ASK (million) 5,207 4,364 19%RPK (million) 3,487 2,970 17%Seat Load Factor 69.7% 72.1% -2.4 pptAverage Fare (RM) 198 189 5%Rev / ASK (sen) 13.72 12.27 12%Rev / ASK (US cents) 3.78 3.82 -1%Cost / ASK (sen) 8.64 10.58 -18%Cost / ASK (US cents) 2.38 3.30 -28%Cost / ASK-ex fuel (sen) 4.88 4.38 11%Cost / ASK-ex fuel (US cents) 1.35 1.37 -2%Aircraft (average) 41.0 36.0 14%Aircraft (end of period) 44 42 5%
Quarter Ended: 31 MarchQuarter Ended: 31 MarchQuarter Ended: 31 MarchQuarter Ended: 31 MarchJan-Mar Jan-Mar Jan-Mar Jan-Mar
2008200820082008
Jan-Mar Jan-Mar Jan-Mar Jan-Mar
2009200920092009∆ (%)(%)(%)(%)
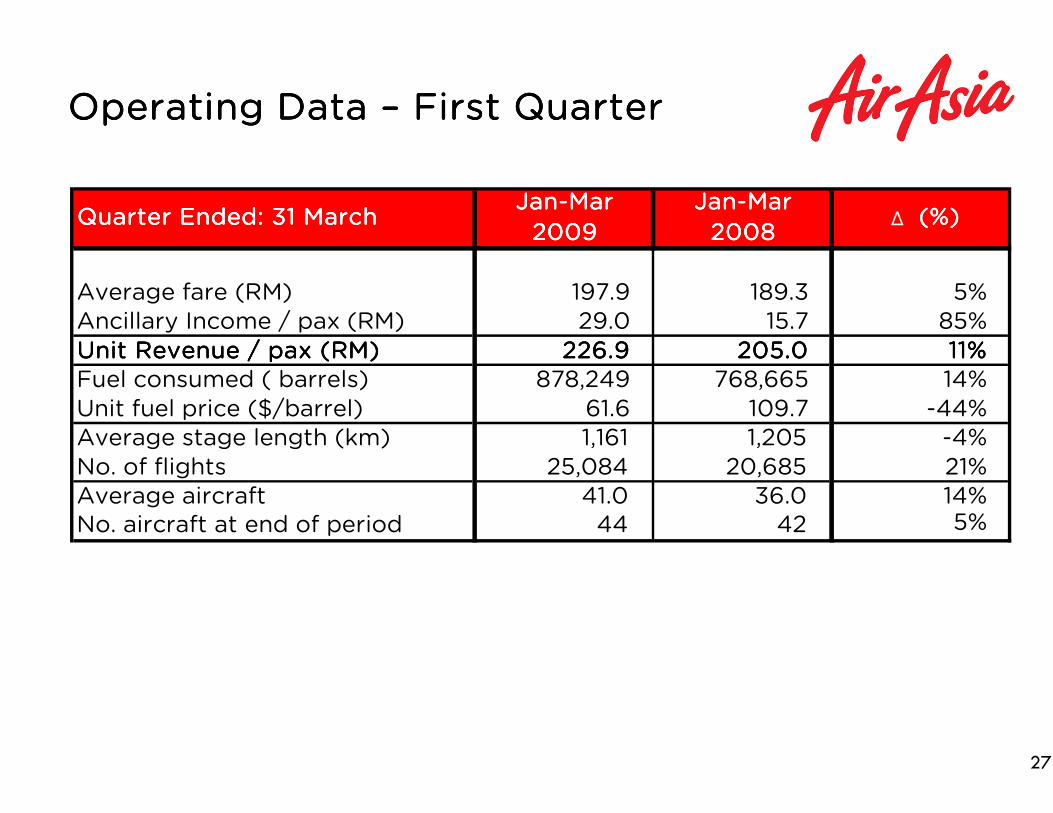
Operating Data Operating Data Operating Data Operating Data –––– First Quarter First Quarter First Quarter First Quarter
27
Average fare (RM) 197.9 189.3 5%Ancillary Income / pax (RM) 29.0 15.7 85%Unit Revenue / pax (RM)Unit Revenue / pax (RM)Unit Revenue / pax (RM)Unit Revenue / pax (RM) 226.9226.9226.9226.9 205.0205.0205.0205.0 11%11%11%11%Fuel consumed ( barrels) 878,249 768,665 14%Unit fuel price ($/barrel) 61.6 109.7 -44%Average stage length (km) 1,161 1,205 -4%No. of flights 25,084 20,685 21%Average aircraft 41.0 36.0 14%No. aircraft at end of period 44 42 5%
Jan-Mar Jan-Mar Jan-Mar Jan-Mar
2008200820082008∆ (%)(%)(%)(%)Quarter Ended: 31 MarchQuarter Ended: 31 MarchQuarter Ended: 31 MarchQuarter Ended: 31 March
Jan-Mar Jan-Mar Jan-Mar Jan-Mar
2009200920092009


![First Draft Meeting PPT - NFPA · Second Revision No. 35-NFPA 901-2015 [ Section No. 2.4 ] 2.4 References for Extracts in Mandatory Sections. NFPA 30, Flammable and Combustible Liquids](https://static.fdocuments.in/doc/165x107/602b35a525ef4411284e5ab0/first-draft-meeting-ppt-nfpa-second-revision-no-35-nfpa-901-2015-section-no.jpg)
