FIRST NINE MONTH OF 2010 - ROADSHOW - …€¦ · Financial results for first 9 months of 2010...
52
Financial results for first 9 months of 2010 Peter Straarup CEO & Chairman of the Executive Board 2 November 2010 FIRST NINE MONTH OF 2010 - ROADSHOW Lars Andreasen Acting CFO
-
Upload
duonghuong -
Category
Documents
-
view
214 -
download
0
Transcript of FIRST NINE MONTH OF 2010 - ROADSHOW - …€¦ · Financial results for first 9 months of 2010...

Financial results for first 9 months of 2010Peter StraarupCEO & Chairman of the Executive Board
2 November 2010
FIRST NINE MONTH OF 2010 - ROADSHOW
Lars AndreasenActing CFO

Agenda
Slide
• Key messages 3
• Highlights 4
• Business trends 5
• Basel III / CRD IV 18
• Macroeconomics 19
• Outlook 20
• Q&A session 21
• Appendix: Trends in focus areas & business units 22
AGENDA
2

-2,000
-1,000
0
1,000
2,000
Den
ma
rk*
No
rwa
y
Sw
eden
Ba
ltic
s
Fin
lan
d
N. I
rela
nd
Irel
an
d
Earnings recovery continues as impairments decline
• Net profit 198% Y/Y to DKK 2.6bn in 9M 2010
• Q3 result shows strong improvement in Denmark
• Cost management continues to deliver results
• Declining impairment charges
• Capital and liquidity are strong
3
DKK m
Profit before taxes(Q3 2010)
* Adjusted for Banking Package 1 (guarantee fee & loan impairment charges)
Q3 2010Q2 2010

DKK m 9M 2009 9M 2010 Index Q2 2010 Q3 2010 Index
Net interest income 20,759 17,774 86 5,927 5,840 99
Net fee income 5,601 6,185 110 2,068 2,069 100
Net trading income 16,283 7,126 44 2,817 1,930 69
Other income 2,211 2,844 129 1,091 703 64
Net income from insurance business 1,031 1,461 142 153 705 461
Total income 45,885 35,390 77 12,056 11,247 93
Expenses* 21,723 19,553 90 6,836 6,294 92
Profit bef. loan imp. charges 24,162 15,837 66 5,220 4,953 95
Loan impairment charges 20,695 10,835 52 3,479 3,083 89
Profit before tax 3,467 5,002 144 1,741 1,870 107
Tax 2,159 2,409 112 804 983 122
Net profit for the period 1,308 2,593 198 937 887 95
Cost/income ratio (%) ex integr.,GW & state guar.fee 38.8 48.5 125 50.1 48.9 98
Core tier 1 capital ratio (%) 8.5 9.8 115 9.1 9.8 107
Risk-weighted assets (DKK bn) 934 843 90 879 843 96
Total loans ex repos (DKK bn) 1,698 1,680 99 1,689 1,680 99
Deposits (ex repos) & issued RD bonds (DKK bn) 1,502 1,487 99 1,487 1,487 100
Total assets (DKK bn) 3,298 3,361 102 3,364 3,361 100
4
* Includes state guarantee fees: DKK 625 m per quarter.
Declining expenses and impairments more than offset lower income

4,500
5,500
6,500
7,500
Q1
08
Q2
08
Q3
08
Q4
08
Q1
09
Q2
09
Q3
09
Q4
09
Q1
10
Q2
10
Q3
10
Quarterly change in net interest income
Y/Y 12%Q/Q 1%
Stable quarterly net interest income not inflated by one-offs
DKK m
* White block is the net cost of government hybrid capital.
*
*
5
Quarterly net interest incomeDKK m
*
*
5,927 5,840
52 9
201
65
82 28
5,000
5,400
5,800
6,200
Q2
20
10
No.
of d
ays
Dep
osit
mar
gin
Lend
ing
mar
gin
Vol
ume
Cur
renc
y ef
fect
Oth
er *
Q3
20
10
* Includes interest on tax refund of DKK106 m in Q210 and 53m higher funding costs
*
*

Stable net fee income despite slow summer season; strong performance at Danske Capital
Activity based fees Y/Y 5% Q/Q 5%Portfolio based fees Y/Y 9% Q/Q 3%
6
Quarterly net fee incomeDKK m
0
500
1,000
1,500
2,000
2,500
Q3 09 Q4 09 Q1 10 Q2 10 Q3 10250
300
350
400
450
Q309 Q409 Q110 Q210 Q310
Quarterly fee income in Danske Capital
DKK m
Total fee income
Fee income adj. for performance fee

0
15
30
45
60
75
90
Jun-08 Mar-09 Dec-09 Sep-10
7
Net trading income at normalised level despite low activity
Breakdown of net trading income
* Q2 10 includes a capital gain of DKK 659m owing to merger of PBS Holding and Nordito AS.** 99% confidence level, 10-day horizon. Calculated as an average of daily VaR values during the period.
IndexDKK m Q2 2009 Q3 2009 Q4 2009 Q1 2010 Q2 2010 Q3 2010
Trading activities 4,410 3,194 1,791 2,013 1,665 1,420
Group Treasury 297 567 -152 119 692 99
Institutional banking (non-Nordic) 26 50 24 75 100 54
Danske Markets in total 4,733 3,811 1,663 2,207 2,457 1,573
BA Denmark 147 139 20 96 159 168
Other trading activities 38 -64 278 76 201 189
Net trading income 4,918 3,886 1,961 2,379 2,817 1,930
Value at Risk (DKK bn)** 0.2 0.2 0.2 0.2 0.3 0.3
*
VIX Volatility
Index

5.8
9.8
5.44.7
0
2
4
6
8
10
12
8
Insurance income up on strong investment return and improved unit-linked result
Net income from insurance businessDKK m 9M 2009 9M 2010 Index Q2 2010 Q3 2010 Index
Premiums (DKK bn) 14.3 17.7 124 5.7 5.5 97
Net income before postponed risk allowance 1,840 1,461 79 330 528 160
Postponed risk allowance -809 0 - -177 177 -
Net income from insurance business 1,031 1,461 142 153 705 461
Unit-linked insurance businessInvestment returns, YTDCustomers’ funds
%
Investments & liabilitiesInvestment return
9M 20109M 2009-50
0
50
100
150
200
250
-15
0
15
30
45
60
75
9M 2006 9M 2007 9M 2008 9M 2009 9M 2010
Premiums Assets under management
DKK mDKK bn
Insurance result

9
Underlying cost base continues to decline; sharp reduction Q/Q owing to seasonality
Expenses and number of employees Quarterly trend in expensesDKK m
DKKm 9M 2009 9M 2010 IndexExpenses 21,723 19,553 90Integration expenses 245 139 57Amortisation of intangibles 380 380 100Severance payments 521 109 21Goodwill impairment charges 1,417 0 -State guarantee fee (Bank Package I) 1,875 1,875 100
Underlying cost base 17,285 17,050 99
Total FTEs (end-period) 22,441 21,634 96
6,836
6,294
290
145
108 45
47
93
6,000
6,500
7,000
Q2
20
10
Hol
iday
pay
men
ts
Dep
. gua
rant
ees
Dep
r. o
f sol
d ca
rs
Pen
sion
obl
igat
ions
Sev
eran
ce p
ay
Oth
er
Q3
20
10

-50
0
50
100
150
200
-2,500
0
2,500
5,000
7,500
10,000
Q4
08
Q1
09
Q2
09
Q3
09
Q4
09
Q1
10
Q2
10
Q3
10
10
Impairment charges fell for seventh consecutive quarter, down almost 50% Y/Y
bp
Total loan imp. charges in basis points
Total impairment chargesCollective impairment charges
Quarterly loan imp. chargesDKK m
Loan impairment charges
DKK m
0
5,000
10,000
15,000
20,000
25,000
9M 2009 9M 2010

0
10
20
30
40
Q109 Q209 Q309 Q409 Q110 Q210 Q310
-1,000
1,000
3,000
5,000
7,000
9,000
Q109 Q209 Q309 Q409 Q110 Q210 Q310
11
Loan impairment charges still dominated by SMEs, but fewer customers in default
Impairments by customer segment- SMEs account for most of the Group’s impairments
PersonalFinancialsLarge corp.SMEs
Net exposures in rating categories 10 and 11*- Declining trend in rating category 11
Exposure DKK bn
Rating category 10
+9%
DKK m
Rating category 11
* Rating category 11 (customers in default)Rating category 10 (financial difficulty, not in default)

3,3192,885
2,097
2,899
2,1682,790
2,195
1,343
0
1,000
2,000
3,000
4,000
5,000
Q4 08 Q1 09 Q2 09 Q3 09 Q4 09 Q1 10 Q2 10 Q3 10
437
297
67
210
10232 3 -11
-100
0
100
200
300
400
500
600
Q4 08 Q1 09 Q2 09 Q3 09 Q4 09 Q1 10 Q2 10 Q3 10
395 385
895
554
-111
125 64 87
-250
0
250
500
750
1,000
1,250
Q4 08 Q1 09 Q2 09 Q3 09 Q4 09 Q1 10 Q2 10 Q3 10
391297
115 109
-12
103
-10 24
-200
0
200
400
600
Q4 08 Q1 09 Q2 09 Q3 09 Q4 09 Q1 10 Q2 10 Q3 10
12
Nordic impairments: Strong improvement in Denmark, stable in other Nordics
Sweden,11% of Group’s lending
Denmark, 59% of Group’s lending Finland, 9% of Group’s lending
Norway, 9% of Group’s lending
*Acc. imp. DKK 19,304 m - Individual 168 bp
- collective 24 bp
DKK m DKK m
127 bp112 bp 114 bp
137 bp
92 bp 91 bp
216 bp
25 bp
90 bp
68 bp
27 bp
55 bp
124 bp
77 bp
18 bp
* Accumulated impairments at the end of period in DKK m and as basis points of total lending. ** Exclusive of payment to Financial Stability.
82 bp 86 bp
- 28 bp
-3 bp27 bp
DKK mDKK m
111 bp
32 bp
23 bp
8 bp
*Acc. imp. DKK 2,674 m - individual 156 bp
- collective 13 bp
*Acc. imp. DKK 1,388 m - individual 69 bp
- collective 4 bp
*Acc. imp. DKK 1,503 m - Individual 92 bp
- collective 4 bp
87 bp
-2 bp
16 bp
1 bp
53 bp(33 bp **)
5 bp
22 bp
-3 bp

3,027
1,640771
75871
-124-725
229
-1,000
0
1,000
2,000
3,000
4,000
5,000
Q4 08 Q1 09 Q2 09 Q3 09 Q4 09 Q1 10 Q2 10 Q3 10
1,002
1,473 1,346 1,232 1,187 1,089
1,647
1020
0
800
1,600
2,400
Q4 08 Q1 09 Q2 09 Q3 09 Q4 09 Q1 10 Q2 10 Q3 10
213
559
839714
613
13851 -18
-400
0
400
800
1,200
Q4 08 Q1 09 Q2 09 Q3 09 Q4 09 Q1 10 Q2 10 Q3 10
415 445 419371
164120
254
409
0
250
500
750
Q4 08 Q1 09 Q2 09 Q3 09 Q4 09 Q1 10 Q2 10 Q3 10
13
Other impairments: Northern Ireland and Ireland are the most problematic
DKK m
DKK mDKK m
DKK m
Other activities
Northern Ireland, 3% of Group’s lending Ireland, 4% of Group’s lending
Baltics, 1% of Group’s lending
Incl. Danske Markets, 4% of Group’s lending
279 bp
311 bp 358 bp296 bp
633 bp
505 bp
736 bp683 bp
1,027 bp
280 bp
749 bp
1,173 bp1,039 bp
577 bp
317 bp
36 bp
127 bp
620 bp
914 bp
467 bp
96 bp
576 bp
211bp
-69 bp
* Accumulated impairments at the end of period in DKK m and as basis points of total lending.
*Acc. imp. DKK 2,839 m - individual 472 bp
- collective 53 bp
*Acc. imp. DKK 10,744 m - individual 1358 bp
- collective 119 bp
*Acc. imp. DKK 3,034 m - individual 860 bp- collective 366 bp
*Acc. imp. DKK 4,897m - individual 707 bp
- collective 57 bp
185 bp
80 bp
883 bp
-377 bp
303 bp
561 bp
143 bp-29 bp

0
20
40
60
80
Q409 Q110 Q210 Q310
Tax rate is inflated by losses in Ireland and adjustment of previous years
14
DKK m Q1 2010 Q2 2010 Q3 2010Pre-tax profit, Group 1,391 1,741 1,870Pre-tax loss, BA Ireland 992 1,553 942Gain on PBS-Nordito merger - 659 -
A Pre-tax profit, Group, adjusted 2,383 2,635 2,812
Tax according to P&L 622 804 983Portion from adj. of previous years - 47 249
B Tax , adjusted 622 757 734
B/A Tax rate, adjusted 26.1% 28.7% 26.1%
Explanation of tax rate Quarterly tax rate%
Adjusted tax rate
Actual tax rate
One-offs

0
10
20
30
40
0
50
100
150
200
2008 2009 2010 2011
Funding need for 2010 completed with duration extended; very limited need in 2011
DKK bn
Issued funding until end of Q3 2010 Estimated funding need
Funding sources- Shift towards long-term funding sources
Cen
tral
ban
ks
Cre
dit
inst
. (ex
. CB
)
Rep
o
Sho
rt-t
erm
bon
ds
Dep
osit
s
Mor
tgag
e fin
ance
(mat
ch-f
unde
d)
Cov
ered
bon
ds
long
-ter
m b
onds
Sub
ordi
nate
d de
bt
Sha
reho
lder
s' e
quit
y
Q3 2010
Q4 2008
%
New funding 2008-11- Entire funding need of DKK 30bn for 2010
already more than covered
Short-term funding Long-term funding
15
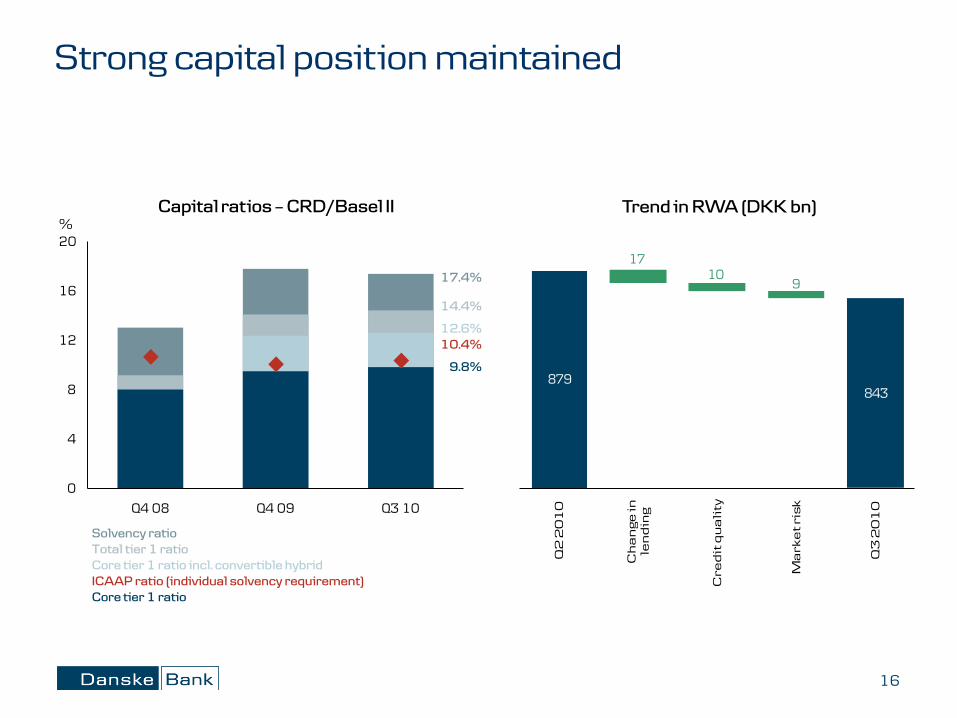
879 843
1710
9
Q2
20
10
Ch
an
ge
in
len
din
g
Cre
dit
qu
ali
ty
Ma
rke
t ri
sk
Q3
20
10
0
4
8
12
16
20
Q4 08 Q4 09 Q3 10
Strong capital position maintained
Capital ratios – CRD/Basel II Trend in RWA (DKK bn)
16
%
Solvency ratio Total tier 1 ratio Core tier 1 ratio incl. convertible hybridICAAP ratio (individual solvency requirement)Core tier 1 ratio
17.4%
14.4%
12.6%10.4%
9.8%

The new Basel III proposal is a step in the right direction, but there are still some issues
• Danske Bank is already aligned with new minimum core tier 1 ratio of 7%
• According to our preliminary assessment, Danske Bank’s core tier 1 capital will be reduced by 1 percentage point:
• RWA will increase by 5 percentage points
• Core equity will decline, mainly because of solvency requirement at Danica and minority interests
• Key concerns about the treatment of the unique Danish mortgage market have not been resolved
17

-16
-12
-8
-4
0
4
8
2009 2010E 2011E
The macroeconomic recovery is still modest
%
Source: Danske Research (October 2010).
GDP, 2009-11E(Growth Y/Y)
* Excl. one-off bank bailout costs.Source: Danske Research (October 2010).
Baltics
Ireland
Sweden
Finland
DenmarkEuroland
Norway
18
Public finances
Gross public Budget bal. Sovereign ratingdebt % of GDP % of GDP & outlook (S&P)
2010 2011Denmark 43.0 -4.4 AAA/StableSweden 43.6 -4.1 AAA/StableNorway 26.0 10.0 AAA/StableFinland 49.0 -1.5 AAA/StableIreland* 77.9 -10.0 AA/Negative

19
Outlook for the rest of 2010 remains cautious
• Macroeconomic improvement, but stable short-term rates and volumes
• Income trend in line with first nine months
• Focus on costs will continue
• Fourth-quarter specifics relative to Q3:
• Fee expenses of DKK 75 m for state guarantee on DKK 38 bn funding (80 bp)
• Expenses down DKK 625 m as fee for general state guarantee has terminated
• Expenses higher due to seasonality (holiday payments, end-of-year costs), IT investment and marketing costs
• Impairment of DKK 466 million under the state guarantee has terminated
• Solid foundation going forward

20
www.danskebank.com/ir

21
Appendix

0
250
500
750
Q1 Q2 Q3 Q4
22
Net interest income - Realkredit Danmark
DKK m
20102009
Note: ex. customer margin and interest on convertible gov’t hybrid capital.

0.75
1.25
1.75
2.25
2.75
Q1 09 Q2 09 Q3 09 Q4 09 Q1 10 Q2 10 Q3 10
23
Net interest income – NII margins by business unit
Net interest margins Q1 2009 – Q3 2010(NII /loan stock)%
Baltics
Ireland
Sweden
Norway
DenmarkGroup
Northern Ireland
Finland

0.0
0.5
1.0
1.5
2.0
2.5
Denmark Finland Sweden Norway Northern Ireland Ireland Baltics
24
Lending margins under pressure as competition grows
%
Quarterly lending margins Q1 2009 – Q3 2010(loan stock)
* Incl. Realkredit Danmark
*

-0.2
0.0
0.2
0.4
0.6
0.8
1.0
Denmark Finland Sweden Norway Northern Ireland Ireland Baltics
25
In some markets, deposit margins are benefiting from increasing short-term rates
Quarterly deposit margins Q1 2009 – Q3 2010(deposit stock)%

0
1
2
3
4
Jun-07 Dec-07 Jun-08 Dec-08 Jun-09 Dec-09 Jun-10
USD
EUR
-100
0
100
200
300
400
Jan-08 Jul-08 Jan-09 Jul-09 Jan-10 Jul-10
26
Favourable market conditions for Danske Markets, but levelling off as expected
EUR/SEK 12M volatility- High FX volatility boosts activity
%
DKK yield curve-Flattening yield curve erodes earnings%
Year
% 3 M Libor vs. overnight swap rate -spread
-Back to pre-crisis level
Covered and mortgage bond ASW spreads- Maintained low spreads on Danish covered bonds
bp, mid
Ireland
Spain
UK
Denmark
Germany
1
2
3
4
5
0 3 6 9 12 15 18 21 24 27 30
30/12/2009
30/06/2010
30/09/2010
0
5
10
15
20
Jul-08 Apr-09 Jan-10 Oct-10

0
1,000
2,000
3,000
4,000
Q1 09 Q2 09 Q3 09 Q4 09 Q1 10 Q2 10 Q3 10
Rise in trading and investment portfolio YTD driven by falling interest rates and increasing USD
Other assets +12%
Trading & inv. portfolio
Banks & repos - 21%
DKK bn
Lending - 1%
Change Y/Y
+18%
Total + 2%
Trend in total assetsend of period
27

Credit exposure decreased by 5% Y/Y
Credit exposure from lending activity, end-Q3 2010(DKK 2,330bn, including DKK 1,846bn in lending and repos)
28
Central and local governments
5% Subsidised housing companies
5%
Banks8%
Commercial property
10%
Construction, engineering and
building products2%
Diversified financials8%
Other financials3%
Energy and utilities2%
Consumer discretionary and consumer staples
9%
Transportation and shipping
3%
Other industrials8%
Personal customers37%

0
20
40
60
80
2001 2002 2003 2004 2005 2006 2007 2008 2009 9M 2010
Source: Moody’s and own data.
Upgrades/downgrades ratio is improving, but Denmark continues to lag
29
Downturn DownturnUpturn
Upgrades > downgrades
Downgrades > upgrades
Upgrades / total internal rating changes on the corporate book%
Denmark
Outside Denmark

0
100
200
300
400
500
19
79
19
80
19
81
19
82
19
83
19
84
19
85
19
86
19
87
19
88
19
89
19
90
19
91
19
92
19
93
19
94
19
95
19
96
19
97
19
98
19
99
20
00
20
01
20
02
20
03
20
04
20
05
20
06
20
07
20
08
20
09
09
10
30
Much larger increase in bankruptcies in Denmark than in the other Nordic countries
SwedenFinland
Denmark
Norway
Number of monthly bankruptcies in the Nordics(indexed, Jan. 1996 =100)
Index
Denmark updated until September 2010.Source: EcoWin.

Credit exposure to commercial property and construction segments
3131
DKK bnCommercial
property
Portion from
developers
Construction and building
materialsSector in
totalDenmark 109.5 1.0 12.7 122.1Finland 15.2 0.6 6.7 21.9Sweden 57.0 0.2 4.8 61.8Norway 32.7 2.4 2.4 35.1Northern Ireland 9.8 3.2 4.4 14.2Ireland 15.7 4.4 3.3 19.1Baltics 2.2 0.8 0.5 2.7Other 1.1 0.1 2.3 3.3Total 243.1 12.7 37.1 280.2
Gross exp. subject to individual imp.testing 32.3 7.4 39.7Individual impairment charges 12.2 3.4 15.6 Portion from BA Ireland 7.8

Exposure to agriculture DKK bn Realkredit Danmark 45Banking Activities Denmark 13Other business units 14Agriculture 71
Agriculture LTV, Realkredit Danmark %Q4 2008 46Q4 2009 64Q2 2010 72Q3 2010 71
Danish agriculture sector pressured by lower property and output prices
32
Agriculture26%
Cattle breeding24%Pig breeding
23%
Grocery trade14%
Mixed operations
7%
Other6%

429 511
183281
1,097
2,990
1,801
1,986
595
0
500
1,000
1,500
2,000
2,500
3,000
Denmark Finland Sweden Norway Northern Ireland
Ireland Baltics Other Act. Group
Q208 Q308 Q408 Q109 Q209 Q309 Q409 Q110 Q210 Q310
Gross exposure subject to individual imp. test in basis points of total loansbp
33
Gross exp. subject to individual imp. test; reflects difficult economic conditions in certain markets

43.2
5.7
11.4
10.4
7.36.5 0.4
8.13.44.55.9
21.7
4.411.1
60.666.3
77.8
88.195.5
102.0 102.4 102.4
0
20
40
60
80
100
120
Q1 09 Q2 09 Q3 09 Q4 09 Q1 10 Q2 10 Q3 10 Q3 10
Gross exposure subject to individual impairment testDKK bn
34
Quarterly trend in gross exposure subject to individual impairment test
In basis points of gross lending
Ireland 2,990 bp
Other 1,986 bp
Finland 511 bp
Denmark 429 bp
Norway 281 bp
Baltics 1,801 bp
Sweden 183 bp
N. Ireland 1,097 bp

140
160
180
200
4,000
8,000
12,000
16,000
19
95
19
96
19
97
19
98
19
99
20
00
20
01
20
02
20
03
20
04
20
05
20
06
20
07
20
08
20
09
20
10
E
20
11
E
20
12
E
Region Prices Price fall Change inpeaked since peak (%) Q310 (%)
Copenhagen Q3 2006 -24.9 1.4Zealand Q3 2007 -21.6 0.4South Denmark Q1 2008 -3.8 -0.6Central Jutland Q4 2007 -1.8 1.3North Jutland Q2 2010 -1.4 -1.4Denmark overall Q2 2007 -12.5 0.6
0
500
1,000
1,500
2,000
0
5
10
15
19
80
19
84
19
88
19
92
19
96
20
00
20
04
20
08
0
100
200
300
400
500
19
96
19
97
19
98
19
99
20
00
20
01
20
02
20
03
20
04
20
05
20
06
20
07
20
08
20
09
Q3
10
35
Property pricesIndex 1996 = 100
Correlation between unemploymentand foreclosures in Denmark
10-year yield
Unemployment
Foreclosures
Source: Danske Research.
No.
Ireland
UK
Norway
DenmarkFinlandSweden
Source: Danske Research.
Signs of housing market stabilising
Correlation between house prices and consumption in Denmark
Source: Danske Research.
Source: Realkredit Denmark.
Consumption
Priceper sqm. DKK bn
House prices
Danish house price development by regions
%
9M
10

0.4
0.6
0.8
1.0
1.2
Feb-
09
Mar
-09
Apr
-09
May
-09
Jun-
09
Jul-0
9
Aug
-09
Sep
-09
Oct
-09
Nov
-09
Dec
-09
Jan-
10
Feb-
10
Mar
-10
Apr
-10
May
-10
Jun-
10
Jul-1
0
Aug
-10
0
25
50
75
100
125
150
0
1,500
3,000
4,500
6,000
20
01
20
02
20
03
20
04
20
05
20
06
20
07
Q1
08
Q2
08
Q3
08
Q4
08
Q1
09
Q2
09
Q3
09
Q4
09
Q1
10
Q2
10
Q3
10
Mortgages in Denmark: low average LTV ratio, arrears picking up, but still low
Mortgage finance: number of arrears, end-period 3- & 6-month arrears and repossessed properties No. No.
Danish mortgages• 145 repossessed properties and 3908 arrears out
of 412,262 loans at end-Q3 (0.9%)• 1.1% of loans with LTV>80% and low rating• Max. 80% LTV on origination for private individuals
(legal requirement)• Max. 60% LTV on origination for commercial
mortgages (legal requirement)• Average LTV of 68% at end-Q3
Breakdown of loans by LTV and rating categoryMortgage finance (residential & commercial)
End-Q310
Arrears on retail loans with monthly payments - Improvement due to lower rates on 1 year floaters
%
36
LTV/rating 1-3 4-7 8-11 Total
0-20% 8.6% 21.8% 4.2% 34.6%
20-40% 5.9% 18.5% 3.9% 28.2%
40-60% 3.5% 13.6% 3.2% 20.4%
60-80% 1.7% 7.9% 2.1% 11.7%
>80% 1.0% 3.1% 1.1% 5.2%
Total (DKK bn) 147 462 104 712

Credit bonds 5%
Certificates 2%Quasi-
government 2%
Swedish covered bonds
15%
Other covered bonds 5%
Governments & municipals 27%
Danish mortgage bonds
44%
Liquid, highly rated bond portfolio
Bond portfolio(DKK 418bn)
37
Rating distribution
Level 1-3 assets
Level 1 89%Level 2 11%Level 3 0%
AAA 82%
AA+ 7%
AA 1%
AA- 4%
A+ 2%
A 1%
A- 0%
BBB+ 0%
BBB 1%
BBB- 0%
BB+ 0%
BB 0%
BB- 0%
Lower 0%
NA 1%

-150
0
150
300
450
1 m
onth
2 m
onth
s
2 m
onth
s
4 m
onth
s
5 m
onth
s
6 m
onth
s
9 m
onth
s
12
mon
ths
105
110
115
120
125
0
100
200
300
400
Q408 Q109 Q209 Q309 Q409 Q110 Q210 Q310
Strong loan-to-deposits ratio and liquidity position
38
Loan-to-deposit gap (DKK bn) and ratio (%)
Note: Deposits include Realkredit Denmark bonds.
DKK bn %
Loan-to-deposit gap Loan-to-deposit ratio
DKK bn
* Main assumptions: No access to capital markets; no refinancing of debt to credit institutions, issued bonds or subordinated capital; and moderate reduction of business activities.
12-month liquidity*Moody’s Financial Strength
End-Q3 2010
End-Q4 2008
End-Q4 2009

Well-diversified funding position
• 57% deposits and fully match-funded Danish mortgage bonds (net)
• Long-term bonds DKK 186bn
• Issued covered bonds DKK 117bn
• Termination of state guarantee at end-September has not changed the funding market.
• Total borrowing decreased by DKK 48 billion in Q3 due to scheduled repayment
39
Deposits, 32%
Match-funded DK mortgage bonds,
25%
Covered bonds, 4%
Subordinated debt, 3%
L-T bonds, 8%
S-T bonds, 7%
Banks, net, 6%
Repos, 6%
Central banks, 4%Equity, 4%

Frontloaded on funding in 2010; all completed with long duration and without guarantees
• YTD Danske Bank has issued bonds for DKK 40 bn, covering more than the estimated long-term funding needed for 2010 (DKK 30 bn)
• 47% of the issuance in covered bonds and 53% in senior debt
• Longest maturity: 15 years
• Weighted average maturities:
– All issues: 7 years– Covered bonds: 10 years– Senior debt: 4 years
• First 12-year covered bond benchmark from Nordic issuer
40
Issues by type and currency
Issue type Currency DKK bnCovered bonds EUR 17
NOK 2CHF 1
Senior debt EUR 11USD 4GBP 3Other 2
Total 40

0
1
2
3
4
Q309 Q409 Q110 Q210 Q310
20
25
30
35
Q309 Q409 Q110 Q210 Q310
41
Banking Activities Denmark: Improvement due to lower costs and impairments, but s-t rate hurts
Profit before loan impairment charges 21%- Declining NII reduces income, partly offset by drop in expenses
DKK bn
Trend in lending volume(average)
Corporate: Y/Y 6%Q/Q 0%
Retail: Y/Y 0%Q/Q 0%
% Market shares(ex Realkredit Danmark)
Deposits
Lending
Deposits
Lending
% Margin trends(ex Realkredit Danmark)
Note: As per 1.1. 2010 operating leasing moved from BA Denmark to Other Banking Act.Move reduces BA Denmark’s quarterly other income and expenses by approx. DKK 150m.
DKK m 9M 2009 9M 2010 IndexNet interest income 12,075 10,015 83 Net fee income 2,708 2,970 110 Other income 1,240 770 62 Total income 16,023 13,755 86 Total expenses 9,311 8,442 91 Profit bef. loan imp. charges 6,712 5,313 79 Loan impairment charges 7,881 6,328 80 Profit before tax -1,169 -1,015 -Bank pack.1 (fees & loan imp.charges) 3,078 3,268 106 Adj. profit before tax 1,909 2,253 118
ROE before loan imp. chgs 23.0 18.90
150
300
450
600
Q309 Q409 Q110 Q210 Q310

0.0
0.5
1.0
1.5
Q309 Q409 Q110 Q210 Q310
6
9
12
15
18
Q309 Q409 Q110 Q210 Q310
Banking Activities Finland: Lower costs and imp. charges, but declining NII reduces profit
Profit before loan impairment charges 53%- NII pressured by low interest rates despite strong deposit growth
Trend in lending volume(average)
%
Deposits
Lending
42
DKK bn Retail: Y/Y 3%Q/Q 2%
Corporate: Y/Y 12%Q/Q 1%
Deposits
Lending
% Market sharesMargin trends
DKK m 9M 2009 9M 2010 IndexNet interest income 2,387 1,739 73 Net fee income 818 863 106 Other income 337 313 93 Total income 3,542 2,915 82 Total integration expenses 520 491 94 Expenses ex total intgr. exp. 1,979 1,937 98 Profit bef. loan imp. charges 1,043 487 47 Loan impairment charges 1,834 276 15 Profit before tax -791 211
ROE before loan imp. chgs 18.5 9.7 50
75
100
Q309 Q409 Q110 Q210 Q310

0.0
0.5
1.0
1.5
Q309 Q409 Q110 Q210 Q310
25
50
75
100
125
Q309 Q409 Q110 Q210 Q310
0
2
4
6
8
Q309 Q409 Q110 Q210 Q310
43
Banking Activities Sweden: Benefits from increasing short-term rates and low impairments
Profit before loan impairment charges 21%- Affected by 11% appreciation of SEK against DKK
Trend in lending volume(average, %-change in local currency)
% Market shares
LendingLending
Deposits
Deposits
DKK bn Retail: Y/Y 17%Q/Q 5%
Corporate: Y/Y 2%Q/Q 1%
% Margin trends
DKK m 9M 2009 9M 2010 IndexNet interest income 1,508 1,710 113 Net fee income 467 515 110 Other income 101 125 124 Total income 2,076 2,350 113 Expenses 1,095 1,161 106 Profit bef. loan imp. charges 981 1,189 121 Loan impairment charges 521 117 22 Profit before tax 460 1,072 233
ROE before loan imp. chgs 15.8 19.3

0
2
4
6
8
10
Q309 Q409 Q110 Q210 Q310
0.0
0.5
1.0
1.5
Q309 Q409 Q110 Q210 Q310
44
Banking Activities Norway: Lower loan imp. charges lead to improved profit before taxes
Profit before loan impairment charges 14%- Costs 4% in local currency. 10% appreciation of NOK against DKK
Trend in lending volume(average %-change in local currency)
%
DepositsDeposits
Lending
Lending
Retail: Y/Y 16%Q/Q 2%
Corporate: Y/Y 1%Q/Q 1%
DKK bn
% Market sharesMargin trends
DKK m 9M 2009 9M 2010 IndexNet interest income 1,988 1,764 89 Net fee income 254 279 110 Other income 436 519 119 Total income 2,678 2,562 96 Expenses 1,349 1,417 105 Profit bef. loan imp. charges 1,329 1,145 86 Loan impairment charges 574 24 4 Profit before tax 755 1,121 148
ROE before loan imp. chgs 23.0 19.725
50
75
100
125
Q309 Q409 Q110 Q210 Q310

0
10
20
30
40
Q309 Q409 Q110 Q210 Q310 0.0
0.5
1.0
1.5
2.0
2.5
Q309 Q409 Q110 Q210 Q310
DKK m 9M 2009 9M 2010 IndexNet interest income 978 899 92 Net fee income 221 232 105 Other income 54 79 146 Total income 1,253 1,210 97 Total integration expenses 53 0 -Expenses ex total intgr. exp. 812 867 107 Profit bef. loan imp. charges 388 343 88 Loan impairment charges 1,235 783 63 Profit before tax -847 -440 -
ROE before loan imp. chgs 26.1 24.1
45
Banking Activities Northern Ireland: Resilient top line, but loan impairments still high
Profit before loan impairment charges 12%- Slightly declining NII despite higher deposits (in local currency)
Market shares%Margin trends%
Trend in lending volume(average, %-change in local currency)
Corporate
Retail
Lending
Deposits
* Corporate lending growth is adjusted for lending to public authorities.
DKK bn
* *
0
25
50
Q309 Q409 Q110 Q210 Q310 * Incl. a levy of DKK 49m in 9M09 and DKK 45m in 9M10
by the UK financial services compensation scheme.
Corporate: Y/Y 7%*Q/Q 1%*
Retail: Y/Y 3%Q/Q 0%

0
2
4
6
8
Q309 Q409 Q110 Q210 Q310
46
Banking Activities Ireland: Still high impairment charges for commercial property segment
%
Profit before loan impairment charges 24%- Income under pressure, cost reduction not fully visible until 2011
Margin trends% Market shares
Trend in lending volume(average)
Lending
Deposits
Lending
Deposits
DKK bnRetail: Y/Y 7%
Q/Q 2%Corporate: Y/Y 5%
Q/Q 3%
DKK m 9M 2009 9M 2010 IndexNet interest income 897 809 90 Net fee income 98 80 82 Other income 42 35 83 Total income 1,037 924 89 Total integration expenses 24 0 -Expenses ex total intgr. exp. 658 655 100 Profit bef. loan imp. charges 355 269 76 Loan impairment charges 4,051 3,756 93 Profit before tax -3,696 -3,487 -
ROE before loan imp. chgs 14.6 12.6 0
25
50
Q309 Q409 Q110 Q210 Q310
0.0
0.5
1.0
1.5
2.0
Q309 Q409 Q110 Q210 Q310

-0.5
0.0
0.5
1.0
1.5
2.0
Q309 Q409 Q110 Q210 Q310 0
5
10
15
Q309 Q409 Q110 Q210 Q310
0
10
20
Q309 Q409 Q110 Q210 Q310
47
Banking Activities Baltics: Profit turns positive as loan impairment charges normalises
Profit before loan impairment charges turns positive- Increased efficiency and profitability due to tight cost control Trend in lending volume
(average)
%Market shares – lending
Retail: Y/Y 6%Q/Q 2%
Corporate: Y/Y 16%Q/Q 3%
Estonia
Latvia
Lithuania
DKK bn
Margin trends
Deposits
Lending%
DKK m 9M 2009 9M 2010 IndexNet interest income 378 376 99 Net fee income 100 115 115 Other income 98 83 85 Total income 576 574 100 Goodwill impairment charges 1,417 0 -Expenses ex. gw imp. charges 287 259 90 Profit bef. loan imp. charges -1,128 315 -Loan impairment charges 2,112 171 8 Profit before tax -3,240 144 -
ROE before loan imp.chgs & gw 27.5 36.0

-
2,000
4,000
6,000
8,000
10,000
12,000
14,000
16,000
18,000
48
Danske Markets: Income down to more normal level
Profit before tax down to more normal level- Decline reflects exceptionally high income in 9M09
Quarterly breakdown of income
Trading activities – accumulated incomeFixed income and forex
2010 2008
Q1 Q2 Q3 Q4
Market position in the Nordics- Strong position in all main product areas
Source: Prospera.
2009
DKK m 9M 2009 9M 2010 IndexTotal income 15,575 6,237 40 Expenses 2,231 2,077 93
Profit bef.loan imp.charges 13,344 4,160 31
Loan impairment charges 2,343 -683 -
Profit before tax 11,001 4,843 44
ROE before loan imp. chgs 381.6 115.0
DKK m Q4 2009 Q1 2010 Q2 2010 Q3 2010Trading activities 1,791 2,013 1,665 1,420Group Treasury -152 119 692 99
Institutional banking (non-Nordic) 24 75 100 54
Danske Markets in total 1,663 2,207 2,457 1,573
*Q2 10 includes a capital gain of DKK 659m owing to merger of PBS Holding and Nordito AS.
*
Product area / # NordicFixed income 2 1 3 2 2Forex 1 2 3 2 2Derivatives 2 1 1 1 1Equities 1 6 11 2 5

49
Danske Capital: Net fees up 23% due to higher volume in assets under management
AuM – Customer breakdownDKK bn
AuM – Asset breakdown
%
Bonds
Equities
Cash
Margin for asset management(adjusted income incl. performance fee/business volume end of period)
Life insurance
Retail cust.
Institutional
Private equity
Profit before loan impairment charges 4%- Lower total income reflects change of business Luxembourg
%
0
25
50
75
100
Q309 Q409 Q110 Q210 Q310
0.10
0.15
0.20
0.25
0.30
0.35
Q309 Q409 Q110 Q210 Q310
0
200
400
600
Q309 Q409 Q110 Q210 Q310
DKK m 9M 2009 9M 2010 IndexNet fee income 873 1,074 123 Total income 1,236 1,199 97 Expenses 718 702 98 Profit bef. loan imp. chrg ex.GL&off-offs 518 497 96 Loan impairment charges 54 4 7 Profit before tax 464 493 106
-60%
-40%
-20%
0%
20%
40%
60%
-2% -1% 0% 1% 2%
Cha
nge
in e
quit
y pr
ices
Change in interest rate
6%2%
9%
16%
67%
5.8
9.8
5.44.7
0
2
4
6
8
10
12
Risk allowance possible
Risk allowance not possible
Danica Pension: Investment return secure full risk allowance
Investment returns, YTDCustomers’ funds
Net income from insurance business 42%
%
Possibility of booking full risk allowance Base: end-Q3 2010
Investments & liabilitiesInvestment return
Other bonds, etc.
Listed equities
Other equities
Asset allocationCustomers’ funds
Properties-10.4%
50
9M 20109M 2009
DKK m 9M 2009 9M 2010 IndexPremiums (DKK bn) 14.3 17.7 124Share of technical provisions 809 837 103Health and accident (insurance result) -56 -15 -Unit-linked (insurance result) 108 209 194Investment result 1,185 828 70Financing result -206 -98 -
Special allotments 0 -300 -Net income before postponed risk allowance 1,840 1,461 79
Postponed risk allowance -809 0 -
Net income from insurance business 1,031 1,461 142
Net income as % p.a. of allocated cap. 24.0 34.7
Credit bonds

837
Profit model DKK m
• Risk allowance 64 bp of technical prov. (DKK 174 bn)
• Return on investment portfolio at shareholders’ risk 828
• Financing result-98
• Insurance result, Unit linked long-term: 0.4-0.5% of AuM
209
Total 1461
Condition / sensitivity
• No usage of bonus potential of paid-up policies and sufficient investment income
• Equity markets, interest rates
• ST interest rate (equity –alloc. cap. + subord. bonds)
• High new sales will lower result and vice versa
9M 2010
• Positive technical basis of DKK 3.6 bn
• Annualised investment return: 3.5%
• Low short-term interest rate
+
+
+
=
∑
1
2
3
4
51
Danica’s profit model
• Special allotments, depending on profit and business volume -300
• Expected to be –DKK 0.5 bn p.a. in next 2-4 years, then declining5
• DKK 300 m in Q1-Q3 2010
• Shadow account
• Health & accident 0
-15
• DKK 583 m remains
• Combined ratio6
• Possibility of booking evaluated at the end of the year
• High competition
+
+
• Result of unit-linked business is now positive

Disclaimer
This presentation does not constitute or form part of and should not be construed as, an offer to sell or issue or the solicitation of an offer to buy or acquire securities of Danske Bank A/S in any jurisdiction or an inducement to enter into investment activity. No part of this presentation, nor the fact of its distribution, should form the basis of, or be relied on in connection with, any contract or commitment or investment decision whatsoever.
This presentation contains forward-looking statements that reflect management’s current views with respect to certain future events and potential financial performance. Although Danske Bank believes that the expectations reflected in such forward looking statements are reasonable, no assurance can be given that such expectations will prove to have been correct. Accordingly, results could differ materially from those set out in the forward-looking statements as a result of various factors many of which are beyond Danske Bank’s control.
This presentation does not imply that Danske Bank has undertaken to revise these forward-looking statements, beyond what is required by applicable law or applicable stock exchange regulations if and when circumstances arise that will lead to changes compared to the date when these statements were provided.
52


![First Nine Weeks - lcboe.net grade[1].docx · Web viewLaurens County Pacing Guide. First Nine Weeks. Units 1-3. Second Nine Weeks](https://static.fdocuments.in/doc/165x107/5a9d95527f8b9a21688ca075/first-nine-weeks-lcboe-grade1docxweb-viewlaurens-county-pacing-guide-first.jpg)