Fipp world media trends special report mobile
33
TRENDS SPECIAL REPORT MOBILE TRENDS VIDEO SOCIAL MEDIA MOBILE BIG DATA CONTENT MAGAZINE MEDIA REVENUE
-
Upload
tuan-anh-nguyen -
Category
Technology
-
view
286 -
download
3
Transcript of Fipp world media trends special report mobile

TRENDS SPECIAL REPORT
MOBILETRENDS
VIDEOSOCIAL MEDIA
MOBILEBIG DATACONTENT
MAGAZINE MEDIAREVENUE
2
GLOBAL MOBILE, APPS AND WEARABLES TRENDS 2015
Welcome to our third FIPP World Media Trendsspecial report.The third FIPP Insight and World Newsmedia Network in-depth special World Media Trends report focuses on mobile, the world’s fastest growing Internet usage device and the fastest growing advertising spend category.
Each report is packed with data charts, commentary on trends and practical, usable case studies.
Through 2015, FIPP Insight and WNMN will release seven such special reports (alongside other FIPP Insight reports), all of them free to FIPP.com users.
Contact André Glazier at FIPP ([email protected]) for unique commercial opportunities in the FIPP Insight reports.
Topics for the year are:1. Video2. Social media and messaging apps3. Mobile (smartphones, tablets and feature phones)4. Big Data5. Content6. Revenue7. Magazine media (i.e. multi-platform brands)
To compile the reports, WNMN sources evidence-based data from sources around the world, analyses the data and provides commentary on top trends identified, trends you should be considering in your business today.
There will be much more to come this year.Visit FIPP.com/Insight for news on upcoming reports and for any queries about this report and ones to follow. Contact FIPP’s Head of Insight, Helen Bland at [email protected] or +44 7404 4169.
AUTHOR and PUBLISHERMartha L StoneWorld Newsmedia [email protected]
EDITORIAL DIRECTORLeah McBride Mensching
DESIGNERJohn Moreno
REPORT LICENSEE
FIPPwww.fipp.com
PROJECT MANAGERHelen [email protected]
COMMERCIAL MANAGERAndré Glazier
COVER DESIGNIan Crawford
FIPP – the worldwide magazine media association represents compa-nies and individuals involved in the creation, publishing or distribu-tion of quality content, in whatever form, by whatever channel, and in the most appropriate frequency, to defined audiences of interest.
FIPP exists so that its members develop better strategies and build better media businesses by identifying and communicating emerging trends, sharing knowledge, and improving skills worldwide.
Further FIPP Insight special reports and other resources at www.fipp.com/Insight
© World Newsmedia Network 2015
All rights reserved, except by prior written permission of FIPP, the worldwide magazine media association, no partof this work may be copied or publicly distributed, displayed or disseminated by any means of publication or communication now known or developed hereafter, including in or by any:
1. i) directory or compilation or other printed publication; 2. ii) information storage and retrieval system 3. iii) electronic device, including any analogue or digital visual or audio visual device or product
Data is provided with thanks to contributors of this book. Every effort has been made in the preparation of this report to ensure ac-curacy of the content, but FiPP, the publishers and WNMN, the copy-right owners, cannot accept liability in respect of errors or omissions. Readers will appreciate that the data is only as up to date as publica-tion schedules and contributors will allow, and is subject to change.
WNMNWORLD NEWSMEDIA NETWORK
WNMNWORLD NEWSMEDIA NETWORK

GLOBAL MOBILE, APPS AND WEARABLES TRENDS 2015
GLOBAL MOBILE, APPS AND WEARABLES TRENDS 2015
Mobile is the world’s fastest growing Internet usage device and the fastest growing advertising spend category. For media companies, mobile presents challenges and opportunities in production,
consumer behaviour and consumption, competition, interaction, distribution, monetisation, attention, advertising revenue, subscription revenue and product development.
WNMNWORLD NEWSMEDIA NETWORK
WNMNWORLD NEWSMEDIA NETWORK
3
GLOBAL MOBILE, APPS AND WEARABLES TRENDS 2015Mobile is the world’s fastest growing Internet usage device and the fastest growing
advertising spend category. Smartphones are quickly replacing feature phones as the
device of choice worldwide, according to multiple digital media research companies.
The share of time spent on mobile Internet is quickly surpassing that of PC-based Internet.
Smartphone and tablet ownership is particularly high and is growing fastest in emerging markets where desktops and laptops are neither popular nor affordable. Some of the high-growth markets include Africa, Latin America and parts of Asia.
Wearables such as smartwatches, fitness bands and smart glasses are beginning their ascent in popularity, especially with the recent release of the much hyped Apple Watch, most spe-cifically in Asia, the United Kingdom and the United States.
For media companies, mobile changes everything: Produc-tion, consumer behaviour and consumption, competition, interaction, distribution, monetisation, attention, advertising revenue, subscription revenue and product development.
The proliferation of mobile technologies, such as smartphones, tablets, apps and wearables, is driving magazine and news-paper publishers to develop new products for users of these platforms, and many are struggling to keep up with consumer demand.
Eight in 10 Internet users worldwide own a smartphone and almost half own a tablet, while the emerging smartwatch market is niche, with only one in 10 Internet users owning a smartphone, according to GlobalWebIndex, a worldwide digi-tal media survey company based outside of London.
According to GWI’s “Device Report,” published in April 2015, Internet users spend an average of almost two hours per day on mobile. The mobile Internet habit is particularly pronounced in the Middle East and Northern Africa and
Latin America, the fastest growth markets, where an average of 3.5 hours are spent on mobile. Youth ages 16-to 24-years-old worldwide spend 43 percent of their total Internet time on mobile devices, and mobile Internet access is expected to exceed desktop access by youth in the foreseeable future, according to GWI.
According to Forrester Research, time spent on mobile Internet has surpassed that of PC-based Internet, especially in emerging countries in Africa, Southeast Asia and Latin America. Mobile innovation is predicted to accelerate in these emerging markets, where many consumers will continue to leapfrog the adoption of PCs with home broadband and go directly online with mobile phones.
Countries including Kenya, Nigeria, Thailand, Indonesia, Saudi Arabia, India, the Philippines, Mexico, Argentina, Columbia, Turkey, the Czech Republic, South Africa, Viet-nam and Brazil already passed the 50 percent mark for daily distribution of time on mobiles vs. desktops in 2014, accord-ing to Millward Brown AdReaction 2014, as reported in Mary Meeker’s 2014 Internet Trends report.
In 2015, Forrester projects entrepreneurs in the developing world will accelerate innovation in mobile payments, health and education.
“For example, the total value of transactions made by mobile phones in Kenya already represents more than 40 percent of the country’s gross domestic product (GDP),” Forrester reports.

4
GLOBAL MOBILE, APPS AND WEARABLES TRENDS 2015
The mobile-first strategyIn response to the skyrocketing adoption of smartphones, the inexorable trend of mobile Internet use and the surging mobile advertising and m-commerce revenue trends, media companies are adopting mobile-first strategies.
Each media company defines the mobile-first strategy differ-ently, but most are focusing on mobile to make it the top-pri-ority platform, including publishing first on mobile, including breaking news and potentially trending or viral content on mobile. Innovative media companies are also focusing their product development and revenue-making schemes on mobile platforms.
In this section, see how very different companies are develop-ing their mobile-first strategies: The Washington Post, BBC’s Good Food Magazine, VOL.at, Refinery29.com and Quartz.com.
Honey, I shrunk the screenAs the screens of choice become smaller and smaller, the con-tent generated by media companies must become more suc-cinct and inviting in the fewest amount of words and the most eye-grabbing visuals possible. This underscores, more than ever, the essential need for excellent headline writers, visual curators and experts at story brevity who can pack compelling and relevant prose onto tiny screens.
The smartphone, tablet and wearables publishing trend is
toward the “atomisation” of content, that is, chunks of content – including text and visuals – that can stand alone and convey a compelling message to inform, entertain or promote content on other platforms.Atomisation of content is driven by quickly evolving social media and Internet user consumption habits, forcing media companies to create a workflow for snappy, riveting content across a multitude of platforms, especially mobile, wearables and social media.
All the news that grips, we printThe atomisation strategy turns publishers’ content aggregation model on its head. Publishers are now planning to write, edit and promote for individual audiences and no longer relying on the “one size fits all” publication of yesterday.
The atomisation model is driven by a quickly evolving trend whereby readers access content they are interested in, often suggested by friends on social media, or unearthed via search engines. Fewer readers are accessing magazine and newspaper home pages to discover the full complement of content the media brand has to offer. Fillers are becoming passé. News and content that is engaging has longer shelf life, drives more unique visitors and creates more valuable inventory for adver-tising.
Breaking content into atomsPrint media companies’ most basic atomic particle is the
Mobile vs. PC Internet time spent, 2014Percentage of time spent on mobile vs. desktop Internet
Source: Millward Brown AdReaction 2014, as reported in Mary Meeker’s 2014 Internet Trends report © World Newsmedia Network 2015
KenyaNigeria
ThailandIndonesia
Saudi ArabiaGermany
JapanIndia
PhilippinesMexico
USACanada
SpainArgentina
UKItaly
South KoreaAustraliaColombia
TurkeyCzech Republic
South AfricaVietnam
BrazilChina
SlovakiaFrance
HungaryPolandRussia
Mobile Desktop

5
GLOBAL MOBILE, APPS AND WEARABLES TRENDS 2015
article. A headline, photos, infographics, text and references to content on digital platforms may accompany that article to form a multimedia package. Atomisation seeks to unbundle the package into bite-sized bits.Digitial media users’ habits are driving the need for breaking down content into smaller chunks: standalone headlines, Tweets, blogs, photos, videos, infographics, listicles and small bits of content culled from much larger articles.
The atomisation of content is gaining popularity in media companies, with the objectives of virality and engagement in mind. Atomising creates smaller nuggets of information that can be shared, discussed and remixed with other content.
“To be a relevant media company means to understand how to reframe content atomically – to make it easier to share, repost, and append to other articles. This is by no means an easy endeavour, but provides for a range of opportunities,” stated the description of a panel discussion at SXSW media conference in Austin in April. “Cir.ca is leading in this space, and newsrooms are responding. Reddit is built on the earliest conception of atomization – the link.”
Cir.ca is a startup company that produces a mobile news app in the United States and has raised more than US$5 million in venture capital funding since 2012. Each “story” posted on the cir.ca app is called an atom and was created to meet the needs of busy readers and the way they prefer to consume news. Cir.ca publishes major international and national stories. When Cir.ca readers follow stories, they are only fed the new-est atoms of the story, not the atoms they have already read. Cir.ca’s algorithm tracks what readers read and don’t read, and serves just the news the reader has not consumed. Cir.ca is currently seeking a partner for more funding to con-tinue operating the mobile news company.
Global trends in smartphonesEight in 10 Internet users in
the world own a smartphone, second only to about nine in 10 Internet users owning a desktop or laptop, according to Global-WebIndex in April 2015.
Almost half of Internet us-ers own a tablet, followed by fewer than 40 percent owning a game console, smart TV or non-smartphone mobile. Less than 10 percent of Internet us-ers own a smartwatch or smart wristband, according to GWI.
Younger Internet users are more likely to be smartphone users, particularly those ages 25 to 34. More than 80 percent of the age group, or about 383.5 million people around the world, own
smartphones, compared to just 58 percent, or about 69.1 million, between 55-and 64-years-old. Smartphone owner-ship among Internet users is nearly equal between men and women, with 80 percent of male and 79 percent of females owning smartphones. Internet users in the top 25th percentile of income are by far more likely to be smartphone owners.
The highest concentrations of smartphone owners worldwide live in the Middle East and Africa (MENA) region and the Asia Pacific region, according to GWI, with more than 80 percent of the Internet users owning a smartphone. The lowest concentration of smartphone owners are in North America, with a penetration of 70 percent.
The highest penetrations of smartphone owners who access the Internet on their smartphones are in China, Singapore, South Korea, Indonesia, South Africa, Spain, Malaysia,
Taiwan, Turkey, the United Arab Emirates, Hong Kong and
Global smartphone ownershipIn percentage of Internet users and in millions of people
Source: GlobalWebIndex, 2014 © World Newsmedia Network 2015
0%
20%
40%
60%
80%
100%
91% 80% 47% 36% 34% 32% 9% 7% 1%PC/
laptopSmartphone Tablet Game
consoleSmart
TVMobile/cell
phone(not
smartphone)
Smartwatch
(e.g. Pebble,Sony
Smartwatch, Samsung
Galaxy Gear)
Smartwristband(e.g. Nike,Fuelband,
Jawbone Up, Adidas
miCoach)
None of the above
18.6m106.3m137.7m464.2m498.8m527.8m680.0m1161.7m1321.7m
Global mobile share of Web traffic, 2009-2015Percentage of total Web pages served to mobile phones
Source: We Are Social, 2015 © World Newsmedia Network 2015
2009 2010 2011 2012 2013 2014 2015
0.7%2.9%
6.1%
10.9%
17.0%
28.9%
33.4%

6
GLOBAL MOBILE, APPS AND WEARABLES TRENDS 2015
Steve Hills, president and general manager of The Washington Post spoke about the company’s trans-formation under its new owner, Amazon founder Jeff Bezos, at INMA’s 2015 World Congress in New York in May, 2015.
Among the many innovations since Bezos purchased the Post in Oct. 2013 are a new set of core principles and new set of goals going forward. The key change is a transition from a traditional media company to a cul-ture of an innovative technology company, with a focus on new product development. The Post’s new goals are transformation through technology, and continued excellence in journalism.
Hills emphasised the Post’s commitment to mobile first publishing and described the Post’s “Big Idea” product as a national edition optimised for mobile with compelling content and a simple user interface designed for “stunning storytelling” that is less work for the user to consume.
The results of these strategies have tremendously grown usership across the Post’s digital platforms. Total unique visitors grew from 29.8 million in Q1 2014 to 49.4 million in Q1 2015, a 66 percent growth. The growth rate of mobile unique visits has outpaced that of desktop uniques three to one, or 94 percent for mobile and 34 percent for desktop. Mobile unique visitors have grown from 16.7 million to 32.4 million, year-over-year.
Total page views grew from 253.6 million page views in Q1 2014 to 509.7 million page views in Q1 2015, a 101 percent increase, according to Hills. The growth rate for mobile page views are more than double that of desktop page views, with an 80 percent year-over-year growth for desktop page views, and a 178 percent growth for year-over-year mobile page views.
The Millennials are the mobile generation. Millennials are an important part of the Post’s growing audience: 37 percent of the Post’s total digital audience are Millennials, including 37 percent of the smartphone audience and 23 percent of the tablet audience.
Another key objective for The Post is to increase discovery of the Washington Post brand and content through partnerships. Among the partnerships struck include a Kindle Fire partnership with Amazon, which allows readers to buy a six-month Post subscription for just US$1.
The Post has grown its national newspaper partner-ships to 259 newsmedia partners across the United States, which offers partner publications the Post’s suite of digital products free as an added value for their partners’ paid subscribers. The Post continues to expand its digital content across desktop, mobile Web and tablet apps.
The Post has also recently launched content partner-ships with MSN and Flipboard.
The Washington Post’s hallmark of innovation: Mobile first

7
GLOBAL MOBILE, APPS AND WEARABLES TRENDS 2015
The Post’s three key principles are:• Put the customer first• Invest and experiment• Be patient
“In my experience, the way invention, innovation and change happen is through team effort. There is no lone genius who figures it out and sends down the magic formula. You study, you debate, you brainstorm and the answers start to emerge. It takes time,” Hills quoted Washington Post and Amazon founder, Jeff Bezos, as saying.
The approach:1. Identify trends2. Experiment3. Measure and analyse4. Experiment 5. Repeat
Regarding identifying trends, Hills used surging mobile and Internet spending as an example of a trend ripe for investment of experimentation. Likewise, video con-tent with advertising, particularly targeted to Millenni-als, is also a potentially powerful trend. Big Data also represents a sizeable trend, as its output is increasing-ly tied to the bottom line and customer service.
Product design and experimentation are high on the list of priorities for the Washington Post, including phones, tablets, smart watches, large-screen TVs, virtual reality and gesture-controlled devices.
Speed of product development is a key component of the experimentation process. Among the components of the speed imperative is to embed engineers in the product development process in self-sufficient pods, where the engineers are “first-class citizens;” in other words, they are an equal member of the team, and not just on the periphery. In the embedded engineer scenario, chaos and duplication are OK, Hills said.
In each product development operation, engineers are empowered with little or no central services, and each development group owns the product development from end to end.
When faced with build or buy decisions, build wins. Open source tools and partnerships with startups are encouraged.
The Washington Post uses “lead” measures to de-termine if the product is likely to succeed, including asking customers if they are likely to read content about certain themes, using analytics to determine how stories on specific subjects are performing, and customer complaint ratings.
The Post’s innovation strategy
Mexico, all of which have smartphone penetrations of more than 80 percent.
Mobile phones’ share of Web traffic is rising dramatically as more users are engaging with the Internet, particularly those with smartphones. From 2009 to 2015, mobile-driven Web traffic grew exponentially from 0.7 percent in 2009 to 33.4 percent in 2015, according to We Are Social and StatCounter in Jan. 2015.
While one-third of all Web traffic happens on mobile phones, it depends on the region as to how many hours of time are spent online via the devices. The countries with the most mobile-driven Internet traffic are Thailand, Saudi Arabia, Malaysia, Brazil, the Philippines, Indonesia, South Africa, the United Arab Emirates, Mexico, India and Argentina. Mobile users in all of these countries spend more than two hours per day online via their phones.
High-speed connectivity is one component that drives an increased smartphone usage. According to We Are Social’s Jan. 2015 report, eight countries have high-speed broadband con-nections that exceed the population, made possible by many mobile users owning more than one phone.
The countries with the highest amount of 3G and 4G con-
nected phones including Hong Kong, Japan, Saudi Arabia, Australia, Thailand, the United Arab Emirates, South Korea and Singapore.Other countries with high penetrations of 3G and 4G con-nected phones include Italy, the United States, Germany, the United Kingdom, Poland, Malaysia, Brazil, Spain, France, Turkey and Canada.
Mobile’s share of Web traffic, measured by Web pages served to mobile phones, is led by Nigeria, followed by India, South Africa, Indonesia, the United Arab Emirates, Saudi Arabia, Poland, Thailand, Malaysia, Singapore, Mexico, Japan, South Korea, Spain, Turkey, the United Kingdom, Hong Kong, Australia and the United States, all of which see three-quar-ters or more of total Internet traffic served to mobile phones, according to We Are Social’s annual report.
Meanwhile, GlobalWebIndex reports different findings: The share of Internet time spent on mobile versus desktops, laptops and tablets are led by Saudi Arabia with 45 percent of Internet access time spent on mobile, followed by Thailand, the United Arab Emirates, Hong Kong, Malaysia, Mexico, Ar-gentina, South Korea, Indonesia, India, Taiwan, China, South Africa, the Philippines, Brazil, Turkey and Singapore, all with more than 30 percent of their Internet access time spent on

8
GLOBAL MOBILE, APPS AND WEARABLES TRENDS 2015
Smartphone ownership by region, country and demographicsIn percentage of Internet users and in millions of people
Source: GlobalWebIndex, 2014 © World Newsmedia Network 2015
0% 20% 40% 60% 80% 100%
0% 20% 40% 60% 80% 100%In
millions
Asia PacificMiddle East & Africa
Latin AmericaEurope
North America
FemaleMale
16 to 2425 to 3435 to 4445 to 5455 to 64
Bottom 25%Mid 50%Top 25%
ChinaSingapore
South KoreaIndonesia
South AfricaSpain
MalaysiaTaiwanTurkey
ThailandUAE
Hong KongMexico
IndiaItaly
IrelandVietnamSweden
BrazilSaudi Arabia
UKAustraliaGermany
RussiaNetherlands
PhilippinesPoland
ArgentinaUSA
CanadaFranceJapan
679.827.795.1
218.9140.2
516.8644.9
312.7383.5247.7139.7
69.1
212417.3252.4
409.22.7
26.722.913.2
1811.111.520.711.7
5.63.2
27.698
20.82
22.64.4
55.98.9
27.610.235.645.6
7.617.613.811.7
126.214
22.832.2
INCOME
AGE
GENDER
COUNTRY
REGION

9
GLOBAL MOBILE, APPS AND WEARABLES TRENDS 2015
Time spent on Internet, by deviceIn number of hours spent, by Internet users in each country
GlobalWebIndex, 2014 © World Newsmedia Network 2015
0h 2h 4h 6h 8h 10h
ThailandMalaysia
BrazilPhilippines
IndonesiaSouth Africa
UAEMexico
IndiaArgentina
Saudi ArabiaVietnam
USATurkeyChina
SingaporeItaly
TaiwanRussia
CanadaPoland
Hong KongSpain
SwedenUK
IrelandSouth Korea
AustraliaGermany
FranceNetherlands
Japan
Mobile PC/Laptop/Tablet
Global share of Web traffic, by deviceShare of total Web pages served to each device and percent change from 2013 to 2014
Source: We Are Social, 2015 © World Newsmedia Network 2015
Share of Web page views:
Laptops and desktops
Share of Web page views:
Mobilephones
Share of Web page views:
Otherdevices
Share of Web page
views:Tablets
62% 31% 7% 0.1%Year-on-year:
-13%Year-on-year:
+39%Year-on-year:
+17%Year-on-year:
+18%
Chris Kerwin, head of publishing for the BBC’s Good Food magazine, spoke at the Digital Innovator’s Sum-mit in Berlin in March 2015. The magazine is enjoying solid revenues and expansion on digital platforms, including mobile (tablet and smartphone), which rep-resents 75 percent of all digital traffic.
“We publish print for profit, and digital for growth,” Kerwin said. “BBC Good Food is being transformed into a multi-faceted, digital-ly-led business, with content available on all devices and platforms.” He add-ed that “mobile first” was Good Food’s strategy going forward.
Good Food’s website, bbcgoodfood.com, attracts 18 million unique users per month, 60 million page impressions, 350,000 video views and has 1 million registered users, making Good Food the UK’s market leader in food websites.
The magazine has sold 100 million copies in its 25-year tenure, and currently has a circulation of 250,000 and 145,000 subscribers. The enhanced magazine app has 11,000 subscribers.
Printed magazines, books and live events will remain central to the Good Food business, as long as the economics of those businesses continue to make sense, Kerwin said. The future is focused on a 12-point strategy:
1. Create a new digital business model 2. Put mobile first 3. Personalise BBC Good Food 4. Take the experience beyond recipes and cooking 5. Add value to the content 6. Create once, publish everywhere 7. Develop the Good Food Kitchen 8. Develop Good Food Local 9. Put the brand at the heart of the national conversa-tion 10. Develop larger, cross-platform commercial partner-ships 11. Explore enterprise opportunities 12. Explore international potential
Digital is becoming an increasingly large percentage of the revenue for Good Food. Revenues are up 100 percent from 2011 to 2015, with a 36 percent growth from 2014 to 2015. One-third of digital ad revenue is now programmatic, Kerwin said.
BBC’s Good Food magazine

10
GLOBAL MOBILE, APPS AND WEARABLES TRENDS 2015
mobile. The countries where less than 20 percent of Internet time is spent on mobile devices is Japan, France, Russia and Poland, according to GWI.
According to We Are Social, 62 percent of the world’s share
of Web page views came from laptops and desktops, while 31 percent came from mobile and 7 percent came from tablets. Gaming devices made up just 0.1 percent of page views.
The Jan. 2015 research reported that the mobile page view
Mobile broadband usage, by countryPercentage of active 3G and 4G usage, compared to total population
Source: We Are Social, 2015 © World Newsmedia Network 2015
NigeriaIndia
South Africa
IndonesiaUAE
Saudi Arabia
Poland
Thaila
nd
Malaysia
Singapore
Global ave
rage
Mexico
Japan
South Korea
SpainTu
rkeyUK
Hong Kong
Australia
USA
Argentina
Egypt
China
Philippines
Brazil
Vietnam
Germany
Italy
Canada
France
Russia
123%
114% 114%112% 111%110%106%
91%
118%
87% 87% 86% 84%78% 76%
70%67%
60% 59%55% 55% 53%
48%44%
41%38% 37% 36% 35%
13%8%
Global share of Web traffic on mobile, by countryPercentage share of total Web pages served to mobile phones
Source: We Are Social, 2015 © World Newsmedia Network 2015
4.global.wearesocial.mobileshareofwebtra�c
NigeriaIndia
South Africa
IndonesiaUAE
Saudi Arabia
Poland
Thaila
nd
Malaysia
Singapore
Global ave
rage
Mexico
Japan
South KoreaSpain
Turkey UK
Hong Kong
Australia USA
Argentina
Egypt
China
Philippines
Brazil
Vietnam
Germany
Italy
Canada
France
Russia
76%
72%
61%
50% 50%48%
46%
36% 35% 34% 33% 32%30% 29% 29% 28% 27% 26% 26% 25% 24% 23%
21% 21% 20% 20%18% 17% 17%
15%12%

11
GLOBAL MOBILE, APPS AND WEARABLES TRENDS 2015
consumption grew 39 percent from 2013 to 2014, while the laptop and desktop access dropped 13 percent during the same time period. Meanwhile, year-over-year tablet access grew 17 percent and gaming access was up 18 percent. GWI shows access to the Internet via laptop and desktop PCs started to decline worldwide from 2011 to 2014, while access via mobile and tablets began to surge. Smart television also saw growth in smaller groups of users, while accessing the Internet via e-reader devices declined.
The quarterly tallies reflected monthly Internet access via browsers or apps on the devices. While accessing the Internet via PCs is declining, it likely will not be surpassed by mobile access in the foreseeable future. Mobiles are the top “second screen” devices of choice, used at the same time users watch TV, followed by laptops, desktops, tablets and e-readers. In 2014, 797.1 million adults accessed the Internet on their mobiles, steadily growing from 2011, according to GWI.
Share of time spent on Internet, by deviceIn number of hours spent, by Internet users in each country
GlobalWebIndex, 2014 © World Newsmedia Network 2015
Saudi Arabia
Thaila
ndUAE
Hong Kong
Malaysia
Mexico
Argentina
South Korea
IndonesiaIndia
Taiwan
China
South Africa
Philippines
Brazil
Turkey
SingaporeSpain
Italy
USA
Ireland
Vietnam UK
Germany
Sweden
Netherlands
Australia
Canada
Poland
Russia
FranceJapan
Mobile Desktop/Laptop/Tablet
100%
80%
60%
40%
20%
0%
Laptop PC Desktop PC E-readerTablet None of the aboveMobile
2011 2012 2013 2014
Devices used as ‘second screens’ globallyUsers accessing the Internet while watching television, in percentage of users and in millions of users
Source: GlobalWebIndex, 2014 © World Newsmedia Network 2015
60%
50%
40%
30%
20%
10%
0%
797.1 mil.
640.2 mil.
411.9 mil.358.1 mil.
48.0 mil.
236.4 mil.

12
GLOBAL MOBILE, APPS AND WEARABLES TRENDS 2015
Meanwhile, laptop and desktop PC second screening is in decline, with 640 million and 412 million users, respectively, in 2014. Tablet second screening is growing quickly, from 10 percent of the global Internet popu-lation in 2011 to 25 percent in 2014, research from GWI showed.
Most of the world’s population is connected via mobile, according to We Are Social’s Jan. 2015 report. In fact, many regions of the world have mobile connections exceeding the total regional population. Many peo-ple own more than one phone for the purpose of separating business and personal accounts, navigating more than one country’s mobile network, or sharing with multiple family mem-bers and friends.
Mobile phone Tablet device
Q12011
Q22011
Q42011
Q22012
Q42012
Q12013
Q42014
Q32014
Q22014
Q12014
Q42013
Q32013
Q22013
Television E-readerDesktop/laptop
Q1 2011Q2 2011 Q4 2011 Q2 2012 Q4 2012 Q1 2013 Q2 2013 Q3 2013 Q4 2013 Q1 2014 Q2 2014 Q3 2014 Q4 2014
Devices used to access Internet globallyIn percentage of users accessing the Internet in the past month and change in usership between 2011 and 2014
Source: GlobalWebIndex, 2014 © World Newsmedia Network 2015
100%
80%
60%
40%
20%
0%
1,500 millions
1,200m
900m
600m
300m
0m
Desktop/Laptop Tablet deviceMobile phone Television E-reader
Global mobile ownership, by regionPercentage mobile phone ownership compared to populations
Source: We Are Social, 2015 © World Newsmedia Network 2015
101%
126%
91%
98%
109%
119%
98%
79%
77%124%
112%
139%
125%
North America West
EuropeEast
Europe
MiddleEast
East Asia
Central Asia
SouthAsia
Africa
OceaniaSouthAmerica
CentralAmerica
Global average

13
GLOBAL MOBILE, APPS AND WEARABLES TRENDS 2015
The highest penetrations for mobile connections are in East-ern Europe, with 139 percent; followed by South America, 126 percent; Western Europe, 125 percent; the Middle East, 124 percent; and Southeast Asia, 119 percent. The lowest mobile connection penetrations are in South Asia, 77 percent; Africa, 79 percent; and Central America, 91 percent.
Expressing the global percentage of Internet device access does not paint an accurate picture of regional access patterns. Around the world, regional Internet users report vastly differ-ent mobile and PC access rates, driven by mobile and PC own-ership rates, connectivity, availability and pricing, bandwidth issues for Wifi, and mobility and personal resource issues.
Mobile access of the Internet tends to lead in Asia, the Middle
Countries where mobiles are preferred over laptopsIn percentage of users using mobiles and laptops, and % lead over laptops
Source: GlobalWebIndex, 2014 © World Newsmedia Network 2015
LaptopLead over
laptops
Mobile
China
Malaysia
India
UAE
South Korea
Saudi Arabia
Mexico
Thailand
Turkey
South Africa
Philippines
Argentina
Vietnam
Singapore
Taiwan
Hong Kong
Brazil
Spain
Ireland
Italy
Sweden
Netherlands
29%
14%
12%
11%
35%
16%
18%
27%
4%
21%
2%
22%
11%
15%
35%
27%
9%
9%
1%
5%
3%
3%
0% 10% 20% 30% 40% 50% 60% 70% 80%
Countries where laptops are preferred over mobilesIn percentage of users using laptops and mobiles, and percentage lead over mobiles
Source: GlobalWebIndex, 2014 © World Newsmedia Network 2015
Indonesia
Poland
USA
UK
Russia
Canada
Germany
France
Australia
Japan
1%
19%
6%
7%
14%
10%
4%
11%
5%
15%
0% 10% 20% 30% 40% 50% 60%
Laptop MobileLead over
mobiles
Time spent on Internet, by ageIn number of hours spent on each device, by Internet users in each country broken out by age groups
GlobalWebIndex, 2014 © World Newsmedia Network 2015
16-24
25-34
35-44
45-54
55-64
16-24
25-34
35-44
45-54
55-64
0h 0.5h 1h 1.5h 2h 2.5h 3h
0h 1h 2h 3h 4h 5h
MOBILE
DESKTOP, LAPTOP, TABLET
2012 2013 2014

14
GLOBAL MOBILE, APPS AND WEARABLES TRENDS 2015
Edward Roussel, chief innovation officer for Dow Jones and The Wall Street Journal, spoke about its innovation strategy at INMA’s World Congress in May 2015. Rous-sel heads the company’s new innovation unit, focusing its efforts on mobile, which will be “THE platform for the next 10 years,” he said.
Part of the company’s objectives are to fan the flames of innovation across Dow Jones, to move fast and learn fast, and to “disrupt ourselves before others do it for us,” he said.
Roussel showed off the key digital platforms launched or refreshed since Jan. 2014, including the Apple Watch app in April 2015, WSJ.com in April 2015, and WSJ’s Android app in March 2015.
WSJ’s innovation lab is constantly updated and improv-ing digital platforms, and has launched or refreshed the following products since the lab’s 2014 January launch, Roussel said:
• Apple Watch app, April 2015: The app includes alerts on top stories, pushes to read other prod-ucts and market data
• WSJ.D, Jan. 2014: A dedicated WSJ technology section and related international technology con-ference
• WSJ.com, April 2015: Added responsive website and mobile ready functionality that is also faster and more visual and sells more subscriptions
• iPad, Sept. 2014: Continuous improvements to the WSJ’s iPad version, including being faster and
more stable crosswords, new templates, multime-dia-rich, and magazine style
• Android, March 2015: Improved experience, com-bines paper and 24/7 news in tablet and smart-phone
• WSJ+, Sept. 2014: Invites, offers and inspiration, and a complimentary addition to subscriptions that gives access to curated events and offers
Through the process of innovation, Roussel’s team learned lessons, including:
• Collaboration works• Move faster• Smaller bite-sized code releases are more man-
ageable than big overhauls. Obsess about page speed and performance
• Planning, planning, planning• How to innovate faster and smarter
For the future, the focus is “on the end game: three mil-lion subscribers,” he said. Other key objectives include:
• Get to know our customers• Obsess about competitors• Empower the newsroom: Journalists, designers
and developers• Fast-track early stage innovation• Obsess about customers and new competitors• Separate “business as usual” development from
early-stage innovation
Wall Street Journal and Dow Jones

15
GLOBAL MOBILE, APPS AND WEARABLES TRENDS 2015
Refinery 29, the fastest growing and largest online network targeting Millennial women, reports it publishes 1,600 articles, 25,000 photos and 40+ videos each month. R29 reached 15.9 million unique visitors in Oct. 2014, compared to its closest competitor, Glam Media, which drew 9 million uniques, according to comScore Media Metrix data. R29’s Oct. 2014 traffic represented a 163 percent increase from Oct. 2013, according to comScore.
“2014 was an epic year for Refinery29. We surpassed 200 employees and well-exceeded our revenue goals,” the company stated on its website.
“Amid our success and fast growth, R29 remains a brand passionate about creating environments con-ducive to connecting people both online and offline. Thanks to a collaboration between our mobile, UX,
and marketing teams, this defining R29 trait has been elevated even further through new social buttons on our mobile site, making it easier for readers to share and connect with each other. The placement, design, and types of social buttons to include were all guided by our analysis of user behaviour. Here’s what we did:
• Added a Pin It button to article opener images• Added Twitter buttons to the byline and bottom of
each article• Redesigned current share buttons at bottom of
the article
“The Pin It button on article opener images increased total Pinterest shares by 25 percent. Adding [a]Twitter link to the bottom of articles and changing the design of buttons increased overall bottom of article shares by 20 percent,” according to Refinery29.
How adding mobile share buttons increased shares by 25 percent
16
GLOBAL MOBILE, APPS AND WEARABLES TRENDS 2015
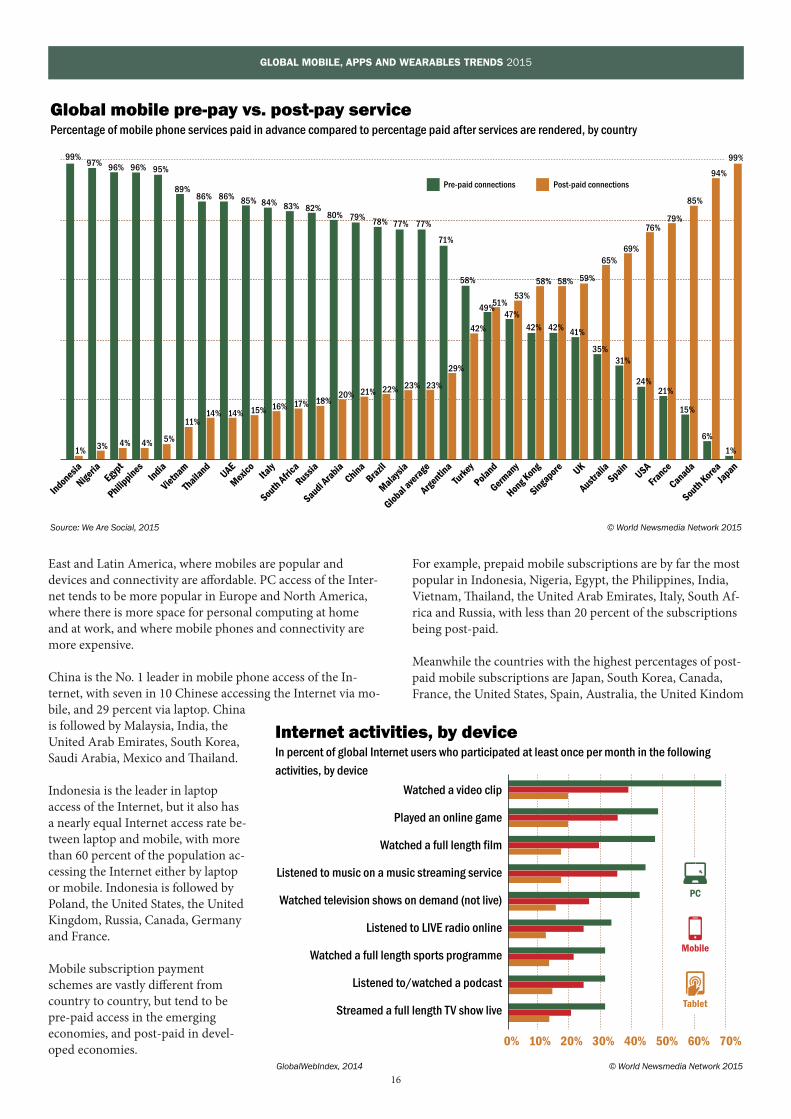
East and Latin America, where mobiles are popular and devices and connectivity are affordable. PC access of the Inter-net tends to be more popular in Europe and North America, where there is more space for personal computing at home and at work, and where mobile phones and connectivity are more expensive.
China is the No. 1 leader in mobile phone access of the In-ternet, with seven in 10 Chinese accessing the Internet via mo-bile, and 29 percent via laptop. China is followed by Malaysia, India, the United Arab Emirates, South Korea, Saudi Arabia, Mexico and Thailand.
Indonesia is the leader in laptop access of the Internet, but it also has a nearly equal Internet access rate be-tween laptop and mobile, with more than 60 percent of the population ac-cessing the Internet either by laptop or mobile. Indonesia is followed by Poland, the United States, the United Kingdom, Russia, Canada, Germany and France.
Mobile subscription payment schemes are vastly different from country to country, but tend to be pre-paid access in the emerging economies, and post-paid in devel-oped economies.
For example, prepaid mobile subscriptions are by far the most popular in Indonesia, Nigeria, Egypt, the Philippines, India, Vietnam, Thailand, the United Arab Emirates, Italy, South Af-rica and Russia, with less than 20 percent of the subscriptions being post-paid.
Meanwhile the countries with the highest percentages of post-paid mobile subscriptions are Japan, South Korea, Canada, France, the United States, Spain, Australia, the United Kindom
Global mobile pre-pay vs. post-pay servicePercentage of mobile phone services paid in advance compared to percentage paid after services are rendered, by country
Source: We Are Social, 2015 © World Newsmedia Network 2015
NigeriaIndia
South Africa
IndonesiaUAE
Saudi Arabia
Poland
Thaila
nd
Malaysia
Singapore
Global ave
rage
Mexico
Japan
South KoreaSpain
Turkey UK
Hong Kong
Australia USA
Argentina
Egypt
China
Philippines
Brazil
Vietnam
Germany
Italy
Canada
France
Russia
99%97% 96% 96% 95%
89%86% 86% 85% 84% 83% 82%
80% 79% 78% 77% 77%
71%
58%
49%47%
42% 42% 41%
35%31%
24%21%
15%
6%
1%1% 3% 4% 4% 5%
11%14% 14% 15% 16% 17% 18%
20% 21% 22% 23% 23%
29%
42%
51%53%
58% 58% 59%
65%69%
76%79%
85%
94%
99%
Pre-paid connections Post-paid connections
Internet activities, by deviceIn percent of global Internet users who participated at least once per month in the following
activities, by device
GlobalWebIndex, 2014 © World Newsmedia Network 2015
Watched a video clip
Played an online game
Watched a full length film
Listened to music on a music streaming service
Watched television shows on demand (not live)
Listened to LIVE radio online
Watched a full length sports programme
Listened to/watched a podcast
Streamed a full length TV show live
0% 10% 20% 30% 40% 50% 60% 70%
PC
Tablet
Mobile

17
GLOBAL MOBILE, APPS AND WEARABLES TRENDS 2015
and Singapore, according to We Are Social.
Time spent accessing the Internet via mobile is increasing rapidly, especially among the younger set, while laptop and desktop access saw declines from 2013 to 2014, according to GlobalWebIndex in Jan. 2014. Those ages 16 to 24 accessed the Internet for about 2.8 hours per day on their mobiles in 2014, up from 2.3 hours in 2013. Meanwhile, the next most prolific mobile Internet users, those 25-to 34-years-old, accessed the mobile Web for two hours per day in 2013 and almost 2.5 hours per day in 2014.
While the same age groups spent more time on PCs during 2013 and 2014, the amount of time is in decline to the benefit of mobile. Those ages 25 to 34 accessed the Internet via PCs on an average of 4.8 hours in 2013 and 4.6 hours in 2014, while those ages 16 to 24 accessed the Web on their PCs for 4.7 hours per day in 2013, and 4.5 hours in 2014, according to GWI. Older age groups showed a similar pattern of growth of mobile Web and decline of PC Web access.
GWI studies usership patterns across devices and determined that PCs are still by far the No. 1 device on which to access the most popular content, including video clips, online games, films, music, on-demand television, live radio, sports pro-grammes, podcasts and full-length television programmes.
Spotlight on the United StatesAccording to comScore, mobile Internet access edged ahead of PC access in 2013. comScore measures Americans’ Internet access in minutes per day via tablet, smartphone and desktop.
The largest growth has occurred in smartphone usage, from 131 billion minutes spent in Dec. 2010, compared to 521 bil-lion minutes spent in July 2014. Meanwhile, desktop Internet access in the United States has grown from 429 billion minutes in December 2013 to 495 billion minutes in July 2014.
Tablet access of the Internet in the United States is by far high-
U.S. Internet use across platformsInternet use in billions of minutes, by platform, plus year-over-year percent change
Source: comScore, 2014 © World Newsmedia Network 2015
Dec2010
Dec2013
Jul2014
0
200
400
600
800
1,000
1,200
401 429 495
131
442
124
+83%
+1040%
+237%
+7%
+16%
+17%
+15%
+17%
11
521
143
543
995
1,159
Tablet Smartphone Desktop
U.S. device usage during times of dayPercentage share of device page traffic on an average weekday
Source: comScore, 2014 © World Newsmedia Network 2015
12%
10%
8%
6%
4%
2%
0%
Shar
e of
dev
ice
page
traf
fic o
n a
wor
kday
Late night
12 AM — 4 AM
AM PM
12 1 2 3 4 5 6 7 8 9 10 11 12 1 2 3 4 5 6 7 8 9 10 11
Early morning
4 AM — 8 AM
Late morning
8 AM — 12 PM
Early afternoon
12 PM — 4 PM
Late afternoon
4 PM — 8 PM
Evening
8 PM — 12 PM
PC Phone Tablet

18
GLOBAL MOBILE, APPS AND WEARABLES TRENDS 2015
Joy Robins, SVP for Global Revenue and Strategy at Quartz.com, spoke at INMA’s World Congress in May 2015, saying that building a mobile-first product has been a labour of dedication to create the high-quali-ty experience the audience demands.
“You can’t fake a high-quality experience: This is expected from the audience. You can’t be rude; you can’t have a bad ad experience. You can engage people in a more powerful way,” Robins said.
However, she had some advice along the way:
• Don’t compromise quality• Capitalise on the mobile mindset• Believe in your product• Create experiences that are native to their environments
She added some sage advice from Quartz’s exec-utive editor and vice president for product, Zach Seward: “Our cardinal design principles have always been to stay out of your way, let the stories shine and make sure it all works well on your phone.”
Gerold Reidmann, CEO of Russmedia Digital, Vorarl-berg, Austria, spoke at INMA’s World Congress about product development at the innovative, regional multimedia group.
Product development philosophy is based on a step-by-step concept developed at the Hasso Plattner Institute of Design at Stanford University: Empathise, Define, Ideate, Prototype and Test.
• Empathise: Learn about the audience for whom you are designing by observation and interview-ing. They ask, “Who is my user?” and “What matters to this person?”
• Define: Create a point of view that is based on user needs and insights. They ask, “What are their needs?”
• Ideate: Brainstorm and come up with as many creative solutions as possible. Wild ideas are encouraged.
• Prototype: Build a representation of one or more of your ideas to show to others. They ask, “How can I show my idea?” Remember, a proto-type is just a rough draft.
• Test: Share your prototyped idea with your original user for feedback. They ask, “What worked?” and “What didn’t?”
At Russmedia, dedicated teams in print and digital are separated. Print has 50 percent reach and digital has 70 percent reach in the region.
When developing a product, they take a “Good enough” approach. “If it’s good enough, publish it,” Riedmann said. This applied specifically to the Apple Watch app design, which provided headlines and ba-sic information, which was “good enough” for launch.
Those at Russmedia look to Facebook for inspiration in mobile because they believe Facebook is a great example of best prac-tices. Facebook is the No. 1 smartphone app in the United States. Russmdia is working on a video “autoplay” function-ality for the newsfeed on VOL.at, following Facebook’s hugely popular autoplay launch in 2014.
Quartz.com VOL.AT

19
GLOBAL MOBILE, APPS AND WEARABLES TRENDS 2015
est after dinnertime, with almost 10 percent of the Internet population doing so, followed by about 7 percent accessing the Internet by phone during the same period. This suggests mo-bile and tablet users are accessing the Internet for leisure and entertainment purposes, and some while they are watching television.
Meanwhile, PC use is highest during work hours, with a
steady 6 percent to 6.5 percent of the Internet population accessing from late morning to early afternoon.Of the Top 10 most popular websites in the United States, 34 percent of monthly visitors are mobile only and 72 percent of the engagement is via an app, not a browser, according to comScore in July 2014. Google garnered the most traffic with 236 million unique visitors in July 2014, followed by 217 million for Yahoo!, 208 million for Microsoft and 206 million
U.S. top sites: Total traffic and browser vs. app accessIn millions of unique users, percentage of traffic and time spent, browser vs. app
Source: comScore, 2014 © World Newsmedia Network 2015
236
217
208
206
171
162
138
127
122
113
Desktop only Desktop + Mobile Mobile only Browser App
Yahoo!
Microsoft
AOL
Amazon.com
Apple sites
Turner
CBS Interactive
11% 20%
33%
21%
9%
57%
30%
0%
41%
23%
45%
20%
18%
27%
28%
34%
55%
39%
67%
39%
80%
67%
79%
91%
43%
70%
99%
59%
77%
55%
Top 10 Properties: Total U.S. Digital PopulationUnique Visitors (MM) by Platform
% of Mobile Time SpentBrowser vs. App
0%
20%
40%
60%
80%
100%
Growth in mobile-exclusive audience for newspaper digital content by age and genderMarch 2015 vs. March 2014, adult unique visitors
Source: GlobalWebIndex, 2014 © World Newsmedia Network 2015
Total adults 18+
18-24 25-34 35-44 45-54 55+ 18-24 25-34 35-44 45-54 55+
53%
68%
Men
54%
65%
36%
79%
42%36%
51%
81%
55%
Women

20
GLOBAL MOBILE, APPS AND WEARABLES TRENDS 2015
for Facebook. The majority of users in the top four most popular sites regularly access the sites via mobile and PC.However, the vast majority of mobile us-ers prefer accessing via app over browser: 80 percent for Google, 67 percent for Yahoo!, 79 percent for Microsoft, and 91 percent for Facebook, according to comScore.
comScore and the Newspaper Associ-ation of America together published a study about the rapid growth of mobile newspaper readers in the United States. According to the April 2015 study, mobile newspaper readership has seen an overall 56 percent growth, and a double-digit growth across age groups from March 2014 to March 2015, especially among certain age and gender combinations.
The most dramatic growth target groups for mobile readership of U.S. newspapers are women from 45-to 54-years-old, 81 percent; men ages 55 and up, 79 percent; and men ages 18 to 24, 68 percent.
The mobile-exclusive newspaper reader trajectory is dramatic from Jan. 2014 to March 2015, according to the com-Score-Newspaper Association of America study. The trend shows mobile-exclusive unique monthly visitor numbers surging from less than 40 percent in Jan. 2014 to more than 70 percent in March 2015 in the United States.
Meanwhile, PC-only newspaper readers’ unique monthly visitors declined during the same period from 60 percent to 55 percent, and unique visitors via both mobile and PC grew from 47 percent to 50 percent.
AppsThe most popular apps in the world are games, social networks, music, entertain-ment, photos, utilities and chat, according to a GlobalWebIn-dex study published in Jan. 2015. The study compared apps that had been downloaded and apps that had actually been used, both in the previous month.
Forty-five percent of global Internet users used game apps last month, followed by 40 percent for social network app users and 35 percent for music app users. The data suggests that game users tend to download apps more regularly than any other category, as the differential between downloading and using the apps is closest among game app users.
Millennials are more prolific users of apps, according to the GWI study. When comparing the entire Internet population using apps to Millennials, ages 18 to 34, 53 percent of Millen-nial Internet users accessed game apps last month, followed by social network apps, 46 percent; music apps, 42 percent; entertainment apps, 42 percent; utilities, 34 percent; chat/mes-saging, 33 percent; and photo, 33 percent.
Apps have become the platform by which most American Internet users access content, according to comScore. In June 2014, 60 percent of digital media time was spent on mobile
Global app usage, by categoryPercentage of Internet users who downloaded in last month and used in last month
Source: GlobalWebIndex, 2014 © World Newsmedia Network 2015
0% 10% 20% 30% 40% 50%
Games
Social networks
Music
Entertainment
Photo
Utilities
Chat/messaging
Maps
News
Shopping
Banking/financial services
Books
Travel
Food/restaurants
Health and fitness
Lifestyle
Sports
VolP (i.e. Skype or Viber)
Business
TV application
Location-based services
Work-related service
Loyalty
Live event
Augmented reality
Location-based dating apps
None of the above
(e.g. Foursquare/Facebook Places)
Used in last month
Downloaded in last month

21
GLOBAL MOBILE, APPS AND WEARABLES TRENDS 2015
Apps accessed by Millennials In percentage of Millennial users globally who accessed the following genres of apps
Source: GlobalWebIndex, “Millennials Audience Report,” 2015 © World Newsmedia Network 2015
0% 10% 20% 30% 40% 50% 60%
53%
46%
42%42%
34%
33%
33%
30%
27%
27%25%
22%
21%
19%
19%18%
17%15%
15%
15%
14%
12%10%
8%
Games
Social networks
Music
Entertainment
Utilities
Chat / messaging
Photo
Maps
Shopping
News
Books
Banking / financial services
Travel
Food / restaurants
Health and fitness
Sports
VolP
Business
TV application
Location based services
Work related service
Loyalty
Augmented reality
Location-based dating apps
U.S. mobile vs. desktop time spentIn percent of share, mobile vs. desktop, including share of mobile app access as a percent of all mobile usage
Source: comScore, 2014 © World Newsmedia Network 2015
60%
55%
50%
45%
40%
35%
30%
Mobile
Mobile App
Desktop
60%
53%
47%
40%
52%
40%
March2013
Apr2013
May2013
Jun2013
Jul2013
Aug2013
Sep2013
Oct2013
Nov2013
Dec2013
Jan2014
Feb2014
Mar2014
Apr2014
May2014
Jun2014
U.S. mobile, desktop usageIn percent of change for mobile Web, mobile app and desktop from June 2013 to 2014
Jun 2013 Jun 2014
+1%
+52%
+17%
+24%
1,400
1,200
1,000
800
600
400
200
0
Mobile Web Mobile app Desktop
U.S. mobile app downloadsIn percent of share for those who downloaded zero to 8 or more apps in June 2014
Source: comScore, 2014 © World Newsmedia Network 2015
No Apps65.5%
1 or more Apps
65.5%
8.4%
8.9%
6.2%
3.7%
4.8%
2.4% 8+ Apps
5-7 Apps
4 Apps
3 Apps
2 Apps
1 App

22
GLOBAL MOBILE, APPS AND WEARABLES TRENDS 2015
and 40 percent on desktop. Of all digital media time spent, 52 percent was spent accessing content via mobile app, the ma-jority of all mobile platform time spent accessing content.
Mobile app usage is grew 24 percent between June 2013 and June 2014, according to comScore. Mobile apps represent the largest percentage of growth and platform access. From 2013 to 2014, mobile app usage grew 52 percent, while desktop access only grew 1 percent and mobile Web usage grew 17 percent in the United States.
Two-thirds of Americans do not download any apps in a month, while 8.4 percent download one, 8.9 percent down-load two, 6.2 percent download three, 3.7 percent download four and 4.8 percent download five to seven apps, according to comScore. All told, those Americans who download one or more apps total one third, or 34.5 percent of the Internet-us-ing population in the United States.
comScore reports that 42 percent of all app time spent on smartphones occurs on an American adult’s most used app, while 75 percent of app usage occurs on the top four apps.
American iPhone app users earn 40 percent more in income than Android phone users and use their apps nine hours more per month, according to a comScore report, released in June 2014. There are 62.6 million iPhone app users in America, compared to 76.1 million Android app users, each with a me-dian age of 40. However, the iPhone app users earn an average of US$85,000 per year and use apps for 64 hours per month, while the Android app users earn $61,000 per year and use apps 55 hours per month, comScore reported.
The majority of U.S. mobile app activity in June 2014 was driven by two main app categories: social networking and games, together representing 41 percent of all app time spent, followed by radio, 8 percent; multimedia such as videos and interactive graphics, 5 percent; retail, 5 percent; instant messengers, 4 percent; and photos, 4 percent, according to comScore.
Share of time spent on apps by U.S. usersRanked by percentage of time spent
Source: comScore, 2014 © World Newsmedia Network 2015
0
10%
20%
30%
40%
50%
42%
17%
1 2 3 4 5 6 7 8 9 10 11+
10%
6%4% 3% 2% 2% 1% 1%
12%
Individuals’ top ranked app by usage
U.S. iPhone vs. Android phone app usage and demographics
Source: comScore, 2014 © World Newsmedia Network 2015
iPhone
Total app users
Median age
Median income
Average hours per app user
62.6
40
$85,000
64
76.1
40
$61,000
55
Android phone
U.S. mobile app engagementIn percent of time spent for app activiites
Source: comScore, 2014 © World Newsmedia Network 2015
All others34%
Photos4%
Instantmessengers
4% Retail5%
Multimedia5%
Radio8%
Games16%
Socialnetworking25%

23
GLOBAL MOBILE, APPS AND WEARABLES TRENDS 2015
The “all others” category represents one third, or 34 percent, of all other app activity, and is a catch-all for a variety of sundry genres of app content, such as fitness, news, sports, weather, and much more.
The most popular digital media brands are also the most popular mobile app brands in the United States, according to comScore. In June 2014, Facebook drew 115.4 million app users, far ahead of the competition, including YouTube’s app with 83.4 million, Google Play with 72.2 million, Goo-gle search with 70.2 million, Pandora radio with 69 million, Google Maps with 64.5 million, Gmail with 60.3 million, and Instagram with 46.6 million.
Digital device trendsMillennials tend to own a proportionally higher number of digital devices with which to access the Internet. In fact, GlobalWebIndex conducted a study of Millennials ages 18 to 34 and determined that 89 percent of Millennials globally own a desktop PC or laptop; 84 percent own a smartphone; 45 percent own a tablet; 37 percent own a gaming console; 35
percent own a smart TV; and 12 percent own a smartwatch.
Meanwhile, the following percentage of global Millennials who accessed the Internet last month using a PC, 89 percent; mobile phone, 82 percent; work PC, 47 percent; tablet, 36 percent; television, 23 percent; games console, 12 percent; and e-reader, 11 percent.
Device brandsSamsung continues to be the No. 1 smartphone brand in the world, according to a GlobalWebIndex report, released in Jan. 2015. As of end of 2014, Samsung’s Android smartphone sold more than 500.6 million handsets, compared to its closest competitor, Apple’s iPhone, which has sold 272.9 million smartphone handsets, while Nokia sold 231.8 million units and Sony sold 138.1 million units.
Meanwhile, Android smartphone makers LG, Huawei, HTC and Lenovo have been making strides with less expensive phones, sold around the world and to some degree, the devel-
Top 25 most popular mobile apps in U.S.In thousands of unique users in June 2014
Source: comScore, 2014 © World Newsmedia Network 2015
0 20,000 40,000 60,000 80,000 100,000 120,000
YouTube
Google Play
Google Search
Pandora Radio
Google Maps
Gmail
Apple Maps
Yahoo Stocks
iTunes Radio/Cloud
Facebook Messenger
Yahoo Weather Widget
The Weather Channel
Google+
Netflix
Snapchat
Amazon Mobile
eBay
Skype
Shazam
Yahoo Mail
Kik Messenger
115,370
83,392
72,24570,163
69,000
64,485
60,320
46,637
42,070
42,069
40,544
39,210
36,07134,702
29,993
28,82127,615
26,469
26,454
24,586
22,294
18,849
18,372
17,599
17,225

24
GLOBAL MOBILE, APPS AND WEARABLES TRENDS 2015
oping world, attempting to capture the opportunity to reach the 4.4 million people on the planet who do not have access to the Internet.
WearablesAccording to a PricewaterhouseCoopers survey in 2015, 73 percent of global respondents expected wearables to make media and entertainment more immersive and fun, while 79 percent of Millennials (those 18-to 34-years-old) said so.
“The media company of the future is one that combines insights with curated experiences, and finds new ways of monetising, and not just through advertising. As purveyors of interest-specific content, media companies will turn to wear-ables to open a huge new frontier for relevance and immersive experiences, helping their audience engage in a category by providing relevant content and solutions,” the PwC report stated.
PwC predicts the adoption rate of wearables parallels that of tablets. In 2012, 20 percent of Americans owned a tablet after two years on the market. Today, 40 percent of Americans own a tablet. In 2014, 21 percent of Americans owned a wearable device. PwC predicts wearable ownership could double by 2016.
According to the survey, respondents want wearables to add enjoyment to their lives. Millennials are twice as likely as those over age 35 to list access to media and entertainment as an important benefit of wearables. Sixty-four percent of Millen-nials said they would be excited to try a wearable technology
Digital devices owned by Millennials In percentage of Millennial
users globally who own the
following devices, and
percentage of their
devices used to access
the Internet
Source: GlobalWebIndex, “Millennials Audience Report,” 2015 © World Newsmedia Network 2015
0%
20%
40%
60%
80%
100%
Personal desktop/laptop
Mobile phone Work desktop/laptop
Tablet device Television Games console E-reader
Gamesconsole
PC/laptop
89%
Smartphone
84%
Tabletdevice
45%37%
SmartTV
35%
Mobile/cellphone that
is not asmartphone
28%
Smartwatch
12%
Smartwristband
9%
Percentage who personally own the following
Devices used to access the Internet in the past month
89% 82% 47% 36% 23% 12% 11%
Countries where laptops are preferred over mobileIn percentage of users using mobiles and laptops, and percentage lead over mobile
Source: GlobalWebIndex, 2014 © World Newsmedia Network 2015
Samsung
iPhone
Nokia
Sony
LG
Huawei
HTC
Lenovo
Motorola
BlackBerry
ZTE
None of the above
500.6
272.9
231.8
138.1
115.1
99.0
95.2
81.8
81.1
70.7
55.4
152.1
0% 10% 20% 30% 40% 50%
0% 10% 20% 30% 40% 50%
2013 2014 Millions

25
GLOBAL MOBILE, APPS AND WEARABLES TRENDS 2015
product introduced by an entertainment or media company, compared to 42 percent for all respondents. Some of the most desired features of wearables could be unobtrusive access to social media and gaming, especially among Millennial respon-dents.
As important as the wearables’ enthusiasts opinions are, detractors also have a powerful voice. According to the PwC survey, more than one-third of the population does not think
they will use any kind of wearable, including fitness bands, 36 percent; smartwatches, 36 percent; smart glasses, 35 percent; and smart clothing, 40 percent.
Those who currently own smartwatches are typically in the top quarter of all incomes among Internet users worldwide (20 percent), are 25-to 34-years-old (15 percent), are from the Asia Pacific region (15 percent) and male (12 percent), accord-ing to GlobalWebIndex in an April 2015 survey. Smartphone
A smart wristband (e.g. NIke Fuelband. Jawbone Up. Adidas miCoach)
Global wristband and smartphone useIn percentage of users by region and demographics
Source: GlobalWebIndex, 2014 © World Newsmedia Network 2015
0% 5% 10% 15% 20%
Asia Pacific
Europe
Latin America
Middle East & Africa
North America
Female
Male
16 to 24
25 to 34
35 to 44
45 to 54
55 to 64
Bottom 25%
Mid 50%
Top 25%
REGION
GENDER
AGE
INCOME
A smartwatch (e.g. Pebble, Sony Smartwatch, Samsung Galaxy Gear)

26
GLOBAL MOBILE, APPS AND WEARABLES TRENDS 2015
ownership is also popular among 16-to 24-year olds (12 per-cent), and 35-to 44-year-olds (10 percent) and middle-income Internet users (11 percent).
Just as Apple smartwatches were introduced in April 2015, GlobalWebIndex took the pulse of the biggest enthusiasts for the device in the United Kingdom and the United States. Of the Internet users in the UK and U.S. interviewed, 26 percent said they were interested in purchasing an Apple smartwatch, 71 percent were already smartwatch owners, 45 percent were ad-aware of the product, 45 percent considered themselves to be fashionistas, 44 percent were early tech adopters, 39 percent were premium purchasers and 26 percent said they were price conscious.
Interest in the Apple Watch in the UK/USJan. 2014 - Mar. 2015 (adult unique visitors, millions)
Source: GlobalWebIndex, 2014 © World Newsmedia Network 2015
TOTAL
Smartwatch owners
Ad-aware
Fashionistas
Early tech adopters
Premium purchasers
Price conscious
26%
71%
45%
45%
44%
39%
26%0% 10% 20% 30% 40% 50% 60% 70% 80%
AUDIENCE
Interest in the Apple Watch and the Apple brandPercentage who say they are interested in using an Apple Watch in the future
Source: GlobalWebIndex, 2014 © World Newsmedia Network 2015
26% 44% 40%
Total IPad users IPhone users
Smartwatch ownership by region
Source: We Are Social, 2015 © World Newsmedia Network 2015
5%
6%
5%
15%
7%
North America
AsiaPacific
Europe
Middle East and Africa
LatinAmerica
0
10%
20%
30%
40%
50%
60%
70%
80%
WeChat users
WhatsAppusers
Instagramusers
Snapchatusers
Twitterusers
IPhoneusers
Pinterestusers
Mobilenetworkers
Facebookusers
All US/UKInternet users
Interest in using the Apple WatchPercentage in each group who say they are interested in using the Apple Watch in the future
Source: We Are Social, 2015 © World Newsmedia Network 2015
75%
48%44% 43% 41% 40%
36% 35%
27% 26%

27
GLOBAL MOBILE, APPS AND WEARABLES TRENDS 2015
While 26 percent of those UK and U.S. survey-takers said they were interested in using Apple smartwatches in the future, the interest level of the smartwatch rose significantly if the person interviewed was also an iPad user (44 percent) or an iPhone owner (40 percent).
Smartwatches have been developed since the 1927, perhaps inspired by the popular Dick Tracy detective watch complete with a two-way radio. It wasn’t until 2012 when Sony rolled out its SmartWatch with touchscreen and Internet connectiv-ity, followed by Samsung’s Galaxy Gear in 2013 and several more sophisticated models since, followed by the now fabled Apple Smartwatch.
Despite having been around in one form or another for nearly a century, smartwatches are in the early phase of adoption in their present iteration. Currently smartwatches have an in-stalled base of only five percent of adults 16-to 64-years-old in North America and Europe, a 6 percent penetration in Latin America, 7 percent in the Middle East and Africa, and a 15 percent penetration in Asia, according to GWI.
Despite the low penetrations on the eve of Apple’s launch, the desire to use an Apple watch in the future is considerably higher, according to GWI. Twenty-six percent of all Internet users in the United Kingdom and the United States say they are interested in Apple’s wearable, 75 percent of WeChat users, 48 percent of WhatsApp users, 44 percent of Instagram users, 43 percent of Snapchat users, 41 percent of Twitter users, 40 percent of iPhone owners, 36 percent of Pinterest users, 35 percent of mobile networkers and 27 percent of Facebook users say they would like to use the Apple watch in the future.
Mobile revenueMobile advertising, defined by ZenithOptimedia to include all Internet advertising delivered to smartphones and tablets, in-cluding display, classified or search, and including in-app ads, is growing nine times faster than desktop Internet advertising expenditure.
Zenith projects mobile advertising will grow by an average of 39.8 percent a year between 2014 and 2017, driven by the rapid spread of devices, connectivity and content on mobile. By contrast, Zenith predicts desktop Internet advertising will grow at an average of 4.6 percent a year.
In 2014, Zenith estimates global expenditure on mobile adver-tising to be US$27.4 billion, representing 22.1 percent of Inter-net adspend and 5.3 percent of total adspend. Zenith predicts that by 2017, mobile adspend will rise to $75.0 billion, or 40.4 percent of Internet adspend and 12.7 percent of all adspend.
“This means that mobile will leapfrog radio, magazines, outdoor and newspapers to become the world’s third-largest medium by the end of our forecast period,” the Zenith report stated.
Contribution to global growth in adspend by medium2014-2017 (US$ million)
Source: We Are Social, 2015 © World Newsmedia Network 2015
-10,000 0 $10,000 $20,000 $30,000 $40,000 $50,000
Mobile Internet
Television
Desktop Internet
Outdoor
Radio
Cinema
Magazines
Newspapers
$47,539
$17,641
$14,097
$3,610
$2,048
$341
-$2,677
-$6,187
Share of global adspend by medium (%)
Source: We Are Social, 2015 © World Newsmedia Network 2015
2014
2017
Mobile Internet
Television
Desktop Internet
Outdoor
Radio Cinema
Magazines
Newspapers
39.4%
18.8%5.3%
15.0%
7.3%
6.8%
6.8% 0.5%
Mobile Internet
Television
Desktop Internet
Outdoor
Radio Cinema
Magazines
Newspapers
37.3%
18.7%12.7%
12.0%
5.9%
6.6%6.3% 0.5%

28
GLOBAL MOBILE, APPS AND WEARABLES TRENDS 2015
Internet adspend overtook total adspend on both newspapers and magazines in 2014.
“We predict Internet advertising will increase its share of the ad market from 21.4 [percent] in 2014 to 31.4 [percent] in 2017, while newspapers and magazines will continue to shrink, at average rates of 3 [percent] and 2 [percent] a year respectively,” Zenith stated in its April 2015 statistical report.The Zenith figures for newspapers and magazines include only advertising in printed editions of these publications, not on their websites, or in tablet editions or mobile apps, all of which are reflected in the Internet category.
Mobile is now the main driver of global adspend growth. Zenith predicts mobile will contribute US$47.5 billion in ad-spend between 2014 and 2017, while television will be the sec-ond-largest contributor to adspend, accounting for US$17.6 billion, followed by desktop Internet at US$14.1 billion. According to Zenith, Mobile Internet adspend represented 5.3 percent in 2014, but will soar to 12.7 percent by 2017, mostly at the expense of traditional media: television, newspapers and magazines, each predicted to fall about 2 percentage points of adspend share between 2014 and 2017. Meanwhile, desktop Internet, outdoor, radio and cinema adspend share are expect-ed to remain stable.
Zenith reports that mobile advertising expenditure is growing exponentially around the world. Here are three examples of intense growth on three continents. The countries explored are China, Mexico and United Kingdom.
ChinaTotal mobile advertising has grown from 84 million RMB (US$13.7 million) in 2009 to 54.54 billion RMB ($8.8 billion) projected for 2017. Mobile advertising is expected to represent half of total desktop Internet adspend, driven mostly by search and display advertising, according to ZenithOptimedia in April 2015.
MexicoMobile display, mobile classified and mobile search advertis-ing expenditure in Mexico tallied to 339 million Mexican pe-sos ($US24.7 million) in 2010, and is expected to reach 10,441 million pesos ($681 million) in 2017, according to ZenithO-ptimedia. Despite the steep growth, faster than other digital advertising, mobile advertising is still expected to represent just over a half of all Internet advertising in Mexico by 2017.
China’s mobile adspend, 2009 to 2017In Chinese yuan
¥20,740¥20,656
¥32,122¥31,958
¥29,673$¥9,391
¥43,560¥42,600
¥282
¥960
¥63,641¥61,592
¥89,098¥78,081
¥117,609¥94,290
¥2,049
¥11,017
¥23,319
¥148,187¥109,859
¥38,328¥176,343
¥121,807¥54,536
¥164
¥84
2009
2010
2011
2012
2013
2014
2015
2016
2017
Source: Zenith Optimedia, March 2015 © World Newsmedia Network 2015
0 ¥50 mil. ¥100 mil. ¥150 mil.
Total
Total desktop
Total mobile
Mexico’s mobile adspend, 2010 to 2017In Mexican pesos
2010
2011
2012
2013
2014
2015
2016
2017
Source: Zenith Optimedia, March 2015 © World Newsmedia Network 2015
0 $5 mil. $10 mil. $15 mil.
Mobile search
Search
Mobile classified
Classified
Mobile display
Display
Total
3,392
4,6252,729
3,774
5,209
6,771
8,464
10,156
10,674
564
1,321
1,563
509102
1,388278
576
1,059
1,721
2,582
3,099
3,316
1,919
2,618
3,443
4,304
5,165
5,527
211
388
631
947
1,136
1,204
704
971
1,262
1,578
1,894
1,985
3,386
4,655
5,586
5,921
6,397
8,828
11,476
14,346
17,215
18,185
2,001200
102
37337
1,018

29
GLOBAL MOBILE, APPS AND WEARABLES TRENDS 2015
United KingdomZenithOptimedia projects that mobile display and search adspend will represent more than half of all Internet adspend by 2017 at 5.64 billion GBP (US$8.6 billion). In 2010, mobile advertising represented in tiny fraction of Internet adspend, at less than 185 million GBP (US281.7 million.)
Paid contentThe most popular paid content online is the mobile app, according to GlobalWebIndex in Jan. 2015, especially high among Millennials ages 17 to 31, 25 percent of whom said they purchased a mobile app in the past month.
Internet-connected Millennials are more likely to pay for on-line content than the general Internet-connected population
as a whole. In addition to mobile apps, the most popular paid content online are e-books, music, Web service such as email or storage, study programmes, games and television shows.
M-commerceMobile e-commerce, or m-commerce, is gaining momentum, but continues to remain far behind desktop PC-generated e-commerce, according to comScore. From Q1 2012 to Q2 2014, e-commerce on PCs and mobile has grown in the dou-ble digits year-over-year in the United States.
The most robust e-commerce period is the fourth quarter prior to the holiday buying season. E-commerce grew from US$64 billion in Q4 2012 to $71.4 billion in Q42013 for PC and mobile sales, including $7.2 billion in m-commerce sales in 2012 and $8.3 billion in 2013. The m-commerce trend continues into 2015, as more consumers are purchasing goods and services on their mobile phones.
While tablet-generated m-commerce earned more than smart-phone-generated commerce per buyer, phones still account for more m-commerce sales share in the United States, according to comScore in 2014.
UK's mobile adspend, 2011 to 2017In GBP
2011
2012
2013
2014
2015
2016
2017
Source: Zenith Optimedia, March 2015 © World Newsmedia Network 2015
Mobile search
Search
Mobile display
Display
Total
0 £2,000 £4,000 £6,000 £8,000
£4,423
£1,075£57
£2,606£128
£341
£963
£1,715
£2,353
£3,109
£3,918
£2,964
£3,208
£3,988
£4,705
£5,182
£5,597
£143
£280
£501
£831
£1,265
£1,721
£1,220
£1,719
£1,927
£2,274
£2,635
£2,868
£4,982
£5,729
£6,779
£7,920
£8,783
£9,398
Online content Millennials pay for In percentage of Millennial users globally who paid for content online last month
Source: GlobalWebIndex, “Millennials Audience Report,” 2015 © World Newsmedia Network 2015
Mobile app
E-book
Music download to keep
Web service e.g. email/storage
Study programmes/learning materials
A game on your mobile phone
A multiplayer online game
TV/film download to keep
TV/film streaming service
Music service where you can stream on demand
In-app purchases (upgrades, add-ons, etc.)
News website
Digital gifts (stickers, badges, avatars, etc.)
A dating service
None of the above
0 5% 10% 15% 20% 25% 30%
25%
25%
24%
22%
21%
20%
20%
20%
18%
14%
13%
11%
9%
34%
18%

30
GLOBAL MOBILE, APPS AND WEARABLES TRENDS 2015
Total m-commerce per buyer in Q2 2014 was US$259 billion by U.S. consumers using tablets, and $198 billion using smartphones. Meanwhile, tablets represented 46 percent of all m-commerce spending during Q2 2014, while smartphones represented 54 percent, mainly due to the larger installed base of smartphones in America, according to comScore.
People Magazine’s future belongs to digitalReprinted with permission from FIPP
The future growth of magazines belongs to digital and, in par-ticular, mobile. For People magazine, part of Time Inc., online growth has been relentless, with mobile browser growth of 147 percent from Jan. 2014 to Jan. 2015. Video views grew during the same period by 259 percent, as reported by FIPP in April 2015.
The People magazine brand represents 18 percent of Time Inc.’s total revenue. The print edition sells more than 2.75 million copies per month. By Nov. 2014, 72 million monthly unique visitors logged onto the site – a 26 percent increase from September 2014, just before Will Lee took over as editor.
Lee told FIPP that not too much can be read into the increase in mobile browsing. It’s a predictable behavioural practice be-cause it’s one the most convenient ways to consume the news, he said.Social media also has played a part in the traffic increases. “I think the arrival of social networks is a jumping off point – or a point of origin – for news. What works for People is the
increasing immediacy and the increasing need for people to know exactly what’s happening at that moment and the fact that we are addressing it with high velocity publishing and the stories that really matter…People as a brand not only wants to be on every device and every screen, but what we are looking for in the next couple of years is to be on every surface.”
The future examples Lee refers to are of people consuming People’s content in their cars and outdoors. “We will be there: on watches, wearable devices, every surface that we can be on. People will be platform-ambiguous.”
U.S. m-commerce: Tablet vs. smartphonePercentage share of m-commerce spending and US$ per buyer per platform in Q2 2014
Source: comScore, 2014 © World Newsmedia Network 2015
46% 54%
$198
$259
Smartphone
Smartphone
Tablet
Tablet
Share of m-commercespending by platform
Total m-commerce dollars per buyer by platform
U.S. mobile, desktop e-commerceIn US$ billions, and year-over-year % change, from 2012 to 2014
Source: comScore, 2014 © World Newsmedia Network 2015
0
$10
$20
$30
$40
$50
$60
$70
$80
Bill
ions
of d
olla
rs
$48.8$4.5
$44.3 $43.2 $41.9
$56.8$50.2 $49.8
$47.5
$63.1$56.1 $54.8
$3.8 $4.6
$7.2
$5.9 $4.7$5.8
$8.3
$7.3 $6.8
$47.0 $45.4
$64.0
$56.1 $54.5 $54.3
$71.4
$63.4 $61.6
Q1 2012 Q2 2012 Q3 2012 Q4 2012 Q1 2013 Q2 2013 Q3 2013 Q4 2013 Q1 2014 Q2 2014
+21% +17% +17% +17% +15% +16% +14% +12% +13% +13%
Desktop Mobile

31
GLOBAL MOBILE, APPS AND WEARABLES TRENDS 2015
The atomisation of storiesBreaking stories into pieces and reassembling them in innovative ways: Hello, FOLD
By Matt CarrollReprinted with permission by Matt Carroll, Future of News Initiative, MIT Media Lab@MattatMIT
Storytelling is evolving. It no longer has to follow the same ba-sic, linear structure. Digital stories are going nonlinear. They are being “atomised” — broken into component pieces and then reassembled in new and interesting ways.
One only needs to look at the work done by Storify, Genius, Circa, and Embed.ly, to name a few organisations that are experimenting with new ways of telling stories or conveying information.
And now here comes FOLD, which opened to the public in April 2014. FOLD is a platform for telling stories. It makes it simple to add multimedia background information or create context. It’s easy and intuitive to use. Anyone can publish stories on it; it’s free.
This is how FOLD is different: The main story reads as all stories do, straight down vertically. But contextual information is placed to the side of the main story, on a horizontal line. That information can be video, photos, or links to other sites. It sounds complicated, but when you see it, you realise how simple and elegant it is.In the initial video image, the main story is on the left; context on the right. For more context, follow links in the story or click on the arrows at the far right. The graphic in the lower right is a story map; it shows you where you are.The information is embedded online so you are not taken away from the main story. This is a step past hyperlinks.
Where did FOLD come from?
FOLD was created by two MIT Media Lab students, Alexis Hope and Kevin Hu, with developer Joe Goldbeck. It came out of Ethan Zuckerman’s News and Participatory Media class. (Transparency alert: I am one of Alexis’s academic advisers.)It’s a smart design for dealing with context, and efficiently deals with a problem that many readers must navigate when reading long-running news stories or complicated issues — what to do with all those paragraphs that deal with the “backstory.”
For instance, think what happens while you read a recent trial story about the Boston Marathon bomber. The top of the story includes the latest developments. But much of the rest will be information about what has happened previously at the trial, as well as details of the bombing from 2013. That’s the backstory.
The problem is this: not everyone wants to read the backstory, maybe even a majority of people. Readers who have followed the trial every day will read the first few paragraphs of new information, and then ignore the many lines of ink devoted to backstory. They don’t need it because they already know it. Other readers, less up-to-date, may read all of it.
For the up-to-date reader, that backstory is an annoyance — it interrupts the flow of the new information they want to read. What the heck do I need all this backstory for, if I already know it?, they think. And that’s what makes FOLD so interest-ing. All the backstory is placed off to the side. If you need it, it’s there to peruse. If you don’t need it, ignore it.
It looks different from many other storytelling platforms. For one thing, it’s a “card”-based system. Information is contained on small pieces of real estate that are the rough equivalent of index cards.
32
GLOBAL MOBILE, APPS AND WEARABLES TRENDS 2015
The main story is written on vertical cards, while contextual information is added to the side. Aleszu Bajak, editor of Sto-rybench, does a nice job explaining the mechanics of adding information.
I’ll just add — it’s remarkably easy to use. The learning curve is minimal.
For readers: Better, worse, or …?
FOLD also also makes for a different writing and reading ex-perience. I didn’t fully understand how different it was until I created my first story in FOLD. I imported a story into FOLD that I had already written on Medium.com about my one near-meeting with Leonard Nimoy, aka Mr. Spock.
The main stories are the same, almost word for word. But the look and feel are totally different. The Medium.com story is simple and elegant. It looks great and is an easy read.
The FOLD story on Spock includes video of the 1967 Red Sox, pictures of a long-defunct department store, and music from a Star Trek movie. It encourages meandering through the pictures and other pieces of multimedia.
It also makes you think hard about how to write a story. Do you want to include that little piece of background informa-tion in the main story? Or should it be placed in a contextual card? How much context is too much? Will people read the context cards I’ve created, or will they see it as extra work to avoid?
(As an extra comparison, I’ve done this story on both Medium and FOLD. Which works better for you?)
bit.ly/1IhsXNx
It also makes for a very different reading experience. How will readers react to all this context that’s been added? Will they take the time to at least browse the context cards? Will they engage with the extra material? I’ve heard the argu-ment that people are more comfortable with linear writing in relaxed settings, whether it’s books or news stories. Sit in the easy chair, put your feet up, and read for awhile.
I was at SxSW and spoke about FOLD in the context of the atomisation of news stories. The question was asked: Is this better or worse for readers?
My answer: It’s different. Not better, not worse, just different. To quote that well-known football philosopher, coach Bill Belichick: It is what it is.
Like oral stories are different than books, like bound books are different than scrolls, like the Kindle is different than a phys-ical book. It’s just different. It’s definitely non-linear. Is that better or worse? Some people have suggested that non-linear
learning is more natural. As one person put it, linear learning doesn’t exist in nature. Linear learning is arbitrary.
Maybe. FOLD certainly creates a reading experience that’s different than the linear writing experience people are used to.
Reading on the Internet supposedly results in more “solu-tion-hunting behaviour.” That argument goes like this: The Internet is not about a leisurely read. It’s about getting infor-mation. Short, punchy reads are best.
I’m not sure I buy into that entirely, although there’s definitely some truth there. Still, I’ve read enough investigative pieces and novels on my phone to know that long-form reading works OK, too.
Anyways, FOLD is definitely a storytelling tool worth trying. It’s an attempt to add contextual information in a way that is non-intrusive on the main story. I’ll be interested in hearing what you think about it.

39
GLOBAL SOCIAL MEDIA TRENDS 2015
the worldwide magazine media associationwww.!pp.com/Insight