finite element dynamic analysis - University of Warwick · This paper has been published under the...
31
This paper has been published under the following reference: Pešić, N., Živanović, S., Dennis, J. and Hargreaves, J. (2015) Experimental and finite element dynamic analysis of incrementally loaded reinforced concrete structures. Engineering Structures, Vol. 103, pp. 15‐27, doi:10.1016/j.engstruct.2015.07.037 1 Experimental and finite element dynamic analysis of incrementally loaded reinforced concrete structures NINOSLAV PEŠIĆ a STANA ŽIVANOVIĆ a JAMIE DENNIS b JAMES HARGREAVES b a University of Warwick, School of Engineering, Coventry CV4 7AL, United Kingdom b ARUP, Adv. Technology & Research Division, Blythe Gate, Blythe Valley Park, Solihull B90 8AE, United Kingdom Submitted for publication on 11 September 2014 Accepted on 21 July 2015
Transcript of finite element dynamic analysis - University of Warwick · This paper has been published under the...

This paper has been published under the following reference: Pešić, N., Živanović, S., Dennis, J. and Hargreaves, J. (2015) Experimental and finite element dynamic analysis of incrementally loaded reinforced concrete structures. Engineering Structures, Vol. 103, pp. 15‐27, doi:10.1016/j.engstruct.2015.07.037
1
Experimental and finite element dynamic analysis of incrementally loaded reinforced concrete
structures
NINOSLAV PEŠIĆa STANA ŽIVANOVIĆa JAMIE DENNISb
JAMES HARGREAVESb a University of Warwick, School of Engineering, Coventry CV4 7AL, United Kingdom b ARUP, Adv. Technology & Research Division, Blythe Gate, Blythe Valley Park, Solihull B90 8AE, United Kingdom
Submitted for publication on 11 September 2014
Accepted on 21 July 2015
This paper has been published under the following reference: Pešić, N., Živanović, S., Dennis, J. and Hargreaves, J. (2015) Experimental and finite element dynamic analysis of incrementally loaded reinforced concrete structures. Engineering Structures, Vol. 103, pp. 15‐27, doi:10.1016/j.engstruct.2015.07.037
2
ABSTRACT
This work investigates influence of damage in reinforced concrete (RC) structures on their
dynamic properties through modal testing and non‐linear finite element (FE) analysis. Five RC
beams were designed with the fundamental flexural mode frequencies in the range of 6.5–18.0
Hz for the uncracked state. Mechanical properties of concrete, such as static and dynamic
elastic moduli were determined from standard tests and ultra‐sonic pulse velocity readings.
The beams were incrementally loaded until the span/250 deflection limit was reached and their
natural frequencies were measured from the free decay vibrations. The progressive damage
reduced fundamental frequencies of tested beams by up to 25%. The non‐linear FE analysis
was carried out for RC beams and one two‐span slab and the calculated reduced frequencies of
the 1st and 2nd vibration modes were in excellent agreement with measurements. This led to
the conclusion that, given that the non‐linear analysis can capture degradation of dynamic
stiffness due to cracking, the future dynamic performance and damage identification on the RC
structure can be reliably determined from the same FE model. The results reveal potential of
the combined modal testing and FE analysis to improve inspection and assessment of the in‐
service RC structures.
Keywords: Concrete; Modal testing; FE analysis; Structural dynamics; Damage assessment
This paper has been published under the following reference: Pešić, N., Živanović, S., Dennis, J. and Hargreaves, J. (2015) Experimental and finite element dynamic analysis of incrementally loaded reinforced concrete structures. Engineering Structures, Vol. 103, pp. 15‐27, doi:10.1016/j.engstruct.2015.07.037
3
1 Introduction
1.1 Background
The modal analysis of the in‐service RC structures is gaining prominence as non‐destructive
damage assessment technique from the basic premise that the measured reduction of natural
frequencies of vibration serves as a structural health or damage indicator. This concept brings
together traditional inspection methodology, the experimental modal analysis and structural
dynamic analysis for investigating structural performance and/or damage in the existing RC
structures.
Among the most important parameters in the dynamic analysis and integrity assessment of any
RC structure is the value of the modulus of elasticity for concrete. The distinction between the
static and dynamic modulus of elasticity, both depending on the concrete mix, has already
been made from small specimens and beam tests [1‐3]. The static modulus, Ec, is determined
from the standardised cylinder compression tests while the dynamic modulus, Ec,dyn, is
obtained from the resonance tests or the ultra‐sonic pulse velocity (UPV) readings [4]. Several
empirical equations correlate compressive strength and static modulus of concrete to the
dynamic modulus [5, 6]. The dynamic modulus of concrete is typically 10% to 40% larger than
the static modulus [7].
It will be addressed in the course of our analysis whether the value of the static or dynamic
elastic modulus of concrete should feature in the governing equation of flexural vibrations of
RC beams. In the case of a simply supported cracked RC beam with the cross‐sectional area and
the second moment of area, A(x) and I(x), varying along the span, Ls, this equation has the
form:

This paper has been published under the following reference: Pešić, N., Živanović, S., Dennis, J. and Hargreaves, J. (2015) Experimental and finite element dynamic analysis of incrementally loaded reinforced concrete structures. Engineering Structures, Vol. 103, pp. 15‐27, doi:10.1016/j.engstruct.2015.07.037
4
Here, y is the sectional displacement (deflection), x is the section coordinate along the beam
span (0⩽x⩽Ls), mb is the mass per unit length of the beam and t denotes time. To calculate the
frequency of the n‐th mode of vibration, the closed‐form solution to Eq. (1) is readily available
for the simplest case when the beam cross‐section is assumed to be uniform along the span:
In Eq. (2), the flexural stiffness of the cracked RC beams is product of the elastic modulus of
concrete and the effective second moment of area defined by the Eurocode 2 [8, 9] as:
where Ic1 and Ic2 are the second moment of areas of the gross and cracked RC section,
respectively, while 0.60⩽α⩽0.80 is the load parameter [9]. This approximation of the second
moment of area might be suitable for estimating the frequency reduction on RC beams at the
design stage but is not applicable for damage identification on the more complex structural
elements or when the cumulative effects of incremental loading need to be assessed.
In an improvement over Eq. (3), a continuous function for reduced flexural stiffness was
proposed for damage identification on cracked RC beams with known frequencies [10]. Three
damage parameters, denoted as α,β and n represent reduced stiffness of the cross‐section, the
length and the shape of the beam damaged zone and are iteratively determined by equating
the measured frequencies with those calculated from the 2D segmental model of the beam.
These analysis steps outline the basics of the model updating technique that needs to be
expanded for dynamic analysis of geometrically more complex RC structures warranting finite
element (FE) modelling and analysis.
It was observed from the experimental modal analysis of the incrementally damaged RC beams
and slabs [8, 11‐13] that their frequency of the 1st vibration mode can be reduced up to 30%

This paper has been published under the following reference: Pešić, N., Živanović, S., Dennis, J. and Hargreaves, J. (2015) Experimental and finite element dynamic analysis of incrementally loaded reinforced concrete structures. Engineering Structures, Vol. 103, pp. 15‐27, doi:10.1016/j.engstruct.2015.07.037
5
when the yielding of the tensile reinforcement occurs [14, 15]. Such magnitude of frequency
reduction, being a consequence of structural damage, gave rise to the concept of damage
identification by means of modal testing [16, 17]. The method is applicable to RC structures for
a range of problems from vibration serviceability of the concrete floor slabs in buildings to the
assessment of bridges.
The FE model updating technique has already been used for accurate evaluation of the
dynamic properties of the field‐tested concrete structures that exhibit linear dynamic
behaviour [18]. This work will further examine the benefits of simultaneous use of the
experimental modal analysis and non‐linear FE analysis for the structural assessment of
traditional RC beams, slabs or other types of structures whose natural frequencies inevitably
reduce due to the load‐induced cracks in concrete. As cracking introduces non‐linear response
of RC structures, their structural performance and dynamic behaviour cannot be accurately
assessed nor predicted by means of linear analysis [19, 20].
1.2 Researchsignificanceandobjectives
The case now exists to expand the FE model updating methodology to the non‐linear analysis
of cracked RC beams and more complex structural elements modelled with solid 2D/3D or shell
elements. Once sufficiently accurate natural frequencies are computed from the updated FE
models, zones with structural damage could be identified from the same models using
parameters that define the non‐linear constitutive law for concrete.
The concept will be studied through the modal testing of five RC beams with different
span/depth ratios and through the non‐linear FE analysis of their 2D/3D models. The
investigated points are:
time‐development of the concrete strength and static and dynamic modulus of
elasticity;
the rate of frequency reduction in RC beams with the increase in the applied loading;

This paper has been published under the following reference: Pešić, N., Živanović, S., Dennis, J. and Hargreaves, J. (2015) Experimental and finite element dynamic analysis of incrementally loaded reinforced concrete structures. Engineering Structures, Vol. 103, pp. 15‐27, doi:10.1016/j.engstruct.2015.07.037
6
influence of the number of load cycles on the frequency reduction in RC beams;
the accuracy of the FE analysis in predicting natural frequencies of cracked RC beams
and identification of the load‐induced damage in concrete.
For further correlation of results from the experimental modal testing and dynamic analysis
with the extent of damage in RC structures, the non‐linear analysis will also be performed on
the FE models of an independently tested two‐span RC slab [12].
2 Experimentalprogramme
Five RC beams were incrementally loaded and their modal properties determined after each
load‐unload step. This section reports on the mechanical properties of concrete, the
experimental configuration of RC beams and, finally, the results from their modal testing.
2.1 Propertiesofconcrete
Details of the concrete mix and the curing regime are provided in Table 1. Compressive
strength of concrete was evaluated as the average from three 100 mm cubes crushed in the
period from 7 to 250 days after casting. Cylinder compressive strength was obtained at the age
of concrete of 32 and 105 days and the static elastic modulus at the age of 32 days (this is
comparable to the 28‐days reference age of concrete in codes of practice). Cement CEM‐II/B‐V
contained 30% fly‐ash which, due to its slower hydration rate, added to the modest
compressive strength gain after the age of 20 days. Time development of the concrete
compressive strength until the age of 250 days is shown in Fig. 1. The 32‐day characteristic
cube and cylinder compressive strengths (fck,cube≈48 MPa and fck≈43 MPa) place this concrete
between the “C35/45” and “C40/50” Eurocode 2 classes [9].
Using the averaged UPV readings, vp, on 300, 400 and 500 mm long prisms with the same cross‐
sections as the tested beams (Section 2.2), the dynamic modulus of concrete was evaluated
from the following relation:

This paper has been published under the following reference: Pešić, N., Živanović, S., Dennis, J. and Hargreaves, J. (2015) Experimental and finite element dynamic analysis of incrementally loaded reinforced concrete structures. Engineering Structures, Vol. 103, pp. 15‐27, doi:10.1016/j.engstruct.2015.07.037
7
in which the Poisson’s coefficient was adopted as a constant ϑ=0.20 while the density of
concrete cubes varied with time (due to drying) within the range of 2300⩾ρc⩾2250 kg/m3.
Table 1. Details of the concrete mix.
Figure 1: Development of the concrete compressive strength with time.
The static modulus of elasticity was experimentally determined as Ec≈30.5 GPa. The Eurocode 2
equation Ec=22.0 (fcm/10)0.30 [GPa], in which fcm=fck+8 [MPa] is the mean characteristic
compressive strength of concrete, over‐estimates the experimental Ec value by nearly 20%. A

This paper has been published under the following reference: Pešić, N., Živanović, S., Dennis, J. and Hargreaves, J. (2015) Experimental and finite element dynamic analysis of incrementally loaded reinforced concrete structures. Engineering Structures, Vol. 103, pp. 15‐27, doi:10.1016/j.engstruct.2015.07.037
8
much better estimate of the static modulus was made using the empirical formula of Noguchi
et al. [21]:
Eq. (5) takes into account not only the compressive strength of concrete but also its density at
the age of 28 days, ρc≈2286 kg/m3, and the type of aggregate and cement through the
correction coefficients k1=0.95 (quartzite aggregate) and k2=1.10 (high volume fly‐ash cement)
giving finally the value of Ec≈30.0 GPa.
The values of the 32‐day static modulus from the cylinder tests, Ec, and the time‐development
of the dynamic modulus of concrete from the UPV readings, Ec,dyn, are plotted in Fig. 2. After 60
days of age, the measured UPV in dry concrete was nearly constant at vp≈4.40 km/s and Eq. (4)
then gives the dynamic modulus value of Ec,dyn≈40.1 GPa. Small reduction in the dynamic
modulus of concrete at the age of concrete between 60 and 90 days is attributed to the
reduction of concrete density due to drying. For the age of concrete beyond 90 days, the
dynamic to the 32‐day static modulus of elasticity ratio becomes nearly constant:
2.2 RCbeamssetup
The geometric data of the five simply supported RC beams are provided in Table 2. The chosen
span‐to‐depth ratios between 27.5 and 45.0 gave the fundamental natural frequencies that are
near and beyond the typical values for the long‐span RC floor slabs and beams in building
construction. Adopting the experimental value of the static elastic modulus, Ec=30.5 GPa, the
predicted 1st mode frequencies of RC beams in their non‐cracked state were in the range from
6.5 to 18.0 Hz. Values in Table 2 are from the FE analysis (f1,FE) and segmental analysis method
that was, in the considered cases, also applicable to simply supported beams with and without
overhangs (Appendix A, f1,a). With the yielding and the ultimate tensile strengths of reinforcing

This paper has been published under the following reference: Pešić, N., Živanović, S., Dennis, J. and Hargreaves, J. (2015) Experimental and finite element dynamic analysis of incrementally loaded reinforced concrete structures. Engineering Structures, Vol. 103, pp. 15‐27, doi:10.1016/j.engstruct.2015.07.037
9
bars measured as 555 MPa and 615 MPa, respectively, the cross‐sectional yielding bending
moment capacity is My≈3.00 kNm and the yielding load level for each beam is simply estimated
as Py=4My/Ls.
Figure 2: Static and dynamic modulus of concrete (time development).
Table 2. Geometry of the tested RC beams.
RC beams were subjected to the symmetric three point load bending tests with one support
fixed and the other made as the low‐friction bearing. The incremental loading was applied
using a single 10 kN capacity hydraulic jack and the static deflections were measured with the
micro‐meter at the peak of each loading cycle and after unloading. To cover the deformation
This paper has been published under the following reference: Pešić, N., Živanović, S., Dennis, J. and Hargreaves, J. (2015) Experimental and finite element dynamic analysis of incrementally loaded reinforced concrete structures. Engineering Structures, Vol. 103, pp. 15‐27, doi:10.1016/j.engstruct.2015.07.037
10
range of practical interest, the beams were loaded until the mid‐span deflection reached the
Ls/250 limit.
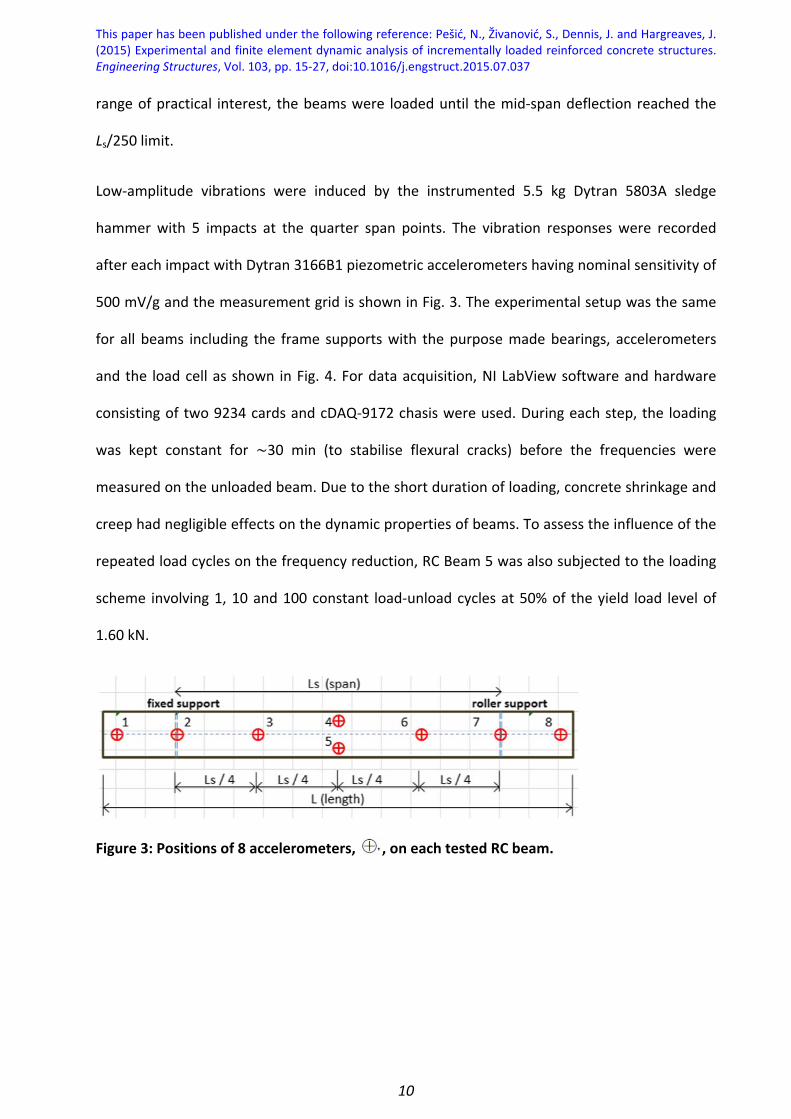
Low‐amplitude vibrations were induced by the instrumented 5.5 kg Dytran 5803A sledge
hammer with 5 impacts at the quarter span points. The vibration responses were recorded
after each impact with Dytran 3166B1 piezometric accelerometers having nominal sensitivity of
500 mV/g and the measurement grid is shown in Fig. 3. The experimental setup was the same
for all beams including the frame supports with the purpose made bearings, accelerometers
and the load cell as shown in Fig. 4. For data acquisition, NI LabView software and hardware
consisting of two 9234 cards and cDAQ‐9172 chasis were used. During each step, the loading
was kept constant for ∼30 min (to stabilise flexural cracks) before the frequencies were
measured on the unloaded beam. Due to the short duration of loading, concrete shrinkage and
creep had negligible effects on the dynamic properties of beams. To assess the influence of the
repeated load cycles on the frequency reduction, RC Beam 5 was also subjected to the loading
scheme involving 1, 10 and 100 constant load‐unload cycles at 50% of the yield load level of
1.60 kN.
Figure 3: Positions of 8 accelerometers, , on each tested RC beam.

This paper has been published under the following reference: Pešić, N., Živanović, S., Dennis, J. and Hargreaves, J. (2015) Experimental and finite element dynamic analysis of incrementally loaded reinforced concrete structures. Engineering Structures, Vol. 103, pp. 15‐27, doi:10.1016/j.engstruct.2015.07.037
11
Figure 4: Experimental setup: (a) RC Beam 4 with accelerometers; (b) RC Beam 5 with the load cell installed at the mid‐span; (c), (d) and (e) installed accelerometers and typical pattern of flexural cracks near the mid‐span point.
2.3 Modalanalysisresults
After each load‐unload cycle, free vibration responses of RC beams were recorded at the
sampling rate of fs=1652 Hz. For every beam, the natural frequencies were obtained from the
averaged Fourier spectra of five acceleration time histories recorded for 8 s after hammer
impact. All beams were subjected to the incremental loads Pi and Table 3 shows the gradual
reduction in measured frequencies of the 1st and 2nd vibration modes, f1,i and f2,i, respectively,
with the index i denoting the load step. The predicted frequencies of the 1st mode of vibration
for the non‐loaded RC beams (see Table 2) are in excellent agreement with the frequencies
measured before any loading was applied, f1,i=0. For the load levels below yielding point, Py,
the gradual shifts in the natural frequencies of the 1st and 2nd modes, as identified on all
tested beams, are plotted in Fig. 5.

This paper has been published under the following reference: Pešić, N., Živanović, S., Dennis, J. and Hargreaves, J. (2015) Experimental and finite element dynamic analysis of incrementally loaded reinforced concrete structures. Engineering Structures, Vol. 103, pp. 15‐27, doi:10.1016/j.engstruct.2015.07.037
12
Table 3. Measured 1st and 2nd natural frequencies, f1,i and f2,i of RC beams subjected to different load levels, Pi (i=0,1,2,3…).
Figure 5: 1st and 2nd mode frequency reduction rate vs. the applied/yielding load ratios Pi/Py.
Similarly to the previously reported findings [11, 15], the frequency reduction is proportionally
larger for the starting load increments. Only near and after the yielding level is reached, the
rate of reduction is slowed down. This is verified from the graphs showing the 1st and 2nd
mode frequency ratios, f1,i/f1,i=0 and f2,i/f2,i=0, against the applied to yielding loading ratio, Pi/Py
(Fig. 5). The frequency reduction trend for RC beam 5 exhibits a discrete drop at the 1.60 kN
load at which 100 load‐unload cycles were applied. This cyclic loading was at relatively low level
(approx. 55% of the yield load) at which no significant cumulative damage was observed. After
the beam was subjected to two additional cycles at 3.0 kN and 4.5 kN, the frequency reduction
resumed in the same manner as observed on other beams.

This paper has been published under the following reference: Pešić, N., Živanović, S., Dennis, J. and Hargreaves, J. (2015) Experimental and finite element dynamic analysis of incrementally loaded reinforced concrete structures. Engineering Structures, Vol. 103, pp. 15‐27, doi:10.1016/j.engstruct.2015.07.037
13
With the deflected shape of the loaded beams resembling the shape of the 1st vibration mode,
the relative magnitude of the frequency reduction near the yielding point (Pi/Py≈1.0) is larger
for the 1st mode (between 10% and 25% of f1,i=0) than for the 2nd mode (between 2% and 15%
of f2,i=0). From the practical point of view, the natural frequencies of the first two vibration
modes need to be clearly identified if the shifts in the measured frequencies caused by damage
in concrete are to be utilised in structural health assessment. To demonstrate this approach,
frequency shifts from the initially unloaded to the yield load level are plotted in Fig. 6.
Figure 6: Frequency shifts from the FFT spectra of the vertical accelerations recorded at the quarter‐span points for RC Beams 1 to 5 before and after damage (a)–(e).
3 AnalysisandFEmodelling
3.1 FEanalysisoftheRCbeams
Finite element analysis of the tested RC beams was performed using the FE analysis software
ABAQUS [22]. The non‐linear concrete behaviour in tension and compression was modelled by
the tension stiffening and damage plasticity models [23]. Two constitutive models for concrete

This paper has been published under the following reference: Pešić, N., Živanović, S., Dennis, J. and Hargreaves, J. (2015) Experimental and finite element dynamic analysis of incrementally loaded reinforced concrete structures. Engineering Structures, Vol. 103, pp. 15‐27, doi:10.1016/j.engstruct.2015.07.037
14
in tension available, the smeared cracking (SCM) and the damage plasticity model (DPM),
account for the reduction of stiffness in concrete by reducing the effective modulus of elasticity
when the total tensile strain exceeds the value corresponding to the peak tensile strength. The
main difference is that DPM features the tensile damage variable that can take values
0⩽dt⩽1.0. This scalar, introduced in the post‐peak tension stress–strain law, allows for further
analytical reduction of the elastic modulus when concrete is subjected to the repeated or
incremental loading. Assuming the linear post‐peak stress–strain relationship for concrete in
tension, σc‐εct, and the total tensile strain expressed as the sum of the elastic and inelastic
(non‐recoverable) strain, εct=εct,e+εct,p, the mathematical reduction of the elastic modulus as a
function of the isotropic tensile damage variable, Ec,i=Ec(1‐dt), is illustrated in Fig. 7. In the FE
analysis, the change of Ec,i is the most influential factor for the calculation of the reduced
natural frequencies of any RC element or structure.
Figure 7: Adopted constitutive model for concrete in tension.
The characteristic compressive strength of concrete adopted in the analysis of RC beams was
fck=53 MPa; this value is representative of the cube strengths achieved during the testing
period between 60 and 90 days after casting. The dynamic analysis was insensitive to the

This paper has been published under the following reference: Pešić, N., Živanović, S., Dennis, J. and Hargreaves, J. (2015) Experimental and finite element dynamic analysis of incrementally loaded reinforced concrete structures. Engineering Structures, Vol. 103, pp. 15‐27, doi:10.1016/j.engstruct.2015.07.037
15
adopted value of fck because the maximum compressive stresses in concrete from the applied
loading were considerably lower (from the cross‐sectional analysis, ∼15 MPa at yielding). The
stress–strain law for concrete in compression was defined by the Eurocode 2 [9] equation:
Two‐ and three‐dimensional FE models of the tested RC beams were analysed with a number of
varying parameters listed in Table 4. Variables include the choice of 2D (4‐ and 8‐noded plane
stress), or 3D (8‐noded hexagon) elements, reinforcement modelling (embedded truss
elements or Abaqus‐rebars) and the elastic modulus, tensile strength and fracture properties of
concrete.
Table 4. FE analysis methodology and variables in the parametric study.
The initial estimate for the tensile strength of concrete was based on the Eurocode 2 formula
(Table 3.1 in [9]) that uses the characteristic 28‐day compressive strength:
It was subsequently found that better correlations with the measured frequencies are obtained
when the concrete tensile strength in the FE model is lower than the value given by Eq. (8). The

This paper has been published under the following reference: Pešić, N., Živanović, S., Dennis, J. and Hargreaves, J. (2015) Experimental and finite element dynamic analysis of incrementally loaded reinforced concrete structures. Engineering Structures, Vol. 103, pp. 15‐27, doi:10.1016/j.engstruct.2015.07.037
16
effects of several other variables and analysis factors were also examined in the parametric
study. For concrete, these included the starting value of the elastic modulus, Ec, and
parameters that define its post‐cracking behaviour like the Mode I fracture energy, GfI, the
maximum crack opening, utck, and the ultimate (failure) tensile strain, εctu. The choice between
2D or 3D solid models and the method of modelling internal reinforcement did not have
significant influence on the computed frequencies of RC beams. Example in Fig. 8 is from 3D
analysis of RC Beam 2 after the 2.55 kN load‐unload step.
Figure 8: 1st and 2nd vibration modes of RC Beam 2 after 2.55 kN load‐unload step (i=7, Table 3).
Variations in the 2D/3D mesh densities, with element sizes from 20 to 50 mm also did not have
substantial qualitative or quantitative impact on the prediction of frequencies. The presented
results are from the FE models featuring uniform mesh with the element lengths and heights of
lm=50 mm and hm=30 mm, respectively. On the other hand, the FE models were most sensitive
to the changes in the modulus of elasticity and tensile strength of concrete. The ranges of
parameters used in the model updating are provided in Table 4 together with the identified
values that best matched the experimentally measured frequencies of the first two vibration
modes.

This paper has been published under the following reference: Pešić, N., Živanović, S., Dennis, J. and Hargreaves, J. (2015) Experimental and finite element dynamic analysis of incrementally loaded reinforced concrete structures. Engineering Structures, Vol. 103, pp. 15‐27, doi:10.1016/j.engstruct.2015.07.037
17
The accuracy of 5% to 10% against the measured frequencies of the 1st and 2nd vibration
modes was achieved in the FE parametric study with the values of the elastic modulus of
concrete adopted as Ec≈29.0–29.5 GPa (nearly equal to the experimental static modulus value)
and the tensile strength in the region 2.30⩽fct⩽2.50 MPa (at the lower bound values defined in
the Eurocode 2 [9] as fct,0.05=0.70fctm≈2.35 MPa). For the 1st vibration mode, the load‐
dependent frequency reductions computed with the selected “best fit” parameter values of the
mechanical properties of concrete are plotted for all beams in Fig. 9. If the elastic modulus and
tensile strength are outside of these ranges, the calculated frequencies deviate considerably
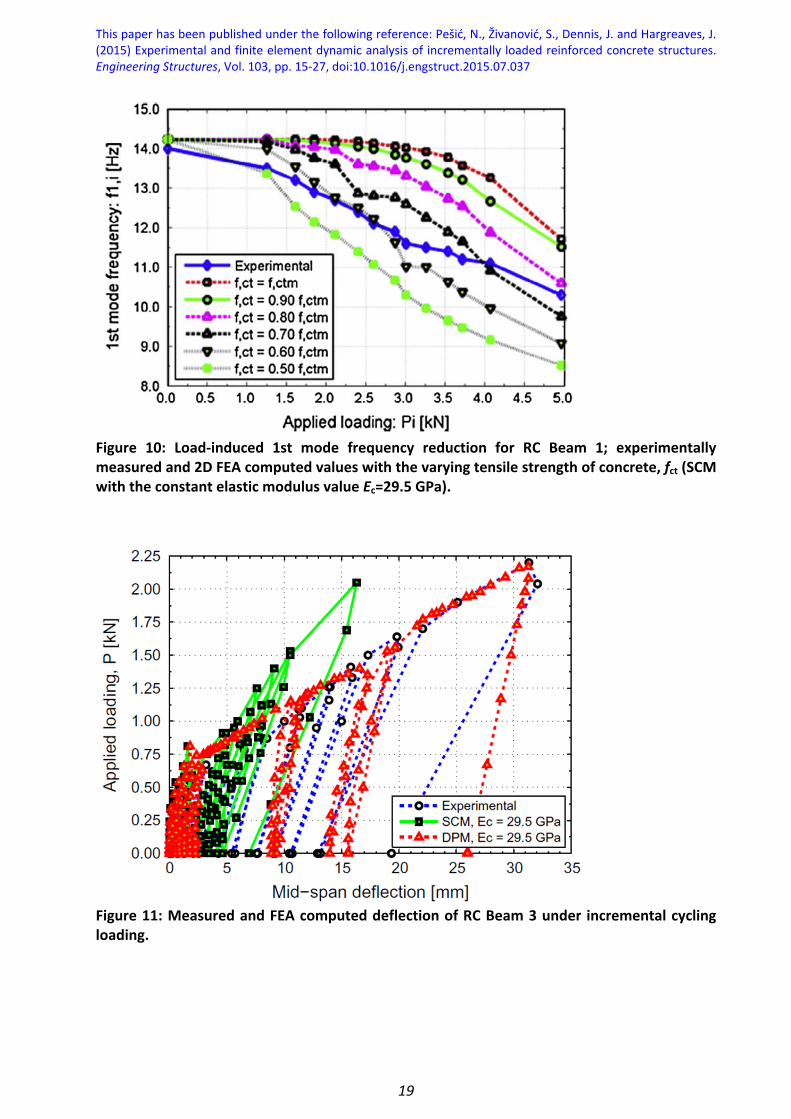
from the measured values. For example, Fig. 10 illustrates the load‐induced frequency
reduction from FE modal analysis of Beam 1 with the varying concrete tensile strength:
fctm⩾fct⩾0.50fctm.
Almost as a rule, in the force‐controlled non‐linear FE analysis, all models of tested RC beams
initially exhibit somewhat higher than experimentally observed dynamic stiffness. In the case of
Beam 3, the experimental frequency reduction line suggests that a minor flexural damage was
already present before the load testing. However, once the applied loading caused further
damage, the numerically predicted frequency reduction rate was, in absolute terms, in
excellent agreement with the experimentally measured values. Fig. 9 also reveals that, for
predicting vibration frequencies of damaged RC beams, the smeared cracking model
outperforms less reliable damage plasticity model. While DPM provided quite accurate
estimate of the beam deflections (the example load–deflection plot in Fig. 11 is for RC Beam 3),
it keeps a much higher stiffness of concrete immediately after unloading which is the probable
explanation for its inadequate frequency estimates.
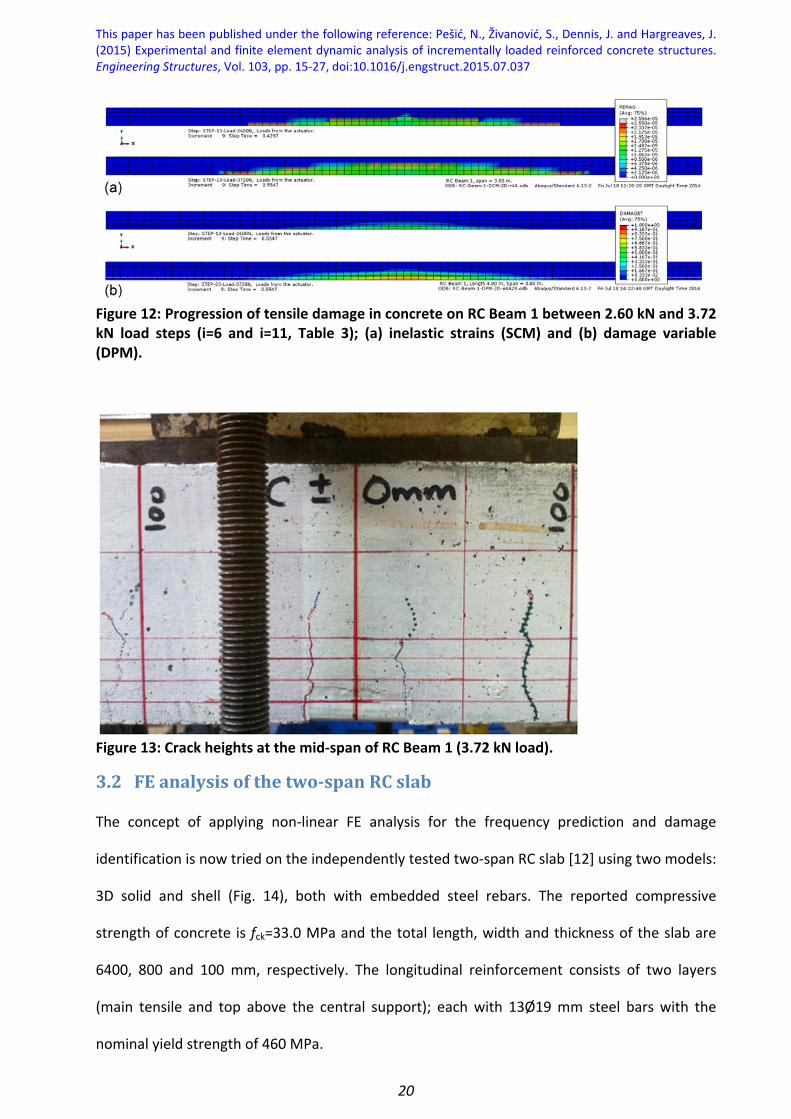
The progressive damage in concrete leading to the frequency reduction can be visualised by
contour plots of the post‐cracking tensile strains (SCM) or of the damage tension parameter
(DPM). Fig. 12 illustrates these damage detection concepts from the analysis example of RC
Beam 1. The contours plots outline the zones in concrete affected by cracking and damage

This paper has been published under the following reference: Pešić, N., Živanović, S., Dennis, J. and Hargreaves, J. (2015) Experimental and finite element dynamic analysis of incrementally loaded reinforced concrete structures. Engineering Structures, Vol. 103, pp. 15‐27, doi:10.1016/j.engstruct.2015.07.037
18
development between the 2.60 kN and 3.72 kN load steps when the steepest 1st mode
frequency reduction gradient was measured. Of the two available concrete models and
irrespective of the mesh density, the SCM tensile strain plot is more consistent with the
observed crack heights of ∼70 mm (see Fig. 13).
Figure 9: (a)–(e): Load‐induced frequency reduction for RC Beams 1 to 5; experimentally measured and 2D FEA computed values.
This paper has been published under the following reference: Pešić, N., Živanović, S., Dennis, J. and Hargreaves, J. (2015) Experimental and finite element dynamic analysis of incrementally loaded reinforced concrete structures. Engineering Structures, Vol. 103, pp. 15‐27, doi:10.1016/j.engstruct.2015.07.037
19
Figure 10: Load‐induced 1st mode frequency reduction for RC Beam 1; experimentally measured and 2D FEA computed values with the varying tensile strength of concrete, fct (SCM with the constant elastic modulus value Ec=29.5 GPa).
Figure 11: Measured and FEA computed deflection of RC Beam 3 under incremental cycling loading.
This paper has been published under the following reference: Pešić, N., Živanović, S., Dennis, J. and Hargreaves, J. (2015) Experimental and finite element dynamic analysis of incrementally loaded reinforced concrete structures. Engineering Structures, Vol. 103, pp. 15‐27, doi:10.1016/j.engstruct.2015.07.037
20
Figure 12: Progression of tensile damage in concrete on RC Beam 1 between 2.60 kN and 3.72 kN load steps (i=6 and i=11, Table 3); (a) inelastic strains (SCM) and (b) damage variable (DPM).
Figure 13: Crack heights at the mid‐span of RC Beam 1 (3.72 kN load).
3.2 FEanalysisofthetwo‐spanRCslab
The concept of applying non‐linear FE analysis for the frequency prediction and damage
identification is now tried on the independently tested two‐span RC slab [12] using two models:
3D solid and shell (Fig. 14), both with embedded steel rebars. The reported compressive
strength of concrete is fck=33.0 MPa and the total length, width and thickness of the slab are
6400, 800 and 100 mm, respectively. The longitudinal reinforcement consists of two layers
(main tensile and top above the central support); each with 13Ø19 mm steel bars with the
nominal yield strength of 460 MPa.
This paper has been published under the following reference: Pešić, N., Živanović, S., Dennis, J. and Hargreaves, J. (2015) Experimental and finite element dynamic analysis of incrementally loaded reinforced concrete structures. Engineering Structures, Vol. 103, pp. 15‐27, doi:10.1016/j.engstruct.2015.07.037
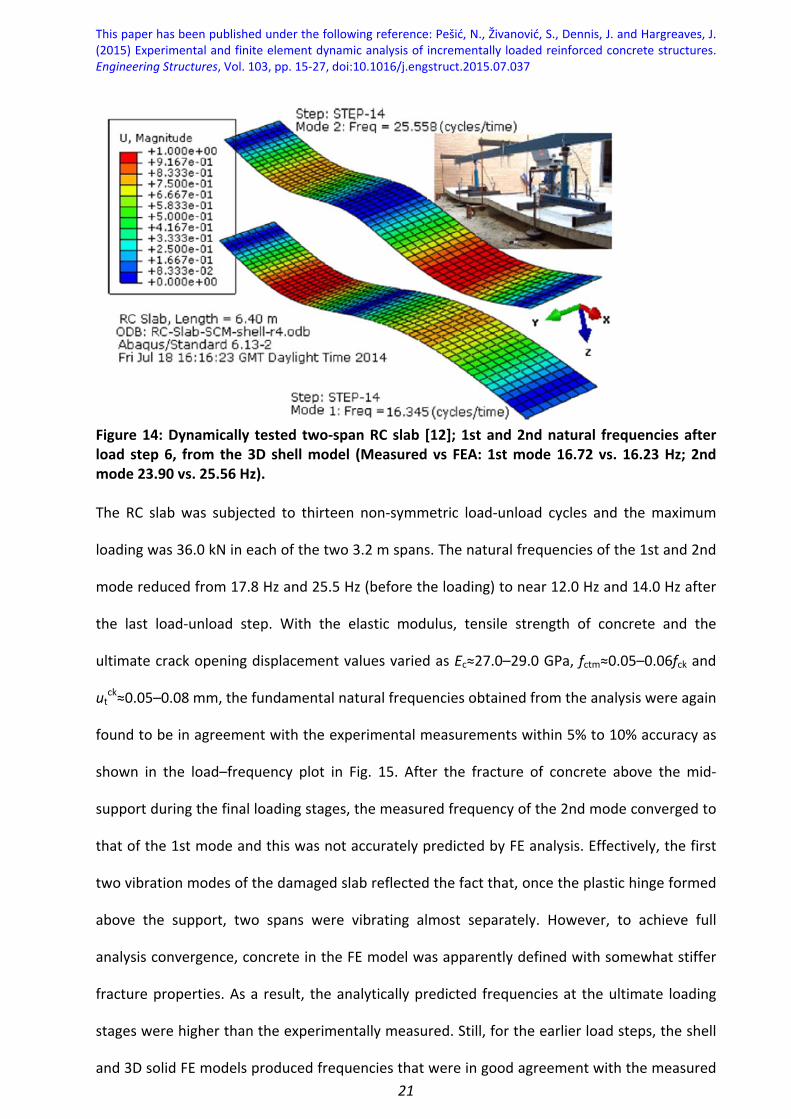
21
Figure 14: Dynamically tested two‐span RC slab [12]; 1st and 2nd natural frequencies after load step 6, from the 3D shell model (Measured vs FEA: 1st mode 16.72 vs. 16.23 Hz; 2nd mode 23.90 vs. 25.56 Hz). The RC slab was subjected to thirteen non‐symmetric load‐unload cycles and the maximum
loading was 36.0 kN in each of the two 3.2 m spans. The natural frequencies of the 1st and 2nd
mode reduced from 17.8 Hz and 25.5 Hz (before the loading) to near 12.0 Hz and 14.0 Hz after
the last load‐unload step. With the elastic modulus, tensile strength of concrete and the
ultimate crack opening displacement values varied as Ec≈27.0–29.0 GPa, fctm≈0.05–0.06fck and
utck≈0.05–0.08 mm, the fundamental natural frequencies obtained from the analysis were again
found to be in agreement with the experimental measurements within 5% to 10% accuracy as
shown in the load–frequency plot in Fig. 15. After the fracture of concrete above the mid‐
support during the final loading stages, the measured frequency of the 2nd mode converged to
that of the 1st mode and this was not accurately predicted by FE analysis. Effectively, the first
two vibration modes of the damaged slab reflected the fact that, once the plastic hinge formed
above the support, two spans were vibrating almost separately. However, to achieve full
analysis convergence, concrete in the FE model was apparently defined with somewhat stiffer
fracture properties. As a result, the analytically predicted frequencies at the ultimate loading
stages were higher than the experimentally measured. Still, for the earlier load steps, the shell
and 3D solid FE models produced frequencies that were in good agreement with the measured

This paper has been published under the following reference: Pešić, N., Živanović, S., Dennis, J. and Hargreaves, J. (2015) Experimental and finite element dynamic analysis of incrementally loaded reinforced concrete structures. Engineering Structures, Vol. 103, pp. 15‐27, doi:10.1016/j.engstruct.2015.07.037
22
values for the 1st and 2nd vibration mode. Finally, the 3D solid FE model has realistically
identified progressive damage in the RC slab that caused frequency reduction (Fig. 16).
Figure 15: 1st and 2nd mode frequency reduction on incrementally loaded RC slab (experimental and numerical values from the 3D solid FE model).
Figure 16: Tensile damage in the two span RC slab (after load step 7).
4 Discussion
The dynamic properties of RC beams (and a slab) were investigated through the study of three
inter‐linked topics: determination of the modulus of elasticity of concrete, Ec, to be adopted for
FE analysis, the rate of frequency reduction under the applied loading and prediction of
frequency changes by means of the non‐linear FE analysis.

This paper has been published under the following reference: Pešić, N., Živanović, S., Dennis, J. and Hargreaves, J. (2015) Experimental and finite element dynamic analysis of incrementally loaded reinforced concrete structures. Engineering Structures, Vol. 103, pp. 15‐27, doi:10.1016/j.engstruct.2015.07.037
23
Whilst the static modulus of elasticity of concrete was determined from the cylinder
compression tests, there are two more options: to estimate Ec using empirical formulas like Eq.
(5) [21] or to derive it indirectly from the dynamic modulus (e.g. the UPV readings on the actual
RC structure). For the second case, measurements taken on prisms of different lengths are
evidence that, for concrete ages beyond 60 days, the UPV and the dynamic modulus of
elasticity, Ec,dyn (Eq. (4)), can be considered as material constants. The UPV readings offer a
prospect for consistently reliable prediction of the static modulus provided that the re ratio (Eq.
(6)) is known for a particular concrete mixture but, unfortunately, this is usually not the case.
The modal testing of RC beams was used to correlate the applied incremental loading (and the
induced damage) to the reduction of natural frequencies. The slenderness of RC beams,
expressed as the span to depth ratio (Ls/h), varied but the change of the measured frequencies
presented in the form of the frequency‐load graphs (Fig. 5) showed the frequency reduction
pattern that is similar to those from the previously published works. The rate of this reduction
is faster at the earlier load stages with the maximum drop in measured frequencies, from the
initially non‐loaded RC beams to the yielding load levels, remaining below 25% for the 1st
mode. It is of practical interest to note that, in relative terms, the frequency reduction was
relatively larger for the 1st than for the 2nd vibration mode and this was expected given that
the beam deflection more resembled the shape of the 1st mode. Furthermore, different static
or dynamic load‐histories can lead to the same frequency reduction and they need to be known
when non‐linear FE analysis is used for structural assessment. The argument comes from the
application of 100 constant load cycles (at 50% yield level) on RC beam 5 that produced the
same cumulative effect on the 1st natural frequency as a single ∼20% higher load increment
would have.
In the parametric FE analysis performed using ABAQUS, the key variables defined the
constitutive laws for concrete in tension. The DPM gives more accurate load–deflections results
but is inferior to SCM for the extraction of the reduced beam frequencies. Calculation of the

This paper has been published under the following reference: Pešić, N., Živanović, S., Dennis, J. and Hargreaves, J. (2015) Experimental and finite element dynamic analysis of incrementally loaded reinforced concrete structures. Engineering Structures, Vol. 103, pp. 15‐27, doi:10.1016/j.engstruct.2015.07.037
24
natural frequencies of RC beams was most sensitive to the values of the initial elastic modulus
of concrete, Ec, and the tensile strength of concrete, fct. Near the median range of tried values
(Table 4), variations in the ultimate tensile strain, εctu, a full crack opening width, utck, and the
energy release rate of the 1st fracture mode, GfI, have lesser influence on the calculated post‐
cracking frequencies. (Example analysis input file for RC beam 2 is provided in Appendix B.) The
best frequency predictions using the SCM in the FE analysis were achieved with the initial value
of the elastic modulus of concrete adopted Ec≈29.5 GPa (close to the experimentally obtained
static value) and with the tensile strength of concrete near the lower bound defined by
Eurocode 2, fct≈0.70fctm (Eq. (8)).
Combined with the experimental vibration measurements, the FE analysis of dynamically
validated structure models has potential to aid and improve traditionally performed visual
inspection and damage assessment of larger RC structures. The proposed vibration based
damage assessment framework for the in‐service RC structures comprises field modal testing
and non‐linear FE analysis with the necessary steps summarised in Fig. 17.
When the frequencies are first measured on a newly built structure with known boundary
conditions, the value of the elastic modulus of concrete should be verified with the starting FE
analysis. Once in exploitation, regular monitoring and periodic modal testing will provide
records of the environmental/load history and reduced fundamental frequencies of the
incrementally damaged structure. This would allow for the FE model to be updated with the
fracture properties of concrete so that the non‐linear analysis can match the measured
frequencies.
From the analysed examples it follows that, if the values of parameters that define concrete
fracture are within the ’narrow’ bands that could be identified after the initial damage load
levels, the progressive reduction of fundamental frequencies can be reasonably accurately
predicted for the later loading stages. The same FE model would then be used for frequency
calculation and identification of the damaged zones in concrete which remains the primary

This paper has been published under the following reference: Pešić, N., Živanović, S., Dennis, J. and Hargreaves, J. (2015) Experimental and finite element dynamic analysis of incrementally loaded reinforced concrete structures. Engineering Structures, Vol. 103, pp. 15‐27, doi:10.1016/j.engstruct.2015.07.037
25
objective of the whole process. It would also be a good practice at construction stage to
produce a set of concrete specimens from which its properties used in the dynamic FE analysis
(such as tensile strength and elastic modulus) can be experimentally determined at the time
when structural assessment is undertaken.
Figure 17: Flow‐chart of the initial modal and FE analysis (Stage I) and the long‐term structural monitoring, assessment and maintenance cycle that incorporates vibration based damage identification (Stage II).
5 Conclusions
The presented work explored how the measurable reduction of natural frequencies of vibration
in cracked RC elements can be exploited for the assessment of their structural health and led to
the following conclusions:

This paper has been published under the following reference: Pešić, N., Živanović, S., Dennis, J. and Hargreaves, J. (2015) Experimental and finite element dynamic analysis of incrementally loaded reinforced concrete structures. Engineering Structures, Vol. 103, pp. 15‐27, doi:10.1016/j.engstruct.2015.07.037
26
In dynamic analysis of RC structures, the value of the elastic modulus of concrete, Ec,
should be adopted as the modulus obtained from the standard cylinder compression
tests.
For concrete older than 60 days, the ultra‐sonic pulse velocity, vp, and the dynamic
modulus of elasticity, Ec,dyn, can be considered as the material property constants. They
could be used for empirical estimation of the concrete compressive strength and static
modulus.
On simply supported RC structures subjected to pure bending (like bridge girders, floor
slabs or beams), the damage‐induced frequency reduction will be more significant for
the 1st mode of vibration.
Non‐linear FE analysis of RC structures modelled with 2D/3D or shell elements can
predict the load‐induced reduction of their frequencies with the accuracy of ±10%. This
is consistently achieved with the elastic modulus of concrete adopted as the “static”
value Ec and the tensile strength as 5% of the characteristic compressive strength,
fct≈0.05fck.
The analysis of the RC beams and a slab was performed on the FE models updated with
results from the modal testing. The same FE models accurately predicted their future
dynamic performance as the damage in concrete was straightforwardly visualised using
parameters that define constitutive models in tensions.
The combined modal and FE analysis methodology can be of particular use in the
maintenance of large RC structures on which the full‐scale visual inspection is difficult
(girders and decks of RC bridges, towers) or when the structural serviceability, rather
than integrity, is affected by cracks (liquid retaining RC structures).
AcknowledgementsThe authors express gratitude to the University of Warwick for funding the project through its internal Research Development Fund. The thanks are extended to the final year engineering students (class of 2014) and to Dr Peter Little of Admor Engineering (UK) for their help with practical work.

This paper has been published under the following reference: Pešić, N., Živanović, S., Dennis, J. and Hargreaves, J. (2015) Experimental and finite element dynamic analysis of incrementally loaded reinforced concrete structures. Engineering Structures, Vol. 103, pp. 15‐27, doi:10.1016/j.engstruct.2015.07.037
27
AppendixA.NumericaldamagerepresentationforRCBeam1
A damage scenario for RC Beam 1 after the load steps i=3,6,11,13 (Table 3) is plotted in Fig.
A.18. It is numerical solution to the beam equation of motion (Eq. (1)) in which the reduction of
the cross‐sectional second moment of area, from I0, and the length of the cracked zone, βLs, are
approximated by the power function [10]: I(x)=I0[1‐(1‐α)cos2(t)] with t=(π/2)(2x/βLs)
n. From the
linear frame analysis, the “best‐fit” frequency results were obtained with the concrete elastic
modulus value Ec=30.5 GPa. The function I(x) is not unique for a given frequency and ranges for
the damage parameter values were 0.80⩽n⩽1.50, 0.70⩾α⩾0.45 and 0.30⩽β⩽0.65.
Figure A.18: Representation of the possible damage length and section stiffness reduction for RC Beam 1.

This paper has been published under the following reference: Pešić, N., Živanović, S., Dennis, J. and Hargreaves, J. (2015) Experimental and finite element dynamic analysis of incrementally loaded reinforced concrete structures. Engineering Structures, Vol. 103, pp. 15‐27, doi:10.1016/j.engstruct.2015.07.037
28
AppendixB.ABAQUSanalysisinputlistingforRCBeam2

This paper has been published under the following reference: Pešić, N., Živanović, S., Dennis, J. and Hargreaves, J. (2015) Experimental and finite element dynamic analysis of incrementally loaded reinforced concrete structures. Engineering Structures, Vol. 103, pp. 15‐27, doi:10.1016/j.engstruct.2015.07.037
29

This paper has been published under the following reference: Pešić, N., Živanović, S., Dennis, J. and Hargreaves, J. (2015) Experimental and finite element dynamic analysis of incrementally loaded reinforced concrete structures. Engineering Structures, Vol. 103, pp. 15‐27, doi:10.1016/j.engstruct.2015.07.037
30
References
[1] Jerath S, Sibani MM. Dynamic modulus for reinforced concrete beams. J Struct Eng 1984;110(6):1405–10.
[2] Casas JR. An experimental study on the use of dynamic tests for surveillance of concrete structures. Mater Struct 1994;27(10):588–95.
[3] Shkolnik IE. Effect of nonlinear response of concrete on its elastic modulus and strength. Cement Concrete Compos 2005;27(7–8):747–57.
[4] Qixian L, Bungey JH. Using compressive wave ultrasonic transducers to measure the velocity of surface waves and hence determine dynamic modulus of elasticity for concrete. Constr Build Mater 1996;10(4):237–42.
[5] Popovics JS, Zemajtis J, Shkolnik I. A study of static and dynamic modulus of concrete. ACI‐CRC Final Report, American Concrete Institute; October 2008.
[6] Han S‐H, Kim J‐K. Effect of temperature and age on the relationship between dynamic and static elastic modulus of concrete. Concrete Cement Res 2004;34(7):1219–27.
[7] Lu X, Sun Q, Feng W, Tian J. Evaluation of dynamic modulus of elasticity of concrete using impact‐echo method. Constr Build Mater 2013;47:231–9.
[8] Musiał M. Static and dynamic stiffness of reinforced concrete beams. Arch Civil Mech Eng 2012;12(2):186–91.
[9] Euronorm 1992‐1‐1: 2004, Eurocode 2 – design of concrete structures. Part 1‐1: General rules and rules for buildings, Comité Européen de Normalisation (CEN), Brussels; 2004.
[10] Maeck J, Wahab MA, Peeters B, De Roeck G, De Visscher J, De Wilde WP, Ndambi J‐M, Vantomme J. Damage identification in reinforced concrete structures by dynamic stiffness determination. Eng Struct 2000;22(10): 1339–49.

This paper has been published under the following reference: Pešić, N., Živanović, S., Dennis, J. and Hargreaves, J. (2015) Experimental and finite element dynamic analysis of incrementally loaded reinforced concrete structures. Engineering Structures, Vol. 103, pp. 15‐27, doi:10.1016/j.engstruct.2015.07.037
31
[11] Neild SA, Williams MS, McFadden PD. Nonlinear vibration characteristics of damaged concrete beams. J Struct Eng 2003;129(2):, 260–268.
[12] Zhu X, Hao H. Damage detection of RC slabs using nonlinear vibration features. Int J Struct Stab Dynam 2009;9(4):687–709.
[13] Massenzio M, Jacquelin E, Ovigne PA. Natural frequency evaluation of a cracked RC beam with or without composite strengthening for a damage assessment. Mater Struct 2005;38(10):, 865–873.
[14] Wang Z, Man XC, Finch RD, Jansen BH. The dynamic behavior and vibration monitoring of reinforced concrete beams. J Testing Eval 1998; 26(5):405–19.
[15] Koh SJA, Maleej M, Quek ST. Damage quantification of flexurally loaded RC slab using frequency response data. Struct Health Monit 2004;3(4):293–311.
[16] Salawu OS. Detection of structural damage through changes in frequency: a review. Eng Struct 1997;19(9):718–23.
[17] Carden EP, Fanning P. Vibration based condition monitoring: a review. Struct Health Monit 2004;3(4):355–77.
[18] Pavic A, Reynolds P, Waldron P, Bennett K. Dynamic modelling of posttensioned concrete floors using finite element analysis. Fin Elem Anal Des 2001;37(4):305–23.
[19] Consuegra F, Irfanoglu A. Variation of small amplitude vibration dynamic properties with displacement in reinforced concrete structures. Exp Mech 2012;52(7):817–28.
[20] Sousa C, Calçada R, Neves AS. Numerical evaluation of the non‐linear behaviour of cracked RC members under variable‐amplitude cyclic loading. Mater Struct; 11 June 2014.
[21] Noguchi T, Tomosawa F, Nemati KM, Chiaia BM, Fantilli AP. A practical equation for elastic modulus of concrete. ACI Struct J 2009;105(5):690–6.
[22] ABAQUS v6.13‐2. Analysis users manual, Dassault Systèmes, Providence, RI, USA; 2013.
[23] Lee J, Fenves GL. Plastic‐damage model for cyclic loading of concrete structures. J Eng Mech 1998;124(8):892–900.