FinEst Bay Area Development The Tallinn Tunnel Project Tunnel...FinEst Bay Area Development ... •...
16
FinEst Bay Area Development The Tallinn Tunnel Project Financial indicators
Transcript of FinEst Bay Area Development The Tallinn Tunnel Project Tunnel...FinEst Bay Area Development ... •...

FinEst Bay Area DevelopmentThe Tallinn Tunnel Project
Financial indicators

Tallinn
EspooHelsinki
Helsinki Airport
Tallinn
EspooHelsinki
Helsinki-Tallinn Airport
125 M
10 M
200 M
50 M
Passenger traffic volumes
Current Assumptions 203070 M
20 M
3 M

Finest economic impact structureCORE CASE
Mobility
Data
Energy
Water
SUSTAINABILITY IMPACT
Urban & real-estate development
Social: Employment & growth
Tourism
Services
GLOBAL STATUS
Global Innovation Node
First Twin Capital
Strategic geopolitical positioning
Security policyEnvironmental impact
Urban innovationGlobal mobility
50+ years 20+ years 10+ years

Financial model based on World Bank methodology
• Project finance methodology is based on Rail Reform Toolkit provided by World Bank and PPIAF (2017)
• Additional calculations and application is provided by the Finest Bay Area Development Company
• Benchmark operators are • Getlink (Channel Tunnel) • Tallink (Baltic sea ferry operator) • VR (State Railway in Finland)

Assumptions for financial calculations• Total tunnel investment 15 017 M€ • Discount Interest rate 6% • Inflation rate 2% • Tunnel investment timespan 30 years • Tunnel life-cycle is 120 years, major
service interval 40 years • Passenger traffic and freight included
in investment calculations • 51 M annual trips (2016: 9M) • € 50 single (41% of passengers) • € 100 return (42% of passengers) • € 2 499 annual pass (17% of passengers) • 22 M tonnes freight (2016: total 8,4M)

Fare and tariff assumptions
Facts: pricing 11/2018*• Finnish train 2018
• Helsinki – Oulu 56€ • Helsinki – Tampere 18€ • Helsinki – Lahti 13€
• Finland - Estonia ferries 2018 • Tallink, return 50€ (2,5h) • Ecerö line, return 24€ (2h 15min)
• Finland – Estonia flight 2018 • 165 € (30min)
Helsinki - Tallinn pricing assumptions 2024*• Inflation assumption 2% p.a. will
result 13% price increase in all prices
• Reference prices • Tallink return 56,5€ • Finnair flight 186,5€
• Tunnel train will be 10 min faster than flight
• Pricing arbitrarily assumed between flight and ferry ticket prices • 100€ return ticket
*single adult

Passenger transit assumptions for 51M annual passengers
• Return 42% (21,42M passengers) • Leisure trips by Finnish and Estonian citizens • Intermittent commuting • Tourists • 365 days / 2 trips / 29 000 passengers
• Single 41% (20,91M passengers) • Tourists • Terminal change travel between Helsinki and Tallinn airports • 365 days / 1 trip / 57 000 passengers
• Annual pass 17% (8,67M passengers) • Commuting passengers • 200 days / 2 trips / 21 000 passengers
Reference (2017): City of Vaasa Population 67 000 Vaasa region population 113 000 Commuters 16 000 https://www.vaasa.fi/node/13531/
Assumed Helsinki Tallinn metropolitan area 2030: Region population 2,5M (FI 2M, EST 0,5M) Commuters 425 000
Assumed each station area 2030: Population 50 000 Commuters 12 000
Reference to growing traffic volumes for example Öresund bridge and tunnel and Eurasian tunnel https://www.oresundsbron.com/en/traffic-stats

Freight tariff assumptions
Assumptions
• In calculations average train freight cost for 1 tonne 9,64 EUR per 103km is used • Equivalent to 0,093 EUR/Ton-km
• One train* • Average 700 tons per trip => 15
trucks per train • 450 EUR tariff per truck per
direction => total 6750 EUR per direction
Trend• Tariffs increase over time by
inflation
*Truck model 1 (12 metres, max. 13 tons) Truck model 2 (18 metres, max. 44

Freight volume
Assumptions• 2016: 8.4 million tons per year total
transports • 4.2 million tons per year maritime
transports • 4.2 million tons per year transports
via tunnel • The potential for Rail Baltica would
be 3.9 million tons per year. • FBA calculations 8,4 M tons per year,
no maritime transports • Helsinki-Tallinn maritime cargo 2016
• 3,8 million tons
Volume trend• 2017: Finland – Estonia
• Sea freight: 3,5M tons • 2016-17 growth 11,4% *
• Trend • 2025 is the first year 6,8M tons • 2025-26: 13M tons • 2027-28: 17M tons • 2030-2048: 22M tons
*https://julkaisut.liikennevirasto.fi/pdf8/lti_2018-04_ulkomaan_meriliikennetilasto_2017_web.pdf
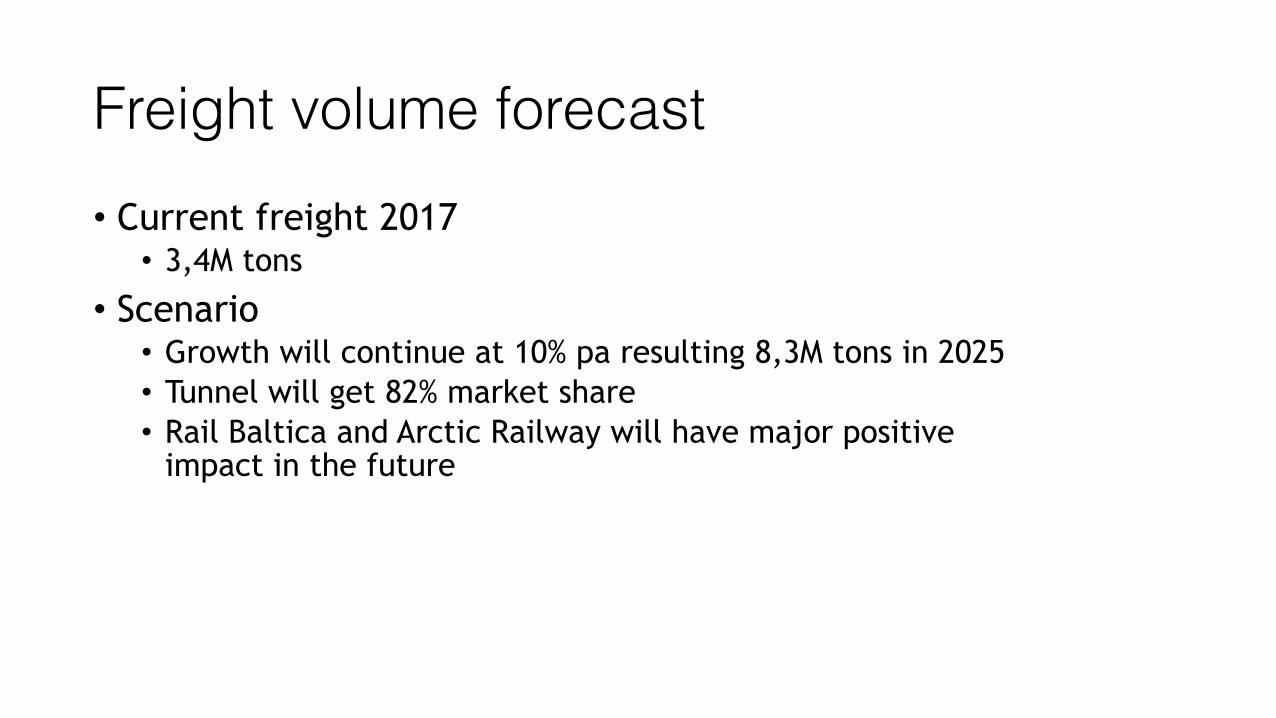
Freight volume forecast• Current freight 2017 • 3,4M tons
• Scenario • Growth will continue at 10% pa resulting 8,3M tons in 2025 • Tunnel will get 82% market share • Rail Baltica and Arctic Railway will have major positive
impact in the future

Tunnel case cash flow breakdown*
*Debt payments not included ** Interest rate assumptionc 5% + 2% margin
**

Cumulative cash flow, tunnel IRR 10,11%Payback period
17 years

Definitions• A tonne-kilometre, abbreviated as tkm, is a unit of measure of freight transport which
represents the transport of one tonne of goods (including packaging and tare weights of intermodal transport units) by a given transport mode (road, rail, air, sea, inland waterways, pipeline etc.) over a distance of one kilometre. Only the distance on the national territory of the reporting country is taken into account for national, international and transit transport. • Calculated as freight tariff (€/t) per kilometre
• Gross Tonne Kilometres (GTK) The sum of the total train weight multiplied by the distance travelled: frequently used to mean GTK trailing
• A passenger-kilometre, abbreviated as pkm, is the unit of measurement representing the transport of one passenger by a defined mode of transport (road, rail, air, sea, inland waterways etc.) over one kilometre. • Calculated as passager fare (€/trip) per kilometre
• The twenty-foot equivalent unit (often TEU or teu) is an inexact unit of cargo capacity often used to describe the capacity of container ships and container terminals.[1] It is based on the volume of a 20-foot-long (6.1 m) intermodal container, a standard-sized metal box which can be easily transferred between different modes of transportation, such as ships, trains and trucks.

Assumptions: general• All calculations are based on World Bank /
PPIAF Rail Renewal Toolkit assumptions • Other assumptions are based on World
Bank / PPIAF Rail Renewal Toolkit assumptions
• Calculations include • Train infrastucture • Passenger and freight traffic
• Calculations do not include • Urban infrastructure • Real estate • Other services
• All values increase by inflation (assumed 2%) • Euribor forecast: 5%
• Tunnel operation will start 24.12.2024 • Construction project will start Q4/2019 • Specific assumptions are based on Finest
Link project when applicable • Scenario: Fixed Link, FL • Exceptions are mentioned • Exceptions mainly in fares (eg. One-way fare
18e => 50e)

Rolling stock assumptions• Track length 103km • 100% electric rolling stock • Each train has 1 000 passenger seats • 6 trains per hour • 700 tons of cargo per train • Freight and units
• Max. 96 TEU per train • Max. 48 trucks per train • 600–700 tons per train • Average length of train 800–1 000 metres • Average cargo
• 8 tons per TEU (source Port of Helsinki) • 12–13 tons per truck per trailer (source Finnish Transport Agency).

How to follow the project?
Facebook: ”FinestBayArea Tunnel Project”
YouTube: FinestBayArea Channel & with Finestbayarea search word videos
Website: www.finestbayarea.online