Financial Status Report – SOAR · budget. Thus, the top ten agencies spent or committed at a rate...
212
District of Columbia Office of the Chief Financial Officer Office of Budget and Planning Financial Status Report – SOAR (Operating Expenditures) As of June 30, 2019
Transcript of Financial Status Report – SOAR · budget. Thus, the top ten agencies spent or committed at a rate...
District of Columbia Office of the Chief Financial Officer Office of Budget and Planning
Financial Status Report – SOAR (Operating Expenditures)
As of June 30, 2019
Government of the District of Columbia
Muriel Bowser Mayor
Rashad M. Young
City Administrator
Kevin Donahue Deputy City Administrator and
Deputy Mayor for Public Safety and Justice
Wayne Turnage Interim Deputy Mayor for Health and Human Services
Brian Kenner Deputy Mayor for Planning and Economic Development
Paul Kihn Acting Deputy Mayor for Education
Brenda Donald Interim Deputy Mayor for Greater Economic Opportunity
Jeffrey S. DeWitt Chief Financial Officer
Members of the Council
Phil Mendelson Chairman
Anita Bonds .................................. At Large Mary M. Cheh ................................ Ward 3 David Grosso ................................ At Large Brandon T. Todd ............................ Ward 4 Elissa Silverman ........................... At Large Kenyan McDuffie ........................... Ward 5 Robert C. White, Jr. .................... At Large Charles Allen .................................. Ward 6 Brianne K. Nadeau ........................ Ward 1 Vincent C. Gray .............................. Ward 7 Jack Evans ...................................... Ward 2 Trayon White, Sr. ........................... Ward 8

Office of Budget and Planning
Gordon McDonald Deputy Chief Financial Officer
James Spaulding Associate Deputy Chief Financial Officer
Lakeia Williams Executive Assistant
Financial Planning, Analysis, and Management Services Division
Leticia Stephenson Director, Financial Planning, Analysis, and Management Services
Samuel Terry Manager, Financial Planning and Analysis
Tayloria Stroman Budget Controller
Carlotta Osorio Senior Financial Systems Analyst
Duane Smith Senior Cost Analyst
Sue Taing Senior Reporting and Systems Analyst
i
FY 2019 Financial Status Report – SOAR Operating Expenditures – June 30, 2019
Table of Contents
(A) Letter from the CFO ............................................................... A - 1 Key Increases (Decreases) in Local Funds Budget Attachment A ................................................................... A - 3 (B) District Summary – by Percentage Spent Percent spent by month, 3-year average, District-wide, Gross Funds ................................................ B - 1 Percent spent by month, 3-year average, District-wide, Local Funds ................................................. B - 2 (C) District Summary - by Source of Funds Gross Funds by Appropriated Fund .........................................C - 1 Gross Funds by Appropriation Title .........................................C - 2 Appropriated Fund and Title Local Funds (0100) by Appropriation Title ..............................C - 3 Dedicated Taxes (0110) by Appropriation Title .......................C - 4 Federal Payments (0150) by Appropriation Title ....................C - 5 Federal Grant Funds (0200) by Appropriation Title ................C - 6 Federal Medicaid Payments (0250) by Appropriation Title ....C - 7 Private Grant Funds (0400) by Appropriation Title .................C - 8 Private Donations (0450) by Appropriation Title ...................C - 9 Special Purpose Revenue Funds (“O” Type) (0600) by Appropriation Title ......................................................... C - 10 Federal Payments - Fund Detail Federal Payments (1110) Internal Detail for Appropriated Fund 0150 ................................................ C - 11 Federal Payments (8110) Internal Detail for Appropriated Fund 0150 ................................................ C – 12 Federal Payments (8120) DC School Choice Agreement for Appropriated Fund 0150 ................................................ C – 13
(D) District Summary - by Source by Agency Appropriation Group Title – Local Funds (0100) .................... D - 1 Appropriation Group Title – Dedicated Taxes (0110) ............ D - 6 Appropriation Group Title – Federal Payments (0150) .... D - 7 Appropriation Group Title – Federal Grant Funds (0200) ...... D - 8 Appropriation Group Title – Federal Medicaid Payments (0250) ............................................................. D - 10 Appropriation Group Title – Private Grant Funds (0400) ..... D - 11 Appropriation Group Title – Private Donations (0450) ....... D - 12 Appropriation Group Title – Special Purpose Revenue Funds (“O” Type) (0600) ................................................. D - 13 (E) Agency Summary - by Source of Funds (Gross Funds) ...........E - 1 (F) Agency Summary - Federal Payments Federal Payments - Internal Detail (1110) ............................... F - 1 Federal Payments – Internal Detail (8110) ............................. F – 2 Federal Payments – DC School Choice Agreement (8120) .... F – 3 (G) District Summary – by Object Class Gross Funds – District-wide by Comptroller Source Group ................................................ G - 1 Budget Only Gross Funds (Budget Only) ..................................................... G - 3 Comptroller Source Group and Fund Local Funds (0100) – District-wide by Comptroller Source Group ................................................ G - 5 Dedicated Taxes (0110) – District-wide by Comptroller Source Group ............................................... G - 6 Federal Payments (0150) – District-wide by Comptroller Source Group ............................................... G – 7

ii
Federal Grant Funds (0200) – District-wide by Comptroller Source Group................................................ G - 8 Federal Medicaid Payments (0250) – District-wide by Comptroller Source Group............................................... G – 9 Private Grant Funds (0400) - District-wide by Comptroller Source Group.............................................. G - 10 Private Donations (0450) - District-wide by Comptroller Source Group.............................................. G - 11 Special Purpose Revenue Funds (“O” Type) (0600) – District-wide By Comptroller Source Group ................... G - 12 (H) Overtime Summaries Overtime Expenditures – All Funds ........................................ H - 1 Overtime Pay –MPD and FEMS............................................... H - 3 Overtime Pay –DCPS and DOC ................................................ H - 4 Overtime Expenditures – Local Funds (0100) 3-year average .................................................................. H - 5 (I) Top Ten Agencies – Local Funds .............................................. I - 1
(J) Governmental Direction and Support
Office of the Mayor (AA0)................................................................. J - 1 Council of the District of Columbia (AB0) ......................................... J - 2 Office of the District of Columbia Auditor (AC0) .............................. J - 3 Office of the Inspector General (AD0) .............................................. J - 4 Office of the City Administrator (AE0) .............................................. J - 5 Contract Appeals Board (AF0) .......................................................... J - 6 DC Board of Ethics and Government Accountability (AG0) .............. J - 7 Mayor’s Office of Legal Counsel (AH0) ............................................. J - 8 Office of the Senior Advisor (AI0) ..................................................... J - 9 Uniform Law Commission (AL0) ..................................................... J - 10 Department of General Services (AM0) ......................................... J - 11 Statehood Initiatives (AR0) ............................................................. J - 12 Office of Finance and Resource Management (AS0) ...................... J - 13 Office of the Chief Financial Officer (AT0) ...................................... J - 14 Office of the Secretary (BA0) .......................................................... J - 15 D.C. Department of Human Resources (BE0) ................................. J - 16
Office of the Attorney General for the District of Columbia (CB0) J - 17 Public Employee Relations Board (CG0) ......................................... J - 18 Office of Employee Appeals (CH0) .................................................. J - 19 Office of Campaign Finance (CJ0) ................................................... J - 20 Board of Elections (DL0) .................................................................. J - 21 Advisory Neighborhood Commissions (DX0) .................................. J - 22 Metropolitan Washington Council of Governments (EA0) ............. J - 23 Deputy Mayor for Greater Economic Opportunity (EM0) ............. J – 24 Section 103 Judgments – GDS (GS0) .............................................. J - 25 Office of Disability Rights (JR0) ....................................................... J - 26 Office of Contracting and Procurement (PO0) ............................... J - 27 Captive Insurance Agency (RJ0) ...................................................... J - 28 D.C. Office of Risk Management (RK0) ........................................... J - 29 Office of the Chief Technology Officer (TO0) ................................. J - 30
(K) Economic Development and Regulation
Office of Planning (BD0) ................................................................... K - 1 Office of Zoning (BJ0) ....................................................................... K - 2 Commission on the Arts and Humanities (BX0) ............................... K - 3 Department of Employment Services (CF0) .................................... K - 4 Office of Cable TV, Film, Music, and Entertainment (CI0) ............... K - 5 Office of the Tenant Advocate (CQ0) ............................................... K - 6 Department of Consumer and Regulatory Affairs (CR0) ................. K - 7 Real Property Tax Appeals Commission (DA0) ................................ K - 8 Department of Housing and Community Development (DB0) ........ K - 9 Office of the People’s Counsel (DJ0) .............................................. K - 10 Office of the Dep. Mayor for Planning and Economic Dev. (EB0) . K - 11 Department of Small and Local Business Development (EN0) ...... K - 12 Housing Production Trust Fund Subsidy (HP0) .............................. K - 13 Housing Authority Subsidy (HY0) ................................................... K – 14 Alcoholic Beverage Regulation Administration (LQ0) ................... K – 15 Department of Insurance, Securities, and Banking (SR0) .............. K - 16
(L) Public Safety and Justice
Homeland Security and Emergency Management Agency (BN0) .... L - 1

iii
Metropolitan Police Department (FA0) ............................................ L - 2 Fire and Emergency Medical Services Department (FB0) ................ L - 3 Police Officers’ and Fire Fighters’ Retirement System (FD0) ........... L - 4 Office of Police Complaints (FH0) ..................................................... L - 5 Corrections Information Council (FI0) .............................................. L - 6 Criminal Justice Coordinating Council (FJ0) ...................................... L - 7 D.C. National Guard (FK0) ................................................................. L - 8 Department of Corrections (FL0) ...................................................... L - 9 Office of Victim Services and Justice Grants (FO0) ......................... L - 10 Office of the Dep. Mayor for Public Safety and Justice (FQ0) ........ L - 11 Department of Forensic Sciences (FR0) .......................................... L - 12 Office of Administrative Hearings (FS0) ......................................... L - 13 Office of the Chief Medical Examiner (FX0) .................................... L - 14 D.C. Sentencing Commission (FZ0) ................................................. L - 15 Criminal Code Reform Commission (MA0) ..................................... L - 16 Neighborhood Safety and Engagement (NS0) ............................... L – 17 Section 103 Judgments – PSJ (PJ0) ................................................. L - 18 Office of Unified Communications (UC0) ....................................... L - 19
(M) Public Education
D.C. Public Library (CE0) ................................................................. M - 1 D.C. Public Schools (GA0) ................................................................ M - 2 D.C. Public Charter Schools (GC0) ................................................... M - 3 Office of the State Superintendent of Education (GD0) ................. M - 4 D.C. State Board of Education (GE0) ............................................... M - 5 University of the District of Columbia Subsidy Account (GG0) ...... M - 6 D.C. State Athletics Commission (GL0) ........................................... M - 7 Non-Public Tuition (GN0) ................................................................ M - 8 Special Education Transportation (GO0) ........................................ M - 9 Office of the Deputy Mayor for Education (GW0) ........................ M - 10 Teachers’ Retirement System (GX0) ............................................ M – 11 Section 103 Judgments – PES (PE0) .............................................. M - 12
(N) Human Support Services
Office on Asian and Pacific Islander Affairs (AP0) ........................... N - 1
Employees’ Compensation Fund (BG0) ........................................... N - 2 Unemployment Compensation Fund (BH0)..................................... N - 3 D.C. Office on Aging (BY0) ................................................................ N - 4 Office on Latino Affairs (BZ0) ........................................................... N - 5 Department of Parks and Recreation (HA0) .................................... N - 6 Department of Health (HC0) ............................................................ N - 7 Office of the Dep. Mayor for Health and Human Services (HG0) .... N - 8 Office of Human Rights (HM0) ........................................................ N – 9 Section 103 Judgments – HSS (HS0) .............................................. N - 10 Department of Health Care Finance (HT0) .................................... N - 11 Not-for-Profit Hospital Corp. Subsidy (HX0) .................................. N - 12 Department of Human Services (JA0) ............................................ N - 13 Department on Disability Services (JM0) ....................................... N - 14 Department of Youth Rehabilitation Services (JZ0) ....................... N - 15 Child and Family Services Agency (RL0) ......................................... N - 16 Department of Behavioral Health (RM0) ....................................... N - 17 Office of Veterans’ Affairs (VA0) .................................................... N - 18
(O) Public Works
District Department of Transportation (KA0) .................................. O - 1 Washington Metropolitan Area Transit Commission (KC0) ............ O - 2 Washington Metropolitan Area Transit Authority (KE0) ................. O - 3 Department of Energy and Environment (KG0)............................... O - 4 Department of Public Works (KT0) .................................................. O - 5 Department of Motor Vehicles (KV0) .............................................. O - 6 Department of For-Hire-Vehicles (TC0) ........................................... O - 7
(P) Financing and Others
Non-Departmental (DO0) ................................................................ P - 1 Repayment of Loans and Interest (DS0) .......................................... P - 2 Master Equipment Lease/Purchase Program (ELO) ........................ P - 3 Convention Center Transfer Dedicated Taxes (EZ0) ........................ P - 4 Pay-As-You-Go Capital Fund (PAO) .................................................. P - 5 District Retiree Health Contribution (RH0) ...................................... P - 6 Workforce Investments (UP0) ......................................................... P - 7 Debt Service - Issuance Costs (ZB0) ................................................. P - 8

iv
Commercial Paper Program (ZC0) .................................................... P - 9 Settlements and Judgments (ZH0).................................................. P - 10 John A. Wilson Building Fund (ZZ0) ................................................ P - 11

(A) Transmittal Letter - CFO
August 26, 2019
Financial Status Report - (Operating Expenditures) as of June 30, 2019 A - 1
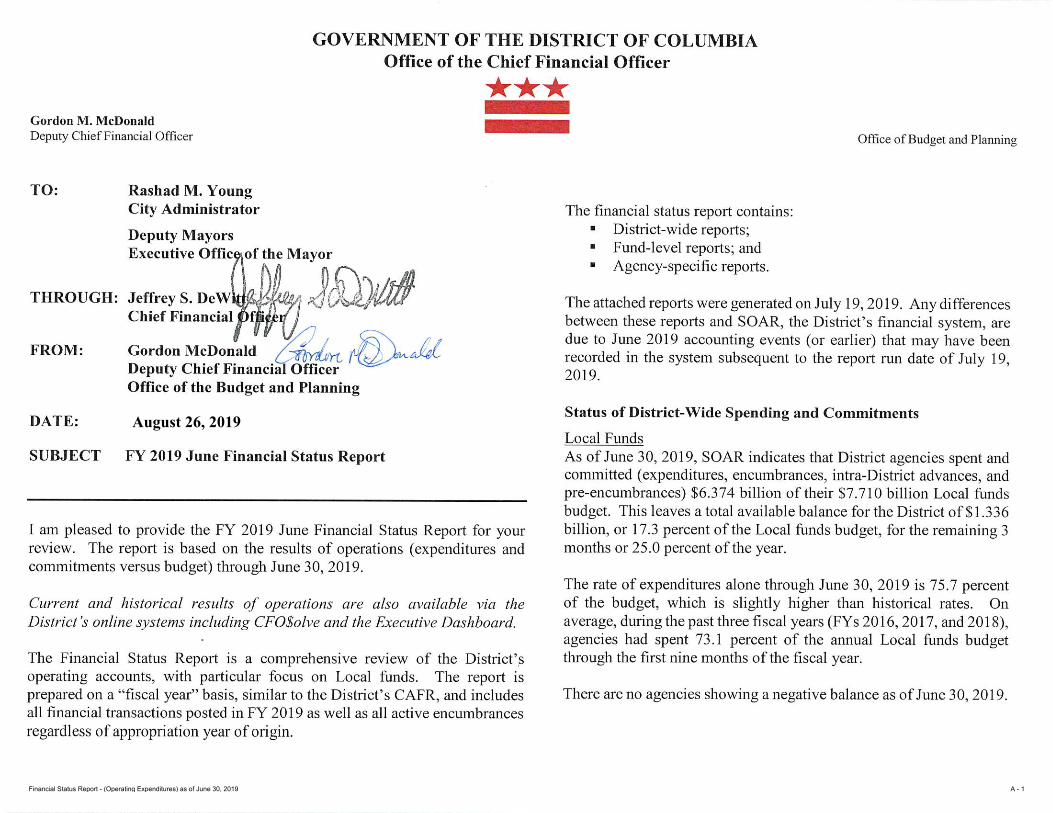
See Attachment A for a table summarizing key Local funds budget increases and decreases in FY 2019 through June 30, 2019.
Gross Funds Agencies spent or committed $9.763 billion of their $12.776 billion budget from all funding sources through the first nine months of FY 2019, leaving $3.013 billion, or 23.6 percent, for the remainder of the year. The rate of expenditures alone was 69.4 percent of budget, which is slightly lower than the three-year historical average of 71.5 percent for gross funds.
To date, District agencies have spent or committed 72.6 percent of their Dedicated Tax funds, 61.6 percent of their Special Purpose Revenue funds (“O”-type funds), 45.0 percent of their Federal Payments, 61.6 percent of their Federal Grants, 70.9 percent of their Federal Medicaid budgets, 38.4 percent of their Private Grant budgets, and 37.8 percent of their Private Donations budgets.
Top Ten Agencies The top ten agencies, ranked by their Local funds budgets, spent or committed $4.184 billion in the first nine months, or 85.1 percent of their $4.914 billion Local funds budgets. This leaves $0.730 billion, or 14.9 percent, for the remaining three months of the year. All District agencies as a whole spent or committed $6.374 billion, or 82.7 percent of the $7.710 billion Local funds budget. Thus, the top ten agencies spent or committed at a rate higher than all District agencies as a whole. The top ten agencies account for about 63.7 percent of the District’s Local funds budget.
If you have any questions, please contact Leticia Stephenson, Director of Financial Planning, Analysis, and Management Services, Office of Budget and Planning, at 202-727-1036.
cc: Honorable Muriel Bowser, Mayor of the District of Columbia Honorable Phil Mendelson, Chairman, Council of the District of
Columbia Honorable Kenyan R. McDuffie, Chairman, Committee on
Business and Economic Development, Council of the District of Columbia
Members of the Council of the District of Columbia Jennifer Budoff, Budget Director, Council of the District of
Columbia John Falcicchio, Chief of Staff, Executive Office of the Mayor Jennifer Reed, Director, Office of Budget and Performance
Management, Office of the City Administrator Angell Jacobs, Deputy Chief Financial Officer and Chief of Staff,
Office of the Chief Financial Officer Associate Chief Financial Officers Paul Lundquist, Executive Director, Office of Management and
Administration, Office of the Chief Financial Officer
Financial Status Report - (Operating Expenditures) as of January 31, 2019 A - 2

Attachment A Key Increases / (Decreases) in the FY 2019 Local Funds Budget through June 30, 2019
Advance into FY 2018 Contingency Reserve
GA0-DISTRICT OF COLUMBIA PUBLIC SCHOOLS -10,314,829 AM0-DEPARTMENT OF GENERAL SERVICES 17,900,000
GC0-DISTRICT OF COLUMBIA PUBLIC CHARTER SCHOOLS -309,144,724 BE0-D.C. DEPARTMENT OF HUMAN RESOURCES 238,504
Subtotal, Advance into FY 2018 -319,459,553 CQ0-OFFICE OF THE TENANT ADVOCATE 3,831,724
DB0-DEPARTMENT OF HOUSING AND COMMUNITY DEVELOPMENT 7,200,000
Local Funds Carry-Over DL0-BOARD OF ELECTIONS 290,000
AA0-DEPARTMENT OF GENERAL SERVICES 70,181 EB0-DEPUTY MAYOR FOR PLANNING AND ECONOMIC DEVELOPMENT 13,000,000
AR0-STATEHOOD INITIATIVE AGENCY 2,141 GD0-STATE SUPERINTENDENT OF EDUCATION (OSSE) 4,650,000
BD0-OFFICE OF PLANNING 54,149 GW0-DEPUTY MAYOR FOR EDUCATION 77,278
CE0-DC PUBLIC LIBRARY 2,741,456 HA0-DEPARTMENT OF PARKS AND RECREATION 1,749,813
CI0-OFFICE OF CABLE TV, FILM, MUSIC & ENTERTAINMENT 308,019 HX0-NOT-FOR-PROFIT HOSPITAL CORP. SUBSIDY 24,260,773
DB0-DEPARTMENT OF HOUSING AND COMMUNITY DEVELOPMENT 452,000 KE0-MASS TRANSIT SUBSIDIES 13,578,432
ENO-DEPARTMENT OF SMALL & LOCAL BUSINESS DEVELOPMT 862,395 KT0-DEPARTMENT OF PUBLIC WORKS 1,000,000
FO0-OFFICE OF JUSTICE GRANTS ADMINISTRATION 2,853,705 RJ0-MEDICAL LIABILITY CAPTIVE INSURANCE AGENCY 1,321,737
GC0-DISTRICT OF COLUMBIA PUBLIC CHARTER SCHOOLS 600,475 Subtotal, Contingency Reserve 89,098,261
GD0-STATE SUPERINTENDENT OF EDUCATION (OSSE) 20,530,542
HC0-DEPARTMENT OF HEALTH 1,932,307 Settlements and Judgments
HY0-HOUSING AUTHORITY SUBSIDY 8,491,224 GS0-SECTION 103 JUDGMENTS-GOVERNMENT DIRECTION AND SUPPORT 12,916,510
NS0-NEIGHBORHOOD SAFETY AND ENGAGEMENT 387,596 PJ0-SECTION 103 JUDGEMENTS-PUBLIC SAFETY AND JUSTICE 240,000
RM0-DEPARTMENT OF BEHAVIORAL HEALTH 689,610 Subtotal, Settlements and Judgments 13,156,510
UP0-WORKFORCE INVESTMENTS 18,380,256
Subtotal, Local Funds Carry-Over 58,356,055 SUMMARY:
Approved Budget 7,852,878,825
Reprogrammings from Capital Funds to Local Funds Advance into FY 2018 -319,459,553
AM0-DEPARTMENT OF GENERAL SERVICES 8,232,400 Local Funds Carry-Over 58,356,056
CE0-DC PUBLIC LIBRARY 383,131 Reprogrammings from Capital Funds to Local Funds 15,805,819
GA0-DISTRICT OF COLUMBIA PUBLIC SCHOOLS 4,756,824 Contingency Reserve 89,098,261
HA0-DEPARTMENT OF PARKS AND RECREATION 1,952,000 Settlements and Judgments 13,156,510
HT0-DEPARTMENT OF HEALTH CARE FINANCE 300,000 Other 18,221
TO0-OFFICE OF THE CHIEF TECHNOLOGY OFFICER 181,464 Revised Budget, June 30, 2019 7,709,854,138
Subtotal, Reprogrammings from Capital Funds to Local Funds 15,805,819
Note: Totals may not sum due to rounding
Financial Status Report - (Operating Expenditures) as of January 31, 2019 A - 3

(B) Comparative Analysis of Percentage Spent –
Expenditure Only

Government of the District of Columbia FY 2019 Financial Status Reports (as of June 30, 2019) % Monthly Time Elapsed: 75.0%Office of the Chief Financial Officer % Monthly Time Remaining: 25.0%SOURCE: CFOSolve / SOAR** UNAUDITED and UNADJUSTED **(Run Date: Jul 19, 2019)
Comparative Analysis of Percentage Spent (Expenditures Only)
General Fund : Gross FundsAccounting Period/Month 1 2 3 4 5 6 7 8 9 10 11 12 YE Total 3-yr Avg:2016 8.4% 6.8% 8.8% 7.1% 7.3% 7.0% 7.0% 8.2% 10.3% 8.6% 7.9% 12.5% 100.0%2017 9.6% 6.0% 9.5% 8.3% 5.6% 7.4% 7.7% 8.1% 10.1% 9.6% 5.5% 12.7% 100.0%2018 9.4% 4.9% 10.0% 8.0% 5.7% 8.6% 7.3% 6.0% 11.4% 9.8% 5.8% 13.2% 100.0%Monthly 9.1% 5.9% 9.4% 7.8% 6.2% 7.7% 7.3% 7.4% 10.6% 9.3% 6.4% 12.8%
Cumulative 9.1% 15.0% 24.5% 32.3% 38.5% 46.1% 53.5% 60.9% 71.5% 80.8% 87.2% 100.0%
2019Monthly 8.6% 4.5% 12.2% 5.2% 6.4% 7.5% 8.8% 5.9% 10.2%
YTD 8.6% 13.1% 25.3% 30.5% 37.0% 44.5% 53.3% 59.2% 69.4%*Percent is based on whole dollars and may not sum to cumulative totals due to rounding.
Comparison of FY2019 Monthly Spending to Prior Years
0.0%
2.0%
4.0%
6.0%
8.0%
10.0%
12.0%
14.0%
1 2 3 4 5 6 7 8 9 10 11 12
Prior yr AvgFY19
Fiscal Month
% o
f Exp
to A
nnua
l Exp
/Bud
get
Comparison of FY2019 Year-to-Date Spending to Prior Years
0.0%
20.0%
40.0%
60.0%
80.0%
100.0%
120.0%
1 2 3 4 5 6 7 8 9 10 11 12
Prior yr AvgFY19
Fiscal Month
% o
f YTD
Exp
to A
nnua
l Exp
/Bud
get
FY 2019 percentages are based on budget and may retroactively change due to budget revisions. Prior year percentages are based on actual annual expenditures. 3-year average consists of fiscal years 2016, 2017 and 2018.
Financial Status Report - (Operating Expenditures) as of June 30, 2019 B - 1

Government of the District of Columbia FY 2019 Financial Status Reports (as of June 30, 2019) % Monthly Time Elapsed: 75.0%Office of the Chief Financial Officer % Monthly Time Remaining: 25.0%SOURCE: CFOSolve / SOAR** UNAUDITED and UNADJUSTED **(Run Date: Jul 19, 2019)
Comparative Analysis of Percentage Spent (Expenditures Only)
General Fund : Local FundAccounting Period/Month 1 2 3 4 5 6 7 8 9 10 11 12 YE Total3-yr Avg:2016 10.2% 5.7% 10.9% 7.9% 5.7% 7.3% 6.9% 6.5% 11.6% 9.2% 5.8% 12.4% 100.0%2017 10.3% 5.7% 12.5% 7.5% 6.3% 6.6% 7.5% 6.4% 11.1% 9.3% 5.8% 11.0% 100.0%2018 10.2% 5.3% 11.0% 7.6% 6.2% 8.7% 6.0% 5.5% 12.5% 9.7% 5.2% 12.2% 100.0%Monthly 10.2% 5.6% 11.5% 7.7% 6.0% 7.5% 6.8% 6.1% 11.7% 9.4% 5.6% 11.9%
Cumulative 10.2% 15.8% 27.2% 34.9% 41.0% 48.5% 55.3% 61.4% 73.1% 82.5% 88.1% 100.0%
2019Monthly 9.6% 5.5% 14.1% 6.4% 6.4% 7.0% 9.3% 6.5% 11.1%
YTD 9.6% 15.1% 29.1% 35.5% 41.9% 48.9% 58.1% 64.6% 75.7%*Percent is based on whole dollars and may not sum to cumulative totals due to rounding.
Comparison of FY2019 Monthly Spending to Prior Years
0.0%
2.0%
4.0%
6.0%
8.0%
10.0%
12.0%
14.0%
16.0%
1 2 3 4 5 6 7 8 9 10 11 12
Prior yr AvgFY19
Fiscal Month
% o
f Exp
to A
nnua
l Exp
/Bud
get
Comparison of FY2019 Year-to-Date Spending to Prior Years
0.0%
20.0%
40.0%
60.0%
80.0%
100.0%
120.0%
1 2 3 4 5 6 7 8 9 10 11 12
Prior yr AvgFY19
Fiscal Month
% o
f YTD
Exp
to A
nnua
l Exp
/Bud
get
FY 2019 percentages are based on budget and may retroactively change due to budget revisions. Prior year percentages are based on actual annual expenditures. 3-year average consists of fiscal years 2016, 2017 and 2018.
Financial Status Report - (Operating Expenditures) as of June 30, 2019 B - 2
(C1) District Summary – Gross Funds by Appropriated Fund

Government of the District of Columbia FY 2019 Financial Status Reports (as of June 30, 2019) % Monthly Time Elapsed: 75.0%Office of the Chief Financial Officer % Monthly Time Remaining: 25.0%SOURCE: CFOSolve / SOAR** UNAUDITED and UNADJUSTED **(Run Date: Jul 19, 2019)
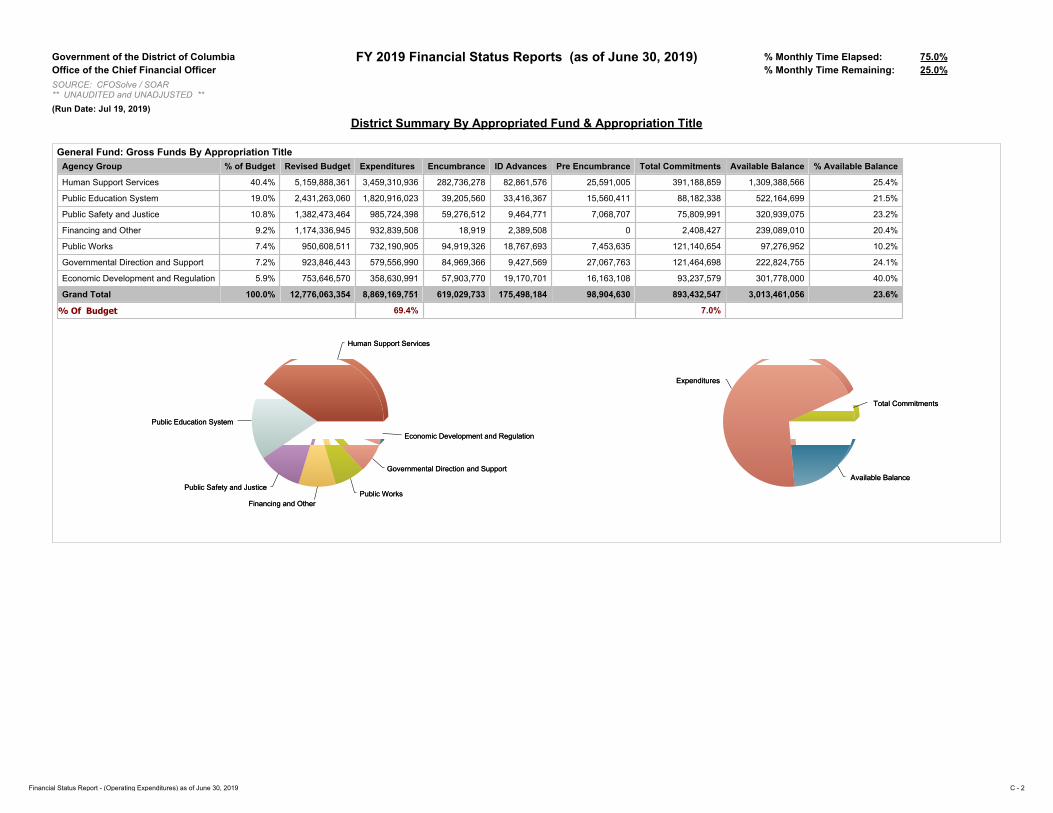
District Summary By Appropriated Fund & Appropriation Title
General Fund: Gross Funds By Appropriated FundAppropriated Fund Fund % of Budget Revised Budget Expenditures Encumbrance ID Advances Pre Encumbrance Total Commitments Available Balance % Available Balance
Local Fund 0100 60.3% 7,709,854,138 5,836,986,167 356,321,441 116,872,640 63,974,291 537,168,372 1,335,699,599 17.3%
Dedicated Taxes 0110 4.4% 568,139,767 402,629,633 7,688,920 1,817,353 141,984 9,648,257 155,861,877 27.4%
Federal Payments 0150 0.9% 116,829,456 48,501,703 4,003,606 22,210 50,000 4,075,816 64,251,937 55.0%
Federal Grant Fund 0200 9.0% 1,150,627,759 526,537,032 126,163,118 32,049,937 23,486,373 181,699,428 442,391,300 38.4%
Federal Medicaid Payments 0250 19.2% 2,450,259,161 1,705,954,911 26,545,064 4,431,882 1,071,191 32,048,137 712,256,113 29.1%
Private Grant Fund 0400 0.1% 10,431,605 3,084,991 718,242 64,463 138,604 921,309 6,425,305 61.6%
Private Donations 0450 0.0% 3,643,395 756,897 455,503 133,789 29,766 619,058 2,267,439 62.2%
Special Purpose Revenue Funds ('O'Type) 0600 6.0% 766,278,073 344,718,416 97,133,838 20,105,911 10,012,421 127,252,170 294,307,487 38.4%
Grand Total 100.0% 12,776,063,354 8,869,169,751 619,029,733 175,498,184 98,904,630 893,432,547 3,013,461,056 23.6%
% Of Budget 69.4% 7.0%
Local Fund
Dedicated TaxesFederal Payments
Federal Grant FundFederal Medicaid Payments
Private Grant FundPrivate DonationsSpecial Purpose Revenue Funds ...
Local Fund
Dedicated TaxesFederal Payments
Federal Grant FundFederal Medicaid Payments
Private Grant FundPrivate DonationsSpecial Purpose Revenue Funds ...
Available Balance
Expenditures
Total Commitments
Available Balance
Expenditures
Total Commitments
Financial Status Report - (Operating Expenditures) as of June 30, 2019 C - 1

(C2) District Summary – Gross Funds by Appropriated Title
Government of the District of Columbia FY 2019 Financial Status Reports (as of June 30, 2019) % Monthly Time Elapsed: 75.0%Office of the Chief Financial Officer % Monthly Time Remaining: 25.0%SOURCE: CFOSolve / SOAR** UNAUDITED and UNADJUSTED **(Run Date: Jul 19, 2019)
District Summary By Appropriated Fund & Appropriation Title
General Fund: Gross Funds By Appropriation TitleAgency Group % of Budget Revised Budget Expenditures Encumbrance ID Advances Pre Encumbrance Total Commitments Available Balance % Available Balance
Human Support Services 40.4% 5,159,888,361 3,459,310,936 282,736,278 82,861,576 25,591,005 391,188,859 1,309,388,566 25.4%
Public Education System 19.0% 2,431,263,060 1,820,916,023 39,205,560 33,416,367 15,560,411 88,182,338 522,164,699 21.5%
Public Safety and Justice 10.8% 1,382,473,464 985,724,398 59,276,512 9,464,771 7,068,707 75,809,991 320,939,075 23.2%
Financing and Other 9.2% 1,174,336,945 932,839,508 18,919 2,389,508 0 2,408,427 239,089,010 20.4%
Public Works 7.4% 950,608,511 732,190,905 94,919,326 18,767,693 7,453,635 121,140,654 97,276,952 10.2%
Governmental Direction and Support 7.2% 923,846,443 579,556,990 84,969,366 9,427,569 27,067,763 121,464,698 222,824,755 24.1%
Economic Development and Regulation 5.9% 753,646,570 358,630,991 57,903,770 19,170,701 16,163,108 93,237,579 301,778,000 40.0%
Grand Total 100.0% 12,776,063,354 8,869,169,751 619,029,733 175,498,184 98,904,630 893,432,547 3,013,461,056 23.6%
% Of Budget 69.4% 7.0%
Economic Development and Regulation
Governmental Direction and Support
Public WorksFinancing and Other
Public Safety and Justice
Public Education System
Human Support Services
Economic Development and Regulation
Governmental Direction and Support
Public WorksFinancing and Other
Public Safety and Justice
Public Education System
Human Support Services
Available Balance
Expenditures
Total Commitments
Available Balance
Expenditures
Total Commitments
Financial Status Report - (Operating Expenditures) as of June 30, 2019 C - 2

(C3) District Summary – by Appropriated Fund & Title

Government of the District of Columbia FY 2019 Financial Status Reports (as of June 30, 2019) % Monthly Time Elapsed: 75.0%Office of the Chief Financial Officer % Monthly Time Remaining: 25.0%SOURCE: CFOSolve / SOAR** UNAUDITED and UNADJUSTED **(Run Date: Jul 19, 2019)
Appropriated Fund By Appropriation Title
General Fund: Local Fund By Appropriation Title
Agency Group % of Budget Revised Budget Expenditures Encumbrance ID Advances Pre Encumbrance Total Commitments Available Balance % Available Balance
Governmental Direction and Support 10.4% 799,437,956 532,331,180 66,302,921 8,810,936 24,447,391 99,561,248 167,545,528 21.0%
Economic Development and Regulation 4.8% 370,485,457 177,157,764 19,294,868 5,961,817 10,055,328 35,312,012 158,015,681 42.7%
Public Safety and Justice 15.5% 1,191,432,023 901,367,987 45,964,114 7,777,877 2,586,739 56,328,730 233,735,306 19.6%
Public Education System 26.0% 2,001,493,289 1,641,090,174 30,653,545 31,728,100 12,236,785 74,618,430 285,784,685 14.3%
Human Support Services 26.6% 2,051,122,627 1,467,566,868 157,050,690 53,063,815 9,587,172 219,701,677 363,854,082 17.7%
Public Works 5.7% 438,040,390 333,128,037 37,036,383 7,140,587 5,060,878 49,237,847 55,674,506 12.7%
Financing and Other 11.1% 857,842,396 784,344,158 18,919 2,389,508 0 2,408,427 71,089,811 8.3%
Grand Total 100.0% 7,709,854,138 5,836,986,167 356,321,441 116,872,640 63,974,291 537,168,372 1,335,699,599 17.3%
% Of Budget 75.7% 7.0%
Economic Development and Regulation
Public Works
Governmental Direction and Support
Financing and Other
Public Safety and Justice
Public Education SystemHuman Support Services
Economic Development and Regulation
Public Works
Governmental Direction and Support
Financing and Other
Public Safety and Justice
Public Education SystemHuman Support Services
Available Balance
ExpendituresTotal Commitments
Available Balance
ExpendituresTotal Commitments
Financial Status Report - (Operating Expenditures) as of June 30, 2019 C - 3

Government of the District of Columbia FY 2019 Financial Status Reports (as of June 30, 2019) % Monthly Time Elapsed: 75.0%Office of the Chief Financial Officer % Monthly Time Remaining: 25.0%SOURCE: CFOSolve / SOAR** UNAUDITED and UNADJUSTED **(Run Date: Jul 19, 2019)
Appropriated Fund By Appropriation Title
General Fund: Dedicated Taxes By Appropriation Title
Agency Group % of Budget Revised Budget Expenditures Encumbrance ID Advances Pre Encumbrance Total Commitments Available Balance % Available Balance
Governmental Direction and Support 0.2% 1,350,000 36,522 0 21,679 0 21,679 1,291,799 95.7%
Economic Development and Regulation 5.2% 29,430,233 18,113,349 6,942,451 1,752,184 141,984 8,836,619 2,480,264 8.4%
Public Education System 1.1% 6,376,619 4,057,956 250,785 360 0 251,145 2,067,517 32.4%
Human Support Services 14.7% 83,686,775 3,396,812 495,684 43,130 0 538,814 79,751,149 95.3%
Public Works 45.5% 258,488,745 258,488,745 0 0 0 0 0 0.0%
Financing and Other 33.2% 188,807,395 118,536,248 0 0 0 0 70,271,147 37.2%
Grand Total 100.0% 568,139,767 402,629,633 7,688,920 1,817,353 141,984 9,648,257 155,861,877 27.4%
% Of Budget 70.9% 1.7%
Governmental Direction and SupportPublic Education System
Economic Development and Regulation
Human Support ServicesFinancing and Other
Public Works
Governmental Direction and SupportPublic Education System
Economic Development and Regulation
Human Support ServicesFinancing and Other
Public Works
Available Balance
Expenditures
Total Commitments
Available Balance
Expenditures
Total Commitments
Financial Status Report - (Operating Expenditures) as of June 30, 2019 C - 4

Government of the District of Columbia FY 2019 Financial Status Reports (as of June 30, 2019) % Monthly Time Elapsed: 75.0%Office of the Chief Financial Officer % Monthly Time Remaining: 25.0%SOURCE: CFOSolve / SOAR** UNAUDITED and UNADJUSTED **(Run Date: Jul 19, 2019)
Appropriated Fund By Appropriation Title
General Fund: Federal Payments By Appropriation Title
Agency Group % of Budget Revised Budget Expenditures Encumbrance ID Advances Pre Encumbrance Total Commitments Available Balance % Available Balance
Public Safety and Justice 3.4% 4,016,161 2,294,931 249,709 21,635 0 271,344 1,449,885 36.1%
Public Education System 80.9% 94,482,613 37,499,984 193,591 575 20,000 214,166 56,768,464 60.1%
Human Support Services 2.6% 3,000,000 3,845,244 3,540,166 0 30,000 3,570,166 (4,415,410) (147.2%)
Public Works 1.1% 1,304,390 427,664 20,141 0 0 20,141 856,586 65.7%
Financing and Other 12.0% 14,026,292 4,433,880 0 0 0 0 9,592,412 68.4%
Grand Total 100.0% 116,829,456 48,501,703 4,003,606 22,210 50,000 4,075,816 64,251,937 55.0%
% Of Budget 41.5% 3.5%
Public Works
Human Support Services
Public Safety and Justice
Financing and Other
Public Education System
Public Works
Human Support Services
Public Safety and Justice
Financing and Other
Public Education System
Available Balance
Expenditures
Total Commitments
Available Balance
Expenditures
Total Commitments
Financial Status Report - (Operating Expenditures) as of June 30, 2019 C - 5

Government of the District of Columbia FY 2019 Financial Status Reports (as of June 30, 2019) % Monthly Time Elapsed: 75.0%Office of the Chief Financial Officer % Monthly Time Remaining: 25.0%SOURCE: CFOSolve / SOAR** UNAUDITED and UNADJUSTED **(Run Date: Jul 19, 2019)
Appropriated Fund By Appropriation Title
General Fund: Federal Grant Fund By Appropriation Title
Agency Group % of Budget Revised Budget Expenditures Encumbrance ID Advances Pre Encumbrance Total Commitments Available Balance % Available Balance
Governmental Direction and Support 3.1% 35,268,618 15,170,909 4,239,198 228,645 388,331 4,856,175 15,241,534 43.2%
Economic Development and Regulation 9.2% 105,334,363 45,209,754 16,931,475 2,832,888 4,125,802 23,890,164 36,234,445 34.4%
Public Safety and Justice 11.5% 132,171,390 49,661,545 7,643,593 675,635 4,217,554 12,536,782 69,973,063 52.9%
Public Education System 25.5% 293,073,337 119,713,924 4,644,500 1,161,353 2,106,850 7,912,702 165,446,711 56.5%
Human Support Services 45.5% 523,506,527 252,646,074 89,278,977 24,510,654 12,579,519 126,369,150 144,491,304 27.6%
Public Works 3.8% 43,748,812 26,610,114 3,425,375 2,640,763 68,317 6,134,455 11,004,243 25.2%
Financing and Other 1.5% 17,524,712 17,524,712 0 0 0 0 0 0.0%
Grand Total 100.0% 1,150,627,759 526,537,032 126,163,118 32,049,937 23,486,373 181,699,428 442,391,300 38.4%
% Of Budget 45.8% 15.8%
Financing and OtherGovernmental Direction and Support
Public Works
Economic Development and Regulation
Public Safety and Justice
Public Education System
Human Support Services
Financing and OtherGovernmental Direction and Support
Public Works
Economic Development and Regulation
Public Safety and Justice
Public Education System
Human Support Services
Available Balance
Expenditures
Total Commitments
Available Balance
Expenditures
Total Commitments
Financial Status Report - (Operating Expenditures) as of June 30, 2019 C - 6
Government of the District of Columbia FY 2019 Financial Status Reports (as of June 30, 2019) % Monthly Time Elapsed: 75.0%Office of the Chief Financial Officer % Monthly Time Remaining: 25.0%SOURCE: CFOSolve / SOAR** UNAUDITED and UNADJUSTED **(Run Date: Jul 19, 2019)
Appropriated Fund By Appropriation Title
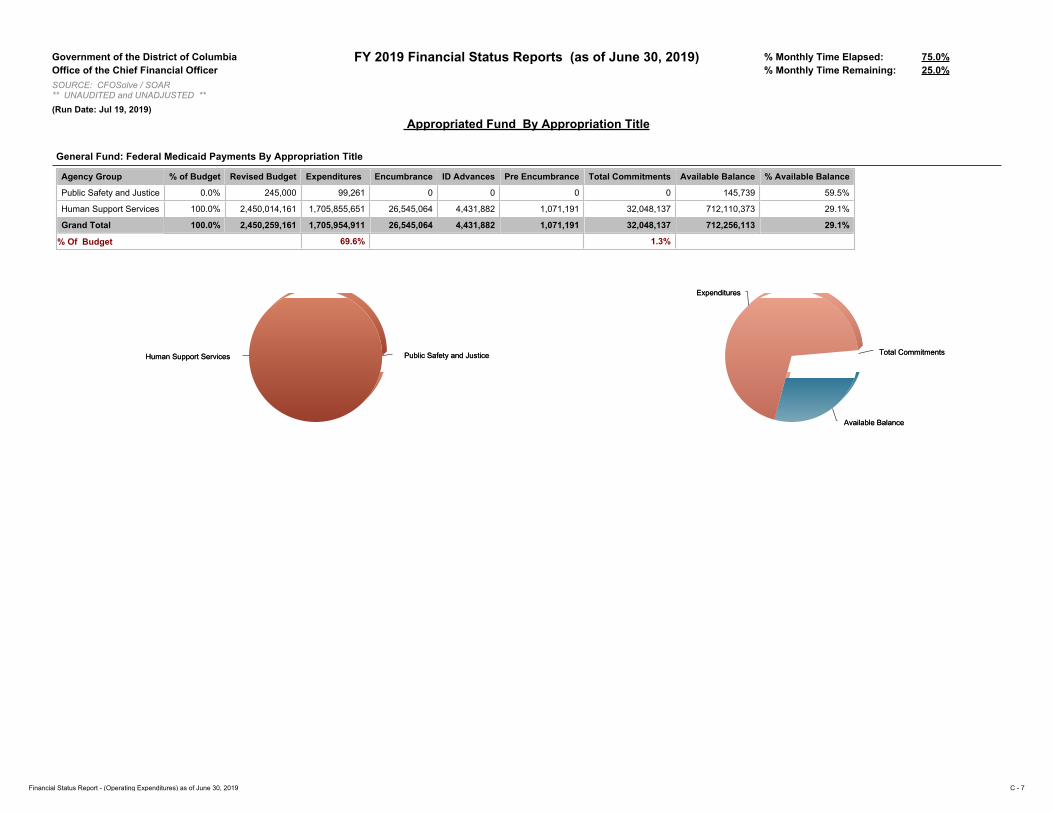
General Fund: Federal Medicaid Payments By Appropriation Title
Agency Group % of Budget Revised Budget Expenditures Encumbrance ID Advances Pre Encumbrance Total Commitments Available Balance % Available Balance
Public Safety and Justice 0.0% 245,000 99,261 0 0 0 0 145,739 59.5%
Human Support Services 100.0% 2,450,014,161 1,705,855,651 26,545,064 4,431,882 1,071,191 32,048,137 712,110,373 29.1%
Grand Total 100.0% 2,450,259,161 1,705,954,911 26,545,064 4,431,882 1,071,191 32,048,137 712,256,113 29.1%
% Of Budget 69.6% 1.3%
Public Safety and JusticeHuman Support Services Public Safety and JusticeHuman Support Services
Available Balance
Expenditures
Total Commitments
Available Balance
Expenditures
Total Commitments
Financial Status Report - (Operating Expenditures) as of June 30, 2019 C - 7
Government of the District of Columbia FY 2019 Financial Status Reports (as of June 30, 2019) % Monthly Time Elapsed: 75.0%Office of the Chief Financial Officer % Monthly Time Remaining: 25.0%SOURCE: CFOSolve / SOAR** UNAUDITED and UNADJUSTED **(Run Date: Jul 19, 2019)
Appropriated Fund By Appropriation Title
General Fund: Private Grant Fund By Appropriation Title
Agency Group % of Budget Revised Budget Expenditures Encumbrance ID Advances Pre Encumbrance Total Commitments Available Balance % Available Balance
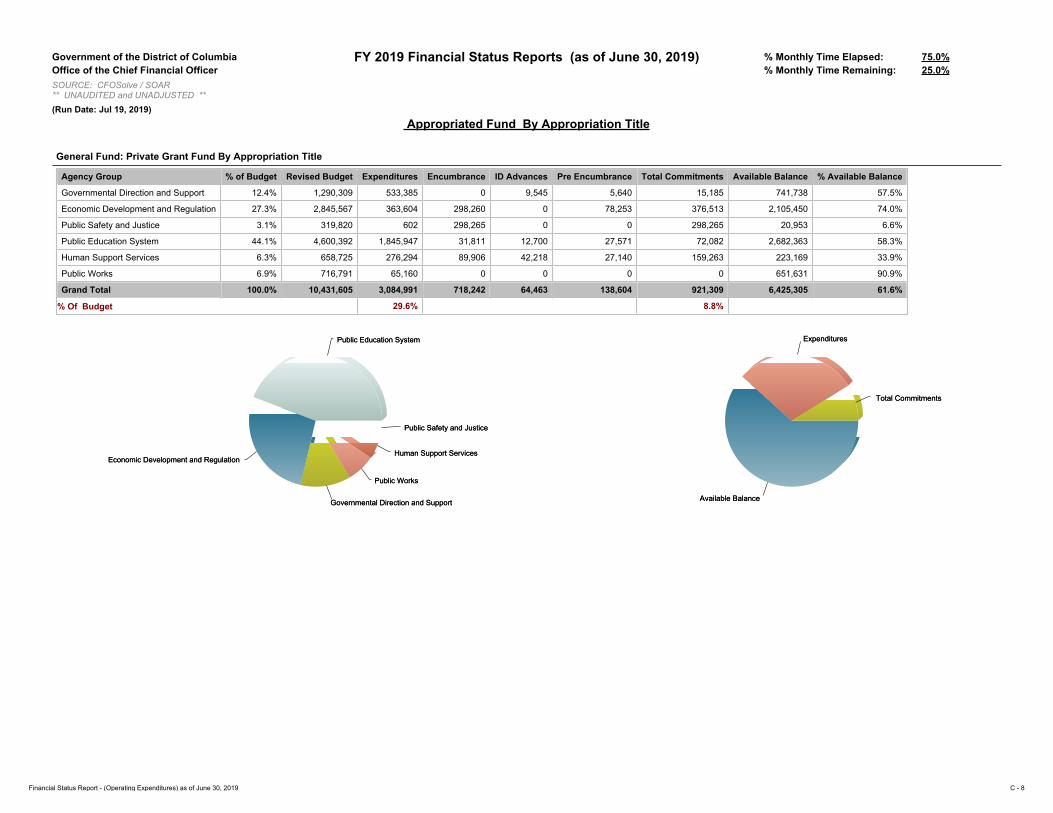
Governmental Direction and Support 12.4% 1,290,309 533,385 0 9,545 5,640 15,185 741,738 57.5%
Economic Development and Regulation 27.3% 2,845,567 363,604 298,260 0 78,253 376,513 2,105,450 74.0%
Public Safety and Justice 3.1% 319,820 602 298,265 0 0 298,265 20,953 6.6%
Public Education System 44.1% 4,600,392 1,845,947 31,811 12,700 27,571 72,082 2,682,363 58.3%
Human Support Services 6.3% 658,725 276,294 89,906 42,218 27,140 159,263 223,169 33.9%
Public Works 6.9% 716,791 65,160 0 0 0 0 651,631 90.9%
Grand Total 100.0% 10,431,605 3,084,991 718,242 64,463 138,604 921,309 6,425,305 61.6%
% Of Budget 29.6% 8.8%
Public Safety and Justice
Human Support Services
Public Works
Governmental Direction and Support
Economic Development and Regulation
Public Education System
Public Safety and Justice
Human Support Services
Public Works
Governmental Direction and Support
Economic Development and Regulation
Public Education System
Available Balance
Expenditures
Total Commitments
Available Balance
Expenditures
Total Commitments
Financial Status Report - (Operating Expenditures) as of June 30, 2019 C - 8

Government of the District of Columbia FY 2019 Financial Status Reports (as of June 30, 2019) % Monthly Time Elapsed: 75.0%Office of the Chief Financial Officer % Monthly Time Remaining: 25.0%SOURCE: CFOSolve / SOAR** UNAUDITED and UNADJUSTED **(Run Date: Jul 19, 2019)
Appropriated Fund By Appropriation Title
General Fund: Private Donations By Appropriation Title
Agency Group % of Budget Revised Budget Expenditures Encumbrance ID Advances Pre Encumbrance Total Commitments Available Balance % Available Balance
Governmental Direction and Support 70.1% 2,553,981 580,190 420,950 0 0 420,950 1,552,841 60.8%
Economic Development and Regulation 1.2% 44,500 7,392 7,528 0 0 7,528 29,580 66.5%
Public Safety and Justice 5.9% 214,087 69,679 0 0 0 0 144,409 67.5%
Public Education System 12.4% 450,086 42,408 13,965 25,122 9,566 48,653 359,025 79.8%
Human Support Services 10.5% 380,740 57,229 13,060 108,667 20,200 141,927 181,584 47.7%
Grand Total 100.0% 3,643,395 756,897 455,503 133,789 29,766 619,058 2,267,439 62.2%
% Of Budget 20.8% 17.0%
Economic Development and Regulation
Public Safety and Justice
Human Support Services
Public Education System
Governmental Direction and Support
Economic Development and Regulation
Public Safety and Justice
Human Support Services
Public Education System
Governmental Direction and Support
Available Balance
Expenditures
Total Commitments
Available Balance
Expenditures
Total Commitments
Financial Status Report - (Operating Expenditures) as of June 30, 2019 C - 9

Government of the District of Columbia FY 2019 Financial Status Reports (as of June 30, 2019) % Monthly Time Elapsed: 75.0%Office of the Chief Financial Officer % Monthly Time Remaining: 25.0%SOURCE: CFOSolve / SOAR** UNAUDITED and UNADJUSTED **(Run Date: Jul 19, 2019)
Appropriated Fund By Appropriation Title
General Fund: Special Purpose Revenue Funds ('O'Type) By Appropriation Title
Agency Group % of Budget Revised Budget Expenditures Encumbrance ID Advances Pre Encumbrance Total Commitments Available Balance % Available Balance
Governmental Direction and Support 11.0% 83,945,579 30,904,804 14,006,297 356,764 2,226,401 16,589,461 36,451,314 43.4%
Economic Development and Regulation 32.0% 245,506,449 117,779,128 14,429,188 8,623,812 1,761,742 24,814,742 102,912,580 41.9%
Public Safety and Justice 7.1% 54,074,984 32,230,394 5,120,831 989,624 264,414 6,374,870 15,469,720 28.6%
Public Education System 4.0% 30,786,724 16,665,630 3,417,364 488,156 1,159,640 5,065,160 9,055,934 29.4%
Human Support Services 6.2% 47,518,805 25,666,766 5,722,731 661,211 2,275,784 8,659,726 13,192,314 27.8%
Public Works 27.2% 208,309,382 113,471,184 54,437,428 8,986,344 2,324,440 65,748,212 29,089,986 14.0%
Financing and Other 12.5% 96,136,150 8,000,511 0 0 0 0 88,135,639 91.7%
Grand Total 100.0% 766,278,073 344,718,416 97,133,838 20,105,911 10,012,421 127,252,170 294,307,487 38.4%
% Of Budget 45.0% 16.6%
Public Education System
Human Support Services
Public Safety and Justice
Governmental Direction and Support
Financing and Other
Public Works
Economic Development and Regulation
Public Education System
Human Support Services
Public Safety and Justice
Governmental Direction and Support
Financing and Other
Public Works
Economic Development and Regulation
Available Balance
ExpendituresTotal Commitments
Available Balance
ExpendituresTotal Commitments
Financial Status Report - (Operating Expenditures) as of June 30, 2019 C - 10

(C4) Federal Payments – by Fund Detail

Government of the District of Columbia FY 2019 Financial Status Reports (as of June 30, 2019) % Monthly Time Elapsed: 75.0%Office of the Chief Financial Officer % Monthly Time Remaining: 25.0%SOURCE: CFOSolve / SOAR** UNAUDITED and UNADJUSTED **(Run Date: Jul 19, 2019)
Federal Payments By Fund Detail
General Fund: Federal Payments -1110 - Federal Payments - Internal for Appropriated Fund 0150
Agency Group % of Budget Revised Budget Expenditures Encumbrance ID Advances Pre Encumbrance Total Commitments Available Balance % Available Balance
Public Education System N/A 0 0 (57) 0 0 (57) 57 N/A
Grand Total 0 0 (57) 0 0 (57) 57 N/A
% Of Budget N/A N/A
Available Balance
Total Commitments
Available Balance
Total Commitments
Financial Status Report - (Operating Expenditures) as of June 30, 2019 C - 11
Government of the District of Columbia FY 2019 Financial Status Reports (as of June 30, 2019) % Monthly Time Elapsed: 75.0%Office of the Chief Financial Officer % Monthly Time Remaining: 25.0%SOURCE: CFOSolve / SOAR** UNAUDITED and UNADJUSTED **(Run Date: Jul 19, 2019)
Federal Payments By Fund Detail
General Fund: Federal Payments -8110 - Federal Payments - Internal for Appropriated Fund 0150
Agency Group % of Budget Revised Budget Expenditures Encumbrance ID Advances Pre Encumbrance Total Commitments Available Balance % Available Balance
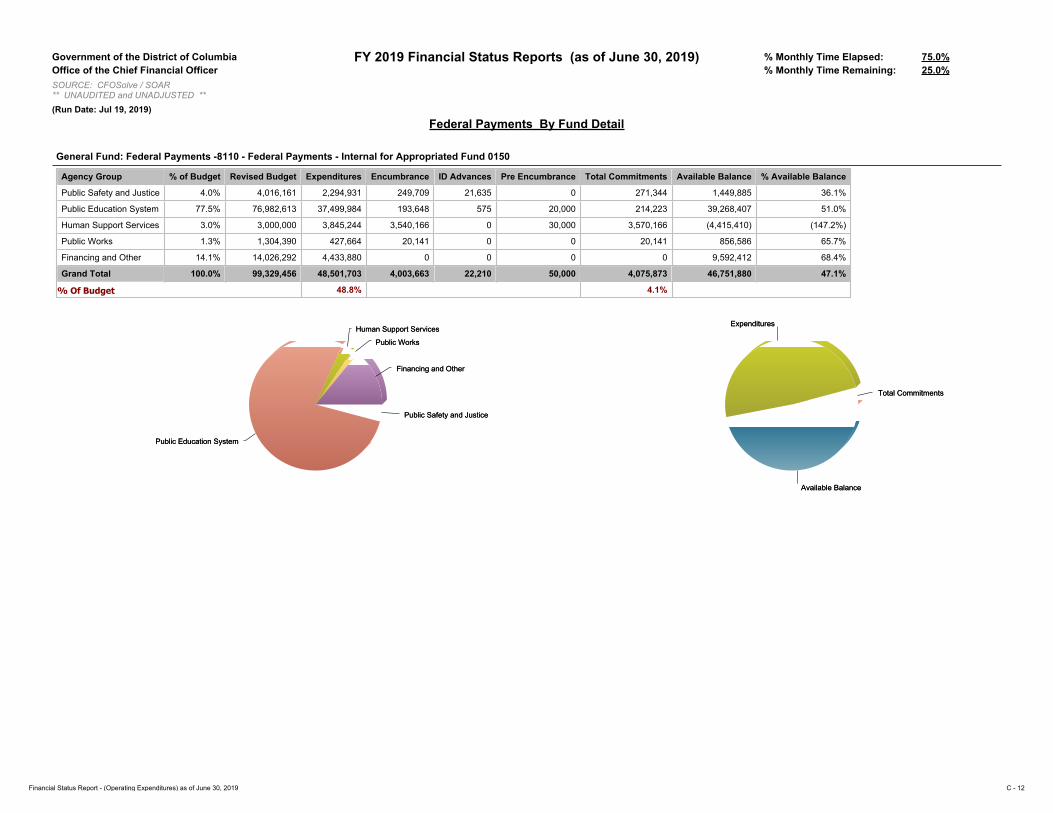
Public Safety and Justice 4.0% 4,016,161 2,294,931 249,709 21,635 0 271,344 1,449,885 36.1%
Public Education System 77.5% 76,982,613 37,499,984 193,648 575 20,000 214,223 39,268,407 51.0%
Human Support Services 3.0% 3,000,000 3,845,244 3,540,166 0 30,000 3,570,166 (4,415,410) (147.2%)
Public Works 1.3% 1,304,390 427,664 20,141 0 0 20,141 856,586 65.7%
Financing and Other 14.1% 14,026,292 4,433,880 0 0 0 0 9,592,412 68.4%
Grand Total 100.0% 99,329,456 48,501,703 4,003,663 22,210 50,000 4,075,873 46,751,880 47.1%
% Of Budget 48.8% 4.1%
Public Safety and Justice
Public Education System
Human Support Services
Public Works
Financing and Other
Public Safety and Justice
Public Education System
Human Support Services
Public Works
Financing and Other
Available Balance
Expenditures
Total Commitments
Available Balance
Expenditures
Total Commitments
Financial Status Report - (Operating Expenditures) as of June 30, 2019 C - 12

Government of the District of Columbia FY 2019 Financial Status Reports (as of June 30, 2019) % Monthly Time Elapsed: 75.0%Office of the Chief Financial Officer % Monthly Time Remaining: 25.0%SOURCE: CFOSolve / SOAR** UNAUDITED and UNADJUSTED **(Run Date: Jul 19, 2019)
Federal Payments By Fund Detail
General Fund: Federal Payments -8120 - Fed Payments- Dc School Choice Agreement for Appropriated Fund 0150
Agency Group % of Budget Revised Budget Expenditures Encumbrance ID Advances Pre Encumbrance Total Commitments Available Balance % Available Balance
Public Education System 100.0% 17,500,000 0 0 0 0 0 17,500,000 100.0%
Grand Total 100.0% 17,500,000 0 0 0 0 0 17,500,000 100.0%
% Of Budget 0.0% 0.0%
Public Education SystemPublic Education System Available BalanceAvailable Balance
Financial Status Report - (Operating Expenditures) as of June 30, 2019 C - 13

(D) Appropriation Fund – by Appropriation Title

Government of the District of Columbia FY 2019 Financial Status Reports (as of June 30, 2019) % Monthly Time Elapsed: 75.0%Office of the Chief Financial Officer % Monthly Time Remaining: 25.0%SOURCE: CFOSolve / SOAR** UNAUDITED and UNADJUSTED **(Run Date: Jul 19, 2019)
Appropriated Fund By Appropriation Title
General Fund: Appropriation Group Title - Local Fund (0100)
AgencyCode/Name Revised Budget
Expenditures Encumbrance ID Advances
Pre Encumbrance
Total Commitments
Available Balance
% Available Balance
AA0 - Office of the Mayor 11,882,368 9,119,706 91,640 7,871 36,000 135,512 2,627,150 22.1%
AB0 - Council of the District of Columbia 27,619,459 17,893,626 317,140 197,435 0 514,575 9,211,258 33.4%
AC0 - Office of the District of Columbia Auditor 6,028,782 3,597,120 450,172 207,677 0 657,849 1,773,812 29.4%
AD0 - Office of the Inspector General 15,943,151 9,164,054 1,642,204 159,887 311,567 2,113,659 4,665,438 29.3%
AE0 - Office of the City Administrator 9,113,478 6,202,048 42,490 498 0 42,988 2,868,442 31.5%
AF0 - Contract Appeals Board 1,556,442 1,149,534 3,571 267 0 3,838 403,071 25.9%
AG0 - Board of Ethics and Government Accountability 2,297,706 1,489,095 49,516 22,942 0 72,458 736,154 32.0%
AH0 - Mayor's Office of Legal Counsel 1,633,505 905,750 660 7,660 0 8,320 719,435 44.0%
AI0 - Office of the Senior Advisor 3,246,077 2,016,330 279,067 61,730 94,500 435,297 794,450 24.5%
AL0 - Uniform Law Commission 60,250 51,864 0 0 0 0 8,386 13.9%
AM0 - Department of General Services 335,485,491 208,293,177 48,225,602 1,144,391 16,177,818 65,547,811 61,644,503 18.4%
AR0 - Statehood Initiatives 244,595 181,672 0 10,878 0 10,878 52,045 21.3%
AS0 - Office of Finance and Resource Management 27,122,756 14,862,934 7,600 3,436,960 0 3,444,560 8,815,262 32.5%
AT0 - Office of the Chief Financial Officer 135,221,186 95,915,951 5,916,734 1,038,196 3,715,659 10,670,589 28,634,646 21.2%
BA0 - Office of the Secretary 3,097,805 2,435,881 40,099 3,017 0 43,116 618,808 20.0%
BE0 - D.C. Department of Human Resources 11,366,116 8,790,326 0 250,841 130,000 380,841 2,194,948 19.3%
CB0 - Office of the Attorney General for the District of Columbia
67,162,926 47,266,100 1,105,043 1,123,126 341,827 2,569,996 17,326,830 25.8%
CG0 - Public Employee Relations Board 1,508,605 784,392 167,283 21,867 0 189,150 535,063 35.5%
CH0 - Office of Employee Appeals 2,178,202 1,544,363 17,164 8,642 0 25,806 608,033 27.9%
CJ0 - Office of Campaign Finance 4,101,184 2,007,625 37,604 3,644 387,000 428,248 1,665,311 40.6%
DL0 - Board of Elections 10,956,457 7,958,289 262,931 16,735 671,418 951,084 2,047,084 18.7%
DX0 - Advisory Neighborhood Commissions 1,145,614 467,124 0 4,131 0 4,131 674,359 58.9%
EA0 - Metropolitan Washington Council of Governments 542,128 542,128 0 0 0 0 0 0.0%
EM0 - Deputy Mayor for Greater Economic Opportunity 5,404,871 2,264,589 1,515,896 731,310 0 2,247,206 893,077 16.5%
GS0 - Section 103 Judgments - Government Direction and Support
12,916,510 10,863,385 0 0 0 0 2,053,125 15.9%
JR0 - Office of Disability Rights 1,153,400 829,810 690 37,361 792 38,843 284,747 24.7%
Financial Status Report - (Operating Expenditures) as of June 30, 2019 D - 1

Government of the District of Columbia FY 2019 Financial Status Reports (as of June 30, 2019) % Monthly Time Elapsed: 75.0%Office of the Chief Financial Officer % Monthly Time Remaining: 25.0%SOURCE: CFOSolve / SOAR** UNAUDITED and UNADJUSTED **(Run Date: Jul 19, 2019)
Appropriated Fund By Appropriation Title
AgencyCode/Name Revised Budget
Expenditures Encumbrance ID Advances
Pre Encumbrance
Total Commitments
Available Balance
% Available Balance
PO0 - Office of Contracting and Procurement 23,393,330 16,949,714 279,865 149,760 0 429,625 6,013,991 25.7%
RJ0 - Captive Insurance Agency 3,416,691 3,025,642 144,021 338 0 144,359 246,691 7.2%
RK0 - D.C. Office of Risk Management 4,102,464 2,560,591 13,298 9,204 0 22,502 1,519,372 37.0%
TO0 - Office of the Chief Technology Officer 69,536,406 53,198,361 5,692,630 154,567 2,580,809 8,428,007 7,910,038 11.4%
Total, Governmental Direction and Support 799,437,956 532,331,180 66,302,921 8,810,936 24,447,391 99,561,248 167,545,528 21.0%
BD0 - Office of Planning 10,419,508 7,007,442 181,283 522,732 152,600 856,615 2,555,450 24.5%
BJ0 - Office of Zoning 3,116,580 2,041,127 163,907 207,704 25,663 397,274 678,180 21.8%
BX0 - Commission on the Arts and Humanities 2,861,767 1,188,348 1,587,500 (586) 10,000 1,596,914 76,506 2.7%
CF0 - Department of Employment Services 69,414,711 32,298,391 5,495,345 5,181,260 1,532,979 12,209,583 24,906,737 35.9%
CI0 - Office of Cable Television, Film, Music, and Entertainment
1,997,631 1,618,390 100,000 0 0 100,000 279,241 14.0%
CQ0 - Office of the Tenant Advocate 7,577,051 3,504,826 21,050 726,861 836,718 1,584,629 2,487,597 32.8%
CR0 - Department of Consumer and Regulatory Affairs 23,898,659 16,238,057 1,214,913 85,348 250,000 1,550,262 6,110,341 25.6%
DA0 - Real Property Tax Appeals Commission 1,763,225 1,284,615 0 60,000 0 60,000 418,610 23.7%
DB0 - Department of Housing and Community Development
39,124,227 24,003,598 6,452,869 (1,619,658) 7,007,000 11,840,210 3,280,419 8.4%
DJ0 - Office of the People's Counsel 775,069 136,068 37,858 0 0 37,858 601,143 77.6%
EB0 - Office of the Deputy Mayor for Planning and Economic Development
34,482,627 10,188,470 2,089,797 507,704 116,868 2,714,369 21,579,787 62.6%
EN0 - Department of Small and Local Business Development
15,739,468 10,437,582 1,950,347 290,452 123,500 2,364,299 2,937,588 18.7%
HP0 - Housing Production Trust Fund Subsidy 39,335,078 0 0 0 0 0 39,335,078 100.0%
HY0 - Housing Authority Subsidy 119,979,855 67,210,851 0 0 0 0 52,769,004 44.0%
Total, Economic Development and Regulation 370,485,457 177,157,764 19,294,868 5,961,817 10,055,328 35,312,012 158,015,681 42.7%
BN0 - Homeland Security and Emergency Management Agency
5,103,405 3,583,747 193,289 102,293 0 295,582 1,224,076 24.0%
FA0 - Metropolitan Police Department 536,987,690 405,453,918 13,603,700 4,254,784 542,389 18,400,873 113,132,899 21.1%
FB0 - Fire and Emergency Medical Services Department 274,019,066 206,712,904 7,123,723 1,969,040 762,071 9,854,834 57,451,327 21.0%
FD0 - Police Officers' and Fire Fighters' Retirement System
92,322,000 91,100,089 0 0 0 0 1,221,911 1.3%
Financial Status Report - (Operating Expenditures) as of June 30, 2019 D - 2

Government of the District of Columbia FY 2019 Financial Status Reports (as of June 30, 2019) % Monthly Time Elapsed: 75.0%Office of the Chief Financial Officer % Monthly Time Remaining: 25.0%SOURCE: CFOSolve / SOAR** UNAUDITED and UNADJUSTED **(Run Date: Jul 19, 2019)
Appropriated Fund By Appropriation Title
AgencyCode/Name Revised Budget
Expenditures Encumbrance ID Advances
Pre Encumbrance
Total Commitments
Available Balance
% Available Balance
FH0 - Office of Police Complaints 2,538,132 1,774,486 18,683 30,966 0 49,649 713,998 28.1%
FI0 - Corrections Information Council 744,054 412,594 0 512 0 512 330,948 44.5%
FJ0 - Criminal Justice Coordinating Council 1,654,930 1,074,547 157,200 18,387 0 175,587 404,796 24.5%
FK0 - District of Columbia National Guard 4,810,037 3,086,017 459,348 82,010 10,231 551,588 1,172,432 24.4%
FL0 - Department of Corrections 143,827,352 101,412,686 12,047,542 293,201 388,909 12,729,652 29,685,013 20.6%
FO0 - Office of Victim Services and Justice Grants 36,870,683 22,658,504 9,284,398 164,628 1,000 9,450,026 4,762,153 12.9%
FQ0 - Office of the Deputy Mayor for Public Safety and Justice
1,496,270 845,992 0 152,437 0 152,437 497,841 33.3%
FR0 - Department of Forensic Sciences 26,550,929 18,953,324 966,301 92,759 383,566 1,442,626 6,154,979 23.2%
FS0 - Office of Administrative Hearings 9,924,220 6,793,909 139,896 37,240 75,380 252,516 2,877,795 29.0%
FX0 - Office of the Chief Medical Examiner 12,351,940 8,745,211 261,247 9,745 2,325 273,317 3,333,411 27.0%
FZ0 - DC Sentencing Commission 1,185,927 802,419 163,548 19,254 0 182,802 200,706 16.9%
MA0 - Criminal Code Reform Commission 723,873 502,604 0 4,668 11,800 16,468 204,802 28.3%
NS0 - Office of Neighborhood Safety and Engagement 5,969,007 2,822,470 1,277,458 545,954 147,669 1,971,080 1,175,457 19.7%
PJ0 - Section 103 Judgments-Public Safety and Justice 240,000 0 0 0 0 0 240,000 100.0%
UC0 - Office of Unified Communications 34,112,507 24,632,565 267,780 0 261,400 529,180 8,950,762 26.2%
Total, Public Safety and Justice 1,191,432,023 901,367,987 45,964,114 7,777,877 2,586,739 56,328,730 233,735,306 19.6%
CE0 - District of Columbia Public Library 64,940,273 41,574,969 5,888,220 478,334 317,416 6,683,970 16,681,333 25.7%
GA0 - District of Columbia Public Schools 842,177,512 682,924,278 12,308,368 24,600,605 9,528,461 46,437,434 112,815,800 13.4%
GC0 - District of Columbia Public Charter Schools 580,233,970 563,843,080 0 0 0 0 16,390,889 2.8%
GD0 - Office of the State Superintendent of Education 191,366,510 101,004,097 12,349,338 3,961,593 2,083,776 18,394,707 71,967,705 37.6%
GE0 - D.C. State Board of Education 1,850,066 1,198,309 24,998 42,878 11,600 79,476 572,282 30.9%
GG0 - University of the District of Columbia Subsidy Account
87,428,491 65,515,118 0 0 0 0 21,913,373 25.1%
GL0 - District of Columbia State Athletics Commission 1,189,207 904,267 29,021 (4,398) 0 24,623 260,318 21.9%
GN0 - Non-Public Tuition 63,161,356 40,042,255 0 0 10,405 10,405 23,108,696 36.6%
GO0 - Special Education Transportation 98,434,203 75,423,372 0 2,516,920 0 2,516,920 20,493,912 20.8%
GW0 - Office of the Deputy Mayor for Education 17,368,701 15,478,299 53,601 132,169 285,126 470,896 1,419,505 8.2%
GX0 - Teachers' Retirement System 53,343,000 53,182,128 0 0 0 0 160,872 0.3%
Financial Status Report - (Operating Expenditures) as of June 30, 2019 D - 3

Government of the District of Columbia FY 2019 Financial Status Reports (as of June 30, 2019) % Monthly Time Elapsed: 75.0%Office of the Chief Financial Officer % Monthly Time Remaining: 25.0%SOURCE: CFOSolve / SOAR** UNAUDITED and UNADJUSTED **(Run Date: Jul 19, 2019)
Appropriated Fund By Appropriation Title
AgencyCode/Name Revised Budget
Expenditures Encumbrance ID Advances
Pre Encumbrance
Total Commitments
Available Balance
% Available Balance
Total, Public Education System 2,001,493,289 1,641,090,174 30,653,545 31,728,100 12,236,785 74,618,430 285,784,685 14.3%
AP0 - Office on Asian and Pacific Islander Affairs 871,535 650,781 1 2,370 0 2,371 218,382 25.1%
BG0 - Employees' Compensation Fund 24,131,582 15,281,349 1,063,211 55,972 0 1,119,183 7,731,051 32.0%
BH0 - Unemployment Compensation Fund 6,201,361 3,676,926 0 0 0 0 2,524,435 40.7%
BY0 - Department of Aging and Community Living 38,391,428 24,336,085 11,028,065 551,802 133,089 11,712,956 2,342,386 6.1%
BZ0 - Mayor’s Office on Latino Affairs 3,403,884 2,095,552 982,357 3,800 0 986,157 322,175 9.5%
HA0 - Department of Parks and Recreation 54,236,582 35,957,032 951,415 76,340 171,849 1,199,604 17,079,946 31.5%
HC0 - Department of Health 86,099,917 51,652,993 22,444,632 2,726,883 743,518 25,915,033 8,531,891 9.9%
HG0 - Office of the Deputy Mayor for Health and Human Services
1,782,358 1,241,120 25,140 32,484 0 57,624 483,614 27.1%
HM0 - Office of Human Rights 5,000,346 3,359,258 77,207 143,092 0 220,299 1,420,789 28.4%
HT0 - Department of Health Care Finance 784,576,601 599,546,815 14,947,801 3,401,791 898,660 19,248,252 165,781,534 21.1%
HX0 - Not-for-Profit Hospital Corp. Subsidy 34,260,773 34,260,773 0 0 0 0 0 0.0%
JA0 - Department of Human Services 383,496,301 263,336,438 57,112,593 11,539,771 1,403,769 70,056,133 50,103,730 13.1%
JM0 - Department on Disability Services 122,010,717 87,205,832 8,645,173 15,681,813 836,727 25,163,713 9,641,172 7.9%
JZ0 - Department of Youth Rehabilitation Services 94,361,430 57,911,297 12,472,390 2,218,195 541,559 15,232,144 21,217,989 22.5%
RL0 - Child and Family Services Agency 161,239,197 108,540,284 10,106,832 3,974,868 1,541,282 15,622,982 37,075,930 23.0%
RM0 - Department of Behavioral Health 250,441,173 178,030,296 17,193,874 12,654,392 3,316,718 33,164,983 39,245,893 15.7%
VA0 - Office of Veterans' Affairs 617,442 484,035 0 243 0 243 133,164 21.6%
Total, Human Support Services 2,051,122,627 1,467,566,868 157,050,690 53,063,815 9,587,172 219,701,677 363,854,082 17.7%
KA0 - District Department of Transportation 107,468,576 62,789,463 27,607,340 937,231 3,734,034 32,278,606 12,400,507 11.5%
KC0 - Washington Metropolitan Area Transit Commission
151,000 68,659 0 0 0 0 82,341 54.5%
KE0 - Washington Metropolitan Area Transit Authority 124,264,346 124,263,914 0 0 0 0 432 0.0%
KG0 - Department of Energy and Environment 28,764,760 21,279,549 467,378 368,433 197,029 1,032,840 6,452,371 22.4%
KT0 - Department of Public Works 141,093,837 102,976,651 5,298,308 2,586,486 829,393 8,714,187 29,402,999 20.8%
KV0 - Department of Motor Vehicles 30,373,427 17,897,175 1,918,833 3,194,437 300,421 5,413,690 7,062,561 23.3%
TC0 - Department of For-Hire Vehicles 5,924,444 3,852,625 1,744,524 54,000 0 1,798,524 273,295 4.6%
Total, Public Works 438,040,390 333,128,037 37,036,383 7,140,587 5,060,878 49,237,847 55,674,506 12.7%
Financial Status Report - (Operating Expenditures) as of June 30, 2019 D - 4

Government of the District of Columbia FY 2019 Financial Status Reports (as of June 30, 2019) % Monthly Time Elapsed: 75.0%Office of the Chief Financial Officer % Monthly Time Remaining: 25.0%SOURCE: CFOSolve / SOAR** UNAUDITED and UNADJUSTED **(Run Date: Jul 19, 2019)
Appropriated Fund By Appropriation Title
AgencyCode/Name Revised Budget
Expenditures Encumbrance ID Advances
Pre Encumbrance
Total Commitments
Available Balance
% Available Balance
DO0 - Non-Departmental 1,750,000 0 0 0 0 0 1,750,000 100.0%
DS0 - Repayment of Loans and Interest 735,609,550 693,930,941 0 0 0 0 41,678,609 5.7%
ELO - Master Equipment Lease/Purchase Program 11,844,303 9,891,789 0 0 0 0 1,952,514 16.5%
EZ0 - Convention Center Transfer 350,000 350,000 0 0 0 0 0 0.0%
PA0 - Pay-As-You-Go Capital Fund 4,421,166 0 0 0 0 0 4,421,166 100.0%
RH0 - District Retiree Health Contribution 46,000,000 46,000,000 0 0 0 0 0 0.0%
UP0 - Workforce Investments 13,316,959 0 0 0 0 0 13,316,959 100.0%
ZB0 - Debt Service - Issuance Costs 8,000,000 5,147,123 0 0 0 0 2,852,877 35.7%
ZC0 - Commercial Paper Program 10,000,000 4,892,986 0 0 0 0 5,107,014 51.1%
ZH0 - Settlements and Judgments 21,824,759 21,795,167 18,919 0 0 18,919 10,672 0.0%
ZZ0 - John A. Wilson Building Fund 4,725,659 2,336,151 0 2,389,508 0 2,389,508 0 0.0%
Total, Financing and Other 857,842,396 784,344,158 18,919 2,389,508 0 2,408,427 71,089,811 8.3%
Grand Total 7,709,854,138 5,836,986,167 356,321,441 116,872,640 63,974,291 537,168,372 1,335,699,599 17.3%
% Of Budget 75.7% 7.0%
Financial Status Report - (Operating Expenditures) as of June 30, 2019 D - 5
Government of the District of Columbia FY 2019 Financial Status Reports (as of June 30, 2019) % Monthly Time Elapsed: 75.0%Office of the Chief Financial Officer % Monthly Time Remaining: 25.0%SOURCE: CFOSolve / SOAR** UNAUDITED and UNADJUSTED **(Run Date: Jul 19, 2019)
Appropriated Fund By Appropriation Title
General Fund: Appropriation Group Title - Dedicated Taxes (0110)
AgencyCode/Name Revised Budget
Expenditures Encumbrance ID Advances
Pre Encumbrance
Total Commitments
Available Balance
% Available Balance
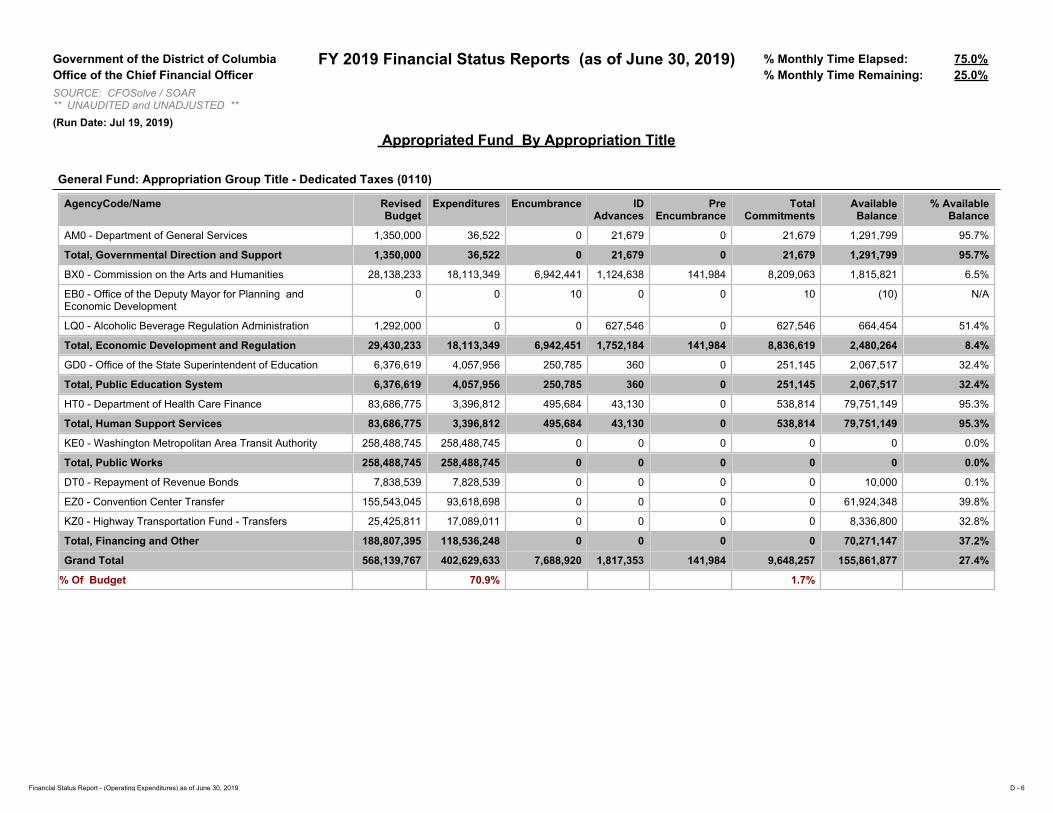
AM0 - Department of General Services 1,350,000 36,522 0 21,679 0 21,679 1,291,799 95.7%
Total, Governmental Direction and Support 1,350,000 36,522 0 21,679 0 21,679 1,291,799 95.7%
BX0 - Commission on the Arts and Humanities 28,138,233 18,113,349 6,942,441 1,124,638 141,984 8,209,063 1,815,821 6.5%
EB0 - Office of the Deputy Mayor for Planning and Economic Development
0 0 10 0 0 10 (10) N/A
LQ0 - Alcoholic Beverage Regulation Administration 1,292,000 0 0 627,546 0 627,546 664,454 51.4%
Total, Economic Development and Regulation 29,430,233 18,113,349 6,942,451 1,752,184 141,984 8,836,619 2,480,264 8.4%
GD0 - Office of the State Superintendent of Education 6,376,619 4,057,956 250,785 360 0 251,145 2,067,517 32.4%
Total, Public Education System 6,376,619 4,057,956 250,785 360 0 251,145 2,067,517 32.4%
HT0 - Department of Health Care Finance 83,686,775 3,396,812 495,684 43,130 0 538,814 79,751,149 95.3%
Total, Human Support Services 83,686,775 3,396,812 495,684 43,130 0 538,814 79,751,149 95.3%
KE0 - Washington Metropolitan Area Transit Authority 258,488,745 258,488,745 0 0 0 0 0 0.0%
Total, Public Works 258,488,745 258,488,745 0 0 0 0 0 0.0%
DT0 - Repayment of Revenue Bonds 7,838,539 7,828,539 0 0 0 0 10,000 0.1%
EZ0 - Convention Center Transfer 155,543,045 93,618,698 0 0 0 0 61,924,348 39.8%
KZ0 - Highway Transportation Fund - Transfers 25,425,811 17,089,011 0 0 0 0 8,336,800 32.8%
Total, Financing and Other 188,807,395 118,536,248 0 0 0 0 70,271,147 37.2%
Grand Total 568,139,767 402,629,633 7,688,920 1,817,353 141,984 9,648,257 155,861,877 27.4%
% Of Budget 70.9% 1.7%
Financial Status Report - (Operating Expenditures) as of June 30, 2019 D - 6

Government of the District of Columbia FY 2019 Financial Status Reports (as of June 30, 2019) % Monthly Time Elapsed: 75.0%Office of the Chief Financial Officer % Monthly Time Remaining: 25.0%SOURCE: CFOSolve / SOAR** UNAUDITED and UNADJUSTED **(Run Date: Jul 19, 2019)
Appropriated Fund By Appropriation Title
General Fund: Appropriation Group Title - Federal Payments (0150)
AgencyCode/Name Revised Budget
Expenditures Encumbrance ID Advances
Pre Encumbrance
Total Commitments
Available Balance
% Available Balance
DQ0 - Commission on Judicial Disabilities and Tenure
295,938 213,353 5,360 10,029 0 15,389 67,196 22.7%
DV0 - Judicial Nomination Commission 436,135 209,392 0 9,698 0 9,698 217,045 49.8%
FJ0 - Criminal Justice Coordinating Council 2,580,892 1,424,829 122,534 1,908 0 124,442 1,031,621 40.0%
FK0 - District of Columbia National Guard 703,196 447,358 121,815 0 0 121,815 134,023 19.1%
Total, Public Safety and Justice 4,016,161 2,294,931 249,709 21,635 0 271,344 1,449,885 36.1%
GA0 - District of Columbia Public Schools 17,500,000 17,500,000 (57) 0 0 (57) 57 0.0%
GD0 - Office of the State Superintendent of Education
76,982,613 19,999,984 193,648 575 20,000 214,223 56,768,407 73.7%
Total, Public Education System 94,482,613 37,499,984 193,591 575 20,000 214,166 56,768,464 60.1%
HC0 - Department of Health 3,000,000 3,845,244 3,540,166 0 30,000 3,570,166 (4,415,410) (147.2%)
Total, Human Support Services 3,000,000 3,845,244 3,540,166 0 30,000 3,570,166 (4,415,410) (147.2%)
KG0 - Department of Energy and Environment 1,304,390 427,664 20,141 0 0 20,141 856,586 65.7%
Total, Public Works 1,304,390 427,664 20,141 0 0 20,141 856,586 65.7%
EP0 - Emergency Planning and Security Fund 14,026,292 4,433,880 0 0 0 0 9,592,412 68.4%
Total, Financing and Other 14,026,292 4,433,880 0 0 0 0 9,592,412 68.4%
Grand Total 116,829,456 48,501,703 4,003,606 22,210 50,000 4,075,816 64,251,937 55.0%
% Of Budget 41.5% 3.5%
Financial Status Report - (Operating Expenditures) as of June 30, 2019 D - 7

Government of the District of Columbia FY 2019 Financial Status Reports (as of June 30, 2019) % Monthly Time Elapsed: 75.0%Office of the Chief Financial Officer % Monthly Time Remaining: 25.0%SOURCE: CFOSolve / SOAR** UNAUDITED and UNADJUSTED **(Run Date: Jul 19, 2019)
Appropriated Fund By Appropriation Title
General Fund: Appropriation Group Title - Federal Grant Fund (0200)
AgencyCode/Name Revised Budget
Expenditures Encumbrance ID Advances
Pre Encumbrance
Total Commitments
Available Balance
% Available Balance
AA0 - Office of the Mayor 4,762,919 908,579 2,514,149 0 130,906 2,645,056 1,209,284 25.4%
AD0 - Office of the Inspector General 2,820,187 1,500,556 24,071 7,500 4,125 35,696 1,283,934 45.5%
AT0 - Office of the Chief Financial Officer 450,000 369,377 80,623 0 0 80,623 0 0.0%
CB0 - Office of the Attorney General for the District of Columbia
23,603,730 12,005,960 1,265,521 217,354 3,300 1,486,175 10,111,595 42.8%
DL0 - Board of Elections 2,822,371 47,384 175,411 0 250,000 425,411 2,349,576 83.2%
JR0 - Office of Disability Rights 809,411 339,053 179,422 3,791 0 183,213 287,145 35.5%
Total, Governmental Direction and Support 35,268,618 15,170,909 4,239,198 228,645 388,331 4,856,175 15,241,534 43.2%
BD0 - Office of Planning 595,346 412,750 73,686 0 0 73,686 108,910 18.3%
BX0 - Commission on the Arts and Humanities 713,500 1,574 190,000 0 40,000 230,000 481,926 67.5%
CF0 - Department of Employment Services 34,333,106 21,321,919 2,214,468 1,689,706 498,824 4,402,998 8,608,189 25.1%
DB0 - Department of Housing and Community Development
67,701,480 22,510,885 14,180,716 1,123,059 3,309,019 18,612,794 26,577,801 39.3%
DH0 - Public Service Commission 565,555 378,029 627 20,123 0 20,750 166,776 29.5%
EB0 - Office of the Deputy Mayor for Planning and Economic Development
0 0 3,205 0 0 3,205 (3,205) N/A
EN0 - Department of Small and Local Business Development
431,181 326,754 0 0 0 0 104,427 24.2%
SR0 - Department of Insurance, Securities, and Banking 994,195 257,842 268,772 0 277,959 546,731 189,622 19.1%
Total, Economic Development and Regulation 105,334,363 45,209,754 16,931,475 2,832,888 4,125,802 23,890,164 36,234,445 34.4%
BN0 - Homeland Security and Emergency Management Agency
98,038,442 36,232,157 2,881,869 0 1,927,530 4,809,399 56,996,886 58.1%
FA0 - Metropolitan Police Department 6,761,739 1,770,371 349,600 203,550 2,158,774 2,711,924 2,279,445 33.7%
FB0 - Fire and Emergency Medical Services Department 807,725 48,833 268,393 0 131,250 399,643 359,249 44.5%
FJ0 - Criminal Justice Coordinating Council 158,700 24,700 134,000 0 0 134,000 0 0.0%
FK0 - District of Columbia National Guard 9,288,006 6,218,536 7,944 415,551 0 423,495 2,645,975 28.5%
FL0 - Department of Corrections 714,800 0 (22,226) 0 0 (22,226) 737,026 103.1%
FO0 - Office of Victim Services and Justice Grants 15,470,816 4,984,860 4,024,013 56,534 0 4,080,547 6,405,408 41.4%
FR0 - Department of Forensic Sciences 931,163 382,089 0 0 0 0 549,074 59.0%
Financial Status Report - (Operating Expenditures) as of June 30, 2019 D - 8

Government of the District of Columbia FY 2019 Financial Status Reports (as of June 30, 2019) % Monthly Time Elapsed: 75.0%Office of the Chief Financial Officer % Monthly Time Remaining: 25.0%SOURCE: CFOSolve / SOAR** UNAUDITED and UNADJUSTED **(Run Date: Jul 19, 2019)
Appropriated Fund By Appropriation Title
AgencyCode/Name Revised Budget
Expenditures Encumbrance ID Advances
Pre Encumbrance
Total Commitments
Available Balance
% Available Balance
Total, Public Safety and Justice 132,171,390 49,661,545 7,643,593 675,635 4,217,554 12,536,782 69,973,063 52.9%
CE0 - District of Columbia Public Library 1,107,034 550,783 104,021 4,351 58,881 167,252 388,999 35.1%
GA0 - District of Columbia Public Schools 14,571,411 10,536,224 308,408 103,338 60,000 471,746 3,563,441 24.5%
GD0 - Office of the State Superintendent of Education 277,394,892 108,626,918 4,232,071 1,053,664 1,987,968 7,273,704 161,494,270 58.2%
Total, Public Education System 293,073,337 119,713,924 4,644,500 1,161,353 2,106,850 7,912,702 165,446,711 56.5%
BY0 - Department of Aging and Community Living 9,464,103 3,499,499 4,402,629 0 0 4,402,629 1,561,975 16.5%
HC0 - Department of Health 168,250,147 76,862,606 30,128,197 3,431,710 1,853,082 35,412,989 55,974,552 33.3%
HM0 - Office of Human Rights 397,675 202,668 23,177 5,389 0 28,566 166,441 41.9%
HT0 - Department of Health Care Finance 2,321,969 1,051,590 0 0 0 0 1,270,379 54.7%
JA0 - Department of Human Services 195,702,343 107,083,669 38,337,322 11,324,858 2,889,281 52,551,462 36,067,212 18.4%
JM0 - Department on Disability Services 37,382,846 20,403,421 6,222,294 1,374,933 87,531 7,684,758 9,294,667 24.9%
RL0 - Child and Family Services Agency 63,871,056 31,117,730 3,012,864 1,731,526 790,163 5,534,553 27,218,773 42.6%
RM0 - Department of Behavioral Health 46,116,388 12,424,891 7,152,494 6,642,236 6,959,462 20,754,193 12,937,305 28.1%
Total, Human Support Services 523,506,527 252,646,074 89,278,977 24,510,654 12,579,519 126,369,150 144,491,304 27.6%
KA0 - District Department of Transportation 11,727,016 5,572,089 1,427,512 2,113,346 0 3,540,858 2,614,070 22.3%
KG0 - Department of Energy and Environment 32,021,796 21,038,025 1,997,863 527,417 68,317 2,593,597 8,390,174 26.2%
Total, Public Works 43,748,812 26,610,114 3,425,375 2,640,763 68,317 6,134,455 11,004,243 25.2%
DS0 - Repayment of Loans and Interest 17,524,712 17,524,712 0 0 0 0 0 0.0%
Total, Financing and Other 17,524,712 17,524,712 0 0 0 0 0 0.0%
Grand Total 1,150,627,759 526,537,032 126,163,118 32,049,937 23,486,373 181,699,428 442,391,300 38.4%
% Of Budget 45.8% 15.8%
Financial Status Report - (Operating Expenditures) as of June 30, 2019 D - 9

Government of the District of Columbia FY 2019 Financial Status Reports (as of June 30, 2019) % Monthly Time Elapsed: 75.0%Office of the Chief Financial Officer % Monthly Time Remaining: 25.0%SOURCE: CFOSolve / SOAR** UNAUDITED and UNADJUSTED **(Run Date: Jul 19, 2019)
Appropriated Fund By Appropriation Title
General Fund: Appropriation Group Title - Federal Medicaid Payments (0250)
AgencyCode/Name Revised Budget
Expenditures Encumbrance ID Advances
Pre Encumbrance
Total Commitments
Available Balance
% Available Balance
FS0 - Office of Administrative Hearings 245,000 99,261 0 0 0 0 145,739 59.5%
Total, Public Safety and Justice 245,000 99,261 0 0 0 0 145,739 59.5%
BY0 - Department of Aging and Community Living
2,752,297 1,873,605 0 0 0 0 878,692 31.9%
HC0 - Department of Health 0 2,230 0 0 0 0 (2,230) N/A
HT0 - Department of Health Care Finance 2,413,633,274 1,684,999,300 23,125,135 2,964,903 664,346 26,754,385 701,879,589 29.1%
JA0 - Department of Human Services 17,380,568 11,366,422 203,895 138,000 12,656 354,552 5,659,594 32.6%
JM0 - Department on Disability Services 10,763,446 5,613,043 2,434,872 1,258,233 50,000 3,743,105 1,407,299 13.1%
RM0 - Department of Behavioral Health 5,484,576 2,001,050 781,162 70,745 344,189 1,196,096 2,287,430 41.7%
Total, Human Support Services 2,450,014,161 1,705,855,651 26,545,064 4,431,882 1,071,191 32,048,137 712,110,373 29.1%
Grand Total 2,450,259,161 1,705,954,911 26,545,064 4,431,882 1,071,191 32,048,137 712,256,113 29.1%
% Of Budget 69.6% 1.3%
Financial Status Report - (Operating Expenditures) as of June 30, 2019 D - 10

Government of the District of Columbia FY 2019 Financial Status Reports (as of June 30, 2019) % Monthly Time Elapsed: 75.0%Office of the Chief Financial Officer % Monthly Time Remaining: 25.0%SOURCE: CFOSolve / SOAR** UNAUDITED and UNADJUSTED **(Run Date: Jul 19, 2019)
Appropriated Fund By Appropriation Title
General Fund: Appropriation Group Title - Private Grant Fund (0400)
AgencyCode/Name Revised Budget
Expenditures Encumbrance ID Advances
Pre Encumbrance
Total Commitments
Available Balance
% Available Balance
AE0 - Office of the City Administrator 1,290,309 533,385 0 9,545 5,640 15,185 741,738 57.5%
Total, Governmental Direction and Support 1,290,309 533,385 0 9,545 5,640 15,185 741,738 57.5%
BD0 - Office of Planning 35,000 14,219 0 0 0 0 20,781 59.4%
CF0 - Department of Employment Services 2,760,567 349,385 253,460 0 78,253 331,713 2,079,469 75.3%
SR0 - Department of Insurance, Securities, and Banking
50,000 0 44,800 0 0 44,800 5,200 10.4%
Total, Economic Development and Regulation 2,845,567 363,604 298,260 0 78,253 376,513 2,105,450 74.0%
FL0 - Department of Corrections 298,540 0 298,265 0 0 298,265 275 0.1%
FX0 - Office of the Chief Medical Examiner 21,280 602 0 0 0 0 20,678 97.2%
Total, Public Safety and Justice 319,820 602 298,265 0 0 298,265 20,953 6.6%
GA0 - District of Columbia Public Schools 4,500,392 1,777,333 31,811 12,700 27,571 72,082 2,650,977 58.9%
GD0 - Office of the State Superintendent of Education
100,000 68,613 0 0 0 0 31,387 31.4%
Total, Public Education System 4,600,392 1,845,947 31,811 12,700 27,571 72,082 2,682,363 58.3%
HA0 - Department of Parks and Recreation 8,000 0 0 0 0 0 8,000 100.0%
HC0 - Department of Health 10,977 3,834 0 4,339 0 4,339 2,804 25.5%
HM0 - Office of Human Rights 122,300 52,027 32,070 0 0 32,070 38,202 31.2%
RM0 - Department of Behavioral Health 517,448 220,432 57,835 37,879 27,140 122,854 174,162 33.7%
Total, Human Support Services 658,725 276,294 89,906 42,218 27,140 159,263 223,169 33.9%
KG0 - Department of Energy and Environment 716,791 65,160 0 0 0 0 651,631 90.9%
Total, Public Works 716,791 65,160 0 0 0 0 651,631 90.9%
Grand Total 10,431,605 3,084,991 718,242 64,463 138,604 921,309 6,425,305 61.6%
% Of Budget 29.6% 8.8%
Financial Status Report - (Operating Expenditures) as of June 30, 2019 D - 11

Government of the District of Columbia FY 2019 Financial Status Reports (as of June 30, 2019) % Monthly Time Elapsed: 75.0%Office of the Chief Financial Officer % Monthly Time Remaining: 25.0%SOURCE: CFOSolve / SOAR** UNAUDITED and UNADJUSTED **(Run Date: Jul 19, 2019)
Appropriated Fund By Appropriation Title
General Fund: Appropriation Group Title - Private Donations (0450)
AgencyCode/Name Revised Budget
Expenditures Encumbrance ID Advances
Pre Encumbrance
Total Commitments
Available Balance
% Available Balance
CB0 - Office of the Attorney General for the District of Columbia
2,548,461 574,670 420,950 0 0 420,950 1,552,841 60.9%
JR0 - Office of Disability Rights 5,520 5,520 0 0 0 0 0 0.0%
Total, Governmental Direction and Support 2,553,981 580,190 420,950 0 0 420,950 1,552,841 60.8%
DB0 - Department of Housing and Community Development
20,000 0 7,528 0 0 7,528 12,472 62.4%
DH0 - Public Service Commission 22,000 7,392 0 0 0 0 14,608 66.4%
SR0 - Department of Insurance, Securities, and Banking
2,500 0 0 0 0 0 2,500 100.0%
Total, Economic Development and Regulation 44,500 7,392 7,528 0 0 7,528 29,580 66.5%
FA0 - Metropolitan Police Department 212,589 69,677 0 0 0 0 142,911 67.2%
FB0 - Fire and Emergency Medical Services Department
1,000 0 0 0 0 0 1,000 100.0%
FI0 - Corrections Information Council 499 1 0 0 0 0 497 99.7%
Total, Public Safety and Justice 214,087 69,679 0 0 0 0 144,409 67.5%
CE0 - District of Columbia Public Library 24,500 1,493 0 0 0 0 23,007 93.9%
GA0 - District of Columbia Public Schools 199,184 36,415 4,079 25,122 4,187 33,389 129,379 65.0%
GD0 - Office of the State Superintendent of Education 57,000 4,500 9,886 0 5,379 15,264 37,236 65.3%
GW0 - Office of the Deputy Mayor for Education 169,402 0 0 0 0 0 169,402 100.0%
Total, Public Education System 450,086 42,408 13,965 25,122 9,566 48,653 359,025 79.8%
HA0 - Department of Parks and Recreation 39,479 8,397 0 1,319 10,000 11,319 19,763 50.1%
RL0 - Child and Family Services Agency 52,486 7,024 0 3,921 0 3,921 41,542 79.1%
RM0 - Department of Behavioral Health 288,775 41,808 13,060 103,427 10,200 126,687 120,280 41.7%
Total, Human Support Services 380,740 57,229 13,060 108,667 20,200 141,927 181,584 47.7%
Grand Total 3,643,395 756,897 455,503 133,789 29,766 619,058 2,267,439 62.2%
% Of Budget 20.8% 17.0%
Financial Status Report - (Operating Expenditures) as of June 30, 2019 D - 12

Government of the District of Columbia FY 2019 Financial Status Reports (as of June 30, 2019) % Monthly Time Elapsed: 75.0%Office of the Chief Financial Officer % Monthly Time Remaining: 25.0%SOURCE: CFOSolve / SOAR** UNAUDITED and UNADJUSTED **(Run Date: Jul 19, 2019)
Appropriated Fund By Appropriation Title
General Fund: Appropriation Group Title - Special Purpose Revenue Funds ('O'Type) (0600)
AgencyCode/Name Revised Budget
Expenditures Encumbrance ID Advances
Pre Encumbrance
Total Commitments
Available Balance
% Available Balance
AE0 - Office of the City Administrator 250,000 0 0 0 0 0 250,000 100.0%
AG0 - Board of Ethics and Government Accountability 152,652 25,312 4,957 0 0 4,957 122,383 80.2%
AM0 - Department of General Services 8,376,988 5,159,567 750,406 10,070 77,339 837,815 2,379,606 28.4%
AS0 - Office of Finance and Resource Management 472,147 126,130 0 0 0 0 346,018 73.3%
AT0 - Office of the Chief Financial Officer 45,430,513 11,495,326 7,231,783 285,028 254,500 7,771,311 26,163,875 57.6%
BA0 - Office of the Secretary 1,100,000 621,520 240,102 0 0 240,102 238,378 21.7%
BE0 - D.C. Department of Human Resources 561,039 419,604 0 0 0 0 141,436 25.2%
CB0 - Office of the Attorney General for the District of Columbia
12,819,443 4,109,168 3,604,845 54,777 83,230 3,742,852 4,967,424 38.7%
PO0 - Office of Contracting and Procurement 1,551,764 952,059 156,105 0 0 156,105 443,600 28.6%
RJ0 - Captive Insurance Agency 210,811 0 0 6,000 0 6,000 204,811 97.2%
TO0 - Office of the Chief Technology Officer 13,020,222 7,996,119 2,018,100 888 1,811,332 3,830,321 1,193,783 9.2%
Total, Governmental Direction and Support 83,945,579 30,904,804 14,006,297 356,764 2,226,401 16,589,461 36,451,314 43.4%
BD0 - Office of Planning 250,000 42,426 168,819 19,020 0 187,839 19,735 7.9%
BX0 - Commission on the Arts and Humanities 199,000 0 0 0 100,000 100,000 99,000 49.7%
CF0 - Department of Employment Services 39,561,459 17,405,108 3,206,109 908,387 98,697 4,213,193 17,943,158 45.4%
CI0 - Office of Cable Television, Film, Music, and Entertainment
15,296,101 7,791,344 1,556,033 1,263,696 253,872 3,073,601 4,431,156 29.0%
CQ0 - Office of the Tenant Advocate 509,037 180,299 0 0 158,282 158,282 170,457 33.5%
CR0 - Department of Consumer and Regulatory Affairs 40,476,877 24,048,115 4,199,870 860,779 372,916 5,433,564 10,995,198 27.2%
DB0 - Department of Housing and Community Development
3,633,812 2,387,540 617,697 212,130 0 829,827 416,445 11.5%
DH0 - Public Service Commission 15,163,455 10,502,748 339,317 514,830 5,313 859,459 3,801,248 25.1%
DJ0 - Office of the People's Counsel 9,310,586 6,211,992 657,336 338,446 14,621 1,010,403 2,088,191 22.4%
EB0 - Office of the Deputy Mayor for Planning and Economic Development
28,703,950 6,878,196 2,147,486 2,925,057 80,385 5,152,929 16,672,825 58.1%
EN0 - Department of Small and Local Business Development
830,000 117,690 414,637 0 0 414,637 297,673 35.9%
ID0 - Business Improvement Districts Transfer 55,000,000 23,285,027 0 0 0 0 31,714,973 57.7%
Financial Status Report - (Operating Expenditures) as of June 30, 2019 D - 13

Government of the District of Columbia FY 2019 Financial Status Reports (as of June 30, 2019) % Monthly Time Elapsed: 75.0%Office of the Chief Financial Officer % Monthly Time Remaining: 25.0%SOURCE: CFOSolve / SOAR** UNAUDITED and UNADJUSTED **(Run Date: Jul 19, 2019)
Appropriated Fund By Appropriation Title
AgencyCode/Name Revised Budget
Expenditures Encumbrance ID Advances
Pre Encumbrance
Total Commitments
Available Balance
% Available Balance
LQ0 - Alcoholic Beverage Regulation Administration 8,006,696 4,803,310 120,088 138,116 179,480 437,684 2,765,701 34.5%
SR0 - Department of Insurance, Securities, and Banking 28,565,477 14,125,332 1,001,796 1,443,352 498,177 2,943,325 11,496,820 40.2%
Total, Economic Development and Regulation 245,506,449 117,779,128 14,429,188 8,623,812 1,761,742 24,814,742 102,912,580 41.9%
FA0 - Metropolitan Police Department 9,111,468 4,699,217 45,780 0 0 45,780 4,366,472 47.9%
FB0 - Fire and Emergency Medical Services Department 1,762,425 135,057 0 0 0 0 1,627,368 92.3%
FL0 - Department of Corrections 23,720,425 17,237,238 338,019 0 (211,690) 126,330 6,356,857 26.8%
FO0 - Office of Victim Services and Justice Grants 2,811,607 824,066 1,474,672 0 0 1,474,672 512,869 18.2%
UC0 - Office of Unified Communications 16,669,059 9,334,816 3,262,360 989,624 476,104 4,728,088 2,606,155 15.6%
Total, Public Safety and Justice 54,074,984 32,230,394 5,120,831 989,624 264,414 6,374,870 15,469,720 28.6%
CE0 - District of Columbia Public Library 1,355,878 667,641 388,967 0 40,330 429,296 258,941 19.1%
GA0 - District of Columbia Public Schools 19,629,993 9,818,483 2,819,109 448,156 1,092,604 4,359,869 5,451,641 27.8%
GB0 - District of Columbia Public Charter School Board 8,524,878 5,572,186 0 0 0 0 2,952,692 34.6%
GD0 - Office of the State Superintendent of Education 1,175,974 588,041 190,188 0 26,706 216,895 371,039 31.6%
GL0 - District of Columbia State Athletics Commission 100,000 19,279 19,100 40,000 0 59,100 21,621 21.6%
Total, Public Education System 30,786,724 16,665,630 3,417,364 488,156 1,159,640 5,065,160 9,055,934 29.4%
HA0 - Department of Parks and Recreation 3,671,257 1,420,075 677,177 142,406 38,796 858,379 1,392,802 37.9%
HC0 - Department of Health 27,386,714 14,161,811 1,682,885 382,936 2,225,988 4,291,809 8,933,094 32.6%
HT0 - Department of Health Care Finance 2,955,610 1,324,939 289,447 31,043 11,000 331,490 1,299,180 44.0%
JA0 - Department of Human Services 1,032,431 529,632 0 104,945 0 104,945 397,854 38.5%
JM0 - Department on Disability Services 9,116,147 5,676,281 2,855,952 0 0 2,855,952 583,913 6.4%
RL0 - Child and Family Services Agency 1,000,000 900,000 0 0 0 0 100,000 10.0%
RM0 - Department of Behavioral Health 2,351,648 1,653,239 217,269 (119) 0 217,150 481,259 20.5%
VA0 - Office of Veterans' Affairs 5,000 789 0 0 0 0 4,211 84.2%
Total, Human Support Services 47,518,805 25,666,766 5,722,731 661,211 2,275,784 8,659,726 13,192,314 27.8%
KA0 - District Department of Transportation 23,720,170 12,260,903 4,355,370 1,254,877 1,763,449 7,373,696 4,085,571 17.2%
KE0 - Washington Metropolitan Area Transit Authority 43,000,000 43,000,000 0 0 0 0 0 0.0%
KG0 - Department of Energy and Environment 108,640,448 36,711,541 45,818,829 7,552,723 43,088 53,414,640 18,514,267 17.0%
KT0 - Department of Public Works 11,072,948 7,103,387 2,356,953 0 45,000 2,401,953 1,567,608 14.2%
Financial Status Report - (Operating Expenditures) as of June 30, 2019 D - 14

Government of the District of Columbia FY 2019 Financial Status Reports (as of June 30, 2019) % Monthly Time Elapsed: 75.0%Office of the Chief Financial Officer % Monthly Time Remaining: 25.0%SOURCE: CFOSolve / SOAR** UNAUDITED and UNADJUSTED **(Run Date: Jul 19, 2019)
Appropriated Fund By Appropriation Title
AgencyCode/Name Revised Budget
Expenditures Encumbrance ID Advances
Pre Encumbrance
Total Commitments
Available Balance
% Available Balance
KV0 - Department of Motor Vehicles 10,080,452 7,236,199 734,606 7,527 227,903 970,036 1,874,217 18.6%
TC0 - Department of For-Hire Vehicles 11,795,365 7,159,155 1,171,670 171,217 245,000 1,587,887 3,048,322 25.8%
Total, Public Works 208,309,382 113,471,184 54,437,428 8,986,344 2,324,440 65,748,212 29,089,986 14.0%
DO0 - Non-Departmental 2,171,560 0 0 0 0 0 2,171,560 100.0%
DS0 - Repayment of Loans and Interest 5,753,000 5,753,000 0 0 0 0 0 0.0%
EZ0 - Convention Center Transfer 3,415,469 2,247,511 0 0 0 0 1,167,958 34.2%
KZ0 - Highway Transportation Fund - Transfers 2,750,000 0 0 0 0 0 2,750,000 100.0%
PA0 - Pay-As-You-Go Capital Fund 82,046,121 0 0 0 0 0 82,046,121 100.0%
Total, Financing and Other 96,136,150 8,000,511 0 0 0 0 88,135,639 91.7%
Grand Total 766,278,073 344,718,416 97,133,838 20,105,911 10,012,421 127,252,170 294,307,487 38.4%
% Of Budget 45.0% 16.6%
Financial Status Report - (Operating Expenditures) as of June 30, 2019 D - 15

(E) Agency Summary – by Gross Funds

Government of the District of Columbia FY 2019 Financial Status Reports (as of June 30, 2019) % Monthly Time Elapsed: 75.0%Office of the Chief Financial Officer % Monthly Time Remaining: 25.0%SOURCE: CFOSolve / SOAR** UNAUDITED and UNADJUSTED **(Run Date: Jul 19, 2019)
Agency Summary
Agency Summary By Gross FundsAgency Appn Fund Title Appn
FundRevised Budget ExpendituresEncumbrance ID Advances Pre
EncumbranceTotal
CommitmentsAvailable
Balance% Available
BalanceAA0 - Office of the Mayor
Local Fund 0100 11,882,368 9,119,706 91,640 7,871 36,000 135,512 2,627,150 22.1%Federal Grant Fund 0200 4,762,919 908,579 2,514,149 0 130,906 2,645,056 1,209,284 25.4%
AA0 - Office of the Mayor 16,645,287 10,028,285 2,605,790 7,871 166,906 2,780,567 3,836,434 23.0%AB0 - Council of the District of Columbia
Local Fund 0100 27,619,459 17,893,626 317,140 197,435 0 514,575 9,211,258 33.4%
AB0 - Council of the District of Columbia 27,619,459 17,893,626 317,140 197,435 0 514,575 9,211,258 33.4%AC0 - Office of the District of Columbia Auditor
Local Fund 0100 6,028,782 3,597,120 450,172 207,677 0 657,849 1,773,812 29.4%
AC0 - Office of the District of Columbia Auditor
6,028,782 3,597,120 450,172 207,677 0 657,849 1,773,812 29.4%
AD0 - Office of the Inspector General
Local Fund 0100 15,943,151 9,164,054 1,642,204 159,887 311,567 2,113,659 4,665,438 29.3%Federal Grant Fund 0200 2,820,187 1,500,556 24,071 7,500 4,125 35,696 1,283,934 45.5%
AD0 - Office of the Inspector General 18,763,338 10,664,610 1,666,276 167,387 315,692 2,149,355 5,949,373 31.7%AE0 - Office of the City Administrator
Local Fund 0100 9,113,478 6,202,048 42,490 498 0 42,988 2,868,442 31.5%Private Grant Fund 0400 1,290,309 533,385 0 9,545 5,640 15,185 741,738 57.5%Special Purpose Revenue Funds ('O'Type)
0600 250,000 0 0 0 0 0 250,000 100.0%
AE0 - Office of the City Administrator 10,653,787 6,735,433 42,490 10,043 5,640 58,173 3,860,180 36.2%AF0 - Contract Appeals Board
Local Fund 0100 1,556,442 1,149,534 3,571 267 0 3,838 403,071 25.9%
AF0 - Contract Appeals Board 1,556,442 1,149,534 3,571 267 0 3,838 403,071 25.9%AG0 - Board of Ethics and Government Accountability
Local Fund 0100 2,297,706 1,489,095 49,516 22,942 0 72,458 736,154 32.0%Special Purpose Revenue Funds ('O'Type)
0600 152,652 25,312 4,957 0 0 4,957 122,383 80.2%
AG0 - Board of Ethics and Government Accountability
2,450,358 1,514,407 54,473 22,942 0 77,414 858,537 35.0%
AH0 - Mayor's Office of Legal Counsel
Local Fund 0100 1,633,505 905,750 660 7,660 0 8,320 719,435 44.0%
AH0 - Mayor's Office of Legal Counsel 1,633,505 905,750 660 7,660 0 8,320 719,435 44.0%AI0 - Office of the Senior Advisor
Local Fund 0100 3,246,077 2,016,330 279,067 61,730 94,500 435,297 794,450 24.5%
AI0 - Office of the Senior Advisor 3,246,077 2,016,330 279,067 61,730 94,500 435,297 794,450 24.5%AL0 - Uniform Law Commission
Local Fund 0100 60,250 51,864 0 0 0 0 8,386 13.9%
AL0 - Uniform Law Commission 60,250 51,864 0 0 0 0 8,386 13.9%AM0 - Department of General Services
Local Fund 0100 335,485,491 208,293,177 48,225,602 1,144,391 16,177,818 65,547,811 61,644,503 18.4%Dedicated Taxes 0110 1,350,000 36,522 0 21,679 0 21,679 1,291,799 95.7%Special Purpose 0600 8,376,988 5,159,567 750,406 10,070 77,339 837,815 2,379,606 28.4%
Financial Status Report - (Operating Expenditures) as of June 30, 2019 E - 1

Government of the District of Columbia FY 2019 Financial Status Reports (as of June 30, 2019) % Monthly Time Elapsed: 75.0%Office of the Chief Financial Officer % Monthly Time Remaining: 25.0%SOURCE: CFOSolve / SOAR** UNAUDITED and UNADJUSTED **(Run Date: Jul 19, 2019)
Agency Summary
Agency Summary By Gross FundsAgency Appn Fund Title Appn
FundRevised Budget ExpendituresEncumbrance ID Advances Pre
EncumbranceTotal
CommitmentsAvailable
Balance% Available
BalanceAM0 - Department of General Services
Revenue Funds ('O'Type)
AM0 - Department of General Services 345,212,479 213,489,266 48,976,007 1,176,140 16,255,157 66,407,305 65,315,909 18.9%AP0 - Office on Asian and Pacific Islander Affairs
Local Fund 0100 871,535 650,781 1 2,370 0 2,371 218,382 25.1%
AP0 - Office on Asian and Pacific Islander Affairs
871,535 650,781 1 2,370 0 2,371 218,382 25.1%
AR0 - Statehood Initiatives
Local Fund 0100 244,595 181,672 0 10,878 0 10,878 52,045 21.3%
AR0 - Statehood Initiatives 244,595 181,672 0 10,878 0 10,878 52,045 21.3%AS0 - Office of Finance and Resource Management
Local Fund 0100 27,122,756 14,862,934 7,600 3,436,960 0 3,444,560 8,815,262 32.5%Special Purpose Revenue Funds ('O'Type)
0600 472,147 126,130 0 0 0 0 346,018 73.3%
AS0 - Office of Finance and Resource Management
27,594,903 14,989,063 7,600 3,436,960 0 3,444,560 9,161,280 33.2%
AT0 - Office of the Chief Financial Officer
Local Fund 0100 135,221,186 95,915,951 5,916,734 1,038,196 3,715,659 10,670,589 28,634,646 21.2%Federal Grant Fund 0200 450,000 369,377 80,623 0 0 80,623 0 0.0%Special Purpose Revenue Funds ('O'Type)
0600 45,430,513 11,495,326 7,231,783 285,028 254,500 7,771,311 26,163,875 57.6%
AT0 - Office of the Chief Financial Officer 181,101,699 107,780,654 13,229,140 1,323,224 3,970,159 18,522,524 54,798,521 30.3%BA0 - Office of the Secretary
Local Fund 0100 3,097,805 2,435,881 40,099 3,017 0 43,116 618,808 20.0%Special Purpose Revenue Funds ('O'Type)
0600 1,100,000 621,520 240,102 0 0 240,102 238,378 21.7%
BA0 - Office of the Secretary 4,197,805 3,057,401 280,201 3,017 0 283,218 857,186 20.4%BD0 - Office of Planning
Local Fund 0100 10,419,508 7,007,442 181,283 522,732 152,600 856,615 2,555,450 24.5%Federal Grant Fund 0200 595,346 412,750 73,686 0 0 73,686 108,910 18.3%Private Grant Fund 0400 35,000 14,219 0 0 0 0 20,781 59.4%Special Purpose Revenue Funds ('O'Type)
0600 250,000 42,426 168,819 19,020 0 187,839 19,735 7.9%
BD0 - Office of Planning 11,299,854 7,476,838 423,788 541,752 152,600 1,118,140 2,704,876 23.9%BE0 - D.C. Department of Human Resources
Local Fund 0100 11,366,116 8,790,326 0 250,841 130,000 380,841 2,194,948 19.3%Special Purpose Revenue Funds ('O'Type)
0600 561,039 419,604 0 0 0 0 141,436 25.2%
BE0 - D.C. Department of Human Resources 11,927,155 9,209,929 0 250,841 130,000 380,841 2,336,384 19.6%BG0 - Employees' Compensation Fund
Local Fund 0100 24,131,582 15,281,349 1,063,211 55,972 0 1,119,183 7,731,051 32.0%
Financial Status Report - (Operating Expenditures) as of June 30, 2019 E - 2

Government of the District of Columbia FY 2019 Financial Status Reports (as of June 30, 2019) % Monthly Time Elapsed: 75.0%Office of the Chief Financial Officer % Monthly Time Remaining: 25.0%SOURCE: CFOSolve / SOAR** UNAUDITED and UNADJUSTED **(Run Date: Jul 19, 2019)
Agency Summary
Agency Summary By Gross FundsAgency Appn Fund Title Appn
FundRevised Budget ExpendituresEncumbrance ID Advances Pre
EncumbranceTotal
CommitmentsAvailable
Balance% Available
BalanceBG0 - Employees' Compensation Fund 24,131,582 15,281,349 1,063,211 55,972 0 1,119,183 7,731,051 32.0%BH0 - Unemployment Compensation Fund
Local Fund 0100 6,201,361 3,676,926 0 0 0 0 2,524,435 40.7%
BH0 - Unemployment Compensation Fund 6,201,361 3,676,926 0 0 0 0 2,524,435 40.7%BJ0 - Office of Zoning
Local Fund 0100 3,116,580 2,041,127 163,907 207,704 25,663 397,274 678,180 21.8%
BJ0 - Office of Zoning 3,116,580 2,041,127 163,907 207,704 25,663 397,274 678,180 21.8%BN0 - Homeland Security and Emergency Management Agency
Local Fund 0100 5,103,405 3,583,747 193,289 102,293 0 295,582 1,224,076 24.0%
Federal Grant Fund 0200 98,038,442 36,232,157 2,881,869 0 1,927,530 4,809,399 56,996,886 58.1%
BN0 - Homeland Security and Emergency Management Agency
103,141,847 39,815,904 3,075,158 102,293 1,927,530 5,104,981 58,220,962 56.4%
BX0 - Commission on the Arts and Humanities
Local Fund 0100 2,861,767 1,188,348 1,587,500 (586) 10,000 1,596,914 76,506 2.7%Dedicated Taxes 0110 28,138,233 18,113,349 6,942,441 1,124,638 141,984 8,209,063 1,815,821 6.5%Federal Grant Fund 0200 713,500 1,574 190,000 0 40,000 230,000 481,926 67.5%Special Purpose Revenue Funds ('O'Type)
0600 199,000 0 0 0 100,000 100,000 99,000 49.7%
BX0 - Commission on the Arts and Humanities
31,912,500 19,303,271 8,719,941 1,124,052 291,984 10,135,977 2,473,252 7.8%
BY0 - Department of Aging and Community Living
Local Fund 0100 38,391,428 24,336,085 11,028,065 551,802 133,089 11,712,956 2,342,386 6.1%Federal Grant Fund 0200 9,464,103 3,499,499 4,402,629 0 0 4,402,629 1,561,975 16.5%Federal Medicaid Payments
0250 2,752,297 1,873,605 0 0 0 0 878,692 31.9%
BY0 - Department of Aging and Community Living
50,607,828 29,709,189 15,430,694 551,802 133,089 16,115,586 4,783,054 9.5%
BZ0 - Mayor’s Office on Latino Affairs
Local Fund 0100 3,403,884 2,095,552 982,357 3,800 0 986,157 322,175 9.5%
BZ0 - Mayor’s Office on Latino Affairs 3,403,884 2,095,552 982,357 3,800 0 986,157 322,175 9.5%CB0 - Office of the Attorney General for the District of Columbia
Local Fund 0100 67,162,926 47,266,100 1,105,043 1,123,126 341,827 2,569,996 17,326,830 25.8%Federal Grant Fund 0200 23,603,730 12,005,960 1,265,521 217,354 3,300 1,486,175 10,111,595 42.8%Private Donations 0450 2,548,461 574,670 420,950 0 0 420,950 1,552,841 60.9%Special Purpose Revenue Funds ('O'Type)
0600 12,819,443 4,109,168 3,604,845 54,777 83,230 3,742,852 4,967,424 38.7%
CB0 - Office of the Attorney General for the District of Columbia
106,134,561 63,955,898 6,396,359 1,395,257 428,357 8,219,973 33,958,690 32.0%
CE0 - District of Columbia Public
Local Fund 0100 64,940,273 41,574,969 5,888,220 478,334 317,416 6,683,970 16,681,333 25.7%Federal Grant Fund 0200 1,107,034 550,783 104,021 4,351 58,881 167,252 388,999 35.1%
Financial Status Report - (Operating Expenditures) as of June 30, 2019 E - 3
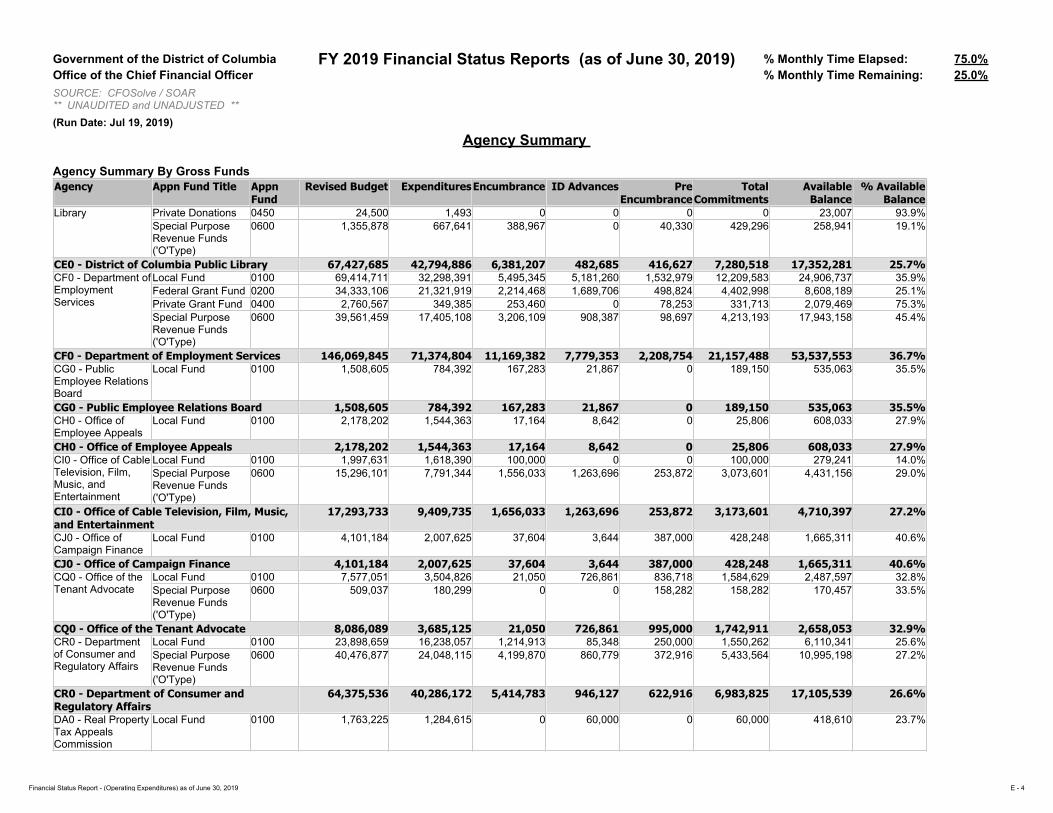
Government of the District of Columbia FY 2019 Financial Status Reports (as of June 30, 2019) % Monthly Time Elapsed: 75.0%Office of the Chief Financial Officer % Monthly Time Remaining: 25.0%SOURCE: CFOSolve / SOAR** UNAUDITED and UNADJUSTED **(Run Date: Jul 19, 2019)
Agency Summary
Agency Summary By Gross FundsAgency Appn Fund Title Appn
FundRevised Budget ExpendituresEncumbrance ID Advances Pre
EncumbranceTotal
CommitmentsAvailable
Balance% Available
BalanceLibrary Private Donations 0450 24,500 1,493 0 0 0 0 23,007 93.9%
Special Purpose Revenue Funds ('O'Type)
0600 1,355,878 667,641 388,967 0 40,330 429,296 258,941 19.1%
CE0 - District of Columbia Public Library 67,427,685 42,794,886 6,381,207 482,685 416,627 7,280,518 17,352,281 25.7%CF0 - Department of Employment Services
Local Fund 0100 69,414,711 32,298,391 5,495,345 5,181,260 1,532,979 12,209,583 24,906,737 35.9%Federal Grant Fund 0200 34,333,106 21,321,919 2,214,468 1,689,706 498,824 4,402,998 8,608,189 25.1%Private Grant Fund 0400 2,760,567 349,385 253,460 0 78,253 331,713 2,079,469 75.3%Special Purpose Revenue Funds ('O'Type)
0600 39,561,459 17,405,108 3,206,109 908,387 98,697 4,213,193 17,943,158 45.4%
CF0 - Department of Employment Services 146,069,845 71,374,804 11,169,382 7,779,353 2,208,754 21,157,488 53,537,553 36.7%CG0 - Public Employee Relations Board
Local Fund 0100 1,508,605 784,392 167,283 21,867 0 189,150 535,063 35.5%
CG0 - Public Employee Relations Board 1,508,605 784,392 167,283 21,867 0 189,150 535,063 35.5%CH0 - Office of Employee Appeals
Local Fund 0100 2,178,202 1,544,363 17,164 8,642 0 25,806 608,033 27.9%
CH0 - Office of Employee Appeals 2,178,202 1,544,363 17,164 8,642 0 25,806 608,033 27.9%CI0 - Office of Cable Television, Film, Music, and Entertainment
Local Fund 0100 1,997,631 1,618,390 100,000 0 0 100,000 279,241 14.0%Special Purpose Revenue Funds ('O'Type)
0600 15,296,101 7,791,344 1,556,033 1,263,696 253,872 3,073,601 4,431,156 29.0%
CI0 - Office of Cable Television, Film, Music, and Entertainment
17,293,733 9,409,735 1,656,033 1,263,696 253,872 3,173,601 4,710,397 27.2%
CJ0 - Office of Campaign Finance
Local Fund 0100 4,101,184 2,007,625 37,604 3,644 387,000 428,248 1,665,311 40.6%
CJ0 - Office of Campaign Finance 4,101,184 2,007,625 37,604 3,644 387,000 428,248 1,665,311 40.6%CQ0 - Office of the Tenant Advocate
Local Fund 0100 7,577,051 3,504,826 21,050 726,861 836,718 1,584,629 2,487,597 32.8%Special Purpose Revenue Funds ('O'Type)
0600 509,037 180,299 0 0 158,282 158,282 170,457 33.5%
CQ0 - Office of the Tenant Advocate 8,086,089 3,685,125 21,050 726,861 995,000 1,742,911 2,658,053 32.9%CR0 - Department of Consumer and Regulatory Affairs
Local Fund 0100 23,898,659 16,238,057 1,214,913 85,348 250,000 1,550,262 6,110,341 25.6%Special Purpose Revenue Funds ('O'Type)
0600 40,476,877 24,048,115 4,199,870 860,779 372,916 5,433,564 10,995,198 27.2%
CR0 - Department of Consumer and Regulatory Affairs
64,375,536 40,286,172 5,414,783 946,127 622,916 6,983,825 17,105,539 26.6%
DA0 - Real Property Tax Appeals Commission
Local Fund 0100 1,763,225 1,284,615 0 60,000 0 60,000 418,610 23.7%
Financial Status Report - (Operating Expenditures) as of June 30, 2019 E - 4

Government of the District of Columbia FY 2019 Financial Status Reports (as of June 30, 2019) % Monthly Time Elapsed: 75.0%Office of the Chief Financial Officer % Monthly Time Remaining: 25.0%SOURCE: CFOSolve / SOAR** UNAUDITED and UNADJUSTED **(Run Date: Jul 19, 2019)
Agency Summary
Agency Summary By Gross FundsAgency Appn Fund Title Appn
FundRevised Budget ExpendituresEncumbrance ID Advances Pre
EncumbranceTotal
CommitmentsAvailable
Balance% Available
BalanceDA0 - Real Property Tax Appeals Commission 1,763,225 1,284,615 0 60,000 0 60,000 418,610 23.7%DB0 - Department of Housing and Community Development
Local Fund 0100 39,124,227 24,003,598 6,452,869 (1,619,658) 7,007,000 11,840,210 3,280,419 8.4%Federal Grant Fund 0200 67,701,480 22,510,885 14,180,716 1,123,059 3,309,019 18,612,794 26,577,801 39.3%Private Donations 0450 20,000 0 7,528 0 0 7,528 12,472 62.4%Special Purpose Revenue Funds ('O'Type)
0600 3,633,812 2,387,540 617,697 212,130 0 829,827 416,445 11.5%
DB0 - Department of Housing and Community Development
110,479,519 48,902,022 21,258,808 (284,469) 10,316,019 31,290,359 30,287,138 27.4%
DH0 - Public Service Commission
Federal Grant Fund 0200 565,555 378,029 627 20,123 0 20,750 166,776 29.5%Private Donations 0450 22,000 7,392 0 0 0 0 14,608 66.4%Special Purpose Revenue Funds ('O'Type)
0600 15,163,455 10,502,748 339,317 514,830 5,313 859,459 3,801,248 25.1%
DH0 - Public Service Commission 15,751,010 10,888,169 339,944 534,953 5,313 880,209 3,982,632 25.3%DJ0 - Office of the People's Counsel
Local Fund 0100 775,069 136,068 37,858 0 0 37,858 601,143 77.6%Special Purpose Revenue Funds ('O'Type)
0600 9,310,586 6,211,992 657,336 338,446 14,621 1,010,403 2,088,191 22.4%
DJ0 - Office of the People's Counsel 10,085,655 6,348,060 695,194 338,446 14,621 1,048,261 2,689,334 26.7%DL0 - Board of Elections
Local Fund 0100 10,956,457 7,958,289 262,931 16,735 671,418 951,084 2,047,084 18.7%Federal Grant Fund 0200 2,822,371 47,384 175,411 0 250,000 425,411 2,349,576 83.2%
DL0 - Board of Elections 13,778,828 8,005,673 438,342 16,735 921,418 1,376,495 4,396,660 31.9%DO0 - Non-Departmental
Local Fund 0100 1,750,000 0 0 0 0 0 1,750,000 100.0%Special Purpose Revenue Funds ('O'Type)
0600 2,171,560 0 0 0 0 0 2,171,560 100.0%
DO0 - Non-Departmental 3,921,560 0 0 0 0 0 3,921,560 100.0%DQ0 - Commission on Judicial Disabilities and Tenure
Federal Payments 0150 295,938 213,353 5,360 10,029 0 15,389 67,196 22.7%
DQ0 - Commission on Judicial Disabilities and Tenure
295,938 213,353 5,360 10,029 0 15,389 67,196 22.7%
DS0 - Repayment of Loans and Interest
Local Fund 0100 735,609,550 693,930,941 0 0 0 0 41,678,609 5.7%Federal Grant Fund 0200 17,524,712 17,524,712 0 0 0 0 0 0.0%Special Purpose Revenue Funds ('O'Type)
0600 5,753,000 5,753,000 0 0 0 0 0 0.0%
DS0 - Repayment of Loans and Interest 758,887,262 717,208,653 0 0 0 0 41,678,609 5.5%DT0 - Repayment of Revenue Bonds
Dedicated Taxes 0110 7,838,539 7,828,539 0 0 0 0 10,000 0.1%
Financial Status Report - (Operating Expenditures) as of June 30, 2019 E - 5
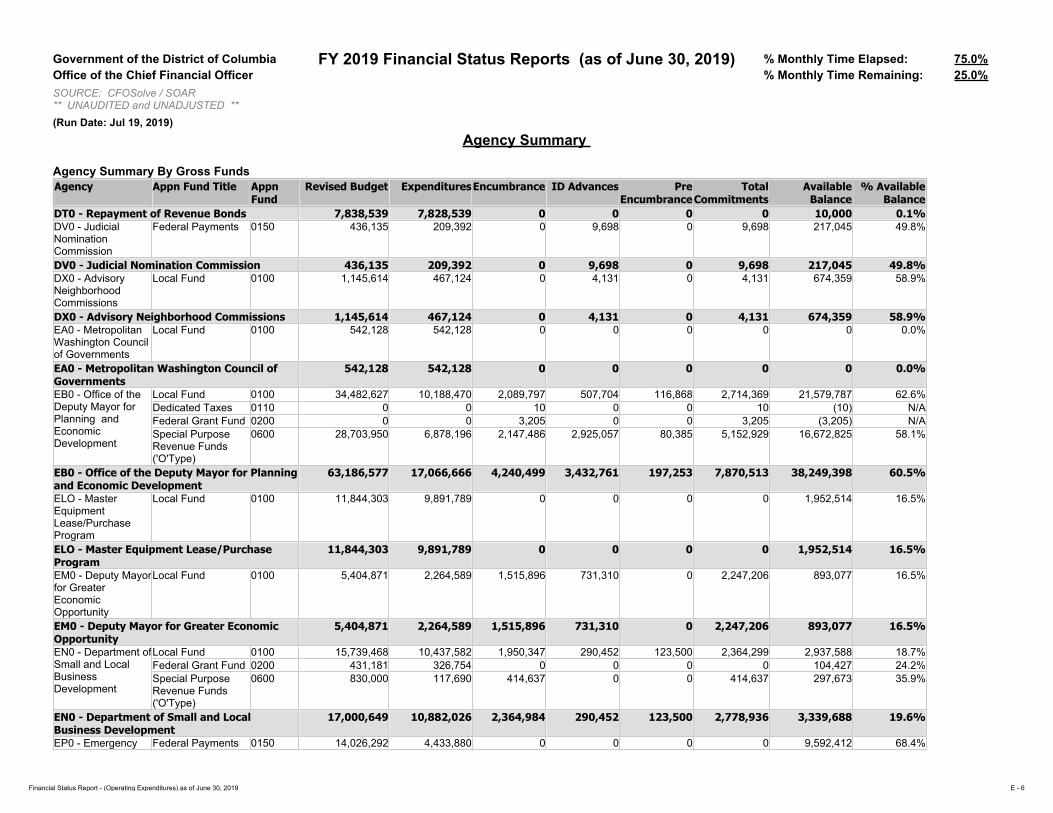
Government of the District of Columbia FY 2019 Financial Status Reports (as of June 30, 2019) % Monthly Time Elapsed: 75.0%Office of the Chief Financial Officer % Monthly Time Remaining: 25.0%SOURCE: CFOSolve / SOAR** UNAUDITED and UNADJUSTED **(Run Date: Jul 19, 2019)
Agency Summary
Agency Summary By Gross FundsAgency Appn Fund Title Appn
FundRevised Budget ExpendituresEncumbrance ID Advances Pre
EncumbranceTotal
CommitmentsAvailable
Balance% Available
BalanceDT0 - Repayment of Revenue Bonds 7,838,539 7,828,539 0 0 0 0 10,000 0.1%DV0 - Judicial Nomination Commission
Federal Payments 0150 436,135 209,392 0 9,698 0 9,698 217,045 49.8%
DV0 - Judicial Nomination Commission 436,135 209,392 0 9,698 0 9,698 217,045 49.8%DX0 - Advisory Neighborhood Commissions
Local Fund 0100 1,145,614 467,124 0 4,131 0 4,131 674,359 58.9%
DX0 - Advisory Neighborhood Commissions 1,145,614 467,124 0 4,131 0 4,131 674,359 58.9%EA0 - Metropolitan Washington Council of Governments
Local Fund 0100 542,128 542,128 0 0 0 0 0 0.0%
EA0 - Metropolitan Washington Council of Governments
542,128 542,128 0 0 0 0 0 0.0%
EB0 - Office of the Deputy Mayor for Planning and Economic Development
Local Fund 0100 34,482,627 10,188,470 2,089,797 507,704 116,868 2,714,369 21,579,787 62.6%Dedicated Taxes 0110 0 0 10 0 0 10 (10) N/AFederal Grant Fund 0200 0 0 3,205 0 0 3,205 (3,205) N/ASpecial Purpose Revenue Funds ('O'Type)
0600 28,703,950 6,878,196 2,147,486 2,925,057 80,385 5,152,929 16,672,825 58.1%
EB0 - Office of the Deputy Mayor for Planning and Economic Development
63,186,577 17,066,666 4,240,499 3,432,761 197,253 7,870,513 38,249,398 60.5%
ELO - Master Equipment Lease/Purchase Program
Local Fund 0100 11,844,303 9,891,789 0 0 0 0 1,952,514 16.5%
ELO - Master Equipment Lease/Purchase Program
11,844,303 9,891,789 0 0 0 0 1,952,514 16.5%
EM0 - Deputy Mayor for Greater Economic Opportunity
Local Fund 0100 5,404,871 2,264,589 1,515,896 731,310 0 2,247,206 893,077 16.5%
EM0 - Deputy Mayor for Greater Economic Opportunity
5,404,871 2,264,589 1,515,896 731,310 0 2,247,206 893,077 16.5%
EN0 - Department of Small and Local Business Development
Local Fund 0100 15,739,468 10,437,582 1,950,347 290,452 123,500 2,364,299 2,937,588 18.7%Federal Grant Fund 0200 431,181 326,754 0 0 0 0 104,427 24.2%Special Purpose Revenue Funds ('O'Type)
0600 830,000 117,690 414,637 0 0 414,637 297,673 35.9%
EN0 - Department of Small and Local Business Development
17,000,649 10,882,026 2,364,984 290,452 123,500 2,778,936 3,339,688 19.6%
EP0 - Emergency Federal Payments 0150 14,026,292 4,433,880 0 0 0 0 9,592,412 68.4%
Financial Status Report - (Operating Expenditures) as of June 30, 2019 E - 6

Government of the District of Columbia FY 2019 Financial Status Reports (as of June 30, 2019) % Monthly Time Elapsed: 75.0%Office of the Chief Financial Officer % Monthly Time Remaining: 25.0%SOURCE: CFOSolve / SOAR** UNAUDITED and UNADJUSTED **(Run Date: Jul 19, 2019)
Agency Summary
Agency Summary By Gross FundsAgency Appn Fund Title Appn
FundRevised Budget ExpendituresEncumbrance ID Advances Pre
EncumbranceTotal
CommitmentsAvailable
Balance% Available
BalancePlanning and Security FundEP0 - Emergency Planning and Security Fund 14,026,292 4,433,880 0 0 0 0 9,592,412 68.4%EZ0 - Convention Center Transfer
Local Fund 0100 350,000 350,000 0 0 0 0 0 0.0%Dedicated Taxes 0110 155,543,045 93,618,698 0 0 0 0 61,924,348 39.8%Special Purpose Revenue Funds ('O'Type)
0600 3,415,469 2,247,511 0 0 0 0 1,167,958 34.2%
EZ0 - Convention Center Transfer 159,308,514 96,216,208 0 0 0 0 63,092,306 39.6%FA0 - Metropolitan Police Department
Local Fund 0100 536,987,690 405,453,918 13,603,700 4,254,784 542,389 18,400,873 113,132,899 21.1%Federal Grant Fund 0200 6,761,739 1,770,371 349,600 203,550 2,158,774 2,711,924 2,279,445 33.7%Private Donations 0450 212,589 69,677 0 0 0 0 142,911 67.2%Special Purpose Revenue Funds ('O'Type)
0600 9,111,468 4,699,217 45,780 0 0 45,780 4,366,472 47.9%
FA0 - Metropolitan Police Department 553,073,486 411,993,183 13,999,079 4,458,334 2,701,163 21,158,576 119,921,726 21.7%FB0 - Fire and Emergency Medical Services Department
Local Fund 0100 274,019,066 206,712,904 7,123,723 1,969,040 762,071 9,854,834 57,451,327 21.0%Federal Grant Fund 0200 807,725 48,833 268,393 0 131,250 399,643 359,249 44.5%Private Donations 0450 1,000 0 0 0 0 0 1,000 100.0%Special Purpose Revenue Funds ('O'Type)
0600 1,762,425 135,057 0 0 0 0 1,627,368 92.3%
FB0 - Fire and Emergency Medical Services Department
276,590,216 206,896,794 7,392,117 1,969,040 893,321 10,254,478 59,438,944 21.5%
FD0 - Police Officers' and Fire Fighters' Retirement System
Local Fund 0100 92,322,000 91,100,089 0 0 0 0 1,221,911 1.3%
FD0 - Police Officers' and Fire Fighters' Retirement System
92,322,000 91,100,089 0 0 0 0 1,221,911 1.3%
FH0 - Office of Police Complaints
Local Fund 0100 2,538,132 1,774,486 18,683 30,966 0 49,649 713,998 28.1%
FH0 - Office of Police Complaints 2,538,132 1,774,486 18,683 30,966 0 49,649 713,998 28.1%FI0 - Corrections Information Council
Local Fund 0100 744,054 412,594 0 512 0 512 330,948 44.5%Private Donations 0450 499 1 0 0 0 0 497 99.7%
FI0 - Corrections Information Council 744,553 412,596 0 512 0 512 331,445 44.5%FJ0 - Criminal Justice Coordinating Council
Local Fund 0100 1,654,930 1,074,547 157,200 18,387 0 175,587 404,796 24.5%Federal Payments 0150 2,580,892 1,424,829 122,534 1,908 0 124,442 1,031,621 40.0%Federal Grant Fund 0200 158,700 24,700 134,000 0 0 134,000 0 0.0%
FJ0 - Criminal Justice Coordinating Council 4,394,521 2,524,075 413,734 20,295 0 434,028 1,436,418 32.7%FK0 - District of Columbia National
Local Fund 0100 4,810,037 3,086,017 459,348 82,010 10,231 551,588 1,172,432 24.4%Federal Payments 0150 703,196 447,358 121,815 0 0 121,815 134,023 19.1%
Financial Status Report - (Operating Expenditures) as of June 30, 2019 E - 7
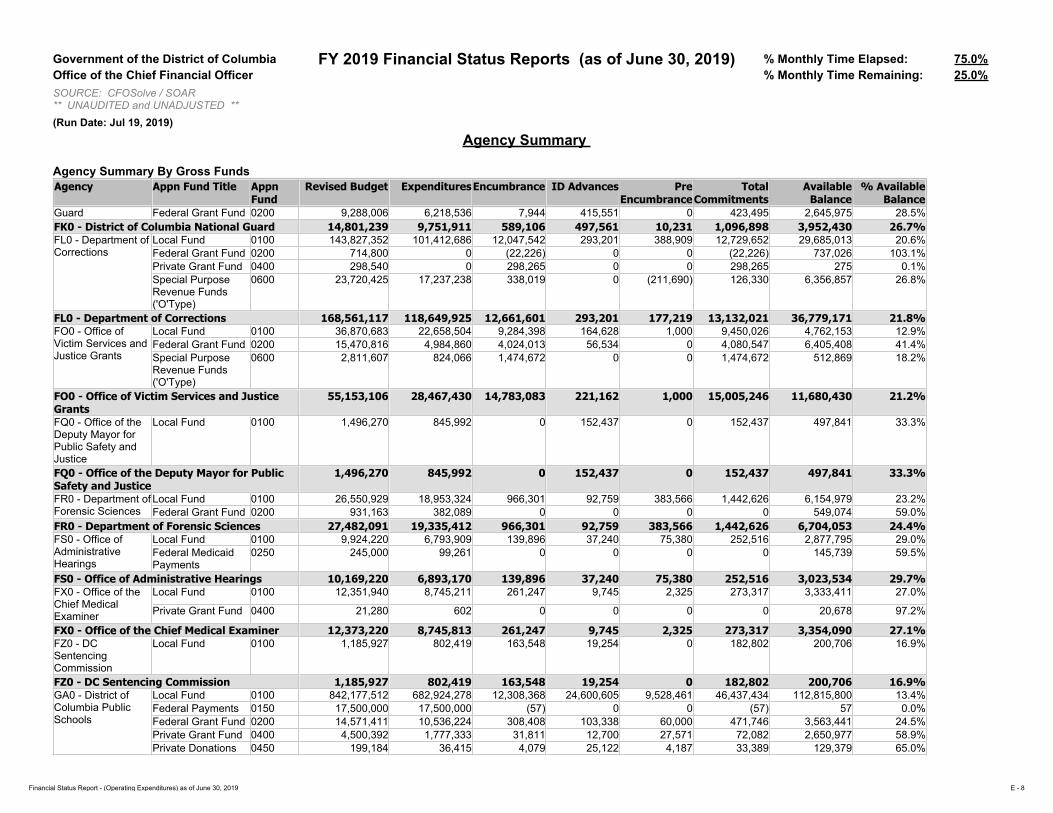
Government of the District of Columbia FY 2019 Financial Status Reports (as of June 30, 2019) % Monthly Time Elapsed: 75.0%Office of the Chief Financial Officer % Monthly Time Remaining: 25.0%SOURCE: CFOSolve / SOAR** UNAUDITED and UNADJUSTED **(Run Date: Jul 19, 2019)
Agency Summary
Agency Summary By Gross FundsAgency Appn Fund Title Appn
FundRevised Budget ExpendituresEncumbrance ID Advances Pre
EncumbranceTotal
CommitmentsAvailable
Balance% Available
BalanceGuard Federal Grant Fund 0200 9,288,006 6,218,536 7,944 415,551 0 423,495 2,645,975 28.5%FK0 - District of Columbia National Guard 14,801,239 9,751,911 589,106 497,561 10,231 1,096,898 3,952,430 26.7%FL0 - Department of Corrections
Local Fund 0100 143,827,352 101,412,686 12,047,542 293,201 388,909 12,729,652 29,685,013 20.6%Federal Grant Fund 0200 714,800 0 (22,226) 0 0 (22,226) 737,026 103.1%Private Grant Fund 0400 298,540 0 298,265 0 0 298,265 275 0.1%Special Purpose Revenue Funds ('O'Type)
0600 23,720,425 17,237,238 338,019 0 (211,690) 126,330 6,356,857 26.8%
FL0 - Department of Corrections 168,561,117 118,649,925 12,661,601 293,201 177,219 13,132,021 36,779,171 21.8%FO0 - Office of Victim Services and Justice Grants
Local Fund 0100 36,870,683 22,658,504 9,284,398 164,628 1,000 9,450,026 4,762,153 12.9%Federal Grant Fund 0200 15,470,816 4,984,860 4,024,013 56,534 0 4,080,547 6,405,408 41.4%Special Purpose Revenue Funds ('O'Type)
0600 2,811,607 824,066 1,474,672 0 0 1,474,672 512,869 18.2%
FO0 - Office of Victim Services and Justice Grants
55,153,106 28,467,430 14,783,083 221,162 1,000 15,005,246 11,680,430 21.2%
FQ0 - Office of the Deputy Mayor for Public Safety and Justice
Local Fund 0100 1,496,270 845,992 0 152,437 0 152,437 497,841 33.3%
FQ0 - Office of the Deputy Mayor for Public Safety and Justice
1,496,270 845,992 0 152,437 0 152,437 497,841 33.3%
FR0 - Department of Forensic Sciences
Local Fund 0100 26,550,929 18,953,324 966,301 92,759 383,566 1,442,626 6,154,979 23.2%Federal Grant Fund 0200 931,163 382,089 0 0 0 0 549,074 59.0%
FR0 - Department of Forensic Sciences 27,482,091 19,335,412 966,301 92,759 383,566 1,442,626 6,704,053 24.4%FS0 - Office of Administrative Hearings
Local Fund 0100 9,924,220 6,793,909 139,896 37,240 75,380 252,516 2,877,795 29.0%Federal Medicaid Payments
0250 245,000 99,261 0 0 0 0 145,739 59.5%
FS0 - Office of Administrative Hearings 10,169,220 6,893,170 139,896 37,240 75,380 252,516 3,023,534 29.7%FX0 - Office of the Chief Medical Examiner
Local Fund 0100 12,351,940 8,745,211 261,247 9,745 2,325 273,317 3,333,411 27.0%
Private Grant Fund 0400 21,280 602 0 0 0 0 20,678 97.2%
FX0 - Office of the Chief Medical Examiner 12,373,220 8,745,813 261,247 9,745 2,325 273,317 3,354,090 27.1%FZ0 - DC Sentencing Commission
Local Fund 0100 1,185,927 802,419 163,548 19,254 0 182,802 200,706 16.9%
FZ0 - DC Sentencing Commission 1,185,927 802,419 163,548 19,254 0 182,802 200,706 16.9%GA0 - District of Columbia Public Schools
Local Fund 0100 842,177,512 682,924,278 12,308,368 24,600,605 9,528,461 46,437,434 112,815,800 13.4%Federal Payments 0150 17,500,000 17,500,000 (57) 0 0 (57) 57 0.0%Federal Grant Fund 0200 14,571,411 10,536,224 308,408 103,338 60,000 471,746 3,563,441 24.5%Private Grant Fund 0400 4,500,392 1,777,333 31,811 12,700 27,571 72,082 2,650,977 58.9%Private Donations 0450 199,184 36,415 4,079 25,122 4,187 33,389 129,379 65.0%
Financial Status Report - (Operating Expenditures) as of June 30, 2019 E - 8

Government of the District of Columbia FY 2019 Financial Status Reports (as of June 30, 2019) % Monthly Time Elapsed: 75.0%Office of the Chief Financial Officer % Monthly Time Remaining: 25.0%SOURCE: CFOSolve / SOAR** UNAUDITED and UNADJUSTED **(Run Date: Jul 19, 2019)
Agency Summary
Agency Summary By Gross FundsAgency Appn Fund Title Appn
FundRevised Budget ExpendituresEncumbrance ID Advances Pre
EncumbranceTotal
CommitmentsAvailable
Balance% Available
BalanceGA0 - District of Columbia Public Schools
Special Purpose Revenue Funds ('O'Type)
0600 19,629,993 9,818,483 2,819,109 448,156 1,092,604 4,359,869 5,451,641 27.8%
GA0 - District of Columbia Public Schools 898,578,492 722,592,734 15,471,718 25,189,921 10,712,823 51,374,462 124,611,296 13.9%GB0 - District of Columbia Public Charter School Board
Special Purpose Revenue Funds ('O'Type)
0600 8,524,878 5,572,186 0 0 0 0 2,952,692 34.6%
GB0 - District of Columbia Public Charter School Board
8,524,878 5,572,186 0 0 0 0 2,952,692 34.6%
GC0 - District of Columbia Public Charter Schools
Local Fund 0100 580,233,970 563,843,080 0 0 0 0 16,390,889 2.8%
GC0 - District of Columbia Public Charter Schools
580,233,970 563,843,080 0 0 0 0 16,390,889 2.8%
GD0 - Office of the State Superintendent of Education
Local Fund 0100 191,366,510 101,004,097 12,349,338 3,961,593 2,083,776 18,394,707 71,967,705 37.6%Dedicated Taxes 0110 6,376,619 4,057,956 250,785 360 0 251,145 2,067,517 32.4%Federal Payments 0150 76,982,613 19,999,984 193,648 575 20,000 214,223 56,768,407 73.7%Federal Grant Fund 0200 277,394,892 108,626,918 4,232,071 1,053,664 1,987,968 7,273,704 161,494,270 58.2%Private Grant Fund 0400 100,000 68,613 0 0 0 0 31,387 31.4%Private Donations 0450 57,000 4,500 9,886 0 5,379 15,264 37,236 65.3%Special Purpose Revenue Funds ('O'Type)
0600 1,175,974 588,041 190,188 0 26,706 216,895 371,039 31.6%
GD0 - Office of the State Superintendent of Education
553,453,608 234,350,110 17,225,916 5,016,192 4,123,830 26,365,938 292,737,560 52.9%
GE0 - D.C. State Board of Education
Local Fund 0100 1,850,066 1,198,309 24,998 42,878 11,600 79,476 572,282 30.9%
GE0 - D.C. State Board of Education 1,850,066 1,198,309 24,998 42,878 11,600 79,476 572,282 30.9%GG0 - University of the District of Columbia Subsidy Account
Local Fund 0100 87,428,491 65,515,118 0 0 0 0 21,913,373 25.1%
GG0 - University of the District of Columbia Subsidy Account
87,428,491 65,515,118 0 0 0 0 21,913,373 25.1%
GL0 - District of Columbia State Athletics Commission
Local Fund 0100 1,189,207 904,267 29,021 (4,398) 0 24,623 260,318 21.9%Special Purpose Revenue Funds ('O'Type)
0600 100,000 19,279 19,100 40,000 0 59,100 21,621 21.6%
GL0 - District of Columbia State Athletics Commission
1,289,207 923,546 48,121 35,602 0 83,723 281,939 21.9%
GN0 - Non-Public Local Fund 0100 63,161,356 40,042,255 0 0 10,405 10,405 23,108,696 36.6%
Financial Status Report - (Operating Expenditures) as of June 30, 2019 E - 9

Government of the District of Columbia FY 2019 Financial Status Reports (as of June 30, 2019) % Monthly Time Elapsed: 75.0%Office of the Chief Financial Officer % Monthly Time Remaining: 25.0%SOURCE: CFOSolve / SOAR** UNAUDITED and UNADJUSTED **(Run Date: Jul 19, 2019)
Agency Summary
Agency Summary By Gross FundsAgency Appn Fund Title Appn
FundRevised Budget ExpendituresEncumbrance ID Advances Pre
EncumbranceTotal
CommitmentsAvailable
Balance% Available
BalanceTuitionGN0 - Non-Public Tuition 63,161,356 40,042,255 0 0 10,405 10,405 23,108,696 36.6%GO0 - Special Education Transportation
Local Fund 0100 98,434,203 75,423,372 0 2,516,920 0 2,516,920 20,493,912 20.8%
GO0 - Special Education Transportation 98,434,203 75,423,372 0 2,516,920 0 2,516,920 20,493,912 20.8%GS0 - Section 103 Judgments - Government Direction and Support
Local Fund 0100 12,916,510 10,863,385 0 0 0 0 2,053,125 15.9%
GS0 - Section 103 Judgments - Government Direction and Support
12,916,510 10,863,385 0 0 0 0 2,053,125 15.9%
GW0 - Office of the Deputy Mayor for Education
Local Fund 0100 17,368,701 15,478,299 53,601 132,169 285,126 470,896 1,419,505 8.2%
Private Donations 0450 169,402 0 0 0 0 0 169,402 100.0%
GW0 - Office of the Deputy Mayor for Education
17,538,103 15,478,299 53,601 132,169 285,126 470,896 1,588,908 9.1%
GX0 - Teachers' Retirement System
Local Fund 0100 53,343,000 53,182,128 0 0 0 0 160,872 0.3%
GX0 - Teachers' Retirement System 53,343,000 53,182,128 0 0 0 0 160,872 0.3%HA0 - Department of Parks and Recreation
Local Fund 0100 54,236,582 35,957,032 951,415 76,340 171,849 1,199,604 17,079,946 31.5%Private Grant Fund 0400 8,000 0 0 0 0 0 8,000 100.0%Private Donations 0450 39,479 8,397 0 1,319 10,000 11,319 19,763 50.1%Special Purpose Revenue Funds ('O'Type)
0600 3,671,257 1,420,075 677,177 142,406 38,796 858,379 1,392,802 37.9%
HA0 - Department of Parks and Recreation 57,955,317 37,385,504 1,628,593 220,064 220,645 2,069,302 18,500,511 31.9%HC0 - Department of Health
Local Fund 0100 86,099,917 51,652,993 22,444,632 2,726,883 743,518 25,915,033 8,531,891 9.9%Federal Payments 0150 3,000,000 3,845,244 3,540,166 0 30,000 3,570,166 (4,415,410) -147.2%Federal Grant Fund 0200 168,250,147 76,862,606 30,128,197 3,431,710 1,853,082 35,412,989 55,974,552 33.3%Federal Medicaid Payments
0250 0 2,230 0 0 0 0 (2,230) N/A
Private Grant Fund 0400 10,977 3,834 0 4,339 0 4,339 2,804 25.5%Special Purpose Revenue Funds ('O'Type)
0600 27,386,714 14,161,811 1,682,885 382,936 2,225,988 4,291,809 8,933,094 32.6%
HC0 - Department of Health 284,747,755 146,528,719 57,795,879 6,545,868 4,852,588 69,194,335 69,024,700 24.2%HG0 - Office of the Deputy Mayor for Health and Human Services
Local Fund 0100 1,782,358 1,241,120 25,140 32,484 0 57,624 483,614 27.1%
Financial Status Report - (Operating Expenditures) as of June 30, 2019 E - 10
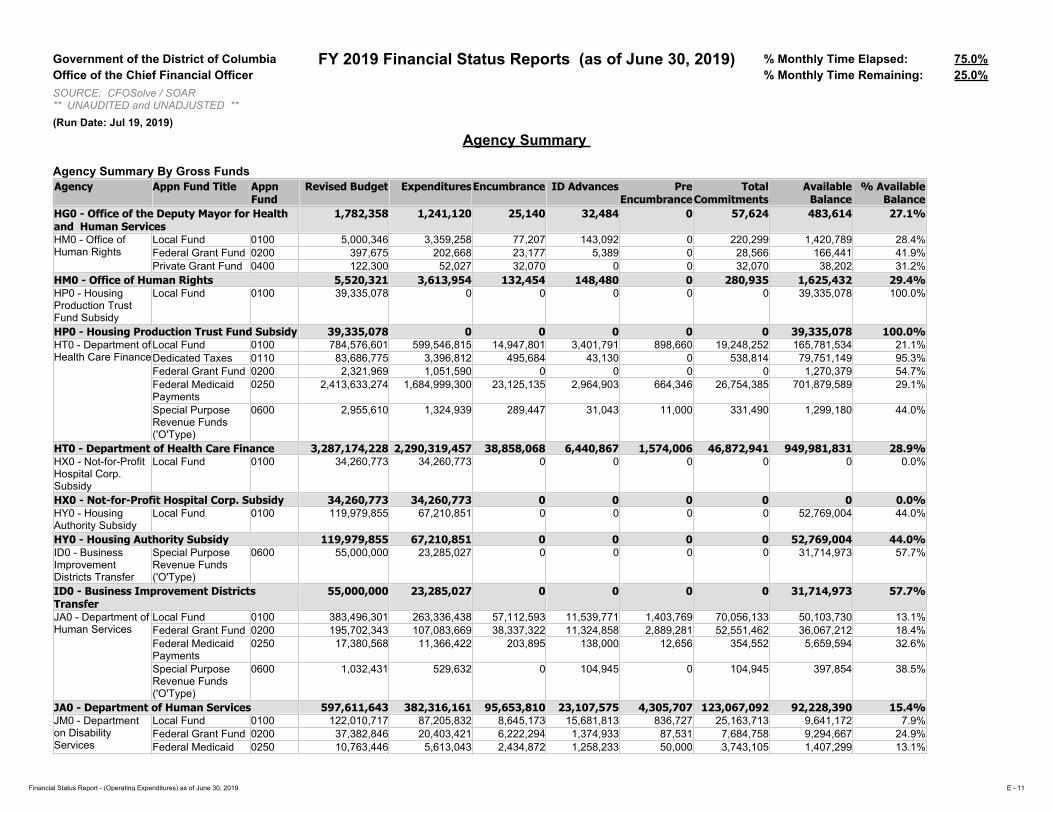
Government of the District of Columbia FY 2019 Financial Status Reports (as of June 30, 2019) % Monthly Time Elapsed: 75.0%Office of the Chief Financial Officer % Monthly Time Remaining: 25.0%SOURCE: CFOSolve / SOAR** UNAUDITED and UNADJUSTED **(Run Date: Jul 19, 2019)
Agency Summary
Agency Summary By Gross FundsAgency Appn Fund Title Appn
FundRevised Budget ExpendituresEncumbrance ID Advances Pre
EncumbranceTotal
CommitmentsAvailable
Balance% Available
BalanceHG0 - Office of the Deputy Mayor for Health and Human Services
1,782,358 1,241,120 25,140 32,484 0 57,624 483,614 27.1%
HM0 - Office of Human Rights
Local Fund 0100 5,000,346 3,359,258 77,207 143,092 0 220,299 1,420,789 28.4%Federal Grant Fund 0200 397,675 202,668 23,177 5,389 0 28,566 166,441 41.9%Private Grant Fund 0400 122,300 52,027 32,070 0 0 32,070 38,202 31.2%
HM0 - Office of Human Rights 5,520,321 3,613,954 132,454 148,480 0 280,935 1,625,432 29.4%HP0 - Housing Production Trust Fund Subsidy
Local Fund 0100 39,335,078 0 0 0 0 0 39,335,078 100.0%
HP0 - Housing Production Trust Fund Subsidy 39,335,078 0 0 0 0 0 39,335,078 100.0%HT0 - Department of Health Care Finance
Local Fund 0100 784,576,601 599,546,815 14,947,801 3,401,791 898,660 19,248,252 165,781,534 21.1%Dedicated Taxes 0110 83,686,775 3,396,812 495,684 43,130 0 538,814 79,751,149 95.3%Federal Grant Fund 0200 2,321,969 1,051,590 0 0 0 0 1,270,379 54.7%Federal Medicaid Payments
0250 2,413,633,274 1,684,999,300 23,125,135 2,964,903 664,346 26,754,385 701,879,589 29.1%
Special Purpose Revenue Funds ('O'Type)
0600 2,955,610 1,324,939 289,447 31,043 11,000 331,490 1,299,180 44.0%
HT0 - Department of Health Care Finance 3,287,174,228 2,290,319,457 38,858,068 6,440,867 1,574,006 46,872,941 949,981,831 28.9%HX0 - Not-for-Profit Hospital Corp. Subsidy
Local Fund 0100 34,260,773 34,260,773 0 0 0 0 0 0.0%
HX0 - Not-for-Profit Hospital Corp. Subsidy 34,260,773 34,260,773 0 0 0 0 0 0.0%HY0 - Housing Authority Subsidy
Local Fund 0100 119,979,855 67,210,851 0 0 0 0 52,769,004 44.0%
HY0 - Housing Authority Subsidy 119,979,855 67,210,851 0 0 0 0 52,769,004 44.0%ID0 - Business Improvement Districts Transfer
Special Purpose Revenue Funds ('O'Type)
0600 55,000,000 23,285,027 0 0 0 0 31,714,973 57.7%
ID0 - Business Improvement Districts Transfer
55,000,000 23,285,027 0 0 0 0 31,714,973 57.7%
JA0 - Department of Human Services
Local Fund 0100 383,496,301 263,336,438 57,112,593 11,539,771 1,403,769 70,056,133 50,103,730 13.1%Federal Grant Fund 0200 195,702,343 107,083,669 38,337,322 11,324,858 2,889,281 52,551,462 36,067,212 18.4%Federal Medicaid Payments
0250 17,380,568 11,366,422 203,895 138,000 12,656 354,552 5,659,594 32.6%
Special Purpose Revenue Funds ('O'Type)
0600 1,032,431 529,632 0 104,945 0 104,945 397,854 38.5%
JA0 - Department of Human Services 597,611,643 382,316,161 95,653,810 23,107,575 4,305,707 123,067,092 92,228,390 15.4%JM0 - Department on Disability Services
Local Fund 0100 122,010,717 87,205,832 8,645,173 15,681,813 836,727 25,163,713 9,641,172 7.9%Federal Grant Fund 0200 37,382,846 20,403,421 6,222,294 1,374,933 87,531 7,684,758 9,294,667 24.9%Federal Medicaid 0250 10,763,446 5,613,043 2,434,872 1,258,233 50,000 3,743,105 1,407,299 13.1%
Financial Status Report - (Operating Expenditures) as of June 30, 2019 E - 11
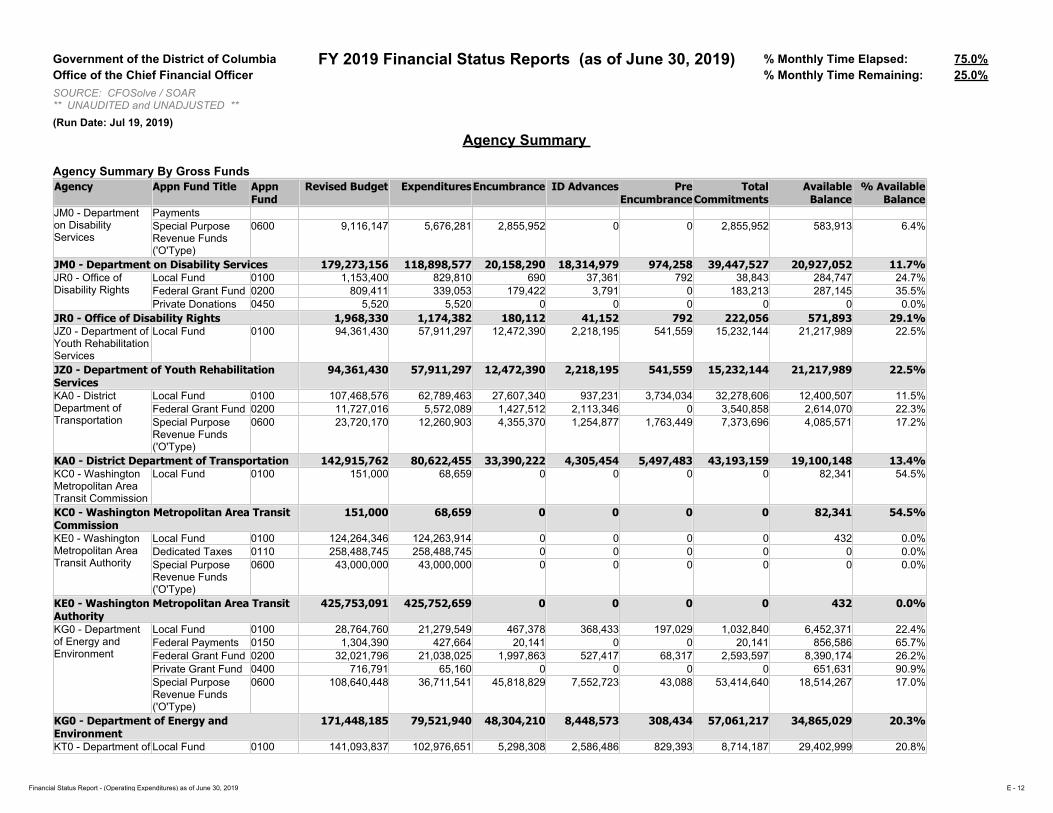
Government of the District of Columbia FY 2019 Financial Status Reports (as of June 30, 2019) % Monthly Time Elapsed: 75.0%Office of the Chief Financial Officer % Monthly Time Remaining: 25.0%SOURCE: CFOSolve / SOAR** UNAUDITED and UNADJUSTED **(Run Date: Jul 19, 2019)
Agency Summary
Agency Summary By Gross FundsAgency Appn Fund Title Appn
FundRevised Budget ExpendituresEncumbrance ID Advances Pre
EncumbranceTotal
CommitmentsAvailable
Balance% Available
BalanceJM0 - Department on Disability Services
PaymentsSpecial Purpose Revenue Funds ('O'Type)
0600 9,116,147 5,676,281 2,855,952 0 0 2,855,952 583,913 6.4%
JM0 - Department on Disability Services 179,273,156 118,898,577 20,158,290 18,314,979 974,258 39,447,527 20,927,052 11.7%JR0 - Office of Disability Rights
Local Fund 0100 1,153,400 829,810 690 37,361 792 38,843 284,747 24.7%Federal Grant Fund 0200 809,411 339,053 179,422 3,791 0 183,213 287,145 35.5%Private Donations 0450 5,520 5,520 0 0 0 0 0 0.0%
JR0 - Office of Disability Rights 1,968,330 1,174,382 180,112 41,152 792 222,056 571,893 29.1%JZ0 - Department of Youth Rehabilitation Services
Local Fund 0100 94,361,430 57,911,297 12,472,390 2,218,195 541,559 15,232,144 21,217,989 22.5%
JZ0 - Department of Youth Rehabilitation Services
94,361,430 57,911,297 12,472,390 2,218,195 541,559 15,232,144 21,217,989 22.5%
KA0 - District Department of Transportation
Local Fund 0100 107,468,576 62,789,463 27,607,340 937,231 3,734,034 32,278,606 12,400,507 11.5%Federal Grant Fund 0200 11,727,016 5,572,089 1,427,512 2,113,346 0 3,540,858 2,614,070 22.3%Special Purpose Revenue Funds ('O'Type)
0600 23,720,170 12,260,903 4,355,370 1,254,877 1,763,449 7,373,696 4,085,571 17.2%
KA0 - District Department of Transportation 142,915,762 80,622,455 33,390,222 4,305,454 5,497,483 43,193,159 19,100,148 13.4%KC0 - Washington Metropolitan Area Transit Commission
Local Fund 0100 151,000 68,659 0 0 0 0 82,341 54.5%
KC0 - Washington Metropolitan Area Transit Commission
151,000 68,659 0 0 0 0 82,341 54.5%
KE0 - Washington Metropolitan Area Transit Authority
Local Fund 0100 124,264,346 124,263,914 0 0 0 0 432 0.0%Dedicated Taxes 0110 258,488,745 258,488,745 0 0 0 0 0 0.0%Special Purpose Revenue Funds ('O'Type)
0600 43,000,000 43,000,000 0 0 0 0 0 0.0%
KE0 - Washington Metropolitan Area Transit Authority
425,753,091 425,752,659 0 0 0 0 432 0.0%
KG0 - Department of Energy and Environment
Local Fund 0100 28,764,760 21,279,549 467,378 368,433 197,029 1,032,840 6,452,371 22.4%Federal Payments 0150 1,304,390 427,664 20,141 0 0 20,141 856,586 65.7%Federal Grant Fund 0200 32,021,796 21,038,025 1,997,863 527,417 68,317 2,593,597 8,390,174 26.2%Private Grant Fund 0400 716,791 65,160 0 0 0 0 651,631 90.9%Special Purpose Revenue Funds ('O'Type)
0600 108,640,448 36,711,541 45,818,829 7,552,723 43,088 53,414,640 18,514,267 17.0%
KG0 - Department of Energy and Environment
171,448,185 79,521,940 48,304,210 8,448,573 308,434 57,061,217 34,865,029 20.3%
KT0 - Department of Local Fund 0100 141,093,837 102,976,651 5,298,308 2,586,486 829,393 8,714,187 29,402,999 20.8%
Financial Status Report - (Operating Expenditures) as of June 30, 2019 E - 12
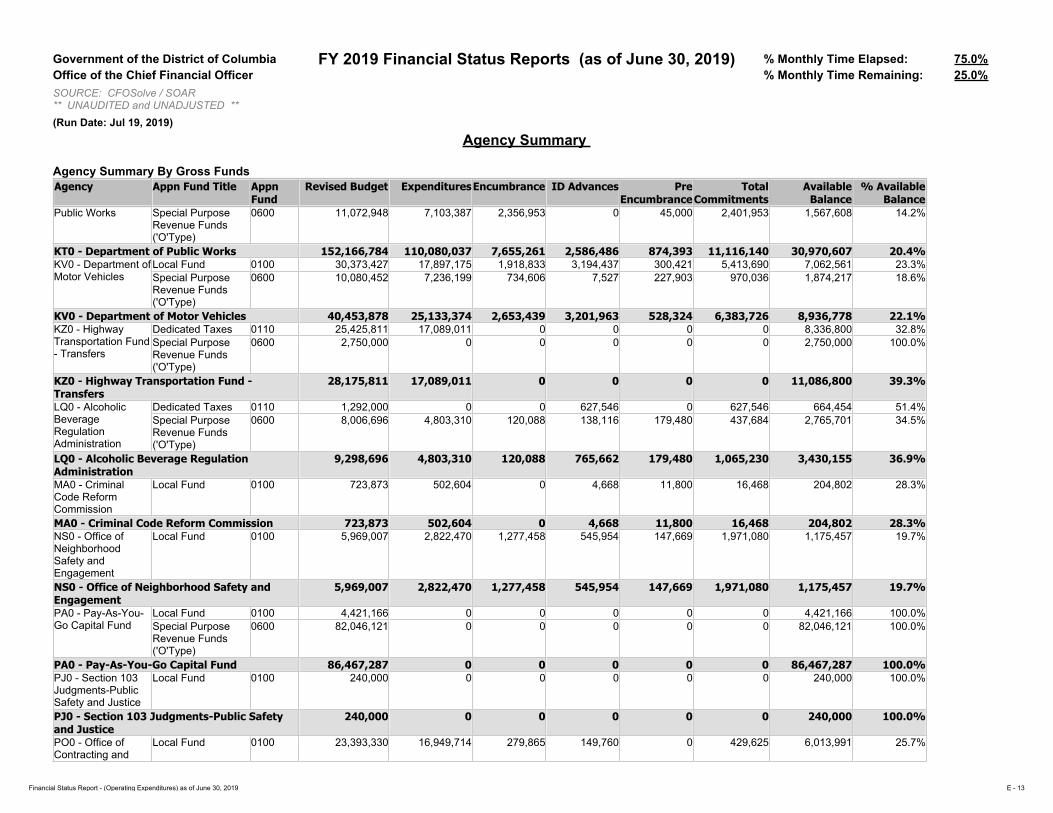
Government of the District of Columbia FY 2019 Financial Status Reports (as of June 30, 2019) % Monthly Time Elapsed: 75.0%Office of the Chief Financial Officer % Monthly Time Remaining: 25.0%SOURCE: CFOSolve / SOAR** UNAUDITED and UNADJUSTED **(Run Date: Jul 19, 2019)
Agency Summary
Agency Summary By Gross FundsAgency Appn Fund Title Appn
FundRevised Budget ExpendituresEncumbrance ID Advances Pre
EncumbranceTotal
CommitmentsAvailable
Balance% Available
BalancePublic Works Special Purpose
Revenue Funds ('O'Type)
0600 11,072,948 7,103,387 2,356,953 0 45,000 2,401,953 1,567,608 14.2%
KT0 - Department of Public Works 152,166,784 110,080,037 7,655,261 2,586,486 874,393 11,116,140 30,970,607 20.4%KV0 - Department of Motor Vehicles
Local Fund 0100 30,373,427 17,897,175 1,918,833 3,194,437 300,421 5,413,690 7,062,561 23.3%Special Purpose Revenue Funds ('O'Type)
0600 10,080,452 7,236,199 734,606 7,527 227,903 970,036 1,874,217 18.6%
KV0 - Department of Motor Vehicles 40,453,878 25,133,374 2,653,439 3,201,963 528,324 6,383,726 8,936,778 22.1%KZ0 - Highway Transportation Fund - Transfers
Dedicated Taxes 0110 25,425,811 17,089,011 0 0 0 0 8,336,800 32.8%Special Purpose Revenue Funds ('O'Type)
0600 2,750,000 0 0 0 0 0 2,750,000 100.0%
KZ0 - Highway Transportation Fund - Transfers
28,175,811 17,089,011 0 0 0 0 11,086,800 39.3%
LQ0 - Alcoholic Beverage Regulation Administration
Dedicated Taxes 0110 1,292,000 0 0 627,546 0 627,546 664,454 51.4%Special Purpose Revenue Funds ('O'Type)
0600 8,006,696 4,803,310 120,088 138,116 179,480 437,684 2,765,701 34.5%
LQ0 - Alcoholic Beverage Regulation Administration
9,298,696 4,803,310 120,088 765,662 179,480 1,065,230 3,430,155 36.9%
MA0 - Criminal Code Reform Commission
Local Fund 0100 723,873 502,604 0 4,668 11,800 16,468 204,802 28.3%
MA0 - Criminal Code Reform Commission 723,873 502,604 0 4,668 11,800 16,468 204,802 28.3%NS0 - Office of Neighborhood Safety and Engagement
Local Fund 0100 5,969,007 2,822,470 1,277,458 545,954 147,669 1,971,080 1,175,457 19.7%
NS0 - Office of Neighborhood Safety and Engagement
5,969,007 2,822,470 1,277,458 545,954 147,669 1,971,080 1,175,457 19.7%
PA0 - Pay-As-You-Go Capital Fund
Local Fund 0100 4,421,166 0 0 0 0 0 4,421,166 100.0%Special Purpose Revenue Funds ('O'Type)
0600 82,046,121 0 0 0 0 0 82,046,121 100.0%
PA0 - Pay-As-You-Go Capital Fund 86,467,287 0 0 0 0 0 86,467,287 100.0%PJ0 - Section 103 Judgments-Public Safety and Justice
Local Fund 0100 240,000 0 0 0 0 0 240,000 100.0%
PJ0 - Section 103 Judgments-Public Safety and Justice
240,000 0 0 0 0 0 240,000 100.0%
PO0 - Office of Contracting and
Local Fund 0100 23,393,330 16,949,714 279,865 149,760 0 429,625 6,013,991 25.7%
Financial Status Report - (Operating Expenditures) as of June 30, 2019 E - 13

Government of the District of Columbia FY 2019 Financial Status Reports (as of June 30, 2019) % Monthly Time Elapsed: 75.0%Office of the Chief Financial Officer % Monthly Time Remaining: 25.0%SOURCE: CFOSolve / SOAR** UNAUDITED and UNADJUSTED **(Run Date: Jul 19, 2019)
Agency Summary
Agency Summary By Gross FundsAgency Appn Fund Title Appn
FundRevised Budget ExpendituresEncumbrance ID Advances Pre
EncumbranceTotal
CommitmentsAvailable
Balance% Available
BalanceProcurement Special Purpose
Revenue Funds ('O'Type)
0600 1,551,764 952,059 156,105 0 0 156,105 443,600 28.6%
PO0 - Office of Contracting and Procurement 24,945,094 17,901,773 435,970 149,760 0 585,730 6,457,591 25.9%RH0 - District Retiree Health Contribution
Local Fund 0100 46,000,000 46,000,000 0 0 0 0 0 0.0%
RH0 - District Retiree Health Contribution 46,000,000 46,000,000 0 0 0 0 0 0.0%RJ0 - Captive Insurance Agency
Local Fund 0100 3,416,691 3,025,642 144,021 338 0 144,359 246,691 7.2%Special Purpose Revenue Funds ('O'Type)
0600 210,811 0 0 6,000 0 6,000 204,811 97.2%
RJ0 - Captive Insurance Agency 3,627,502 3,025,642 144,021 6,338 0 150,359 451,502 12.4%RK0 - D.C. Office of Risk Management
Local Fund 0100 4,102,464 2,560,591 13,298 9,204 0 22,502 1,519,372 37.0%
RK0 - D.C. Office of Risk Management 4,102,464 2,560,591 13,298 9,204 0 22,502 1,519,372 37.0%RL0 - Child and Family Services Agency
Local Fund 0100 161,239,197 108,540,284 10,106,832 3,974,868 1,541,282 15,622,982 37,075,930 23.0%Federal Grant Fund 0200 63,871,056 31,117,730 3,012,864 1,731,526 790,163 5,534,553 27,218,773 42.6%Private Donations 0450 52,486 7,024 0 3,921 0 3,921 41,542 79.1%Special Purpose Revenue Funds ('O'Type)
0600 1,000,000 900,000 0 0 0 0 100,000 10.0%
RL0 - Child and Family Services Agency 226,162,740 140,565,038 13,119,696 5,710,315 2,331,445 21,161,457 64,436,245 28.5%RM0 - Department of Behavioral Health
Local Fund 0100 250,441,173 178,030,296 17,193,874 12,654,392 3,316,718 33,164,983 39,245,893 15.7%Federal Grant Fund 0200 46,116,388 12,424,891 7,152,494 6,642,236 6,959,462 20,754,193 12,937,305 28.1%Federal Medicaid Payments
0250 5,484,576 2,001,050 781,162 70,745 344,189 1,196,096 2,287,430 41.7%
Private Grant Fund 0400 517,448 220,432 57,835 37,879 27,140 122,854 174,162 33.7%Private Donations 0450 288,775 41,808 13,060 103,427 10,200 126,687 120,280 41.7%Special Purpose Revenue Funds ('O'Type)
0600 2,351,648 1,653,239 217,269 (119) 0 217,150 481,259 20.5%
RM0 - Department of Behavioral Health 305,200,008 194,371,716 25,415,694 19,508,561 10,657,708 55,581,963 55,246,329 18.1%SR0 - Department of Insurance, Securities, and Banking
Federal Grant Fund 0200 994,195 257,842 268,772 0 277,959 546,731 189,622 19.1%Private Grant Fund 0400 50,000 0 44,800 0 0 44,800 5,200 10.4%Private Donations 0450 2,500 0 0 0 0 0 2,500 100.0%Special Purpose Revenue Funds ('O'Type)
0600 28,565,477 14,125,332 1,001,796 1,443,352 498,177 2,943,325 11,496,820 40.2%
SR0 - Department of Insurance, Securities, and Banking
29,612,171 14,383,174 1,315,369 1,443,352 776,135 3,534,856 11,694,141 39.5%
TC0 - Department of Local Fund 0100 5,924,444 3,852,625 1,744,524 54,000 0 1,798,524 273,295 4.6%
Financial Status Report - (Operating Expenditures) as of June 30, 2019 E - 14
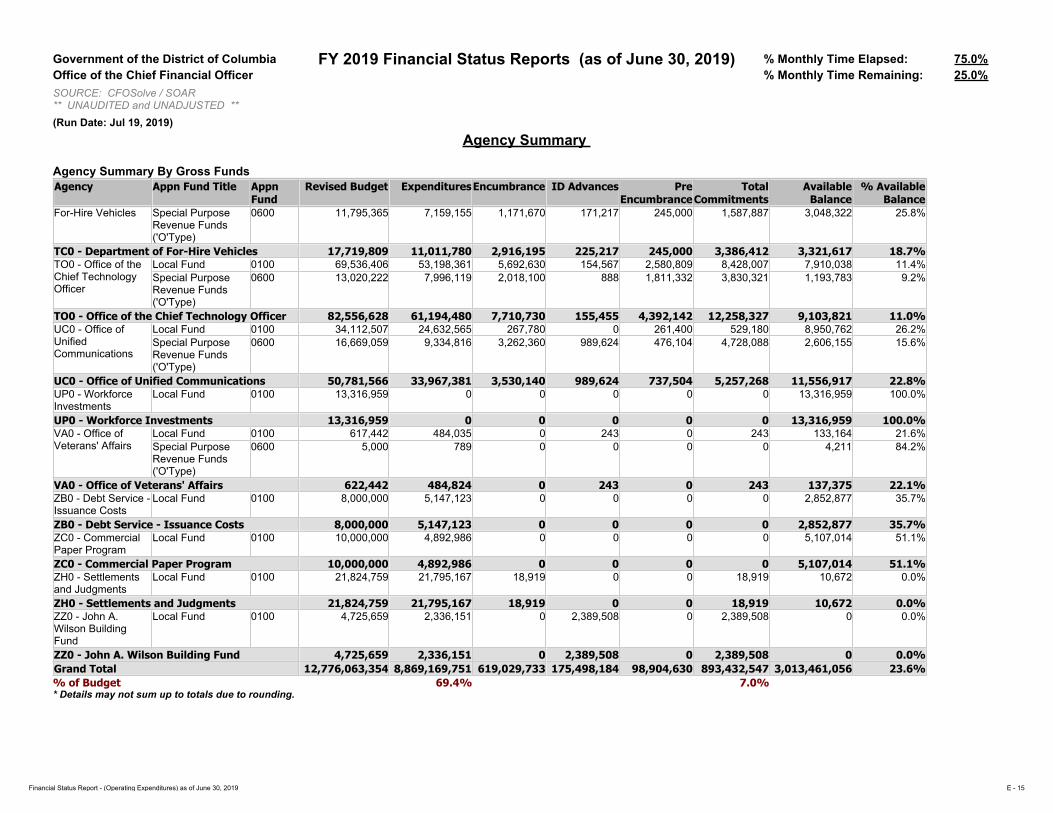
Government of the District of Columbia FY 2019 Financial Status Reports (as of June 30, 2019) % Monthly Time Elapsed: 75.0%Office of the Chief Financial Officer % Monthly Time Remaining: 25.0%SOURCE: CFOSolve / SOAR** UNAUDITED and UNADJUSTED **(Run Date: Jul 19, 2019)
Agency Summary
Agency Summary By Gross FundsAgency Appn Fund Title Appn
FundRevised Budget ExpendituresEncumbrance ID Advances Pre
EncumbranceTotal
CommitmentsAvailable
Balance% Available
BalanceFor-Hire Vehicles Special Purpose
Revenue Funds ('O'Type)
0600 11,795,365 7,159,155 1,171,670 171,217 245,000 1,587,887 3,048,322 25.8%
TC0 - Department of For-Hire Vehicles 17,719,809 11,011,780 2,916,195 225,217 245,000 3,386,412 3,321,617 18.7%TO0 - Office of the Chief Technology Officer
Local Fund 0100 69,536,406 53,198,361 5,692,630 154,567 2,580,809 8,428,007 7,910,038 11.4%Special Purpose Revenue Funds ('O'Type)
0600 13,020,222 7,996,119 2,018,100 888 1,811,332 3,830,321 1,193,783 9.2%
TO0 - Office of the Chief Technology Officer 82,556,628 61,194,480 7,710,730 155,455 4,392,142 12,258,327 9,103,821 11.0%UC0 - Office of Unified Communications
Local Fund 0100 34,112,507 24,632,565 267,780 0 261,400 529,180 8,950,762 26.2%Special Purpose Revenue Funds ('O'Type)
0600 16,669,059 9,334,816 3,262,360 989,624 476,104 4,728,088 2,606,155 15.6%
UC0 - Office of Unified Communications 50,781,566 33,967,381 3,530,140 989,624 737,504 5,257,268 11,556,917 22.8%UP0 - Workforce Investments
Local Fund 0100 13,316,959 0 0 0 0 0 13,316,959 100.0%
UP0 - Workforce Investments 13,316,959 0 0 0 0 0 13,316,959 100.0%VA0 - Office of Veterans' Affairs
Local Fund 0100 617,442 484,035 0 243 0 243 133,164 21.6%Special Purpose Revenue Funds ('O'Type)
0600 5,000 789 0 0 0 0 4,211 84.2%
VA0 - Office of Veterans' Affairs 622,442 484,824 0 243 0 243 137,375 22.1%ZB0 - Debt Service - Issuance Costs
Local Fund 0100 8,000,000 5,147,123 0 0 0 0 2,852,877 35.7%
ZB0 - Debt Service - Issuance Costs 8,000,000 5,147,123 0 0 0 0 2,852,877 35.7%ZC0 - Commercial Paper Program
Local Fund 0100 10,000,000 4,892,986 0 0 0 0 5,107,014 51.1%
ZC0 - Commercial Paper Program 10,000,000 4,892,986 0 0 0 0 5,107,014 51.1%ZH0 - Settlements and Judgments
Local Fund 0100 21,824,759 21,795,167 18,919 0 0 18,919 10,672 0.0%
ZH0 - Settlements and Judgments 21,824,759 21,795,167 18,919 0 0 18,919 10,672 0.0%ZZ0 - John A. Wilson Building Fund
Local Fund 0100 4,725,659 2,336,151 0 2,389,508 0 2,389,508 0 0.0%
ZZ0 - John A. Wilson Building Fund 4,725,659 2,336,151 0 2,389,508 0 2,389,508 0 0.0%Grand Total 12,776,063,354 8,869,169,751 619,029,733 175,498,184 98,904,630 893,432,547 3,013,461,056 23.6%% of Budget 69.4% 7.0%* Details may not sum up to totals due to rounding.
Financial Status Report - (Operating Expenditures) as of June 30, 2019 E - 15

(F) Agency Summary – by Fund Detail

Government of the District of Columbia FY 2019 Financial Status Reports (as of June 30, 2019) % Monthly Time Elapsed: 75.0%Office of the Chief Financial Officer % Monthly Time Remaining: 25.0%SOURCE: CFOSolve / SOAR** UNAUDITED and UNADJUSTED **(Run Date: Jul 19, 2019)
Agency Summary
Agency Summary By Fund Detail
1110 - Federal Payments - Internal
Agency Appn Fund Title Revised Budget
Expenditures Encumbrance ID Advances
Pre Encumbrance
Total Commitments
Available Balance
% Available Balance
GA0 - District of Columbia Public Schools Federal Payments 0 0 (57) 0 0 (57) 57 N/A
Public Education System 0 0 (57) 0 0 (57) 57 N/A
1110 - Federal Payments - Internal 0 0 (57) 0 0 (57) 57 N/A
Financial Status Report - (Operating Expenditures) as of June 30, 2019 F - 1
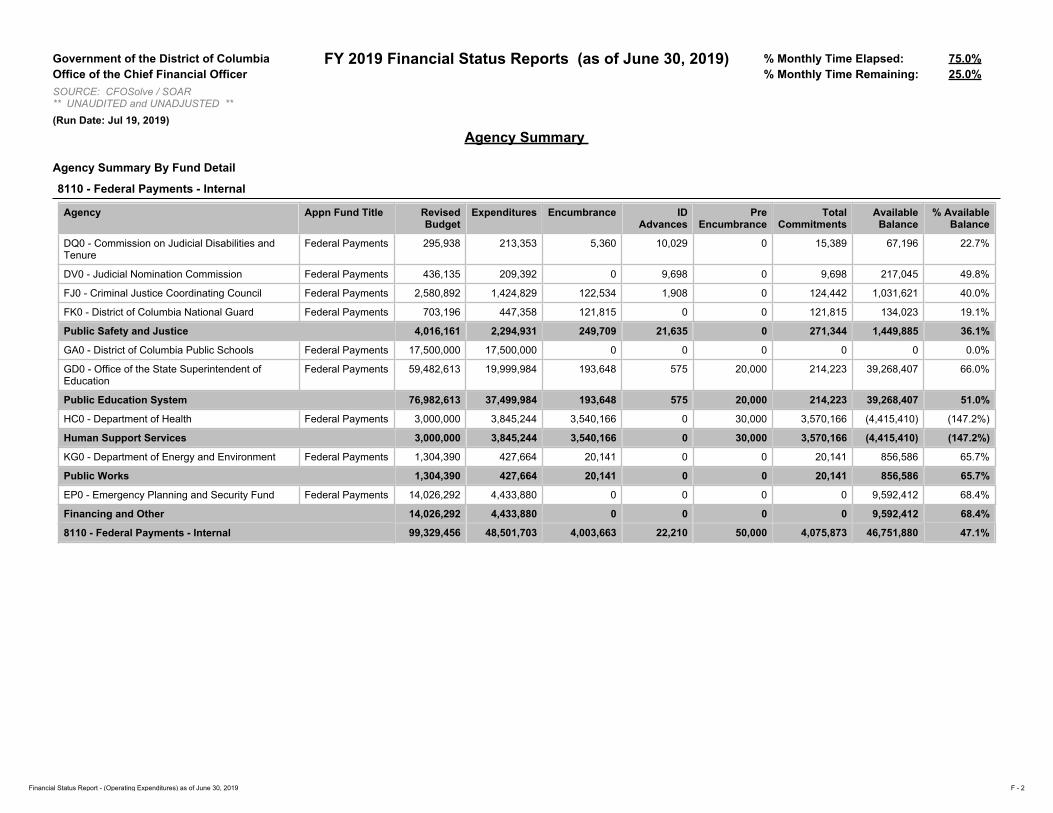
Government of the District of Columbia FY 2019 Financial Status Reports (as of June 30, 2019) % Monthly Time Elapsed: 75.0%Office of the Chief Financial Officer % Monthly Time Remaining: 25.0%SOURCE: CFOSolve / SOAR** UNAUDITED and UNADJUSTED **(Run Date: Jul 19, 2019)
Agency Summary
Agency Summary By Fund Detail
8110 - Federal Payments - Internal
Agency Appn Fund Title Revised Budget
Expenditures Encumbrance ID Advances
Pre Encumbrance
Total Commitments
Available Balance
% Available Balance
DQ0 - Commission on Judicial Disabilities and Tenure
Federal Payments 295,938 213,353 5,360 10,029 0 15,389 67,196 22.7%
DV0 - Judicial Nomination Commission Federal Payments 436,135 209,392 0 9,698 0 9,698 217,045 49.8%
FJ0 - Criminal Justice Coordinating Council Federal Payments 2,580,892 1,424,829 122,534 1,908 0 124,442 1,031,621 40.0%
FK0 - District of Columbia National Guard Federal Payments 703,196 447,358 121,815 0 0 121,815 134,023 19.1%
Public Safety and Justice 4,016,161 2,294,931 249,709 21,635 0 271,344 1,449,885 36.1%
GA0 - District of Columbia Public Schools Federal Payments 17,500,000 17,500,000 0 0 0 0 0 0.0%
GD0 - Office of the State Superintendent of Education
Federal Payments 59,482,613 19,999,984 193,648 575 20,000 214,223 39,268,407 66.0%
Public Education System 76,982,613 37,499,984 193,648 575 20,000 214,223 39,268,407 51.0%
HC0 - Department of Health Federal Payments 3,000,000 3,845,244 3,540,166 0 30,000 3,570,166 (4,415,410) (147.2%)
Human Support Services 3,000,000 3,845,244 3,540,166 0 30,000 3,570,166 (4,415,410) (147.2%)
KG0 - Department of Energy and Environment Federal Payments 1,304,390 427,664 20,141 0 0 20,141 856,586 65.7%
Public Works 1,304,390 427,664 20,141 0 0 20,141 856,586 65.7%
EP0 - Emergency Planning and Security Fund Federal Payments 14,026,292 4,433,880 0 0 0 0 9,592,412 68.4%
Financing and Other 14,026,292 4,433,880 0 0 0 0 9,592,412 68.4%
8110 - Federal Payments - Internal 99,329,456 48,501,703 4,003,663 22,210 50,000 4,075,873 46,751,880 47.1%
Financial Status Report - (Operating Expenditures) as of June 30, 2019 F - 2

Government of the District of Columbia FY 2019 Financial Status Reports (as of June 30, 2019) % Monthly Time Elapsed: 75.0%Office of the Chief Financial Officer % Monthly Time Remaining: 25.0%SOURCE: CFOSolve / SOAR** UNAUDITED and UNADJUSTED **(Run Date: Jul 19, 2019)
Agency Summary
Agency Summary By Fund Detail
8120 - Fed Payments- Dc School Choice Agreement
Agency Appn Fund Title Revised Budget
Expenditures Encumbrance ID Advances
Pre Encumbrance
Total Commitments
Available Balance
% Available Balance
GD0 - Office of the State Superintendent of Education
Federal Payments 17,500,000 0 0 0 0 0 17,500,000 100.0%
Public Education System 17,500,000 0 0 0 0 0 17,500,000 100.0%
8120 - Fed Payments- Dc School Choice Agreement 17,500,000 0 0 0 0 0 17,500,000 100.0%
Financial Status Report - (Operating Expenditures) as of June 30, 2019 F - 3

(G1) Districtwide – by Comptroller Source Group

Government of the District of Columbia FY 2019 Financial Status Reports (as of June 30, 2019) % Monthly Time Elapsed: 75.0%Office of the Chief Financial Officer % Monthly Time Remaining: 25.0%SOURCE: CFOSolve / SOAR** UNAUDITED and UNADJUSTED **(Run Date: Jul 19, 2019)
Districtwide By Comptroller Source Group
General Fund: Gross Funds - Districtwide By Comptroller Source Group
Comp Source Group Revised Budget
Expenditures Encumbrance ID Advances
Pre Encumbrance
Total Commitments
Available Balance
% Available
Balance
%Spent and Obligated as of
June2019
%Spent and Obligated as of
June2018
0011 Regular Pay - Cont Full Time
2,437,761,495 1,834,379,336 0 1,090,127 0 1,090,127 602,292,031 24.7% 75.3% 71.3%
0012 Regular Pay - Other
276,261,962 162,759,295 0 0 0 0 113,502,667 41.1% 58.9% 84.1%
0013 Additional Gross Pay
86,254,825 88,006,266 0 2,630 0 2,630 (1,754,071) (2.0%) 102.0% 87.3%
0014 Fringe Benefits - Curr Personnel
550,900,590 400,132,149 0 68,964 0 68,964 150,699,476 27.4% 72.6% 72.6%
0015 Overtime Pay 79,301,368 87,509,158 0 0 0 0 (8,207,790) (10.4%) 110.4% 109.4%
Personnel Services 3,430,480,240 2,572,786,204 0 1,161,721 0 1,161,721 856,532,314 25.0% 75.0% 73.7%
0020 Supplies And Materials
70,083,047 36,024,802 15,038,780 3,271,734 2,432,163 20,742,677 13,315,569 19.0% 81.0% 76.3%
0030 Energy, Comm. And Bldg Rentals
98,055,291 59,826,141 3,658,012 9,224,770 3,189,555 16,072,337 22,156,813 22.6% 77.4% 81.2%
0031 Telecommunications
39,895,555 20,175,055 157,397 12,109,907 0 12,267,304 7,453,196 18.7% 81.3% 83.0%
0032 Rentals - Land And Structures
145,675,044 120,559,364 0 18,058,793 0 18,058,793 7,056,887 4.8% 95.2% 84.2%
0033 Janitorial Services
60,641 29,465 13,479 69 12,416 25,964 5,212 8.6% 91.4% 59.5%
0034 Security Services
44,034,536 19,470,543 6,632,818 10,078,648 2,786,453 19,497,919 5,066,074 11.5% 88.5% 98.1%
0035 Occupancy Fixed Costs
76,201,715 42,812,457 20,035,845 5,322,096 6,448,022 31,805,963 1,583,295 2.1% 97.9% 96.9%
0040 Other Services And Charges
337,506,029 177,301,504 51,932,319 29,259,541 12,105,914 93,297,773 66,906,751 19.8% 80.2% 75.5%
0041 Contractual Services - Other
885,195,888 401,597,444 241,338,966 32,552,311 41,551,762 315,443,039 168,155,405 19.0% 81.0% 77.8%
0050 Subsidies And Transfers
6,780,470,384 4,653,999,953 266,754,365 52,430,797 20,725,866 339,911,029 1,786,559,402 26.3% 73.7% 71.0%
0070 Equipment & Equipment Rental
62,561,271 19,631,730 13,467,752 2,027,798 9,652,478 25,148,028 17,781,513 28.4% 71.6% 66.2%
Financial Status Report - (Operating Expenditures) as of June 30, 2019 G - 1
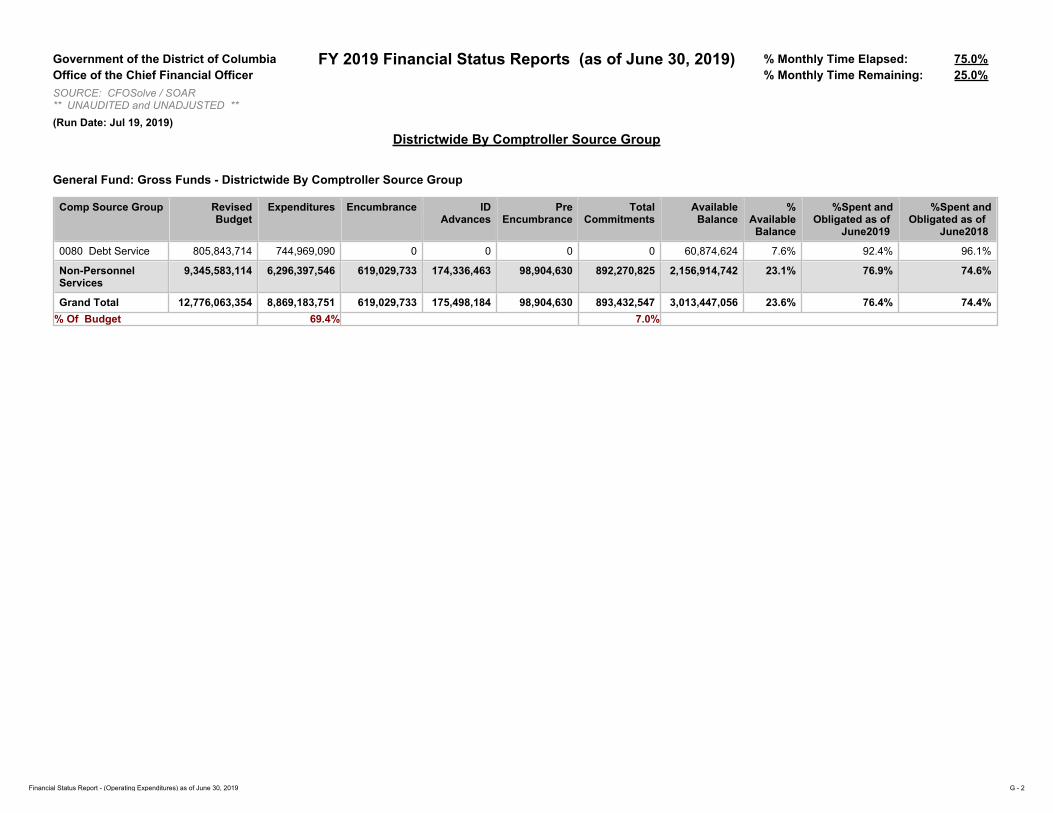
Government of the District of Columbia FY 2019 Financial Status Reports (as of June 30, 2019) % Monthly Time Elapsed: 75.0%Office of the Chief Financial Officer % Monthly Time Remaining: 25.0%SOURCE: CFOSolve / SOAR** UNAUDITED and UNADJUSTED **(Run Date: Jul 19, 2019)
Districtwide By Comptroller Source Group
General Fund: Gross Funds - Districtwide By Comptroller Source Group
Comp Source Group Revised Budget
Expenditures Encumbrance ID Advances
Pre Encumbrance
Total Commitments
Available Balance
% Available
Balance
%Spent and Obligated as of
June2019
%Spent and Obligated as of
June2018
0080 Debt Service 805,843,714 744,969,090 0 0 0 0 60,874,624 7.6% 92.4% 96.1%
Non-Personnel Services
9,345,583,114 6,296,397,546 619,029,733 174,336,463 98,904,630 892,270,825 2,156,914,742 23.1% 76.9% 74.6%
Grand Total 12,776,063,354 8,869,183,751 619,029,733 175,498,184 98,904,630 893,432,547 3,013,447,056 23.6% 76.4% 74.4%% Of Budget 69.4% 7.0%
Financial Status Report - (Operating Expenditures) as of June 30, 2019 G - 2

(G2) Districtwide – by Comptroller Source Group (Budget Only)

Government of the District of Columbia FY 2019 Financial Status Reports (as of June 30, 2019) % Monthly Time Elapsed: 75.0%Office of the Chief Financial Officer % Monthly Time Remaining: 25.0%SOURCE: CFOSolve / SOAR** UNAUDITED and UNADJUSTED **(Run Date: Jul 19, 2019)
Districtwide By Comptroller Source Group(Budget Only)
General Fund: Gross Funds - Districtwide By Comptroller Source Group
GAAP Category Title
Comp Source Group
Local Fund Dedicated Taxes
Federal Payments
Federal Grant Fund
Federal Medicaid
Payments
Private Grant Fund
Private Donations
Special Purpose Revenue Funds
('O'Type)
Grand Total % of Budget
Personnel Services
0011-Regular Pay - Cont Full Time
2,108,147,881 3,314,389 19,318,592 147,359,572 30,850,776 2,736,681 69,065 125,964,539 2,437,761,495 19.1%
0012-Regular Pay - Other
194,604,618 858,748 45,469 43,054,670 5,739,769 715,856 454,400 30,788,433 276,261,962 2.2%
0013-Additional Gross Pay
77,134,547 0 0 1,920,414 0 1,020,800 25,300 6,153,764 86,254,825 0.7%
0014-Fringe Benefits - Curr Personnel
457,672,756 922,810 2,584,073 43,969,994 8,358,959 657,815 112,381 36,621,802 550,900,590 4.3%
0015-Overtime Pay 63,783,625 0 0 2,553,144 3,100 0 0 12,961,499 79,301,368 0.6%
Personnel Services
2,901,343,426 5,095,946 21,948,134 238,857,794 44,952,604 5,131,151 661,146 212,490,038 3,430,480,240 26.9%
Non-Personnel Services
0020-Supplies And Materials
47,438,308 27,100 85,500 16,533,837 176,462 160,268 167,979 5,493,593 70,083,047 0.5%
0030-Energy, Comm. And Bldg Rentals
92,350,747 0 0 3,705,489 114,383 0 0 1,884,672 98,055,291 0.8%
0031-Telecommunications
34,245,335 12,500 12,370 1,795,311 256,200 0 0 3,573,839 39,895,555 0.3%
0032-Rentals - Land And Structures
129,349,545 0 0 5,054,832 2,018,697 0 0 9,251,970 145,675,044 1.1%
0033-Janitorial Services
0 0 0 60,641 0 0 0 0 60,641 0.0%
0034-Security Services
37,713,785 0 0 1,429,231 220,925 0 0 4,670,595 44,034,536 0.3%
0035-Occupancy Fixed Costs
73,214,355 0 0 832,892 261,105 0 0 1,893,363 76,201,715 0.6%
0040-Other Services And Charges
214,656,418 794,164 988,234 46,675,645 4,817,912 2,080,181 2,504,090 64,989,383 337,506,029 2.6%
0041-Contractual Services - Other
499,294,039 5,509,333 5,120,649 112,994,326 91,953,790 1,209,883 55,532 169,058,336 885,195,888 6.9%
Financial Status Report - (Operating Expenditures) as of June 30, 2019 G - 3

Government of the District of Columbia FY 2019 Financial Status Reports (as of June 30, 2019) % Monthly Time Elapsed: 75.0%Office of the Chief Financial Officer % Monthly Time Remaining: 25.0%SOURCE: CFOSolve / SOAR** UNAUDITED and UNADJUSTED **(Run Date: Jul 19, 2019)
Districtwide By Comptroller Source Group(Budget Only)
General Fund: Gross Funds - Districtwide By Comptroller Source Group
GAAP Category Title
Comp Source Group
Local Fund Dedicated Taxes
Federal Payments
Federal Grant Fund
Federal Medicaid
Payments
Private Grant Fund
Private Donations
Special Purpose Revenue Funds
('O'Type)
Grand Total % of Budget
Non-Personnel Services
0050-Subsidies And Transfers
2,871,393,515 548,834,369 88,655,567 691,140,752 2,304,519,702 1,519,413 185,527 274,221,539 6,780,470,384 53.1%
0070-Equipment & Equipment Rental
34,127,200 27,815 19,002 14,022,298 967,382 330,708 69,121 12,997,745 62,561,271 0.5%
0080-Debt Service 774,727,463 7,838,539 0 17,524,712 0 0 0 5,753,000 805,843,714 6.3%
Non-Personnel Services
4,808,510,712 563,043,821 94,881,322 911,769,965 2,405,306,557 5,300,453 2,982,249 553,788,035 9,345,583,114 73.1%
Grand Total 7,709,854,138 568,139,767 116,829,456 1,150,627,759 2,450,259,161 10,431,605 3,643,395 766,278,073 12,776,063,354 100.0%
Financial Status Report - (Operating Expenditures) as of June 30, 2019 G - 4
(G3) Districtwide – by Comptroller Source Group and Fund
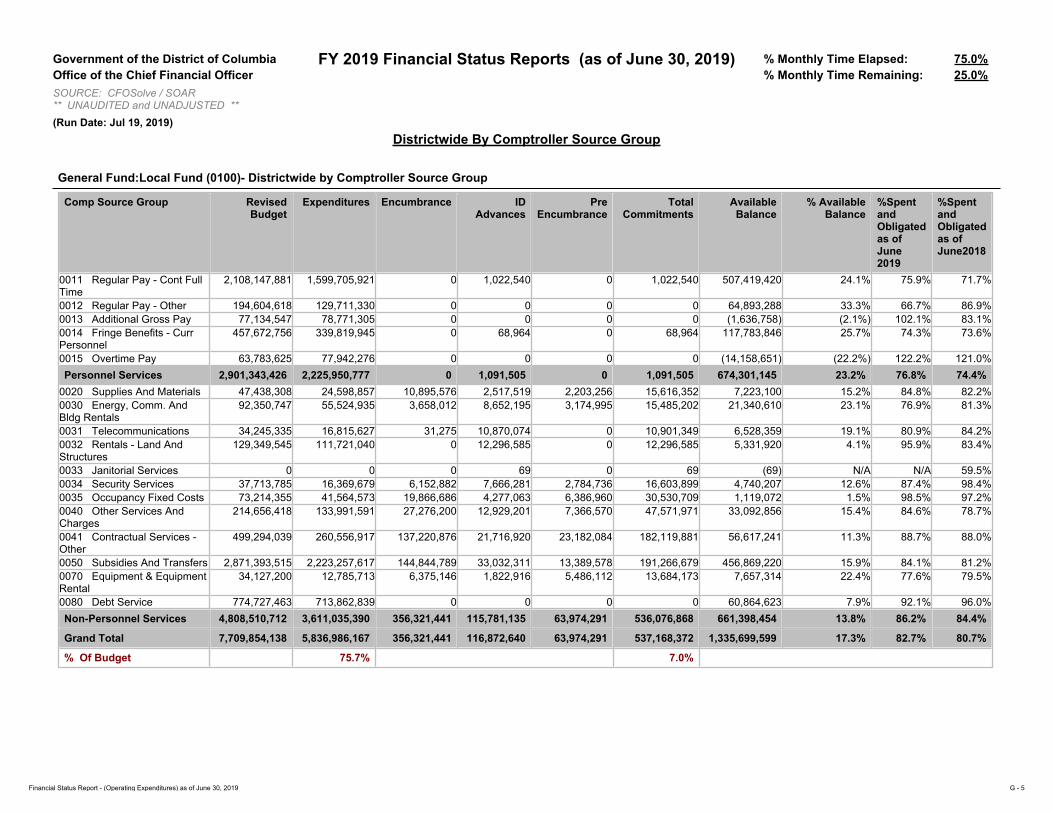
Government of the District of Columbia FY 2019 Financial Status Reports (as of June 30, 2019) % Monthly Time Elapsed: 75.0%Office of the Chief Financial Officer % Monthly Time Remaining: 25.0%SOURCE: CFOSolve / SOAR** UNAUDITED and UNADJUSTED **(Run Date: Jul 19, 2019)
Districtwide By Comptroller Source Group
General Fund:Local Fund (0100)- Districtwide by Comptroller Source Group
Comp Source Group Revised Budget
Expenditures Encumbrance ID Advances
Pre Encumbrance
Total Commitments
Available Balance
% Available Balance
%Spent and Obligated as of June 2019
%Spent and Obligated as of June2018
0011 Regular Pay - Cont Full Time
2,108,147,881 1,599,705,921 0 1,022,540 0 1,022,540 507,419,420 24.1% 75.9% 71.7%
0012 Regular Pay - Other 194,604,618 129,711,330 0 0 0 0 64,893,288 33.3% 66.7% 86.9%0013 Additional Gross Pay 77,134,547 78,771,305 0 0 0 0 (1,636,758) (2.1%) 102.1% 83.1%0014 Fringe Benefits - Curr Personnel
457,672,756 339,819,945 0 68,964 0 68,964 117,783,846 25.7% 74.3% 73.6%
0015 Overtime Pay 63,783,625 77,942,276 0 0 0 0 (14,158,651) (22.2%) 122.2% 121.0%Personnel Services 2,901,343,426 2,225,950,777 0 1,091,505 0 1,091,505 674,301,145 23.2% 76.8% 74.4%
0020 Supplies And Materials 47,438,308 24,598,857 10,895,576 2,517,519 2,203,256 15,616,352 7,223,100 15.2% 84.8% 82.2%0030 Energy, Comm. And Bldg Rentals
92,350,747 55,524,935 3,658,012 8,652,195 3,174,995 15,485,202 21,340,610 23.1% 76.9% 81.3%
0031 Telecommunications 34,245,335 16,815,627 31,275 10,870,074 0 10,901,349 6,528,359 19.1% 80.9% 84.2%0032 Rentals - Land And Structures
129,349,545 111,721,040 0 12,296,585 0 12,296,585 5,331,920 4.1% 95.9% 83.4%
0033 Janitorial Services 0 0 0 69 0 69 (69) N/A N/A 59.5%0034 Security Services 37,713,785 16,369,679 6,152,882 7,666,281 2,784,736 16,603,899 4,740,207 12.6% 87.4% 98.4%0035 Occupancy Fixed Costs 73,214,355 41,564,573 19,866,686 4,277,063 6,386,960 30,530,709 1,119,072 1.5% 98.5% 97.2%0040 Other Services And Charges
214,656,418 133,991,591 27,276,200 12,929,201 7,366,570 47,571,971 33,092,856 15.4% 84.6% 78.7%
0041 Contractual Services - Other
499,294,039 260,556,917 137,220,876 21,716,920 23,182,084 182,119,881 56,617,241 11.3% 88.7% 88.0%
0050 Subsidies And Transfers 2,871,393,515 2,223,257,617 144,844,789 33,032,311 13,389,578 191,266,679 456,869,220 15.9% 84.1% 81.2%0070 Equipment & Equipment Rental
34,127,200 12,785,713 6,375,146 1,822,916 5,486,112 13,684,173 7,657,314 22.4% 77.6% 79.5%
0080 Debt Service 774,727,463 713,862,839 0 0 0 0 60,864,623 7.9% 92.1% 96.0%Non-Personnel Services 4,808,510,712 3,611,035,390 356,321,441 115,781,135 63,974,291 536,076,868 661,398,454 13.8% 86.2% 84.4%
Grand Total 7,709,854,138 5,836,986,167 356,321,441 116,872,640 63,974,291 537,168,372 1,335,699,599 17.3% 82.7% 80.7%
% Of Budget 75.7% 7.0%
Financial Status Report - (Operating Expenditures) as of June 30, 2019 G - 5

Government of the District of Columbia FY 2019 Financial Status Reports (as of June 30, 2019) % Monthly Time Elapsed: 75.0%Office of the Chief Financial Officer % Monthly Time Remaining: 25.0%SOURCE: CFOSolve / SOAR** UNAUDITED and UNADJUSTED **(Run Date: Jul 19, 2019)
Districtwide By Comptroller Source Group
General Fund:Dedicated Taxes (0110)- Districtwide by Comptroller Source Group
Comp Source Group Revised Budget
Expenditures Encumbrance ID Advances
Pre Encumbrance
Total Commitments
Available Balance
% Available Balance
%Spent and Obligated as of June 2019
%Spent and Obligated as of June2018
0011 Regular Pay - Cont Full Time
3,314,389 2,847,583 0 0 0 0 466,806 14.1% 85.9% 76.5%
0012 Regular Pay - Other 858,748 240,130 0 0 0 0 618,618 72.0% 28.0% (1.7%)0014 Fringe Benefits - Curr Personnel
922,810 670,493 0 0 0 0 252,317 27.3% 72.7% 63.6%
Personnel Services 5,095,946 3,792,631 0 0 0 0 1,303,315 25.6% 74.4% 72.8%0020 Supplies And Materials 27,100 10,318 6,688 2,090 0 8,778 8,005 29.5% 70.5% 35.3%0031 Telecommunications 12,500 0 0 9,860 0 9,860 2,640 21.1% 78.9% 0.0%0040 Other Services And Charges
794,164 210,312 218,425 (14,921) 41,984 245,488 338,365 42.6% 57.4% 98.0%
0041 Contractual Services - Other
5,509,333 1,418,545 1,431,928 110,794 85,000 1,627,722 2,463,067 44.7% 55.3% 34.8%
0050 Subsidies And Transfers 548,834,369 389,369,106 6,029,125 1,709,530 0 7,738,655 151,726,608 27.6% 72.4% 57.7%0070 Equipment & Equipment Rental
27,815 183 2,754 0 15,000 17,754 9,878 35.5% 64.5% 0.0%
0080 Debt Service 7,838,539 7,828,539 0 0 0 0 10,000 0.1% 99.9% 99.9%Non-Personnel Services 563,043,821 398,837,001 7,688,920 1,817,353 141,984 9,648,257 154,558,562 27.5% 72.5% 58.4%
Grand Total 568,139,767 402,629,633 7,688,920 1,817,353 141,984 9,648,257 155,861,877 27.4% 72.6% 58.5%
% Of Budget 70.9% 1.7%
Financial Status Report - (Operating Expenditures) as of June 30, 2019 G - 6
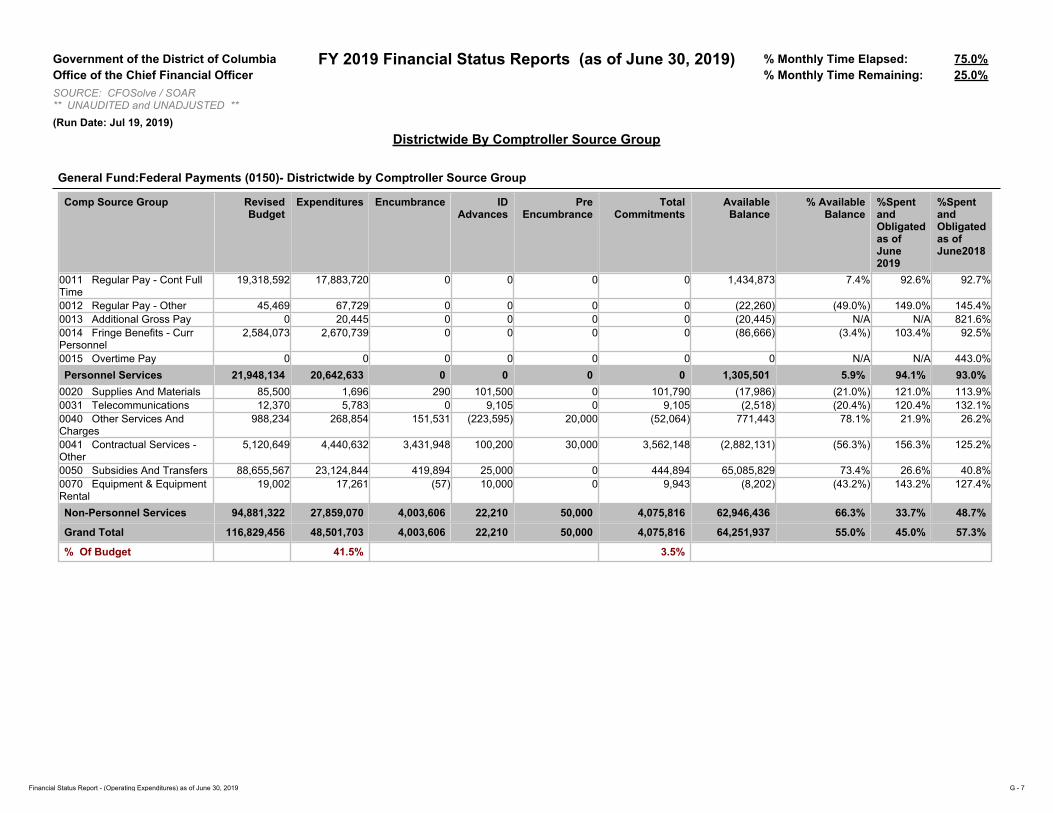
Government of the District of Columbia FY 2019 Financial Status Reports (as of June 30, 2019) % Monthly Time Elapsed: 75.0%Office of the Chief Financial Officer % Monthly Time Remaining: 25.0%SOURCE: CFOSolve / SOAR** UNAUDITED and UNADJUSTED **(Run Date: Jul 19, 2019)
Districtwide By Comptroller Source Group
General Fund:Federal Payments (0150)- Districtwide by Comptroller Source Group
Comp Source Group Revised Budget
Expenditures Encumbrance ID Advances
Pre Encumbrance
Total Commitments
Available Balance
% Available Balance
%Spent and Obligated as of June 2019
%Spent and Obligated as of June2018
0011 Regular Pay - Cont Full Time
19,318,592 17,883,720 0 0 0 0 1,434,873 7.4% 92.6% 92.7%
0012 Regular Pay - Other 45,469 67,729 0 0 0 0 (22,260) (49.0%) 149.0% 145.4%0013 Additional Gross Pay 0 20,445 0 0 0 0 (20,445) N/A N/A 821.6%0014 Fringe Benefits - Curr Personnel
2,584,073 2,670,739 0 0 0 0 (86,666) (3.4%) 103.4% 92.5%
0015 Overtime Pay 0 0 0 0 0 0 0 N/A N/A 443.0%Personnel Services 21,948,134 20,642,633 0 0 0 0 1,305,501 5.9% 94.1% 93.0%
0020 Supplies And Materials 85,500 1,696 290 101,500 0 101,790 (17,986) (21.0%) 121.0% 113.9%0031 Telecommunications 12,370 5,783 0 9,105 0 9,105 (2,518) (20.4%) 120.4% 132.1%0040 Other Services And Charges
988,234 268,854 151,531 (223,595) 20,000 (52,064) 771,443 78.1% 21.9% 26.2%
0041 Contractual Services - Other
5,120,649 4,440,632 3,431,948 100,200 30,000 3,562,148 (2,882,131) (56.3%) 156.3% 125.2%
0050 Subsidies And Transfers 88,655,567 23,124,844 419,894 25,000 0 444,894 65,085,829 73.4% 26.6% 40.8%0070 Equipment & Equipment Rental
19,002 17,261 (57) 10,000 0 9,943 (8,202) (43.2%) 143.2% 127.4%
Non-Personnel Services 94,881,322 27,859,070 4,003,606 22,210 50,000 4,075,816 62,946,436 66.3% 33.7% 48.7%
Grand Total 116,829,456 48,501,703 4,003,606 22,210 50,000 4,075,816 64,251,937 55.0% 45.0% 57.3%
% Of Budget 41.5% 3.5%
Financial Status Report - (Operating Expenditures) as of June 30, 2019 G - 7
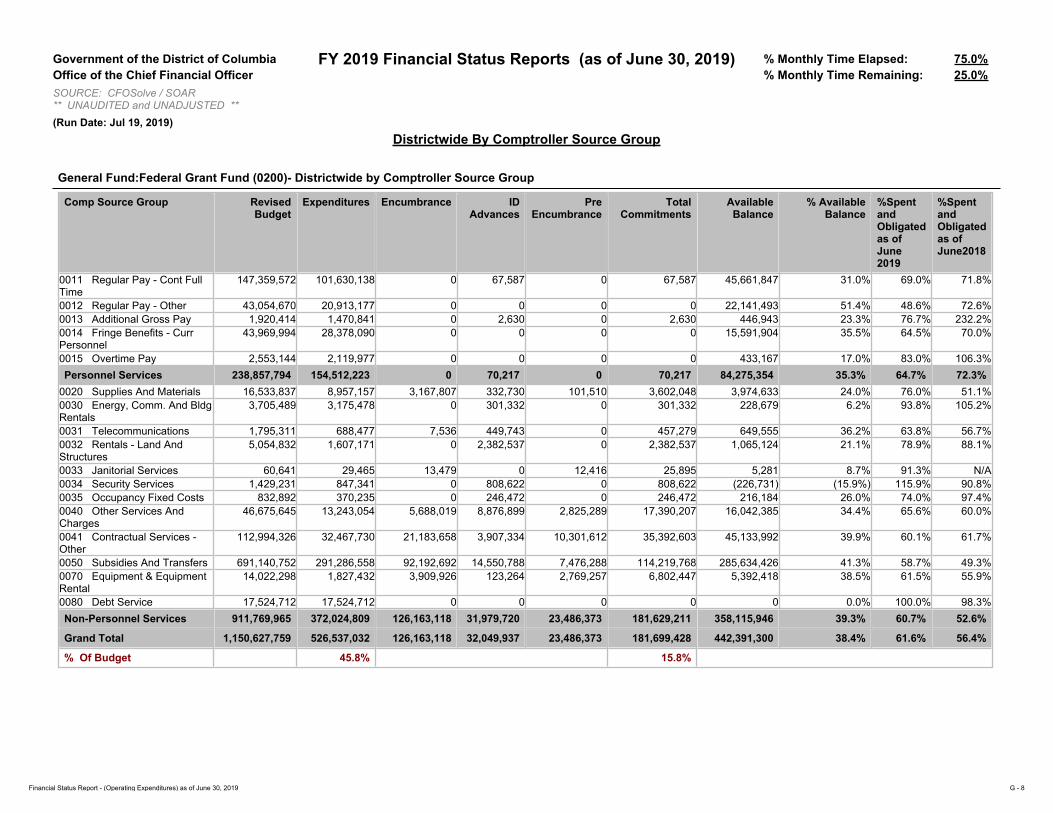
Government of the District of Columbia FY 2019 Financial Status Reports (as of June 30, 2019) % Monthly Time Elapsed: 75.0%Office of the Chief Financial Officer % Monthly Time Remaining: 25.0%SOURCE: CFOSolve / SOAR** UNAUDITED and UNADJUSTED **(Run Date: Jul 19, 2019)
Districtwide By Comptroller Source Group
General Fund:Federal Grant Fund (0200)- Districtwide by Comptroller Source Group
Comp Source Group Revised Budget
Expenditures Encumbrance ID Advances
Pre Encumbrance
Total Commitments
Available Balance
% Available Balance
%Spent and Obligated as of June 2019
%Spent and Obligated as of June2018
0011 Regular Pay - Cont Full Time
147,359,572 101,630,138 0 67,587 0 67,587 45,661,847 31.0% 69.0% 71.8%
0012 Regular Pay - Other 43,054,670 20,913,177 0 0 0 0 22,141,493 51.4% 48.6% 72.6%0013 Additional Gross Pay 1,920,414 1,470,841 0 2,630 0 2,630 446,943 23.3% 76.7% 232.2%0014 Fringe Benefits - Curr Personnel
43,969,994 28,378,090 0 0 0 0 15,591,904 35.5% 64.5% 70.0%
0015 Overtime Pay 2,553,144 2,119,977 0 0 0 0 433,167 17.0% 83.0% 106.3%Personnel Services 238,857,794 154,512,223 0 70,217 0 70,217 84,275,354 35.3% 64.7% 72.3%
0020 Supplies And Materials 16,533,837 8,957,157 3,167,807 332,730 101,510 3,602,048 3,974,633 24.0% 76.0% 51.1%0030 Energy, Comm. And Bldg Rentals
3,705,489 3,175,478 0 301,332 0 301,332 228,679 6.2% 93.8% 105.2%
0031 Telecommunications 1,795,311 688,477 7,536 449,743 0 457,279 649,555 36.2% 63.8% 56.7%0032 Rentals - Land And Structures
5,054,832 1,607,171 0 2,382,537 0 2,382,537 1,065,124 21.1% 78.9% 88.1%
0033 Janitorial Services 60,641 29,465 13,479 0 12,416 25,895 5,281 8.7% 91.3% N/A0034 Security Services 1,429,231 847,341 0 808,622 0 808,622 (226,731) (15.9%) 115.9% 90.8%0035 Occupancy Fixed Costs 832,892 370,235 0 246,472 0 246,472 216,184 26.0% 74.0% 97.4%0040 Other Services And Charges
46,675,645 13,243,054 5,688,019 8,876,899 2,825,289 17,390,207 16,042,385 34.4% 65.6% 60.0%
0041 Contractual Services - Other
112,994,326 32,467,730 21,183,658 3,907,334 10,301,612 35,392,603 45,133,992 39.9% 60.1% 61.7%
0050 Subsidies And Transfers 691,140,752 291,286,558 92,192,692 14,550,788 7,476,288 114,219,768 285,634,426 41.3% 58.7% 49.3%0070 Equipment & Equipment Rental
14,022,298 1,827,432 3,909,926 123,264 2,769,257 6,802,447 5,392,418 38.5% 61.5% 55.9%
0080 Debt Service 17,524,712 17,524,712 0 0 0 0 0 0.0% 100.0% 98.3%Non-Personnel Services 911,769,965 372,024,809 126,163,118 31,979,720 23,486,373 181,629,211 358,115,946 39.3% 60.7% 52.6%
Grand Total 1,150,627,759 526,537,032 126,163,118 32,049,937 23,486,373 181,699,428 442,391,300 38.4% 61.6% 56.4%
% Of Budget 45.8% 15.8%
Financial Status Report - (Operating Expenditures) as of June 30, 2019 G - 8

Government of the District of Columbia FY 2019 Financial Status Reports (as of June 30, 2019) % Monthly Time Elapsed: 75.0%Office of the Chief Financial Officer % Monthly Time Remaining: 25.0%SOURCE: CFOSolve / SOAR** UNAUDITED and UNADJUSTED **(Run Date: Jul 19, 2019)
Districtwide By Comptroller Source Group
General Fund:Federal Medicaid Payments (0250)- Districtwide by Comptroller Source Group
Comp Source Group Revised Budget
Expenditures Encumbrance ID Advances
Pre Encumbrance
Total Commitments
Available Balance
% Available Balance
%Spent and Obligated as of June 2019
%Spent and Obligated as of June2018
0011 Regular Pay - Cont Full Time
30,850,776 21,639,690 0 0 0 0 9,211,086 29.9% 70.1% 67.8%
0012 Regular Pay - Other 5,739,769 1,757,845 0 0 0 0 3,981,924 69.4% 30.6% 34.8%0014 Fringe Benefits - Curr Personnel
8,358,959 5,441,308 0 0 0 0 2,917,651 34.9% 65.1% 58.0%
0015 Overtime Pay 3,100 549,427 0 0 0 0 (546,327) (17,623.5%) 17,723.5% 13,072.6%Personnel Services 44,952,604 29,533,440 0 0 0 0 15,419,164 34.3% 65.7% 59.9%
0020 Supplies And Materials 176,462 44,588 54,723 42,526 0 97,250 34,625 19.6% 80.4% 81.7%0030 Energy, Comm. And Bldg Rentals
114,383 77,731 0 39,377 0 39,377 (2,726) (2.4%) 102.4% 105.6%
0031 Telecommunications 256,200 187,033 0 195,831 0 195,831 (126,665) (49.4%) 149.4% 91.6%0032 Rentals - Land And Structures
2,018,697 773,021 0 1,245,676 0 1,245,676 0 0.0% 100.0% 100.0%
0034 Security Services 220,925 504,280 0 162,466 0 162,466 (445,821) (201.8%) 301.8% 104.7%0035 Occupancy Fixed Costs 261,105 122,318 0 106,368 0 106,368 32,419 12.4% 87.6% 103.2%0040 Other Services And Charges
4,817,912 1,833,713 526,937 233,018 335,447 1,095,402 1,888,797 39.2% 60.8% 33.7%
0041 Contractual Services - Other
91,953,790 41,624,996 21,256,015 2,380,312 724,834 24,361,162 25,967,632 28.2% 71.8% 63.0%
0050 Subsidies And Transfers 2,304,519,702 1,630,810,909 4,511,139 0 0 4,511,139 669,197,654 29.0% 71.0% 69.5%0070 Equipment & Equipment Rental
967,382 442,883 196,249 26,308 10,910 233,467 291,032 30.1% 69.9% 29.1%
Non-Personnel Services 2,405,306,557 1,676,421,472 26,545,064 4,431,882 1,071,191 32,048,137 696,836,948 29.0% 71.0% 69.1%
Grand Total 2,450,259,161 1,705,954,911 26,545,064 4,431,882 1,071,191 32,048,137 712,256,113 29.1% 70.9% 68.9%
% Of Budget 69.6% 1.3%
Financial Status Report - (Operating Expenditures) as of June 30, 2019 G - 9

Government of the District of Columbia FY 2019 Financial Status Reports (as of June 30, 2019) % Monthly Time Elapsed: 75.0%Office of the Chief Financial Officer % Monthly Time Remaining: 25.0%SOURCE: CFOSolve / SOAR** UNAUDITED and UNADJUSTED **(Run Date: Jul 19, 2019)
Districtwide By Comptroller Source Group
General Fund:Private Grant Fund (0400)- Districtwide by Comptroller Source Group
Comp Source Group Revised Budget
Expenditures Encumbrance ID Advances
Pre Encumbrance
Total Commitments
Available Balance
% Available Balance
%Spent and Obligated as of June 2019
%Spent and Obligated as of June2018
0011 Regular Pay - Cont Full Time
2,736,681 1,067,090 0 0 0 0 1,669,591 61.0% 39.0% 55.3%
0012 Regular Pay - Other 715,856 611,777 0 0 0 0 104,079 14.5% 85.5% 38.7%0013 Additional Gross Pay 1,020,800 407,460 0 0 0 0 613,340 60.1% 39.9% 139.2%0014 Fringe Benefits - Curr Personnel
657,815 326,154 0 0 0 0 331,662 50.4% 49.6% 44.7%
Personnel Services 5,131,151 2,412,839 0 0 0 0 2,718,313 53.0% 47.0% 56.4%0020 Supplies And Materials 160,268 6,692 14,363 11,700 22,674 48,736 104,840 65.4% 34.6% 26.5%0040 Other Services And Charges
2,080,181 380,925 255,996 38,218 40,459 334,673 1,364,583 65.6% 34.4% 65.4%
0041 Contractual Services - Other
1,209,883 164,223 186,190 11,324 15,927 213,441 832,220 68.8% 31.2% 42.8%
0050 Subsidies And Transfers 1,519,413 22,875 247,562 0 0 247,562 1,248,976 82.2% 17.8% 15.7%0070 Equipment & Equipment Rental
330,708 97,437 14,130 3,222 59,545 76,897 156,374 47.3% 52.7% 39.2%
Non-Personnel Services 5,300,453 672,152 718,242 64,463 138,604 921,309 3,706,992 69.9% 30.1% 49.4%
Grand Total 10,431,605 3,084,991 718,242 64,463 138,604 921,309 6,425,305 61.6% 38.4% 51.9%
% Of Budget 29.6% 8.8%
Financial Status Report - (Operating Expenditures) as of June 30, 2019 G - 10

Government of the District of Columbia FY 2019 Financial Status Reports (as of June 30, 2019) % Monthly Time Elapsed: 75.0%Office of the Chief Financial Officer % Monthly Time Remaining: 25.0%SOURCE: CFOSolve / SOAR** UNAUDITED and UNADJUSTED **(Run Date: Jul 19, 2019)
Districtwide By Comptroller Source Group
General Fund:Private Donations (0450)- Districtwide by Comptroller Source Group
Comp Source Group Revised Budget
Expenditures Encumbrance ID Advances
Pre Encumbrance
Total Commitments
Available Balance
% Available Balance
%Spent and Obligated as of June 2019
%Spent and Obligated as of June2018
0011 Regular Pay - Cont Full Time
69,065 8,696 0 0 0 0 60,369 87.4% 12.6% 65.6%
0012 Regular Pay - Other 454,400 193,366 0 0 0 0 261,035 57.4% 42.6% 75.3%0013 Additional Gross Pay 25,300 6,036 0 0 0 0 19,264 76.1% 23.9% 51.6%0014 Fringe Benefits - Curr Personnel
112,381 31,055 0 0 0 0 81,326 72.4% 27.6% 54.1%
Personnel Services 661,146 239,337 0 0 0 0 421,809 63.8% 36.2% 68.1%0020 Supplies And Materials 167,979 31,382 11,511 39,480 8,581 59,571 77,025 45.9% 54.1% 38.3%0040 Other Services And Charges
2,504,090 468,682 443,992 77,098 11,186 532,276 1,503,132 60.0% 40.0% 26.7%
0041 Contractual Services - Other
55,532 11,795 0 0 10,000 10,000 33,737 60.8% 39.2% 58.7%
0050 Subsidies And Transfers 185,527 1,293 0 4,832 0 4,832 179,402 96.7% 3.3% 89.3%0070 Equipment & Equipment Rental
69,121 4,408 0 12,379 0 12,379 52,334 75.7% 24.3% 66.8%
Non-Personnel Services 2,982,249 517,561 455,503 133,789 29,766 619,058 1,845,630 61.9% 38.1% 47.1%
Grand Total 3,643,395 756,897 455,503 133,789 29,766 619,058 2,267,439 62.2% 37.8% 57.1%
% Of Budget 20.8% 17.0%
Financial Status Report - (Operating Expenditures) as of June 30, 2019 G - 11

Government of the District of Columbia FY 2019 Financial Status Reports (as of June 30, 2019) % Monthly Time Elapsed: 75.0%Office of the Chief Financial Officer % Monthly Time Remaining: 25.0%SOURCE: CFOSolve / SOAR** UNAUDITED and UNADJUSTED **(Run Date: Jul 19, 2019)
Districtwide By Comptroller Source Group
General Fund:Special Purpose Revenue Funds ('O'Type) (0600)- Districtwide by Comptroller Source Group
Comp Source Group Revised Budget
Expenditures Encumbrance ID Advances
Pre Encumbrance
Total Commitments
Available Balance
% Available Balance
%Spent and Obligated as of June 2019
%Spent and Obligated as of June2018
0011 Regular Pay - Cont Full Time
125,964,539 89,596,500 0 0 0 0 36,368,039 28.9% 71.1% 61.9%
0012 Regular Pay - Other 30,788,433 9,263,941 0 0 0 0 21,524,492 69.9% 30.1% 117.3%0013 Additional Gross Pay 6,153,764 7,150,804 0 0 0 0 (997,040) (16.2%) 116.2% 520.3%0014 Fringe Benefits - Curr Personnel
36,621,802 22,794,364 0 0 0 0 13,827,438 37.8% 62.2% 66.8%
0015 Overtime Pay 12,961,499 6,896,715 0 0 0 0 6,064,784 46.8% 53.2% 45.2%Personnel Services 212,490,038 135,702,324 0 0 0 0 76,787,714 36.1% 63.9% 67.2%
0020 Supplies And Materials 5,493,593 2,374,113 887,822 224,189 96,142 1,208,153 1,911,327 34.8% 65.2% 85.7%0030 Energy, Comm. And Bldg Rentals
1,884,672 1,047,997 0 231,866 14,560 246,426 590,249 31.3% 68.7% 67.6%
0031 Telecommunications 3,573,839 2,478,135 118,586 575,294 0 693,880 401,825 11.2% 88.8% 80.4%0032 Rentals - Land And Structures
9,251,970 6,458,132 0 2,133,995 0 2,133,995 659,843 7.1% 92.9% 93.6%
0034 Security Services 4,670,595 1,749,243 479,936 1,441,279 1,718 1,922,932 998,420 21.4% 78.6% 97.4%0035 Occupancy Fixed Costs 1,893,363 755,330 169,159 692,193 61,061 922,413 215,620 11.4% 88.6% 87.9%0040 Other Services And Charges
64,989,383 26,904,372 17,371,219 7,343,622 1,464,981 26,179,822 11,905,190 18.3% 81.7% 78.5%
0041 Contractual Services - Other
169,058,336 60,912,606 56,628,351 4,325,427 7,202,305 68,156,083 39,989,647 23.7% 76.3% 67.9%
0050 Subsidies And Transfers 274,221,539 96,126,751 18,509,163 3,108,336 (140,000) 21,477,499 156,617,289 57.1% 42.9% 53.3%0070 Equipment & Equipment Rental
12,997,745 4,456,413 2,969,603 29,710 1,311,655 4,310,968 4,230,365 32.5% 67.5% 52.3%
0080 Debt Service 5,753,000 5,753,000 0 0 0 0 0 0.0% 100.0% 100.0%Non-Personnel Services 553,788,035 209,016,092 97,133,838 20,105,911 10,012,421 127,252,170 217,519,773 39.3% 60.7% 63.5%
Grand Total 766,278,073 344,718,416 97,133,838 20,105,911 10,012,421 127,252,170 294,307,487 38.4% 61.6% 64.5%
% Of Budget 45.0% 16.6%
Financial Status Report - (Operating Expenditures) as of June 30, 2019 G - 12

(H) Overtime Summaries

Government of the District of Columbia FY 2019 Financial Status Reports (as of June 30, 2019) % Monthly Time Elapsed: 75.0%Office of the Chief Financial Officer % Monthly Time Remaining: 25.0%SOURCE: CFOSolve / SOAR** UNAUDITED and UNADJUSTED **(Run Date: Jul 19, 2019)
Overtime Expenditures-All Funds
Agency Name Local Fund Dedicated Taxes Federal Grant Fund
Federal Medicaid Payments
Private Grant Fund
Private Donations
Special Purpose Revenue Funds
('O'Type)
Grand Total
FA0 - Metropolitan Police Department 20,407,941 100,555 3,586,821 24,095,317
FB0 - Fire and Emergency Medical Services Department 14,938,160 47,519 14,985,679
FL0 - Department of Corrections 10,793,509 1,700,854 12,494,363
KT0 - Department of Public Works 7,315,138 144,952 7,460,089
GO0 - Special Education Transportation 5,595,676 5,595,676
AM0 - Department of General Services 3,678,054 85,608 3,763,661
RM0 - Department of Behavioral Health 3,162,919 179,452 59,836 3,402,208
JZ0 - Department of Youth Rehabilitation Services 2,187,780 2,187,780
GA0 - District of Columbia Public Schools 1,983,585 2,339 242 281,343 2,267,509
KA0 - District Department of Transportation 1,767,417 39,134 1,806,551
UC0 - Office of Unified Communications 1,626,153 99,191 1,725,344
JA0 - Department of Human Services 1,155,039 740,548 513,007 2,408,594
RL0 - Child and Family Services Agency 852,578 206,524 1,059,102
DL0 - Board of Elections 427,403 427,403
AT0 - Office of the Chief Financial Officer 316,972 41,911 358,883
CE0 - District of Columbia Public Library 281,363 575 281,938
HA0 - Department of Parks and Recreation 244,133 149,571 393,704
FR0 - Department of Forensic Sciences 178,118 6,371 184,489
CR0 - Department of Consumer and Regulatory Affairs 172,131 284,479 456,610
KV0 - Department of Motor Vehicles 149,826 21,838 171,664
CF0 - Department of Employment Services 125,975 131,456 117 17,263 274,810
CB0 - Office of the Attorney General for the District of Columbia
107,343 21,982 184 3,220 132,729
FX0 - Office of the Chief Medical Examiner 99,180 99,180
BN0 - Homeland Security and Emergency Management Agency
83,727 162,037 245,763
HC0 - Department of Health 66,717 31,777 17,862 116,357
TO0 - Office of the Chief Technology Officer 58,752 14,416 73,168
FK0 - District of Columbia National Guard 34,601 109,694 144,295
GD0 - Office of the State Superintendent of Education 27,718 15,279 42,997
HT0 - Department of Health Care Finance 19,433 36,324 443 56,200
AB0 - Council of the District of Columbia 15,906 15,906
BD0 - Office of Planning 12,774 170 12,945
BE0 - D.C. Department of Human Resources 9,609 9,609
Financial Status Report - (Operating Expenditures) as of June 30, 2019 H - 1

Government of the District of Columbia FY 2019 Financial Status Reports (as of June 30, 2019) % Monthly Time Elapsed: 75.0%Office of the Chief Financial Officer % Monthly Time Remaining: 25.0%SOURCE: CFOSolve / SOAR** UNAUDITED and UNADJUSTED **(Run Date: Jul 19, 2019)
Overtime Expenditures-All Funds
Agency Name Local Fund Dedicated Taxes Federal Grant Fund
Federal Medicaid Payments
Private Grant Fund
Private Donations
Special Purpose Revenue Funds
('O'Type)
Grand Total
DB0 - Department of Housing and Community Development 7,899 581 8,480
AG0 - Board of Ethics and Government Accountability 7,055 7,055
JM0 - Department on Disability Services 6,582 369,367 96 376,046
CQ0 - Office of the Tenant Advocate 6,389 6,389
PO0 - Office of Contracting and Procurement 6,103 187 6,290
AS0 - Office of Finance and Resource Management 4,258 4,258
EB0 - Office of the Deputy Mayor for Planning and Economic Development
2,880 0 2,880
AE0 - Office of the City Administrator 1,203 1,203
DA0 - Real Property Tax Appeals Commission 874 874
AC0 - Office of the District of Columbia Auditor 763 763
KG0 - Department of Energy and Environment 757 2,043 3,333 6,133
HM0 - Office of Human Rights 535 535
EM0 - Deputy Mayor for Greater Economic Opportunity 462 462
BG0 - Employees' Compensation Fund 359 359
AD0 - Office of the Inspector General 332 94 426
FS0 - Office of Administrative Hearings 160 160
NS0 - Office of Neighborhood Safety and Engagement 29 29
JR0 - Office of Disability Rights 17 17
BX0 - Commission on the Arts and Humanities 0 221 221
LQ0 - Alcoholic Beverage Regulation Administration 0 100,274 100,274
CI0 - Office of Cable Television, Film, Music, and Entertainment
159,624 159,624
DH0 - Public Service Commission 2,520 2,520
DJ0 - Office of the People's Counsel 687 687
SR0 - Department of Insurance, Securities, and Banking 28,601 28,601
TC0 - Department of For-Hire Vehicles 44,361 44,361
EN0 - Department of Small and Local Business Development
(5) (5)
AP0 - Office on Asian and Pacific Islander Affairs (7) (7)
Total 77,942,276 221 2,119,977 549,427 359 184 6,896,715 87,509,158
Financial Status Report - (Operating Expenditures) as of June 30, 2019 H - 2

Government of the District of Columbia FY 2019 Financial Status Reports (as of June 30, 2019) % Monthly Time Elapsed: 75.0%Office of the Chief Financial Officer % Monthly Time Remaining: 25.0%SOURCE: CFOSolve / SOAR** UNAUDITED and UNADJUSTED **(Run Date: Jul 19, 2019)
Overtime Pay
Comparison of FY19 Monthly Overtime Pay to 3-yr Avg MPD
(6,000)
(4,000)
(2,000)
0
2,000
4,000
6,000
8,000
10,000
1 2 3 4 5 6 7 8 9 10 11 12
3-yr AvgFY19
Period
Ove
rtim
e P
ay (0
00s)
Comparison of FY 19 YTD Overtime Pay to 3-yr Avg MPD
0
4,000
8,000
12,000
16,000
20,000
24,000
28,000
1 2 3 4 5 6 7 8 9 10 11 12
3-yr AvgFY19
Period
Ove
rtim
e P
ay (0
00s)
Comparison of FY 19 Monthly Overtime Pay to 3-yr Avg FEMS
(8,000)
(6,000)
(4,000)
(2,000)
0
2,000
4,000
6,000
8,000
10,000
12,000
1 2 3 4 5 6 7 8 9 10 11 12
3-yr AvgFY19
Period
Ove
rtim
e P
ay (0
00s)
Comparison of FY 19 YTD Overtime Pay to 3-yr Avg FEMS
0
4,000
8,000
12,000
16,000
20,000
24,000
1 2 3 4 5 6 7 8 9 10 11 12
3-yr AvgFY19
Period
Ove
rtim
e P
ay (0
00s)
Financial Status Report - (Operating Expenditures) as of June 30, 2019 H - 3
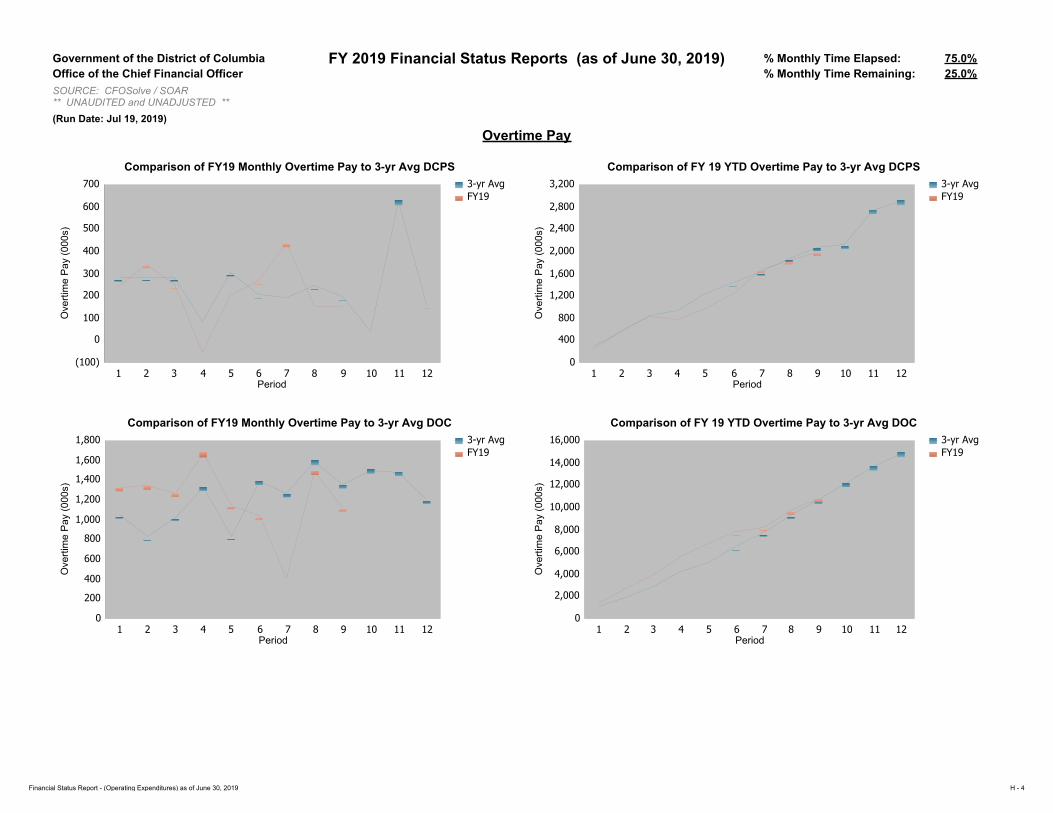
Government of the District of Columbia FY 2019 Financial Status Reports (as of June 30, 2019) % Monthly Time Elapsed: 75.0%Office of the Chief Financial Officer % Monthly Time Remaining: 25.0%SOURCE: CFOSolve / SOAR** UNAUDITED and UNADJUSTED **(Run Date: Jul 19, 2019)
Overtime Pay
Comparison of FY19 Monthly Overtime Pay to 3-yr Avg DCPS
(100)
0
100
200
300
400
500
600
700
1 2 3 4 5 6 7 8 9 10 11 12
3-yr AvgFY19
Period
Ove
rtim
e P
ay (0
00s)
Comparison of FY 19 YTD Overtime Pay to 3-yr Avg DCPS
0
400
800
1,200
1,600
2,000
2,400
2,800
3,200
1 2 3 4 5 6 7 8 9 10 11 12
3-yr AvgFY19
Period
Ove
rtim
e P
ay (0
00s)
Comparison of FY19 Monthly Overtime Pay to 3-yr Avg DOC
0
200
400
600
800
1,000
1,200
1,400
1,600
1,800
1 2 3 4 5 6 7 8 9 10 11 12
3-yr AvgFY19
Period
Ove
rtim
e P
ay (0
00s)
Comparison of FY 19 YTD Overtime Pay to 3-yr Avg DOC
0
2,000
4,000
6,000
8,000
10,000
12,000
14,000
16,000
1 2 3 4 5 6 7 8 9 10 11 12
3-yr AvgFY19
Period
Ove
rtim
e P
ay (0
00s)
Financial Status Report - (Operating Expenditures) as of June 30, 2019 H - 4
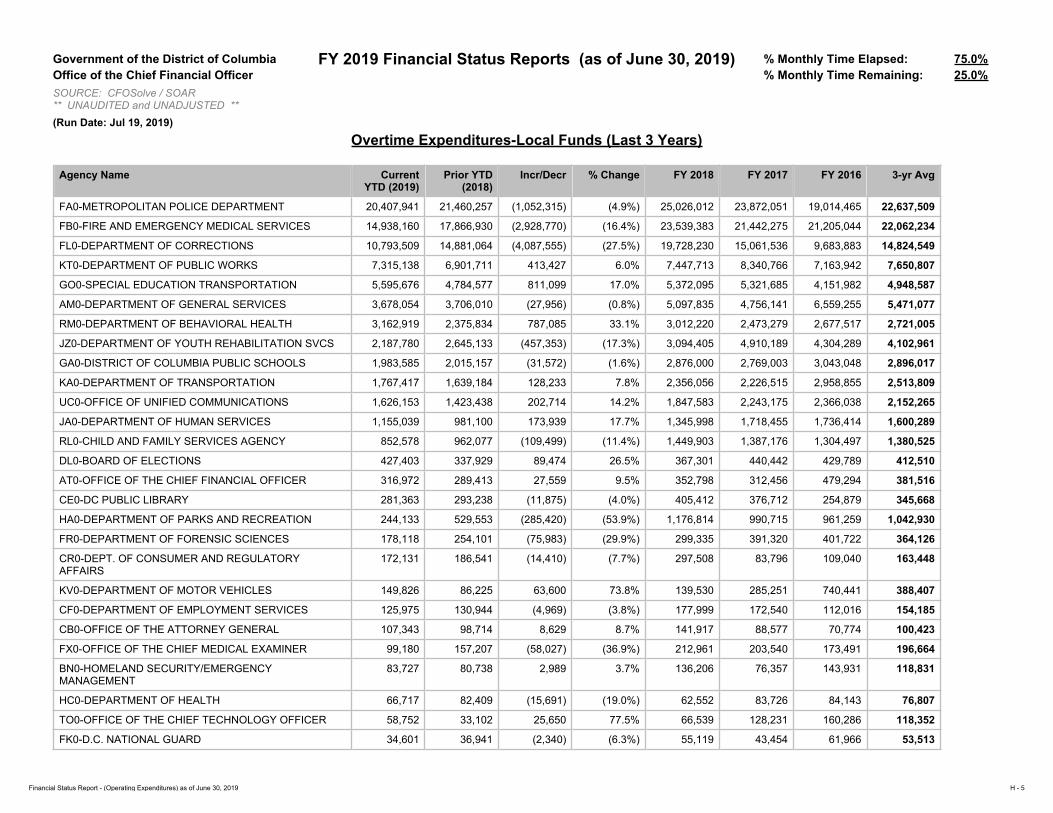
Government of the District of Columbia FY 2019 Financial Status Reports (as of June 30, 2019) % Monthly Time Elapsed: 75.0%Office of the Chief Financial Officer % Monthly Time Remaining: 25.0%SOURCE: CFOSolve / SOAR** UNAUDITED and UNADJUSTED **(Run Date: Jul 19, 2019)
Overtime Expenditures-Local Funds (Last 3 Years)
Agency Name Current YTD (2019)
Prior YTD (2018)
Incr/Decr % Change FY 2018 FY 2017 FY 2016 3-yr Avg
FA0-METROPOLITAN POLICE DEPARTMENT 20,407,941 21,460,257 (1,052,315) (4.9%) 25,026,012 23,872,051 19,014,465 22,637,509
FB0-FIRE AND EMERGENCY MEDICAL SERVICES 14,938,160 17,866,930 (2,928,770) (16.4%) 23,539,383 21,442,275 21,205,044 22,062,234
FL0-DEPARTMENT OF CORRECTIONS 10,793,509 14,881,064 (4,087,555) (27.5%) 19,728,230 15,061,536 9,683,883 14,824,549
KT0-DEPARTMENT OF PUBLIC WORKS 7,315,138 6,901,711 413,427 6.0% 7,447,713 8,340,766 7,163,942 7,650,807
GO0-SPECIAL EDUCATION TRANSPORTATION 5,595,676 4,784,577 811,099 17.0% 5,372,095 5,321,685 4,151,982 4,948,587
AM0-DEPARTMENT OF GENERAL SERVICES 3,678,054 3,706,010 (27,956) (0.8%) 5,097,835 4,756,141 6,559,255 5,471,077
RM0-DEPARTMENT OF BEHAVIORAL HEALTH 3,162,919 2,375,834 787,085 33.1% 3,012,220 2,473,279 2,677,517 2,721,005
JZ0-DEPARTMENT OF YOUTH REHABILITATION SVCS 2,187,780 2,645,133 (457,353) (17.3%) 3,094,405 4,910,189 4,304,289 4,102,961
GA0-DISTRICT OF COLUMBIA PUBLIC SCHOOLS 1,983,585 2,015,157 (31,572) (1.6%) 2,876,000 2,769,003 3,043,048 2,896,017
KA0-DEPARTMENT OF TRANSPORTATION 1,767,417 1,639,184 128,233 7.8% 2,356,056 2,226,515 2,958,855 2,513,809
UC0-OFFICE OF UNIFIED COMMUNICATIONS 1,626,153 1,423,438 202,714 14.2% 1,847,583 2,243,175 2,366,038 2,152,265
JA0-DEPARTMENT OF HUMAN SERVICES 1,155,039 981,100 173,939 17.7% 1,345,998 1,718,455 1,736,414 1,600,289
RL0-CHILD AND FAMILY SERVICES AGENCY 852,578 962,077 (109,499) (11.4%) 1,449,903 1,387,176 1,304,497 1,380,525
DL0-BOARD OF ELECTIONS 427,403 337,929 89,474 26.5% 367,301 440,442 429,789 412,510
AT0-OFFICE OF THE CHIEF FINANCIAL OFFICER 316,972 289,413 27,559 9.5% 352,798 312,456 479,294 381,516
CE0-DC PUBLIC LIBRARY 281,363 293,238 (11,875) (4.0%) 405,412 376,712 254,879 345,668
HA0-DEPARTMENT OF PARKS AND RECREATION 244,133 529,553 (285,420) (53.9%) 1,176,814 990,715 961,259 1,042,930
FR0-DEPARTMENT OF FORENSIC SCIENCES 178,118 254,101 (75,983) (29.9%) 299,335 391,320 401,722 364,126
CR0-DEPT. OF CONSUMER AND REGULATORY AFFAIRS
172,131 186,541 (14,410) (7.7%) 297,508 83,796 109,040 163,448
KV0-DEPARTMENT OF MOTOR VEHICLES 149,826 86,225 63,600 73.8% 139,530 285,251 740,441 388,407
CF0-DEPARTMENT OF EMPLOYMENT SERVICES 125,975 130,944 (4,969) (3.8%) 177,999 172,540 112,016 154,185
CB0-OFFICE OF THE ATTORNEY GENERAL 107,343 98,714 8,629 8.7% 141,917 88,577 70,774 100,423
FX0-OFFICE OF THE CHIEF MEDICAL EXAMINER 99,180 157,207 (58,027) (36.9%) 212,961 203,540 173,491 196,664
BN0-HOMELAND SECURITY/EMERGENCY MANAGEMENT
83,727 80,738 2,989 3.7% 136,206 76,357 143,931 118,831
HC0-DEPARTMENT OF HEALTH 66,717 82,409 (15,691) (19.0%) 62,552 83,726 84,143 76,807
TO0-OFFICE OF THE CHIEF TECHNOLOGY OFFICER 58,752 33,102 25,650 77.5% 66,539 128,231 160,286 118,352
FK0-D.C. NATIONAL GUARD 34,601 36,941 (2,340) (6.3%) 55,119 43,454 61,966 53,513
Financial Status Report - (Operating Expenditures) as of June 30, 2019 H - 5

Government of the District of Columbia FY 2019 Financial Status Reports (as of June 30, 2019) % Monthly Time Elapsed: 75.0%Office of the Chief Financial Officer % Monthly Time Remaining: 25.0%SOURCE: CFOSolve / SOAR** UNAUDITED and UNADJUSTED **(Run Date: Jul 19, 2019)
Overtime Expenditures-Local Funds (Last 3 Years)
Agency Name Current YTD (2019)
Prior YTD (2018)
Incr/Decr % Change FY 2018 FY 2017 FY 2016 3-yr Avg
GD0-STATE SUPERINTENDENT OF EDUCATION (OSSE) 27,718 16,845 10,873 64.5% 21,789 24,491 10,292 18,857
HT0-DEPARTMENT OF HEALTH CARE FINANCE 19,433 5,286 14,148 267.7% 11,339 10,102 9,032 10,158
AB0-COUNCIL OF THE DISTRICT OF COLUMBIA 15,906 11,193 4,713 42.1% 15,673 6,730 6,363 9,589
BD0-OFFICE OF PLANNING 12,774 17,560 (4,785) (27.3%) 19,797 18,005 8,202 15,335
BE0-D.C. DEPARTMENT OF HUMAN RESOURCES 9,609 21,584 (11,976) (55.5%) 24,288 22,261 13,038 19,862
DB0-DEPT. OF HOUSING AND COMM. DEVELOPMENT 7,899 26,001 (18,101) (69.6%) 28,806 17,438 28,419 24,888
AG0-DC BD OF ETHICS AND GOVT ACCOUNTABILITY 7,055 597 6,458 1,082.3% 563 0 394 319
JM0-DEPARTMENT ON DISABILITY SERVICES 6,582 5,213 1,369 26.3% 6,995 18,882 9,628 11,835
CQ0-OFFICE OF THE TENANT ADVOCATE 6,389 2,691 3,698 137.4% 6,974 8,956 8,741 8,224
PO0-OFFICE OF CONTRACTING AND PROCUREMENT 6,103 4,780 1,323 27.7% 10,430 18,729 24,563 17,907
AS0-OFFICE OF FINANCE & RESOURCE MGMT 4,258 3,915 343 8.8% 3,366 4,634 7,136 5,045
EB0-DEPUTY MAYOR FOR PLANNING AND ECON DEV 2,880 0 2,880 N/A 0 402 2,166 856
AE0-CITY ADMINISTRATOR / DEPUTY MAYOR 1,203 (38) 1,240 (3,282.6%) 1,065 3,542 4,598 3,068
DA0-REAL PROPERTY TAX APPEALS COMMISSION 874 24 850 3,532.9% 24 0 0 8
AC0-OFFICE OF THE D.C. AUDITOR 763 0 763 N/A 0 0 0 0
KG0-DEPARTMENT OF ENERGY AND ENVIRONMENT 757 132 625 473.9% 899 7,865 16,517 8,427
HM0-OFFICE OF HUMAN RIGHTS 535 0 535 N/A 352 719 0 357
EM0-DEPTY MAYOR GREATER ECONOMIC OPPORTUNITY
462 454 8 1.8% 420 0 0 140
BG0-EMPLOYEES'COMPENSATION FUND 359 0 359 N/A 0 0 0 0
AD0-OFFICE OF THE INSPECTOR GENERAL 332 3,097 (2,765) (89.3%) 4,516 5,693 4,034 4,748
FS0-OFFICE OF ADMINISTRATIVE HEARINGS 160 570 (410) (71.9%) 0 0 0 0
NS0-NEIGHBORHOOD SAFETY AND ENGAGEMENT 29 1,419 (1,391) (98.0%) 1,419 0 0 473
JR0-OFFICE OF DISABILITY RIGHTS 17 0 17 N/A 0 421 0 140
BX0-COMM ON ARTS & HUMANITIES -CREATIVE ECON 0 265 (265) (100.0%) 273 0 0 91
CJ0-OFFICE OF CAMPAIGN FINANCE 0 0 0 N/A 0 545 0 182
FH0-OFFICE OF POLICE COMPLAINTS 0 224 (224) (100.0%) 1,366 3,183 7,447 3,999
EN0-DEPT OF SMALL & LOCAL BUSINESS DEVELOPMT (5) 854 (860) (100.6%) 1,265 1,656 3,203 2,041
AP0-OFFICE ON ASIAN/PACIFIC AFFAIRS (7) 0 (7) N/A 1,141 0 0 380
Financial Status Report - (Operating Expenditures) as of June 30, 2019 H - 6

Government of the District of Columbia FY 2019 Financial Status Reports (as of June 30, 2019) % Monthly Time Elapsed: 75.0%Office of the Chief Financial Officer % Monthly Time Remaining: 25.0%SOURCE: CFOSolve / SOAR** UNAUDITED and UNADJUSTED **(Run Date: Jul 19, 2019)
Overtime Expenditures-Local Funds (Last 3 Years)
Agency Name Current YTD (2019)
Prior YTD (2018)
Incr/Decr % Change FY 2018 FY 2017 FY 2016 3-yr Avg
AA0-OFFICE OF THE MAYOR 0 0 0 N/A 0 980 508 496
AH0-MAYOR'S OFFICE OF LEGAL COUNSEL 0 0 0 N/A 505 0 0 168
AI0-OFFICE OF THE SENIOR ADVISOR 0 256 (256) (100.0%) 246 2,862 0 1,036
AR0-STATEHOOD INITIATIVE AGENCY 0 0 0 N/A 0 265 0 88
BJ0-OFFICE OF ZONING 0 131 (131) (100.0%) 131 603 519 417
BY0-DEPARTMENT OF AGING AND COMMUNITY LIVING 0 229 (229) (100.0%) 220 200 0 140
BZ0-MAYOR'S OFFICE ON LATINO AFFAIRS 0 0 0 N/A 0 23 296 106
CH0-OFFICE OF EMPLOYEE APPEALS 0 0 0 N/A 466 356 0 274
DX0-ADVISORY NEIGHBORHOOD COMMISSIONS 0 0 0 N/A 0 0 327 109
FQ0-DEPUTY MAYOR FOR PUBLIC SAFETY & JUSTICE 0 0 0 N/A 0 423 0 141
GN0-OFFICE FOR NON-PUBLIC TUITION 0 0 0 N/A 0 446 0 149
HG0-DEPUTY MAYOR FOR HEALTH & HUMAN SERVICES
0 0 0 N/A 0 0 295 98
RK0-OFFICE OF RISK MANAGEMENT 0 0 0 N/A 0 177 0 59
Grand Total 77,942,276 84,362,810 (6,420,534) (7.6%) 106,249,749 100,379,949 90,517,979 99,049,225
Financial Status Report - (Operating Expenditures) as of June 30, 2019 H - 7

(I) Top Ten Agencies – Local Funds

Government of the District of Columbia FY 2019 Financial Status Reports (as of June 30, 2019) % Monthly Time Elapsed: 75.0%Office of the Chief Financial Officer % Monthly Time Remaining: 25.0%SOURCE: CFOSolve / SOAR** UNAUDITED and UNADJUSTED **(Run Date: Jul 19, 2019)
Top10 Agencies - Local Funds
Agency % of Local Budget
Revised Budget
Expenditures % Of Budget
Encumbrance ID Advances
Pre Encumbrance
Total Commitments
% Of Budget
Available Balance
% Available Balance
GA0 - District of Columbia Public Schools
10.9% 842,177,512 682,924,278 81.1% 12,308,368 24,600,605 9,528,461 46,437,434 5.5% 112,815,800 13.4%
HT0 - Department of Health Care Finance
10.2% 784,576,601 599,546,815 76.4% 14,947,801 3,401,791 898,660 19,248,252 2.5% 165,781,534 21.1%
DS0 - Repayment of Loans and Interest
9.5% 735,609,550 693,930,941 94.3% 0 0 0 0 0.0% 41,678,609 5.7%
GC0 - District of Columbia Public Charter Schools
7.5% 580,233,970 563,843,080 97.2% 0 0 0 0 0.0% 16,390,889 2.8%
FA0 - Metropolitan Police Department
7.0% 536,987,690 405,453,918 75.5% 13,603,700 4,254,784 542,389 18,400,873 3.4% 113,132,899 21.1%
JA0 - Department of Human Services
5.0% 383,496,301 263,336,438 68.7% 57,112,593 11,539,771 1,403,769 70,056,133 18.3% 50,103,730 13.1%
AM0 - Department of General Services
4.4% 335,485,491 208,293,177 62.1% 48,225,602 1,144,391 16,177,818 65,547,811 19.5% 61,644,503 18.4%
FB0 - Fire and Emergency Medical Services Department
3.6% 274,019,066 206,712,904 75.4% 7,123,723 1,969,040 762,071 9,854,834 3.6% 57,451,327 21.0%
RM0 - Department of Behavioral Health
3.2% 250,441,173 178,030,296 71.1% 17,193,874 12,654,392 3,316,718 33,164,983 13.2% 39,245,893 15.7%
GD0 - Office of the State Superintendent of Education
2.5% 191,366,510 101,004,097 52.8% 12,349,338 3,961,593 2,083,776 18,394,707 9.6% 71,967,705 37.6%
Total- Top 10 Agencies 63.7% 4,914,393,864 3,903,075,946 79.4% 182,864,999 63,526,366 34,713,663 281,105,027 5.7% 730,212,890 14.9%
Total - Other Agencies 36.3% 2,795,460,274 1,933,910,221 69.2% 173,456,443 53,346,273 29,260,629 256,063,345 9.2% 605,486,708 21.7%
Grand Total 100.0% 7,709,854,138 5,836,986,167 75.7% 356,321,441 116,872,640 63,974,291 537,168,372 7.0% 1,335,699,599 17.3%
Comparative Analysis of Percentage Spent(Expenditures Only):
Accounting Period/Month 1 2 3 4 5 6 7 8 9 10 11 12
3-yr Avg:
Monthly 9.1% 5.5% 13.0% 8.4% 6.1% 6.3% 7.4% 5.8% 12.8% 11.2% 5.2% 9.2%
Cumulative 9.1% 14.5% 27.6% 36.0% 42.1% 48.4% 55.8% 61.6% 74.4% 85.5% 90.7% 100.0%
2019
Monthly 9.8% 5.2% 17.6% 5.8% 6.3% 6.4% 8.9% 6.6% 12.8% 0.0% 0.0% 0.0%
YTD 9.8% 15.0% 32.6% 38.4% 44.7% 51.2% 60.1% 66.6% 79.4% 79.4% 79.4% 79.4%
YTD Variance-3-yr avg vs Current 5.1%
*Percent is based on whole dollars and may not sum to cumulative totals due to rounding.FY 2019 percentages are based on budget and may retroactively change due to budget revisions. Prior year percentages are based on actual annual expenditures. 3-year average consists of fiscal years 2016, 2017 and 2018.
Financial Status Report - (Operating Expenditures) as of June 30, 2019 I - 1

(J) Governmental Direction and Support

Government of the District of Columbia FY 2019 Financial Status Reports (as of June 30, 2019)General Fund: Local Funds (0100) By Comptroller Source Group
% Monthly Time Elapsed: 75.0%
Office of the Chief Financial Officer % Monthly Time Remaining: 25.0%SOURCE: CFOSolve / SOAR** UNAUDITED and UNADJUSTED **(Run Date: Jul 19, 2019)
AA0 - Office of the Mayor
GAAP Category
CSG CSG Title % of Budget
Revised Budget
Expenditures Encumbrance ID Advances
Pre Encumbrance
Total Commitments
Available Balance
% Available
Balance
%Spent and
Obligated as of June 2019
%Spent and
Obligated as of June 2018
Personnel Services
0011 Regular Pay - Cont Full Time
8,213,146 6,130,089 0 0 0 0 2,083,056 25.4% 74.6% 78.7%
0012 Regular Pay - Other 258,752 198,704 0 0 0 0 60,048 23.2% 76.8% 17.7%
0014 Fringe Benefits - Curr Personnel
1,721,450 1,210,197 0 0 0 0 511,253 29.7% 70.3% 74.1%
Personnel Services 85.8% 10,193,348 7,618,008 0 0 0 0 2,575,340 25.3% 74.7% 75.4%
Non-Personnel Services
0020 Supplies And Materials
99,686 59,812 0 0 1,000 1,000 38,874 39.0% 61.0% 73.2%
0031 Telecommunications 0 0 0 3,095 0 3,095 (3,095) N/A N/A N/A
0040 Other Services And Charges
1,200,879 1,230,795 66,340 4,776 0 71,117 (101,033) (8.4%) 108.4% 91.7%
0050 Subsidies And Transfers
341,705 214,700 16,300 0 0 16,300 110,705 32.4% 67.6% 79.2%
0070 Equipment & Equipment Rental
46,750 0 9,000 0 35,000 44,000 2,750 5.9% 94.1% 11.2%
Non-Personnel Services 14.2% 1,689,020 1,501,698 91,640 7,871 36,000 135,512 51,810 3.1% 96.9% 86.5%
AA0 - Office of the Mayor 100.0% 11,882,368 9,119,706 91,640 7,871 36,000 135,512 2,627,150 22.1% 77.9% 77.0%
% Of Budget for AA0 - Office of the Mayor 76.7% 1.1%
Financial Status Report - (Operating Expenditures) as of June 30, 2019 J - 1
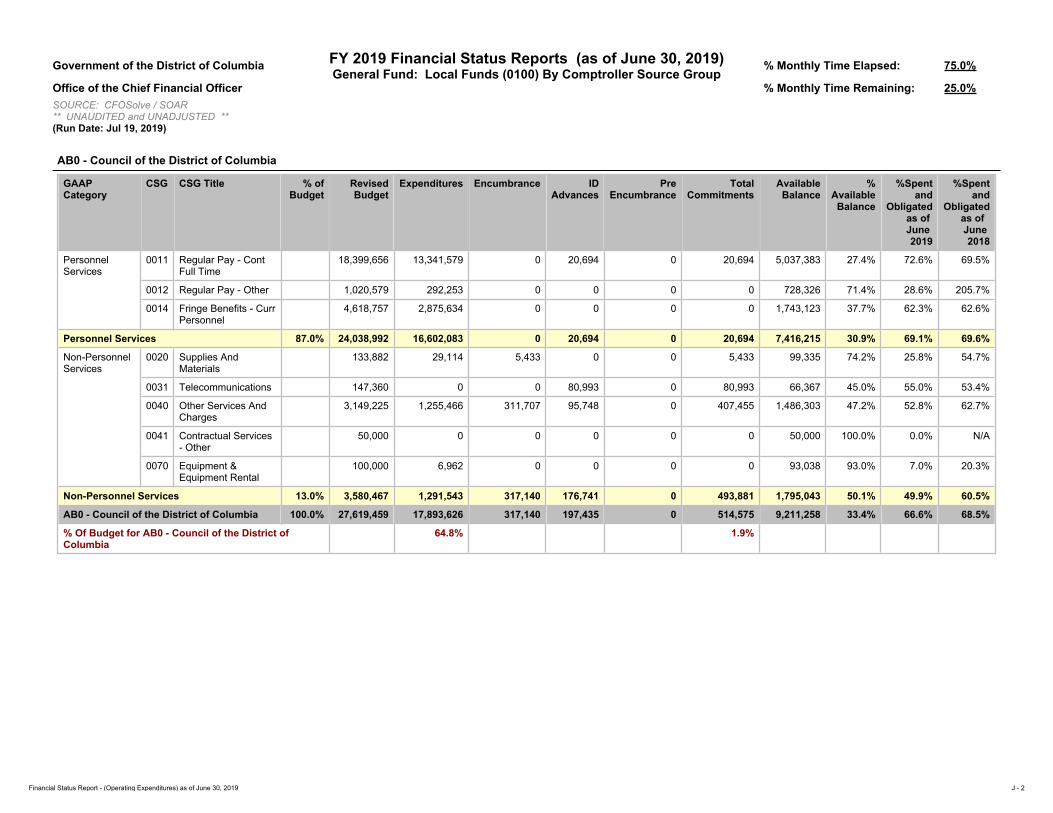
Government of the District of Columbia FY 2019 Financial Status Reports (as of June 30, 2019)General Fund: Local Funds (0100) By Comptroller Source Group
% Monthly Time Elapsed: 75.0%
Office of the Chief Financial Officer % Monthly Time Remaining: 25.0%SOURCE: CFOSolve / SOAR** UNAUDITED and UNADJUSTED **(Run Date: Jul 19, 2019)
AB0 - Council of the District of Columbia
GAAP Category
CSG CSG Title % of Budget
Revised Budget
Expenditures Encumbrance ID Advances
Pre Encumbrance
Total Commitments
Available Balance
% Available
Balance
%Spent and
Obligated as of June 2019
%Spent and
Obligated as of June 2018
Personnel Services
0011 Regular Pay - Cont Full Time
18,399,656 13,341,579 0 20,694 0 20,694 5,037,383 27.4% 72.6% 69.5%
0012 Regular Pay - Other 1,020,579 292,253 0 0 0 0 728,326 71.4% 28.6% 205.7%
0014 Fringe Benefits - Curr Personnel
4,618,757 2,875,634 0 0 0 0 1,743,123 37.7% 62.3% 62.6%
Personnel Services 87.0% 24,038,992 16,602,083 0 20,694 0 20,694 7,416,215 30.9% 69.1% 69.6%
Non-Personnel Services
0020 Supplies And Materials
133,882 29,114 5,433 0 0 5,433 99,335 74.2% 25.8% 54.7%
0031 Telecommunications 147,360 0 0 80,993 0 80,993 66,367 45.0% 55.0% 53.4%
0040 Other Services And Charges
3,149,225 1,255,466 311,707 95,748 0 407,455 1,486,303 47.2% 52.8% 62.7%
0041 Contractual Services - Other
50,000 0 0 0 0 0 50,000 100.0% 0.0% N/A
0070 Equipment & Equipment Rental
100,000 6,962 0 0 0 0 93,038 93.0% 7.0% 20.3%
Non-Personnel Services 13.0% 3,580,467 1,291,543 317,140 176,741 0 493,881 1,795,043 50.1% 49.9% 60.5%
AB0 - Council of the District of Columbia 100.0% 27,619,459 17,893,626 317,140 197,435 0 514,575 9,211,258 33.4% 66.6% 68.5%
% Of Budget for AB0 - Council of the District of Columbia
64.8% 1.9%
Financial Status Report - (Operating Expenditures) as of June 30, 2019 J - 2

Government of the District of Columbia FY 2019 Financial Status Reports (as of June 30, 2019)General Fund: Local Funds (0100) By Comptroller Source Group
% Monthly Time Elapsed: 75.0%
Office of the Chief Financial Officer % Monthly Time Remaining: 25.0%SOURCE: CFOSolve / SOAR** UNAUDITED and UNADJUSTED **(Run Date: Jul 19, 2019)
AC0 - Office of the District of Columbia Auditor
GAAP Category
CSG CSG Title % of Budget
Revised Budget
Expenditures Encumbrance ID Advances
Pre Encumbrance
Total Commitments
Available Balance
% Available
Balance
%Spent and
Obligated as of June 2019
%Spent and
Obligated as of June 2018
Personnel Services
0011 Regular Pay - Cont Full Time
2,739,830 1,767,180 0 0 0 0 972,651 35.5% 64.5% 70.1%
0012 Regular Pay - Other 469,316 423,553 0 0 0 0 45,763 9.8% 90.2% 85.5%
0014 Fringe Benefits - Curr Personnel
785,980 522,738 0 0 0 0 263,243 33.5% 66.5% 67.2%
Personnel Services 66.3% 3,995,126 2,752,966 0 0 0 0 1,242,161 31.1% 68.9% 72.2%
Non-Personnel Services
0020 Supplies And Materials
18,534 6,891 0 0 0 0 11,643 62.8% 37.2% 35.5%
0030 Energy, Comm. And Bldg Rentals
477 463 0 14 0 14 0 0.0% 100.0% N/A
0031 Telecommunications 42,787 13,995 0 9,843 0 9,843 18,949 44.3% 55.7% 187.7%
0032 Rentals - Land And Structures
594,310 402,175 0 192,135 0 192,135 0 0.0% 100.0% 100.0%
0034 Security Services 378 0 0 378 0 378 0 0.0% 100.0% N/A
0035 Occupancy Fixed Costs
3,150 343 0 2,807 0 2,807 0 0.0% 100.0% N/A
0040 Other Services And Charges
143,600 68,639 26,389 2,500 0 28,889 46,072 32.1% 67.9% 76.2%
0041 Contractual Services - Other
1,182,420 322,075 417,400 0 0 417,400 442,945 37.5% 62.5% 76.8%
0070 Equipment & Equipment Rental
48,000 29,574 6,383 0 0 6,383 12,043 25.1% 74.9% 23.5%
Non-Personnel Services 33.7% 2,033,656 844,154 450,172 207,677 0 657,849 531,652 26.1% 73.9% 80.0%
AC0 - Office of the District of Columbia Auditor
100.0% 6,028,782 3,597,120 450,172 207,677 0 657,849 1,773,812 29.4% 70.6% 74.7%
% Of Budget for AC0 - Office of the District of Columbia Auditor
59.7% 10.9%
Financial Status Report - (Operating Expenditures) as of June 30, 2019 J - 3

Government of the District of Columbia FY 2019 Financial Status Reports (as of June 30, 2019)General Fund: Local Funds (0100) By Comptroller Source Group
% Monthly Time Elapsed: 75.0%
Office of the Chief Financial Officer % Monthly Time Remaining: 25.0%SOURCE: CFOSolve / SOAR** UNAUDITED and UNADJUSTED **(Run Date: Jul 19, 2019)
AD0 - Office of the Inspector General
GAAP Category
CSG CSG Title % of Budget
Revised Budget
Expenditures Encumbrance ID Advances
Pre Encumbrance
Total Commitments
Available Balance
% Available
Balance
%Spent and
Obligated as of June 2019
%Spent and
Obligated as of June 2018
Personnel Services
0011 Regular Pay - Cont Full Time
8,772,537 5,817,499 0 0 0 0 2,955,038 33.7% 66.3% 64.4%
0012 Regular Pay - Other 270,816 192,982 0 0 0 0 77,834 28.7% 71.3% 71.6%
0013 Additional Gross Pay 105,965 73,273 0 0 0 0 32,691 30.9% 69.1% 64.3%
0014 Fringe Benefits - Curr Personnel
1,886,324 1,123,822 0 0 0 0 762,503 40.4% 59.6% 60.2%
Personnel Services 69.2% 11,035,642 7,207,908 0 0 0 0 3,827,734 34.7% 65.3% 63.9%
Non-Personnel Services
0020 Supplies And Materials
211,612 20,439 0 45,522 0 45,522 145,652 68.8% 31.2% 7.5%
0031 Telecommunications 0 0 0 (712) 0 (712) 712 N/A N/A N/A
0040 Other Services And Charges
4,670,896 1,895,329 1,642,204 115,078 286,567 2,043,849 731,719 15.7% 84.3% 77.3%
0070 Equipment & Equipment Rental
25,000 0 0 0 25,000 25,000 0 0.0% 100.0% N/A
Non-Personnel Services 30.8% 4,907,509 1,956,146 1,642,204 159,887 311,567 2,113,659 837,704 17.1% 82.9% 73.6%
AD0 - Office of the Inspector General 100.0% 15,943,151 9,164,054 1,642,204 159,887 311,567 2,113,659 4,665,438 29.3% 70.7% 66.6%
% Of Budget for AD0 - Office of the Inspector General 57.5% 13.3%
Financial Status Report - (Operating Expenditures) as of June 30, 2019 J - 4

Government of the District of Columbia FY 2019 Financial Status Reports (as of June 30, 2019)General Fund: Local Funds (0100) By Comptroller Source Group
% Monthly Time Elapsed: 75.0%
Office of the Chief Financial Officer % Monthly Time Remaining: 25.0%SOURCE: CFOSolve / SOAR** UNAUDITED and UNADJUSTED **(Run Date: Jul 19, 2019)
AE0 - Office of the City Administrator
GAAP Category
CSG CSG Title % of Budget
Revised Budget
Expenditures Encumbrance ID Advances
Pre Encumbrance
Total Commitments
Available Balance
% Available
Balance
%Spent and
Obligated as of June 2019
%Spent and
Obligated as of June 2018
Personnel Services
0011 Regular Pay - Cont Full Time
6,809,503 4,660,886 0 0 0 0 2,148,617 31.6% 68.4% 73.0%
0012 Regular Pay - Other 282,464 274,147 0 0 0 0 8,317 2.9% 97.1% 100.0%
0014 Fringe Benefits - Curr Personnel
1,294,538 925,385 0 0 0 0 369,153 28.5% 71.5% 77.1%
Personnel Services 92.0% 8,386,505 5,914,695 0 0 0 0 2,471,810 29.5% 70.5% 75.8%
Non-Personnel Services
0020 Supplies And Materials
28,000 31,421 0 0 0 0 (3,421) (12.2%) 112.2% 45.1%
0031 Telecommunications 0 0 0 10,043 0 10,043 (10,043) N/A N/A 136.4%
0040 Other Services And Charges
588,655 222,123 34,815 (9,617) 0 25,198 341,334 58.0% 42.0% 61.4%
0041 Contractual Services - Other
105,318 29,310 7,675 0 0 7,675 68,333 64.9% 35.1% 96.1%
0070 Equipment & Equipment Rental
5,000 4,499 0 72 0 72 429 8.6% 91.4% 251.3%
Non-Personnel Services 8.0% 726,973 287,353 42,490 498 0 42,988 396,632 54.6% 45.4% 62.8%
AE0 - Office of the City Administrator 100.0% 9,113,478 6,202,048 42,490 498 0 42,988 2,868,442 31.5% 68.5% 72.2%
% Of Budget for AE0 - Office of the City Administrator 68.1% 0.5%
Financial Status Report - (Operating Expenditures) as of June 30, 2019 J - 5
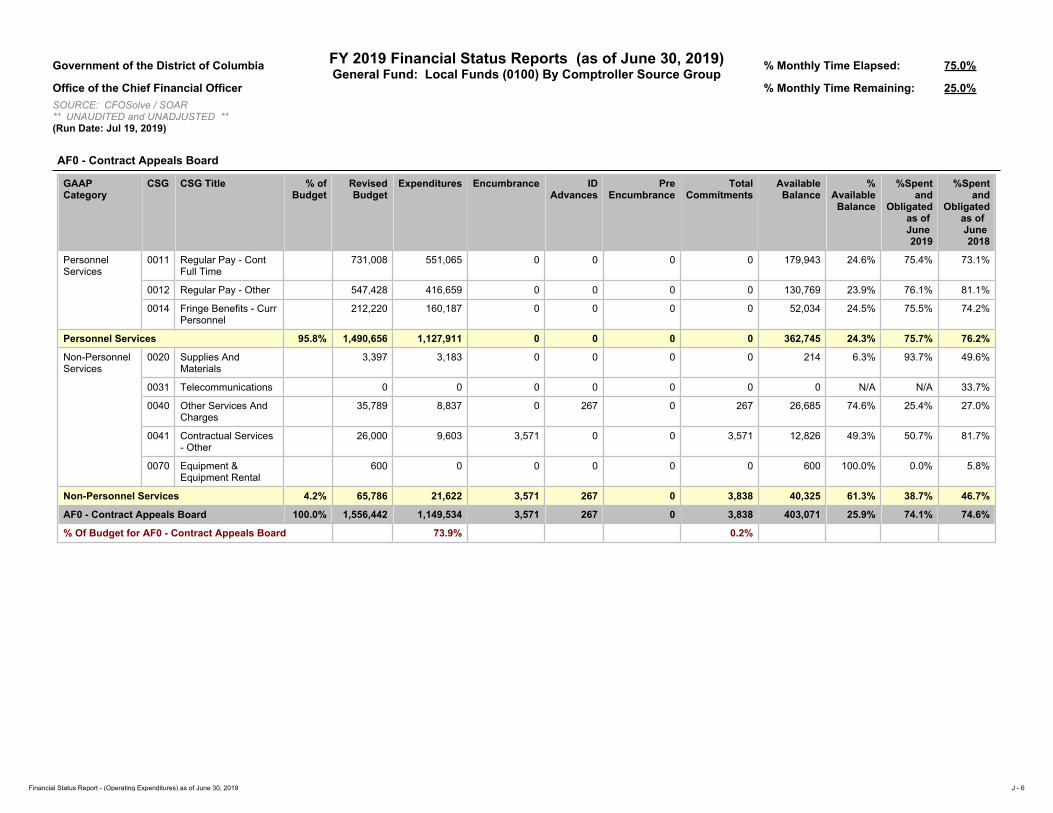
Government of the District of Columbia FY 2019 Financial Status Reports (as of June 30, 2019)General Fund: Local Funds (0100) By Comptroller Source Group
% Monthly Time Elapsed: 75.0%
Office of the Chief Financial Officer % Monthly Time Remaining: 25.0%SOURCE: CFOSolve / SOAR** UNAUDITED and UNADJUSTED **(Run Date: Jul 19, 2019)
AF0 - Contract Appeals Board
GAAP Category
CSG CSG Title % of Budget
Revised Budget
Expenditures Encumbrance ID Advances
Pre Encumbrance
Total Commitments
Available Balance
% Available
Balance
%Spent and
Obligated as of June 2019
%Spent and
Obligated as of June 2018
Personnel Services
0011 Regular Pay - Cont Full Time
731,008 551,065 0 0 0 0 179,943 24.6% 75.4% 73.1%
0012 Regular Pay - Other 547,428 416,659 0 0 0 0 130,769 23.9% 76.1% 81.1%
0014 Fringe Benefits - Curr Personnel
212,220 160,187 0 0 0 0 52,034 24.5% 75.5% 74.2%
Personnel Services 95.8% 1,490,656 1,127,911 0 0 0 0 362,745 24.3% 75.7% 76.2%
Non-Personnel Services
0020 Supplies And Materials
3,397 3,183 0 0 0 0 214 6.3% 93.7% 49.6%
0031 Telecommunications 0 0 0 0 0 0 0 N/A N/A 33.7%
0040 Other Services And Charges
35,789 8,837 0 267 0 267 26,685 74.6% 25.4% 27.0%
0041 Contractual Services - Other
26,000 9,603 3,571 0 0 3,571 12,826 49.3% 50.7% 81.7%
0070 Equipment & Equipment Rental
600 0 0 0 0 0 600 100.0% 0.0% 5.8%
Non-Personnel Services 4.2% 65,786 21,622 3,571 267 0 3,838 40,325 61.3% 38.7% 46.7%
AF0 - Contract Appeals Board 100.0% 1,556,442 1,149,534 3,571 267 0 3,838 403,071 25.9% 74.1% 74.6%
% Of Budget for AF0 - Contract Appeals Board 73.9% 0.2%
Financial Status Report - (Operating Expenditures) as of June 30, 2019 J - 6
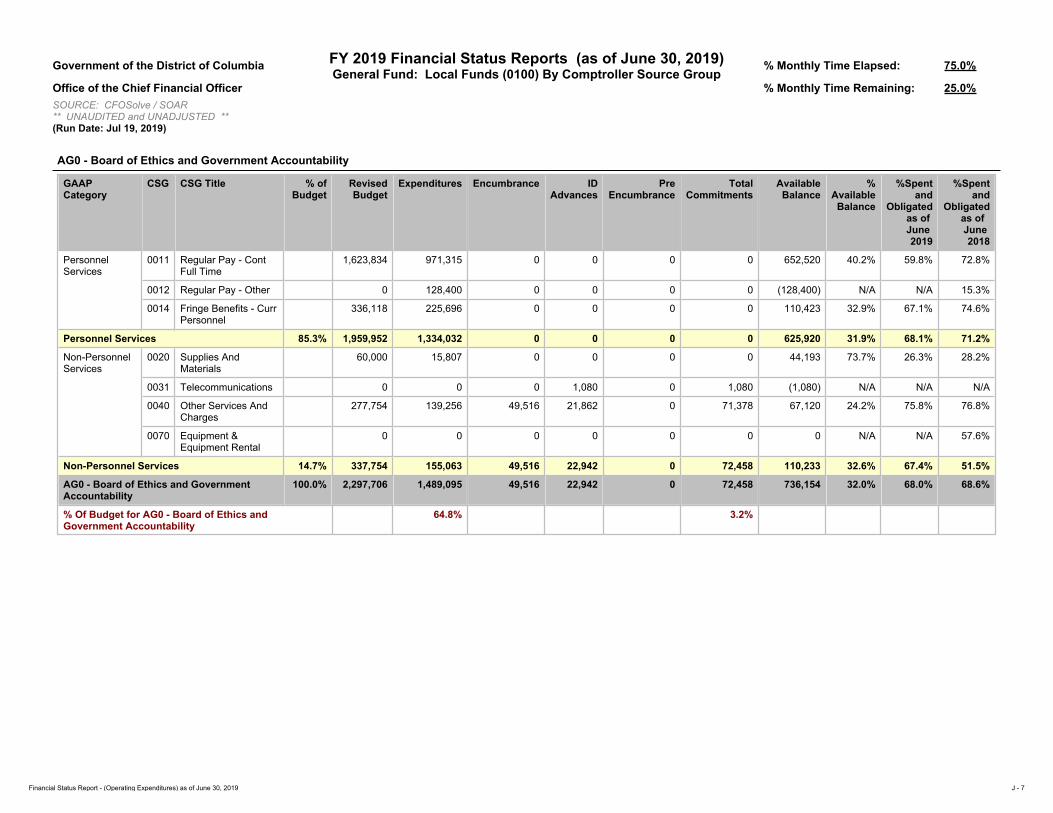
Government of the District of Columbia FY 2019 Financial Status Reports (as of June 30, 2019)General Fund: Local Funds (0100) By Comptroller Source Group
% Monthly Time Elapsed: 75.0%
Office of the Chief Financial Officer % Monthly Time Remaining: 25.0%SOURCE: CFOSolve / SOAR** UNAUDITED and UNADJUSTED **(Run Date: Jul 19, 2019)
AG0 - Board of Ethics and Government Accountability
GAAP Category
CSG CSG Title % of Budget
Revised Budget
Expenditures Encumbrance ID Advances
Pre Encumbrance
Total Commitments
Available Balance
% Available
Balance
%Spent and
Obligated as of June 2019
%Spent and
Obligated as of June 2018
Personnel Services
0011 Regular Pay - Cont Full Time
1,623,834 971,315 0 0 0 0 652,520 40.2% 59.8% 72.8%
0012 Regular Pay - Other 0 128,400 0 0 0 0 (128,400) N/A N/A 15.3%
0014 Fringe Benefits - Curr Personnel
336,118 225,696 0 0 0 0 110,423 32.9% 67.1% 74.6%
Personnel Services 85.3% 1,959,952 1,334,032 0 0 0 0 625,920 31.9% 68.1% 71.2%
Non-Personnel Services
0020 Supplies And Materials
60,000 15,807 0 0 0 0 44,193 73.7% 26.3% 28.2%
0031 Telecommunications 0 0 0 1,080 0 1,080 (1,080) N/A N/A N/A
0040 Other Services And Charges
277,754 139,256 49,516 21,862 0 71,378 67,120 24.2% 75.8% 76.8%
0070 Equipment & Equipment Rental
0 0 0 0 0 0 0 N/A N/A 57.6%
Non-Personnel Services 14.7% 337,754 155,063 49,516 22,942 0 72,458 110,233 32.6% 67.4% 51.5%
AG0 - Board of Ethics and Government Accountability
100.0% 2,297,706 1,489,095 49,516 22,942 0 72,458 736,154 32.0% 68.0% 68.6%
% Of Budget for AG0 - Board of Ethics and Government Accountability
64.8% 3.2%
Financial Status Report - (Operating Expenditures) as of June 30, 2019 J - 7
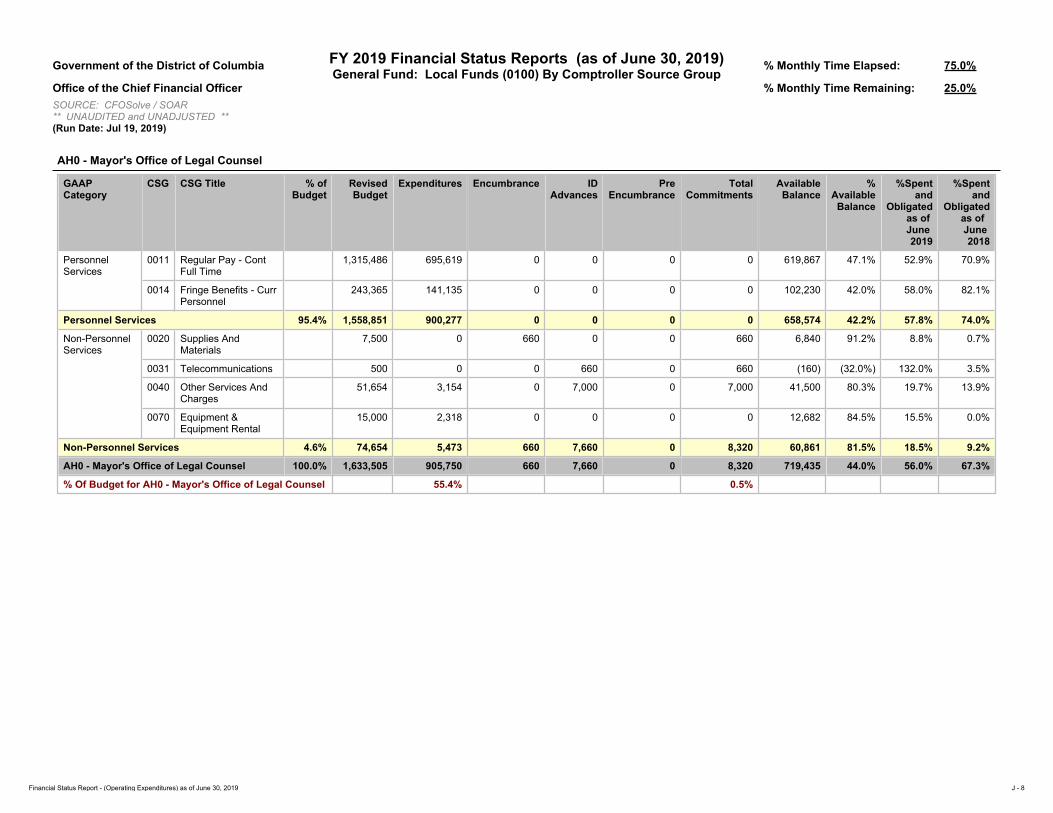
Government of the District of Columbia FY 2019 Financial Status Reports (as of June 30, 2019)General Fund: Local Funds (0100) By Comptroller Source Group
% Monthly Time Elapsed: 75.0%
Office of the Chief Financial Officer % Monthly Time Remaining: 25.0%SOURCE: CFOSolve / SOAR** UNAUDITED and UNADJUSTED **(Run Date: Jul 19, 2019)
AH0 - Mayor's Office of Legal Counsel
GAAP Category
CSG CSG Title % of Budget
Revised Budget
Expenditures Encumbrance ID Advances
Pre Encumbrance
Total Commitments
Available Balance
% Available
Balance
%Spent and
Obligated as of June 2019
%Spent and
Obligated as of June 2018
Personnel Services
0011 Regular Pay - Cont Full Time
1,315,486 695,619 0 0 0 0 619,867 47.1% 52.9% 70.9%
0014 Fringe Benefits - Curr Personnel
243,365 141,135 0 0 0 0 102,230 42.0% 58.0% 82.1%
Personnel Services 95.4% 1,558,851 900,277 0 0 0 0 658,574 42.2% 57.8% 74.0%
Non-Personnel Services
0020 Supplies And Materials
7,500 0 660 0 0 660 6,840 91.2% 8.8% 0.7%
0031 Telecommunications 500 0 0 660 0 660 (160) (32.0%) 132.0% 3.5%
0040 Other Services And Charges
51,654 3,154 0 7,000 0 7,000 41,500 80.3% 19.7% 13.9%
0070 Equipment & Equipment Rental
15,000 2,318 0 0 0 0 12,682 84.5% 15.5% 0.0%
Non-Personnel Services 4.6% 74,654 5,473 660 7,660 0 8,320 60,861 81.5% 18.5% 9.2%
AH0 - Mayor's Office of Legal Counsel 100.0% 1,633,505 905,750 660 7,660 0 8,320 719,435 44.0% 56.0% 67.3%
% Of Budget for AH0 - Mayor's Office of Legal Counsel 55.4% 0.5%
Financial Status Report - (Operating Expenditures) as of June 30, 2019 J - 8

Government of the District of Columbia FY 2019 Financial Status Reports (as of June 30, 2019)General Fund: Local Funds (0100) By Comptroller Source Group
% Monthly Time Elapsed: 75.0%
Office of the Chief Financial Officer % Monthly Time Remaining: 25.0%SOURCE: CFOSolve / SOAR** UNAUDITED and UNADJUSTED **(Run Date: Jul 19, 2019)
AI0 - Office of the Senior Advisor
GAAP Category
CSG CSG Title % of Budget
Revised Budget
Expenditures Encumbrance ID Advances
Pre Encumbrance
Total Commitments
Available Balance
% Available
Balance
%Spent and
Obligated as of June 2019
%Spent and
Obligated as of June 2018
Personnel Services
0011 Regular Pay - Cont Full Time
1,794,262 1,406,720 0 0 0 0 387,542 21.6% 78.4% 75.8%
0012 Regular Pay - Other 198,880 30,255 0 0 0 0 168,625 84.8% 15.2% 0.0%
0014 Fringe Benefits - Curr Personnel
331,315 221,305 0 0 0 0 110,010 33.2% 66.8% 61.2%
Personnel Services 71.6% 2,324,458 1,660,749 0 0 0 0 663,708 28.6% 71.4% 72.4%
Non-Personnel Services
0020 Supplies And Materials
66,620 34,851 0 18,940 0 18,940 12,829 19.3% 80.7% 51.7%
0031 Telecommunications 0 0 0 2,578 0 2,578 (2,578) N/A N/A 53.0%
0040 Other Services And Charges
834,000 317,731 279,067 33,210 94,500 406,777 109,492 13.1% 86.9% 50.9%
0041 Contractual Services - Other
0 0 0 0 0 0 0 N/A N/A 45.2%
0070 Equipment & Equipment Rental
20,999 2,998 0 7,002 0 7,002 10,999 52.4% 47.6% 97.8%
Non-Personnel Services 28.4% 921,620 355,580 279,067 61,730 94,500 435,297 130,742 14.2% 85.8% 47.4%
AI0 - Office of the Senior Advisor 100.0% 3,246,077 2,016,330 279,067 61,730 94,500 435,297 794,450 24.5% 75.5% 63.7%
% Of Budget for AI0 - Office of the Senior Advisor 62.1% 13.4%
Financial Status Report - (Operating Expenditures) as of June 30, 2019 J - 9

Government of the District of Columbia FY 2019 Financial Status Reports (as of June 30, 2019)General Fund: Local Funds (0100) By Comptroller Source Group
% Monthly Time Elapsed: 75.0%
Office of the Chief Financial Officer % Monthly Time Remaining: 25.0%SOURCE: CFOSolve / SOAR** UNAUDITED and UNADJUSTED **(Run Date: Jul 19, 2019)
AL0 - Uniform Law Commission
GAAP Category CSG CSG Title % of Budget
Revised Budget
Expenditures Encumbrance ID Advances
Pre Encumbrance
Total Commitments
Available Balance
% Available
Balance
%Spent and
Obligated as of June 2019
%Spent and
Obligated as of June 2018
Non-Personnel Services
0040 Other Services And Charges
60,250 51,864 0 0 0 0 8,386 13.9% 86.1% 74.5%
Non-Personnel Services 100.0% 60,250 51,864 0 0 0 0 8,386 13.9% 86.1% 74.5%
AL0 - Uniform Law Commission 100.0% 60,250 51,864 0 0 0 0 8,386 13.9% 86.1% 74.5%
% Of Budget for AL0 - Uniform Law Commission 86.1% 0.0%
Financial Status Report - (Operating Expenditures) as of June 30, 2019 J - 10

Government of the District of Columbia FY 2019 Financial Status Reports (as of June 30, 2019)General Fund: Local Funds (0100) By Comptroller Source Group
% Monthly Time Elapsed: 75.0%
Office of the Chief Financial Officer % Monthly Time Remaining: 25.0%SOURCE: CFOSolve / SOAR** UNAUDITED and UNADJUSTED **(Run Date: Jul 19, 2019)
AM0 - Department of General Services
GAAP Category
CSG CSG Title % of Budget
Revised Budget
Expenditures Encumbrance ID Advances
Pre Encumbrance
Total Commitments
Available Balance
% Available
Balance
%Spent and
Obligated as of June 2019
%Spent and
Obligated as of June 2018
Personnel Services
0011 Regular Pay - Cont Full Time
48,072,402 33,822,221 0 61,895 0 61,895 14,188,286 29.5% 70.5% 77.2%
0012 Regular Pay - Other 1,424,233 279,946 0 0 0 0 1,144,287 80.3% 19.7% 43.9%
0013 Additional Gross Pay 1,461,097 1,495,144 0 0 0 0 (34,047) (2.3%) 102.3% 61.8%
0014 Fringe Benefits - Curr Personnel
13,647,720 8,662,421 0 13,111 0 13,111 4,972,188 36.4% 63.6% 72.5%
0015 Overtime Pay 2,296,378 3,678,054 0 0 0 0 (1,381,676) (60.2%) 160.2% 161.4%
Personnel Services 19.9% 66,901,829 47,937,786 0 75,006 0 75,006 18,889,037 28.2% 71.8% 77.8%
Non-Personnel Services
0020 Supplies And Materials
2,663,537 972,251 1,240,531 125,853 243,569 1,609,953 81,333 3.1% 96.9% 92.6%
0030 Energy, Comm. And Bldg Rentals
57,463,030 33,762,460 1,709,606 14,803 674,995 2,399,405 21,301,164 37.1% 62.9% 70.0%
0031 Telecommunications 105,000 3,903 0 33,766 0 33,766 67,330 64.1% 35.9% 46.0%
0032 Rentals - Land And Structures
68,416,971 64,945,162 0 0 0 0 3,471,809 5.1% 94.9% 71.0%
0034 Security Services 23,398,040 10,015,878 6,152,882 10,550 2,784,736 8,948,167 4,433,995 19.0% 81.0% 97.3%
0035 Occupancy Fixed Costs
62,719,804 35,692,953 19,866,686 0 6,386,960 26,253,646 773,206 1.2% 98.8% 97.8%
0040 Other Services And Charges
8,772,884 4,912,744 1,881,046 780,036 983,972 3,645,054 215,087 2.5% 97.5% 88.1%
0041 Contractual Services - Other
35,404,831 9,981,832 17,292,444 104,376 5,015,533 22,412,353 3,010,646 8.5% 91.5% 91.8%
0070 Equipment & Equipment Rental
365,955 68,207 82,407 0 88,053 170,460 127,287 34.8% 65.2% 82.0%
0080 Debt Service 9,273,610 0 0 0 0 0 9,273,610 100.0% 0.0% N/A
Non-Personnel Services 80.1% 268,583,662 160,355,391 48,225,602 1,069,386 16,177,818 65,472,805 42,755,466 15.9% 84.1% 82.7%
AM0 - Department of General Services 100.0% 335,485,491 208,293,177 48,225,602 1,144,391 16,177,818 65,547,811 61,644,503 18.4% 81.6% 81.8%
% Of Budget for AM0 - Department of General Services
62.1% 19.5%
Financial Status Report - (Operating Expenditures) as of June 30, 2019 J - 11

Government of the District of Columbia FY 2019 Financial Status Reports (as of June 30, 2019)General Fund: Local Funds (0100) By Comptroller Source Group
% Monthly Time Elapsed: 75.0%
Office of the Chief Financial Officer % Monthly Time Remaining: 25.0%SOURCE: CFOSolve / SOAR** UNAUDITED and UNADJUSTED **(Run Date: Jul 19, 2019)
AR0 - Statehood Initiatives
GAAP Category
CSG CSG Title % of Budget
Revised Budget
Expenditures Encumbrance ID Advances
Pre Encumbrance
Total Commitments
Available Balance
% Available
Balance
%Spent and
Obligated as of June 2019
%Spent and
Obligated as of June 2018
Personnel Services
0012 Regular Pay - Other 127,800 107,265 0 0 0 0 20,536 16.1% 83.9% 85.1%
0014 Fringe Benefits - Curr Personnel
14,314 15,384 0 0 0 0 (1,070) (7.5%) 107.5% 111.2%
Personnel Services 58.1% 142,114 122,954 0 0 0 0 19,160 13.5% 86.5% 87.2%
Non-Personnel Services
0020 Supplies And Materials
15,340 1,599 0 11,971 0 11,971 1,770 11.5% 88.5% 75.9%
0040 Other Services And Charges
77,141 57,118 0 (1,093) 0 (1,093) 21,115 27.4% 72.6% 64.8%
0050 Subsidies And Transfers
10,000 0 0 0 0 0 10,000 100.0% 0.0% N/A
Non-Personnel Services 41.9% 102,481 58,717 0 10,878 0 10,878 32,885 32.1% 67.9% 67.8%
AR0 - Statehood Initiatives 100.0% 244,595 181,672 0 10,878 0 10,878 52,045 21.3% 78.7% 79.8%
% Of Budget for AR0 - Statehood Initiatives 74.3% 4.4%
Financial Status Report - (Operating Expenditures) as of June 30, 2019 J - 12

Government of the District of Columbia FY 2019 Financial Status Reports (as of June 30, 2019)General Fund: Local Funds (0100) By Comptroller Source Group
% Monthly Time Elapsed: 75.0%
Office of the Chief Financial Officer % Monthly Time Remaining: 25.0%SOURCE: CFOSolve / SOAR** UNAUDITED and UNADJUSTED **(Run Date: Jul 19, 2019)
AS0 - Office of Finance and Resource Management
GAAP Category
CSG CSG Title % of Budget
Revised Budget
Expenditures Encumbrance ID Advances
Pre Encumbrance
Total Commitments
Available Balance
% Available
Balance
%Spent and
Obligated as of June 2019
%Spent and
Obligated as of June 2018
Personnel Services
0011 Regular Pay - Cont Full Time
4,277,460 2,828,991 0 0 0 0 1,448,469 33.9% 66.1% 74.7%
0012 Regular Pay - Other 49,566 0 0 0 0 0 49,566 100.0% 0.0% 33.4%
0014 Fringe Benefits - Curr Personnel
963,365 633,920 0 0 0 0 329,445 34.2% 65.8% 73.1%
0015 Overtime Pay 4,070 4,258 0 0 0 0 (188) (4.6%) 104.6% 96.2%
Personnel Services 19.5% 5,294,461 3,513,684 0 0 0 0 1,780,777 33.6% 66.4% 74.7%
Non-Personnel Services
0020 Supplies And Materials
50,000 24,496 0 0 0 0 25,504 51.0% 49.0% 47.6%
0031 Telecommunications 21,520,877 11,147,821 0 3,436,960 0 3,436,960 6,936,096 32.2% 67.8% 69.2%
0040 Other Services And Charges
217,418 148,452 7,600 0 0 7,600 61,366 28.2% 71.8% 81.7%
0070 Equipment & Equipment Rental
40,000 28,481 0 0 0 0 11,519 28.8% 71.2% 79.4%
Non-Personnel Services 80.5% 21,828,295 11,349,250 7,600 3,436,960 0 3,444,560 7,034,485 32.2% 67.8% 69.3%
AS0 - Office of Finance and Resource Management
100.0% 27,122,756 14,862,934 7,600 3,436,960 0 3,444,560 8,815,262 32.5% 67.5% 70.4%
% Of Budget for AS0 - Office of Finance and Resource Management
54.8% 12.7%
Financial Status Report - (Operating Expenditures) as of June 30, 2019 J - 13

Government of the District of Columbia FY 2019 Financial Status Reports (as of June 30, 2019)General Fund: Local Funds (0100) By Comptroller Source Group
% Monthly Time Elapsed: 75.0%
Office of the Chief Financial Officer % Monthly Time Remaining: 25.0%SOURCE: CFOSolve / SOAR** UNAUDITED and UNADJUSTED **(Run Date: Jul 19, 2019)
AT0 - Office of the Chief Financial Officer
GAAP Category
CSG CSG Title % of Budget
Revised Budget
Expenditures Encumbrance ID Advances
Pre Encumbrance
Total Commitments
Available Balance
% Available
Balance
%Spent and
Obligated as of June 2019
%Spent and
Obligated as of June 2018
Personnel Services
0011 Regular Pay - Cont Full Time
85,141,244 61,722,332 0 0 0 0 23,418,912 27.5% 72.5% 73.8%
0012 Regular Pay - Other 1,193,397 1,514,632 0 0 0 0 (321,235) (26.9%) 126.9% 151.5%
0013 Additional Gross Pay
51,250 443,216 0 0 0 0 (391,966) (764.8%) 864.8% 563.1%
0014 Fringe Benefits - Curr Personnel
18,583,087 13,461,937 0 0 0 0 5,121,151 27.6% 72.4% 74.3%
0015 Overtime Pay 25,000 316,972 0 0 0 0 (291,972) (1,167.9%) 1,267.9% 1,157.7%
Personnel Services 77.6% 104,993,979 77,459,089 0 0 0 0 27,534,890 26.2% 73.8% 75.1%
Non-Personnel Services
0020 Supplies And Materials
405,849 150,462 77,555 47,386 0 124,941 130,445 32.1% 67.9% 70.0%
0031 Telecommunications 0 4,619 0 155,381 0 155,381 (160,000) N/A N/A N/A
0040 Other Services And Charges
10,895,272 7,699,112 1,388,776 651,729 512,950 2,553,455 642,705 5.9% 94.1% 84.4%
0041 Contractual Services - Other
17,494,007 9,494,311 4,318,056 171,700 3,199,809 7,689,564 310,131 1.8% 98.2% 84.5%
0050 Subsidies And Transfers
35,000 0 0 0 0 0 35,000 100.0% 0.0% N/A
0070 Equipment & Equipment Rental
1,397,080 1,108,358 132,348 12,000 2,900 147,248 141,475 10.1% 89.9% 70.2%
Non-Personnel Services 22.4% 30,227,208 18,456,863 5,916,734 1,038,196 3,715,659 10,670,589 1,099,756 3.6% 96.4% 83.9%
AT0 - Office of the Chief Financial Officer 100.0% 135,221,186 95,915,951 5,916,734 1,038,196 3,715,659 10,670,589 28,634,646 21.2% 78.8% 77.0%
% Of Budget for AT0 - Office of the Chief Financial Officer
70.9% 7.9%
Financial Status Report - (Operating Expenditures) as of June 30, 2019 J - 14

Government of the District of Columbia FY 2019 Financial Status Reports (as of June 30, 2019)General Fund: Local Funds (0100) By Comptroller Source Group
% Monthly Time Elapsed: 75.0%
Office of the Chief Financial Officer % Monthly Time Remaining: 25.0%SOURCE: CFOSolve / SOAR** UNAUDITED and UNADJUSTED **(Run Date: Jul 19, 2019)
BA0 - Office of the Secretary
GAAP Category
CSG CSG Title % of Budget
Revised Budget
Expenditures Encumbrance ID Advances
Pre Encumbrance
Total Commitments
Available Balance
% Available
Balance
%Spent and
Obligated as of June 2019
%Spent and
Obligated as of June 2018
Personnel Services
0011 Regular Pay - Cont Full Time
1,855,805 1,411,823 0 0 0 0 443,983 23.9% 76.1% 76.8%
0012 Regular Pay - Other 55,418 66,527 0 0 0 0 (11,109) (20.0%) 120.0% 78.3%
0014 Fringe Benefits - Curr Personnel
366,555 302,895 0 0 0 0 63,660 17.4% 82.6% 87.1%
0015 Overtime Pay 19,000 0 0 0 0 0 19,000 100.0% 0.0% 0.0%
Personnel Services 74.1% 2,296,778 1,825,212 0 0 0 0 471,566 20.5% 79.5% 77.7%
Non-Personnel Services
0020 Supplies And Materials
50,000 4,021 0 10,000 0 10,000 35,979 72.0% 28.0% 88.4%
0031 Telecommunications 0 0 0 2,547 0 2,547 (2,547) N/A N/A N/A
0040 Other Services And Charges
75,581 63,842 5,124 (14,530) 0 (9,406) 21,144 28.0% 72.0% 80.7%
0041 Contractual Services - Other
475,446 342,806 34,975 5,000 0 39,975 92,665 19.5% 80.5% 97.7%
0050 Subsidies And Transfers
200,000 200,000 0 0 0 0 0 0.0% 100.0% 100.0%
Non-Personnel Services 25.9% 801,027 610,669 40,099 3,017 0 43,116 147,241 18.4% 81.6% 95.7%
BA0 - Office of the Secretary 100.0% 3,097,805 2,435,881 40,099 3,017 0 43,116 618,808 20.0% 80.0% 82.6%
% Of Budget for BA0 - Office of the Secretary 78.6% 1.4%
Financial Status Report - (Operating Expenditures) as of June 30, 2019 J - 15

Government of the District of Columbia FY 2019 Financial Status Reports (as of June 30, 2019)General Fund: Local Funds (0100) By Comptroller Source Group
% Monthly Time Elapsed: 75.0%
Office of the Chief Financial Officer % Monthly Time Remaining: 25.0%SOURCE: CFOSolve / SOAR** UNAUDITED and UNADJUSTED **(Run Date: Jul 19, 2019)
BE0 - D.C. Department of Human Resources
GAAP Category
CSG CSG Title % of Budget
Revised Budget
Expenditures Encumbrance ID Advances
Pre Encumbrance
Total Commitments
Available Balance
% Available
Balance
%Spent and
Obligated as of June 2019
%Spent and
Obligated as of June 2018
Personnel Services
0011 Regular Pay - Cont Full Time
8,830,993 5,165,518 0 250,000 0 250,000 3,415,474 38.7% 61.3% 72.0%
0012 Regular Pay - Other 224,369 2,058,121 0 0 0 0 (1,833,752) (817.3%) 917.3% 153.5%
0014 Fringe Benefits - Curr Personnel
1,882,250 1,343,386 0 0 0 0 538,864 28.6% 71.4% 72.7%
Personnel Services 96.2% 10,937,612 8,702,581 0 250,000 0 250,000 1,985,031 18.1% 81.9% 81.0%
Non-Personnel Services
0040 Other Services And Charges
47,500 2,864 0 841 0 841 43,795 92.2% 7.8% 112.7%
0041 Contractual Services - Other
238,504 84,881 0 0 130,000 130,000 23,623 9.9% 90.1% 74.3%
0070 Equipment & Equipment Rental
142,500 0 0 0 0 0 142,500 100.0% 0.0% N/A
Non-Personnel Services 3.8% 428,504 87,745 0 841 130,000 130,841 209,917 49.0% 51.0% 74.6%
BE0 - D.C. Department of Human Resources 100.0% 11,366,116 8,790,326 0 250,841 130,000 380,841 2,194,948 19.3% 80.7% 80.6%
% Of Budget for BE0 - D.C. Department of Human Resources
77.3% 3.4%
Financial Status Report - (Operating Expenditures) as of June 30, 2019 J - 16

Government of the District of Columbia FY 2019 Financial Status Reports (as of June 30, 2019)General Fund: Local Funds (0100) By Comptroller Source Group
% Monthly Time Elapsed: 75.0%
Office of the Chief Financial Officer % Monthly Time Remaining: 25.0%SOURCE: CFOSolve / SOAR** UNAUDITED and UNADJUSTED **(Run Date: Jul 19, 2019)
CB0 - Office of the Attorney General for the District of Columbia
GAAP Category
CSG CSG Title % of Budget
Revised Budget
Expenditures Encumbrance ID Advances
Pre Encumbrance
Total Commitments
Available Balance
% Available
Balance
%Spent and
Obligated as of June 2019
%Spent and
Obligated as of June 2018
Personnel Services
0011 Regular Pay - Cont Full Time
44,003,401 32,371,203 0 0 0 0 11,632,198 26.4% 73.6% 76.0%
0012 Regular Pay - Other 3,003,721 2,805,042 0 0 0 0 198,679 6.6% 93.4% 72.3%
0013 Additional Gross Pay 856,864 457,964 0 0 0 0 398,901 46.6% 53.4% 48.1%
0014 Fringe Benefits - Curr Personnel
10,128,430 6,914,424 0 0 0 0 3,214,006 31.7% 68.3% 73.2%
Personnel Services 86.3% 57,992,416 42,655,975 0 0 0 0 15,336,441 26.4% 73.6% 75.0%
Non-Personnel Services
0020 Supplies And Materials
401,687 198,434 75,816 56,211 0 132,027 71,226 17.7% 82.3% 48.0%
0030 Energy, Comm. And Bldg Rentals
595,489 497,133 0 98,357 0 98,357 0 0.0% 100.0% 100.0%
0031 Telecommunications 386,058 362,922 0 135,792 0 135,792 (112,656) (29.2%) 129.2% 135.7%
0034 Security Services 192,141 140,761 0 51,380 0 51,380 0 0.0% 100.0% 100.0%
0035 Occupancy Fixed Costs
1,151,800 522,055 0 629,745 0 629,745 0 0.0% 100.0% 100.0%
0040 Other Services And Charges
2,041,882 1,081,602 342,326 104,311 30,127 476,764 483,515 23.7% 76.3% 57.8%
0041 Contractual Services - Other
3,461,627 1,487,698 556,985 37,331 311,700 906,017 1,067,913 30.9% 69.1% 68.8%
0050 Subsidies And Transfers
543,846 150,532 66,524 0 0 66,524 326,790 60.1% 39.9% 34.5%
0070 Equipment & Equipment Rental
395,980 168,987 63,391 10,000 0 73,391 153,601 38.8% 61.2% 28.8%
Non-Personnel Services 13.7% 9,170,510 4,610,125 1,105,043 1,123,126 341,827 2,569,996 1,990,389 21.7% 78.3% 67.7%
CB0 - Office of the Attorney General for the District of Columbia
100.0% 67,162,926 47,266,100 1,105,043 1,123,126 341,827 2,569,996 17,326,830 25.8% 74.2% 73.8%
% Of Budget for CB0 - Office of the Attorney General for the District of Columbia
70.4% 3.8%
Financial Status Report - (Operating Expenditures) as of June 30, 2019 J - 17

Government of the District of Columbia FY 2019 Financial Status Reports (as of June 30, 2019)General Fund: Local Funds (0100) By Comptroller Source Group
% Monthly Time Elapsed: 75.0%
Office of the Chief Financial Officer % Monthly Time Remaining: 25.0%SOURCE: CFOSolve / SOAR** UNAUDITED and UNADJUSTED **(Run Date: Jul 19, 2019)
CG0 - Public Employee Relations Board
GAAP Category
CSG CSG Title % of Budget
Revised Budget
Expenditures Encumbrance ID Advances
Pre Encumbrance
Total Commitments
Available Balance
% Available
Balance
%Spent and
Obligated as of June 2019
%Spent and
Obligated as of June 2018
Personnel Services
0011 Regular Pay - Cont Full Time
1,003,443 554,451 0 0 0 0 448,992 44.7% 55.3% 61.4%
0014 Fringe Benefits - Curr Personnel
204,702 98,303 0 0 0 0 106,399 52.0% 48.0% 53.1%
Personnel Services 80.1% 1,208,145 658,787 0 0 0 0 549,359 45.5% 54.5% 60.1%
Non-Personnel Services
0020 Supplies And Materials
5,000 3,903 0 2,842 0 2,842 (1,745) (34.9%) 134.9% 93.0%
0031 Telecommunications 23,146 7,048 0 21,867 0 21,867 (5,768) (24.9%) 124.9% 100.0%
0040 Other Services And Charges
83,295 58,212 38,343 (2,842) 0 35,501 (10,418) (12.5%) 112.5% 103.5%
0041 Contractual Services - Other
184,019 46,680 128,940 0 0 128,940 8,398 4.6% 95.4% 98.4%
0070 Equipment & Equipment Rental
5,000 9,763 0 0 0 0 (4,763) (95.3%) 195.3% 82.5%
Non-Personnel Services 19.9% 300,460 125,605 167,283 21,867 0 189,150 (14,296) (4.8%) 104.8% 99.0%
CG0 - Public Employee Relations Board 100.0% 1,508,605 784,392 167,283 21,867 0 189,150 535,063 35.5% 64.5% 68.3%
% Of Budget for CG0 - Public Employee Relations Board
52.0% 12.5%
Financial Status Report - (Operating Expenditures) as of June 30, 2019 J - 18

Government of the District of Columbia FY 2019 Financial Status Reports (as of June 30, 2019)General Fund: Local Funds (0100) By Comptroller Source Group
% Monthly Time Elapsed: 75.0%
Office of the Chief Financial Officer % Monthly Time Remaining: 25.0%SOURCE: CFOSolve / SOAR** UNAUDITED and UNADJUSTED **(Run Date: Jul 19, 2019)
CH0 - Office of Employee Appeals
GAAP Category
CSG CSG Title % of Budget
Revised Budget
Expenditures Encumbrance ID Advances
Pre Encumbrance
Total Commitments
Available Balance
% Available
Balance
%Spent and
Obligated as of June 2019
%Spent and
Obligated as of June 2018
Personnel Services
0011 Regular Pay - Cont Full Time
1,579,547 1,172,885 0 0 0 0 406,662 25.7% 74.3% 78.3%
0012 Regular Pay - Other 130,311 96,806 0 0 0 0 33,505 25.7% 74.3% 79.2%
0014 Fringe Benefits - Curr Personnel
350,520 237,223 0 0 0 0 113,297 32.3% 67.7% 75.3%
Personnel Services 94.6% 2,060,378 1,507,088 0 0 0 0 553,290 26.9% 73.1% 77.9%
Non-Personnel Services
0020 Supplies And Materials
3,000 2,276 0 2,092 0 2,092 (1,368) (45.6%) 145.6% 35.1%
0040 Other Services And Charges
83,824 13,697 4,926 6,550 0 11,476 58,651 70.0% 30.0% 82.9%
0041 Contractual Services - Other
30,000 21,302 12,239 0 0 12,239 (3,541) (11.8%) 111.8% 96.1%
0070 Equipment & Equipment Rental
1,000 0 0 0 0 0 1,000 100.0% 0.0% 73.9%
Non-Personnel Services 5.4% 117,824 37,275 17,164 8,642 0 25,806 54,743 46.5% 53.5% 84.5%
CH0 - Office of Employee Appeals 100.0% 2,178,202 1,544,363 17,164 8,642 0 25,806 608,033 27.9% 72.1% 79.1%
% Of Budget for CH0 - Office of Employee Appeals 70.9% 1.2%
Financial Status Report - (Operating Expenditures) as of June 30, 2019 J - 19

Government of the District of Columbia FY 2019 Financial Status Reports (as of June 30, 2019)General Fund: Local Funds (0100) By Comptroller Source Group
% Monthly Time Elapsed: 75.0%
Office of the Chief Financial Officer % Monthly Time Remaining: 25.0%SOURCE: CFOSolve / SOAR** UNAUDITED and UNADJUSTED **(Run Date: Jul 19, 2019)
CJ0 - Office of Campaign Finance
GAAP Category
CSG CSG Title % of Budget
Revised Budget
Expenditures Encumbrance ID Advances
Pre Encumbrance
Total Commitments
Available Balance
% Available
Balance
%Spent and
Obligated as of June 2019
%Spent and
Obligated as of June 2018
Personnel Services
0011 Regular Pay - Cont Full Time
2,438,936 1,568,478 0 0 0 0 870,458 35.7% 64.3% 70.8%
0014 Fringe Benefits - Curr Personnel
550,851 341,546 0 0 0 0 209,305 38.0% 62.0% 67.4%
Personnel Services 72.9% 2,989,787 1,941,178 0 0 0 0 1,048,610 35.1% 64.9% 70.7%
Non-Personnel Services
0020 Supplies And Materials
35,000 3,951 0 (3,951) 0 (3,951) 35,000 100.0% 0.0% 37.4%
0031 Telecommunications 0 0 0 568 0 568 (568) N/A N/A N/A
0040 Other Services And Charges
627,397 39,450 5,338 7,027 0 12,365 575,582 91.7% 8.3% 89.7%
0041 Contractual Services - Other
387,000 0 0 0 387,000 387,000 0 0.0% 100.0% N/A
0070 Equipment & Equipment Rental
62,000 23,047 32,266 0 0 32,266 6,687 10.8% 89.2% 100.0%
Non-Personnel Services 27.1% 1,111,397 66,448 37,604 3,644 387,000 428,248 616,702 55.5% 44.5% 101.8%
CJ0 - Office of Campaign Finance 100.0% 4,101,184 2,007,625 37,604 3,644 387,000 428,248 1,665,311 40.6% 59.4% 73.8%
% Of Budget for CJ0 - Office of Campaign Finance 49.0% 10.4%
Financial Status Report - (Operating Expenditures) as of June 30, 2019 J - 20
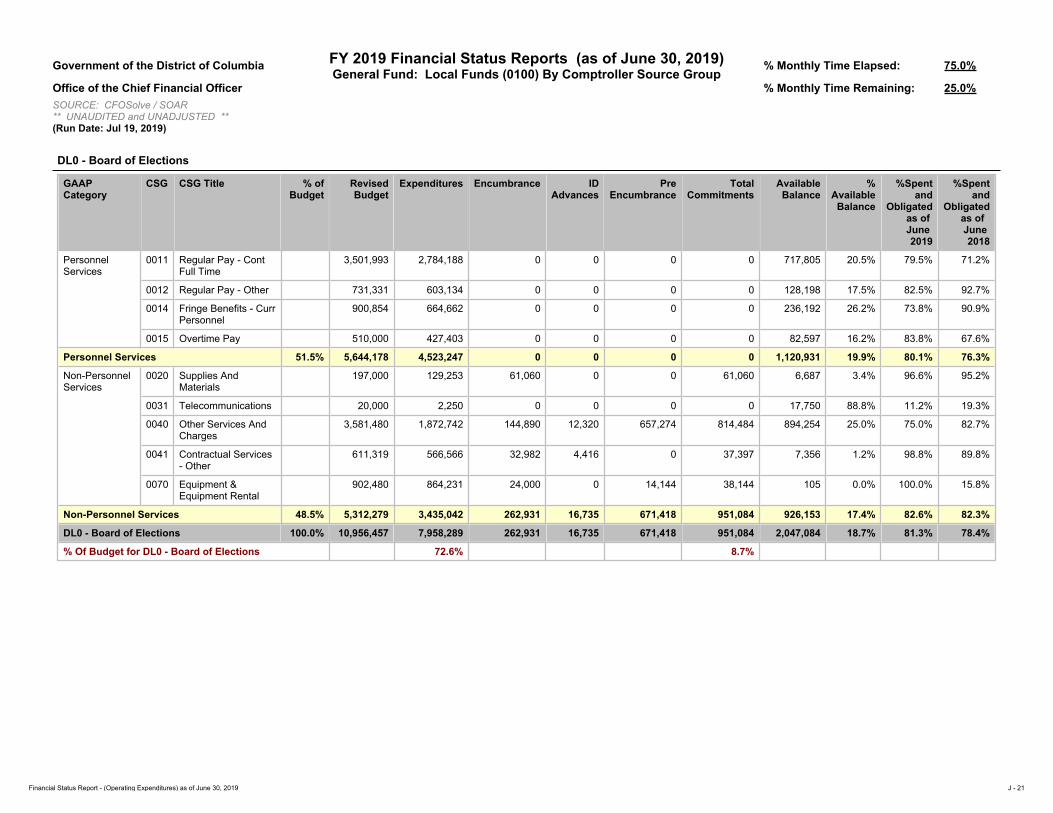
Government of the District of Columbia FY 2019 Financial Status Reports (as of June 30, 2019)General Fund: Local Funds (0100) By Comptroller Source Group
% Monthly Time Elapsed: 75.0%
Office of the Chief Financial Officer % Monthly Time Remaining: 25.0%SOURCE: CFOSolve / SOAR** UNAUDITED and UNADJUSTED **(Run Date: Jul 19, 2019)
DL0 - Board of Elections
GAAP Category
CSG CSG Title % of Budget
Revised Budget
Expenditures Encumbrance ID Advances
Pre Encumbrance
Total Commitments
Available Balance
% Available
Balance
%Spent and
Obligated as of June 2019
%Spent and
Obligated as of June 2018
Personnel Services
0011 Regular Pay - Cont Full Time
3,501,993 2,784,188 0 0 0 0 717,805 20.5% 79.5% 71.2%
0012 Regular Pay - Other 731,331 603,134 0 0 0 0 128,198 17.5% 82.5% 92.7%
0014 Fringe Benefits - Curr Personnel
900,854 664,662 0 0 0 0 236,192 26.2% 73.8% 90.9%
0015 Overtime Pay 510,000 427,403 0 0 0 0 82,597 16.2% 83.8% 67.6%
Personnel Services 51.5% 5,644,178 4,523,247 0 0 0 0 1,120,931 19.9% 80.1% 76.3%
Non-Personnel Services
0020 Supplies And Materials
197,000 129,253 61,060 0 0 61,060 6,687 3.4% 96.6% 95.2%
0031 Telecommunications 20,000 2,250 0 0 0 0 17,750 88.8% 11.2% 19.3%
0040 Other Services And Charges
3,581,480 1,872,742 144,890 12,320 657,274 814,484 894,254 25.0% 75.0% 82.7%
0041 Contractual Services - Other
611,319 566,566 32,982 4,416 0 37,397 7,356 1.2% 98.8% 89.8%
0070 Equipment & Equipment Rental
902,480 864,231 24,000 0 14,144 38,144 105 0.0% 100.0% 15.8%
Non-Personnel Services 48.5% 5,312,279 3,435,042 262,931 16,735 671,418 951,084 926,153 17.4% 82.6% 82.3%
DL0 - Board of Elections 100.0% 10,956,457 7,958,289 262,931 16,735 671,418 951,084 2,047,084 18.7% 81.3% 78.4%
% Of Budget for DL0 - Board of Elections 72.6% 8.7%
Financial Status Report - (Operating Expenditures) as of June 30, 2019 J - 21
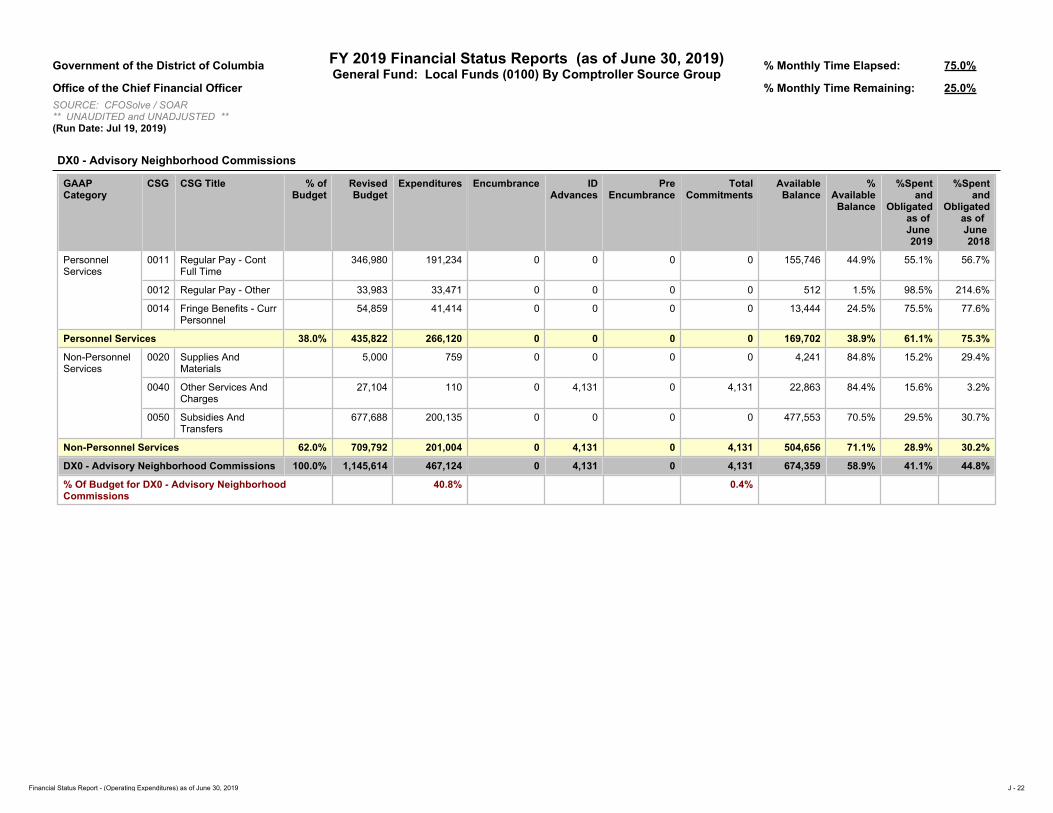
Government of the District of Columbia FY 2019 Financial Status Reports (as of June 30, 2019)General Fund: Local Funds (0100) By Comptroller Source Group
% Monthly Time Elapsed: 75.0%
Office of the Chief Financial Officer % Monthly Time Remaining: 25.0%SOURCE: CFOSolve / SOAR** UNAUDITED and UNADJUSTED **(Run Date: Jul 19, 2019)
DX0 - Advisory Neighborhood Commissions
GAAP Category
CSG CSG Title % of Budget
Revised Budget
Expenditures Encumbrance ID Advances
Pre Encumbrance
Total Commitments
Available Balance
% Available
Balance
%Spent and
Obligated as of June 2019
%Spent and
Obligated as of June 2018
Personnel Services
0011 Regular Pay - Cont Full Time
346,980 191,234 0 0 0 0 155,746 44.9% 55.1% 56.7%
0012 Regular Pay - Other 33,983 33,471 0 0 0 0 512 1.5% 98.5% 214.6%
0014 Fringe Benefits - Curr Personnel
54,859 41,414 0 0 0 0 13,444 24.5% 75.5% 77.6%
Personnel Services 38.0% 435,822 266,120 0 0 0 0 169,702 38.9% 61.1% 75.3%
Non-Personnel Services
0020 Supplies And Materials
5,000 759 0 0 0 0 4,241 84.8% 15.2% 29.4%
0040 Other Services And Charges
27,104 110 0 4,131 0 4,131 22,863 84.4% 15.6% 3.2%
0050 Subsidies And Transfers
677,688 200,135 0 0 0 0 477,553 70.5% 29.5% 30.7%
Non-Personnel Services 62.0% 709,792 201,004 0 4,131 0 4,131 504,656 71.1% 28.9% 30.2%
DX0 - Advisory Neighborhood Commissions 100.0% 1,145,614 467,124 0 4,131 0 4,131 674,359 58.9% 41.1% 44.8%
% Of Budget for DX0 - Advisory Neighborhood Commissions
40.8% 0.4%
Financial Status Report - (Operating Expenditures) as of June 30, 2019 J - 22
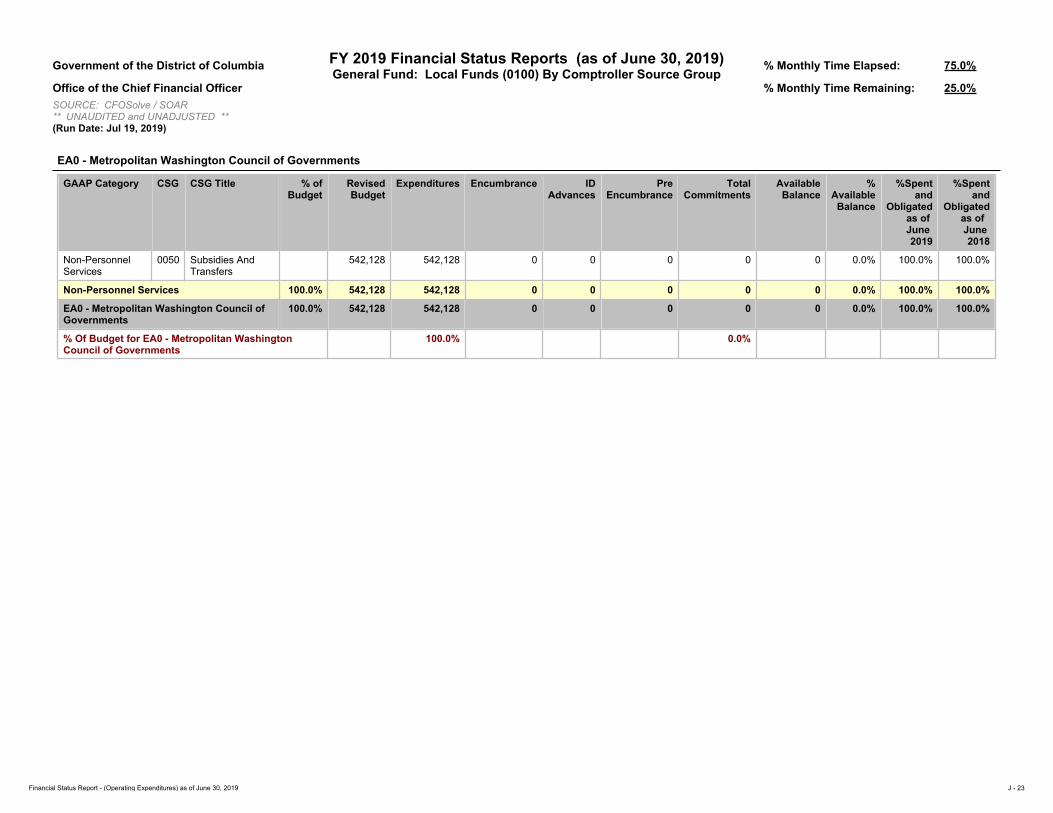
Government of the District of Columbia FY 2019 Financial Status Reports (as of June 30, 2019)General Fund: Local Funds (0100) By Comptroller Source Group
% Monthly Time Elapsed: 75.0%
Office of the Chief Financial Officer % Monthly Time Remaining: 25.0%SOURCE: CFOSolve / SOAR** UNAUDITED and UNADJUSTED **(Run Date: Jul 19, 2019)
EA0 - Metropolitan Washington Council of Governments
GAAP Category CSG CSG Title % of Budget
Revised Budget
Expenditures Encumbrance ID Advances
Pre Encumbrance
Total Commitments
Available Balance
% Available
Balance
%Spent and
Obligated as of June 2019
%Spent and
Obligated as of June 2018
Non-Personnel Services
0050 Subsidies And Transfers
542,128 542,128 0 0 0 0 0 0.0% 100.0% 100.0%
Non-Personnel Services 100.0% 542,128 542,128 0 0 0 0 0 0.0% 100.0% 100.0%
EA0 - Metropolitan Washington Council of Governments
100.0% 542,128 542,128 0 0 0 0 0 0.0% 100.0% 100.0%
% Of Budget for EA0 - Metropolitan Washington Council of Governments
100.0% 0.0%
Financial Status Report - (Operating Expenditures) as of June 30, 2019 J - 23

Government of the District of Columbia FY 2019 Financial Status Reports (as of June 30, 2019)General Fund: Local Funds (0100) By Comptroller Source Group
% Monthly Time Elapsed: 75.0%
Office of the Chief Financial Officer % Monthly Time Remaining: 25.0%SOURCE: CFOSolve / SOAR** UNAUDITED and UNADJUSTED **(Run Date: Jul 19, 2019)
EM0 - Deputy Mayor for Greater Economic Opportunity
GAAP Category
CSG CSG Title % of Budget
Revised Budget
Expenditures Encumbrance ID Advances
Pre Encumbrance
Total Commitments
Available Balance
% Available
Balance
%Spent and
Obligated as of June 2019
%Spent and
Obligated as of June 2018
Personnel Services
0011 Regular Pay - Cont Full Time
1,133,429 642,078 0 0 0 0 491,351 43.4% 56.6% 55.1%
0012 Regular Pay - Other 179,331 27,681 0 0 0 0 151,650 84.6% 15.4% 48.6%
0014 Fringe Benefits - Curr Personnel
280,673 160,406 0 0 0 0 120,267 42.8% 57.2% 82.4%
Personnel Services 29.5% 1,593,433 920,253 0 0 0 0 673,180 42.2% 57.8% 58.3%
Non-Personnel Services
0020 Supplies And Materials
20,291 4,075 0 925 0 925 15,291 75.4% 24.6% 0.2%
0031 Telecommunications 5,582 0 0 6,293 0 6,293 (711) (12.7%) 112.7% 0.0%
0040 Other Services And Charges
134,411 84,425 7,796 33,584 0 41,380 8,606 6.4% 93.6% 105.7%
0041 Contractual Services - Other
0 0 0 0 0 0 0 N/A N/A 21.4%
0050 Subsidies And Transfers
3,621,154 1,255,835 1,508,100 690,508 0 2,198,608 166,711 4.6% 95.4% 100.0%
0070 Equipment & Equipment Rental
30,000 0 0 0 0 0 30,000 100.0% 0.0% N/A
Non-Personnel Services 70.5% 3,811,438 1,344,336 1,515,896 731,310 0 2,247,206 219,897 5.8% 94.2% 54.0%
EM0 - Deputy Mayor for Greater Economic Opportunity
100.0% 5,404,871 2,264,589 1,515,896 731,310 0 2,247,206 893,077 16.5% 83.5% 56.3%
% Of Budget for EM0 - Deputy Mayor for Greater Economic Opportunity
41.9% 41.6%
Financial Status Report - (Operating Expenditures) as of June 30, 2019 J - 24

Government of the District of Columbia FY 2019 Financial Status Reports (as of June 30, 2019)General Fund: Local Funds (0100) By Comptroller Source Group
% Monthly Time Elapsed: 75.0%
Office of the Chief Financial Officer % Monthly Time Remaining: 25.0%SOURCE: CFOSolve / SOAR** UNAUDITED and UNADJUSTED **(Run Date: Jul 19, 2019)
GS0 - Section 103 Judgments - Government Direction and Support
GAAP Category CSG CSG Title % of Budget
Revised Budget
Expenditures Encumbrance ID Advances
Pre Encumbrance
Total Commitments
Available Balance
% Available
Balance
%Spent and
Obligated as of June 2019
%Spent and
Obligated as of June 2018
Non-Personnel Services
0050 Subsidies And Transfers
12,916,510 10,863,385 0 0 0 0 2,053,125 15.9% 84.1% 99.9%
Non-Personnel Services 100.0% 12,916,510 10,863,385 0 0 0 0 2,053,125 15.9% 84.1% 99.9%
GS0 - Section 103 Judgments - Government Direction and Support
100.0% 12,916,510 10,863,385 0 0 0 0 2,053,125 15.9% 84.1% 99.9%
% Of Budget for GS0 - Section 103 Judgments - Government Direction and Support
84.1% 0.0%
Financial Status Report - (Operating Expenditures) as of June 30, 2019 J - 25

Government of the District of Columbia FY 2019 Financial Status Reports (as of June 30, 2019)General Fund: Local Funds (0100) By Comptroller Source Group
% Monthly Time Elapsed: 75.0%
Office of the Chief Financial Officer % Monthly Time Remaining: 25.0%SOURCE: CFOSolve / SOAR** UNAUDITED and UNADJUSTED **(Run Date: Jul 19, 2019)
JR0 - Office of Disability Rights
GAAP Category
CSG CSG Title % of Budget
Revised Budget
Expenditures Encumbrance ID Advances
Pre Encumbrance
Total Commitments
Available Balance
% Available
Balance
%Spent and
Obligated as of June 2019
%Spent and
Obligated as of June 2018
Personnel Services
0011 Regular Pay - Cont Full Time
853,299 635,372 0 0 0 0 217,927 25.5% 74.5% 75.9%
0012 Regular Pay - Other 0 0 0 0 0 0 0 N/A N/A 7.6%
0014 Fringe Benefits - Curr Personnel
185,757 139,881 0 0 0 0 45,877 24.7% 75.3% 72.7%
Personnel Services 90.1% 1,039,056 776,253 0 0 0 0 262,803 25.3% 74.7% 74.5%
Non-Personnel Services
0020 Supplies And Materials 4,500 438 0 562 0 562 3,500 77.8% 22.2% 100.0%
0031 Telephone, Telegraph, Telegram, Etc
0 0 0 0 0 0 0 N/A N/A 1.3%
0040 Other Services And Charges
50,991 28,280 690 6,146 0 6,836 15,875 31.1% 68.9% 47.3%
0041 Contractual Services - Other
54,513 24,838 0 29,674 792 30,466 (792) (1.5%) 101.5% 94.3%
0070 Equipment & Equipment Rental
4,339 0 0 978 0 978 3,361 77.5% 22.5% 49.3%
Non-Personnel Services 9.9% 114,343 53,556 690 37,361 792 38,843 21,944 19.2% 80.8% 67.3%
JR0 - Office of Disability Rights 100.0% 1,153,400 829,810 690 37,361 792 38,843 284,747 24.7% 75.3% 73.7%
% Of Budget for JR0 - Office of Disability Rights 71.9% 3.4%
Financial Status Report - (Operating Expenditures) as of June 30, 2019 J - 26

Government of the District of Columbia FY 2019 Financial Status Reports (as of June 30, 2019)General Fund: Local Funds (0100) By Comptroller Source Group
% Monthly Time Elapsed: 75.0%
Office of the Chief Financial Officer % Monthly Time Remaining: 25.0%SOURCE: CFOSolve / SOAR** UNAUDITED and UNADJUSTED **(Run Date: Jul 19, 2019)
PO0 - Office of Contracting and Procurement
GAAP Category
CSG CSG Title % of Budget
Revised Budget
Expenditures Encumbrance ID Advances
Pre Encumbrance
Total Commitments
Available Balance
% Available
Balance
%Spent and
Obligated as of June 2019
%Spent and
Obligated as of June 2018
Personnel Services
0011 Regular Pay - Cont Full Time
18,421,331 13,573,888 0 0 0 0 4,847,443 26.3% 73.7% 74.4%
0013 Additional Gross Pay 7,842 42,353 0 0 0 0 (34,511) (440.1%) 540.1% 1,029.8%
0014 Fringe Benefits - Curr Personnel
3,979,008 2,851,412 0 0 0 0 1,127,595 28.3% 71.7% 72.8%
Personnel Services 95.8% 22,408,181 16,473,757 0 0 0 0 5,934,424 26.5% 73.5% 75.1%
Non-Personnel Services
0020 Supplies And Materials
67,000 70,818 0 10,000 0 10,000 (13,818) (20.6%) 120.6% 112.9%
0031 Telecommunications 0 0 0 7,500 0 7,500 (7,500) N/A N/A N/A
0040 Other Services And Charges
637,431 271,364 266,637 95,020 0 361,657 4,410 0.7% 99.3% 90.4%
0041 Contractual Services - Other
61,500 44,120 13,228 0 0 13,228 4,152 6.8% 93.2% 101.1%
0070 Equipment & Equipment Rental
219,218 89,656 0 37,240 0 37,240 92,322 42.1% 57.9% 52.8%
Non-Personnel Services 4.2% 985,149 475,958 279,865 149,760 0 429,625 79,566 8.1% 91.9% 87.9%
PO0 - Office of Contracting and Procurement
100.0% 23,393,330 16,949,714 279,865 149,760 0 429,625 6,013,991 25.7% 74.3% 75.8%
% Of Budget for PO0 - Office of Contracting and Procurement
72.5% 1.8%
Financial Status Report - (Operating Expenditures) as of June 30, 2019 J - 27
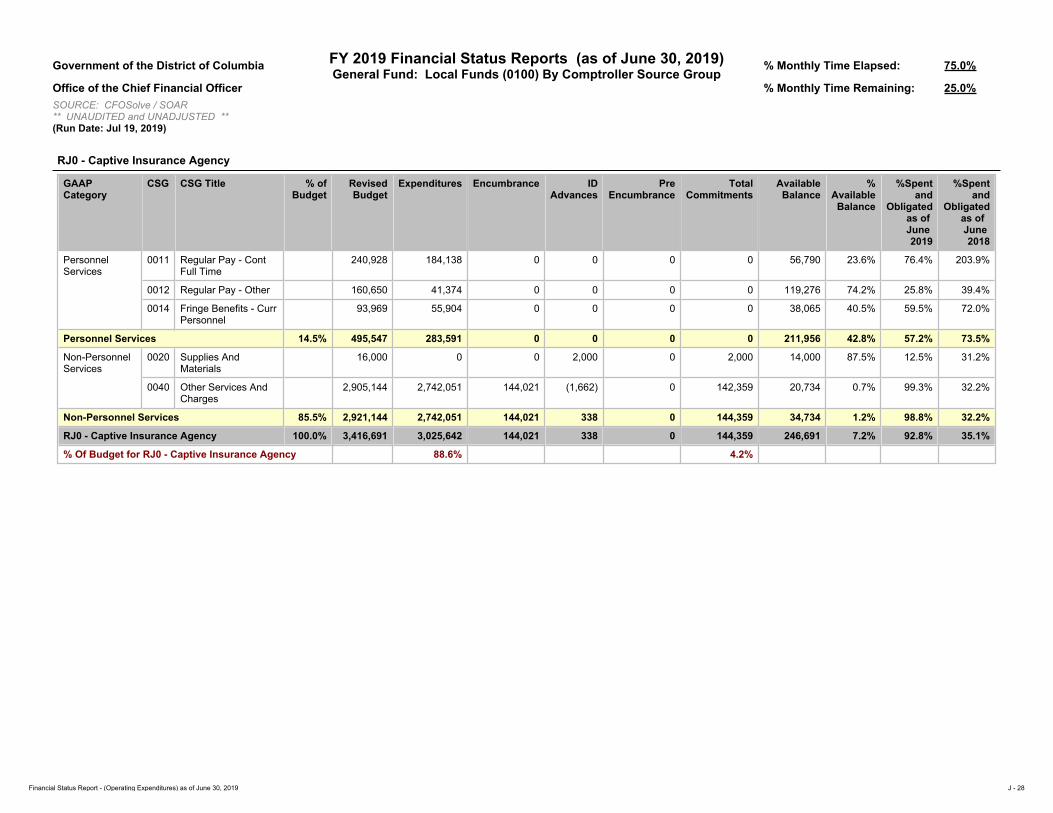
Government of the District of Columbia FY 2019 Financial Status Reports (as of June 30, 2019)General Fund: Local Funds (0100) By Comptroller Source Group
% Monthly Time Elapsed: 75.0%
Office of the Chief Financial Officer % Monthly Time Remaining: 25.0%SOURCE: CFOSolve / SOAR** UNAUDITED and UNADJUSTED **(Run Date: Jul 19, 2019)
RJ0 - Captive Insurance Agency
GAAP Category
CSG CSG Title % of Budget
Revised Budget
Expenditures Encumbrance ID Advances
Pre Encumbrance
Total Commitments
Available Balance
% Available
Balance
%Spent and
Obligated as of June 2019
%Spent and
Obligated as of June 2018
Personnel Services
0011 Regular Pay - Cont Full Time
240,928 184,138 0 0 0 0 56,790 23.6% 76.4% 203.9%
0012 Regular Pay - Other 160,650 41,374 0 0 0 0 119,276 74.2% 25.8% 39.4%
0014 Fringe Benefits - Curr Personnel
93,969 55,904 0 0 0 0 38,065 40.5% 59.5% 72.0%
Personnel Services 14.5% 495,547 283,591 0 0 0 0 211,956 42.8% 57.2% 73.5%
Non-Personnel Services
0020 Supplies And Materials
16,000 0 0 2,000 0 2,000 14,000 87.5% 12.5% 31.2%
0040 Other Services And Charges
2,905,144 2,742,051 144,021 (1,662) 0 142,359 20,734 0.7% 99.3% 32.2%
Non-Personnel Services 85.5% 2,921,144 2,742,051 144,021 338 0 144,359 34,734 1.2% 98.8% 32.2%
RJ0 - Captive Insurance Agency 100.0% 3,416,691 3,025,642 144,021 338 0 144,359 246,691 7.2% 92.8% 35.1%
% Of Budget for RJ0 - Captive Insurance Agency 88.6% 4.2%
Financial Status Report - (Operating Expenditures) as of June 30, 2019 J - 28

Government of the District of Columbia FY 2019 Financial Status Reports (as of June 30, 2019)General Fund: Local Funds (0100) By Comptroller Source Group
% Monthly Time Elapsed: 75.0%
Office of the Chief Financial Officer % Monthly Time Remaining: 25.0%SOURCE: CFOSolve / SOAR** UNAUDITED and UNADJUSTED **(Run Date: Jul 19, 2019)
RK0 - D.C. Office of Risk Management
GAAP Category
CSG CSG Title % of Budget
Revised Budget
Expenditures Encumbrance ID Advances
Pre Encumbrance
Total Commitments
Available Balance
% Available
Balance
%Spent and
Obligated as of June 2019
%Spent and
Obligated as of June 2018
Personnel Services
0011 Regular Pay - Cont Full Time
2,661,128 1,742,433 0 0 0 0 918,695 34.5% 65.5% 69.1%
0012 Regular Pay - Other 646,911 317,800 0 0 0 0 329,111 50.9% 49.1% 95.5%
0014 Fringe Benefits - Curr Personnel
714,276 444,382 0 0 0 0 269,893 37.8% 62.2% 70.7%
Personnel Services 98.0% 4,022,315 2,504,614 0 0 0 0 1,517,700 37.7% 62.3% 74.4%
Non-Personnel Services
0020 Supplies And Materials
8,000 5,874 0 0 0 0 2,126 26.6% 73.4% 2.4%
0031 Telecommunications 0 0 0 1,152 0 1,152 (1,152) N/A N/A 91.1%
0040 Other Services And Charges
72,149 50,102 13,298 8,052 0 21,350 698 1.0% 99.0% 80.8%
0070 Equipment & Equipment Rental
0 0 0 0 0 0 0 N/A N/A 71.1%
Non-Personnel Services 2.0% 80,149 55,976 13,298 9,204 0 22,502 1,671 2.1% 97.9% 73.3%
RK0 - D.C. Office of Risk Management 100.0% 4,102,464 2,560,591 13,298 9,204 0 22,502 1,519,372 37.0% 63.0% 74.1%
% Of Budget for RK0 - D.C. Office of Risk Management 62.4% 0.5%
Financial Status Report - (Operating Expenditures) as of June 30, 2019 J - 29
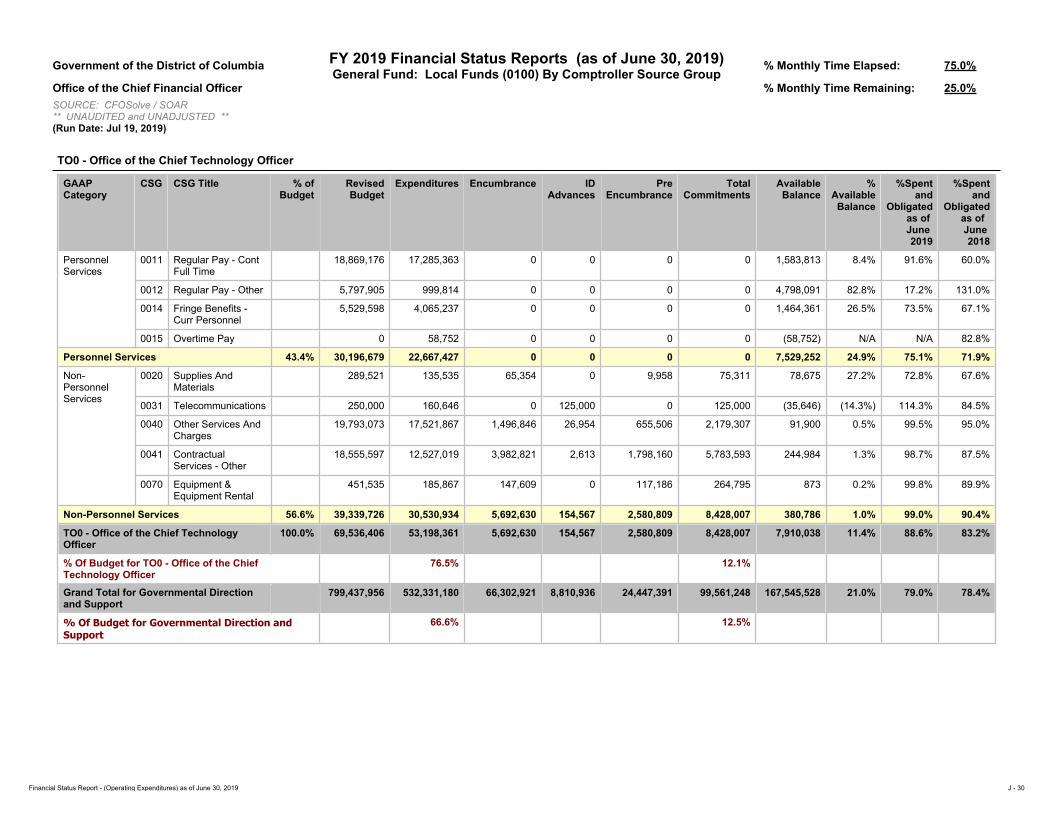
Government of the District of Columbia FY 2019 Financial Status Reports (as of June 30, 2019)General Fund: Local Funds (0100) By Comptroller Source Group
% Monthly Time Elapsed: 75.0%
Office of the Chief Financial Officer % Monthly Time Remaining: 25.0%SOURCE: CFOSolve / SOAR** UNAUDITED and UNADJUSTED **(Run Date: Jul 19, 2019)
TO0 - Office of the Chief Technology Officer
GAAP Category
CSG CSG Title % of Budget
Revised Budget
Expenditures Encumbrance ID Advances
Pre Encumbrance
Total Commitments
Available Balance
% Available
Balance
%Spent and
Obligated as of June 2019
%Spent and
Obligated as of June 2018
Personnel Services
0011 Regular Pay - Cont Full Time
18,869,176 17,285,363 0 0 0 0 1,583,813 8.4% 91.6% 60.0%
0012 Regular Pay - Other 5,797,905 999,814 0 0 0 0 4,798,091 82.8% 17.2% 131.0%
0014 Fringe Benefits - Curr Personnel
5,529,598 4,065,237 0 0 0 0 1,464,361 26.5% 73.5% 67.1%
0015 Overtime Pay 0 58,752 0 0 0 0 (58,752) N/A N/A 82.8%
Personnel Services 43.4% 30,196,679 22,667,427 0 0 0 0 7,529,252 24.9% 75.1% 71.9%
Non-Personnel Services
0020 Supplies And Materials
289,521 135,535 65,354 0 9,958 75,311 78,675 27.2% 72.8% 67.6%
0031 Telecommunications 250,000 160,646 0 125,000 0 125,000 (35,646) (14.3%) 114.3% 84.5%
0040 Other Services And Charges
19,793,073 17,521,867 1,496,846 26,954 655,506 2,179,307 91,900 0.5% 99.5% 95.0%
0041 Contractual Services - Other
18,555,597 12,527,019 3,982,821 2,613 1,798,160 5,783,593 244,984 1.3% 98.7% 87.5%
0070 Equipment & Equipment Rental
451,535 185,867 147,609 0 117,186 264,795 873 0.2% 99.8% 89.9%
Non-Personnel Services 56.6% 39,339,726 30,530,934 5,692,630 154,567 2,580,809 8,428,007 380,786 1.0% 99.0% 90.4%
TO0 - Office of the Chief Technology Officer
100.0% 69,536,406 53,198,361 5,692,630 154,567 2,580,809 8,428,007 7,910,038 11.4% 88.6% 83.2%
% Of Budget for TO0 - Office of the Chief Technology Officer
76.5% 12.1%
Grand Total for Governmental Direction and Support
799,437,956 532,331,180 66,302,921 8,810,936 24,447,391 99,561,248 167,545,528 21.0% 79.0% 78.4%
% Of Budget for Governmental Direction and Support
66.6% 12.5%
Financial Status Report - (Operating Expenditures) as of June 30, 2019 J - 30

(K) Economic Development and Regulation

Government of the District of Columbia FY 2019 Financial Status Reports (as of June 30, 2019)General Fund: Local Funds (0100) By Comptroller Source Group
% Monthly Time Elapsed: 75.0%
Office of the Chief Financial Officer % Monthly Time Remaining: 25.0%SOURCE: CFOSolve / SOAR** UNAUDITED and UNADJUSTED **(Run Date: Jul 19, 2019)
BD0 - Office of Planning
GAAP Category
CSG CSG Title % of Budget
Revised Budget
Expenditures Encumbrance ID Advances
Pre Encumbrance
Total Commitments
Available Balance
% Available
Balance
%Spent and
Obligated as of June 2019
%Spent and
Obligated as of June 2018
Personnel Services
0011 Regular Pay - Cont Full Time
7,525,361 5,517,303 0 0 0 0 2,008,058 26.7% 73.3% 77.5%
0013 Additional Gross Pay 67,714 67,869 0 0 0 0 (155) (0.2%) 100.2% 100.0%
0014 Fringe Benefits - Curr Personnel
1,622,430 1,136,237 0 0 0 0 486,192 30.0% 70.0% 73.3%
0015 Overtime Pay 20,000 12,774 0 0 0 0 7,226 36.1% 63.9% 28.8%
Personnel Services 88.6% 9,235,504 6,734,183 0 0 0 0 2,501,321 27.1% 72.9% 76.5%
Non-Personnel Services
0020 Supplies And Materials
37,500 27,062 0 (3,711) 0 (3,711) 14,149 37.7% 62.3% 7.2%
0031 Telecommunications 0 0 0 5,000 0 5,000 (5,000) N/A N/A 145.9%
0040 Other Services And Charges
231,339 107,052 5,774 25,572 0 31,346 92,941 40.2% 59.8% 76.8%
0041 Contractual Services - Other
557,515 85,846 172,965 495,872 152,600 821,437 (349,767) (62.7%) 162.7% 80.6%
0050 Subsidies And Transfers
304,149 9,966 0 0 0 0 294,183 96.7% 3.3% 31.2%
0070 Equipment & Equipment Rental
53,500 43,333 2,544 0 0 2,544 7,623 14.2% 85.8% 58.7%
Non-Personnel Services 11.4% 1,184,003 273,259 181,283 522,732 152,600 856,615 54,129 4.6% 95.4% 62.1%
BD0 - Office of Planning 100.0% 10,419,508 7,007,442 181,283 522,732 152,600 856,615 2,555,450 24.5% 75.5% 74.5%
% Of Budget for BD0 - Office of Planning 67.3% 8.2%
Financial Status Report - (Operating Expenditures) as of June 30, 2019 K - 1

Government of the District of Columbia FY 2019 Financial Status Reports (as of June 30, 2019)General Fund: Local Funds (0100) By Comptroller Source Group
% Monthly Time Elapsed: 75.0%
Office of the Chief Financial Officer % Monthly Time Remaining: 25.0%SOURCE: CFOSolve / SOAR** UNAUDITED and UNADJUSTED **(Run Date: Jul 19, 2019)
BJ0 - Office of Zoning
GAAP Category
CSG CSG Title % of Budget
Revised Budget
Expenditures Encumbrance ID Advances
Pre Encumbrance
Total Commitments
Available Balance
% Available
Balance
%Spent and
Obligated as of June 2019
%Spent and
Obligated as of June 2018
Personnel Services
0011 Regular Pay - Cont Full Time
1,823,660 1,303,334 0 0 0 0 520,326 28.5% 71.5% 77.1%
0014 Fringe Benefits - Curr Personnel
386,616 268,074 0 0 0 0 118,542 30.7% 69.3% 73.2%
Personnel Services 70.9% 2,210,276 1,629,646 0 0 0 0 580,630 26.3% 73.7% 76.4%
Non-Personnel Services
0020 Supplies And Materials
30,000 11,682 2,064 13,503 0 15,568 2,750 9.2% 90.8% 86.6%
0040 Other Services And Charges
507,690 215,578 7,487 193,240 6,613 207,340 84,772 16.7% 83.3% 83.4%
0041 Contractual Services - Other
338,614 184,221 154,356 0 0 154,356 38 0.0% 100.0% 93.1%
0070 Equipment & Equipment Rental
30,000 0 0 960 19,050 20,010 9,990 33.3% 66.7% 45.7%
Non-Personnel Services 29.1% 906,305 411,481 163,907 207,704 25,663 397,274 97,550 10.8% 89.2% 84.8%
BJ0 - Office of Zoning 100.0% 3,116,580 2,041,127 163,907 207,704 25,663 397,274 678,180 21.8% 78.2% 78.9%
% Of Budget for BJ0 - Office of Zoning 65.5% 12.7%
Financial Status Report - (Operating Expenditures) as of June 30, 2019 K - 2

Government of the District of Columbia FY 2019 Financial Status Reports (as of June 30, 2019)General Fund: Local Funds (0100) By Comptroller Source Group
% Monthly Time Elapsed: 75.0%
Office of the Chief Financial Officer % Monthly Time Remaining: 25.0%SOURCE: CFOSolve / SOAR** UNAUDITED and UNADJUSTED **(Run Date: Jul 19, 2019)
BX0 - Commission on the Arts and Humanities
GAAP Category
CSG CSG Title % of Budget
Revised Budget
Expenditures Encumbrance ID Advances
Pre Encumbrance
Total Commitments
Available Balance
% Available
Balance
%Spent and
Obligated as of June 2019
%Spent and
Obligated as of June 2018
Personnel Services
0011 Regular Pay - Cont Full Time
0 0 0 0 0 0 0 N/A N/A 59.9%
0012 Regular Pay - Other 0 0 0 0 0 0 0 N/A N/A 100.5%
0014 Fringe Benefits - Curr Personnel
0 0 0 0 0 0 0 N/A N/A 83.4%
Personnel Services 0.0% 0 0 0 0 0 0 0 N/A N/A 71.5%
Non-Personnel Services
0020 Supplies And Materials 0 0 0 0 0 0 0 N/A N/A 100.0%
0031 Telephone, Telegraph, Telegram, Etc
0 0 0 0 0 0 0 N/A N/A 100.0%
0040 Other Services And Charges
0 848 0 (586) 0 (586) (261) N/A N/A 61.4%
0041 Contractual Services - Other
0 0 0 0 0 0 0 N/A N/A 71.2%
0050 Subsidies And Transfers
2,861,767 1,187,500 1,587,500 0 10,000 1,597,500 76,767 2.7% 97.3% 96.5%
0070 Equipment & Equipment Rental
0 0 0 0 0 0 0 N/A N/A 82.5%
Non-Personnel Services 100.0% 2,861,767 1,188,348 1,587,500 (586) 10,000 1,596,914 76,506 2.7% 97.3% 93.5%
BX0 - Commission on the Arts and Humanities
100.0% 2,861,767 1,188,348 1,587,500 (586) 10,000 1,596,914 76,506 2.7% 97.3% 92.1%
% Of Budget for BX0 - Commission on the Arts and Humanities
41.5% 55.8%
Financial Status Report - (Operating Expenditures) as of June 30, 2019 K - 3

Government of the District of Columbia FY 2019 Financial Status Reports (as of June 30, 2019)General Fund: Local Funds (0100) By Comptroller Source Group
% Monthly Time Elapsed: 75.0%
Office of the Chief Financial Officer % Monthly Time Remaining: 25.0%SOURCE: CFOSolve / SOAR** UNAUDITED and UNADJUSTED **(Run Date: Jul 19, 2019)
CF0 - Department of Employment Services
GAAP Category
CSG CSG Title % of Budget
Revised Budget
Expenditures Encumbrance ID Advances
Pre Encumbrance
Total Commitments
Available Balance
% Available
Balance
%Spent and
Obligated as of June 2019
%Spent and
Obligated as of June 2018
Personnel Services
0011 Regular Pay - Cont Full Time
12,577,786 11,409,944 0 0 0 0 1,167,841 9.3% 90.7% 78.3%
0012 Regular Pay - Other 7,671,261 3,272,843 0 0 0 0 4,398,418 57.3% 42.7% 56.5%
0014 Fringe Benefits - Curr Personnel
4,714,596 3,208,093 0 0 0 0 1,506,502 32.0% 68.0% 79.2%
0015 Overtime Pay 410,892 125,975 0 0 0 0 284,918 69.3% 30.7% N/A
Personnel Services 36.6% 25,374,534 18,130,531 0 0 0 0 7,244,003 28.5% 71.5% 73.5%
Non-Personnel Services
0020 Supplies And Materials
342,436 184,139 56,045 32,365 555 88,965 69,332 20.2% 79.8% 57.9%
0030 Energy, Comm. And Bldg Rentals
199,599 213,138 0 32,206 0 32,206 (45,745) (22.9%) 122.9% 102.0%
0031 Telecommunications 306,442 229,169 0 157,936 0 157,936 (80,663) (26.3%) 126.3% 107.4%
0032 Rentals - Land And Structures
0 214 0 38,548 0 38,548 (38,762) N/A N/A N/A
0034 Security Services 756,749 375,363 0 956,100 0 956,100 (574,714) (75.9%) 175.9% 167.8%
0035 Occupancy Fixed Costs
1,295,572 371,500 0 545,786 0 545,786 378,286 29.2% 70.8% 113.1%
0040 Other Services And Charges
9,921,794 4,255,651 1,600,293 1,984,314 613,000 4,197,606 1,468,536 14.8% 85.2% 74.9%
0041 Contractual Services - Other
1,557,110 712,641 225,125 3,736 208,814 437,674 406,794 26.1% 73.9% 71.1%
0050 Subsidies And Transfers
29,081,740 7,754,845 3,416,236 1,411,551 674,937 5,502,724 15,824,171 54.4% 45.6% 47.6%
0070 Equipment & Equipment Rental
578,735 71,200 197,647 18,717 35,673 252,036 255,498 44.1% 55.9% 56.3%
Non-Personnel Services 63.4% 44,040,177 14,167,860 5,495,345 5,181,260 1,532,979 12,209,583 17,662,734 40.1% 59.9% 58.0%
CF0 - Department of Employment Services 100.0% 69,414,711 32,298,391 5,495,345 5,181,260 1,532,979 12,209,583 24,906,737 35.9% 64.1% 63.3%
% Of Budget for CF0 - Department of Employment Services
46.5% 17.6%
Financial Status Report - (Operating Expenditures) as of June 30, 2019 K - 4

Government of the District of Columbia FY 2019 Financial Status Reports (as of June 30, 2019)General Fund: Local Funds (0100) By Comptroller Source Group
% Monthly Time Elapsed: 75.0%
Office of the Chief Financial Officer % Monthly Time Remaining: 25.0%SOURCE: CFOSolve / SOAR** UNAUDITED and UNADJUSTED **(Run Date: Jul 19, 2019)
CI0 - Office of Cable Television, Film, Music, and Entertainment
GAAP Category CSG CSG Title % of Budget
Revised Budget
Expenditures Encumbrance ID Advances
Pre Encumbrance
Total Commitments
Available Balance
% Available
Balance
%Spent and
Obligated as of June 2019
%Spent and
Obligated as of June 2018
Personnel Services
0011 Regular Pay - Cont Full Time
685,097 493,592 0 0 0 0 191,505 28.0% 72.0% 125.2%
0012 Regular Pay - Other 92,692 60,804 0 0 0 0 31,888 34.4% 65.6% 19.7%
0014 Fringe Benefits - Curr Personnel
178,114 128,285 0 0 0 0 49,829 28.0% 72.0% 75.7%
Personnel Services 47.9% 955,903 684,680 0 0 0 0 271,222 28.4% 71.6% 74.1%
Non-Personnel Services
0050 Subsidies And Transfers
1,041,729 933,710 100,000 0 0 100,000 8,019 0.8% 99.2% 89.6%
Non-Personnel Services 52.1% 1,041,729 933,710 100,000 0 0 100,000 8,019 0.8% 99.2% 89.6%
CI0 - Office of Cable Television, Film, Music, and Entertainment
100.0% 1,997,631 1,618,390 100,000 0 0 100,000 279,241 14.0% 86.0% 83.8%
% Of Budget for CI0 - Office of Cable Television, Film, Music, and Entertainment
81.0% 5.0%
Financial Status Report - (Operating Expenditures) as of June 30, 2019 K - 5
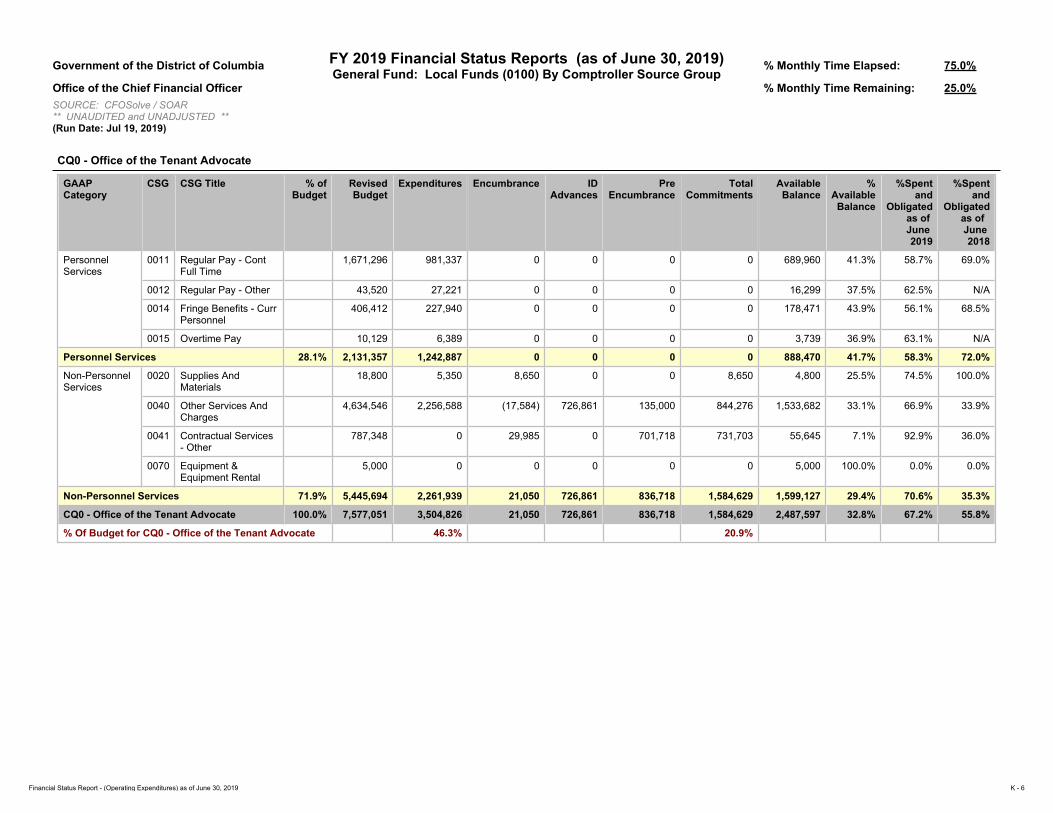
Government of the District of Columbia FY 2019 Financial Status Reports (as of June 30, 2019)General Fund: Local Funds (0100) By Comptroller Source Group
% Monthly Time Elapsed: 75.0%
Office of the Chief Financial Officer % Monthly Time Remaining: 25.0%SOURCE: CFOSolve / SOAR** UNAUDITED and UNADJUSTED **(Run Date: Jul 19, 2019)
CQ0 - Office of the Tenant Advocate
GAAP Category
CSG CSG Title % of Budget
Revised Budget
Expenditures Encumbrance ID Advances
Pre Encumbrance
Total Commitments
Available Balance
% Available
Balance
%Spent and
Obligated as of June 2019
%Spent and
Obligated as of June 2018
Personnel Services
0011 Regular Pay - Cont Full Time
1,671,296 981,337 0 0 0 0 689,960 41.3% 58.7% 69.0%
0012 Regular Pay - Other 43,520 27,221 0 0 0 0 16,299 37.5% 62.5% N/A
0014 Fringe Benefits - Curr Personnel
406,412 227,940 0 0 0 0 178,471 43.9% 56.1% 68.5%
0015 Overtime Pay 10,129 6,389 0 0 0 0 3,739 36.9% 63.1% N/A
Personnel Services 28.1% 2,131,357 1,242,887 0 0 0 0 888,470 41.7% 58.3% 72.0%
Non-Personnel Services
0020 Supplies And Materials
18,800 5,350 8,650 0 0 8,650 4,800 25.5% 74.5% 100.0%
0040 Other Services And Charges
4,634,546 2,256,588 (17,584) 726,861 135,000 844,276 1,533,682 33.1% 66.9% 33.9%
0041 Contractual Services - Other
787,348 0 29,985 0 701,718 731,703 55,645 7.1% 92.9% 36.0%
0070 Equipment & Equipment Rental
5,000 0 0 0 0 0 5,000 100.0% 0.0% 0.0%
Non-Personnel Services 71.9% 5,445,694 2,261,939 21,050 726,861 836,718 1,584,629 1,599,127 29.4% 70.6% 35.3%
CQ0 - Office of the Tenant Advocate 100.0% 7,577,051 3,504,826 21,050 726,861 836,718 1,584,629 2,487,597 32.8% 67.2% 55.8%
% Of Budget for CQ0 - Office of the Tenant Advocate 46.3% 20.9%
Financial Status Report - (Operating Expenditures) as of June 30, 2019 K - 6

Government of the District of Columbia FY 2019 Financial Status Reports (as of June 30, 2019)General Fund: Local Funds (0100) By Comptroller Source Group
% Monthly Time Elapsed: 75.0%
Office of the Chief Financial Officer % Monthly Time Remaining: 25.0%SOURCE: CFOSolve / SOAR** UNAUDITED and UNADJUSTED **(Run Date: Jul 19, 2019)
CR0 - Department of Consumer and Regulatory Affairs
GAAP Category
CSG CSG Title % of Budget
Revised Budget
Expenditures Encumbrance ID Advances
Pre Encumbrance
Total Commitments
Available Balance
% Available
Balance
%Spent and
Obligated as of June 2019
%Spent and
Obligated as of June 2018
Personnel Services
0011 Regular Pay - Cont Full Time
13,811,519 10,772,564 0 0 0 0 3,038,955 22.0% 78.0% 62.4%
0012 Regular Pay - Other 2,291,711 508,030 0 0 0 0 1,783,681 77.8% 22.2% 173.3%
0014 Fringe Benefits - Curr Personnel
4,007,504 2,510,381 0 0 0 0 1,497,123 37.4% 62.6% 64.0%
0015 Overtime Pay 0 172,131 0 0 0 0 (172,131) N/A N/A 96.2%
Personnel Services 84.2% 20,110,734 14,164,423 0 0 0 0 5,946,311 29.6% 70.4% 69.6%
Non-Personnel Services
0031 Telecommunications 0 6,280 0 100,708 0 100,708 (106,988) N/A N/A N/A
0040 Other Services And Charges
1,275,925 541,001 436,137 194 250,000 686,330 48,593 3.8% 96.2% 47.3%
0041 Contractual Services - Other
2,487,000 1,515,612 764,517 (15,554) 0 748,963 222,425 8.9% 91.1% 96.2%
0070 Equipment & Equipment Rental
25,000 10,740 14,260 0 0 14,260 0 0.0% 100.0% N/A
Non-Personnel Services 15.8% 3,787,925 2,073,633 1,214,913 85,348 250,000 1,550,262 164,030 4.3% 95.7% 89.2%
CR0 - Department of Consumer and Regulatory Affairs
100.0% 23,898,659 16,238,057 1,214,913 85,348 250,000 1,550,262 6,110,341 25.6% 74.4% 73.5%
% Of Budget for CR0 - Department of Consumer and Regulatory Affairs
67.9% 6.5%
Financial Status Report - (Operating Expenditures) as of June 30, 2019 K - 7

Government of the District of Columbia FY 2019 Financial Status Reports (as of June 30, 2019)General Fund: Local Funds (0100) By Comptroller Source Group
% Monthly Time Elapsed: 75.0%
Office of the Chief Financial Officer % Monthly Time Remaining: 25.0%SOURCE: CFOSolve / SOAR** UNAUDITED and UNADJUSTED **(Run Date: Jul 19, 2019)
DA0 - Real Property Tax Appeals Commission
GAAP Category
CSG CSG Title % of Budget
Revised Budget
Expenditures Encumbrance ID Advances
Pre Encumbrance
Total Commitments
Available Balance
% Available
Balance
%Spent and
Obligated as of June 2019
%Spent and
Obligated as of June 2018
Personnel Services
0011 Regular Pay - Cont Full Time
375,403 256,908 0 0 0 0 118,495 31.6% 68.4% 70.9%
0012 Regular Pay - Other 751,955 602,613 0 0 0 0 149,342 19.9% 80.1% 80.7%
0014 Fringe Benefits - Curr Personnel
200,670 153,269 0 0 0 0 47,401 23.6% 76.4% 83.1%
Personnel Services 75.3% 1,328,028 1,013,664 0 0 0 0 314,363 23.7% 76.3% 78.4%
Non-Personnel Services
0020 Supplies And Materials
12,000 0 0 12,000 0 12,000 0 0.0% 100.0% 0.0%
0031 Telecommunications 2,500 0 0 0 0 0 2,500 100.0% 0.0% 4.2%
0040 Other Services And Charges
285,698 210,951 0 (2,000) 0 (2,000) 76,747 26.9% 73.1% 61.7%
0041 Contractual Services - Other
125,000 60,000 0 50,000 0 50,000 15,000 12.0% 88.0% 93.3%
0070 Equipment & Equipment Rental
10,000 0 0 0 0 0 10,000 100.0% 0.0% 60.2%
Non-Personnel Services 24.7% 435,198 270,951 0 60,000 0 60,000 104,247 24.0% 76.0% 68.6%
DA0 - Real Property Tax Appeals Commission
100.0% 1,763,225 1,284,615 0 60,000 0 60,000 418,610 23.7% 76.3% 75.8%
% Of Budget for DA0 - Real Property Tax Appeals Commission
72.9% 3.4%
Financial Status Report - (Operating Expenditures) as of June 30, 2019 K - 8

Government of the District of Columbia FY 2019 Financial Status Reports (as of June 30, 2019)General Fund: Local Funds (0100) By Comptroller Source Group
% Monthly Time Elapsed: 75.0%
Office of the Chief Financial Officer % Monthly Time Remaining: 25.0%SOURCE: CFOSolve / SOAR** UNAUDITED and UNADJUSTED **(Run Date: Jul 19, 2019)
DB0 - Department of Housing and Community Development
GAAP Category
CSG CSG Title % of Budget
Revised Budget
Expenditures Encumbrance ID Advances
Pre Encumbrance
Total Commitments
Available Balance
% Available
Balance
%Spent and
Obligated as of June 2019
%Spent and
Obligated as of June 2018
Personnel Services
0011 Regular Pay - Cont Full Time
6,217,327 5,021,103 0 189,252 0 189,252 1,006,971 16.2% 83.8% 79.5%
0012 Regular Pay - Other 896,391 274,493 0 0 0 0 621,898 69.4% 30.6% 50.6%
0013 Additional Gross Pay 175,633 46,812 0 0 0 0 128,821 73.3% 26.7% 37.8%
0014 Fringe Benefits - Curr Personnel
1,555,145 1,079,587 0 26,222 0 26,222 449,336 28.9% 71.1% 71.0%
Personnel Services 22.6% 8,844,496 6,429,896 0 215,474 0 215,474 2,199,127 24.9% 75.1% 72.6%
Non-Personnel Services
0020 Supplies And Materials
19,473 7,901 0 11,573 0 11,573 (1) 0.0% 100.0% 36.8%
0030 Energy, Comm. And Bldg Rentals
565 11,467 0 (10,902) 0 (10,902) 0 0.0% 100.0% 100.0%
0031 Telecommunications 5,264 0 0 10,000 0 10,000 (4,736) (90.0%) 190.0% 25.3%
0032 Rentals - Land And Structures
75,686 2,015,549 0 (1,939,862) 0 (1,939,862) 0 0.0% 100.0% N/A
0034 Security Services 6,087 0 0 6,087 0 6,087 0 0.0% 100.0% 100.0%
0035 Occupancy Fixed Costs
2,050 0 0 2,050 0 2,050 0 0.0% 100.0% 100.0%
0040 Other Services And Charges
303,992 258,872 65,464 (429) 7,000 72,036 (26,916) (8.9%) 108.9% 148.3%
0041 Contractual Services - Other
1,269,102 663,730 402,869 25,000 0 427,869 177,504 14.0% 86.0% 99.6%
0050 Subsidies And Transfers
28,546,354 14,583,547 5,984,535 56,885 7,000,000 13,041,421 921,386 3.2% 96.8% 31.0%
0070 Equipment & Equipment Rental
51,158 32,637 0 4,466 0 4,466 14,055 27.5% 72.5% 23.8%
Non-Personnel Services 77.4% 30,279,731 17,573,702 6,452,869 (1,835,132) 7,007,000 11,624,736 1,081,292 3.6% 96.4% 35.8%
DB0 - Department of Housing and Community Development
100.0% 39,124,227 24,003,598 6,452,869 (1,619,658) 7,007,000 11,840,210 3,280,419 8.4% 91.6% 45.8%
% Of Budget for DB0 - Department of Housing and Community Development
61.4% 30.3%
Financial Status Report - (Operating Expenditures) as of June 30, 2019 K - 9
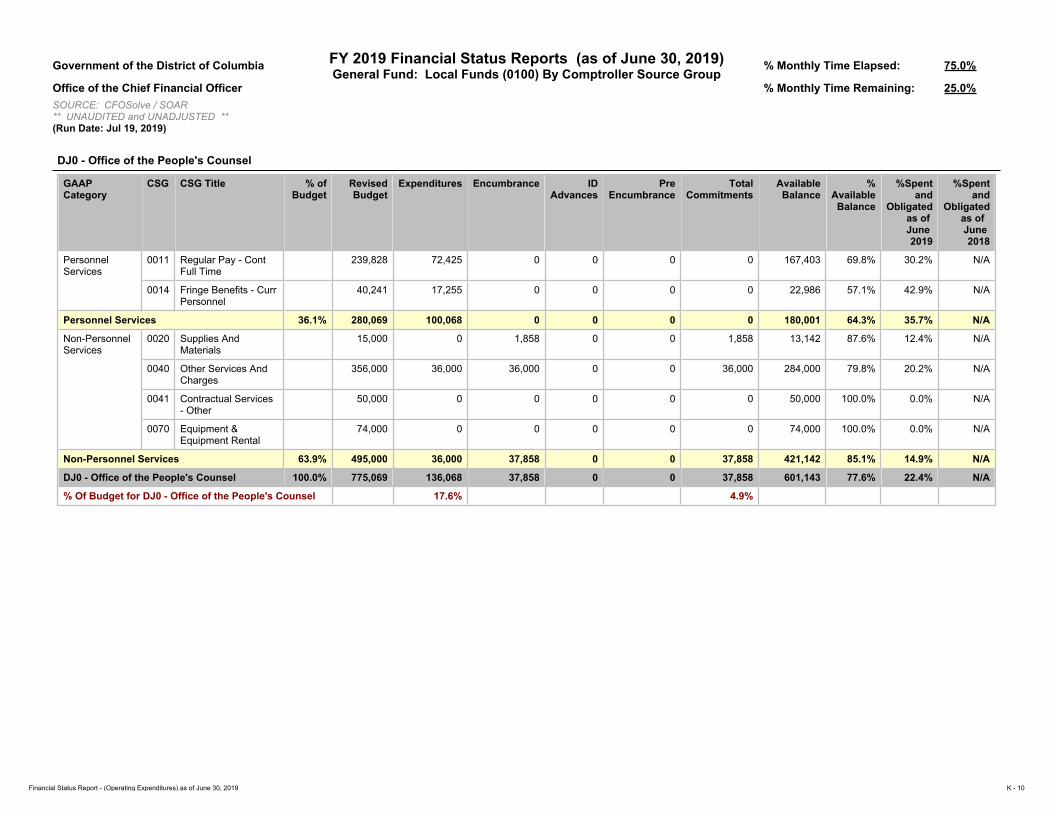
Government of the District of Columbia FY 2019 Financial Status Reports (as of June 30, 2019)General Fund: Local Funds (0100) By Comptroller Source Group
% Monthly Time Elapsed: 75.0%
Office of the Chief Financial Officer % Monthly Time Remaining: 25.0%SOURCE: CFOSolve / SOAR** UNAUDITED and UNADJUSTED **(Run Date: Jul 19, 2019)
DJ0 - Office of the People's Counsel
GAAP Category
CSG CSG Title % of Budget
Revised Budget
Expenditures Encumbrance ID Advances
Pre Encumbrance
Total Commitments
Available Balance
% Available
Balance
%Spent and
Obligated as of June 2019
%Spent and
Obligated as of June 2018
Personnel Services
0011 Regular Pay - Cont Full Time
239,828 72,425 0 0 0 0 167,403 69.8% 30.2% N/A
0014 Fringe Benefits - Curr Personnel
40,241 17,255 0 0 0 0 22,986 57.1% 42.9% N/A
Personnel Services 36.1% 280,069 100,068 0 0 0 0 180,001 64.3% 35.7% N/A
Non-Personnel Services
0020 Supplies And Materials
15,000 0 1,858 0 0 1,858 13,142 87.6% 12.4% N/A
0040 Other Services And Charges
356,000 36,000 36,000 0 0 36,000 284,000 79.8% 20.2% N/A
0041 Contractual Services - Other
50,000 0 0 0 0 0 50,000 100.0% 0.0% N/A
0070 Equipment & Equipment Rental
74,000 0 0 0 0 0 74,000 100.0% 0.0% N/A
Non-Personnel Services 63.9% 495,000 36,000 37,858 0 0 37,858 421,142 85.1% 14.9% N/A
DJ0 - Office of the People's Counsel 100.0% 775,069 136,068 37,858 0 0 37,858 601,143 77.6% 22.4% N/A
% Of Budget for DJ0 - Office of the People's Counsel 17.6% 4.9%
Financial Status Report - (Operating Expenditures) as of June 30, 2019 K - 10

Government of the District of Columbia FY 2019 Financial Status Reports (as of June 30, 2019)General Fund: Local Funds (0100) By Comptroller Source Group
% Monthly Time Elapsed: 75.0%
Office of the Chief Financial Officer % Monthly Time Remaining: 25.0%SOURCE: CFOSolve / SOAR** UNAUDITED and UNADJUSTED **(Run Date: Jul 19, 2019)
EB0 - Office of the Deputy Mayor for Planning and Economic Development
GAAP Category
CSG CSG Title % of Budget
Revised Budget
Expenditures Encumbrance ID Advances
Pre Encumbrance
Total Commitments
Available Balance
% Available
Balance
%Spent and
Obligated as of June 2019
%Spent and
Obligated as of June 2018
Personnel Services
0011 Regular Pay - Cont Full Time
4,719,721 3,475,911 0 0 0 0 1,243,810 26.4% 73.6% 72.1%
0012 Regular Pay - Other 2,609,692 1,356,607 0 0 0 0 1,253,085 48.0% 52.0% 71.4%
0014 Fringe Benefits - Curr Personnel
1,508,103 916,759 0 0 0 0 591,344 39.2% 60.8% 67.4%
Personnel Services 25.6% 8,837,516 5,815,821 0 0 0 0 3,021,695 34.2% 65.8% 71.4%
Non-Personnel Services
0020 Supplies And Materials
30,000 12,743 4,777 0 0 4,777 12,480 41.6% 58.4% 60.1%
0031 Telecommunications 12,000 0 0 7,315 0 7,315 4,685 39.0% 61.0% 137.8%
0040 Other Services And Charges
178,213 172,889 0 85,259 0 85,259 (79,934) (44.9%) 144.9% 80.8%
0041 Contractual Services - Other
15,881,897 1,910,022 1,140,613 415,131 116,868 1,672,612 12,299,263 77.4% 22.6% 39.0%
0050 Subsidies And Transfers
9,543,000 2,276,994 944,407 0 0 944,407 6,321,599 66.2% 33.8% 100.0%
0070 Equipment & Equipment Rental
0 0 0 0 0 0 0 N/A N/A 79.7%
Non-Personnel Services 74.4% 25,645,110 4,372,648 2,089,797 507,704 116,868 2,714,369 18,558,093 72.4% 27.6% 62.5%
EB0 - Office of the Deputy Mayor for Planning and Economic Development
100.0% 34,482,627 10,188,470 2,089,797 507,704 116,868 2,714,369 21,579,787 62.6% 37.4% 64.7%
% Of Budget for EB0 - Office of the Deputy Mayor for Planning and Economic Development
29.5% 7.9%
Financial Status Report - (Operating Expenditures) as of June 30, 2019 K - 11

Government of the District of Columbia FY 2019 Financial Status Reports (as of June 30, 2019)General Fund: Local Funds (0100) By Comptroller Source Group
% Monthly Time Elapsed: 75.0%
Office of the Chief Financial Officer % Monthly Time Remaining: 25.0%SOURCE: CFOSolve / SOAR** UNAUDITED and UNADJUSTED **(Run Date: Jul 19, 2019)
EN0 - Department of Small and Local Business Development
GAAP Category
CSG CSG Title % of Budget
Revised Budget
Expenditures Encumbrance ID Advances
Pre Encumbrance
Total Commitments
Available Balance
% Available
Balance
%Spent and
Obligated as of June 2019
%Spent and
Obligated as of June 2018
Personnel Services
0011 Regular Pay - Cont Full Time
4,193,179 3,106,715 0 0 0 0 1,086,465 25.9% 74.1% 67.8%
0012 Regular Pay - Other 223,439 124,125 0 0 0 0 99,313 44.4% 55.6% 94.0%
0014 Fringe Benefits - Curr Personnel
1,008,055 645,747 0 0 0 0 362,308 35.9% 64.1% 65.5%
Personnel Services 34.5% 5,424,673 3,916,469 0 0 0 0 1,508,205 27.8% 72.2% 69.9%
Non-Personnel Services
0020 Supplies And Materials
69,871 31,220 0 0 0 0 38,651 55.3% 44.7% 28.0%
0031 Telecommunications 57,732 19,691 0 39,221 0 39,221 (1,180) (2.0%) 102.0% 102.8%
0040 Other Services And Charges
332,820 166,445 166,850 6,000 0 172,850 (6,474) (1.9%) 101.9% 29.1%
0041 Contractual Services - Other
1,008,208 199,896 31,803 245,231 10,000 287,033 521,280 51.7% 48.3% 61.9%
0050 Subsidies And Transfers
8,788,913 6,098,887 1,742,675 0 88,500 1,831,175 858,852 9.8% 90.2% 97.7%
0070 Equipment & Equipment Rental
57,251 4,975 9,019 0 25,000 34,019 18,256 31.9% 68.1% 0.0%
Non-Personnel Services 65.5% 10,314,795 6,521,113 1,950,347 290,452 123,500 2,364,299 1,429,383 13.9% 86.1% 88.4%
EN0 - Department of Small and Local Business Development
100.0% 15,739,468 10,437,582 1,950,347 290,452 123,500 2,364,299 2,937,588 18.7% 81.3% 82.2%
% Of Budget for EN0 - Department of Small and Local Business Development
66.3% 15.0%
Financial Status Report - (Operating Expenditures) as of June 30, 2019 K - 12

Government of the District of Columbia FY 2019 Financial Status Reports (as of June 30, 2019)General Fund: Local Funds (0100) By Comptroller Source Group
% Monthly Time Elapsed: 75.0%
Office of the Chief Financial Officer % Monthly Time Remaining: 25.0%SOURCE: CFOSolve / SOAR** UNAUDITED and UNADJUSTED **(Run Date: Jul 19, 2019)
HP0 - Housing Production Trust Fund Subsidy
GAAP Category CSG CSG Title % of Budget
Revised Budget
Expenditures Encumbrance ID Advances
Pre Encumbrance
Total Commitments
Available Balance
% Available
Balance
%Spent and
Obligated as of June 2019
%Spent and
Obligated as of June 2018
Non-Personnel Services
0050 Subsidies And Transfers
39,335,078 0 0 0 0 0 39,335,078 100.0% 0.0% 0.0%
Non-Personnel Services 100.0% 39,335,078 0 0 0 0 0 39,335,078 100.0% 0.0% 0.0%
HP0 - Housing Production Trust Fund Subsidy
100.0% 39,335,078 0 0 0 0 0 39,335,078 100.0% 0.0% 0.0%
% Of Budget for HP0 - Housing Production Trust Fund Subsidy
0.0% 0.0%
Financial Status Report - (Operating Expenditures) as of June 30, 2019 K - 13

Government of the District of Columbia FY 2019 Financial Status Reports (as of June 30, 2019)General Fund: Local Funds (0100) By Comptroller Source Group
% Monthly Time Elapsed: 75.0%
Office of the Chief Financial Officer % Monthly Time Remaining: 25.0%SOURCE: CFOSolve / SOAR** UNAUDITED and UNADJUSTED **(Run Date: Jul 19, 2019)
HY0 - Housing Authority Subsidy
GAAP Category
CSG CSG Title % of Budget
Revised Budget
Expenditures Encumbrance ID Advances
Pre Encumbrance
Total Commitments
Available Balance
% Available
Balance
%Spent and
Obligated as of June 2019
%Spent and
Obligated as of June 2018
Non-Personnel Services
0041 Contractual Services - Other
8,491,224 5,614,579 0 0 0 0 2,876,645 33.9% 66.1% 82.6%
0050 Subsidies And Transfers
111,488,631 61,596,272 0 0 0 0 49,892,359 44.8% 55.2% 66.3%
Non-Personnel Services 100.0% 119,979,855 67,210,851 0 0 0 0 52,769,004 44.0% 56.0% 67.0%
HY0 - Housing Authority Subsidy 100.0% 119,979,855 67,210,851 0 0 0 0 52,769,004 44.0% 56.0% 67.0%
% Of Budget for HY0 - Housing Authority Subsidy 56.0% 0.0%
Financial Status Report - (Operating Expenditures) as of June 30, 2019 K - 14
Government of the District of Columbia FY 2019 Financial Status Reports (as of June 30, 2019)General Fund: Local Funds (0100) By Comptroller Source Group
% Monthly Time Elapsed: 75.0%
Office of the Chief Financial Officer % Monthly Time Remaining: 25.0%SOURCE: CFOSolve / SOAR** UNAUDITED and UNADJUSTED **(Run Date: Jul 19, 2019)
LQ0 - Alcoholic Beverage Regulation Administration
GAAP Category CSG CSG Title
% of Budget
Revised Budget
Expenditures Encumbrance ID Advances
Pre Encumbrance
Total Commitments
Available Balance
% Available
Balance
%Spent and
Obligated as of June 2019
%Spent and
Obligated as of June 2018
Personnel Services
Financial Status Report - (Operating Expenditures) as of June 30, 2019 K - 15

Government of the District of Columbia FY 2019 Financial Status Reports (as of June 30, 2019)General Fund: Local Funds (0100) By Comptroller Source Group
% Monthly Time Elapsed: 75.0%
Office of the Chief Financial Officer % Monthly Time Remaining: 25.0%SOURCE: CFOSolve / SOAR** UNAUDITED and UNADJUSTED **(Run Date: Jul 19, 2019)
SR0 - Department of Insurance, Securities, and Banking
GAAP Category
CSG CSG Title % of Budget
Revised Budget
Expenditures Encumbrance ID Advances
Pre Encumbrance
Total Commitments
Available Balance
% Available
Balance
%Spent and
Obligated as of June 2019
%Spent and
Obligated as of June 2018
Non-Personnel Services
0041 Contractual Services - Other
0 0 0 0 0 0 0 N/A N/A 99.8%
Non-Personnel Services N/A 0 0 0 0 0 0 0 N/A N/A 99.8%
SR0 - Department of Insurance, Securities, and Banking
N/A 0 0 0 0 0 0 0 N/A N/A 99.8%
% Of Budget for SR0 - Department of Insurance, Securities, and Banking
N/A N/A
Grand Total for Economic Development and Regulation
370,485,457 177,157,764 19,294,868 5,961,817 10,055,328 35,312,012 158,015,681 42.7% 57.3% 58.7%
% Of Budget for Economic Development and Regulation
47.8% 9.5%
Financial Status Report - (Operating Expenditures) as of June 30, 2019 K - 16

(L) Public Safety and Justice
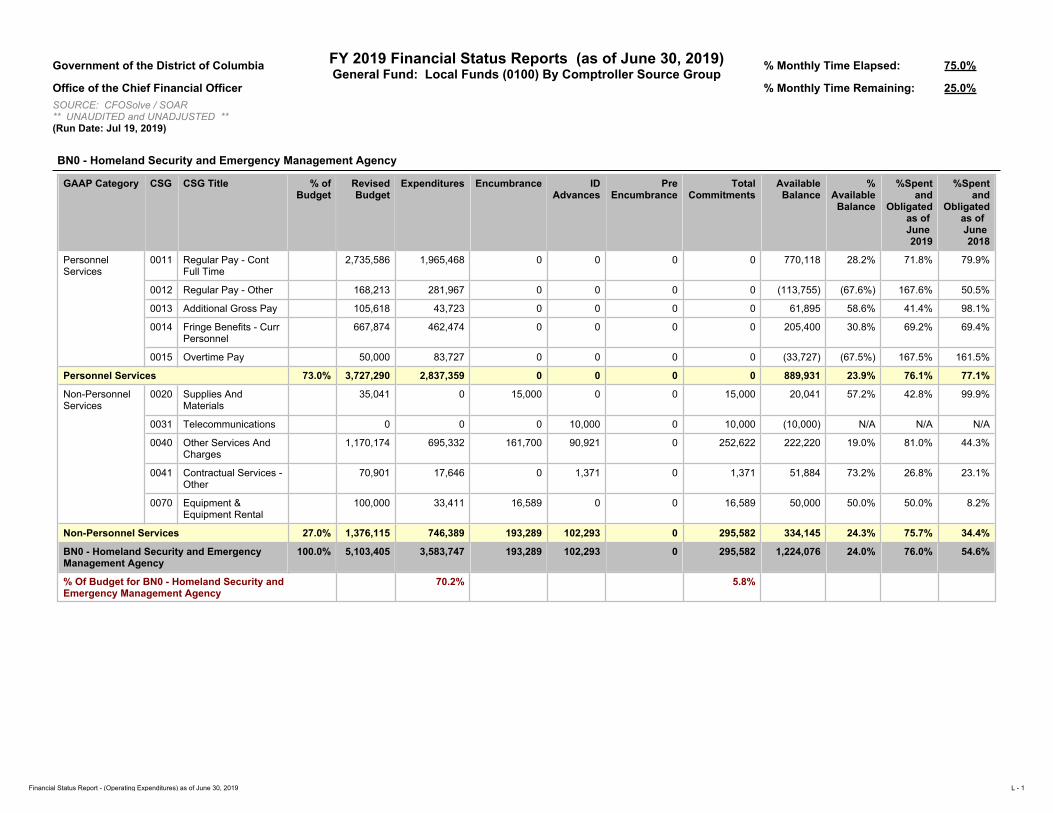
Government of the District of Columbia FY 2019 Financial Status Reports (as of June 30, 2019)General Fund: Local Funds (0100) By Comptroller Source Group
% Monthly Time Elapsed: 75.0%
Office of the Chief Financial Officer % Monthly Time Remaining: 25.0%SOURCE: CFOSolve / SOAR** UNAUDITED and UNADJUSTED **(Run Date: Jul 19, 2019)
BN0 - Homeland Security and Emergency Management Agency
GAAP Category CSG CSG Title % of Budget
Revised Budget
Expenditures Encumbrance ID Advances
Pre Encumbrance
Total Commitments
Available Balance
% Available
Balance
%Spent and
Obligated as of June 2019
%Spent and
Obligated as of June 2018
Personnel Services
0011 Regular Pay - Cont Full Time
2,735,586 1,965,468 0 0 0 0 770,118 28.2% 71.8% 79.9%
0012 Regular Pay - Other 168,213 281,967 0 0 0 0 (113,755) (67.6%) 167.6% 50.5%
0013 Additional Gross Pay 105,618 43,723 0 0 0 0 61,895 58.6% 41.4% 98.1%
0014 Fringe Benefits - Curr Personnel
667,874 462,474 0 0 0 0 205,400 30.8% 69.2% 69.4%
0015 Overtime Pay 50,000 83,727 0 0 0 0 (33,727) (67.5%) 167.5% 161.5%
Personnel Services 73.0% 3,727,290 2,837,359 0 0 0 0 889,931 23.9% 76.1% 77.1%
Non-Personnel Services
0020 Supplies And Materials
35,041 0 15,000 0 0 15,000 20,041 57.2% 42.8% 99.9%
0031 Telecommunications 0 0 0 10,000 0 10,000 (10,000) N/A N/A N/A
0040 Other Services And Charges
1,170,174 695,332 161,700 90,921 0 252,622 222,220 19.0% 81.0% 44.3%
0041 Contractual Services - Other
70,901 17,646 0 1,371 0 1,371 51,884 73.2% 26.8% 23.1%
0070 Equipment & Equipment Rental
100,000 33,411 16,589 0 0 16,589 50,000 50.0% 50.0% 8.2%
Non-Personnel Services 27.0% 1,376,115 746,389 193,289 102,293 0 295,582 334,145 24.3% 75.7% 34.4%
BN0 - Homeland Security and Emergency Management Agency
100.0% 5,103,405 3,583,747 193,289 102,293 0 295,582 1,224,076 24.0% 76.0% 54.6%
% Of Budget for BN0 - Homeland Security and Emergency Management Agency
70.2% 5.8%
Financial Status Report - (Operating Expenditures) as of June 30, 2019 L - 1
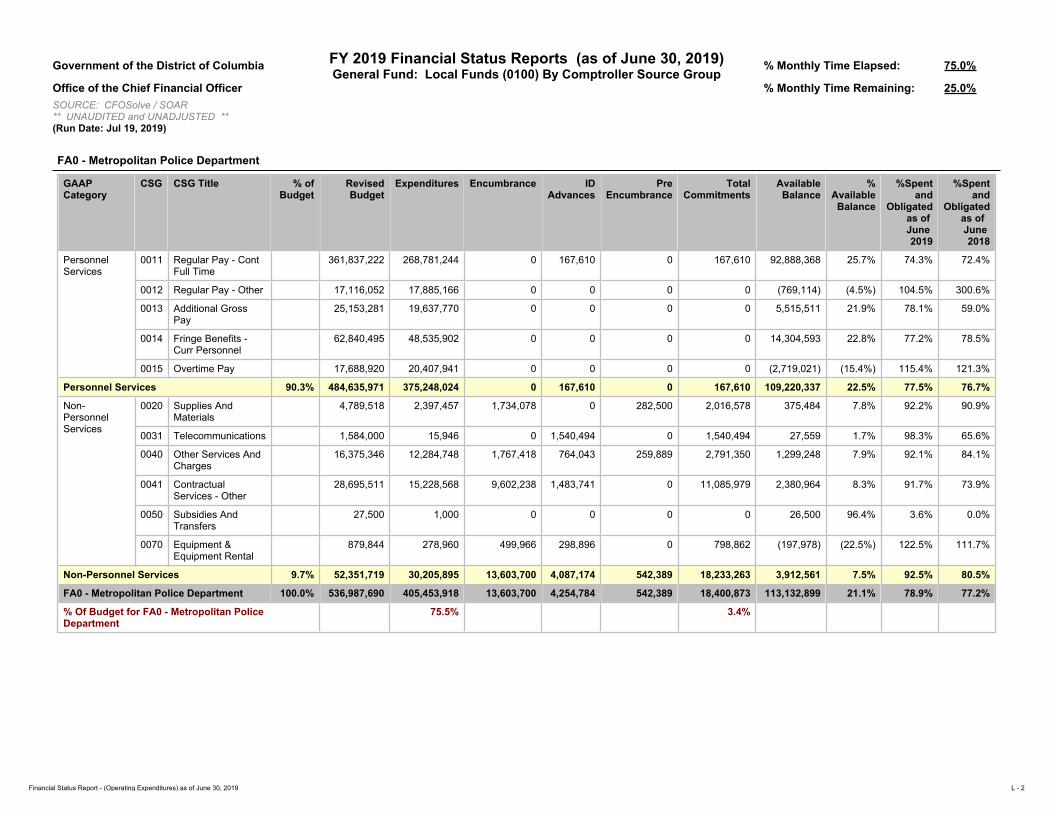
Government of the District of Columbia FY 2019 Financial Status Reports (as of June 30, 2019)General Fund: Local Funds (0100) By Comptroller Source Group
% Monthly Time Elapsed: 75.0%
Office of the Chief Financial Officer % Monthly Time Remaining: 25.0%SOURCE: CFOSolve / SOAR** UNAUDITED and UNADJUSTED **(Run Date: Jul 19, 2019)
FA0 - Metropolitan Police Department
GAAP Category
CSG CSG Title % of Budget
Revised Budget
Expenditures Encumbrance ID Advances
Pre Encumbrance
Total Commitments
Available Balance
% Available
Balance
%Spent and
Obligated as of June 2019
%Spent and
Obligated as of June 2018
Personnel Services
0011 Regular Pay - Cont Full Time
361,837,222 268,781,244 0 167,610 0 167,610 92,888,368 25.7% 74.3% 72.4%
0012 Regular Pay - Other 17,116,052 17,885,166 0 0 0 0 (769,114) (4.5%) 104.5% 300.6%
0013 Additional Gross Pay
25,153,281 19,637,770 0 0 0 0 5,515,511 21.9% 78.1% 59.0%
0014 Fringe Benefits - Curr Personnel
62,840,495 48,535,902 0 0 0 0 14,304,593 22.8% 77.2% 78.5%
0015 Overtime Pay 17,688,920 20,407,941 0 0 0 0 (2,719,021) (15.4%) 115.4% 121.3%
Personnel Services 90.3% 484,635,971 375,248,024 0 167,610 0 167,610 109,220,337 22.5% 77.5% 76.7%
Non-Personnel Services
0020 Supplies And Materials
4,789,518 2,397,457 1,734,078 0 282,500 2,016,578 375,484 7.8% 92.2% 90.9%
0031 Telecommunications 1,584,000 15,946 0 1,540,494 0 1,540,494 27,559 1.7% 98.3% 65.6%
0040 Other Services And Charges
16,375,346 12,284,748 1,767,418 764,043 259,889 2,791,350 1,299,248 7.9% 92.1% 84.1%
0041 Contractual Services - Other
28,695,511 15,228,568 9,602,238 1,483,741 0 11,085,979 2,380,964 8.3% 91.7% 73.9%
0050 Subsidies And Transfers
27,500 1,000 0 0 0 0 26,500 96.4% 3.6% 0.0%
0070 Equipment & Equipment Rental
879,844 278,960 499,966 298,896 0 798,862 (197,978) (22.5%) 122.5% 111.7%
Non-Personnel Services 9.7% 52,351,719 30,205,895 13,603,700 4,087,174 542,389 18,233,263 3,912,561 7.5% 92.5% 80.5%
FA0 - Metropolitan Police Department 100.0% 536,987,690 405,453,918 13,603,700 4,254,784 542,389 18,400,873 113,132,899 21.1% 78.9% 77.2%
% Of Budget for FA0 - Metropolitan Police Department
75.5% 3.4%
Financial Status Report - (Operating Expenditures) as of June 30, 2019 L - 2
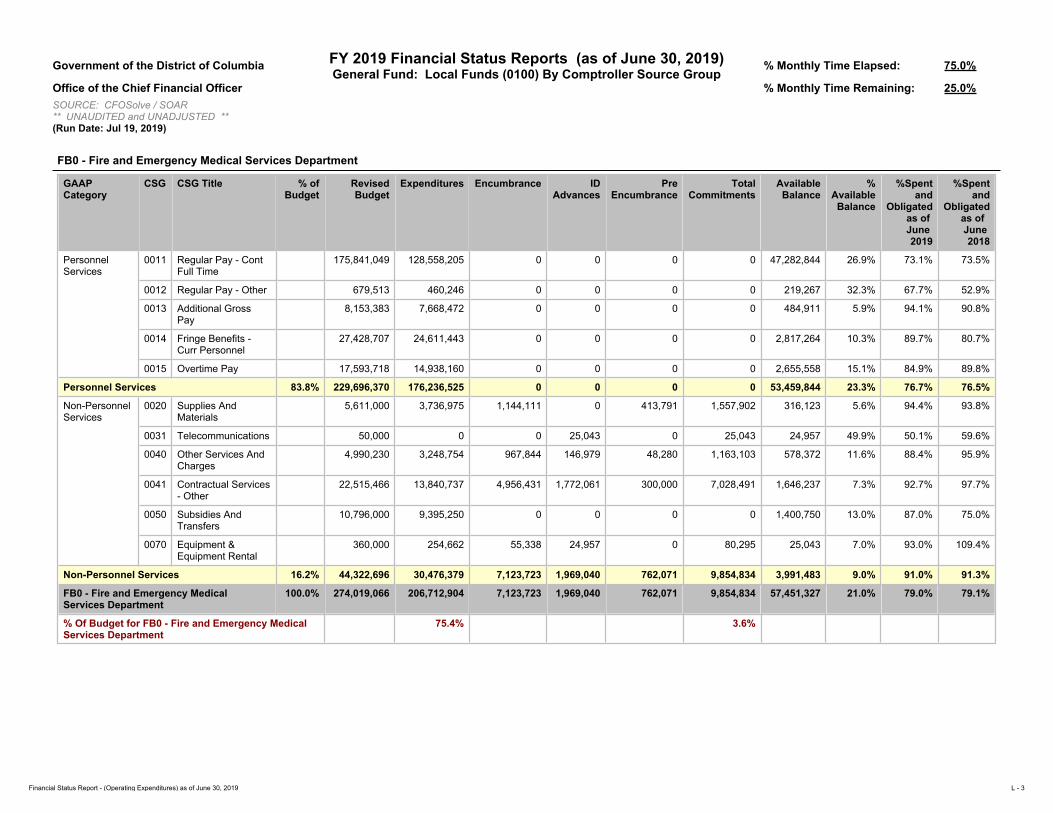
Government of the District of Columbia FY 2019 Financial Status Reports (as of June 30, 2019)General Fund: Local Funds (0100) By Comptroller Source Group
% Monthly Time Elapsed: 75.0%
Office of the Chief Financial Officer % Monthly Time Remaining: 25.0%SOURCE: CFOSolve / SOAR** UNAUDITED and UNADJUSTED **(Run Date: Jul 19, 2019)
FB0 - Fire and Emergency Medical Services Department
GAAP Category
CSG CSG Title % of Budget
Revised Budget
Expenditures Encumbrance ID Advances
Pre Encumbrance
Total Commitments
Available Balance
% Available
Balance
%Spent and
Obligated as of June 2019
%Spent and
Obligated as of June 2018
Personnel Services
0011 Regular Pay - Cont Full Time
175,841,049 128,558,205 0 0 0 0 47,282,844 26.9% 73.1% 73.5%
0012 Regular Pay - Other 679,513 460,246 0 0 0 0 219,267 32.3% 67.7% 52.9%
0013 Additional Gross Pay
8,153,383 7,668,472 0 0 0 0 484,911 5.9% 94.1% 90.8%
0014 Fringe Benefits - Curr Personnel
27,428,707 24,611,443 0 0 0 0 2,817,264 10.3% 89.7% 80.7%
0015 Overtime Pay 17,593,718 14,938,160 0 0 0 0 2,655,558 15.1% 84.9% 89.8%
Personnel Services 83.8% 229,696,370 176,236,525 0 0 0 0 53,459,844 23.3% 76.7% 76.5%
Non-Personnel Services
0020 Supplies And Materials
5,611,000 3,736,975 1,144,111 0 413,791 1,557,902 316,123 5.6% 94.4% 93.8%
0031 Telecommunications 50,000 0 0 25,043 0 25,043 24,957 49.9% 50.1% 59.6%
0040 Other Services And Charges
4,990,230 3,248,754 967,844 146,979 48,280 1,163,103 578,372 11.6% 88.4% 95.9%
0041 Contractual Services - Other
22,515,466 13,840,737 4,956,431 1,772,061 300,000 7,028,491 1,646,237 7.3% 92.7% 97.7%
0050 Subsidies And Transfers
10,796,000 9,395,250 0 0 0 0 1,400,750 13.0% 87.0% 75.0%
0070 Equipment & Equipment Rental
360,000 254,662 55,338 24,957 0 80,295 25,043 7.0% 93.0% 109.4%
Non-Personnel Services 16.2% 44,322,696 30,476,379 7,123,723 1,969,040 762,071 9,854,834 3,991,483 9.0% 91.0% 91.3%
FB0 - Fire and Emergency Medical Services Department
100.0% 274,019,066 206,712,904 7,123,723 1,969,040 762,071 9,854,834 57,451,327 21.0% 79.0% 79.1%
% Of Budget for FB0 - Fire and Emergency Medical Services Department
75.4% 3.6%
Financial Status Report - (Operating Expenditures) as of June 30, 2019 L - 3

Government of the District of Columbia FY 2019 Financial Status Reports (as of June 30, 2019)General Fund: Local Funds (0100) By Comptroller Source Group
% Monthly Time Elapsed: 75.0%
Office of the Chief Financial Officer % Monthly Time Remaining: 25.0%SOURCE: CFOSolve / SOAR** UNAUDITED and UNADJUSTED **(Run Date: Jul 19, 2019)
FD0 - Police Officers' and Fire Fighters' Retirement System
GAAP Category CSG CSG Title % of Budget
Revised Budget
Expenditures Encumbrance ID Advances
Pre Encumbrance
Total Commitments
Available Balance
% Available
Balance
%Spent and
Obligated as of June 2019
%Spent and
Obligated as of June 2018
Non-Personnel Services
0050 Subsidies And Transfers
92,322,000 91,100,089 0 0 0 0 1,221,911 1.3% 98.7% 100.0%
Non-Personnel Services 100.0% 92,322,000 91,100,089 0 0 0 0 1,221,911 1.3% 98.7% 100.0%
FD0 - Police Officers' and Fire Fighters' Retirement System
100.0% 92,322,000 91,100,089 0 0 0 0 1,221,911 1.3% 98.7% 100.0%
% Of Budget for FD0 - Police Officers' and Fire Fighters' Retirement System
98.7% 0.0%
Financial Status Report - (Operating Expenditures) as of June 30, 2019 L - 4
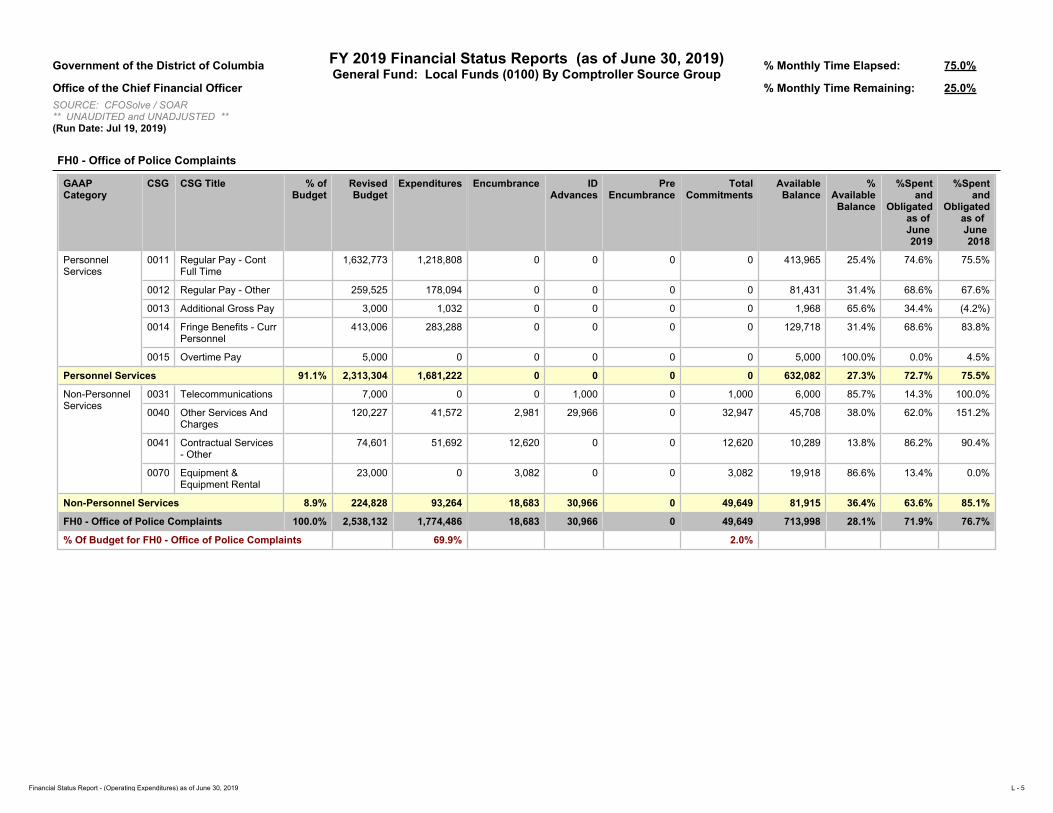
Government of the District of Columbia FY 2019 Financial Status Reports (as of June 30, 2019)General Fund: Local Funds (0100) By Comptroller Source Group
% Monthly Time Elapsed: 75.0%
Office of the Chief Financial Officer % Monthly Time Remaining: 25.0%SOURCE: CFOSolve / SOAR** UNAUDITED and UNADJUSTED **(Run Date: Jul 19, 2019)
FH0 - Office of Police Complaints
GAAP Category
CSG CSG Title % of Budget
Revised Budget
Expenditures Encumbrance ID Advances
Pre Encumbrance
Total Commitments
Available Balance
% Available
Balance
%Spent and
Obligated as of June 2019
%Spent and
Obligated as of June 2018
Personnel Services
0011 Regular Pay - Cont Full Time
1,632,773 1,218,808 0 0 0 0 413,965 25.4% 74.6% 75.5%
0012 Regular Pay - Other 259,525 178,094 0 0 0 0 81,431 31.4% 68.6% 67.6%
0013 Additional Gross Pay 3,000 1,032 0 0 0 0 1,968 65.6% 34.4% (4.2%)
0014 Fringe Benefits - Curr Personnel
413,006 283,288 0 0 0 0 129,718 31.4% 68.6% 83.8%
0015 Overtime Pay 5,000 0 0 0 0 0 5,000 100.0% 0.0% 4.5%
Personnel Services 91.1% 2,313,304 1,681,222 0 0 0 0 632,082 27.3% 72.7% 75.5%
Non-Personnel Services
0031 Telecommunications 7,000 0 0 1,000 0 1,000 6,000 85.7% 14.3% 100.0%
0040 Other Services And Charges
120,227 41,572 2,981 29,966 0 32,947 45,708 38.0% 62.0% 151.2%
0041 Contractual Services - Other
74,601 51,692 12,620 0 0 12,620 10,289 13.8% 86.2% 90.4%
0070 Equipment & Equipment Rental
23,000 0 3,082 0 0 3,082 19,918 86.6% 13.4% 0.0%
Non-Personnel Services 8.9% 224,828 93,264 18,683 30,966 0 49,649 81,915 36.4% 63.6% 85.1%
FH0 - Office of Police Complaints 100.0% 2,538,132 1,774,486 18,683 30,966 0 49,649 713,998 28.1% 71.9% 76.7%
% Of Budget for FH0 - Office of Police Complaints 69.9% 2.0%
Financial Status Report - (Operating Expenditures) as of June 30, 2019 L - 5
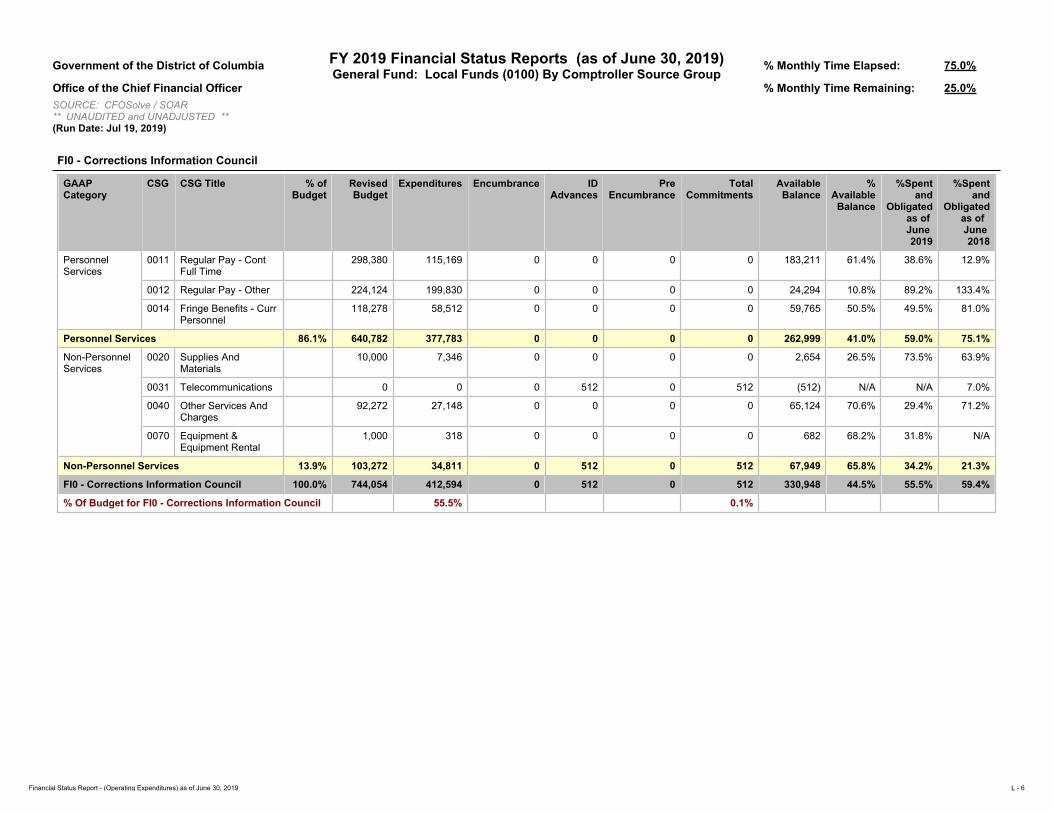
Government of the District of Columbia FY 2019 Financial Status Reports (as of June 30, 2019)General Fund: Local Funds (0100) By Comptroller Source Group
% Monthly Time Elapsed: 75.0%
Office of the Chief Financial Officer % Monthly Time Remaining: 25.0%SOURCE: CFOSolve / SOAR** UNAUDITED and UNADJUSTED **(Run Date: Jul 19, 2019)
FI0 - Corrections Information Council
GAAP Category
CSG CSG Title % of Budget
Revised Budget
Expenditures Encumbrance ID Advances
Pre Encumbrance
Total Commitments
Available Balance
% Available
Balance
%Spent and
Obligated as of June 2019
%Spent and
Obligated as of June 2018
Personnel Services
0011 Regular Pay - Cont Full Time
298,380 115,169 0 0 0 0 183,211 61.4% 38.6% 12.9%
0012 Regular Pay - Other 224,124 199,830 0 0 0 0 24,294 10.8% 89.2% 133.4%
0014 Fringe Benefits - Curr Personnel
118,278 58,512 0 0 0 0 59,765 50.5% 49.5% 81.0%
Personnel Services 86.1% 640,782 377,783 0 0 0 0 262,999 41.0% 59.0% 75.1%
Non-Personnel Services
0020 Supplies And Materials
10,000 7,346 0 0 0 0 2,654 26.5% 73.5% 63.9%
0031 Telecommunications 0 0 0 512 0 512 (512) N/A N/A 7.0%
0040 Other Services And Charges
92,272 27,148 0 0 0 0 65,124 70.6% 29.4% 71.2%
0070 Equipment & Equipment Rental
1,000 318 0 0 0 0 682 68.2% 31.8% N/A
Non-Personnel Services 13.9% 103,272 34,811 0 512 0 512 67,949 65.8% 34.2% 21.3%
FI0 - Corrections Information Council 100.0% 744,054 412,594 0 512 0 512 330,948 44.5% 55.5% 59.4%
% Of Budget for FI0 - Corrections Information Council 55.5% 0.1%
Financial Status Report - (Operating Expenditures) as of June 30, 2019 L - 6

Government of the District of Columbia FY 2019 Financial Status Reports (as of June 30, 2019)General Fund: Local Funds (0100) By Comptroller Source Group
% Monthly Time Elapsed: 75.0%
Office of the Chief Financial Officer % Monthly Time Remaining: 25.0%SOURCE: CFOSolve / SOAR** UNAUDITED and UNADJUSTED **(Run Date: Jul 19, 2019)
FJ0 - Criminal Justice Coordinating Council
GAAP Category
CSG CSG Title % of Budget
Revised Budget
Expenditures Encumbrance ID Advances
Pre Encumbrance
Total Commitments
Available Balance
% Available
Balance
%Spent and
Obligated as of June 2019
%Spent and
Obligated as of June 2018
Personnel Services
0011 Regular Pay - Cont Full Time
464,876 304,508 0 0 0 0 160,368 34.5% 65.5% 77.1%
0012 Regular Pay - Other 16,817 71,593 0 0 0 0 (54,776) (325.7%) 425.7% 79.2%
0014 Fringe Benefits - Curr Personnel
88,151 75,302 0 0 0 0 12,849 14.6% 85.4% 90.6%
Personnel Services 34.4% 569,844 451,753 0 0 0 0 118,091 20.7% 79.3% 79.1%
Non-Personnel Services
0040 Other Services And Charges
415,854 184,313 64,960 13,921 0 78,881 152,661 36.7% 63.3% 77.8%
0041 Contractual Services - Other
509,231 363,481 92,240 4,466 0 96,706 49,044 9.6% 90.4% 96.9%
0070 Equipment & Equipment Rental
160,000 75,000 0 0 0 0 85,000 53.1% 46.9% 98.7%
Non-Personnel Services 65.6% 1,085,086 622,794 157,200 18,387 0 175,587 286,705 26.4% 73.6% 95.9%
FJ0 - Criminal Justice Coordinating Council 100.0% 1,654,930 1,074,547 157,200 18,387 0 175,587 404,796 24.5% 75.5% 89.2%
% Of Budget for FJ0 - Criminal Justice Coordinating Council
64.9% 10.6%
Financial Status Report - (Operating Expenditures) as of June 30, 2019 L - 7

Government of the District of Columbia FY 2019 Financial Status Reports (as of June 30, 2019)General Fund: Local Funds (0100) By Comptroller Source Group
% Monthly Time Elapsed: 75.0%
Office of the Chief Financial Officer % Monthly Time Remaining: 25.0%SOURCE: CFOSolve / SOAR** UNAUDITED and UNADJUSTED **(Run Date: Jul 19, 2019)
FK0 - District of Columbia National Guard
GAAP Category
CSG CSG Title % of Budget
Revised Budget
Expenditures Encumbrance ID Advances
Pre Encumbrance
Total Commitments
Available Balance
% Available
Balance
%Spent and
Obligated as of June 2019
%Spent and
Obligated as of June 2018
Personnel Services
0011 Regular Pay - Cont Full Time
1,595,875 1,239,744 0 0 0 0 356,131 22.3% 77.7% 78.0%
0012 Regular Pay - Other 636,415 402,307 0 0 0 0 234,108 36.8% 63.2% 77.9%
0013 Additional Gross Pay 24,500 18,999 0 0 0 0 5,501 22.5% 77.5% 55.9%
0014 Fringe Benefits - Curr Personnel
581,060 350,310 0 0 0 0 230,749 39.7% 60.3% 73.7%
0015 Overtime Pay 28,750 34,601 0 0 0 0 (5,851) (20.4%) 120.4% 93.9%
Personnel Services 59.6% 2,866,600 2,045,960 0 0 0 0 820,640 28.6% 71.4% 77.2%
Non-Personnel Services
0020 Supplies And Materials
213,462 91,151 33,036 0 10,231 43,267 79,045 37.0% 63.0% 84.5%
0031 Telecommunications 34,056 12,918 16,275 0 0 16,275 4,863 14.3% 85.7% 70.5%
0040 Other Services And Charges
1,424,029 810,801 368,956 82,010 0 450,965 162,263 11.4% 88.6% 65.3%
0050 Subsidies And Transfers
181,855 76,482 21,036 0 0 21,036 84,336 46.4% 53.6% 67.0%
0070 Equipment & Equipment Rental
90,035 48,705 20,045 0 0 20,045 21,284 23.6% 76.4% 36.9%
Non-Personnel Services 40.4% 1,943,437 1,040,056 459,348 82,010 10,231 551,588 351,792 18.1% 81.9% 65.6%
FK0 - District of Columbia National Guard 100.0% 4,810,037 3,086,017 459,348 82,010 10,231 551,588 1,172,432 24.4% 75.6% 71.9%
% Of Budget for FK0 - District of Columbia National Guard
64.2% 11.5%
Financial Status Report - (Operating Expenditures) as of June 30, 2019 L - 8
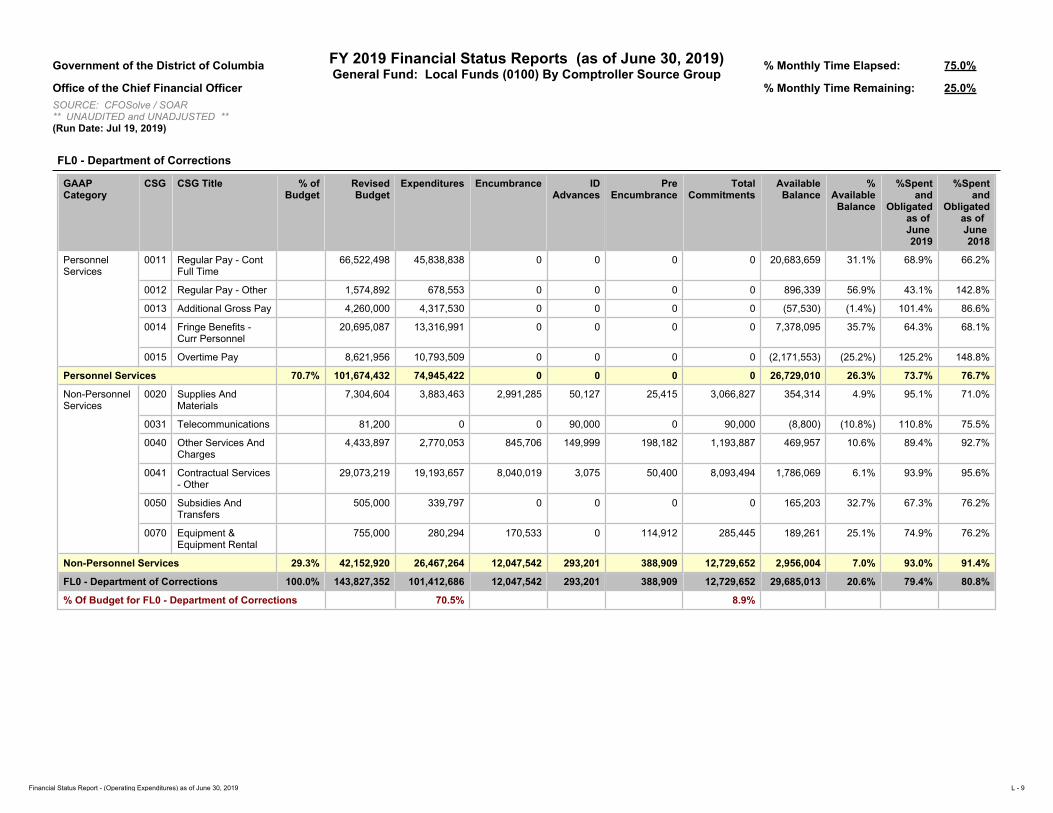
Government of the District of Columbia FY 2019 Financial Status Reports (as of June 30, 2019)General Fund: Local Funds (0100) By Comptroller Source Group
% Monthly Time Elapsed: 75.0%
Office of the Chief Financial Officer % Monthly Time Remaining: 25.0%SOURCE: CFOSolve / SOAR** UNAUDITED and UNADJUSTED **(Run Date: Jul 19, 2019)
FL0 - Department of Corrections
GAAP Category
CSG CSG Title % of Budget
Revised Budget
Expenditures Encumbrance ID Advances
Pre Encumbrance
Total Commitments
Available Balance
% Available
Balance
%Spent and
Obligated as of June 2019
%Spent and
Obligated as of June 2018
Personnel Services
0011 Regular Pay - Cont Full Time
66,522,498 45,838,838 0 0 0 0 20,683,659 31.1% 68.9% 66.2%
0012 Regular Pay - Other 1,574,892 678,553 0 0 0 0 896,339 56.9% 43.1% 142.8%
0013 Additional Gross Pay 4,260,000 4,317,530 0 0 0 0 (57,530) (1.4%) 101.4% 86.6%
0014 Fringe Benefits - Curr Personnel
20,695,087 13,316,991 0 0 0 0 7,378,095 35.7% 64.3% 68.1%
0015 Overtime Pay 8,621,956 10,793,509 0 0 0 0 (2,171,553) (25.2%) 125.2% 148.8%
Personnel Services 70.7% 101,674,432 74,945,422 0 0 0 0 26,729,010 26.3% 73.7% 76.7%
Non-Personnel Services
0020 Supplies And Materials
7,304,604 3,883,463 2,991,285 50,127 25,415 3,066,827 354,314 4.9% 95.1% 71.0%
0031 Telecommunications 81,200 0 0 90,000 0 90,000 (8,800) (10.8%) 110.8% 75.5%
0040 Other Services And Charges
4,433,897 2,770,053 845,706 149,999 198,182 1,193,887 469,957 10.6% 89.4% 92.7%
0041 Contractual Services - Other
29,073,219 19,193,657 8,040,019 3,075 50,400 8,093,494 1,786,069 6.1% 93.9% 95.6%
0050 Subsidies And Transfers
505,000 339,797 0 0 0 0 165,203 32.7% 67.3% 76.2%
0070 Equipment & Equipment Rental
755,000 280,294 170,533 0 114,912 285,445 189,261 25.1% 74.9% 76.2%
Non-Personnel Services 29.3% 42,152,920 26,467,264 12,047,542 293,201 388,909 12,729,652 2,956,004 7.0% 93.0% 91.4%
FL0 - Department of Corrections 100.0% 143,827,352 101,412,686 12,047,542 293,201 388,909 12,729,652 29,685,013 20.6% 79.4% 80.8%
% Of Budget for FL0 - Department of Corrections 70.5% 8.9%
Financial Status Report - (Operating Expenditures) as of June 30, 2019 L - 9

Government of the District of Columbia FY 2019 Financial Status Reports (as of June 30, 2019)General Fund: Local Funds (0100) By Comptroller Source Group
% Monthly Time Elapsed: 75.0%
Office of the Chief Financial Officer % Monthly Time Remaining: 25.0%SOURCE: CFOSolve / SOAR** UNAUDITED and UNADJUSTED **(Run Date: Jul 19, 2019)
FO0 - Office of Victim Services and Justice Grants
GAAP Category
CSG CSG Title % of Budget
Revised Budget
Expenditures Encumbrance ID Advances
Pre Encumbrance
Total Commitments
Available Balance
% Available
Balance
%Spent and
Obligated as of June 2019
%Spent and
Obligated as of June 2018
Personnel Services
0011 Regular Pay - Cont Full Time
1,171,036 787,397 0 0 0 0 383,638 32.8% 67.2% 73.9%
0012 Regular Pay - Other 173,341 105,586 0 0 0 0 67,755 39.1% 60.9% 83.1%
0014 Fringe Benefits - Curr Personnel
295,815 172,724 0 0 0 0 123,091 41.6% 58.4% 77.4%
Personnel Services 4.4% 1,640,191 1,065,988 0 0 0 0 574,203 35.0% 65.0% 75.9%
Non-Personnel Services
0020 Supplies And Materials
35,000 0 0 0 0 0 35,000 100.0% 0.0% 43.3%
0031 Telecommunications 0 0 0 2,128 0 2,128 (2,128) N/A N/A N/A
0040 Other Services And Charges
248,198 64,366 0 0 0 0 183,832 74.1% 25.9% 64.1%
0050 Subsidies And Transfers
34,947,295 21,528,150 9,284,398 162,500 1,000 9,447,898 3,971,247 11.4% 88.6% 89.6%
Non-Personnel Services 95.6% 35,230,492 21,592,516 9,284,398 164,628 1,000 9,450,026 4,187,951 11.9% 88.1% 89.4%
FO0 - Office of Victim Services and Justice Grants
100.0% 36,870,683 22,658,504 9,284,398 164,628 1,000 9,450,026 4,762,153 12.9% 87.1% 88.9%
% Of Budget for FO0 - Office of Victim Services and Justice Grants
61.5% 25.6%
Financial Status Report - (Operating Expenditures) as of June 30, 2019 L - 10

Government of the District of Columbia FY 2019 Financial Status Reports (as of June 30, 2019)General Fund: Local Funds (0100) By Comptroller Source Group
% Monthly Time Elapsed: 75.0%
Office of the Chief Financial Officer % Monthly Time Remaining: 25.0%SOURCE: CFOSolve / SOAR** UNAUDITED and UNADJUSTED **(Run Date: Jul 19, 2019)
FQ0 - Office of the Deputy Mayor for Public Safety and Justice
GAAP Category CSG CSG Title % of Budget
Revised Budget
Expenditures Encumbrance ID Advances
Pre Encumbrance
Total Commitments
Available Balance
% Available
Balance
%Spent and
Obligated as of June 2019
%Spent and
Obligated as of June 2018
Personnel Services
0011 Regular Pay - Cont Full Time
953,162 633,772 0 0 0 0 319,391 33.5% 66.5% 67.0%
0014 Fringe Benefits - Curr Personnel
197,314 135,536 0 0 0 0 61,778 31.3% 68.7% 68.7%
Personnel Services 76.9% 1,150,476 817,911 0 0 0 0 332,565 28.9% 71.1% 73.5%
Non-Personnel Services
0020 Supplies And Materials
10,800 0 0 2,667 0 2,667 8,133 75.3% 24.7% 25.9%
0031 Telecommunications 0 0 0 844 0 844 (844) N/A N/A 95.7%
0040 Other Services And Charges
326,994 28,080 0 149,486 0 149,486 149,427 45.7% 54.3% 86.6%
0041 Contractual Services - Other
0 0 0 (560) 0 (560) 560 N/A N/A N/A
0070 Equipment & Equipment Rental
8,000 0 0 0 0 0 8,000 100.0% 0.0% 0.0%
Non-Personnel Services 23.1% 345,794 28,080 0 152,437 0 152,437 165,276 47.8% 52.2% 83.4%
FQ0 - Office of the Deputy Mayor for Public Safety and Justice
100.0% 1,496,270 845,992 0 152,437 0 152,437 497,841 33.3% 66.7% 75.8%
% Of Budget for FQ0 - Office of the Deputy Mayor for Public Safety and Justice
56.5% 10.2%
Financial Status Report - (Operating Expenditures) as of June 30, 2019 L - 11

Government of the District of Columbia FY 2019 Financial Status Reports (as of June 30, 2019)General Fund: Local Funds (0100) By Comptroller Source Group
% Monthly Time Elapsed: 75.0%
Office of the Chief Financial Officer % Monthly Time Remaining: 25.0%SOURCE: CFOSolve / SOAR** UNAUDITED and UNADJUSTED **(Run Date: Jul 19, 2019)
FR0 - Department of Forensic Sciences
GAAP Category
CSG CSG Title % of Budget
Revised Budget
Expenditures Encumbrance ID Advances
Pre Encumbrance
Total Commitments
Available Balance
% Available
Balance
%Spent and
Obligated as of June 2019
%Spent and
Obligated as of June 2018
Personnel Services
0011 Regular Pay - Cont Full Time
14,130,286 12,593,291 0 0 0 0 1,536,995 10.9% 89.1% 75.8%
0012 Regular Pay - Other 2,795,707 157,742 0 0 0 0 2,637,965 94.4% 5.6% 52.3%
0013 Additional Gross Pay 541,794 599,624 0 0 0 0 (57,830) (10.7%) 110.7% 84.2%
0014 Fringe Benefits - Curr Personnel
3,804,377 2,650,340 0 0 0 0 1,154,037 30.3% 69.7% 71.2%
0015 Overtime Pay 264,000 178,118 0 0 0 0 85,882 32.5% 67.5% 95.3%
Personnel Services 81.1% 21,536,164 16,179,115 0 0 0 0 5,357,050 24.9% 75.1% 72.8%
Non-Personnel Services
0020 Supplies And Materials
1,190,180 611,658 248,824 1,000 101,548 351,371 227,151 19.1% 80.9% 96.5%
0031 Telecommunications 42,537 572 0 13,428 0 13,428 28,537 67.1% 32.9% 100.0%
0040 Other Services And Charges
1,578,352 1,020,711 164,467 25,358 64,626 254,451 303,190 19.2% 80.8% 79.0%
0041 Contractual Services - Other
2,002,731 1,059,236 553,010 974 155,454 709,439 234,056 11.7% 88.3% 91.2%
0070 Equipment & Equipment Rental
200,965 82,032 0 52,000 61,938 113,938 4,995 2.5% 97.5% 82.7%
Non-Personnel Services 18.9% 5,014,764 2,774,209 966,301 92,759 383,566 1,442,626 797,929 15.9% 84.1% 87.1%
FR0 - Department of Forensic Sciences 100.0% 26,550,929 18,953,324 966,301 92,759 383,566 1,442,626 6,154,979 23.2% 76.8% 76.1%
% Of Budget for FR0 - Department of Forensic Sciences
71.4% 5.4%
Financial Status Report - (Operating Expenditures) as of June 30, 2019 L - 12

Government of the District of Columbia FY 2019 Financial Status Reports (as of June 30, 2019)General Fund: Local Funds (0100) By Comptroller Source Group
% Monthly Time Elapsed: 75.0%
Office of the Chief Financial Officer % Monthly Time Remaining: 25.0%SOURCE: CFOSolve / SOAR** UNAUDITED and UNADJUSTED **(Run Date: Jul 19, 2019)
FS0 - Office of Administrative Hearings
GAAP Category
CSG CSG Title % of Budget
Revised Budget
Expenditures Encumbrance ID Advances
Pre Encumbrance
Total Commitments
Available Balance
% Available
Balance
%Spent and
Obligated as of June 2019
%Spent and
Obligated as of June 2018
Personnel Services
0011 Regular Pay - Cont Full Time
7,076,340 5,026,385 0 0 0 0 2,049,956 29.0% 71.0% 66.2%
0012 Regular Pay - Other 466,232 303,861 0 0 0 0 162,372 34.8% 65.2% 78.9%
0013 Additional Gross Pay 26,806 9,094 0 0 0 0 17,711 66.1% 33.9% 45.3%
0014 Fringe Benefits - Curr Personnel
1,413,111 1,000,240 0 0 0 0 412,871 29.2% 70.8% 68.1%
0015 Overtime Pay 70 160 0 0 0 0 (90) (128.7%) 228.7% 5.1%
Personnel Services 90.5% 8,982,560 6,339,740 0 0 0 0 2,642,820 29.4% 70.6% 66.9%
Non-Personnel Services
0020 Supplies And Materials
85,948 51,000 12,478 0 0 12,478 22,470 26.1% 73.9% 100.0%
0031 Telecommunications 5,000 0 0 5,000 0 5,000 0 0.0% 100.0% 5.9%
0040 Other Services And Charges
267,857 76,117 28,422 31,511 1,073 61,006 130,734 48.8% 51.2% 95.0%
0041 Contractual Services - Other
454,129 273,789 85,844 729 74,307 160,880 19,460 4.3% 95.7% 75.4%
0070 Equipment & Equipment Rental
128,727 53,264 13,152 0 0 13,152 62,311 48.4% 51.6% 73.4%
Non-Personnel Services 9.5% 941,661 454,169 139,896 37,240 75,380 252,516 234,975 25.0% 75.0% 73.3%
FS0 - Office of Administrative Hearings 100.0% 9,924,220 6,793,909 139,896 37,240 75,380 252,516 2,877,795 29.0% 71.0% 67.4%
% Of Budget for FS0 - Office of Administrative Hearings
68.5% 2.5%
Financial Status Report - (Operating Expenditures) as of June 30, 2019 L - 13
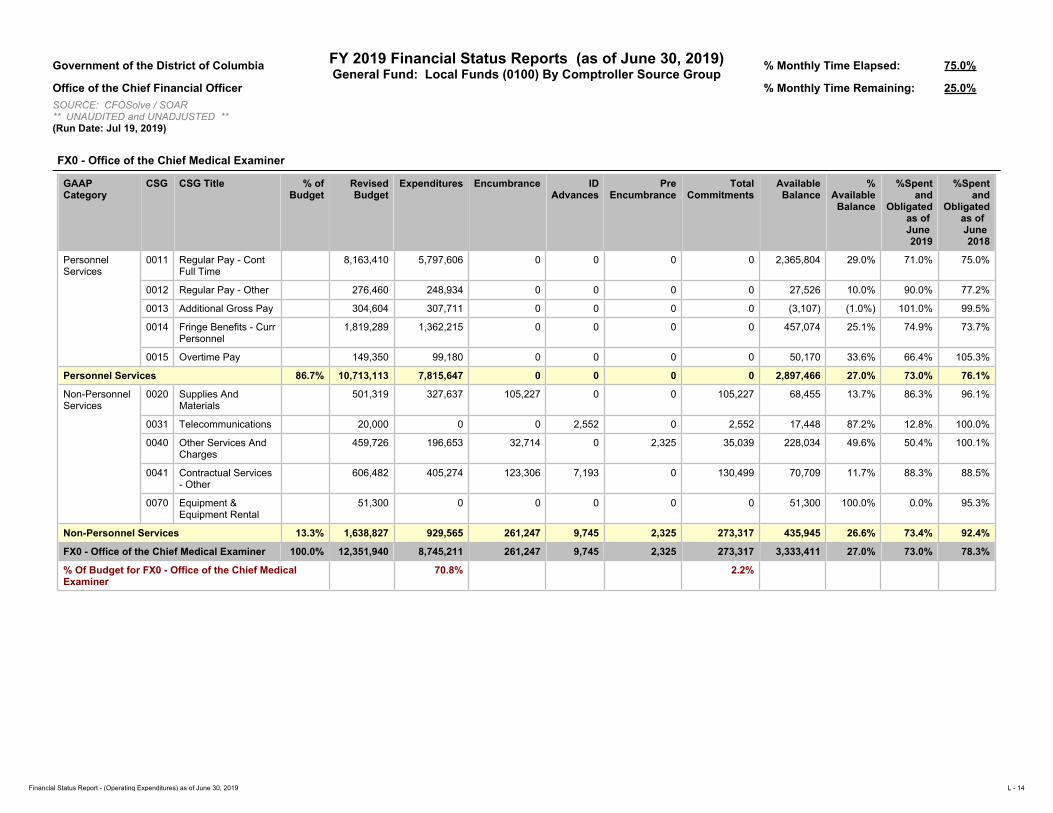
Government of the District of Columbia FY 2019 Financial Status Reports (as of June 30, 2019)General Fund: Local Funds (0100) By Comptroller Source Group
% Monthly Time Elapsed: 75.0%
Office of the Chief Financial Officer % Monthly Time Remaining: 25.0%SOURCE: CFOSolve / SOAR** UNAUDITED and UNADJUSTED **(Run Date: Jul 19, 2019)
FX0 - Office of the Chief Medical Examiner
GAAP Category
CSG CSG Title % of Budget
Revised Budget
Expenditures Encumbrance ID Advances
Pre Encumbrance
Total Commitments
Available Balance
% Available
Balance
%Spent and
Obligated as of June 2019
%Spent and
Obligated as of June 2018
Personnel Services
0011 Regular Pay - Cont Full Time
8,163,410 5,797,606 0 0 0 0 2,365,804 29.0% 71.0% 75.0%
0012 Regular Pay - Other 276,460 248,934 0 0 0 0 27,526 10.0% 90.0% 77.2%
0013 Additional Gross Pay 304,604 307,711 0 0 0 0 (3,107) (1.0%) 101.0% 99.5%
0014 Fringe Benefits - Curr Personnel
1,819,289 1,362,215 0 0 0 0 457,074 25.1% 74.9% 73.7%
0015 Overtime Pay 149,350 99,180 0 0 0 0 50,170 33.6% 66.4% 105.3%
Personnel Services 86.7% 10,713,113 7,815,647 0 0 0 0 2,897,466 27.0% 73.0% 76.1%
Non-Personnel Services
0020 Supplies And Materials
501,319 327,637 105,227 0 0 105,227 68,455 13.7% 86.3% 96.1%
0031 Telecommunications 20,000 0 0 2,552 0 2,552 17,448 87.2% 12.8% 100.0%
0040 Other Services And Charges
459,726 196,653 32,714 0 2,325 35,039 228,034 49.6% 50.4% 100.1%
0041 Contractual Services - Other
606,482 405,274 123,306 7,193 0 130,499 70,709 11.7% 88.3% 88.5%
0070 Equipment & Equipment Rental
51,300 0 0 0 0 0 51,300 100.0% 0.0% 95.3%
Non-Personnel Services 13.3% 1,638,827 929,565 261,247 9,745 2,325 273,317 435,945 26.6% 73.4% 92.4%
FX0 - Office of the Chief Medical Examiner 100.0% 12,351,940 8,745,211 261,247 9,745 2,325 273,317 3,333,411 27.0% 73.0% 78.3%
% Of Budget for FX0 - Office of the Chief Medical Examiner
70.8% 2.2%
Financial Status Report - (Operating Expenditures) as of June 30, 2019 L - 14

Government of the District of Columbia FY 2019 Financial Status Reports (as of June 30, 2019)General Fund: Local Funds (0100) By Comptroller Source Group
% Monthly Time Elapsed: 75.0%
Office of the Chief Financial Officer % Monthly Time Remaining: 25.0%SOURCE: CFOSolve / SOAR** UNAUDITED and UNADJUSTED **(Run Date: Jul 19, 2019)
FZ0 - DC Sentencing Commission
GAAP Category
CSG CSG Title % of Budget
Revised Budget
Expenditures Encumbrance ID Advances
Pre Encumbrance
Total Commitments
Available Balance
% Available
Balance
%Spent and
Obligated as of June 2019
%Spent and
Obligated as of June 2018
Personnel Services
0011 Regular Pay - Cont Full Time
583,204 433,746 0 0 0 0 149,458 25.6% 74.4% 78.5%
0014 Fringe Benefits - Curr Personnel
123,639 86,919 0 0 0 0 36,720 29.7% 70.3% 71.1%
Personnel Services 59.6% 706,844 520,665 0 0 0 0 186,179 26.3% 73.7% 76.1%
Non-Personnel Services
0020 Supplies And Materials
10,468 0 0 16,968 0 16,968 (6,500) (62.1%) 162.1% 915.5%
0031 Telecommunications 3,648 0 0 300 0 300 3,348 91.8% 8.2% 6.8%
0040 Other Services And Charges
78,752 60,190 0 1,986 0 1,986 16,576 21.0% 79.0% 87.9%
0041 Contractual Services - Other
386,215 221,563 163,548 0 0 163,548 1,103 0.3% 99.7% 78.7%
Non-Personnel Services 40.4% 479,083 281,753 163,548 19,254 0 182,802 14,528 3.0% 97.0% 80.4%
FZ0 - DC Sentencing Commission 100.0% 1,185,927 802,419 163,548 19,254 0 182,802 200,706 16.9% 83.1% 78.0%
% Of Budget for FZ0 - DC Sentencing Commission 67.7% 15.4%
Financial Status Report - (Operating Expenditures) as of June 30, 2019 L - 15

Government of the District of Columbia FY 2019 Financial Status Reports (as of June 30, 2019)General Fund: Local Funds (0100) By Comptroller Source Group
% Monthly Time Elapsed: 75.0%
Office of the Chief Financial Officer % Monthly Time Remaining: 25.0%SOURCE: CFOSolve / SOAR** UNAUDITED and UNADJUSTED **(Run Date: Jul 19, 2019)
MA0 - Criminal Code Reform Commission
GAAP Category
CSG CSG Title % of Budget
Revised Budget
Expenditures Encumbrance ID Advances
Pre Encumbrance
Total Commitments
Available Balance
% Available
Balance
%Spent and
Obligated as of June 2019
%Spent and
Obligated as of June 2018
Personnel Services
0011 Regular Pay - Cont Full Time
536,176 407,842 0 0 0 0 128,333 23.9% 76.1% 75.8%
0014 Fringe Benefits - Curr Personnel
113,669 73,879 0 0 0 0 39,790 35.0% 65.0% 67.8%
Personnel Services 89.8% 649,845 481,722 0 0 0 0 168,124 25.9% 74.1% 74.9%
Non-Personnel Services
0020 Supplies And Materials
1,735 0 0 0 0 0 1,735 100.0% 0.0% 0.0%
0031 Telecommunications 6,600 0 0 0 0 0 6,600 100.0% 0.0% 0.0%
0040 Other Services And Charges
65,693 20,882 0 4,668 11,800 16,468 28,343 43.1% 56.9% 23.9%
Non-Personnel Services 10.2% 74,028 20,882 0 4,668 11,800 16,468 36,678 49.5% 50.5% 22.2%
MA0 - Criminal Code Reform Commission 100.0% 723,873 502,604 0 4,668 11,800 16,468 204,802 28.3% 71.7% 70.3%
% Of Budget for MA0 - Criminal Code Reform Commission
69.4% 2.3%
Financial Status Report - (Operating Expenditures) as of June 30, 2019 L - 16

Government of the District of Columbia FY 2019 Financial Status Reports (as of June 30, 2019)General Fund: Local Funds (0100) By Comptroller Source Group
% Monthly Time Elapsed: 75.0%
Office of the Chief Financial Officer % Monthly Time Remaining: 25.0%SOURCE: CFOSolve / SOAR** UNAUDITED and UNADJUSTED **(Run Date: Jul 19, 2019)
NS0 - Office of Neighborhood Safety and Engagement
GAAP Category
CSG CSG Title % of Budget
Revised Budget
Expenditures Encumbrance ID Advances
Pre Encumbrance
Total Commitments
Available Balance
% Available
Balance
%Spent and
Obligated as of June 2019
%Spent and
Obligated as of June 2018
Personnel Services
0011 Regular Pay - Cont Full Time
1,938,476 984,205 0 0 0 0 954,271 49.2% 50.8% 66.4%
0012 Regular Pay - Other 0 135,886 0 0 0 0 (135,886) N/A N/A 154.3%
0013 Additional Gross Pay 75,614 3,143 0 0 0 0 72,471 95.8% 4.2% N/A
0014 Fringe Benefits - Curr Personnel
383,495 284,681 0 0 0 0 98,814 25.8% 74.2% 78.8%
0015 Overtime Pay 25,000 29 0 0 0 0 24,971 99.9% 0.1% N/A
Personnel Services 40.6% 2,422,585 1,407,944 0 0 0 0 1,014,641 41.9% 58.1% 72.8%
Non-Personnel Services
0020 Supplies And Materials
50,500 27,513 16,732 0 0 16,732 6,255 12.4% 87.6% 75.3%
0031 Telecommunications 15,000 8,475 0 6,842 0 6,842 (317) (2.1%) 102.1% 43.6%
0040 Other Services And Charges
475,922 161,370 120,248 16,989 101,313 238,550 76,002 16.0% 84.0% 97.7%
0050 Subsidies And Transfers
2,925,000 1,188,898 1,140,477 522,122 0 1,662,599 73,503 2.5% 97.5% 96.3%
0070 Equipment & Equipment Rental
80,000 28,270 0 0 46,356 46,356 5,374 6.7% 93.3% 80.2%
Non-Personnel Services 59.4% 3,546,422 1,414,526 1,277,458 545,954 147,669 1,971,080 160,816 4.5% 95.5% 94.6%
NS0 - Office of Neighborhood Safety and Engagement
100.0% 5,969,007 2,822,470 1,277,458 545,954 147,669 1,971,080 1,175,457 19.7% 80.3% 86.4%
% Of Budget for NS0 - Office of Neighborhood Safety and Engagement
47.3% 33.0%
Financial Status Report - (Operating Expenditures) as of June 30, 2019 L - 17

Government of the District of Columbia FY 2019 Financial Status Reports (as of June 30, 2019)General Fund: Local Funds (0100) By Comptroller Source Group
% Monthly Time Elapsed: 75.0%
Office of the Chief Financial Officer % Monthly Time Remaining: 25.0%SOURCE: CFOSolve / SOAR** UNAUDITED and UNADJUSTED **(Run Date: Jul 19, 2019)
PJ0 - Section 103 Judgments-Public Safety and Justice
GAAP Category CSG CSG Title % of Budget
Revised Budget
Expenditures Encumbrance ID Advances
Pre Encumbrance
Total Commitments
Available Balance
% Available
Balance
%Spent and
Obligated as of June 2019
%Spent and
Obligated as of June 2018
Non-Personnel Services
0050 Subsidies And Transfers
240,000 0 0 0 0 0 240,000 100.0% 0.0% N/A
Non-Personnel Services 100.0% 240,000 0 0 0 0 0 240,000 100.0% 0.0% N/A
PJ0 - Section 103 Judgments-Public Safety and Justice
100.0% 240,000 0 0 0 0 0 240,000 100.0% 0.0% N/A
% Of Budget for PJ0 - Section 103 Judgments-Public Safety and Justice
0.0% 0.0%
Financial Status Report - (Operating Expenditures) as of June 30, 2019 L - 18

Government of the District of Columbia FY 2019 Financial Status Reports (as of June 30, 2019)General Fund: Local Funds (0100) By Comptroller Source Group
% Monthly Time Elapsed: 75.0%
Office of the Chief Financial Officer % Monthly Time Remaining: 25.0%SOURCE: CFOSolve / SOAR** UNAUDITED and UNADJUSTED **(Run Date: Jul 19, 2019)
UC0 - Office of Unified Communications
GAAP Category
CSG CSG Title % of Budget
Revised Budget
Expenditures Encumbrance ID Advances
Pre Encumbrance
Total Commitments
Available Balance
% Available
Balance
%Spent and
Obligated as of June 2019
%Spent and
Obligated as of June 2018
Personnel Services
0011 Regular Pay - Cont Full Time
22,060,587 16,335,729 0 0 0 0 5,724,858 26.0% 74.0% 68.8%
0012 Regular Pay - Other
833,478 246,269 0 0 0 0 587,209 70.5% 29.5% 588.1%
0013 Additional Gross Pay
2,346,747 1,750,186 0 0 0 0 596,562 25.4% 74.6% 76.5%
0014 Fringe Benefits - Curr Personnel
6,713,612 4,468,409 0 0 0 0 2,245,203 33.4% 66.6% 65.4%
0015 Overtime Pay 1,310,583 1,626,153 0 0 0 0 (315,570) (24.1%) 124.1% 108.6%
Personnel Services 97.5% 33,265,007 24,426,745 0 0 0 0 8,838,262 26.6% 73.4% 73.3%
Non-Personnel Services
0040 Other Services And Charges
347,500 205,820 29,180 0 0 29,180 112,500 32.4% 67.6% N/A
0041 Contractual Services - Other
500,000 0 238,600 0 261,400 500,000 0 0.0% 100.0% N/A
Non-Personnel Services 2.5% 847,500 205,820 267,780 0 261,400 529,180 112,500 13.3% 86.7% N/A
UC0 - Office of Unified Communications 100.0% 34,112,507 24,632,565 267,780 0 261,400 529,180 8,950,762 26.2% 73.8% 73.3%
% Of Budget for UC0 - Office of Unified Communications
72.2% 1.6%
Grand Total for Public Safety and Justice
1,191,432,023 901,367,987 45,964,114 7,777,877 2,586,739 56,328,730 233,735,306 19.6% 80.4% 80.1%
% Of Budget for Public Safety and Justice 75.7% 4.7%
Financial Status Report - (Operating Expenditures) as of June 30, 2019 L - 19

(M) Public Education System

Government of the District of Columbia FY 2019 Financial Status Reports (as of June 30, 2019)General Fund: Local Funds (0100) By Comptroller Source Group
% Monthly Time Elapsed: 75.0%
Office of the Chief Financial Officer % Monthly Time Remaining: 25.0%SOURCE: CFOSolve / SOAR** UNAUDITED and UNADJUSTED **(Run Date: Jul 19, 2019)
CE0 - District of Columbia Public Library
GAAP Category
CSG CSG Title % of Budget
Revised Budget
Expenditures Encumbrance ID Advances
Pre Encumbrance
Total Commitments
Available Balance
% Available
Balance
%Spent and
Obligated as of June 2019
%Spent and
Obligated as of June 2018
Personnel Services
0011 Regular Pay - Cont Full Time
32,965,366 24,923,645 0 0 0 0 8,041,721 24.4% 75.6% 77.0%
0012 Regular Pay - Other 1,814,891 1,229,949 0 0 0 0 584,942 32.2% 67.8% 61.5%
0013 Additional Gross Pay 676,000 589,964 0 0 0 0 86,036 12.7% 87.3% 61.3%
0014 Fringe Benefits - Curr Personnel
8,903,745 6,375,734 0 0 0 0 2,528,011 28.4% 71.6% 73.7%
0015 Overtime Pay 377,000 281,363 0 0 0 0 95,637 25.4% 74.6% 198.1%
Personnel Services 68.9% 44,737,002 33,400,655 0 0 0 0 11,336,346 25.3% 74.7% 75.7%
Non-Personnel Services
0020 Supplies And Materials
502,261 283,688 101,118 58,755 8,362 168,235 50,338 10.0% 90.0% 76.3%
0031 Telecommunications 137,476 0 0 137,476 0 137,476 0 0.0% 100.0% 100.0%
0040 Other Services And Charges
9,879,490 4,686,115 3,155,401 234,707 67,261 3,457,370 1,736,005 17.6% 82.4% 82.3%
0041 Contractual Services - Other
383,131 0 383,131 0 0 383,131 0 0.0% 100.0% 33.5%
0070 Equipment & Equipment Rental
9,300,914 3,204,511 2,248,569 47,396 241,793 2,537,758 3,558,645 38.3% 61.7% 80.2%
Non-Personnel Services 31.1% 20,203,271 8,174,314 5,888,220 478,334 317,416 6,683,970 5,344,987 26.5% 73.5% 80.6%
CE0 - District of Columbia Public Library 100.0% 64,940,273 41,574,969 5,888,220 478,334 317,416 6,683,970 16,681,333 25.7% 74.3% 77.2%
% Of Budget for CE0 - District of Columbia Public Library
64.0% 10.3%
Financial Status Report - (Operating Expenditures) as of June 30, 2019 M - 1

Government of the District of Columbia FY 2019 Financial Status Reports (as of June 30, 2019)General Fund: Local Funds (0100) By Comptroller Source Group
% Monthly Time Elapsed: 75.0%
Office of the Chief Financial Officer % Monthly Time Remaining: 25.0%SOURCE: CFOSolve / SOAR** UNAUDITED and UNADJUSTED **(Run Date: Jul 19, 2019)
GA0 - District of Columbia Public Schools
GAAP Category
CSG CSG Title % of Budget
Revised Budget
Expenditures Encumbrance ID Advances
Pre Encumbrance
Total Commitments
Available Balance
% Available
Balance
%Spent and
Obligated as of June 2019
%Spent and
Obligated as of June 2018
Personnel Services
0011 Regular Pay - Cont Full Time
553,858,062 465,454,563 0 0 0 0 88,403,499 16.0% 84.0% 80.7%
0012 Regular Pay - Other 34,769,504 27,857,170 0 0 0 0 6,912,334 19.9% 80.1% 84.7%
0013 Additional Gross Pay
22,678,731 26,710,141 0 0 0 0 (4,031,410) (17.8%) 117.8% 125.6%
0014 Fringe Benefits - Curr Personnel
82,930,781 69,918,167 0 0 0 0 13,012,614 15.7% 84.3% 78.4%
0015 Overtime Pay 926,886 1,983,585 0 0 0 0 (1,056,699) (114.0%) 214.0% 213.2%
Personnel Services 82.5% 695,163,964 591,923,626 0 0 0 0 103,240,338 14.9% 85.1% 81.5%
Non-Personnel Services
0020 Supplies And Materials
7,901,920 3,412,770 399,600 1,695,870 657,245 2,752,716 1,736,434 22.0% 78.0% 90.0%
0030 Energy, Comm. And Bldg Rentals
23,784,764 17,322,771 0 6,461,993 0 6,461,993 0 0.0% 100.0% 100.0%
0031 Telecommunications 3,350,592 1,795,456 0 1,554,571 0 1,554,571 565 0.0% 100.0% 90.4%
0032 Rentals - Land And Structures
7,037,349 5,525,344 0 1,512,005 0 1,512,005 0 0.0% 100.0% 100.0%
0034 Security Services 189,218 4,404 0 184,814 0 184,814 0 0.0% 100.0% 0.0%
0040 Other Services And Charges
11,185,189 6,161,490 707,107 545,451 647,388 1,899,945 3,123,755 27.9% 72.1% 80.3%
0041 Contractual Services - Other
82,099,913 51,988,916 10,162,282 11,557,609 4,153,148 25,873,038 4,237,958 5.2% 94.8% 94.5%
0050 Subsidies And Transfers
3,362,420 3,338,332 0 0 0 0 24,088 0.7% 99.3% 96.0%
0070 Equipment & Equipment Rental
8,102,183 1,451,169 1,039,379 1,088,292 4,070,680 6,198,351 452,662 5.6% 94.4% 90.3%
Non-Personnel Services 17.5% 147,013,548 91,000,652 12,308,368 24,600,605 9,528,461 46,437,434 9,575,462 6.5% 93.5% 94.1%
GA0 - District of Columbia Public Schools
100.0% 842,177,512 682,924,278 12,308,368 24,600,605 9,528,461 46,437,434 112,815,800 13.4% 86.6% 83.7%
% Of Budget for GA0 - District of Columbia Public Schools
81.1% 5.5%
Financial Status Report - (Operating Expenditures) as of June 30, 2019 M - 2

Government of the District of Columbia FY 2019 Financial Status Reports (as of June 30, 2019)General Fund: Local Funds (0100) By Comptroller Source Group
% Monthly Time Elapsed: 75.0%
Office of the Chief Financial Officer % Monthly Time Remaining: 25.0%SOURCE: CFOSolve / SOAR** UNAUDITED and UNADJUSTED **(Run Date: Jul 19, 2019)
GC0 - District of Columbia Public Charter Schools
GAAP Category
CSG CSG Title % of Budget
Revised Budget
Expenditures Encumbrance ID Advances
Pre Encumbrance
Total Commitments
Available Balance
% Available
Balance
%Spent and
Obligated as of June 2019
%Spent and
Obligated as of June 2018
Personnel Services
0011 Regular Pay - Cont Full Time
133,480 105,077 0 0 0 0 28,403 21.3% 78.7% 75.4%
0014 Fringe Benefits - Curr Personnel
38,442 28,501 0 0 0 0 9,941 25.9% 74.1% 73.6%
Personnel Services 0.0% 171,922 133,578 0 0 0 0 38,344 22.3% 77.7% 75.0%
Non-Personnel Services
0040 Other Services And Charges
117,991 0 0 0 0 0 117,991 100.0% 0.0% 0.0%
0050 Subsidies And Transfers
579,944,057 563,709,502 0 0 0 0 16,234,555 2.8% 97.2% 98.5%
Non-Personnel Services 100.0% 580,062,048 563,709,502 0 0 0 0 16,352,545 2.8% 97.2% 98.5%
GC0 - District of Columbia Public Charter Schools
100.0% 580,233,970 563,843,080 0 0 0 0 16,390,889 2.8% 97.2% 98.5%
% Of Budget for GC0 - District of Columbia Public Charter Schools
97.2% 0.0%
Financial Status Report - (Operating Expenditures) as of June 30, 2019 M - 3

Government of the District of Columbia FY 2019 Financial Status Reports (as of June 30, 2019)General Fund: Local Funds (0100) By Comptroller Source Group
% Monthly Time Elapsed: 75.0%
Office of the Chief Financial Officer % Monthly Time Remaining: 25.0%SOURCE: CFOSolve / SOAR** UNAUDITED and UNADJUSTED **(Run Date: Jul 19, 2019)
GD0 - Office of the State Superintendent of Education
GAAP Category
CSG CSG Title % of Budget
Revised Budget
Expenditures Encumbrance ID Advances
Pre Encumbrance
Total Commitments
Available Balance
% Available
Balance
%Spent and
Obligated as of June 2019
%Spent and
Obligated as of June 2018
Personnel Services
0011 Regular Pay - Cont Full Time
26,491,485 18,602,950 0 0 0 0 7,888,535 29.8% 70.2% 68.5%
0012 Regular Pay - Other 270,803 545,237 0 0 0 0 (274,434) (101.3%) 201.3% 145.7%
0014 Fringe Benefits - Curr Personnel
6,158,262 4,180,875 0 0 0 0 1,977,387 32.1% 67.9% 64.4%
Personnel Services 17.2% 32,920,550 23,497,165 0 0 0 0 9,423,386 28.6% 71.4% 68.8%
Non-Personnel Services
0020 Supplies And Materials
156,000 79,374 4 0 0 4 76,622 49.1% 50.9% 57.9%
0030 Energy, Comm. And Bldg Rentals
38,389 18,846 0 19,542 0 19,542 0 0.0% 100.0% 100.0%
0031 Telecommunications 604,592 310,267 0 291,944 0 291,944 2,380 0.4% 99.6% 121.5%
0032 Rentals - Land And Structures
6,166,973 2,609,017 0 1,414,855 0 1,414,855 2,143,101 34.8% 65.2% 100.0%
0034 Security Services 35,842 8,371 0 27,471 0 27,471 0 0.0% 100.0% 100.0%
0035 Occupancy Fixed Costs
356,044 185,078 0 170,966 0 170,966 0 0.0% 100.0% 100.0%
0040 Other Services And Charges
2,424,436 798,902 726,746 (61,805) 299,602 964,542 660,991 27.3% 72.7% 80.3%
0041 Contractual Services - Other
22,113,315 10,361,719 8,015,962 101,421 1,366,201 9,483,584 2,268,012 10.3% 89.7% 85.6%
0050 Subsidies And Transfers
125,473,703 62,567,524 3,348,090 1,996,155 414,500 5,758,745 57,147,434 45.5% 54.5% 44.3%
0070 Equipment & Equipment Rental
1,076,667 567,833 258,536 1,045 3,473 263,055 245,780 22.8% 77.2% 67.6%
Non-Personnel Services 82.8% 158,445,959 77,506,933 12,349,338 3,961,593 2,083,776 18,394,707 62,544,320 39.5% 60.5% 52.2%
GD0 - Office of the State Superintendent of Education
100.0% 191,366,510 101,004,097 12,349,338 3,961,593 2,083,776 18,394,707 71,967,705 37.6% 62.4% 54.9%
% Of Budget for GD0 - Office of the State Superintendent of Education
52.8% 9.6%
Financial Status Report - (Operating Expenditures) as of June 30, 2019 M - 4

Government of the District of Columbia FY 2019 Financial Status Reports (as of June 30, 2019)General Fund: Local Funds (0100) By Comptroller Source Group
% Monthly Time Elapsed: 75.0%
Office of the Chief Financial Officer % Monthly Time Remaining: 25.0%SOURCE: CFOSolve / SOAR** UNAUDITED and UNADJUSTED **(Run Date: Jul 19, 2019)
GE0 - D.C. State Board of Education
GAAP Category
CSG CSG Title % of Budget
Revised Budget
Expenditures Encumbrance ID Advances
Pre Encumbrance
Total Commitments
Available Balance
% Available
Balance
%Spent and
Obligated as of June 2019
%Spent and
Obligated as of June 2018
Personnel Services
0011 Regular Pay - Cont Full Time
933,531 746,389 0 0 0 0 187,142 20.0% 80.0% 75.9%
0012 Regular Pay - Other 340,372 168,001 0 0 0 0 172,370 50.6% 49.4% 69.7%
0014 Fringe Benefits - Curr Personnel
257,485 156,836 0 0 0 0 100,649 39.1% 60.9% 63.7%
Personnel Services 82.8% 1,531,387 1,080,288 0 0 0 0 451,099 29.5% 70.5% 74.8%
Non-Personnel Services
0020 Supplies And Materials
37,500 10,067 0 17,949 0 17,949 9,484 25.3% 74.7% 188.7%
0031 Telecommunications 3,307 0 0 2,379 0 2,379 928 28.1% 71.9% 9.1%
0040 Other Services And Charges
227,416 98,710 19,955 22,270 5,600 47,825 80,882 35.6% 64.4% 81.4%
0041 Contractual Services - Other
20,000 325 0 (1,783) 6,000 4,217 15,458 77.3% 22.7% N/A
0050 Subsidies And Transfers
0 0 0 0 0 0 0 N/A N/A 24.9%
0070 Equipment & Equipment Rental
30,455 8,919 5,043 2,061 0 7,104 14,432 47.4% 52.6% N/A
Non-Personnel Services 17.2% 318,679 118,021 24,998 42,878 11,600 79,476 121,183 38.0% 62.0% 78.1%
GE0 - D.C. State Board of Education 100.0% 1,850,066 1,198,309 24,998 42,878 11,600 79,476 572,282 30.9% 69.1% 75.2%
% Of Budget for GE0 - D.C. State Board of Education 64.8% 4.3%
Financial Status Report - (Operating Expenditures) as of June 30, 2019 M - 5

Government of the District of Columbia FY 2019 Financial Status Reports (as of June 30, 2019)General Fund: Local Funds (0100) By Comptroller Source Group
% Monthly Time Elapsed: 75.0%
Office of the Chief Financial Officer % Monthly Time Remaining: 25.0%SOURCE: CFOSolve / SOAR** UNAUDITED and UNADJUSTED **(Run Date: Jul 19, 2019)
GG0 - University of the District of Columbia Subsidy Account
GAAP Category CSG CSG Title % of Budget
Revised Budget
Expenditures Encumbrance ID Advances
Pre Encumbrance
Total Commitments
Available Balance
% Available
Balance
%Spent and
Obligated as of June 2019
%Spent and
Obligated as of June 2018
Non-Personnel Services
0050 Subsidies And Transfers
87,428,491 65,515,118 0 0 0 0 21,913,373 25.1% 74.9% 75.0%
Non-Personnel Services 100.0% 87,428,491 65,515,118 0 0 0 0 21,913,373 25.1% 74.9% 75.0%
GG0 - University of the District of Columbia Subsidy Account
100.0% 87,428,491 65,515,118 0 0 0 0 21,913,373 25.1% 74.9% 75.0%
% Of Budget for GG0 - University of the District of Columbia Subsidy Account
74.9% 0.0%
Financial Status Report - (Operating Expenditures) as of June 30, 2019 M - 6

Government of the District of Columbia FY 2019 Financial Status Reports (as of June 30, 2019)General Fund: Local Funds (0100) By Comptroller Source Group
% Monthly Time Elapsed: 75.0%
Office of the Chief Financial Officer % Monthly Time Remaining: 25.0%SOURCE: CFOSolve / SOAR** UNAUDITED and UNADJUSTED **(Run Date: Jul 19, 2019)
GL0 - District of Columbia State Athletics Commission
GAAP Category
CSG CSG Title % of Budget
Revised Budget
Expenditures Encumbrance ID Advances
Pre Encumbrance
Total Commitments
Available Balance
% Available
Balance
%Spent and
Obligated as of June 2019
%Spent and
Obligated as of June 2018
Personnel Services
0011 Regular Pay - Cont Full Time
617,861 465,496 0 0 0 0 152,365 24.7% 75.3% N/A
0014 Fringe Benefits - Curr Personnel
142,108 80,868 0 0 0 0 61,240 43.1% 56.9% N/A
Personnel Services 63.9% 759,969 548,006 0 0 0 0 211,963 27.9% 72.1% N/A
Non-Personnel Services
0020 Supplies And Materials
6,860 0 0 0 0 0 6,860 100.0% 0.0% N/A
0040 Other Services And Charges
416,667 356,261 29,021 (4,398) 0 24,623 35,784 8.6% 91.4% N/A
0070 Equipment & Equipment Rental
5,711 0 0 0 0 0 5,711 100.0% 0.0% N/A
Non-Personnel Services 36.1% 429,238 356,261 29,021 (4,398) 0 24,623 48,355 11.3% 88.7% N/A
GL0 - District of Columbia State Athletics Commission
100.0% 1,189,207 904,267 29,021 (4,398) 0 24,623 260,318 21.9% 78.1% N/A
% Of Budget for GL0 - District of Columbia State Athletics Commission
76.0% 2.1%
Financial Status Report - (Operating Expenditures) as of June 30, 2019 M - 7

Government of the District of Columbia FY 2019 Financial Status Reports (as of June 30, 2019)General Fund: Local Funds (0100) By Comptroller Source Group
% Monthly Time Elapsed: 75.0%
Office of the Chief Financial Officer % Monthly Time Remaining: 25.0%SOURCE: CFOSolve / SOAR** UNAUDITED and UNADJUSTED **(Run Date: Jul 19, 2019)
GN0 - Non-Public Tuition
GAAP Category
CSG CSG Title % of Budget
Revised Budget
Expenditures Encumbrance ID Advances
Pre Encumbrance
Total Commitments
Available Balance
% Available
Balance
%Spent and
Obligated as of June 2019
%Spent and
Obligated as of June 2018
Personnel Services
0011 Regular Pay - Cont Full Time
1,538,102 1,099,517 0 0 0 0 438,585 28.5% 71.5% 66.7%
0014 Fringe Benefits - Curr Personnel
389,140 316,144 0 0 0 0 72,996 18.8% 81.2% 71.1%
Personnel Services 3.1% 1,927,242 1,444,030 0 0 0 0 483,213 25.1% 74.9% 68.9%
Non-Personnel Services
0020 Supplies And Materials
2,000 0 0 0 0 0 2,000 100.0% 0.0% 0.0%
0040 Other Services And Charges
37,000 19,924 0 0 10,405 10,405 6,671 18.0% 82.0% 84.0%
0050 Subsidies And Transfers
61,185,114 38,578,302 0 0 0 0 22,606,812 36.9% 63.1% 56.9%
0070 Equipment & Equipment Rental
10,000 0 0 0 0 0 10,000 100.0% 0.0% 0.0%
Non-Personnel Services 96.9% 61,234,114 38,598,226 0 0 10,405 10,405 22,625,483 36.9% 63.1% 56.9%
GN0 - Non-Public Tuition 100.0% 63,161,356 40,042,255 0 0 10,405 10,405 23,108,696 36.6% 63.4% 57.2%
% Of Budget for GN0 - Non-Public Tuition 63.4% 0.0%
Financial Status Report - (Operating Expenditures) as of June 30, 2019 M - 8

Government of the District of Columbia FY 2019 Financial Status Reports (as of June 30, 2019)General Fund: Local Funds (0100) By Comptroller Source Group
% Monthly Time Elapsed: 75.0%
Office of the Chief Financial Officer % Monthly Time Remaining: 25.0%SOURCE: CFOSolve / SOAR** UNAUDITED and UNADJUSTED **(Run Date: Jul 19, 2019)
GO0 - Special Education Transportation
GAAP Category
CSG CSG Title % of Budget
Revised Budget
Expenditures Encumbrance ID Advances
Pre Encumbrance
Total Commitments
Available Balance
% Available
Balance
%Spent and
Obligated as of June 2019
%Spent and
Obligated as of June 2018
Personnel Services
0011 Regular Pay - Cont Full Time
29,266,012 20,742,490 0 0 0 0 8,523,522 29.1% 70.9% 84.0%
0012 Regular Pay - Other 38,967,190 29,882,818 0 0 0 0 9,084,371 23.3% 76.7% 73.9%
0014 Fringe Benefits - Curr Personnel
19,043,459 14,708,485 0 0 0 0 4,334,975 22.8% 77.2% 72.6%
0015 Overtime Pay 4,463,400 5,595,676 0 0 0 0 (1,132,276) (25.4%) 125.4% 108.7%
Personnel Services 93.2% 91,740,061 71,617,777 0 0 0 0 20,122,284 21.9% 78.1% 78.3%
Non-Personnel Services
0020 Supplies And Materials
0 0 0 1,346 0 1,346 (1,346) N/A N/A 92.5%
0030 Energy, Comm. And Bldg Rentals
1,363,579 1,294,869 0 68,710 0 68,710 0 0.0% 100.0% 100.0%
0031 Telecommunications 806,204 190,778 0 615,426 0 615,426 0 0.0% 100.0% 108.2%
0032 Rentals - Land And Structures
2,083,081 1,196,906 0 886,175 0 886,175 0 0.0% 100.0% 83.5%
0034 Security Services 1,641,211 820,307 0 820,904 0 820,904 0 0.0% 100.0% 100.0%
0035 Occupancy Fixed Costs
134,045 10,672 0 123,373 0 123,373 0 0.0% 100.0% 100.0%
0040 Other Services And Charges
327,378 292,063 0 (400,723) 0 (400,723) 436,037 133.2% (33.2%) 70.5%
0041 Contractual Services - Other
338,644 0 0 401,708 0 401,708 (63,064) (18.6%) 118.6% 185.1%
0050 Subsidies And Transfers
0 0 0 0 0 0 0 N/A N/A 24.5%
0070 Equipment & Equipment Rental
0 0 0 0 0 0 0 N/A N/A 68.1%
Non-Personnel Services 6.8% 6,694,142 3,805,595 0 2,516,920 0 2,516,920 371,627 5.6% 94.4% 93.9%
GO0 - Special Education Transportation 100.0% 98,434,203 75,423,372 0 2,516,920 0 2,516,920 20,493,912 20.8% 79.2% 79.7%
% Of Budget for GO0 - Special Education Transportation
76.6% 2.6%
Financial Status Report - (Operating Expenditures) as of June 30, 2019 M - 9
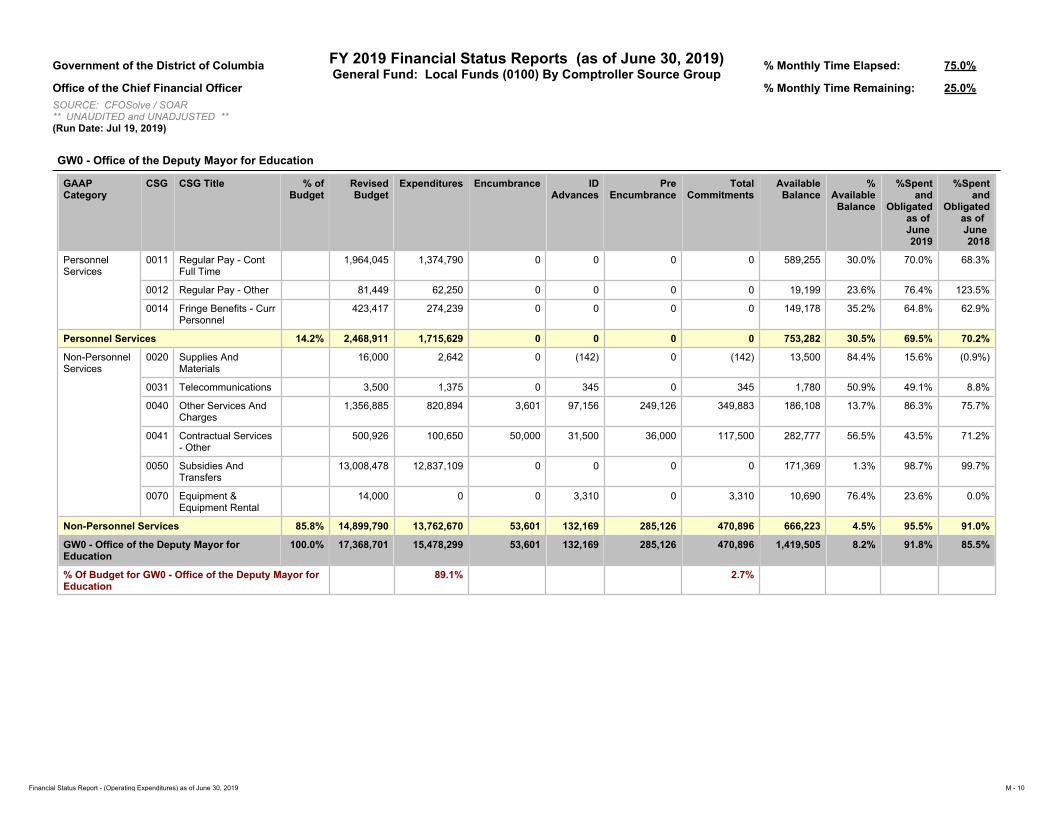
Government of the District of Columbia FY 2019 Financial Status Reports (as of June 30, 2019)General Fund: Local Funds (0100) By Comptroller Source Group
% Monthly Time Elapsed: 75.0%
Office of the Chief Financial Officer % Monthly Time Remaining: 25.0%SOURCE: CFOSolve / SOAR** UNAUDITED and UNADJUSTED **(Run Date: Jul 19, 2019)
GW0 - Office of the Deputy Mayor for Education
GAAP Category
CSG CSG Title % of Budget
Revised Budget
Expenditures Encumbrance ID Advances
Pre Encumbrance
Total Commitments
Available Balance
% Available
Balance
%Spent and
Obligated as of June 2019
%Spent and
Obligated as of June 2018
Personnel Services
0011 Regular Pay - Cont Full Time
1,964,045 1,374,790 0 0 0 0 589,255 30.0% 70.0% 68.3%
0012 Regular Pay - Other 81,449 62,250 0 0 0 0 19,199 23.6% 76.4% 123.5%
0014 Fringe Benefits - Curr Personnel
423,417 274,239 0 0 0 0 149,178 35.2% 64.8% 62.9%
Personnel Services 14.2% 2,468,911 1,715,629 0 0 0 0 753,282 30.5% 69.5% 70.2%
Non-Personnel Services
0020 Supplies And Materials
16,000 2,642 0 (142) 0 (142) 13,500 84.4% 15.6% (0.9%)
0031 Telecommunications 3,500 1,375 0 345 0 345 1,780 50.9% 49.1% 8.8%
0040 Other Services And Charges
1,356,885 820,894 3,601 97,156 249,126 349,883 186,108 13.7% 86.3% 75.7%
0041 Contractual Services - Other
500,926 100,650 50,000 31,500 36,000 117,500 282,777 56.5% 43.5% 71.2%
0050 Subsidies And Transfers
13,008,478 12,837,109 0 0 0 0 171,369 1.3% 98.7% 99.7%
0070 Equipment & Equipment Rental
14,000 0 0 3,310 0 3,310 10,690 76.4% 23.6% 0.0%
Non-Personnel Services 85.8% 14,899,790 13,762,670 53,601 132,169 285,126 470,896 666,223 4.5% 95.5% 91.0%
GW0 - Office of the Deputy Mayor for Education
100.0% 17,368,701 15,478,299 53,601 132,169 285,126 470,896 1,419,505 8.2% 91.8% 85.5%
% Of Budget for GW0 - Office of the Deputy Mayor for Education
89.1% 2.7%
Financial Status Report - (Operating Expenditures) as of June 30, 2019 M - 10

Government of the District of Columbia FY 2019 Financial Status Reports (as of June 30, 2019)General Fund: Local Funds (0100) By Comptroller Source Group
% Monthly Time Elapsed: 75.0%
Office of the Chief Financial Officer % Monthly Time Remaining: 25.0%SOURCE: CFOSolve / SOAR** UNAUDITED and UNADJUSTED **(Run Date: Jul 19, 2019)
GX0 - Teachers' Retirement System
GAAP Category CSG CSG Title % of Budget
Revised Budget
Expenditures Encumbrance ID Advances
Pre Encumbrance
Total Commitments
Available Balance
% Available
Balance
%Spent and
Obligated as of June 2019
%Spent and
Obligated as of June 2018
Non-Personnel Services
0050 Subsidies And Transfers
53,343,000 53,182,128 0 0 0 0 160,872 0.3% 99.7% 99.8%
Non-Personnel Services 100.0% 53,343,000 53,182,128 0 0 0 0 160,872 0.3% 99.7% 99.8%
GX0 - Teachers' Retirement System 100.0% 53,343,000 53,182,128 0 0 0 0 160,872 0.3% 99.7% 99.8%
% Of Budget for GX0 - Teachers' Retirement System 99.7% 0.0%
Financial Status Report - (Operating Expenditures) as of June 30, 2019 M - 11

Government of the District of Columbia FY 2019 Financial Status Reports (as of June 30, 2019)General Fund: Local Funds (0100) By Comptroller Source Group
% Monthly Time Elapsed: 75.0%
Office of the Chief Financial Officer % Monthly Time Remaining: 25.0%SOURCE: CFOSolve / SOAR** UNAUDITED and UNADJUSTED **(Run Date: Jul 19, 2019)
PE0 - Section 103 Judgments-Public Education System
GAAP Category
CSG CSG Title % of Budget
Revised Budget
Expenditures Encumbrance ID Advances
Pre Encumbrance
Total Commitments
Available Balance
% Available
Balance
%Spent and
Obligated as of June 2019
%Spent and
Obligated as of June 2018
Non-Personnel Services
0040 Other Services And Charges
0 0 0 0 0 0 0 N/A N/A 100.0%
Non-Personnel Services N/A 0 0 0 0 0 0 0 N/A N/A 100.0%
PE0 - Section 103 Judgments-Public Education System
N/A 0 0 0 0 0 0 0 N/A N/A 100.0%
% Of Budget for PE0 - Section 103 Judgments-Public Education System
N/A N/A
Grand Total for Public Education System
2,001,493,289 1,641,090,174 30,653,545 31,728,100 12,236,785 74,618,430 285,784,685 14.3% 85.7% 83.9%
% Of Budget for Public Education System 82.0% 3.7%
Financial Status Report - (Operating Expenditures) as of June 30, 2019 M - 12

(N) Human Support Services

Government of the District of Columbia FY 2019 Financial Status Reports (as of June 30, 2019)General Fund: Local Funds (0100) By Comptroller Source Group
% Monthly Time Elapsed: 75.0%
Office of the Chief Financial Officer % Monthly Time Remaining: 25.0%SOURCE: CFOSolve / SOAR** UNAUDITED and UNADJUSTED **(Run Date: Jul 19, 2019)
AP0 - Office on Asian and Pacific Islander Affairs
GAAP Category
CSG CSG Title % of Budget
Revised Budget
Expenditures Encumbrance ID Advances
Pre Encumbrance
Total Commitments
Available Balance
% Available
Balance
%Spent and
Obligated as of June 2019
%Spent and
Obligated as of June 2018
Personnel Services
0011 Regular Pay - Cont Full Time
358,102 172,963 0 0 0 0 185,139 51.7% 48.3% 57.5%
0012 Regular Pay - Other 106,295 106,466 0 0 0 0 (171) (0.2%) 100.2% 197.7%
0014 Fringe Benefits - Curr Personnel
106,347 63,036 0 0 0 0 43,311 40.7% 59.3% 78.8%
Personnel Services 65.5% 570,744 342,459 0 0 0 0 228,285 40.0% 60.0% 74.0%
Non-Personnel Services
0020 Supplies And Materials
4,000 1,387 0 0 0 0 2,613 65.3% 34.7% 0.2%
0040 Other Services And Charges
18,734 33,218 0 2,370 0 2,370 (16,854) (90.0%) 190.0% 113.2%
0050 Subsidies And Transfers
247,757 247,749 1 0 0 1 7 0.0% 100.0% 100.0%
0070 Equipment & Equipment Rental
30,300 25,969 0 0 0 0 4,331 14.3% 85.7% 0.0%
Non-Personnel Services 34.5% 300,791 308,323 1 2,370 0 2,371 (9,903) (3.3%) 103.3% 98.3%
AP0 - Office on Asian and Pacific Islander Affairs
100.0% 871,535 650,781 1 2,370 0 2,371 218,382 25.1% 74.9% 82.4%
% Of Budget for AP0 - Office on Asian and Pacific Islander Affairs
74.7% 0.3%
Financial Status Report - (Operating Expenditures) as of June 30, 2019 N - 1

Government of the District of Columbia FY 2019 Financial Status Reports (as of June 30, 2019)General Fund: Local Funds (0100) By Comptroller Source Group
% Monthly Time Elapsed: 75.0%
Office of the Chief Financial Officer % Monthly Time Remaining: 25.0%SOURCE: CFOSolve / SOAR** UNAUDITED and UNADJUSTED **(Run Date: Jul 19, 2019)
BG0 - Employees' Compensation Fund
GAAP Category
CSG CSG Title % of Budget
Revised Budget
Expenditures Encumbrance ID Advances
Pre Encumbrance
Total Commitments
Available Balance
% Available
Balance
%Spent and
Obligated as of June 2019
%Spent and
Obligated as of June 2018
Personnel Services
0011 Regular Pay - Cont Full Time
4,008,953 1,166,729 0 0 0 0 2,842,224 70.9% 29.1% N/A
0012 Regular Pay - Other 12,350,000 10,158,271 0 0 0 0 2,191,729 17.7% 82.3% 94.0%
0014 Fringe Benefits - Curr Personnel
3,245,392 1,692,853 0 0 0 0 1,552,539 47.8% 52.2% 60.8%
Personnel Services 81.2% 19,604,345 13,045,249 0 0 0 0 6,559,096 33.5% 66.5% 88.8%
Non-Personnel Services
0020 Supplies And Materials
1,510,002 728,741 0 0 0 0 781,261 51.7% 48.3% 42.0%
0040 Other Services And Charges
3,017,235 1,507,359 1,063,211 55,972 0 1,119,183 390,693 12.9% 87.1% 82.9%
Non-Personnel Services 18.8% 4,527,237 2,236,100 1,063,211 55,972 0 1,119,183 1,171,954 25.9% 74.1% 74.6%
BG0 - Employees' Compensation Fund 100.0% 24,131,582 15,281,349 1,063,211 55,972 0 1,119,183 7,731,051 32.0% 68.0% 83.2%
% Of Budget for BG0 - Employees' Compensation Fund
63.3% 4.6%
Financial Status Report - (Operating Expenditures) as of June 30, 2019 N - 2

Government of the District of Columbia FY 2019 Financial Status Reports (as of June 30, 2019)General Fund: Local Funds (0100) By Comptroller Source Group
% Monthly Time Elapsed: 75.0%
Office of the Chief Financial Officer % Monthly Time Remaining: 25.0%SOURCE: CFOSolve / SOAR** UNAUDITED and UNADJUSTED **(Run Date: Jul 19, 2019)
BH0 - Unemployment Compensation Fund
GAAP Category CSG CSG Title % of Budget
Revised Budget
Expenditures Encumbrance ID Advances
Pre Encumbrance
Total Commitments
Available Balance
% Available
Balance
%Spent and
Obligated as of June 2019
%Spent and
Obligated as of June 2018
Non-Personnel Services
0050 Subsidies And Transfers
6,201,361 3,676,926 0 0 0 0 2,524,435 40.7% 59.3% 56.8%
Non-Personnel Services 100.0% 6,201,361 3,676,926 0 0 0 0 2,524,435 40.7% 59.3% 56.8%
BH0 - Unemployment Compensation Fund 100.0% 6,201,361 3,676,926 0 0 0 0 2,524,435 40.7% 59.3% 56.8%
% Of Budget for BH0 - Unemployment Compensation Fund
59.3% 0.0%
Financial Status Report - (Operating Expenditures) as of June 30, 2019 N - 3
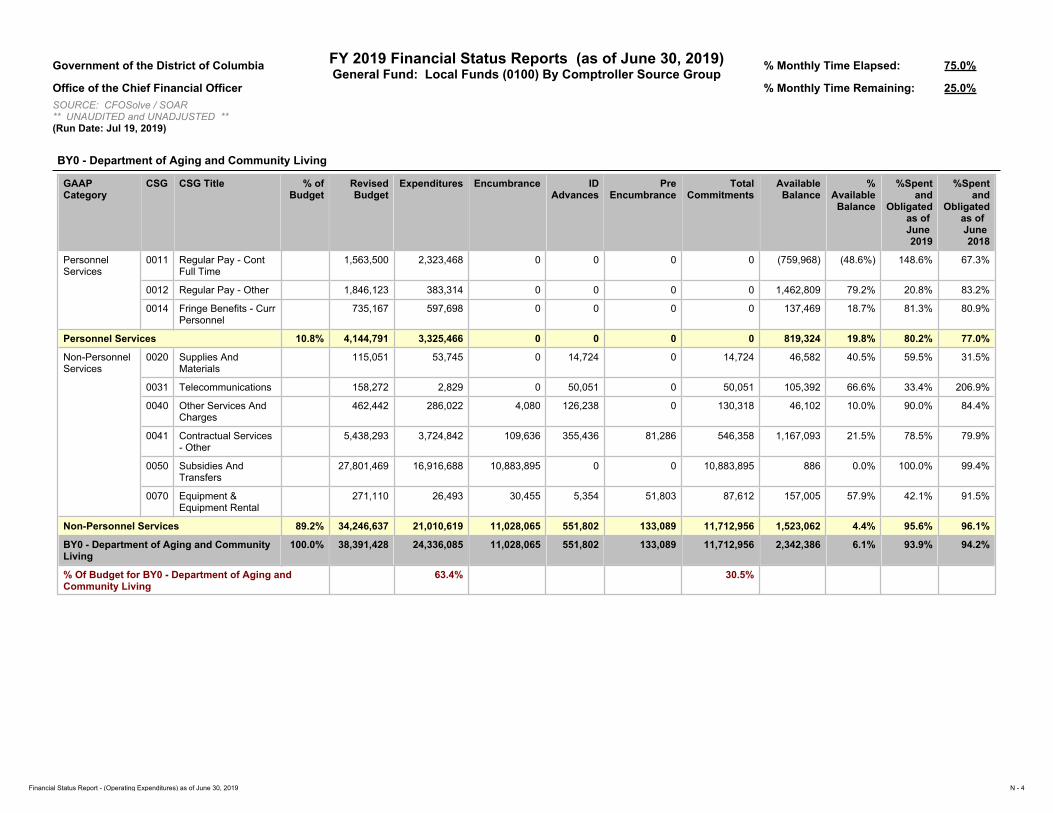
Government of the District of Columbia FY 2019 Financial Status Reports (as of June 30, 2019)General Fund: Local Funds (0100) By Comptroller Source Group
% Monthly Time Elapsed: 75.0%
Office of the Chief Financial Officer % Monthly Time Remaining: 25.0%SOURCE: CFOSolve / SOAR** UNAUDITED and UNADJUSTED **(Run Date: Jul 19, 2019)
BY0 - Department of Aging and Community Living
GAAP Category
CSG CSG Title % of Budget
Revised Budget
Expenditures Encumbrance ID Advances
Pre Encumbrance
Total Commitments
Available Balance
% Available
Balance
%Spent and
Obligated as of June 2019
%Spent and
Obligated as of June 2018
Personnel Services
0011 Regular Pay - Cont Full Time
1,563,500 2,323,468 0 0 0 0 (759,968) (48.6%) 148.6% 67.3%
0012 Regular Pay - Other 1,846,123 383,314 0 0 0 0 1,462,809 79.2% 20.8% 83.2%
0014 Fringe Benefits - Curr Personnel
735,167 597,698 0 0 0 0 137,469 18.7% 81.3% 80.9%
Personnel Services 10.8% 4,144,791 3,325,466 0 0 0 0 819,324 19.8% 80.2% 77.0%
Non-Personnel Services
0020 Supplies And Materials
115,051 53,745 0 14,724 0 14,724 46,582 40.5% 59.5% 31.5%
0031 Telecommunications 158,272 2,829 0 50,051 0 50,051 105,392 66.6% 33.4% 206.9%
0040 Other Services And Charges
462,442 286,022 4,080 126,238 0 130,318 46,102 10.0% 90.0% 84.4%
0041 Contractual Services - Other
5,438,293 3,724,842 109,636 355,436 81,286 546,358 1,167,093 21.5% 78.5% 79.9%
0050 Subsidies And Transfers
27,801,469 16,916,688 10,883,895 0 0 10,883,895 886 0.0% 100.0% 99.4%
0070 Equipment & Equipment Rental
271,110 26,493 30,455 5,354 51,803 87,612 157,005 57.9% 42.1% 91.5%
Non-Personnel Services 89.2% 34,246,637 21,010,619 11,028,065 551,802 133,089 11,712,956 1,523,062 4.4% 95.6% 96.1%
BY0 - Department of Aging and Community Living
100.0% 38,391,428 24,336,085 11,028,065 551,802 133,089 11,712,956 2,342,386 6.1% 93.9% 94.2%
% Of Budget for BY0 - Department of Aging and Community Living
63.4% 30.5%
Financial Status Report - (Operating Expenditures) as of June 30, 2019 N - 4

Government of the District of Columbia FY 2019 Financial Status Reports (as of June 30, 2019)General Fund: Local Funds (0100) By Comptroller Source Group
% Monthly Time Elapsed: 75.0%
Office of the Chief Financial Officer % Monthly Time Remaining: 25.0%SOURCE: CFOSolve / SOAR** UNAUDITED and UNADJUSTED **(Run Date: Jul 19, 2019)
BZ0 - Mayor’s Office on Latino Affairs
GAAP Category
CSG CSG Title % of Budget
Revised Budget
Expenditures Encumbrance ID Advances
Pre Encumbrance
Total Commitments
Available Balance
% Available
Balance
%Spent and
Obligated as of June 2019
%Spent and
Obligated as of June 2018
Personnel Services
0011 Regular Pay - Cont Full Time
648,398 456,189 0 0 0 0 192,209 29.6% 70.4% 78.5%
0012 Regular Pay - Other 126,476 106,462 0 0 0 0 20,013 15.8% 84.2% 54.0%
0014 Fringe Benefits - Curr Personnel
173,915 126,694 0 0 0 0 47,220 27.2% 72.8% 74.1%
Personnel Services 27.9% 948,788 696,958 0 0 0 0 251,829 26.5% 73.5% 74.6%
Non-Personnel Services
0020 Supplies And Materials
25,000 17,614 0 0 0 0 7,386 29.5% 70.5% 63.7%
0031 Telecommunications 0 0 0 550 0 550 (550) N/A N/A N/A
0040 Other Services And Charges
149,484 126,521 7,857 3,250 0 11,107 11,855 7.9% 92.1% 89.3%
0050 Subsidies And Transfers
2,275,612 1,247,104 974,500 0 0 974,500 54,008 2.4% 97.6% 100.0%
0070 Equipment & Equipment Rental
5,000 0 0 0 0 0 5,000 100.0% 0.0% 0.0%
Non-Personnel Services 72.1% 2,455,096 1,398,593 982,357 3,800 0 986,157 70,346 2.9% 97.1% 96.5%
BZ0 - Mayor’s Office on Latino Affairs 100.0% 3,403,884 2,095,552 982,357 3,800 0 986,157 322,175 9.5% 90.5% 90.5%
% Of Budget for BZ0 - Mayor’s Office on Latino Affairs 61.6% 29.0%
Financial Status Report - (Operating Expenditures) as of June 30, 2019 N - 5
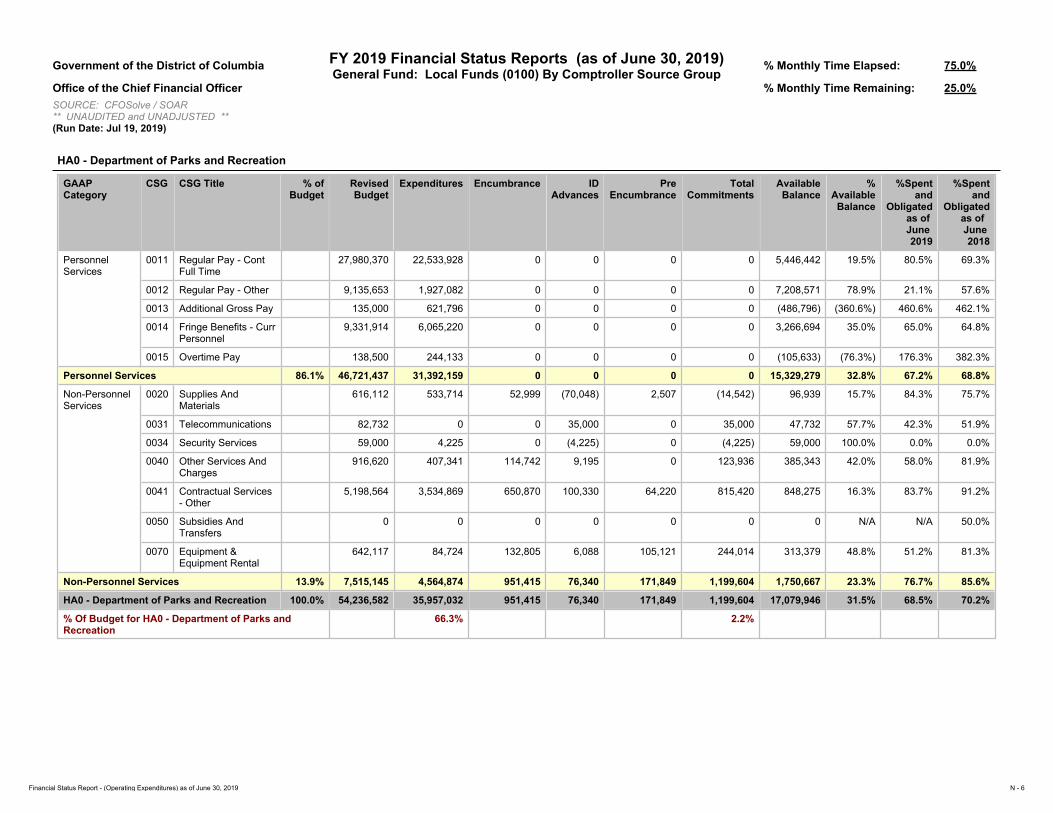
Government of the District of Columbia FY 2019 Financial Status Reports (as of June 30, 2019)General Fund: Local Funds (0100) By Comptroller Source Group
% Monthly Time Elapsed: 75.0%
Office of the Chief Financial Officer % Monthly Time Remaining: 25.0%SOURCE: CFOSolve / SOAR** UNAUDITED and UNADJUSTED **(Run Date: Jul 19, 2019)
HA0 - Department of Parks and Recreation
GAAP Category
CSG CSG Title % of Budget
Revised Budget
Expenditures Encumbrance ID Advances
Pre Encumbrance
Total Commitments
Available Balance
% Available
Balance
%Spent and
Obligated as of June 2019
%Spent and
Obligated as of June 2018
Personnel Services
0011 Regular Pay - Cont Full Time
27,980,370 22,533,928 0 0 0 0 5,446,442 19.5% 80.5% 69.3%
0012 Regular Pay - Other 9,135,653 1,927,082 0 0 0 0 7,208,571 78.9% 21.1% 57.6%
0013 Additional Gross Pay 135,000 621,796 0 0 0 0 (486,796) (360.6%) 460.6% 462.1%
0014 Fringe Benefits - Curr Personnel
9,331,914 6,065,220 0 0 0 0 3,266,694 35.0% 65.0% 64.8%
0015 Overtime Pay 138,500 244,133 0 0 0 0 (105,633) (76.3%) 176.3% 382.3%
Personnel Services 86.1% 46,721,437 31,392,159 0 0 0 0 15,329,279 32.8% 67.2% 68.8%
Non-Personnel Services
0020 Supplies And Materials
616,112 533,714 52,999 (70,048) 2,507 (14,542) 96,939 15.7% 84.3% 75.7%
0031 Telecommunications 82,732 0 0 35,000 0 35,000 47,732 57.7% 42.3% 51.9%
0034 Security Services 59,000 4,225 0 (4,225) 0 (4,225) 59,000 100.0% 0.0% 0.0%
0040 Other Services And Charges
916,620 407,341 114,742 9,195 0 123,936 385,343 42.0% 58.0% 81.9%
0041 Contractual Services - Other
5,198,564 3,534,869 650,870 100,330 64,220 815,420 848,275 16.3% 83.7% 91.2%
0050 Subsidies And Transfers
0 0 0 0 0 0 0 N/A N/A 50.0%
0070 Equipment & Equipment Rental
642,117 84,724 132,805 6,088 105,121 244,014 313,379 48.8% 51.2% 81.3%
Non-Personnel Services 13.9% 7,515,145 4,564,874 951,415 76,340 171,849 1,199,604 1,750,667 23.3% 76.7% 85.6%
HA0 - Department of Parks and Recreation 100.0% 54,236,582 35,957,032 951,415 76,340 171,849 1,199,604 17,079,946 31.5% 68.5% 70.2%
% Of Budget for HA0 - Department of Parks and Recreation
66.3% 2.2%
Financial Status Report - (Operating Expenditures) as of June 30, 2019 N - 6

Government of the District of Columbia FY 2019 Financial Status Reports (as of June 30, 2019)General Fund: Local Funds (0100) By Comptroller Source Group
% Monthly Time Elapsed: 75.0%
Office of the Chief Financial Officer % Monthly Time Remaining: 25.0%SOURCE: CFOSolve / SOAR** UNAUDITED and UNADJUSTED **(Run Date: Jul 19, 2019)
HC0 - Department of Health
GAAP Category
CSG CSG Title % of Budget
Revised Budget
Expenditures Encumbrance ID Advances
Pre Encumbrance
Total Commitments
Available Balance
% Available
Balance
%Spent and
Obligated as of June 2019
%Spent and
Obligated as of June 2018
Personnel Services
0011 Regular Pay - Cont Full Time
14,151,284 10,172,227 0 0 0 0 3,979,056 28.1% 71.9% 73.1%
0012 Regular Pay - Other 631,055 576,180 0 0 0 0 54,875 8.7% 91.3% 77.2%
0014 Fringe Benefits - Curr Personnel
3,224,092 2,332,357 0 0 0 0 891,735 27.7% 72.3% 71.4%
Personnel Services 20.9% 18,006,431 13,323,487 0 0 0 0 4,682,944 26.0% 74.0% 74.4%
Non-Personnel Services
0020 Supplies And Materials
619,434 195,272 299,455 42,650 27,041 369,146 55,016 8.9% 91.1% 80.7%
0030 Energy, Comm. And Bldg Rentals
198,713 160,440 0 38,273 0 38,273 0 0.0% 100.0% 100.0%
0031 Telecommunications 1,467,885 881,747 0 604,545 0 604,545 (18,407) (1.3%) 101.3% 101.8%
0032 Rentals - Land And Structures
9,676,655 8,305,266 0 1,615,685 0 1,615,685 (244,297) (2.5%) 102.5% 99.9%
0034 Security Services 448,522 260,011 0 188,511 0 188,511 0 0.0% 100.0% 100.0%
0035 Occupancy Fixed Costs
402,305 376,803 0 25,502 0 25,502 0 0.0% 100.0% 100.0%
0040 Other Services And Charges
1,055,094 712,675 52,681 (329,044) 3,800 (272,563) 614,981 58.3% 41.7% 56.0%
0041 Contractual Services - Other
28,445,347 14,510,882 12,085,066 522,839 335,378 12,943,283 991,182 3.5% 96.5% 97.9%
0050 Subsidies And Transfers
25,319,799 12,911,303 9,994,945 0 242,675 10,237,620 2,170,876 8.6% 91.4% 87.6%
0070 Equipment & Equipment Rental
459,733 15,108 12,485 17,920 134,624 165,029 279,596 60.8% 39.2% 67.7%
Non-Personnel Services 79.1% 68,093,486 38,329,507 22,444,632 2,726,883 743,518 25,915,033 3,848,947 5.7% 94.3% 94.4%
HC0 - Department of Health 100.0% 86,099,917 51,652,993 22,444,632 2,726,883 743,518 25,915,033 8,531,891 9.9% 90.1% 89.7%
% Of Budget for HC0 - Department of Health 60.0% 30.1%
Financial Status Report - (Operating Expenditures) as of June 30, 2019 N - 7

Government of the District of Columbia FY 2019 Financial Status Reports (as of June 30, 2019)General Fund: Local Funds (0100) By Comptroller Source Group
% Monthly Time Elapsed: 75.0%
Office of the Chief Financial Officer % Monthly Time Remaining: 25.0%SOURCE: CFOSolve / SOAR** UNAUDITED and UNADJUSTED **(Run Date: Jul 19, 2019)
HG0 - Office of the Deputy Mayor for Health and Human Services
GAAP Category CSG CSG Title % of Budget
Revised Budget
Expenditures Encumbrance ID Advances
Pre Encumbrance
Total Commitments
Available Balance
% Available
Balance
%Spent and
Obligated as of June 2019
%Spent and
Obligated as of June 2018
Personnel Services
0011 Regular Pay - Cont Full Time
1,387,821 962,150 0 0 0 0 425,671 30.7% 69.3% 73.2%
0014 Fringe Benefits - Curr Personnel
249,808 149,994 0 0 0 0 99,814 40.0% 60.0% 60.3%
Personnel Services 91.9% 1,637,629 1,176,260 0 0 0 0 461,369 28.2% 71.8% 74.5%
Non-Personnel Services
0020 Supplies And Materials
20,000 639 0 5,361 0 5,361 14,000 70.0% 30.0% 35.3%
0031 Telecommunications 23,862 13,970 0 10,517 0 10,517 (625) (2.6%) 102.6% 110.5%
0040 Other Services And Charges
50,242 32,240 1,481 15,982 0 17,462 539 1.1% 98.9% 62.5%
0041 Contractual Services - Other
50,000 18,011 23,659 0 0 23,659 8,330 16.7% 83.3% 106.1%
0070 Equipment & Equipment Rental
625 0 0 625 0 625 0 0.0% 100.0% 80.1%
Non-Personnel Services 8.1% 144,729 64,860 25,140 32,484 0 57,624 22,245 15.4% 84.6% 80.7%
HG0 - Office of the Deputy Mayor for Health and Human Services
100.0% 1,782,358 1,241,120 25,140 32,484 0 57,624 483,614 27.1% 72.9% 75.3%
% Of Budget for HG0 - Office of the Deputy Mayor for Health and Human Services
69.6% 3.2%
Financial Status Report - (Operating Expenditures) as of June 30, 2019 N - 8

Government of the District of Columbia FY 2019 Financial Status Reports (as of June 30, 2019)General Fund: Local Funds (0100) By Comptroller Source Group
% Monthly Time Elapsed: 75.0%
Office of the Chief Financial Officer % Monthly Time Remaining: 25.0%SOURCE: CFOSolve / SOAR** UNAUDITED and UNADJUSTED **(Run Date: Jul 19, 2019)
HM0 - Office of Human Rights
GAAP Category
CSG CSG Title % of Budget
Revised Budget
Expenditures Encumbrance ID Advances
Pre Encumbrance
Total Commitments
Available Balance
% Available
Balance
%Spent and
Obligated as of June 2019
%Spent and
Obligated as of June 2018
Personnel Services
0011 Regular Pay - Cont Full Time
2,772,915 2,140,197 0 0 0 0 632,718 22.8% 77.2% 61.2%
0012 Regular Pay - Other 980,751 469,581 0 0 0 0 511,170 52.1% 47.9% 87.6%
0014 Fringe Benefits - Curr Personnel
863,343 577,858 0 0 0 0 285,485 33.1% 66.9% 68.1%
Personnel Services 92.3% 4,617,009 3,205,088 0 0 0 0 1,411,921 30.6% 69.4% 68.9%
Non-Personnel Services
0020 Supplies And Materials
11,749 5,385 1 6,363 0 6,364 1 0.0% 100.0% 100.0%
0040 Other Services And Charges
25,222 19,112 2,603 813 0 3,416 2,694 10.7% 89.3% 79.3%
0041 Contractual Services - Other
339,089 122,397 74,604 135,916 0 210,520 6,172 1.8% 98.2% 99.9%
0070 Equipment & Equipment Rental
7,277 7,277 0 0 0 0 0 0.0% 100.0% 100.0%
Non-Personnel Services 7.7% 383,337 154,171 77,207 143,092 0 220,299 8,868 2.3% 97.7% 98.9%
HM0 - Office of Human Rights 100.0% 5,000,346 3,359,258 77,207 143,092 0 220,299 1,420,789 28.4% 71.6% 70.4%
% Of Budget for HM0 - Office of Human Rights 67.2% 4.4%
Financial Status Report - (Operating Expenditures) as of June 30, 2019 N - 9

Government of the District of Columbia FY 2019 Financial Status Reports (as of June 30, 2019)General Fund: Local Funds (0100) By Comptroller Source Group
% Monthly Time Elapsed: 75.0%
Office of the Chief Financial Officer % Monthly Time Remaining: 25.0%SOURCE: CFOSolve / SOAR** UNAUDITED and UNADJUSTED **(Run Date: Jul 19, 2019)
HS0 - Section 103 Judgements-Human Services
GAAP Category CSG CSG Title % of Budget
Revised Budget
Expenditures Encumbrance ID Advances
Pre Encumbrance
Total Commitments
Available Balance
% Available
Balance
%Spent and
Obligated as of June 2019
%Spent and
Obligated as of June 2018
Non-Personnel Services
0040 Other Services And Charges
0 0 0 0 0 0 0 N/A N/A 100.0%
Non-Personnel Services N/A 0 0 0 0 0 0 0 N/A N/A 100.0%
HS0 - Section 103 Judgements-Human Services
N/A 0 0 0 0 0 0 0 N/A N/A 100.0%
% Of Budget for HS0 - Section 103 Judgements-Human Services
N/A N/A
Financial Status Report - (Operating Expenditures) as of June 30, 2019 N - 10
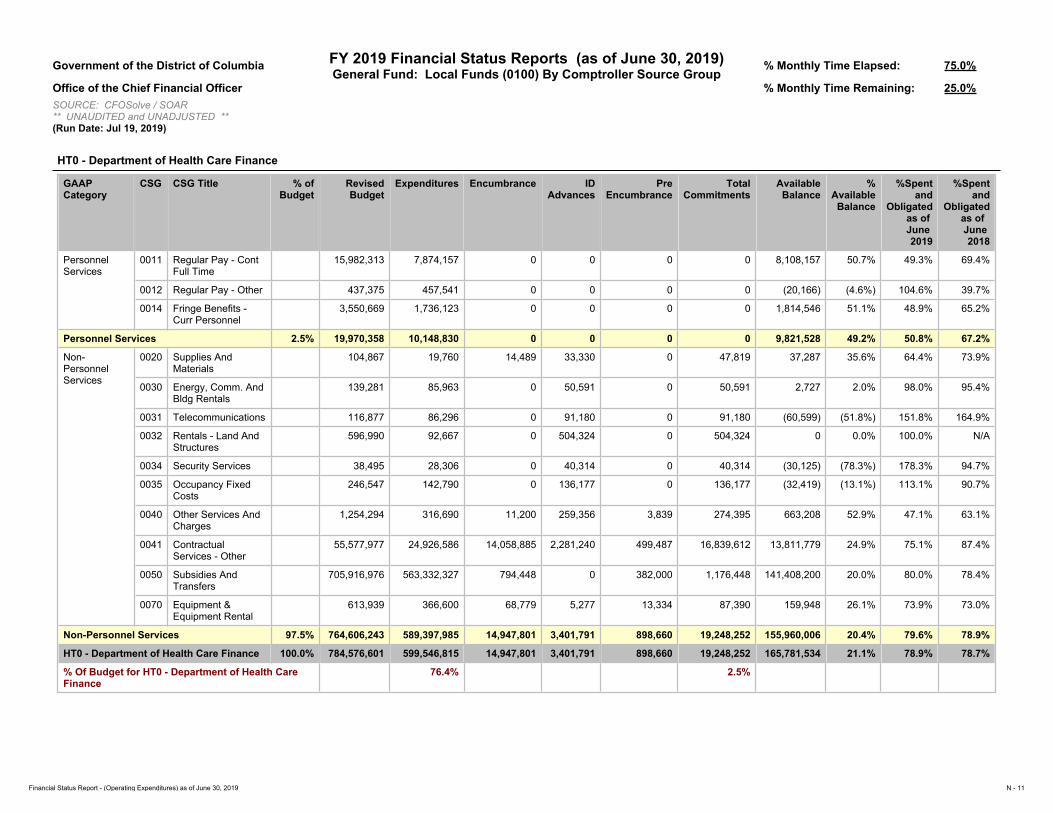
Government of the District of Columbia FY 2019 Financial Status Reports (as of June 30, 2019)General Fund: Local Funds (0100) By Comptroller Source Group
% Monthly Time Elapsed: 75.0%
Office of the Chief Financial Officer % Monthly Time Remaining: 25.0%SOURCE: CFOSolve / SOAR** UNAUDITED and UNADJUSTED **(Run Date: Jul 19, 2019)
HT0 - Department of Health Care Finance
GAAP Category
CSG CSG Title % of Budget
Revised Budget
Expenditures Encumbrance ID Advances
Pre Encumbrance
Total Commitments
Available Balance
% Available
Balance
%Spent and
Obligated as of June 2019
%Spent and
Obligated as of June 2018
Personnel Services
0011 Regular Pay - Cont Full Time
15,982,313 7,874,157 0 0 0 0 8,108,157 50.7% 49.3% 69.4%
0012 Regular Pay - Other 437,375 457,541 0 0 0 0 (20,166) (4.6%) 104.6% 39.7%
0014 Fringe Benefits - Curr Personnel
3,550,669 1,736,123 0 0 0 0 1,814,546 51.1% 48.9% 65.2%
Personnel Services 2.5% 19,970,358 10,148,830 0 0 0 0 9,821,528 49.2% 50.8% 67.2%
Non-Personnel Services
0020 Supplies And Materials
104,867 19,760 14,489 33,330 0 47,819 37,287 35.6% 64.4% 73.9%
0030 Energy, Comm. And Bldg Rentals
139,281 85,963 0 50,591 0 50,591 2,727 2.0% 98.0% 95.4%
0031 Telecommunications 116,877 86,296 0 91,180 0 91,180 (60,599) (51.8%) 151.8% 164.9%
0032 Rentals - Land And Structures
596,990 92,667 0 504,324 0 504,324 0 0.0% 100.0% N/A
0034 Security Services 38,495 28,306 0 40,314 0 40,314 (30,125) (78.3%) 178.3% 94.7%
0035 Occupancy Fixed Costs
246,547 142,790 0 136,177 0 136,177 (32,419) (13.1%) 113.1% 90.7%
0040 Other Services And Charges
1,254,294 316,690 11,200 259,356 3,839 274,395 663,208 52.9% 47.1% 63.1%
0041 Contractual Services - Other
55,577,977 24,926,586 14,058,885 2,281,240 499,487 16,839,612 13,811,779 24.9% 75.1% 87.4%
0050 Subsidies And Transfers
705,916,976 563,332,327 794,448 0 382,000 1,176,448 141,408,200 20.0% 80.0% 78.4%
0070 Equipment & Equipment Rental
613,939 366,600 68,779 5,277 13,334 87,390 159,948 26.1% 73.9% 73.0%
Non-Personnel Services 97.5% 764,606,243 589,397,985 14,947,801 3,401,791 898,660 19,248,252 155,960,006 20.4% 79.6% 78.9%
HT0 - Department of Health Care Finance 100.0% 784,576,601 599,546,815 14,947,801 3,401,791 898,660 19,248,252 165,781,534 21.1% 78.9% 78.7%
% Of Budget for HT0 - Department of Health Care Finance
76.4% 2.5%
Financial Status Report - (Operating Expenditures) as of June 30, 2019 N - 11

Government of the District of Columbia FY 2019 Financial Status Reports (as of June 30, 2019)General Fund: Local Funds (0100) By Comptroller Source Group
% Monthly Time Elapsed: 75.0%
Office of the Chief Financial Officer % Monthly Time Remaining: 25.0%SOURCE: CFOSolve / SOAR** UNAUDITED and UNADJUSTED **(Run Date: Jul 19, 2019)
HX0 - Not-for-Profit Hospital Corp. Subsidy
GAAP Category CSG CSG Title % of Budget
Revised Budget
Expenditures Encumbrance ID Advances
Pre Encumbrance
Total Commitments
Available Balance
% Available
Balance
%Spent and
Obligated as of June 2019
%Spent and
Obligated as of June 2018
Non-Personnel Services
0050 Subsidies And Transfers
34,260,773 34,260,773 0 0 0 0 0 0.0% 100.0% 100.0%
Non-Personnel Services 100.0% 34,260,773 34,260,773 0 0 0 0 0 0.0% 100.0% 100.0%
HX0 - Not-for-Profit Hospital Corp. Subsidy
100.0% 34,260,773 34,260,773 0 0 0 0 0 0.0% 100.0% 100.0%
% Of Budget for HX0 - Not-for-Profit Hospital Corp. Subsidy
100.0% 0.0%
Financial Status Report - (Operating Expenditures) as of June 30, 2019 N - 12

Government of the District of Columbia FY 2019 Financial Status Reports (as of June 30, 2019)General Fund: Local Funds (0100) By Comptroller Source Group
% Monthly Time Elapsed: 75.0%
Office of the Chief Financial Officer % Monthly Time Remaining: 25.0%SOURCE: CFOSolve / SOAR** UNAUDITED and UNADJUSTED **(Run Date: Jul 19, 2019)
JA0 - Department of Human Services
GAAP Category
CSG CSG Title % of Budget
Revised Budget
Expenditures Encumbrance ID Advances
Pre Encumbrance
Total Commitments
Available Balance
% Available
Balance
%Spent and
Obligated as of June
2019
%Spent and
Obligated as of
June 2018
Personnel Services
0011 Regular Pay - Cont Full Time
35,900,987 32,670,665 0 108,223 0 108,223 3,122,100 8.7% 91.3% 63.7%
0012 Regular Pay - Other 13,615,499 2,517,729 0 0 0 0 11,097,770 81.5% 18.5% 91.6%
0013 Additional Gross Pay
5,000 1,153,900 0 0 0 0 (1,148,900) (22,978.0%) 23,078.0% 3,469.1%
0014 Fringe Benefits - Curr Personnel
12,598,927 8,567,158 0 29,631 0 29,631 4,002,137 31.8% 68.2% 66.3%
0015 Overtime Pay 4,024 1,155,039 0 0 0 0 (1,151,015) (28,605.8%) 28,705.8% 10,907.9%
Personnel Services 16.2% 62,124,436 46,064,492 0 137,854 0 137,854 15,922,091 25.6% 74.4% 72.3%
Non-Personnel Services
0020 Supplies And Materials
258,999 149,350 45,282 0 22,073 67,355 42,293 16.3% 83.7% 58.6%
0030 Energy, Comm. And Bldg Rentals
658,858 403,871 0 254,987 0 254,987 0 0.0% 100.0% 78.4%
0031 Telecommunications 1,656,898 989,436 0 667,462 0 667,462 0 0.0% 100.0% 221.1%
0032 Rentals - Land And Structures
20,115,710 16,083,576 0 4,032,134 0 4,032,134 0 0.0% 100.0% 100.0%
0034 Security Services 3,472,190 1,062,672 0 1,557,467 0 1,557,467 852,051 24.5% 75.5% 100.0%
0035 Occupancy Fixed Costs
2,371,212 1,723,137 0 648,075 0 648,075 0 0.0% 100.0% 67.6%
0040 Other Services And Charges
3,706,747 1,990,906 348,295 225,574 0 573,869 1,141,972 30.8% 69.2% 94.6%
0041 Contractual Services - Other
2,504,657 923,386 720,353 379,868 66,538 1,166,759 414,512 16.5% 83.5% 96.3%
0050 Subsidies And Transfers
286,359,643 193,800,868 55,934,256 3,636,348 1,312,245 60,882,849 31,675,927 11.1% 88.9% 86.8%
0070 Equipment & Equipment Rental
266,951 144,746 64,406 0 2,914 67,320 54,884 20.6% 79.4% 60.4%
Non-Personnel Services 83.8% 321,371,865 217,271,947 57,112,593 11,401,917 1,403,769 69,918,278 34,181,640 10.6% 89.4% 88.5%
JA0 - Department of Human Services 100.0% 383,496,301 263,336,438 57,112,593 11,539,771 1,403,769 70,056,133 50,103,730 13.1% 86.9% 86.1%
% Of Budget for JA0 - Department of Human Services
68.7% 18.3%
Financial Status Report - (Operating Expenditures) as of June 30, 2019 N - 13

Government of the District of Columbia FY 2019 Financial Status Reports (as of June 30, 2019)General Fund: Local Funds (0100) By Comptroller Source Group
% Monthly Time Elapsed: 75.0%
Office of the Chief Financial Officer % Monthly Time Remaining: 25.0%SOURCE: CFOSolve / SOAR** UNAUDITED and UNADJUSTED **(Run Date: Jul 19, 2019)
JM0 - Department on Disability Services
GAAP Category
CSG CSG Title % of Budget
Revised Budget
Expenditures Encumbrance ID Advances
Pre Encumbrance
Total Commitments
Available Balance
% Available
Balance
%Spent and
Obligated as of June 2019
%Spent and
Obligated as of June 2018
Personnel Services
0011 Regular Pay - Cont Full Time
18,786,451 12,452,081 0 0 0 0 6,334,370 33.7% 66.3% 75.6%
0012 Regular Pay - Other 237,658 214,735 0 0 0 0 22,922 9.6% 90.4% 116.4%
0013 Additional Gross Pay 47,240 46,007 0 0 0 0 1,233 2.6% 97.4% N/A
0014 Fringe Benefits - Curr Personnel
4,545,529 2,957,626 0 0 0 0 1,587,904 34.9% 65.1% 73.9%
0015 Overtime Pay 35,500 6,582 0 0 0 0 28,918 81.5% 18.5% 14.7%
Personnel Services 19.4% 23,652,378 15,677,031 0 0 0 0 7,975,347 33.7% 66.3% 76.3%
Non-Personnel Services
0030 Energy, Comm. And Bldg Rentals
11,872 1,740 0 10,132 0 10,132 0 0.0% 100.0% N/A
0031 Telephone, Telegraph, Telegram, Etc
0 0 0 0 0 0 0 N/A N/A 100.0%
0032 Rentals - Land And Structures
2,545,895 825,036 0 1,720,859 0 1,720,859 0 0.0% 100.0% 100.0%
0034 Security Services 0 0 0 0 0 0 0 N/A N/A 100.0%
0035 Occupancy Fixed Costs
0 0 0 0 0 0 0 0.0% 100.0% 100.0%
0040 Other Services And Charges
351,601 173,463 91,415 34,289 0 125,704 52,434 14.9% 85.1% 74.9%
0041 Contractual Services - Other
655,067 285,649 32,140 177,814 0 209,954 159,463 24.3% 75.7% 89.4%
0050 Subsidies And Transfers
94,793,904 70,242,891 8,521,618 13,738,718 836,727 23,097,063 1,453,950 1.5% 98.5% 98.1%
Non-Personnel Services 80.6% 98,358,339 71,528,801 8,645,173 15,681,813 836,727 25,163,713 1,665,826 1.7% 98.3% 98.1%
JM0 - Department on Disability Services 100.0% 122,010,717 87,205,832 8,645,173 15,681,813 836,727 25,163,713 9,641,172 7.9% 92.1% 94.5%
% Of Budget for JM0 - Department on Disability Services
71.5% 20.6%
Financial Status Report - (Operating Expenditures) as of June 30, 2019 N - 14

Government of the District of Columbia FY 2019 Financial Status Reports (as of June 30, 2019)General Fund: Local Funds (0100) By Comptroller Source Group
% Monthly Time Elapsed: 75.0%
Office of the Chief Financial Officer % Monthly Time Remaining: 25.0%SOURCE: CFOSolve / SOAR** UNAUDITED and UNADJUSTED **(Run Date: Jul 19, 2019)
JZ0 - Department of Youth Rehabilitation Services
GAAP Category
CSG CSG Title % of Budget
Revised Budget
Expenditures Encumbrance ID Advances
Pre Encumbrance
Total Commitments
Available Balance
% Available
Balance
%Spent and
Obligated as of June 2019
%Spent and
Obligated as of June 2018
Personnel Services
0011 Regular Pay - Cont Full Time
34,457,003 27,299,020 0 224,867 0 224,867 6,933,116 20.1% 79.9% 68.6%
0012 Regular Pay - Other 3,485,475 802,542 0 0 0 0 2,682,933 77.0% 23.0% 71.5%
0013 Additional Gross Pay 2,331,225 1,979,892 0 0 0 0 351,333 15.1% 84.9% 80.7%
0014 Fringe Benefits - Curr Personnel
10,605,230 7,814,462 0 0 0 0 2,790,768 26.3% 73.7% 67.5%
0015 Overtime Pay 3,124,208 2,187,780 0 0 0 0 936,428 30.0% 70.0% 84.7%
Personnel Services 57.2% 54,003,141 40,083,696 0 224,867 0 224,867 13,694,578 25.4% 74.6% 70.0%
Non-Personnel Services
0020 Supplies And Materials
746,368 368,874 113,323 97,963 0 211,286 166,208 22.3% 77.7% 74.3%
0031 Telecommunications 0 7,874 0 22,126 0 22,126 (30,000) N/A N/A N/A
0040 Other Services And Charges
3,261,126 1,489,054 475,030 349,988 0 825,018 947,053 29.0% 71.0% 89.3%
0041 Contractual Services - Other
2,447,554 1,343,945 608,832 26,513 22,200 657,545 446,065 18.2% 81.8% 90.0%
0050 Subsidies And Transfers
32,566,296 14,274,098 10,837,279 1,356,313 396,209 12,589,802 5,702,397 17.5% 82.5% 98.2%
0070 Equipment & Equipment Rental
1,336,945 343,757 437,926 140,424 123,150 701,500 291,688 21.8% 78.2% 95.9%
Non-Personnel Services 42.8% 40,358,289 17,827,601 12,472,390 1,993,327 541,559 15,007,277 7,523,411 18.6% 81.4% 96.6%
JZ0 - Department of Youth Rehabilitation Services
100.0% 94,361,430 57,911,297 12,472,390 2,218,195 541,559 15,232,144 21,217,989 22.5% 77.5% 81.4%
% Of Budget for JZ0 - Department of Youth Rehabilitation Services
61.4% 16.1%
Financial Status Report - (Operating Expenditures) as of June 30, 2019 N - 15

Government of the District of Columbia FY 2019 Financial Status Reports (as of June 30, 2019)General Fund: Local Funds (0100) By Comptroller Source Group
% Monthly Time Elapsed: 75.0%
Office of the Chief Financial Officer % Monthly Time Remaining: 25.0%SOURCE: CFOSolve / SOAR** UNAUDITED and UNADJUSTED **(Run Date: Jul 19, 2019)
RL0 - Child and Family Services Agency
GAAP Category
CSG CSG Title % of Budget
Revised Budget
Expenditures Encumbrance ID Advances
Pre Encumbrance
Total Commitments
Available Balance
% Available
Balance
%Spent and
Obligated as of June 2019
%Spent and
Obligated as of June 2018
Personnel Services
0011 Regular Pay - Cont Full Time
54,632,930 39,844,071 0 0 0 0 14,788,858 27.1% 72.9% 75.4%
0012 Regular Pay - Other 421,876 87,613 0 0 0 0 334,262 79.2% 20.8% 55.5%
0013 Additional Gross Pay 0 1,020,139 0 0 0 0 (1,020,139) N/A N/A 106.8%
0014 Fringe Benefits - Curr Personnel
13,378,318 9,510,848 0 0 0 0 3,867,470 28.9% 71.1% 72.7%
0015 Overtime Pay 310,095 852,578 0 0 0 0 (542,483) (174.9%) 274.9% 155.8%
Personnel Services 42.6% 68,743,219 51,315,250 0 0 0 0 17,427,969 25.4% 74.6% 75.9%
Non-Personnel Services
0030 Energy, Comm. And Bldg Rentals
99,486 68,782 0 30,705 0 30,705 0 0.0% 100.0% 100.1%
0031 Telecommunications 0 (400) 0 (70,959) 0 (70,959) 71,359 N/A N/A 90.2%
0032 Rentals - Land And Structures
5,641,607 5,074,371 0 567,167 0 567,167 69 0.0% 100.0% 100.0%
0033 Janitorial Services 0 0 0 69 0 69 (69) N/A N/A 59.5%
0034 Security Services 2,459,864 942,558 0 1,517,306 0 1,517,306 0 0.0% 100.0% 100.0%
0035 Occupancy Fixed Costs
1,334,559 725,339 0 609,220 0 609,220 0 0.0% 100.0% 100.0%
0040 Other Services And Charges
5,933 48,487 0 (39,632) 0 (39,632) (2,922) (49.2%) 149.2% 96.3%
0041 Contractual Services - Other
4,404,445 1,749,044 1,286,745 98,648 1,311,282 2,696,675 (41,274) (0.9%) 100.9% N/A
0050 Subsidies And Transfers
78,095,083 48,330,232 8,655,575 1,262,344 230,000 10,147,919 19,616,932 25.1% 74.9% 79.8%
0070 Equipment & Equipment Rental
455,000 286,621 164,513 0 0 164,513 3,866 0.8% 99.2% N/A
Non-Personnel Services 57.4% 92,495,978 57,225,035 10,106,832 3,974,868 1,541,282 15,622,982 19,647,961 21.2% 78.8% 82.0%
RL0 - Child and Family Services Agency 100.0% 161,239,197 108,540,284 10,106,832 3,974,868 1,541,282 15,622,982 37,075,930 23.0% 77.0% 79.3%
% Of Budget for RL0 - Child and Family Services Agency
67.3% 9.7%
Financial Status Report - (Operating Expenditures) as of June 30, 2019 N - 16

Government of the District of Columbia FY 2019 Financial Status Reports (as of June 30, 2019)General Fund: Local Funds (0100) By Comptroller Source Group
% Monthly Time Elapsed: 75.0%
Office of the Chief Financial Officer % Monthly Time Remaining: 25.0%SOURCE: CFOSolve / SOAR** UNAUDITED and UNADJUSTED **(Run Date: Jul 19, 2019)
RM0 - Department of Behavioral Health
GAAP Category
CSG CSG Title % of Budget
Revised Budget
Expenditures Encumbrance ID Advances
Pre Encumbrance
Total Commitments
Available Balance
% Available
Balance
%Spent and
Obligated as of June 2019
%Spent and
Obligated as of June 2018
Personnel Services
0011 Regular Pay - Cont Full Time
96,983,375 69,742,240 0 0 0 0 27,241,134 28.1% 71.9% 72.0%
0012 Regular Pay - Other 6,765,241 3,677,181 0 0 0 0 3,088,060 45.6% 54.4% 70.1%
0013 Additional Gross Pay
3,995,047 4,557,073 0 0 0 0 (562,026) (14.1%) 114.1% 74.6%
0014 Fringe Benefits - Curr Personnel
25,920,266 18,707,909 0 0 0 0 7,212,357 27.8% 72.2% 70.8%
0015 Overtime Pay 1,476,155 3,162,919 0 0 0 0 (1,686,764) (114.3%) 214.3% 104.3%
Personnel Services 54.0% 135,140,084 99,847,322 0 0 0 0 35,292,761 26.1% 73.9% 72.4%
Non-Personnel Services
0020 Supplies And Materials
4,382,201 2,832,792 630,431 26,552 86,057 743,039 806,370 18.4% 81.6% 79.8%
0030 Energy, Comm. And Bldg Rentals
1,902,273 743,519 0 1,158,754 0 1,158,754 0 0.0% 100.0% 100.0%
0031 Telecommunications 688,143 504,475 0 183,668 0 183,668 0 0.0% 100.0% 107.9%
0032 Rentals - Land And Structures
6,398,318 4,645,759 0 1,752,558 0 1,752,558 0 0.0% 100.0% 100.0%
0034 Security Services 3,250,485 1,931,052 0 1,319,432 0 1,319,432 0 0.0% 100.0% 100.0%
0035 Occupancy Fixed Costs
216,926 171,910 0 45,016 0 45,016 0 0.0% 100.0% 100.0%
0040 Other Services And Charges
7,548,852 4,526,916 2,190,383 227,357 357,556 2,775,296 246,640 3.3% 96.7% 93.8%
0041 Contractual Services - Other
26,529,584 17,813,152 7,236,409 31,702 1,072,321 8,340,432 375,999 1.4% 98.6% 92.4%
0050 Subsidies And Transfers
64,338,259 45,008,364 7,129,150 7,901,838 1,800,784 16,831,772 2,498,123 3.9% 96.1% 92.4%
0070 Equipment & Equipment Rental
46,050 5,035 7,500 7,515 0 15,015 26,000 56.5% 43.5% 70.3%
Non-Personnel Services 46.0% 115,301,089 78,182,974 17,193,874 12,654,392 3,316,718 33,164,983 3,953,132 3.4% 96.6% 92.8%
RM0 - Department of Behavioral Health 100.0% 250,441,173 178,030,296 17,193,874 12,654,392 3,316,718 33,164,983 39,245,893 15.7% 84.3% 81.8%
% Of Budget for RM0 - Department of Behavioral Health
71.1% 13.2%
Financial Status Report - (Operating Expenditures) as of June 30, 2019 N - 17

Government of the District of Columbia FY 2019 Financial Status Reports (as of June 30, 2019)General Fund: Local Funds (0100) By Comptroller Source Group
% Monthly Time Elapsed: 75.0%
Office of the Chief Financial Officer % Monthly Time Remaining: 25.0%SOURCE: CFOSolve / SOAR** UNAUDITED and UNADJUSTED **(Run Date: Jul 19, 2019)
VA0 - Office of Veterans' Affairs
GAAP Category
CSG CSG Title % of Budget
Revised Budget
Expenditures Encumbrance ID Advances
Pre Encumbrance
Total Commitments
Available Balance
% Available
Balance
%Spent and
Obligated as of June 2019
%Spent and
Obligated as of June 2018
Personnel Services
0011 Regular Pay - Cont Full Time
314,284 286,661 0 0 0 0 27,623 8.8% 91.2% 129.8%
0012 Regular Pay - Other 73,911 0 0 0 0 0 73,911 100.0% 0.0% 2.6%
0014 Fringe Benefits - Curr Personnel
90,849 59,683 0 0 0 0 31,166 34.3% 65.7% 61.2%
Personnel Services 77.6% 479,044 346,863 0 0 0 0 132,181 27.6% 72.4% 77.4%
Non-Personnel Services
0020 Supplies And Materials
3,600 3,480 0 0 0 0 120 3.3% 96.7% 34.6%
0031 Telecommunications 0 0 0 243 0 243 (243) N/A N/A N/A
0040 Other Services And Charges
129,798 131,564 0 0 0 0 (1,766) (1.4%) 101.4% 88.3%
0070 Equipment & Equipment Rental
5,000 2,128 0 0 0 0 2,872 57.4% 42.6% 0.0%
Non-Personnel Services 22.4% 138,398 137,172 0 243 0 243 983 0.7% 99.3% 80.9%
VA0 - Office of Veterans' Affairs 100.0% 617,442 484,035 0 243 0 243 133,164 21.6% 78.4% 78.2%
% Of Budget for VA0 - Office of Veterans' Affairs 78.4% 0.0%
Grand Total for Human Support Services
2,051,122,627 1,467,566,868 157,050,690 53,063,815 9,587,172 219,701,677 363,854,082 17.7% 82.3% 82.5%
% Of Budget for Human Support Services 71.5% 10.7%
Financial Status Report - (Operating Expenditures) as of June 30, 2019 N - 18
(O) Public Works

Government of the District of Columbia FY 2019 Financial Status Reports (as of June 30, 2019)General Fund: Local Funds (0100) By Comptroller Source Group
% Monthly Time Elapsed: 75.0%
Office of the Chief Financial Officer % Monthly Time Remaining: 25.0%SOURCE: CFOSolve / SOAR** UNAUDITED and UNADJUSTED **(Run Date: Jul 19, 2019)
KA0 - District Department of Transportation
GAAP Category
CSG CSG Title % of Budget
Revised Budget
Expenditures Encumbrance ID Advances
Pre Encumbrance
Total Commitments
Available Balance
% Available
Balance
%Spent and
Obligated as of June 2019
%Spent and
Obligated as of June 2018
Personnel Services
0011 Regular Pay - Cont Full Time
33,121,673 25,108,168 0 0 0 0 8,013,505 24.2% 75.8% 67.9%
0012 Regular Pay - Other 3,795,642 3,701,868 0 0 0 0 93,774 2.5% 97.5% 82.6%
0013 Additional Gross Pay 365,000 696,054 0 0 0 0 (331,054) (90.7%) 190.7% 155.6%
0014 Fringe Benefits - Curr Personnel
10,158,178 7,343,886 0 0 0 0 2,814,292 27.7% 72.3% 65.9%
0015 Overtime Pay 755,000 1,767,417 0 0 0 0 (1,012,417) (134.1%) 234.1% 217.1%
Personnel Services 44.8% 48,195,492 38,617,393 0 0 0 0 9,578,099 19.9% 80.1% 71.7%
Non-Personnel Services
0020 Supplies And Materials
1,137,706 327,723 345,396 0 232,406 577,802 232,182 20.4% 79.6% 75.6%
0030 Energy, Comm. And Bldg Rentals
4,967,430 437,344 1,948,406 0 2,500,000 4,448,406 81,680 1.6% 98.4% 95.1%
0031 Telecommunications 150,000 0 0 480,000 0 480,000 (330,000) (220.0%) 320.0% 128.4%
0040 Other Services And Charges
3,784,978 1,150,557 870,228 114,519 97,388 1,082,135 1,552,287 41.0% 59.0% 68.0%
0041 Contractual Services - Other
47,390,598 21,415,724 24,254,230 342,712 863,021 25,459,964 514,910 1.1% 98.9% 97.5%
0050 Subsidies And Transfers
1,488,634 797,827 51,130 0 0 51,130 639,678 43.0% 57.0% 73.9%
0070 Equipment & Equipment Rental
353,737 42,895 137,950 0 41,220 179,170 131,672 37.2% 62.8% 29.3%
Non-Personnel Services 55.2% 59,273,084 24,172,070 27,607,340 937,231 3,734,034 32,278,606 2,822,408 4.8% 95.2% 92.0%
KA0 - District Department of Transportation 100.0% 107,468,576 62,789,463 27,607,340 937,231 3,734,034 32,278,606 12,400,507 11.5% 88.5% 80.5%
% Of Budget for KA0 - District Department of Transportation
58.4% 30.0%
Financial Status Report - (Operating Expenditures) as of June 30, 2019 O - 1

Government of the District of Columbia FY 2019 Financial Status Reports (as of June 30, 2019)General Fund: Local Funds (0100) By Comptroller Source Group
% Monthly Time Elapsed: 75.0%
Office of the Chief Financial Officer % Monthly Time Remaining: 25.0%SOURCE: CFOSolve / SOAR** UNAUDITED and UNADJUSTED **(Run Date: Jul 19, 2019)
KC0 - Washington Metropolitan Area Transit Commission
GAAP Category CSG CSG Title % of Budget
Revised Budget
Expenditures Encumbrance ID Advances
Pre Encumbrance
Total Commitments
Available Balance
% Available
Balance
%Spent and
Obligated as of June 2019
%Spent and
Obligated as of June 2018
Non-Personnel Services
0050 Subsidies And Transfers
151,000 68,659 0 0 0 0 82,341 54.5% 45.5% 40.2%
Non-Personnel Services 100.0% 151,000 68,659 0 0 0 0 82,341 54.5% 45.5% 40.2%
KC0 - Washington Metropolitan Area Transit Commission
100.0% 151,000 68,659 0 0 0 0 82,341 54.5% 45.5% 40.2%
% Of Budget for KC0 - Washington Metropolitan Area Transit Commission
45.5% 0.0%
Financial Status Report - (Operating Expenditures) as of June 30, 2019 O - 2

Government of the District of Columbia FY 2019 Financial Status Reports (as of June 30, 2019)General Fund: Local Funds (0100) By Comptroller Source Group
% Monthly Time Elapsed: 75.0%
Office of the Chief Financial Officer % Monthly Time Remaining: 25.0%SOURCE: CFOSolve / SOAR** UNAUDITED and UNADJUSTED **(Run Date: Jul 19, 2019)
KE0 - Washington Metropolitan Area Transit Authority
GAAP Category CSG CSG Title % of Budget
Revised Budget
Expenditures Encumbrance ID Advances
Pre Encumbrance
Total Commitments
Available Balance
% Available
Balance
%Spent and
Obligated as of June 2019
%Spent and
Obligated as of June 2018
Non-Personnel Services
0050 Subsidies And Transfers
124,264,346 124,263,914 0 0 0 0 432 0.0% 100.0% 99.7%
Non-Personnel Services 100.0% 124,264,346 124,263,914 0 0 0 0 432 0.0% 100.0% 99.7%
KE0 - Washington Metropolitan Area Transit Authority
100.0% 124,264,346 124,263,914 0 0 0 0 432 0.0% 100.0% 99.7%
% Of Budget for KE0 - Washington Metropolitan Area Transit Authority
100.0% 0.0%
Financial Status Report - (Operating Expenditures) as of June 30, 2019 O - 3

Government of the District of Columbia FY 2019 Financial Status Reports (as of June 30, 2019)General Fund: Local Funds (0100) By Comptroller Source Group
% Monthly Time Elapsed: 75.0%
Office of the Chief Financial Officer % Monthly Time Remaining: 25.0%SOURCE: CFOSolve / SOAR** UNAUDITED and UNADJUSTED **(Run Date: Jul 19, 2019)
KG0 - Department of Energy and Environment
GAAP Category
CSG CSG Title % of Budget
Revised Budget
Expenditures Encumbrance ID Advances
Pre Encumbrance
Total Commitments
Available Balance
% Available
Balance
%Spent and
Obligated as of June 2019
%Spent and
Obligated as of June 2018
Personnel Services
0011 Regular Pay - Cont Full Time
6,534,940 5,000,480 0 0 0 0 1,534,459 23.5% 76.5% 68.5%
0012 Regular Pay - Other 3,002,062 1,623,096 0 0 0 0 1,378,967 45.9% 54.1% 63.5%
0013 Additional Gross Pay 4,655 40,358 0 0 0 0 (35,703) (767.0%) 867.0% 484.6%
0014 Fringe Benefits - Curr Personnel
2,201,339 1,523,257 0 0 0 0 678,082 30.8% 69.2% 65.4%
Personnel Services 40.8% 11,742,996 8,187,947 0 0 0 0 3,555,048 30.3% 69.7% 66.6%
Non-Personnel Services
0020 Supplies And Materials
81,591 35,776 900 0 0 900 44,915 55.0% 45.0% 25.1%
0031 Telecommunications 27,605 5,332 0 1,400 0 1,400 20,873 75.6% 24.4% 43.1%
0040 Other Services And Charges
2,313,041 400,067 224,173 70,004 179,029 473,206 1,439,768 62.2% 37.8% 46.8%
0041 Contractual Services - Other
815,385 169,455 65,122 0 0 65,122 580,808 71.2% 28.8% 8.2%
0050 Subsidies And Transfers
13,673,519 12,433,164 172,949 297,029 0 469,978 770,377 5.6% 94.4% 98.3%
0070 Equipment & Equipment Rental
110,624 47,809 4,233 0 18,000 22,233 40,582 36.7% 63.3% 58.5%
Non-Personnel Services 59.2% 17,021,765 13,091,602 467,378 368,433 197,029 1,032,840 2,897,323 17.0% 83.0% 71.3%
KG0 - Department of Energy and Environment
100.0% 28,764,760 21,279,549 467,378 368,433 197,029 1,032,840 6,452,371 22.4% 77.6% 68.5%
% Of Budget for KG0 - Department of Energy and Environment
74.0% 3.6%
Financial Status Report - (Operating Expenditures) as of June 30, 2019 O - 4

Government of the District of Columbia FY 2019 Financial Status Reports (as of June 30, 2019)General Fund: Local Funds (0100) By Comptroller Source Group
% Monthly Time Elapsed: 75.0%
Office of the Chief Financial Officer % Monthly Time Remaining: 25.0%SOURCE: CFOSolve / SOAR** UNAUDITED and UNADJUSTED **(Run Date: Jul 19, 2019)
KT0 - Department of Public Works
GAAP Category
CSG CSG Title % of Budget
Revised Budget
Expenditures Encumbrance ID Advances
Pre Encumbrance
Total Commitments
Available Balance
% Available
Balance
%Spent and
Obligated as of June 2019
%Spent and
Obligated as of June 2018
Personnel Services
0011 Regular Pay - Cont Full Time
68,593,896 49,530,515 0 0 0 0 19,063,381 27.8% 72.2% 71.4%
0012 Regular Pay - Other 4,214,065 4,242,465 0 0 0 0 (28,400) (0.7%) 100.7% 99.7%
0013 Additional Gross Pay
3,174,938 1,774,668 0 0 0 0 1,400,270 44.1% 55.9% 54.8%
0014 Fringe Benefits - Curr Personnel
21,629,316 15,415,509 0 0 0 0 6,213,807 28.7% 71.3% 71.8%
0015 Overtime Pay 3,140,040 7,315,138 0 0 0 0 (4,175,097) (133.0%) 233.0% 147.2%
Personnel Services 71.4% 100,752,255 78,278,295 0 0 0 0 22,473,960 22.3% 77.7% 76.0%
Non-Personnel Services
0020 Supplies And Materials
3,655,477 2,121,036 901,273 95,000 64,000 1,060,273 474,168 13.0% 87.0% 84.4%
0031 Telecommunications 189,100 29,938 15,000 91,418 0 106,418 52,744 27.9% 72.1% 127.1%
0040 Other Services And Charges
22,628,437 13,132,194 1,838,581 2,357,066 289,277 4,484,924 5,011,320 22.1% 77.9% 73.4%
0041 Contractual Services - Other
11,002,654 7,188,568 2,310,996 12,681 425,447 2,749,124 1,064,961 9.7% 90.3% 93.2%
0070 Equipment & Equipment Rental
2,865,914 2,226,620 232,458 30,320 50,670 313,448 325,845 11.4% 88.6% 91.6%
Non-Personnel Services 28.6% 40,341,582 24,698,356 5,298,308 2,586,486 829,393 8,714,187 6,929,038 17.2% 82.8% 81.6%
KT0 - Department of Public Works 100.0% 141,093,837 102,976,651 5,298,308 2,586,486 829,393 8,714,187 29,402,999 20.8% 79.2% 77.6%
% Of Budget for KT0 - Department of Public Works 73.0% 6.2%
Financial Status Report - (Operating Expenditures) as of June 30, 2019 O - 5
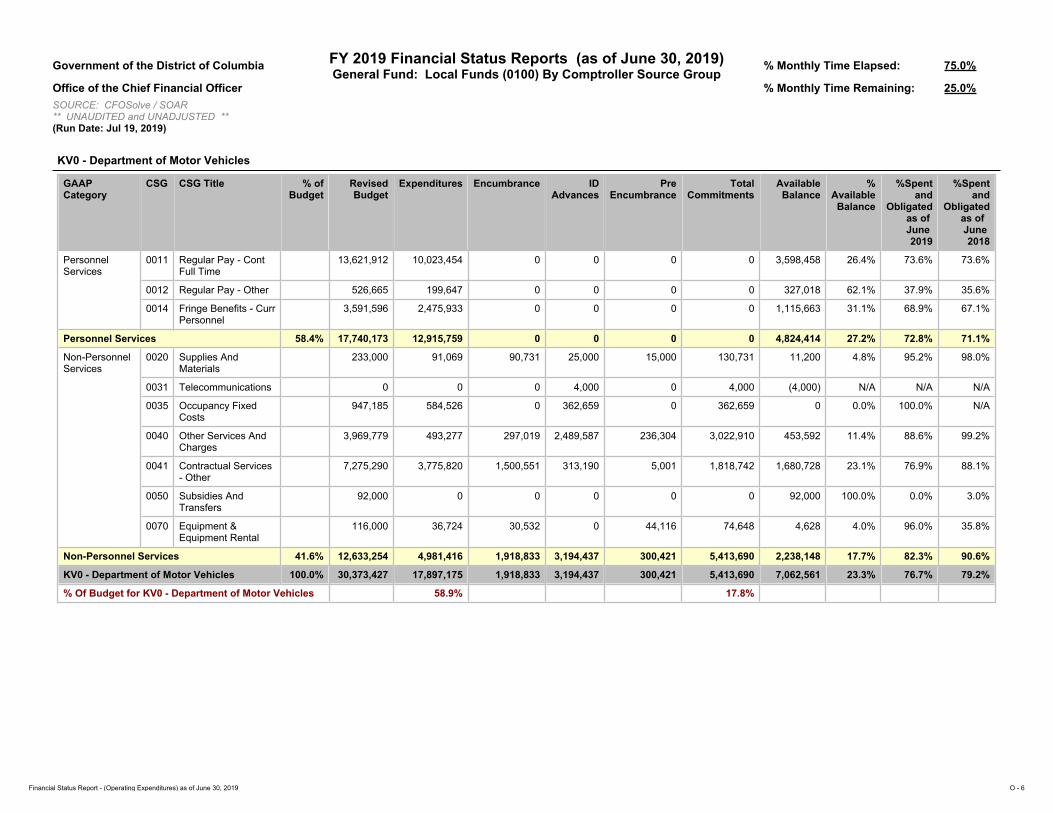
Government of the District of Columbia FY 2019 Financial Status Reports (as of June 30, 2019)General Fund: Local Funds (0100) By Comptroller Source Group
% Monthly Time Elapsed: 75.0%
Office of the Chief Financial Officer % Monthly Time Remaining: 25.0%SOURCE: CFOSolve / SOAR** UNAUDITED and UNADJUSTED **(Run Date: Jul 19, 2019)
KV0 - Department of Motor Vehicles
GAAP Category
CSG CSG Title % of Budget
Revised Budget
Expenditures Encumbrance ID Advances
Pre Encumbrance
Total Commitments
Available Balance
% Available
Balance
%Spent and
Obligated as of June 2019
%Spent and
Obligated as of June 2018
Personnel Services
0011 Regular Pay - Cont Full Time
13,621,912 10,023,454 0 0 0 0 3,598,458 26.4% 73.6% 73.6%
0012 Regular Pay - Other 526,665 199,647 0 0 0 0 327,018 62.1% 37.9% 35.6%
0014 Fringe Benefits - Curr Personnel
3,591,596 2,475,933 0 0 0 0 1,115,663 31.1% 68.9% 67.1%
Personnel Services 58.4% 17,740,173 12,915,759 0 0 0 0 4,824,414 27.2% 72.8% 71.1%
Non-Personnel Services
0020 Supplies And Materials
233,000 91,069 90,731 25,000 15,000 130,731 11,200 4.8% 95.2% 98.0%
0031 Telecommunications 0 0 0 4,000 0 4,000 (4,000) N/A N/A N/A
0035 Occupancy Fixed Costs
947,185 584,526 0 362,659 0 362,659 0 0.0% 100.0% N/A
0040 Other Services And Charges
3,969,779 493,277 297,019 2,489,587 236,304 3,022,910 453,592 11.4% 88.6% 99.2%
0041 Contractual Services - Other
7,275,290 3,775,820 1,500,551 313,190 5,001 1,818,742 1,680,728 23.1% 76.9% 88.1%
0050 Subsidies And Transfers
92,000 0 0 0 0 0 92,000 100.0% 0.0% 3.0%
0070 Equipment & Equipment Rental
116,000 36,724 30,532 0 44,116 74,648 4,628 4.0% 96.0% 35.8%
Non-Personnel Services 41.6% 12,633,254 4,981,416 1,918,833 3,194,437 300,421 5,413,690 2,238,148 17.7% 82.3% 90.6%
KV0 - Department of Motor Vehicles 100.0% 30,373,427 17,897,175 1,918,833 3,194,437 300,421 5,413,690 7,062,561 23.3% 76.7% 79.2%
% Of Budget for KV0 - Department of Motor Vehicles 58.9% 17.8%
Financial Status Report - (Operating Expenditures) as of June 30, 2019 O - 6

Government of the District of Columbia FY 2019 Financial Status Reports (as of June 30, 2019)General Fund: Local Funds (0100) By Comptroller Source Group
% Monthly Time Elapsed: 75.0%
Office of the Chief Financial Officer % Monthly Time Remaining: 25.0%SOURCE: CFOSolve / SOAR** UNAUDITED and UNADJUSTED **(Run Date: Jul 19, 2019)
TC0 - Department of For-Hire Vehicles
GAAP Category
CSG CSG Title % of Budget
Revised Budget
Expenditures Encumbrance ID Advances
Pre Encumbrance
Total Commitments
Available Balance
% Available
Balance
%Spent and
Obligated as of June 2019
%Spent and
Obligated as of June 2018
Non-Personnel Services
0031 Telecommunications 44,000 0 0 44,000 0 44,000 0 0.0% 100.0% N/A
0040 Other Services And Charges
173,829 24,390 9,759 10,000 0 19,759 129,680 74.6% 25.4% N/A
0050 Subsidies And Transfers
5,706,615 3,828,235 1,734,765 0 0 1,734,765 143,615 2.5% 97.5% 99.3%
Non-Personnel Services 100.0% 5,924,444 3,852,625 1,744,524 54,000 0 1,798,524 273,295 4.6% 95.4% 99.3%
TC0 - Department of For-Hire Vehicles 100.0% 5,924,444 3,852,625 1,744,524 54,000 0 1,798,524 273,295 4.6% 95.4% 99.3%
% Of Budget for TC0 - Department of For-Hire Vehicles
65.0% 30.4%
Grand Total for Public Works 438,040,390 333,128,037 37,036,383 7,140,587 5,060,878 49,237,847 55,674,506 12.7% 87.3% 89.2%
% Of Budget for Public Works 76.0% 11.2%
Financial Status Report - (Operating Expenditures) as of June 30, 2019 O - 7

(P) Financing and Others
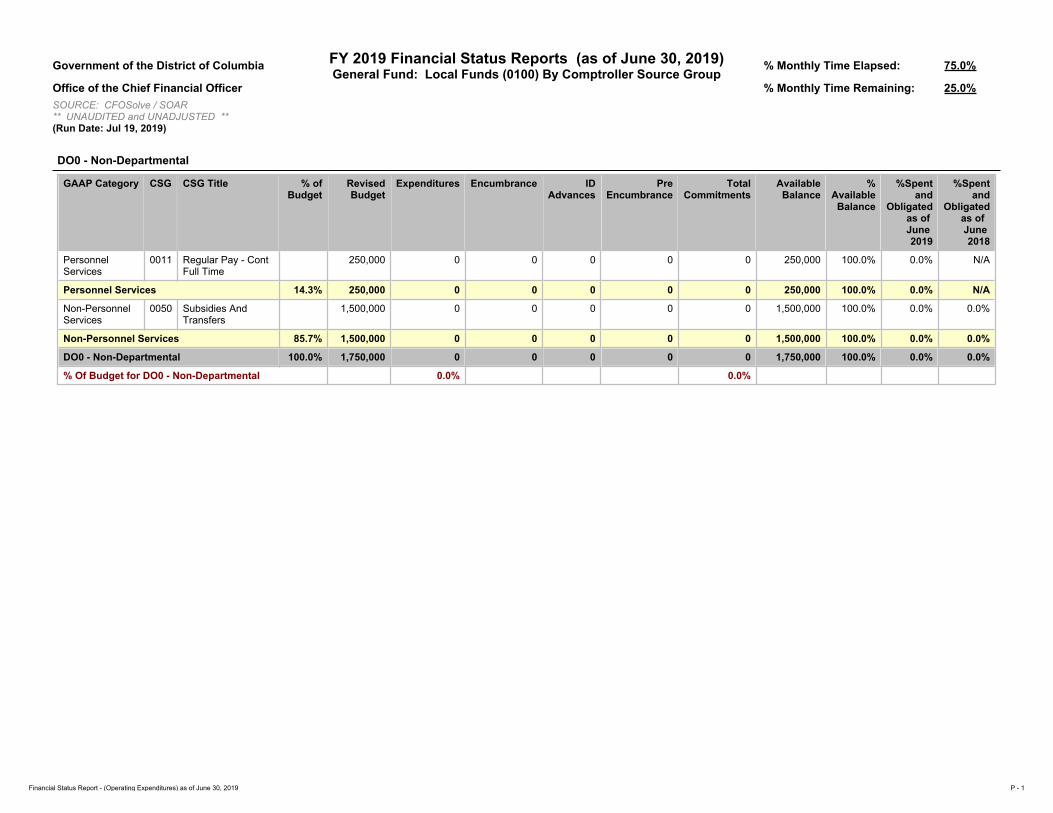
Government of the District of Columbia FY 2019 Financial Status Reports (as of June 30, 2019)General Fund: Local Funds (0100) By Comptroller Source Group
% Monthly Time Elapsed: 75.0%
Office of the Chief Financial Officer % Monthly Time Remaining: 25.0%SOURCE: CFOSolve / SOAR** UNAUDITED and UNADJUSTED **(Run Date: Jul 19, 2019)
DO0 - Non-Departmental
GAAP Category CSG CSG Title % of Budget
Revised Budget
Expenditures Encumbrance ID Advances
Pre Encumbrance
Total Commitments
Available Balance
% Available
Balance
%Spent and
Obligated as of June 2019
%Spent and
Obligated as of June 2018
Personnel Services
0011 Regular Pay - Cont Full Time
250,000 0 0 0 0 0 250,000 100.0% 0.0% N/A
Personnel Services 14.3% 250,000 0 0 0 0 0 250,000 100.0% 0.0% N/A
Non-Personnel Services
0050 Subsidies And Transfers
1,500,000 0 0 0 0 0 1,500,000 100.0% 0.0% 0.0%
Non-Personnel Services 85.7% 1,500,000 0 0 0 0 0 1,500,000 100.0% 0.0% 0.0%
DO0 - Non-Departmental 100.0% 1,750,000 0 0 0 0 0 1,750,000 100.0% 0.0% 0.0%
% Of Budget for DO0 - Non-Departmental 0.0% 0.0%
Financial Status Report - (Operating Expenditures) as of June 30, 2019 P - 1

Government of the District of Columbia FY 2019 Financial Status Reports (as of June 30, 2019)General Fund: Local Funds (0100) By Comptroller Source Group
% Monthly Time Elapsed: 75.0%
Office of the Chief Financial Officer % Monthly Time Remaining: 25.0%SOURCE: CFOSolve / SOAR** UNAUDITED and UNADJUSTED **(Run Date: Jul 19, 2019)
DS0 - Repayment of Loans and Interest
GAAP Category CSG CSG Title % of Budget
Revised Budget
Expenditures Encumbrance ID Advances
Pre Encumbrance
Total Commitments
Available Balance
% Available
Balance
%Spent and
Obligated as of June 2019
%Spent and
Obligated as of June 2018
Non-Personnel Services
0080 Debt Service
735,609,550 693,930,941 0 0 0 0 41,678,609 5.7% 94.3% 98.0%
Non-Personnel Services 100.0% 735,609,550 693,930,941 0 0 0 0 41,678,609 5.7% 94.3% 98.0%
DS0 - Repayment of Loans and Interest
100.0% 735,609,550 693,930,941 0 0 0 0 41,678,609 5.7% 94.3% 98.0%
% Of Budget for DS0 - Repayment of Loans and Interest
94.3% 0.0%
Financial Status Report - (Operating Expenditures) as of June 30, 2019 P - 2

Government of the District of Columbia FY 2019 Financial Status Reports (as of June 30, 2019)General Fund: Local Funds (0100) By Comptroller Source Group
% Monthly Time Elapsed: 75.0%
Office of the Chief Financial Officer % Monthly Time Remaining: 25.0%SOURCE: CFOSolve / SOAR** UNAUDITED and UNADJUSTED **(Run Date: Jul 19, 2019)
ELO - Master Equipment Lease/Purchase Program
GAAP Category CSG CSG Title % of Budget
Revised Budget
Expenditures Encumbrance ID Advances
Pre Encumbrance
Total Commitments
Available Balance
% Available
Balance
%Spent and
Obligated as of June 2019
%Spent and
Obligated as of June 2018
Non-Personnel Services
0080 Debt Service
11,844,303 9,891,789 0 0 0 0 1,952,514 16.5% 83.5% 81.2%
Non-Personnel Services 100.0% 11,844,303 9,891,789 0 0 0 0 1,952,514 16.5% 83.5% 81.2%
ELO - Master Equipment Lease/Purchase Program
100.0% 11,844,303 9,891,789 0 0 0 0 1,952,514 16.5% 83.5% 81.2%
% Of Budget for ELO - Master Equipment Lease/Purchase Program
83.5% 0.0%
Financial Status Report - (Operating Expenditures) as of June 30, 2019 P - 3

Government of the District of Columbia FY 2019 Financial Status Reports (as of June 30, 2019)General Fund: Local Funds (0100) By Comptroller Source Group
% Monthly Time Elapsed: 75.0%
Office of the Chief Financial Officer % Monthly Time Remaining: 25.0%SOURCE: CFOSolve / SOAR** UNAUDITED and UNADJUSTED **(Run Date: Jul 19, 2019)
EZ0 - Convention Center Transfer
GAAP Category CSG CSG Title % of Budget
Revised Budget
Expenditures Encumbrance ID Advances
Pre Encumbrance
Total Commitments
Available Balance
% Available
Balance
%Spent and
Obligated as of June 2019
%Spent and
Obligated as of June 2018
Non-Personnel Services
0050 Subsidies And Transfers
350,000 350,000 0 0 0 0 0 0.0% 100.0% 100.0%
Non-Personnel Services 100.0% 350,000 350,000 0 0 0 0 0 0.0% 100.0% 100.0%
EZ0 - Convention Center Transfer 100.0% 350,000 350,000 0 0 0 0 0 0.0% 100.0% 100.0%
% Of Budget for EZ0 - Convention Center Transfer 100.0% 0.0%
Financial Status Report - (Operating Expenditures) as of June 30, 2019 P - 4

Government of the District of Columbia FY 2019 Financial Status Reports (as of June 30, 2019)General Fund: Local Funds (0100) By Comptroller Source Group
% Monthly Time Elapsed: 75.0%
Office of the Chief Financial Officer % Monthly Time Remaining: 25.0%SOURCE: CFOSolve / SOAR** UNAUDITED and UNADJUSTED **(Run Date: Jul 19, 2019)
PA0 - Pay-As-You-Go Capital Fund
GAAP Category CSG CSG Title % of Budget
Revised Budget
Expenditures Encumbrance ID Advances
Pre Encumbrance
Total Commitments
Available Balance
% Available
Balance
%Spent and
Obligated as of June 2019
%Spent and
Obligated as of June 2018
Non-Personnel Services
0050 Subsidies And Transfers
4,421,166 0 0 0 0 0 4,421,166 100.0% 0.0% 0.0%
Non-Personnel Services 100.0% 4,421,166 0 0 0 0 0 4,421,166 100.0% 0.0% 0.0%
PA0 - Pay-As-You-Go Capital Fund 100.0% 4,421,166 0 0 0 0 0 4,421,166 100.0% 0.0% 0.0%
% Of Budget for PA0 - Pay-As-You-Go Capital Fund 0.0% 0.0%
Financial Status Report - (Operating Expenditures) as of June 30, 2019 P - 5

Government of the District of Columbia FY 2019 Financial Status Reports (as of June 30, 2019)General Fund: Local Funds (0100) By Comptroller Source Group
% Monthly Time Elapsed: 75.0%
Office of the Chief Financial Officer % Monthly Time Remaining: 25.0%SOURCE: CFOSolve / SOAR** UNAUDITED and UNADJUSTED **(Run Date: Jul 19, 2019)
RH0 - District Retiree Health Contribution
GAAP Category CSG CSG Title % of Budget
Revised Budget
Expenditures Encumbrance ID Advances
Pre Encumbrance
Total Commitments
Available Balance
% Available
Balance
%Spent and
Obligated as of June 2019
%Spent and
Obligated as of June 2018
Non-Personnel Services
0050 Subsidies And Transfers
46,000,000 46,000,000 0 0 0 0 0 0.0% 100.0% 0.0%
Non-Personnel Services 100.0% 46,000,000 46,000,000 0 0 0 0 0 0.0% 100.0% 0.0%
RH0 - District Retiree Health Contribution 100.0% 46,000,000 46,000,000 0 0 0 0 0 0.0% 100.0% 0.0%
% Of Budget for RH0 - District Retiree Health Contribution
100.0% 0.0%
Financial Status Report - (Operating Expenditures) as of June 30, 2019 P - 6

Government of the District of Columbia FY 2019 Financial Status Reports (as of June 30, 2019)General Fund: Local Funds (0100) By Comptroller Source Group
% Monthly Time Elapsed: 75.0%
Office of the Chief Financial Officer % Monthly Time Remaining: 25.0%SOURCE: CFOSolve / SOAR** UNAUDITED and UNADJUSTED **(Run Date: Jul 19, 2019)
UP0 - Workforce Investments
GAAP Category
CSG CSG Title % of Budget
Revised Budget
Expenditures Encumbrance ID Advances
Pre Encumbrance
Total Commitments
Available Balance
% Available
Balance
%Spent and
Obligated as of June 2019
%Spent and
Obligated as of June 2018
Personnel Services
0011 Regular Pay - Cont Full Time
13,316,959 0 0 0 0 0 13,316,959 100.0% 0.0% 0.0%
Personnel Services 100.0% 13,316,959 0 0 0 0 0 13,316,959 100.0% 0.0% 0.0%
UP0 - Workforce Investments 100.0% 13,316,959 0 0 0 0 0 13,316,959 100.0% 0.0% 0.0%
% Of Budget for UP0 - Workforce Investments 0.0% 0.0%
Financial Status Report - (Operating Expenditures) as of June 30, 2019 P - 7
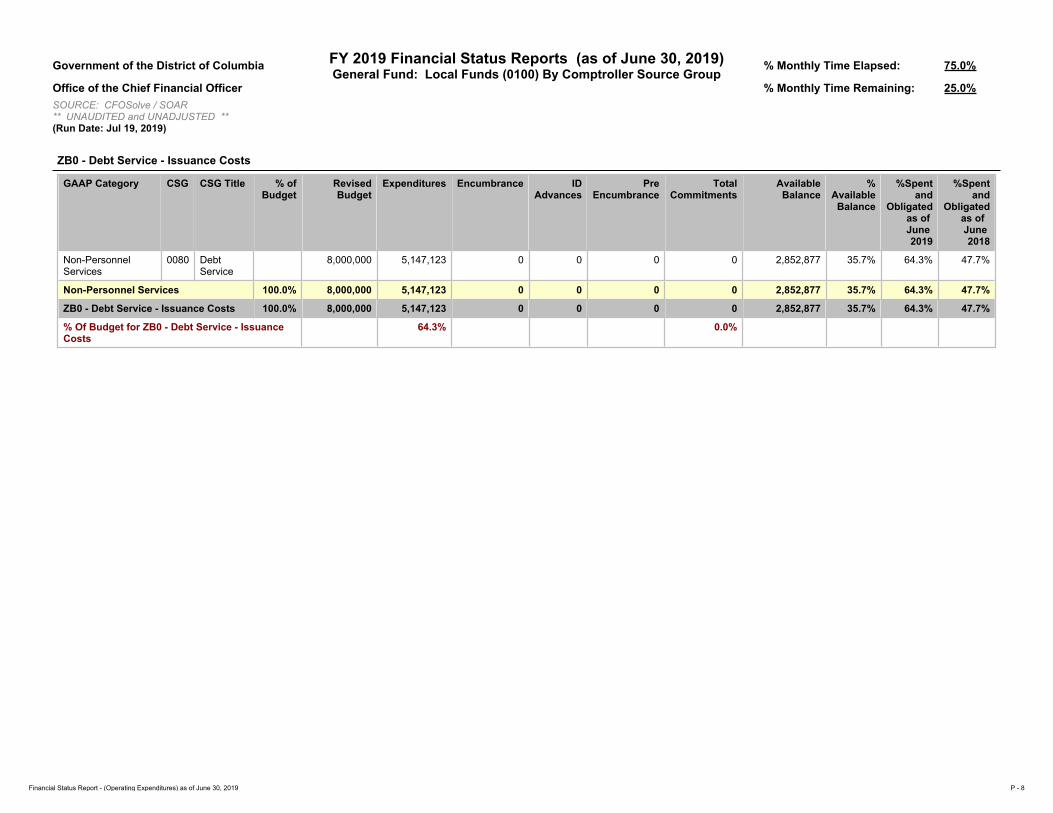
Government of the District of Columbia FY 2019 Financial Status Reports (as of June 30, 2019)General Fund: Local Funds (0100) By Comptroller Source Group
% Monthly Time Elapsed: 75.0%
Office of the Chief Financial Officer % Monthly Time Remaining: 25.0%SOURCE: CFOSolve / SOAR** UNAUDITED and UNADJUSTED **(Run Date: Jul 19, 2019)
ZB0 - Debt Service - Issuance Costs
GAAP Category CSG CSG Title % of Budget
Revised Budget
Expenditures Encumbrance ID Advances
Pre Encumbrance
Total Commitments
Available Balance
% Available
Balance
%Spent and
Obligated as of June 2019
%Spent and
Obligated as of June 2018
Non-Personnel Services
0080 Debt Service
8,000,000 5,147,123 0 0 0 0 2,852,877 35.7% 64.3% 47.7%
Non-Personnel Services 100.0% 8,000,000 5,147,123 0 0 0 0 2,852,877 35.7% 64.3% 47.7%
ZB0 - Debt Service - Issuance Costs 100.0% 8,000,000 5,147,123 0 0 0 0 2,852,877 35.7% 64.3% 47.7%
% Of Budget for ZB0 - Debt Service - Issuance Costs
64.3% 0.0%
Financial Status Report - (Operating Expenditures) as of June 30, 2019 P - 8
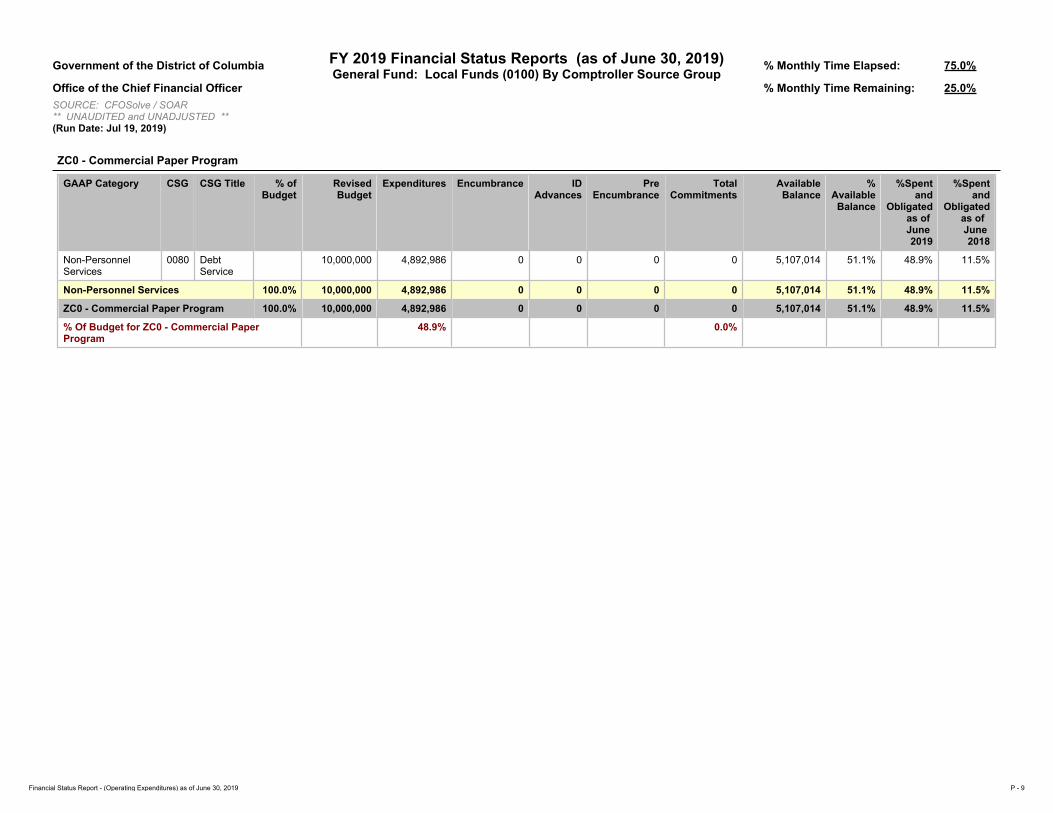
Government of the District of Columbia FY 2019 Financial Status Reports (as of June 30, 2019)General Fund: Local Funds (0100) By Comptroller Source Group
% Monthly Time Elapsed: 75.0%
Office of the Chief Financial Officer % Monthly Time Remaining: 25.0%SOURCE: CFOSolve / SOAR** UNAUDITED and UNADJUSTED **(Run Date: Jul 19, 2019)
ZC0 - Commercial Paper Program
GAAP Category CSG CSG Title % of Budget
Revised Budget
Expenditures Encumbrance ID Advances
Pre Encumbrance
Total Commitments
Available Balance
% Available
Balance
%Spent and
Obligated as of June 2019
%Spent and
Obligated as of June 2018
Non-Personnel Services
0080 Debt Service
10,000,000 4,892,986 0 0 0 0 5,107,014 51.1% 48.9% 11.5%
Non-Personnel Services 100.0% 10,000,000 4,892,986 0 0 0 0 5,107,014 51.1% 48.9% 11.5%
ZC0 - Commercial Paper Program 100.0% 10,000,000 4,892,986 0 0 0 0 5,107,014 51.1% 48.9% 11.5%
% Of Budget for ZC0 - Commercial Paper Program
48.9% 0.0%
Financial Status Report - (Operating Expenditures) as of June 30, 2019 P - 9
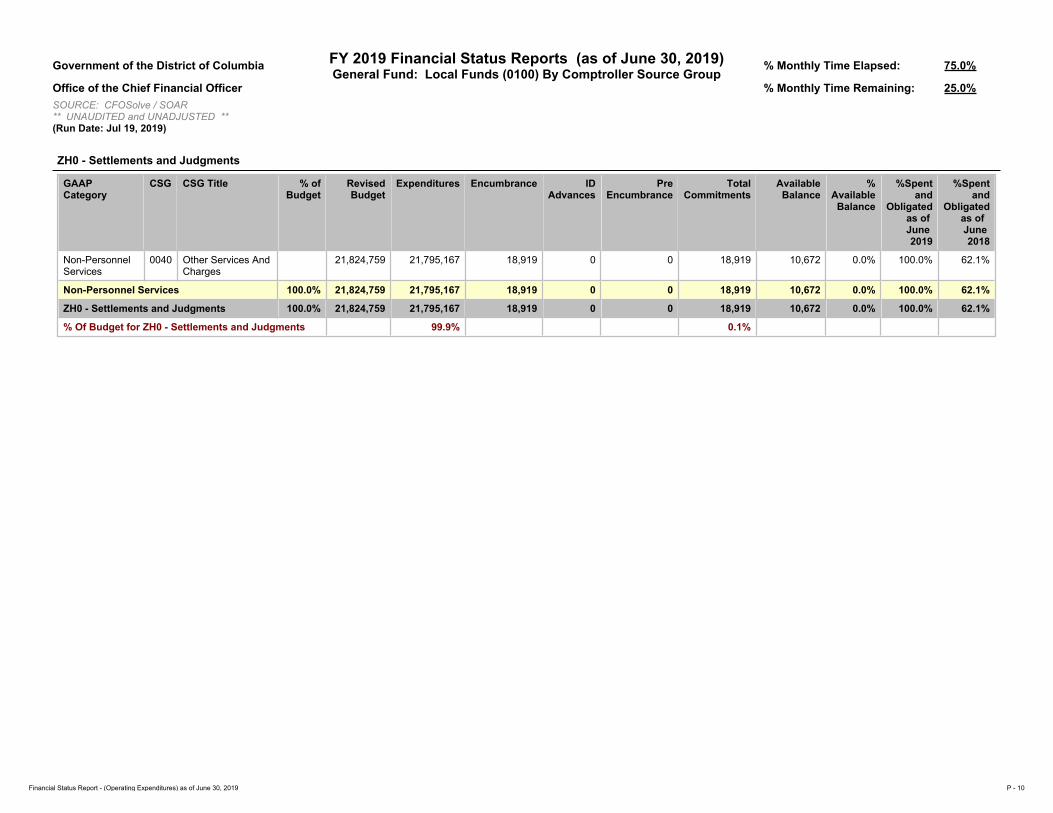
Government of the District of Columbia FY 2019 Financial Status Reports (as of June 30, 2019)General Fund: Local Funds (0100) By Comptroller Source Group
% Monthly Time Elapsed: 75.0%
Office of the Chief Financial Officer % Monthly Time Remaining: 25.0%SOURCE: CFOSolve / SOAR** UNAUDITED and UNADJUSTED **(Run Date: Jul 19, 2019)
ZH0 - Settlements and Judgments
GAAP Category
CSG CSG Title % of Budget
Revised Budget
Expenditures Encumbrance ID Advances
Pre Encumbrance
Total Commitments
Available Balance
% Available
Balance
%Spent and
Obligated as of June 2019
%Spent and
Obligated as of June 2018
Non-Personnel Services
0040 Other Services And Charges
21,824,759 21,795,167 18,919 0 0 18,919 10,672 0.0% 100.0% 62.1%
Non-Personnel Services 100.0% 21,824,759 21,795,167 18,919 0 0 18,919 10,672 0.0% 100.0% 62.1%
ZH0 - Settlements and Judgments 100.0% 21,824,759 21,795,167 18,919 0 0 18,919 10,672 0.0% 100.0% 62.1%
% Of Budget for ZH0 - Settlements and Judgments 99.9% 0.1%
Financial Status Report - (Operating Expenditures) as of June 30, 2019 P - 10

Government of the District of Columbia FY 2019 Financial Status Reports (as of June 30, 2019)General Fund: Local Funds (0100) By Comptroller Source Group
% Monthly Time Elapsed: 75.0%
Office of the Chief Financial Officer % Monthly Time Remaining: 25.0%SOURCE: CFOSolve / SOAR** UNAUDITED and UNADJUSTED **(Run Date: Jul 19, 2019)
ZZ0 - John A. Wilson Building Fund
GAAP Category
CSG CSG Title % of Budget
Revised Budget
Expenditures Encumbrance ID Advances
Pre Encumbrance
Total Commitments
Available Balance
% Available
Balance
%Spent and
Obligated as of June 2019
%Spent and
Obligated as of June 2018
Non-Personnel Services
0030 Energy, Comm. And Bldg Rentals
926,942 502,912 0 424,030 0 424,030 0 0.0% 100.0% 100.0%
0034 Security Services 1,765,562 775,770 0 989,792 0 989,792 0 0.0% 100.0% 100.0%
0035 Occupancy Fixed Costs
2,033,155 1,057,469 0 975,686 0 975,686 0 0.0% 100.0% 100.0%
Non-Personnel Services 100.0% 4,725,659 2,336,151 0 2,389,508 0 2,389,508 0 0.0% 100.0% 100.0%
ZZ0 - John A. Wilson Building Fund 100.0% 4,725,659 2,336,151 0 2,389,508 0 2,389,508 0 0.0% 100.0% 100.0%
% Of Budget for ZZ0 - John A. Wilson Building Fund 49.4% 50.6%
Grand Total for Financing and Other 857,842,396 784,344,158 18,919 2,389,508 0 2,408,427 71,089,811 8.3% 91.7% 76.1%
% Of Budget for Financing and Other 91.4% 0.3%
Financial Status Report - (Operating Expenditures) as of June 30, 2019 P - 11