Financial Statements Audit Report Washington School ...
36
Financial Statements Audit Report Washington School Information Processing Cooperative For the period September 1, 2018 through August 31, 2019 Published April 20, 2020 Report No. 1026083
Transcript of Financial Statements Audit Report Washington School ...

Financial Statements Audit Report
Washington School Information
Processing Cooperative
For the period September 1, 2018 through August 31, 2019
Published April 20, 2020
Report No. 1026083

Insurance Building, P.O. Box 40021 Olympia, Washington 98504-0021 (564) 999-0950 [email protected]
Office of the Washington State Auditor
Pat McCarthy
April 20, 2020
Board of Directors
Washington School Information Processing Cooperative
Everett, Washington
Report on Financial Statements
Please find attached our report on the Washington School Information Processing Cooperative’s
financial statements.
We are issuing this report in order to provide information on the Cooperative’s financial condition.
Sincerely,
Pat McCarthy
State Auditor
Olympia, WA

Office of the Washington State Auditor
TABLE OF CONTENTS
Independent Auditor's Report on Internal Control Over Financial Reporting and on Compliance
and Other Matters Based on an Audit of Financial Statements Performed in Accordance with
Government Auditing Standards..................................................................................................... 4
Independent Auditor's Report on Financial Statements .................................................................. 7
Financial Section ........................................................................................................................... 10
About the State Auditor's Office ................................................................................................... 36
Page 3

Office of the Washington State Auditor
INDEPENDENT AUDITOR’S REPORT ON INTERNAL CONTROL
OVER FINANCIAL REPORTING AND ON COMPLIANCE AND
OTHER MATTERS BASED ON AN AUDIT OF FINANCIAL
STATEMENTS PERFORMED IN ACCORDANCE WITH
GOVERNMENT AUDITING STANDARDS
Washington School Information Processing Cooperative
September 1, 2018 through August 31, 2019
Board of Directors
Washington School Information Processing Cooperative
Everett, Washington
We have audited, in accordance with auditing standards generally accepted in the United States of
America and the standards applicable to financial audits contained in Government Auditing
Standards, issued by the Comptroller General of the United States, the financial statements of the
Washington School Information Processing Cooperative, as of and for the year ended August 31,
2019, and the related notes to the financial statements, which collectively comprise the
Cooperative’s basic financial statements, and have issued our report thereon dated April 13, 2020.
The Cooperative has omitted the management’s discussion and analysis information that
governmental accounting principles generally accepted in the United States of America have
determined is necessary to supplement, although not required to be part of, the basic financial
statements. Our opinion on the basic financial statements is not affected by this missing
information.
As discussed in Note 9 to the financial statements, in February 2020, a state of emergency was
declared that could have a negative financial effect on the Cooperative. Management’s plans in
response to this matter are also described in Note 9.
INTERNAL CONTROL OVER FINANCIAL REPORTING
In planning and performing our audit of the financial statements, we considered the Cooperative’s
internal control over financial reporting (internal control) to determine the audit procedures that
are appropriate in the circumstances for the purpose of expressing our opinion on the financial
statements, but not for the purpose of expressing an opinion on the effectiveness of the
Cooperative’s internal control. Accordingly, we do not express an opinion on the effectiveness of
the Cooperative’s internal control.
Page 4
Office of the Washington State Auditor
A deficiency in internal control exists when the design or operation of a control does not allow
management or employees, in the normal course of performing their assigned functions, to prevent,
or detect and correct, misstatements on a timely basis. A material weakness is a deficiency, or a
combination of deficiencies, in internal control such that there is a reasonable possibility that a
material misstatement of the Cooperative’s financial statements will not be prevented, or detected
and corrected on a timely basis. A significant deficiency is a deficiency, or a combination of
deficiencies, in internal control that is less severe than a material weakness, yet important enough
to merit attention by those charged with governance.
Our consideration of internal control was for the limited purpose described in the first paragraph
of this section and was not designed to identify all deficiencies in internal control that might be
material weaknesses or significant deficiencies. Given these limitations, during our audit we did
not identify any deficiencies in internal control that we consider to be material weaknesses.
However, material weaknesses may exist that have not been identified.
COMPLIANCE AND OTHER MATTERS
As part of obtaining reasonable assurance about whether the Cooperative’s financial statements
are free from material misstatement, we performed tests of the Cooperative’s compliance with
certain provisions of laws, regulations, contracts and grant agreements, noncompliance with which
could have a direct and material effect on the determination of financial statement amounts.
However, providing an opinion on compliance with those provisions was not an objective of our
audit, and accordingly, we do not express such an opinion.
The results of our tests disclosed no instances of noncompliance or other matters that are required
to be reported under Government Auditing Standards.
PURPOSE OF THIS REPORT
The purpose of this report is solely to describe the scope of our testing of internal control and
compliance and the results of that testing, and not to provide an opinion on the effectiveness of the
Cooperative’s internal control or on compliance. This report is an integral part of an audit
performed in accordance with Government Auditing Standards in considering the Cooperative’s
internal control and compliance. Accordingly, this communication is not suitable for any other
Page 5

Office of the Washington State Auditor
purpose. However, this report is a matter of public record and its distribution is not limited. It also
serves to disseminate information to the public as a reporting tool to help citizens assess
government operations.
Pat McCarthy
State Auditor
Olympia, WA
April 13, 2020
Page 6

Office of the Washington State Auditor
INDEPENDENT AUDITOR’S REPORT ON
FINANCIAL STATEMENTS
Washington School Information Processing Cooperative
September 1, 2018 through August 31, 2019
Board of Directors
Washington School Information Processing Cooperative
Everett, Washington
REPORT ON THE FINANCIAL STATEMENTS
We have audited the accompanying financial statements of the Washington School Information
Processing Cooperative, as of and for the year ended August 31, 2019, and the related notes to the
financial statements, which collectively comprise the Cooperative’s basic financial statements as
listed on page 10.
Management’s Responsibility for the Financial Statements
Management is responsible for the preparation and fair presentation of these financial statements
in accordance with accounting principles generally accepted in the United States of America; this
includes the design, implementation, and maintenance of internal control relevant to the
preparation and fair presentation of financial statements that are free from material misstatement,
whether due to fraud or error.
Auditor’s Responsibility
Our responsibility is to express an opinion on these financial statements based on our audit. We
conducted our audit in accordance with auditing standards generally accepted in the United States
of America and the standards applicable to financial audits contained in Government Auditing
Standards, issued by the Comptroller General of the United States. Those standards require that
we plan and perform the audit to obtain reasonable assurance about whether the financial
statements are free from material misstatement.
An audit involves performing procedures to obtain audit evidence about the amounts and
disclosures in the financial statements. The procedures selected depend on the auditor’s judgment,
including the assessment of the risks of material misstatement of the financial statements, whether
Page 7

Office of the Washington State Auditor
due to fraud or error. In making those risk assessments, the auditor considers internal control
relevant to the Cooperative’s preparation and fair presentation of the financial statements in order
to design audit procedures that are appropriate in the circumstances, but not for the purpose of
expressing an opinion on the effectiveness of the Cooperative’s internal control. Accordingly, we
express no such opinion. An audit also includes evaluating the appropriateness of accounting
policies used and the reasonableness of significant accounting estimates made by management, as
well as evaluating the overall presentation of the financial statements.
We believe that the audit evidence we have obtained is sufficient and appropriate to provide a basis
for our audit opinion.
Opinion
In our opinion, the financial statements referred to above present fairly, in all material respects,
the financial position of the Washington School Information Processing Cooperative, as of
August 31, 2019, and the changes in financial position and cash flows thereof for the year then
ended in accordance with accounting principles generally accepted in the United States of
America.
Matters of Emphasis
As discussed in Note 9 to the financial statements, in February 2020, a state of emergency was
declared that could have a negative financial effect on the Cooperative. Management’s plans in
response to this matter are also described in Note 9. Our opinion is not modified with respect to
this matter.
Other Matters
Required Supplementary Information
Accounting principles generally accepted in the United States of America require that the required
supplementary information listed on page 10 be presented to supplement the basic financial
statements. Such information, although not a part of the basic financial statements, is required by
the Governmental Accounting Standards Board who considers it to be an essential part of financial
reporting for placing the basic financial statements in an appropriate operational, economic or
historical context. We have applied certain limited procedures to the required supplementary
information in accordance with auditing standards generally accepted in the United States of
America, which consisted of inquiries of management about the methods of preparing the
information and comparing the information for consistency with management’s responses to our
inquiries, the basic financial statements, and other knowledge we obtained during our audit of the
Page 8

Office of the Washington State Auditor
basic financial statements. We do not express an opinion or provide any assurance on the
information because the limited procedures do not provide us with sufficient evidence to express
an opinion or provide any assurance.
Management has omitted the management’s discussion and analysis information that
governmental accounting principles generally accepted in the United States of America require
to be presented to supplement the basic financial statements. Such missing information, although
not a part of the basic financial statements, is required by the Governmental Accounting Standards
Board who considers it to be an essential part of financial reporting for placing the basic financial
statements in an appropriate operational, economic, or historical context. Our opinion on the basic
financial statements is not affected by this missing information.
OTHER REPORTING REQUIRED BY GOVERNMENT AUDITING
STANDARDS
In accordance with Government Auditing Standards, we have also issued our report dated April 13,
2020 on our consideration of the Cooperative’s internal control over financial reporting and on our
tests of its compliance with certain provisions of laws, regulations, contracts and grant agreements
and other matters. The purpose of that report is to describe the scope of our testing of internal
control over financial reporting and compliance and the results of that testing, and not to provide
an opinion on internal control over financial reporting or on compliance. That report is an integral
part of an audit performed in accordance with Government Auditing Standards in considering the
Cooperative’s internal control over financial reporting and compliance.
Pat McCarthy
State Auditor
Olympia, WA
April 13, 2020
Page 9

Office of the Washington State Auditor
FINANCIAL SECTION
Washington School Information Processing Cooperative
September 1, 2018 through August 31, 2019
BASIC FINANCIAL STATEMENTS
Statement of Net Position – 2019
Statement of Revenues, Expenses and Changes in Net Position – 2019
Statement of Cash Flows – 2019
Notes to Financial Statements – 2019
REQUIRED SUPPLEMENTARY INFORMATION
Schedule of Employer Contributions – PERS 1 and PERS 2/3 – 2019
Schedule of Proportionate Share of Net Pension Liability – PERS 1 and PERS 2/3 – 2019
Schedule of Investment Returns – PERS 1 and PERS 2/3 – 2019
Schedule of Changes in Total OPEB Liability and Related Ratios – 2019
Notes to the Required Supplementary Information – 2019
Page 10
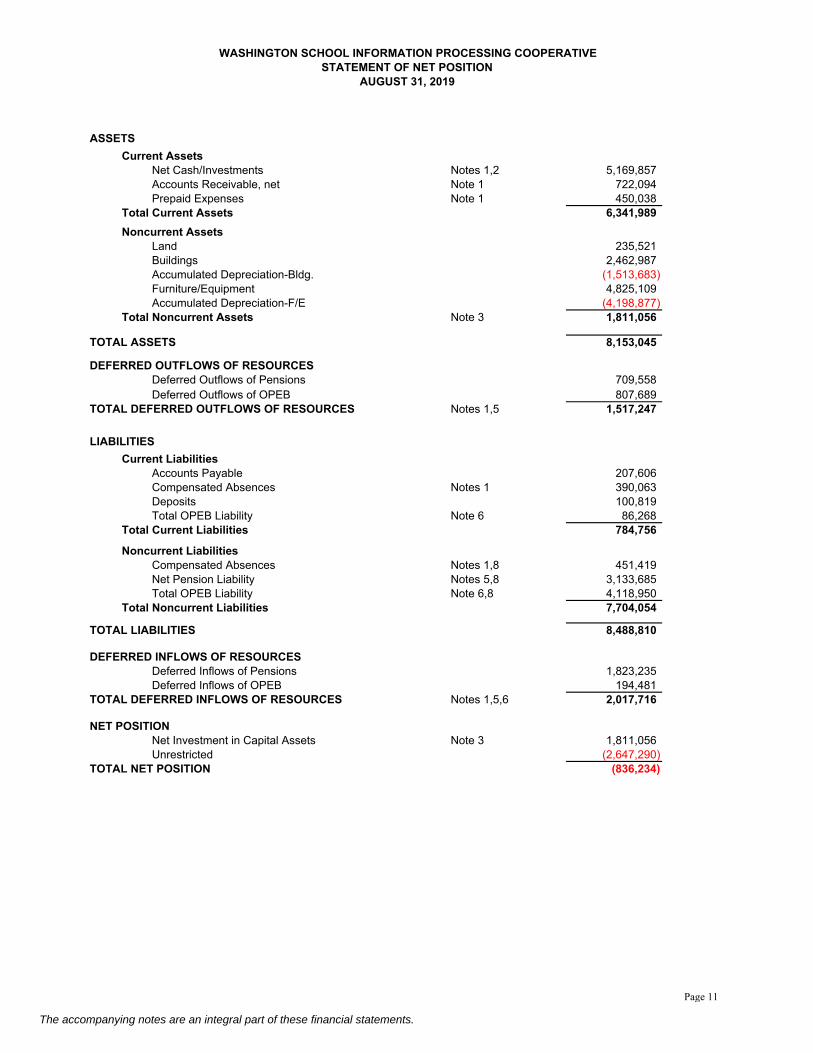
WASHINGTON SCHOOL INFORMATION PROCESSING COOPERATIVESTATEMENT OF NET POSITION
AUGUST 31, 2019
ASSETS
Current AssetsNet Cash/Investments Notes 1,2 5,169,857Accounts Receivable, net Note 1 722,094Prepaid Expenses Note 1 450,038
Total Current Assets 6,341,989
Noncurrent AssetsLand 235,521Buildings 2,462,987Accumulated Depreciation-Bldg. (1,513,683)Furniture/Equipment 4,825,109Accumulated Depreciation-F/E (4,198,877)
Total Noncurrent Assets Note 3 1,811,056
TOTAL ASSETS 8,153,045
DEFERRED OUTFLOWS OF RESOURCESDeferred Outflows of Pensions 709,558 Deferred Outflows of OPEB 807,689
TOTAL DEFERRED OUTFLOWS OF RESOURCES Notes 1,5 1,517,247
LIABILITIES
Current LiabilitiesAccounts Payable 207,606Compensated Absences Notes 1 390,063Deposits 100,819Total OPEB Liability Note 6 86,268
Total Current Liabilities 784,756
Noncurrent LiabilitiesCompensated Absences Notes 1,8 451,419Net Pension Liability Notes 5,8 3,133,685Total OPEB Liability Note 6,8 4,118,950
Total Noncurrent Liabilities 7,704,054
TOTAL LIABILITIES 8,488,810
DEFERRED INFLOWS OF RESOURCESDeferred Inflows of Pensions 1,823,235Deferred Inflows of OPEB 194,481
TOTAL DEFERRED INFLOWS OF RESOURCES Notes 1,5,6 2,017,716
NET POSITIONNet Investment in Capital Assets Note 3 1,811,056Unrestricted (2,647,290)
TOTAL NET POSITION (836,234)
The accompanying notes are an integral part of these financial statements.
Page 11

WASHINGTON SCHOOL INFORMATION PROCESSING COOPERATIVESTATEMENT OF REVENUES, EXPENSES AND CHANGES IN NET POSITION
FOR THE YEAR ENDED AUGUST 31, 2019
OPERATING REVENUES
Member Contributions 15,699,354Other Operating Revenue 8,225,167
TOTAL OPERATING REVENUES 23,924,521
OPERATING EXPENSES
Membership Services 21,691,727General and Administrative 1,852,923Depreciation Note 3 412,370
TOTAL OPERATING EXPENSES 23,957,020
NONOPERATING REVENUES (EXPENSES)Interest Income 111,488
TOTAL NONOPERATING REVENUES (EXPENSES) 111,488
NET POSITION - BEGINNING BALANCE (915,223)
NET POSITION - ENDING BALANCE (836,234)
78,989INCREASE (DECREASE) IN NET POSITION
(32,500)OPERATING INCOME/(LOSS)
The accompanying notes are an integral part of these financial statements.
Page 12

WASHINGTON SCHOOL INFORMATION PROCESSING COOPERATIVESTATEMENT OF CASH FLOWS
FOR THE YEAR ENDED AUGUST 31, 2019
CASH FLOWS FROM OPERATING ACTIVITIESCash received from customers, etc. 23,585,126Cash payments to suppliers for goods & services (13,686,197)Cash payments to employees for services (10,322,184)Net cash provided by operating activities (423,256)
CASH FLOWS FROM CAPITAL AND RELATED FINANCING ACTIVITIESAcquisition of Capital Assets - Net Note 3 (535,207)Net cash flows from capital and related financing activities (535,207)
CASH FLOWS FROM INVESTING ACTIVITIESInterest and dividends on investments 111,488Net cash flows from investing activities 111,488
INCREASE (DECREASE) IN CASH AND CASH EQUIVALENTS (846,974)
CASH AND CASH EQUIVALENTS - BEGINNING 6,016,830
CASH AND CASH EQUIVALENTS - ENDING Notes 1,2 5,169,857
The accompanying notes are an integral part of these financial statements.
Page 13

WASHINGTON SCHOOL INFORMATION PROCESSING COOPERATIVE
Statement of Cash Flows for the Fiscal Year Ended August 31, 2019 (Cont.)RECONCILIATION OF OPERATING INCOME TO NET CASH PROVIDED (USED) BY OPERATING ACTIVITIES
OPERATING INCOME(LOSS): (32,500)
Non-cash items:Depreciation expense Note 3 412,370Pension expense from change in Net Pension Liability Note 5 (681,291)OPEB expense from change in Net OPEB Liability Note 6 251,210
Total Non-cash items (17,711)
Change in current accounts:(Increase)/Decrease in accounts receivable (operations) (337,743)(Increase)/Decrease in prepaid amounts 50,983Increase/(Decrease) in accounts payable (operations) (103,495)Increase/(Decrease) in salaries payable (1,976)Increase/(Decrease) in payroll taxes payable (287)Increase/(Decrease) in compensated absences payable 1,915Increase/(Decrease) in deposits (48,250)
Change in noncurrent accounts:Increase/(Decrease) in compensated absences payable Note 8 65,808
NET CASH PROVIDED/ (USED) BY OPERATING ACTIVITIES: (423,256)
The accompanying notes are an integral part of these financial statements.
Page 14

NOTES TO THE FINANCIAL STATEMENTS
Note 1: SUMMARY OF SIGNIFICANT ACCOUNTING POLICIES
The accounting policies of Washington School Information Processing Cooperative (“WSIPC”) were developed under authority of the Office of Superintendent of Public Instruction. Except where noted as exceptions, the rules of generally accepted accounting principles (GAAP) are the basis for accounting and financial reporting in WSIPC. The following summary of the more significant accounting policies is presented to assist the reader in interpreting the financial statements and other data in this report. These policies should be viewed as an integral part of the accompanying financial statements.
Reporting Entity
Washington School Information Processing Cooperative (“WSIPC”) is an interlocal cooperative formed by the nine Educational Service Districts (ESDs) of the State of Washington, pursuant to Title 39.34, Revised Code of Washington (RCW), the Interlocal Cooperation Act, for the purpose of providing extensive information system services to school districts, educational service districts, and other educational entities. WSIPC is a non-profit public agency formed by mutual agreement of the nine ESDs, including Northeast Washington ESD 101, ESD 105, ESD 112, ESD 113, Olympic ESD 114, Puget Sound ESD 121, ESD 123, North Central ESD 171 and Northwest ESD 189, with an equal share of the investment in joint venture recorded on each of the ESD’s consolidated financial statements.
Oversight responsibility for WSIPC's operations is vested with the Board of Directors who are appointed by the boards of directors of the nine Educational Service Districts that are signatory to the Interlocal Cooperative Agreement, one from each educational service district. Management of WSIPC is appointed by and accountable to the Board of Directors. Fiscal responsibility, including budget authority, setting fees for services and issuing debt consistent with the provisions of state statutes, rests with the Board of Directors. ESD 123 is the fiscal agent of the joint venture, and reports directly to the WSIPC Board of Directors on financial matters. For financial reporting purposes, WSIPC’s financial statements include all fund entities that are controlled by WSIPC's Board of Directors and managed by the administrative staff, unless noted hereafter.
As required by generally accepted accounting principles, management has considered all potential component units in defining the reporting entity. Based on the standards set by Governmental Accounting Standards Board (GASB) Statement 14, there were no component units of WSIPC.
Basis of Accounting and Reporting
WSIPC’s accounting policies, as reflected in the accompanying financial statements, conform to the Accounting Manual for Educational Service Districts, prescribed by the Office of Superintendent of Public Instruction (OSPI). This manual allows for a practice that differs from generally accepted accounting principles in the following manner: (1) The Management Discussion and Analysis is not required.
The financial statements are reported using the economic resources measurement focus and the accrual basis of accounting. Under this method, revenues are recorded when earned and expenses are recorded when a liability is incurred, regardless of the timing of related cash flows. WSIPC reports as a stand-alone proprietary fund.
Proprietary funds distinguish operating revenues and expenses from non-operating items. Operating revenues and expenses generally result from providing services and producing and delivering goods in connection with a proprietary fund’s principle ongoing operations. Operating expenses for proprietary funds
Page 15

include the cost of providing services, administrative expenses, depreciation on capital assets, and gain/loss on sale of assets. Grants used to finance operations and expenses not related to the provision of WSIPC services are reported as non-operating revenues and expenses. Assets, Liabilities, and Equity
Cash and Cash Equivalents The Franklin County Treasurer is the ex-officio treasurer for WSIPC. In this capacity, the County Treasurer receives daily deposits and transacts investments on behalf of WSIPC. These amounts are classified on the Statement of Net Position as Cash and Investments. See Note 2. For the purposes of the Statement of Cash Flows, WSIPC considers all highly liquid investments (including restricted assets) with a maturity of three months or less when purchased to be cash and cash equivalents.
Deposits and Investments – See Note 2
Receivables WSIPC’s accounts and contracts receivable represent the value of goods and services provided and invoiced to clients at fiscal year-end. All receivables are shown net of an allowance for uncollectibles. On August 31, 2019, and there were no uncollectible accounts.
Prepaid Items Certain payments to vendors reflect costs applicable to future accounting periods and are recorded as prepaid items in the financial statements.
Capital Assets and Depreciation – See Note 3
Compensated Absences Employees earn vacation leave at varying rates in accordance with WSIPC policy. A maximum of 30 accrued days’ vacation leave is payable upon termination. Employees earn sick leave at a rate of 12 days per year and may accumulate up to 180 days unused sick leave balance. Under the provisions of Chapter 28A.400.210 RCW, sick leave accumulated by employees is reimbursed at death or retirement at the rate of 1 day for each 4 days of accrued leave, limited to 180 accrued days. This chapter also provides employees who have accumulated in excess of 60 accrued days at the end of the calendar year an annual buy-back at the rate of 1 day for each 4 days of accrued leave, of an amount up to the maximum annual accumulations of 12 days. For buy-back purposes, employees may accumulate such leave to a maximum of 180 days, including annual accumulation, as of December 31 of each year.
The balances reported in the Statement of Net Position as of August 31, 2019, represent the aggregate amount of unused vacation leave payable, and sick leave eligible for payout upon retirement for all eligible employees of WSIPC.
Deposits This account consists of conference attendee registrations and any early payments from districts for services attributable to the next fiscal year.
Page 16
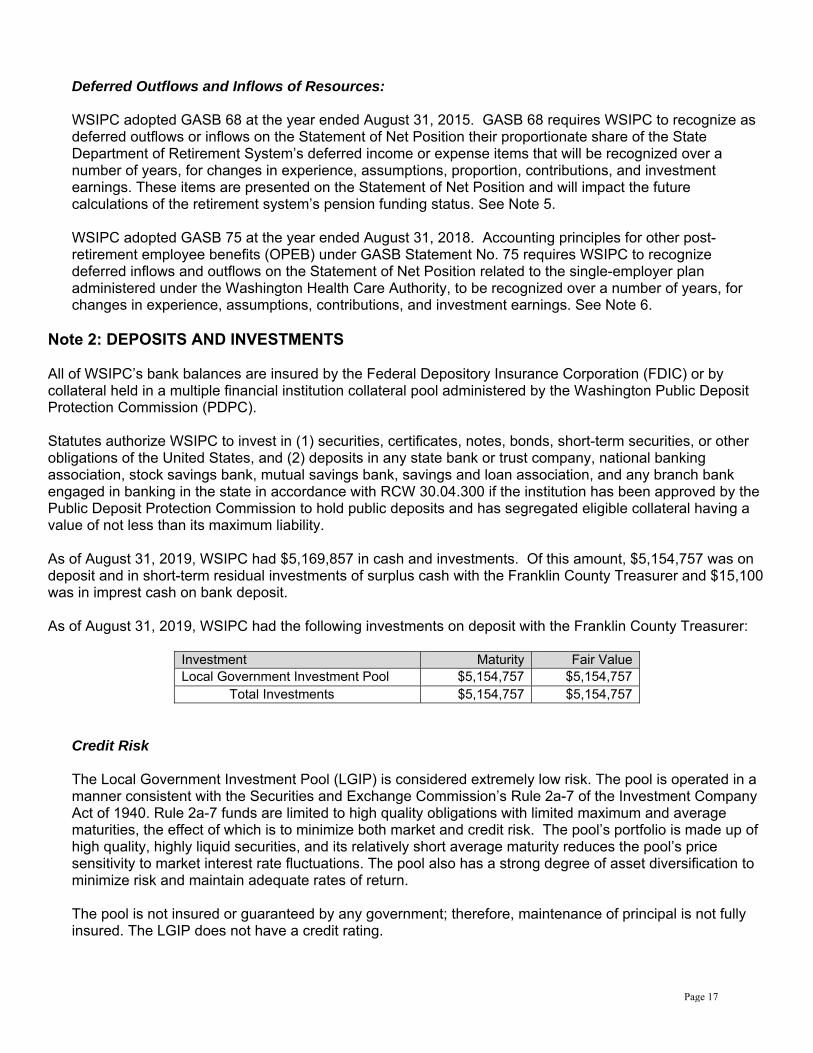
Deferred Outflows and Inflows of Resources: WSIPC adopted GASB 68 at the year ended August 31, 2015. GASB 68 requires WSIPC to recognize as deferred outflows or inflows on the Statement of Net Position their proportionate share of the State Department of Retirement System’s deferred income or expense items that will be recognized over a number of years, for changes in experience, assumptions, proportion, contributions, and investment earnings. These items are presented on the Statement of Net Position and will impact the future calculations of the retirement system’s pension funding status. See Note 5.
WSIPC adopted GASB 75 at the year ended August 31, 2018. Accounting principles for other post-retirement employee benefits (OPEB) under GASB Statement No. 75 requires WSIPC to recognize deferred inflows and outflows on the Statement of Net Position related to the single-employer plan administered under the Washington Health Care Authority, to be recognized over a number of years, for changes in experience, assumptions, contributions, and investment earnings. See Note 6.
Note 2: DEPOSITS AND INVESTMENTS All of WSIPC’s bank balances are insured by the Federal Depository Insurance Corporation (FDIC) or by collateral held in a multiple financial institution collateral pool administered by the Washington Public Deposit Protection Commission (PDPC). Statutes authorize WSIPC to invest in (1) securities, certificates, notes, bonds, short-term securities, or other obligations of the United States, and (2) deposits in any state bank or trust company, national banking association, stock savings bank, mutual savings bank, savings and loan association, and any branch bank engaged in banking in the state in accordance with RCW 30.04.300 if the institution has been approved by the Public Deposit Protection Commission to hold public deposits and has segregated eligible collateral having a value of not less than its maximum liability. As of August 31, 2019, WSIPC had $5,169,857 in cash and investments. Of this amount, $5,154,757 was on deposit and in short-term residual investments of surplus cash with the Franklin County Treasurer and $15,100 was in imprest cash on bank deposit. As of August 31, 2019, WSIPC had the following investments on deposit with the Franklin County Treasurer:
Investment Maturity Fair Value Local Government Investment Pool $5,154,757 $5,154,757
Total Investments $5,154,757 $5,154,757 Credit Risk
The Local Government Investment Pool (LGIP) is considered extremely low risk. The pool is operated in a manner consistent with the Securities and Exchange Commission’s Rule 2a-7 of the Investment Company Act of 1940. Rule 2a-7 funds are limited to high quality obligations with limited maximum and average maturities, the effect of which is to minimize both market and credit risk. The pool’s portfolio is made up of high quality, highly liquid securities, and its relatively short average maturity reduces the pool’s price sensitivity to market interest rate fluctuations. The pool also has a strong degree of asset diversification to minimize risk and maintain adequate rates of return. The pool is not insured or guaranteed by any government; therefore, maintenance of principal is not fully insured. The LGIP does not have a credit rating.
Page 17

The pool is managed and operated by the Office of the State Treasurer for the State of Washington. The LGIP publishes an annual report, which is on the Internet at the Treasurer’s Web site (http://tre.wa.gov). As of the most recent report date, fair value equaled amortized cost. It is the policy of the LGIP to permit participants to withdraw their investments on a daily basis; therefore, WSIPC’s investment balance in the pool is equal to fair value. Custodial Credit Risk Custodial credit risk is the risk that in the event of a failure of the counterparty to an investment transaction, WSIPC would not be able to recover the value of the investment or collateral securities. Of WSIPC’s total cash and investment position of $5,169,857, $5,154,757 is exposed to custodial credit risk because the investments held by the LGIP are not insured or guaranteed by any government. WSIPC does not have a policy for custodial credit risk.
Concentration of Credit Risk
WSIPC does not have investments in any one issuer that represents five percent or more of total investments.
Note 3: CAPITAL ASSETS Capital assets, which include property, facilities, and large equipment, are capitalized at total acquisition cost, provided such cost exceeds $5,000 and has an expected useful life of three or more years. Depreciation is recorded on all depreciable capital assets on a straight-line basis over the following estimated useful lives:
Asset Years Building 30 Computer Hardware & Equipment 3 Phone systems, Vehicles 5 Furniture 10
Major expenses for capital assets, including capital leases and major repairs that extend the useful life of an asset are capitalized. Assets under the capitalization threshold, maintenance, repairs, and minor renewals are accounted for as expenses when incurred.
Page 18

Capital assets activity for the fiscal year ended August 31, 2019, was as follows:
Beginning Balance 9/1/2018
Increases
(Decreases)
Ending Balance
8/31/2019 Capital Assets not being depreciated: Land $ 235,521
$ 235,521
Total Capital Assets not being depreciated $ 235,521 $ 235,521
Depreciable Capital Assets: Buildings $2,462,987 $2,462,987 Furniture & Equipment 4,377,811 535,207 (87,909) 4,825,109 Total Depreciable Capital Assets $6,840,797 $535,207 ($87,909) $7,288,095
Less Accumulated Depreciation for: Buildings $1,438,839 74,845 $1,513,683 Furniture & Equipment $3,949,260 337,526 (87,909) $4,198,877 Total Accumulated Depreciation $5,388,099 $412,370 ($87,909) $5,712,560
Total Depreciable Assets, net $1,452,699 $122,836 $0 $1,575,535
Total Capital Assets, net $1,688,220 $122,836 $0 $1,811,056
Note 4: LEASES
Operating Lease(s)
WSIPC is committed under various leases for copy machines. All leases are considered operating leases for accounting purposes because WSIPC does not acquire interests in the property. Lease expenses for the year ended August 31, 2019, totaled $34,770. Future minimum rental commitments for these leases are as follows:
Fiscal Year Ending August 31
Amount
2020 $34,178 2021 $34,178 2022 $34,178 2023 $23,552 2024 & thereafter $0
Note 5: PENSION PLANS
General Information
The Washington State Department of Retirement Systems (DRS), a department within the primary government of the state of Washington, prepares a stand-alone comprehensive annual financial report (CAFR) that includes financial statements and required supplementary information for each pension plan. The pension plan’s basic financial statement is accounted for using the accrual basis of accounting. The measurement date of the pension plans is June 30. Benefit payments (including refunds of employee contributions) are recognized when due and payable in accordance with the benefit terms. Investments are reported at fair value. For the purposes of measuring the net pension liability, deferred outflows of resources and deferred inflows of resources related to pensions, and pension expense, information about the fiduciary net position of
Page 19

pension plans administered by DRS and additions to/deductions from the plans’ net position have been determined on the same basis as they are reported by the plans. Detailed information about the pension plans’ fiduciary net position is available in the separately issued DRS CAFR. Copies of the report may be obtained by contacting the Washington State Department of Retirement Systems, P.O. Box 48380, Olympia, WA 98504-8380; or online at http://www.drs.wa.gov./administrations/annual-report. Membership Participation & Plan Benefits
The Public Employees' Retirement System (PERS) includes non-certificated staff of state, county, local government, and 295 public school district employees. Membership participation by retirement plan as of June 30, 2019, was as follows:
Plan
Active Plan Members
Inactive Plan Members Entitled
to but not yet Receiving Benefits
Retirees and Beneficiaries
Receiving Benefits
PERS 1 1,535 401 45,792 PERS 2 121,968 29,139 55,161 PERS 3 37,545 6,381 5,709
Plan 1 members of PERS programs are defined benefit pension plans whose members joined the system on or before September 30, 1977. Plan 1 is closed to new entrants. PERS Plan 1 provides retirement, disability and death benefits. PERS 1 members were vested after the completion of five years of eligible service. Retirement benefits are determined as two percent of the member’s average final compensation (AFC) times the member’s years of service. The AFC is the average of the member’s 24 highest consecutive service months. Members are eligible for retirement from active status at any age with at least 30 years of service, at age 55 with at least 25 years of service, or at age 60 with at least five years of service.
Members retiring from inactive status prior to the age of 65 may receive actuarially reduced benefits. PERS Plan 1 retirement benefits are actuarially reduced to reflect the choice of a survivor benefit. Other benefits include duty and non-duty disability payments, an optional cost-of-living adjustment (COLA), and a one-time duty-related death benefit, if found eligible by the Department of Labor and Industries.
Plan 2 (employment on or after October 1, 1977) members of PERS are eligible to retire with full benefits after five years of credited service and attainment of age 65 or after 20 years of credited service and attainment of age 55 with the benefit actuarially reduced from age 65. Plan 3 (employment on or after Oct 1, 1977) members of PERS are eligible to retire with full benefits after 10 years of credited service and attainment of age 65 or after 10 years of credited service and attainment of age 55 with benefits actuarially reduced from age 65. Average final compensation (AFC) for Plan 2 and 3 PERS members is the average compensation earnable of the highest consecutive sixty months of service credit months. The retirement allowance for PERS 2 members is the AFC multiplied by two percent per year of service with provision for a cost-of-living adjustment capped at three percent per year. For the defined benefit portion of Plan 3 PERS it is the AFC multiplied by one percent per year of service with provision for a cost-of-living adjustment.
Page 20

Plan Contributions
Under current law the employer must contribute 100 percent of the employer-required contribution. The employer contribution rates for Plans 1 and 2 for PERS are established by the Pension Funding Council based upon the rates set by the Legislature. The employee contribution rate for Plan 2 is also determined by the Legislature. However, the employee contribution rate for Plan 1 is set by statute at six percent and does not vary from year to year. The employer and employee contribution rates for Plan 2 are developed by the state actuary to fully fund these plans. The employer rates for Plan 1 are not necessarily adequate to fully fund the level established by the Legislature. The methods used to determine the contribution requirements are established under Chapters 41.34 and 41.40 RCW for PERS.
Plan 3 is a combination defined benefit, defined contribution plan. Employer contribution rates are established each biennium by the Legislature. The state actuary calculates the rates, the economic revenue forecast council adopts the rates, and the Legislature enacts the rates for the defined benefit portion of the plan. Employee rates are established each biennium by the Legislature as well. These rates fund the defined contribution portion of the plan. The employer and employee contribution rates for each of the PERS plans are effective as of the dates shown in the table. The pension plan contribution rates (expressed as a percentage of covered payroll) for 2018 and 2019 are listed below:
7/1/19 Rate 9/1/18 Rate PERS 1 Member Contribution Rate 6.00% 6.00% PERS 1 Employer Contribution Rate 12.86% 12.83% 7/1/19Rate 9/1/18 Rate PERS 2 Member Contribution Rate 7.90% 7.41% PERS 2 Employer Contribution Rate 12.86% 12.83% PERS 3 Member Contribution Rate varies varies PERS 3 Employer Contribution Rate 12.86% 12.83%
The Collective Net Pension Liability
The collective net pension liabilities for the pension plans WSIPC participated in are reported in the following tables.
The Net Pension Liability as of June 30, 2019 Dollars in Thousands PERS 1 PERS 2/3
Total Pension Liability $11,696,634 $43,503,168 Plan Fiduciary Net Position ($7,851,279) ($42,531,828) Participating employers’ net pension liability $3,845,355 $971,340
Plan fiduciary net position as a percentage of the total pension liability 67.12% 97.77%
WSIPC’s Proportionate Share of the Net Pension Liability (NPL)
At June 30, 2019, WSIPC reported a total liability of $3,133,685 for its proportionate shares of the individual plans’ collective net pension liability. WSIPC’s proportionate share of the collective net pension liability is based on annual contributions for each of the employers participating in the DRS administered plans. At June 30, 2019, WSIPC’s proportionate share of each plan’s net pension liability is reported below:
June 30, 2019 PERS 1 PERS 2/3 Annual Contributions $441,193 $645,467
Proportionate Share of the Net Pension Liability $2,366,035 $767,650
Page 21

At June 30, 2019, WSIPC’s percentage of the proportionate share of the collective net pension liability was as follows and the change in the allocation percentage from the prior year is illustrated below:
Change in Proportionate Shares PERS 1 PERS 2/3 Current year proportionate share of the Net Pension Liability 0.061530% 0.079030%
Prior year proportionate share of the Net Pension Liability 0.057645% 0.071320%
Net difference percentage 0.003884% 0.007710%
WSIPC has no independent ability to fund or satisfy this pension liability outside of Washington State’s legislatively adopted contribution rates, as they currently exist, or may be adopted in the future. Assessments now and in the future are made based upon the annual qualified worker compensation and are paid by both WSIPC, as the employer, and its employees. Actuarial Assumptions
Capital Market Assumptions (CMAs) and expected rates of return by asset class provided by the Washington State Investment Board. The Office of the State Actuary relied on the CMAs in the selection of the long-term expected rate of return for reporting purposes. The total pension liabilities were determined by actuarial valuation as of June 30, 2018, with the results rolled forward to June 30, 2019, using the following actuarial assumptions, applied to all prior periods included in the measurement: Mortality Rates
Mortality rates used in the plans were based on the RP-2000 Combined Healthy Table and Combined Disabled Table published by the Society of Actuaries. The Office of the State Actuary applied offsets to the base table and recognized future improvements in mortality by projecting the mortality rates using 100 percent Scale BB. Mortality rates are applied on a generational basis, meaning members are assumed to receive additional mortality improvements in each future year, throughout their lifetime. The actuarial assumptions used in the June 30, 2018, valuation were based on the results of OSA’s 2007–2012 Experience Study Report and the 2017 Economic Experience Study. Additional assumptions for subsequent events and law changes are current as of the 2018 actuarial valuation report.
Long-term Expected Rate of Return
The long-term expected rate of return on pension plan investments was determined using a building-block method in which a best-estimate of expected future rates of return (expected returns, net of pension plan investment expense, but including inflation) are developed for each major asset class by the Washington State Investment Board (WSIB). Those expected returns make up one component of WSIB’s CMAs. The CMAs contain three pieces of information for each class of assets the WSIB currently invest in:
Expected annual return Standard deviation of the annual return Correlations between the annual returns of each asset class with every other asset class
WSIB uses the CMAs and their target asset allocation to simulate future investment returns over various time horizons.
Inflation 2.75% total economic inflation, 3.50% salary inflation Salary increases In addition to the base 3.50% salary inflation assumption,
salaries are also expected to grow by promotions and longevity. Investment rate of return 7.40%
Page 22
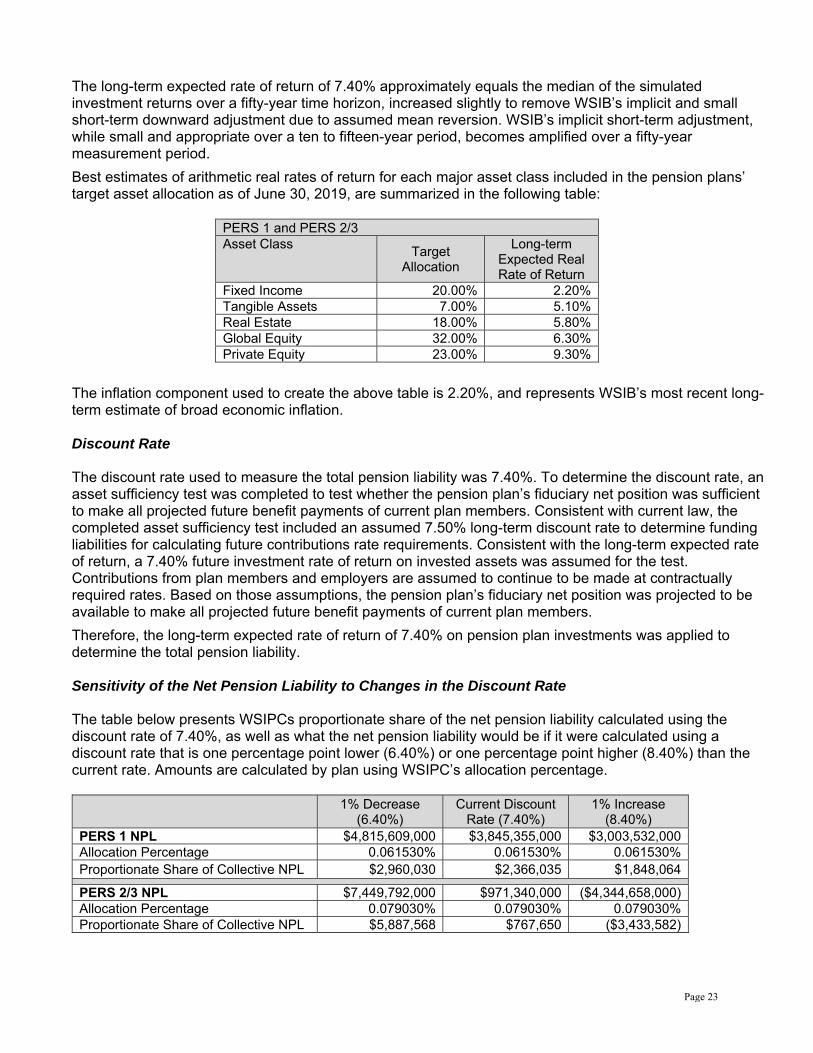
The long-term expected rate of return of 7.40% approximately equals the median of the simulated investment returns over a fifty-year time horizon, increased slightly to remove WSIB’s implicit and small short-term downward adjustment due to assumed mean reversion. WSIB’s implicit short-term adjustment, while small and appropriate over a ten to fifteen-year period, becomes amplified over a fifty-year measurement period.
Best estimates of arithmetic real rates of return for each major asset class included in the pension plans’ target asset allocation as of June 30, 2019, are summarized in the following table:
PERS 1 and PERS 2/3 Asset Class
Target Allocation
Long-term Expected Real Rate of Return
Fixed Income 20.00% 2.20% Tangible Assets 7.00% 5.10% Real Estate 18.00% 5.80% Global Equity 32.00% 6.30% Private Equity 23.00% 9.30%
The inflation component used to create the above table is 2.20%, and represents WSIB’s most recent long-term estimate of broad economic inflation. Discount Rate The discount rate used to measure the total pension liability was 7.40%. To determine the discount rate, an asset sufficiency test was completed to test whether the pension plan’s fiduciary net position was sufficient to make all projected future benefit payments of current plan members. Consistent with current law, the completed asset sufficiency test included an assumed 7.50% long-term discount rate to determine funding liabilities for calculating future contributions rate requirements. Consistent with the long-term expected rate of return, a 7.40% future investment rate of return on invested assets was assumed for the test. Contributions from plan members and employers are assumed to continue to be made at contractually required rates. Based on those assumptions, the pension plan’s fiduciary net position was projected to be available to make all projected future benefit payments of current plan members.
Therefore, the long-term expected rate of return of 7.40% on pension plan investments was applied to determine the total pension liability.
Sensitivity of the Net Pension Liability to Changes in the Discount Rate
The table below presents WSIPCs proportionate share of the net pension liability calculated using the discount rate of 7.40%, as well as what the net pension liability would be if it were calculated using a discount rate that is one percentage point lower (6.40%) or one percentage point higher (8.40%) than the current rate. Amounts are calculated by plan using WSIPC’s allocation percentage.
1% Decrease
(6.40%) Current Discount
Rate (7.40%) 1% Increase
(8.40%) PERS 1 NPL $4,815,609,000 $3,845,355,000 $3,003,532,000 Allocation Percentage 0.061530% 0.061530% 0.061530% Proportionate Share of Collective NPL $2,960,030 $2,366,035 $1,848,064
PERS 2/3 NPL $7,449,792,000 $971,340,000 ($4,344,658,000) Allocation Percentage 0.079030% 0.079030% 0.079030% Proportionate Share of Collective NPL $5,887,568 $767,650 ($3,433,582)
Page 23

Deferred Outflows of Resources and Deferred Inflows of Resources Related to Pensions
The Pension Plans reported collective Deferred Outflows of Resources and collective Deferred Inflows of Resources related to the individual plans. At August 31, 2019, WSIPC reported Deferred Outflows of Resources and Deferred Inflows of Resources related to pensions from the following sources:
PERS 1 Deferred Outflows
of Resources Deferred Inflows
of Resources Difference between expected and actual experiences Net difference between projected and actual earnings on pension plan investments
$158,071
Changes in assumptions or other inputs Changes in proportion and differences between contributions and proportionate share of contributions
Contributions subsequent to the measurement date $63,638
TOTAL $63,638 $158,071
PERS 2/3 Deferred Outflows
of Resources Deferred Inflows
of Resources Difference between expected and actual experiences $219,933 $165,040 Net difference between projected and actual earnings on pension plan investments
$1,117,385
Changes in assumptions or other inputs $19,657 $322,080 Changes in proportion and differences between contributions and proportionate share of contributions
$297,629 $60,658
Contributions subsequent to the measurement date $108,701
TOTAL $645,920 $1,665,164 $172,339 reported as Deferred Outflows of Resources related to pensions resulting from WSIPC contributions subsequent to the measurement date will be recognized as a reduction of the net pension liability in the year ending August 31, 2020. Other amounts reported as Deferred Outflows of Resources and Deferred Inflows of Resources related to pensions will be recognized in pension expense as follows:
Year ended August 31 PERS 1 PERS 2/3
2020 ($34,895) ($310,626) 2021 ($82,656) ($528,568) 2022 ($29,497) ($209,419) 2023 ($11,023) ($91,205) 2024 - ($31,009)
Thereafter - ($42,881) Pension Expense
WSIPC recognizes a pension expense for its proportionate share of the collective pension expense. This is determined by using WSIPC’s proportionate share of the collective net pension liability. For the year ending August 31, 2019, WSIPC recognized a total pension expense as follows:
PERS 1 PERS 2/3 TOTAL Pension expense $252,264 $92,023 $344,287
Page 24

Note 6: POST EMPLOYMENT BENEFIT PLANS OTHER THAN PENSION PLANS
457 Plan – Deferred Compensation Plan
WSIPC employees have the option of participating in an IRC, Section 457, deferred compensation plan administered by the state retirement system. The plan assets and all related income are held in trust for the exclusive benefit of the participants and their beneficiaries. The Washington State Department of Retirement Systems offers audited financial statements which provide more detailed information regarding the plan description, significant accounting policies and other information concerning the state’s deferred compensation plan. The report may be obtained at http://www.drs.wa.gov/administration/annual-report/cafr/. 403(b) Plan – Tax Sheltered Annuity (TSA)
WSIPC offers a tax deferred annuity plan for its employees. The plan permits participants to defer a portion of their salary until future years under the elective deferral (employee contribution method). WSIPC complies with IRS regulations that require school districts to have written plans to include participating investment companies, types of investments, loans, transfers, and various requirements. Plans are administered by third party administrators. The plan assets are assets of WSIPC employees, not WSIPC, and are therefore not reflected in these financial statements. WSIPC had no 403(b) participants as of the fiscal year ending August 31, 2019. Access to Other Post Employment Medical Benefits through the Washington State Health Care Authority (HCA) Washington State, through HCA, administers a defined benefit other post-employment (OPEB) plan. The Public Employees Benefits Board (PEBB) created under HCA is authorized to design benefits and determine the terms and conditions of employee and retired employee participation and coverage, including establishment of eligibility criteria for both active and retired employees. Eligible retirees and spouses are entitled to subsidies associated with postemployment medical benefits provided through PEBB.
The relationship between the PEBB OPEB plan and its employers and their employees and retirees is not formalized in a contract or plan document. Rather, the benefits are provided in accordance with a substantive plan. A substantive plan is one in which the plan terms are understood by the employers and plan members. This understanding is based on communications between HCA, employers and plan members, and the historical pattern of practice with regard to sharing of benefit costs.
Participation in the plan is administered by HCA as a single-employer defined benefit OPEB plan. No assets are accumulated in a trust that meets the criteria in paragraph 4 of Governmental Accounting Standards Board Statement No. 75 (GASB 75).
Valuation Date, Measurement Date, and Reporting Date The “valuation date” is July 1, 2018. This is the date as of which the census data is gathered and the actuarial valuation is performed. The “measurement date” is August 31, 2019. This is the date as of which the Total OPEB Liability is determined. Generally accepted accounting principles for OPEB allows a lag of up to one year between the measurement date and the reporting date. No adjustment is required between the measurement date and the reporting date. The “reporting date” is WSIPC’s fiscal year end of August 31, 2019.
Page 25

General Description Employers participating in the PEBB plan include the Washington state general government agencies, higher education institutions, K-12 school and educational service districts and political subdivisions. Additionally, the PEBB’s OPEB plan is available to retirees of K-12 entities who do not participate in PEBB for insurance for their active employees. RCW 41.05.085 provides that contribution requirements of participating employers and of plan members are established by and may be amended by the HCA Board of Directors. Participating employers and active plan members are required to contribute the established benefit rates. All K-12 entities contribute the same rate which is set annually as an amount per pro-rated FTE under RCW 28A.400.410. Employers do not have the ability to contribute additionally to funding against future liabilities or impact funding progress on the actuarially determined liability of the HCA OPEB plan. WSIPC’s established contribution to PEBB for retiree OPEB for the fiscal year ending August 31, 2019 under the required formula was $74,660. The PEBB OPEB plan provides healthcare insurance benefits (medical and dental) for retirees and their dependents. Retired members may only elect dental coverage if they have elected medical coverage. PEBB offers thirteen (13) medical plans and three (3) dental plans. All current and future retirees who elect medical and dental coverage are assumed to elect carriers based on the weighted average of selection of carriers by current PEBB retirees. Employees Covered by Benefit Terms. WSIPC employees are eligible for retiree medical benefits after becoming eligible for service retirement pension benefits (either reduced or full pension benefits) under Plan 2 or 3 of PERS (see Note 5):
Age 65 with 5 years of service for Plan 2 Age 55 with 20 years of service for Plan 2 Age 55 with 10 years of service for Plan 3
Former members who are entitled to a deferred vested pension benefit are not eligible to receive medical and life insurance benefits after pension benefit commencement. Survivors of covered members who die are eligible for medical benefits. At July 1, 2018, the following employees were covered by benefit terms:
Retirees or dependents currently receiving benefit payments 32 Active employees who may qualify for benefits upon retirement 87
It is not possible to determine the number of inactive employees entitled to, but not yet receiving benefit payments. Retiring employees apply for benefits at their discretion, may be otherwise working and not eligible for benefits or be deceased. This data is not monitored by WSIPC, HCA or the State of Washington.
Election Assumptions. 50% of employees are assumed to elect medical and dental benefits upon retirement. 45% of employees are assumed to enroll eligible dependents as of the retirement date. 100% of employees are assumed to enroll in Medicare, once eligible, after initial participation. Total OPEB Liability
WSIPC’s Total OPEB Liability of $3,113,905 and $4,205,218 was measured for the years ending August 31, 2018 and 2019, respectively, and was determined by an actuarial valuation as of the valuation date of July 1, 2018, calculated based on the discount rates discussed below, projected to the measurement dates. There have been no significant changes between the valuation date and the fiscal year end. If there were significant changes, an additional analysis or valuation might be required.
Page 26

Actuarial Assumptions and Other Inputs
The Total OPEB Liability in the July 1, 2018 actuarial valuation was determined using the following actuarial assumptions and other inputs, applied to all periods included in the measurement dates, unless otherwise specified.
Inflation. The inflation rate of 2.75% was developed by the Office of the State Actuary for PEBB and was applied to the measurement dates ending August 31, 2018 and 2019. Salary Increases. Salary assumptions reflect the assumptions used in the actuarial valuations for Washington State Public Employees’ Retirement System (PERS). Projected payroll increases have been assumed to be 3.5% which equals 0.75% real wage growth above inflation. Projected annual merit and longevity increases for PERS range from 6.0% for 0 years of service to 0.10% for 17 years of service. Discount Rate. The discount rate used to measure the Total OPEB Liability, as required by generally accepted accounting principles for the Actuarial Accrued Liability calculated using the Individual Entry Age Normal Cost Method, was based on the yield or index rate for 20-year Tax-Exempt General Obligation Municipal bonds with an average rating of AA/Aa or higher (Bond Buyer General Obligation 20-bond municipal index for bonds that mature in 20 years). Discount rate assumptions were 3.96% and 2.97% for the measurement dates of August 31, 2018 and 2019, respectively. Demographic Assumptions. Demographic assumptions regarding retirement, mortality, turnover, and marriage are based on assumptions used in the Office of the State Actuary’s actuarial valuation for Washington State PERS, modified for WSIPC.
Service retirement assumptions for plans 2 and 3 were used, which vary based on hire date and years of service.
The assumed rates of disability under PERS plans 2 and 3 are less than 0.1% for ages 50 and below and continue to be low after that; demographic assumptions assume a 0% disability rate for all ages.
Mortality assumptions for PERS were used (RP-2000 base mortality table, adjusted by -1 year for both males and females, with generational mortality adjustments using projection scale BB).
Healthcare Cost Trends. Healthcare cost trends used in the actuarial valuation were developed for use in the July 1, 2019 OPEB valuation for the PEBB program, to be performed by the Office of the State Actuary. These assumptions are summarized below and refer to the amount by which medical costs are anticipated to exceed costs for the year ending 2019:
Year Ending June 30, Pre-65 Retiree
Premiums & Claims Post-65 Retiree
Claims Post-65 Retiree
Premiums 2019 6.8% 3.6% 2.8% 2020-2095 6.3% to 4.5% 7.6% to 4.7% 12.5% to 4.7%
Dental costs trends are assumed to increase 1.1% to 4.0% for the year 2019-2026 and beyond. Healthcare cost trends reflect the impact of the excise tax for high cost or “Cadillac” health plans for 2022 and beyond, consistent with the current tax code in effect.
Page 27

Premium Levels. Assumed annual medical retiree contributions as of July 1, 2018, used in the actuarial valuation are displayed below. These represent a weighted average of 2018 PEBB retiree contributions by medical plan, based on overall PEBB current retiree medical plan election. Contribution assumptions exclude fees charged as a direct pass-through to participating retirees.
Employee or Spouse Non-Medicare Medicare
Weighted average based on current PEBB retirees $8,052.58 $3,180.06 The July 1, 2018 assumed annual dental retiree contributions for employee or spouse is $547.17, representing a weighted average of 2018 PEBB retiree contributions by dental plan, based on overall PEBB current retiree dental plan elections.
Actuarial Cost Method. The actuarial cost method used for determining the benefit obligations is the Entry Age Actuarial Cost Method. Under the principles of this method, the actuarial present value of the projected benefits of each individual included in the valuation is allocated as a level percentage of expected salary for each year of employment between entry age (defined as age at hire) and assumed exit (until maximum retirement age). The actuarial valuation for the Washington state OPEB plan offered through PEBB under administration of HCA can be found at http://leg.wa.gov/osa/additionalservices/Pages/OPEB.aspx
The actuarial valuation for the Washington State Public Employees’ Retirement System (PSERS) can be found in the Department of Retirement Systems annual Comprehensive Annual Financial Report (CAFR) at https://www.drs.wa.gov/administration/annual-report/default.htm
Claims Cost Assumptions Subsidies provided by PEBB and valued in the actuarial valuation include the following:
Explicit medical subsidy for post-65 retirees and spouses Implicit medical and dental subsidy
The explicit subsidies are monthly amounts paid per post-65 retirees and spouses. As of the valuation date, the explicit subsidy for post-65 retirees and spouses is the lessor of $150 or 50% of the monthly premiums. As of January 1, 2019, the subsidy was increased to $168 per month, and as of January 1, 2020, the subsidy will be increased to $183 per month. In 2019, retirees and spouses pay the premium minus $168 when the premium is over $336 per month and pay half the premium when the premium is lower than $336. The implicit medical subsidy is the difference between the total cost of medical benefits and premiums. For pre-65 retirees and spouses, the retiree pays the full premium amount, based on a pool that includes active employees. Active employees will tend to be younger and healthier than retirees on average and therefore can be expected to have lower average health costs. (For post-65 retirees and spouses, the retiree does not pay the full premium due to the explicit subsidy discussed above.) Under generally accepted accounting principles, the total cost of benefit payments is to be based on claims costs or age-adjusted premiums approximating claims costs. The projection of retiree premiums is based on current amounts for the retirees’ share of the premium, projected with the medical trend assumption, varied by age and sex. Implicit subsidies for dental coverage is also reflected in the actuarial valuation.
Page 28

Changes in the Total OPEB Liability The increase (decrease) in the Total OPEB Liability is detailed in the table below for the fiscal year ending August 31, 2019:
Total OPEB Liability as of August 31, 2018 $3,113,905 Changes for the year:
Service cost 114,230 Interest on Total OPEB Liability 126,415 Effect of plan changes - Effect of economic/demographic gains or losses 284,077 Effect of assumptions changes or inputs 638,998 Expected benefit payments (72,407)
Total OPEB Liability as of August 31, 2019 $4,205,218 Service cost represents the portion of the actuarial present value of expected benefit payments that is attributed to the valuation year. Changes in assumptions or inputs represents the change in the portion of changes in the Total OPEB Liability that is not immediately recognized in OPEB expense and includes differences between expected and actual experience, changes in assumptions, and differences between expected and actual earnings on plan investments. Expected benefit payments represent all benefits estimated to be payable through the OPEB plan to current active and inactive employees as a result of their past service and expected future service. This is the subsidy difference between the total cost of benefits and the portion of the benefits paid by the retirees. Per employee health costs vary depending on age, number of dependents and expected morbidity.
Sensitivity of the Total OPEB Liability to Changes in the Discount Rate The following presents WSIPC’s Total OPEB Liability, calculated using the discount rate of 2.97%, as well as what WSIPC’s Total OPEB liability would be if it were calculated using a discount rate that is one percentage point lower (1.97%) or one percentage point higher (3.97%) than the current rate: 1% Decrease
1.97% Discount Rate
2.97% 1% Increase
3.97% Total OPEB Liability as of August 31, 2019 $5,098,651 $4,205,218 $3,510,213
Sensitivity of the Total OPEB Liability to Changes in the Healthcare Cost Trend Rates The following presents the Total OPEB Liability of WSIPC, calculated using the current healthcare cost trend rates as well as what WSIPC’s Total OPEB Liability would be if it were calculated using trend rates that are one percentage point lower or one percentage point higher than the current trend rates: 1%
Decrease Current Trend
Rate 1% Increase Total OPEB Liability as of August 31, 2019 $3,399,070 $4,205,218 $5,283,404
Page 29

OPEB Expense and Deferred Outflows of Resource and Deferred Inflows of Resources Related to OPEB For the year ended August 31, 2019, WSIPC recognized OPEB expense of $323,617 as follows:
For the year ending August 31, 2019 Service cost $114,230 Interest on Total OPEB Liability 126,415 Effect of plan changes - Recognition of Deferred Inflows/Outflows of Resources Recognition of economic/demographic gains/losses 35,510 Recognition of assumption changes or inputs 47,461
OPEB Expense $323,617 WSIPC reported deferred outflows and inflows of resources as of the August 31, 2019 Measurement Date as follows:
Deferred Outflows of Resources
Deferred Inflows of Resources
Differences between expected and actual experience
248,567 -
Changes of assumptions or inputs 559,122 ($194,481)
Payments made subsequent to the Measurement Date
- -
Total $807,689 ($194,481) Amounts reported as deferred outflows of resources and deferred inflows of resources related to OPEB will be recognized in OPEB expense below. Additional future deferred outflows and inflows of resources may impact these numbers.
Measurement Period Ending August 31, 2020 $82,971 2021 82,971 2022 82,971 2023 82,971 2024 82,971 Thereafter $198,353
Note 7: RISK MANAGEMENT
WSIPC is a member of the Southwest Washington Risk Management Insurance Cooperative (Cooperative). This Cooperative provides property and casualty insurance coverage for its membership as authorized by Chapter 48.62 RCW. An agreement to form a pooling arrangement was made pursuant to the provisions of Chapter 39.34 RCW, the Interlocal Cooperation Act. The Cooperative was formed in September 1986 to pool their self-insured losses and jointly purchase insurance and administrative services. WSIPC joined the Cooperative effective September 1, 2003. WSIPC had no insurance claim settlements, individually or in aggregate, that exceeded coverage for fiscal years ending August 31, 2019, 2018, and 2017.
Page 30

The Cooperative purchases excess insurance coverage and provides related services, such as administration, risk management and claims administration. All coverage is on an occurrence basis. The Cooperative provides the following forms of group purchased insurance coverage for its members: Property, including owned buildings, automobiles and equipment, Equipment Breakdown, Commercial Crime, General Liability, Errors and Omissions Liability and Employment Practices Liability. Members are responsible for the first $1,000 of all property claims and the Cooperative is responsible for the next $250,000. There is no member deductible for liability claims. Excess insurance covers insured losses over $250,000 up to the limits of each policy. The Cooperative is a member of Washington Schools Risk Management Pool to obtain this excess insurance. The Cooperative also purchases additional excess crime coverage as well as required Public Official Bonds. The Commercial Crime coverage is subject to a per-occurrence deductible of $5,000. Members are responsible for $1,000 of that deductible amount for each claim. The Cooperative provides privacy and network liability coverage with a $1,000,000 limit subject to a $1,000 member deductible, along with Terrorism/Bioterrorism coverage. Cooperative members contract to automatically renew from year to year unless the member gives written notice of its election to terminate at least 180 days prior to August 31 of any year. Termination occurs on August 31. Even after termination, a member is still responsible for contributions to the Cooperative for any unresolved, unreported, and in-process claims for the period they were a signatory to the interlocal governmental agreement. The Cooperative is fully funded by its member participants. The Cooperative is governed by a board of directors which is comprised of one designated representative from each participating member. A five member executive committee is responsible for conducting the business affairs of the Cooperative. The financial statements and disclosures of the Cooperative may be obtained from the following address: Educational Service District 112 2500 NE 65th Avenue Vancouver, WA 98661-6812 WSIPC is a member of the Unemployment Compensation Pool (Pool) administered by Northwest ESD 189. The purpose of this Pool is to share the risk of unemployment compensation claims arising from previous employees of its members. The Pool is fully funded by member participants. Member participants pay a percentage of their employees’ wages. These contributions plus investment earnings pay for unemployment claims and for the administration of the fund. Financial statements and disclosures for the Pool can be obtained from the following address: Northwest Educational Service District 189 1601 R Avenue Anacortes, WA 98221
Page 31

Note 8: CHANGES IN LONG-TERM LIABILITIES
WSIPC operates as a proprietary fund. Accordingly, long-term liabilities are classified as business-type activities. During the year that ended August 31, 2019, the following changes occurred in long-term liabilities:
Business-Type Activities:
Beginning Balance 9/1/2018 Additions Reductions
Ending Balance
8/31/2019 Due Within One Year
Net Pension Liability $3,792,197 $658,512 $3,133,685 Net OPEB Liability 3,113,905 1,091,313 4,205,218 $86,268
Compensated Absences 773,759 101,869 34,146 841,482 390,063
Business-Type Activity Long-term Liabilities $7,679,861 $1,193,182 $692,658 $8,160,385 $476,331
Note 9: OTHER DISCLOSURES
Subsequent Events
In February 2020, the Governor of the State of Washington declared a state of emergency in response to the spread of the COVID-19 virus. In the weeks following the declaration, precautionary measures to slow the spread of the virus have been ordered. These measures include closing schools, colleges and universities, cancelling public events, and limiting gathering sizes. During this state of emergency, WSIPC has continued to provide software and support to school districts and educational service districts in Washington. However, as a result of the emergency measures and restrictions to gathering sizes, WSIPC’s Spring 2020 WASWUG conference was cancelled. WSIPC operations remain at normal levels with staff working from remote locations. At this time, there appears to be minimal financial impact to WSIPC’s financial position. The length of time these measures will be in place, and the full extent of the financial impact on WSIPC is unknown at this time.
Page 32

Washington School Information Processing Cooperative (WSIPC) Required Supplementary Information
PENSION PLANS
The Washington State Department of Retirement Systems (DRS), a department within the primary government of the state of Washington, prepares a stand-alone comprehensive annual financial report (CAFR) that includes financial statements and required supplementary information for each pension plan. The required supplementary information identified below is presented separately for each of the DRS plans that WSIPC participates in.
The amounts reported in the Schedules of WSIPC’s Contributions are determined as of WSIPC’s fiscal year ending August 31.
SCHEDULE OF WSIPC CONTRIBUTIONS Public Employees’ Retirement System (PERS) Plan 1
Last 10 Fiscal Years* 2015 2016 2017 2018 2019
Contractually required contribution $289,793 $351,277 $355,395 $392,695 $404,789 Contributions in relation to the contractually required contributions
$289,793 $351,277 $355,395 $392,695 $404,789
Contribution deficiency (excess) $ - $ - $ - $ - $ - WSIPC’s covered payroll $6,865,668 $7,242,228 $7,256,660 $7,689,668 $7,973,565 Contribution as a percentage of covered payroll 4.22% 4.85% 4.90% 5.11% 5.08%
*This schedule is to be built prospectively until it contains ten years of data.
SCHEDULE OF WSIPC CONTRIBUTIONS Public Employees’ Retirement System (PERS) Plan 2/3
Last 10 Fiscal Years* 2015 2016 2017 2018 2019
Contractually required contribution $352,639 $445,368 $461,341 $567,243 $606,432 Contributions in relation to the contractually required contributions
$352,639 $445,368 $461,341 $567,243 $606,432
Contribution deficiency (excess) $ - $ - $ - $ - $ - WSIPC’s covered payroll $6,751,189 $7,148,773 $7,162,216 $7,596,501 $7,973,565 Contribution as a percentage of covered payroll
5.22% 6.23% 6.44% 7.47% 7.61%
*This schedule is to be built prospectively until it contains ten years of data.
The amounts reported in the Schedules of WSIPC’s Proportionate Share of Net Pension Liability are determined as of the June 30 measurement date of the collective net pension liability.
SCHEDULE OF WSIPC’s PROPORTIONATE SHARE OF THE NET PENSION LIABILITY
Public Employees’ Retirement System (PERS) Plan 1 Last 10 Fiscal Years*
2015 2016 2017 2018 2019 WSIPC PERS 1 employer’s proportion of the net pension liability (percentage)
0.061455% 0.056059% 0.058411% 0.057645% 0.061530%
WSIPC PERS 1 employer’s proportionate share of the net pension liability (amount)
$3,214,668 $3,010,632 $2,771,665 $2,574,467 $2,366,035
WSIPC PERS 1 employer’s covered payroll $6,892,412 $6,551,460 $7,243,446 $7,556,693 $8,606,796 WSIPC PERS 1 employer’s proportionate share of the net pension liability (amount) as a percentage of its covered payroll
46.64% 45.95% 38.26% 34.07% 27.49%
Plan fiduciary net position as a percentage of the total pension liability
59.10% 57.03% 61.24% 63.22% 67.12%
*This schedule is to be built prospectively until it contains ten years of data.
Page 33

Washington School Information Processing Cooperative (WSIPC) Required Supplementary Information
SCHEDULE OF WSIPC’s PROPORTIONATE SHARE OF THE NET PENSION LIABILITY Public Employees’ Retirement System (PERS) Plan 2/3
Last 10 Fiscal Years* 2015 2016 2017 2018 2019 WSIPC PERS 2/3 employer’s proportion of the net pension liability (percentage)
0.076314% 0.069807% 0.072925% 0.071320% 0.079030%
WSIPC PERS 2/3 employer’s proportionate share of the net pension liability (amount)
$2,726,743 $3,514,737 $2,533,804 $1,217,731 $767,650
WSIPC PERS 2/3 employer’s covered payroll
$6,771,600 $6,466,247 $7,149,596 $7,458,722 $8,587,644
WSIPC PERS 2/3 employer’s proportionate share of the net pension liability (amount) as a percentage of its covered payroll
40.27% 54.36% 35.44% 16.33% 8.94%
Plan fiduciary net position as a percentage of the total pension liability
89.20% 85.82% 90.97% 95.77% 97.77%
*This schedule is to be built prospectively until it contains ten years of data.
The amounts reported in the Schedules of Investment Returns are determined as of the June 30 measurement date.
SCHEDULE OF INVESTMENT RETURNS
Public Employees’ Retirement System (PERS) Plan 1 Last 10 Fiscal Years*
2015 2016 2017 2018 2019 Annual money-weighted rate of return, net of investment expense
4.45% 2.19% 13.84% 9.55% 8.68%
*This schedule is to be built prospectively until it contains ten years of data.
SCHEDULE OF INVESTMENT RETURNS
Public Employees’ Retirement System (PERS) Plan 2/3 Last 10 Fiscal Years*
2015 2016 2017 2018 2019 Annual money-weighted rate of return, net of investment expense
4.63% 2.47% 14.11% 9.56% 8.89%
*This schedule is to be built prospectively until it contains ten years of data.
Page 34

Washington School Information Processing Cooperative (WSIPC) Required Supplementary Information
POST EMPLOYMENT BENEFIT PLANS OTHER THAN PENSION PLANS
GASB No. 75 Accounting and Financial Reporting for Postemployment Benefits Other than Pensions (GASB 75) governs the specifics of accounting for public OPEB plan obligations for participating employers.
The amounts reported in the Schedules of Changes in Total OPEB Liability and Related Ratios are determined as of WSIPC’s fiscal year ending August 31.
SCHEDULES OF CHANGES IN TOTAL OPEB LIABILITY AND RELATED RATIOS Last 10 Fiscal Years*
2018 2019 Service Cost $126,426 $114,230 Interest on total OPEB Liability 115,538 126,415 Changes in benefit terms - - Effect of economic/demographic gains or (losses) - 284,077 Effect of assumption changes or inputs (259,309) 638,998 Expected benefit payments (67,424) (72,407)
Net change in total OPEB liability ($84,769) $1,091,313
Total OPEB Liability, beginning balance $3,198,674 $3,113,905 Total OPEB Liability, ending balance $3,113,905 $4,205,218
Covered employee payroll $7,727,193 $8,089,866 Total OPEB Liability as a percentage of covered payroll 40.30% 51.98%
*This schedule is to be built prospectively until it contains ten years of data.
Note 6 to the financial statements includes information regarding factors that may affect trends in the amounts reported in these schedules.
NOTES TO THE REQUIRED SUPPLEMENTARY INFORMATION
Note 1: Changes in Benefit Terms
There were no changes of benefit terms for the Pension Plans or OPEB Plan.
Note 2: Changes of Assumptions
There were no changes of assumptions for the Pension Plans. Changes of assumptions and other inputs related to OPEB reflect the effects of changes in the discount rate each period.
Note 3: Assets Accumulated in a Trust
There were no assets accumulated in a trust that meet the criteria in Paragraph 4 of GASB 75 to pay related benefits.
Page 35
Office of the Washington State Auditor
ABOUT THE STATE AUDITOR’S OFFICE
The State Auditor’s Office is established in the state’s Constitution and is part of the executive
branch of state government. The State Auditor is elected by the citizens of Washington and serves
four-year terms.
We work with our audit clients and citizens to achieve our vision of government that works for
citizens, by helping governments work better, cost less, deliver higher value, and earn greater
public trust.
In fulfilling our mission to hold state and local governments accountable for the use of public
resources, we also hold ourselves accountable by continually improving our audit quality and
operational efficiency and developing highly engaged and committed employees.
As an elected agency, the State Auditor’s Office has the independence necessary to objectively
perform audits and investigations. Our audits are designed to comply with professional standards
as well as to satisfy the requirements of federal, state, and local laws.
Our audits look at financial information and compliance with state, federal and local laws on the
part of all local governments, including schools, and all state agencies, including institutions of
higher education. In addition, we conduct performance audits of state agencies and local
governments as well as fraud, state whistleblower and citizen hotline investigations.
The results of our work are widely distributed through a variety of reports, which are available on
our website and through our free, electronic subscription service.
We take our role as partners in accountability seriously, and provide training and technical
assistance to governments, and have an extensive quality assurance program.
Contact information for the State Auditor’s Office
Public Records requests [email protected]
Main telephone (564) 999-0950
Toll-free Citizen Hotline (866) 902-3900
Website www.sao.wa.gov
Page 36