
THURSTON COUNTY WASHINGTON › auditor › financedocuments... · 2 days ago · The Office of the...
280
Transcript of THURSTON COUNTY WASHINGTON › auditor › financedocuments... · 2 days ago · The Office of the...


THURSTON COUNTY WASHINGTON
COMPREHENSIVE ANNUAL
FINANCIAL REPORT
FOR YEAR ENDED DECEMBER 31, 2019

Contributors Auditor’s Office Mary Hall – Thurston County Auditor Darren Bennett, CPA – Financial Services Manager Ron Hoene, CPA – Senior Financial Analyst Julia Carruth – Business Applications Administrator Corey Arndt – Financial Analyst Kathy Goulet – Financial Analyst Olivia Oudman – Financial Analyst Maggie Baker – Accounting Analyst Shanin Brennan – Accounting Analyst Treasurer’s Office Jeff Gadman – Thurston County Treasurer Ann Lundeen – Chief Accountant Additional assistance provided by all County fiscal personnel. Cover Photo by Kathy Goulet

i
THURSTON COUNTY COMPREHENSIVE ANNUAL FINANCIAL REPORT
TABLE OF CONTENTS Fiscal Year Ended December 31, 2019
I. INTRODUCTORY SECTION: Page
Letter of Transmittal 1
Certificate of Achievement for Excellence in Financial Reporting 8
Organizational Chart 9
Elected Officials 10
II. FINANCIAL SECTION: Independent Auditor’s Opinion 11
Management Discussion and Analysis 15
Basic Financial Statements: Government Wide Financial Statements
Statement of Net Position 36
Statement of Activities 38
Fund Financial Statements:
Balance Sheet – Governmental Funds 41
Reconciliation of the Balance Sheet of Governmental Funds
To The Statement of Net Position 42
Statement of Revenues, Expenditures and Changes in Fund
Balances – Governmental Funds 43
Reconciliation of the Statement of Revenues, Expenditures, and
Changes in Fund Balances of Governmental Funds to the
Statement of Activities 44
General Fund Statement of Revenues, Expenditures, and Changes
In Fund Balance – Budget (GAAP Basis) and Actual 45
Statement of Revenue, Expenditures, and Changes in Fund Balance –
Budget (GAAP Basis) and Actual – Other Major Funds 52
Statement of Net Position – Proprietary Funds 56
Reconciliation of the Statement of Net Position of Proprietary
Funds to the Statement of Net Position 58
Statement of Revenues, Expenses, and Changes in Fund
Net Position – Proprietary Funds 59
Reconciliation of the Statement of Revenues, Expenses, and
Changes in Fund Net Position of Proprietary Funds to the
Statement of Activities 60

ii
Statement of Cash Flows – Proprietary Funds 61
Statement of Fiduciary Net Position – Fiduciary Funds 63
Statement of Changes in Fiduciary Net Position – Fiduciary Funds 64
Notes to the Financial Statements 65
Required Supplementary Information
Schedule of Proportionate Share of the Net Pension Liability - By Plan 129
Schedule of Employer Contributions - By Plan 134
Changes in Total OPEB Liability – PEBB 138
Combining and Individual Fund Statements and Schedules:
Nonmajor Governmental Funds:
Combining Balance Sheet Nonmajor Governmental Funds 141
Combining Statement of Revenues, Expenditures and Changes in Fund
Balances Nonmajor Governmental Funds 142
Description of Nonmajor Special Revenue Funds 143
Combining Balance Sheet Nonmajor Special Revenue Funds 145
Combining Statement of Revenues, Expenditures and Changes in
Fund Balances Nonmajor Special Revenue Funds 151
Schedule of Revenues, Expenditures, and Changes in Fund Balance-Budget
(GAAP Basis) and Actual Nonmajor Special Revenue Funds 157
Nonmajor Debt Service Funds:
Description of Nonmajor Debt Service Funds 181
Combining Balance Sheet Nonmajor Debt Service Funds 182
Combining Statement of Revenues, Expenditures, and Changes in Fund
Balances Nonmajor Debt Service Funds 183
Schedule of Revenues, Expenditures, and Changes in Fund Balance-Budget
(GAAP Basis) and Actual Nonmajor Debt Service Funds 184
Nonmajor Capital Project Funds:
Description of Nonmajor Capital Project Funds 188
Combining Balance Sheet Nonmajor Capital Project Funds 189
Combining Statement of Revenues, Expenditures, and Changes in Fund
Balances Nonmajor Capital Project Funds 191
Schedule of Revenues, Expenditures, and Changes in Fund Balance-Budget
(GAAP Basis) and Actual Nonmajor Capital Project Funds 193
Nonmajor Enterprise Funds:
Description of Nonmajor Enterprise Funds 201
Combining Statement of Net Position Nonmajor Enterprise Funds 202
Combining Statement of Revenues, Expenses, and Changes in Fund
Net Position Nonmajor Enterprise Funds 204
iii
Combining Statement of Cash Flows Nonmajor Enterprise Funds 206
Internal Service Funds:
Description of Internal Service Funds 211
Combining Statement of Net Position Internal Service Funds 212
Combining Statement of Revenues, Expenses, and Changes in Fund
Net Position Internal Service Funds 214
Combining Statement of Cash Flows Internal Service Funds 216
Fiduciary Funds:
Description of Fiduciary Funds 221
Combining Statement of Fiduciary Net Position Fiduciary Funds 222
Combining Statement of Changes in Fiduciary Net Position Fiduciary Funds 227
Other Supplementary Information:
Description of Nonmajor Special Revenue Subsidiary Funds 233
Schedule of Revenues, Expenditures, and Changes in Fund Balance – Budget
(GAAP Basis) And Actual - Subfunds 234
III. STATISTICAL SECTION Statistical Section Overview 239
Net Position by Component 240
Changes in Net Position 242
Fund Balances, Governmental Funds 246
Changes in Fund Balances, Governmental Funds 248
Property Tax Revenue Base Information 252
Revenue Rate Information Property Tax Levy Rate - Direct and Overlapping 253
Principal Tax Payers 254
Property Tax Levies and Collections 255
Legal Debt Margin Information 256
Total Outstanding Debt Information 257
Ratio of Net General Obligation Bonded Debt to Assessed Value 258
Computation of Direct and Overlapping Bonded Debt General Obligation Bonds 259
Demographic and Economic Information 260
Principal Employers 261
Government Employment Information
Authorized Thurston County Positions by Function 262
Operating Indicators by Function/Program 264
Capital Asset Information 268

iv
This Page Intentionally Left Blank
Mary Hall
Auditor June 30, 2020 To the Honorable Board of Commissioners and Citizens of Thurston County: As required by state law (Chapter 36.22 of the Revised Code of Washington), we submit the Comprehensive Annual Financial Report (CAFR) of Thurston County for the fiscal year ended December 31, 2019. The financial statements conform to generally accepted accounting principles (GAAP) and independent auditors from the Office of the Washington State Auditor have audited the statements in accordance with generally accepted auditing standards. The CAFR consists of management’s representations concerning the finances of the County. The responsibility for providing accurate and complete data for the CAFR rests with the management of Thurston County. Thurston County has established internal controls to provide a reasonable basis for making these representations. Internal controls are designed to protect assets from loss, theft, or misuse, and to compile information for the preparation of the County’s financial statements in conformity with GAAP. The County’s internal controls provide reasonable assurance that the financial statements will be free from material misstatements. The Office of the Washington State Auditor conducts an audit of Thurston County’s financial statements every year, as required by state law. The independent audit provides reasonable assurance the financial statements of the County for the fiscal year end are free from material misstatement. The audit examines evidence supporting the amounts and disclosures in the financial statements and assessing the overall financial statement presentation. The independent auditor concludes a reasonable basis exists for providing an unmodified opinion that Thurston County’s financial statements for fiscal year ended December 31, 2019, conform to GAAP. The independent auditor’s opinion can be found in the first part of the CAFR’s financial section.
Thurston County, Washington 2019
1

Federal law also requires the County undergo an annual single audit (Single Audit Act of 1984 and U.S. Office of Management and Budget). The Office of the Washington State Auditor will issue a Single Audit Report with information about this audit, including:
• The schedule of expenditures of federal awards and state/local financial assistance; • Findings and recommendations; and • Reports on the internal controls and compliance.
For new grants awarded on or after December 26, 2014, the County has new reporting requirements (Uniform Administrative Requirements, Cost Principles, and Audit Requirements for Federal Awards, part 200 of the Electronic Code of Federal Regulations). GAAP requires certain information come with the basic financial statements in the form of Management’s Discussion and Analysis (MD&A). This letter of transmittal complements and should be read with the MD&A which immediately follows the independent auditor’s report in this report. Profile of Thurston County Thurston County, Washington is located at the southern end of Puget Sound in the beautiful Pacific Northwest. Majestic Mount Rainier and the rugged Cascade Mountains are nearby to the east, while Washington's Pacific Ocean coast lies just an hour's drive to the west. Thurston County is 60 miles south of Seattle, Washington and 100 miles north of Portland, Oregon. Of the 285,800 residents in Thurston County, approximately 142,605 reside in incorporated cities and 143,195 live in unincorporated areas of the County. Thurston County ranks sixth in population among Washington’s 39 counties and stands out as one of the fastest growing counties in the Pacific Northwest. Thurston County is a statute county, meaning state statute prescribes the organization of the county. The three-member Board of County Commissioners (BoCC) acts as the County’s legislative body. Other elected officials include the County Assessor, Auditor, Clerk, Coroner, Prosecuting Attorney, Sheriff and Treasurer. The County also has eight elected Superior Court Judges and three elected District Court Judges. These officials govern the County and create policies based on the community’s needs. The Board of County Commissioners appoints a County Manager who acts as the Chief Administrative Officer of the County and oversees non-elected offices and departments. The County provides a range of services, including public safety, public works, planning and economic development, public health and social services, county parks and fairgrounds, and general administrative services.
Thurston County, Washington 2019
2

The County’s budget guides its financial planning. State law (RCW 36.40) establishes the general requirements of Thurston County’s budget process. Office and department heads can move funds within their office or department, but only the County Manager can approve moving funds between offices and departments. All elected officials and department managers have access to detailed online reports to compare current budgets to actual revenue and spending. Review of each office and department’s budget status occurs every month. Offices and departments that want changes to their budgets must submit requests to the County Auditor’s Office quarterly and then to the County Manager and BoCC. Only the BoCC can approve budget increases. The BoCC creates a two-year budget plan in September of even numbered years. They must approve a final budget no later than the close of the fiscal year. After approving the budget, the Auditor’s Office monitors the budget at the office or department level for the County’s General Fund and at the fund-level for all other funds with a required appropriated budget. Approval for the acquisition, construction, or major renovation of capital items occurs in accordance with a long-term capital plan. Local Economy In December 2019, a novel coronavirus known as SARS-CoV-2 was first detected in Wuhan, China, causing outbreaks of the disease (now known as COVID-19) to spread globally. On March 1st, 2020, the President of the United States declared a national emergency in response to this outbreak. COVID-19 has impacted the national, state and local economies in many negative ways. Due to this pandemic, many local economies are feeling the impacts as they are bracing themselves as the country heads into a recession. COVID-19 has resulted in many social distancing measures to be implemented at a national level and many states have activated “stay-at-home” orders. Due to these orders, many businesses have closed their doors leaving people without jobs. Future economic forecasts are difficult to predict at this moment. It is anticipated that local governments will see a significant decrease in tax revenues resulting from the sudden halt in today’s economy. Any forecasts mentioned throughout this letter are based on statistics collected pre-COVID-19. As time goes on, Thurston County will gain more visibility of future economic predictions, however, as of right now it is too difficult to assess the total damage to Thurston County’s economy. Because of Thurston County’s location as the mid-point between Portland and Seattle along the I-5 corridor, the County has solid infrastructure with access to the entire state and West Coast. This infrastructure includes vibrant communities, new industrial and commercial business areas, beautiful parks and open spaces, and strong centers of business activity. Thurston County offers employers a strong workforce. As of 2019, most Thurston County residents age 25 and older (94 percent) graduated high school, which compares favorably with 91 percent of Washington’s residents and 90 percent of U.S. residents. Over the same time period, those with a bachelor’s degree or higher made up 46 percent of Thurston County residents age 25 and older compared to 45 percent of state residents and 36 percent of U.S. residents.
Thurston County, Washington 2019
3

Thurston County has seen a big shift in its economy in recent years. While government accounts for over 25 percent of its workforce, other leading industries include retail trade (10.6 percent), health care and social assistance (11.6 percent), and accommodation and food services (6.6 percent). In 2018, Thurston County experienced a 2.9 percent growth in employment over 2017. Thurston County has seen a steady increase in the workforce for 7 consecutive years.
Between 2009 and 2019, Thurston County’s population increased by 13.3 percent. Much of the growth comes from the Seattle–Tacoma metropolitan area. The County attracts new residents because of good schools and lower housing costs than nearby King and Pierce Counties.
The 2019 average annual unemployment rate in Thurston County increased slightly to 5.0 percent, up from 4.8 percent in 2018 and 5.0 percent in 2017. The 2019 statewide unemployment rate was 4.3 percent. In 2018 the most recent job forecast for Thurston County expects the County to add approximately 7,000 new jobs by 2020. The same forecast expects 18,000 new jobs by 2025. It is expected that job growth will be much less than originally forecasted as a result of the COVID-19 pandemic.
The median household income in Thurston County in 2018 was $74,718 compared to $73,294 in the state and $61,937 for the nation. The County ranked 11th for per capita income in Washington State at $51,684 in 2018. Both the state and nation had a higher per capita income at $62,026 and $54,446, respectively. The percent of the County’s population below the official poverty rate in 2018 was 8.7 percent, compared to the state’s rate of 10.3 percent and the nation at 11.8 percent.
Since the fallout of the Great Recession of 2008/09, the housing market, based on issuance of building permits, has remained relatively flat. However, the number of building permits issued in 2019 was 2,622, or 4.7 percent fewer than just one year earlier. During 2018 the Total Taxable Retail Sales across all industries was $5.7 billion. This represents a sizable increase of 9.6% over 2017. The Retail Trade Industry represents $3 billion or 52.6% of total Taxable Sales in the County. The average home price in 2018 was $340,193. This was an increase of 10.3 percent compared to 2017 and was the sixth consecutive year home prices have increased. Previously, it had not increased since 2007, the peak of the housing market. The pace of home sales in 2018 increased over the prior year, with the average home on the market for 30 days versus 38 in 2017. This represents the sixth straight year of a decrease in this statistic. During 2018, the number of homes sold in Thurston County decreased to 5,014 compared to 5,633 in 2017. This represents a decrease of nearly 11 percent. The housing affordability index, a measure of the financial ability of families to buy a house, was at 127.0 for 2019 compared to 139.4 for 2018. An index of 100 indicates a balance between a family’s ability to pay and cost. Higher indexes indicate more affordable housing, lower indexes mean less affordable housing. Thurston County’s housing affordability index number has fluctuated quite a bit in the past several years with a low of 104.8 in 2007 and a high of 198.2 in 2013.
Thurston County, Washington 2019
4
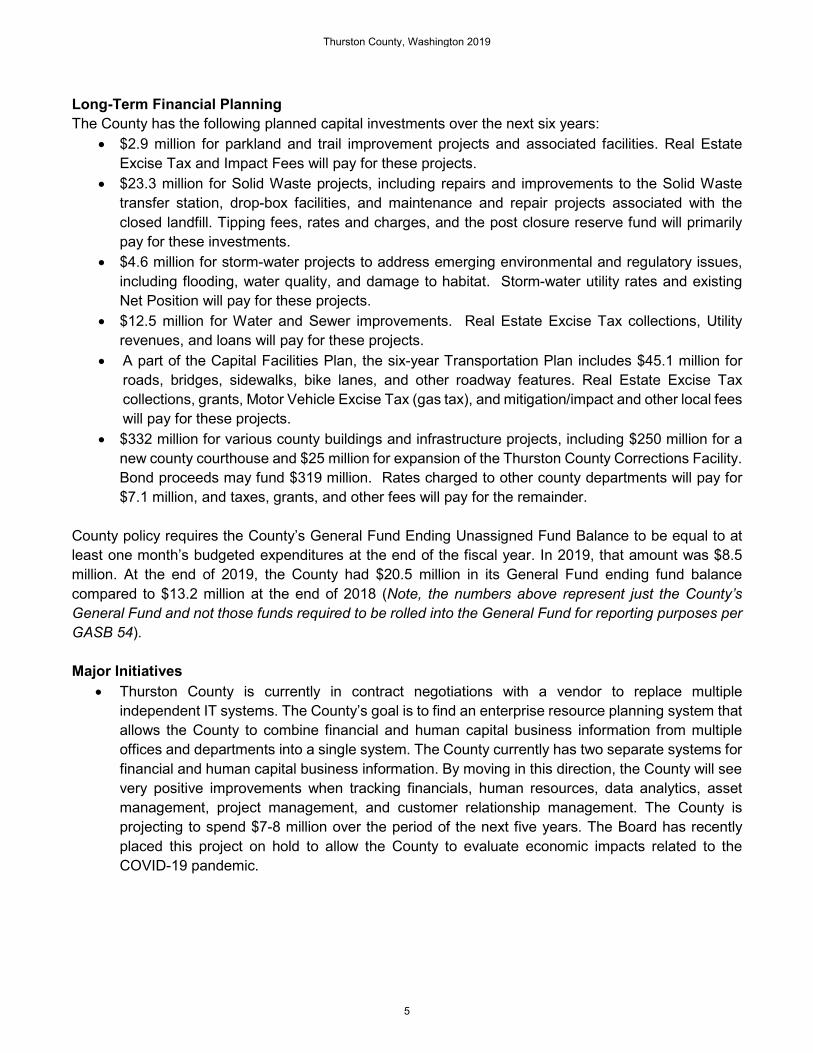
Long-Term Financial Planning The County has the following planned capital investments over the next six years:
• $2.9 million for parkland and trail improvement projects and associated facilities. Real Estate Excise Tax and Impact Fees will pay for these projects.
• $23.3 million for Solid Waste projects, including repairs and improvements to the Solid Waste transfer station, drop-box facilities, and maintenance and repair projects associated with the closed landfill. Tipping fees, rates and charges, and the post closure reserve fund will primarily pay for these investments.
• $4.6 million for storm-water projects to address emerging environmental and regulatory issues, including flooding, water quality, and damage to habitat. Storm-water utility rates and existing Net Position will pay for these projects.
• $12.5 million for Water and Sewer improvements. Real Estate Excise Tax collections, Utility revenues, and loans will pay for these projects.
• A part of the Capital Facilities Plan, the six-year Transportation Plan includes $45.1 million for roads, bridges, sidewalks, bike lanes, and other roadway features. Real Estate Excise Tax collections, grants, Motor Vehicle Excise Tax (gas tax), and mitigation/impact and other local fees will pay for these projects.
• $332 million for various county buildings and infrastructure projects, including $250 million for a new county courthouse and $25 million for expansion of the Thurston County Corrections Facility. Bond proceeds may fund $319 million. Rates charged to other county departments will pay for $7.1 million, and taxes, grants, and other fees will pay for the remainder.
County policy requires the County’s General Fund Ending Unassigned Fund Balance to be equal to at least one month’s budgeted expenditures at the end of the fiscal year. In 2019, that amount was $8.5 million. At the end of 2019, the County had $20.5 million in its General Fund ending fund balance compared to $13.2 million at the end of 2018 (Note, the numbers above represent just the County’s General Fund and not those funds required to be rolled into the General Fund for reporting purposes per GASB 54). Major Initiatives
• Thurston County is currently in contract negotiations with a vendor to replace multiple independent IT systems. The County’s goal is to find an enterprise resource planning system that allows the County to combine financial and human capital business information from multiple offices and departments into a single system. The County currently has two separate systems for financial and human capital business information. By moving in this direction, the County will see very positive improvements when tracking financials, human resources, data analytics, asset management, project management, and customer relationship management. The County is projecting to spend $7-8 million over the period of the next five years. The Board has recently placed this project on hold to allow the County to evaluate economic impacts related to the COVID-19 pandemic.
Thurston County, Washington 2019
5

• The County hired a consulting firm to identify building options for a new county courthouse. The current courthouse facility was built in the 1970’s which is approaching the end of its useful life and has little space to meet expected growth projections. Estimates for a new facility have the cost as high as $250 million. The Capital Facilities Plan lists the sale of bonds as the main funding source. The Board of County Commissioners voted 2-1 to add a ballot proposition to increase the levy of the regular property tax to fund a new courthouse during the April, 2020 election, however, due to the COVID-19 pandemic this election has been postponed to a future date. The ballot requires a simple majority to pass. In 2016, the state legislature passed a bill to increase the maximum lid lift from 9 years to 25 years in which the County may raise its property tax growth limit to repay bond debt.
• Information technology enables the County to function and operate effectively. Investments in IT can result in longer-term gains in effectiveness and efficiency. As a result, Thurston County has created an independent IT department that no longer fall within its Central Services department. The new IT department will continue work of the IT Strategic Plan, including development of the comprehensive Information Technology Plan. The County has established a cybersecurity task force to implement the protections needed to secure county operations.
• The Thurston County Corrections Facility (TCCF) was planned and designed to be built in phases as detention needs changed over time. In 2016, the Board authorized a $13 million project to expand detention space and improve storm-water management. This will be paid from bonds financed under REET 1 (Real Estate Excise Tax). In 2018, it was brought to the Board’s attention that additional financing capacity exists in REET 1. After some deliberations, the Board agreed to expand the scope to enable the County to add at least one courtroom at the TCCF, increasing the overall maximum budget to $25 million. This will greatly improve operational efficiency for both the Courts and Corrections. The Board has recently placed this project on hold to allow the County to evaluate economic impacts related to the COVID-19 pandemic.
Relevant Financial Policies The County has comprehensive financial policies and procedures and revises them as needed. The Financial Management Committee, made up of the Auditor, Treasurer, and County Manager, reviews these policies, which provide guidance for strong management of the County’s resources and finances. The County applies these policies consistently. Awards and Acknowledgements The Government Finance Officers Association of the United States and Canada (GFOA) awarded a Certificate of Achievement for Excellence in Financial Reporting to Thurston County for its CAFR for the fiscal year ended December 31, 2018. Thurston County has received this prestigious award for thirteen consecutive years. In order to receive a Certificate of Achievement, the county must publish an easily readable and efficiently organized CAFR. This report must satisfy both GAAP and related legal requirements.
Thurston County, Washington 2019
6

A Certificate of Achievement is valid for a period of one year. We believe our current financial report meets the Certificate of Achievement Program’s requirements and we will submit it to the GFOA to determine eligibility for another certificate. Thank you to those who have devoted their time to preparing this report, especially the Financial Services staff in the Thurston County Auditor’s office and the Thurston County Treasurer’s office. I also recognize the great efforts of the State Auditor’s Office in their audit, and the help and advice they provide us. Finally, thanks to the BoCC for their continued support and their tireless efforts in support of the community. Respectfully Submitted, Mary Hall Thurston County Auditor
Thurston County, Washington 2019
7
Thurston County, Washington 2019
8

THURSTON COUNTY ORGANIZATION CHART
Emergency Services
Emergency Management Medic One
Pretrial Services
Public Defense
Human Resources
Personnel Payroll & Benefits Risk Management Labor Relations
Training Board of Equalization
Central Services
Facility Maintenance Mail Services & Records
Purchasing Fleet Operations Capital Projects
Information Technology
Application, Desktop and Network Support
Geodata
Public Health & Social Services
Public Health Social Services
Environmental Health Housing & Community
Renewal Veteran’s Assistance Treatment Sales Tax
Community Planning and Economic Development
Permitting Services Compliance
Extension Services Community Planning Natural Resources,
Conservation, Water and Hazard Planning
Growth Management Regional Sustainability Thurston County Fair
Public Works
Road Maintenance & Traffic Safety
Garbage & Recycling Water & Sewer Utilities
Stormwater Utilities Noxious Weed &
Lakes Management Parks & Trails
Planning & Construction Permits & Right-of Way
Citizens
Assessor
Clerk
District Court
Sheriff
Treasurer
Auditor
Coroner
Prosecuting Attorney
Superior Court
Board of County Commissioners
County Manager
Juvenile Court and Probation
Superior Court
District Court Probation
Community Relations Office Budget Office
Thurston County, Washington 2019
9

Elected Officials December 31, 2019 Thurston County Board of Commissioners Honorable John Hutchings, District One Honorable Gary Edwards, District Two Honorable Tye Menser, District Three Honorable Steven J Drew, Assessor Honorable Mary Hall, Auditor Honorable Linda Myhre-Enlow, Clerk Honorable Gary Warnock, Coroner Honorable Jon Tunheim, Prosecuting Attorney Honorable John Snaza, Sheriff Honorable Jeff Gadman, Treasurer District Court Judges Honorable M. Brett Buckley Honorable Samuel Meyer Honorable Kalo Wilcox Superior Court Judges Honorable Anne Hirsch
Honorable Carol Murphy Honorable James J Dixon
Honorable Erik D. Price Honorable Christine Schaller Honorable Mary Sue Wilson
Honorable John Skinder Honorable Chris Lanese
Thurston County, Washington 2019
10

Office of the Washington State Auditor
Pat McCarthy
INDEPENDENT AUDITOR’S REPORT ON FINANCIAL STATEMENTS
June 26, 2020
Board of Commissioners
Thurston County
Olympia, Washington
REPORT ON THE FINANCIAL STATEMENTS
We have audited the accompanying financial statements of the governmental activities, the business-
type activities, each major fund and the aggregate remaining fund information of Thurston County, as
of and for the year ended December 31, 2019, and the related notes to the financial statements, which
collectively comprise the County’s basic financial statements as listed in the table of contents.
Management’s Responsibility for the Financial Statements
Management is responsible for the preparation and fair presentation of these financial statements in
accordance with accounting principles generally accepted in the United States of America; this includes
the design, implementation, and maintenance of internal control relevant to the preparation and fair
presentation of financial statements that are free from material misstatement, whether due to fraud or
error.
Auditor’s Responsibility
Our responsibility is to express opinions on these financial statements based on our audit. We conducted
our audit in accordance with auditing standards generally accepted in the United States of America and
the standards applicable to financial audits contained in Government Auditing Standards, issued by the
Comptroller General of the United States. Those standards require that we plan and perform the audit to
obtain reasonable assurance about whether the financial statements are free from material misstatement.
An audit involves performing procedures to obtain audit evidence about the amounts and disclosures in
the financial statements. The procedures selected depend on the auditor’s judgment, including the
assessment of the risks of material misstatement of the financial statements, whether due to fraud or
error. In making those risk assessments, the auditor considers internal control relevant to the County’s
preparation and fair presentation of the financial statements in order to design audit procedures that are
Thurston County, Washington 2019
11

appropriate in the circumstances, but not for the purpose of expressing an opinion on the effectiveness
of the County’s internal control. Accordingly, we express no such opinion. An audit also includes
evaluating the appropriateness of accounting policies used and the reasonableness of significant
accounting estimates made by management, as well as evaluating the overall presentation of the financial
statements.
We believe that the audit evidence we have obtained is sufficient and appropriate to provide a basis for
our audit opinions.
Opinions
In our opinion, the financial statements referred to above present fairly, in all material respects, the
respective financial position of the governmental activities, the business-type activities, each major fund
and the aggregate remaining fund information of Thurston County, as of December 31, 2019, and the
respective changes in financial position and, where applicable, cash flows thereof, and the respective
budgetary comparison for the General, Medic One, Public Health & Social Services and Roads &
Transportation funds for the year then ended in accordance with accounting principles generally accepted
in the United States of America.
Matters of Emphasis
As discussed in Note 18 to the financial statements, in 2019, the County adopted new accounting
guidance, Governmental Accounting Standards Board Statement 84, Fiduciary Activities. Our opinion
is not modified with respect to this matter.
As discussed in Note 19 to the financial statements, in February 2020, a state of emergency was declared
that could have a negative financial effect on the County. Our opinion is not modified with respect to
this matter.
Other Matters
Required Supplementary Information
Accounting principles generally accepted in the United States of America require that the management’s
discussion and analysis and required supplementary information listed in the table of contents be
presented to supplement the basic financial statements. Such information, although not a part of the basic
financial statements, is required by the Governmental Accounting Standards Board who considers it to
be an essential part of financial reporting for placing the basic financial statements in an appropriate
operational, economic or historical context. We have applied certain limited procedures to the required
supplementary information in accordance with auditing standards generally accepted in the United States
of America, which consisted of inquiries of management about the methods of preparing the information
and comparing the information for consistency with management’s responses to our inquiries, the basic
Thurston County, Washington 2019
12

financial statements, and other knowledge we obtained during our audit of the basic financial statements.
We do not express an opinion or provide any assurance on the information because the limited
procedures do not provide us with sufficient evidence to express an opinion or provide any assurance.
Supplementary and Other Information
Our audit was conducted for the purpose of forming opinions on the financial statements that collectively
comprise the County’s basic financial statements as a whole. The combining financial statements and
schedules are presented for the purposes of additional analysis and are not a required part of the basic
financial statements. Such information is the responsibility of management and was derived from and
relates directly to the underlying accounting and other records used to prepare the financial statements.
This information has been subjected to auditing procedures applied in the audit of the basic financial
statements and certain additional procedures, including comparing and reconciling such information
directly to the underlying accounting and other records used to prepare the financial statements or to the
financial statements themselves, and other additional procedures in accordance with auditing standards
generally accepted in the United States of America. In our opinion, the information is fairly stated, in all
material respects, in relation to the basic financial statements taken as a whole.
Our audit was conducted for the purpose of forming opinions on the financial statements that collectively
comprise the County’s basic financial statements as a whole. The Introductory and Statistical Sections
are presented for purposes of additional analysis and are not a required part of the basic financial
statements of the County. Such information has not been subjected to the auditing procedures applied in
the audit of the basic financial statements and, accordingly, we do not express an opinion or provide any
assurance on it.
OTHER REPORTING REQUIRED BY GOVERNMENT AUDITING STANDARDS
In accordance with Government Auditing Standards, we will also issue our report dated June 26, 2020,
on our consideration of the County’s internal control over financial reporting and on our tests of its
compliance with certain provisions of laws, regulations, contracts and grant agreements and other
matters. That report will be issued under separate cover in the County’s Single Audit Report. The purpose
of that report is to describe the scope of our testing of internal control over financial reporting and
compliance and the results of that testing, and not to provide an opinion on internal control over financial
reporting or on compliance. That report is an integral part of an audit performed in accordance with
Thurston County, Washington 2019
13

Government Auditing Standards in considering the County’s internal control over financial reporting
and compliance.
Sincerely,
Pat McCarthy
State Auditor
Olympia, WA
Thurston County, Washington 2019
14

MANAGEMENT DISCUSSION AND ANALYSIS Thurston County’s discussion and analysis provides a narrative overview and analysis of the County’s financial activities for the year ended December 31, 2019. We encourage readers to consider the information presented here in conjunction with additional information in the letter of transmittal, which can be found preceding this narrative, and with the County’s financial statements and notes to the financial statements, which follow this discussion. FINANCIAL HIGHLIGHTS
• Total Fund Balance for the General Fund increased to $22 million at December 31, 2019 compared to
$12.8 million at the end of 2018. This is an increase of $9.2 million, or 72%. Total ending Fund Balance represents 22.6% of 2019 General Fund total expenditures compared to 12.5% in 2018. This significant increase in Fund Balance was due to several factors, including a one-time increase for a tax revenue accrual adjustment, tax collections exceeding prior year collections, and expenditure reductions due to a shift in charging allowable costs to a restricted revenue source. Details of these factors are discussed later in this report.
• 2019 was the first-year implementation of GASB Statement No. 84 – Fiduciary Activities. This new
standard required a rework of the Fiduciary Statements of Net Position and the Statement of Changes in Fiduciary Net Position as well as the related Combining Fiduciary Statements. New account detail and roll-up funds were added to the statements. Additionally, based on this statement, the county did a study of its operations early in the year and noted some fiduciary activity not previously reported in its Fiduciary Funds that now has been reported properly.
• The total GASB 68 Net Pension Liability decreased by $7.6 million from 2018 to 2019 due to an increase at the statewide level of required employer and employee rates. The County’s Net Pension Liability is $21.5 million for Governmental Activities and $4 million in Business-type activities.
• The total GASB 75 Other Post Employment Benefit Obligation (OPEB) Liability increased by $8.9 million from 2018 to 2019. This increase is not unexpected given the nature of this liability. Specifically how closely it is tied to rising medical costs. The County’s OPEB Liability is $50.7 million for Governmental Activities and $6.4 million in Business-type activities
• For 2019, total Net Position of the County (governmental and business-type, combined) increased by
$31 million over 2018. The 2019 balances are comprised of the following:
1. Net Investment in Capital Assets, of $454.6 million. This includes property, infrastructure, and equipment, net of accumulated depreciation, and is reduced for outstanding debt related to the purchase or construction of the County’s capital assets.
2. Restricted net position of $68.5 million represents the portion restricted by constraints imposed from outside the County such as debt covenants, grants, and laws.
3. Unrestricted net position of $66.9 million represents the portion not restricted by outside constraints.
• Remaining capacity for non-voted and voted debt was $516.4 million and $896.4 million respectively.
• The county added a new major Enterprise Fund this year, Environmental Health. The activity tracked
by this fund was previously reported in the county’s Public Health major Governmental fund.
Thurston County, Washington 2019
15
• Just as the county’s General Fund’s financial health was vastly improving by the end of 2019 as described above, the COVID-19 economic shut down of the State of Washington as ordered by the Governor in February 2020, has drastically changed the future health of this fund. As of the date of the CAFR, the full ramifications of this shut down is not fully known. It may not be known for quite some time even after the economy reopens. However, the county’s Board of County Commissioners (BOCC) expect a large negative impact on receipts and other revenues. As such, the BOCC is exploring different levels of budget cuts based on different levels of lost revenue.
OVERVIEW OF THE FINANCIAL STATEMENTS This discussion and analysis is intended to serve as an introduction to Thurston County’s basic financial statements. Thurston County’s basic financial statements are comprised of three components: 1) government-wide financial statements, 2) fund financial statements, and 3) notes to the financial statements. Government-wide Financial Statements The government-wide financial statements are designed to provide readers with a broad overview of Thurston County’s finances in a manner similar to a private sector business. Thurston County reports two Government-wide financial statements: the statement of net position and the statement of activities. The statement of net position presents information on all of Thurston County’s assets and liabilities, with the difference between the two reported as net position. Over time, increases or decreases in net position may serve as a useful indicator of whether the financial position of the County is improving or deteriorating. The statement of activities presents information showing how the government’s net position changed during the most recent fiscal year. All changes in net position are reported as soon as the underlying event giving rise to the change occurs, regardless of timing of related cash flows. Thus, revenues and expenses are reported in this statement for some items that will only result in cash flows in future fiscal periods, such as revenues related to uncollected taxes and expenses related to earned but unused vacation leave and sick leave. This statement separates program income (revenue generated by specific programs through charges for services, grants, and contributions) from general revenue (revenue provided by taxes and other sources not tied to a particular program). By separating program revenue from general revenue, users can identify the extent to which each program relies on taxes for funding. The government-wide financial statements distinguish functions of Thurston County that are principally supported by taxes and intergovernmental revenues (governmental activities) from other functions that are intended to recover all or a significant portion of their costs through user fees and charges (business-type activities). The governmental activities including but not limited to: services provided to the public such as law enforcement and public safety; road construction and maintenance; recreation and open space preservation; public health and social services; and general administration. Business-type activities of Thurston County include solid waste, land use and permitting, and sewer and water management. Fund Financial Statements A fund is a grouping of related accounts that is used to maintain control over resources that have been segregated for specific activities or objectives. Thurston County, like other state and local governments, uses fund accounting to ensure and demonstrate compliance with finance-related legal requirements. All of the funds of the County can be divided into one of three categories: governmental, proprietary, or fiduciary.
Thurston County, Washington 2019
16
Governmental funds are used to account for essentially the same functions reported as governmental activities in the government-wide financial statements. However, unlike government-wide financial statements, governmental fund financial statements focus on near-term inflows and outflows of spendable resources, as well as on balances of spendable resources available at the end of the year. Such information is useful in evaluating a government’s near-term financing requirements in comparison to available near-term resources. Because the focus of governmental fund financial statements is narrower than that of government-wide financial statements, it is useful to compare information presented for governmental funds with similar information presented for governmental activities in the government-wide financial statements. This gives readers a better understanding of the long-term impact of the government’s financing decisions. Both the governmental fund balance sheet and the governmental fund statement of revenues, expenditures, and changes in fund balances provide a reconciliation to facilitate this comparison between governmental funds and governmental activities. The governmental funds balance sheet and the governmental funds statement of revenues, expenditures, and changes in fund balances present separate columns for financial data for the following funds: General, Roads, Medic One, Real Estate Excise Tax, Public Health and Social Services, and Other Governmental, which are considered major funds for financial reporting purposes. The Other Governmental Fund aggregates data from the remaining non-major governmental funds into a single, combined presentation. The governmental fund financial statements can be found immediately following the government-wide financial statements. Individual fund data for each of the non-major governmental funds is provided in the form of combining statements, outside of the basic financial statements, following the notes to the financial statements. The County maintains budgetary controls with an annual appropriated budget to ensure compliance with legal provisions. The County moved to a biennial budget beginning in 2017. Budgets for governmental funds are established in accordance with state law, and are adopted on a fund level, except for the General Fund, which is adopted on a department level. A budgetary comparison of revenues, expenditures, and changes in fund balances is provided for the General Fund, and special revenue, debt service, and capital project funds with statutorily mandated budgets. Major fund budgetary variance statements are included with the basic financial statements, while non-major fund budget variance schedules follow the combining fund statements. Budgetary variances for the General Fund are discussed in more detail in a subsequent section. Proprietary funds are used to account for a government’s business type activities, where all or part of the costs of activities are supported by fees and charges that are paid directly by those who benefit from the activities. Proprietary funds provide the same type of information as the government-wide financial statements, only in more detail, since both apply the accrual basis of accounting. Proprietary fund statements follow the governmental fund statements in this report. The County maintains two types of proprietary funds:
Enterprise funds are used to report the same functions presented as business-type activities in the government-wide financial statements. Enterprise funds account for the County’s solid waste, land use and permitting, utilities planning and development, environmental health, septic assistance community loan, storm water, and waste-water programs. The Solid Waste, Grand Mound, Land Use and Permitting, Environmental Health, and Storm Water funds are considered major funds for financial reporting purposes. The County reports four non-major enterprise funds.
Thurston County, Washington 2019
17

Internal service funds are used to report activities that provide services to the County’s other programs and activities on a cost reimbursement basis. The County internal service funds include: Risk Management, Benefits Administration, Central Services (facilities maintenance, construction and information technology support) Unemployment Compensation and Equipment Rental and Replacement. The revenues and expenses of internal service funds that are duplicated in other funds through allocations are eliminated in the government-wide statements, with the remaining balances included in the governmental activities column. All internal service funds are aggregated in a single column in the basic proprietary fund financial statements.
Fiduciary funds are used to account for resources that are held by a government as a trustee or agent for parties outside of the government. Fiduciary funds are not reflected in the government-wide financial statements because the resources of those funds are not available to support Thurston County’s own programs. The accounting used for fiduciary funds is like that for proprietary funds.
The County has three types of fiduciary funds: 1) Investment Trust Funds report fiduciary activities from the external portion of the county’s investment pool that are held in a trust that meets the criteria in paragraph 11c(1) of GASB 84. 2) Private Purpose Trust Funds are used to report all fiduciary activities that are not required to be reported in trust funds or investment trust funds and are held in a trust that meets the criteria in paragraph 11c(1) of GASB 84. 3) Custodial Funds are all other fiduciary activity not meeting the definition of the Investment Trust Funds or Private Purpose Trust Funds noted above. These include the portion of the county’s investment pool that are not held in a trust that meets the criteria in paragraph 11c(1) of GASB 84. Notes to the Financial Statements The notes provide additional information that is essential to a full understanding of the data provided in the government-wide and fund financial statements. The notes to the financial statements can be found immediately following the basic financial statements in this report. Required Supplementary Information This section details the changes in total OPEB Liabilities for the PEBB and LEOFF 1 per GASB 75 and schedules required per GASB 68 including a schedule of employer contributions and proportionate share of the Net Pension Liability for each of the five retirement plans in which the County participates. Statistical Section The statistical section presents a summary of County financial, revenue, debt, economic, demographic and performance information over the past ten years. GOVERNMENT-WIDE FINANCIAL ANALYSIS Analysis of Net Position Over time, Net Position serves as a useful indicator of a government’s financial position. As indicated in the condensed financial information on the following pages, which was derived from the government-wide Statement of Net Position, the County’s combined net position (governmental and business-type activities) was $590 million at the end of 2019. This reflects an increase of $31 million from prior year and is mainly in the cash and investments account. This was due to property and sales tax collections exceeding budget, an increase in investment valuations because the economy was in good shape at year-end, and a stabilization of the expenses for the year compared to last year.
Thurston County, Washington 2019
18
Of the County’s total Net Position, $454.6 million, or 77.1%, is invested in capital assets net of related debt. These assets provide services to County citizens and are not available for future spending purposes. However, resources needed to repay debt must be provided by other sources since capital assets cannot be readily liquidated to pay these liabilities. Of the County’s total Net Position, $68.5 million, or 11.6%, are subject to external spending restrictions. External restrictions include those provided by state law or by contractual agreement with outside entities, primarily state and federal agencies. Of this amount, 46% is restricted to Internal Service funds. The remaining $66.9 million, or 11.3%, is unrestricted and represents the amount that is not restricted by outside sources. This increase was mainly due to annual depreciation, debt payments, and more cash collections without spending restrictions. Thurston County reported $776.2 million of total assets as of December 31, 2019, compared to $753 million for 2018. This represents an increase of $23.2 million and was mainly a result of the Cash and Pooled Investments increasing by $18.7 million. Thurston County’s total liabilities decreased in 2019 compared to 2018, by just $3.2 million, or 1.7%. The decrease was the net result of several increases and decreases. For instance, the Bonds Payable decreased by $5.9 million for annual debt service payments with no corresponding sale of bonds and the Net Pension Liability decreased by $7.6 million due to a change in the employer and employee contribution rates at the State level to two of the County’s larger pension plans. The OPEB Liability increased by $9 million mainly due to increased medical costs. The County reported a Total Deferred Outflow of Resources of $15.5 million in 2019 compared to $9.2 million at the end of 2018. The increase in this account was related to Pensions and the balance of this account is out of the county’s control. Likewise, Pensions is also the reason why the reported Total Deferred Inflow of Resources increased by $1.5 million, to $18.3 million in 2019. The condensed financial information that follows is derived from the Government-Wide Statement of Net Position and reflects how the County’s net position in 2019 compares with 2018:
Thurston County, Washington 2019
19

Thurston County Net Position
TotalAccount 2019 2018 2019 2018 2019 2018
Current & Non-Capital Assets 190,169,715$ 175,141,521$ 76,786,369$ 69,749,435$ 266,956,084$ 244,890,956$ Capital Assets 476,903,958 476,226,127 32,290,380 31,896,808 509,194,338 508,122,935 Total Assets 667,073,673 651,367,648 109,076,749 101,646,243 776,150,422 753,013,891
Total Deferred Outflow of Resources 13,705,459 8,509,576 1,795,213 726,107 15,500,672 9,235,683 Current Liabilities 19,778,313 18,648,157 4,461,755 4,067,903 24,240,068 22,716,060 Long Term Liabilities 133,397,337 140,484,327 25,711,659 23,337,263 159,108,996 163,821,590 Total Liabilities 153,175,650 159,132,484 30,173,414 27,405,166 183,349,064 186,537,650
Total Deferred Inflow of Resources 16,015,621 15,241,339 2,252,021 1,515,386 18,267,642 16,756,725
Net Investment in Capital Assets 422,610,081 417,421,171 32,013,331 30,295,391 454,623,412 447,716,562 Restricted 68,277,233 61,570,890 185,497 431,544 68,462,730 62,002,434 Unrestricted 20,700,547 6,511,340 46,247,699 42,724,863 66,948,246 49,236,203
Total Net Position 511,587,861$ 485,503,401$ 78,446,527$ 73,451,798$ 590,034,388$ 558,955,199$
Governmental Business-typeActivities Activities
Governmental activities – During 2019, the total net position for Governmental activities realized an increase of $26.1 million due to activity over prior year. $422.6 million in total net position was invested in capital assets, which is an increase of $5.2 million over prior year. $68.3 million in net position is restricted and $20.7 million is unrestricted net position. The unrestricted amount increased by $14.2 million over prior year mainly due to increase in collection of unrestricted sources of cash (taxes) reduction of debt service, and an increase in Pension related Deferred Outflows or Resources. Nearly all unrestricted assets are assigned for certain purposes but are essentially available for any future spending purposes based on actions and decisions by Thurston County’s Board of County Commissioners. Business-type activities – During 2019, the Business-type activity accounts remained fairly constant compared to prior year balances even though the county added a new major Enterprise Fund during 2019. The new fund is titled Environmental Health. The activity in this fund was previously reported in the county’s Public Health Special Revenue fund. Overall, the Net Position did increase by $5 million, to $78.4 million. Net Invested in Capital Assets was $32 million. Restricted Net Position and Unrestricted Net Position were $185,000 and $46.2 million respectively. The latter category of net position is available for future spending in the Business-Type funds and increased by $3.5 million because of cash collections in the county’s Solid Waste fund that were $4.4 million greater than prior year. Analysis of the Statement of Activities The following chart presents key elements in the Statement of Activities. In 2019, total County primary government revenues increased by $6.6 million, up to $253.9 million, compared to prior year. The several reasons for this include increased tax collections, solid waste charges for services, and increased investment valuations by way of required market value adjustments. These increases were partially offset by a decrease in Capital Contributions from developers compared to prior year. Total Primary County governmental expenses increased by $8.1 million to $223.8 million mainly due to more Transportation related expenses.
Thurston County, Washington 2019
20

Thurston County's Statement of Activities
Governmental Business-Type Total PrimaryActivities Activities Government
Account 2019 2018 2019 2018 2019 2018Program Revenues: Charges for Services 27,562,688$ 30,964,726$ 43,173,430$ 39,509,998$ 70,736,118$ 70,474,724$
Operating Grants & Contrib. 27,716,227 23,489,002 310,747 131,367 28,026,974 23,620,369
Capital Grants & Contrib. 14,333,409 22,261,488 1,308,381 366,364 15,641,790 22,627,852
General Revenues: Taxes 129,492,194 124,373,225 - - 129,492,194 124,373,225
Interest and Invest. Earnings 8,457,483 4,980,211 260,372 213,927 8,717,855 5,194,138
Other General Revenues 461,770 946,432 779,306 58,230 1,241,076 1,004,662 Total Revenues 208,023,771 207,015,084 45,832,236 40,279,886 253,856,007 247,294,970
Program Expenses: (Net) General Government 9,834,970 11,326,493 - - 9,834,970 11,326,493
Culture and Recreation 3,173,850 3,007,329 - - 3,173,850 3,007,329
Economic Environment 8,144,766 7,710,811 - - 8,144,766 7,710,811
Health and Human Services 36,836,311 39,271,956 - - 36,836,311 39,271,956
Utilities and Environment 1,413,981 1,425,547 - - 1,413,981 1,425,547
Public Safety 85,673,513 86,360,254 - - 85,673,513 86,360,254
Transportation 33,285,354 29,951,132 - - 33,285,354 29,951,132
Interest 1,894,437 2,042,183 - - 1,894,437 2,042,183
Solid Waste - - 22,645,386 22,309,307 22,645,386 22,309,307
Water - - 1,026,871 933,885 1,026,871 933,885
Sewer - - 2,126,989 1,975,390 2,126,989 1,975,390
Stormwater - - 4,990,767 4,877,917 4,990,767 4,877,917
Environmental Health - - 7,604,202 - 7,604,202 -
Land Use & Permitting - - 5,128,747 4,463,126 5,128,747 4,463,126
Total Expenses 180,257,182 181,095,705 43,522,962 34,559,625 223,780,144 215,655,330
Excess (Deficiency) of RevenuesOver (Under) ExpensesBefore Transfers 27,766,589 25,919,379 2,309,274 5,720,261 30,075,863 31,639,640
Transfers (2,685,455) (1,183,980) 2,685,455 1,183,980 - -
Special Item - Transfer to BHO - (5,229,766) - - - (5,229,766)
Change in Net Position 25,081,134 19,505,633 4,994,729 6,904,241 30,075,863 26,409,874
Net Position as of January 1 485,503,401 471,416,275 73,451,798 67,267,261 558,955,199 538,683,536
Cumulative Effect of Change in Accounting Principle & Prior Period Adj. 1,003,326 (5,418,507) - (719,704) 1,003,326 (6,138,211)
Restated Net Position as of January 1 486,506,727 465,997,768 73,451,798 66,547,557 559,958,525 532,545,325
Ending Net Position 511,587,861$ 485,503,401$ 78,446,527$ 73,451,798$ 590,034,388$ 558,955,199$
Thurston County, Washington 2019
21

In 2019 Governmental activities provided $208 million in revenues (81.9% of total county revenues), while business type activities provided $45.8 million (18.1% of total county revenues). The three largest governmental revenues are - taxes at $129.5 million, or 62.3%, of total governmental revenues, charges for services at $27.6 million, or 13.3%, of total governmental revenues, and operating grants & contributions at $27.7 million, or 13.3% of total governmental revenues. The remaining 11.1% of governmental revenues include capital grants, interest and investment earnings and other general revenues. In 2019, charges for services were $43.2 million, or 94.3%, of total business-type revenues, which were $45.8 million. This represents an increase of $3.7 million over 2018 and is mainly due to the new Environmental Health Enterprise Fund created in 2019. The Solid Waste fund makes up the majority the revenues for the Business-Type Activities. Total governmental expenses decreased by just $0.8 million. Most expense categories stayed very constant compared to prior year. The governmental and business-type expense distribution of $180.3 million, or 80.6%, and $43.5 million, or 19.4%, closely resembles the distribution from the prior year. The county recorded another prior period adjustment related to year-end tax accruals in 2019. The amount this year was just over $1 million. The following graph illustrates the distribution of expenses by program for both governmental and business type activities.
$- $10,000,000 $20,000,000 $30,000,000 $40,000,000 $50,000,000 $60,000,000 $70,000,000 $80,000,000 $90,000,000
1 2 3 4 5 6 7 8 9 10 11 12 13
38.3%
16.5%14.9%
10.1%4.4% 3.6% 3.4% 2.3%
2.2% 1.4% 1.4% 0.8% 0.6%
Program Expenses - Government-Wide
Legend: 1. Public Safety 4. Solid Waste 7. Land Use & Permitting 10. Environmental Health 2. Health & Human Serv. 5. General Government 8. Stormwater 11. Culture & Recreation 3. Transportation 6. Economic Environment 9. Water & Sewer 12. Interest
13. Utilities & Environment
Thurston County, Washington 2019
22

FINANCIAL ANALYSIS OF THE COUNTY’S MAJOR FUNDS Following is an analysis of the County’s major governmental and proprietary funds. Governmental Funds Analysis
The focus of Thurston County’s governmental funds is to provide information on near-term inflows, outflows, and balances of resources that are available for spending. Fund balance serves as a useful measure of the County’s net resources available for spending at the end of the fiscal year. The County’s governmental funds reported a combined total ending fund balance of $115 million, an increase of $12.2 million from prior year ($102.8 million). Most of this increase was due to an increase in the Cash account of $10.5 million. This was due to the more tax collections in the governmental funds and a reduction of expenditures in the General Fund. The following chart shows the distribution of total assets for all major governmental funds:
General Fund23%
Roads18%Medic One
7%Real Estate Excise Tax
12%
Public Health & Social Services
7%
Other Gov't Funds33%
Total Assets - Governmental Funds
Governmental Fund revenues in 2019 increased vs. 2018 by $8.7 million, mainly in the Taxes category. Taxes increased due to the expansion of the regional economy during 2019. Governmental expenditures in 2019 were lower than 2018 by $6.2 million, or 3.1%, mainly in the Capital Outlay and Public Health categories. The county’s Roads fund, the Salaries and Benefits accounts in several departments increased. For Capital Outlay, the Roads fund had a large number of road overlay project activity that happened in 2018 compared to other years. In the Public Health area, the county’s Environmental Health activity, previously reported in the Public Health Special Revenue fund, is now reported as a major Enterprise Fund. Expenses in the Environmental Health fund were $7.4 million in 2019.
Thurston County, Washington 2019
23

The following chart shows revenues and expenditures for Thurston County’s major governmental funds, including Other Governmental Funds. Charted revenues and expenditures exclude other financing sources/uses and transfers.
$- $10,000,000 $20,000,000 $30,000,000 $40,000,000 $50,000,000 $60,000,000 $70,000,000 $80,000,000 $90,000,000
$100,000,000 $110,000,000 $120,000,000 $130,000,000 $140,000,000 $150,000,000 $160,000,000 $170,000,000 $180,000,000 $190,000,000 $200,000,000 $210,000,000
General Fund Roads Medic One Real EstateExcise Tax
Public Health &Social Services
Other Gov'tFunds
Tota lGovernmenta l
FundsRevenues $107,135,048 $31,526,839 $11,628,750 $6,243,936 $11,796,510 $39,926,213 $208,257,296Expenditures $97,228,927 $34,319,932 $14,053,446 $- $12,989,981 $36,797,185 $195,389,471
Governmental Fund Revenues and Expenditures
In 2019, the General Fund and the Roads Fund accounted for 66.5% of total revenues and 67.3% of total expenditures. For 2019 the County is reporting the following as major governmental funds: General, Roads, Medic One, Real Estate Excise Tax, Public Health and Social Services, and Other Governmental. The following are highlights related to each major fund in 2019: The General Fund is the chief operating fund of the County. The General Fund’s total ending fund balance was $22 million at the end of 2019, compared to $12.8 million at the end of 2018. This represents an increase of $9.2 million compared to prior year. This increase was due to several factors including: 1) tax receipts for mainly sales and property taxes increased by $4.4 million due to a strong economy, 2) a reduction of Public Safety expenditures due to the shifting of allowable expenditures to a restricted revenue source causing a reduction in interfund charges, 3) an increase of central service indirect cost allocation revenue collections, 4) a one-time accrual adjustment of tax revenue received from the State of Washington in early 2020 for revenues earned in the last two months of 2019 of $1.2 million, and 5) A $1.1 million payment from the State for court impact fees that were not paid in 2018. Total Unassigned fund balance was $21.8 million compared to $12.7 million at the end of 2018. This increase corresponds closely with the above-stated difference in total fund balance as the other categories of Fund Balance changed very little from prior year. General Fund total assets were $31.1 million and total liabilities were $5.1 million at the end of 2019. Compared to 2018, assets increased by $9 million, or 40.7%, and liabilities increased by just 2%. The main increase in assets was in the Cash and Pooled Investments and Customer Account Receivable accounts as previously discussed.
Thurston County, Washington 2019
24

General Fund revenues increased by $12 million, or 12.6%, from 2018 to 2019 due to increases in property and sales taxes and charges for services. General Fund expenditures decreased by $5 million, or 4.9%. This decrease, explained earlier, was due to recording allowable expenditures directly to a restricted revenue source and the underlying indirect costs. The General Fund also had a $1.1 million prior period adjustment increase to beginning Fund Balance. This is related to the recognition of tax revenue previously described. Beginning in 2018, the County began recognizing the first two months of sales tax collections in the new year as revenues of the prior year in accordance with GASB 33. An adjustment had to be made to beginning year fund balance so as to only have 12 months of revenue reported for 2018. In 2019 the county included additional tax accounts that were not included in the initial adjustment in prior year. Transfers-in to the General fund decreased by $6 million in 2019. The decrease was mainly due to two different instances. In 2018 the General Fund transferred $4.5 million to its Treatment Sales Tax (TST) and Detention Facility Sales Tax (DFST) funds for allowable costs incurred by the General Fund (mostly payroll related). These transfers were a result of interfund billings paid by the TST and DFST funds to the General Fund. In 2019, the county discontinued this practice in favor of directly charging the allowable activity to both the TST and the DFST funds. In so doing, the transfers in were eliminated. Additionally, in 2018 there was a one-time $1.7 million transfer-in to the General Fund from the county’s Unemployment Compensation Internal Service fund for internal service overpayment billing adjustments the past several years. The Roads Fund provides road maintenance and construction services to the citizens of Thurston County. Balance Sheet activity in this fund remained constant compared to prior year. There was very little fluctuation in total assets and total liabilities. As a result, Fund Balance in this fund increased by only $300,000 compared to last year. Compared to 2018, revenues in the Roads fund decreased by $2.9 million, or 8.4%. Expenditures also decreased $5.1 million, or 12.9% in 2019 mainly due to less road construction activity being performed than prior year. Grant funds, and the spending thereof, contributed to these decreases. Additionally, this fund also had $2.2 million less in transfers-in as a result in less construction activity. The Medic One Fund provides basic and advanced life support services to the citizens of Thurston County. In 2019, Medic One’s total assets decreased by $1.8 million, or 16.7% compared to prior year. Additionally, the fund balance in this fund has been steadily decreasing the last several years down to $7.1 million at the end of 2019. The reason for this continued decrease has been a series of purchases centered on a replacement of the county’s outdated medic units, software and hardware upgrades, and other equipment upgrades. Both revenues and expenditures in this fund remained very constant, increasing by just $500,000 and decreasing by $400,000 respectively. The Real Estate Excise Tax fund is a Capital Projects fund established for holding excise tax proceeds dedicated to capital projects from the one-half percent tax on real property sales in unincorporated Thurston County. Cash is the main asset in this fund. Assets, Liabilities, Revenues, Expenditures, Other Financing Sources, and Fund Balance all stayed constant compared to 2018 activity. Fund Balance increased by $900,000, to $15.9 million in 2019.
Thurston County, Washington 2019
25

The Public Health and Social Services Fund provides social and health services to the citizens of Thurston County. Total assets and total liabilities remained constant in 2019 decreasing by just $1.5 million and $200,000 respectively. However, compared to prior year, revenues decreased by $3.6 million, or 23.7% and expenditures decreased by $4.7 million, or 26.6%. Decreases in these nominal accounts was due to the county moving its Environmental Health activity out of the Public Health and creating a separate Enterprise Fund. It was determined this activity meets the definition of an Enterprise Fund because the revenues are derived by imposing a fee on the public who use its services. In 2019, the Environmental Health fund was a major Enterprise Fund. Fund Balance in the Public Health fund decreased by only $1.3 million from 2018 despite the adjustment described above. The Other Governmental Funds is a major fund comprised of all non-major Special Revenue, Capital Projects, and Debt Service funds of the County. Total assets in this major fund increased by $4.8 million mainly in the Cash account due to more tax collections in certain funds and higher investment values spread across most funds. As such, Fund Balance increased by $5.4 million. Expenditures increased by $9.4 million. This was due to more tax dollars being passed through to the county’s TCOMM fund and an increase in direct charges to the Treatment Sales Tax and the Detention Facility Sales Tax funds as previously described. Likewise, transfers out decreased by $4.6 million because of the direct billing as previously described. Proprietary Funds Net Position Analysis The county’s enterprise funds provide the same type of information found in the government-wide financial statements for business-type activities and are presented in the same accounting format. Internal service funds, although proprietary, are not Business-Type Funds and are therefore excluded in the following section.
Thurston County, Washington 2019
26

Thurston County Enterprise Net Position
Land Use Other TotalSolid Grand Storm Environmental And Enterprise Enterprise
Assets Waste Mound Water Health Permitting Funds FundsCash & Pooled Investments 37,148,085$ 1,362,129$ 13,589,128$ 2,483,256$ 1,964,080$ 1,588,872$ 58,135,550$
Other Current Assets 1,746,622 194,673 1,470,982 396,468 301,713 135,753 4,246,211
Restricted Assets:
Cash and Pooled Investments - 800 - - - 22,488 23,288
Total Current Assets 38,894,707 1,557,602 15,060,110 2,879,724 2,265,793 1,747,113 62,405,049
Long-Term Assets:
Receivables - - - - - 192,644 192,644
Capital Assets 7,593,469 14,125,382 7,753,815 - 29,960 2,787,754 32,290,380
Restrict Assets: Cash and Pooled Investments 13,207,569 - - - - - 13,207,569
Total Long Term Assets 20,801,038 14,125,382 7,753,815 - 29,960 2,980,398 45,690,593
Total Assets 59,695,745 15,682,984 22,813,925 2,879,724 2,295,753 4,727,511 108,095,642
Total Deferred Outflow of Resources 383,034 131,509 332,051 462,825 433,485 52,309 1,795,213
LiabilitiesCurrent Liabilities:
Accounts Payable/ Due To's 3,264,969 237,411 900,017 263,409 223,657 124,418 5,013,881
Restricted Laibilities - Debt - - - - - 78,282 78,282
Total Current Liabilities 3,264,969 237,411 900,017 263,409 223,657 202,700 5,092,163 Long-Term Liabilities:
Restricted Laibilities - Debt - 157,207 - - - 34,847 192,054
Comp Abs & OPEB Payable 1,697,354 294,187 1,287,868 1,996,863 1,810,442 179,542 7,266,256
Intergov. Loans & Contracts Payable 8,911 30,990 - - 6,805 356,227 402,933
Accumulated Landfill Closure Costs 13,850,238 - - - - - 13,850,238
Net Pension Liability 803,994 187,150 823,836 1,045,049 1,006,645 133,504 4,000,178
Total Long Term Liabilities 16,360,497 669,534 2,111,704 3,041,912 2,823,892 704,120 25,711,659
Total Liabilities 19,625,466 906,945 3,011,721 3,305,321 3,047,549 906,820 30,803,822
Total Deferred Inflow of Resources 462,436 103,118 456,354 590,938 565,653 73,522 2,252,021
Net PositionNet Investment in Capital Assets 7,579,690 13,989,995 7,753,815 - 15,206 2,674,625 32,013,331
Restricted For:
Debt Service - 3,966 - - - 181,531 185,497
Unrestricted (Deficit) 32,411,187 810,469 11,924,086 (553,710) (899,170) 943,322 44,636,184
Total Net Position 39,990,877$ 14,804,430$ 19,677,901$ (553,710)$ (883,964)$ 3,799,478$ 76,835,012$
The Solid Waste, Grand Mound, Storm & Surface Water Utility, Environmental Health, and Land Use and Permitting Funds are the major enterprise funds for Thurston County in 2019.
Thurston County, Washington 2019
27

The Solid Waste Fund provides solid waste disposal and reduction services to the citizens of Thurston County. The Grand Mound Fund provides water and waste water services to residents of Grand Mound in southern Thurston County. The Storm & Surface Water Fund accounts for assessments levied to minimize the harmful effects of storm water run-off and to construct and improve storm water run-off facilities within the utility’s boundaries. The Environmental Health Fund accounts for activity in the county related to preventing pollution, human exposure to environmental hazards, and ensuring safe and clean drinking water. This is a newly created fund in 2019 that broke off from the Public Health Special Revenue Fund. Land Use and Permitting Fund uses development license fees and service charges to provide planning, permitting, and development inspection services in unincorporated Thurston County. These funds comprise 95.7% of enterprise assets and 97.1% of enterprise liabilities. The total Net Position in these funds increased by $5.2 million, or 7.3% mainly in the Cash account in Solid Waste which saw an increase of $4.4 million due to normal operations. The total Net Position at the end of 2019 is $76.8 million. The addition of the Environmental Health fund did not have much of an effect on Total Net Position. This fund had a $550,000 negative Net Position at the end of 2019, However, $2.8 million of Liabilities in this fund are liabilities related to Pensions and OPEB and not due to normal operations. Of the total enterprise funds’ net position, $32 million, or 41.7%, is invested in capital assets net or related debt, whereas $44.8 million, or 58.3%, is restricted for debt service or is unrestricted. Total liabilities for all enterprise funds remained constant vs. prior year. All other account balances in these funds remained constant vs. prior year with only slight increases in most due to more activity from population increases and annual inflation.
Thurston County, Washington 2019
28

Proprietary Funds Revenue/Expense Analysis The following table is a summary of enterprise fund revenues and expenses in 2019.
Land Use Other TotalSolid Grand Storm Environmental And Enterprise EnterpriseWaste Mound Water Health Permitting Funds Funds
Revenues: Operating: Charges for Services 25,972,911$ 1,993,543$ 7,017,510$ 4,745,466$ 3,894,685$ 846,136$ 44,470,251$ Miscellaneous 135,137 46,262 108 582,896 95 14,808 779,306 Non-Operating: Interest Revenue - 64,114 40,264 30,990 76,944 48,060 260,372 Operating & Capital Grant Proceeds 58,858 - 58,704 193,185 - - 310,747 Other Non-Operating Revenues - - - - - - - Total Revenues 26,166,906 2,103,919 7,116,586 5,552,537 3,971,724 909,004 45,820,676 Expenses: Operating: Salaries and Benefits 2,429,040 615,076 2,570,327 6,850,000 3,352,171 400,988 16,217,602 Other Supplies and Expenses 94,316 94,979 194,739 118,649 59,688 80,678 643,049 Contractual Services 3,252,144 407,809 527,420 128,238 118,936 188,712 4,623,259 Longhaul Contract 14,687,582 - - - - - 14,687,582 Interfund Services and Charges 2,052,224 396,193 1,552,472 320,848 1,620,377 126,599 6,068,713 Depreciation/Amortization 1,037,038 646,390 489,158 - 7,820 156,421 2,336,827 Non-Operating: External & Internal Tax Payments - - - - - - - Interest Expense & Fiscal Charges 1,914 29,983 - - 559 11,152 43,608 Other Including Capital Asset Gain/Loss - - 3,819 - - - 3,819 Total Expenses 23,554,258 2,190,430 5,337,935 7,417,735 5,159,551 964,550 44,624,459 Income (Loss) before contrib. and trans. 2,612,648 (86,511) 1,778,651 (1,865,198) (1,187,827) (55,546) 1,196,217 Capital Contributions - 172,721 1,105,553 - - 30,107 1,308,381 Transfers In (Out) 3,838 925,676 (182,832) 1,311,488 594,470 32,815 2,685,455 Change in Net Position 2,616,486 1,011,886 2,701,372 (553,710) (593,357) 7,376 5,190,053 Net Position as of January 1 37,374,391 13,792,544 16,976,529 - (290,607) 3,792,102 71,644,959 Cumulative Effect of Change in Accounting Principle - - - - - - - Restated Net Position as of January 1 37,374,391 13,792,544 16,976,529 - (290,607) 3,792,102 71,644,959
Net Position as of December 31 39,990,877$ 14,804,430$ 19,677,901$ (553,710)$ (883,964)$ 3,799,478$ 76,835,012$
Thurston County WashingtonEnterprise Funds Revenues and Expenses
For all enterprise funds, total operating revenues from charges for services in 2019 are $44.5 million and comprise 97.2% of total enterprise operating and non-operating revenues. Compared to prior year, total charges for services for enterprise funds increased by $5 million. The main driver for this is the addition of the Environmental Health fund in 2019. This fund added $4.7 million in charges for services revenues. Please note that non-operating revenues and expenses are not segregated within the accompanying summarized table above whereas they are segregated within the fund financial statements.
Thurston County, Washington 2019
29

The Solid Waste Fund has provided waste disposal and reduction services through a solid waste transfer facility since 1999 at the Hawk’s Prairie Solid Waste and Recovery Center. Solid waste was disposed at a landfill at this site prior to that time. Maintenance of the closed landfill is fully funded through post closure reserves generated from landfill revenues prior to closure. Solid Waste Fund revenues comprise 57% of total enterprise revenues and 52.9% of total enterprise expenses. Net Position increased in this fund by $2.7 million over 2018. This increase was due to total revenues exceeding total expenses by $2.6 million. Net Position in this fund has been steadily increasing each year for the past several years with charges for services consistently exceeding expenses. The Net Position in 2009 was $16.9 million and the net position at the end of 2019 is $40 million. This represents an increase of $23.1 million, or 136.7% since that time. The Grand Mound Fund has provided water and waste water services to the Grand Mound area since 1999. Grand Mound Fund revenues comprise 4.6% of total enterprise revenues and 4.9% of total enterprise expenses. In 2019 both revenues and expenses remained fairly constant over prior year. Net Position was nearly identical in 2019 vs. 2018, increasing by just $1 million, or 7.2%, up to $14.8 million. The Storm & Surface Water Fund has been collecting assessments from landowners to mitigate the effects of storm water run-off from construction and development since 1985. Revenues comprise 15.5% of total enterprise revenues and 11.9% of total enterprise expenses. Net Position increased by $2.7 million in this fund over prior year due to normal operations of revenues exceeding expenses. The Land Use and Permitting Fund provides planning, permitting, and development inspection services to citizens living in unincorporated Thurston County. Revenues comprise 8.7% of total enterprise revenues and 11.7% of total enterprise expenses. Revenues decreased by $1 million, or 20.4% in 2019 mainly due to less permitting activity driven by the local construction market. The charges for services revenue collection activity in 2018 appears to be an outlier as it was nearly 30% higher than the few years preceding 2018 as well as in 2019. Total expenses in 2019 increased by $700,000, or 15.6% due to normal salary increases and increases in interfund central service charges. Net Position decreased by $593,000 to a negative $884,000 at year end. This fund has been in a negative Net Position since the inception of GASB 68. Now, with an increased OPEB Liability per GASB 75, Net Position is further affected. The Environmental Health Fund was a newly created enterprise fund in 2019. The activity in this fund was previously recorded in the county’s Public Health Special Revenue fund. This fund accounts for the activity in the county related to preventing pollution, human exposure to environmental hazards, and ensuring safe and clean drinking water and meets the definition of an enterprise fund. Year to year comparisons in this fund is not possible in 2019 given that it is a new fund. The Net Position in this fund was a negative $554,000 at year’s end. The fund realized an operating loss of $1.9 million in 2019 and it received a one-time $1.3 million transfer in from Public Health to set up the fund. General Fund Budgetary Highlights Beginning in 2019, Thurston County began a biennial budget. Periodic adjustments were made to the budget during the year. Although the budget is considered a biennial, appropriations still lapse at the end of each year. The following table shows changes between the original and final budget as of December 31, 2019. A positive variance is reported if final budget revenues exceed original budget revenues whereas a negative variance is reported if final budget revenues are less than original budgeted revenues. The reverse is shown for expenditures. A negative variance is reported if final budget expenditures exceed original budget expenditures and a positive variance is shown if the final budget expenditures are less than original budgeted expenditures. Note that transfers are included within the amounts reported for revenues and expenditures for each office and department. Both the Sheriff’s Office and Corrections had the largest increase in final vs. original budgets. The main reason for this is new positions added during the year.
Thurston County, Washington 2019
30
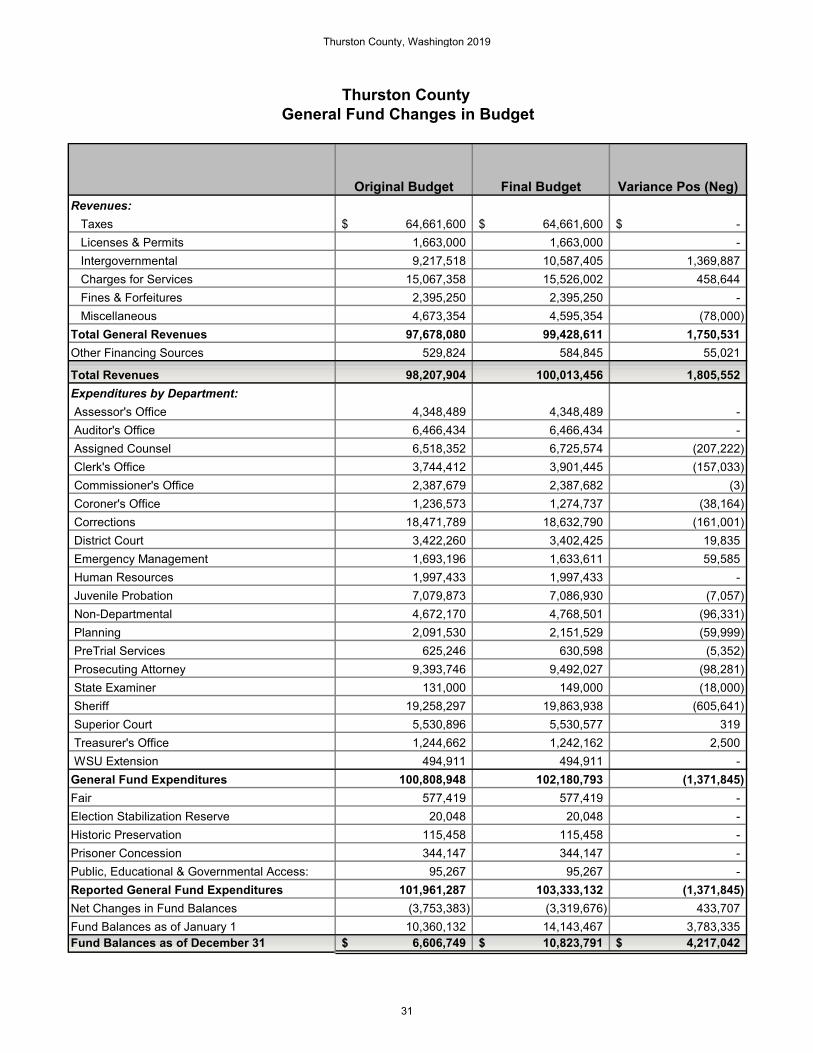
Thurston County General Fund Changes in Budget
Original Budget Final Budget Variance Pos (Neg)Revenues: Taxes 64,661,600$ 64,661,600$ -$ Licenses & Permits 1,663,000 1,663,000 - Intergovernmental 9,217,518 10,587,405 1,369,887 Charges for Services 15,067,358 15,526,002 458,644 Fines & Forfeitures 2,395,250 2,395,250 - Miscellaneous 4,673,354 4,595,354 (78,000) Total General Revenues 97,678,080 99,428,611 1,750,531 Other Financing Sources 529,824 584,845 55,021
Total Revenues 98,207,904 100,013,456 1,805,552 Expenditures by Department: Assessor's Office 4,348,489 4,348,489 - Auditor's Office 6,466,434 6,466,434 - Assigned Counsel 6,518,352 6,725,574 (207,222) Clerk's Office 3,744,412 3,901,445 (157,033) Commissioner's Office 2,387,679 2,387,682 (3) Coroner's Office 1,236,573 1,274,737 (38,164) Corrections 18,471,789 18,632,790 (161,001) District Court 3,422,260 3,402,425 19,835 Emergency Management 1,693,196 1,633,611 59,585 Human Resources 1,997,433 1,997,433 - Juvenile Probation 7,079,873 7,086,930 (7,057) Non-Departmental 4,672,170 4,768,501 (96,331) Planning 2,091,530 2,151,529 (59,999) PreTrial Services 625,246 630,598 (5,352) Prosecuting Attorney 9,393,746 9,492,027 (98,281) State Examiner 131,000 149,000 (18,000) Sheriff 19,258,297 19,863,938 (605,641) Superior Court 5,530,896 5,530,577 319 Treasurer's Office 1,244,662 1,242,162 2,500 WSU Extension 494,911 494,911 - General Fund Expenditures 100,808,948 102,180,793 (1,371,845) Fair 577,419 577,419 - Election Stabilization Reserve 20,048 20,048 - Historic Preservation 115,458 115,458 - Prisoner Concession 344,147 344,147 - Public, Educational & Governmental Access: 95,267 95,267 - Reported General Fund Expenditures 101,961,287 103,333,132 (1,371,845) Net Changes in Fund Balances (3,753,383) (3,319,676) 433,707 Fund Balances as of January 1 10,360,132 14,143,467 3,783,335 Fund Balances as of December 31 6,606,749$ 10,823,791$ 4,217,042$
Thurston County, Washington 2019
31
The County’s original and final General Fund budgets were similar with a $1.8 million increase in budgeted revenues and a $1.4 million increase in budgeted expenditures. The final budget ending fund balance was $10.8 million, an increase of $4.7 million over 2018. General Fund Budget to Actual Variances The following table summarizes differences between budget and actual revenues and expenditures in the General Fund for 2019. Note that transfers are included within the amounts reported for revenues and expenditures for each office and department. The final results for 2019 show actual total revenues (including other financing sources) at $108 million, which is $8 million, or 8%, above the final budget. Actual expenditures were $99 million, which is $3.2 million or 3.1% under budget. This percentage underspend is in line with annual historic percentages. The largest revenue variance between budget and actual was in the Miscellaneous, receiving $3 million more than planned. Most of this balance is related to an unbudgeted market value adjustment of the county’s marketable securities. Taxes was next receiving $1.7 million more than budgeted due to a strong economy during 2019. All offices/departments had a positive expenditure variance in 2019, meaning no office or department over-spent its budget authority. The largest budget under-expenditure by a department was in the County’s Juvenile department with a $553,000 under-expenditure, mostly in salary related expenditures.
Thurston County, Washington 2019
32

Thurston CountyGeneral Fund Revenues, Expenditures & Fund Balance
Final Budget Actuals Variance Pos (Neg)Revenues: Taxes 64,661,600$ 66,398,838$ 1,737,238$ Licenses & Permits 1,663,000 2,227,282 564,282 Intergovernmental 10,587,405 12,221,446 1,634,041 Charges for Services 15,526,002 16,064,549 538,547 Fines & Forfeitures 2,395,250 2,656,552 261,302 Miscellaneous 4,595,354 7,566,381 2,971,027 Total General Revenues 99,428,611 107,135,048 7,706,437 Total Other Financing Sources 584,845 841,904 257,059
Total Revenues 100,013,456 107,976,952 7,963,496 Expenditures by Department: Assessor's Office 4,348,489 4,325,234 23,255 Auditor's Office 6,466,434 6,173,703 292,731 Assigned Counsel 6,725,574 6,665,110 60,464 Clerk's Office 3,901,445 3,767,326 134,119 Commissioner's Office 2,387,682 2,311,972 75,710 Coroner's Office 1,274,737 1,274,735 2 Corrections 18,632,790 18,397,908 234,882 District Court 3,402,425 3,294,372 108,053 Emergency Management 1,633,611 1,416,775 216,836 Human Resources 1,997,433 1,749,561 247,872 Juvenile Probation 7,086,930 6,533,864 553,066 Non-Departmental 4,768,501 4,524,859 243,642 Planning 2,151,529 1,825,705 325,824 PreTrial Services 630,598 589,571 41,027 Prosecuting Attorney 9,492,027 9,206,808 285,219 State Examiner 149,000 138,338 10,662 Sheriff 19,863,938 19,758,957 104,981 Superior Court 5,530,577 5,374,760 155,817 Treasurer's Office 1,242,162 1,214,404 27,758 WSU Extension 494,911 450,743 44,168 General Fund Expenditures 102,180,793 98,994,705 3,186,088 Fair 577,419 546,650 30,769 Election Stabilization Reserve 20,048 48 20,000 Historic Preservation 115,458 58,736 56,722 Prisoner Concession 344,147 100,368 243,779 Public, Educational & Governmental Access: 95,267 84,267 11,000 Reported General Fund Expenditures 103,333,132 99,784,774 3,548,358 Net Changes in Fund Balances (3,319,676) 8,192,178 11,511,854 Fund Balances as of January 1 14,143,467 12,767,084 (1,376,383) Prior Period Adjustments - 1,056,441 1,056,441 Fund Balances as of January 1 - Restated 14,143,467 13,823,525 (319,942)
Fund Balances as of December 31 10,823,791$ 22,015,703$ 11,191,912$
Thurston County, Washington 2019
33

CAPITAL ASSET AND DEBT ADMINISTRATION Capital Assets Capital assets include land, construction in progress, buildings, improvements, machinery and equipment intangible assets, and infrastructure. Thurston County’s total governmental and business-type capital asset balance was $509.2 million at year end. Of this total, $276.9 million (54.4%) are non-depreciable assets and $232.3 million (45.6%) are depreciable. Capital assets comprise 65.6% of total assets. A capital asset breakdown is provided in Note VII within the financial statement section. Total capital assets in both governmental and business-type increased by just $1.1 million over prior year. At year-end the County had $9.5 million in commitments for capital expenditures related to a large Road Fund construction project. Long-Term Debt Total general obligation debt outstanding at year end was $54.7 million ($54.6 million in governmental activities and $150,000 in Business-type activities). This total represents a decrease of $5.9 million over 2018 due to annual debt payments. At the end of 2019, the County has the remaining capacity to issue $516.4 million in debt without a vote and a remaining capacity of $896.4 million with a 3/5-majority vote. See financial statement note VIIII for more information on debt issues outstanding and the reasons for their issuance. OTHER SIGNIFIGANT MATTERS In February 2020, the Governor of the state of Washington declared a state of emergency in response to the spread of a deadly new virus. In the weeks following the declaration, precautionary measures to slow the spread of the virus have been ordered. These measures include closing schools, colleges and universities, cancelling public events, prohibiting public and private gatherings, and requiring people to stay home unless they are leaving for an essential function. The length of time these measures will be in place, and the full extent of the financial impact on the county is unknown at this time. However, the Board of County Commissioners (BOCC) are assessing the situation and are modeling potential loss of revenue impacts to the remainder of 2020 budget and beyond. The BOCC is expecting significant loss of revenue for the rest of 2020 and into 2021, especially in the sales taxes category as the economy has mostly shut down per direction of the governor. This unfortunate situation is being closely monitored and the BOCC is prepared to take action as new information arises. REQUESTS FOR INFORMATION This financial report is designed to provide a general overview of Thurston County’s finances for all those with an interest in the County’s finances. Questions concerning any of the information provided in this report or requests for additional information should be addressed to the Auditor’s Office, Thurston County, 2000 Lakeridge Drive SW, Olympia, WA. 98502.
Thurston County, Washington 2019
34
Government Wide Financial Statements
Thurston County, Washington 2019
35
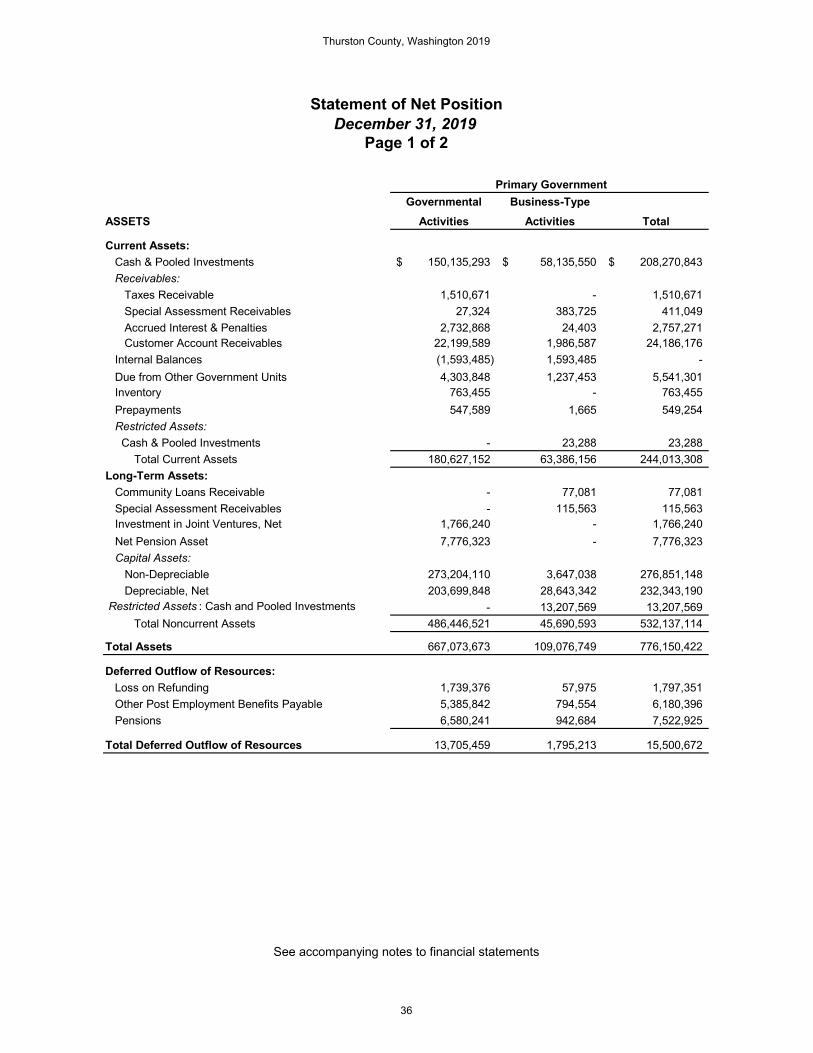
Primary GovernmentGovernmental Business-Type
ASSETS Activities Activities Total
Current Assets: Cash & Pooled Investments 150,135,293$ 58,135,550$ 208,270,843$ Receivables: Taxes Receivable 1,510,671 - 1,510,671 Special Assessment Receivables 27,324 383,725 411,049 Accrued Interest & Penalties 2,732,868 24,403 2,757,271 Customer Account Receivables 22,199,589 1,986,587 24,186,176 Internal Balances (1,593,485) 1,593,485 - Due from Other Government Units 4,303,848 1,237,453 5,541,301 Inventory 763,455 - 763,455 Prepayments 547,589 1,665 549,254 Restricted Assets: Cash & Pooled Investments - 23,288 23,288 Total Current Assets 180,627,152 63,386,156 244,013,308 Long-Term Assets: Community Loans Receivable - 77,081 77,081 Special Assessment Receivables - 115,563 115,563 Investment in Joint Ventures, Net 1,766,240 - 1,766,240 Net Pension Asset 7,776,323 - 7,776,323 Capital Assets: Non-Depreciable 273,204,110 3,647,038 276,851,148 Depreciable, Net 203,699,848 28,643,342 232,343,190 Restricted Assets : Cash and Pooled Investments - 13,207,569 13,207,569 Total Noncurrent Assets 486,446,521 45,690,593 532,137,114
Total Assets 667,073,673 109,076,749 776,150,422
Deferred Outflow of Resources: Loss on Refunding 1,739,376 57,975 1,797,351 Other Post Employment Benefits Payable 5,385,842 794,554 6,180,396 Pensions 6,580,241 942,684 7,522,925
Total Deferred Outflow of Resources 13,705,459 1,795,213 15,500,672
Statement of Net PositionDecember 31, 2019
Page 1 of 2
See accompanying notes to financial statements
Thurston County, Washington 2019
36

Primary GovernmentGovernmental Business-Type
LIABILITIES Activities Activities TotalCurrent Liabilities: Accounts Payable 12,892,776 4,120,038 17,012,814 Notes/Leases Payable 155,002 62,348 217,350 Due to Other Government Units 4,255 - 4,255 Compensated Absences 361,656 48,419 410,075 Claims & Judgments Payable 548,671 - 548,671 Total Other Post Employment Benefits Liability 869,337 89,490 958,827 Limited G.O. Bonds Payable 4,780,255 - 4,780,255 Special Assess. Debt - Gov. Commitment - 78,282 78,282 Unearned Revenue 166,361 63,178 229,539 Total Current Liabilities 19,778,313 4,461,755 24,240,068 Long-Term Liabilities: Limited G.O. Bonds Payable 49,794,554 157,207 49,951,761 Special Assess. Debt - Gov. Commitment - 34,847 34,847 Compensated Absences 6,754,600 904,317 7,658,917 Total Other Post Employment Benefits Liability 49,848,580 6,361,939 56,210,519 Other Non-Current Liabilities 809,247 - 809,247 Claims & Judgments Payable 3,568,515 - 3,568,515 Notes/Leases Payable 1,112,180 402,933 1,515,113 Accumulated Landfill Closure Costs - 13,850,238 13,850,238 Net Pension Liability 21,509,661 4,000,178 25,509,839 Total Noncurrent Liabilities 133,397,337 25,711,659 159,108,996 Total Liabilities 153,175,650 30,173,414 183,349,064 Deferred Inflow of Resources: Gain on Refunding 320,907 - 320,907 Other Post Employment Benefits Payable 1,520,644 229,995 1,750,639 Pensions 14,174,070 2,022,026 16,196,096 Total Deferred Inflow of Resources 16,015,621 2,252,021 18,267,642 NET POSITIONNet Investment in Capital Assets 422,610,081 32,013,331 454,623,412 Restricted For: Culture & Recreation 2,627,625 - 2,627,625 Economic Environment 754,640 - 754,640 General Government 15,461,760 - 15,461,760 Health and Human Services 5,007,404 - 5,007,404 Internal Service 27,698,446 - 27,698,446 Public Safety 2,262,079 - 2,262,079 Utilities & Environment 6,994,899 - 6,994,899 Transportation 7,470,380 - 7,470,380 Debt Service - 185,497 185,497 Unrestricted (Deficit) 20,700,547 46,247,699 66,948,246
Total Net Position 511,587,861$ 78,446,527$ 590,034,388$
Statement of Net PositionDecember 31, 2019
Page 2 of 2
See accompanying notes to financial statements
Thurston County, Washington 2019
37
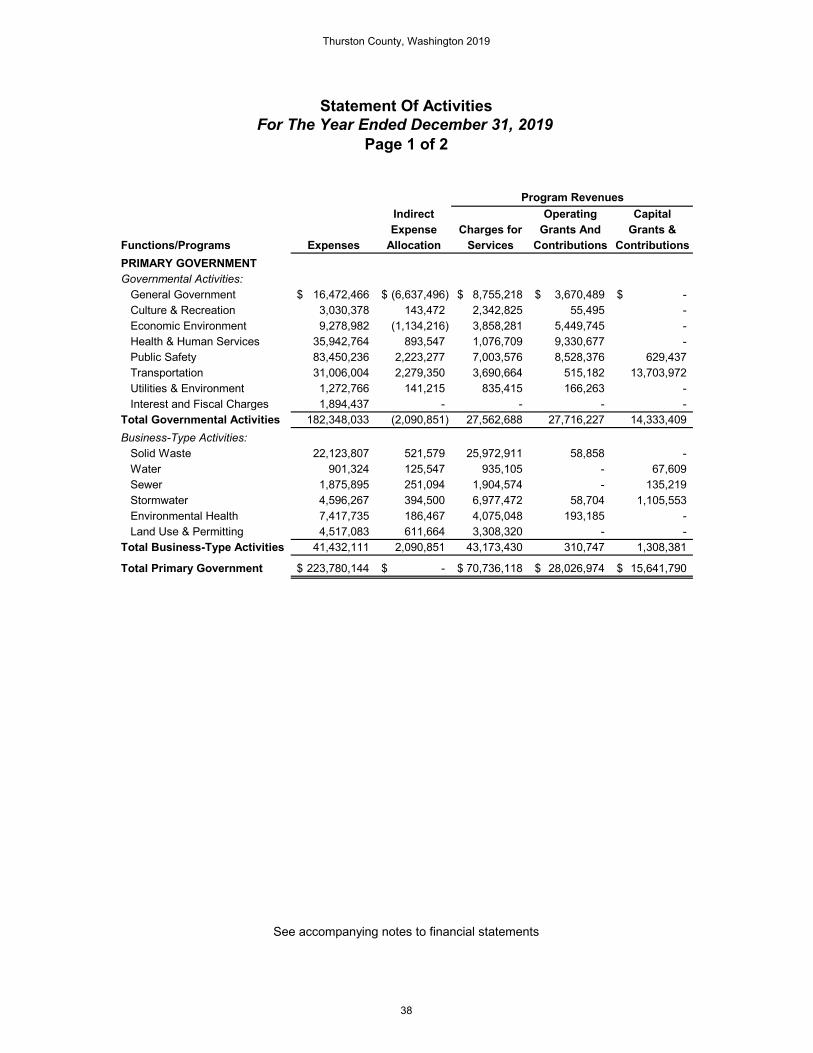
Indirect Operating CapitalExpense Charges for Grants And Grants &
Functions/Programs Expenses Allocation Services Contributions ContributionsPRIMARY GOVERNMENTGovernmental Activities: General Government 16,472,466$ (6,637,496)$ 8,755,218$ 3,670,489$ -$ Culture & Recreation 3,030,378 143,472 2,342,825 55,495 - Economic Environment 9,278,982 (1,134,216) 3,858,281 5,449,745 - Health & Human Services 35,942,764 893,547 1,076,709 9,330,677 - Public Safety 83,450,236 2,223,277 7,003,576 8,528,376 629,437 Transportation 31,006,004 2,279,350 3,690,664 515,182 13,703,972 Utilities & Environment 1,272,766 141,215 835,415 166,263 - Interest and Fiscal Charges 1,894,437 - - - - Total Governmental Activities 182,348,033 (2,090,851) 27,562,688 27,716,227 14,333,409 Business-Type Activities: Solid Waste 22,123,807 521,579 25,972,911 58,858 - Water 901,324 125,547 935,105 - 67,609 Sewer 1,875,895 251,094 1,904,574 - 135,219 Stormwater 4,596,267 394,500 6,977,472 58,704 1,105,553 Environmental Health 7,417,735 186,467 4,075,048 193,185 - Land Use & Permitting 4,517,083 611,664 3,308,320 - - Total Business-Type Activities 41,432,111 2,090,851 43,173,430 310,747 1,308,381
Total Primary Government 223,780,144$ -$ 70,736,118$ 28,026,974$ 15,641,790$
Page 1 of 2
Statement Of ActivitiesFor The Year Ended December 31, 2019
Program Revenues
See accompanying notes to financial statements
Thurston County, Washington 2019
38
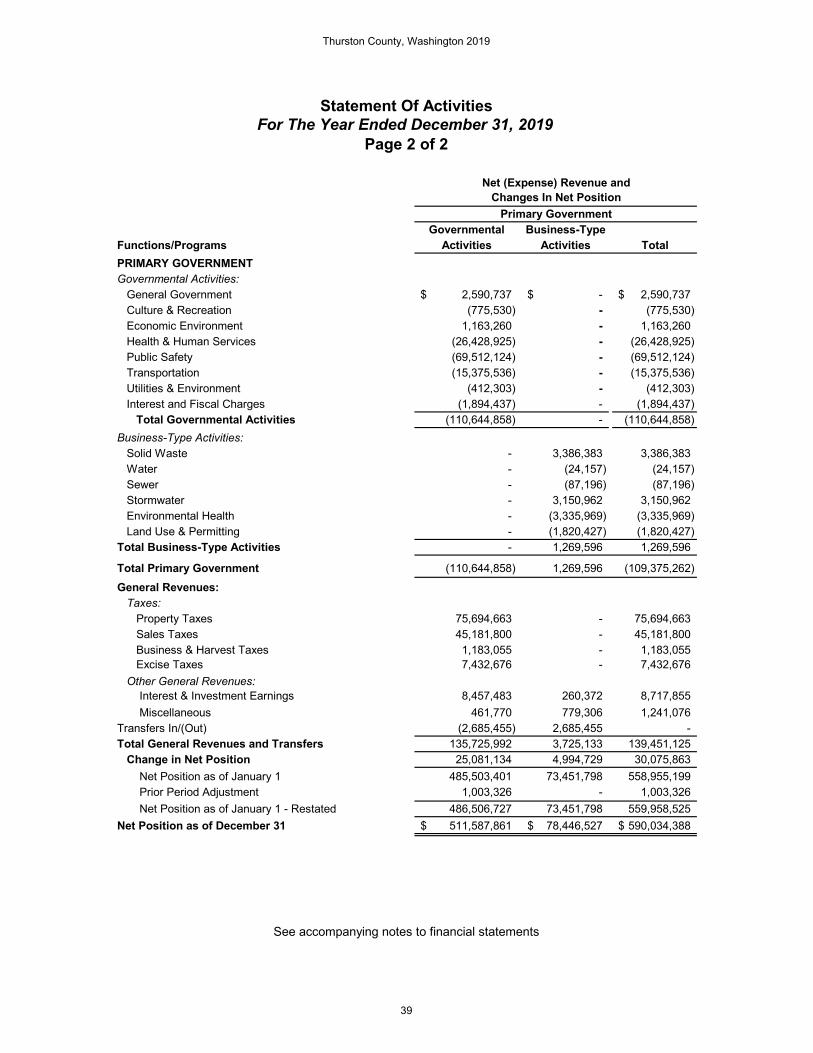
Governmental Business-TypeFunctions/Programs Activities Activities TotalPRIMARY GOVERNMENTGovernmental Activities: General Government 2,590,737$ -$ 2,590,737$ Culture & Recreation (775,530) - (775,530) Economic Environment 1,163,260 - 1,163,260 Health & Human Services (26,428,925) - (26,428,925) Public Safety (69,512,124) - (69,512,124) Transportation (15,375,536) - (15,375,536) Utilities & Environment (412,303) - (412,303) Interest and Fiscal Charges (1,894,437) - (1,894,437) Total Governmental Activities (110,644,858) - (110,644,858) Business-Type Activities: Solid Waste - 3,386,383 3,386,383 Water - (24,157) (24,157) Sewer - (87,196) (87,196) Stormwater - 3,150,962 3,150,962 Environmental Health - (3,335,969) (3,335,969) Land Use & Permitting - (1,820,427) (1,820,427) Total Business-Type Activities - 1,269,596 1,269,596
Total Primary Government (110,644,858) 1,269,596 (109,375,262) General Revenues: Taxes: Property Taxes 75,694,663 - 75,694,663 Sales Taxes 45,181,800 - 45,181,800 Business & Harvest Taxes 1,183,055 - 1,183,055 Excise Taxes 7,432,676 - 7,432,676 Other General Revenues: Interest & Investment Earnings 8,457,483 260,372 8,717,855 Miscellaneous 461,770 779,306 1,241,076 Transfers In/(Out) (2,685,455) 2,685,455 - Total General Revenues and Transfers 135,725,992 3,725,133 139,451,125 Change in Net Position 25,081,134 4,994,729 30,075,863 Net Position as of January 1 485,503,401 73,451,798 558,955,199 Prior Period Adjustment 1,003,326 - 1,003,326 Net Position as of January 1 - Restated 486,506,727 73,451,798 559,958,525 Net Position as of December 31 511,587,861$ 78,446,527$ 590,034,388$
Page 2 of 2
Statement Of ActivitiesFor The Year Ended December 31, 2019
Net (Expense) Revenue andChanges In Net Position
Primary Government
See accompanying notes to financial statements
Thurston County, Washington 2019
39

This Page Intentionally Left Blank
Thurston County, Washington 2019
40

PublicReal Health Other Total
General Medic Estate & Social Governmental GovernmentalFund Roads One Excise Tax Services Funds Funds
ASSETS Cash & Pooled Investments 17,380,739$ 21,196,734$ 8,794,550$ 16,373,877$ 8,294,042$ 38,020,299$ 110,060,241$ Receivables: Taxes Receivable 802,182 458,447 202,099 - 15,432 32,511 1,510,671 Special Assessment Receivables - - - - - 27,324 27,324 Accrued Interest & Penalties 2,513,521 - 25,881 - 23,479 134,817 2,697,698 Customer Account Receivables 7,205,348 972,491 1,177 - 2,375 4,733,931 12,915,322 Due from Other Funds 619,035 986,493 - 1,050 125,859 141,568 1,874,005 Due from Other Government Units 2,543,667 218,054 - - 823,106 703,112 4,287,939 Inventory - 478,121 - - - - 478,121 Prepayments 78,343 5,046 - - 1,740 14,250 99,379
Total Assets 31,142,835$ 24,315,386$ 9,023,707$ 16,374,927$ 9,286,033$ 43,807,812$ 133,950,700$
LIABILITIES Accounts Payable 4,634,287$ 1,773,518$ 1,775,238$ -$ 974,523$ 2,299,576$ 11,457,142$ Due to Other Funds 450,703 504,409 - 433,535 46,560 861,741 2,296,948 Due to Other Government Units 318 - - - - 3,937 4,255 Unearned Revenues 18,938 3,650 - - 14,858 128,915 166,361
Total Liabilities 5,104,246 2,281,577 1,775,238 433,535 1,035,941 3,294,169 13,924,706
Deferred Inflow of Resources: Property Taxes 2,392,226 397,568 176,068 - 13,427 28,318 3,007,607 Special Assessments - - - - - 27,367 27,367 Courts 1,630,660 - - - - 352,562 1,983,222
Total Deferred Inflow of Resources 4,022,886 397,568 176,068 - 13,427 408,247 5,018,196
FUND BALANCES Nonspendable 78,343 483,167 - - 1,740 14,250 577,500 Restricted 158,164 - - 14,324,592 - 26,096,031 40,578,787 Committed - - - - - 533,782 533,782 Assigned - 21,153,074 7,072,401 1,616,800 8,234,925 13,461,333 51,538,533 Unassigned 21,779,196 - - - - - 21,779,196
Total Fund Balance 22,015,703 21,636,241 7,072,401 15,941,392 8,236,665 40,105,396 115,007,798
Total Liabilities, Deferred Inflow of Resources & Fund Balances 31,142,835$ 24,315,386$ 9,023,707$ 16,374,927$ 9,286,033$ 43,807,812$ 133,950,700$
Balance SheetGovernmental FundsDecember 31, 2019
See accompanying notes to financial statements
Thurston County, Washington 2019
41

GovernmentalFunds
Fund balance as shown in the Governmental Funds Balance Sheet 115,007,798$
The cost of capital assets and joint ventures, which is expended and not recognized in governmental funds, is deferred to future periods in the statement of net position 441,589,214
Debt, which is not reported in governmental funds, is reported in the statement of net position (55,002,173)
Assets, liabilities and resulting net position of internal service funds, which are separately reported in proprietary fund statements, are included and combined with governmental balances in the statement of net position 63,130,365
Deferred gains and losses on refunding, which is not reported in governmental funds, is reported in the statement of net position 1,418,470
Long term (non-available) receivables, which are deferred in governmental funds, are recognized and accrued as revenues in the statement of net position 14,179,360
Compensated absences, other post employment benefits and pensions, which are not reported in governmental funds, are reported as accrued liabilities in the statement of net position (67,123,658)
Interfund balances, which are reported in governmental and proprietary funds, are eliminated in the statement of net position (except for a residual amount outstanding between governmental and enterprise activities) (1,611,515)
Net position for governmental funds as shown in statement of net position 511,587,861$
Reconciliation of The Balance Sheet of Governmental FundsTo The Statement of Net Position
December 31, 2019
See accompanying notes to financial statements
Thurston County, Washington 2019
42

PublicReal Health Other Total
General Medic Estate & Social Governmental GovernmentalFund Roads One Excise Tax Services Funds Funds
Revenues: Taxes 66,398,838$ 19,536,437$ 11,223,660$ 6,243,816$ 987,443$ 24,055,093$ 128,445,287$ Licenses & Permits 2,227,282 681,087 - - 26,535 - 2,934,904 Intergovernmental 12,221,446 9,304,592 81,123 - 8,906,695 6,080,067 36,593,923 Charges for Services 16,064,549 1,897,197 28,044 - 1,271,089 7,840,722 27,101,601 Fines & Forfeits 2,656,552 - - - - 235,190 2,891,742 Miscellaneous Revenue 7,566,381 107,526 295,923 120 604,748 1,715,141 10,289,839
Total Revenues 107,135,048 31,526,839 11,628,750 6,243,936 11,796,510 39,926,213 208,257,296
Expenditures:Current: General Government 16,423,526 - - - - 779,196 17,202,722 Culture & Recreation 997,921 1,098,062 - - - 978,441 3,074,424 Economic Environment 2,166,273 - - - - 7,647,674 9,813,947 Health & Human Services - - 13,504,108 - 12,981,741 11,762,500 38,248,349 Public Safety 76,476,017 - - - - 8,371,979 84,847,996 Transportation 226,549 25,952,508 - - - 823 26,179,880 Utilities & Environment 739,058 - - - - 709,409 1,448,467 Capital Outlay 102,521 7,167,323 545,385 - - 412,632 8,227,861 Debt Service: Principal 82,803 68,988 3,307 - 5,783 3,964,417 4,125,298 Interest & Fiscal Charges 14,259 33,051 646 - 2,457 2,170,114 2,220,527
Total Expenditures 97,228,927 34,319,932 14,053,446 - 12,989,981 36,797,185 195,389,471
Excess (Deficiency) of Revenues Over Expenditures 9,906,121 (2,793,093) (2,424,696) 6,243,936 (1,193,471) 3,129,028 12,867,825
Other Financing Sources (Uses) Capital Lease Financing 54,256 - - - - - 54,256 Sale of Capital Assets 497,828 516,393 136,926 - 10,550 21,654 1,183,351 Transfers In 289,820 3,480,737 2,500 - 1,170,612 7,171,467 12,115,136 Transfers Out (2,555,847) (1,134,196) - (5,292,154) (1,277,693) (5,067,188) (15,327,078)
Total Other Financing Sources (Uses) (1,713,943) 2,862,934 139,426 (5,292,154) (96,531) 2,125,933 (1,974,335)
Net Changes In Fund Balances 8,192,178 69,841 (2,285,270) 951,782 (1,290,002) 5,254,961 10,893,490
Fund Balances as of January 1 12,767,084 21,485,940 9,357,671 14,989,610 9,526,667 34,719,929 102,846,901 Prior Period Adjustments 1,056,441 80,460 - - - 130,506 1,267,407 Fund Balances as of January 1-Restated 13,823,525 21,566,400 9,357,671 14,989,610 9,526,667 34,850,435 104,114,308
Fund Balances as of December 31 22,015,703$ 21,636,241$ 7,072,401$ 15,941,392$ 8,236,665$ 40,105,396$ 115,007,798$
Statement of Revenues, Expenditures and Changes In Fund BalancesGovernmental Funds
For The Year Ended December 31, 2019
See accompanying notes to financial statements
Thurston County, Washington 2019
43
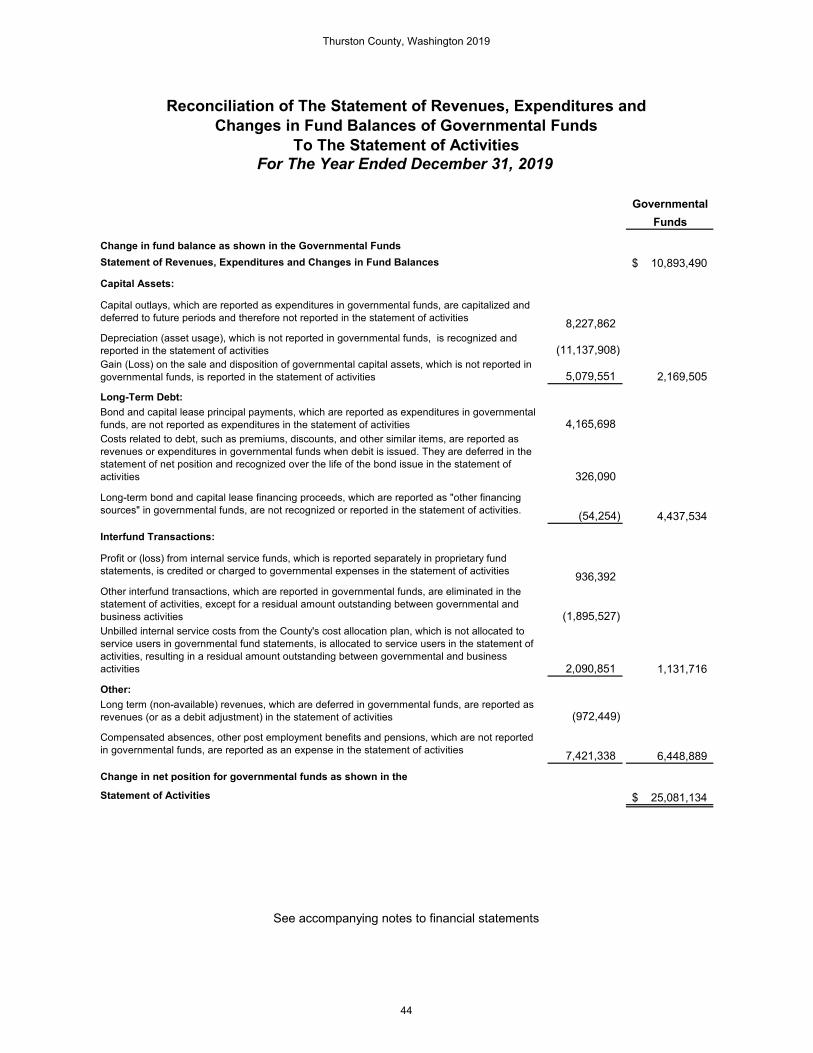
GovernmentalFunds
Change in fund balance as shown in the Governmental Funds Statement of Revenues, Expenditures and Changes in Fund Balances 10,893,490$
Capital Assets:
Capital outlays, which are reported as expenditures in governmental funds, are capitalized and deferred to future periods and therefore not reported in the statement of activities 8,227,862 Depreciation (asset usage), which is not reported in governmental funds, is recognized and reported in the statement of activities (11,137,908)Gain (Loss) on the sale and disposition of governmental capital assets, which is not reported in governmental funds, is reported in the statement of activities 5,079,551 2,169,505
Long-Term Debt:Bond and capital lease principal payments, which are reported as expenditures in governmental funds, are not reported as expenditures in the statement of activities 4,165,698 Costs related to debt, such as premiums, discounts, and other similar items, are reported as revenues or expenditures in governmental funds when debit is issued. They are deferred in the statement of net position and recognized over the life of the bond issue in the statement of activities 326,090
Long-term bond and capital lease financing proceeds, which are reported as "other financing sources" in governmental funds, are not recognized or reported in the statement of activities. (54,254) 4,437,534
Interfund Transactions:
Profit or (loss) from internal service funds, which is reported separately in proprietary fund statements, is credited or charged to governmental expenses in the statement of activities 936,392 Other interfund transactions, which are reported in governmental funds, are eliminated in the statement of activities, except for a residual amount outstanding between governmental and business activities (1,895,527)Unbilled internal service costs from the County's cost allocation plan, which is not allocated to service users in governmental fund statements, is allocated to service users in the statement of activities, resulting in a residual amount outstanding between governmental and business activities 2,090,851 1,131,716
Other:Long term (non-available) revenues, which are deferred in governmental funds, are reported as revenues (or as a debit adjustment) in the statement of activities (972,449)
Compensated absences, other post employment benefits and pensions, which are not reported in governmental funds, are reported as an expense in the statement of activities 7,421,338 6,448,889
Change in net position for governmental funds as shown in the
Statement of Activities 25,081,134$
Reconciliation of The Statement of Revenues, Expenditures andChanges in Fund Balances of Governmental Funds
To The Statement of ActivitiesFor The Year Ended December 31, 2019
See accompanying notes to financial statements
Thurston County, Washington 2019
44
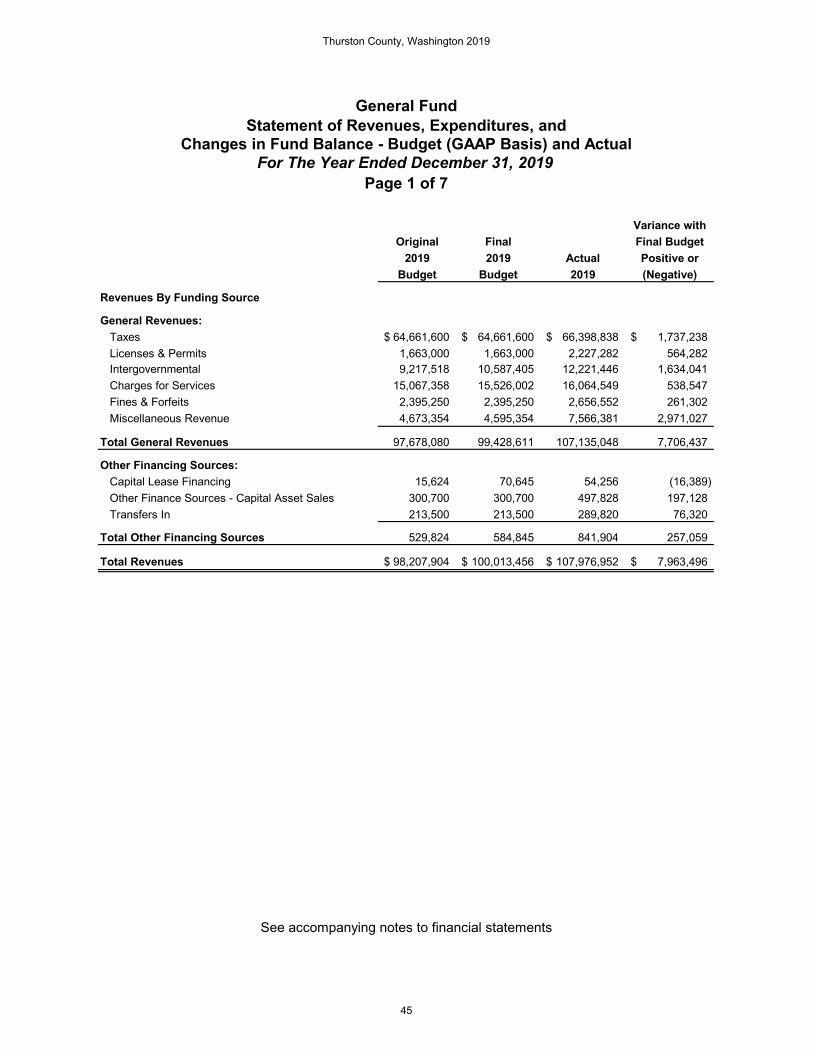
Variance withOriginal Final Final Budget
2019 2019 Actual Positive orBudget Budget 2019 (Negative)
Revenues By Funding Source
General Revenues: Taxes 64,661,600$ 64,661,600$ 66,398,838$ 1,737,238$ Licenses & Permits 1,663,000 1,663,000 2,227,282 564,282 Intergovernmental 9,217,518 10,587,405 12,221,446 1,634,041 Charges for Services 15,067,358 15,526,002 16,064,549 538,547 Fines & Forfeits 2,395,250 2,395,250 2,656,552 261,302 Miscellaneous Revenue 4,673,354 4,595,354 7,566,381 2,971,027
Total General Revenues 97,678,080 99,428,611 107,135,048 7,706,437
Other Financing Sources: Capital Lease Financing 15,624 70,645 54,256 (16,389) Other Finance Sources - Capital Asset Sales 300,700 300,700 497,828 197,128 Transfers In 213,500 213,500 289,820 76,320
Total Other Financing Sources 529,824 584,845 841,904 257,059
Total Revenues 98,207,904$ 100,013,456$ 107,976,952$ 7,963,496$
General FundStatement of Revenues, Expenditures, and
Changes in Fund Balance - Budget (GAAP Basis) and ActualFor The Year Ended December 31, 2019
Page 1 of 7
See accompanying notes to financial statements
Thurston County, Washington 2019
45

Variance withOriginal Final Final Budget
2019 2019 Actual Positive orBudget Budget 2019 (Negative)
Expenditures by Department
Assessor's Office: General Government 4,348,489$ 4,348,489$ 4,325,234$ 23,255$
Total Assessor's Office 4,348,489 4,348,489 4,325,234 23,255
Auditor's Office: General Government 6,328,857 6,328,857 6,041,610 287,247 Debt Service: Principal 6,300 6,300 6,394 (94) Interest and Fiscal Charges 6,277 6,277 699 5,578 Transfers Out 125,000 125,000 125,000 -
Total Auditor's Office 6,466,434 6,466,434 6,173,703 292,731
Public Defense: Public Safety 6,515,378 6,711,848 6,642,856 68,992 Capital Outlay - 10,752 10,752 - Debt Service: Principal 2,894 2,894 9,278 (6,384) Interest and Fiscal Charges 80 80 2,224 (2,144)
Total Public Defense 6,518,352 6,725,574 6,665,110 60,464
Clerk's Office: Public Safety 3,729,136 3,886,169 3,737,729 148,440 Capital Outlay - - 13,447 (13,447) Debt Service: Principal 12,447 12,447 14,786 (2,339) Interest and Fiscal Charges 2,829 2,829 1,364 1,465
Total Clerk's Office 3,744,412 3,901,445 3,767,326 134,119
Page 2 of 7
General FundStatement of Revenues, Expenditures, and
Changes in Fund Balance - Budget (GAAP Basis) and ActualFor The Year Ended December 31, 2019
See accompanying notes to financial statements
Thurston County, Washington 2019
46
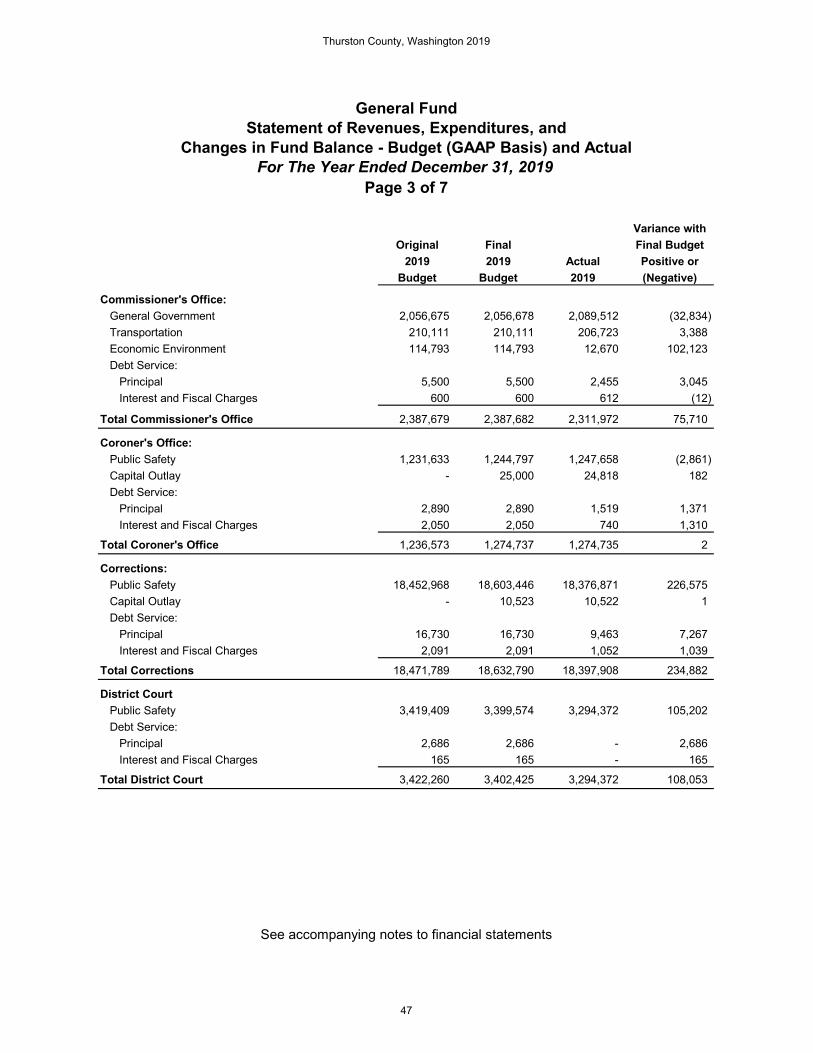
Variance withOriginal Final Final Budget
2019 2019 Actual Positive orBudget Budget 2019 (Negative)
Commissioner's Office: General Government 2,056,675 2,056,678 2,089,512 (32,834) Transportation 210,111 210,111 206,723 3,388 Economic Environment 114,793 114,793 12,670 102,123 Debt Service: Principal 5,500 5,500 2,455 3,045 Interest and Fiscal Charges 600 600 612 (12)
Total Commissioner's Office 2,387,679 2,387,682 2,311,972 75,710
Coroner's Office: Public Safety 1,231,633 1,244,797 1,247,658 (2,861) Capital Outlay - 25,000 24,818 182 Debt Service: Principal 2,890 2,890 1,519 1,371 Interest and Fiscal Charges 2,050 2,050 740 1,310
Total Coroner's Office 1,236,573 1,274,737 1,274,735 2
Corrections: Public Safety 18,452,968 18,603,446 18,376,871 226,575 Capital Outlay - 10,523 10,522 1 Debt Service: Principal 16,730 16,730 9,463 7,267 Interest and Fiscal Charges 2,091 2,091 1,052 1,039
Total Corrections 18,471,789 18,632,790 18,397,908 234,882
District Court Public Safety 3,419,409 3,399,574 3,294,372 105,202 Debt Service: Principal 2,686 2,686 - 2,686 Interest and Fiscal Charges 165 165 - 165
Total District Court 3,422,260 3,402,425 3,294,372 108,053
General FundStatement of Revenues, Expenditures, and
Changes in Fund Balance - Budget (GAAP Basis) and ActualFor The Year Ended December 31, 2019
Page 3 of 7
See accompanying notes to financial statements
Thurston County, Washington 2019
47

Variance withOriginal Final Final Budget
2019 2019 Actual Positive orBudget Budget 2019 (Negative)
Emergency Management: Public Safety 1,691,196 1,631,611 1,414,775 216,836 Transfers Out 2,000 2,000 2,000 -
Emergency Management 1,693,196 1,633,611 1,416,775 216,836
Human Resources: General Government 1,837,346 1,837,346 1,630,126 207,220 Public Safety 147,573 147,573 115,951 31,622 Principal 9,858 9,858 2,896 6,962 Interest and Fiscal Charges 2,656 2,656 588 2,068
Total Human Resources 1,997,433 1,997,433 1,749,561 247,872
Juvenile Probation: Public Safety 7,064,249 7,059,191 6,516,355 542,836 Capital Outlay 15,624 27,739 11,351 16,388 Debt Service: Principal - - 5,015 (5,015) Interest and Fiscal Charges - - 1,143 (1,143)
Total Juvenile Probation 7,079,873 7,086,930 6,533,864 553,066
Page 4 of 7
General FundStatement of Revenues, Expenditures, and
Changes in Fund Balance - Budget (GAAP Basis) and ActualFor The Year Ended December 31, 2019
See accompanying notes to financial statements
Thurston County, Washington 2019
48

Variance withOriginal Final Final Budget
2019 2019 Actual Positive orBudget Budget 2019 (Negative)
Non-Departmental: General Government 1,367,579 1,064,520 873,381 191,139 Public Safety 170,000 292,000 291,979 21 Utilities & Environment 708,240 708,240 739,058 (30,818) Transportation 6,500 6,500 19,826 (13,326) Economic Environment 308,500 381,559 327,898 53,661 Transfers Out 2,111,351 2,315,682 2,272,717 42,965
Total Non-Departmental 4,672,170 4,768,501 4,524,859 243,642
Planning: Economic Environment 2,091,530 2,151,529 1,825,705 325,824
Total Planning 2,091,530 2,151,529 1,825,705 325,824
Pretrial Services: Public Safety 625,246 622,098 579,899 42,199 Capital Outlay - 8,500 8,500 - Debt Service: Principal - - 850 (850) Interest and Fiscal Charges - - 322 (322)
Total Pretrial Services 625,246 630,598 589,571 41,027
Prosecuting Attorney: Public Safety 9,337,546 9,452,696 9,173,753 278,943 Capital Outlay 30,000 13,131 13,131 - Debt Service: Principal 21,300 21,300 16,409 4,891 Interest and Fiscal Charges 4,900 4,900 3,515 1,385
Total Prosecuting Attorney 9,393,746 9,492,027 9,206,808 285,219
State Examiner: General Government 131,000 149,000 138,338 10,662
Total State Examiner 131,000 149,000 138,338 10,662
General FundStatement of Revenues, Expenditures, and
Changes in Fund Balance - Budget (GAAP Basis) and ActualFor The Year Ended December 31, 2019
Page 5 of 7
See accompanying notes to financial statements
Thurston County, Washington 2019
49

Variance withOriginal Final Final Budget
2019 2019 Actual Positive orBudget Budget 2019 (Negative)
Sheriff: Public Safety 19,099,351 19,704,992 19,608,691 96,301 Capital Outlay 5,000 5,000 10,000 (5,000) Principal 9,079 9,079 9,777 (698) Interest and Fiscal Charges 2,867 2,867 489 2,378 Transfers Out 142,000 142,000 130,000 12,000
Total Sheriff 19,258,297 19,863,938 19,758,957 104,981
Superior Court: Public Safety 5,522,973 5,522,654 5,374,760 147,894 Debt Service: Principal 5,300 5,300 - 5,300 Interest and Fiscal Charges 2,623 2,623 - 2,623
Total Superior Court 5,530,896 5,530,577 5,374,760 155,817
Treasurer's Office General Government 1,244,662 1,242,162 1,214,404 27,758
Total Treasurer's Office 1,244,662 1,242,162 1,214,404 27,758
WSU Extension Culture and Recreation 491,879 491,879 447,679 44,200 Debt Service: Principal 1,417 1,417 2,358 (941) Interest and Fiscal Charges 1,615 1,615 706 909
Total WSU Extension 494,911 494,911 450,743 44,168
Total General Fund Expenditures 100,808,948 102,180,793 98,994,705 3,186,088
Page 6 of 7
General FundStatement of Revenues, Expenditures, and
Changes in Fund Balance - Budget (GAAP Basis) and ActualFor The Year Ended December 31, 2019
See accompanying notes to financial statements
Thurston County, Washington 2019
50
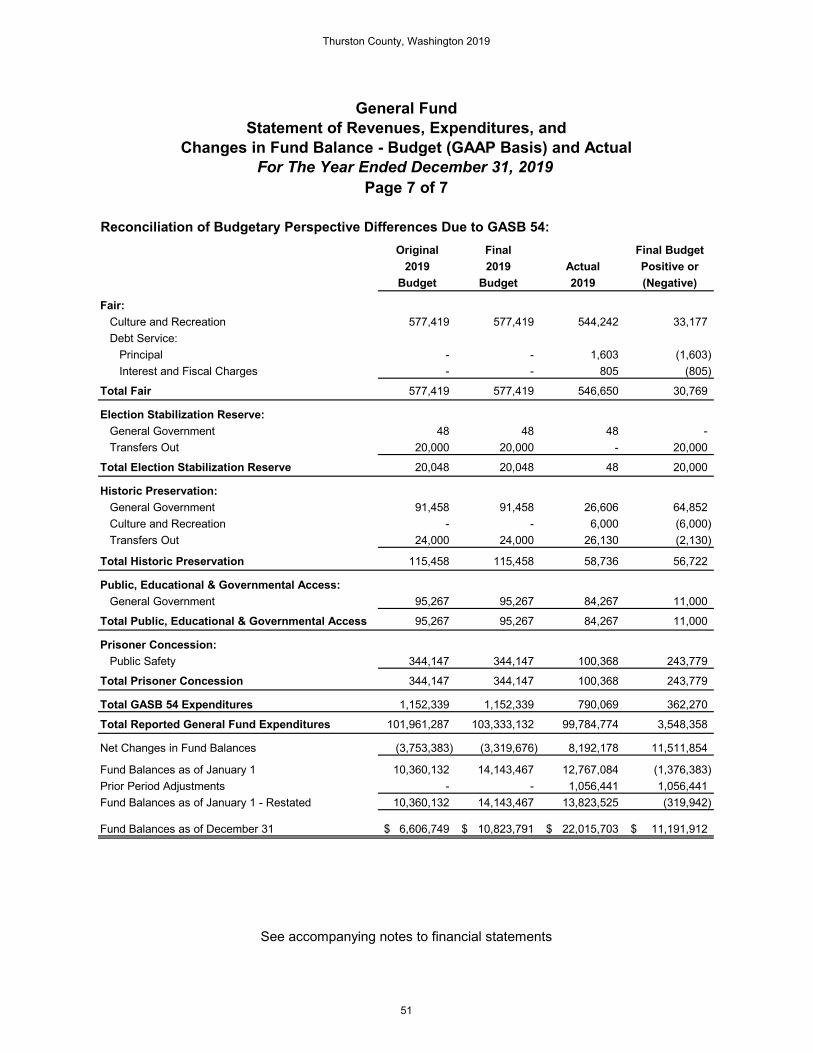
Original Final Final Budget2019 2019 Actual Positive or
Budget Budget 2019 (Negative)
Fair: Culture and Recreation 577,419 577,419 544,242 33,177 Debt Service: Principal - - 1,603 (1,603) Interest and Fiscal Charges - - 805 (805)
Total Fair 577,419 577,419 546,650 30,769
Election Stabilization Reserve: General Government 48 48 48 - Transfers Out 20,000 20,000 - 20,000
Total Election Stabilization Reserve 20,048 20,048 48 20,000
Historic Preservation: General Government 91,458 91,458 26,606 64,852 Culture and Recreation - - 6,000 (6,000) Transfers Out 24,000 24,000 26,130 (2,130)
Total Historic Preservation 115,458 115,458 58,736 56,722
Public, Educational & Governmental Access: General Government 95,267 95,267 84,267 11,000
Total Public, Educational & Governmental Access 95,267 95,267 84,267 11,000
Prisoner Concession: Public Safety 344,147 344,147 100,368 243,779
Total Prisoner Concession 344,147 344,147 100,368 243,779
Total GASB 54 Expenditures 1,152,339 1,152,339 790,069 362,270
Total Reported General Fund Expenditures 101,961,287 103,333,132 99,784,774 3,548,358
Net Changes in Fund Balances (3,753,383) (3,319,676) 8,192,178 11,511,854
Fund Balances as of January 1 10,360,132 14,143,467 12,767,084 (1,376,383) Prior Period Adjustments - - 1,056,441 1,056,441 Fund Balances as of January 1 - Restated 10,360,132 14,143,467 13,823,525 (319,942)
Fund Balances as of December 31 6,606,749$ 10,823,791$ 22,015,703$ 11,191,912$
Reconciliation of Budgetary Perspective Differences Due to GASB 54:
See accompanying notes to financial statements
General FundStatement of Revenues, Expenditures, and
Changes in Fund Balance - Budget (GAAP Basis) and ActualFor The Year Ended December 31, 2019
Page 7 of 7
Thurston County, Washington 2019
51

Variance withOriginal Final Final Budget
2019 2019 Actual Positive orBudget Budget 2019 (Negative)
Revenues: Taxes 11,153,000$ 11,153,000$ 11,223,660$ 70,660$ Intergovernmental 62,135 62,135 81,123 18,988 Charges for Services 24,030 24,030 28,044 4,014 Miscellaneous Revenue 304,370 304,370 295,923 (8,447)
Total Revenues 11,543,535 11,543,535 11,628,750 85,215
Expenditures:Current: Health & Human Services 13,977,557 13,977,557 13,504,108 473,449 Capital Outlay 1,281,066 1,281,066 545,385 735,681 Debt Service: Principal 4,532 4,532 3,307 1,225 Interest & Fiscal Charges 381 381 646 (265)
Total Expenditures 15,263,536 15,263,536 14,053,446 1,210,090
Excess (Deficiency) of Revenues Over Expenditures (3,720,001) (3,720,001) (2,424,696) 1,295,305
Other Financing Sources (Uses) Sale of Capital Assets 33,000 33,000 136,926 103,926 Transfers In 2,500 2,500 2,500 -
Total Other Financing Sources (Uses) 35,500 35,500 139,426 103,926
Net Changes In Fund Balances (3,684,501) (3,684,501) (2,285,270) 1,399,231
Fund Balances as of January 1 9,649,400 9,454,130 9,357,671 (96,459)
Fund Balances as of December 31 5,964,899$ 5,769,629$ 7,072,401$ 1,302,772$
Medic OneStatement of Revenues, Expenditures, and
Changes in Fund Balance - Budget (GAAP Basis) and ActualFor The Year Ended December 31, 2019
See accompanying notes to financial statements
Thurston County, Washington 2019
52
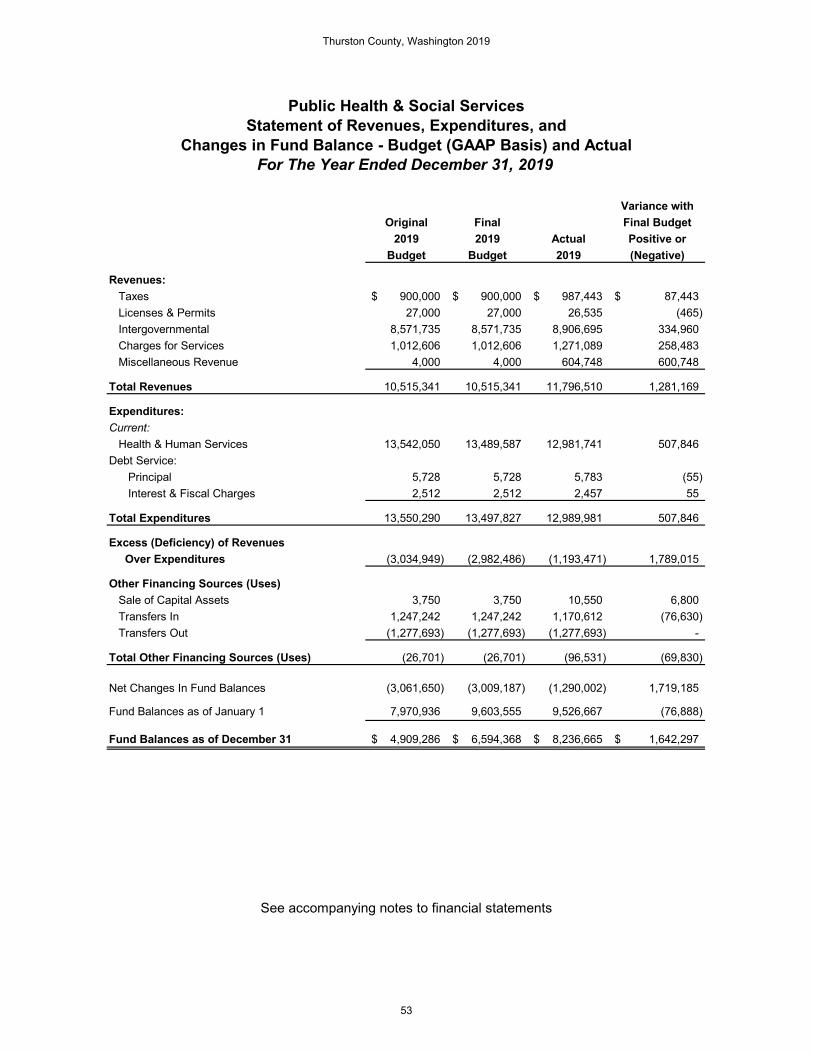
Variance withOriginal Final Final Budget
2019 2019 Actual Positive orBudget Budget 2019 (Negative)
Revenues: Taxes 900,000$ 900,000$ 987,443$ 87,443$ Licenses & Permits 27,000 27,000 26,535 (465) Intergovernmental 8,571,735 8,571,735 8,906,695 334,960 Charges for Services 1,012,606 1,012,606 1,271,089 258,483 Miscellaneous Revenue 4,000 4,000 604,748 600,748
Total Revenues 10,515,341 10,515,341 11,796,510 1,281,169
Expenditures:Current: Health & Human Services 13,542,050 13,489,587 12,981,741 507,846 Debt Service: Principal 5,728 5,728 5,783 (55) Interest & Fiscal Charges 2,512 2,512 2,457 55
Total Expenditures 13,550,290 13,497,827 12,989,981 507,846
Excess (Deficiency) of Revenues Over Expenditures (3,034,949) (2,982,486) (1,193,471) 1,789,015
Other Financing Sources (Uses) Sale of Capital Assets 3,750 3,750 10,550 6,800 Transfers In 1,247,242 1,247,242 1,170,612 (76,630) Transfers Out (1,277,693) (1,277,693) (1,277,693) -
Total Other Financing Sources (Uses) (26,701) (26,701) (96,531) (69,830)
Net Changes In Fund Balances (3,061,650) (3,009,187) (1,290,002) 1,719,185
Fund Balances as of January 1 7,970,936 9,603,555 9,526,667 (76,888)
Fund Balances as of December 31 4,909,286$ 6,594,368$ 8,236,665$ 1,642,297$
Public Health & Social ServicesStatement of Revenues, Expenditures, and
Changes in Fund Balance - Budget (GAAP Basis) and ActualFor The Year Ended December 31, 2019
See accompanying notes to financial statements
Thurston County, Washington 2019
53
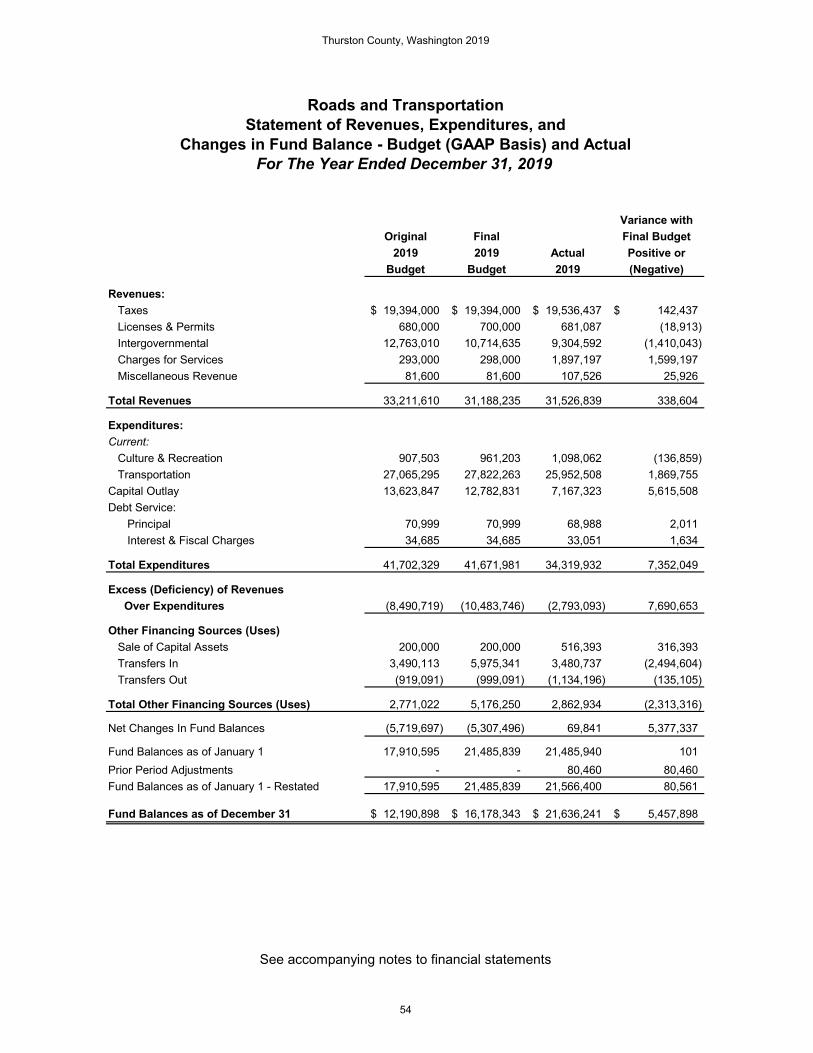
Variance withOriginal Final Final Budget
2019 2019 Actual Positive orBudget Budget 2019 (Negative)
Revenues: Taxes 19,394,000$ 19,394,000$ 19,536,437$ 142,437$ Licenses & Permits 680,000 700,000 681,087 (18,913) Intergovernmental 12,763,010 10,714,635 9,304,592 (1,410,043) Charges for Services 293,000 298,000 1,897,197 1,599,197 Miscellaneous Revenue 81,600 81,600 107,526 25,926
Total Revenues 33,211,610 31,188,235 31,526,839 338,604
Expenditures:Current: Culture & Recreation 907,503 961,203 1,098,062 (136,859) Transportation 27,065,295 27,822,263 25,952,508 1,869,755 Capital Outlay 13,623,847 12,782,831 7,167,323 5,615,508 Debt Service: Principal 70,999 70,999 68,988 2,011 Interest & Fiscal Charges 34,685 34,685 33,051 1,634
Total Expenditures 41,702,329 41,671,981 34,319,932 7,352,049
Excess (Deficiency) of Revenues Over Expenditures (8,490,719) (10,483,746) (2,793,093) 7,690,653
Other Financing Sources (Uses) Sale of Capital Assets 200,000 200,000 516,393 316,393 Transfers In 3,490,113 5,975,341 3,480,737 (2,494,604) Transfers Out (919,091) (999,091) (1,134,196) (135,105)
Total Other Financing Sources (Uses) 2,771,022 5,176,250 2,862,934 (2,313,316)
Net Changes In Fund Balances (5,719,697) (5,307,496) 69,841 5,377,337
Fund Balances as of January 1 17,910,595 21,485,839 21,485,940 101 Prior Period Adjustments - - 80,460 80,460 Fund Balances as of January 1 - Restated 17,910,595 21,485,839 21,566,400 80,561
Fund Balances as of December 31 12,190,898$ 16,178,343$ 21,636,241$ 5,457,898$
Roads and TransportationStatement of Revenues, Expenditures, and
Changes in Fund Balance - Budget (GAAP Basis) and ActualFor The Year Ended December 31, 2019
See accompanying notes to financial statements
Thurston County, Washington 2019
54

This Page Intentionally Left Blank
Thurston County, Washington 2019
55
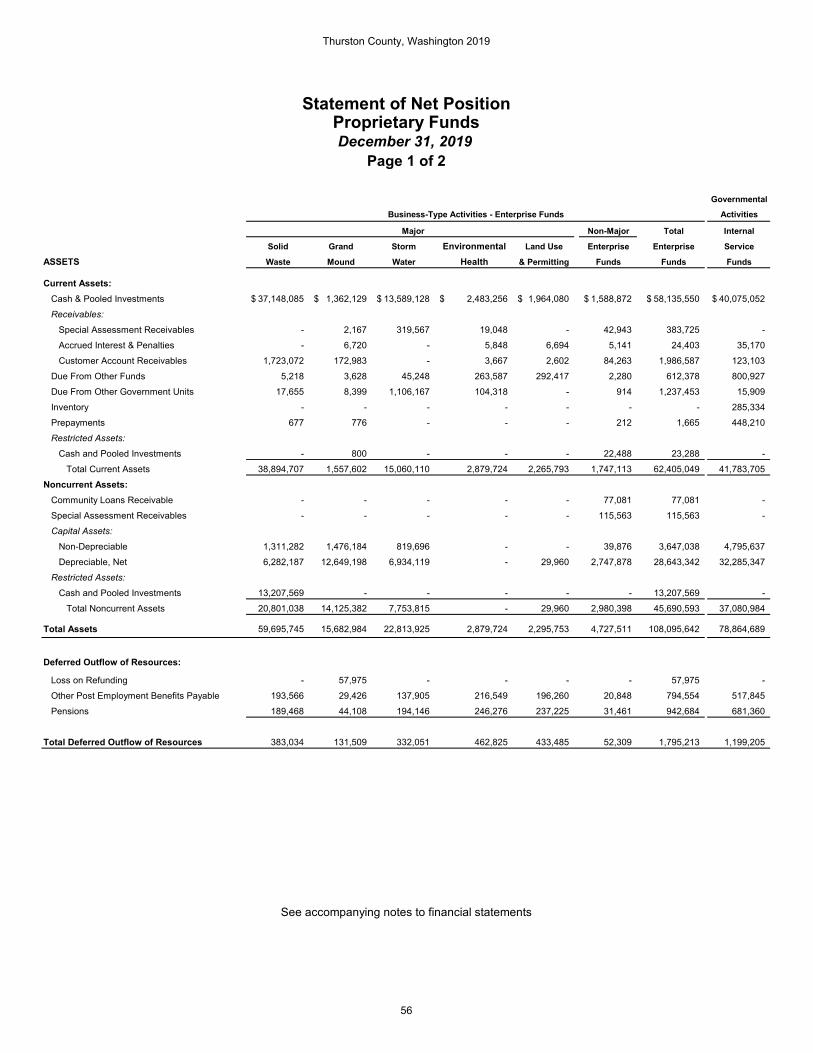
Governmental
Activities
Major Non-Major Total Internal
Solid Grand Storm Environmental Land Use Enterprise Enterprise Service
ASSETS Waste Mound Water Health & Permitting Funds Funds Funds
Current Assets: Cash & Pooled Investments 37,148,085$ 1,362,129$ 13,589,128$ 2,483,256$ 1,964,080$ 1,588,872$ 58,135,550$ 40,075,052$ Receivables:
Special Assessment Receivables - 2,167 319,567 19,048 - 42,943 383,725 - Accrued Interest & Penalties - 6,720 - 5,848 6,694 5,141 24,403 35,170 Customer Account Receivables 1,723,072 172,983 - 3,667 2,602 84,263 1,986,587 123,103 Due From Other Funds 5,218 3,628 45,248 263,587 292,417 2,280 612,378 800,927 Due From Other Government Units 17,655 8,399 1,106,167 104,318 - 914 1,237,453 15,909 Inventory - - - - - - - 285,334 Prepayments 677 776 - - - 212 1,665 448,210 Restricted Assets:
Cash and Pooled Investments - 800 - - - 22,488 23,288 - Total Current Assets 38,894,707 1,557,602 15,060,110 2,879,724 2,265,793 1,747,113 62,405,049 41,783,705 Noncurrent Assets: Community Loans Receivable - - - - - 77,081 77,081 - Special Assessment Receivables - - - - - 115,563 115,563 - Capital Assets:
Non-Depreciable 1,311,282 1,476,184 819,696 - - 39,876 3,647,038 4,795,637 Depreciable, Net 6,282,187 12,649,198 6,934,119 - 29,960 2,747,878 28,643,342 32,285,347 Restricted Assets:
Cash and Pooled Investments 13,207,569 - - - - - 13,207,569 - Total Noncurrent Assets 20,801,038 14,125,382 7,753,815 - 29,960 2,980,398 45,690,593 37,080,984
Total Assets 59,695,745 15,682,984 22,813,925 2,879,724 2,295,753 4,727,511 108,095,642 78,864,689
Deferred Outflow of Resources:
Loss on Refunding - 57,975 - - - - 57,975 - Other Post Employment Benefits Payable 193,566 29,426 137,905 216,549 196,260 20,848 794,554 517,845 Pensions 189,468 44,108 194,146 246,276 237,225 31,461 942,684 681,360
Total Deferred Outflow of Resources 383,034 131,509 332,051 462,825 433,485 52,309 1,795,213 1,199,205
Statement of Net PositionProprietary FundsDecember 31, 2019
Page 1 of 2
Business-Type Activities - Enterprise Funds
See accompanying notes to financial statements
Thurston County, Washington 2019
56

Governmental
Activities
Major Non-Major Total Internal
Solid Grand Storm Environmental Land Use Enterprise Enterprise Service
ASSETS Waste Mound Water Health & Permitting Funds Funds Funds
Current Liabilities: Accounts Payable 2,984,351 174,060 496,140 224,937 180,785 59,765 4,120,038 1,435,635 Notes/Leases Payable 4,868 5,165 - - 7,949 44,366 62,348 5,254 Due To Other Funds 243,064 5,517 378,510 - 20 3,297 630,408 359,954 Compensated Absences 7,897 3,135 9,834 14,081 12,797 675 48,419 33,763 Claims and Judgments Payable - - - - - - - 548,671 Total Other Post Employment Benefits Liability 21,802 3,312 15,533 24,391 22,106 2,346 89,490 58,325 Unearned Revenue 2,987 46,222 - - - 13,969 63,178 - Lim. Tax G. O. Bond - Current Portion - - - - - - - 112,500 Spec Assessment Debt - Govern. Commitment - - - - - 78,282 78,282 - Total Current Liabilities 3,264,969 237,411 900,017 263,409 223,657 202,700 5,092,163 2,554,102 Noncurrent Liabilities: Limited G.O. Bonds Payable - 157,207 - - - - 157,207 1,525,350 Special Assess. Debt - Gov. Commitment - - - - - 34,847 34,847 - Compensated Absences 147,489 58,563 183,678 262,981 239,000 12,606 904,317 630,573 Total Other Post Employment Benefits Liability 1,549,865 235,624 1,104,190 1,733,882 1,571,442 166,936 6,361,939 4,146,329 Claims and Judgments Payable - - - - - - - 3,568,515 Notes/Leases Payable 8,911 30,990 - - 6,805 356,227 402,933 5,961 Accumulated Landfill Closure Costs 13,850,238 - - - - - 13,850,238 - Net Pension Liability 803,994 187,150 823,836 1,045,049 1,006,645 133,504 4,000,178 2,891,301 Total Noncurrent Liabilities 16,360,497 669,534 2,111,704 3,041,912 2,823,892 704,120 25,711,659 12,768,029
Total Liabilities 19,625,466 906,945 3,011,721 3,305,321 3,047,549 906,820 30,803,822 15,322,131
Deferred Inflow of Resources:
Other Post Employment Benefits Payable 56,030 8,518 39,918 62,683 56,810 6,036 229,995 149,895
Pensions 406,406 94,600 416,436 528,255 508,843 67,486 2,022,026 1,461,503
Total Deferred Inflow of Resources 462,436 103,118 456,354 590,938 565,653 73,522 2,252,021 1,611,398
NET POSITION
Net Investment in Capital Assets 7,579,690 13,989,995 7,753,815 - 15,206 2,674,625 32,013,331 35,431,919 Restricted For: Debt Service - 3,966 - - - 181,531 185,497 - Unrestricted (Deficit) 32,411,187 810,469 11,924,086 (553,710) (899,170) 943,322 44,636,184 27,698,446
Total Net Position 39,990,877$ 14,804,430$ 19,677,901$ (553,710)$ (883,964)$ 3,799,478$ 76,835,012$ 63,130,365$
See accompanying notes to financial statements
Statement of Net PositionProprietary FundsDecember 31, 2019
Page 2 of 2
Business-Type Activities - Enterprise Funds
Thurston County, Washington 2019
57
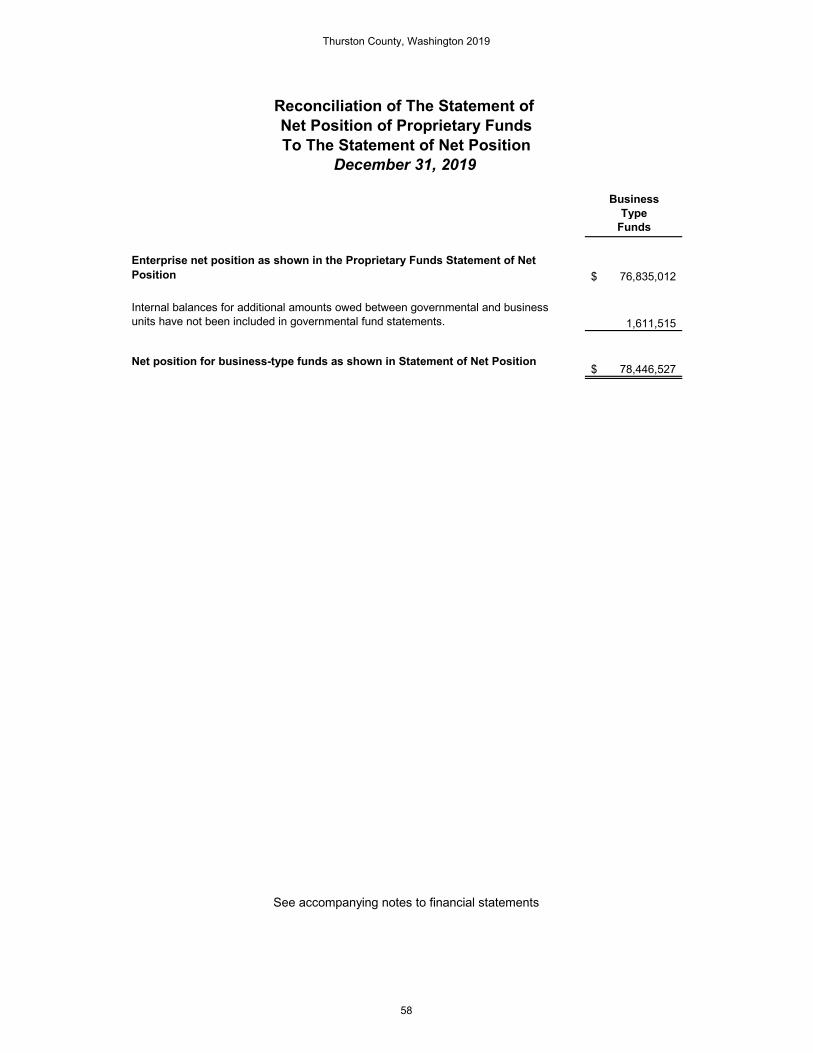
BusinessType
Funds
Enterprise net position as shown in the Proprietary Funds Statement of Net Position 76,835,012$
Internal balances for additional amounts owed between governmental and business units have not been included in governmental fund statements. 1,611,515
Net position for business-type funds as shown in Statement of Net Position78,446,527$
Reconciliation of The Statement of Net Position of Proprietary FundsTo The Statement of Net Position
December 31, 2019
See accompanying notes to financial statements
Thurston County, Washington 2019
58

GovernmentalActivities
Major Non-Major Total InternalSolid Grand Storm Environmental Land Use Enterprise Enterprise ServiceWaste Mound Water Health & Permitting Funds Funds Funds
Operating Revenues: Charges for Services 25,972,911$ 1,993,543$ 7,017,510$ 4,745,466$ 3,894,685$ 846,136$ 44,470,251$ 20,757,317$
Equipment Rental - - - - - - - 8,244,132
Miscellaneous 135,137 46,262 108 582,896 95 14,808 779,306 16,093
Total Operating Revenues 26,108,048 2,039,805 7,017,618 5,328,362 3,894,780 860,944 45,249,557 29,017,542
Operating Expenses: Salaries and Benefits 2,429,040 615,076 2,570,327 6,850,000 3,352,171 400,988 16,217,602 9,993,783
Other Supplies and Expenses 94,316 94,979 194,739 118,649 59,688 80,678 643,049 3,123,318
Contractual Services 3,252,144 407,809 527,420 128,238 118,936 188,712 4,623,259 7,643,260
Longhaul Contract 14,687,582 - - - - - 14,687,582 -
Interfund Services and Charges 2,052,224 396,193 1,552,472 320,848 1,620,377 126,599 6,068,713 2,258,897
Depreciation/Amortization 1,037,038 646,390 489,158 - 7,820 156,421 2,336,827 4,387,454
Claims Payments - - - - - - - 1,725,013
Total Operating Expenses 23,552,344 2,160,447 5,334,116 7,417,735 5,158,992 953,398 44,577,032 29,131,725
Operating Income (Loss) 2,555,704 (120,642) 1,683,502 (2,089,373) (1,264,212) (92,454) 672,525 (114,183)
Nonoperating Revenue (Expenses): Interest Revenue - 64,114 40,264 30,990 76,944 48,060 260,372 333,465
Operating Grants & Contributions 58,858 - 58,704 193,185 - - 310,747 30,406
Gain/Loss on Disposition of Capital Assets - - (3,819) - - - (3,819) 160,099
Insurance Recoveries - - - - - - - 82,830
Interest Expense & Fiscal Charges (1,914) (29,983) - - (559) (11,152) (43,608) (85,455)
Total Nonoperating Revenue (Expense) 56,944 34,131 95,149 224,175 76,385 36,908 523,692 521,345
Income Before Contributions and Transfers 2,612,648 (86,511) 1,778,651 (1,865,198) (1,187,827) (55,546) 1,196,217 407,162
Capital Grants & Contributions - 172,721 1,105,553 - - 30,107 1,308,381 2,743
Interfund Capital Contributions - - - - - - - 219,198
Special Item:
Transfers In 8,000 961,424 5,250 1,327,488 594,470 32,815 2,929,447 1,679,749
Transfers Out (4,162) (35,748) (188,082) (16,000) - - (243,992) (1,153,262)
Change in Net Position 2,616,486 1,011,886 2,701,372 (553,710) (593,357) 7,376 5,190,053 1,155,590
Net Position as of January 1 37,374,391 13,792,544 16,976,529 - (290,607) 3,792,102 71,644,959 61,974,775
Net Position as of December 31 39,990,877$ 14,804,430$ 19,677,901$ (553,710)$ (883,964)$ 3,799,478$ 76,835,012$ 63,130,365$
See accompanying notes to financial statements
Statement of Revenues, Expenses and Changes In Fund Net PositionProprietary Funds
For The Year Ended December 31, 2019
Business-Type Activities - Enterprise Funds
Thurston County, Washington 2019
59

Business-TypeFunds
Change in enterprise net position as shown in the Statement of Revenues, Expenses and Changes in Fund Net Position 5,190,053$
Internal services, provided primarily by internal service funds, also occurs between other County funds. The net effect of the elimination of these services is reflected in the statement of activities: Other interfund transactions 1,895,527 Allocated direct and indirect costs from the County's cost plan (2,090,851)
Change in net position for business-type funds as shown in the Statement of Activities 4,994,729$
Reconciliation of The Statement of Revenues, Expenses andChanges In Fund Net Position of Proprietary Funds
To The Statement of ActivitiesFor The Year Ended December 31, 2019
See accompanying notes to financial statements
Thurston County, Washington 2019
60

GovernmentalActivities
Major Non-Major Total InternalSolid Grand Storm Environmental Land Use Enterprise Enterprise ServiceWaste Mound Water Health & Permitting Funds Funds Funds
Cash Flows from Operating Activities: Cash Received from Customers 25,792,999$ 2,463,397$ 6,925,609$ 5,189,221$ 3,698,907$ 855,303 44,925,436 -$ Cash Received from Interfund Services - - - - - - - 28,610,361 Cash Paid for Goods & Services (17,265,222) (820,799) (313,503) (21,950) (190,281) (267,346) (18,879,101) (13,081,368) Cash Paid for Interfund Services (2,052,224) (396,193) (1,552,472) (320,848) (1,620,377) (126,599) (6,068,713) (2,258,897) Cash Paid to Employees (2,419,103) (587,655) (2,569,901) (3,769,616) (3,301,141) (425,160) (13,072,576) (9,873,315)
Net Cash Provided (Used) by Operating Activities 4,056,450 658,750 2,489,733 1,076,807 (1,412,892) 36,198 6,905,046 3,396,781 Cash Flows from NoncapitalFinancing Activities: Transfers In 8,000 961,424 5,250 1,327,488 578,470 32,815 2,913,447 1,662,259 Transfers Out (4,162) (35,748) (181,776) - - - (221,686) (1,142,078) Grant Proceeds 104,946 - 58,704 88,867 - - 252,517 30,406 Community Loans Issued to Homeowners - - - - - 34,826 34,826 - Community Loan Financing Payments - - - - - (48,250) (48,250) - Insurance Recoveries - - - - - - - 82,830 Interest Payments - - - - - (11,152) (11,152) - Net Cash Provided (Used) by NoncapitalFinancing Activities 108,784 925,676 (117,822) 1,416,355 578,470 8,239 2,919,702 633,417 Cash Flows from Capital &Related Financing Activities: Cash Proceeds from Sale of Capital Assets - - - - - - - 587,083 Capital Asset Purchases (20,405) (1,303,238) (1,339,009) (16,000) - (58,328) (2,736,980) (3,827,783) Bond/Loan Payments (4,302) (1,244,165) - - (7,718) (78,282) (1,334,467) (113,946) Grant Proceeds - - 277,412 - - - 277,412 - Contributed Capital - 172,721 - - - 30,107 202,828 219,198 Assessment Receipts - 96,818 - (19,048) - 50,413 128,183 - Interest Payments (1,914) (19,884) - - (559) - (22,357) (85,455) Net Cash Provided (Used) by Capital &Related Financing Activities (26,621) (2,297,748) (1,061,597) (35,048) (8,277) (56,090) (3,485,381) (3,220,903)
Cash Flows from Investing Activities: Interest Receipts - 73,358 40,264 25,142 81,086 49,115 268,965 331,557
Net Cash Provided (Used) by Investing Activities - 73,358 40,264 25,142 81,086 49,115 268,965 331,557 Net Increase (Decrease) in Cash &Cash Equivalents 4,138,613 (639,964) 1,350,578 2,483,256 (761,613) 37,462 6,608,332 1,140,852
Cash & Cash Equivalents as of January 1 46,217,041 2,002,893 12,238,550 - 2,725,693 1,573,898 64,758,075 38,934,200
Cash & Cash Equivalents as of December 31 50,355,654$ 1,362,929$ 13,589,128$ 2,483,256$ 1,964,080$ 1,611,360$ 71,366,407$ 40,075,052$
Statement Of Cash FlowsProprietary Funds
For The Year Ended December 31, 2019Page 1 of 2
Business-Type Activities - Enterprise Funds
See accompanying notes to financial statements
Thurston County, Washington 2019
61

GovernmentalActivities
Major Non-Major Total InternalSolid Grand Storm Environmental Land Use Enterprise Enterprise ServiceWaste Mound Water Health & Permitting Funds Funds Funds
Reconciliation of Operating Income To NetCash Provided (Used) by Operating Income:Operating Income 2,555,704$ (120,642)$ 1,683,502$ (2,089,373)$ (1,264,212)$ (92,454)$ 672,525$ (114,183)$ Adjustments to Reconcile Operating Incometo Net Cash Provided (Used) by Operating Activities:Depreciation Expense 1,037,038 646,390 489,158 - 7,820 156,421 2,336,827 4,387,454 (Increase) Decrease in: Customer Account Receivables (135,605) 7,824 - (3,667) 17 (10,723) (142,154) 31,150 Special Assessment Receivables - - 50,597 - - - 50,597 - Due from Other Funds (2,219) 441,262 (37,240) (263,587) (40,600) 12,953 110,569 (75,481) Due from Other Government Units - (8,399) - - - (466) (8,865) 27,073 Inventories - - - - - - - 11,355 Prepaid Expense - - - - 105 - 105 (424,949) Increase (Decrease) in: Accounts Payable 1,377,212 (300,511) 296,771 224,937 (11,362) (456) 1,586,591 (40,521) Due to Other Funds (19,438) (17,500) 111,885 - (400) 2,500 77,047 200,873 Claims and Judgments - - - - - - - (336,535) Unearned Revenue 1,021 3,589 - - - 3,692 8,302 - Compensated Absences Payable (39,563) 25,429 11,677 277,062 20,760 (44,370) 250,995 14,367 Other Post Employment Benefits 180,828 13,482 64,050 1,604,407 89,847 9,552 1,962,166 273,393 Net Pension Liability (309,574) (32,174) (180,667) 1,327,028 (214,867) (451) 589,295 (557,215) Accumulated Landfill Closure (588,954) - - - - - (588,954) -
Total Adjustments 1,500,746 779,392 806,231 3,166,180 (148,680) 128,652 6,232,521 3,510,964
Net Cash Provided (Used) by Operating Activities 4,056,450$ 658,750$ 2,489,733$ 1,076,807$ (1,412,892)$ 36,198$ 6,905,046$ 3,396,781$
Noncash Investing, Capital, and FinancingActivities: Disposition of Capital Assets: Gain of Disposition -$ -$ -$ -$ -$ -$ -$ 684,966$ Loss on Disposition -$ -$ (3,819)$ -$ -$ -$ (3,819)$ (1,111,950)$ Transfers In -$ -$ -$ -$ 16,000$ -$ 16,000$ 17,490$ Transfers Out -$ -$ (6,306)$ (16,000)$ -$ -$ (22,306)$ (11,184)$ Transfers To Governmental -$ -$ -$ -$ -$ -$ -$ 1,091,295$
See accompanying notes to financial statements
Statement Of Cash FlowsProprietary Funds
For The Year Ended December 31, 2019Page 2 of 2
Business-Type Activities - Enterprise Funds
Thurston County, Washington 2019
62
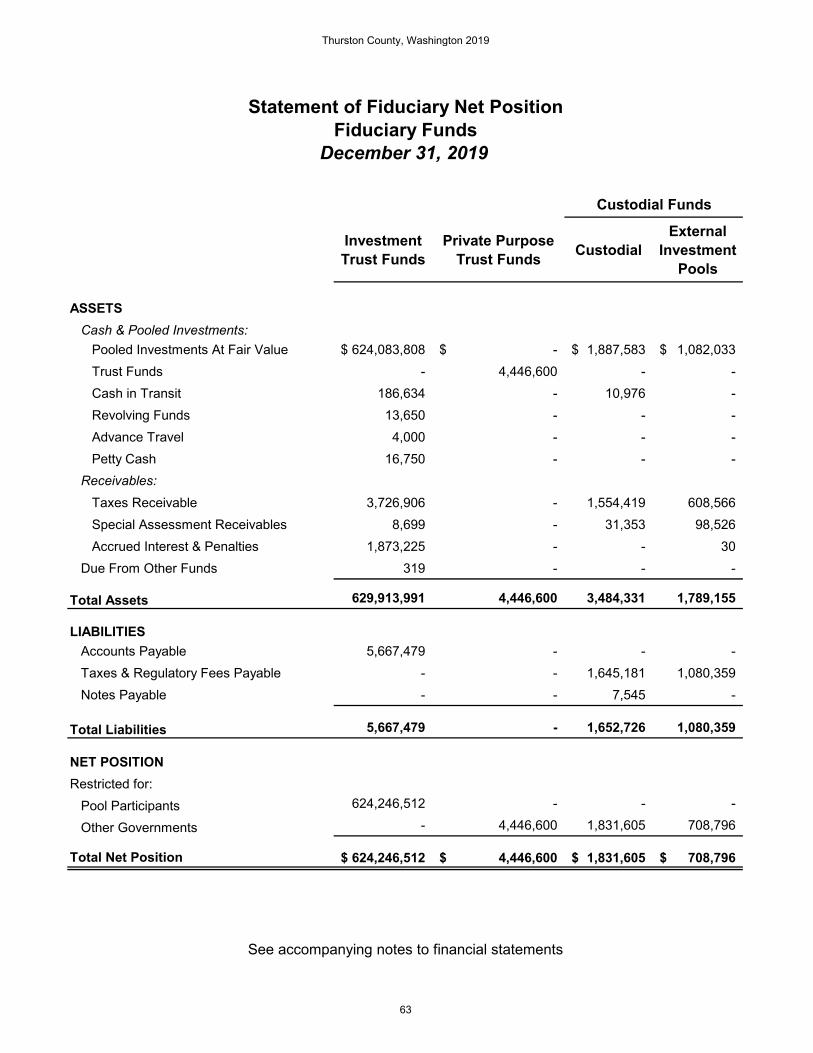
Custodial Funds
Investment Trust Funds
Private Purpose Trust Funds Custodial
External Investment
Pools
ASSETS Cash & Pooled Investments: Pooled Investments At Fair Value 624,083,808$ -$ 1,887,583$ 1,082,033$ Trust Funds - 4,446,600 - - Cash in Transit 186,634 - 10,976 - Revolving Funds 13,650 - - - Advance Travel 4,000 - - - Petty Cash 16,750 - - - Receivables:
Taxes Receivable 3,726,906 - 1,554,419 608,566 Special Assessment Receivables 8,699 - 31,353 98,526 Accrued Interest & Penalties 1,873,225 - - 30 Due From Other Funds 319 - - -
Total Assets 629,913,991 4,446,600 3,484,331 1,789,155
LIABILITIES Accounts Payable 5,667,479 - - - Taxes & Regulatory Fees Payable - - 1,645,181 1,080,359 Notes Payable - - 7,545 -
Total Liabilities 5,667,479 - 1,652,726 1,080,359
NET POSITIONRestricted for: Pool Participants 624,246,512 - - -
Other Governments - 4,446,600 1,831,605 708,796
Total Net Position 624,246,512$ 4,446,600$ 1,831,605$ 708,796$
See accompanying notes to financial statements
Statement of Fiduciary Net PositionFiduciary Funds
December 31, 2019
Thurston County, Washington 2019
63

Investment Trust Funds
Private Purpose Trust
FundsCustodial
External Investment
Pools
ADDITIONS: Contributions Taxes and Assessments Collected 195,531,172$ -$ 126,957,288$ 52,107,632$ Administrative Revenues 308,131 - 932 534 Deposits from Inmates - - 208,141 - Additions by Participants 995,315,083 19,984,703 14,502,401 1,297,206
Total Contributions 1,191,154,386 19,984,703 141,668,762 53,405,372
Investment Income 13,329,317 - 5,987 66,380
Total Additions 1,204,483,703 19,984,703 141,674,749 53,471,752
DEDUCTIONS: Distributions to Participants - 19,554,569 141,396,538 53,709,745 Administrative Costs 308,131 932 534 Purchases of Merchandise - - 169,324 - Distributions by Participants 1,167,495,306 - - -
Total Deductions 1,167,803,437 19,554,569 141,566,794 53,710,279
Change in Net Position 36,680,266 430,134 107,955 (238,527)
Net Position as of January 1, 2019 582,869,212 23,192,126 - - Cumulative Effect of Change in Accounting Principle 4,697,034 (19,614,258) 1,723,650 947,323 Prior Period Adjustment - 438,598 - - Net Position as of January 1 - Restated 587,566,246 4,016,466 1,723,650 947,323
Net Position as of December 31, 2019 624,246,512$ 4,446,600$ 1,831,605$ 708,796$
Statement of Changes in Fiduciary Net PositionFiduciary Funds
December 31, 2019
Custodial Funds
See accompanying notes to financial statements
Thurston County, Washington 2019
64

NOTES TO THE FINANCIAL STATEMENTS Guide to Notes Year ended December 31, 2019 NOTE I – SUMMARY OF SIGNIFICANT ACCOUNTING POLICIES ......................................................... 66
NOTE II – RECONCILIATION OF GOVERNMENT WIDE AND FUND FINANCIAL STATEMENTS ......... 75
NOTE III – STEWARDSHIP, COMPLIANCE, AND ACCOUNTABILITY .................................................... 76
NOTE IV – DEPOSITS AND INVESTMENTS ............................................................................................ 76
NOTE V – EXTERNAL INVESTMENT POOL ............................................................................................ 82
NOTE VI – PROPERTY TAXES ................................................................................................................. 83
NOTE VII – CAPITAL ASSETS AND COMMITMENTS ............................................................................. 85
NOTE VIII – RECEIVABLE BALANCES .................................................................................................... 88
NOTE IX – LONG-TERM AND OTHER SIGNIFICANT DEBT .................................................................... 88
NOTE X – INTERFUND TRANSACTIONS ................................................................................................. 98
NOTE XI – PENSION PLANS .................................................................................................................... 99
NOTE XII – RISK MANAGEMENT ........................................................................................................... 112
NOTE XIII – OTHER POST-EMPLOYMENT BENEFITS .......................................................................... 115
NOTE XIV – JOINT VENTURES/JOINTLY GOVERNED ORGANIZATIONS .......................................... 122
NOTE XV – CLOSURE AND POST CLOSURE CARE COSTS ............................................................... 124
NOTE XVI – FUND BALANCES, GOVERNMENTAL FUNDS ................................................................. 125
NOTE XVII – NET INVESTMENT IN CAPITAL ASSETS ......................................................................... 127
NOTE XVIII – OTHER DISCLOSURES .................................................................................................... 127
NOTE XIX – SUBSEQUENT EVENTS ..................................................................................................... 128
Thurston County, Washington 2019
65

NOTES TO THE FINANCIAL STATEMENTS
Year Ended December 31, 2019
NOTE I – SUMMARY OF SIGNIFICANT ACCOUNTING POLICIES The financial statements of Thurston County have been prepared in conformity with generally accepted accounting principles (GAAP) as applied to governmental units. The Governmental Accounting Standards Board (GASB) is the accepted standard setting body for establishing governmental accounting and financial reporting principles. The significant accounting policies are described below. A. Reporting Entity The County was incorporated in 1852 and operates under the laws of the state of Washington applicable to counties. As required by the generally accepted accounting principles the financial statements present Thurston County, the primary government. During 2019, the County had no component units currently in operation for which it was financially accountable. See next paragraph for a component unit not currently in operation. Thurston County is a statute county, which means the organization of the county is prescribed by state statute. The County has a commissioner form of government with a governing body consisting of three County commissioners. Blended Component Unit: On December 31, 2014, the Thurston County Board of County Commissioners adopted an ordinance establishing the Thurston County Transportation Benefit District (TBD) in unincorporated Thurston County, pursuant to chapter 36.73 of the Revised Code of Washington (RCW). The purpose of the TBD, as an independent taxing authority, is to provide a source of funding for transportation improvements that preserve, maintain, and improve transportation and related infrastructure within the unincorporated limits of Thurston County. The TBD, when operational, will be authorized to collect a $20 per vehicle fee for vehicles registered to owners living in unincorporated Thurston County. An interlocal agreement between the TBD and the County will be entered into for the purpose of identifying the responsibilities of the TBD and the County. The TBD, when operational, will be a component unit of the County because: 1) it is a separate legal entity; 2) The Board of County Commissioners comprises the Board of the TBD and has operational responsibility for the TBD; and 3) the County can impose its will on the TBD. The TBD will be governed by a three-member board composed of the three members of the Thurston County Board of County Commissioners. Although it is legally separated from the County, the TBD will be reported as if it was part of the primary government because its sole purpose is to finance transportation improvements. The TBD is not operational and did not collect any revenues in 2019 because an agreement on a funding mechanism has not been finalized. Therefore, there were no financial operations for the TBD to report in 2019. It is expected that the TBD will begin to collect revenues in the near future. B. Government-Wide and Fund Financial Statements The government-wide financial statements (i.e., the statement of net position and the statement of activities) report information on all of the non-fiduciary activities of the primary government. Governmental activities, which normally are supported by taxes and intergovernmental revenues, are reported separately from business-type activities, which rely to a significant extent on fees and charges for support.
Thurston County, Washington 2019
66

The statement of activities demonstrates the degree to which the direct expenses of a given function or segment is offset by program revenues. Direct expenses are those that are clearly identifiable with a specific function or segment. Our policy is to allocate indirect costs to a specific function or segment. Program revenues include 1) charges to customers or applicants who purchase, use, or directly benefit from goods, services, or privileges provided by a given function or segment and 2) grants and contributions that are restricted to meeting the operational or capital requirements or a particular function or segment. Internally dedicated resources are reported as general revenues rather than program revenues. Taxes and other items not included among program revenues are reported instead as general revenues.
Separate fund financial statements are provided for governmental funds, proprietary funds, and fiduciary funds, even though the latter are excluded from the government-wide financial statements. Major individual governmental funds and major individual enterprise funds are reported as separate columns in the fund financials statements. C. Measurement Focus, Basis of Accounting, and Financial Statement Presentation The government-wide financial statements are reported using the economic resources measurement focus and the accrual basis of accounting, as are the proprietary fund and fiduciary fund financial statements. Under this measurement focus, revenues are recorded when earned and expenses are recorded at the time liabilities are incurred, regardless of the timing of related cash flows. Property taxes are recognized as revenues in the year for which they are levied. Grants and similar items are recognized as revenue as soon as all eligibility requirements imposed by the provider have been met. Fiduciary Funds are not included in the government-wide statements. Governmental fund financial statements are reported using the current financial resources measurement focus and the modified accrual basis of accounting. Revenues are recognized as soon as they are both measurable and available. Revenues are considered to be available when they are collectible within the current period or soon enough thereafter to pay liabilities of the current period. For this purpose, the County generally considers revenues to be available if they are collected within 60 days of the end of the current fiscal period. For example, property taxes are recognized if they are collected within 60 days after year end. Expenditures generally are recorded when a liability is incurred, as under accrual accounting. However, debt service expenditures, as well as expenditures related to compensated absences and claims and judgments, are recorded only when payment is due. Property taxes, licenses, fines and forfeitures and interest associated within the current period are all considered to be susceptible to accrual and have been recognized as revenues of the current fiscal period. Only the portion of special assessment receivable due within the current fiscal period is susceptible to accrual as revenue of the current period. All other revenue items are measurable and available only when cash is received by the County. The County reports the following major governmental funds:
General Fund - is the County’s primary operating fund. It is used to account for all activities of the
general government not accounted for in another fund. Roads Special Revenue Fund – accounts for the design, construction, and maintenance of county
roads. Most of the revenues for this fund come from transportation related taxes and grants. Medic One Special Revenue Fund - accounts for countywide delivery of advanced life support
response and transport services. The revenues for this fund come from a portion of the County’s property tax levy.
Thurston County, Washington 2019
67
Real Estate Excise Tax fund – a fund established for holding excise tax proceeds dedicated to capital projects from the one-half percent tax on real property sales in unincorporated Thurston County. This fund is a newly added major fund for 2016. In prior years it was a Non-Major Capital Projects fund.
Public Health and Social Services Special Revenue Fund - accounts for the following services: mental health, developmental disabilities, substance abuse prevention & treatment, children and family, environmental protection, and personal health. Most of the revenues in this fund come from health-related state and federal grants.
The County reports the following major proprietary funds:
Solid Waste - accounts for county-wide solid waste activities including waste prevention, recycling and disposal activities at the county’s waste and recovery center.
Grand Mound Water and Wastewater - accounts for maintenance and operations of the Grand Mound water & wastewater systems.
Storm & Surface Water Utility – accounts for assessments levied to minimize the harmful effects of storm water runoff and to construct and improve storm water run-off facilities within the utility’s boundaries in unincorporated Thurston County.
Land Use and Permitting – accounts for the receipt of development license fees and service charges that support planning, permitting, and development inspection services within the unincorporated sections of Thurston County.
Environmental Health – accounts for activity in the county related to preventing pollution, human exposure to environmental hazards, and ensuring safe and clean drinking water. This is a newly created fund in 2019 that broke off from the Public Health Special Revenue Fund.
Additionally, the County reports the following fund types:
Internal Service Funds account for technology acquisition/improvement, building maintenance, equipment acquisition/maintenance, risk management and payroll/benefit administration provided to other departments or agencies of the County on a cost reimbursement basis.
Investment Trust Funds account for external pooled and non-pooled investments held in trust (as defined by paragraph 11c(1) of GASB 84) by the County Treasurer on behalf of external participants in the County’s investment program.
Private Purpose Trust Funds report amounts not required to be reported in investment trust funds and are held in trust per paragraph 11c(1) of GASB 84. These represent amounts deposited with the County Clerk through Superior Court trust arrangements and agreements and the county’s District Court.
Custodial Funds are used to report fiduciary activities that are not required to be reported in investment trust funds or private-purpose trust funds. The external portion of the County’s investment pool not held in a trust that meets the criteria in paragraph 11c(1) of GASB 84 are reported within these funds as well.
The effect of the interfund activity has been eliminated for the government-wide financial statements. Exceptions to this general rule include exchange or exchange-like transactions for internal services that are normally provided internally or to the public. This excludes internal services of internal service funds since the doubling effect of the cost of these services has already been removed from the financial statements. Amounts reported as program revenues include 1) charges to customers, 2) operating grants and contributions, and 3) capital grants and contributions, including special assessments. Internally dedicated resources are reported as general revenues rather than program revenues. General revenues include all taxes, interest earnings, sale of capital assets (if material), and transfers.
Thurston County, Washington 2019
68

Proprietary funds distinguish operating revenues and expenses from non-operating items. Operating revenues and expenses generally result from providing services and producing and delivering goods in connection with a proprietary fund’s principal ongoing operations. The principal operating revenues of the Solid Waste, Grand Mound, Storm & Surface Water Utility, Land Use and Permitting, and Other Enterprise Funds and the County’s internal service funds are charges to customers for sales and services. Operating expenses for enterprise and internal service funds include the cost of sales and services, administrative expenses, and depreciation on capital assets. All revenues and expenses not meeting this definition are reported as non-operating revenues and expenses.
D. Budgetary Information 1. Scope of Budget The County adopted a biennial budget and is currently in the 2019/2020 budget period. While the County is on a biennial budget, the budget authority does not carryforward into the second year. Budgets are adopted for all county funds in accordance with the provisions of the Revised Code of Washington (RCW), as interpreted by Budgeting, Accounting, and Reporting System (BARS) of the State of Washington and on a basis consistent with generally accepted accounting principles. Appropriations are authorized at the fund level for all funds, except the General Fund, where expenditures may not exceed appropriations at the department level. The budgets constitute the legal authority for expenditures at these levels. Budgets for debt service and capital project funds are adopted at the level of the individual debt issue or project and for fiscal periods that correspond to the lives of debt issues or projects. During the budget process, each County official submits detailed estimates of anticipated revenue and expenditure requests for the subsequent budget year. The data is compiled and made available for public comment beginning the third week in September. A recommended budget is submitted to the Board of County Commissioners in the third week of November. Public hearings are held the first week of December and the final budget is adopted, by resolution, shortly thereafter. 2. Amending the Budget The Board of County Commissioners must approve revisions that alter total expenditures of any County fund or General Fund department. These changes must be approved by resolution by a majority of Commissioners at a public hearing. General Fund departments or other County funds may transfer budget amounts between expenditure items without Board approval if these adjustments do not exceed the total department or fund budget. The budget amounts shown in the financial statements are the final authorized amounts as revised during the year. The financial statements report authorized original and final budgets for that year. The original budget is the first complete appropriated budget. The final budget is the original budget adjusted by all reserves, transfers, allocations, supplemental appropriations, and other legally authorized changes applicable for the fiscal year. E. Assets, Liabilities, Fund Balance and Net Position 1. Cash Deposits and Investments (See Note IV – Deposits and Investments) It is the County’s policy to invest all temporary cash surpluses. At December 31, 2019, all cash and cash equivalents were cash on hand and demand deposits with average maturities as noted in Note IV. This amount is classified on the balance sheet as cash and pooled investments in various funds. The interest on these investments is allocated to the various funds on an average daily balance basis.
Thurston County, Washington 2019
69
The amounts reported as cash and cash equivalents also include compensating balances maintained with certain banks in lieu of payments for services rendered. The average compensating balances maintained during the year was approximately $8,675,900. The County’s cash and cash equivalents are cash on hand and demand deposits. The County pools internal and external cash and investments into one pool for investment purposes with the County Treasurer, except as otherwise requested, in order to facilitate the management of cash. Some securities are measured at fair value as required by GASB 72. Cash applicable to a fund is readily identifiable. Earnings on cash and cash equivalents accrue to the individual fund owning the cash, with the exception of the following funds, which accrue to the County’s General Fund: Law Library, Auditor’s Maintenance & Operation, Detention Facility Sales Tax, Investment Administration, Treatment Sales Tax, Medic One, Roads, Conservation Futures, Real Estate Excise Tax, Solid Waste, Stormwater, Unemployment Compensation, Insurance Risk, Central Services, and Equipment Rental & Revolving. For the purposes of the statement of cash flows, the County considers all amounts invested in its cash pool to be cash and cash equivalents. All other investments, if applicable, are reported as investments at cost. For more information on the County’s investments, see Note IV – Deposits and Investments. 2. Receivables (See Note VIII – Receivable Balances) Taxes receivable consist of delinquent property taxes and related interest and penalties (See Property Taxes Note VI) and sales tax received shortly after the end of the year. The County considers property taxes to be available if they are collected within 60 days after year end. The County accrues these amounts as revenue unless they are immaterial to the amount collected or to the outstanding balance. Accrued interest receivable consists of amounts earned on investments, notes, and contracts at the end of the year. The County considers interest on investments to be available if they will be collected within 60 days after year-end. However, the County does not accrue these amounts as revenue unless they are material to the amount collected or to the outstanding balance. Special Assessment receivables consist of current and delinquent assessments and related penalties and interest against the property benefited. Long-term special assessments are outstanding unbilled special assessments and are recorded when levied. Special assessments and utility billings are collectible through liens on property. Therefore, no estimates of uncollectible amounts are established. In the governmental funds, special assessment receivables are offset by Deferred Inflows of Resources – Special Assessments, for county road improvement and lake management districts, public health assessments, and the countywide noxious weed program. In enterprise funds, they represent receivables for repayment of general obligation and special assessment debt issued to construct water and wastewater facilities and to fund storm water operations. See Note IX for more information about the County’s debt. Customer account receivables are amounts owed by private individuals or organizations for County services including amounts owned for which billings have not yet been prepared. They primarily include receivables for sales tax, court fines and forfeitures, incarceration fees and fees for public health services. Receivable amounts exclude any amounts estimated to be material and uncollectible at year end. 3. Amounts Due to and from Other Funds and Governments, Accounts Payable, Interfund Loans and Advances Receivable
Thurston County, Washington 2019
70

Activity between funds that are representative of lending/borrowing arrangements and outstanding at year end are reported in the fund financial statements as interfund loans receivable and payable if due within one year or advances to and from other funds if due within more than one year. Advances to other funds are offset by a non-spendable fund balance account in the applicable governmental funds to indicate that they are not available for appropriation and are not expendable financial resources. All other outstanding balances between funds, including interfund loans receivable and payable due within one year, are reported as “due to/from other funds”. The County reports accrued wages payable as accounts payable, whenever possible, for simplicity. Any residual balances outstanding between the governmental activities and business-type activities are reported in the government-wide financial statements as “internal balances.” Interfund balances between governmental funds and interfund balances between proprietary funds have been eliminated and are not included in the government-wide statement of net position. Due to and from other funds and other governments is reported as a cash flow change impacting operating activities in the statement of cash flows. However, cash flows from governmental receivables are treated differently for enterprise and internal service funds in the statement of cash flows. Due from other governments for enterprise funds is generally reported as a cash flow change impacting grant cash proceeds from non-capital financing activities. Due from other governments for internal service funds is generally reported as a cash flow change that impacts operating activities. 4. Inventories and Prepaid Items Inventories are assets held for internal consumption or for resale. Any material inventory remaining at year-end is reported at market value and is included in the balance sheet of the appropriate fund. The purchase method, where the cost is expended when the item is purchased, is used in governmental funds, except for the Roads special revenue and the Equipment Rental internal service funds, where the perpetual inventory method is used. The perpetual inventory method capitalizes the cost when inventory is purchased and then expends the cost when the item is consumed. Inventories recorded in the Roads Fund are stated at cost on a moving weighted average basis. Enterprise funds had no reportable material inventories at year end. Prepayments are payments in advance of the receipt of goods and services in an exchange transaction and are recorded as an expenditure or expense only when consumed. These payments to vendors reflect costs applicable to future accounting periods and are recorded as prepaid items in both government wide and fund financial statements. 5. Capital Assets and Depreciation (See Note VII – Capital Assets and Commitments) Capital assets, which include land, buildings, improvements to land and buildings, vehicles, machinery, equipment, easements, construction in progress and infrastructure assets and all other tangible and intangible assets used in operations, are reported in the applicable governmental or business-type columns in the government-wide financial statements. Infrastructure assets are usually stationary and normally can be preserved a significantly greater number of years than most other capital assets. Examples of infrastructure include roads, bridges, drainage systems, sidewalks, trails and paths, and water and sewer systems. Capital assets are defined by the County as assets with an initial, individual cost of $5,000 or more, including ancillary costs, with an estimated useful life in excess of one year. Capital assets are valued at cost where historical records are available and at estimated historical cost where no records exist. Donated capital assets are valued at their acquisition value at the date of donation.
Thurston County, Washington 2019
71
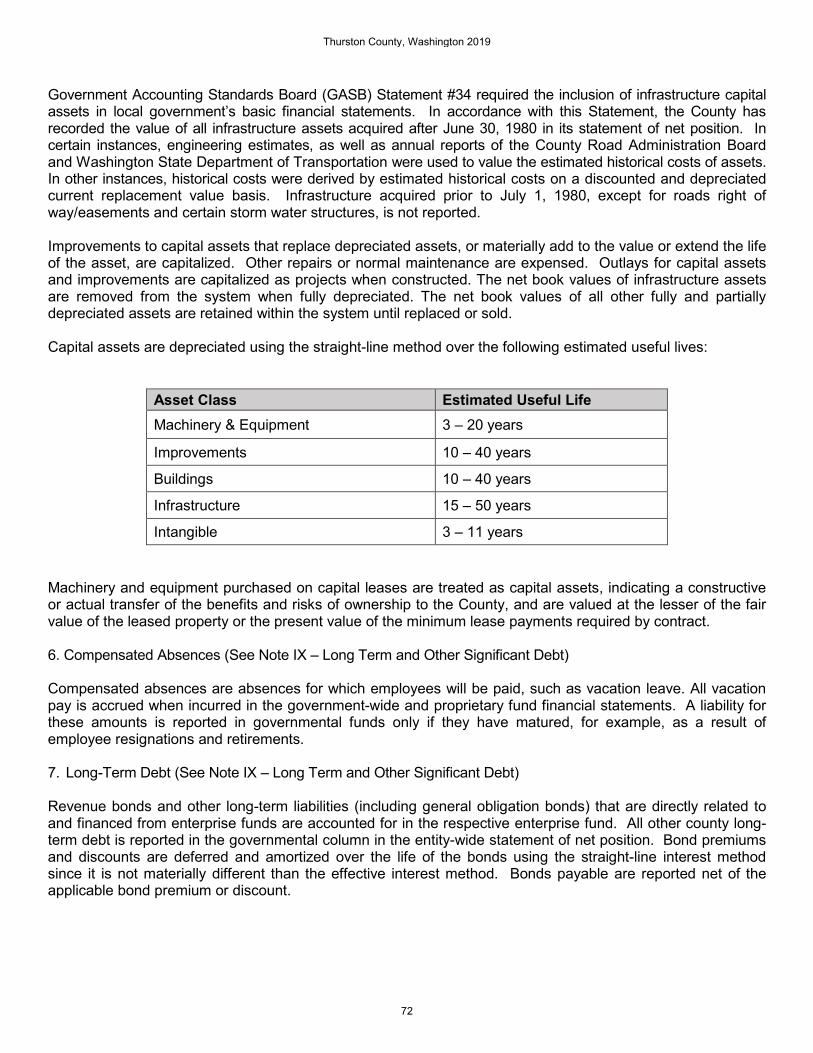
Government Accounting Standards Board (GASB) Statement #34 required the inclusion of infrastructure capital assets in local government’s basic financial statements. In accordance with this Statement, the County has recorded the value of all infrastructure assets acquired after June 30, 1980 in its statement of net position. In certain instances, engineering estimates, as well as annual reports of the County Road Administration Board and Washington State Department of Transportation were used to value the estimated historical costs of assets. In other instances, historical costs were derived by estimated historical costs on a discounted and depreciated current replacement value basis. Infrastructure acquired prior to July 1, 1980, except for roads right of way/easements and certain storm water structures, is not reported. Improvements to capital assets that replace depreciated assets, or materially add to the value or extend the life of the asset, are capitalized. Other repairs or normal maintenance are expensed. Outlays for capital assets and improvements are capitalized as projects when constructed. The net book values of infrastructure assets are removed from the system when fully depreciated. The net book values of all other fully and partially depreciated assets are retained within the system until replaced or sold. Capital assets are depreciated using the straight-line method over the following estimated useful lives:
Asset Class Estimated Useful Life Machinery & Equipment 3 – 20 years
Improvements 10 – 40 years
Buildings 10 – 40 years
Infrastructure 15 – 50 years
Intangible 3 – 11 years
Machinery and equipment purchased on capital leases are treated as capital assets, indicating a constructive or actual transfer of the benefits and risks of ownership to the County, and are valued at the lesser of the fair value of the leased property or the present value of the minimum lease payments required by contract. 6. Compensated Absences (See Note IX – Long Term and Other Significant Debt) Compensated absences are absences for which employees will be paid, such as vacation leave. All vacation pay is accrued when incurred in the government-wide and proprietary fund financial statements. A liability for these amounts is reported in governmental funds only if they have matured, for example, as a result of employee resignations and retirements. 7. Long-Term Debt (See Note IX – Long Term and Other Significant Debt) Revenue bonds and other long-term liabilities (including general obligation bonds) that are directly related to and financed from enterprise funds are accounted for in the respective enterprise fund. All other county long-term debt is reported in the governmental column in the entity-wide statement of net position. Bond premiums and discounts are deferred and amortized over the life of the bonds using the straight-line interest method since it is not materially different than the effective interest method. Bonds payable are reported net of the applicable bond premium or discount.
Thurston County, Washington 2019
72
When bonds are sold by a governmental fund, bond premiums and discounts are recognized in the fund financial statements in the current period. The face amount of debt is reported as other financing sources. Issuance costs are reported as debt service expenditures. Premiums received on debt issuance are reported as other financing sources while discounts on debt issuance are reported as other financing uses. Amounts reserved for long-term debt are shown as restricted fund balance in the fund financial statements and restricted net position in the statement of net position. 8. Unearned Revenue Unearned revenues in the fund financial statements include amounts collected before revenue recognition criteria are met. Unearned revenues in the government-wide financial statements represent resources received but not yet earned. 9. Deferred Outflows/Inflows of Resources The statement of net position will generally report a separate section for deferred outflows of resources. This element represents a consumption of net position that applies to future periods and will not be recognized as an outflow of resources (expense or expenditure) until then. The County currently reports three items as deferred outflows of resources. These items are deferred charge on refunding and amounts related to pensions and OPEB. The statements of financial position will also generally report a separate section for deferred inflows of resources. This element represents an acquisition of net position that applies to future periods and will not be recognized as an inflow of resources (revenue) until then. On the Statement of Net Position, the County currently reports three items as deferred inflows of resources. These items are deferred charge on refunding and amounts related to pensions and OPEB. On the fund balance sheets the County reports deferred inflows of resources related to property taxes and related penalties/interest, special assessments, and court fees. These amounts will be recognized as an inflow of resources in the period that the amounts become available. 10. Pensions For purposes of measuring the net pension liability, deferred outflows of resources and deferred inflows of resources related to pensions, and pension expense, information about the fiduciary net position of all state sponsored pension plans and additions to/deductions from those plans’ fiduciary net position have been determined on the same basis as they are reported by the Washington State Department of Retirement Systems. For this purpose, benefit payments (including refunds of employee contributions) are recognized when due and payable in accordance with the benefit terms. Investments are reported at fair value. 11. Rebateable Arbitrage Thurston County has not incurred any rebateable arbitrage as of December 31, 2019. Rebateable arbitrage, if incurred, will be treated as a reduction in revenue.
Thurston County, Washington 2019
73

12. Net Position Fund equity is recognized as net position in proprietary funds and entity wide statements. A portion of the County’s net position are subject to external legal restrictions on how they may be used and therefore are not available for general spending at the discretion of the County. This is considered restricted net position. Examples include fees and charges for services levied for a specific purpose or use, operating/capital grants restricted by the grantor, and Solid Waste cash and investments restricted to fund a 30-year landfill post-closure care period (see Note XV – Closure and Post Closure Care Costs). When both restricted and unrestricted resources are available for use, it is the County’s policy to use restricted resources, if available, before accessing and using unrestricted resources to finance the County’s ongoing operations as reported in the Statements of Net Position and Activities. 13. Fund Balance Classification Fund equity is recognized as fund balance in governmental funds. Beginning in 2011, the County has implemented GASB Statement No. 54 into its financial statements. Per this statement, there are five fund balance classifications as follows: Non-Spendable, Restricted, Committed, Assigned, and Unassigned. In relation to this statement, the County has adopted policy/procedure #2200. Specifics of this are as follows:
• The Board of County Commissioners (BoCC) is the highest level of decision making authority for the County. It has the authority to set aside governmental funds for a specific purpose. For funds to be set aside as committed for any purpose, a formal resolution by the BoCC is required to be passed, on or prior to, December 31st of the applicable calendar year. The same action is required by the BoCC to remove a commitment of fund balance.
• Amounts in the assigned fund balance classification are intended to be used by the County for specific purposes but do not meet the criteria to be classified as committed. The BoCC, through policy, has authorized the County’s Financial Management Committee (FMC) to assign fund balance. The FMC is a three-member committee made up of the County Manager, County Auditor and the County Treasurer. Unlike commitments, assignments generally only exist temporarily. In other words, an additional action does not normally have to be taken for the removal of an assignment. Conversely, as discussed above, an additional action is essential to either remove or revise a commitment.
• When both restricted and unrestricted funds are available for expenditure, it is County policy that
restricted funds be depleted first, before using any of the components of unrestricted fund balance. Further, when the components of unrestricted fund balance can be used for the same purpose, committed fund balance is depleted first, followed by assigned fund balance. Unassigned fund balance is applied last, unless legal requirements disallow it. It is also County policy that when committed, assigned and unassigned funds are available for expenditure, it is assumed that committed funds are spent first, assigned funds second, and unassigned funds last.
14. Minimum Fund Balance The County’s formal adopted minimum fund balance policy for the General Fund stipulates that the minimum balance should equal one month of average budgeted annual expenditures. The BoCC has the ultimate responsibility of monitoring this balance on a periodic basis. For all other governmental funds, establishment of an appropriate minimum balance is the responsibility of the department managing that fund.
Thurston County, Washington 2019
74

NOTE II – RECONCILIATION OF GOVERNMENT WIDE AND FUND FINANCIAL STATEMENTS A. Explanation of Certain Differences Between the Governmental Fund Balance Sheet and the Government-Wide Statement of Net Position Fund balance in the governmental funds balance sheet is reconciled to net position in the statement of net position. One element of that reconciliation, as detailed below, was for $441,589,213 because the cost of capital assets, which is expended in governmental funds, is deferred to future periods in the statement of net position:
Governmental Net Book Value - End of Prior Year 439,902,988$ Gains (Losses) and Adjustments on Dispositions of Capital Assets 4,860,353 Prior Period Adjustment (264,081) Governmental Capital Outlays 8,227,861 Governmental Depreciation & Amortization Expense (11,137,908) Governmental Net Book Value - End of Current Year 441,589,213$
Another element of the reconciliation, as detailed below, was for $55,002,173 because long-term debt, which is not reported in governmental funds, is reported in the statement of net position:
Governmental Debt - End of Prior Year 58,754,626$ Bond/Note Proceeds 863,501 Refunding, Amortization, Deferrals & Debt Issue Costs (450,256) Principal Payments (4,165,698) Computed Governmental Debt - End of Current Year 55,002,173$
Thurston County, Washington 2019
75
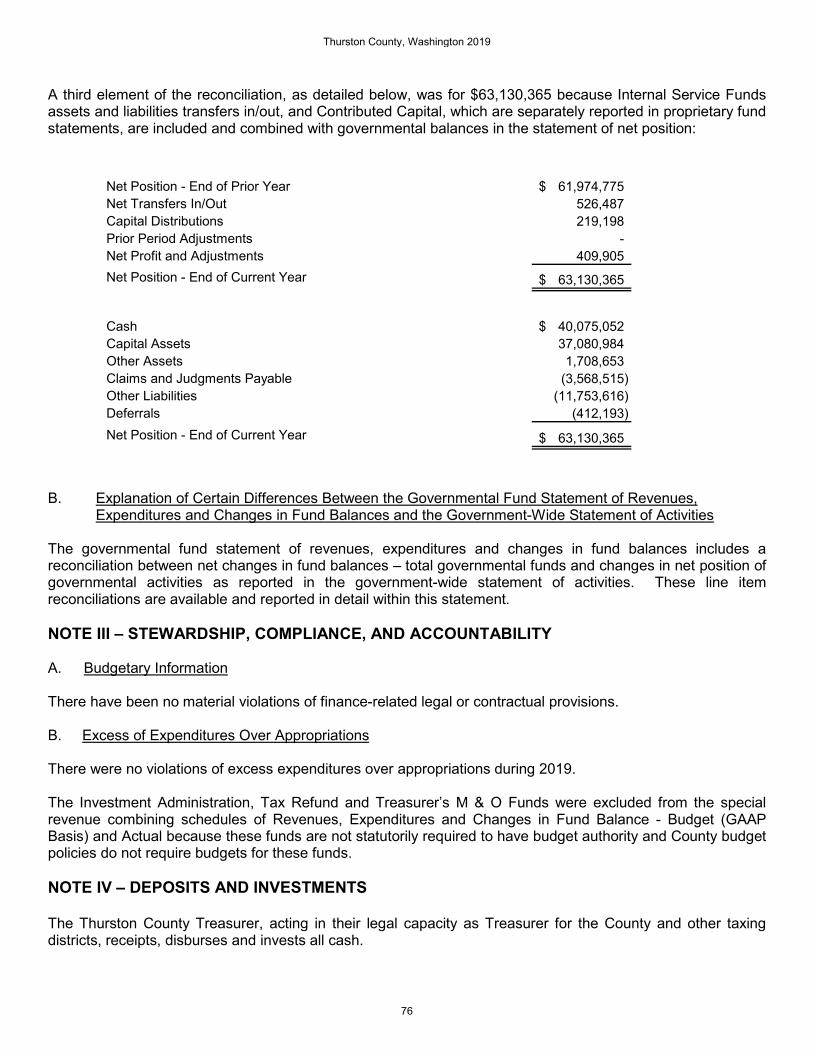
A third element of the reconciliation, as detailed below, was for $63,130,365 because Internal Service Funds assets and liabilities transfers in/out, and Contributed Capital, which are separately reported in proprietary fund statements, are included and combined with governmental balances in the statement of net position:
Net Position - End of Prior Year 61,974,775$ Net Transfers In/Out 526,487 Capital Distributions 219,198 Prior Period Adjustments - Net Profit and Adjustments 409,905 Net Position - End of Current Year 63,130,365$
Cash 40,075,052$ Capital Assets 37,080,984 Other Assets 1,708,653 Claims and Judgments Payable (3,568,515) Other Liabilities (11,753,616) Deferrals (412,193) Net Position - End of Current Year 63,130,365$
B. Explanation of Certain Differences Between the Governmental Fund Statement of Revenues,
Expenditures and Changes in Fund Balances and the Government-Wide Statement of Activities The governmental fund statement of revenues, expenditures and changes in fund balances includes a reconciliation between net changes in fund balances – total governmental funds and changes in net position of governmental activities as reported in the government-wide statement of activities. These line item reconciliations are available and reported in detail within this statement. NOTE III – STEWARDSHIP, COMPLIANCE, AND ACCOUNTABILITY A. Budgetary Information There have been no material violations of finance-related legal or contractual provisions. B. Excess of Expenditures Over Appropriations There were no violations of excess expenditures over appropriations during 2019. The Investment Administration, Tax Refund and Treasurer’s M & O Funds were excluded from the special revenue combining schedules of Revenues, Expenditures and Changes in Fund Balance - Budget (GAAP Basis) and Actual because these funds are not statutorily required to have budget authority and County budget policies do not require budgets for these funds. NOTE IV – DEPOSITS AND INVESTMENTS The Thurston County Treasurer, acting in their legal capacity as Treasurer for the County and other taxing districts, receipts, disburses and invests all cash.
Thurston County, Washington 2019
76

A. Deposits Custodial risk for deposits is the risk that, in the event of a bank failure, the government’s deposits may not be returned. The County has an adopted policy that addresses deposit custodial risk; however, the County’s deposits and certificates of deposit are entirely covered by the Federal Deposit Insurance Corporation (FDIC) or by collateral held in a multiple financial institution collateral pool administered by the Washington Public Deposit Protection Commission (PDPC). In the event of a bank failure, claims for the County’s deposits would be satisfied by the FDIC or from the sale of collateral held in the PDPC pool. The PDPC is a statutory authority established under Chapter 39.58 of the Revised Code of Washington. All deposits held at December 31, 2019 and throughout the year were insured or collateralized with securities held by the County Treasurer or by their agent in the County Treasurer’s name. Total cash on hand at the bank on December 31, 2019 was $12,104,574. B. Investments Investments are governed by State statute and county investment policy. All investment instruments are those allowed by statute. These include U.S. Treasury Obligations, Federal Agencies, supernationals, corporate notes, bankers’ acceptances, commercial paper, municipal bonds, money market account and the State Treasurer’s Local Government Investment Pool (LGIP). C. Investments in Local Government Investment Pool (LGIP) The County is a participant in the Local Government Investment Pool was authorized by Chapter 294, Laws of 1986, and is managed and operated by the Washington State Treasurer. The State Finance Committee is the administrator of the statute that created the pool and adopts rules. The State Treasurer is responsible for establishing the investment policy for the pool and reviews the policy annually and proposed changes are reviewed by the LGIP advisory Committee. Investments in the LGIP, a qualified external investment pool, are reported at amortized cost which approximates fair value. The LGIP is an unrated external investment pool. The pool portfolio is invested in a manner that meets the maturity, quality, diversification and liquidity requirements set forth by the GASBS 79 for external investments pools that elect to measure, for financial reporting purposes, investments at amortized cost. The LGIP does not have any legally binding guarantees of share values. The LGIP does not impose liquidity fees or redemption gates on participant withdrawals. The Office of the State Treasurer prepares a stand-alone LGIP financial report. A copy of the report is available from the Office of the State Treasurer, PO Box 40200, Olympia, Washington 98504-0200, online at http://www.tre.wa.gov. D. Thurston County Investment Pool (TCIP) Also see Note V County’s External Investment Pool for more information.
Thurston County, Washington 2019
77
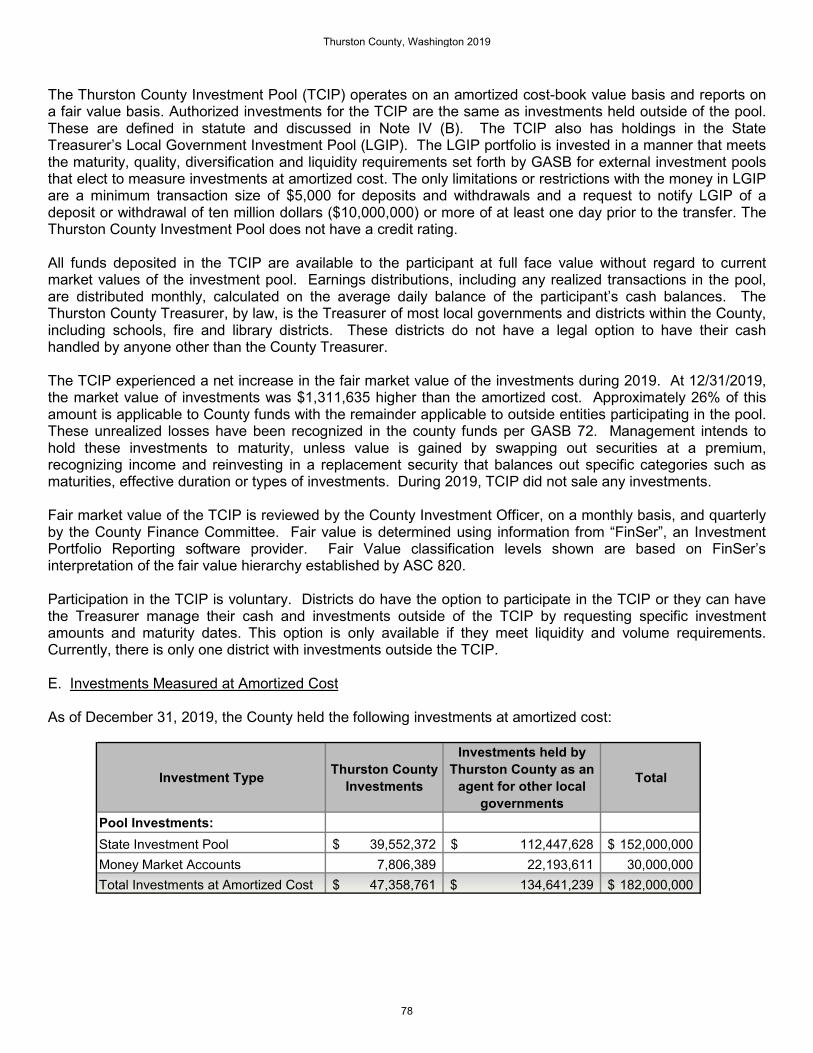
The Thurston County Investment Pool (TCIP) operates on an amortized cost-book value basis and reports on a fair value basis. Authorized investments for the TCIP are the same as investments held outside of the pool. These are defined in statute and discussed in Note IV (B). The TCIP also has holdings in the State Treasurer’s Local Government Investment Pool (LGIP). The LGIP portfolio is invested in a manner that meets the maturity, quality, diversification and liquidity requirements set forth by GASB for external investment pools that elect to measure investments at amortized cost. The only limitations or restrictions with the money in LGIP are a minimum transaction size of $5,000 for deposits and withdrawals and a request to notify LGIP of a deposit or withdrawal of ten million dollars ($10,000,000) or more of at least one day prior to the transfer. The Thurston County Investment Pool does not have a credit rating. All funds deposited in the TCIP are available to the participant at full face value without regard to current market values of the investment pool. Earnings distributions, including any realized transactions in the pool, are distributed monthly, calculated on the average daily balance of the participant’s cash balances. The Thurston County Treasurer, by law, is the Treasurer of most local governments and districts within the County, including schools, fire and library districts. These districts do not have a legal option to have their cash handled by anyone other than the County Treasurer. The TCIP experienced a net increase in the fair market value of the investments during 2019. At 12/31/2019, the market value of investments was $1,311,635 higher than the amortized cost. Approximately 26% of this amount is applicable to County funds with the remainder applicable to outside entities participating in the pool. These unrealized losses have been recognized in the county funds per GASB 72. Management intends to hold these investments to maturity, unless value is gained by swapping out securities at a premium, recognizing income and reinvesting in a replacement security that balances out specific categories such as maturities, effective duration or types of investments. During 2019, TCIP did not sale any investments. Fair market value of the TCIP is reviewed by the County Investment Officer, on a monthly basis, and quarterly by the County Finance Committee. Fair value is determined using information from “FinSer”, an Investment Portfolio Reporting software provider. Fair Value classification levels shown are based on FinSer’s interpretation of the fair value hierarchy established by ASC 820. Participation in the TCIP is voluntary. Districts do have the option to participate in the TCIP or they can have the Treasurer manage their cash and investments outside of the TCIP by requesting specific investment amounts and maturity dates. This option is only available if they meet liquidity and volume requirements. Currently, there is only one district with investments outside the TCIP. E. Investments Measured at Amortized Cost As of December 31, 2019, the County held the following investments at amortized cost:
Investment Type Thurston County Investments
Investments held by Thurston County as an
agent for other local governments
Total
Pool Investments:State Investment Pool 39,552,372$ 112,447,628$ 152,000,000$ Money Market Accounts 7,806,389 22,193,611 30,000,000 Total Investments at Amortized Cost 47,358,761$ 134,641,239$ 182,000,000$
Thurston County, Washington 2019
78

Credit risk related to investments at amortized costs is the risk that an issuer or other counterparty to an investment will not fulfill its obligations. County policy further limits risk to investments in securities that have one of the three highest ratings of a national rating agency at the time of investment. The County’s exposure to credit risk is limited to its investment in the Washington State Investment Pool. F. Investments Measured at Fair Value The County measures and reports investments at fair value using the valuation input hierarchy established by generally accepted accounting principles, as follows:
• Level 1: Quoted prices in active markets for identical assets or liabilities. • Level 2: Quoted market prices for similar assets or liabilities in markets that are not active. • Level 3: Unobservable inputs for an asset or liability.
At December 31, 2019, the County had the following investments measured at fair value:
Investment Type Fair Value
Quoted Prices in Active markets for
Identical Assets (Level 1)
Significant Other Observable
Inputs (Level 2)
Weighted Average Maturity (Years)
Interest Rate Ranges
Municipal Bonds 5,647,763 5,647,763 0.50 2.850%-4.062%US Treasurer Securities 40,124,219 10,065,625 30,058,594 0.75 1.375%-2.500%US Agency Securities 561,951,220 26,938,112 535,013,108 2.00 1.125%-5.200%Supernationals 23,037,270 23,037,270 1.33 1.860%-2.125%Corporate Securities 23,500,176 1,898,050 21,602,126 1.33 1.700%-3.000%Total Investments by Fair Value Level 654,260,648$ 38,901,787$ 615,358,861$
Fair Value Measurements Using
The County’s investments measured at fair value are subject to the following risks:
• Interest Rate Risk – The adopted investment policy limited investment maturities to a maximum of five years, with the exception of preapproval by the County Treasurer. The weighted average maturity of the county investments is 1.46 years as of December 31, 2019. During 2019 the County did not buy or own any securities earning interest at a rate which varied depending on an underlying rate or index.
• Credit Risk – Credit risk is the risk that an issuer or other counterparty to an investment will not fulfill its obligations. County policy further limits credit risk to investments in securities that have one of the three highest ratings of a national rating agency at the time of investment.
Thurston County, Washington 2019
79
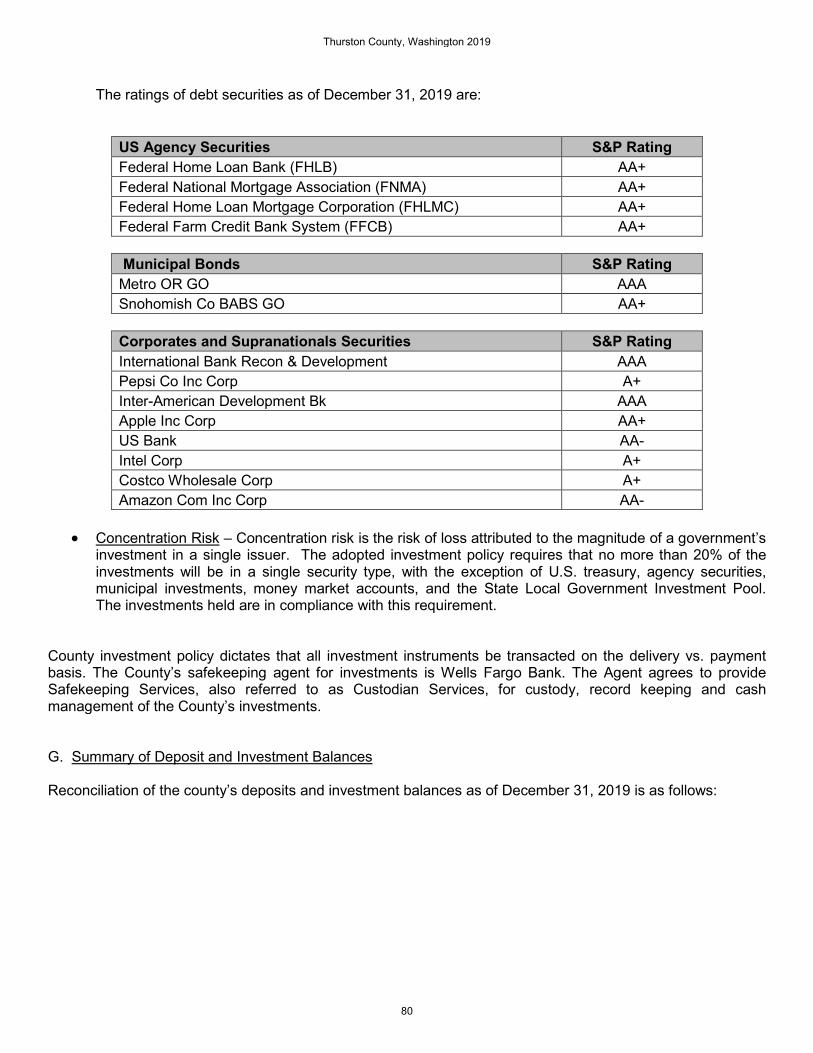
The ratings of debt securities as of December 31, 2019 are:
US Agency Securities S&P Rating Federal Home Loan Bank (FHLB) AA+ Federal National Mortgage Association (FNMA) AA+ Federal Home Loan Mortgage Corporation (FHLMC) AA+ Federal Farm Credit Bank System (FFCB) AA+
Municipal Bonds S&P Rating Metro OR GO AAA Snohomish Co BABS GO AA+
Corporates and Supranationals Securities S&P Rating International Bank Recon & Development AAA Pepsi Co Inc Corp A+ Inter-American Development Bk AAA Apple Inc Corp AA+ US Bank AA- Intel Corp A+ Costco Wholesale Corp A+ Amazon Com Inc Corp AA-
• Concentration Risk – Concentration risk is the risk of loss attributed to the magnitude of a government’s
investment in a single issuer. The adopted investment policy requires that no more than 20% of the investments will be in a single security type, with the exception of U.S. treasury, agency securities, municipal investments, money market accounts, and the State Local Government Investment Pool. The investments held are in compliance with this requirement.
County investment policy dictates that all investment instruments be transacted on the delivery vs. payment basis. The County’s safekeeping agent for investments is Wells Fargo Bank. The Agent agrees to provide Safekeeping Services, also referred to as Custodian Services, for custody, record keeping and cash management of the County’s investments. G. Summary of Deposit and Investment Balances Reconciliation of the county’s deposits and investment balances as of December 31, 2019 is as follows:
Thurston County, Washington 2019
80

Non-PooledPooled Cash Cash &
Total Investments InvestmentsState Investment Pool 152,000,000$ 152,000,000$ -$ Municipal Bonds 5,605,000 5,605,000 - US Treasury & Agency Securities 600,755,000 600,755,000 - Money Market Accounts 30,000,000 30,000,000 - Supernationals 23,000,000 23,000,000 Corporate Securities 23,345,000 23,345,000 Total Investment Pool Investments 834,705,000 834,705,000 - Deposits With Financial Institutions 12,104,574 12,104,574 - Net Increase (Decrease) in Fair Value of Investments 1,311,635 1,311,635 - Pool Accruals 378,024 378,024.00 Total Investment Pool Cash & Investments 848,499,233 848,499,233 - Fiscal and Petty Cash 55,891 - 55,891 Clerk's Trust Funds 4,446,600 - 4,446,600
Total Reported Cash & Investments 853,001,724$ 848,499,233$ 4,502,491$
Schedules of Deposits and InvestmentsComposition of Cash & Investments
December 31, 2019
Statements ofFiduciary Net
Total Net Position PositionCash & Pooled Investments - County Funds 221,445,809$ -$ 221,445,809$ Cash & Pooled Investments - Investment Trust Fund 624,083,808 624,083,808 - Cash & Pooled Investments - Investments Not In Trust 1,082,033 1,082,033 Cash & Pooled Investments - Custodial Funds 1,887,583 1,887,583 - Total Investment Pool Cash & Investments 848,499,233 627,053,424 221,445,809 Fiscal and Petty Cash 55,891 55,891 Private Purpose Trust Funds 4,446,600 4,446,600 -
Total Reported Cash & Investments 853,001,724$ 631,500,024$ 221,501,700$
December 31, 2019Reconciliation of Cash & Investments to Statements
A condensed statement of net position and statement of changes in net position for the external portion of the County’s investment trust pool and the Clerk’s and District Court’s private purpose trust funds at December 31, 2019 is reported in the following schedule:
Thurston County, Washington 2019
81

PrivateInvestment Purpose
Trust TrustFund Fund
Cash, Cash Equivalents, Investments and Pooled Investments 629,913,991$ 4,446,600$ Total Assets 629,913,991 4,446,600 Pool Liabilities 5,667,479 - Total Liabilities 5,667,479 - Net Position Held in Trust for Pool Participants 624,246,512$ 4,446,600$
PrivateInvestment Purpose
Trust TrustFund Fund
Changes in Net Position Resulting from Operations 13,329,317$ -$ Earnings Distributions to Participants (13,329,317) - Changes in Net Position Resulting from Depositor Transactions 36,680,266 430,134 Net Position Available 36,680,266 430,134 Net Position Beginning of Year as Restated and Adjusted 587,566,246 4,016,466 Net Position End of Year 624,246,512$ 4,446,600$
Condensed Statement of Net PositionDecember 31, 2019
Condensed Statement of Changes in Net PositionDecember 31, 2019
NOTE V – EXTERNAL INVESTMENT POOL The External Investment Pool sponsored by the County was established on January 1, 1992. Revised Code of Washington (RCW) 36.29.022, 36.29.010, 36.29.020, authorize the County Treasurer to invest its surplus cash and any funds of municipal corporations which are not required for immediate expenditure and are in the custody or control of the county treasurer. The External Investment Pool’s investments are invested pursuant to the Revised Code of Washington. Any credits or payments to pool participants are calculated and made in a manner as required by RCW 36.29.024. The investments are managed by the Treasurer, which reports investment activity to the County Finance Committee on a quarterly basis. Additionally, the County treasurer investment activity is subject to an annual investment policy review, compliance oversight, quarterly financial review, and annual financial reporting. The County has not provided nor obtained any legally binding guarantees during the year ended December 31, 2020, to support the value of shares in the Pool. The External Investment Pool is not registered with the SEC and is not subject to any formal oversight other than that provided by the County Finance Committee. The Committee is responsible for adopting investment objectives and policies, for hiring investment advisors, and for monitoring policy implementation and investment performance. The Committee’s primary role is to oversee the allocation of the Pool’s portfolio among the asset classes, investment vehicles, and investment managers.
Thurston County, Washington 2019
82

The interest or other earnings of income from the funds of any municipal corporation of which the governing body has not taken any action pertaining to the investment of funds and that have been invested in accordance with state statutes, shall be deposited in the General Fund of the county and may be used for general county purposes. The total amount of income from the External Investment Pool assigned to the County’s general fund for the year was $348,013. These investments made by the County Treasurer on behalf of the participants is involuntary participation in the County Treasurer’s Investment Pool as they are required to be invested by statute. 85% of the County Treasurer’s Pool consists of these involuntary participants. Voluntary participants in the County Treasurer’s Pool include Housing Authority, Olympic Region Clean Air Agency, Thurston Regional Planning Council, 911 Communications, Lewis-Mason-Thurston Area Agency on Aging, Thurston Mason Behavioral Health Organization, Transit Authorities, and LOTT Clean Water Alliance. The deposits held for both involuntary and voluntary entities are included in the Pooled Investment Trust Fund. NOTE VI – PROPERTY TAXES The County Treasurer acts as an agent to collect property taxes levied in the County for all taxing authorities.
Property Tax Calendar
January 1 Taxes are levied and become an enforceable lien against the properties.
April 30 First of two equal installment payments is due.
October 31 Second installment is due. Property tax is recorded as a receivable when levied, but revenue is not recognized until collected. No allowance for uncollectible taxes is established because delinquent taxes are considered fully collectible. An enforceable lien attaches at the point of levy. Interest accrues on delinquent taxes at a rate of 12% per annum. Penalties of 3% are assessed in June and 8% in December, in the first year of delinquency. The County is permitted by law to levy up to a combined amount of $4.05 per $1,000 of assessed valuation. A maximum of $1.80 per $1,000 of assessed valuation may be levied on all property in the County for general government services. A maximum of $2.25 per $1,000 of assessed valuation may be levied on property in unincorporated Thurston County for the County Road Fund for road construction and maintenance. However, a county is authorized to increase its levy from $1.80 to a rate not to exceed $2.475 per $1,000 of assessed value for general county purposes if the total levies for both the county and the county road district do not exceed $4.05 per $1,000 of assessed value, and no other taxing district has its levy reduced as a result of the increased county levy. These levies may be reduced subject to these limitations:
Thurston County, Washington 2019
83

1. The district budget is one of the limitations on taxation.
2. The amount authorized by a district in their resolution or ordinance is another limitation on taxation. When district officials need to increase their budget over the spending of the previous year, they are required to pass one or more resolutions (or ordinances).
3. Statutory dollar rate limits are specified for regular property tax levy rates for most types of taxing
districts in RCW 84.52.043.
4. Most taxing districts are authorized by state law to levy a certain rate each year without approval by the voters; these are commonly referred to as regular levies. The aggregate levies of junior taxing districts and senior taxing districts, other than the state, shall not exceed five dollars and ninety cents per thousand dollars of assessed valuations (RCW 84.52.043). At the county level this limitation does not apply to the Conservation Futures or Medic One levies.
5. The Washington State Constitution limits total regular property taxes to 1 percent of true and fair market valuation. This limit would equate to a regular levy rate of $10 per $1,000 of assessed value if the property were assessed at its true and fair value. If taxes for regular districts (excluding the Port & PUD) exceed this amount, the proration order starts with junior taxing districts first, then senior taxing districts, if necessary, until the total is at the 1 percent limit.
The County may voluntarily levy taxes below the legal limit. Special levies approved by the voters are not subject to the above limitations. The following identifies the tax rates levied in 2018 for collection in 2019:
Levy In Dollars Assessed TotalPer Thousand Value Levy
General Fund 1.2161$ 35,031,856,677$ 42,602,886$ Medic One 0.3169$ 35,031,856,677$ 11,101,512$ Roads 1.2235$ 16,827,970,617$ 20,589,108$
Thurston County, Washington 2019
84

NOTE VII – CAPITAL ASSETS AND COMMITMENTS A. Capital Assets Capital assets activity for the year ended December 31, 2019 was as follows:
Beginning Balance
01/01/2019Prior Period Adjustment
Revised Beginning Balance
01/01/2019 IncreasesDecreases & Adjustments
Ending Balance
12/31/2019
GOVERNMENTAL TYPE ACTIVITIES
Capital Assets - Non-Depreciable: Land 259,894,807$ -$ 259,894,807$ 4,735,046$ (89,897)$ 264,539,956$ Construction in Progress 33,741,120 (270,728) 33,470,392 6,399,735 (34,183,790) 5,686,337 Intangible Assets 2,953,017 - 2,953,017 24,800 - 2,977,817 Capital Assets - Non-Depreciable 296,588,944 (270,728) 296,318,216 11,159,581 (34,273,687) 273,204,110 Capital Assets - Depreciable: Buildings 138,991,445 - 138,991,445 453,425 (93,239) 139,351,631 Intangible Assets 2,270,266 - 2,270,266 944,906 (900,210) 2,314,962 Improvements Other Than Buildings 5,483,872 - 5,483,872 350,608 (31,989) 5,802,491 Machinery & Equipment 49,283,393 - 49,283,393 8,884,963 (7,705,299) 50,463,057 Infrastructure 133,725,357 - 133,725,357 38,282,573 (8,137,291) 163,870,639 Original Cost 329,754,333 - 329,754,333 48,916,475 (16,868,028) 361,802,780 Less Accumulated Depreciation: Buildings (48,620,194) - (48,620,194) (3,821,679) - (52,441,873) Improvements Other Than Buildings (4,978,274) - (4,978,274) (123,084) 12,162 (5,089,196) Machinery & Equipment (30,610,076) - (30,610,076) (3,817,143) 2,657,297 (31,769,922) Intangible Assets (2,050,116) - (2,050,116) (31,130) 6,213 (2,075,033) Infrastructure (63,858,489) - (63,858,489) (7,732,325) 4,863,904 (66,726,910) Accumulated Depreciation (150,117,149) - (150,117,149) (15,525,361) 7,539,576 (158,102,934) Capital Assets - Depr, Net 179,637,184 - 179,637,184 33,391,114 (9,328,452) 203,699,846 Total Original Cost 626,343,277 (270,728) 626,072,549 60,076,056 (51,141,715) 635,006,890 Total Accumulated Depreciation (150,117,149) - (150,117,149) (15,525,361) 7,539,576 (158,102,934)
Governmental Capital Assets, Net476,226,128$ (270,728)$ 475,955,400$ 44,550,695$ (43,602,139)$ 476,903,956$
Thurston County, Washington 2019
85
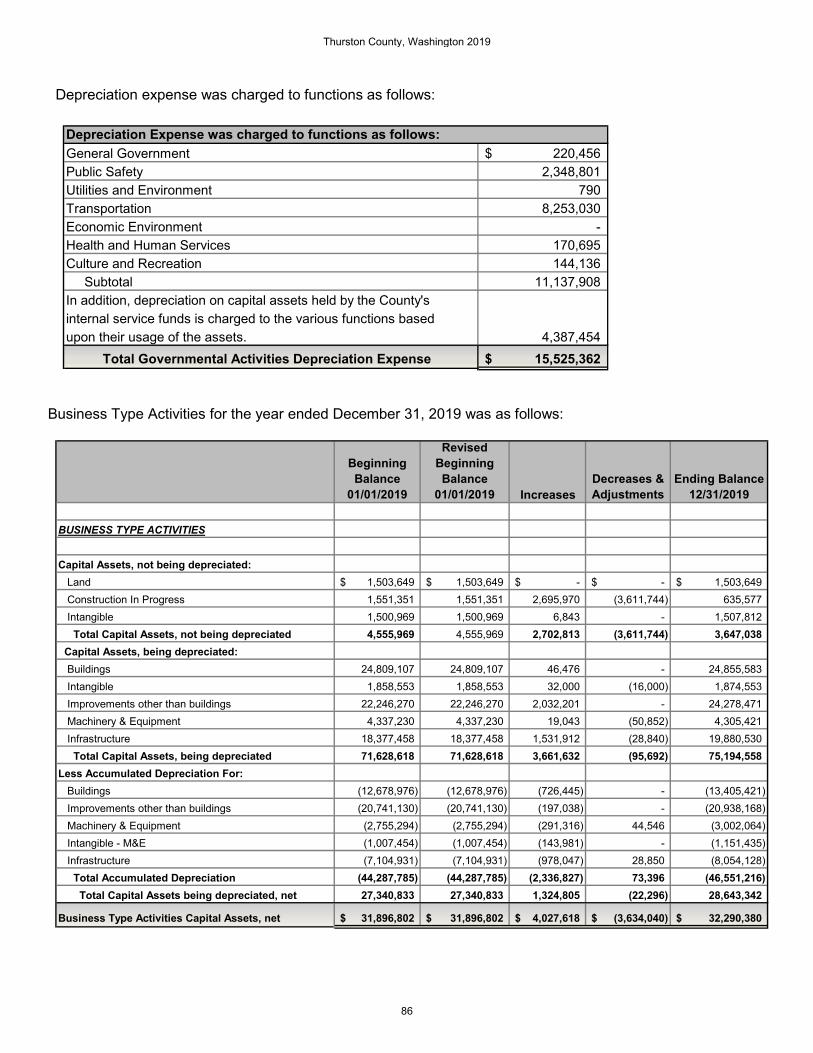
Depreciation expense was charged to functions as follows:
General Government 220,456$ Public Safety 2,348,801 Utilities and Environment 790 Transportation 8,253,030 Economic Environment - Health and Human Services 170,695 Culture and Recreation 144,136 Subtotal 11,137,908 In addition, depreciation on capital assets held by the County'sinternal service funds is charged to the various functions basedupon their usage of the assets. 4,387,454 Total Governmental Activities Depreciation Expense 15,525,362$
Depreciation Expense was charged to functions as follows:
Business Type Activities for the year ended December 31, 2019 was as follows:
Beginning Balance
01/01/2019
Revised Beginning Balance
01/01/2019 IncreasesDecreases & Adjustments
Ending Balance 12/31/2019
BUSINESS TYPE ACTIVITIES
Capital Assets, not being depreciated: Land 1,503,649$ 1,503,649$ -$ -$ 1,503,649$ Construction In Progress 1,551,351 1,551,351 2,695,970 (3,611,744) 635,577 Intangible 1,500,969 1,500,969 6,843 - 1,507,812 Total Capital Assets, not being depreciated 4,555,969 4,555,969 2,702,813 (3,611,744) 3,647,038 Capital Assets, being depreciated: Buildings 24,809,107 24,809,107 46,476 - 24,855,583 Intangible 1,858,553 1,858,553 32,000 (16,000) 1,874,553 Improvements other than buildings 22,246,270 22,246,270 2,032,201 - 24,278,471 Machinery & Equipment 4,337,230 4,337,230 19,043 (50,852) 4,305,421 Infrastructure 18,377,458 18,377,458 1,531,912 (28,840) 19,880,530 Total Capital Assets, being depreciated 71,628,618 71,628,618 3,661,632 (95,692) 75,194,558 Less Accumulated Depreciation For: Buildings (12,678,976) (12,678,976) (726,445) - (13,405,421) Improvements other than buildings (20,741,130) (20,741,130) (197,038) - (20,938,168) Machinery & Equipment (2,755,294) (2,755,294) (291,316) 44,546 (3,002,064) Intangible - M&E (1,007,454) (1,007,454) (143,981) - (1,151,435) Infrastructure (7,104,931) (7,104,931) (978,047) 28,850 (8,054,128) Total Accumulated Depreciation (44,287,785) (44,287,785) (2,336,827) 73,396 (46,551,216) Total Capital Assets being depreciated, net 27,340,833 27,340,833 1,324,805 (22,296) 28,643,342
Business Type Activities Capital Assets, net 31,896,802$ 31,896,802$ 4,027,618$ (3,634,040)$ 32,290,380$
Thurston County, Washington 2019
86
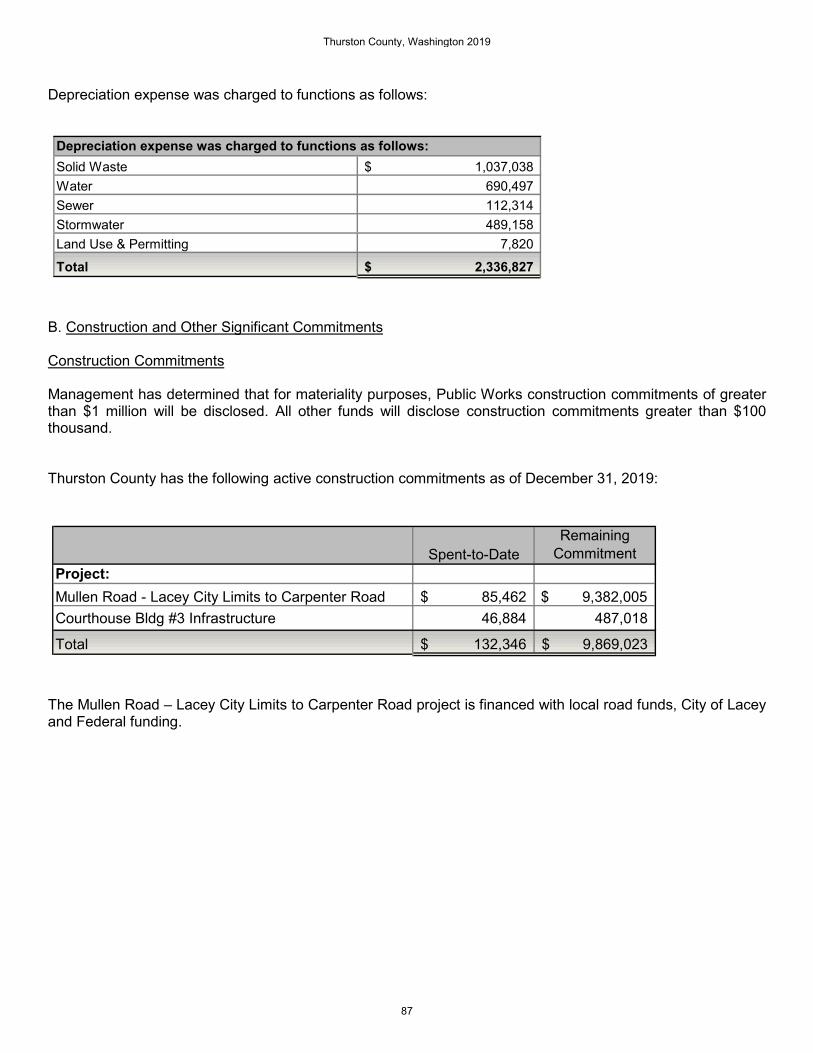
Depreciation expense was charged to functions as follows:
Solid Waste 1,037,038$ Water 690,497 Sewer 112,314 Stormwater 489,158 Land Use & Permitting 7,820
Total 2,336,827$
Depreciation expense was charged to functions as follows:
B. Construction and Other Significant Commitments Construction Commitments Management has determined that for materiality purposes, Public Works construction commitments of greater than $1 million will be disclosed. All other funds will disclose construction commitments greater than $100 thousand. Thurston County has the following active construction commitments as of December 31, 2019:
Spent-to-DateRemaining
CommitmentProject:Mullen Road - Lacey City Limits to Carpenter Road 85,462$ $ 9,382,005 Courthouse Bldg #3 Infrastructure 46,884 487,018
Total 132,346$ 9,869,023$
The Mullen Road – Lacey City Limits to Carpenter Road project is financed with local road funds, City of Lacey and Federal funding.
Thurston County, Washington 2019
87
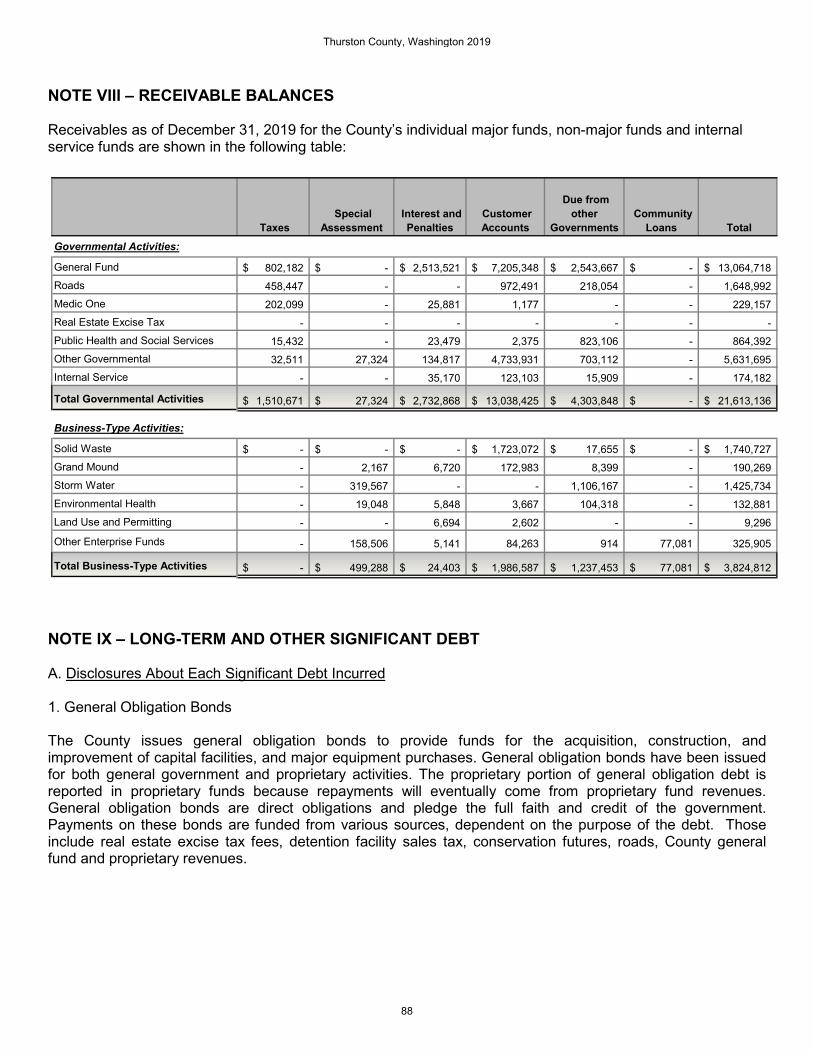
NOTE VIII – RECEIVABLE BALANCES Receivables as of December 31, 2019 for the County’s individual major funds, non-major funds and internal service funds are shown in the following table:
Taxes Special
Assessment Interest and
Penalties Customer Accounts
Due from other
Governments Community
Loans Total Governmental Activities:
General Fund 802,182$ -$ 2,513,521$ 7,205,348$ 2,543,667$ -$ 13,064,718$ Roads 458,447 - - 972,491 218,054 - 1,648,992 Medic One 202,099 - 25,881 1,177 - - 229,157 Real Estate Excise Tax - - - - - - - Public Health and Social Services 15,432 - 23,479 2,375 823,106 - 864,392 Other Governmental 32,511 27,324 134,817 4,733,931 703,112 - 5,631,695 Internal Service - - 35,170 123,103 15,909 - 174,182
Total Governmental Activities 1,510,671$ 27,324$ 2,732,868$ 13,038,425$ 4,303,848$ -$ 21,613,136$
Business-Type Activities:
Solid Waste -$ -$ -$ 1,723,072$ 17,655$ -$ 1,740,727$ Grand Mound - 2,167 6,720 172,983 8,399 - 190,269 Storm Water - 319,567 - - 1,106,167 - 1,425,734 Environmental Health - 19,048 5,848 3,667 104,318 - 132,881 Land Use and Permitting - - 6,694 2,602 - - 9,296
Other Enterprise Funds - 158,506 5,141 84,263 914 77,081 325,905
Total Business-Type Activities -$ 499,288$ 24,403$ 1,986,587$ 1,237,453$ 77,081$ 3,824,812$
NOTE IX – LONG-TERM AND OTHER SIGNIFICANT DEBT A. Disclosures About Each Significant Debt Incurred 1. General Obligation Bonds The County issues general obligation bonds to provide funds for the acquisition, construction, and improvement of capital facilities, and major equipment purchases. General obligation bonds have been issued for both general government and proprietary activities. The proprietary portion of general obligation debt is reported in proprietary funds because repayments will eventually come from proprietary fund revenues. General obligation bonds are direct obligations and pledge the full faith and credit of the government. Payments on these bonds are funded from various sources, dependent on the purpose of the debt. Those include real estate excise tax fees, detention facility sales tax, conservation futures, roads, County general fund and proprietary revenues.
Thurston County, Washington 2019
88

2010 Limited General Obligation Bonds of $29,665,000 were issued in 2010. The bonds were used as follows: $8,775,000 was used for an advance refunding of $1,800,000 of outstanding 1999 bonds and for a partial advance refunding of $6,730,000 of outstanding 2002 bonds. The bonds bear an interest rate of 2% to 4% payable semi-annually with annual principal installments ranging from $555,000 to $1,505,000. The term of the bonds is 12 years with final payment due in 2022. The advanced refunding portion of the 1999 bonds is serviced by the Grand Mound Debt Service Fund (Enterprise Fund). The Grand Mound Debt Service Fund includes assessments from ULID No. 96-2. The total principal assessment due in 2019 were $98,985. The amount paid was $96,818, leaving a delinquent amount in 2019 of $2,167. The remaining debt balance portion of the Grand Mound Utility was paid off in 2016. The balance at December 31, 2019 was $2,150,000. $18,850,000 of Taxable Build America Bonds were issued to finance construction of the Tilley Road project, communication system upgrades and other building improvements. The bonds bear an interest rate of .75% to 5.4% payable semi-annually with annual principal installments ranging from $825,000 to $1,285,000. The Build America Bonds also have an interest subsidy from the Internal Revenue Service to be received in semi-annual installments of 35% of the interest amount, of which a portion was reduced due to sequestration by the federal government beginning in 2013. The term of the bonds is 20 years with final payment due in 2030. The balance at December 31, 2019 was $11,095,000. $2,040,000 of Taxable Qualified Energy Conservation Bonds were issued to finance a portion of the Tilley Road project. The bonds bear an interest rate of 5.5% payable in semi-annual interest payments. Qualified Energy Conservation Bonds also have an interest subsidy from the Internal Revenue Service to be received in semi-annual installments ranging from $41,746 to $74,398, of which a portion was reduced due to sequestration by the federal government beginning in 2013. The term of the bonds is 18 years with a single principal payment due in 2029. The balance at December 31, 2019 was $ 2,040,000. A sinking fund was created in 2011 for future principal payments for the QECB bonds. The cash balance of the sinking fund at December 31, 2019 was $836,636. 2015 Limited Tax General Obligation Bonds of $13,795,000 were issued in 2015. The Bonds were issued to refund the 2004 Limited General Obligation Bonds of $6,650,000 and a partial refunding of the 2005 Limited General Obligation Bonds of $8,940.000. The bonds bear interest rates of 2.5% to 5.0% semi-annually with annual principal installments ranging from $145,000 to $3,560,000 a year. The term of the bonds is 10 years with a final payment due in 2025. The balance at December 31, 2019 is $4,100,000. 2016 Limited Tax General Obligation Bonds of $33,010,000 were issued in 2016. The Bonds were issued to partially refund the 2007 Limited General Obligation Bonds of $2,680,000 and a partial refunding of the 2009 Limited General Obligation Bonds of $30,330,000. The bonds bear interest rates of 2.0% to 5.0% semi-annually with annual principal installments ranging from $210,000 to $3,255,000 a year. The term of the bonds is 14 years with a final payment due in 2030. The balance at December 31, 2019 is $30,930,000.
Thurston County, Washington 2019
89

The annual debt service requirements to maturity for general obligation bonds are as follows:
Year EndingDecember 31 Principal Interest
2020 4,330,000 2,073,650 2021 4,610,000 1,894,200 2022 4,900,000 1,702,000 2023 4,435,000 1,497,950 2024 4,650,000 1,282,710 2025 - 2029 22,950,000 3,429,930 2030 4,440,000 140,378
Total 50,315,000$ 12,020,818$
Governmental Activities
2. Loans and Contracts Payable The Community Loan Repayment Funds (Enterprise Funds) have entered into nine state revolving fund (SRF) loan agreements with the State of Washington Department of Ecology to create a community loan program to provide low interest loans for the repair of failing on-site septic systems. The loan programs are 80% federal from the Environmental Protection Agency, and 20% state from the Department of Ecology. The term of each of the loans with the State of Washington Department of Ecology is twenty years. The first loan is not to exceed $300,000 with an interest rate of 5% per annum. Repayment began in 1996. The final payment was made in 2015. The second loan is not to exceed $200,000 with an interest rate of 0%. The final payment was made in 2019. The third loan is not to exceed $200,000 with an interest rate of 4.3%. Repayment began in 2003. The balance at December 31, 2019 is $17,255. The fourth loan is not to exceed $100,000 with an interest rate of 0%. Repayments began in 2003. The balance at December 31, 2019 is $2,909. The fifth loan is not to exceed $150,000 with an interest rate of 1.5%. Repayment began in 2005. The balance as of December 31, 2019 is $29,175. The sixth loan is not to exceed $200,000 with an interest rate of 1.5%. Repayment began in 2009. The balance at December 31, 2019 was $85,422. The seventh loan is not to exceed $254,695 with an interest rate of 2.2%. Repayment began in 2012. The balance as of December 31, 2019 was $171,098. The eighth loan is not to exceed $250,000 with an interest rate of 2.6%. Repayment began in 2017. The balance as of December 31, 2019 was $81,255. The ninth loan is not to exceed $150,000 with an interest rate of 2.7%. Repayment began in 2017. The balance as of December 31, 2019 is $13,479. Public Works entered into a state revolving fund (DWSRF) loan agreement with the State of Washington Department of Commerce to construct a corrosion control system for the Grand Mound water system in 2006. The term of the loan is for twenty years and the amount financed was $132,518 with an interest rate of 1%. The balance as of December 31, 2019 was $36,155. Public Works entered into a loan agreement with the State of Washington Department of Ecology to construct a sanitary sewer system for Woodland Creek in 2011. The term of the loan is for twenty years and the loan is not to exceed $1,286,721 with an interest amount of 2.8%. Payments began in 2015. The balance as of December 31, 2019 was $1,037,069
Thurston County, Washington 2019
90
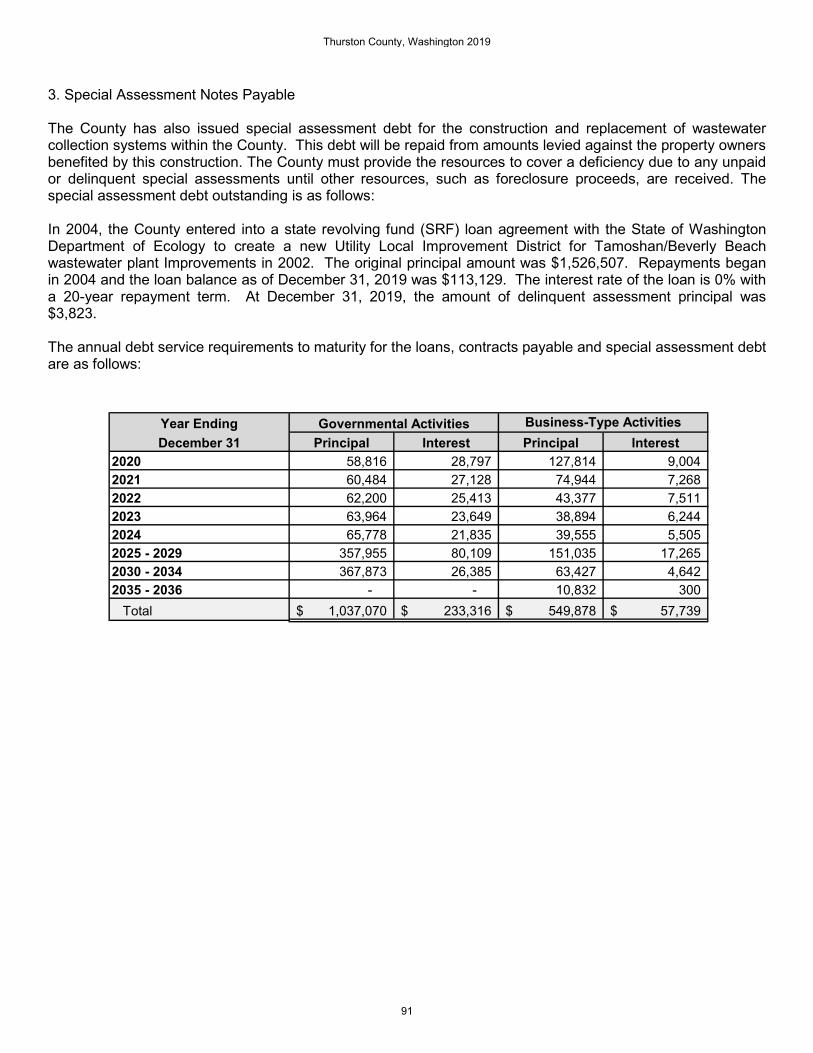
3. Special Assessment Notes Payable The County has also issued special assessment debt for the construction and replacement of wastewater collection systems within the County. This debt will be repaid from amounts levied against the property owners benefited by this construction. The County must provide the resources to cover a deficiency due to any unpaid or delinquent special assessments until other resources, such as foreclosure proceeds, are received. The special assessment debt outstanding is as follows: In 2004, the County entered into a state revolving fund (SRF) loan agreement with the State of Washington Department of Ecology to create a new Utility Local Improvement District for Tamoshan/Beverly Beach wastewater plant Improvements in 2002. The original principal amount was $1,526,507. Repayments began in 2004 and the loan balance as of December 31, 2019 was $113,129. The interest rate of the loan is 0% with a 20-year repayment term. At December 31, 2019, the amount of delinquent assessment principal was $3,823. The annual debt service requirements to maturity for the loans, contracts payable and special assessment debt are as follows:
Year EndingDecember 31 Principal Interest Principal Interest
2020 58,816 28,797 127,814 9,004 2021 60,484 27,128 74,944 7,268 2022 62,200 25,413 43,377 7,511 2023 63,964 23,649 38,894 6,244 2024 65,778 21,835 39,555 5,505 2025 - 2029 357,955 80,109 151,035 17,265 2030 - 2034 367,873 26,385 63,427 4,642 2035 - 2036 - - 10,832 300 Total 1,037,070$ 233,316$ 549,878$ 57,739$
Governmental Activities Business-Type Activities
Thurston County, Washington 2019
91

4. Leases a. Operating Lease Liabilities The County has lease commitments for leases of buildings and office space that are cancelable and non-cancelable. Currently, the County has thirteen leases that will come to expire over the course of the next five years. Operating lease expenditures for the year ended December 31, 2019 were $613,440. The future minimum lease payments for these leases are:
Year Ending December 31 Amount2020 597,680$ 2021 512,892 2022 402,693 2023 297,001 2024 144,637 2025 - Total 1,954,903$
b. Capital Lease Liabilities The County has entered into the transactions that are recorded as capital lease purchases to account for copier leases. These long-term contracts incorporate some or all of the benefits and risks of ownership. The leased assets and related obligations are accounted for in the statement of net position. The net capital lease amount shown below reflects the assets continuing to be financed through the capital lease. These lease agreements qualify as capital leases for accounting purposes, and therefore, have been recorded at the present value of the future minimum lease payments as of the inception date. The assets acquired through capital lease are as follows:
AssetGovernmental
ActivitiesBusiness-Type
ActivitiesMachinery & Equipment 564,505$ 71,391$ Less: accumulated depreciation (334,392) (42,858) Present Value of Minimum Lease Payments 230,113 28,533 Plus amount representing interest 25,528 3,370 Total Invested in Capital Leases 255,641$ 31,903$
Thurston County, Washington 2019
92

The future minimum lease obligations and net present value of minimum lease payments for assets acquired through capital leases as of December 31, 2019 were as follows:
Year Ending December 31Governmental
ActivitiesBusiness-Type
Activities2020 110,385$ 14,493$ 2021 74,686 10,502 2022 51,147 3,604 2023 17,201 3,304 2024 2,220 Total Minimum Lease Payments 255,641 31,903 Less: Interest (25,528) (3,370) Present Value of Minimum Lease Payments 230,113$ 28,533$
c. Lease Receivables The County currently leases some of its property to various tenants under long-term cancelable and non-cancelable contracts. The following is an analysis of the County’s investment in property under long-term operating leases as of December 31, 2019:
Asset Governmental ActivitiesLand 1,175,162$ Buildings 7,461,460 Less: Accumulated Depreciation (3,319,748) Total Invested in Long Term Leases 5,316,874$
The County received $284,020 of operating lease revenues from these contracts in 2019. Amounts that will be received in future years under these lease agreements are noted below:
Year Ending December 31 Amount2020 227,707$ 2021 194,258 2022 194,258 2023 194,258 2024 4 2025-2050 100
Total Lease Receivable 810,585$
Thurston County, Washington 2019
93

The $100 receivable from 2025 through 2050 is a combination of park and ride lease with Intercity Transit located at the Waste and Recovery Center, Quixote Village Panza located 3350 Mottman RD SW Olympia and Homes First! Located at 5505 32ND CT SE Olympia. 5. Long-term Compensated Absences Thurston County has traditional and alternative leave plans allowed per collective bargaining agreements and personnel policies. Thurston County employees who chose the traditional leave plan earn 12 days of sick leave and 12-24.75 days of vacation leave per year depending upon the employee’s length of service. A maximum of 150 days of sick leave may be accrued and a maximum of 50 days of vacation may be accrued. County employees, who chose the alternative leave plan, earn 12-20.50 days of annual or personal leave (a combination of sick leave and vacation leave) per year depending upon the employee’s length of service. A maximum of 212 days of personal leave may be accrued. Accumulated unpaid vacation/annual leave is recorded as earned by employees. In the traditional plan, terminating employees are entitled to be paid for unused vacation up to a maximum of 280 hours and, if retiring, half of unused sick leave, to a maximum of 360 hours. Alternative plan employees who terminate are entitled to be paid for unused leave up to 300 hours. The County reported a liability of $8,068,993 at December 31, 2019 for that portion of unpaid accumulated vacation and personal leave payable in the Statement of Net Position. This liability includes $6,451,920 for governmental funds, $664,336 for internal service funds and $952,737 for enterprise funds. $410,074 of this liability is expected to be incurred in 2019. Leave costs are paid from governmental funds that fund the personnel costs for those employees. Vested sick leave is not considered material and is not accrued.
Thurston County, Washington 2019
94

B. Changes in Long-Term and Other Significant Debt The following is a summary of long-term and other significant debt transactions of the County:
New Issues RetirementsBeginning And And Ending Due WithinBalance Adjustments Adjustments Balance One Year
Governmental Activities:
Bonds payable:
General Obligation Bonds 54,427,413$ -$ 4,112,413$ 50,315,000$ 4,330,000$ For Issuance Premiums 4,710,066 - 450,255 4,259,811 450,255
Total Bonds Payable 59,137,479 - 4,562,668 54,574,811 4,780,255
Notes Payable:
Loans Payable 1,094,263 - 57,194 1,037,069 58,816 Capital Leases Payable 285,895 54,255 110,037 230,113 96,186
Total Notes Payable 1,380,158 54,255 167,231 1,267,182 155,002 Claims and Judgments Payable 4,453,721 57,501 394,036 4,117,186 548,671 Compensated Absences 7,341,534 145,123 370,401 7,116,256 361,656 Other Post Employment Benefits (OPEB) 44,496,018 7,061,804 839,905 50,717,917 869,337 Other Non-Current Liabilities 809,247 - - 809,247 Net Pension Liability 29,289,055 - 7,779,394 21,509,661
Total Governmental Activities 146,907,212$ 7,318,683$ 14,113,635$ 140,112,260$ 6,714,921$
Business-type Activities:
Bonds Payable:
General Obligation Bonds 1,212,587$ -$ 1,212,587$ -$ -$ For Issuance Premiums 183,620 26,413 157,207 -
Total Bonds Payable 1,396,207 - 1,239,000 157,207 -
Notes Payable:
Loans Payable 490,163 - 53,415 436,748 49,531 Capital Leases Payable 40,553 - 12,020 28,533 12,817
Total Notes Payable 530,716 - 65,435 465,281 62,348 Special Assessments Payable 191,411 - 78,282 113,129 78,282 Compensated Absences 701,741 286,400 35,405 952,736 48,419 Accumulated Landfill Closure Costs 14,439,192 - 588,954 13,850,238 - Other Post Employment Benefits (OPEB) 3,768,126 2,771,174 87,871 6,451,429 89,490 Net Pension Liability 3,789,450 210,728 - 4,000,178 -
Total Business-type Activities 24,816,843$ 3,268,302$ 2,094,947$ 25,990,198$ 278,539$
Schedule Of Changes Debt and Other Long-Term LiabilitiesFor The Year Ended December 31, 2019
Thurston County, Washington 2019
95

Internal Service funds predominately serve governmental funds. Accordingly, their long-term liabilities are included in totals for governmental activities. At year end, $664,335 of internal service fund compensated absences are included in the amounts above. Internal service funds also include $1,637,850 of general obligation bonds payable and $4,204,654 of other post-employment benefits payable. Claims and judgments are generally liquidated by the Insurance Risk Management Internal Service Fund and compensated absences are liquidated by the funds incurring the liability. Enterprise segment information is not disclosed since revenue streams are not pledged to support proprietary long-term debt. Compensated absence liabilities for governmental funds are typically liquidated by the fund in which the employee is being compensated reports his/her time. Additionally, the County liquidates and funds past and future pension and OPEB obligations through employee and employer paid pension and medical benefit obligations. Therefore, only funds with FTEs would fund these types of obligations which would exclude the following reported County Funds: Anti-Profiteering, Auditor Election Reserve, Basin Planning, Conservation Futures, Law Library, Detention Facilities Sales Tax Holding, Emergency Management Council, Superior Court Family Services, Trial Court Improvement, Stadium/Convention/Art Center, Tax Refunds, Tourism Promotion, Communications, Historic Preservation, Debt Service Funds, Capital Project Funds and the Community Loan Program Fund. C. Assets Available for Debt Service The County is meeting debt service requirements. The County has sufficient assets in a variety of different funds to meet current and future debt service payments. At December 31, 2019, the County had $940,363 available in reserve in governmental debt service funds to service general obligation and assessment debt. The County’s general obligation debt, as noted above, will be funded by cash balances and future revenue streams from the Real Estate Tax and Detention Facility Sales Tax Holding Funds. At December 31, 2019 the County also had $185,497 in net position restricted for business type debt, which primarily include current and long term special assessment receivables that have been assessed on benefitting utility districts. D. Legal Debt Margin State law limits Thurston County’s non-voted debt capacity of 1 ½% and voted debt capacity of 2 ½% of the assessed valuation. The capacity amounts are as follows for 2019:
Purpose of Remaining
Indebtedness Total Capacity CapacityGeneral Government(No vote required)General Government(With 3/5-majority vote)
570,104,933$ 516,367,984$
950,174,889$ 896,437,940$
E. Contingent Liability for Refunded and Defeased Debt In prior years, the County issued general obligation refunding (new) bonds to provide resources to purchase U.S. government securities that were placed in an irrevocable trust for the purpose of generating resources for all future debt service payments on the refunded (old) debt. As a result, the refunded bonds are defeased and the liability for the defeased bonds is not included in the County’s financial statements. Currently the County has four outstanding refunded issues.
Thurston County, Washington 2019
96
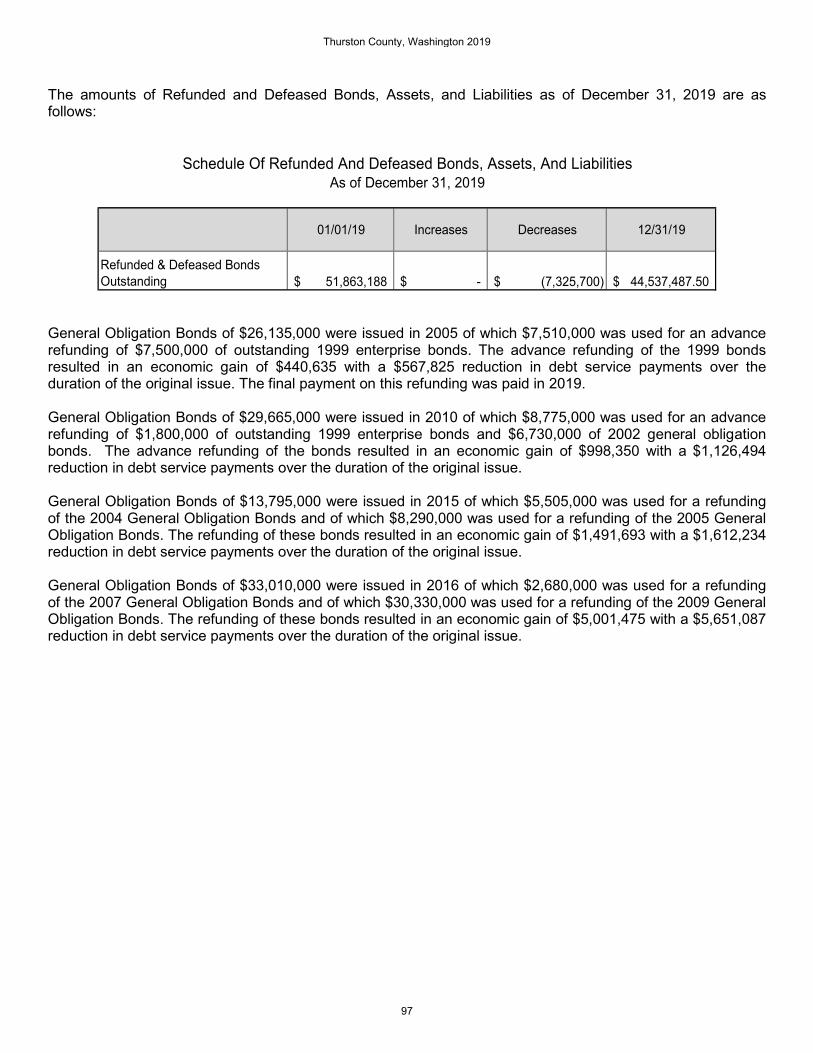
The amounts of Refunded and Defeased Bonds, Assets, and Liabilities as of December 31, 2019 are as follows:
01/01/19 Increases Decreases 12/31/19
Refunded & Defeased Bonds Outstanding 51,863,188$ -$ (7,325,700)$ 44,537,487.50$
Schedule Of Refunded And Defeased Bonds, Assets, And LiabilitiesAs of December 31, 2019
General Obligation Bonds of $26,135,000 were issued in 2005 of which $7,510,000 was used for an advance refunding of $7,500,000 of outstanding 1999 enterprise bonds. The advance refunding of the 1999 bonds resulted in an economic gain of $440,635 with a $567,825 reduction in debt service payments over the duration of the original issue. The final payment on this refunding was paid in 2019. General Obligation Bonds of $29,665,000 were issued in 2010 of which $8,775,000 was used for an advance refunding of $1,800,000 of outstanding 1999 enterprise bonds and $6,730,000 of 2002 general obligation bonds. The advance refunding of the bonds resulted in an economic gain of $998,350 with a $1,126,494 reduction in debt service payments over the duration of the original issue. General Obligation Bonds of $13,795,000 were issued in 2015 of which $5,505,000 was used for a refunding of the 2004 General Obligation Bonds and of which $8,290,000 was used for a refunding of the 2005 General Obligation Bonds. The refunding of these bonds resulted in an economic gain of $1,491,693 with a $1,612,234 reduction in debt service payments over the duration of the original issue. General Obligation Bonds of $33,010,000 were issued in 2016 of which $2,680,000 was used for a refunding of the 2007 General Obligation Bonds and of which $30,330,000 was used for a refunding of the 2009 General Obligation Bonds. The refunding of these bonds resulted in an economic gain of $5,001,475 with a $5,651,087 reduction in debt service payments over the duration of the original issue.
Thurston County, Washington 2019
97

NOTE X – INTERFUND TRANSACTIONS A. Interfund Receivables and Payables Interfund transactions usually involve the exchange of goods and services between funds in a normal business relationship. These amounts, which are reported in the fund financial statements, were eliminated in the government-wide statements. The composition of interfund receivables and payables in the fund financial statements as of December 31, 2019 is shown in the following table:
Due to General Public Non-Maj Internal Solid Grand Non-MajOther Funds Fund Roads Health REET Gov Service Waste Mound Enter TotalGeneral Fund 181,611$ -$ -$ 40,518$ 80,381$ -$ -$ 5,210$ 142,983$ -$ -$ 450,703$ Roads 41,999 2,275 - 89,000 333,248 2,302 8 35,462 - 115 - 504,409$ Medic One - - - - - - - - - - - - -$ Public Health 46,464 - - - - - 96 - - - - - 46,560$ REET - 382,510 - - - 45,207 - 3,570 - - - 2,248 433,535$
Non-Major Governmental405,605 398,990 51,942 - 2,869 870 1,465 - - - - - 861,741$
Internal Service 75,598 11,339 - - 9,000 264,017 - - - - - - 359,954$ Solid Waste 37,756 7,005 71,642 - - 1,677 - - - - 124,984 - 243,064$ Grand Mound - 1,414 - - - 133 135 - 3,661 - 174 - 5,517$ Stormwater 11,613 2,705 - - 181 75,370 1,130 50 - 149,434 137,995 32 378,510$ Land Use & Permittihg - - - - - 20 - - - - - - 20$ Non-Major Enterprise - 919 - 1,050 - 4 90 - 915 - 319 - 3,297$
Total Due to/Due from 619,035$ 986,493$ 125,859$ 1,050$ 141,568$ 800,927$ 5,218$ 3,628$ 45,248$ 292,417$ 263,587$ 2,280$ 3,287,310$
Due From Other Funds Storm Water
Land Use & Permitting
Environmental Health
B. Interfund Loans and Advances Interfund loans are fund transfers for less than a year that are outstanding at year end and advances are fund transfers for more than one year. These amounts, which are reported in the fund financial statements, were eliminated in the government-wide statements. The county had no interfund loans or advances outstanding at the end of 2019. C. Interfund Transfers Interfund transfers are subsidies and contributions provided by one fund to another fund with no corresponding promise for repayment. These amounts, which are reported in the fund financial statements, were eliminated in the government-wide statements. Transfers out from the General Fund are usually made to subsidize activities in other funds, such as Public Health and Land Use and Permitting that are not fully funded by taxes, grants or program and service fees. Transfers in to the General Fund are primarily from sales tax holding funds for public safety purposes. Transfers out of Detention Facilities Sales Tax and Debt Holding Funds are primarily to fund public safety capital projects in capital project funds and public safety operations in the General Fund. Transfers in to Public Health and Social Services mostly comprise subsidies and support service payments from the General Fund. Transfers in to and out of proprietary and non-major governmental funds are primarily for debt service and associated capital projects. Transfers could also include transfers of residual fund balances to active ongoing funds from funds that were closed out and terminated during the year.
Thurston County, Washington 2019
98

Interfund transfers occurring between major funds, non-major governmental funds, non-major enterprise funds and internal service funds of the County during the year ended December 31, 2019 are summarized below:
Transfer Out General Fund Roads Medic One REET Public Health Non-Major
Govt Internal Service Solid Waste
Grand Mound
Land Use and Permitting StormWater
Non-Major Enterprise Total
General Fund 170,000$ 1,083,735$ 655,638$ 130,000$ 466,679$ 49,795$ -$ 2,555,847$
Roads 794,797 339,399 1,134,196$
Medic One -$
REET 1,907,004 2,108,461 284,200 961,424 31,065 5,292,154$
Public Health 1,277,693 1,277,693$
Non-Major Govt 20,000 1,373,508 66,877 3,598,821 7,982 5,067,188$
Internal Service 269,820 30,000 2,500 20,000 13,750 794,692 8,000 7,500 5,250 1,750 1,153,262$
Solid Waste 225 3,937 4,162$
Ground Mound 35,748 35,748$
Land Use and Permitting -$
StormWater 83,791 104,291 188,082$
Environmental Health 16,000 16,000$
Health -$ Total Transfers 289,820$ 3,480,737$ 2,500$ -$ 1,170,612$ 7,171,467$ 1,679,749$ 8,000$ 961,424$ 594,470$ 5,250$ 1,327,488$ 32,815$ 16,724,332$
Transfer In
Environmental Health
NOTE XI – PENSION PLANS The following table represents the aggregate pension amounts for all plans for the year 2019:
Pension liabilities (25,509,839)$ Pension assets 7,776,323$ Deferred outflows of resources 7,522,920$ Deferred inflows of resources (16,196,095)$ Pension expense/expenditures 2,278,323$
Aggregate Pension Amounts - All Plans
State Sponsored Pension Plans Substantially all County full-time and qualifying part-time employees participate in one of the following statewide retirement systems administered by the Washington State Department of Retirement Systems, under cost-sharing, multiple-employer public employee defined benefit and defined contribution retirement plans. The state Legislature establishes, and amends, laws pertaining to the creation and administration of all public retirement systems.
Thurston County, Washington 2019
99

The Department of Retirement Systems (DRS), a department within the primary government of the State of Washington, issues a publicly available comprehensive annual financial report (CAFR) that includes financial statements and required supplementary information for each plan. The DRS CAFR may be obtained by writing to: Department of Retirement Systems Communications Unit P.O. Box 48380 Olympia, WA 98540-8380 Or the DRS CAFR may be downloaded from the DRS website at www.drs.wa.gov. Public Employees’ Retirement System (PERS) PERS members include elected officials; state employees; employees of the Supreme, Appeals and Superior Courts; employees of the legislature; employees of district and municipal courts; employees of local governments; and higher education employees not participating in higher education retirement programs. PERS is comprised of three separate pension plans for membership purposes. PERS plans 1 and 2 are defined benefit plans, and PERS plan 3 is a defined benefit plan with a defined contribution component. PERS Plan 1 provides retirement, disability and death benefits. Retirement benefits are determined as two percent of the member’s average final compensation (AFC) times the member’s years of service. The AFC is the average of the member’s 24 highest consecutive service months. Members are eligible for retirement from active status at any age with at least 30 years of service, at age 55 with at least 25 years of service, or at age 60 with at least five years of service. Members retiring from active status prior to the age of 65 may receive actuarially reduced benefits. Retirement benefits are actuarially reduced to reflect the choice of a survivor benefit. Other benefits include duty and non-duty disability payments, an optional cost-of-living adjustment (COLA), and a one-time duty-related death benefit, if found eligible by the Department of Labor and Industries. PERS 1 members were vested after the completion of five years of eligible service. The plan was closed to new entrants on September 30, 1977.
Thurston County, Washington 2019
100

Contributions The PERS Plan 1 member contribution rate is established by State statute at 6 percent. The employer contribution rate is developed by the Office of the State Actuary and includes an administrative expense component that is currently set at 0.18 percent. Each biennium, the state Pension Funding Council adopts Plan 1 employer contribution rates. The PERS Plan 1 required contribution rates (expressed as a percentage of covered payroll) for 2019 were as follows:
PERS Plan 1 Actual Contribution Rates
Employer Employee*
January – June 2019 PERS Plan 1 7.52% 6.00% PERS Plan 1 UAAL 5.13% Administrative Fee 0.18%
Total 12.83% 6.00% July – December 2019 PERS Plan 1 7.92% 6.00% PERS Plan 1 UAAL 4.76% Administrative Fee 0.18%
Total 12.86% 6.00%
* For employees participating in JBM, the contribution rate was 12.26%. PERS Plan 2/3 provides retirement, disability and death benefits. Retirement benefits are determined as two percent of the member’s average final compensation (AFC) times the member’s years of service for Plan 2 and 1 percent of AFC for Plan 3. The AFC is the average of the member’s 60 highest-paid consecutive service months. There is no cap on years of service credit. Members are eligible for retirement with a full benefit at 65 with at least five years of service credit. Retirement before age 65 is considered an early retirement. PERS Plan 2/3 members who have at least 20 years of service credit and are 55 years of age or older, are eligible for early retirement with a benefit that is reduced by a factor that varies according to age for each year before age 65. PERS Plan 2/3 members who have 30 or more years of service credit and are at least 55 years old can retire under one of two provisions:
• With a benefit that is reduced by three percent for each year before age 65; or
• With a benefit that has a smaller (or no) reduction (depending on age) that imposes stricter return-to-work rules.
Thurston County, Washington 2019
101

PERS Plan 2/3 members hired on or after May 1, 2013 have the option to retire early by accepting a reduction of five percent for each year of retirement before age 65. This option is available only to those who are age 55 or older and have at least 30 years of service credit. PERS Plan 2/3 retirement benefits are also actuarially reduced to reflect the choice of a survivor benefit. Other PERS Plan 2/3 benefits include duty and non-duty disability payments, a cost-of-living allowance (based on the CPI), capped at three percent annually and a one-time duty related death benefit, if found eligible by the Department of Labor and Industries. PERS 2 members are vested after completing five years of eligible service. Plan 3 members are vested in the defined benefit portion of their plan after ten years of service; or after five years of service if 12 months of that service are earned after age 44. PERS Plan 3 defined contribution benefits are totally dependent on employee contributions and investment earnings on those contributions. PERS Plan 3 members choose their contribution rate upon joining membership and have a chance to change rates upon changing employers. As established by statute, Plan 3 required defined contribution rates are set at a minimum of 5 percent and escalate to 15 percent with a choice of six options. Employers do not contribute to the defined contribution benefits. PERS Plan 3 members are immediately vested in the defined contribution portion of their plan. Contributions The PERS Plan 2/3 employer and employee contribution rates are developed by the Office of the State Actuary to fully fund Plan 2 and the defined benefit portion of Plan 3. The Plan 2/3 employer rates include a component to address the PERS Plan 1 UAAL and an administrative expense that is currently set at 0.18 percent. Each biennium, the state Pension Funding Council adopts Plan 2 employer and employee contribution rates and Plan 3 contribution rates. The PERS Plan 2/3 required contribution rates (expressed as a percentage of covered payroll) for 2019 were as follows:
PERS Plan 2/3 Actual Contribution Rates
Employer 2/3 Employee 2*
January – June 2019 PERS Plan 2/3 7.52% 7.41% PERS Plan 1 UAAL 5.13% Administrative Fee 0.18% Employee PERS Plan 3 Varies
Total 12.83% 7.41% July – December 2019 PERS Plan 2/3 7.92% 7.90% PERS Plan 1 UAAL 4.76% Administrative Fee 0.18% Employee PERS Plan 3 Varies
Total 12.86% 7.90%
* For employees participating in JBM, the contribution rate was 18.53% to 19.75%. The County’s actual PERS plan contributions were $3,689,985 to PERS Plan 1 and $4,762,500 to PERS Plan 2/3 for the year ended December 31, 2019.
Thurston County, Washington 2019
102
Public Safety Employees’ Retirement System (PSERS) PSERS Plan 2 was created by the 2004 Legislature and became effective July 1, 2006. To be eligible for membership, an employee must work on a full time basis and:
• Have completed a certified criminal justice training course with authority to arrest, conduct criminal
investigations, enforce the criminal laws of Washington, and carry a firearm as part of the job; or
• Have primary responsibility to ensure the custody and security of incarcerated or probationary individuals; or
• Function as a limited authority Washington peace officer, as defined in RCW 10.93.020; or
• Have primary responsibility to supervise eligible members who meet the above criteria. PSERS membership includes:
• PERS 2 or 3 employees hired by a covered employer before July 1, 2006, who met at least one of the PSERS eligibility criteria and elected membership during the period of July 1, 2006 to September 30 2006; and
• Employees hired on or after July 1, 2006 by a covered employer, that meet at least one of the PSERS eligibility criteria.
PSERS covered employers include:
• Certain State of Washington agencies (Department of Corrections, Department of Natural Resources, Gambling Commission, Liquor and Cannabis Board, Parks and Recreation Commission, and Washington State Patrol),
• Washington State Counties,
• Washington State Cities (except for Seattle, Spokane, and Tacoma),
• Correctional entities formed by PSERS employers under the Interlocal Cooperation Act. PSERS Plan 2 provides retirement, disability and death benefits. Retirement benefits are determined as two percent of the average final compensation (AFC) for each year of service. The AFC is based on the member’s 60 consecutive highest creditable months of service. Benefits are actuarially reduced for each year that the member’s age is less than 60 (with ten or more service credit years in PSERS), or less than 65 (with fewer than ten service credit years). There is no cap on years of service credit. Members are eligible for retirement at the age of 65 with five years of service; or at the age of 60 with at least ten years of PSERS service credit; or at age 53 with 20 years of service. Retirement before age 60 is considered an early retirement. PSERS members who retire prior to the age of 60 receive reduced benefits. If retirement is at age 53 or older with at least 20 years of service, a three percent per year reduction for each year between the age at retirement and age 60 applies. PSERS Plan 2 retirement benefits are actuarially reduced to reflect the choice of a survivor benefit. Other benefits include duty and non-duty disability payments, an optional cost-of living adjustment (COLA), and a one-time duty-related death benefit, if found eligible by the Department of Labor and Industries. PSERS Plan 2 members are vested after completing five years of eligible service.
Thurston County, Washington 2019
103

Contributions The PSERS Plan 2 employer and employee contribution rates are developed by the Office of the State Actuary to fully fund Plan 2. The Plan 2 employer rates include components to address the PERS Plan 1 unfunded actuarial accrued liability and administrative expense currently set at 0.18 percent. Each biennium, the state Pension Funding Council adopts Plan 2 employer and employee contribution rates. The PSERS Plan 2 required contribution rates (expressed as a percentage of current-year covered payroll) for 2019 were as follows:
PSERS Plan 2 Actual Contribution Rates
Employer Employee
January – June 2019 PSERS Plan 2 7.07% 7.07% PERS Plan 1 UAAL 5.13% Administrative Fee 0.18%
Total 12.38% 7.07% July – December 2019 PSERS Plan 2 7.20% 7.20% PERS Plan 1 UAAL 4.76% Administrative Fee 0.18%
Total 12.14% 7.20% The County’s actual plan contributions were $868,354 to PSERS Plan 2 for the year ended December 31, 2019. Law Enforcement Officers’ and Fire Fighters’ Retirement System (LEOFF) LEOFF membership includes all full-time, fully compensated, local law enforcement commissioned officers, firefighters, and as of July 24, 2005, emergency medical technicians. LEOFF is comprised of two separate defined benefit plans. LEOFF Plan 1 provides retirement, disability and death benefits. Retirement benefits are determined per year of service calculated as a percent of final average salary (FAS) as follows:
• 20+ years of service – 2.0% of FAS • 10-19 years of service – 1.5% of FAS • 5-9 years of service – 1% of FAS
The FAS is the basic monthly salary received at the time of retirement, provided a member has held the same position or rank for 12 months preceding the date of retirement. Otherwise, it is the average of the highest consecutive 24 months’ salary within the last ten years of service. Members are eligible for retirement with five years of service at the age of 50. Other benefits include duty and non-duty disability payments, a cost-of living adjustment (COLA), and a one-time duty-related death benefit, if found eligible by the Department of Labor and Industries. LEOFF 1 members were vested after the completion of five years of eligible service. The plan was closed to new entrants on September 30, 1977.
Thurston County, Washington 2019
104

Contributions Starting on July 1, 2000, LEOFF Plan 1 employers and employees contribute zero percent, as long as the plan remains fully funded. The LEOFF Plan I had no required employer or employee contributions for fiscal year 2019. Employers paid only the administrative expense of 0.18 percent of covered payroll. LEOFF Plan 2 provides retirement, disability and death benefits. Retirement benefits are determined as two percent of the final average salary (FAS) per year of service (the FAS is based on the highest consecutive 60 months). Members are eligible for retirement with a full benefit at 53 with at least five years of service credit. Members who retire prior to the age of 53 receive reduced benefits. If the member has at least 20 years of service and is age 50, the reduction is three percent for each year prior to age 53. Otherwise, the benefits are actuarially reduced for each year prior to age 53. LEOFF 2 retirement benefits are also actuarially reduced to reflect the choice of a survivor benefit. Other benefits include duty and non-duty disability payments, a cost-of-living allowance (based on the CPI), capped at three percent annually and a one-time duty-related death benefit, if found eligible by the Department of Labor and Industries. LEOFF 2 members are vested after the completion of five years of eligible service. Contributions The LEOFF Plan 2 employer and employee contribution rates are developed by the Office of the State Actuary to fully fund Plan 2. The employer rate includes an administrative expense component set at 0.18 percent. Plan 2 employers and employees are required to pay at the level adopted by the LEOFF Plan 2 Retirement Board. Effective July 1, 2017, when a LEOFF employer charges a fee or recovers costs for services rendered by a LEOFF 2 member to a non-LEOFF employer, the LEOFF employer must cover both the employer and state contributions on the LEOFF 2 basic salary earned for those services. The state contribution rate (expressed as a percentage of covered payroll) was 3.44% as of July 1, 2019.
Thurston County, Washington 2019
105
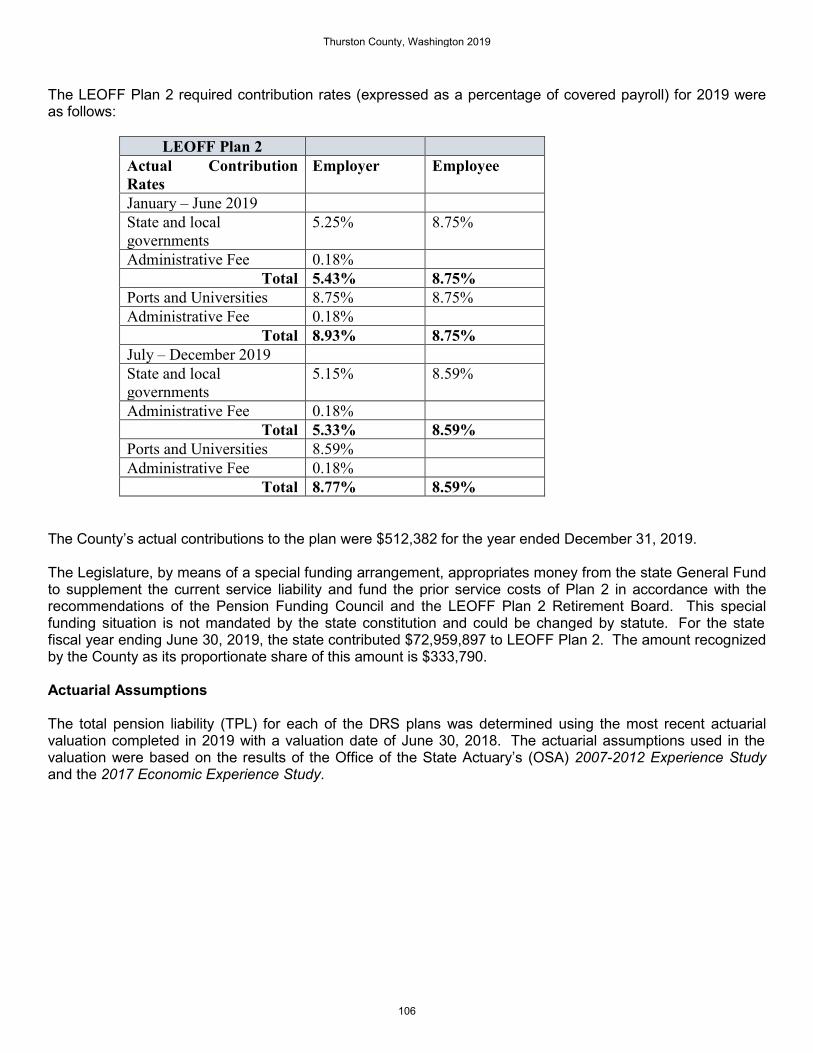
The LEOFF Plan 2 required contribution rates (expressed as a percentage of covered payroll) for 2019 were as follows:
LEOFF Plan 2 Actual Contribution Rates
Employer Employee
January – June 2019 State and local governments
5.25% 8.75%
Administrative Fee 0.18% Total 5.43% 8.75%
Ports and Universities 8.75% 8.75% Administrative Fee 0.18%
Total 8.93% 8.75% July – December 2019 State and local governments
5.15% 8.59%
Administrative Fee 0.18% Total 5.33% 8.59%
Ports and Universities 8.59% Administrative Fee 0.18%
Total 8.77% 8.59%
The County’s actual contributions to the plan were $512,382 for the year ended December 31, 2019.
The Legislature, by means of a special funding arrangement, appropriates money from the state General Fund to supplement the current service liability and fund the prior service costs of Plan 2 in accordance with the recommendations of the Pension Funding Council and the LEOFF Plan 2 Retirement Board. This special funding situation is not mandated by the state constitution and could be changed by statute. For the state fiscal year ending June 30, 2019, the state contributed $72,959,897 to LEOFF Plan 2. The amount recognized by the County as its proportionate share of this amount is $333,790.
Actuarial Assumptions
The total pension liability (TPL) for each of the DRS plans was determined using the most recent actuarial valuation completed in 2019 with a valuation date of June 30, 2018. The actuarial assumptions used in the valuation were based on the results of the Office of the State Actuary’s (OSA) 2007-2012 Experience Study and the 2017 Economic Experience Study.
Thurston County, Washington 2019
106

Additional assumptions for subsequent events and law changes are current as of the 2018 actuarial valuation report. The TPL was calculated as of the valuation date and rolled forward to the measurement date of June 30, 2019. Plan liabilities were rolled forward from June 30, 2018, to June 30, 2019, reflecting each plan’s normal cost (using the entry-age cost method), assumed interest and actual benefit payments.
• Inflation: 2.75% total economic inflation; 3.50% salary inflation
• Salary increases: In addition to the base 3.50% salary inflation assumption, salaries are also expected to grow by promotions and longevity.
• Investment rate of return: 7.4% Mortality rates were based on the RP-2000 report’s Combined Healthy Table and Combined Disabled Table, published by the Society of Actuaries. The OSA applied offsets to the base table and recognized future improvements in mortality by projecting the mortality rates using 100 percent Scale BB. Mortality rates are applied on a generational basis; meaning, each member is assumed to receive additional mortality improvements in each future year throughout his or her lifetime. There were changes in methods and assumptions since the last valuation.
• OSA updated modeling to reflect providing benefit payments to the date of the initial retirement eligibility for terminated vested members who delay application for retirement benefits.
• OSA updated COLA programming to reflect legislation signed during the 2018 legislative session that provides PERS and TRS Plan 1 annuitants who are not receiving a basic minimum, alternate minimum, or temporary disability benefit with a one-time permanent 1.5% increase to their monthly retirement benefit, not to exceed a maximum of $62.50 per month.
Discount Rate The discount rate used to measure the total pension liability for all DRS plans was 7.4 percent. To determine that rate, an asset sufficiency test included an assumed 7.5 percent long-term discount rate to determine funding liabilities for calculating future contribution rate requirements. (All plans use 7.5 percent except LEOFF 2, which has assumed 7.4 percent). Consistent with the long-term expected rate of return, a 7.4 percent future investment rate of return on invested assets was assumed for the test. Contributions from plan members and employers are assumed to continue being made at contractually required rates (including PERS 2/3, PSERS 2, SERS 2/3, and TRS 2/3 employers, whose rates include a component for the PERS 1, and TRS 1 plan liabilities). Based on these assumptions, the pension plans’ fiduciary net position was projected to be available to make all projected future benefit payments of current plan members. Therefore, the long-term expected rate of return of 7.4 percent was used to determine the total liability. Long-Term Expected Rate of Return The long-term expected rate of return on the DRS pension plan investments of 7.4 percent was determined using a building-block-method. In selecting this assumption, the Office of the State Actuary (OSA) reviewed the historical experience data, considered the historical conditions that produced past annual investment returns, and considered capital market assumptions and simulated expected investment returns provided by the Washington State Investment Board (WSIB). The WSIB uses the capital market assumptions and their target asset allocation to simulate future investment returns over various time horizons.
Thurston County, Washington 2019
107

Estimated Rates of Return by Asset Class Best estimates of arithmetic real rates of return for each major asset class included in the pension plan’s target asset allocation as of June 30, 2019, are summarized in the table below. The inflation component used to create the table is 2.2 percent and represents the WSIB’s most recent long-term estimate of broad economic inflation.
Asset Class
Target
Allocation
% Long-Term Expected Real Rate of
Return Arithmetic Fixed Income 20% 2.20% Tangible Assets 7% 5.10% Real Estate 18% 5.80% Global Equity 32% 6.30% Private Equity 23% 9.30% 100%
Sensitivity of the Net Pension Liability/(Asset) The table below presents the County’s proportionate share* of the net pension liability calculated using the discount rate of 7.4 percent, as well as what the County’s proportionate share of the net pension liability would be if it were calculated using a discount rate that is 1-percentage point lower (6.4 percent) or 1-percentage point higher (8.4 percent) than the current rate.
1% Decrease Current Discount Rate 1% increase6.40% 7.40% 8.40%
PERS 1 25,168,973 20,097,902 15,698,080PERS 2/3 41,507,410 5,411,937 (24,206,783)PSERS 2 3,457,820 (334,933) (3,314,461)LEOFF 1 (848,119) (1,036,752) (1,199,619)LEOFF 2 (1,190,892) (6,404,637) (10,660,246)
* See Note 4.C of the DRS Participating Employer Financial Information report for the year ended June 30. Multiply the total net pension liability amounts for each applicable plan by your proportionate share for that plan. Pension Plan Fiduciary Net Position Detailed information about the State’s pension plans’ fiduciary net position is available in the separately issued DRS financial report.
Thurston County, Washington 2019
108
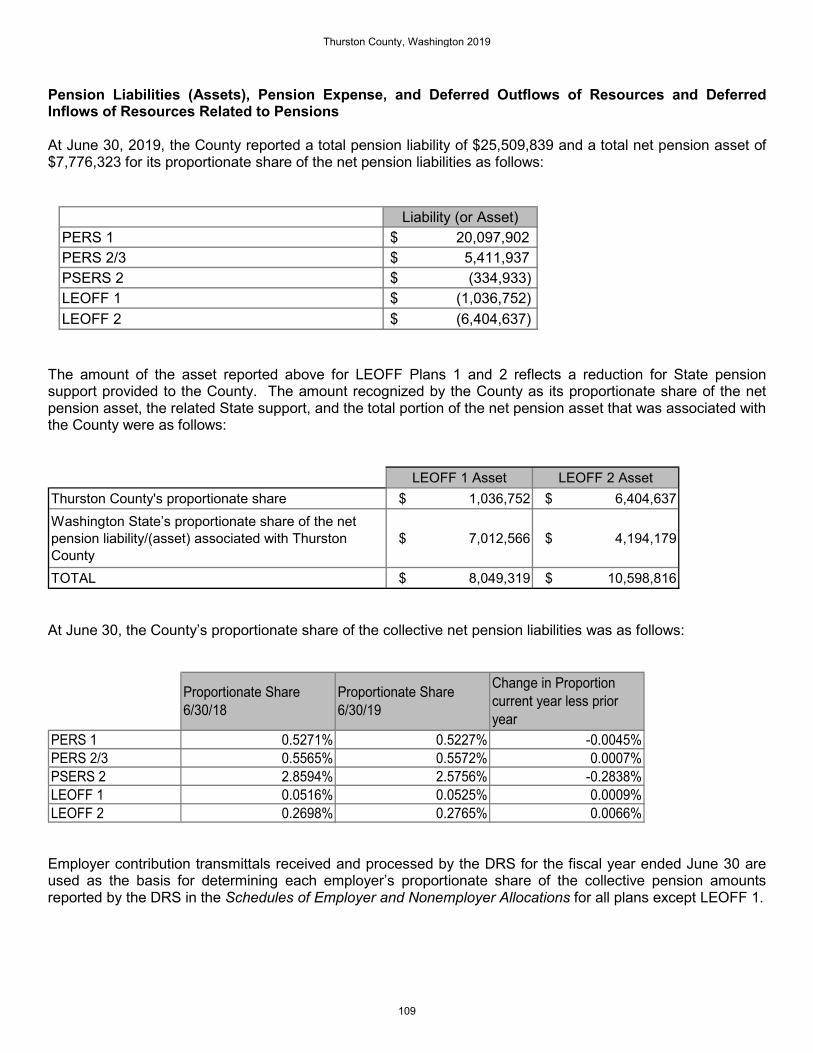
Pension Liabilities (Assets), Pension Expense, and Deferred Outflows of Resources and Deferred Inflows of Resources Related to Pensions At June 30, 2019, the County reported a total pension liability of $25,509,839 and a total net pension asset of $7,776,323 for its proportionate share of the net pension liabilities as follows:
Liability (or Asset)PERS 1 $ 20,097,902 PERS 2/3 $ 5,411,937 PSERS 2 $ (334,933)LEOFF 1 $ (1,036,752)LEOFF 2 $ (6,404,637)
The amount of the asset reported above for LEOFF Plans 1 and 2 reflects a reduction for State pension support provided to the County. The amount recognized by the County as its proportionate share of the net pension asset, the related State support, and the total portion of the net pension asset that was associated with the County were as follows:
LEOFF 1 Asset LEOFF 2 AssetThurston County's proportionate share $ 1,036,752 $ 6,404,637 Washington State’s proportionate share of the net pension liability/(asset) associated with Thurston County
$ 7,012,566 $ 4,194,179
TOTAL $ 8,049,319 $ 10,598,816 At June 30, the County’s proportionate share of the collective net pension liabilities was as follows:
PERS 1 0.5271% 0.5227% -0.0045%PERS 2/3 0.5565% 0.5572% 0.0007%PSERS 2 2.8594% 2.5756% -0.2838%LEOFF 1 0.0516% 0.0525% 0.0009%LEOFF 2 0.2698% 0.2765% 0.0066%
Proportionate Share 6/30/18
Proportionate Share 6/30/19
Change in Proportion current year less prior year
Employer contribution transmittals received and processed by the DRS for the fiscal year ended June 30 are used as the basis for determining each employer’s proportionate share of the collective pension amounts reported by the DRS in the Schedules of Employer and Nonemployer Allocations for all plans except LEOFF 1.
Thurston County, Washington 2019
109

LEOFF Plan 1 allocation percentages are based on the total historical employer contributions to LEOFF 1 from 1971 through 2000 and the retirement benefit payments in fiscal year 2019. Historical data was obtained from a 2011 study by the Office of the State Actuary (OSA). In fiscal year 2019, the state of Washington contributed 87.12 percent of LEOFF 1 employer contributions and all other employers contributed the remaining 12.88 percent of employer contributions. LEOFF 1 is fully funded and no further employer contributions have been required since June 2000. If the plan becomes underfunded, funding of the remaining liability will require new legislation. The allocation method the plan chose reflects the projected long-term contribution effort based on historical data. In fiscal year 2019, the state of Washington contributed 39.57 percent of LEOFF 2 employer contributions pursuant to RCW 41.26.725 and all other employers contributed the remaining 60.43 percent of employer contributions. The collective net pension liability (asset) was measured as of June 30, 2019, and the actuarial valuation date on which the total pension liability (asset) is based was as of June 30, 2018, with update procedures used to roll forward the total pension liability to the measurement date. Pension Expense For the year ended December 31, 2019, the county recognized pension expense as follows:
Pension ExpensePERS 1 $ 718,663 PERS 2/3 973,144 PSERS 543,611 LEOFF 1 (68,895)LEOFF 2 111,800 TOTAL $ 2,278,323
Deferred Outflows of Resources and Deferred Inflows of Resources At December 31, 2019, the County reported deferred outflows of resources and deferred inflows of resources related to pensions from the following sources:
PERS 1 Deferred Outflows of Resources
Deferred Inflows of Resources
Net difference between projected and actual investment earnings on pension plan investments $ - $ (1,342,709)
Contributions subsequent to the measurement date 1,779,058 -
TOTAL $ 1,779,058 $ (1,342,709)
Thurston County, Washington 2019
110
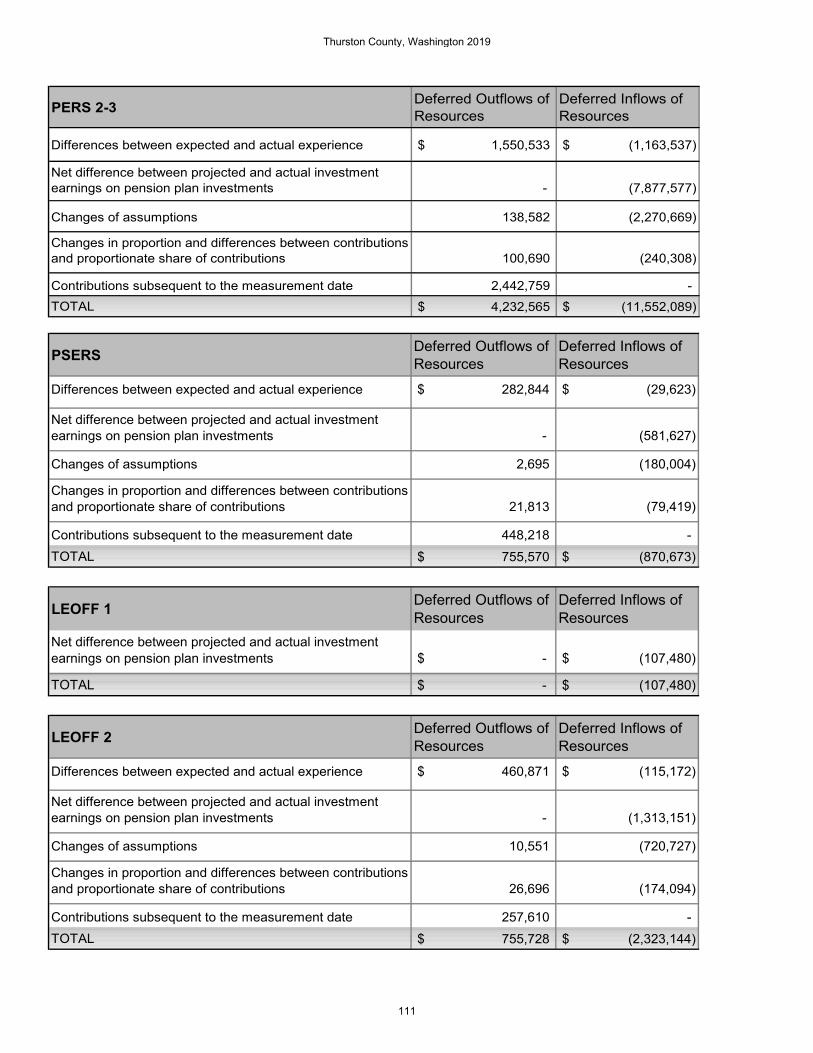
PERS 2-3 Deferred Outflows of Resources
Deferred Inflows of Resources
Differences between expected and actual experience $ 1,550,533 $ (1,163,537)
Net difference between projected and actual investment earnings on pension plan investments - (7,877,577)
Changes of assumptions 138,582 (2,270,669)
Changes in proportion and differences between contributions and proportionate share of contributions 100,690 (240,308)
Contributions subsequent to the measurement date 2,442,759 - TOTAL $ 4,232,565 $ (11,552,089)
PSERS Deferred Outflows of Resources
Deferred Inflows of Resources
Differences between expected and actual experience $ 282,844 $ (29,623)
Net difference between projected and actual investment earnings on pension plan investments - (581,627)
Changes of assumptions 2,695 (180,004)
Changes in proportion and differences between contributions and proportionate share of contributions 21,813 (79,419)
Contributions subsequent to the measurement date 448,218 - TOTAL $ 755,570 $ (870,673)
LEOFF 1 Deferred Outflows of Resources
Deferred Inflows of Resources
Net difference between projected and actual investment earnings on pension plan investments $ - $ (107,480)
TOTAL $ - $ (107,480)
LEOFF 2 Deferred Outflows of Resources
Deferred Inflows of Resources
Differences between expected and actual experience $ 460,871 $ (115,172)
Net difference between projected and actual investment earnings on pension plan investments - (1,313,151)
Changes of assumptions 10,551 (720,727)
Changes in proportion and differences between contributions and proportionate share of contributions 26,696 (174,094)
Contributions subsequent to the measurement date 257,610 - TOTAL $ 755,728 $ (2,323,144)
Thurston County, Washington 2019
111

Deferred outflows of resources related to pensions resulting from the County’s contributions subsequent to the measurement date will be recognized as a reduction of the net pension liability in the year ended December 31, 2020. Other amounts reported as deferred outflows and deferred inflows of resources related to pensions will be recognized in pension expense as follows:
Year PERS 1 PERS 2 PSERS LEOFF 1 LEOFF 22020 $ (296,410) $ (2,453,757) $ (104,488) $ (24,965) $ (345,981)
2021 $ (702,111) $ (4,064,408) $ (195,948) $ (55,024) $ (678,758)
2022 $ (250,554) $ (1,814,405) $ (122,801) $ (19,967) $ (318,312)
2023 $ (93,633) $ (980,984) $ (66,408) $ (7,524) $ (179,052)2024 $ - $ (480,017) $ (12,661) $ - $ (73,834)
Thereafter $ - $ 31,287 $ (61,016) $ - $ (229,089)
Deferred Outflows/Inflows of Resources by Plan
NOTE XII – RISK MANAGEMENT A. RISK POOL AND GENERAL LIABILITY INSURANCE Thurston County is a participating member of the Washington Counties Risk Pool (WCRP). Chapter 48.62 RCW authorizes the governing body of one or more governmental entities to join together for the joint purchasing of insurance, and/or joint self-insuring, and/or joint hiring or contracting for risk management services to the same extent that they may individually purchase insurance, self-insure, or hire or contract for risk management services. An agreement to form a pooling arrangement was made pursuant to the provisions of Chapter 39.34 RCW, the Interlocal Cooperation Act. The Pool was formed in August of 1988 when 15 counties in the state of Washington joined together by signing an Interlocal Governmental Agreement to pool their self-insured losses and jointly purchase insurance and administrative services. As of December 31, 2019, 26 counties participate in the WCRP. The Pool allows members to jointly establish a plan of self-insurance, and provides related services, such as risk management and claims administration. Members enjoy occurrence-based, jointly purchased and/or jointly self-insured liability coverage for bodily injury, personal injury, property damage, errors and omissions, and advertising injury caused by a covered occurrence during an eligible period and occurring anywhere in the world. Total coverage limits are $25 million per occurrence and each member selects its occurrence deductible amount for the ensuing coverage year from these options: $10,000, $25,000, $50,000, $100,000, $250,000 or $500,000. For losses occurring in 2019, Thurston County selects a per-occurrence deductible of $250,000.
Thurston County, Washington 2019
112
Members make an annual contribution to fund the Pool. The Pool acquires excess and reinsurance for further protection from larger losses. For the first $10,000,000 of coverage, the Pool acquires reinsurance. The reinsurance agreements are written with self-insured retentions (“SIRs”) equal to the amount of the layer of coverage below. For 2018-19, the Pool’s SIR was $1,000,000 (for 2019-20, the Pool’s SIR increased to $2,000,000). More recent years’ reinsurance programs have included “corridor deductibles” with aggregated stop losses which have the effect of increasing the Pool’s SIR. For 2018-19, the “corridor” increased the SIR to $2,000,000, with losses between $1,000,000 and $2,000,000 having an annual aggregated stop loss of $2.5 million. The other reinsurance agreements respond up to the applicable policy limits and the agreements contain aggregate limits for the maximum annual reimbursements to the Pool of $20 million (lowest reinsured layer), $30 million, (second layer), and $50 million (third layer). The Pool purchases excess coverage for the additional $10,000,000 with an aggregate limit of $100,000,000. Since the Pool is a cooperative program, there is a joint liability among the participating members. Sixteen of the Pool’s 26 member counties group purchase an additional $5,000,000 policy in excess of the pooled $20,000,000. New members may be asked to pay modest fees to cover the costs to analyze their loss data and risk profiles, and for their proportional shares of the entry year’s assessments. New members contract under the Interlocal Agreement to remain in the Pool for at least five years. Following its initial 60-month term, any member may terminate its membership at the conclusion of any Pool fiscal year, provided the county timely files the required advance written notice. Otherwise, the Interlocal Agreement and membership automatically renews for another year. Even after termination, former members remain responsible for reassessments by the Pool for the members’ proportional shares of any unresolved, unreported, and in-process claims for the periods that the former members were signatories to the Interlocal Agreement. The Pool is fully funded by its member participants. Claims are filed directly with the Pool by members and adjusted by one of the six staff members responsible for evaluating each claim for coverage, establishing reserves, and investigating for any risk-shared liability. The Pool does not contract with any third-party administrators for claims adjustment or loss prevention services. During 2018-19, Thurston County was also one of twenty-six (26) counties which participated in the Washington Counties Property Program (WCPP). Property losses are covered under the WCPP to the participating counties’ buildings and contents, vehicles, mobile/contractor equipment, EDP and communication equipment, etc. that have been scheduled. The WCPP includes ‘All Other Perils (“AOP”)’ coverage limits of $500 million per occurrence as well as Flood and Earthquake (catastrophe) coverages with separate occurrence limits, each being $200 million. There are no AOP annual aggregate limits, but the flood and earthquake coverages include annual aggregate limits of $200 million each. Each participating county is solely responsible for paying their selected deductible, ranging between $5,000 and $50,000. Higher deductibles apply to losses resulting from catastrophe-type losses. Thurston County also participates in the jointly purchased cyber risk and security coverage from a highly-rated commercial insurer. The Pool is governed by a board of directors which is comprised of one designated representative from each participating member. The Board of Directors generally meets three-times each year with the Annual Meeting of the Pool being held in summer. The Board approves the extent of risk-sharing, approves the Pool’s self-insuring coverage documents, approves the selection of reinsurance and excess agreements, and approves the Pool’s annual operating budget.
Thurston County, Washington 2019
113

An 11-member executive committee is elected by and from the WCRP Board for staggered, 3-year terms. Authority has been delegated to the Committee by the Board of Directors to, a) approve all disbursements and reviews the Pool’s financial health, b) approve case settlements exceeding the applicable member’s deductible by at least $50,000, c) review all claims with incurred loss estimates exceeding $100,000, and d) evaluate the Pool’s operations, program deliverables, and the Executive Director’s performance. Committee members are expected to participate in the Board’s standing committees (finance, personnel, risk management, and underwriting) which develop or review/revise proposals for and/or recommendations to the association’s policies and its coverages for the Board to consider and act upon During 2018-19, the WCRP’s assets increased to $60.6 million while its liabilities increased to $40.6 million. The Pool’s net position remained at $19.8 million. The Pool more than satisfies the State Risk Manager’s solvency requirements (WAC 200.100.03001). The Pool is a cooperative program with joint liability amongst its participating members. Deficits of the Pool resulting from any fiscal year are financed by reassessments of the deficient year’s membership in proportion with the initially levied and collected deposit assessments. The Pool’s reassessments receivable balance as of December 31, 2019 was zero ($0). As such, there were no known contingent liabilities at that time for disclosure by the member counties.
Thurston County paid general claims costs of $781,079 during 2019. The County’s suggested reserves which are (Thurston County’s proportionate share of the Pool’s expected losses) plus reserve funding for uninsured losses and a catastrophic property loss at least equal to the current minimum deductible of ($1 million) for this exposure, equates to $4,117,186. This suggested reserve includes reserves for open claims plus an estimate of incurred but not reported (IBNR) claims. It should be recognized that portions of the estimated additional liability incurred are projections from our claims experience. This loss estimate does not include (IBNR) liabilities for non-insured claims, some employment relations including past wages or benefits, some pollutants, property losses / takings, certain municipal activities, punitive damages, willful civil violations and other loss exposures not currently insured. As estimates, these values fluctuate significantly and are subject to inherent variability and may or may not become payable over the course of several years.
2019 2018Beginning claims liability 4,453,721$ 4,509,222$ Claims incurred during the year (including IBNRs)* 444,544 617,778 Claims payments (781,079) (673,279) Ending claims liability 4,117,186$ 4,453,721$
Schedule of Claims and Judgments Payable
*Includes total provision for events of the current fiscal year and any changes in the provision for events for prior fiscal years.
B. OTHER The County is not self-insured for other types of risks and losses except as described above under “Risk Pool and General Liability Insurance”. The County reimburses Washington State Employment Security for unemployment compensation claims. These claims are funded through employee related fund transfers into the County’s Unemployment Compensation fund. The County also pays Washington State Labor and Industries a stipulated amount per employee per payroll period for a state mandated industrial insurance program for worker compensation claims. As discussed in Note VII.F., the County also has a contingent financial liability for the payment of refunded debt.
Thurston County, Washington 2019
114

NOTE XIII – OTHER POST-EMPLOYMENT BENEFITS The following table represents the aggregate OPEB amounts for all plans subject to the requirements of GASB 75 for the year 2019:
OPEB liabilities $ 57,169,346 Deferred outflows of resources $ 6,180,396 Deferred inflows of resources $ 1,750,639 OPEB expense/expenditures $ 3,964,174
Aggregate OPEB Amounts – All Plans
The County participates in two plans that provide Other Post Employment Benefits (OPEB) to its members. They are the Public Employee Benefits Board (PEBB) and Law Enforcement and Fire Fighters Retirement System Plan 1 (LEOFF 1). Below is a description of each plan. Public Employees Benefits Board (PEBB) Plan Description – The PEBB is a cost-sharing multiple-employer defined benefit healthcare plan. County eligible retirees and spouses are entitled to subsidies associated with postemployment medical benefits provided through the Public Employee Benefits Board (PEBB). Per RCW 41.05.065, the PEBB was created within the Washington State Health Care Authority to administer medical, dental, and life insurance plans for public employees and retirees. It is authorized to design benefits and determine the terms and conditions of employee and retired employee participation and coverage. The PEBB establishes eligibility criteria for both active employees and retirees. The PEBB OPEB plan is funded on a pay-as-you-go basis and is reported in governmental funds using the modified accrual basis and the current financial resources measurement focus. For all proprietary funds, the OPEB plan is reported using the economic resources measurement focus and the accrual basis of accounting. The PEBB OPEB plan has no assets and does not issue a publicly available financial report. Benefits Provided – the benefits provided by the PEBB to pre-65 and post-65 retirees and spouses include an explicit and implicit medical subsidy and an implicit dental subsidy. The explicit subsidies are monthly amounts paid per post-65 retiree and spouse. As of the valuation date, the explicit subsidy for post-65 retirees and spouses is the lesser of $168 or 50% of the monthly premiums. As of January 1, 2020, the subsidy will be increased to $183 per month. The retirees and spouses currently pay the premium minus $168 when the premium is over $300 per month and pay half the premium when the premium is lower than $300. The implicit medical subsidy is the difference between the total cost of medical benefits and the premiums. For pre-65 retirees and spouses, the retiree pays the full premium amount, but that amount is based on a pool that includes active employees. Active employees will tend to be younger and healthier than retirees on average, and therefore can be expected to have lower average health costs. For post-65 retirees and spouses, the retiree does not pay the full premium due to the subsidy discussed above. Employees Covered by Benefit Terms - At the measurement date of June 30, 2019, the following employees were covered by the benefit terms:
Inactive employees or beneficiaries currently receiving benefits 322 Active employees 1,075
Total 1,397
Thurston County, Washington 2019
115
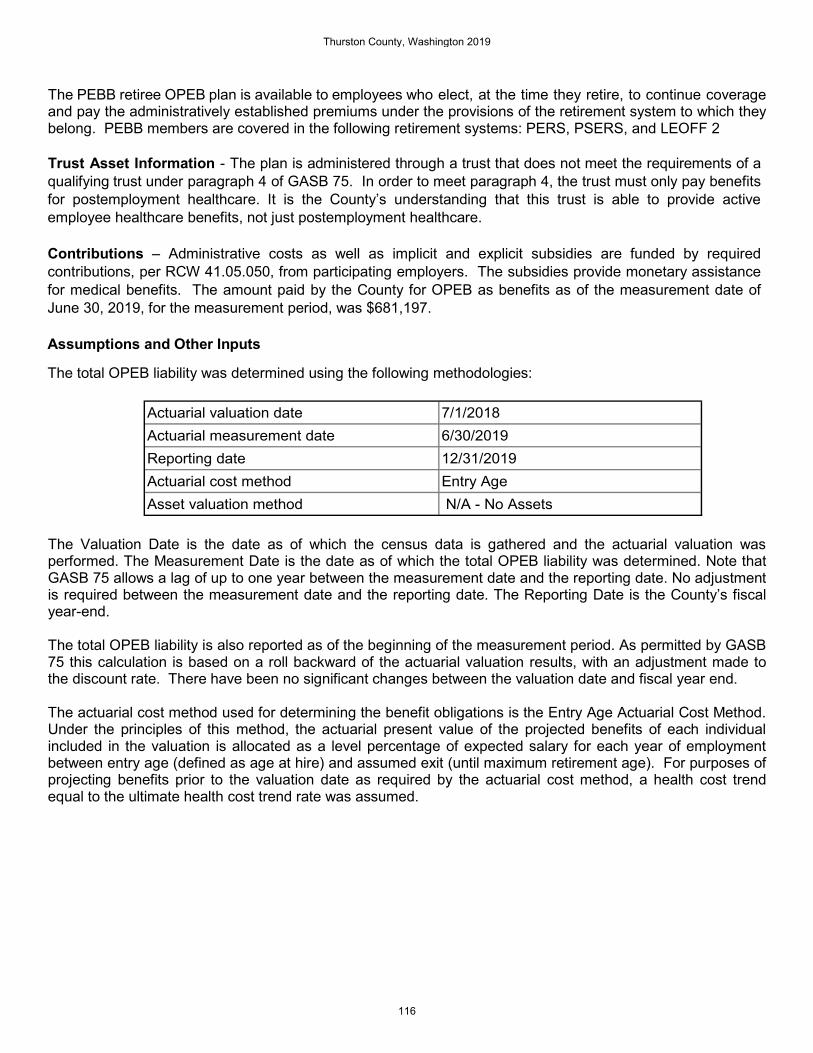
The PEBB retiree OPEB plan is available to employees who elect, at the time they retire, to continue coverage and pay the administratively established premiums under the provisions of the retirement system to which they belong. PEBB members are covered in the following retirement systems: PERS, PSERS, and LEOFF 2 Trust Asset Information - The plan is administered through a trust that does not meet the requirements of a qualifying trust under paragraph 4 of GASB 75. In order to meet paragraph 4, the trust must only pay benefits for postemployment healthcare. It is the County’s understanding that this trust is able to provide active employee healthcare benefits, not just postemployment healthcare. Contributions – Administrative costs as well as implicit and explicit subsidies are funded by required contributions, per RCW 41.05.050, from participating employers. The subsidies provide monetary assistance for medical benefits. The amount paid by the County for OPEB as benefits as of the measurement date of June 30, 2019, for the measurement period, was $681,197. Assumptions and Other Inputs The total OPEB liability was determined using the following methodologies:
Actuarial valuation date 7/1/2018Actuarial measurement date 6/30/2019Reporting date 12/31/2019Actuarial cost method Entry AgeAsset valuation method N/A - No Assets
The Valuation Date is the date as of which the census data is gathered and the actuarial valuation was performed. The Measurement Date is the date as of which the total OPEB liability was determined. Note that GASB 75 allows a lag of up to one year between the measurement date and the reporting date. No adjustment is required between the measurement date and the reporting date. The Reporting Date is the County’s fiscal year-end. The total OPEB liability is also reported as of the beginning of the measurement period. As permitted by GASB 75 this calculation is based on a roll backward of the actuarial valuation results, with an adjustment made to the discount rate. There have been no significant changes between the valuation date and fiscal year end. The actuarial cost method used for determining the benefit obligations is the Entry Age Actuarial Cost Method. Under the principles of this method, the actuarial present value of the projected benefits of each individual included in the valuation is allocated as a level percentage of expected salary for each year of employment between entry age (defined as age at hire) and assumed exit (until maximum retirement age). For purposes of projecting benefits prior to the valuation date as required by the actuarial cost method, a health cost trend equal to the ultimate health cost trend rate was assumed.
Thurston County, Washington 2019
116

The total OPEB liability was determined using the following actuarial assumptions, applied to all periods in the measurement, unless otherwise specified:
Inflation rate 2.75%
Projected salary/wage growth 3.50%, plus service-based salary increases
Healthcare cost trend rate Initial rate is 6.80% and trends down to 4.5% by 2096
Post-retirement participation percentage 65%
Percentage with spouse coverage 45%
Demographic assumptions regarding retirement, mortality, disability mortality, turnover, and marriage are based on assumptions used in the 2017 actuarial valuation for the Washington State retirement systems, and modified for the County. The assumed rates of disability under PERS Plans 1, 2, and 3 and PSERS Plan 2 from the 2017 actuarial valuation are less than 0.1% for ages 50 and below and continue to be low after that. A 0% disability rate was assumed for all ages for those plans. For service retirement, the assumptions used for all plans were taken from the 2017 actuarial valuation for Washington State retirement systems. The service requirements for these plans vary based on hire date and years of service. Mortality rate assumptions were based on the 2017 actuarial valuation for Washington State retirement systems, adjusted for the County. For all healthy members, the RP-2000 base mortality table, adjusted by -1 year for both males and females, with generational mortality adjustments using projection scale BB, was used. For disabled retirees across all plans, the RP-2000 Disabled Retiree mortality table with generational mortality adjustments using projection scale BB, was used. For other termination of employment, the assumptions by plan from the 2017 actuarial valuation for Washington State retirement systems were used. Discount Rate – The discount rate used to measure the total OPEB liability was 3.87% for the 6/30/2018 measurement date and was 3.50% for the 6/30/2019 measurement date. Since OPEB benefits are funded on a pay- as-you-go basis, the discount rate used to measure the total OPEB liability was set equal to the Bond Buyer General Obligation 20-Bond Municipal Bond Index. Sensitivity of Total OPEB Liability to Changes in the Discount Rate - The following presents the total OPEB liability of the County calculated using the discount rate of 3.5 percent, as well as what the OPEB liability would be if it were calculated using a discount rate that is 1-percentage point lower (2.5%) or 1-percentage point higher (4.5%) that the current rate.
Thurston County, Washington 2019
117

1% Decrease Current Discount Rate 1% Increase
2.50% 3.50% 4.50%Total June 30, 2019 OPEB Liability $ 59,845,425 $ 49,105,899 $ 40,790,475
Sensitivity Analysis - Discount Rate
Sensitivity of Total OPEB Liability to Changes in the Health Care Cost Trend Rates - The following presents the total OPEB liability of the County calculated using the current healthcare cost trend rate of 6.8 percent, as well as what the OPEB liability would be if it were calculated using a discount rate that is 1-percentage point lower (5.8%) or 1-percentage point higher (7.8%) that the current rate.
1% Decrease Current Discount Rate 1% Increase
5.80% 6.80% 7.80%Total June 30, 2019 OPEB Liability $ 39,520,250 $ 49,105,899 $ 61,983,562
Sensitivity Analysis - Healthcare Trend
Total OPEB Liability – As of December 31, 2019, the County reported a total OPEB Liability of $49,105,899. Changes in the Total OPEB Liability – the following table presents the change in the total OPEB Liability as of the June 30, 2019, the measurement date:
2019 2018Total Beg OPEB Liability 6/30 39,784,991$ 39,040,229$ Service Cost 2,049,606 2,164,431 Interest on total OPEB liability 1,605,943 1,463,658 Effect on plan changes - - Effect on economic/demographic gains or losses 3,024,244 - Effect of assumptions changes or inputs 3,322,312 (2,236,927) Expected benefit payments (681,197) (646,400) Total End OPEB Liability 49,105,899$ 39,784,991$
OPEB Expense – As of the measurement date of June 30, 2019, the County recognized OPEB expense of $4,102,248.
Thurston County, Washington 2019
118

Deferred Outflows of Resources and Deferred Inflows of Resources Related to OPEB – On December 31, 2019, the County reported deferred outflows of resources and deferred inflows of resources related to OPEB from the following sources:
Deferred Outflows of Resources
Deferred Inflows of Resources
Differences between expected and actual experience 2,695,522$ -$
Changes of assumptions 2,961,191 1,750,639 Payments subsequent to the measurement date 391,144 -
TOTAL $ 6,047,857 1,750,639$ Deferred outflows of resources total $6,047,857. Of that $391,144 resulted from payments subsequent to the measurement date that will be recognized as a reduction of the total OPEB liability in the year ended December 31, 2020. Other amounts reported as deferred outflows and deferred inflows of resources are related to changes in assumptions and the difference between original estimations and actuals:
Year ended December 31: Amount2019 $ 446,699 2020 $ 446,699 2021 $ 446,699 2022 $ 446,699 2023 $ 446,699
Thereafter $ 1,672,579
Law Enforcement and Fire Fighters Retirement System Plan 1 (LEOFF 1). Plan Description - The County provides lifetime medical care for members of the Law Enforcement Officers and Firefighters Retirement System (LEOFF) hired before October 1, 1977 as required by RCW 41.26. The eligible members are covered under LEOFF Plan 1. LEOFF Plan 1 is a cost-sharing multiple-employer defined benefit healthcare plan. The members necessary hospital, medical, and nursing care expenses not payable by worker’s compensation, social security, insurance provided by another employer, other pension plan or any other similar source are covered. Under the authorization of the LEOFF Disability Board, direct payment is made for other retiree medical plan benefit provisions. Financial reporting for the LEOFF retiree healthcare plan is included in the County’s Comprehensive Annual Financial Report.
Thurston County, Washington 2019
119
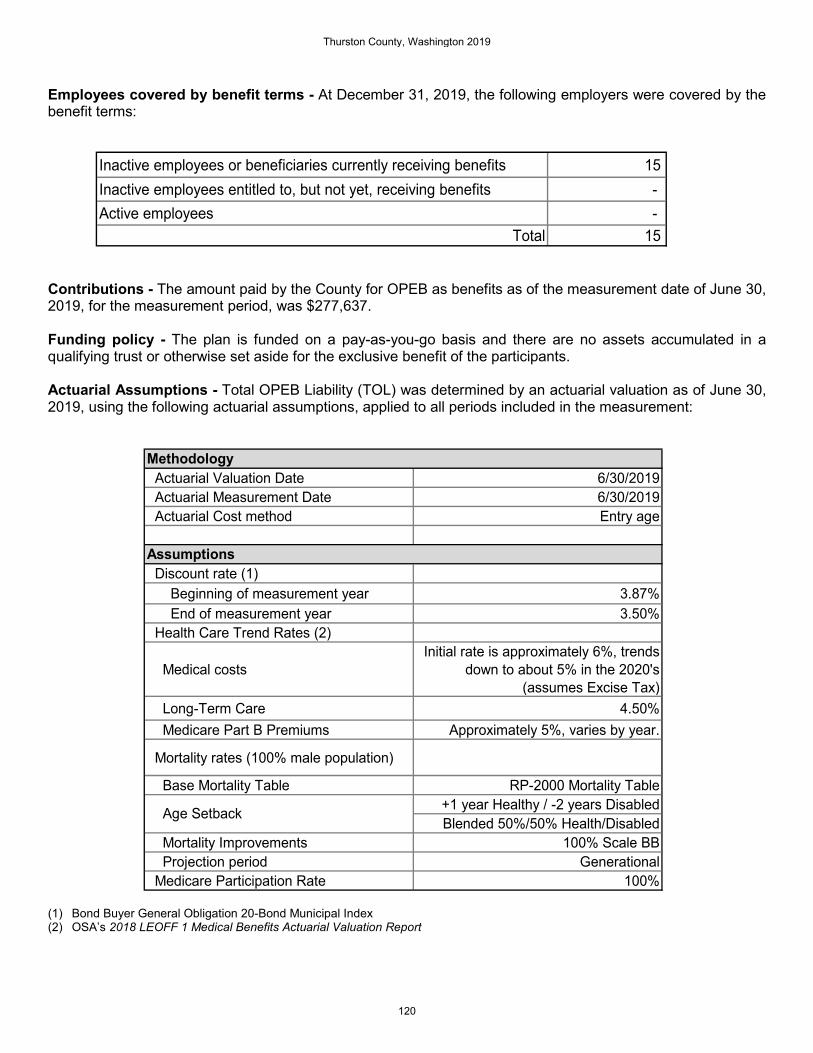
Employees covered by benefit terms - At December 31, 2019, the following employers were covered by the benefit terms:
Inactive employees or beneficiaries currently receiving benefits 15 Inactive employees entitled to, but not yet, receiving benefits - Active employees -
Total 15
Contributions - The amount paid by the County for OPEB as benefits as of the measurement date of June 30, 2019, for the measurement period, was $277,637. Funding policy - The plan is funded on a pay-as-you-go basis and there are no assets accumulated in a qualifying trust or otherwise set aside for the exclusive benefit of the participants. Actuarial Assumptions - Total OPEB Liability (TOL) was determined by an actuarial valuation as of June 30, 2019, using the following actuarial assumptions, applied to all periods included in the measurement:
Actuarial Valuation Date 6/30/2019 Actuarial Measurement Date 6/30/2019 Actuarial Cost method Entry age
Discount rate (1) Beginning of measurement year 3.87% End of measurement year 3.50% Health Care Trend Rates (2)
Medical costsInitial rate is approximately 6%, trends
down to about 5% in the 2020's (assumes Excise Tax)
Long-Term Care 4.50% Medicare Part B Premiums Approximately 5%, varies by year.
Mortality rates (100% male population)
Base Mortality Table RP-2000 Mortality Table+1 year Healthy / -2 years DisabledBlended 50%/50% Health/Disabled
Mortality Improvements 100% Scale BB Projection period Generational Medicare Participation Rate 100%
Methodology
Assumptions
Age Setback
(1) Bond Buyer General Obligation 20-Bond Municipal Index (2) OSA’s 2018 LEOFF 1 Medical Benefits Actuarial Valuation Report
Thurston County, Washington 2019
120
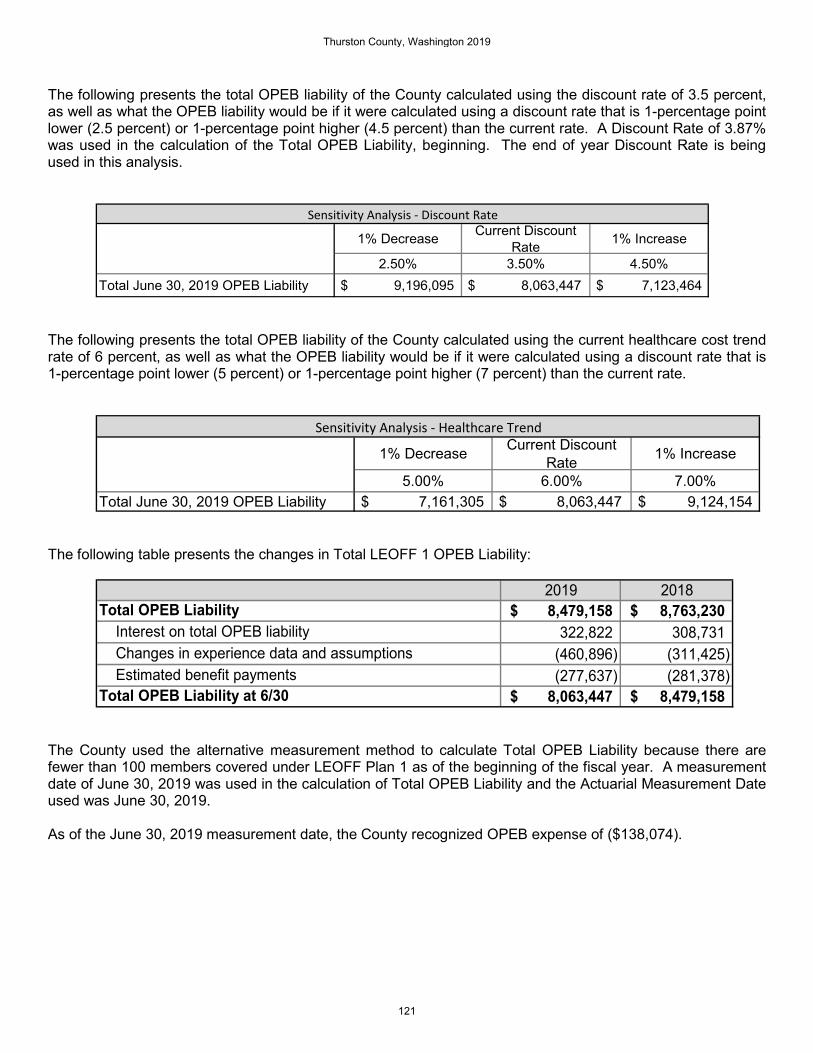
The following presents the total OPEB liability of the County calculated using the discount rate of 3.5 percent, as well as what the OPEB liability would be if it were calculated using a discount rate that is 1-percentage point lower (2.5 percent) or 1-percentage point higher (4.5 percent) than the current rate. A Discount Rate of 3.87% was used in the calculation of the Total OPEB Liability, beginning. The end of year Discount Rate is being used in this analysis.
1% Decrease Current Discount Rate 1% Increase
2.50% 3.50% 4.50%Total June 30, 2019 OPEB Liability $ 9,196,095 $ 8,063,447 $ 7,123,464
Sensitivity Analysis - Discount Rate
The following presents the total OPEB liability of the County calculated using the current healthcare cost trend rate of 6 percent, as well as what the OPEB liability would be if it were calculated using a discount rate that is 1-percentage point lower (5 percent) or 1-percentage point higher (7 percent) than the current rate.
1% Decrease Current Discount Rate 1% Increase
5.00% 6.00% 7.00%Total June 30, 2019 OPEB Liability $ 7,161,305 $ 8,063,447 $ 9,124,154
Sensitivity Analysis - Healthcare Trend
The following table presents the changes in Total LEOFF 1 OPEB Liability:
2019 2018Total OPEB Liability 8,479,158$ 8,763,230$ Interest on total OPEB liability 322,822 308,731 Changes in experience data and assumptions (460,896) (311,425) Estimated benefit payments (277,637) (281,378) Total OPEB Liability at 6/30 8,063,447$ 8,479,158$
The County used the alternative measurement method to calculate Total OPEB Liability because there are fewer than 100 members covered under LEOFF Plan 1 as of the beginning of the fiscal year. A measurement date of June 30, 2019 was used in the calculation of Total OPEB Liability and the Actuarial Measurement Date used was June 30, 2019. As of the June 30, 2019 measurement date, the County recognized OPEB expense of ($138,074).
Thurston County, Washington 2019
121

As of December 31, 2019, the County reported deferred outflows of resources related to OPEB from the following sources:
Deferred Outflows of Resources
Deferred Inflows of Resources
Payments subsequent to the measurement date $ 132,539 -$
TOTAL $ 132,539 -$
The $132,539 reported as deferred outflows of resources related to OPEB benefits results from County contributions subsequent to the measurement date and will be recognized as a reduction of the TOL in the year ended December 31, 2020. NOTE XIV – JOINT VENTURES/JOINTLY GOVERNED ORGANIZATIONS Thurston County participates in two joint ventures and five jointly governed organizations as follows: Animal Control Services, the Inter-local Drug Control Unit, Olympic Region Clean Air Agency (ORCAA), Thurston Regional Planning Council (TRPC), the Thurston County Regional Health and Human Services Council and The Chehalis River Flood Control Authority. Animal Control Services is a joint venture governed by a six-member board of which Thurston County is a member. Each member’s contribution is based on a formula factoring population and basic service components. Thurston County’s cost is based on their computed share of services in compliance with the interlocal agreement with Animal Control Services. City of Lacey reported an increase of $75,064 to Net Position – Ending 12/31/2019. The adjustment is included in the Animal Control table below. The County contributed $628,561 as its share of operations in 2019, which is 51.49% of the total contributions from participating agencies. The County’s equity interest at December 31, 2019 is therefore $1,766,241. The financial health of this joint venture remains strong mainly due to a steady stream of revenue received from the Cities of Olympia, Lacey, and Tumwater, and Thurston County. Net Position for Animal Control at the end of 2018 totaled $3,430,260. Complete financial statements for Animal Control can be obtained from its administrative office at the City of Lacey, Post Office Box 3400, Lacey, Washington 98509-3400.
Total Assets 3,910,831$ Total Deferred Outflows of Resources 105,452 Total Liabilities: (391,141) Total Deferred Inflows of Resources (194,882) Net Position 3,430,260$ Total Revenues 1,849,100$ Total Expenses 1,774,036 Change in Net Position 75,064 Net Position - Beginning 12/31/2019 3,355,196 Net Position - Ending 12/31/2019 3,430,260$
Animal Control
The Thurston County Narcotics Task Force (Interlocal Drug Unit) is a joint venture governed by a five-member executive committee. Participating members are Thurston County, the City of Lacey, the City of Tumwater, and the Washington State Patrol as a result of an interlocal agreement.
Thurston County, Washington 2019
122

The City of Olympia is currently an inactive member of the task force. The interlocal Drug Control Unit is funded by grants and seizures of drug funds. The Interlocal Drug Unit operates as a joint venture and is responsible for controlling illegal drug trafficking in Thurston County, investigating violations of the Uniform Controlled Substance Act, and providing training and assistance to nine local law enforcement agencies in Thurston County. As the administrative jurisdiction, Thurston County provides accounting services for the operation of this joint venture. Thurston County Narcotics Task Force equity interest as of December 31, 2019 was $479,698. Any party may withdraw from this Agreement by giving ninety (90) days written notice to the other parties. Monies contributed during the calendar year of the party’s withdrawal will be returned to that party, on a prorated basis, after determination by the Executive Committee of any purchase commitments made prior to the notification of a party’s withdrawal. Money so refunded will be used by the withdrawing party for its use in carrying out drug enforcement activities pursuant to Ch. 69.50 RCW. Property purchased with the drug unit funds or forfeited to the drug unit will remain the property of the non-withdrawing parties and the withdrawing party will have no interest in or claim of title to said property. All monies and equipment remain with the drug unit until the drug unit disbands entirely. Disposition and disbursement of net equity upon dissolution is not specified in the agreement, therefore, is not recorded in Thurston County’s financial statements. There is no ongoing financial responsibility. For more detailed information about the task force, contact the Thurston County Sheriff’s Office, 2000 Lakeridge Dr. SW, Olympia, WA 98502, or call (360) 754-3800. Olympic Region Clean Air Agency is a jointly-governed organization governed by a nine-member board of which Thurston County is a member. Thurston County contributed $110,497 as its share of operations in 2019. The assessment was based on population and violation fees collected. Thurston County did not have an equity interest in ORCAA in 2019. Complete financial statements for ORCAA can be obtained from its administrative office at 2940 B Limited Lane NW, Olympia, Washington 98502. Thurston Regional Planning Council is a jointly-governed organization governed by a fifteen-member council of which Thurston County is a member. Thurston County contributed $204,059 as its share of operations in 2019 for intergovernmental professional services. The assessment was based on population and contractual commitments. Thurston County did not have an equity interest in TRPC in 2019. Complete financial statements for TRPC can be obtained from its administrative office at 2424 Heritage Court SE Suite A, Olympia, Washington 98502. The Chehalis River Flood Control Authority is a jointly-governed organization governed by an eleven-member body of which Thurston County is a member. This Authority was formed for the purpose of study, analysis, and implementation of flood control projects to protect the Chehalis River Basin. The assessment is based on 50% populations of communities prone to flooding and 50% on historic FEMA flood insurance payments. In 2019, Thurston County contributed $8,478.74 for the Operating and Maintenance of the Early Warning System. We do not have an equity interest in this Authority. More information regarding this Authority can be obtained from the Lewis County Community Development Department, at 2025 NE Kresky Ave., Chehalis, Washington 98532. Thurston County Regional Health and Human Services Council is a jointly-governed organization formed by an interlocal agreement between Thurston County and the cities of Lacey, Olympia and Tumwater. The council was formed for the purpose of working together, joining resources, and consolidating services necessary to address common gaps in meeting basic health and human services needs within this region. The council is governed by one elected official from each participating jurisdiction. The required annual funding contribution from each jurisdiction shall not be less than one half of one percent of the last full year general sales and use tax collected as of the time each jurisdiction is preparing its budget. Thurston County provides administrative staffing for the Council. During 2019, the County contributed $78,175.43 as its share of annual operations.
Thurston County, Washington 2019
123

Thurston Mason Behavioral Health Organization (TMBHO) is a jointly governed organization that was formed on April 1, 2016. It was formed when the Regional Support Network of the Thurston County Public Health Department (along with the Health Department of Mason County, a neighboring county to the northwest) split off from the County and formed its own Behavioral Health Organization. The name of the organization is the Thurston Mason Behavioral Health Organization. On September 15, 2016, the Thurston County Board of County Commissioners passed resolution #15183 that officially created this joint operating agreement pursuant to State Law, RCW Chapters 71.24 and 39.34. The TMBHO’s governing body is comprised of three members, two of which are appointed by the Thurston County Commissioners and one by the Mason County Commissioners. After several discussions with the Washington State Auditor’s Office, it was determined that this newly formed organization was considered a jointly governed organization and the results of which were not included within the County’s general-purpose financial statements. The main source of revenue for the TMBHO is Medicare payments from the Washington State Department of Social and Health Services. The Water Conservancy Board of Thurston County is a related organization to the county. The board is a separate unit of local government in the state. The board’s duties are to act on applications for changes to existing water rights and its decisions are subject to final action by the Washington State Department of Ecology. The board is governed by state statute, RCW 90.80.050. Board members are appointed by the Board of County Commissioners. The county does not have a financial relationship, nor can it impose it’s will on this board. NOTE XV – CLOSURE AND POST CLOSURE CARE COSTS State and federal laws and regulations require Thurston County to perform landfill maintenance and monitoring activities for thirty years after closure. An expense provision and related liability for these activities was recognized in the Solid Waste Enterprise Fund before the landfill was closed. This expense provision was based on estimated future post closure care costs after closure. Cell No. 1, the last landfill cell used for waste disposal at the Hawke’s Prairie landfill site, was closed on April 30, 2000. The County’s long haul of waste to a regional landfill in Klickitat County was initiated on May 1, 2000. The post closure care period was therefore initiated on January 1, 2001. The estimated remaining liability for post closure care costs is $13,850,238 on December 31, 2019. Thurston County, as required by state and federal laws and regulations, made annual contributions to finance post closure care. The County is in compliance with these requirements, and at December 31, 2019 cash and pooled investments of $13,207,569 are held for these purposes. The post closure care cost was based on the amount that would have been paid if all equipment, facilities and services required to monitor and maintain the landfill site were acquired as of December 31, 2000. However, the actual cost of post closure care may be higher due to inflation, changes in technology, or changes in landfill laws and regulations. It is anticipated that future inflation costs will be financed in part from earnings on the cash and investments. The remaining portion of anticipated future inflation costs (including inadequate earnings on investments, if any) and additional costs that may arise from changes in post closure requirements (due to changes in technology or more rigorous environmental regulations, for example) may need to be covered by charges to future landfill users, taxpayers, or both.
Thurston County, Washington 2019
124
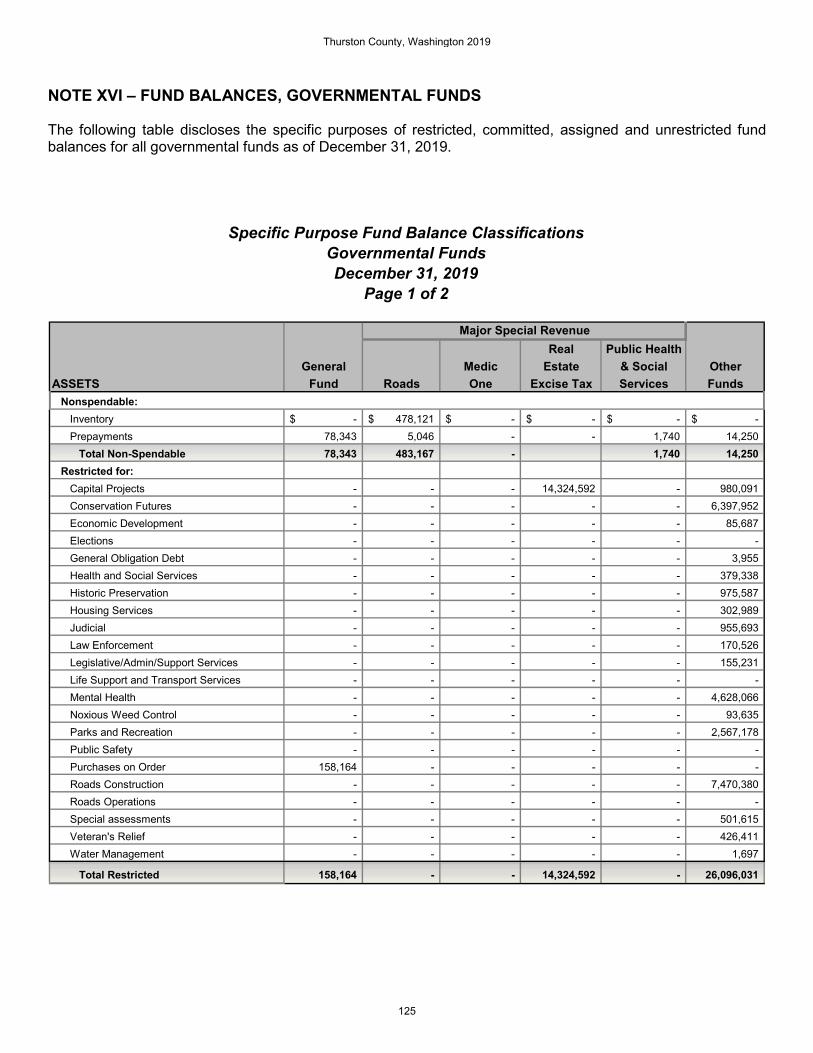
NOTE XVI – FUND BALANCES, GOVERNMENTAL FUNDS The following table discloses the specific purposes of restricted, committed, assigned and unrestricted fund balances for all governmental funds as of December 31, 2019.
Specific Purpose Fund Balance ClassificationsGovernmental FundsDecember 31, 2019
Page 1 of 2
Real Public HealthGeneral Medic Estate & Social Other
ASSETS Fund Roads One Excise Tax Services Funds Nonspendable: Inventory -$ 478,121$ -$ -$ -$ -$ Prepayments 78,343 5,046 - - 1,740 14,250 Total Non-Spendable 78,343 483,167 - 1,740 14,250 Restricted for: Capital Projects - - - 14,324,592 - 980,091 Conservation Futures - - - - - 6,397,952 Economic Development - - - - - 85,687 Elections - - - - - - General Obligation Debt - - - - - 3,955 Health and Social Services - - - - - 379,338 Historic Preservation - - - - - 975,587 Housing Services - - - - - 302,989 Judicial - - - - - 955,693 Law Enforcement - - - - - 170,526 Legislative/Admin/Support Services - - - - - 155,231 Life Support and Transport Services - - - - - - Mental Health - - - - - 4,628,066 Noxious Weed Control - - - - - 93,635 Parks and Recreation - - - - - 2,567,178 Public Safety - - - - - - Purchases on Order 158,164 - - - - - Roads Construction - - - - - 7,470,380 Roads Operations - - - - - - Special assessments - - - - - 501,615 Veteran's Relief - - - - - 426,411 Water Management - - - - - 1,697
Total Restricted 158,164 - - 14,324,592 - 26,096,031
Major Special Revenue
Thurston County, Washington 2019
125
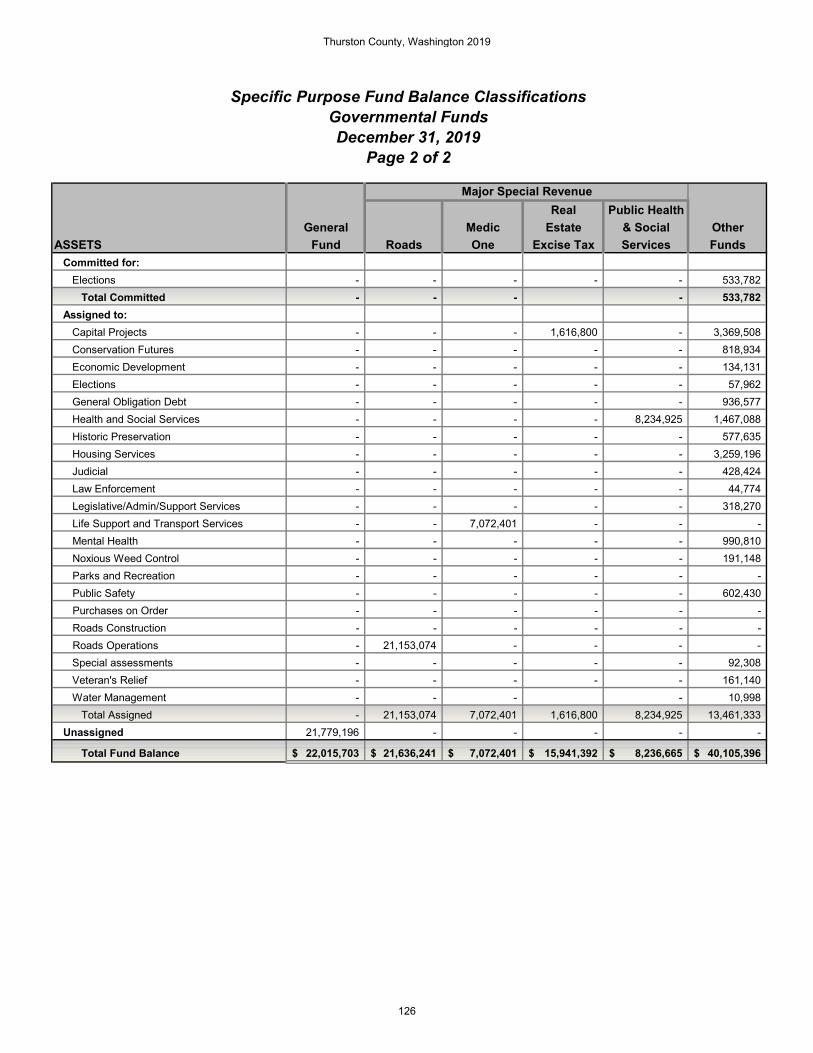
Specific Purpose Fund Balance ClassificationsGovernmental FundsDecember 31, 2019
Page 2 of 2
Real Public HealthGeneral Medic Estate & Social Other
ASSETS Fund Roads One Excise Tax Services Funds Committed for: Elections - - - - - 533,782 Total Committed - - - - 533,782 Assigned to: Capital Projects - - - 1,616,800 - 3,369,508 Conservation Futures - - - - - 818,934 Economic Development - - - - - 134,131 Elections - - - - - 57,962 General Obligation Debt - - - - - 936,577 Health and Social Services - - - - 8,234,925 1,467,088 Historic Preservation - - - - - 577,635 Housing Services - - - - - 3,259,196 Judicial - - - - - 428,424 Law Enforcement - - - - - 44,774 Legislative/Admin/Support Services - - - - - 318,270 Life Support and Transport Services - - 7,072,401 - - - Mental Health - - - - - 990,810 Noxious Weed Control - - - - - 191,148 Parks and Recreation - - - - - - Public Safety - - - - - 602,430 Purchases on Order - - - - - - Roads Construction - - - - - - Roads Operations - 21,153,074 - - - - Special assessments - - - - - 92,308 Veteran's Relief - - - - - 161,140 Water Management - - - - 10,998 Total Assigned - 21,153,074 7,072,401 1,616,800 8,234,925 13,461,333 Unassigned 21,779,196 - - - - -
Total Fund Balance 22,015,703$ 21,636,241$ 7,072,401$ 15,941,392$ 8,236,665$ 40,105,396$
Major Special Revenue
Thurston County, Washington 2019
126

NOTE XVII – NET INVESTMENT IN CAPITAL ASSETS Net Investment in Capital Assets includes all capitalized assets, less outstanding obligations for current and long-term bonds, and notes payable related to capital investments. These amounts are adjusted for unexpended bond proceeds, other borrowings, negative equities, debt incurred to finance capital acquisitions by outside parties, and non-capital financings as noted below.
Governmental Business-Type Activities Activities
Capital Assets, Net of Depreciation 476,903,958$ 32,290,380$ Less: Total Reported Outstanding Debt (55,841,991) (735,617) Net Investment in Capital Assets Before Adjustments 421,061,967 31,554,763 Adjustments: Non-County Agency Debt 129,645 - Loss on Refunding 1,739,376 57,975 Gain on Refunding (320,907) - Non-Capital Debt - 400,593 Net Investment in Capital Assets 422,610,081$ 32,013,331$
Reconciliation of Net Investment in Capital Assets
NOTE XVIII – OTHER DISCLOSURES A. Prior Period Adjustments The County reported a $1,003,326 prior period adjustment in Governmental Activities. A detail discussion of this balance is as follows:
• A total adjustment of $1,357,890 was recorded in six Governmental Funds. This was due to the County previously not accruing Sales Tax revenues which, earned in the last two months of the year, but not collected until January and February of the next year due to delayed remittances from the State. The County accrued as 2019 revenues, Sales Tax collections in January/February 2020. Additionally, a prior period adjustment to beginning Fund Balance was made for Sales Tax collections in January/February 2019. The funds affected are as follows:
o General Fund - $1,146,924 o Roads - $80,460 o REET Technology - $2,963 o TCOMM - $817 o Tourism Promotion - $120,100 o Hotel/Motel - $6,626
• An adjustment of ($264,081) was recorded in the Government Wide Statement of Activities for
recognizing prior year capital asset adjustments previously unrecorded. • An adjustment of ($90,483) was recorded to fix an accounting adjustment related to an overpayment to
the Thurston Mason Behavioral Health Organization during the 2018 contract with the county’s Superior Court.
Thurston County, Washington 2019
127
B. Fund Changes
The following funds were established in 2019 and added to the 2019 financial statements:
• Environmental Health – major Enterprise Fund. Previously reported in Public Health major Special Revenue Fund
• Courthouse Project – Non-major Capital Projects Fund C. Contingencies Thurston County has other claims and lawsuits pending at this time that could be a liability to the County over the next few years. The amount of these other claims cannot be reasonably estimated. D. Accounting and Reporting Changes During the year, the County early implemented one GASB statement, GASB 84, Fiduciary Activities – The primary objective of this Statement is to improve guidance regarding the identification of fiduciary activities for accounting and financial reporting purposes and how those activities should be reported. This statement will improve financial reporting by enhancing consistency and comparability by establishing specific criteria for identifying activities that should be reported as fiduciary activities and clarifying whether and how business-type activities should report their fiduciary activities. The original implementation date of this statement was for the county’s 2019 CAFR. However, because of the COVID-19 virus, the Governmental Accounting Standards Board (GASB) has moved the implementation date back one year. At the time of this notification by GASB, the county was substantially complete with its GASB 84 implementation. Therefore, it was decided to early implement this standard with the 2019 CAFR. NOTE XIX – SUBSEQUENT EVENTS In February 2020, the Governor of the state of Washington declared a state of emergency in response to the spread of a deadly new virus. In the weeks following the declaration, precautionary measures to slow the spread of the virus have been ordered. These measures include closing schools, colleges and universities, cancelling public events, prohibiting public and private gatherings, and requiring people to stay home unless they are leaving for an essential function. The length of time these measures will be in place, and the full extent of the financial impact on the county is unknown at this time. The Board of County Commissioners are assessing the situation and are modeling potential loss of revenue impacts to the remainder of 2020 budget and beyond.
Thurston County, Washington 2019
128

REQUIRED SUPPLEMENTARY INFORMATION SCHEDULE OF PROPORTIONATE SHARE OF THE
NET PENSION LIABILITY – BY PLAN
2019 2018 2017 2016 2015
Employer's proportion of the net pension liability (asset) 0.52265% 0.52712% 0.53694% 0.53414% 0.54111%
Employer's proportionate share of the net pension liability $ 20,097,902 $ 23,541,403 25,478,222$ 28,685,834$ 28,305,295$
Covered payroll $ 72,903,952 $ 68,272,438 66,896,398$ 62,772,447$ 60,498,584$
Employer's proportionate share of the net pension liability as a percentage of covered employee payroll 27.57% 34.48% 38.09% 45.70% 46.79%
Plan fiduciary net position as a percentage of the total pension liability 67.12% 63.22% 61.24% 57.03% 59.10%
Notes to Schedule:
* This schedule is to be built prospectively until it contains ten years of data.
Thurston CountySchedule of Proportionate Share of the Net Pension Liability
PERS 1As of June 30, 2019
Last 10 Fiscal Years*
Thurston County, Washington 2019
129

2019 2018 2017 2016 2015
Employer's proportion of the net pension liability (asset) 0.55716% 0.55650% 0.56401% 0.56076% 0.56903%
Employer's proportionate share of the net pension liability $ 5,411,937 $ 9,501,674 19,596,756$ 28,233,771$ 20,331,695$
Covered payroll $ 60,622,605 $ 56,717,146 55,457,431$ 52,509,692$ 50,535,914$
Employer's proportionate share of the net pension liability as a percentage of covered employee payroll 8.93% 16.75% 35.34% 53.77% 40.23%
Plan fiduciary net position as a percentage of the total pension liability 97.77% 95.77% 90.97% 85.82% 89.20%
Notes to Schedule:
* This schedule is to be built prospectively until it contains ten years of data.
Thurston CountySchedule of Proportionate Share of the Net Pension Liability
PERS 2/3As of June 30, 2019
Last 10 Fiscal Years*
Thurston County, Washington 2019
130

2019 2018 2017 2016 2015
Employer's proportion of the net pension liability (asset) 2.57562% 2.85940% 2.98852% 2.83819% 2.97578%
Employer's proportionate share of the net pension liability (asset) $ (334,933) $ 35,428 585,541$ 1,206,174$ 543,139$
Covered payroll $ 11,877,813 $ 10,914,664 10,622,021$ 9,245,155$ 8,732,083$
Employer's proportionate share of the net pension liability (asset) as a percentage of covered employee payroll -2.82% 0.32% 5.51% 13.05% 6.22%
Plan fiduciary net position as a percentage of the total pension liability 101.85% 99.79% 96.26% 90.41% 95.08%
Notes to Schedule:
* This schedule is to be built prospectively until it contains ten years of data.
Thurston CountySchedule of Proportionate Share of the Net Pension Liability
PSERSAs of June 30, 2019
Last 10 Fiscal Years*
Thurston County, Washington 2019
131

2019 2018 2017 2016 2015
Employer's proportion of the net pension liability (asset) 0.05245% 0.05158% 0.05158% 0.05040% 0.04875%
Employer's proportionate share of the net pension (asset) $ (1,036,752) $ (936,400) (782,506)$ (519,223)$ (587,485)$
State's proportionate share of the net pension liability (asset) associated with the employer (7,012,566) (6,333,784) (5,292,853) (3,512,011) (3,973,734)
TOTAL (8,049,319)$ (7,270,183)$ (6,075,359)$ (4,031,234)$ (4,561,219)$
Covered payroll -$ -$ -$ 45,806$ 97,578$
Employer's proportionate share of the net pension liability (asset) as a percentage of covered employee payroll N/A N/A N/A -1133.53% -602.07%
Plan fiduciary net position as a percentage of the total pension liability 148.78% 144.42% 135.96% 123.74% 127.36%
Notes to Schedule:
* This schedule is to be built prospectively until it contains ten years of data.* For covered payroll, as of the start of 2016, the County had no current employees active in the LEOFF 1 Plan.
Thurston CountySchedule of Proportionate Share of the Net Pension Liability
LEOFF 1As of June 30, 2019
Last 10 Fiscal Years*
Thurston County, Washington 2019
132

2019 2018 2017 2016 2015
Employer's proportion of the net pension liability (asset) 0.27646% 0.26981% 0.26170% 0.26031% 0.25764%
Employer's proportionate share of the net pension (asset) $ (6,404,637) $ (5,477,670) (3,631,506)$ (1,514,065)$ (2,648,014)$
State's proportionate share of the net pension liability (asset) associated with the employer (4,194,179) (3,546,688) (2,355,690) (987,060) (1,750,899)$
TOTAL (10,598,816)$ (9,024,358)$ (5,987,197)$ (2,501,125)$ (4,398,913)$
Covered payroll $ 9,554,576 $ 8,443,780 8,160,872$ 7,909,406$ 7,505,894$
Employer's proportionate share of the net pension liability (asset) as a percentage of covered employee payroll -64.87% -64.87% -44.50% -19.14% -35.28%
Plan fiduciary net position as a percentage of the total pension liability 119.43% 118.50% 113.36% 106.04% 111.67%
Notes to Schedule:
* This schedule is to be built prospectively until it contains ten years of data.
Thurston CountySchedule of Proportionate Share of the Net Pension Liability
LEOFF 2As of June 30, 2019
Last 10 Fiscal Years*
Thurston County, Washington 2019
133

REQUIRED SUPPLEMENTARY INFORMATION SCHEDULE OF EMPLOYER CONTRIBUTIONS – BY PLAN
2019 2018 2017 2016 2015
Contractually required contributions 3,689,985$ 3,633,665$ 3,384,559$ 3,152,092$ 2,753,010$
Contributions in relation to the contractually required contributions 3,689,985 3,633,665 3,384,559 3,152,092 2,753,010
Contribution deficiency (excess) -$ -$ -$ -$ -$
Covered payroll $ 74,161,632 $ 71,176,239 68,176,847$ 64,911,819$ 61,270,546$
Contributions as a percentage of covered employee payroll 4.98% 5.11% 4.96% 4.86% 4.49%
Notes to Schedule:
* This schedule is to be built prospectively until it contains ten years of data.
Thurston CountySchedule of Employer Contributions
PERS 1As of December 31, 2019
Last 10 Fiscal Years*
Thurston County, Washington 2019
134

2019 2018 2017 2016 2015
Contractually required contributions 4,762,500$ 4,442,192$ 3,984,624$ 3,464,070$ 2,973,565$
Contributions in relation to the contractually required contributions 4,762,500 4,442,192 3,984,624 3,464,070 2,973,565
Contribution deficiency (excess) -$ -$ -$ -$ -$
Covered payroll $ 61,696,101 $ 59,241,899 56,594,498$ 54,048,064$ 51,167,804$
Contributions as a percentage of covered employee payroll 7.72% 7.50% 7.04% 6.41% 5.81%
Notes to Schedule:
* This schedule is to be built prospectively until it contains ten years of data.
Thurston CountySchedule of Employer Contributions
PERS 2/3As of December 31, 2019
Last 10 Fiscal Years*
Thurston County, Washington 2019
135
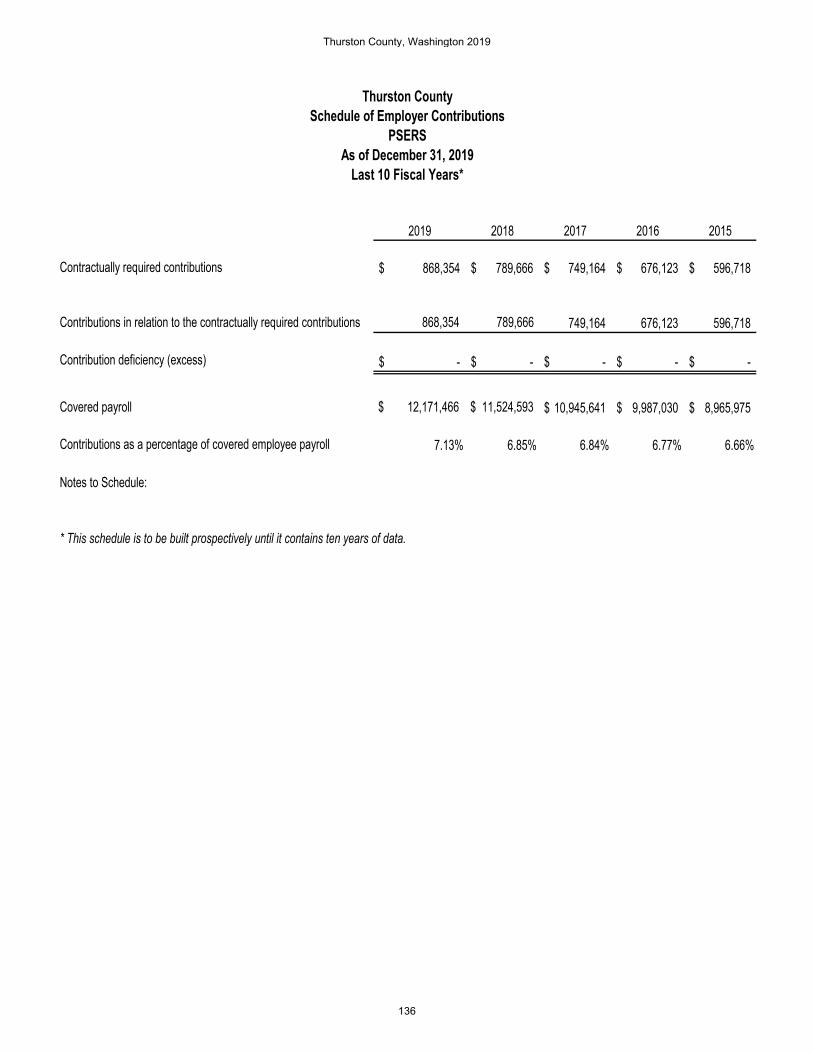
2019 2018 2017 2016 2015
Contractually required contributions 868,354$ 789,666$ 749,164$ 676,123$ 596,718$
Contributions in relation to the contractually required contributions 868,354 789,666 749,164 676,123 596,718
Contribution deficiency (excess) -$ -$ -$ -$ -$
Covered payroll $ 12,171,466 $ 11,524,593 10,945,641$ 9,987,030$ 8,965,975$
Contributions as a percentage of covered employee payroll 7.13% 6.85% 6.84% 6.77% 6.66%
Notes to Schedule:
* This schedule is to be built prospectively until it contains ten years of data.
Thurston CountySchedule of Employer Contributions
PSERSAs of December 31, 2019
Last 10 Fiscal Years*
Thurston County, Washington 2019
136

2019 2018 2017 2016 2015
Contractually required contributions 512,382$ 480,660$ 458,853$ 422,633$ 401,274$
Contributions in relation to the contractually required contributions 512,382 480,660 458,853 422,633 401,274
Contribution deficiency (excess) -$ -$ -$ -$ -$
Covered payroll $ 9,656,997 $ 9,155,412 8,541,674$ 8,080,915$ 7,672,529$
Contributions as a percentage of covered employee payroll 5.31% 5.25% 5.37% 5.23% 5.23%
Notes to Schedule:
* This schedule is to be built prospectively until it contains ten years of data.
Thurston CountySchedule of Employer Contributions
LEOFF 2As of December 31, 2018
Last 10 Fiscal Years*
Thurston County, Washington 2019
137
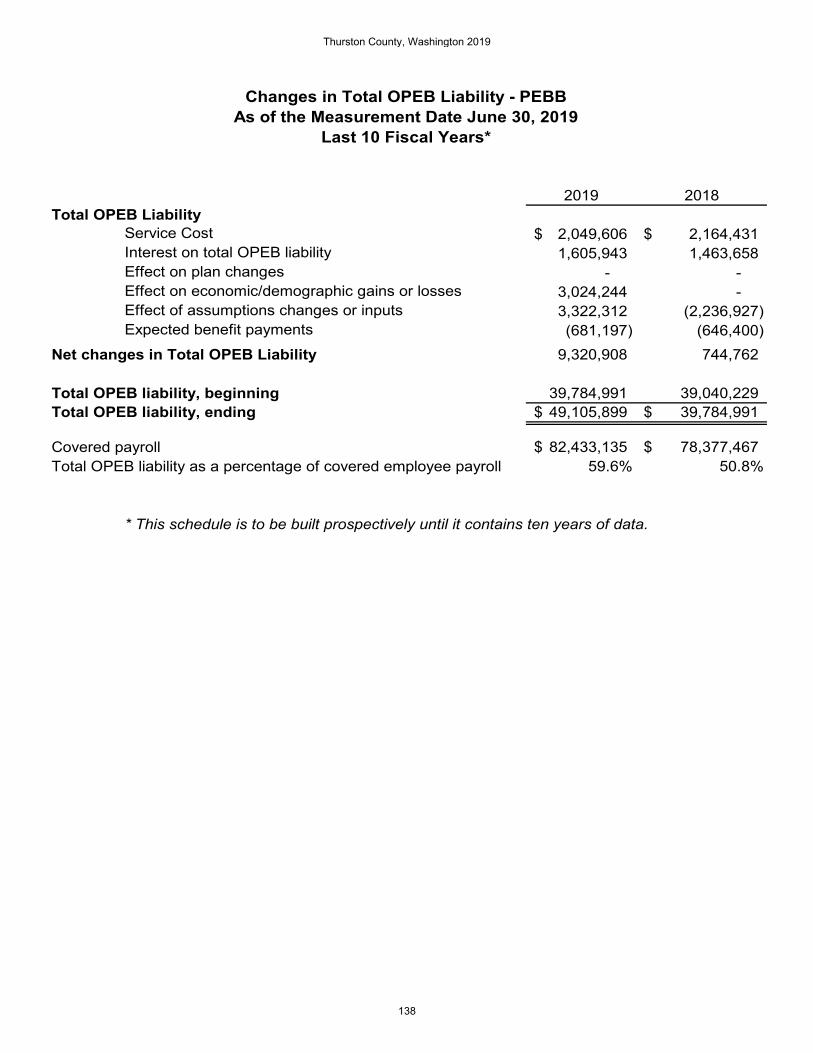
2019 2018Total OPEB Liability
Service Cost 2,049,606$ 2,164,431$ Interest on total OPEB liability 1,605,943 1,463,658 Effect on plan changes - - Effect on economic/demographic gains or losses 3,024,244 - Effect of assumptions changes or inputs 3,322,312 (2,236,927) Expected benefit payments (681,197) (646,400)
Net changes in Total OPEB Liability 9,320,908 744,762
Total OPEB liability, beginning 39,784,991 39,040,229 Total OPEB liability, ending 49,105,899$ 39,784,991$
Covered payroll 82,433,135$ 78,377,467$ Total OPEB liability as a percentage of covered employee payroll 59.6% 50.8%
* This schedule is to be built prospectively until it contains ten years of data.
Changes in Total OPEB Liability - PEBBAs of the Measurement Date June 30, 2019
Last 10 Fiscal Years*
Thurston County, Washington 2019
138
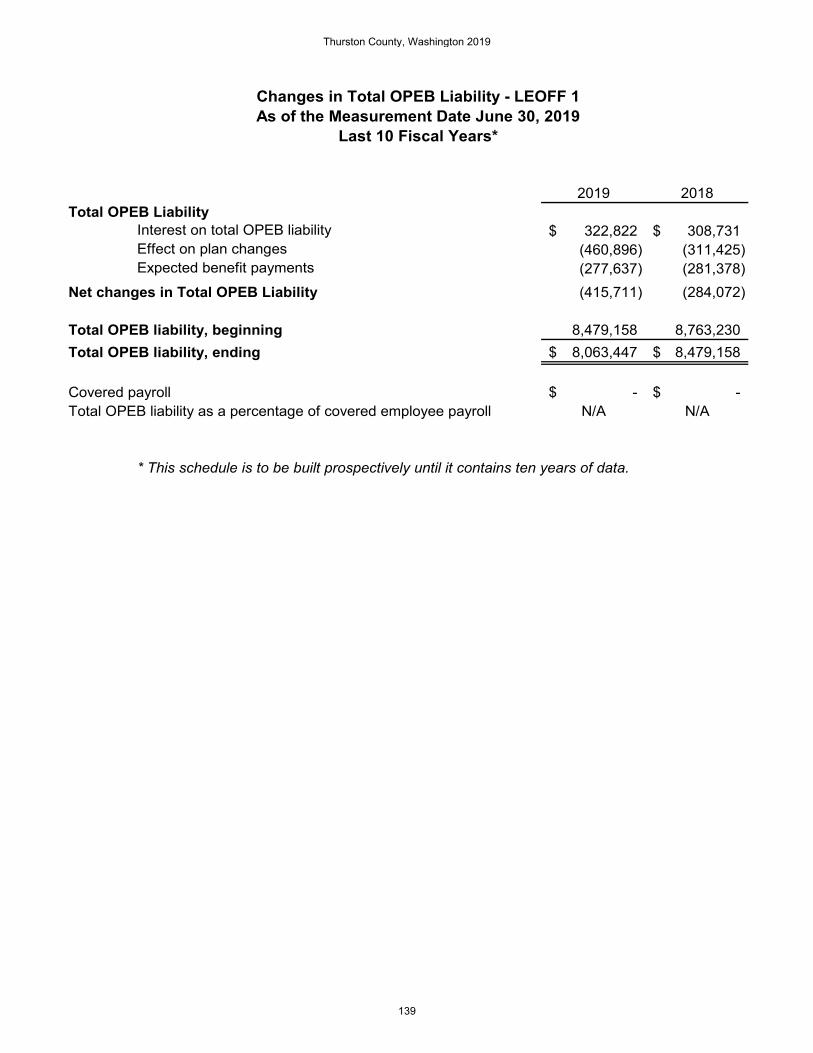
2019 2018Total OPEB Liability
Interest on total OPEB liability 322,822$ 308,731$ Effect on plan changes (460,896) (311,425) Expected benefit payments (277,637) (281,378)
Net changes in Total OPEB Liability (415,711) (284,072)
Total OPEB liability, beginning 8,479,158 8,763,230 Total OPEB liability, ending 8,063,447$ 8,479,158$
Covered payroll -$ -$ Total OPEB liability as a percentage of covered employee payroll N/A N/A
* This schedule is to be built prospectively until it contains ten years of data.
Changes in Total OPEB Liability - LEOFF 1As of the Measurement Date June 30, 2019
Last 10 Fiscal Years*
Thurston County, Washington 2019
139
This Page Intentionally Left Blank
Thurston County, Washington 2019
140

Nonmajor Nonmajor NonmajorSpecial Debt Capital
Revenue Service ProjectsFunds Funds Funds Total
ASSETSAssets: Cash & Pooled Investments 23,336,495$ 838,051$ 13,845,753$ 38,020,299$ Receivables: Taxes Receivable 32,511 - - 32,511 Special Assessment Receivables 27,324 - - 27,324 Accrued Interest & Penalties 100,765 2,481 31,571 134,817 Customer Account Receivables 3,579,494 - 1,154,437 4,733,931 Due from Other Funds 41,568 100,000 - 141,568 Due from Other Government Units 703,112 - - 703,112 Prepayments 14,250 - - 14,250
Total Assets 27,835,519$ 940,532$ 15,031,761$ 43,807,812$
LIABILITIESLiabilities: Accounts Payable 2,162,428$ -$ 137,148$ 2,299,576$ Due to Other Funds 490,375 - 371,366 861,741 Due to Other Government Units 3,937 - - 3,937 Unearned Revenues 128,915 - - 128,915
Total Liabilities 2,785,655 - 508,514 3,294,169
Deferred Inflow of Resources: Property Taxes 28,318 - - 28,318 Special Assessments 27,367 - - 27,367 Courts 352,562 - - 352,562
Total Deferred Inflow of Resources 408,247 - - 408,247
FUND BALANCES Nonspendable 14,250 - - 14,250 Restricted 15,070,121 3,955 11,021,955 26,096,031 Committed 533,782 - - 533,782 Assigned 9,023,464 936,577 3,501,292 13,461,333
Total Fund Balance 24,641,617 940,532 14,523,247 40,105,396
Total Liabilities, Deferred Inflow of Resources & Fund Balances 27,835,519$ 940,532$ 15,031,761$ 43,807,812$
Combining Balance SheetNonmajor Governmental Funds
December 31, 2019
Thurston County, Washington 2019
141
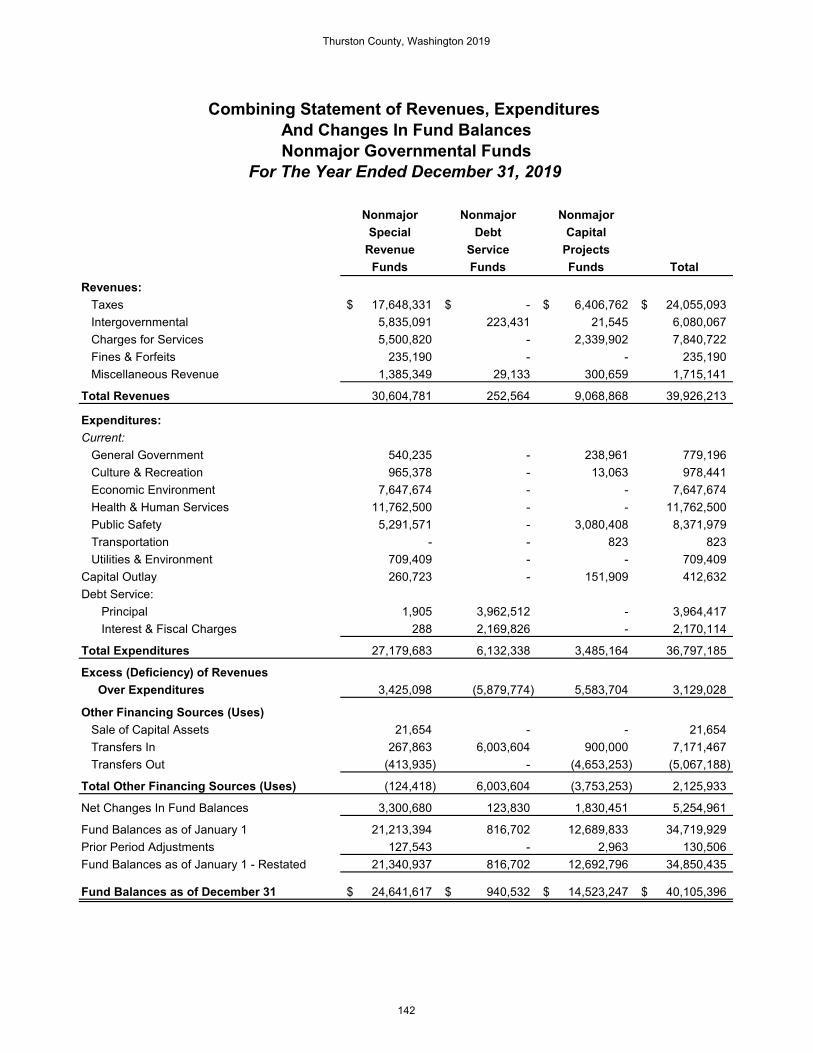
Nonmajor Nonmajor NonmajorSpecial Debt Capital
Revenue Service ProjectsFunds Funds Funds Total
Revenues: Taxes 17,648,331$ -$ 6,406,762$ 24,055,093$ Intergovernmental 5,835,091 223,431 21,545 6,080,067 Charges for Services 5,500,820 - 2,339,902 7,840,722 Fines & Forfeits 235,190 - - 235,190 Miscellaneous Revenue 1,385,349 29,133 300,659 1,715,141
Total Revenues 30,604,781 252,564 9,068,868 39,926,213
Expenditures:Current: General Government 540,235 - 238,961 779,196 Culture & Recreation 965,378 - 13,063 978,441 Economic Environment 7,647,674 - - 7,647,674 Health & Human Services 11,762,500 - - 11,762,500 Public Safety 5,291,571 - 3,080,408 8,371,979 Transportation - - 823 823 Utilities & Environment 709,409 - - 709,409 Capital Outlay 260,723 - 151,909 412,632 Debt Service: Principal 1,905 3,962,512 - 3,964,417 Interest & Fiscal Charges 288 2,169,826 - 2,170,114
Total Expenditures 27,179,683 6,132,338 3,485,164 36,797,185
Excess (Deficiency) of Revenues Over Expenditures 3,425,098 (5,879,774) 5,583,704 3,129,028
Other Financing Sources (Uses) Sale of Capital Assets 21,654 - - 21,654 Transfers In 267,863 6,003,604 900,000 7,171,467 Transfers Out (413,935) - (4,653,253) (5,067,188)
Total Other Financing Sources (Uses) (124,418) 6,003,604 (3,753,253) 2,125,933
Net Changes In Fund Balances 3,300,680 123,830 1,830,451 5,254,961
Fund Balances as of January 1 21,213,394 816,702 12,689,833 34,719,929 Prior Period Adjustments 127,543 - 2,963 130,506 Fund Balances as of January 1 - Restated 21,340,937 816,702 12,692,796 34,850,435
Fund Balances as of December 31 24,641,617$ 940,532$ 14,523,247$ 40,105,396$
Combining Statement of Revenues, Expenditures And Changes In Fund BalancesNonmajor Governmental Funds
For The Year Ended December 31, 2019
Thurston County, Washington 2019
142
NONMAJOR SPECIAL REVENUE FUNDS
Special revenue funds are established pursuant to state statutes or local ordinances to segregate resources designated for specific purposes. Anti-Profiteering – A fund that uses proceeds from anti-profiteering cases to investigate and prosecute similar cases. Auditor - Election Reserve – A fund that uses election service surcharges to acquire and replace election equipment. Auditor - Maintenance and Operations – A fund that uses service charges (including election service surcharges, duplicating fees and document preservation fees) to purchase systems and equipment for preservation of County historic documents. The fund is also used to cover document imaging by other County departments. Basin Planning & Enhancement Projects – A fund established to account for grant activity related to water quality. Clerk’s Legal Financial Obligations (LFO) Collections – A fund that uses intergovernmental service revenues to collect for court ordered financial obligations and the associated expenses. Conservation Futures – A fund that uses property taxes to purchase land or the rights to future development of land. A land preservation program that protects, preserves, and improves open space, timberlands, wetlands, habitat areas, culturally significant sites, and agriculture farmlands. Emergency Management Council – A fund established to use intergovernmental service and miscellaneous revenues from local jurisdictions and outside entities to fund joint emergency management activities. Family Court Services for Clerk & Superior Court – Two funds that use revenue from fees, marriage license surcharge and the sale of forms. These funds pay for the expenditures related to the Family Court Facilitator Program. The Family Court Facilitator provides assistance, coordination, direction and services related to family law issues for litigants not represented by an attorney. Housing & Community Renewal – A fund that uses business, occupation and excise taxes, grants, recording surcharges and interfund payments to provide planning and grant management services for housing development and homelessness prevention. Interlocal Drug Enforcement – A fund established to account for funds obtained from seizures and forfeitures of property, monetary instruments and other tangible items of value. Dedicated to administering the Thurston County Narcotics Taskforce. Investment Administration – A fund that uses fees from pool participants which reimburse the Treasurer’s Office for the actual expenses incurred in administering the investment function under a local pooling program.
Thurston County, Washington 2019
143
Lake Lawrence L. M. D. – A fund established to levy assessments to manage water quality through the control of aquatic vegetation in Lake Lawrence. Law Library – A fund that uses filing fees to fund a legal law library for Thurston County’s Superior Courts. Long Lake L. M. D. – A fund established to levy assessments to manage water quality through the control of aquatic vegetation at Long Lake. Noxious Weed – A fund established to levy tax assessments to County property owners to educate, consult with and provide services to landowners in protection of lands from the impact of invasive noxious weeds. Sheriff’s Special Programs – A fund that uses vessel registration fees to fund boating enforcement and grants for boating safety. Stadium, Convention and Art Center – A fund that uses lodging tax proceeds in unincorporated Thurston County to promote tourism and acquisition or operation of tourism-related facilities throughout the County. Tax Refunds – A fund established to return taxes improperly collected as mandated by court order. Thurston Communications (T-COMM 911) – A fund established to account for County collected 911 taxes on property and telephone lines and passes the funds to TCOMM, who provides countywide emergency communication services within Thurston County. Tourism Promotion Area Fund – A fund that uses a charge on hotel stays for tourism marketing and promotion. Transportation Benefit District – A fund established that uses auto licensing fees for road improvement projects. Treasurer’s Maintenance and Operations – A revolving fund that uses Treasurer’s assessment collection fees for the foreclosing process of selling property due to delinquent property taxes. Treatment Sales Tax – A sales tax established to provide new or expanded chemical dependency or mental health treatment services for the operation of therapeutic court programs and services. Trial Court Improvement – A fund established to use judicial salary contributions from the state to fund improvements to Superior and District Court staffing, programs, facilities, or services. Veterans Assistance Revolving Fund– A fund that uses property taxes to fund emergency assistance to eligible veterans and their families in Thurston County. Victim Advocate Program Fund – A fund that uses court penalties and assessments from the County’s crime victim/witness program and grant proceeds to fund services to victims of crimes.
Thurston County, Washington 2019
144
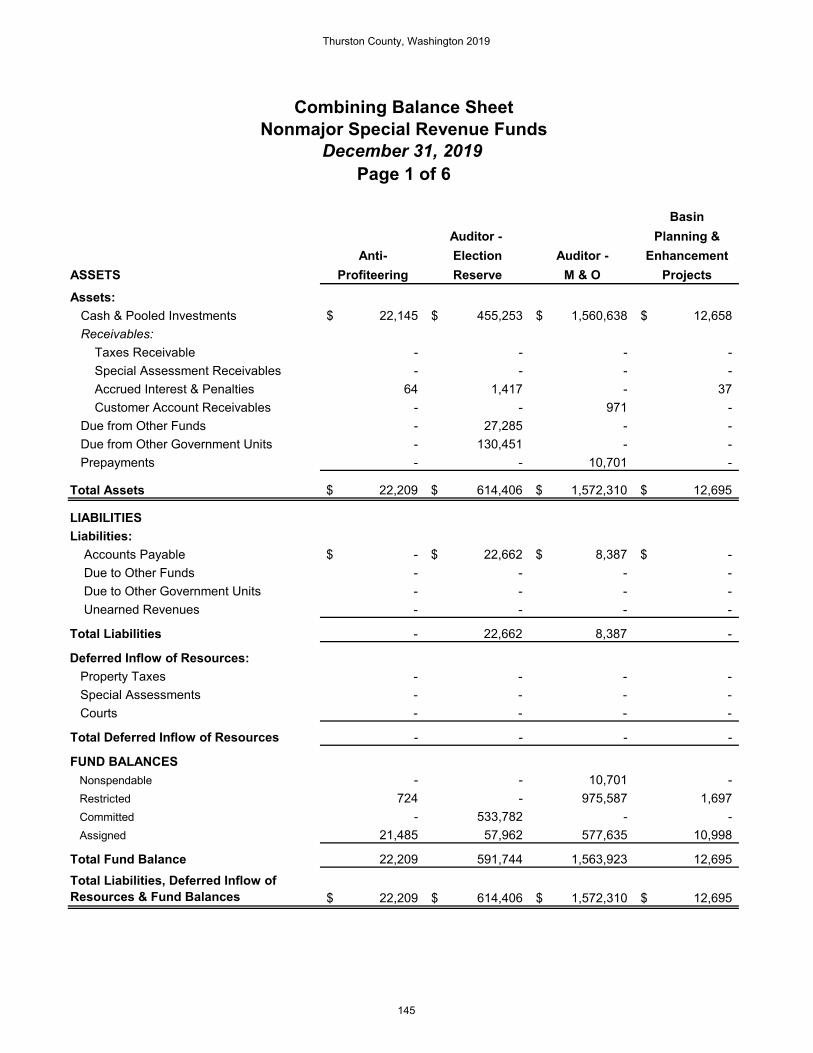
BasinAuditor - Planning &
Anti- Election Auditor - EnhancementASSETS Profiteering Reserve M & O ProjectsAssets: Cash & Pooled Investments 22,145$ 455,253$ 1,560,638$ 12,658$ Receivables: Taxes Receivable - - - - Special Assessment Receivables - - - - Accrued Interest & Penalties 64 1,417 - 37 Customer Account Receivables - - 971 - Due from Other Funds - 27,285 - - Due from Other Government Units - 130,451 - - Prepayments - - 10,701 -
Total Assets 22,209$ 614,406$ 1,572,310$ 12,695$
LIABILITIESLiabilities: Accounts Payable -$ 22,662$ 8,387$ -$ Due to Other Funds - - - - Due to Other Government Units - - - - Unearned Revenues - - - -
Total Liabilities - 22,662 8,387 -
Deferred Inflow of Resources: Property Taxes - - - - Special Assessments - - - - Courts - - - -
Total Deferred Inflow of Resources - - - -
FUND BALANCES Nonspendable - - 10,701 - Restricted 724 - 975,587 1,697 Committed - 533,782 - - Assigned 21,485 57,962 577,635 10,998
Total Fund Balance 22,209 591,744 1,563,923 12,695 Total Liabilities, Deferred Inflow of Resources & Fund Balances 22,209$ 614,406$ 1,572,310$ 12,695$
Combining Balance SheetNonmajor Special Revenue Funds
December 31, 2019Page 1 of 6
Thurston County, Washington 2019
145
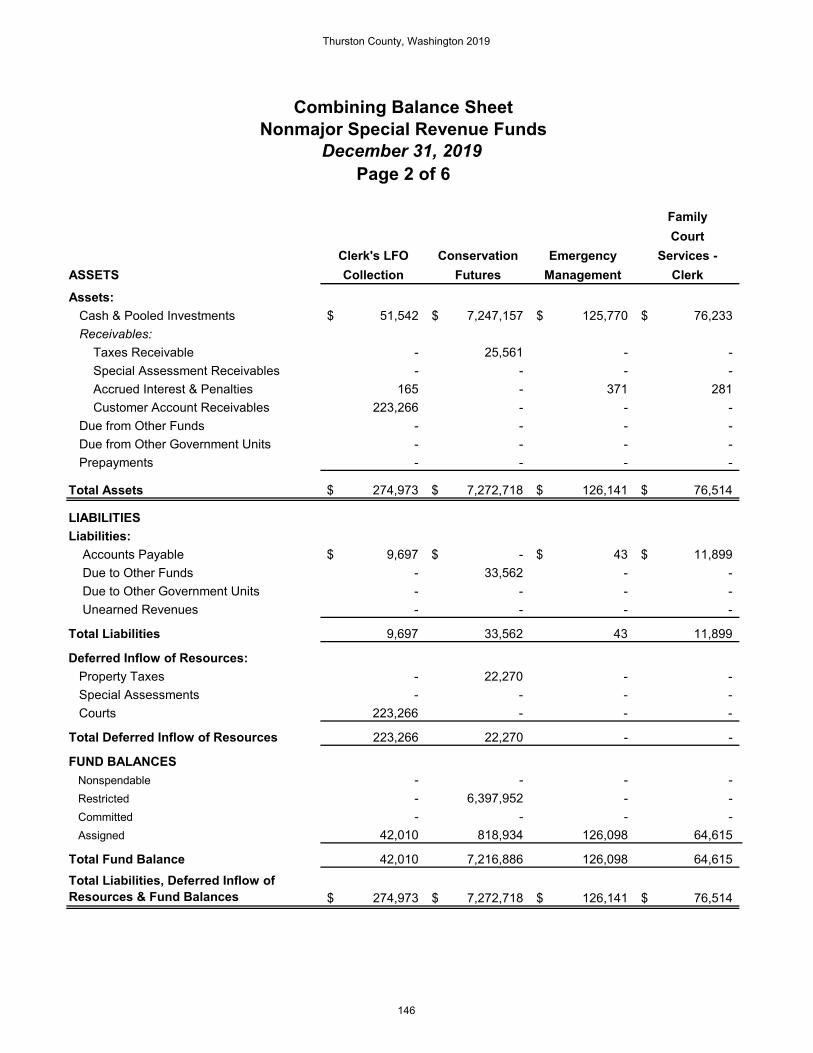
FamilyCourt
Clerk's LFO Conservation Emergency Services -ASSETS Collection Futures Management ClerkAssets: Cash & Pooled Investments 51,542$ 7,247,157$ 125,770$ 76,233$ Receivables: Taxes Receivable - 25,561 - - Special Assessment Receivables - - - - Accrued Interest & Penalties 165 - 371 281 Customer Account Receivables 223,266 - - - Due from Other Funds - - - - Due from Other Government Units - - - - Prepayments - - - -
Total Assets 274,973$ 7,272,718$ 126,141$ 76,514$
LIABILITIESLiabilities: Accounts Payable 9,697$ -$ 43$ 11,899$ Due to Other Funds - 33,562 - - Due to Other Government Units - - - - Unearned Revenues - - - -
Total Liabilities 9,697 33,562 43 11,899
Deferred Inflow of Resources: Property Taxes - 22,270 - - Special Assessments - - - - Courts 223,266 - - -
Total Deferred Inflow of Resources 223,266 22,270 - -
FUND BALANCES Nonspendable - - - - Restricted - 6,397,952 - - Committed - - - - Assigned 42,010 818,934 126,098 64,615
Total Fund Balance 42,010 7,216,886 126,098 64,615 Total Liabilities, Deferred Inflow of Resources & Fund Balances 274,973$ 7,272,718$ 126,141$ 76,514$
Combining Balance SheetNonmajor Special Revenue Funds
December 31, 2019Page 2 of 6
Thurston County, Washington 2019
146

FamilyCourt Housing & Interlocal Lake
Services - Community Drug Investment Lawrence -ASSETS Sup. Crt. Renewal Enforcement Admin. L. M. D.Assets: Cash & Pooled Investments 139,678$ 3,747,883$ 634,578$ 218,354$ 143,632$ Receivables: Taxes Receivable - - - - - Special Assessment Receivables - - - - 3,046 Accrued Interest & Penalties 389 9,644 1,846 79,401 432 Customer Account Receivables 21,957 139,727 - - - Due from Other Funds - - - - - Due from Other Government Units - 413,413 37,365 - - Prepayments - - 3,366 - -
Total Assets 162,024$ 4,310,667$ 677,155$ 297,755$ 147,110$
LIABILITIESLiabilities: Accounts Payable -$ 748,482$ 193,072$ 27,388$ 631$ Due to Other Funds - - 448 - 536 Due to Other Government Units - - 3,937 - - Unearned Revenues - - - - -
Total Liabilities - 748,482 197,457 27,388 1,167
Deferred Inflow of Resources: Property Taxes - - - - - Special Assessments - - - - 3,089 Courts - - - - -
Total Deferred Inflow of Resources - - - - 3,089
FUND BALANCES Nonspendable - - 3,366 - - Restricted 13,208 302,989 - 95,003 121,509 Committed - - - - - Assigned 148,816 3,259,196 476,332 175,364 21,345
Total Fund Balance 162,024 3,562,185 479,698 270,367 142,854 Total Liabilities, Deferred Inflow of Resources & Fund Balances 162,024$ 4,310,667$ 677,155$ 297,755$ 147,110$
Combining Balance SheetNonmajor Special Revenue Funds
December 31, 2019Page 3 of 6
Thurston County, Washington 2019
147

Long Sheriff'sLaw Lake - Noxious Special
ASSETS Library L. M. D. Weed ProgramsAssets: Cash & Pooled Investments 297,419$ 451,822$ 297,439$ 192,874$ Receivables: Taxes Receivable - - - - Special Assessment Receivables - 3,711 20,567 - Accrued Interest & Penalties - 1,226 804 587 Customer Account Receivables - - - - Due from Other Funds - - 1,170 - Due from Other Government Units - - 3,157 - Prepayments - - - -
Total Assets 297,419$ 456,759$ 323,137$ 193,461$
LIABILITIESLiabilities: Accounts Payable 8,065$ 1,436$ 15,212$ 370$ Due to Other Funds - 543 2,575 - Due to Other Government Units - - - - Unearned Revenues - - - -
Total Liabilities 8,065 1,979 17,787 370
Deferred Inflow of Resources: Property Taxes - - - - Special Assessments - 3,711 20,567 - Courts - - - -
Total Deferred Inflow of Resources - 3,711 20,567 -
FUND BALANCES Nonspendable - - - - Restricted 286,541 380,106 93,635 169,802 Committed - - - - Assigned 2,813 70,963 191,148 23,289
Total Fund Balance 289,354 451,069 284,783 193,091 Total Liabilities, Deferred Inflow of Resources & Fund Balances 297,419$ 456,759$ 323,137$ 193,461$
Combining Balance SheetNonmajor Special Revenue Funds
December 31, 2019Page 4 of 6
Thurston County, Washington 2019
148
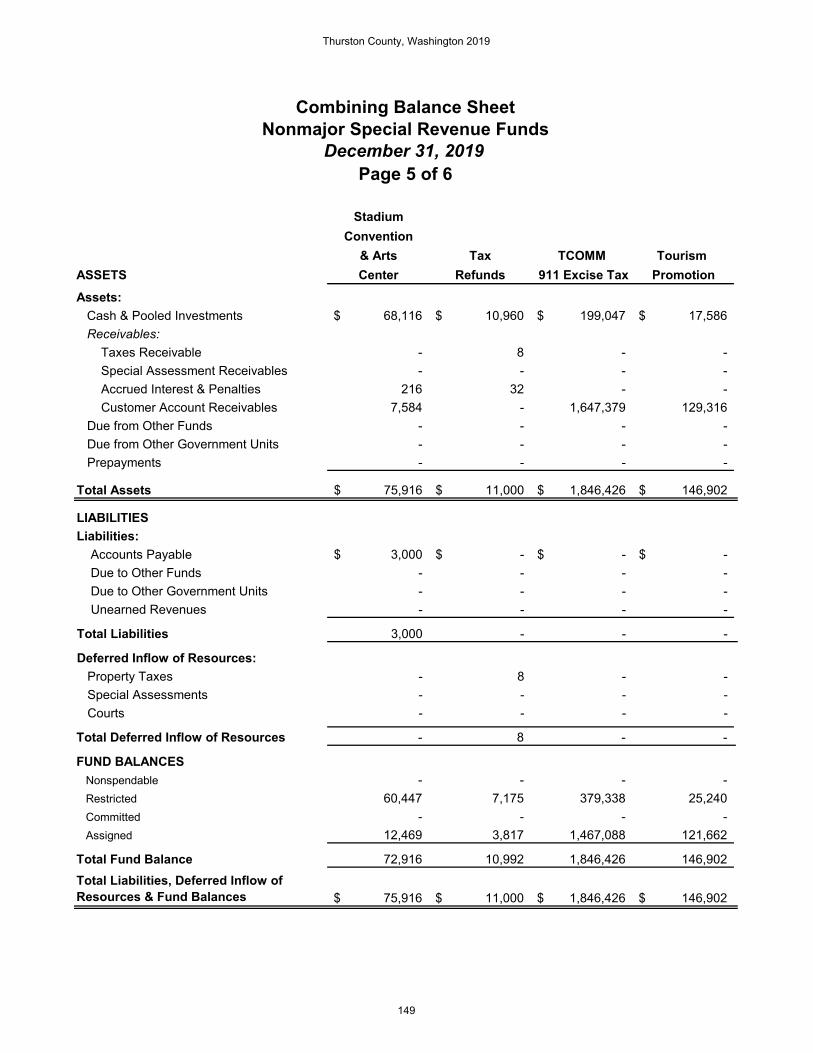
StadiumConvention
& Arts Tax TCOMM Tourism ASSETS Center Refunds 911 Excise Tax PromotionAssets: Cash & Pooled Investments 68,116$ 10,960$ 199,047$ 17,586$ Receivables: Taxes Receivable - 8 - - Special Assessment Receivables - - - - Accrued Interest & Penalties 216 32 - - Customer Account Receivables 7,584 - 1,647,379 129,316 Due from Other Funds - - - - Due from Other Government Units - - - - Prepayments - - - -
Total Assets 75,916$ 11,000$ 1,846,426$ 146,902$
LIABILITIESLiabilities: Accounts Payable 3,000$ -$ -$ -$ Due to Other Funds - - - - Due to Other Government Units - - - - Unearned Revenues - - - -
Total Liabilities 3,000 - - -
Deferred Inflow of Resources: Property Taxes - 8 - - Special Assessments - - - - Courts - - - -
Total Deferred Inflow of Resources - 8 - -
FUND BALANCES Nonspendable - - - - Restricted 60,447 7,175 379,338 25,240 Committed - - - - Assigned 12,469 3,817 1,467,088 121,662
Total Fund Balance 72,916 10,992 1,846,426 146,902 Total Liabilities, Deferred Inflow of Resources & Fund Balances 75,916$ 11,000$ 1,846,426$ 146,902$
Combining Balance SheetNonmajor Special Revenue Funds
December 31, 2019Page 5 of 6
Thurston County, Washington 2019
149

Trial VictimTreasurer Treatment Court Advocate
ASSETS M & O Sales Tax Improve Veterans Program TotalAssets: Cash & Pooled Investments 66,453$ 5,967,876$ 502,603$ 601,196$ 227,583$ 23,336,495$ Receivables: Taxes Receivable - - - 6,942 - 32,511 Special Assessment Receivables - - - - - 27,324 Accrued Interest & Penalties 161 - 1,440 1,632 620 100,765 Customer Account Receivables 128,915 1,151,083 - - 129,296 3,579,494 Due from Other Funds - 11,233 - 1,880 - 41,568 Due from Other Government Units - - - - 118,726 703,112 Prepayments - 183 - - - 14,250
Total Assets 195,529$ 7,130,375$ 504,043$ 611,650$ 476,225$ 27,835,519$
LIABILITIESLiabilities: Accounts Payable 8,214$ 1,060,953$ -$ 18,059$ 24,858$ 2,162,428$ Due to Other Funds 2,348 450,363 - - - 490,375 Due to Other Government Units - - - - - 3,937 Unearned Revenues 128,915 - - - - 128,915
Total Liabilities 139,477 1,511,316 - 18,059 24,858 2,785,655
Deferred Inflow of Resources: Property Taxes - - - 6,040 - 28,318 Special Assessments - - - - - 27,367 Courts - - - - 129,296 352,562
Total Deferred Inflow of Resources - - - 6,040 129,296 408,247
FUND BALANCES Nonspendable - 183 - - - 14,250 Restricted 48,747 4,628,066 457,828 426,411 198,116 15,070,121 Committed - - - - - 533,782 Assigned 7,305 990,810 46,215 161,140 123,955 9,023,464
Total Fund Balance 56,052 5,619,059 504,043 587,551 322,071 24,641,617 Total Liabilities, Deferred Inflow of Resources & Fund Balances 195,529$ 7,130,375$ 504,043$ 611,650$ 476,225$ 27,835,519$
Nonmajor Special Revenue FundsCombining Balance Sheet
Page 6 of 6December 31, 2019
Thurston County, Washington 2019
150

BasinAuditor- Planning &
Anti- Election Auditor - EnhancementProfiteering Reserve M & O Projects
Revenues: Taxes -$ -$ -$ -$ Intergovernmental - 25,969 94,733 - Charges for Services - 208,690 233,350 - Fines & Forfeits - - - - Miscellaneous Revenue 664 15,655 9,134 387
Total Revenues 664 250,314 337,217 387
Expenditures:Current: General Government - 54,749 204,673 - Culture & Recreation - - - - Economic Environment - - - - Health & Human Services - - - - Public Safety 257 - - - Utilities & Environment - - - - Capital Outlay - 193,216 10,263 - Debt Service: Principal - - - - Interest & Fiscal Charges - - - -
Total Expenditures 257 247,965 214,936 -
Excess (Deficiency) of Revenues Over Expenditures 407 2,349 122,281 387
Other Financing Sources (Uses) Sale of Capital Assets - - - - Transfers In - - - - Transfers Out - - - -
Total Other Financing Sources (Uses) - - - -
Net Changes In Fund Balances 407 2,349 122,281 387
Fund Balances as of January 1 21,802 589,395 1,441,642 12,308 Prior Period Adjustments - - - - Fund Balances as of January 1 - Restated 21,802 589,395 1,441,642 12,308
Fund Balances as of December 31 22,209$ 591,744$ 1,563,923$ 12,695$
Combining Statement of Revenues, ExpendituresAnd Changes In Fund Balances
Nonmajor Special Revenue FundsFor The Year Ended December 31, 2019
Page 1 of 6
Thurston County, Washington 2019
151
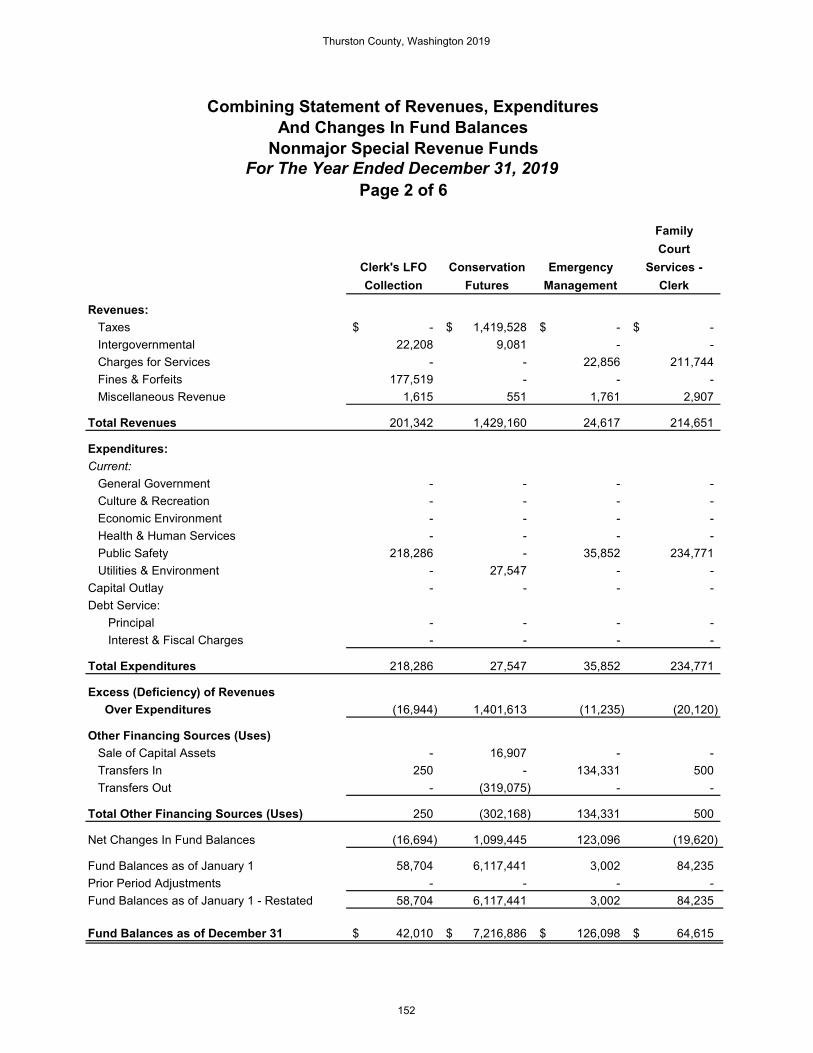
FamilyCourt
Clerk's LFO Conservation Emergency Services -Collection Futures Management Clerk
Revenues: Taxes -$ 1,419,528$ -$ -$ Intergovernmental 22,208 9,081 - - Charges for Services - - 22,856 211,744 Fines & Forfeits 177,519 - - - Miscellaneous Revenue 1,615 551 1,761 2,907
Total Revenues 201,342 1,429,160 24,617 214,651
Expenditures:Current: General Government - - - - Culture & Recreation - - - - Economic Environment - - - - Health & Human Services - - - - Public Safety 218,286 - 35,852 234,771 Utilities & Environment - 27,547 - - Capital Outlay - - - - Debt Service: Principal - - - - Interest & Fiscal Charges - - - -
Total Expenditures 218,286 27,547 35,852 234,771
Excess (Deficiency) of Revenues Over Expenditures (16,944) 1,401,613 (11,235) (20,120)
Other Financing Sources (Uses) Sale of Capital Assets - 16,907 - - Transfers In 250 - 134,331 500 Transfers Out - (319,075) - -
Total Other Financing Sources (Uses) 250 (302,168) 134,331 500
Net Changes In Fund Balances (16,694) 1,099,445 123,096 (19,620)
Fund Balances as of January 1 58,704 6,117,441 3,002 84,235 Prior Period Adjustments - - - - Fund Balances as of January 1 - Restated 58,704 6,117,441 3,002 84,235
Fund Balances as of December 31 42,010$ 7,216,886$ 126,098$ 64,615$
Combining Statement of Revenues, ExpendituresAnd Changes In Fund Balances
Nonmajor Special Revenue FundsFor The Year Ended December 31, 2019
Page 2 of 6
Thurston County, Washington 2019
152

FamilyCourt Housing & Interlocal Lake
Services - Community Drug Investment Lawrence -Sup. Crt. Renewal Enforcement Admin. L. M. D.
Revenues: Taxes -$ 35,595$ -$ -$ -$ Intergovernmental - 4,965,830 134,308 - - Charges for Services 33,672 3,093,214 - - - Fines & Forfeits - - 47,542 - 180 Miscellaneous Revenue 3,754 89,412 279,306 51,097 107,007
Total Revenues 37,426 8,184,051 461,156 51,097 107,187
Expenditures:Current: General Government - - - 64,639 - Culture & Recreation - - - - - Economic Environment - 7,380,340 - - - Health & Human Services - - - - - Public Safety 945 - 394,617 - - Utilities & Environment - - - - 55,197 Capital Outlay - - 7,029 44,696 - Debt Service: Principal - - 1,905 - - Interest & Fiscal Charges - - 288 - -
Total Expenditures 945 7,380,340 403,839 109,335 55,197
Excess (Deficiency) of Revenues Over Expenditures 36,481 803,711 57,317 (58,238) 51,990
Other Financing Sources (Uses) Sale of Capital Assets - - - - - Transfers In - 129,782 - 500 - Transfers Out - (52,503) - - -
Total Other Financing Sources (Uses) - 77,279 - 500 -
Net Changes In Fund Balances 36,481 880,990 57,317 (57,738) 51,990
Fund Balances as of January 1 125,543 2,681,195 422,381 328,105 90,864 Prior Period Adjustments - - - - - Fund Balances as of January 1 - Restated 125,543 2,681,195 422,381 328,105 90,864
Fund Balances as of December 31 162,024$ 3,562,185$ 479,698$ 270,367$ 142,854$
Combining Statement of Revenues, ExpendituresAnd Changes In Fund Balances
Nonmajor Special Revenue FundsFor The Year Ended December 31, 2019
Page 3 of 6
Thurston County, Washington 2019
153

Long Sheriff'sLaw Lake - Noxious Special
Library L. M. D. Weed Programs
Revenues: Taxes -$ -$ -$ -$ Intergovernmental - - 34,216 67,521 Charges for Services 107,801 6,101 455 - Fines & Forfeits - 190 - - Miscellaneous Revenue - 207,219 543,209 6,254
Total Revenues 107,801 213,510 577,880 73,775
Expenditures:Current: General Government - - - - Culture & Recreation - - - - Economic Environment - - - - Health & Human Services - - - - Public Safety 56,495 - - 66,809 Utilities & Environment - 83,031 543,634 - Capital Outlay - - - 5,519 Debt Service: Principal - - - - Interest & Fiscal Charges - - - -
Total Expenditures 56,495 83,031 543,634 72,328
Excess (Deficiency) of Revenues Over Expenditures 51,306 130,479 34,246 1,447
Other Financing Sources (Uses) Sale of Capital Assets - - - - Transfers In - - 750 - Transfers Out - - - -
Total Other Financing Sources (Uses) - - 750 -
Net Changes In Fund Balances 51,306 130,479 34,996 1,447
Fund Balances as of January 1 238,048 320,590 249,787 191,644 Prior Period Adjustments - - - - Fund Balances as of January 1 - Restated 238,048 320,590 249,787 191,644
Fund Balances as of December 31 289,354$ 451,069$ 284,783$ 193,091$
Combining Statement of Revenues, ExpendituresAnd Changes In Fund Balances
Nonmajor Special Revenue FundsFor The Year Ended December 31, 2019
Page 4 of 6
Thurston County, Washington 2019
154

StadiumConvention
& Arts Tax TCOMM Tourism Center Refunds 911 Excise Tax Promotion
Revenues: Taxes 59,383$ -$ 9,329,814$ -$ Intergovernmental - - - - Charges for Services - - - 967,239 Fines & Forfeits - - - - Miscellaneous Revenue 1,859 327 5,117 1,563
Total Revenues 61,242 327 9,334,931 968,802
Expenditures:Current: General Government - - - - Culture & Recreation 23,378 - - 942,000 Economic Environment - - - - Health & Human Services - - 9,018,900 - Public Safety - - - - Utilities & Environment - - - - Capital Outlay - - - - Debt Service: Principal - - - - Interest & Fiscal Charges - - - -
Total Expenditures 23,378 - 9,018,900 942,000
Excess (Deficiency) of Revenues Over Expenditures 37,864 327 316,031 26,802
Other Financing Sources (Uses) Sale of Capital Assets - - - - Transfers In - - - - Transfers Out (20,000) - - -
Total Other Financing Sources (Uses) (20,000) - - -
Net Changes In Fund Balances 17,864 327 316,031 26,802
Fund Balances as of January 1 48,426 10,665 1,529,578 - Prior Period Adjustments 6,626 - 817 120,100 Fund Balances as of January 1 - Restated 55,052 10,665 1,530,395 120,100
Fund Balances as of December 31 72,916$ 10,992$ 1,846,426$ 146,902$
Combining Statement of Revenues, ExpendituresAnd Changes In Fund Balances
Nonmajor Special Revenue FundsFor The Year Ended December 31, 2019
Page 5 of 6
Thurston County, Washington 2019
155

Trial VictimTreasurer Treatment Court Advocate
M & O Sales Tax Improvement Veterans Program Total
Revenues: Taxes -$ 6,405,703$ -$ 398,308$ -$ 17,648,331$ Intergovernmental - - 68,420 2,550 410,255 5,835,091 Charges for Services 239,217 4,520 - - 371,961 5,500,820 Fines & Forfeits - - - - 9,759 235,190 Miscellaneous Revenue 2,969 - 14,387 15,265 23,930 1,385,349
Total Revenues 242,186 6,410,223 82,807 416,123 815,905 30,604,781
Expenditures:Current: General Government 216,174 - - - - 540,235 Culture & Recreation - - - - - 965,378 Economic Environment - 29,997 - 237,337 - 7,647,674 Health & Human Services - 2,743,600 - - - 11,762,500 Public Safety - 3,633,983 20,511 - 629,045 5,291,571 Utilities & Environment - - - - - 709,409 Capital Outlay - - - - - 260,723 Debt Service: Principal - - - - - 1,905 Interest & Fiscal Charges - - - - - 288
Total Expenditures 216,174 6,407,580 20,511 237,337 629,045 27,179,683
Excess (Deficiency) of Revenues Over Expenditures 26,012 2,643 62,296 178,786 186,860 3,425,098
Other Financing Sources (Uses) Sale of Capital Assets - - - 4,747 - 21,654 Transfers In 250 - - 250 1,250 267,863 Transfers Out - (2,855) (7,982) (11,520) - (413,935)
Total Other Financing Sources (Uses) 250 (2,855) (7,982) (6,523) 1,250 (124,418)
Net Changes In Fund Balances 26,262 (212) 54,314 172,263 188,110 3,300,680
Fund Balances as of January 1 29,790 5,619,271 449,729 415,288 133,961 21,213,394 Prior Period Adjustments - - - - - 127,543 Fund Balances as of January 1 - Restated 29,790 5,619,271 449,729 415,288 133,961 21,340,937
Fund Balances as of December 31 56,052$ 5,619,059$ 504,043$ 587,551$ 322,071$ 24,641,617$
Combining Statement of Revenues, Expenditures
Nonmajor Special Revenue FundsAnd Changes In Fund Balances
Page 6 of 6For The Year Ended December 31, 2019
Thurston County, Washington 2019
156

Variance withOriginal Final Final Budget
2019 2019 Actual Positive orBudget Budget 2019 (Negative)
Revenues: Fines & Forfeits 100$ 100$ -$ (100)$ Miscellaneous Revenue 200 200 664 464
Total Revenues 300 300 664 364
Expenditures:Current: Public Safety 20,257 10,257 257 10,000
Total Expenditures 20,257 10,257 257 10,000
Excess (Deficiency) of Revenues Over Expenditures (19,957) (9,957) 407 10,364
Net Changes In Fund Balances (19,957) (9,957) 407 10,364
Fund Balances as of January 1 21,908 22,001 21,802 (199)
Fund Balances as of December 31 1,951$ 12,044$ 22,209$ 10,165$
Anti-ProfiteeringSchedule of Revenues, Expenditures, and
Changes in Fund Balance - Budget (GAAP Basis) and ActualFor The Year Ended December 31, 2019
Thurston County, Washington 2019
157
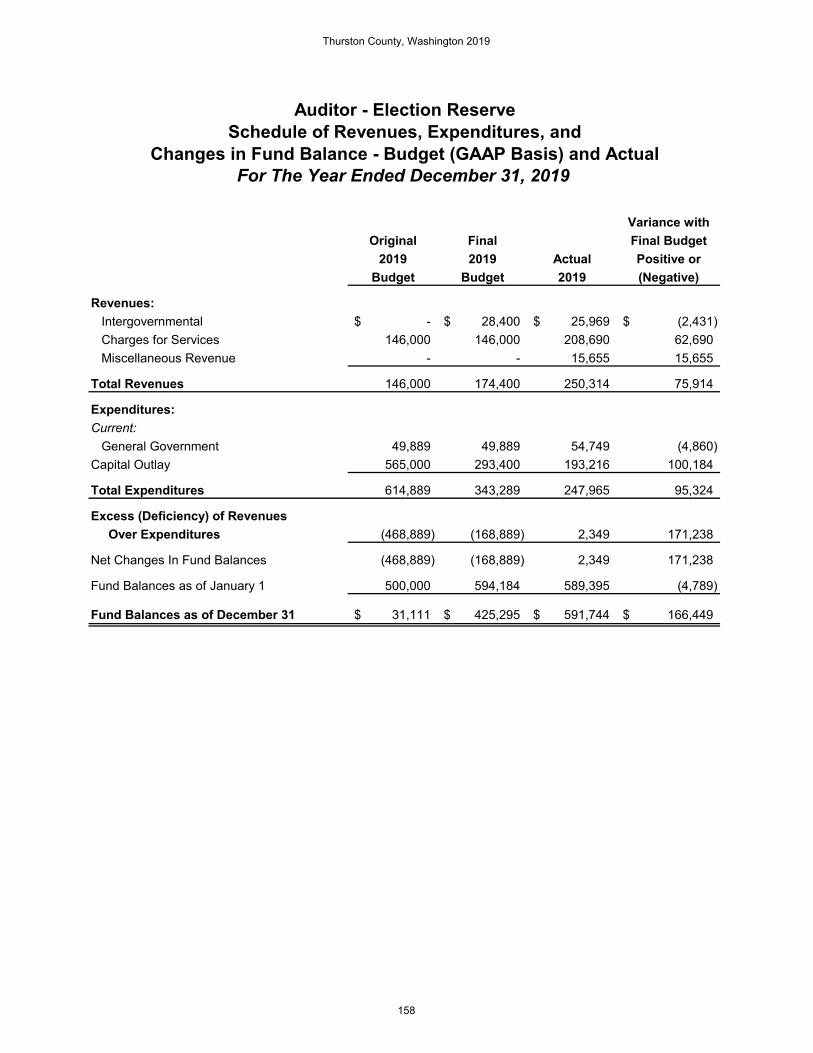
Variance withOriginal Final Final Budget
2019 2019 Actual Positive orBudget Budget 2019 (Negative)
Revenues: Intergovernmental -$ 28,400$ 25,969$ (2,431)$ Charges for Services 146,000 146,000 208,690 62,690 Miscellaneous Revenue - - 15,655 15,655
Total Revenues 146,000 174,400 250,314 75,914
Expenditures:Current: General Government 49,889 49,889 54,749 (4,860) Capital Outlay 565,000 293,400 193,216 100,184
Total Expenditures 614,889 343,289 247,965 95,324
Excess (Deficiency) of Revenues Over Expenditures (468,889) (168,889) 2,349 171,238
Net Changes In Fund Balances (468,889) (168,889) 2,349 171,238
Fund Balances as of January 1 500,000 594,184 589,395 (4,789)
Fund Balances as of December 31 31,111$ 425,295$ 591,744$ 166,449$
Schedule of Revenues, Expenditures, andChanges in Fund Balance - Budget (GAAP Basis) and Actual
For The Year Ended December 31, 2019
Auditor - Election Reserve
Thurston County, Washington 2019
158

Variance withOriginal Final Final Budget
2019 2019 Actual Positive orBudget Budget 2019 (Negative)
Revenues: Intergovernmental 90,000$ 90,000$ 94,733$ 4,733$ Charges for Services 168,800 168,800 233,350 64,550 Miscellaneous Revenue 11,200 11,200 9,134 (2,066)
Total Revenues 270,000 270,000 337,217 67,217
Expenditures:Current: General Government 356,767 356,767 204,673 152,094 Capital Outlay 22,500 22,500 10,263 12,237
Total Expenditures 379,267 379,267 214,936 164,331
Excess (Deficiency) of Revenues Over Expenditures (109,267) (109,267) 122,281 231,548
Net Changes In Fund Balances (109,267) (109,267) 122,281 231,548
Fund Balances as of January 1 1,468,139 1,441,642 1,441,642 -
Fund Balances as of December 31 1,358,872$ 1,332,375$ 1,563,923$ 231,548$
Auditor - M & OSchedule of Revenues, Expenditures, and
Changes in Fund Balance - Budget (GAAP Basis) and ActualFor The Year Ended December 31, 2019
Thurston County, Washington 2019
159

Variance withOriginal Final Final Budget
2019 2019 Actual Positive orBudget Budget 2019 (Negative)
Revenues: Miscellaneous Revenue -$ -$ 387$ 387$
Total Revenues - - 387 387
Excess (Deficiency) of Revenues Over Expenditures - - 387 387
Net Changes In Fund Balances - - 387 387
Fund Balances as of January 1 19,033 12,449 12,308 (141)
Fund Balances as of December 31 19,033$ 12,449$ 12,695$ 246$
Basin Planning & Enhancement ProjectsSchedule of Revenues, Expenditures, and
Changes in Fund Balance - Budget (GAAP Basis) and ActualFor The Year Ended December 31, 2019
Thurston County, Washington 2019
160

Variance withOriginal Final Final Budget
2019 2019 Actual Positive orBudget Budget 2019 (Negative)
Revenues: Intergovernmental 5,000$ 5,000$ 22,208$ 17,208$ Fines & Forfeits 219,559 219,559 177,519 (42,040) Miscellaneous Revenue 500 500 1,615 1,115
Total Revenues 225,059 225,059 201,342 (23,717)
Expenditures:Current: Public Safety 223,891 223,891 218,286 5,605
Total Expenditures 223,891 223,891 218,286 5,605
Excess (Deficiency) of Revenues Over Expenditures 1,168 1,168 (16,944) (18,112)
Other Financing Sources (Uses) Transfers In 250 250 250 -
Total Other Financing Sources (Uses) 250 250 250 -
Net Changes In Fund Balances 1,418 1,418 (16,694) (18,112)
Fund Balances as of January 1 45,378 59,158 58,704 (454)
Fund Balances as of December 31 46,796$ 60,576$ 42,010$ (18,566)$
Schedule of Revenues, Expenditures, andClerk's LFO Collections
Changes in Fund Balance - Budget (GAAP Basis) and ActualFor The Year Ended December 31, 2019
Thurston County, Washington 2019
161
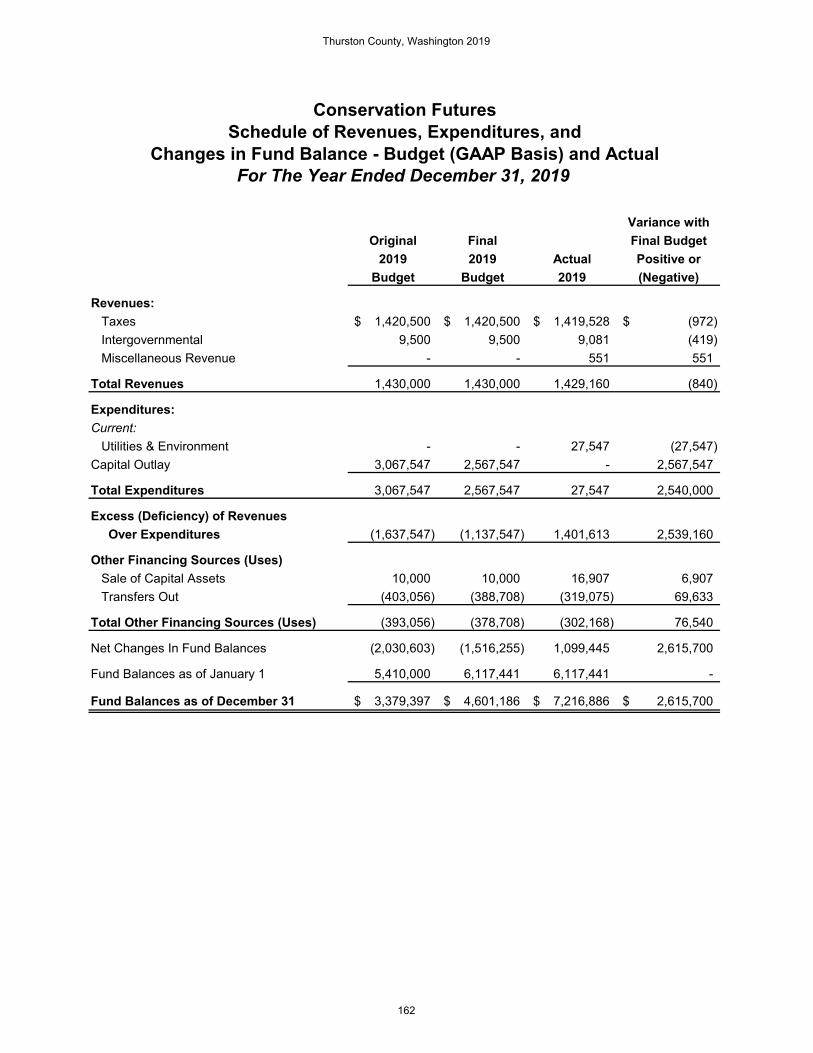
Variance withOriginal Final Final Budget
2019 2019 Actual Positive orBudget Budget 2019 (Negative)
Revenues: Taxes 1,420,500$ 1,420,500$ 1,419,528$ (972)$ Intergovernmental 9,500 9,500 9,081 (419) Miscellaneous Revenue - - 551 551
Total Revenues 1,430,000 1,430,000 1,429,160 (840)
Expenditures:Current: Utilities & Environment - - 27,547 (27,547) Capital Outlay 3,067,547 2,567,547 - 2,567,547
Total Expenditures 3,067,547 2,567,547 27,547 2,540,000
Excess (Deficiency) of Revenues Over Expenditures (1,637,547) (1,137,547) 1,401,613 2,539,160
Other Financing Sources (Uses) Sale of Capital Assets 10,000 10,000 16,907 6,907 Transfers Out (403,056) (388,708) (319,075) 69,633
Total Other Financing Sources (Uses) (393,056) (378,708) (302,168) 76,540
Net Changes In Fund Balances (2,030,603) (1,516,255) 1,099,445 2,615,700
Fund Balances as of January 1 5,410,000 6,117,441 6,117,441 -
Fund Balances as of December 31 3,379,397$ 4,601,186$ 7,216,886$ 2,615,700$
Conservation FuturesSchedule of Revenues, Expenditures, and
Changes in Fund Balance - Budget (GAAP Basis) and ActualFor The Year Ended December 31, 2019
Thurston County, Washington 2019
162
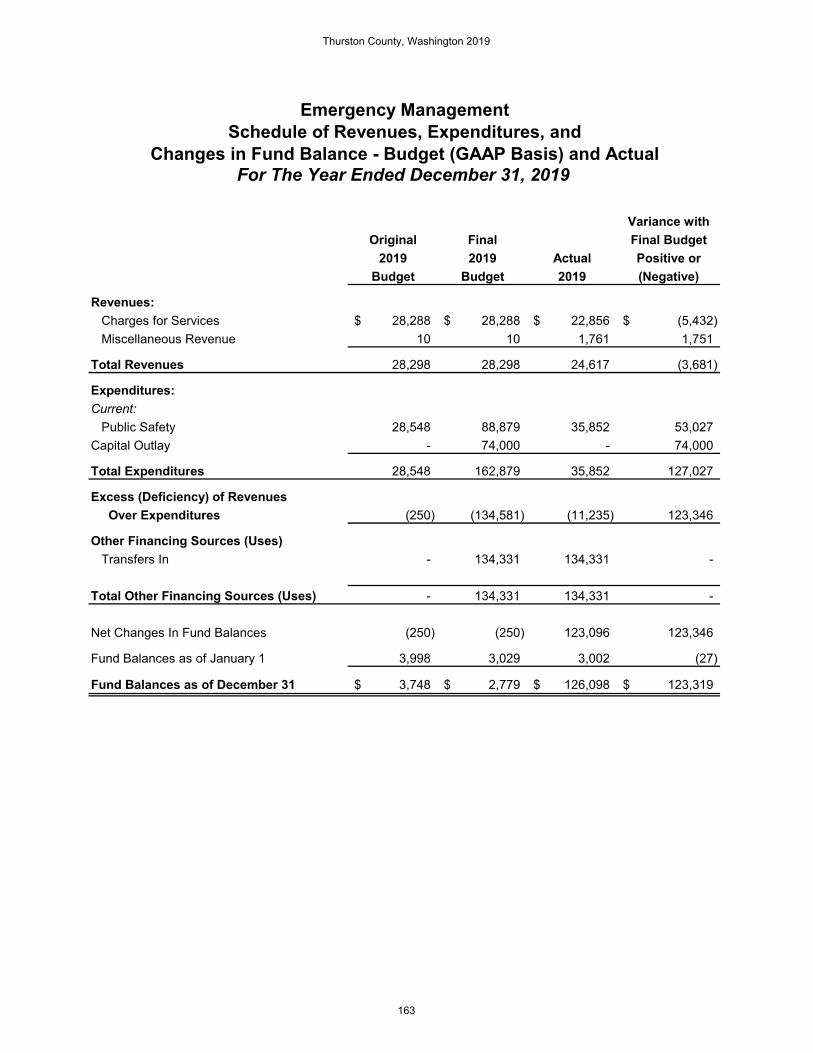
Variance withOriginal Final Final Budget
2019 2019 Actual Positive orBudget Budget 2019 (Negative)
Revenues: Charges for Services 28,288$ 28,288$ 22,856$ (5,432)$ Miscellaneous Revenue 10 10 1,761 1,751
Total Revenues 28,298 28,298 24,617 (3,681)
Expenditures:Current: Public Safety 28,548 88,879 35,852 53,027 Capital Outlay - 74,000 - 74,000
Total Expenditures 28,548 162,879 35,852 127,027
Excess (Deficiency) of Revenues Over Expenditures (250) (134,581) (11,235) 123,346
Other Financing Sources (Uses) Transfers In - 134,331 134,331 -
Total Other Financing Sources (Uses) - 134,331 134,331 -
Net Changes In Fund Balances (250) (250) 123,096 123,346
Fund Balances as of January 1 3,998 3,029 3,002 (27)
Fund Balances as of December 31 3,748$ 2,779$ 126,098$ 123,319$
Emergency ManagementSchedule of Revenues, Expenditures, and
Changes in Fund Balance - Budget (GAAP Basis) and ActualFor The Year Ended December 31, 2019
Thurston County, Washington 2019
163
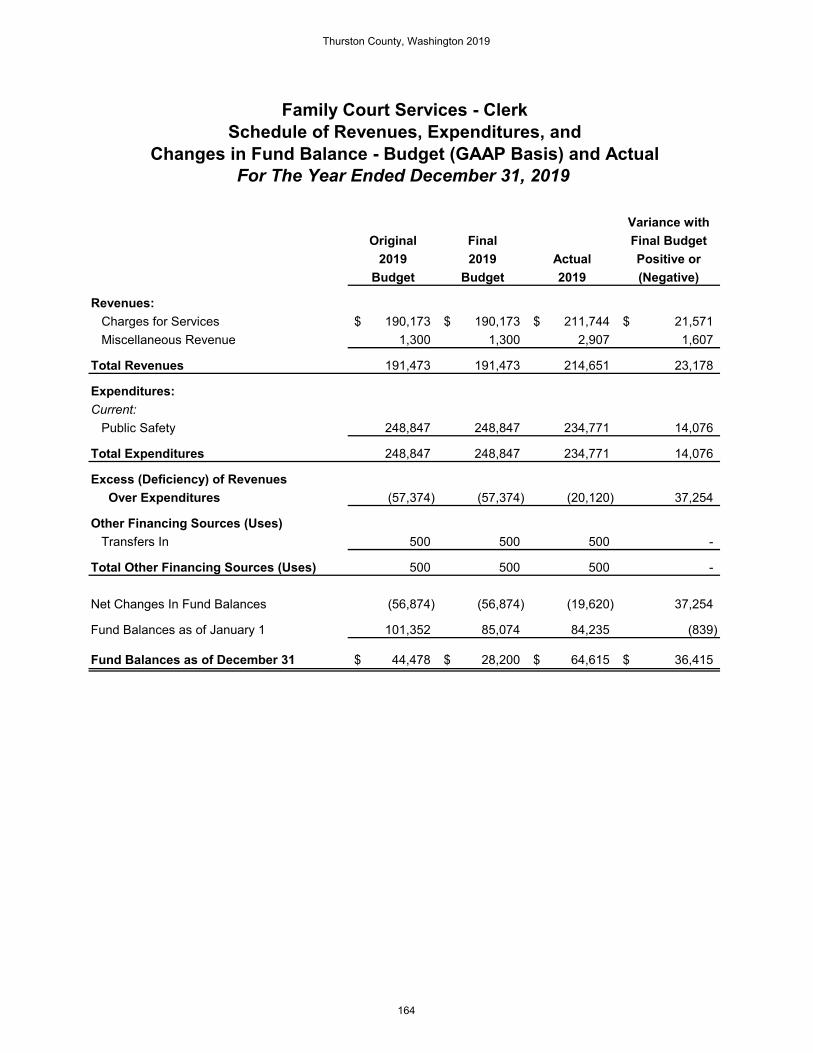
Variance withOriginal Final Final Budget
2019 2019 Actual Positive orBudget Budget 2019 (Negative)
Revenues: Charges for Services 190,173$ 190,173$ 211,744$ 21,571$ Miscellaneous Revenue 1,300 1,300 2,907 1,607
Total Revenues 191,473 191,473 214,651 23,178
Expenditures:Current: Public Safety 248,847 248,847 234,771 14,076
Total Expenditures 248,847 248,847 234,771 14,076
Excess (Deficiency) of Revenues Over Expenditures (57,374) (57,374) (20,120) 37,254
Other Financing Sources (Uses) Transfers In 500 500 500 -
Total Other Financing Sources (Uses) 500 500 500 -
Net Changes In Fund Balances (56,874) (56,874) (19,620) 37,254
Fund Balances as of January 1 101,352 85,074 84,235 (839)
Fund Balances as of December 31 44,478$ 28,200$ 64,615$ 36,415$
Schedule of Revenues, Expenditures, andFamily Court Services - Clerk
Changes in Fund Balance - Budget (GAAP Basis) and ActualFor The Year Ended December 31, 2019
Thurston County, Washington 2019
164
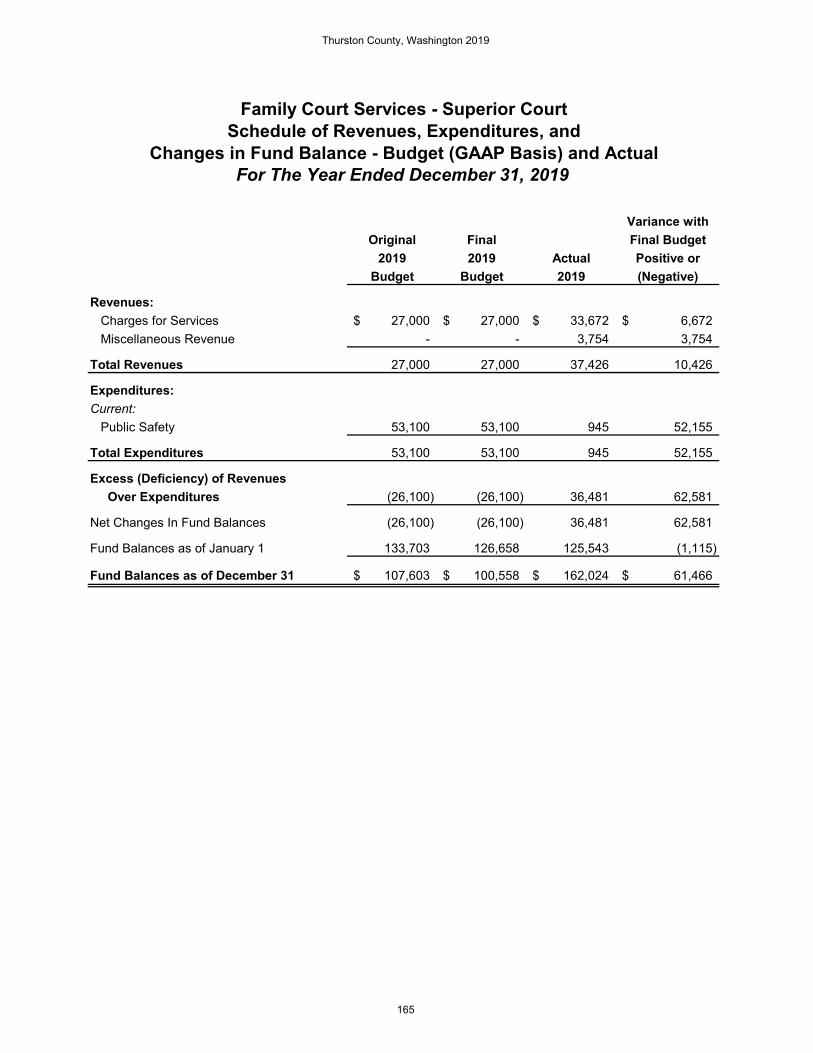
Variance withOriginal Final Final Budget
2019 2019 Actual Positive orBudget Budget 2019 (Negative)
Revenues: Charges for Services 27,000$ 27,000$ 33,672$ 6,672$ Miscellaneous Revenue - - 3,754 3,754
Total Revenues 27,000 27,000 37,426 10,426
Expenditures:Current: Public Safety 53,100 53,100 945 52,155
Total Expenditures 53,100 53,100 945 52,155
Excess (Deficiency) of Revenues Over Expenditures (26,100) (26,100) 36,481 62,581
Net Changes In Fund Balances (26,100) (26,100) 36,481 62,581
Fund Balances as of January 1 133,703 126,658 125,543 (1,115)
Fund Balances as of December 31 107,603$ 100,558$ 162,024$ 61,466$
Family Court Services - Superior CourtSchedule of Revenues, Expenditures, and
Changes in Fund Balance - Budget (GAAP Basis) and ActualFor The Year Ended December 31, 2019
Thurston County, Washington 2019
165

Variance withOriginal Final Final Budget
2019 2019 Actual Positive orBudget Budget 2019 (Negative)
Revenues: Taxes -$ -$ 35,595$ 35,595$ Intergovernmental 5,732,915 5,732,915 4,965,830 (767,085) Charges for Services 2,413,000 2,413,000 3,093,214 680,214 Miscellaneous Revenue 20,000 20,000 89,412 69,412
Total Revenues 8,165,915 8,165,915 8,184,051 18,136
Expenditures:Current: Economic Environment 8,290,105 8,290,105 7,380,340 909,765
Total Expenditures 8,290,105 8,290,105 7,380,340 909,765
Excess (Deficiency) of Revenues Over Expenditures (124,190) (124,190) 803,711 927,901
Other Financing Sources (Uses) Transfers In 154,782 154,782 129,782 (25,000) Transfers Out (52,503) (52,503) (52,503) -
Total Other Financing Sources (Uses) 102,279 102,279 77,279 (25,000)
Net Changes In Fund Balances (21,911) (21,911) 880,990 902,901
Fund Balances as of January 1 3,219,090 2,707,136 2,681,195 (25,941)
Fund Balances as of December 31 3,197,179$ 2,685,225$ 3,562,185$ 876,960$
Housing & Community RenewalSchedule of Revenues, Expenditures, and
Changes in Fund Balance - Budget (GAAP Basis) and ActualFor The Year Ended December 31, 2019
Thurston County, Washington 2019
166

Variance withOriginal Final Final Budget
2019 2019 Actual Positive orBudget Budget 2019 (Negative)
Revenues: Intergovernmental 82,387$ 165,956$ 134,308$ (31,648)$ Fines & Forfeits 80,000 80,000 47,542 (32,458) Miscellaneous Revenue 5,000 5,000 279,306 274,306
Total Revenues 167,387 250,956 461,156 210,200
Expenditures:Current: General Government - 133,345 - 133,345 Public Safety 572,480 480,085 394,617 85,468 Capital Outlay - - 7,029 (7,029) Debt Service: Principal 462 462 1,905 (1,443) Interest & Fiscal Charges - - 288 (288)
Total Expenditures 572,942 613,892 403,839 210,053
Excess (Deficiency) of Revenues Over Expenditures (405,555) (362,936) 57,317 420,253
Other Financing Sources (Uses) Sale of Capital Assets 290,000 290,000 - (290,000)
Total Other Financing Sources (Uses) 290,000 290,000 - (290,000)
Net Changes In Fund Balances (115,555) (72,936) 57,317 130,253
Fund Balances as of January 1 508,745 403,458 422,381 18,923
Fund Balances as of December 31 393,190$ 330,522$ 479,698$ 149,176$
Schedule of Revenues, Expenditures, andInterlocal Drug Enforcement
Changes in Fund Balance - Budget (GAAP Basis) and ActualFor The Year Ended December 31, 2019
Thurston County, Washington 2019
167

Variance withOriginal Final Final Budget
2019 2019 Actual Positive orBudget Budget 2019 (Negative)
Revenues: Fines & Forfeits 300$ 300$ 180$ (120)$ Miscellaneous Revenue 102,754 102,754 107,007 4,253
Total Revenues 103,054 103,054 107,187 4,133
Expenditures:Current: Utilities & Environment 92,551 92,551 55,197 37,354
Total Expenditures 92,551 92,551 55,197 37,354
Excess (Deficiency) of Revenues Over Expenditures 10,503 10,503 51,990 41,487
Net Changes In Fund Balances 10,503 10,503 51,990 41,487
Fund Balances as of January 1 85,619 91,701 90,864 (837)
Fund Balances as of December 31 96,122$ 102,204$ 142,854$ 40,650$
Lake Lawrence - L.M.D.Schedule of Revenues, Expenditures, and
Changes in Fund Balance - Budget (GAAP Basis) and ActualFor The Year Ended December 31, 2019
Thurston County, Washington 2019
168
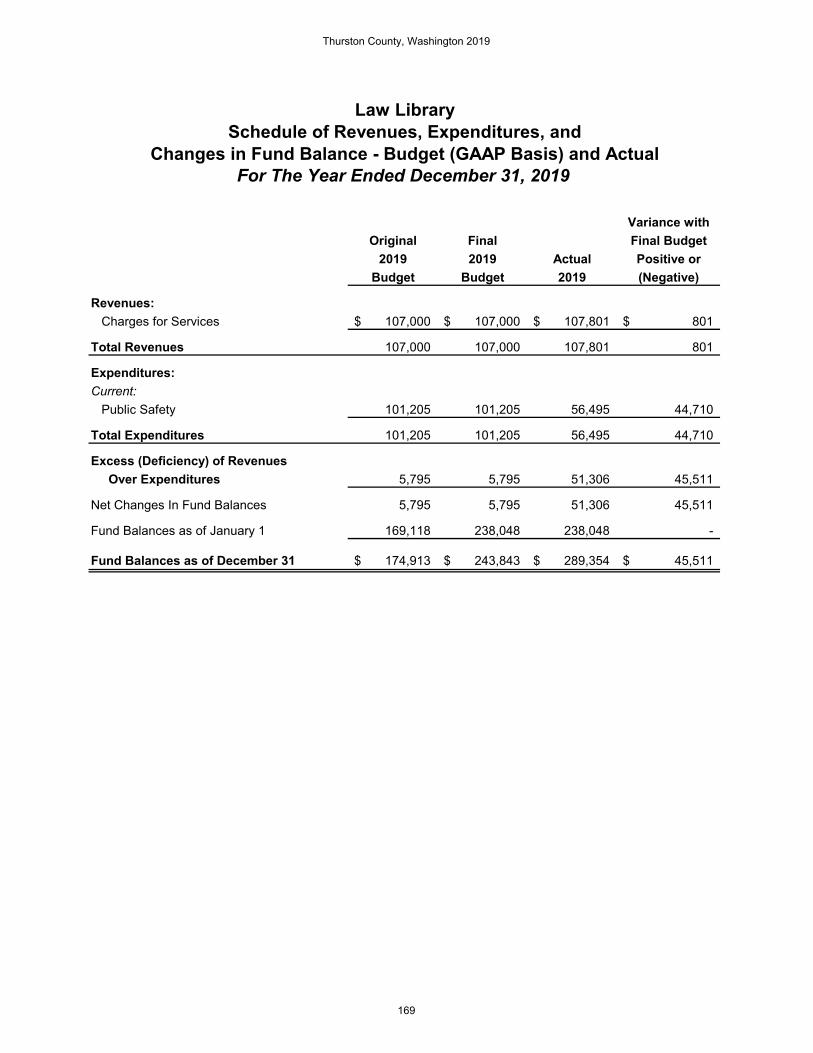
Variance withOriginal Final Final Budget
2019 2019 Actual Positive orBudget Budget 2019 (Negative)
Revenues: Charges for Services 107,000$ 107,000$ 107,801$ 801$
Total Revenues 107,000 107,000 107,801 801
Expenditures:Current: Public Safety 101,205 101,205 56,495 44,710
Total Expenditures 101,205 101,205 56,495 44,710
Excess (Deficiency) of Revenues Over Expenditures 5,795 5,795 51,306 45,511
Net Changes In Fund Balances 5,795 5,795 51,306 45,511
Fund Balances as of January 1 169,118 238,048 238,048 -
Fund Balances as of December 31 174,913$ 243,843$ 289,354$ 45,511$
Law LibrarySchedule of Revenues, Expenditures, and
Changes in Fund Balance - Budget (GAAP Basis) and ActualFor The Year Ended December 31, 2019
Thurston County, Washington 2019
169

Variance withOriginal Final Final Budget
2019 2019 Actual Positive orBudget Budget 2019 (Negative)
Revenues: Charges for Services 5,934$ 5,934$ 6,101$ 167$ Fines & Forfeits 300 300 190 (110) Miscellaneous Revenue 184,392 184,392 207,219 22,827
Total Revenues 190,626 190,626 213,510 22,884
Expenditures:Current: Utilities & Environment 173,782 173,782 83,031 90,751
Total Expenditures 173,782 173,782 83,031 90,751
Excess (Deficiency) of Revenues Over Expenditures 16,844 16,844 130,479 113,635
Net Changes In Fund Balances 16,844 16,844 130,479 113,635
Fund Balances as of January 1 304,708 323,534 320,590 (2,944)
Fund Balances as of December 31 321,552$ 340,378$ 451,069$ 110,691$
Schedule of Revenues, Expenditures, andLong Lake - L.M.D.
Changes in Fund Balance - Budget (GAAP Basis) and ActualFor The Year Ended December 31, 2019
Thurston County, Washington 2019
170

Variance withOriginal Final Final Budget
2019 2019 Actual Positive orBudget Budget 2019 (Negative)
Revenues: Intergovernmental 61,573$ 41,824$ 34,216$ (7,608)$ Charges for Services 4,000 4,000 455 (3,545) Miscellaneous Revenue 523,429 523,429 543,209 19,780
Total Revenues 589,002 569,253 577,880 8,627
Expenditures:Current: Utilities & Environment 677,696 677,683 543,634 134,049
Total Expenditures 677,696 677,683 543,634 134,049
Excess (Deficiency) of Revenues Over Expenditures (88,694) (108,430) 34,246 142,676
Other Financing Sources (Uses) Transfers In 750 750 750 -
Total Other Financing Sources (Uses) 750 750 750 -
Net Changes In Fund Balances (87,944) (107,680) 34,996 142,676
Fund Balances as of January 1 226,127 252,114 249,787 (2,327)
Fund Balances as of December 31 138,183$ 144,434$ 284,783$ 140,349$
Noxious WeedSchedule of Revenues, Expenditures, and
Changes in Fund Balance - Budget (GAAP Basis) and ActualFor The Year Ended December 31, 2019
Thurston County, Washington 2019
171

Variance withOriginal Final Final Budget
2019 2019 Actual Positive orBudget Budget 2019 (Negative)
Revenues: Intergovernmental 61,789$ 61,789$ 67,521$ 5,732$ Miscellaneous Revenue 1,600 1,600 6,254 4,654
Total Revenues 63,389 63,389 73,775 10,386
Expenditures:Current: Public Safety 108,709 108,709 66,809 41,900 Capital Outlay - - 5,519 (5,519)
Total Expenditures 108,709 108,709 72,328 36,381
Excess (Deficiency) of Revenues Over Expenditures (45,320) (45,320) 1,447 46,767
Net Changes In Fund Balances (45,320) (45,320) 1,447 46,767
Fund Balances as of January 1 204,227 193,397 191,644 (1,753)
Fund Balances as of December 31 158,907$ 148,077$ 193,091$ 45,014$
Sheriff's Special ProgramsSchedule of Revenues, Expenditures, and
Changes in Fund Balance - Budget (GAAP Basis) and ActualFor The Year Ended December 31, 2019
Thurston County, Washington 2019
172

Variance withOriginal Final Final Budget
2019 2019 Actual Positive orBudget Budget 2019 (Negative)
Revenues: Taxes 35,000$ 35,000$ 59,383$ 24,383$ Miscellaneous Revenue 605 605 1,859 1,254
Total Revenues 35,605 35,605 61,242 25,637
Expenditures:Current: Culture & Recreation 50,378 50,378 23,378 27,000
Total Expenditures 50,378 50,378 23,378 27,000
Excess (Deficiency) of Revenues Over Expenditures (14,773) (14,773) 37,864 52,637
Other Financing Sources (Uses) Transfers Out - - (20,000) (20,000)
Total Other Financing Sources (Uses) - - (20,000) (20,000)
Net Changes In Fund Balances (14,773) (14,773) 17,864 32,637
Fund Balances as of January 1 40,000 48,869 48,426 (443) Prior Period Adjustments - - 6,626 6,626 Fund Balances as of January 1 - Restated 40,000 48,869 55,052 6,183
Fund Balances as of December 31 25,227$ 34,096$ 72,916$ 38,820$
Schedule of Revenues, Expenditures, andStadium, Convention & Arts Center
Changes in Fund Balance - Budget (GAAP Basis) and ActualFor The Year Ended December 31, 2019
Thurston County, Washington 2019
173

Variance withOriginal Final Final Budget
2019 2019 Actual Positive orBudget Budget 2019 (Negative)
Revenues: Taxes 9,018,000$ 9,018,000$ 9,329,814$ 311,814$ Miscellaneous Revenue 900 900 5,117 4,217
Total Revenues 9,018,900 9,018,900 9,334,931 316,031
Expenditures:Current: Health & Human Services 9,018,900 9,018,900 9,018,900 -
Total Expenditures 9,018,900 9,018,900 9,018,900 -
Excess (Deficiency) of Revenues Over Expenditures - - 316,031 316,031
Net Changes In Fund Balances - - 316,031 316,031
Fund Balances as of January 1 - 1,529,578 1,529,578 - Prior Period Adjustments - - 817 817 Fund Balances as of January 1 - Restated - 1,529,578 1,530,395 817
Fund Balances as of December 31 -$ 1,529,578$ 1,846,426$ 316,848$
TCOMM 911 Excise TaxSchedule of Revenues, Expenditures, and
Changes in Fund Balance - Budget (GAAP Basis) and ActualFor The Year Ended December 31, 2019
Thurston County, Washington 2019
174
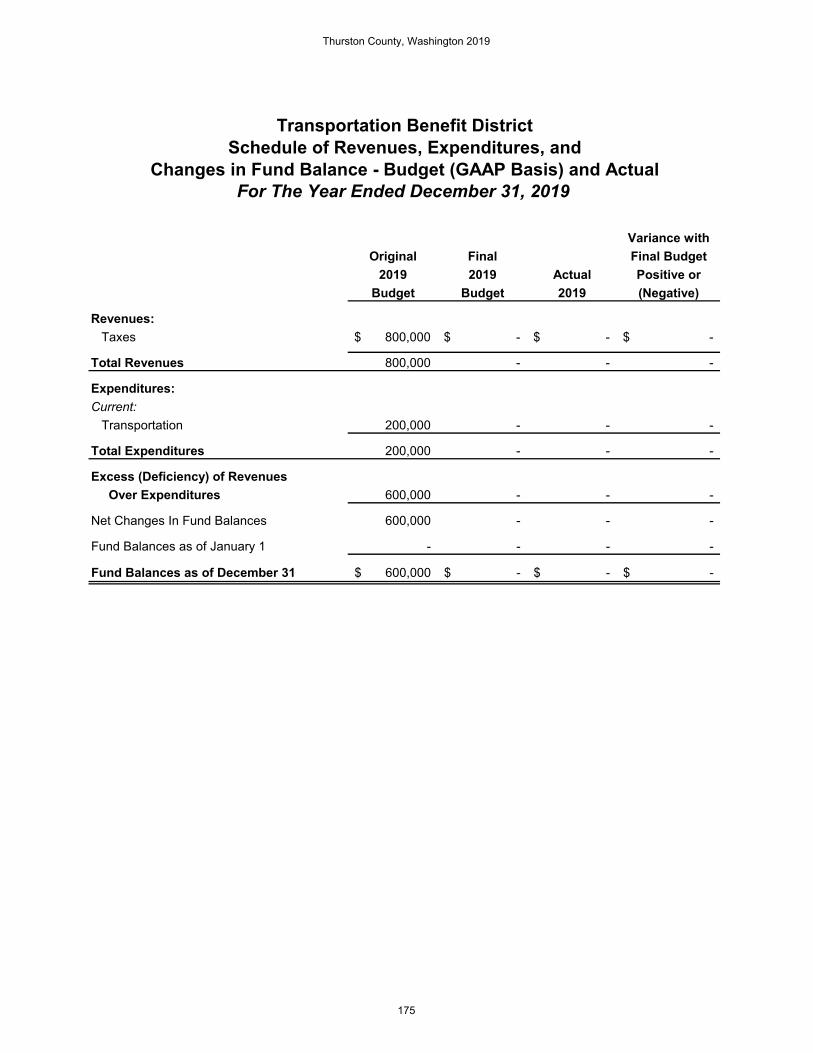
Variance withOriginal Final Final Budget
2019 2019 Actual Positive orBudget Budget 2019 (Negative)
Revenues: Taxes 800,000$ -$ -$ -$
Total Revenues 800,000 - - -
Expenditures:Current: Transportation 200,000 - - -
Total Expenditures 200,000 - - -
Excess (Deficiency) of Revenues Over Expenditures 600,000 - - -
Net Changes In Fund Balances 600,000 - - -
Fund Balances as of January 1 - - - -
Fund Balances as of December 31 600,000$ -$ -$ -$
Transportation Benefit DistrictSchedule of Revenues, Expenditures, and
Changes in Fund Balance - Budget (GAAP Basis) and ActualFor The Year Ended December 31, 2019
Thurston County, Washington 2019
175

Variance withOriginal Final Final Budget
2019 2019 Actual Positive orBudget Budget 2019 (Negative)
Revenues: Charges for Services 942,000$ 942,000$ 967,239$ 25,239$ Miscellaneous Revenue - - 1,563 1,563
Total Revenues 942,000 942,000 968,802 26,802
Expenditures:Current: Culture & Recreation 942,000 942,000 942,000 -
Total Expenditures 942,000 942,000 942,000 -
Excess (Deficiency) of Revenues Over Expenditures - - 26,802 26,802 Net Changes In Fund Balances - - 26,802 26,802
Fund Balances as of January 1 - - - - Prior Period Adjustments - - 120,100 120,100 Fund Balances as of January 1 - Restated - - 120,100 120,100
Fund Balances as of December 31 -$ -$ 146,902$ 146,902$
Tourism PromotionSchedule of Revenues, Expenditures, and
Changes in Fund Balance - Budget (GAAP Basis) and ActualFor The Year Ended December 31, 2019
Thurston County, Washington 2019
176

Variance withOriginal Final Final Budget
2019 2019 Actual Positive orBudget Budget 2019 (Negative)
Revenues: Taxes 6,199,000$ 6,199,000$ 6,405,703$ 206,703$ Charges for Services - - 4,520 4,520 Total Revenues 6,199,000 6,199,000 6,410,223 211,223
Expenditures:Current: Economic Environment 50,723 50,723 29,997 20,726 Health & Human Services 2,804,202 2,811,334 2,743,600 67,734 Public Safety 3,771,516 4,148,606 3,633,983 514,623 Debt Service: Principal 241 241 - 241 Interest & Fiscal Charges 241 241 - 241
Total Expenditures 6,626,923 7,011,145 6,407,580 603,565
Excess (Deficiency) of Revenues Over Expenditures (427,923) (812,145) 2,643 814,788
Other Financing Sources (Uses) Transfers Out (76,630) (76,630) (2,855) 73,775
Total Other Financing Sources (Uses) (76,630) (76,630) (2,855) 73,775
Net Changes In Fund Balances (504,553) (888,775) (212) 888,563
Fund Balances as of January 1 4,278,000 5,619,271 5,619,271 -
Fund Balances as of December 31 3,773,447$ 4,730,496$ 5,619,059$ 888,563$
Treatment Sales TaxSchedule of Revenues, Expenditures, and
Changes in Fund Balance - Budget (GAAP Basis) and ActualFor The Year Ended December 31, 2019
Thurston County, Washington 2019
177
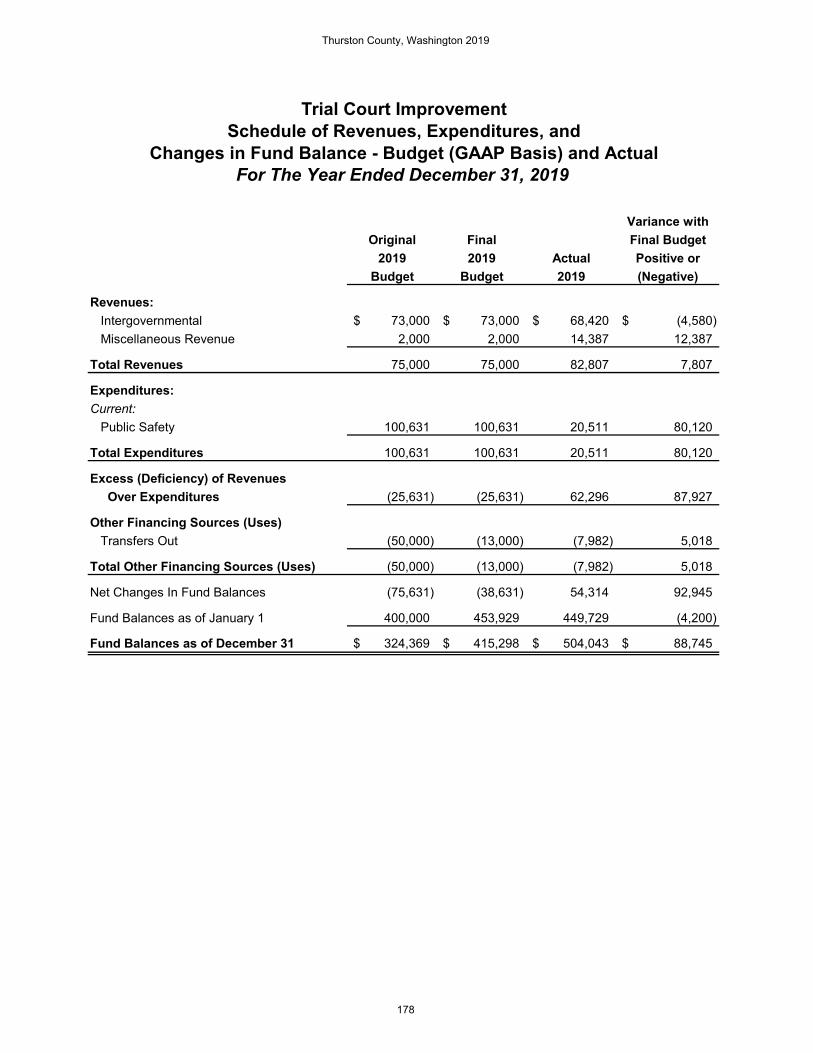
Variance withOriginal Final Final Budget
2019 2019 Actual Positive orBudget Budget 2019 (Negative)
Revenues: Intergovernmental 73,000$ 73,000$ 68,420$ (4,580)$ Miscellaneous Revenue 2,000 2,000 14,387 12,387
Total Revenues 75,000 75,000 82,807 7,807
Expenditures:Current: Public Safety 100,631 100,631 20,511 80,120
Total Expenditures 100,631 100,631 20,511 80,120
Excess (Deficiency) of Revenues Over Expenditures (25,631) (25,631) 62,296 87,927
Other Financing Sources (Uses) Transfers Out (50,000) (13,000) (7,982) 5,018
Total Other Financing Sources (Uses) (50,000) (13,000) (7,982) 5,018
Net Changes In Fund Balances (75,631) (38,631) 54,314 92,945
Fund Balances as of January 1 400,000 453,929 449,729 (4,200)
Fund Balances as of December 31 324,369$ 415,298$ 504,043$ 88,745$
Changes in Fund Balance - Budget (GAAP Basis) and ActualFor The Year Ended December 31, 2019
Schedule of Revenues, Expenditures, andTrial Court Improvement
Thurston County, Washington 2019
178

Variance withOriginal Final Final Budget
2019 2019 Actual Positive orBudget Budget 2019 (Negative)
Revenues: Taxes 402,100$ 402,100$ 398,308$ (3,792)$ Intergovernmental 2,360 2,360 2,550 190 Miscellaneous Revenue 1,375 1,375 15,265 13,890
Total Revenues 405,835 405,835 416,123 10,288
Expenditures:Current: Economic Environment 335,027 335,027 237,337 97,690
Total Expenditures 335,027 335,027 237,337 97,690
Excess (Deficiency) of Revenues Over Expenditures 70,808 70,808 178,786 107,978
Other Financing Sources (Uses) Sale of Capital Assets 1,500 1,500 4,747 3,247 Transfers In 250 250 250 - Transfers Out (14,375) (14,375) (11,520) 2,855
Total Other Financing Sources (Uses) (12,625) (12,625) (6,523) 6,102
Net Changes In Fund Balances 58,183 58,183 172,263 114,080
Fund Balances as of January 1 327,749 419,158 415,288 (3,870)
Fund Balances as of December 31 385,932$ 477,341$ 587,551$ 110,210$
VeteransSchedule of Revenues, Expenditures, and
Changes in Fund Balance - Budget (GAAP Basis) and ActualFor The Year Ended December 31, 2019
Thurston County, Washington 2019
179

Variance withOriginal Final Final Budget
2019 2019 Actual Positive orBudget Budget 2019 (Negative)
Revenues: Intergovernmental 402,205$ 430,846$ 410,255$ (20,591)$ Charges for Services 175,000 275,000 371,961 96,961 Fines & Forfeits 12,000 12,000 9,759 (2,241) Miscellaneous Revenue 400 10,400 23,930 13,530
Total Revenues 589,605 728,246 815,905 87,659
Expenditures:Current: Public Safety 634,740 753,378 629,045 124,333
Total Expenditures 634,740 753,378 629,045 124,333
Excess (Deficiency) of Revenues Over Expenditures (45,135) (25,132) 186,860 211,992
Other Financing Sources (Uses) Transfers In 1,250 1,250 1,250 -
Total Other Financing Sources (Uses) 1,250 1,250 1,250 -
Net Changes In Fund Balances (43,885) (23,882) 188,110 211,992
Fund Balances as of January 1 66,909 134,361 133,961 (400)
Fund Balances as of December 31 23,024$ 110,479$ 322,071$ 211,592$
Victim Advocate ProgramSchedule of Revenues, Expenditures, and
Changes in Fund Balance - Budget (GAAP Basis) and ActualFor The Year Ended December 31, 2019
Thurston County, Washington 2019
180
NONMAJOR DEBT SERVICE FUNDS Debt service funds are established to account for the accumulation of resources for the payment of current principal and interest on general obligation debt. All general obligation debt issues are funded by local option sales taxes and/or real estate excise taxes. G. O. Bonds - 2010 – A fund that accounts for current annual principal and interest payments on general obligation bonds issued in 2010 for a partial advance refunding of 1999 and 2002 bonds and for taxable Build America and energy conservation bonds for the Tilley Road project and other communication system and building improvements. G. O. Bonds - 2015 – A fund that accounts for bonds issued to refund the 2004 limited general obligation bonds and the partial refunding of the 2005 limited general obligation bonds. These bonds fund construction of additional office space, land acquisition for the justice center, parks and park acquisition, repairs to the juvenile detention facility, acquisition of a phone system for the courthouse complex, and other capital improvements. G. O. Bonds - 2016 – A fund that accounts for bonds issued to partially refund the 2007 and 2009 limited general obligation bonds. These bonds fund an Accountability Restitution Center (second jail), remodeling a fish processing warehouse into office space, communication system upgrades, and other approved capital projects. 2010C Debt Sinking Fund – A fund that uses transfers from the General and Roads Funds to fund Qualified Energy Conservation Bonds issued in 2010 for building and energy efficiency modifications at Tilley and for other County buildings.
Thurston County, Washington 2019
181
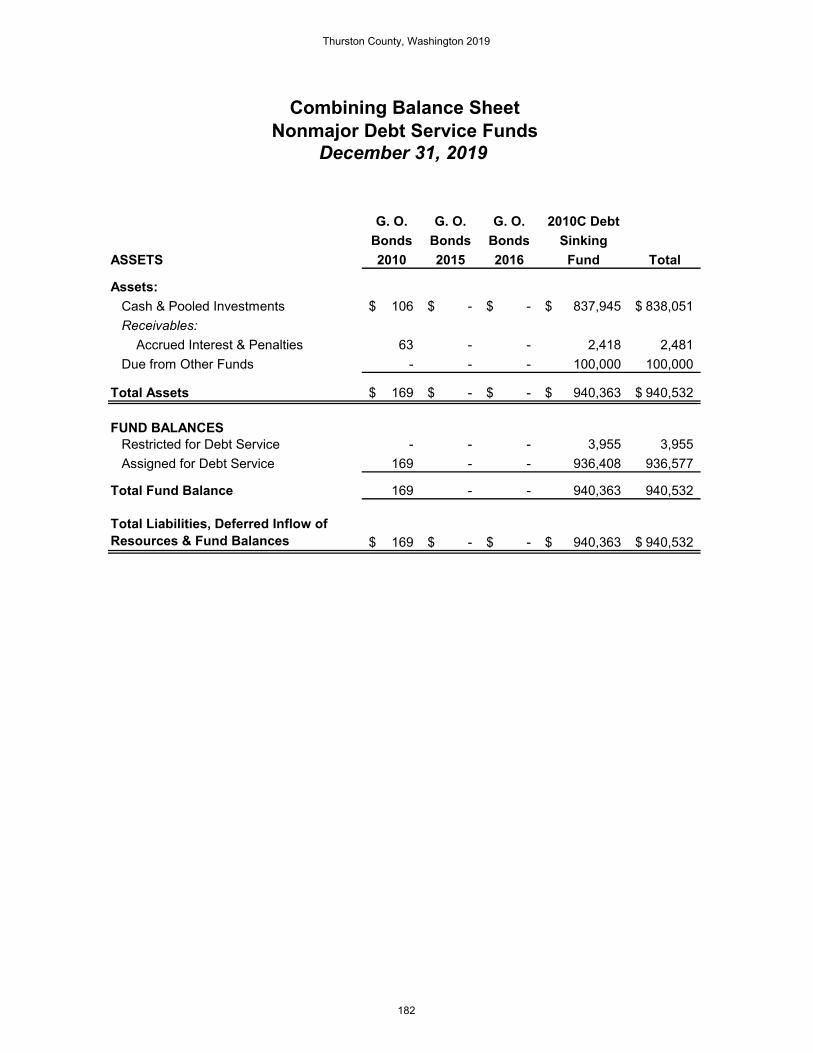
Combining Balance SheetNonmajor Debt Service Funds
December 31, 2019
G. O. G. O. G. O. 2010C DebtBonds Bonds Bonds Sinking
ASSETS 2010 2015 2016 Fund Total
Assets: Cash & Pooled Investments 106$ -$ -$ 837,945$ 838,051$ Receivables: Accrued Interest & Penalties 63 - - 2,418 2,481 Due from Other Funds - - - 100,000 100,000
Total Assets 169$ -$ -$ 940,363$ 940,532$
FUND BALANCES Restricted for Debt Service - - - 3,955 3,955 Assigned for Debt Service 169 - - 936,408 936,577
Total Fund Balance 169 - - 940,363 940,532
Total Liabilities, Deferred Inflow of Resources & Fund Balances 169$ -$ -$ 940,363$ 940,532$
Thurston County, Washington 2019
182
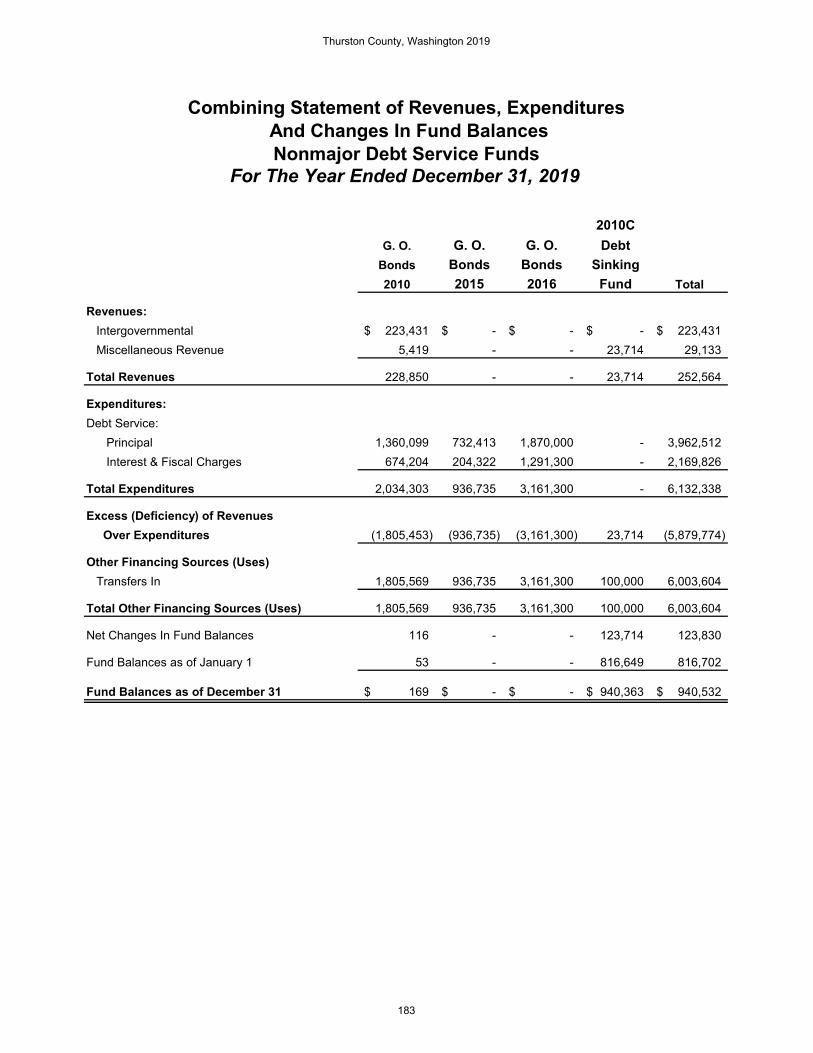
Combining Statement of Revenues, Expenditures And Changes In Fund BalancesNonmajor Debt Service Funds
For The Year Ended December 31, 2019
2010CG. O. G. O. G. O. Debt
Bonds Bonds Bonds Sinking2010 2015 2016 Fund Total
Revenues: Intergovernmental 223,431$ -$ -$ -$ 223,431$ Miscellaneous Revenue 5,419 - - 23,714 29,133
Total Revenues 228,850 - - 23,714 252,564
Expenditures:Debt Service: Principal 1,360,099 732,413 1,870,000 - 3,962,512 Interest & Fiscal Charges 674,204 204,322 1,291,300 - 2,169,826
Total Expenditures 2,034,303 936,735 3,161,300 - 6,132,338
Excess (Deficiency) of Revenues Over Expenditures (1,805,453) (936,735) (3,161,300) 23,714 (5,879,774)
Other Financing Sources (Uses) Transfers In 1,805,569 936,735 3,161,300 100,000 6,003,604
Total Other Financing Sources (Uses) 1,805,569 936,735 3,161,300 100,000 6,003,604
Net Changes In Fund Balances 116 - - 123,714 123,830
Fund Balances as of January 1 53 - - 816,649 816,702
Fund Balances as of December 31 169$ -$ -$ 940,363$ 940,532$
Thurston County, Washington 2019
183
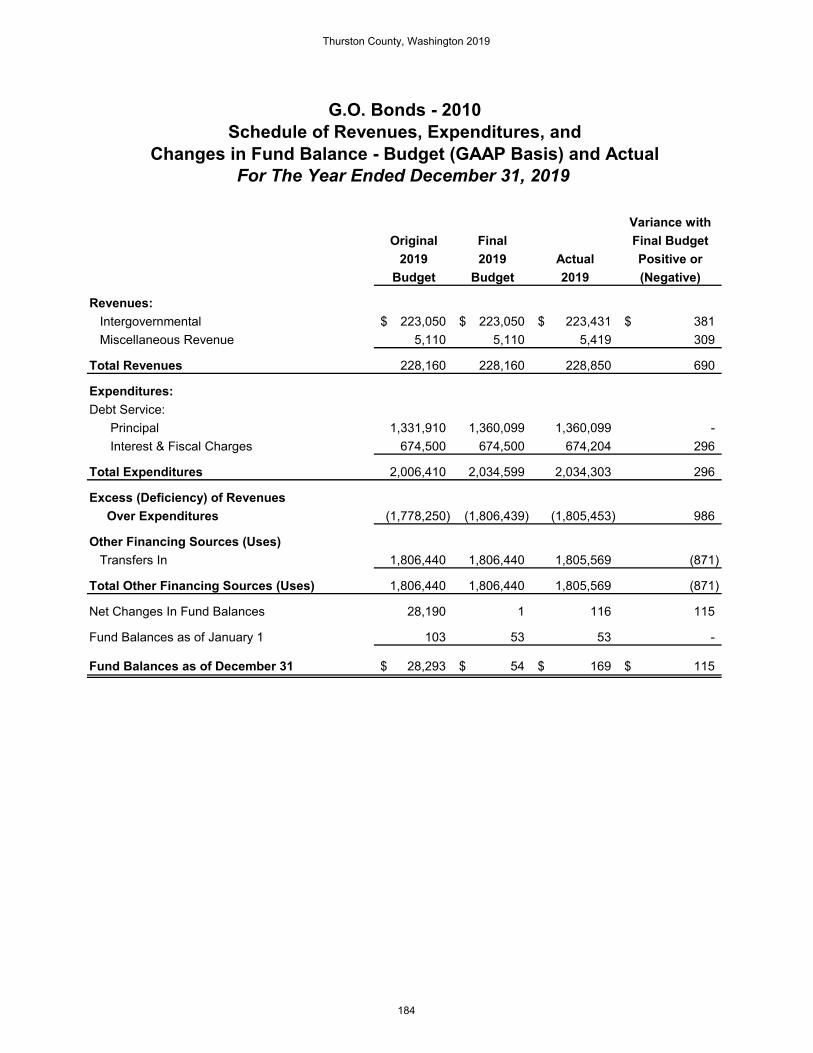
Variance withOriginal Final Final Budget
2019 2019 Actual Positive orBudget Budget 2019 (Negative)
Revenues: Intergovernmental 223,050$ 223,050$ 223,431$ 381$ Miscellaneous Revenue 5,110 5,110 5,419 309
Total Revenues 228,160 228,160 228,850 690
Expenditures:Debt Service: Principal 1,331,910 1,360,099 1,360,099 - Interest & Fiscal Charges 674,500 674,500 674,204 296
Total Expenditures 2,006,410 2,034,599 2,034,303 296
Excess (Deficiency) of Revenues Over Expenditures (1,778,250) (1,806,439) (1,805,453) 986
Other Financing Sources (Uses) Transfers In 1,806,440 1,806,440 1,805,569 (871)
Total Other Financing Sources (Uses) 1,806,440 1,806,440 1,805,569 (871)
Net Changes In Fund Balances 28,190 1 116 115
Fund Balances as of January 1 103 53 53 -
Fund Balances as of December 31 28,293$ 54$ 169$ 115$
G.O. Bonds - 2010
Changes in Fund Balance - Budget (GAAP Basis) and ActualFor The Year Ended December 31, 2019
Schedule of Revenues, Expenditures, and
Thurston County, Washington 2019
184

Variance withOriginal Final Final Budget
2019 2019 Actual Positive orBudget Budget 2019 (Negative)
Expenditures:Debt Service: Principal 732,450$ 732,450$ 732,413$ 37$ Interest & Fiscal Charges 204,350 204,350 204,322 28
Total Expenditures 936,800 936,800 936,735 65
Excess (Deficiency) of Revenues Over Expenditures (936,800) (936,800) (936,735) 65
Other Financing Sources (Uses) Transfers In 936,800 936,800 936,735 (65)
Total Other Financing Sources (Uses) 936,800 936,800 936,735 (65)
Net Changes In Fund Balances - - - -
Fund Balances as of January 1 - - - -
Fund Balances as of December 31 -$ -$ -$ -$
G.O. Bonds - 2015Schedule of Revenues, Expenditures, and
Changes in Fund Balance - Budget (GAAP Basis) and ActualFor The Year Ended December 31, 2019
Thurston County, Washington 2019
185

Variance withOriginal Final Final Budget
2019 2019 Actual Positive orBudget Budget 2019 (Negative)
Expenditures:Debt Service: Principal 1,870,000$ 1,870,000$ 1,870,000$ -$ Interest & Fiscal Charges 1,291,300 1,291,300 1,291,300 -
Total Expenditures 3,161,300 3,161,300 3,161,300 -
Excess (Deficiency) of Revenues Over Expenditures (3,161,300) (3,161,300) (3,161,300) -
Other Financing Sources (Uses) Transfers In 3,161,500 3,161,500 3,161,300 (200)
Total Other Financing Sources (Uses) 3,161,500 3,161,500 3,161,300 (200)
Net Changes In Fund Balances 200 200 - (200)
Fund Balances as of January 1 - - - -
Fund Balances as of December 31 200$ 200$ -$ (200)$
G.O. Bonds - 2016Schedule of Revenues, Expenditures, and
Changes in Fund Balance - Budget (GAAP Basis) and ActualFor The Year Ended December 31, 2019
Thurston County, Washington 2019
186
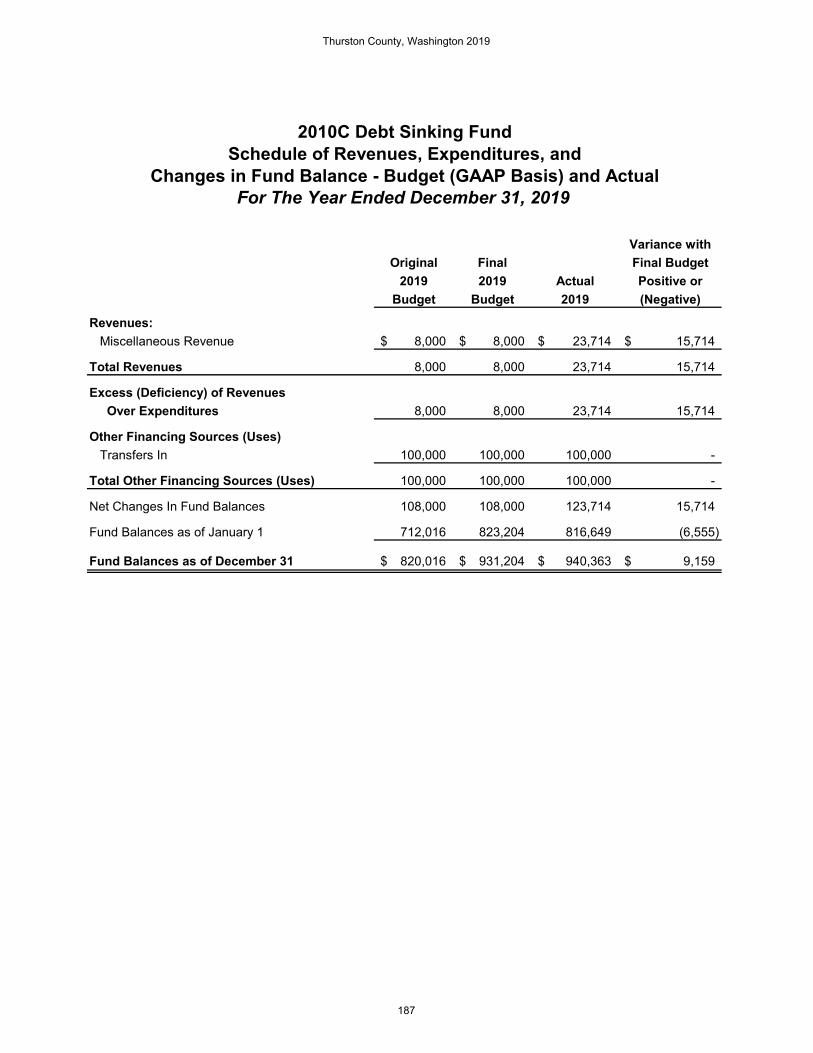
Variance withOriginal Final Final Budget
2019 2019 Actual Positive orBudget Budget 2019 (Negative)
Revenues: Miscellaneous Revenue 8,000$ 8,000$ 23,714$ 15,714$
Total Revenues 8,000 8,000 23,714 15,714
Excess (Deficiency) of Revenues Over Expenditures 8,000 8,000 23,714 15,714
Other Financing Sources (Uses) Transfers In 100,000 100,000 100,000 -
Total Other Financing Sources (Uses) 100,000 100,000 100,000 -
Net Changes In Fund Balances 108,000 108,000 123,714 15,714
Fund Balances as of January 1 712,016 823,204 816,649 (6,555)
Fund Balances as of December 31 820,016$ 931,204$ 940,363$ 9,159$
2010C Debt Sinking FundSchedule of Revenues, Expenditures, and
Changes in Fund Balance - Budget (GAAP Basis) and ActualFor The Year Ended December 31, 2019
Thurston County, Washington 2019
187

NONMAJOR CAPITAL PROJECT FUNDS Capital project funds are established to account for the accumulation of resources used to develop and construct additions and improvements to capital facilities and associated systems and equipment. Detention Facilities Sales Tax Holding – A holding fund established for local option sales taxes levied to construct, maintain, and operate adult and juvenile detention facilities. Jail Capital Projects – A fund used to accumulate the costs related to the construction of jail expansion projects. Parks Impact Fees – A holding fund that collects fees from residential building permits issued, for new developments dedicated to parks capital projects. REET Technology – A fund established to use real estate excise taxes and treasurer surcharge fees to develop and implement technology to process real estate excise tax affidavits. Transportation Impact Fees - A holding fund that collects Road Fund impact fees from building permits issued, for new developments dedicated to transportation capital projects.
Thurston County, Washington 2019
188

DetentionFacility Jail Parks
Courthouse Sales Tax Capital ImpactProject Holding Projects Fees
ASSETSAssets: Cash & Pooled Investments 211,821$ 2,697,530$ 433,406$ 2,891,668$ Receivables: Accrued Interest & Penalties 646 - 853 8,075 Customer Account Receivables - 1,151,103 - -
Total Assets 212,467$ 3,848,633$ 434,259$ 2,899,743$
LIABILITIESLiabilities: Accounts Payable -$ 137,148$ -$ -$ Due to Other Funds 1,631 6,679 302 332,565
Total Liabilities 1,631 143,827 302 332,565
FUND BALANCES Restricted for Capital Projects - 980,091 - 2,567,178 Assigned for Capital Projects 210,836 2,724,715 433,957 -
Total Fund Balance 210,836 3,704,806 433,957 2,567,178
Total Liabilities & Fund Balances 212,467$ 3,848,633$ 434,259$ 2,899,743$
Page 1 of 2
Combining Balance SheetNonmajor Capital Projects Funds
December 31, 2019
Thurston County, Washington 2019
189

TransportationREET Impact
Technology Fees TotalASSETSAssets: Cash & Pooled Investments 132,402$ 7,478,926$ 13,845,753$ Receivables: Accrued Interest & Penalties 354 21,643 31,571 Customer Account Receivables 3,334 - 1,154,437
Total Assets 136,090$ 7,500,569$ 15,031,761$
LIABILITIESLiabilities: Accounts Payable -$ -$ 137,148$ Due to Other Funds - 30,189 371,366
Total Liabilities - 30,189 508,514
FUND BALANCES Restricted for Capital Projects 4,306 7,470,380 11,021,955 Assigned for Capital Projects 131,784 - 3,501,292
Total Fund Balance 136,090 7,470,380 14,523,247
Total Liabilities & Fund Balances 136,090$ 7,500,569$ 15,031,761$
Page 2 of 2
Combining Balance SheetNonmajor Capital Projects Funds
December 31, 2019
Thurston County, Washington 2019
190

DetentionFacility Jail Parks
Courthouse Sales Tax Capital ImpactProject Holding Projects Fees
Revenues: Taxes -$ 6,406,762$ -$ -$ Intergovernmental - - - - Charges for Services - - - 585,503 Miscellaneous Revenue 5,305 - 4,987 76,805
Total Revenues 5,305 6,406,762 4,987 662,308
Expenditures:Current: General Government 194,469 - - - Culture & Recreation - - - 13,063 Public Safety - 3,078,261 2,147 - Transportation - - - - Capital Outlay - - 151,909 -
Total Expenditures 194,469 3,078,261 154,056 13,063
Excess (Deficiency) of Revenues Over Expenditures (189,164) 3,328,501 (149,069) 649,245
Other Financing Sources (Uses) Transfers In 400,000 - 500,000 - Transfers Out - (3,547,770) - (377,125)
Total Other Financing Sources (Uses) 400,000 (3,547,770) 500,000 (377,125)
Net Changes In Fund Balances 210,836 (219,269) 350,931 272,120
Fund Balances as of January 1 - 3,924,075 83,026 2,295,058 Prior Period Adjustments - - - - Fund Balances as of January 1 - Restated - 3,924,075 83,026 2,295,058
Fund Balances as of December 31 210,836$ 3,704,806$ 433,957$ 2,567,178$
For The Year Ended December 31, 2019Page 1 of 2
Combining Statement of Revenues, ExpendituresAnd Changes In Fund Balances
Nonmajor Capital Projects Funds
Thurston County, Washington 2019
191

REET TransportationTechnology Impact Fees Total
Revenues: Taxes -$ -$ 6,406,762$ Intergovernmental 21,545 - 21,545 Charges for Services 27,253 1,727,146 2,339,902 Miscellaneous Revenue 3,566 209,996 300,659
Total Revenues 52,364 1,937,142 9,068,868
Expenditures:Current: General Government 44,492 - 238,961 Culture & Recreation - - 13,063 Public Safety - - 3,080,408 Transportation - 823 823 Capital Outlay - - 151,909
Total Expenditures 44,492 823 3,485,164
Excess (Deficiency) of Revenues Over Expenditures 7,872 1,936,319 5,583,704
Other Financing Sources (Uses) Transfers In - - 900,000 Transfers Out - (728,358) (4,653,253)
Total Other Financing Sources (Uses) - (728,358) (3,753,253)
Net Changes In Fund Balances 7,872 1,207,961 1,830,451
Fund Balances as of January 1 125,255 6,262,419 12,689,833 Prior Period Adjustments 2,963 - 2,963 Fund Balances as of January 1 - Restated 128,218 6,262,419 12,692,796
Fund Balances as of December 31 136,090$ 7,470,380$ 14,523,247$
For The Year Ended December 31, 2019Page 2 of 2
Combining Statement of Revenues, ExpendituresAnd Changes In Fund Balances
Nonmajor Capital Projects Funds
Thurston County, Washington 2019
192

Variance withOriginal Final Final Budget
2019 2019 Actual Positive orBudget Budget 2019 (Negative)
Revenues: Miscellaneous Revenue -$ -$ 5,305$ 5,305$
Total Revenues - - 5,305 5,305
Expenditures:Current: General Government - - 194,469 (194,469) Capital Outlay 300,000 300,000 - 300,000
Total Expenditures 300,000 300,000 194,469 105,531
Excess (Deficiency) of Revenues Over Expenditures (300,000) (300,000) (189,164) 110,836
Other Financing Sources (Uses) Transfers In 400,000 400,000 400,000 -
Total Other Financing Sources (Uses) 400,000 400,000 400,000 -
Net Changes In Fund Balances 100,000 100,000 210,836 110,836
Fund Balances as of January 1 - - - -
Fund Balances as of December 31 100,000$ 100,000$ 210,836$ 110,836$
Courthouse ProjectSchedule of Revenues, Expenditures, and
Changes in Fund Balance - Budget (GAAP Basis) and ActualFor The Year Ended December 31, 2019
Thurston County, Washington 2019
193

Variance withOriginal Final Final Budget
2019 2019 Actual Positive orBudget Budget 2019 (Negative)
Revenues: Taxes 6,131,000$ 6,131,000$ 6,406,762$ 275,762$
Total Revenues 6,131,000 6,131,000 6,406,762 275,762
Expenditures:Current: Public Safety 3,111,412 3,111,412 3,078,261 33,151
Total Expenditures 3,111,412 3,111,412 3,078,261 33,151
Excess (Deficiency) of Revenues Over Expenditures 3,019,588 3,019,588 3,328,501 308,913
Other Financing Sources (Uses) Transfers Out (3,548,055) (3,548,055) (3,547,770) 285
Total Other Financing Sources (Uses) (3,548,055) (3,548,055) (3,547,770) 285
Net Changes In Fund Balances (528,467) (528,467) (219,269) 309,198
Fund Balances as of January 1 2,250,000 3,924,075 3,924,075 -
Fund Balances as of December 31 1,721,533$ 3,395,608$ 3,704,806$ 309,198$
Schedule of Revenues, Expenditures, andDetention Facilities Sales Tax Holding
Changes in Fund Balance - Budget (GAAP Basis) and ActualFor The Year Ended December 31, 2019
Thurston County, Washington 2019
194
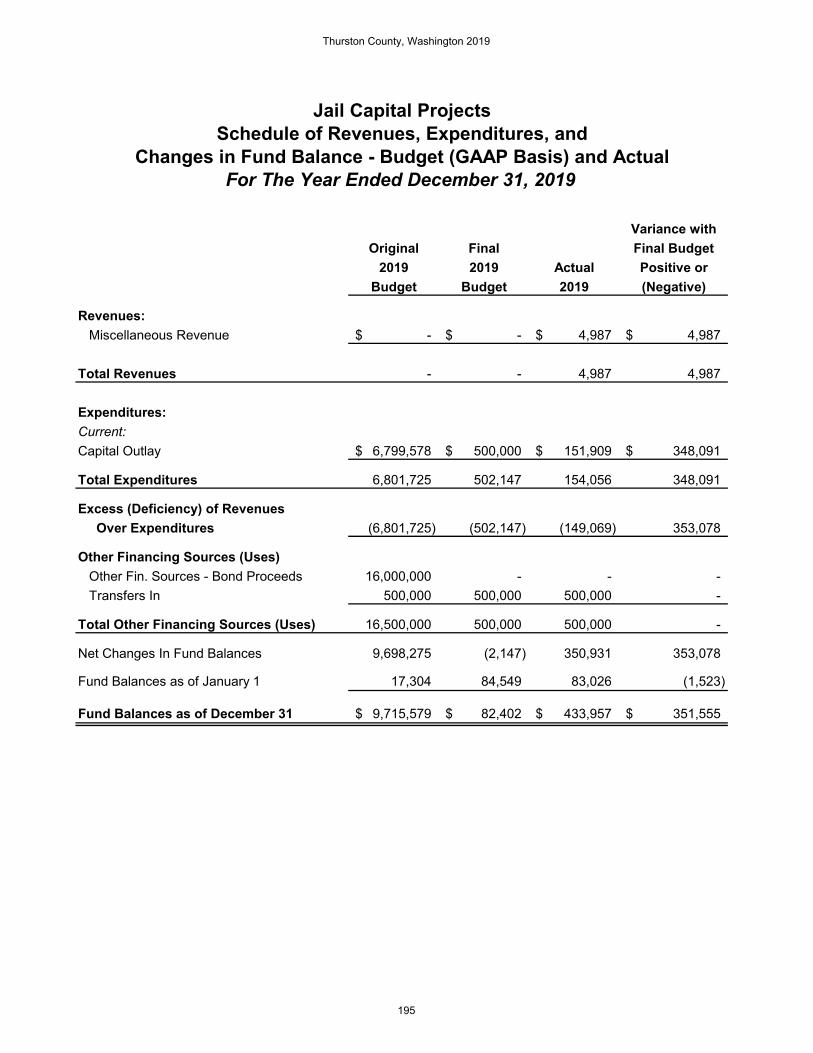
Variance withOriginal Final Final Budget
2019 2019 Actual Positive orBudget Budget 2019 (Negative)
Revenues: Miscellaneous Revenue -$ -$ 4,987$ 4,987$
Total Revenues - - 4,987 4,987
Expenditures:Current:Capital Outlay 6,799,578$ 500,000$ 151,909$ 348,091$
Total Expenditures 6,801,725 502,147 154,056 348,091
Excess (Deficiency) of Revenues Over Expenditures (6,801,725) (502,147) (149,069) 353,078
Other Financing Sources (Uses) Other Fin. Sources - Bond Proceeds 16,000,000 - - - Transfers In 500,000 500,000 500,000 -
Total Other Financing Sources (Uses) 16,500,000 500,000 500,000 -
Net Changes In Fund Balances 9,698,275 (2,147) 350,931 353,078
Fund Balances as of January 1 17,304 84,549 83,026 (1,523)
Fund Balances as of December 31 9,715,579$ 82,402$ 433,957$ 351,555$
Jail Capital ProjectsSchedule of Revenues, Expenditures, and
Changes in Fund Balance - Budget (GAAP Basis) and ActualFor The Year Ended December 31, 2019
Thurston County, Washington 2019
195

Variance withOriginal Final Final Budget
2019 2019 Actual Positive orBudget Budget 2019 (Negative)
Revenues: Charges for Services 600,000$ 600,000$ 585,503$ (14,497)$ Miscellaneous Revenue 25,000 25,000 76,805 51,805
Total Revenues 625,000 625,000 662,308 37,308
Expenditures:Current: Culture & Recreation 13,063 13,063 13,063 -
Total Expenditures 13,063 13,063 13,063 -
Excess (Deficiency) of Revenues Over Expenditures 611,937 611,937 649,245 37,308
Other Financing Sources (Uses) Transfers Out (602,500) (1,313,358) (377,125) 936,233
Total Other Financing Sources (Uses) (602,500) (1,313,358) (377,125) 936,233
Net Changes In Fund Balances 9,437 (701,421) 272,120 973,541
Fund Balances as of January 1 1,691,825 2,316,110 2,295,058 (21,052)
Fund Balances as of December 31 1,701,262$ 1,614,689$ 2,567,178$ 952,489$
Changes in Fund Balance - Budget (GAAP Basis) and ActualFor The Year Ended December 31, 2019
Parks Impact FeesSchedule of Revenues, Expenditures, and
Thurston County, Washington 2019
196

Variance withOriginal Final Final Budget
2019 2019 Actual Positive orBudget Budget 2019 (Negative)
Revenues: Taxes 5,850,000$ 5,850,000$ 6,243,816$ 393,816$ Miscellaneous Revenue - - 120 120
Total Revenues 5,850,000 5,850,000 6,243,936 393,936 Excess (Deficiency) of Revenues Over Expenditures 5,850,000 5,850,000 6,243,936 393,936
Other Financing Sources (Uses) Transfers Out (6,646,292) (7,367,985) (5,292,154) 2,075,831
Total Other Financing Sources (Uses) (6,646,292) (7,367,985) (5,292,154) 2,075,831
Net Changes In Fund Balances (796,292) (1,517,985) 951,782 2,469,767
Fund Balances as of January 1 12,418,014 14,989,610 14,989,610 -
Fund Balances as of December 31 11,621,722$ 13,471,625$ 15,941,392$ 2,469,767$
Real Estate Excise Tax
Changes in Fund Balance - Budget (GAAP Basis) and ActualFor The Year Ended December 31, 2019
Schedule of Revenues, Expenditures, and
Thurston County, Washington 2019
197

Variance withOriginal Final Final Budget
2019 2019 Actual Positive orBudget Budget 2019 (Negative)
Revenues: Intergovernmental 20,000$ 20,000$ 21,545$ 1,545$ Charges for Services 25,000 25,000 27,253 2,253 Miscellaneous Revenue 800 800 3,566 2,766
Total Revenues 45,800 45,800 52,364 6,564
Expenditures:Current: General Government 87,749 87,749 44,492 43,257
Total Expenditures 87,749 87,749 44,492 43,257
Excess (Deficiency) of Revenues Over Expenditures (41,949) (41,949) 7,872 49,821
Net Changes In Fund Balances (41,949) (41,949) 7,872 49,821
Fund Balances as of January 1 120,000 126,395 125,255 (1,140) Prior Period Adjustments - - 2,963 2,963 Fund Balances as of January 1 - Restated 120,000 126,395 128,218 1,823
Fund Balances as of December 31 78,051$ 84,446$ 136,090$ 51,644$
REET TechnologySchedule of Revenues, Expenditures, and
Changes in Fund Balance - Budget (GAAP Basis) and ActualFor The Year Ended December 31, 2019
Thurston County, Washington 2019
198
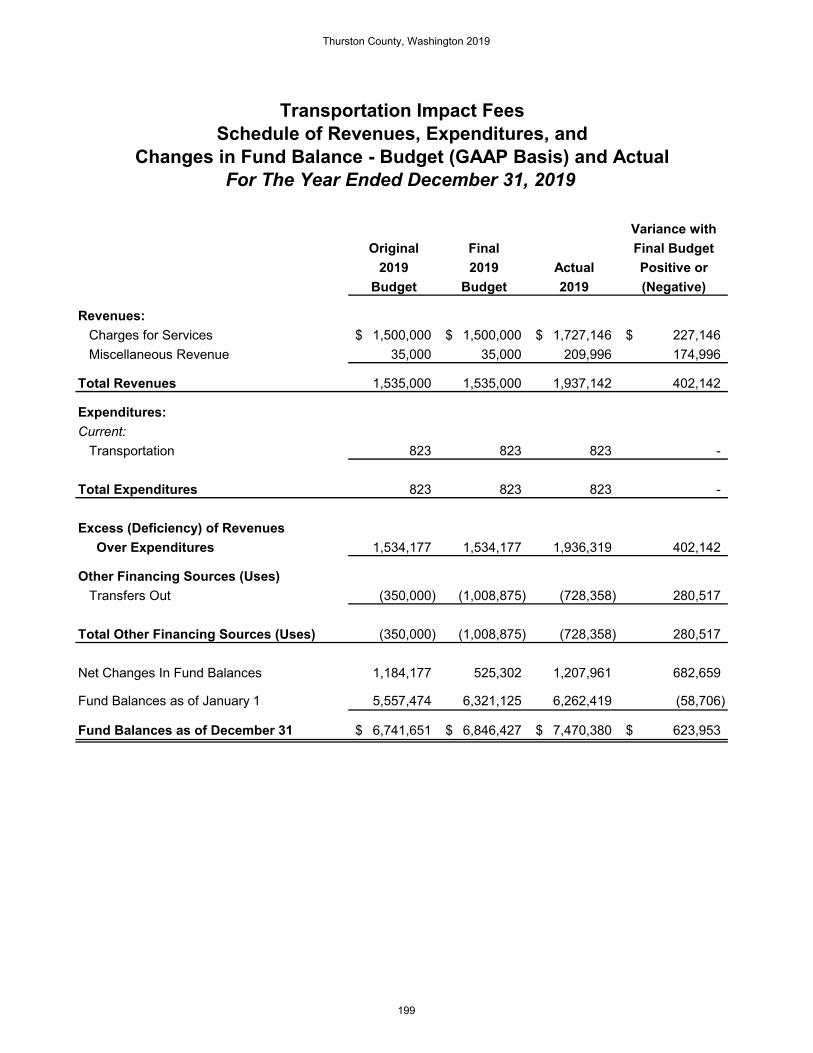
Variance withOriginal Final Final Budget
2019 2019 Actual Positive orBudget Budget 2019 (Negative)
Revenues: Charges for Services 1,500,000$ 1,500,000$ 1,727,146$ 227,146$ Miscellaneous Revenue 35,000 35,000 209,996 174,996
Total Revenues 1,535,000 1,535,000 1,937,142 402,142
Expenditures:Current: Transportation 823 823 823 -
Total Expenditures 823 823 823 -
Excess (Deficiency) of Revenues Over Expenditures 1,534,177 1,534,177 1,936,319 402,142
Other Financing Sources (Uses) Transfers Out (350,000) (1,008,875) (728,358) 280,517
Total Other Financing Sources (Uses) (350,000) (1,008,875) (728,358) 280,517
Net Changes In Fund Balances 1,184,177 525,302 1,207,961 682,659
Fund Balances as of January 1 5,557,474 6,321,125 6,262,419 (58,706)
Fund Balances as of December 31 6,741,651$ 6,846,427$ 7,470,380$ 623,953$
Schedule of Revenues, Expenditures, andChanges in Fund Balance - Budget (GAAP Basis) and Actual
For The Year Ended December 31, 2019
Transportation Impact Fees
Thurston County, Washington 2019
199

This Page Intentionally Left Blank
Thurston County, Washington 2019
200

NONMAJOR ENTERPRISE FUNDS Enterprise funds are established to account for the financing of goods and services provided by Thurston County to the County’s residents and customers primarily through user charges on a cost reimbursement basis. All enterprise utilities and programs are funded by user fees and charges, including the Storm Water Utility which is funded by storm water tax assessments, except for Utility Planning which is funded by real estate excise taxes and interfund service payments. Boston Harbor Utility – Funds established to account for user fees and charges for the maintenance and operation of the Boston Harbor water and wastewater systems. Community Loan Programs – Funds established to account for loans provided to Thurston County residents to upgrade and improve failing septic systems. Olympic View Utility – Funds established to account for user fees and charges for the maintenance, operations, and capital projects of the sewer utility in the Olympic View subdivision. Tamoshan Utility – Funds established to account for user fees and charges for the design, construction, maintenance and operation of the Tamoshan water system and Tamoshan/Beverly Beach sewer utility funds.
Thurston County, Washington 2019
201
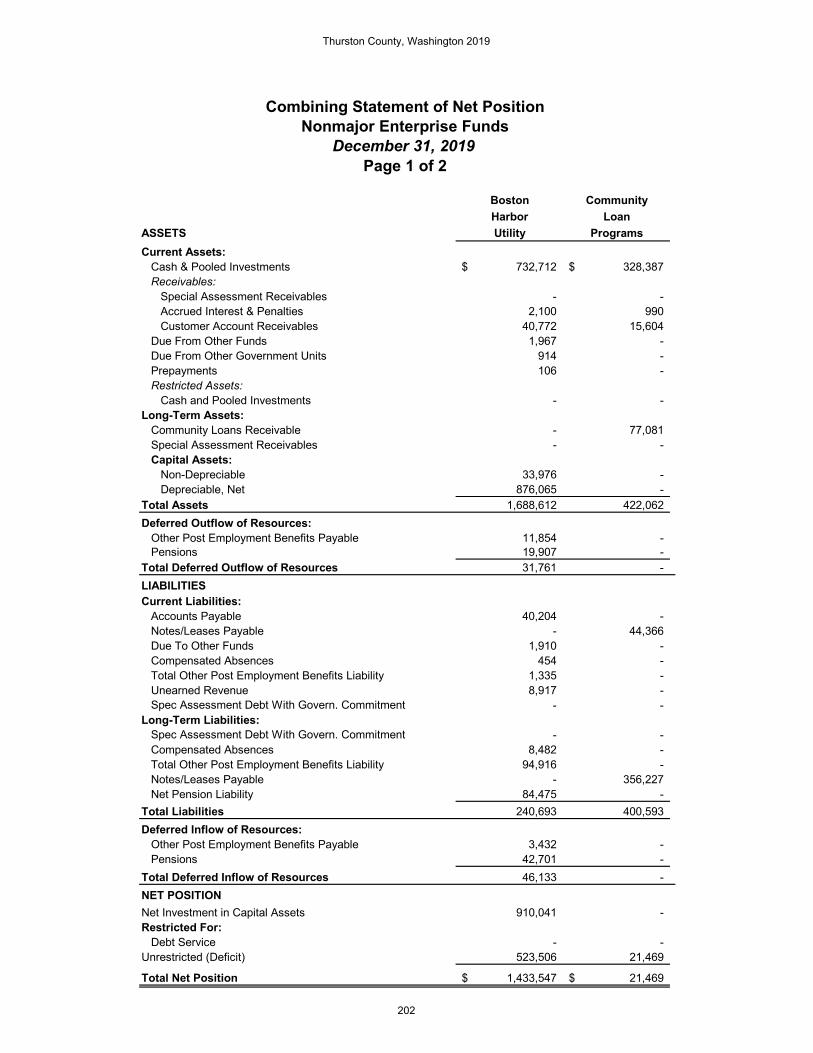
Boston CommunityHarbor Loan
ASSETS Utility ProgramsCurrent Assets: Cash & Pooled Investments 732,712$ 328,387$ Receivables: Special Assessment Receivables - - Accrued Interest & Penalties 2,100 990 Customer Account Receivables 40,772 15,604 Due From Other Funds 1,967 - Due From Other Government Units 914 - Prepayments 106 - Restricted Assets: Cash and Pooled Investments - - Long-Term Assets: Community Loans Receivable - 77,081 Special Assessment Receivables - - Capital Assets: Non-Depreciable 33,976 - Depreciable, Net 876,065 - Total Assets 1,688,612 422,062 Deferred Outflow of Resources: Other Post Employment Benefits Payable 11,854 - Pensions 19,907 - Total Deferred Outflow of Resources 31,761 - LIABILITIESCurrent Liabilities: Accounts Payable 40,204 - Notes/Leases Payable - 44,366 Due To Other Funds 1,910 - Compensated Absences 454 - Total Other Post Employment Benefits Liability 1,335 - Unearned Revenue 8,917 - Spec Assessment Debt With Govern. Commitment - - Long-Term Liabilities: Spec Assessment Debt With Govern. Commitment - - Compensated Absences 8,482 - Total Other Post Employment Benefits Liability 94,916 - Notes/Leases Payable - 356,227 Net Pension Liability 84,475 - Total Liabilities 240,693 400,593 Deferred Inflow of Resources: Other Post Employment Benefits Payable 3,432 - Pensions 42,701 - Total Deferred Inflow of Resources 46,133 - NET POSITIONNet Investment in Capital Assets 910,041 - Restricted For: Debt Service - - Unrestricted (Deficit) 523,506 21,469
Total Net Position 1,433,547$ 21,469$
Page 1 of 2
Combining Statement of Net PositionNonmajor Enterprise Funds
December 31, 2019
Thurston County, Washington 2019
202

OlympicView Tamoshan
ASSETS Utility Utility TotalCurrent Assets: Cash & Pooled Investments 54,751$ 473,022$ 1,588,872$ Receivables: Special Assessment Receivables - 42,943 42,943 Accrued Interest & Penalties 159 1,892 5,141 Customer Account Receivables 2,851 25,036 84,263 Due From Other Funds - 313 2,280 Due From Other Government Units - - 914 Prepayments - 106 212 Restricted Assets: Cash and Pooled Investments - 22,488 22,488 Long-Term Assets: Community Loans Receivable - - 77,081 Special Assessment Receivables - 115,563 115,563 Capital Assets: Non-Depreciable - 5,900 39,876 Depreciable, Net - 1,871,813 2,747,878 Total Assets 57,761 2,559,076 4,727,511 Deferred Outflow of Resources: Other Post Employment Benefits Payable 1,248 7,746 20,848 Pensions 1,382 10,172 31,461 Total Deferred Outflow of Resources 2,630 17,918 52,309 LIABILITIESCurrent Liabilities: Accounts Payable 568 18,993 59,765 Notes/Leases Payable - - 44,366 Due To Other Funds 1,074 313 3,297 Compensated Absences 17 204 675 Other Post Employment Benefits Payable 140 871 2,346 Unearned Revenue - 5,052 13,969 Spec Assessment Debt With Govern. Commitment - 78,282 78,282 Long-Term Liabilities: Spec Assessment Debt With Govern. Commitment - 34,847 34,847 Compensated Absences 316 3,808 12,606 Other Post Employment Benefits Payable 9,992 62,028 166,936 Notes/Leases Payable - - 356,227 Net Pension Liability 5,867 43,162 133,504 Total Liabilities 17,974 247,560 906,820 Deferred Inflow of Resources: Other Post Employment Benefits Payable 361 2,243 6,036 Pensions 2,966 21,819 67,486 Total Deferred Inflow of Resources 3,327 24,062 73,522 NET POSITIONNet Investment in Capital Assets - 1,764,584 2,674,625 Restricted For: Debt Service - 181,531 181,531 Unrestricted (Deficit) 39,090 359,257 943,322
Total Net Position 39,090$ 2,305,372$ 3,799,478$
Page 2 of 2
Combining Statement of Net PositionNonmajor Enterprise Funds
December 31, 2019
Thurston County, Washington 2019
203

Boston CommunityHarbor LoanUtility Programs
Operating Revenues: Charges for Services 514,983$ -$ Miscellaneous 7,629 3,180
Total Operating Revenues 522,612 3,180
Operating Expenses: Salaries and Benefits 236,482 - Other Supplies and Expenses 51,046 - Contractual Services 112,992 - Interfund Services and Charges 68,153 1,243 Depreciation/Amortization 46,424 -
Total Operating Expenses 515,097 1,243
Operating Income (Loss) 7,515 1,937
Nonoperating Revenue (Expenses): Interest Revenue 21,282 10,336 Gain/Loss on Disposition of Capital Assets - - Interest Expense & Fiscal Charges - (11,152)
Total Nonoperating Revenue (Expense) 21,282 (816)
Income Before Contributions and Transfers: 28,797 1,121 Capital Grants & Contributions 30,107 -
Transfers In 28,146 -
Change in Net Position 87,050 1,121
Net Position as of January 1 1,346,497 20,348
Net Position as of December 31 1,433,547$ 21,469$
For The Year Ended December 31, 2019Page 1 of 2
Combining Statement of Revenues, ExpensesAnd Changes In Fund Net Position
Nonmajor Enterprise Funds
Thurston County, Washington 2019
204
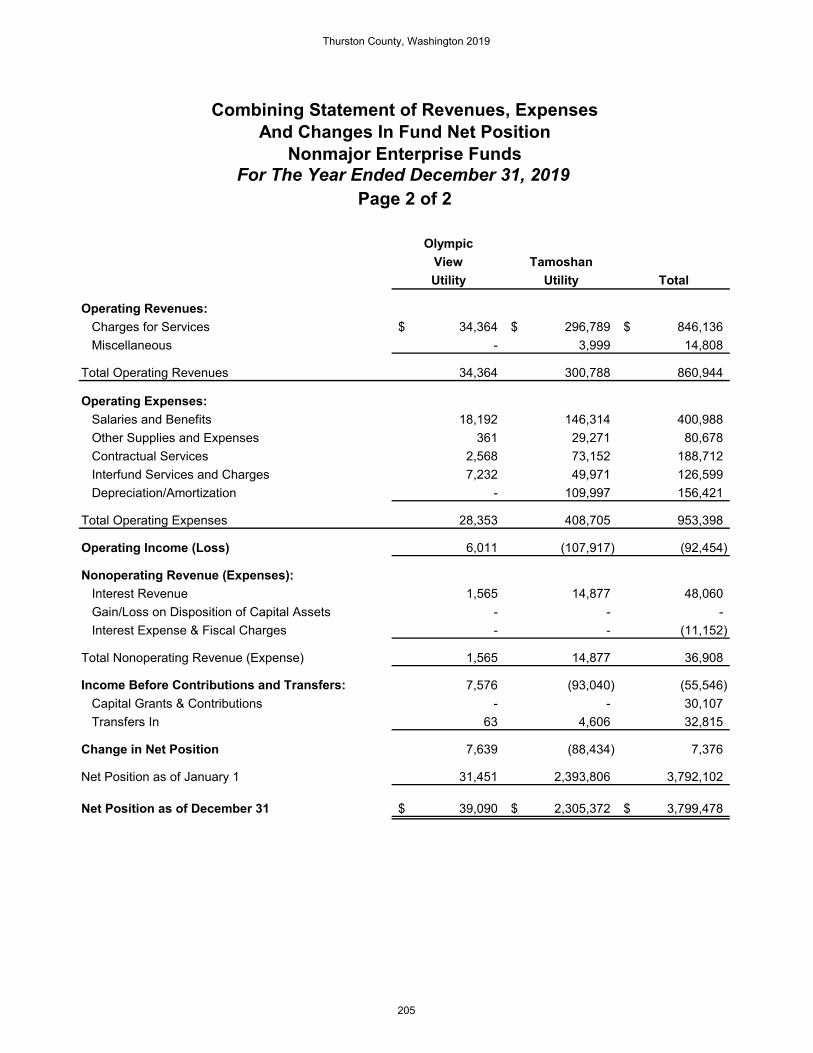
OlympicView TamoshanUtility Utility Total
Operating Revenues: Charges for Services 34,364$ 296,789$ 846,136$ Miscellaneous - 3,999 14,808
Total Operating Revenues 34,364 300,788 860,944
Operating Expenses: Salaries and Benefits 18,192 146,314 400,988 Other Supplies and Expenses 361 29,271 80,678 Contractual Services 2,568 73,152 188,712 Interfund Services and Charges 7,232 49,971 126,599 Depreciation/Amortization - 109,997 156,421
Total Operating Expenses 28,353 408,705 953,398
Operating Income (Loss) 6,011 (107,917) (92,454)
Nonoperating Revenue (Expenses): Interest Revenue 1,565 14,877 48,060 Gain/Loss on Disposition of Capital Assets - - - Interest Expense & Fiscal Charges - - (11,152)
Total Nonoperating Revenue (Expense) 1,565 14,877 36,908
Income Before Contributions and Transfers: 7,576 (93,040) (55,546) Capital Grants & Contributions - - 30,107 Transfers In 63 4,606 32,815
Change in Net Position 7,639 (88,434) 7,376
Net Position as of January 1 31,451 2,393,806 3,792,102
Net Position as of December 31 39,090$ 2,305,372$ 3,799,478$
For The Year Ended December 31, 2019Page 2 of 2
Combining Statement of Revenues, ExpensesAnd Changes In Fund Net Position
Nonmajor Enterprise Funds
Thurston County, Washington 2019
205

Boston CommunityHarbor LoanUtility Programs
Cash Flows from Operating Activities: Cash Received from Customers 527,187$ (1,852)$ Cash Paid for Goods & Services (167,896) - Cash Paid for Interfund Services (68,153) (1,243) Cash Paid to Employees (269,653) -
Net Cash Provided (Used) by Operating Activities 21,485 (3,095)
Cash Flows from Noncapital Financing Activities: Transfers In 28,146 - Community Loans Issued to Homeowners - 34,826 Community Loan Financing Payments - (48,250) Interest Payments - (11,152) Net Cash Provided (Used) byNoncapital Financing Activities 28,146 (24,576) Cash Flows from Capital &Related Financing Activities: Capital Asset Purchases (55,559) - Bond/Loan Payments - - Contributed Capital 30,107 - Assessment Receipts - - Net Cash Provided (Used) by Capital &Related Financing Activities (25,452) -
Cash Flows from Investing Activities: Interest Receipts 21,645 10,656
Net Cash Provided (Used) by Investing Activities 21,645 10,656
Net Increase (Decrease) in Cash & Cash Equivalents 45,824 (17,015)
Cash & Cash Equivalents as of January 1 686,888 345,402
Cash & Cash Equivalents as of December 31 732,712$ 328,387$
Combining Statement of Cash FlowsNonmajor Enterprise Funds
For The Year Ended December 31, 2019Page 1 of 4
Thurston County, Washington 2019
206

OlympicView TamoshanUtility Utility Total
Cash Flows from Operating Activities: Cash Received from Customers 33,244$ 296,724$ 855,303$ Cash Paid for Goods & Services (3,544) (95,906) (267,346) Cash Paid for Interfund Services (7,232) (49,971) (126,599) Cash Paid to Employees (18,444) (137,063) (425,160)
Net Cash Provided (Used) by Operating Activities 4,024 13,784 36,198
Cash Flows from Noncapital Financing Activities: Transfers In 63 4,606 32,815 Community Loans Issued to Homeowners - - 34,826 Community Loan Financing Payments - - (48,250) Interest Payments - - (11,152) Net Cash Provided (Used) byNoncapital Financing Activities 63 4,606 8,239 Cash Flows from Capital &Related Financing Activities: Capital Asset Purchases - (2,769) (58,328) Bond/Loan Payments - (78,282) (78,282) Contributed Capital - - 30,107 Assessment Receipts - 50,413 50,413 Net Cash Provided (Used) by Capital &Related Financing Activities - (30,638) (56,090)
Cash Flows from Investing Activities: Interest Receipts 1,604 15,210 49,115
Net Cash Provided (Used) by Investing Activities 1,604 15,210 49,115
Net Increase (Decrease) in Cash & Cash Equivalents 5,691 2,962 37,462
Cash & Cash Equivalents as of January 1 49,060 492,548 1,573,898
Cash & Cash Equivalents as of December 31 54,751$ 495,510$ 1,611,360$
Combining Statement of Cash FlowsNonmajor Enterprise Funds
For The Year Ended December 31, 2019Page 2 of 4
Thurston County, Washington 2019
207

Boston CommunityHarbor LoanUtility Programs
Reconciliation of Operating Income To Net CashProvided (Used) by Operating Income:Operating Income 7,515$ 1,937$
Adjustments to Reconcile Operating Income toNet Cash Provided (Used) by Operating Activities:Depreciation Expense 46,424 - (Increase) Decrease in: Customer Account Receivables (4,093) (5,032) Due from Other Funds 13,216 - Due from Other Government Units (466) - Increase (Decrease) in: Accounts Payable (5,129) - Due to Other Funds 1,271 - Unearned Revenue 1,757 - Compensated Absences Payable (43,273) - Other Post Employment Benefits 5,431 - Net Pension Liability (1,168) -
Total Adjustments 13,970 (5,032)
Net Cash Provided (Used) by Operating Activities 21,485$ (3,095)$
For The Year Ended December 31, 2019Page 3 of 4
Combining Statement of Cash FlowsNonmajor Enterprise Funds
Thurston County, Washington 2019
208
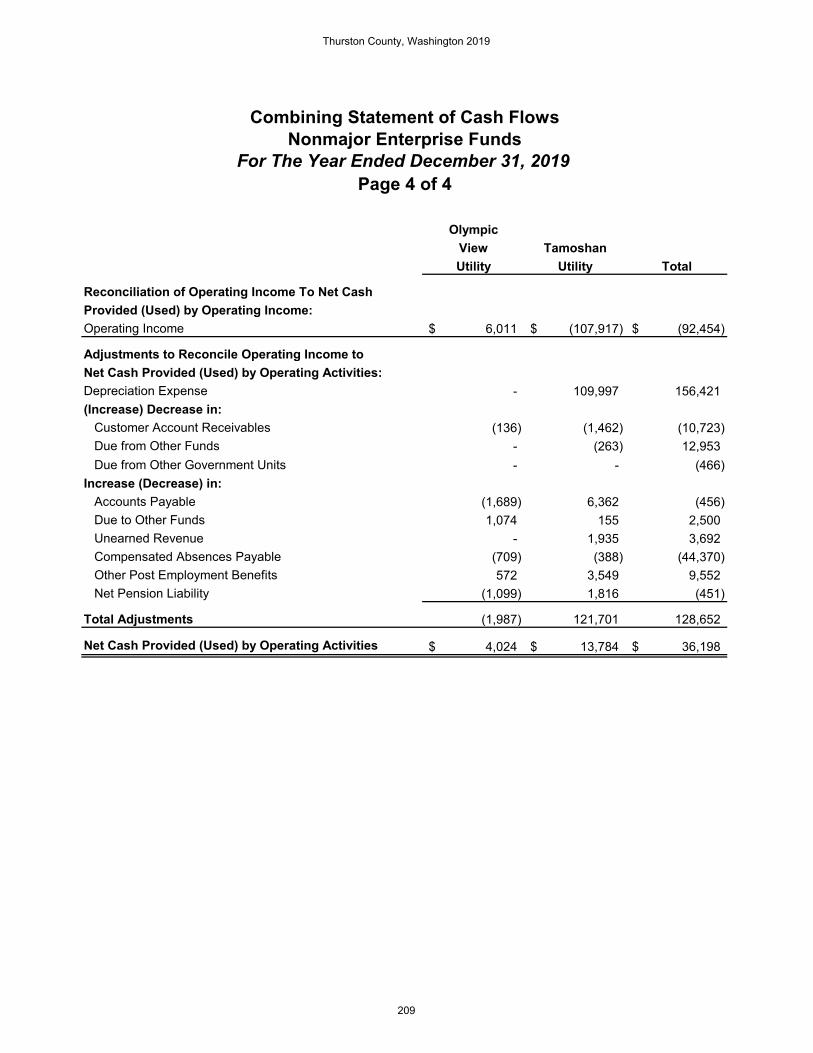
OlympicView TamoshanUtility Utility Total
Reconciliation of Operating Income To Net CashProvided (Used) by Operating Income:Operating Income 6,011$ (107,917)$ (92,454)$
Adjustments to Reconcile Operating Income toNet Cash Provided (Used) by Operating Activities:Depreciation Expense - 109,997 156,421 (Increase) Decrease in: Customer Account Receivables (136) (1,462) (10,723) Due from Other Funds - (263) 12,953 Due from Other Government Units - - (466) Increase (Decrease) in: Accounts Payable (1,689) 6,362 (456) Due to Other Funds 1,074 155 2,500 Unearned Revenue - 1,935 3,692 Compensated Absences Payable (709) (388) (44,370) Other Post Employment Benefits 572 3,549 9,552 Net Pension Liability (1,099) 1,816 (451)
Total Adjustments (1,987) 121,701 128,652
Net Cash Provided (Used) by Operating Activities 4,024$ 13,784$ 36,198$
For The Year Ended December 31, 2019Page 4 of 4
Combining Statement of Cash FlowsNonmajor Enterprise Funds
Thurston County, Washington 2019
209

This Page Intentionally Left Blank
Thurston County, Washington 2019
210

INTERNAL SERVICE FUNDS Internal service funds are established to account for the financing of goods and services provided by one department, agency, or government unit to other departments, agencies or other government units on a cost reimbursement basis. Central Services – A fund established to account for technology and building and maintenance service charges and fees to maintain, acquire and service equipment and facilities and to provide associated services including records, mail, facility maintenance and operations, utilities, surplus, lease administration, contracted landscaping and custodial services and a separate department, information technology and telecommunications. Equipment Rental and Revolving – Funds established to account for equipment usage and replacement charges used to finance the maintenance, operation and acquisition of vehicles and equipment. Insurance Risk Management – A fund established to account for risk service charges used to finance the costs of insurance coverage for Thurston County. Benefits Administration – A fund established to account for interfund contributions used to finance the benefits administration costs of County employees. Unemployment Compensation – A fund established to account for interfund contributions used to self insure the County against unemployment claims and settlements from former County employees.
Thurston County, Washington 2019
211

Equipment InsuranceCentral Rental & Risk
ASSETS Services Revolv. ManagementCurrent Assets: Cash & Pooled Investments 14,846,651$ 18,200,400$ 4,686,283$ Receivables: Accrued Interest & Penalties 33,456 - - Customer Account Receivables 4,656 90,110 26,971 Due From Other Funds 703,153 97,774 - Due From Other Government Units - 15,909 - Inventory - 285,334 - Prepayments 448,210 - - Capital Assets: Non-Depreciable 4,751,638 43,999 - Depreciable, Net 14,993,773 17,291,574 -
Total Assets 35,781,537 36,025,100 4,713,254
Deferred Outflow of Resources: Other Post Employment Benefits Payable 403,460 77,989 16,118 Pensions 534,321 94,458 25,587
Total Deferred Outflow of Resources 937,781 172,447 41,705
LIABILITIESCurrent Liabilities: Accounts Payable 1,017,712 160,245 218,281 Notes/Leases Payable 5,254 - - Due To Other Funds 87,407 245,577 26,970 Compensated Absences 24,529 4,495 1,846 Total Other Post Employment Benefits Liability 45,442 8,784 1,815 Claims and Judgments Payable - - 548,671 Lim. Tax G. O. Bond - Current Portion - 112,500 - Long-Term Liabilities: Limited G.O. Bonds Payable - 1,525,350 - Compensated Absences 458,122 83,951 34,469 Total Other Post Employment Benefits Liability 3,230,473 624,448 129,052 Claims and Judgments Payable - - 3,568,515 Notes/Leases Payable 5,961 - - Net Pension Liability 2,267,356 400,826 108,572
Total Liabilities 7,142,256 3,166,176 4,638,191
Deferred Inflow of Resources: Other Post Employment Benefits Payable 116,787 22,574 4,665 Pensions 1,146,111 202,610 54,882
Total Deferred Inflow of Resources 1,262,898 225,184 59,547
NET POSITIONNet Investment in Capital Assets 19,734,196 15,697,723 - Unrestricted (Deficit) 8,579,968 17,108,464 57,221
Total Net Position 28,314,164$ 32,806,187$ 57,221$
Page 1 of 2
Combining Statement of Net PositionInternal Service Funds
December 31, 2019
Thurston County, Washington 2019
212
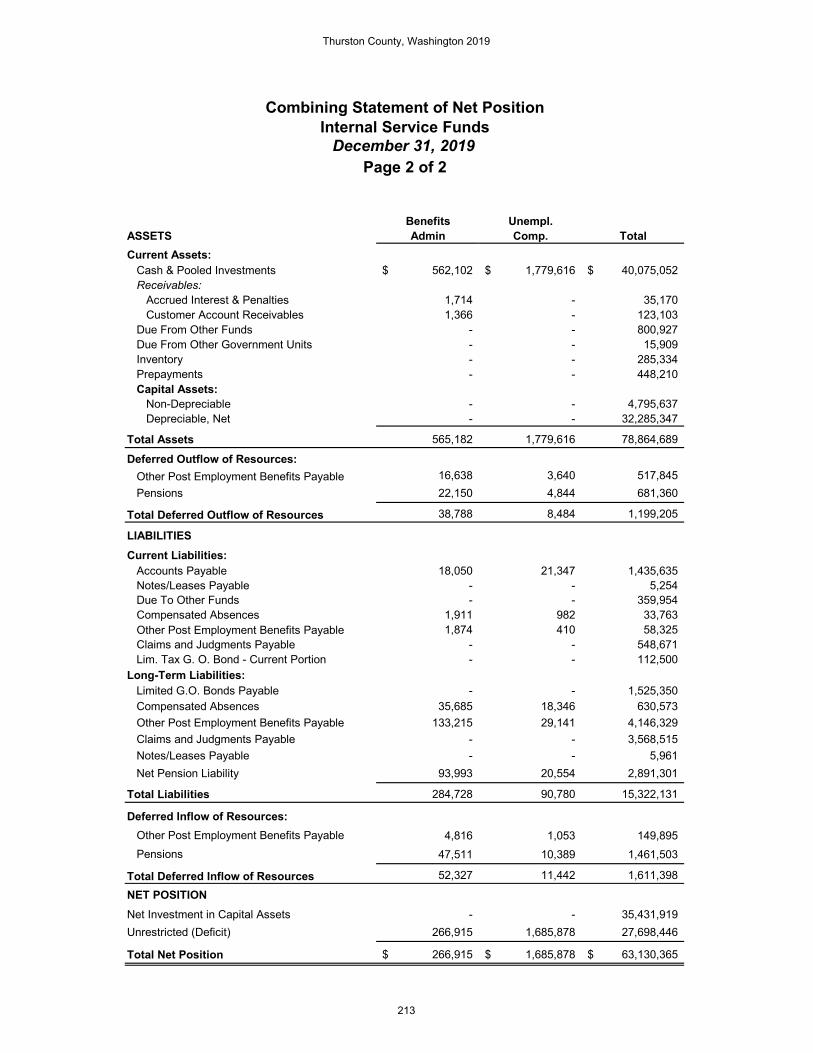
Benefits Unempl.ASSETS Admin Comp. TotalCurrent Assets: Cash & Pooled Investments 562,102$ 1,779,616$ 40,075,052$ Receivables: Accrued Interest & Penalties 1,714 - 35,170 Customer Account Receivables 1,366 - 123,103 Due From Other Funds - - 800,927 Due From Other Government Units - - 15,909 Inventory - - 285,334 Prepayments - - 448,210 Capital Assets: Non-Depreciable - - 4,795,637 Depreciable, Net - - 32,285,347
Total Assets 565,182 1,779,616 78,864,689
Deferred Outflow of Resources: Other Post Employment Benefits Payable 16,638 3,640 517,845 Pensions 22,150 4,844 681,360
Total Deferred Outflow of Resources 38,788 8,484 1,199,205
LIABILITIESCurrent Liabilities: Accounts Payable 18,050 21,347 1,435,635 Notes/Leases Payable - - 5,254 Due To Other Funds - - 359,954 Compensated Absences 1,911 982 33,763 Other Post Employment Benefits Payable 1,874 410 58,325 Claims and Judgments Payable - - 548,671 Lim. Tax G. O. Bond - Current Portion - - 112,500 Long-Term Liabilities: Limited G.O. Bonds Payable - - 1,525,350 Compensated Absences 35,685 18,346 630,573 Other Post Employment Benefits Payable 133,215 29,141 4,146,329 Claims and Judgments Payable - - 3,568,515 Notes/Leases Payable - - 5,961 Net Pension Liability 93,993 20,554 2,891,301
Total Liabilities 284,728 90,780 15,322,131
Deferred Inflow of Resources: Other Post Employment Benefits Payable 4,816 1,053 149,895 Pensions 47,511 10,389 1,461,503
Total Deferred Inflow of Resources 52,327 11,442 1,611,398
NET POSITIONNet Investment in Capital Assets - - 35,431,919 Unrestricted (Deficit) 266,915 1,685,878 27,698,446
Total Net Position 266,915$ 1,685,878$ 63,130,365$
Page 2 of 2
Combining Statement of Net PositionInternal Service Funds
December 31, 2019
Thurston County, Washington 2019
213

Equipment InsuranceCentral Rental & RiskServices Revolv. Management
Operating Revenues: Charges for Services 18,299,511$ -$ 2,023,935$ Equipment Rental - 8,244,132 - Miscellaneous 4,293 5,007 -
Total Operating Revenues 18,303,804 8,249,139 2,023,935
Operating Expenses: Salaries and Benefits 7,863,373 1,381,609 314,240 Other Supplies and Expenses 840,037 2,279,368 3,140 Contractual Services 7,207,211 151,656 267,856 Interfund Services and Charges 1,651,566 484,084 107,273 Depreciation/Amortization 1,379,905 3,007,549 - Claims Payments 6,468 - 1,718,545
Total Operating Expenses 18,948,560 7,304,266 2,411,054
Operating Income (Loss) (644,756) 944,873 (387,119)
Nonoperating Revenue (Expenses): Interest Revenue 313,819 - - Operating Grants & Contributions - 30,406 - Gain/Loss on Disposition of Capital Assets (229,839) 389,938 - Insurance Recoveries - 26,970 55,860 Interest Expense & Fiscal Charges (1,897) (83,558) -
Total Nonoperating Revenue (Expense) 82,083 363,756 55,860
Income Before Contributions and Transfers: (562,673) 1,308,629 (331,259) Capital Grants & Contributions 2,743 - - Interfund Capital Contributions 153,290 65,908 - Special Item: Transfers In 1,500,462 177,787 1,000 Transfers Out (78,203) (782,059) (43,000)
Change in Net Position 1,015,619 770,265 (373,259)
Net Position as of January 1 27,298,545 32,035,922 430,480
Net Position as of December 31 28,314,164$ 32,806,187$ 57,221$
Combining Statement of Revenues, ExpensesAnd Changes In Fund Net Position
Internal Service FundsFor The Year Ended December 31, 2019
Page 1 of 2
Thurston County, Washington 2019
214
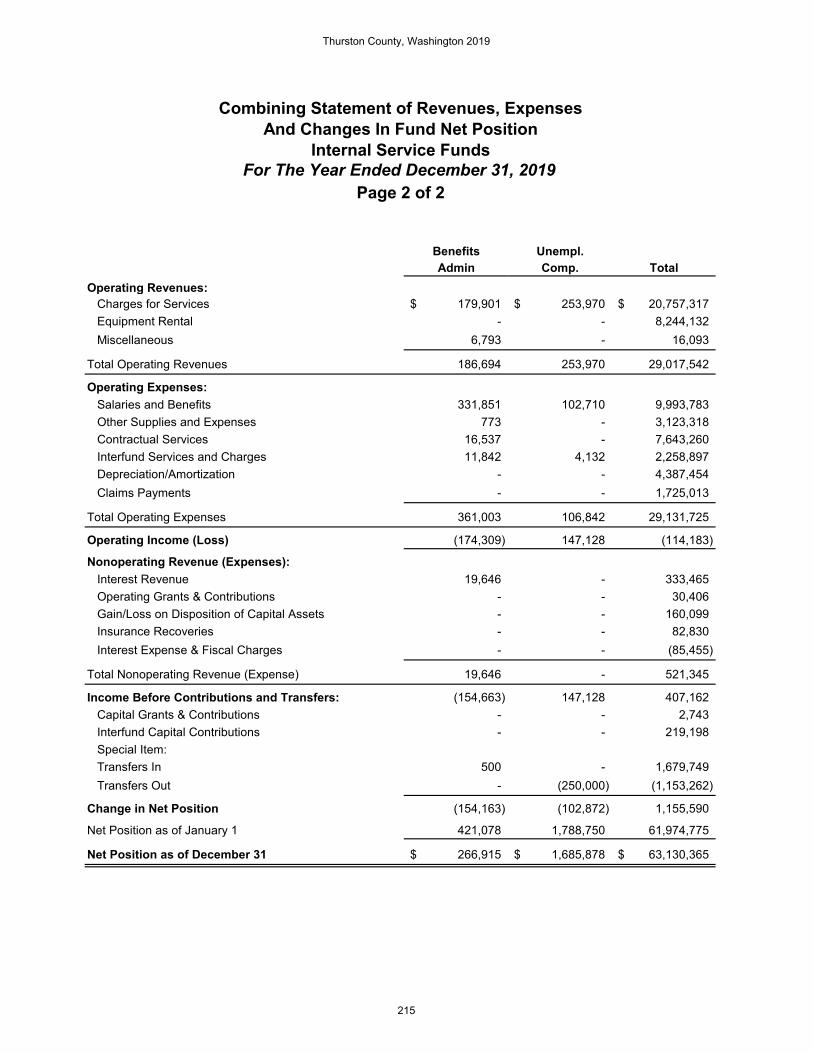
Benefits Unempl.Admin Comp. Total
Operating Revenues: Charges for Services 179,901$ 253,970$ 20,757,317$ Equipment Rental - - 8,244,132 Miscellaneous 6,793 - 16,093
Total Operating Revenues 186,694 253,970 29,017,542
Operating Expenses: Salaries and Benefits 331,851 102,710 9,993,783 Other Supplies and Expenses 773 - 3,123,318 Contractual Services 16,537 - 7,643,260 Interfund Services and Charges 11,842 4,132 2,258,897 Depreciation/Amortization - - 4,387,454 Claims Payments - - 1,725,013
Total Operating Expenses 361,003 106,842 29,131,725
Operating Income (Loss) (174,309) 147,128 (114,183)
Nonoperating Revenue (Expenses): Interest Revenue 19,646 - 333,465 Operating Grants & Contributions - - 30,406 Gain/Loss on Disposition of Capital Assets - - 160,099 Insurance Recoveries - - 82,830 Interest Expense & Fiscal Charges - - (85,455)
Total Nonoperating Revenue (Expense) 19,646 - 521,345
Income Before Contributions and Transfers: (154,663) 147,128 407,162 Capital Grants & Contributions - - 2,743 Interfund Capital Contributions - - 219,198 Special Item: Transfers In 500 - 1,679,749 Transfers Out - (250,000) (1,153,262)
Change in Net Position (154,163) (102,872) 1,155,590
Net Position as of January 1 421,078 1,788,750 61,974,775
Net Position as of December 31 266,915$ 1,685,878$ 63,130,365$
Combining Statement of Revenues, ExpensesAnd Changes In Fund Net Position
Internal Service FundsFor The Year Ended December 31, 2019
Page 2 of 2
Thurston County, Washington 2019
215

Equipment InsuranceCentral Rental & RiskServices Revolv. Management
Cash Flows from Operating Activities: Cash Received from Interfund Services 18,164,469$ 8,040,479$ 1,980,019$ Cash Paid for Goods & Services (8,190,140) (2,472,704) (2,417,315) Cash Paid for Interfund Services (1,651,566) (484,084) (107,273) Cash Paid to Employees (7,774,162) (1,339,870) (349,510)
Net Cash Provided (Used) by Operating Activities 548,601 3,743,821 (894,079)
Cash Flows from Noncapital Financing Activities: Transfers In 1,500,462 160,297 1,000 Transfers Out (67,019) (782,059) (43,000) Grant Proceeds - 30,406 - Insurance Recoveries - 26,970 55,860
Net Cash Provided (Used) byNoncapital Financing Activities 1,433,443 (564,386) 13,860
Cash Flows from Capital & Related Financing Activities: Cash Proceeds (Loss) from Sale of Capital Assets - 587,083 - Capital Asset Purchases (790,412) (3,037,371) - Bond/Loan Payments (4,446) (109,500) - Contributed Capital 153,290 65,908 - Interest Payments (1,897) (83,558) -
Net Cash Provided (Used) by Capital & Related Financing Activities (643,465) (2,577,438) -
Cash Flows from Investing Activities: Interest Receipts 311,119 - -
Net Cash Provided (Used) by Investing Activities 311,119 - -
Net Increase (Decrease) in Cash & Cash Equivalents 1,649,698 601,997 (880,219)
Cash & Cash Equivalents as of January 1 13,196,953 17,598,403 5,566,502
Cash & Cash Equivalents as of December 31 14,846,651$ 18,200,400$ 4,686,283$
Combining Statement of Cash FlowsInternal Service Funds
For The Year Ended December 31, 2019Page 1 of 4
Thurston County, Washington 2019
216

Benefits Unempl.Admin Comp. Total
Cash Flows from Operating Activities: Cash Received from Interfund Services 175,697$ 249,697$ 28,610,361$ Cash Paid for Goods & Services (13,641) 12,432 (13,081,368) Cash Paid for Interfund Services (11,842) (4,132) (2,258,897) Cash Paid to Employees (312,985) (96,788) (9,873,315)
Net Cash Provided (Used) by Operating Activities (162,771) 161,209 3,396,781
Cash Flows from Noncapital Financing Activities: Transfers In 500 - 1,662,259 Transfers Out - (250,000) (1,142,078) Grant Proceeds - - 30,406 Insurance Recoveries - - 82,830
Net Cash Provided (Used) byNoncapital Financing Activities 500 (250,000) 633,417
Cash Flows from Capital & Related Financing Activities: Cash Proceeds (Loss) from Sale of Capital Assets - - 587,083 Capital Asset Purchases - - (3,827,783) Bond/Loan Payments - - (113,946) Contributed Capital - - 219,198 Interest Payments - - (85,455)
Net Cash Provided (Used) by Capital & Related Financing Activities - - (3,220,903)
Cash Flows from Investing Activities: Interest Receipts 20,438 - 331,557
Net Cash Provided (Used) by Investing Activities 20,438 - 331,557
Net Increase (Decrease) in Cash & Cash Equivalents (141,833) (88,791) 1,140,852
Cash & Cash Equivalents as of January 1 703,935 1,868,407 38,934,200
Cash & Cash Equivalents as of December 31 562,102$ 1,779,616$ 40,075,052$
Combining Statement of Cash FlowsInternal Service Funds
For The Year Ended December 31, 2019Page 2 of 4
Thurston County, Washington 2019
217

Equipment InsuranceCentral Rental & RiskServices Revolv. Management
Reconciliation of Operating Income To Net CashProvided (Used) by Operating Income:Operating Income (644,756)$ 944,873$ (387,119)$ Adjustments to Reconcile Operating Income toNet Cash Provided (Used) by Operating Activities:Depreciation Expense 1,379,905 3,007,549 - (Increase) Decrease in: Customer Account Receivables 148,302 (90,110) (26,971) Due from Other Funds (36,372) (39,109) - Due from Other Government Units 42,982 (15,909) - Inventories - 11,355 - Prepaid Expense (427,376) 2,427 - Increase (Decrease) in: Accounts Payable 217,926 (156,393) (118,155) Due to Other Funds 73,026 100,931 26,916 Claims and Judgments - - (336,535) Compensated Absences Payable (17,362) 13,023 (3,216) Other Post Employment Benefits 184,849 71,870 7,384 Net Pension Liability (372,523) (106,686) (56,383)
Total Adjustments 1,193,357 2,798,948 (506,960)
Net Cash Provided (Used) by Operating Activities 548,601$ 3,743,821$ (894,079)$
Noncash Investing, Capital, and Financing Activities: Disposition of Capital Assets: Gain of Disposition 684,966$ -$ -$ Loss on Disposition (914,805)$ (197,145)$ -$ Transfers In -$ 17,490$ -$ Transfers Out (11,184)$ -$ -$ Transfers To Governmental 1,091,295$ -$ -$
For The Year Ended December 31, 2019Page 3 of 4
Combining Statement of Cash FlowsInternal Service Funds
Thurston County, Washington 2019
218

Benefits Unempl.Admin Comp. Total
Reconciliation of Operating Income To Net CashProvided (Used) by Operating Income:Operating Income (174,309)$ 147,128$ (114,183)$ Adjustments to Reconcile Operating Income toNet Cash Provided (Used) by Operating Activities:Depreciation Expense - - 4,387,454 (Increase) Decrease in: Customer Account Receivables (71) - 31,150 Due from Other Funds - - (75,481) Due from Other Government Units - - 27,073 Inventories - - 11,355 Prepaid Expense - - (424,949) Increase (Decrease) in: Accounts Payable 3,669 12,432 (40,521) Due to Other Funds - - 200,873 Claims and Judgments - - (336,535) Compensated Absences Payable 8,168 13,754 14,367 Other Post Employment Benefits 7,623 1,667 273,393 Net Pension Liability (7,851) (13,772) (557,215)
Total Adjustments 11,538 14,081 3,510,964
Net Cash Provided (Used) by Operating Activities (162,771)$ 161,209$ 3,396,781$
Noncash Investing, Capital, and Financing Activities: Disposition of Capital Assets: Gain of Disposition -$ -$ 684,966$ Loss on Disposition -$ -$ (1,111,950)$ Transfers In -$ -$ 17,490$ Transfers Out -$ -$ (11,184)$ Transfers To/From Governmental -$ -$ 1,091,295$
For The Year Ended December 31, 2019Page 4 of 4
Combining Statement of Cash FlowsInternal Service Funds
Thurston County, Washington 2019
219

This Page Intentionally Left Blank
Thurston County, Washington 2019
220

FIDUCIARY FUNDS Fiduciary funds are used to account for monies held by Thurston County as an agent or trustee. Amounts held for governmental and custodial units are invested in Thurston County’s Investment Pool. Amounts held for private parties for the Court’s expendable trust funds are held and invested outside and apart from Thurston County’s Investment Pool. These amounts are reported in fiduciary funds in compliance with GASB 84 in the following categories in the Combining Statements of Fiduciary Net Position and Changes in Fiduciary Net Position. Private Purpose Trust Funds - Funds that are not required to be reported in investment trust funds and are held in trust per paragraph 11c(1) of GASB 84. These represent amounts deposited with the County Clerk through Superior Court trust arrangements and agreements and the County’s District Court. Investment Trust Funds – Funds that account for external pooled investments held in trust (as defined by paragraph 11c(1) of GASB 84) by the County Treasurer on behalf of external participants in the County’s investment program. Custodial Funds-External Investment Pools - Funds that account for fiduciary activities that are not reported in investment or private-purpose trust funds. These funds within the County’s investment pool held for external participants are not held in trust on behalf of these participants that meet the criteria in paragraph 11c(1) of GASB 84. Custodial Funds - Funds that account for fiduciary activities that are not reported in investment or private-purpose trust funds. These funds within the County’s investment pool are custodial in nature and are not held for external participants and therefore do meet the criteria in paragraph 11c(1) of GASB 84.”
Thurston County, Washington 2019
221

Custodial Funds
State Passthrough Funds
Other Custodial Funds
External Investment Pool - Cities and Towns
External Investment Pool - Other Custodial
Agencies
ASSETS Cash & Pooled Investments: Pooled Investments At Fair Value 1,632,061$ 255,522$ 998,085$ 83,948$ Trust Funds - - - - Cash in Transit 10,976 - - - Revolving Funds - - - - Advance Travel - - - - Petty Cash - - - - Receivables: Taxes Receivable 1,554,419 - 539,612 68,954 Special Assessment Receivables 31,353 - 84,694 13,832 Accrued Interest & Penalties - - - 30 Due From Other Funds - - - -
Total Assets 3,228,809 255,522 1,622,391 166,764
LIABILITIES Accounts Payable - - - - Taxes & Regulatory Fees Payable 1,639,636 5,545 996,541 83,818 Notes Payable - 7,545 - -
Total Liabilities 1,639,636 13,090 996,541 83,818
NET POSITIONRestricted for: Pool Participants - - - - Individuals, Organizations and Other Governments 1,589,173 242,432 625,850 82,946
Total Net Position 1,589,173$ 242,432$ 625,850$ 82,946$
Combining Statement of Fiduciary Net PositionFiduciary Funds
December 31, 2019Page 1 of 5
Thurston County, Washington 2019
222
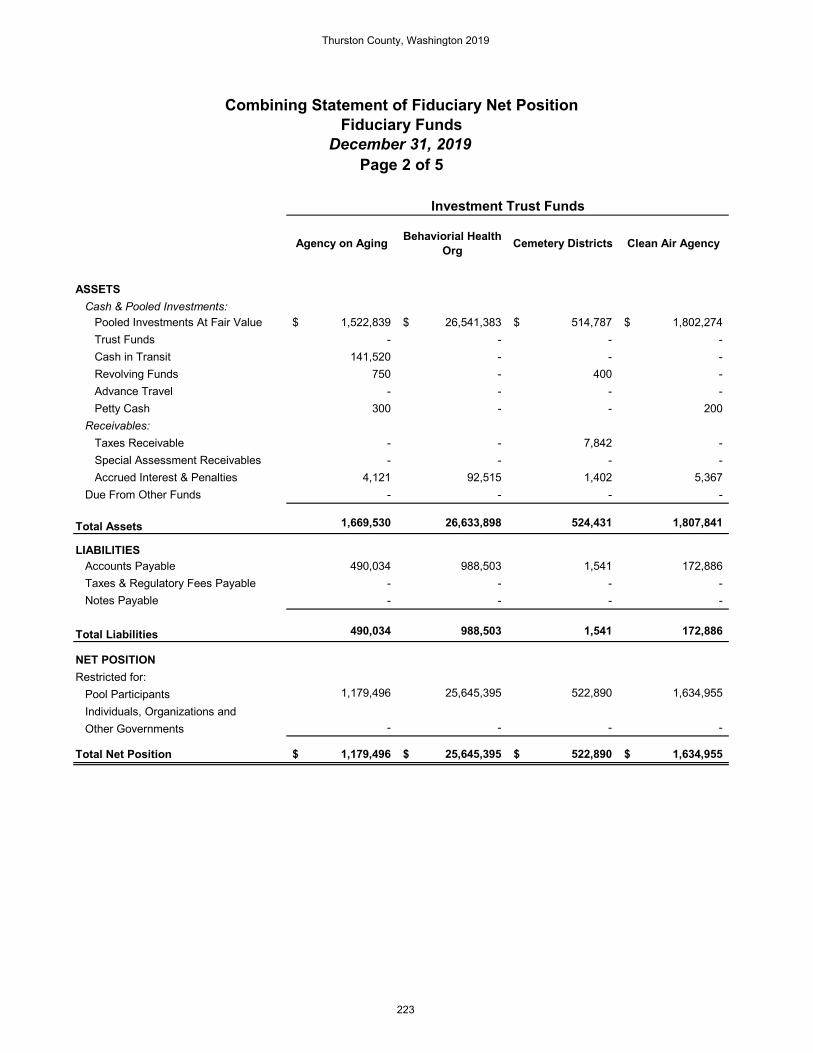
Investment Trust Funds
Agency on Aging Behaviorial Health Org Cemetery Districts Clean Air Agency
ASSETS Cash & Pooled Investments: Pooled Investments At Fair Value 1,522,839$ 26,541,383$ 514,787$ 1,802,274$ Trust Funds - - - - Cash in Transit 141,520 - - - Revolving Funds 750 - 400 - Advance Travel - - - - Petty Cash 300 - - 200 Receivables: Taxes Receivable - - 7,842 - Special Assessment Receivables - - - - Accrued Interest & Penalties 4,121 92,515 1,402 5,367 Due From Other Funds - - - -
Total Assets 1,669,530 26,633,898 524,431 1,807,841
LIABILITIES Accounts Payable 490,034 988,503 1,541 172,886 Taxes & Regulatory Fees Payable - - - - Notes Payable - - - -
Total Liabilities 490,034 988,503 1,541 172,886
NET POSITIONRestricted for: Pool Participants 1,179,496 25,645,395 522,890 1,634,955 Individuals, Organizations and Other Governments - - - -
Total Net Position 1,179,496$ 25,645,395$ 522,890$ 1,634,955$
Combining Statement of Fiduciary Net PositionFiduciary Funds
December 31, 2019Page 2 of 5
Thurston County, Washington 2019
223
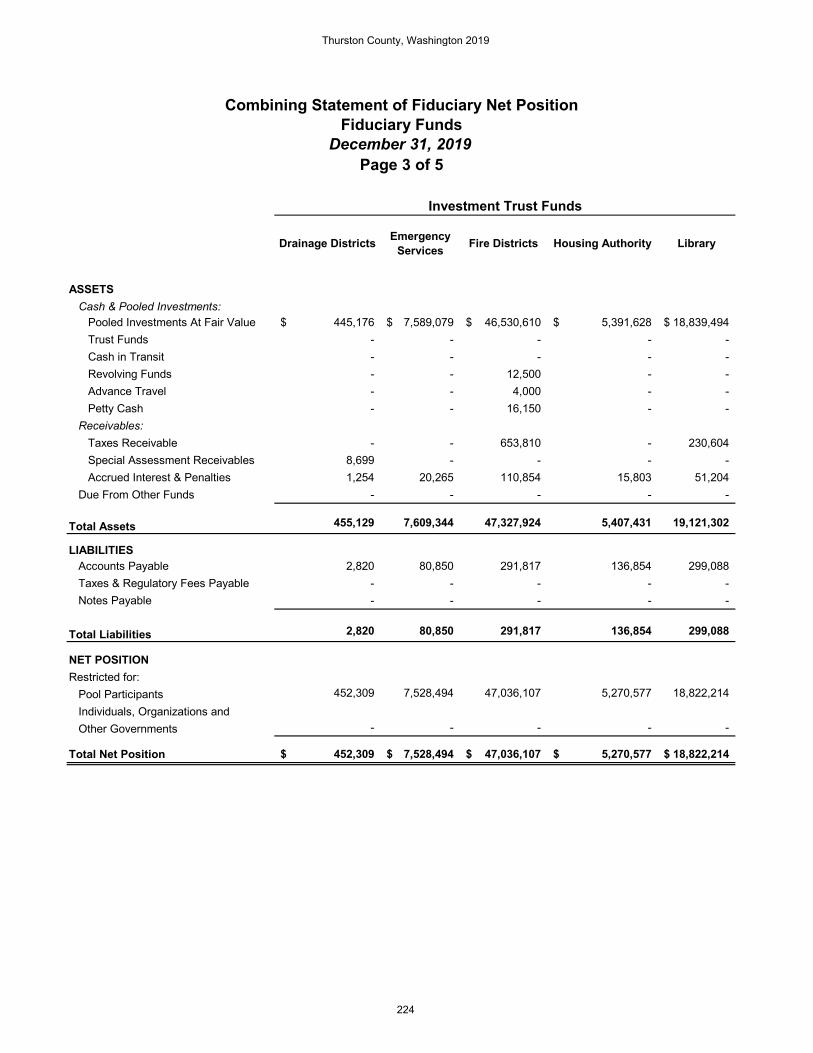
Investment Trust Funds
Drainage Districts Emergency Services Fire Districts Housing Authority Library
ASSETS Cash & Pooled Investments: Pooled Investments At Fair Value 445,176$ 7,589,079$ 46,530,610$ 5,391,628$ 18,839,494$ Trust Funds - - - - - Cash in Transit - - - - - Revolving Funds - - 12,500 - - Advance Travel - - 4,000 - - Petty Cash - - 16,150 - - Receivables: Taxes Receivable - - 653,810 - 230,604 Special Assessment Receivables 8,699 - - - - Accrued Interest & Penalties 1,254 20,265 110,854 15,803 51,204 Due From Other Funds - - - - -
Total Assets 455,129 7,609,344 47,327,924 5,407,431 19,121,302
LIABILITIES Accounts Payable 2,820 80,850 291,817 136,854 299,088 Taxes & Regulatory Fees Payable - - - - - Notes Payable - - - - -
Total Liabilities 2,820 80,850 291,817 136,854 299,088
NET POSITIONRestricted for: Pool Participants 452,309 7,528,494 47,036,107 5,270,577 18,822,214 Individuals, Organizations and Other Governments - - - - -
Total Net Position 452,309$ 7,528,494$ 47,036,107$ 5,270,577$ 18,822,214$
Combining Statement of Fiduciary Net PositionFiduciary Funds
December 31, 2019Page 3 of 5
Thurston County, Washington 2019
224

Investment Trust Funds
Park Districts Port Regional Planning Council School Districts
ASSETS Cash & Pooled Investments: Pooled Investments At Fair Value 26,402$ 9,721,464$ 1,058,352$ 331,355,523$ Trust Funds - - - - Cash in Transit - - 45,114 - Revolving Funds - - - - Advance Travel - - - - Petty Cash - - 100 - Receivables: Taxes Receivable 1,638 114,403 - 2,713,311 Special Assessment Receivables - - - - Accrued Interest & Penalties 74 31,235 2,767 1,061,017 Due From Other Funds - - 319 -
Total Assets 28,114 9,867,102 1,106,652 335,129,851
LIABILITIES Accounts Payable - 44,528 189,323 2,703,635 Taxes & Regulatory Fees Payable - - - - Notes Payable - - - -
Total Liabilities - 44,528 189,323 2,703,635
NET POSITIONRestricted for: Pool Participants 28,114 9,822,574 917,329 332,426,216 Individuals, Organizations and Other Governments - - - -
Total Net Position 28,114$ 9,822,574$ 917,329$ 332,426,216$
Combining Statement of Fiduciary Net PositionFiduciary Funds
December 31, 2019Page 4 of 5
Thurston County, Washington 2019
225

Investment Trust Funds Private Purpose Trust Funds
Transit Authority Utility Districts Clerk WSTIP District Court Total
ASSETS Cash & Pooled Investments: Pooled Investments At Fair Value 113,952,895$ 58,791,902$ -$ -$ -$ 627,053,424$ Trust Funds - - 3,932,602 - 513,998 4,446,600 Cash in Transit - - - - - 197,610 Revolving Funds - - - - - 13,650 Advance Travel - - - - - 4,000 Petty Cash - - - - - 16,750 Receivables: Taxes Receivable - 5,298 - - - 5,889,891 Special Assessment Receivables - - - - - 138,578 Accrued Interest & Penalties 304,683 170,664 - - - 1,873,255 Due From Other Funds - - - - - 319
Total Assets 114,257,578 58,967,864 3,932,602 - 513,998 639,634,077
LIABILITIES Accounts Payable 180,256 85,344 - - - 5,667,479 Taxes & Regulatory Fees Payable - - - - - 2,725,540 Notes Payable - - - - - 7,545
Total Liabilities 180,256 85,344 - - - 8,400,564
NET POSITIONRestricted for: Pool Participants 114,077,322 58,882,520 - - - 624,246,512 Individuals, Organizations and Other Governments - - 3,932,602 - 513,998 6,987,001
Total Net Position 114,077,322$ 58,882,520$ 3,932,602$ -$ 513,998$ 631,233,513$
Combining Statement of Fiduciary Net PositionFiduciary Funds
December 31, 2019Page 5 of 5
Thurston County, Washington 2019
226

Custodial Funds
State Passthrough
Funds
Other Custodial
Funds
External Investment Pool -
Cities and Towns
External Investment Pool - Other Custodial
Agencies
ADDITIONS: Contributions Taxes and Assessments Collected 126,846,171$ 111,117$ 47,354,502$ 4,753,130$ Deposits from Inmates - 208,141 - - Additions by Participants 14,455,560 46,841 319,710 977,496
Total Contributions 141,301,731 366,099 47,674,212 5,730,626
Investment Income 5,592 395 62,737 3,643
Total Additions 141,307,323 366,494 47,736,949 5,734,269
DEDUCTIONS: Distributions to Participants 141,262,881 133,657 47,974,319 5,735,426 Purchases of Merchandise - 169,324 - - Distributions by Participants - - - -
Total Deductions 141,262,881 302,981 47,974,319 5,735,426
Change in Net Position 44,442 63,513 (237,370) (1,157) Net Position as of January 1, 2019 - - - - Cumulative Effect of Change in Acctg Principle 1,544,731 178,919 863,220 84,103 Prior Period Adjustment Net Position as of January 1 - Restated 1,544,731 178,919 863,220 84,103
Net Position as of December 31, 2019 1,589,173$ 242,432$ 625,850$ 82,946$
Combining Statement of Changes in Fiduciary Net PositionFiduciary Funds
December 31, 2019Page 1 of 5
Thurston County, Washington 2019
227

Investment Trust Funds
Agency on Aging
Behaviorial Health Org
Cemetery Districts
Clean Air Agency
ADDITIONS: Contributions Taxes and Assessments Collected -$ -$ 241,984$ -$ Deposits from Inmates - - - - Additions by Participants 8,687,893 61,947,179 90,640 2,430,320
Total Contributions 8,687,893 61,947,179 332,624 2,430,320
Investment Income 26,867 807,114 9,637 39,523
Total Additions 8,714,760 62,754,293 342,261 2,469,843
DEDUCTIONS: Distributions to Participants - - - - Purchases of Merchandise - - - - Distributions by Participants 7,750,650 79,822,151 242,401 2,457,660
Total Deductions 7,750,650 79,822,151 242,401 2,457,660
Change in Net Position 964,110 (17,067,858) 99,860 12,183 Net Position as of January 1, 2019 213,664 42,371,804 419,648 1,609,799 Cumulative Effect of Change in Acctg Principle 1,722 341,449 3,382 12,973 Prior Period Adjustment Net Position as of January 1 - Restated 215,386 42,713,253 423,030 1,622,772
Net Position as of December 31, 2019 1,179,496$ 25,645,395$ 522,890$ 1,634,955$
Combining Statement of Changes in Fiduciary Net PositionFiduciary Funds
December 31, 2019Page 2 of 5
Thurston County, Washington 2019
228

Investment Trust Funds
Drainage Districts
Emergency Services Fire Districts Housing
Authority Library
ADDITIONS: Contributions Taxes and Assessments Collected 217,432$ -$ 39,651,831$ -$ 12,900,735$ Deposits from Inmates - - - - - Additions by Participants - 9,746,480 23,462,336 22,482,398 12,089,647
Total Contributions 217,432 9,746,480 63,114,167 22,482,398 24,990,382
Investment Income 9,184 137,145 744,147 106,636 348,575
Total Additions 226,616 9,883,625 63,858,314 22,589,034 25,338,957
DEDUCTIONS: Distributions to Participants - - - - - Purchases of Merchandise - - - - - Distributions by Participants 177,933 8,239,077 50,823,704 22,807,764 23,149,977
Total Deductions 177,933 8,239,077 50,823,704 22,807,764 23,149,977
Change in Net Position 48,683 1,644,548 13,034,610 (218,730) 2,188,980 Net Position as of January 1, 2019 400,399 5,836,909 33,729,687 5,445,425 16,500,267 Cumulative Effect of Change in Acctg Principle 3,227 47,037 271,810 43,882 132,967 Prior Period Adjustment Net Position as of January 1 - Restated 403,626 5,883,946 34,001,497 5,489,307 16,633,234
Net Position as of December 31, 2019 452,309$ 7,528,494$ 47,036,107$ 5,270,577$ 18,822,214$
Combining Statement of Changes in Fiduciary Net PositionFiduciary Funds
December 31, 2019Page 3 of 5
Thurston County, Washington 2019
229

Investment Trust Funds
Park Districts PortRegional Planning Council
School Districts
ADDITIONS: Contributions Taxes and Assessments Collected 65,929$ 6,554,645$ -$ 135,602,451$ Deposits from Inmates - - - - Additions by Participants - 12,854,224 3,721,088 691,181,912
Total Contributions 65,929 19,408,869 3,721,088 826,784,363
Investment Income 592 214,024 19,986 7,456,353
Total Additions 66,521 19,622,893 3,741,074 834,240,716
DEDUCTIONS: Distributions to Participants - - - - Purchases of Merchandise - - - - Distributions by Participants 76,383 18,275,429 3,615,815 824,665,216
Total Deductions 76,383 18,275,429 3,615,815 824,665,216
Change in Net Position (9,862) 1,347,464 125,259 9,575,500 Net Position as of January 1, 2019 37,672 8,407,360 785,738 320,269,831 Cumulative Effect of Change in Acctg Principle 304 67,750 6,332 2,580,885 Prior Period Adjustment Net Position as of January 1 - Restated 37,976 8,475,110 792,070 322,850,716
Net Position as of December 31, 2019 28,114$ 9,822,574$ 917,329$ 332,426,216$
Combining Statement of Changes in Fiduciary Net PositionFiduciary Funds
December 31, 2019Page 4 of 5
Thurston County, Washington 2019
230
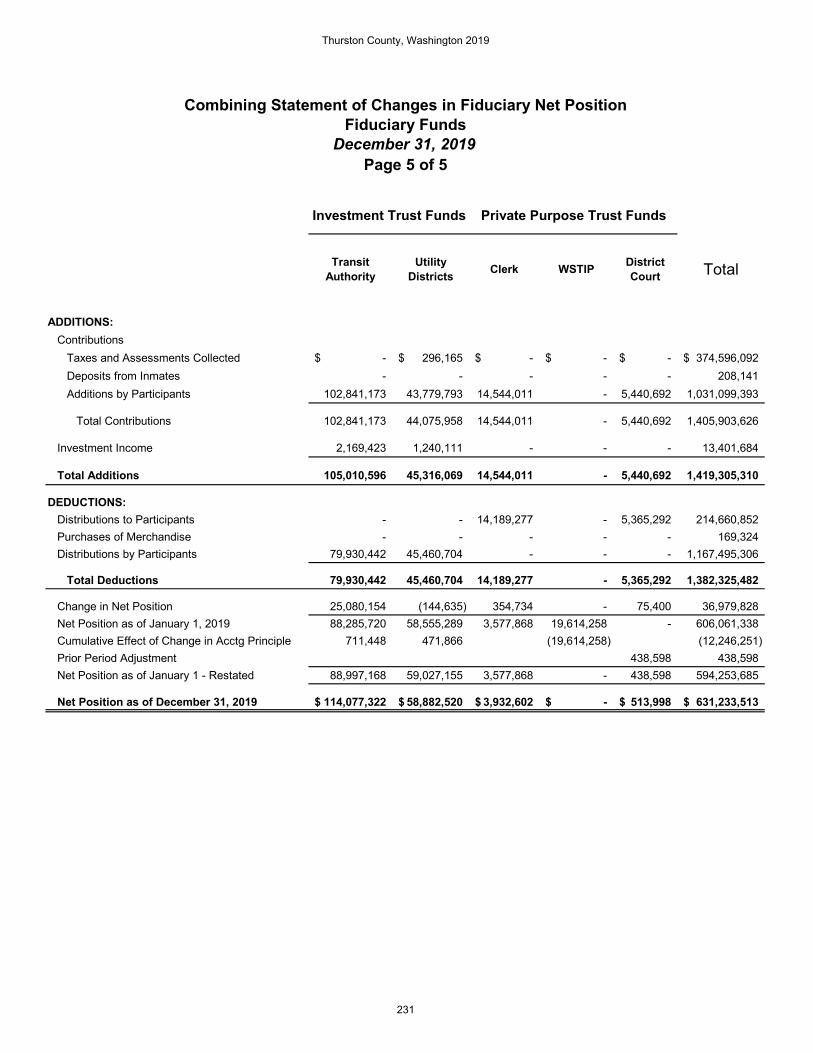
Investment Trust Funds Private Purpose Trust Funds
Transit Authority
Utility Districts Clerk WSTIP District
Court Total
ADDITIONS: Contributions Taxes and Assessments Collected -$ 296,165$ -$ -$ -$ 374,596,092$ Deposits from Inmates - - - - - 208,141 Additions by Participants 102,841,173 43,779,793 14,544,011 - 5,440,692 1,031,099,393
Total Contributions 102,841,173 44,075,958 14,544,011 - 5,440,692 1,405,903,626
Investment Income 2,169,423 1,240,111 - - - 13,401,684
Total Additions 105,010,596 45,316,069 14,544,011 - 5,440,692 1,419,305,310
DEDUCTIONS: Distributions to Participants - - 14,189,277 - 5,365,292 214,660,852 Purchases of Merchandise - - - - - 169,324 Distributions by Participants 79,930,442 45,460,704 - - - 1,167,495,306
Total Deductions 79,930,442 45,460,704 14,189,277 - 5,365,292 1,382,325,482
Change in Net Position 25,080,154 (144,635) 354,734 - 75,400 36,979,828 Net Position as of January 1, 2019 88,285,720 58,555,289 3,577,868 19,614,258 - 606,061,338 Cumulative Effect of Change in Acctg Principle 711,448 471,866 (19,614,258) (12,246,251) Prior Period Adjustment 438,598 438,598 Net Position as of January 1 - Restated 88,997,168 59,027,155 3,577,868 - 438,598 594,253,685
Net Position as of December 31, 2019 114,077,322$ 58,882,520$ 3,932,602$ -$ 513,998$ 631,233,513$
Combining Statement of Changes in Fiduciary Net PositionFiduciary Funds
December 31, 2019Page 5 of 5
Thurston County, Washington 2019
231

This Page Intentionally Left Blank
Thurston County, Washington 2019
232

NONMAJOR SPECIAL REVENUE SUBSIDIARY FUNDS Fair – A fund that uses event service charges, facility rentals and general fund subsidies to fund the annual fair and other activities at the County’s fairgrounds. Election Stabilization Reserve Fund – A fund that provides reserves for funding the fluctuation of election costs. Historic Preservation Fund – A fund that uses a one-dollar surcharge for each document recorded to promote historical preservation or programs. Prisoner Concession – A fund established to use commissary sales and telephone commissions to contribute to the projects, activities and well-being of inmates and their environment. Public Educational and Governmental (PEG) – A fund that collects fees per franchise agreements with local broadcasters. Used for costs associated with providing support and programming for the PEG access channels.
Thurston County, Washington 2019
233
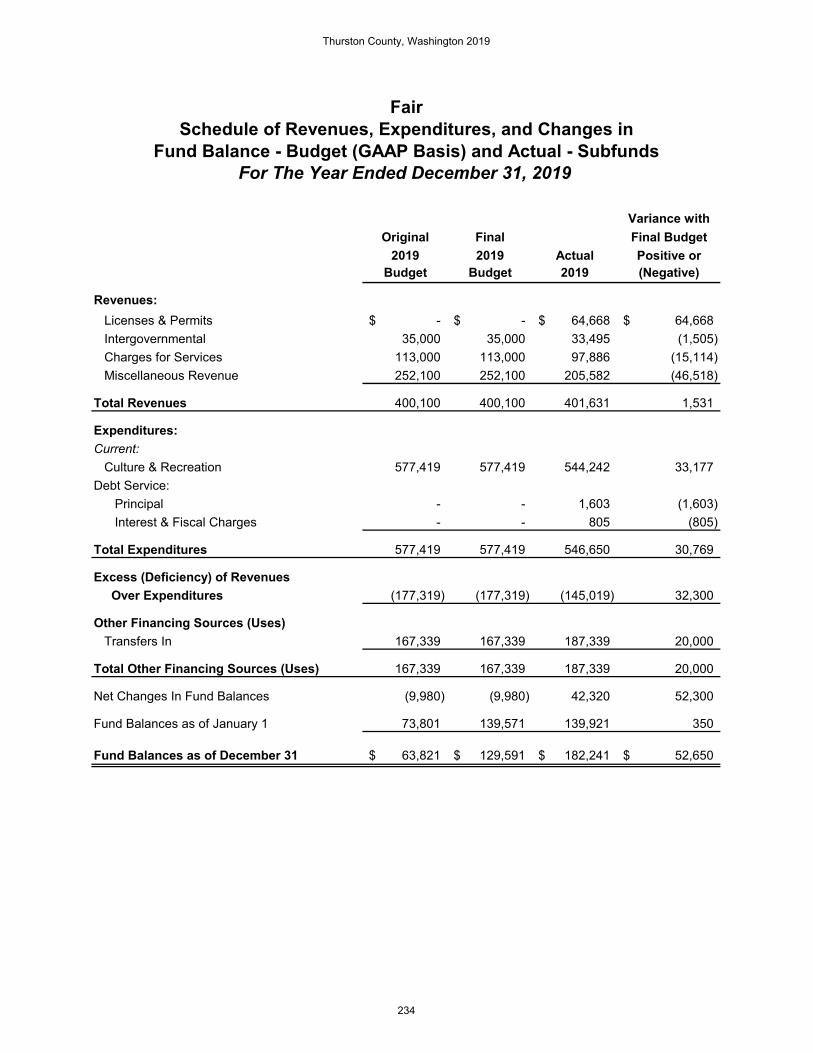
Variance withOriginal Final Final Budget
2019 2019 Actual Positive orBudget Budget 2019 (Negative)
Revenues: Licenses & Permits -$ -$ 64,668$ 64,668$ Intergovernmental 35,000 35,000 33,495 (1,505) Charges for Services 113,000 113,000 97,886 (15,114) Miscellaneous Revenue 252,100 252,100 205,582 (46,518)
Total Revenues 400,100 400,100 401,631 1,531
Expenditures:Current: Culture & Recreation 577,419 577,419 544,242 33,177 Debt Service: Principal - - 1,603 (1,603) Interest & Fiscal Charges - - 805 (805)
Total Expenditures 577,419 577,419 546,650 30,769
Excess (Deficiency) of Revenues Over Expenditures (177,319) (177,319) (145,019) 32,300
Other Financing Sources (Uses) Transfers In 167,339 167,339 187,339 20,000
Total Other Financing Sources (Uses) 167,339 167,339 187,339 20,000
Net Changes In Fund Balances (9,980) (9,980) 42,320 52,300
Fund Balances as of January 1 73,801 139,571 139,921 350
Fund Balances as of December 31 63,821$ 129,591$ 182,241$ 52,650$
FairSchedule of Revenues, Expenditures, and Changes in
Fund Balance - Budget (GAAP Basis) and Actual - SubfundsFor The Year Ended December 31, 2019
Thurston County, Washington 2019
234
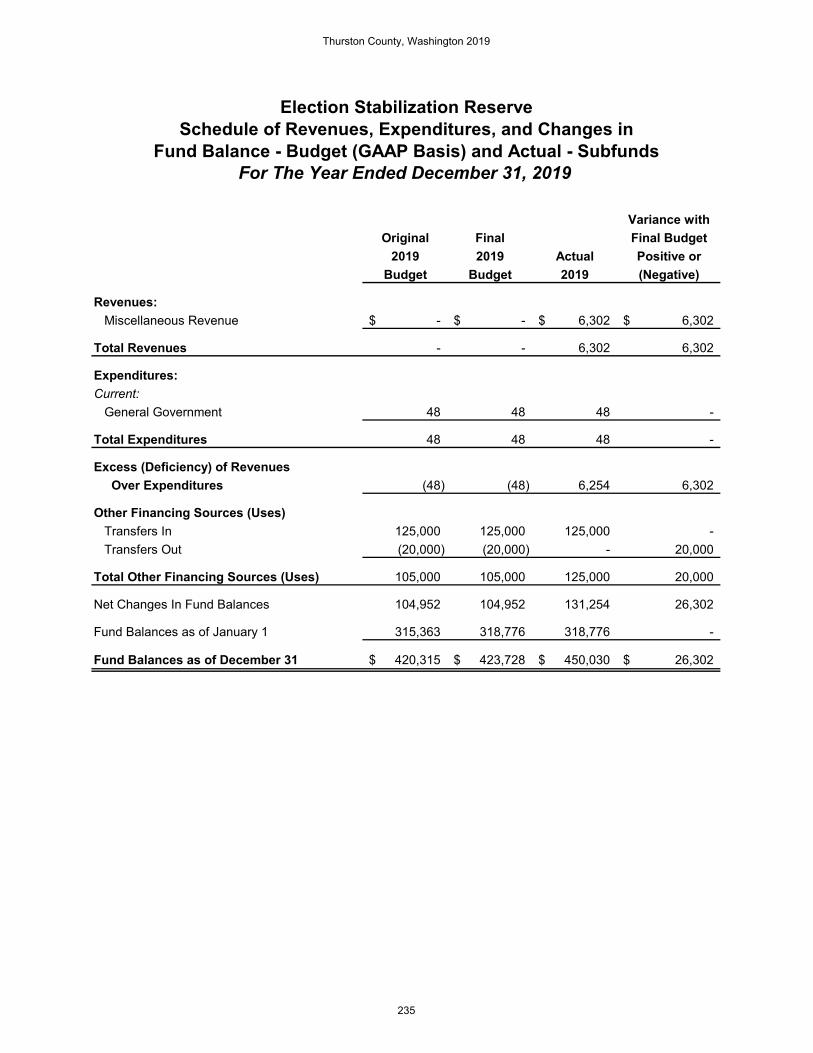
Variance withOriginal Final Final Budget
2019 2019 Actual Positive orBudget Budget 2019 (Negative)
Revenues: Miscellaneous Revenue -$ -$ 6,302$ 6,302$
Total Revenues - - 6,302 6,302
Expenditures:Current: General Government 48 48 48 -
Total Expenditures 48 48 48 -
Excess (Deficiency) of Revenues Over Expenditures (48) (48) 6,254 6,302
Other Financing Sources (Uses) Transfers In 125,000 125,000 125,000 - Transfers Out (20,000) (20,000) - 20,000
Total Other Financing Sources (Uses) 105,000 105,000 125,000 20,000
Net Changes In Fund Balances 104,952 104,952 131,254 26,302
Fund Balances as of January 1 315,363 318,776 318,776 -
Fund Balances as of December 31 420,315$ 423,728$ 450,030$ 26,302$
Election Stabilization ReserveSchedule of Revenues, Expenditures, and Changes in
Fund Balance - Budget (GAAP Basis) and Actual - SubfundsFor The Year Ended December 31, 2019
Thurston County, Washington 2019
235

Variance withOriginal Final Final Budget
2019 2019 Actual Positive orBudget Budget 2019 (Negative)
Revenues: Charges for Services 60,000$ 60,000$ 64,512$ 4,512$ Miscellaneous Revenue 1,923 1,923 4,419 2,496
Total Revenues 61,923 61,923 68,931 7,008
Expenditures:Current: General Government 91,458 91,458 26,606 64,852 Culture & Recreation - - 6,000 (6,000)
Total Expenditures 91,458 91,458 32,606 58,852
Excess (Deficiency) of Revenues Over Expenditures (29,535) (29,535) 36,325 65,860
Other Financing Sources (Uses) Transfers Out (24,000) (24,000) (26,130) (2,130)
Total Other Financing Sources (Uses) (24,000) (24,000) (26,130) (2,130)
Net Changes In Fund Balances (53,535) (53,535) 10,195 63,730
Fund Balances as of January 1 193,676 207,696 207,696 -
Fund Balances as of December 31 140,141$ 154,161$ 217,891$ 63,730$
For The Year Ended December 31, 2019
Historic PreservationSchedule of Revenues, Expenditures, and Changes in
Fund Balance - Budget (GAAP Basis) and Actual - Subfunds
Thurston County, Washington 2019
236

Variance withOriginal Final Final Budget
2019 2019 Actual Positive orBudget Budget 2019 (Negative)
Revenues: Licenses & Permits -$ -$ 103,824$ 103,824$ Charges for Services 242,400 242,400 4,700 (237,700) Miscellaneous Revenue 118,000 118,000 1,653 (116,347)
Total Revenues 360,400 360,400 110,177 (250,223)
Expenditures:Current: Public Safety 344,147 344,147 100,368 243,779
Total Expenditures 344,147 344,147 100,368 243,779
Excess (Deficiency) of Revenues Over Expenditures 16,253 16,253 9,809 (6,444)
Net Changes In Fund Balances 16,253 16,253 9,809 (6,444)
Fund Balances as of January 1 192,744 260,136 260,136 -
Fund Balances as of December 31 208,997$ 276,389$ 269,945$ (6,444)$
Prisoner ConcessionSchedule of Revenues, Expenditures, and Changes in
Fund Balance - Budget (GAAP Basis) and Actual - SubfundsFor The Year Ended December 31, 2019
Thurston County, Washington 2019
237
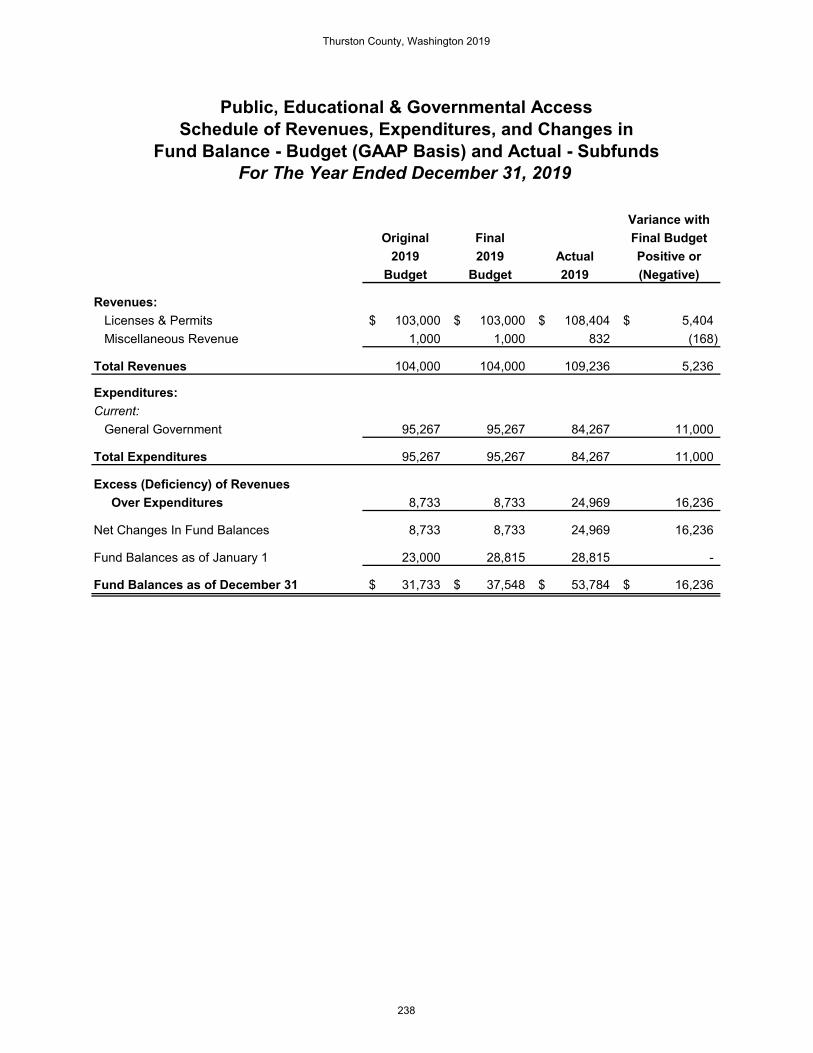
Variance withOriginal Final Final Budget
2019 2019 Actual Positive orBudget Budget 2019 (Negative)
Revenues: Licenses & Permits 103,000$ 103,000$ 108,404$ 5,404$ Miscellaneous Revenue 1,000 1,000 832 (168)
Total Revenues 104,000 104,000 109,236 5,236
Expenditures:Current: General Government 95,267 95,267 84,267 11,000
Total Expenditures 95,267 95,267 84,267 11,000
Excess (Deficiency) of Revenues Over Expenditures 8,733 8,733 24,969 16,236
Net Changes In Fund Balances 8,733 8,733 24,969 16,236
Fund Balances as of January 1 23,000 28,815 28,815 -
Fund Balances as of December 31 31,733$ 37,548$ 53,784$ 16,236$
Fund Balance - Budget (GAAP Basis) and Actual - SubfundsFor The Year Ended December 31, 2019
Public, Educational & Governmental AccessSchedule of Revenues, Expenditures, and Changes in
Thurston County, Washington 2019
238

Statistical Section
The Thurston County Comprehensive Annual Financial Report includes statistical information to show the government’s overall financial health. Financial Trends Schedules 1-4 explain the County’s financial management and health. Revenue Capacity Schedules 5-8 illustrate the County’s largest revenue source, property tax. Debt Capacity Schedules 9-12 contain information on the County’s current level of outstanding debt and ability to issue debt in the future. Thurston County does not issue pledged revenue debt. Demographic and Economic Information Schedules 13-14 show the economic and demographic environment of Thurston County. Operating Information Schedules 15-17 incorporates services the County provides and capital asset and infrastructure information. Sources: Previous comprehensive and annual financial reports, budget workload indicators, and as noted on schedules.
Thurston County, Washington 2019
239

2010 2011 2012 2013 2014Governmental activitiesNet Investment in Capital Assets 369,474,630$ 379,700,249$ 388,913,237$ 396,205,995$ 402,742,302$ Restricted Net Position 123,019,483 114,171,619 112,519,421 70,574,027 72,910,583 Unrestricted 8,639,298 22,407,924 16,589,052 46,651,152 51,995,627 Total governmentalactivities net position 501,133,411 516,279,792 518,021,710 513,431,174 527,648,512
Business-type activitiesNet Investment in Capital Assets 29,716,183 30,267,496 34,019,243 30,617,626 29,842,737 Restricted Net Position 3,993,892 5,198,356 5,596,734 3,970,011 2,458,875 Unrestricted 10,919,784 13,309,861 17,874,279 23,558,098 30,997,159 Total business-typeactivities net position 44,629,859 48,775,713 57,490,256 58,145,735 63,298,771
Primary governmentNet Investment in Capital Assets 399,190,813 409,967,745 422,932,480 426,823,621 432,585,039 Restricted Net Position 127,013,375 119,369,975 118,116,155 74,544,038 75,369,458 Unrestricted 19,559,082 35,717,785 34,463,331 70,209,250 82,992,786
Total primary governmentnet position 545,763,270$ 565,055,505$ 575,511,966$ 571,576,909$ 590,947,283$
Net Position By ComponentLast Ten Fiscal Years
(accrual basis of accounting)Schedule 1Page 1 of 2
Thurston County, Washington 2019
240

2015 2016 2017 2018 2019Governmental activitiesNet Investment in Capital Assets 399,574,658$ 403,865,867$ 401,510,661$ 417,421,171$ 422,610,081$ Restricted Net Position 68,052,131 61,898,850 59,678,896 61,570,890 68,277,233 Unrestricted 24,506,302 5,131,135 10,226,718 6,511,340 20,700,547 Total governmentalactivities net position 492,133,091 470,895,852 471,416,275 485,503,401 511,587,861
Business-type activitiesNet Investment in Capital Assets 28,885,135 30,342,696 30,282,873 30,295,391 32,013,331 Restricted Net Position 2,030,134 875,759 653,567 431,544 185,497 Unrestricted 29,482,869 33,596,732 36,330,821 42,724,863 46,247,699 Total business-typeactivities net position 60,398,138 64,815,187 67,267,261 73,451,798 78,446,527
Primary governmentNet Investment in Capital Assets 428,459,793 434,208,563 431,793,534 447,716,562 454,623,412 Restricted Net Position 70,082,265 62,774,609 60,332,463 62,002,434 68,462,730 Unrestricted 53,989,171 38,727,867 46,557,539 49,236,203 66,948,246
Total primary governmentnet position 552,531,229$ 535,711,039$ 538,683,536$ 558,955,199$ 590,034,388$
Schedule 1Page 2 of 2
Net Position By ComponentLast Ten Fiscal Years
(accrual basis of accounting)
Thurston County, Washington 2019
241

2010 2011 2012 2013 2014Governmental Activities: Expenses (Net of Indirect Expenses): General Government 8,631,534$ 12,451,387$ 7,016,301$ 6,344,596$ 6,412,715$ Culture & Recreation 4,312,994 1,796,682 2,339,289 2,229,405 2,543,965 Economic Environment 15,326,356 6,052,672 7,085,690 8,595,725 8,629,235 Health & Human Services 45,154,389 46,686,199 48,117,848 56,812,854 58,831,809 Public Safety 69,864,003 68,543,177 75,992,534 74,058,431 73,990,662 Transportation 26,688,315 27,849,786 26,594,614 27,098,694 27,421,298 Utilities & Environment 1,284,194 1,813,192 1,897,652 3,138,218 2,253,126 Interest and Fiscal Charges 4,016,966 3,961,926 3,776,247 3,610,284 3,440,826 Total Expenses 175,278,751 169,155,021 172,820,175 181,888,207 183,523,636 Program Revenues: Charges for Services: General Government 5,418,389 5,940,798 6,100,407 7,860,336 7,845,770 Culture & Recreation 768,987 676,193 623,633 683,254 1,172,275 Economic Environment 1,563,871 1,319,872 1,584,452 1,675,529 1,536,422 Health & Human Services 4,263,352 3,127,170 2,691,267 23,186,366 30,699,123 Public Safety 8,647,506 8,650,138 7,317,323 6,290,508 6,957,352 Transportation 4,760,155 5,898,026 1,385,242 1,858,051 1,648,722 Utilities & Environment 689,319 705,356 703,810 688,478 689,652 Operating Grants & Contributions 45,542,586 42,260,776 44,533,116 28,345,069 27,569,926 Capital Grants 5,097,806 16,381,902 11,578,538 11,035,528 15,512,833 Total Program Revenues 76,751,971 84,960,231 76,517,788 81,623,119 93,632,075 Total Net Expense (98,526,780) (84,194,790) (96,302,387) (100,265,088) (89,891,561) General Revenues & Other Items: Taxes 103,779,418 87,428,011 94,942,556 99,312,211 102,096,192 Other General Revenues 6,266,385 5,567,086 5,157,934 3,826,373 3,086,524 Special Items, Transfers & Adjustments (168,677) 6,346,074 (2,056,185) (7,464,032) (1,073,817) Total General Revenues & Other Items 109,877,126 99,341,171 98,044,305 95,674,552 104,108,899 Change in Net Position 11,350,346 15,146,381 1,741,918 (4,590,536) 14,217,338
Changes in Net PositionLast Ten Years
Schedule 2Page 1 of 4
Thurston County, Washington 2019
242
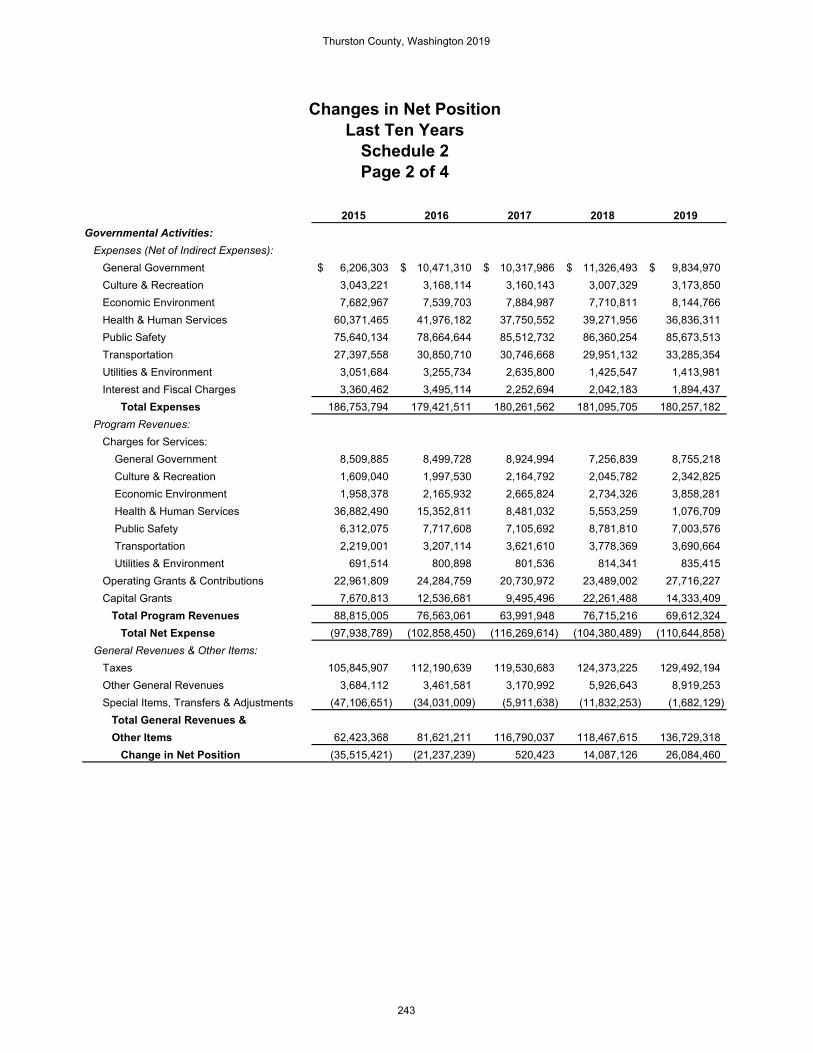
2015 2016 2017 2018 2019Governmental Activities: Expenses (Net of Indirect Expenses): General Government 6,206,303$ 10,471,310$ 10,317,986$ 11,326,493$ 9,834,970$ Culture & Recreation 3,043,221 3,168,114 3,160,143 3,007,329 3,173,850 Economic Environment 7,682,967 7,539,703 7,884,987 7,710,811 8,144,766 Health & Human Services 60,371,465 41,976,182 37,750,552 39,271,956 36,836,311 Public Safety 75,640,134 78,664,644 85,512,732 86,360,254 85,673,513 Transportation 27,397,558 30,850,710 30,746,668 29,951,132 33,285,354 Utilities & Environment 3,051,684 3,255,734 2,635,800 1,425,547 1,413,981 Interest and Fiscal Charges 3,360,462 3,495,114 2,252,694 2,042,183 1,894,437 Total Expenses 186,753,794 179,421,511 180,261,562 181,095,705 180,257,182 Program Revenues: Charges for Services: General Government 8,509,885 8,499,728 8,924,994 7,256,839 8,755,218 Culture & Recreation 1,609,040 1,997,530 2,164,792 2,045,782 2,342,825 Economic Environment 1,958,378 2,165,932 2,665,824 2,734,326 3,858,281 Health & Human Services 36,882,490 15,352,811 8,481,032 5,553,259 1,076,709 Public Safety 6,312,075 7,717,608 7,105,692 8,781,810 7,003,576 Transportation 2,219,001 3,207,114 3,621,610 3,778,369 3,690,664 Utilities & Environment 691,514 800,898 801,536 814,341 835,415 Operating Grants & Contributions 22,961,809 24,284,759 20,730,972 23,489,002 27,716,227 Capital Grants 7,670,813 12,536,681 9,495,496 22,261,488 14,333,409 Total Program Revenues 88,815,005 76,563,061 63,991,948 76,715,216 69,612,324 Total Net Expense (97,938,789) (102,858,450) (116,269,614) (104,380,489) (110,644,858) General Revenues & Other Items: Taxes 105,845,907 112,190,639 119,530,683 124,373,225 129,492,194 Other General Revenues 3,684,112 3,461,581 3,170,992 5,926,643 8,919,253 Special Items, Transfers & Adjustments (47,106,651) (34,031,009) (5,911,638) (11,832,253) (1,682,129) Total General Revenues & Other Items 62,423,368 81,621,211 116,790,037 118,467,615 136,729,318 Change in Net Position (35,515,421) (21,237,239) 520,423 14,087,126 26,084,460
Changes in Net PositionLast Ten Years
Schedule 2Page 2 of 4
Thurston County, Washington 2019
243

2010 2011 2012 2013 2014Business-Type Activities Expenses (Net of Indirect Expenses): Solid Waste 16,675,874 16,257,083 17,099,113 17,492,669 18,349,420 Land Use and Permitting 3,322,395 3,519,591 3,514,208 3,448,720 3,456,285 Other Utilities 5,912,654 5,522,200 6,310,626 6,827,353 6,755,328 Total Expenses 25,910,923 25,298,874 26,923,947 27,768,742 28,561,033 Program Revenues: Charges for Services: Solid Waste 19,925,078 18,980,963 20,884,983 20,329,957 20,875,869 Land Use & Permitting 3,383,773 2,882,951 2,809,748 2,889,663 3,039,753 Other Utilities 4,801,913 5,132,589 5,917,307 6,451,550 7,907,929 Operating Grants & Contributions 772,906 470,051 549,431 219,192 274,228 Capital Grants 45,114 541,632 238,716 171,159 373,572 Total Program Revenues 28,928,784 28,008,186 30,400,185 30,061,521 32,471,351 Total Net Expense 3,017,861 2,709,312 3,476,238 2,292,779 3,910,318 General Revenues & Other Items: Other General Revenues 838,925 300,773 409,873 33,425 168,901 Special Items, Transfers & Adjustments 950,340 1,135,769 4,828,432 (1,670,725) 1,073,817 Total General Revenues & Other Items 1,789,265 1,436,542 5,238,305 (1,637,300) 1,242,718 Change in Net Position 4,807,126 4,145,854 8,714,543 655,479 5,153,036
Total Change In Net Position 16,157,472$ 19,292,235$ 10,456,461$ (3,935,057)$ 19,370,374$
Changes in Net PositionLast Ten Years
Schedule 2Page 3 of 4
Thurston County, Washington 2019
244
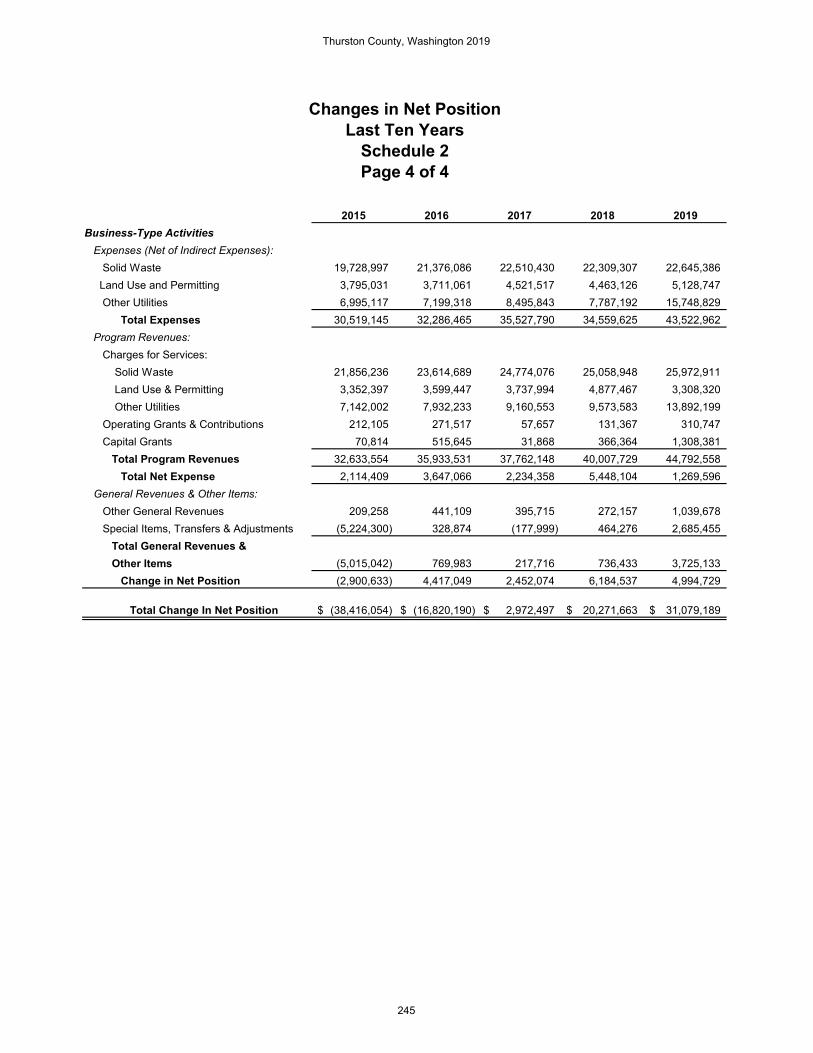
2015 2016 2017 2018 2019Business-Type Activities Expenses (Net of Indirect Expenses): Solid Waste 19,728,997 21,376,086 22,510,430 22,309,307 22,645,386 Land Use and Permitting 3,795,031 3,711,061 4,521,517 4,463,126 5,128,747 Other Utilities 6,995,117 7,199,318 8,495,843 7,787,192 15,748,829 Total Expenses 30,519,145 32,286,465 35,527,790 34,559,625 43,522,962 Program Revenues: Charges for Services: Solid Waste 21,856,236 23,614,689 24,774,076 25,058,948 25,972,911 Land Use & Permitting 3,352,397 3,599,447 3,737,994 4,877,467 3,308,320 Other Utilities 7,142,002 7,932,233 9,160,553 9,573,583 13,892,199 Operating Grants & Contributions 212,105 271,517 57,657 131,367 310,747 Capital Grants 70,814 515,645 31,868 366,364 1,308,381 Total Program Revenues 32,633,554 35,933,531 37,762,148 40,007,729 44,792,558 Total Net Expense 2,114,409 3,647,066 2,234,358 5,448,104 1,269,596 General Revenues & Other Items: Other General Revenues 209,258 441,109 395,715 272,157 1,039,678 Special Items, Transfers & Adjustments (5,224,300) 328,874 (177,999) 464,276 2,685,455 Total General Revenues & Other Items (5,015,042) 769,983 217,716 736,433 3,725,133 Change in Net Position (2,900,633) 4,417,049 2,452,074 6,184,537 4,994,729
Total Change In Net Position (38,416,054)$ (16,820,190)$ 2,972,497$ 20,271,663$ 31,079,189$
Schedule 2Page 4 of 4
Changes in Net PositionLast Ten Years
Thurston County, Washington 2019
245

2010 2011 2012 2013 2014
General fund Nonspendable -$ 2,289,785$ 2,346,978$ 1,693,349$ 1,847,292$ Restricted - 42,033 5,775 66,345 92,244 Unreserved (Prior to 2011) 15,066,274 - - - - Unassigned - 16,119,833 14,197,193 9,068,302 9,865,708 Total general fund 15,066,274 18,451,651 16,549,946 10,827,996 11,805,244
All other governmental funds Nonspendable - 585,226 449,009 1,099,040 1,129,587 Restricted - 66,933,770 53,424,803 43,732,434 43,982,674 Reserved (Prior to 2011) 906,697 - - - - Committed - - 336,395 266,808 178,495 Assigned - 26,592,999 34,813,376 41,683,842 49,108,377 Unreserved (Prior to 2011) 111,107,110 - - - - Unassigned - (17,054) (782,218) - 981,566 Total all other governmental funds 112,013,807 94,094,941 88,241,365 86,782,124 95,380,699
Total governmental fund balances 127,080,081$ 112,546,592$ 104,791,311$ 97,610,120$ 107,185,943$
Fund Balances, Governmental FundsLast Ten Fiscal Years
(modified basis of accounting)Schedule 3 (*)
Page 1 of 2
Thurston County, Washington 2019
246
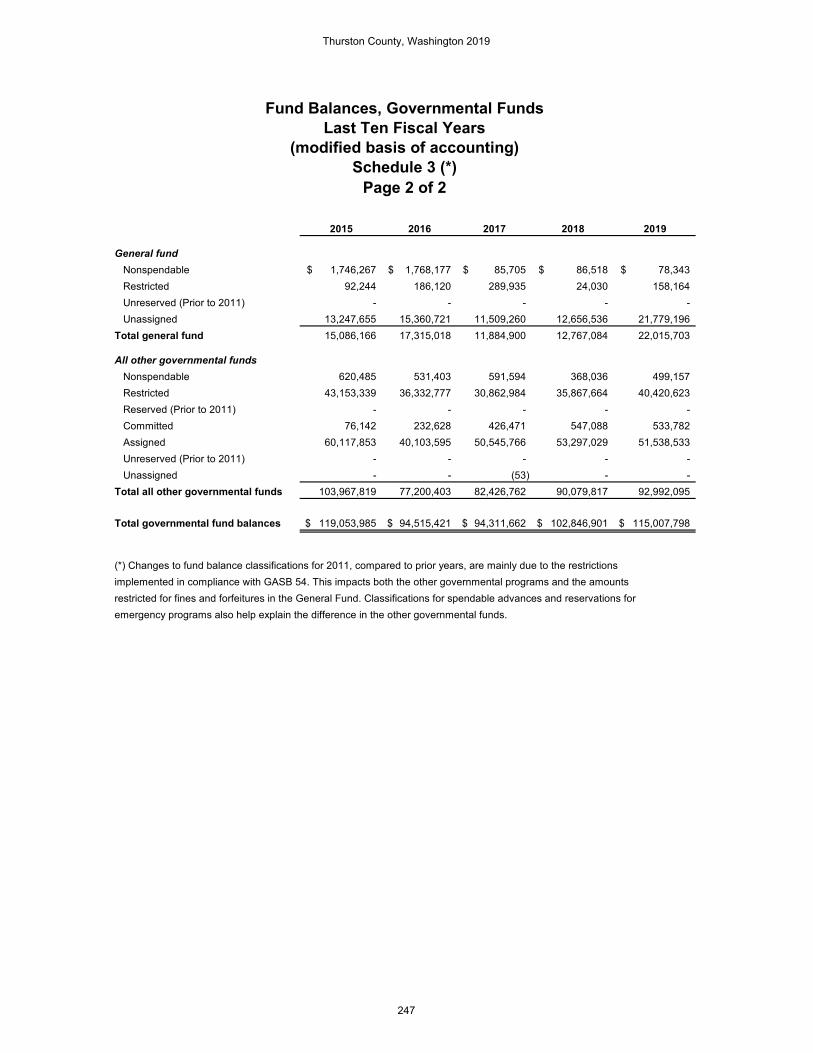
2015 2016 2017 2018 2019
General fund Nonspendable 1,746,267$ 1,768,177$ 85,705$ 86,518$ 78,343$ Restricted 92,244 186,120 289,935 24,030 158,164 Unreserved (Prior to 2011) - - - - - Unassigned 13,247,655 15,360,721 11,509,260 12,656,536 21,779,196 Total general fund 15,086,166 17,315,018 11,884,900 12,767,084 22,015,703
All other governmental funds Nonspendable 620,485 531,403 591,594 368,036 499,157 Restricted 43,153,339 36,332,777 30,862,984 35,867,664 40,420,623 Reserved (Prior to 2011) - - - - - Committed 76,142 232,628 426,471 547,088 533,782 Assigned 60,117,853 40,103,595 50,545,766 53,297,029 51,538,533 Unreserved (Prior to 2011) - - - - - Unassigned - - (53) - - Total all other governmental funds 103,967,819 77,200,403 82,426,762 90,079,817 92,992,095
Total governmental fund balances 119,053,985$ 94,515,421$ 94,311,662$ 102,846,901$ 115,007,798$
Fund Balances, Governmental FundsLast Ten Fiscal Years
(modified basis of accounting)
restricted for fines and forfeitures in the General Fund. Classifications for spendable advances and reservations for emergency programs also help explain the difference in the other governmental funds.
Schedule 3 (*)Page 2 of 2
(*) Changes to fund balance classifications for 2011, compared to prior years, are mainly due to the restrictionsimplemented in compliance with GASB 54. This impacts both the other governmental programs and the amounts
Thurston County, Washington 2019
247

2010 2011 2012 2013 2014
Revenues
Taxes 94,979,502$ 90,358,043$ 98,850,775$ 98,197,510$ 101,465,719$
Licenses & Permits 2,868,901 3,048,415 2,980,102 3,068,347 3,189,969
Intergovernmental 66,324,115 64,452,288 57,633,792 39,116,873 41,399,793
Charges for Services 17,986,272 17,884,808 16,433,005 39,923,061 49,131,127
Licenses & Permits 1,951,651 1,964,441 1,877,712 2,740,954 2,936,782
Miscellaneous Revenues 4,976,525 3,903,509 3,379,273 5,245,674 4,916,959
Total Revenues 189,086,966 181,611,504 181,154,659 188,292,419 203,040,349
Expenditures
Current:
General Government 13,137,478 14,786,791 14,738,755 14,269,072 14,100,437
Culture & Recreation 3,774,411 1,239,891 1,801,680 1,871,206 2,147,793
Economic Environment 15,369,767 5,711,593 6,773,457 8,343,894 8,412,577
Health & Human Services 44,298,063 45,380,280 47,133,080 56,513,076 58,313,051
Public Safety 66,012,224 64,088,451 71,972,422 69,148,914 68,048,020
Transportation 20,568,696 20,376,567 19,155,696 20,003,339 20,239,099
Utilities & Environment 1,316,786 1,547,404 1,745,844 3,009,658 2,113,376
Capital Outlay 19,271,963 33,410,436 15,016,833 13,072,588 12,182,681
Debt Service:
Principal 3,381,295 4,042,259 4,365,372 4,613,266 5,086,459
Interest & Fiscal Charges 4,396,504 4,023,798 3,806,411 3,656,379 3,486,921
Total Expenditures 191,527,187 194,607,470 186,509,550 194,501,392 194,130,414
Excess of Revenues Over (under)
Expenditures (2,440,221) (12,995,966) (5,354,891) (6,208,973) 8,909,935
Changes in Fund Balances, Governmental FundsLast Ten Years
Schedule 4Page 1 of 4
Thurston County, Washington 2019
248
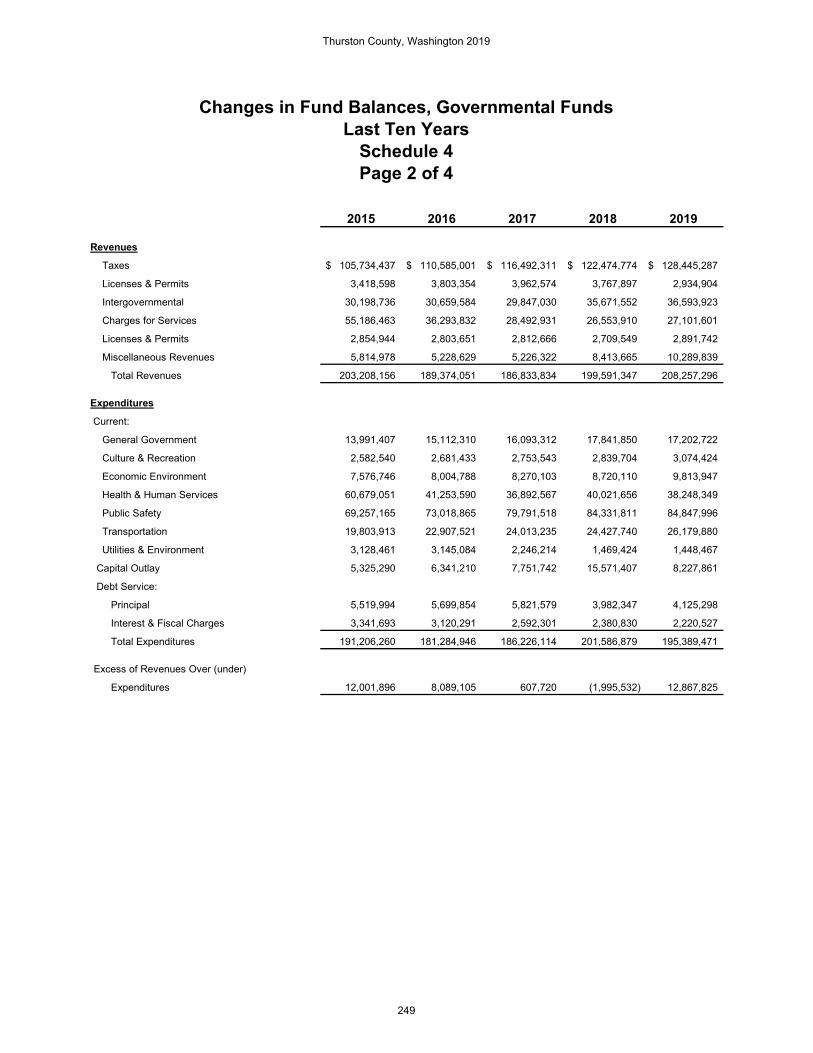
2015 2016 2017 2018 2019
Revenues
Taxes 105,734,437$ 110,585,001$ 116,492,311$ 122,474,774$ 128,445,287$
Licenses & Permits 3,418,598 3,803,354 3,962,574 3,767,897 2,934,904
Intergovernmental 30,198,736 30,659,584 29,847,030 35,671,552 36,593,923
Charges for Services 55,186,463 36,293,832 28,492,931 26,553,910 27,101,601
Licenses & Permits 2,854,944 2,803,651 2,812,666 2,709,549 2,891,742
Miscellaneous Revenues 5,814,978 5,228,629 5,226,322 8,413,665 10,289,839
Total Revenues 203,208,156 189,374,051 186,833,834 199,591,347 208,257,296
Expenditures
Current:
General Government 13,991,407 15,112,310 16,093,312 17,841,850 17,202,722
Culture & Recreation 2,582,540 2,681,433 2,753,543 2,839,704 3,074,424
Economic Environment 7,576,746 8,004,788 8,270,103 8,720,110 9,813,947
Health & Human Services 60,679,051 41,253,590 36,892,567 40,021,656 38,248,349
Public Safety 69,257,165 73,018,865 79,791,518 84,331,811 84,847,996
Transportation 19,803,913 22,907,521 24,013,235 24,427,740 26,179,880
Utilities & Environment 3,128,461 3,145,084 2,246,214 1,469,424 1,448,467
Capital Outlay 5,325,290 6,341,210 7,751,742 15,571,407 8,227,861
Debt Service:
Principal 5,519,994 5,699,854 5,821,579 3,982,347 4,125,298
Interest & Fiscal Charges 3,341,693 3,120,291 2,592,301 2,380,830 2,220,527
Total Expenditures 191,206,260 181,284,946 186,226,114 201,586,879 195,389,471
Excess of Revenues Over (under)
Expenditures 12,001,896 8,089,105 607,720 (1,995,532) 12,867,825
Changes in Fund Balances, Governmental FundsLast Ten Years
Schedule 4Page 2 of 4
Thurston County, Washington 2019
249
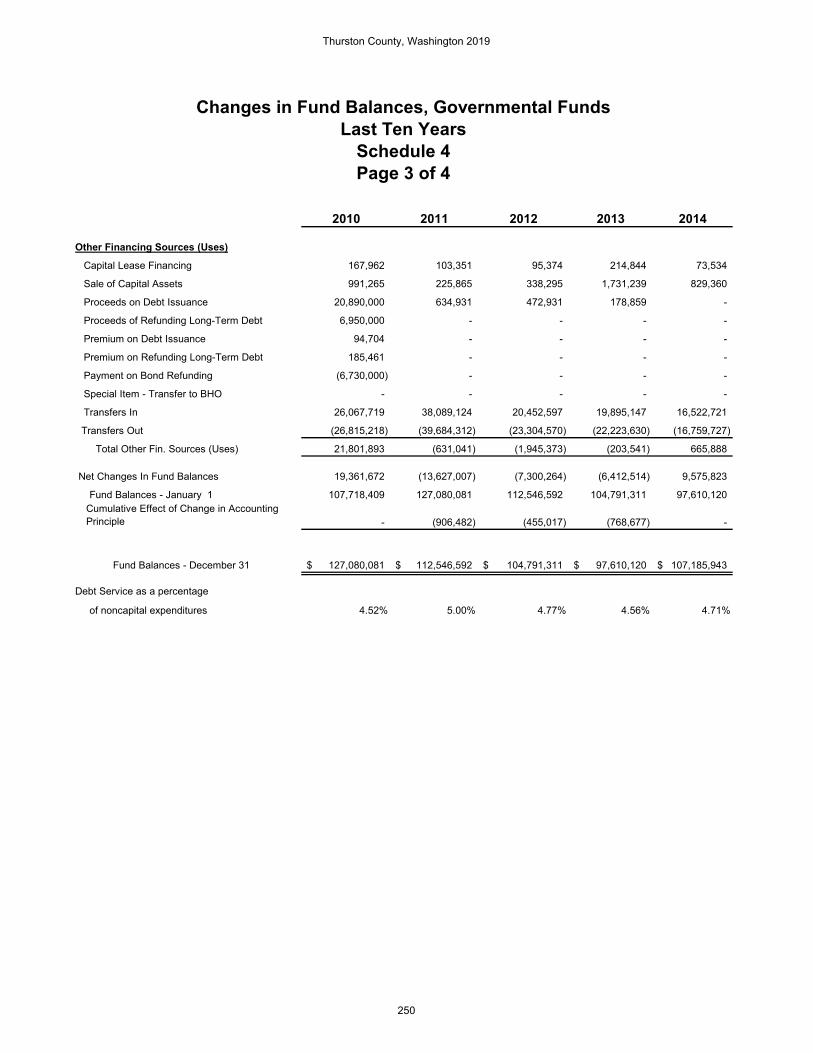
2010 2011 2012 2013 2014
Other Financing Sources (Uses)
Capital Lease Financing 167,962 103,351 95,374 214,844 73,534
Sale of Capital Assets 991,265 225,865 338,295 1,731,239 829,360
Proceeds on Debt Issuance 20,890,000 634,931 472,931 178,859 -
Proceeds of Refunding Long-Term Debt 6,950,000 - - - -
Premium on Debt Issuance 94,704 - - - -
Premium on Refunding Long-Term Debt 185,461 - - - -
Payment on Bond Refunding (6,730,000) - - - -
Special Item - Transfer to BHO - - - - -
Transfers In 26,067,719 38,089,124 20,452,597 19,895,147 16,522,721
Transfers Out (26,815,218) (39,684,312) (23,304,570) (22,223,630) (16,759,727)
Total Other Fin. Sources (Uses) 21,801,893 (631,041) (1,945,373) (203,541) 665,888
Net Changes In Fund Balances 19,361,672 (13,627,007) (7,300,264) (6,412,514) 9,575,823
Fund Balances - January 1 107,718,409 127,080,081 112,546,592 104,791,311 97,610,120 Cumulative Effect of Change in Accounting Principle - (906,482) (455,017) (768,677) -
Fund Balances - December 31 127,080,081$ 112,546,592$ 104,791,311$ 97,610,120$ 107,185,943$
Debt Service as a percentage
of noncapital expenditures 4.52% 5.00% 4.77% 4.56% 4.71%
Changes in Fund Balances, Governmental FundsLast Ten Years
Schedule 4Page 3 of 4
Thurston County, Washington 2019
250

2015 2016 2017 2018 2019
Other Financing Sources (Uses)
Capital Lease Financing 117,041 80,260 96,145 137,098 54,256
Sale of Capital Assets 924,307 2,070,416 4,037,162 1,831,779 1,183,351
Proceeds on Debt Issuance 10,463,228 - - - -
Proceeds of Refunding Long-Term Debt - 32,899,823 - 574,913 -
Premium on Debt Issuance (*) 1,171,772 - - - -
Premium on Refunding Long-Term Debt - 4,659,147 - - -
Payment on Bond Refunding (*) (11,635,000) (37,558,970) - - -
Special Item - Transfer to BHO - (33,702,135) - - -
Transfers In 17,318,204 15,145,168 16,847,792 20,082,839 12,115,136
Transfers Out (18,493,406) (16,221,378) (20,327,666) (19,254,591) (15,327,078)
Total Other Fin. Sources (Uses) (133,854) (32,627,669) 653,433 3,372,038 (1,974,335)
Net Changes In Fund Balances 11,868,042 (24,538,564) 1,261,153 1,376,506 10,893,490
Fund Balances - January 1 107,185,943 119,053,985 94,515,421 94,311,662 102,846,901 Cumulative Effect of Change in Accounting Principle - - (1,464,912) 7,158,733 1,267,407
Fund Balances - December 31 119,053,985$ 94,515,421$ 94,311,662$ 102,846,901$ 115,007,798$
4.77% 5.04% 4.71% 3.42% 3.39%
Changes in Fund Balances, Governmental FundsLast Ten Years
Schedule 4Page 4 of 4
(*) Premium on Debt Issuance and Payment on Bond Refunding corrected for 2015.
Thurston County, Washington 2019
251
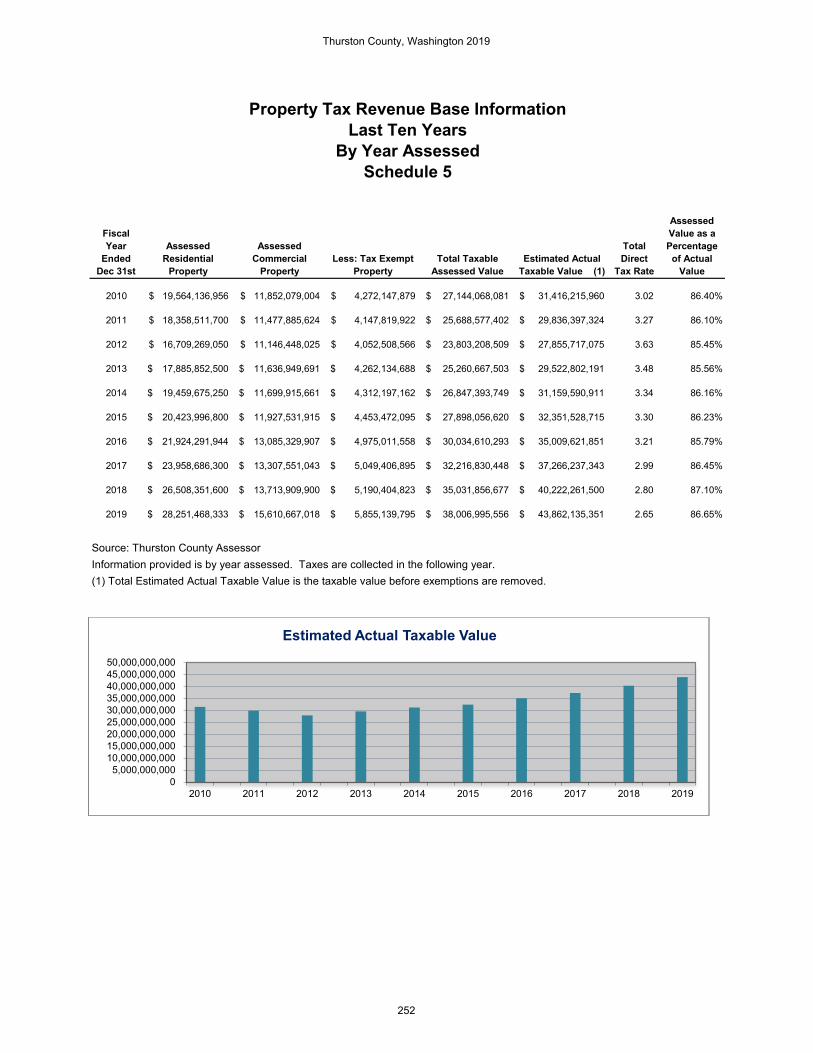
Fiscal Year
Ended Dec 31st
Assessed Residential
Property
Assessed Commercial
Property Less: Tax Exempt
PropertyTotal Taxable
Assessed Value Estimated Actual
Taxable Value (1)
Total Direct
Tax Rate
Assessed Value as a Percentage
of Actual Value
2010 19,564,136,956$ 11,852,079,004$ 4,272,147,879$ 27,144,068,081$ 31,416,215,960$ 3.02 86.40%
2011 18,358,511,700$ 11,477,885,624$ 4,147,819,922$ 25,688,577,402$ 29,836,397,324$ 3.27 86.10%
2012 16,709,269,050$ 11,146,448,025$ 4,052,508,566$ 23,803,208,509$ 27,855,717,075$ 3.63 85.45%
2013 17,885,852,500$ 11,636,949,691$ 4,262,134,688$ 25,260,667,503$ 29,522,802,191$ 3.48 85.56%
2014 19,459,675,250$ 11,699,915,661$ 4,312,197,162$ 26,847,393,749$ 31,159,590,911$ 3.34 86.16%
2015 20,423,996,800$ 11,927,531,915$ 4,453,472,095$ 27,898,056,620$ 32,351,528,715$ 3.30 86.23%
2016 21,924,291,944$ 13,085,329,907$ 4,975,011,558$ 30,034,610,293$ 35,009,621,851$ 3.21 85.79%
2017 23,958,686,300$ 13,307,551,043$ 5,049,406,895$ 32,216,830,448$ 37,266,237,343$ 2.99 86.45%
2018 26,508,351,600$ 13,713,909,900$ 5,190,404,823$ 35,031,856,677$ 40,222,261,500$ 2.80 87.10%
2019 28,251,468,333$ 15,610,667,018$ 5,855,139,795$ 38,006,995,556$ 43,862,135,351$ 2.65 86.65%
(1) Total Estimated Actual Taxable Value is the taxable value before exemptions are removed.
Source: Thurston County AssessorInformation provided is by year assessed. Taxes are collected in the following year.
Property Tax Revenue Base InformationLast Ten Years
By Year AssessedSchedule 5
05,000,000,000
10,000,000,00015,000,000,00020,000,000,00025,000,000,00030,000,000,00035,000,000,00040,000,000,000
2005 0 2006 0 2007 0 2008 0 2009 0 2010 0 2011 0 2012 0 2013 0 2014
Estimated Actual Taxable Value
05,000,000,000
10,000,000,00015,000,000,00020,000,000,00025,000,000,00030,000,000,00035,000,000,00040,000,000,00045,000,000,00050,000,000,000
2010 2011 2012 2013 2014 2015 2016 2017 2018 2019
Estimated Actual Taxable Value
Thurston County, Washington 2019
252
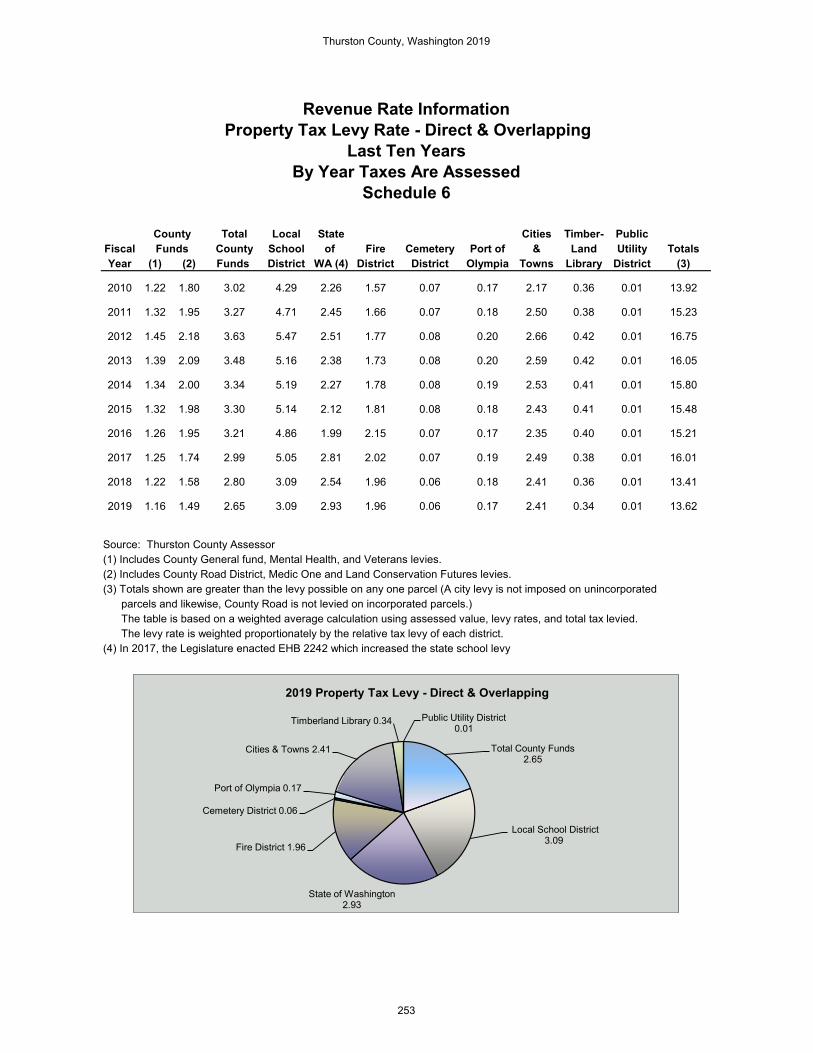
Total Local State Cities Timber- PublicFiscal County School of Fire Cemetery Port of & Land Utility TotalsYear (1) (2) Funds District WA (4) District District Olympia Towns Library District (3)
2010 1.22 1.80 3.02 4.29 2.26 1.57 0.07 0.17 2.17 0.36 0.01 13.92
2011 1.32 1.95 3.27 4.71 2.45 1.66 0.07 0.18 2.50 0.38 0.01 15.23
2012 1.45 2.18 3.63 5.47 2.51 1.77 0.08 0.20 2.66 0.42 0.01 16.75
2013 1.39 2.09 3.48 5.16 2.38 1.73 0.08 0.20 2.59 0.42 0.01 16.05
2014 1.34 2.00 3.34 5.19 2.27 1.78 0.08 0.19 2.53 0.41 0.01 15.80
2015 1.32 1.98 3.30 5.14 2.12 1.81 0.08 0.18 2.43 0.41 0.01 15.48
2016 1.26 1.95 3.21 4.86 1.99 2.15 0.07 0.17 2.35 0.40 0.01 15.21
2017 1.25 1.74 2.99 5.05 2.81 2.02 0.07 0.19 2.49 0.38 0.01 16.01
2018 1.22 1.58 2.80 3.09 2.54 1.96 0.06 0.18 2.41 0.36 0.01 13.41
2019 1.16 1.49 2.65 3.09 2.93 1.96 0.06 0.17 2.41 0.34 0.01 13.62
(4) In 2017, the Legislature enacted EHB 2242 which increased the state school levy
County
Revenue Rate InformationProperty Tax Levy Rate - Direct & Overlapping
Last Ten YearsBy Year Taxes Are Assessed
Schedule 6
The levy rate is weighted proportionately by the relative tax levy of each district.
Source: Thurston County Assessor(1) Includes County General fund, Mental Health, and Veterans levies.
Funds
(2) Includes County Road District, Medic One and Land Conservation Futures levies.(3) Totals shown are greater than the levy possible on any one parcel (A city levy is not imposed on unincorporated parcels and likewise, County Road is not levied on incorporated parcels.) The table is based on a weighted average calculation using assessed value, levy rates, and total tax levied.
Total County Funds 3.34
Local School District 5.19State of Washington
2.27
Fire District 1.78
Cemetery District 0.08
Port of Olympia 0.19
Cities & Towns 2.53
Timberland Library 0.41 Public Utility District 0.01
2014 Property Tax Levy - Direct & Overlapping
Total County Funds 2.65
Local School District 3.09
State of Washington 2.93
Fire District 1.96
Cemetery District 0.06
Port of Olympia 0.17
Cities & Towns 2.41
Timberland Library 0.34 Public Utility District 0.01
2019 Property Tax Levy - Direct & Overlapping
Thurston County, Washington 2019
253

TAXPAYERTaxable Assessed
Value Rank
% of Total Taxable
Assessed Value Taxable Assessed Value Rank
% of Total
Taxable Assessed
ValuePuget Sound Energy 349,025,878 1 1.00% 174,833,011$ 2 0.60%Vine Street Investors 240,080,800 2 0.69% 310,984,850 1 1.06%Target Corporation 113,347,500 3 0.32% 110,196,280 4 0.38%Capital Mall 111,128,700 4 0.32% 166,914,400 3 0.57%Kaufman Real Estate 88,101,220 5 0.25% 83,440,794 6 0.29%Panorama City Inc 87,746,114 6 0.25% 87,913,122 5 0.30%Comcast 68,426,860 7 0.20% 0.00%Walmart Stores 65,173,279 8 0.19% 65,371,219 8 0.22%DM Ventures 57,312,909 9 0.16% 0.00%WIG Properties 55,735,700 10 0.16% 0.00%CDC Properties 60,996,850 10 0.21%Quest Corporation 62,179,224 9 0.21%Home Depot 77,764,843 7
Total Top Ten Value 1,236,078,960$ 3.53% 1,200,594,593$ 3.84%
Total County Assessed Value 35,031,856,677$ 29,248,858,362$
2010 Thurston County Comprehensive Annual Financial StatementSource: Thurston County Treasurer by Year Taxes are Collected
Principal Tax Payers2019
Schedule 7
2019 2010
Thurston County, Washington 2019
254
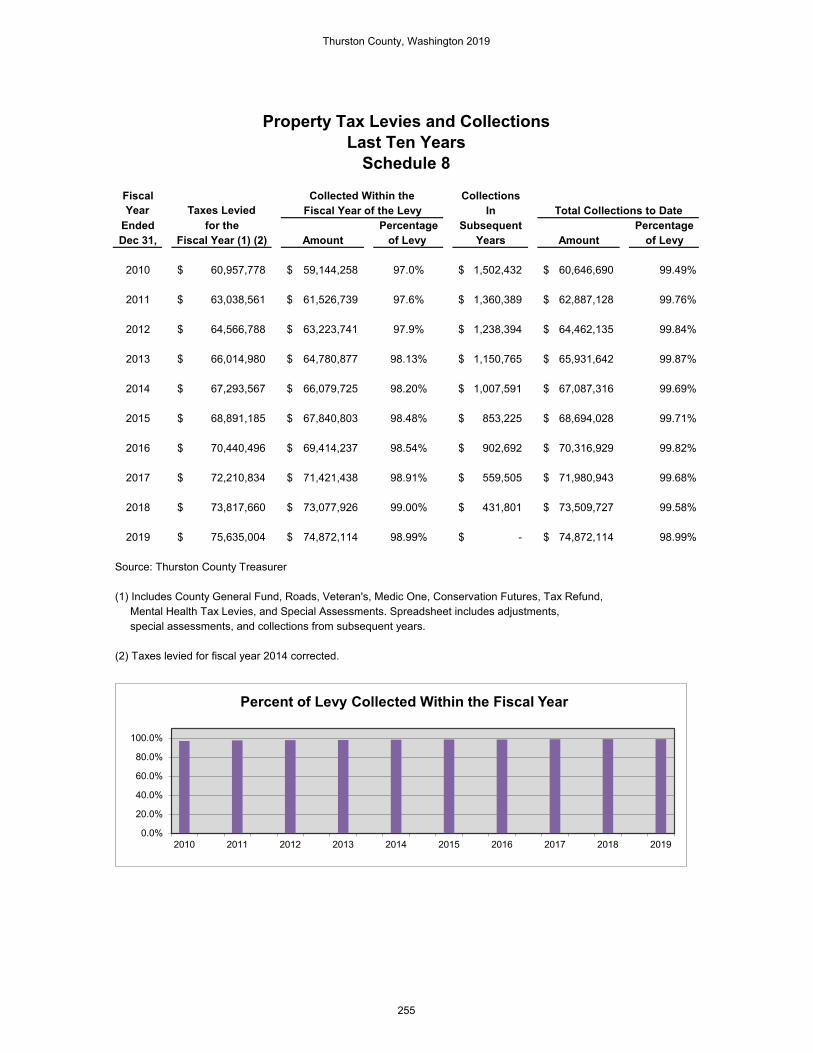
Fiscal CollectionsYear Taxes Levied In
Ended for the Percentage Subsequent PercentageDec 31, Fiscal Year (1) (2) Amount of Levy Years Amount of Levy
2010 60,957,778$ 59,144,258$ 97.0% 1,502,432$ 60,646,690$ 99.49%
2011 63,038,561$ 61,526,739$ 97.6% 1,360,389$ 62,887,128$ 99.76%
2012 64,566,788$ 63,223,741$ 97.9% 1,238,394$ 64,462,135$ 99.84%
2013 66,014,980$ 64,780,877$ 98.13% 1,150,765$ 65,931,642$ 99.87%
2014 67,293,567$ 66,079,725$ 98.20% 1,007,591$ 67,087,316$ 99.69%
2015 68,891,185$ 67,840,803$ 98.48% 853,225$ 68,694,028$ 99.71%
2016 70,440,496$ 69,414,237$ 98.54% 902,692$ 70,316,929$ 99.82%
2017 72,210,834$ 71,421,438$ 98.91% 559,505$ 71,980,943$ 99.68%
2018 73,817,660$ 73,077,926$ 99.00% 431,801$ 73,509,727$ 99.58%
2019 75,635,004$ 74,872,114$ 98.99% -$ 74,872,114$ 98.99%
Property Tax Levies and CollectionsLast Ten Years
Schedule 8
Collected Within theFiscal Year of the Levy Total Collections to Date
(1) Includes County General Fund, Roads, Veteran's, Medic One, Conservation Futures, Tax Refund,
special assessments, and collections from subsequent years.
(2) Taxes levied for fiscal year 2014 corrected.
Source: Thurston County Treasurer
Mental Health Tax Levies, and Special Assessments. Spreadsheet includes adjustments,
0.0%
20.0%
40.0%
60.0%
80.0%
100.0%
2010 2011 2012 2013 2014 2015 2016 2017 2018 2019
Percent of Levy Collected Within the Fiscal Year
Thurston County, Washington 2019
255

Less: Outstanding Limited Tax General Obligation Bond Debt (2)
2010 2011 2012 2013 2014 2015 2016 2017 2018 2019
407,161$ 385,329$ 357,048$ 378,910$ 402,711$ 418,471$ 450,519$ 483,252$ 570,105$ 570,105$
98,467 94,607 90,294 86,066 80,695 74,247 69,838 63,573 54,575 54,575
580,142$ 547,788$ 505,038$ 545,790$ 590,918$ 623,646$ 681,651$ 742,556$ 896,438$ 896,438$
24.18% 24.55% 25.29% 22.71% 20.04% 17.74% 15.50% 13.16% 9.57% 9.57%
Total Assessed Property Valuation (1) 38,006,995,556$
Legal Debt Margin Calculation for Year 2019Schedule 9
Limited Tax General Obligation Debt Capacity (non-voted):
Legal Limit of 1.5% of the Assessed Valuation 570,104,933$ (54,575,000)
Add: Available Assets 838,051
(2) Excludes proprietary debt funded from user fees
Remaining Capacity (non-voted) 516,367,984$
Limited Tax General Obligation Debt Capacity (voted and non-voted): Legal Limit of 2.5% of the Assessed Valuation 950,174,889$ Less: Outstanding Limited Tax General Obligation Bond Debt (54,575,000) Add: Available Assets 838,051
Remaining Capacity (voted and non-voted) 896,437,940$
(1) Property assessment is for property assessed in 2015 for collection in 2016
Non-Voted Debt Margin
Legal Debt Margin InformationLegal Debt Margin Calculation for Year 2019
(amounts expressed in thousands)
Non-Voted Debt Margin
Total Debt Applicableto Non-Voted Margin
Voted and Non- Voted
Debt Margin
Total Debt as aPercentage of
Thurston County, Washington 2019
256

Inter- Inter- % of General govern- General govern- Personal Per
Fiscal Obligation mental Capital Obligation mental Capital Income (1) CapitaYear Bonds Loans Leases Bonds Loans Leases Total (1) (2)
2010 98,467$ -$ 336$ 8,623$ 1,506$ 47$ 108,979$ 1.06% 432$
2011 93,972$ 635$ 302$ 7,873$ 1,521$ 103$ 104,406$ 0.99% 411$
2012 89,186$ 1,108$ 260$ 7,070$ 1,414$ 120$ 99,158$ 0.87% 390$
2013 79,408$ 1,287$ 292$ 5,415$ 1,182$ 63$ 87,647$ 0.75% 341$
2014 79,408$ 1,287$ 292$ 5,415$ 1,182$ 63$ 87,647$ 0.77% 332$
2015 72,990$ 1,257$ 287$ 4,426$ 1,051$ 44$ 80,055$ N/A 299$
2016 69,838$ 1,204$ 245$ 3,520$ 953$ 55$ 75,815$ N/A 278$
2017 63,573$ 1,150$ 243$ 2,520$ 812$ 40$ 68,338$ N/A 247$
2018 59,137$ 1,094$ 286$ 1,396$ 682$ 41$ 62,636$ N/A 222$
2019 54,575$ 1,037$ 230$ 157$ 550$ 29$ 56,578$ N/A 198$
(2) Reports debt payable per person using total County population. County total population is from the Thurston County Regional Planning Council and is extracted from Schedule 13.
Total Outstanding Debt InformationLast Ten Years
Schedule 10(in thousands of dollars)
Governmental-Type Activities Business-Type Activities Primary Government
(1) Represents County debt as a percentage of total personal income. Personal income is from the Bureau of Economic Analysis and is extracted from Schedule 13.
Thurston County, Washington 2019
257
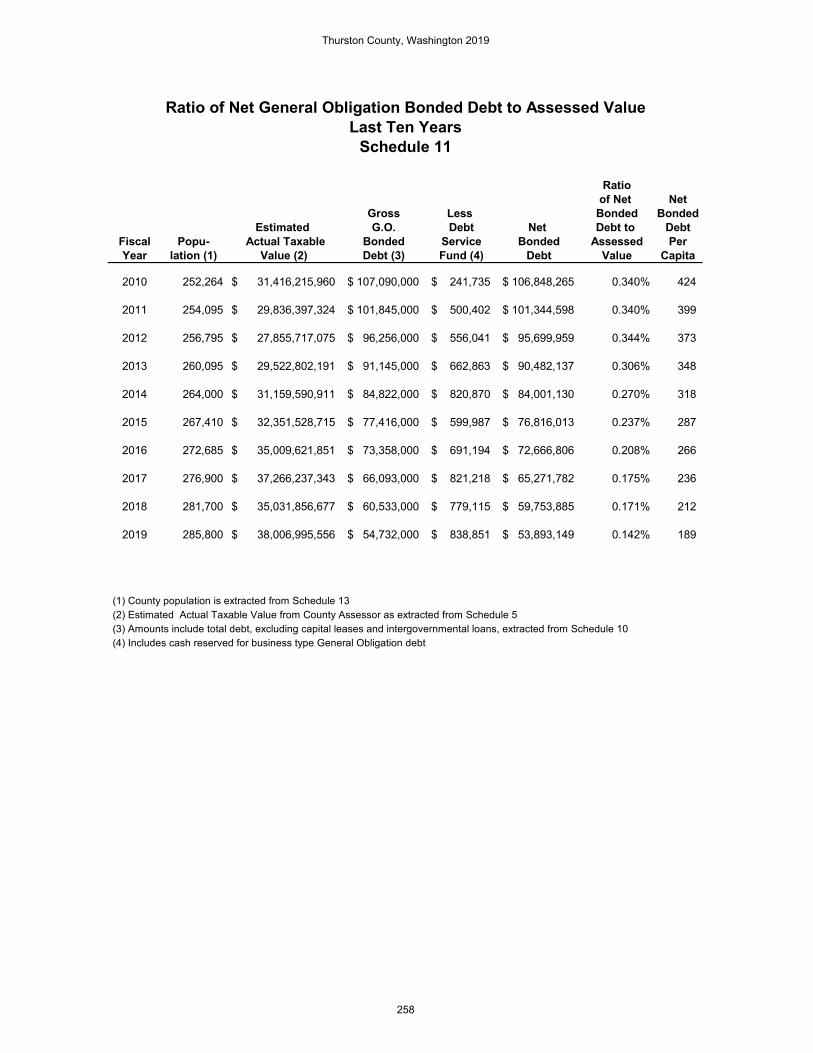
Ratioof Net Net
Gross Less Bonded BondedEstimated G.O. Debt Net Debt to Debt
Fiscal Popu- Actual Taxable Bonded Service Bonded Assessed PerYear lation (1) Value (2) Debt (3) Fund (4) Debt Value Capita
2010 252,264 31,416,215,960$ 107,090,000$ 241,735$ 106,848,265$ 0.340% 424
2011 254,095 29,836,397,324$ 101,845,000$ 500,402$ 101,344,598$ 0.340% 399
2012 256,795 27,855,717,075$ 96,256,000$ 556,041$ 95,699,959$ 0.344% 373
2013 260,095 29,522,802,191$ 91,145,000$ 662,863$ 90,482,137$ 0.306% 348
2014 264,000 31,159,590,911$ 84,822,000$ 820,870$ 84,001,130$ 0.270% 318
2015 267,410 32,351,528,715$ 77,416,000$ 599,987$ 76,816,013$ 0.237% 287
2016 272,685 35,009,621,851$ 73,358,000$ 691,194$ 72,666,806$ 0.208% 266
2017 276,900 37,266,237,343$ 66,093,000$ 821,218$ 65,271,782$ 0.175% 236
2018 281,700 35,031,856,677$ 60,533,000$ 779,115$ 59,753,885$ 0.171% 212
2019 285,800 38,006,995,556$ 54,732,000$ 838,851$ 53,893,149$ 0.142% 189
(4) Includes cash reserved for business type General Obligation debt
Ratio of Net General Obligation Bonded Debt to Assessed ValueLast Ten Years
Schedule 11
(1) County population is extracted from Schedule 13 (2) Estimated Actual Taxable Value from County Assessor as extracted from Schedule 5 (3) Amounts include total debt, excluding capital leases and intergovernmental loans, extracted from Schedule 10
Thurston County, Washington 2019
258

G.O. PercentageBonded Debt Applicable to Amount Applicable
Jurisdiction Outstanding County (2) To Thurston County
Direct: Thurston County (1) 55,842,000$ 100% 55,842,000$
Overlapping: Fire Districts 28,018,246 100% 28,018,246 Port of Olympia 42,730,800 100% 42,730,800 Thurston PUD 15,088,149 100% 15,088,149 Lott Clean Water Alliance 16,025,000 100% 16,025,000 School Districts 643,181,182 100% 643,181,182 Drainage District 92,700 100% 92,700 Cities and Towns 85,366,574 100% 85,366,574
Total Overlapping 830,502,651 100% 830,502,651
Total 886,344,651$ 886,344,651$
(2) Percentage of overlap is based on percentage of jurisdiction included within Thurston County(3) Total direct debt includes all long-term debt instruments of governmental activies, including bonds, notes, loans, and capital leases.
Computation Of Direct And Overlapping Bonded Debt General Obligation Bonds
December 31, 2019Schedule 12
Source: Thurston County Treasurer and individual cities and towns.
(1) Includes all debt that is backed by the full faith and credit of the governmental unit
Thurston County 55,842,000
Fire Districts28,018,246
Port of Olympia42,730,800
Thurston PUD15,088,149
Lott Clean Water Alliance16,025,000
School Districts
643,181,182
Cities and Towns85,366,574
Direct and Overlapping Bonded Debt
Thurston County, Washington 2019
259
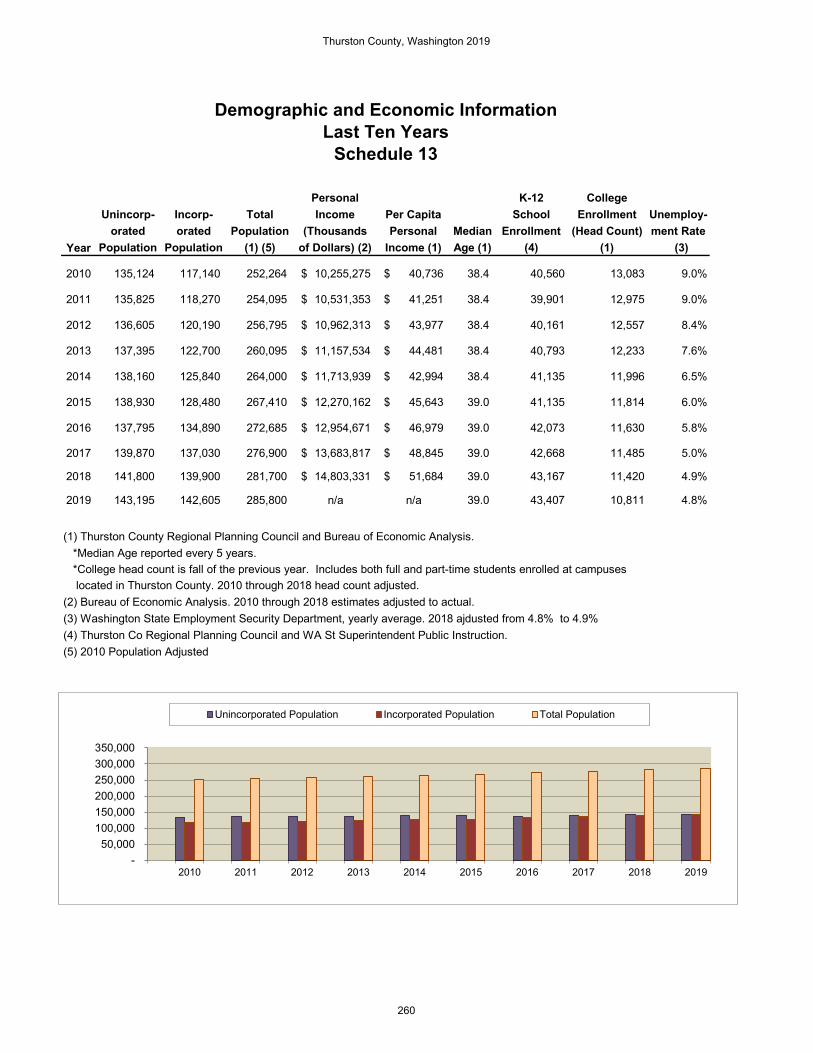
Personal K-12 CollegeUnincorp- Incorp- Total Income Per Capita School Enrollment Unemploy-
orated orated Population (Thousands Personal Median Enrollment (Head Count) ment RateYear Population Population (1) (5) of Dollars) (2) Income (1) Age (1) (4) (1) (3)
2010 135,124 117,140 252,264 10,255,275$ 40,736$ 38.4 40,560 13,083 9.0%
2011 135,825 118,270 254,095 10,531,353$ 41,251$ 38.4 39,901 12,975 9.0%
2012 136,605 120,190 256,795 10,962,313$ 43,977$ 38.4 40,161 12,557 8.4%
2013 137,395 122,700 260,095 11,157,534$ 44,481$ 38.4 40,793 12,233 7.6%
2014 138,160 125,840 264,000 11,713,939$ 42,994$ 38.4 41,135 11,996 6.5%
2015 138,930 128,480 267,410 12,270,162$ 45,643$ 39.0 41,135 11,814 6.0%
2016 137,795 134,890 272,685 12,954,671$ 46,979$ 39.0 42,073 11,630 5.8%
2017 139,870 137,030 276,900 13,683,817$ 48,845$ 39.0 42,668 11,485 5.0%
2018 141,800 139,900 281,700 14,803,331$ 51,684$ 39.0 43,167 11,420 4.9%
2019 143,195 142,605 285,800 n/a n/a 39.0 43,407 10,811 4.8%
(5) 2010 Population Adjusted(4) Thurston Co Regional Planning Council and WA St Superintendent Public Instruction.
(1) Thurston County Regional Planning Council and Bureau of Economic Analysis. *Median Age reported every 5 years.
Demographic and Economic InformationLast Ten Years
Schedule 13
*College head count is fall of the previous year. Includes both full and part-time students enrolled at campuses located in Thurston County. 2010 through 2018 head count adjusted.(2) Bureau of Economic Analysis. 2010 through 2018 estimates adjusted to actual.(3) Washington State Employment Security Department, yearly average. 2018 ajdusted from 4.8% to 4.9%
- 50,000
100,000 150,000 200,000 250,000 300,000 350,000
2010 2011 2012 2013 2014 2015 2016 2017 2018 2019
Unincorporated Population Incorporated Population Total Population
Thurston County, Washington 2019
260

Employer Employees RankPercentage of Total County Employment
State Government, Including Education 26,100 1 19.19%Local Government, Including Education 13,200 2 9.71%Providence St. Peter Hospital (4) 2,849 3 2.10%Safeway (4) 1,024 4 0.75%Walmart Stores, Inc. (4) 1,002 5 0.74%Federal Government 800 6 0.59%Nisqually Red Wind Casino (4) 760 7 0.56%Lucky Eagle Casino (4) 688 8 0.51%Fred Meyer (4) 665 9 0.49%Washington State Employees Credit Union (4) 662 10 0.49%
Totals 47,750 35.13%Total Employed (3) 135,982
Employer Employees RankPercentage of Total County Employment
State Government, Including Education 24,000 1 20.78%Local Government, Including Education 11,300 2 9.78%Providence St. Peter Hospital 2,300 3 1.99%Federal Government 1,000 4 0.87%Affiliated Computer Services (ACS) 800 5 0.69%Safeway Stores 758 6 0.66%Lucky Eagle Casino 686 7 0.59%Great Wolf Lodge 646 8 0.56%Red Wind Casino 610 9 0.53%Costco Wholesale 524 10 0.45%
Totals 42,624 36.90%Total Employed (3) 115,500
and 2010 Comprehensive Annual Financial Report.
(4) 2018 data used. 2019 data not available.
Not seasonally adjusted. (2) Source 2019 and 2010: Thurston Economic Development Council, Thurston Regional Planning,
(3) Total Employed: Washington State Employment Security Department year's average of 2010 and 2019 data for non-farm industry employment and is not seasonally adjusted.
Principal EmployersCurrent Year and Ten Years Ago
Schedule 14
Top Ten Employers for 2019 (1) (2)
Top Ten Employers for 2010 (1) (2)
(1) Source for Government Employment 2019 and 2010: Employment Security Department.
Thurston County, Washington 2019
261

Function/Program 2010 2011 2012 2013 2014 2015 2016 2017 2018 2019
General Government Assessor 28.25 28.75 31.00 30.00 30.00 29.00 29.00 31.00 31.00 31.00 Auditor 38.50 38.50 38.50 38.50 38.00 37.75 38.75 40.00 40.00 42.00 Commissioners/County Admin 13.00 13.25 14.80 14.80 16.00 13.60 14.80 18.75 18.25 17.00 Treasurer 8.90 8.90 9.00 9.00 9.00 12.50 8.90 8.90 8.90 8.90 Human Resources 11.00 12.00 13.00 12.00 11.00 11.00 11.50 12.39 12.39 12.99 Other General Gov Programs (3) 11.15 11.15 11.80 11.80 9.80 8.55 12.15 11.00 11.00 12.95 Central Services & Facilities (1) 60.50 62.50 64.50 66.20 63.45 53.20 54.20 57.20 57.20 31.20 Central Services Engineering (1) 3.50 3.50 3.50 3.80 2.80 1.80 1.80 3.80 4.80 4.80 Information Technology (1) and GeoData (5) 7.25 7.00 7.00 7.00 7.00 7.00 7.00 7.00 7.00 41.60 Emergency Services (6) - 7.00 7.55 7.05 7.05 7.05 7.05 7.05 7.05 8.05Total FTE 182.05 192.55 200.65 200.15 194.10 181.45 185.15 197.09 197.59 210.49
Public Safety Clerk 32.00 32.00 34.00 34.00 30.50 30.50 32.50 33.50 33.50 39.50 Superior Court 40.65 40.65 40.65 42.65 40.80 41.80 38.80 39.30 39.30 37.30 District Court 24.50 25.00 25.00 26.00 27.75 27.75 31.25 31.25 31.25 29.00 Juvenile Probation 61.00 61.00 61.00 61.00 59.00 59.00 58.00 58.00 58.00 52.00 Pretrial (8) - - - - - - 5.00 5.00 5.00 5.00 Prosecuting Attorney 60.25 62.90 66.90 65.10 63.60 61.85 60.10 61.85 66.60 67.60 Sheriff 103.50 104.50 103.50 105.00 107.00 107.00 108.00 106.75 106.75 107.61 Corrections 100.00 100.00 103.00 123.00 125.50 118.00 120.00 121.00 121.00 114.94 Coroner 6.00 6.00 6.50 6.50 6.50 6.50 6.50 6.50 6.50 7.50 Public Defense 20.00 21.00 23.00 23.00 27.00 27.00 31.00 31.00 31.00 38.84 Other Public Safety Programs (4) 16.15 15.65 12.65 13.95 11.00 15.50 12.50 14.00 8.75 61.56 Communications (8) 63.75 - - - - - - - - Total FTE 527.80 468.70 476.20 500.20 498.65 494.90 503.65 508.15 507.65 560.85
Culture & Recreation WSU Cooperative Extension 1.55 1.55 2.05 1.05 1.05 1.05 1.05 2.20 2.20 2.14 Fair 3.75 3.50 2.55 2.55 0.80 2.55 2.30 2.53 2.53 2.16 Recreation Services 3.00 3.00 2.00 2.00 2.00 - - - - - Total FTE 8.30 8.05 6.60 5.60 3.85 3.60 3.35 4.73 4.73 4.30
Health & Human Services Medic One & Reserve 7.00 7.00 6.95 7.45 8.45 8.45 8.45 8.95 8.95 10.45 Social Services (9) 17.25 17.25 17.25 17.25 18.25 20.25 21.45 26.06 26.06 - Public Health & Social Services (9) 74.60 69.10 64.35 66.50 64.50 64.40 68.20 74.72 78.72 52.95 Environmental Health (9) - - - - - - - - - 41.65Total FTE 98.85 93.35 88.55 91.20 91.20 93.10 98.10 109.73 113.73 105.05
Government Employment InformationAuthorized Thurston County Positions by Function
Last Ten YearsSchedule 15Page 1 of 2
Thurston County, Washington 2019
262
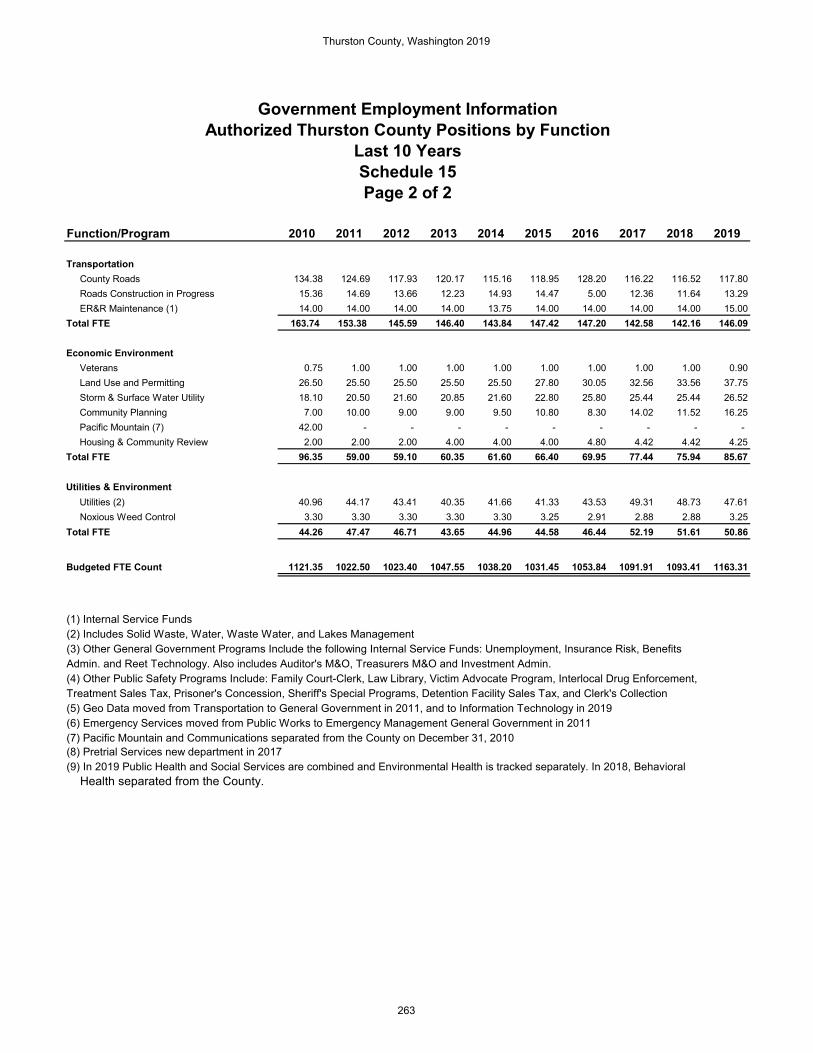
Function/Program 2010 2011 2012 2013 2014 2015 2016 2017 2018 2019
Transportation County Roads 134.38 124.69 117.93 120.17 115.16 118.95 128.20 116.22 116.52 117.80 Roads Construction in Progress 15.36 14.69 13.66 12.23 14.93 14.47 5.00 12.36 11.64 13.29 ER&R Maintenance (1) 14.00 14.00 14.00 14.00 13.75 14.00 14.00 14.00 14.00 15.00Total FTE 163.74 153.38 145.59 146.40 143.84 147.42 147.20 142.58 142.16 146.09
Economic Environment Veterans 0.75 1.00 1.00 1.00 1.00 1.00 1.00 1.00 1.00 0.90 Land Use and Permitting 26.50 25.50 25.50 25.50 25.50 27.80 30.05 32.56 33.56 37.75 Storm & Surface Water Utility 18.10 20.50 21.60 20.85 21.60 22.80 25.80 25.44 25.44 26.52 Community Planning 7.00 10.00 9.00 9.00 9.50 10.80 8.30 14.02 11.52 16.25 Pacific Mountain (7) 42.00 - - - - - - - - - Housing & Community Review 2.00 2.00 2.00 4.00 4.00 4.00 4.80 4.42 4.42 4.25Total FTE 96.35 59.00 59.10 60.35 61.60 66.40 69.95 77.44 75.94 85.67
Utilities & Environment Utilities (2) 40.96 44.17 43.41 40.35 41.66 41.33 43.53 49.31 48.73 47.61 Noxious Weed Control 3.30 3.30 3.30 3.30 3.30 3.25 2.91 2.88 2.88 3.25Total FTE 44.26 47.47 46.71 43.65 44.96 44.58 46.44 52.19 51.61 50.86
Budgeted FTE Count 1121.35 1022.50 1023.40 1047.55 1038.20 1031.45 1053.84 1091.91 1093.41 1163.31
(9) In 2019 Public Health and Social Services are combined and Environmental Health is tracked separately. In 2018, Behavioral Health separated from the County.
Government Employment InformationAuthorized Thurston County Positions by Function
Last 10 YearsSchedule 15Page 2 of 2
(1) Internal Service Funds
(6) Emergency Services moved from Public Works to Emergency Management General Government in 2011(7) Pacific Mountain and Communications separated from the County on December 31, 2010
(2) Includes Solid Waste, Water, Waste Water, and Lakes Management
(8) Pretrial Services new department in 2017
(3) Other General Government Programs Include the following Internal Service Funds: Unemployment, Insurance Risk, BenefitsAdmin. and Reet Technology. Also includes Auditor's M&O, Treasurers M&O and Investment Admin.(4) Other Public Safety Programs Include: Family Court-Clerk, Law Library, Victim Advocate Program, Interlocal Drug Enforcement,Treatment Sales Tax, Prisoner's Concession, Sheriff's Special Programs, Detention Facility Sales Tax, and Clerk's Collection(5) Geo Data moved from Transportation to General Government in 2011, and to Information Technology in 2019
Thurston County, Washington 2019
263

Function/Program 2010 2011 2012 2013 2014
General GovernmentGeneral Elections Registered Voters 149,024 152,475 160,302 161,326 162,655 Votes Cast 107,344 80,871 128,652 72,064 85,446 % of Registered Voters Voting 72.03% 53.04% 80.26% 44.67% 52.53%Public SafetySheriff's Office Jail Population (average) 410 432 422 451 414 Total Persons Booked 5,657 5,804 5,240 5,500 5,405 Citations (tickets) Issued (8) 3,350 3,614 2,710 2,255 2,390 Total Warrants Processed 9,620 9,566 9,360 9,044 7,559 Fraud Reports 635 730 596 428 511 Coroner Deaths Reported 1,986 2,144 2,203 2,178 2,194 Autopsies/External Examines Performed 114 170 158 171 139 Jurisdiction Assumed 300 359 337 322 270 Accidents 116 129 111 117 83 Bones 11 10 1 1 2 Homicide 4 5 15 3 4 Natural 97 141 141 127 118 Suicide 26 41 44 39 41 Traffic 21 17 17 16 17 Undetermined 25 16 8 10 5 Pending (10)Juvenile Probation Average Caseload (monthly) 37 36 33 30 31 Population in Detention (average) 30 31 30 27 26 Courts District Court Filings (6) 31,691 30,216 30,000 31,667 31,510 District Court Proceedings (6) 34,375 35,161 33,549 33,426 42,152 Superior Court Filings (1) 14,477 14,343 12,775 14,415 14,728 Superior Court Proceedings (1) 39,425 43,862 43,524 43,393 39,143 Culture and RecreationCounty Fair Attendance 30,028 32,149 28,710 33,350 36,719 Parks Attendance (9) 1,159,389 1,333,297 855,000 1,111,635 1,239,784
Operating IndicatorsBy Function/Program
Last Ten YearsSchedule 16Page 1 of 4
Thurston County, Washington 2019
264

Function/Program 2015 2016 2017 2018 2019
General GovernmentGeneral Elections Registered Voters 164,555 175,078 176,312 181,316 186,573 Votes Cast 60,872 135,966 60,478 126,031 82,661 % of Registered Voters Voting 36.99% 77.66% 34.30% 69.51% 44.30%Public SafetySheriff's Office Jail Population (average) 406 466 472 449 406 Total Persons Booked 4,752 5,132 5,391 5,556 5,905 Citations (tickets) Issued (8) 2,396 2,111 2,102 2,943 4,419 Total Warrants Processed 6,922 7,226 7,728 8,349 8,600 Fraud Reports 574 550 569 466 419 Coroner Deaths Reported 2,408 2,360 2,457 2,525 2,553 Autopsies/External Examines Performed 175 173 247 176 133 Jurisdiction Assumed 314 319 391 323 317 Accidents 105 101 111 88 100 Bones 1 1 1 - - Homicide 6 5 14 10 4 Natural 123 117 145 119 128 Suicide 48 53 60 45 50 Traffic 14 16 18 30 19 Undetermined 17 11 7 6 9 Pending (10) 15 15 25 7 Juvenile Probation Average Caseload (monthly) 26 25 27 23 20 Population in Detention (average) 24 15 14 13 11 Courts District Court Filings (6) 31,957 33,383 33,344 33,307 34,695 District Court Proceedings (6) 35,939 30,811 29,777 30,363 30,824 Superior Court Filings (1) 12,687 12,484 14,705 14,090 14,548 Superior Court Proceedings (1) 40,232 40,358 43,573 42,472 43,174 Culture and RecreationCounty Fair Attendance 26,250 30,524 21,500 25,676 25,000 Parks Attendance (9) 1,270,528 1,398,277 1,400,000 1,250,000 1,413,651
Operating IndicatorsBy Function/Program
Last Ten YearsSchedule 16Page 2 of 4
Thurston County, Washington 2019
265

Function/Program 2010 2011 2012 2013 2014
Roads and Trans Services Litter Ctrl-Shoulder Miles 1,401 2,558 786 1,092 914 Litter Control-lbs of Litter 129,830 180,889 119,229 193,749 191,050 Striping Roads (Miles) 195 1,440 1,557 1,380 1,121 Paving-Overlay Miles (12) 0.74 4.36 - - 84.00 Paving-Chip Seal Miles 17.39 - 35.65 41.65 45.37 Economic EnvironmentBuilding Permits Permits Issued (11) 2,487 2,103 2,311 2,346 2,368 Value of Bldg (000's Omitted) (11) 154,365 137,331 119,417 126,215 124,059 Utilities & EnvironmentWaste and Recovery Center Customers 194,060 179,212 195,289 176,700 173,681 New Utility Connect, actuals (5) 10 10 2 26 36 Health & Human ServicesPublic Health Laboratory Water Tests 9,744 9,616 8,546 7,384 7,231 Persons Served/Reached (2) 10,456 9,253 7,731 7,069 7,635 Social Services Cases (3) 10,800 11,397 11,500 11,750 12,167 Housing Cases (4) - - 1,900 3,200 4,193 Medic One ALS Reponses (7) 9,040 8,638 8,427 8,621 8,324 Medic One BLS Reponses (7) 16,373 16,695 16,690 20,005 18,243
Last Ten YearsSchedule 16Page 3 of 4
By Function/ProgramOperating Indicators
Thurston County, Washington 2019
266

Function/Program 2015 2016 2017 2018 2019
Roads and Trans Services Litter Ctrl-Shoulder Miles 756 931 898 2,605 1,964 Litter Control-lbs of Litter 199,912 191,545 184,993 140,025 118,756 Striping Roads (Miles) 743 482 1,379 2,251 984 Paving-Overlay Miles (12) 4.4 23.00 8.00 12.40 6.77 Paving-Chip Seal Miles (12) 36.00 - 43.60 43.00 37.41 Economic EnvironmentBuilding Permits Permits Issued (11) 2,498 2,334 2,880 2,753 2,622 Value of Bldg (000's Omitted) (11) 146,060 178,481 201,554 221,747 174,071 Utilities & EnvironmentWaste and Recovery Center Customers 183,075 198,003 209,746 220,004 233,780 New Utility Connect, actuals (5) - - - 6 9 Health & Human ServicesPublic Health Laboratory Water Tests 7,322 7,303 7,109 9,677 9,212 Persons Served/Reached (2) 23,355 13,562 19,678 18,115 11,699 Social Services Cases (3) 12,654 3,371 525 541 549 Housing Cases (4) 5,858 3,140 3,205 3,828 3,069 Medic One ALS Reponses (7) 9,314 9,394 9,677 10,192 10,550 Medic One BLS Reponses (7) 20,578 22,046 24,037 24,209 25,447
Operating IndicatorsBy Function/Program
Last Ten YearsSchedule 16Page 4 of 4
(4) Public Health Housing Cases newly tracked statistic starting in 2012(5) Utility connections include sewer and water. 2015-2017 connections corrected.(6) District Court 2010 and 2011 filings and proceedings revised.
(12) 2016 and 2018 Paving-Overlay Miles Corrected. 2018 Paying Overlay Miles Corrected.
(7) Medic One ALS (Advanced Life Support) and BLS (Basic Life Support).(8) Citations for driving while license suspended not included in 2010 due to referral program.(9) Parks attendance for 2010-2011 not available. 2010 Estimate from average of 2008 and 2009, 2011 add 15%.(10) Pending added to Coroner's statistics in 2016.(11) 2016 Building Permits and Value Updated.
Effective April 1, 2016 Mental Health and Substance Abuse are no longer part of Thurston County government.
Source: Thurston County Offices and Departments(1) The Clerk's Office is the record keeper for all Superior Court cases which include cases for juvenile's. 2010-2012 updated to include proceedings for all Superior Court cases which include cases for Juvenile's.(2) Public Health persons served include Education & Outreach, Communicable Disease, Maternal Child Health,Specialized Recreation, Veterans Assistance, and other workshops/events.(3) Social Services cases include Developmental Disabilities, Mental Health, and Substance Abuse cases.
Thurston County, Washington 2019
267

2010 2011 2012 2013 2014Function/Program (5) (6) (6)
General Government Building Usage/Cnty Owned (sq feet) 82,180 82,180 94,398 110,471 110,471 Public Safety Building Usage/Cnty Owned (sq feet) (1) (5) 296,016 296,016 274,950 294,708 297,918 Sheriff's Vehicles 88 88 90 101 101 Sheriff's Boats 6 7 7 7 7 Sheriff's Special Purpose Vehicles 6 6 6 5 6 Culture & Recreation Building Usage/Cnty Owned (sq feet) 103,739 103,739 103,739 105,330 105,330 Parks 24 24 24 24 24 Parks Acres (11) 2,578 2,578 2,578 2,578 2,578 Health & Human Services Building Usage/Cnty Owned (sq feet) 54,715 54,715 58,127 62,768 62,768 Transportation Building Usage/Cnty Owned (sq feet) 64,278 64,278 65,883 116,619 103,818 Paved Roads (in miles) (2) 1,007 1,013 1,013 1,068 1,068 Unpaved Roads (in miles) (2) 25 23 23 23 23 Economic Environment Building Usage/Cnty Owned (sq feet) 8,500 8,500 8,616 8,868 8,868 Utilities & Environment Building Usage/Cnty Owned (sq feet) (4) 65,591 65,591 58,264 61,533 61,893 Water Mains (in feet) 93,122 95,057 95,057 95,057 95,057 Water Storage Capacity (in gallons) 1,060,400 1,060,400 1,060,400 1,060,400 1,060,400 Sewer Mains (in feet) 86,836 87,941 87,971 87,971 87,971 Treatment Capacity (gallons per day) 484,000 484,000 484,000 484,000 484,000 Treat. Devices-Stormwater Sewers (6) 36 28 45 51 55 Ponds Maintained (3) 26 24 27 35 40
Capital Asset InformationCapital Asset and Infrastructure by Function/Program
Last Ten Years
Schedule 17Page 1 of 2
Thurston County, Washington 2019
268

2015 2016 2017 2018 2019Function/Program
General Government Building Usage/Cnty Owned (sq feet) (7) 159,666 159,760 159,760 52,486 52,486 Public Safety Building Usage/Cnty Owned (sq feet) (1) (5) 265,481 265,481 274,531 274,411 274,411 Sheriff's Vehicles 101 101 101 101 107 Sheriff's Boats 7 7 7 7 4 Sheriff's Special Purpose Vehicles 6 6 6 6 5 Culture & Recreation Building Usage/Cnty Owned (sq feet) (8) 106,232 106,232 106,232 97,299 97,299 Parks (11) 24 24 24 24 24 Parks Acres (11) 2,578 2,578 2,578 2,578 2,578 Health & Human Services Building Usage/Cnty Owned (sq feet) (9) 62,515 63,634 63,634 39,424 39,424 Transportation Building Usage/Cnty Owned (sq feet) 111,478 111,478 111,478 110,404 114,627 Paved Roads (in miles) (2) 1,002 1,007 1,008.40 989.52 1,009.33 Unpaved Roads (in miles) (2) 22 22 21.60 21.60 21.45 Economic Environment Building Usage/Cnty Owned (sq feet) 8,868 8,868 8,868 8,659 8,659 Utilities & Environment Building Usage/Cnty Owned (sq feet) (4) 53,718 53,718 53,718 53,718 49,495 Water Mains (in feet) 95,057 95,557 96,724 96,724 97,224 Water Storage Capacity (in gallons) (10) 1,060,400 1,060,400 1,060,400 1,060,400 1,560,400 Sewer Mains (in feet) 87,971 88,641 89,587 89,787 90,287 Treatment Capacity (gallons per day) 484,000 484,000 484,000 484,000 484,000 Treat. Devices-Stormwater Sewers (6) 78 80 86 88 88 County Maintained Ponds (3) 55 61 66 72 95
(9) Social Health Building sold 2018(10) New 500,000 gallon reservoir in Grand Mound 2019(11) Parks and Parks Acres adjusted to combine Parks, Open Space, and Trails Plan 2010-2019
(1) Mottman Building and vacated Corrections assigned to General Government Fund occupancy. Vacant while restoring. (2) Decrease in roads paved and unpaved miles reflect annexation of roads to surrounding cities.(3) Non County owned ponds are maintained during initial Homeowners Association startup.(4) Building Usage adjusted for utilities & environment to include Waste & Recovery Center and other utilities(5) New Accountability and Restitution Center, detention facility complete(6) In 2011 redefined some Stormwater devices as Infaltration devices. In 2012 a detailed inventory of CountyStormwater infrastructure was completed.(7) Mottman Building sold 2017(8) Mclane Building sold 2018
Capital Asset InformationCapital Asset and Infrastructure by Function/Program
Last Ten YearsSchedule 17Page 2 of 2
Source: Thurston County Offices and Departments
Thurston County, Washington 2019
269

This Page Intentionally Left Blank
Thurston County, Washington 2019
270

The major objective of the Comprehensive Annual Financial Report is to describe the
County’s financial condition and the financial results of its operations

Thurston County Auditor Financial Services
2000 Lakeridge Dr. SW Olympia WA 98502
(360) 786-5402
www.co.thurston.wa.us