Financial statements and review 2Q 2010 - equinor.com · Productio n on Gullfak s an d Giml e wa s...
47
Financial statements and review 2nd quarter 2010
Transcript of Financial statements and review 2Q 2010 - equinor.com · Productio n on Gullfak s an d Giml e wa s...

Financial statementsand review2nd quarter 2010

High activity and good operationsSecond quarter Operating and Financial Review Statoil's second quarter 2010 net operating income was NOK 26.6 billion, compared to NOK 24.3 billion in the second quarter of 2009. The quarterly result was affected by a 32% increase in liquids prices measured in NOK, a 6% increase in equity production and a 12% decrease in gas prices measured in NOK. Also impairments, loss on derivatives and a provision for an onerous contract influenced net operating income. Adjusted earnings in the second quarter 2010 were NOK 36.4 billion, up 25% from second quarter 2009 when adjusted earnings were NOK 29.2 billion. Net income in the second quarter of 2010 was NOK 3.1 billion. This result reflects higher oil prices and increased liftings, lower net financial losses and lower tax rates partly offset by lower gas prices, impairments, losses on derivatives and an onerous contract compared to the second quarter of 2009, when net income was zero and the tax rate unusually high. Adjusted earnings after tax were NOK 10.6 billion in the second quarter of 2010, up 21% from second quarter 2009 when adjusted earnings after tax were NOK 8.8 billion. Adjusted earnings after tax excludes the effect of financial items and the tax on net financial items, and represents an effective adjusted tax rate of 71% in the second quarter of 2010 and 70% in the second quarter of 2009. "Statoil's second quarter is characterised by strong operational performance and a high activity level," says Statoil's Chief Executive Officer Helge Lund. "We are making good progress on important projects. The Gjøa production platform is now anchored at the field in the North Sea. The Gudrun development was approved by the Norwegian Parliament in June, and key contracts have now been awarded. In Brazil, the Peregrino field development is moving forward and we have agreed to bring in Sinochem as a 40% partner in the project," says Lund. "Statoil's production is on track. Equity production is up 6% compared to second quarter last year. However, planned maintenance turnarounds will heavily impact production in the third quarter," says Statoil's CEO Helge Lund.
Secondquarter Firsthalf Fullyear 2010 2009 Change 2010 2009 Change 2009
Netoperatingincome(NOKbillion) 26.6 24.3 9% 66.2 59.8 11% 121.6
Adjustedearnings(NOKbillion) 36.4 29.2 25% 75.3 65.2 15% 130.7
Netincome(NOKbillion) 3.1 0.0 >100% 14.2 4.0 >100% 17.7
Earningspershare(NOK) 1.14 0.02 >100% 4.63 1.18 >100% 5.75
Averageliquidsprice(NOK/bbl) 462 349 32% 447 320 40% 364
Averagegasprice(NOK/scm) 1.61 1.82 (12%) 1.62 2.21 (27%) 1.90
Equityproduction(mboeperday) 1,957 1,845 6% 2,029 1,959 4% 1,962
Operationaldata Secondquarter Firsthalf Fullyear 2010 2009 Change 2010 2009 Change 2009
Averageliquidsprice(USD/bbl) 74.1 53.7 38% 74.0 47.8 55% 58.0
USDNOKaveragedailyexchangerate 6.24 6.50 (4%) 6.04 6.69 (10%) 6.28
Averageliquidsprice(NOK/bbl)[3] 462 349 32% 447 320 40% 364
Gasprices(NOK/scm) 1.61 1.82 (12%) 1.62 2.21 (27%) 1.90
Refiningmargin,FCC(USD/boe)[4] 6.0 4.8 25% 5.9 5.1 16% 4.3
Totalentitlementliquidsproduction(mboeperday)[5] 981 1,032 (5%) 1,023 1,068 (4%) 1,066
Totalentitlementgasproduction(mboeperday) 783 696 12% 817 763 7% 740
Totalentitlementliquidsandgasproduction
(mboeperday)[6] 1,765 1,729 2% 1,839 1,831 0% 1,806
Totalequitygasproduction(mboeperday) 809 708 14% 847 783 8% 760
Totalequityliquidsproduction(mboeperday) 1,147 1,137 1% 1,182 1,176 1% 1,202
Totalequityliquidsandgasproduction(mboeperday) 1,957 1,845 6% 2,029 1,959 4% 1,962
Totalliquidsliftings(mboeperday) 942 968 (3%) 1,010 1,049 (4%) 1,045
Totalgasliftings(mboeperday) 783 696 12% 817 764 7% 740
Totalliquidsandgasliftings(mboeperday)[7] 1,725 1,664 4% 1,826 1,813 1% 1,785
Productioncostentitlementvolumes
(NOK/boe,last12months)[8] 40.1 38.0 5% 40.1 38.0 5% 38.4
Productioncostequityvolumes
(NOK/boe,last12months) 36.3 35.0 4% 36.3 35.0 4% 35.3
Equityproductioncostexcludingrestructuring
andgasinjectioncost(NOK/boe,last12months)[9] 35.2 35.6 (1%) 35.2 35.6 (1%) 35.3
Highlights since first quarter 2010: Equity production is up 6% from second quarter 2009 to 1,957 mboe per day. For the first six months of the year, equity production is 2,029 mboe
per day. Entitlement production is up 2% from second quarter last year to 1,765 mboe per day. Average prices measured in NOK are up 32% for liquids and down 12% for gas compared to second quarter last year. Gas prices continue to be low in a historical perspective. On 19 May pressure change and loss of drilling fluid occurred in the C-06 well at Gullfaks C, causing production on Gullfaks C, Gimle and Tordis to be shut down. Production on Gullfaks and Gimle was resumed 14 July, and Tordis will be back on stream after a planned pipeline operation, which started on 20 July. On 21 May Statoil announced its agreement with the Sinochem Group to sell 40% of the Peregrino field offshore Brazil. On 27 May a six months drilling moratorium was imposed in the Gulf of Mexico. On 16 June the Norwegian Parliament (Stortinget) approved the plan for development and operation (PDO) for Gudrun. On 1 July the Agbami equity determination process was completed increasing Statoil's share in the Nigerian field from 18.85% to 20.21%.
Statoil 2nd quarter 2010 1

OPERATIONAL REVIEW
Second quarter Total liquids and gas entitlement production in the second quarter of 2010 was 1,765 mboe per day, compared to 1,729 mboe per day in the second quarter of 2009. Total equity [9] production was 1,957 mboe per day in the second quarter of 2010 compared to 1,845 mboe per day in the second quarter of 2009. The 6% increase in total equity production was primarily related to the start-up of new fields and ramp-up of production from existing fields, and was partly offset by declining production from mature fields, maintenance activities and various operational issues. Entitlement production increased by 2% impacted by the changes in equity production described above as well as the relatively higher adverse effect from Production Sharing Agreements (PSA-effects) in the second quarter of 2010. The average negative PSA effect was 192 mboe per day in the second quarter of 2010 compared to 116 mboe per day in the second quarter of 2009. The increase was a result of changes in profit tranches regarding fields in Angola, some positive PSA adjustments in second quarter 2009 related to previous periods and higher prices in second quarter of 2010 leading to reduced entitlement shares.
Secondquarter Firsthalf Fullyear 2010 2009 Change 2010 2009 Change 2009
Netoperatingincome(NOKbillion) 26.6 24.3 9% 66.2 59.8 11% 121.6
Adjustedearnings(NOKbillion) 36.4 29.2 25% 75.3 65.2 15% 130.7
Netincome(NOKbillion) 3.1 0.0 >100% 14.2 4.0 >100% 17.7
Earningspershare(NOK) 1.14 0.02 >100% 4.63 1.18 >100% 5.75
Averageliquidsprice(NOK/bbl) 462 349 32% 447 320 40% 364
Averagegasprice(NOK/scm) 1.61 1.82 (12%) 1.62 2.21 (27%) 1.90
Equityproduction(mboeperday) 1,957 1,845 6% 2,029 1,959 4% 1,962
Operationaldata Secondquarter Firsthalf Fullyear 2010 2009 Change 2010 2009 Change 2009
Averageliquidsprice(USD/bbl) 74.1 53.7 38% 74.0 47.8 55% 58.0
USDNOKaveragedailyexchangerate 6.24 6.50 (4%) 6.04 6.69 (10%) 6.28
Averageliquidsprice(NOK/bbl)[3] 462 349 32% 447 320 40% 364
Gasprices(NOK/scm) 1.61 1.82 (12%) 1.62 2.21 (27%) 1.90
Refiningmargin,FCC(USD/boe)[4] 6.0 4.8 25% 5.9 5.1 16% 4.3
Totalentitlementliquidsproduction(mboeperday)[5] 981 1,032 (5%) 1,023 1,068 (4%) 1,066
Totalentitlementgasproduction(mboeperday) 783 696 12% 817 763 7% 740
Totalentitlementliquidsandgasproduction
(mboeperday)[6] 1,765 1,729 2% 1,839 1,831 0% 1,806
Totalequitygasproduction(mboeperday) 809 708 14% 847 783 8% 760
Totalequityliquidsproduction(mboeperday) 1,147 1,137 1% 1,182 1,176 1% 1,202
Totalequityliquidsandgasproduction(mboeperday) 1,957 1,845 6% 2,029 1,959 4% 1,962
Totalliquidsliftings(mboeperday) 942 968 (3%) 1,010 1,049 (4%) 1,045
Totalgasliftings(mboeperday) 783 696 12% 817 764 7% 740
Totalliquidsandgasliftings(mboeperday)[7] 1,725 1,664 4% 1,826 1,813 1% 1,785
Productioncostentitlementvolumes
(NOK/boe,last12months)[8] 40.1 38.0 5% 40.1 38.0 5% 38.4
Productioncostequityvolumes
(NOK/boe,last12months) 36.3 35.0 4% 36.3 35.0 4% 35.3
Equityproductioncostexcludingrestructuring
andgasinjectioncost(NOK/boe,last12months)[9] 35.2 35.6 (1%) 35.2 35.6 (1%) 35.3
Total liftings of liquids and gas were 1,725 mboe per day in the second quarter of 2010, a 4% increase from 1,664 mboe per day in the second quarter of 2009. The increase in lifting is based on the increase in entitlement production. In the second quarter of 2010 there was an underlift of 26 mboe per day [5], compared to an underlift of 49 mboe per day in the second quarter of 2009. Refining margins (FCC) were USD 6.0 per barrel in the second quarter of 2010, a 25% increase compared with the second quarter of 2009, however, continue to be low in a historical perspective. Production cost per boe of entitlement volumes was NOK 40.1 for the 12 months ended 30 June 2010, compared to NOK 38.0 for the 12 months ended 30 June 2009 [8]. Based on equity volumes [9], the production cost per boe for the two periods was NOK 36.3 and NOK 35.0, respectively. Adjusted for restructuring costs and other costs arising from the merger recorded in the fourth quarter of 2007, and partially reversed in the fourth quarter of 2008 and 2009, and gas injection costs, the production cost per boe of equity production for the 12 months ended 30 June 2010 was NOK 35.2 The comparable figure for the 12 months ended 30 June 2009 was NOK 35.6. The decrease in adjusted production cost per boe is mainly related to value driven deferral of gas volumes in 2009 and lower maintenance activity in the second quarter of 2010 compared to second quarter of 2009, as well as currency effects from the strengthening of NOK versus USD in the most recent 12 month period compared to the 12 months ended 30 June 2009. In the second quarter of 2010, a total of eight exploration wells were completed before 30 June 2010, five on the NCS and three internationally. Seven wells were announced as discoveries, of which two are located outside the NCS.
Statoil 2nd quarter 2010 2

Major business developments in the period include the start up of the Tyrihans well on 8 May, the tow out of the Gjøa platform in June, the agreement for sale of 40% of the Peregrino field offshore Brazil to Sinochem Group (21 May), the signing of an intergovernmental declaration between Turkey and Azerbaijan (7 June) and the completion of the Agbami equity determination process increased Statoil's share from 18.85% to 20.21% in the Agbami field offshore Nigeria (1 July). On 27 May a six months drilling moratorium was imposed in the Gulf of Mexico following the Deepwater Horizon accident in April which will, if sustained significantly affect Statoil's exploration activity in US Golf of Mexico. Statoil has not recognised any provision for onerous contracts in the second quarter 2010 following the current moratorium . On 19 May a well control incident with loss of drilling fluid occurred at Gullfaks C causing the production to shut down both on Gullfaks C and the satellite fields Gimle and Tordis. A plan to manage the incident was implemented and barriers in the well were re-established allowing for production to resume on14 July without any environmental spills or safety being compromised.
First half 2010 Total liquids and gas entitlement production in the first half of 2010 was 1,839 mboe per day, largely unchanged from 1,831 mboe per day in the first half of 2009. Total equity production was 2,029 mboe per day in the first half of 2010 compared to 1,959 mboe per day in the first half of 2009. The 4% increase in total equity production in the first six months of 2010 compared to the same period in 2009 was primarily due to increased production from start up of new fields and ramp up on existing fields, partly offset by declining production from mature fields, shut down of the Lufeng field in 2009, various operational issues and maintenance activities. The average negative PSA effect on entitlement production was 190 mboe per day in the first half of 2010 compared to 127 mboe per day in the first half of 2009. The increase was a result of changes in profit tranches regarding fields in Angola, some positive PSA adjustments in second quarter 2009 related to previous periods and higher prices in second quarter of 2010 leading to reduced entitlement shares. Total liquids and gas liftings in the first half of 2010 were 1,826 mboe per day, compared to 1,813 mboe per day in the first half of 2009. The 1% increase in lifting is based on the increase in entitlement production. In the first half of 2009 there was an underlift position of 3 mboe per day, but there was no under/overlift position in the first six months of 2010. Refining margins (FCC) were USD 5.9 per barrel in the first half of 2010, a 16% increase since the same period of 2009, however, continue to be low in a historical perspective. In the first half of 2010 Statoil completed 18 exploration wells, nine on the NCS and nine internationally. A total of 11 wells were announced as discoveries in the period, eight on the NCS and three internationally. In the first half of 2010 production started from the Tyrihans well (8 May) on the NCS.
Statoil 2nd quarter 2010 3
FINANCIAL REVIEW
2Q 09 2Q 10
NO
K bi
llion
Net operating income
70
Earnings per share Net income
2Q 09 2Q 10
NO
K
0
6
3
2
1
2Q 09 2Q 10
NO
K bi
llion
15
5
0
1050
40
10
0First
half 09First
half 10First
half 09First
half 10First
half 09First
half 10
60
30
20
4
Second quarter In the second quarter of 2010, net operating income was NOK 26.6 billion, compared to NOK 24.3 billion in the second quarter of 2009. The increase is mainly attributable to higher prices for liquids and higher volumes of gas sold, partly offset by lower gas prices. Purchases (net of inventory variation) represent Statoil's purchases of SDFI and 3rd party volumes and increased by 39%, mainly due to higher prices of liquids measured in NOK. Operating expenses increased by NOK 1.6 billion and selling, general and administration expenses increased by NOK 1.2 billion, significantly affected by a provision of NOK 3.8 billion regarding an onerous contract at a re-gasification terminal in the US.
IFRSincomestatement Secondquarter Firsthalf Fullyear(inNOKbillion) 2010 2009 Change 2010 2009 Change 2009
Revenuesandotherincome
Revenues 129.2 104.6 23% 257.9 217.3 19% 462.3
Netincome(loss)from
associatedcompanies 0.1 0.6 (91%) 0.7 0.6 7% 1.8
Otherincome (0.0) 0.0 >(100)% 0.4 0.1 >100% 1.4
Totalrevenuesandotherincome 129.2 105.2 23% 258.9 218.0 19% 465.4
Operatingexpenses
Purchase(netofinventoryvariation) 64.9 46.6 39% 122.3 90.7 35% 205.9
Operatingexpenses 15.6 14.0 11% 31.3 28.0 12% 56.9
Selling,generaland
administrativeexpenses 4.3 3.1 40% 6.9 5.8 19% 10.3
Depreciation,amortisation
andnetimpairmentlosses 14.3 12.8 12% 25.4 24.0 6% 54.1
Explorationexpenses 3.6 4.4 (19%) 6.8 9.7 (30%) 16.7
Totaloperatingexpenses (102.6) (80.9) (27%) (192.8) (158.2) (22%) (343.8)
Netoperatingincome 26.6 24.3 9% 66.2 59.8 11% 121.6
Netfinancialitems (0.8) (4.8) 84% (2.5) (8.7) 72% (6.7)
Incometax (22.8) (19.5) (17%) (49.5) (47.1) (5%) (97.2)
Netincome 3.1 0.0 >100% 14.2 4.0 >100% 17.7
Adjustedearnings Secondquarter Firsthalf Fullyear(inNOKbillion) 2010 2009 Change 2010 2009 Change 2009
Totalrevenuesandother
incomeadjusted 132.9 108.2 23% 260.9 220.4 18% 465.7
Purchase,netofinventory
variationadjusted 64.8 47.8 36% 122.7 92.4 33% 208.1
Operatingexpensesadjusted 13.9 14.6 (4%) 28.5 29.5 (3%) 58.5
Selling,generaland
administrativeexpensesadjusted 2.6 3.0 (11%) 5.2 5.6 (6%) 10.1
Depreciation,amortisation
andimpairmentadjusted 11.4 11.2 2% 22.5 22.1 2% 47.0
Explorationexpensesadjusted 3.7 2.4 52% 6.6 5.6 18% 11.3
Adjustedearnings[11] 36.4 29.2 25% 75.3 65.2 15% 130.7
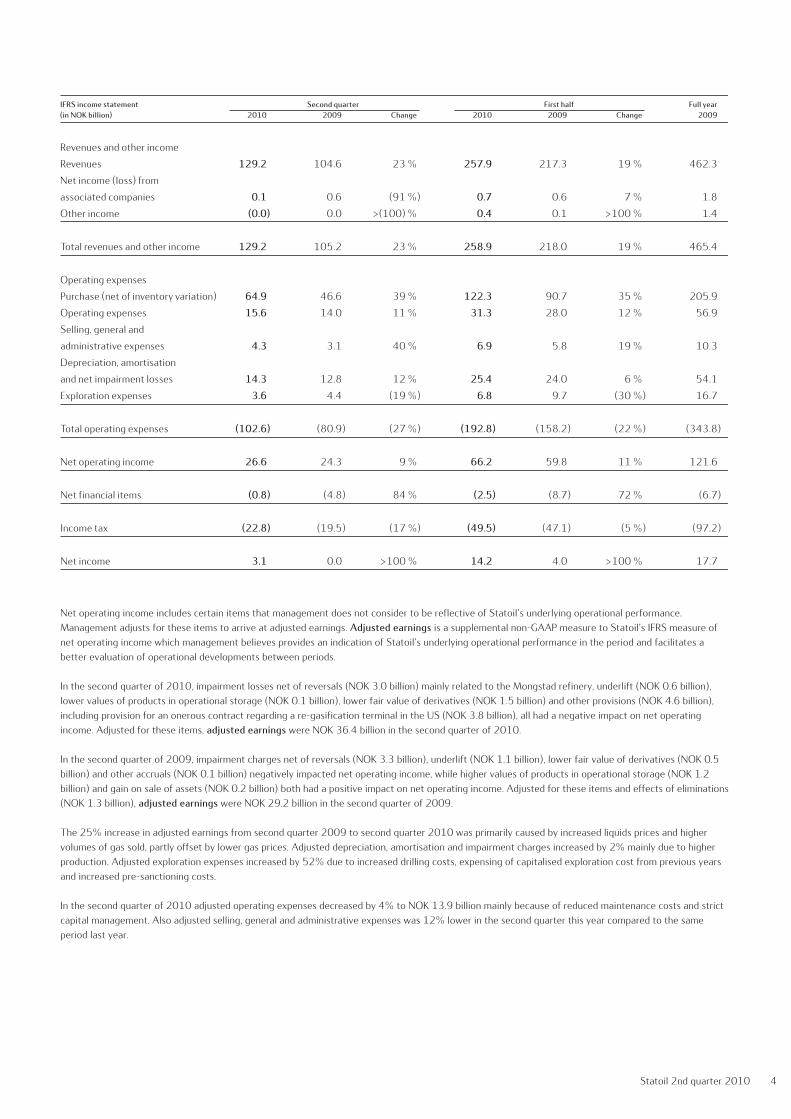
Net operating income includes certain items that management does not consider to be reflective of Statoil's underlying operational performance. Management adjusts for these items to arrive at adjusted earnings. Adjusted earnings is a supplemental non-GAAP measure to Statoil's IFRS measure of net operating income which management believes provides an indication of Statoil's underlying operational performance in the period and facilitates a better evaluation of operational developments between periods. In the second quarter of 2010, impairment losses net of reversals (NOK 3.0 billion) mainly related to the Mongstad refinery, underlift (NOK 0.6 billion), lower values of products in operational storage (NOK 0.1 billion), lower fair value of derivatives (NOK 1.5 billion) and other provisions (NOK 4.6 billion), including provision for an onerous contract regarding a re-gasification terminal in the US (NOK 3.8 billion), all had a negative impact on net operating income. Adjusted for these items, adjusted earnings were NOK 36.4 billion in the second quarter of 2010. In the second quarter of 2009, impairment charges net of reversals (NOK 3.3 billion), underlift (NOK 1.1 billion), lower fair value of derivatives (NOK 0.5 billion) and other accruals (NOK 0.1 billion) negatively impacted net operating income, while higher values of products in operational storage (NOK 1.2 billion) and gain on sale of assets (NOK 0.2 billion) both had a positive impact on net operating income. Adjusted for these items and effects of eliminations (NOK 1.3 billion), adjusted earnings were NOK 29.2 billion in the second quarter of 2009. The 25% increase in adjusted earnings from second quarter 2009 to second quarter 2010 was primarily caused by increased liquids prices and higher volumes of gas sold, partly offset by lower gas prices. Adjusted depreciation, amortisation and impairment charges increased by 2% mainly due to higher production. Adjusted exploration expenses increased by 52% due to increased drilling costs, expensing of capitalised exploration cost from previous years and increased pre-sanctioning costs. In the second quarter of 2010 adjusted operating expenses decreased by 4% to NOK 13.9 billion mainly because of reduced maintenance costs and strict capital management. Also adjusted selling, general and administrative expenses was 12% lower in the second quarter this year compared to the same period last year.
Statoil 2nd quarter 2010 4

IFRSincomestatement Secondquarter Firsthalf Fullyear(inNOKbillion) 2010 2009 Change 2010 2009 Change 2009
Revenuesandotherincome
Revenues 129.2 104.6 23% 257.9 217.3 19% 462.3
Netincome(loss)from
associatedcompanies 0.1 0.6 (91%) 0.7 0.6 7% 1.8
Otherincome (0.0) 0.0 >(100)% 0.4 0.1 >100% 1.4
Totalrevenuesandotherincome 129.2 105.2 23% 258.9 218.0 19% 465.4
Operatingexpenses
Purchase(netofinventoryvariation) 64.9 46.6 39% 122.3 90.7 35% 205.9
Operatingexpenses 15.6 14.0 11% 31.3 28.0 12% 56.9
Selling,generaland
administrativeexpenses 4.3 3.1 40% 6.9 5.8 19% 10.3
Depreciation,amortisation
andnetimpairmentlosses 14.3 12.8 12% 25.4 24.0 6% 54.1
Explorationexpenses 3.6 4.4 (19%) 6.8 9.7 (30%) 16.7
Totaloperatingexpenses (102.6) (80.9) (27%) (192.8) (158.2) (22%) (343.8)
Netoperatingincome 26.6 24.3 9% 66.2 59.8 11% 121.6
Netfinancialitems (0.8) (4.8) 84% (2.5) (8.7) 72% (6.7)
Incometax (22.8) (19.5) (17%) (49.5) (47.1) (5%) (97.2)
Netincome 3.1 0.0 >100% 14.2 4.0 >100% 17.7
Adjustedearnings Secondquarter Firsthalf Fullyear(inNOKbillion) 2010 2009 Change 2010 2009 Change 2009
Totalrevenuesandother
incomeadjusted 132.9 108.2 23% 260.9 220.4 18% 465.7
Purchase,netofinventory
variationadjusted 64.8 47.8 36% 122.7 92.4 33% 208.1
Operatingexpensesadjusted 13.9 14.6 (4%) 28.5 29.5 (3%) 58.5
Selling,generaland
administrativeexpensesadjusted 2.6 3.0 (11%) 5.2 5.6 (6%) 10.1
Depreciation,amortisation
andimpairmentadjusted 11.4 11.2 2% 22.5 22.1 2% 47.0
Explorationexpensesadjusted 3.7 2.4 52% 6.6 5.6 18% 11.3
Adjustedearnings[11] 36.4 29.2 25% 75.3 65.2 15% 130.7
Financialdata Secondquarter Firsthalf Fullyear 2010 2009 Change 2010 2009 Change 2009
Weightedaveragenumberof
ordinarysharesoutstanding 3,182,704,054 3,184,206,446 3,182,943,356 3,184,516,025 3,183,873,643
Earningspershare(NOK) 1.14 0.02 >100% 4.63 1.18 >100% 5.75
Non-controllinginterests
(NOKbillion) 0.6 0.1 >100% 0.5 (0.3) >100% 0.6
Cashflowsprovidedby
operatingactivities(NOKbillion) 23.4 30.5 (23%) 47.9 38.7 24% 73.0
Grossinvestments(NOKbillion) 18.5 19.8 (6%) 39.7 39.3 1% 85.0
Netdebttocapitalemployedratio 29.2% 28.3% 29.2% 28.3% 27.3%
Netfinancialitems Secondquarter2010
Interest Netforeign Interest Netbefore Estimatedtax Netafter(inNOKbillion) income exchange expense tax effect tax
FinancialitemsaccordingtoIFRS 0.4 (3.3) 2.1 (0.8) 1.4 0.6
Foreignexchange(FX)impacts(incl.derivatives) (0.1) 3.3 3.2
Interestrate(IR)derivatives (3.0) (3.0)
Subtotal (0.1) 3.3 (3.0) 0.2 (1.1) (0.9)
FinancialitemsexcludingFXandIRderivatives 0.3 0 (0.9) (0.6) 0.3 (0.3)
Exchangerates 30June2010 31December2009 30June2009
USDNOK 6.50 5.78 6.38
EURNOK 7.97 8.32 9.02
Compositionoftaxexpenseandeffectivetaxrateinthesecondquarterof2010 Beforetax Tax Taxrate Aftertax
Adjustedearnings 36.4 (25.9) 71% 10.6
Adjustments 9.8 (1.7) 17% 8.2
Netoperatingincome 26.6 (24.2) 91% 2.4
Financialitems (0.8) 1.4 184% 0.7
Total 25.8 (22.8) 88% 3.1
Net financial items amounted to a loss of NOK 0.8 billion in the second quarter of 2010, compared to a loss of NOK 4.8 billion in the second quarter of 2009. The loss in the second quarter of 2010 was primarily due to foreign exchange losses of NOK 3.3 billion, partly offset by fair value gains on interest rate swap positions related to the interest rate management of external loans of NOK 2.9 billion. The loss in the second quarter of 2009 was mainly due to losses on interest rate swap positions related to the interest rate mangement of NOK 4.0 billion and a loss related to impairment of the investment in the Pernis refinery of NOK 1.1 billion. The fair value gains on interest rate swap positions are caused by decreasing USD interest rates during the second quarter of 2010. The net foreign exchange losses mainly relate to currency swap positions used for liquidity management, due to an increase in USDNOK currency rates during the second quarter of 2010. Adjusted for these factors, foreign exchange effects on the financial income and impairment of assets, net financial items before tax would amount to a loss of approximately NOK 0.6 billion for the period. In the second quarter of 2009 adjusted net financial items before tax was a gain of NOK 0.2 billion.
Financialdata Secondquarter Firsthalf Fullyear 2010 2009 Change 2010 2009 Change 2009
Weightedaveragenumberof
ordinarysharesoutstanding 3,182,704,054 3,184,206,446 3,182,943,356 3,184,516,025 3,183,873,643
Earningspershare(NOK) 1.14 0.02 >100% 4.63 1.18 >100% 5.75
Non-controllinginterests
(NOKbillion) 0.6 0.1 >100% 0.5 (0.3) >100% 0.6
Cashflowsprovidedby
operatingactivities(NOKbillion) 23.4 30.5 (23%) 47.9 38.7 24% 73.0
Grossinvestments(NOKbillion) 18.5 19.8 (6%) 39.7 39.3 1% 85.0
Netdebttocapitalemployedratio 29.2% 28.3% 29.2% 28.3% 27.3%
Netfinancialitems Secondquarter2010
Interest Netforeign Interest Netbefore Estimatedtax Netafter(inNOKbillion) income exchange expense tax effect tax
FinancialitemsaccordingtoIFRS 0.4 (3.3) 2.1 (0.8) 1.4 0.6
Foreignexchange(FX)impacts(incl.derivatives) (0.1) 3.3 3.2
Interestrate(IR)derivatives (3.0) (3.0)
Subtotal (0.1) 3.3 (3.0) 0.2 (1.1) (0.9)
FinancialitemsexcludingFXandIRderivatives 0.3 0 (0.9) (0.6) 0.3 (0.3)
Exchangerates 30June2010 31December2009 30June2009
USDNOK 6.50 5.78 6.38
EURNOK 7.97 8.32 9.02
Compositionoftaxexpenseandeffectivetaxrateinthesecondquarterof2010 Beforetax Tax Taxrate Aftertax
Adjustedearnings 36.4 (25.9) 71% 10.6
Adjustments 9.8 (1.7) 17% 8.2
Netoperatingincome 26.6 (24.2) 91% 2.4
Financialitems (0.8) 1.4 184% 0.7
Total 25.8 (22.8) 88% 3.1
Statoil 2nd quarter 2010 5

Financialdata Secondquarter Firstsixmonths Fullyear 2010 2009 Change 2010 2009 Change 2009
Weightedaveragenumberof
ordinarysharesoutstanding 3,182,704,054 3,184,206,446 3,182,943,356 3,184,516,025 3,183,873,643
Earningspershare(NOK) 1.14 0.02 >100% 4.63 1.18 >100% 5.75
Non-controllinginterests
(NOKbillion) 0.6 0.1 >100% 0.5 (0.3) >100% 0.6
Cashflowsprovidedby
operatingactivities(NOKbillion) 23.4 30.5 (23%) 47.9 38.7 24% 73.0
Grossinvestments(NOKbillion) 18.5 19.8 (6%) 39.7 39.3 1% 85.0
Netdebttocapitalemployedratio 29.2% 28.3% 29.2% 28.3% 27.3%
Secondquarter2010 Interest Netforeign Interest Netbefore Estimatedtax Netafter(inNOKbillion) income exchange expense tax effect tax
FinancialitemsaccordingtoIFRS 0.4 (3.3) 2.1 (0.8) 1.4 0.6
Foreignexchange(FX)impacts(incl.derivatives) (0.1) 3.3 3.2
Interestrate(IR)derivatives (3.0) (3.0)
Subtotal (0.1) 3.3 (3.0) 0.2 (1.1) (0.9)
FinancialitemsexcludingFXandIRderivatives 0.3 0 (0.9) (0.6) 0.3 (0.3)
Exchangerates 30June2010 31December2009 30June2009
USDNOK 6.50 5.78 6.38
EURNOK 7.97 8.32 9.02
Compositionoftaxexpenseandeffectivetaxrateinthesecondquarterof2010 Beforetax Tax Taxrate Aftertax
Adjustedearnings 36.4 (25.9) 71% 10.6
Adjustments 9.8 (1.7) 17% 8.2
Netoperatingincome 26.6 (24.2) 91% 2.4
Financialitems (0.8) 1.4 184% 0.7
Total 25.8 (22.8) 88% 3.1
Income taxes were NOK 22.8 billion in the second quarter of 2010, equivalent to a tax rate of 88.2%, compared to NOK 19.5 billion in the second quarter of 2009, equivalent to a tax rate of 99.9%. The decrease in tax rate was mainly due to a high tax rate in the second quarter of 2009 caused by significantly higher taxable income than consolidated accounting income in companies that are taxable in other currencies than the functional currency. This was partly offset by operating losses and impairment losses in the second quarter of 2010 in entities which are subject to lower than average tax rate. Also, deferred taxes in the second quarter of 2010 were higher than in the second quarter of 2009 due to currency effects in companies that are taxable in other currencies than the functional currency. In the second quarter of 2010, income before tax amounted to NOK 25.8 billion, while taxable income was estimated to be NOK 4.8 billion lower. The estimated difference of NOK 4.8 billion arose in companies that are taxable in other currencies than the functional currency. The tax effect of this estimated difference contributed to a tax rate of 88.2%. Management does not consider this tax rate to be reflective of the underlying tax exposure. Adjusted earnings after tax, which exclude net financial items and tax on net financial items, is an alternative measure which provides an indication of Statoil's tax exposure to its underlying operational performance in the period, and management believes that this measure better facilitates a comparison between periods.
Financialdata Secondquarter Firstsixmonths Fullyear 2010 2009 Change 2010 2009 Change 2009
Weightedaveragenumberof
ordinarysharesoutstanding 3,182,704,054 3,184,206,446 3,182,943,356 3,184,516,025 3,183,873,643
Earningspershare(NOK) 1.14 0.02 >100% 4.63 1.18 >100% 5.75
Non-controllinginterests
(NOKbillion) 0.6 0.1 >100% 0.5 (0.3) >100% 0.6
Cashflowsprovidedby
operatingactivities(NOKbillion) 23.4 30.5 (23%) 47.9 38.7 24% 73.0
Grossinvestments(NOKbillion) 18.5 19.8 (6%) 39.7 39.3 1% 85.0
Netdebttocapitalemployedratio 29.2% 28.3% 29.2% 28.3% 27.3%
Secondquarter2010 Interest Netforeign Interest Netbefore Estimatedtax Netafter(inNOKbillion) income exchange expense tax effect tax
FinancialitemsaccordingtoIFRS 0.4 (3.3) 2.1 (0.8) 1.4 0.6
Foreignexchange(FX)impacts(incl.derivatives) (0.1) 3.3 3.2
Interestrate(IR)derivatives (3.0) (3.0)
Subtotal (0.1) 3.3 (3.0) 0.2 (1.1) (0.9)
FinancialitemsexcludingFXandIRderivatives 0.3 0 (0.9) (0.6) 0.3 (0.3)
Exchangerates 30June2010 31December2009 30June2009
USDNOK 6.50 5.78 6.38
EURNOK 7.97 8.32 9.02
Compositionoftaxexpenseandeffectivetaxrateinthesecondquarterof2010 Beforetax Tax Taxrate Aftertax
Adjustedearnings 36.4 (25.9) 71% 10.6
Adjustments 9.8 (1.7) 17% 8.2
Netoperatingincome 26.6 (24.2) 91% 2.4
Financialitems (0.8) 1.4 184% 0.7
Total 25.8 (22.8) 88% 3.1
Adjusted earnings after tax in the second quarter of 2010 was NOK 10.6 billion, up from NOK 8.8 billion in the second quarter of 2009. The tax rate on adjusted earnings was 71% and 70% in the second quarter of 2010 and 2009, respectively.
Adjustedearningsaftertaxbysegment Secondquarter
2010 2009
Taxon Adjusted Taxon Adjusted Adjusted adjusted earnings Adjusted adjusted earnings(inNOKbillion) earnings earnings aftertax earnings earnings aftertax
E&PNorway 29.1 21.5 7.6 20.7 15.1 5.6
InternationalE&P 2.9 1.5 1.4 2.8 0.9 1.9
NaturalGas 3.3 2.5 0.8 4.2 3.3 0.8
Manufacturing&Marketing 0.7 0.2 0.5 1.4 0.9 0.5
Other 0.5 0.1 0.3 0.2 0.3 (0.1)
Adjustedearnings[11] 36.4 25.9 10.6 29.2 20.4 8.8
Firsthalfyear2010 Interest Netforeign Interest Netbefore Estimatedtax Netafter(inNOKbillion) income exchange expense tax effect tax
FinancialitemsaccordingtoIFRS 1.3 (5.8) 2.0 (2.5) 2.2 (0.3)
Foreignexchange(FX)impacts(incl.derivatives) 0.0 5.8 5.8
Interestrate(IR)derivatives (4.1) (4.1)
Subtotal 0.0 5.8 (4.1) 1.7 (1.7) (0.0)
FinancialitemsexcludingFXandIRderivatives 1.3 0 (2.1) (0.8) 0.5 (0.3)
Compositionoftaxexpenseandeffectivetaxrateinthefirsthalfof2010 Beforetax Tax Taxrate Aftertax
Adjustedearnings 75.3 (52.5) 70% 22.8
Adjustments 9.1 (0.8) 8% 8.4
Netoperatingincome 66.2 (51.8) 78% 14.4
Financialitems (2.5) 2.2 91% (0.2)
Total 63.7 (49.5) 78% 14.2
In the second quarter of 2010, net income was NOK 3.1 billion compared to NOK 0.0 billion in the second quarter of 2009. The significant increase is mainly due to the increase in operating income caused mainly by higher prices for liquids and increased volumes of gas sold, but also reduced loss on net financial items and a lower effective tax rate contributed to the positive development. In the second quarter of 2010, earnings per share based on net income were NOK 1.14 compared to NOK 0.02 in the second quarter of 2009. Cash flows provided by operating activities amounted to NOK 23.4 billion in the second quarter of 2010, compared to NOK 30.5 billion in the second quarter of 2009. The NOK 7.1 billion decrease was mainly due to decreased cash flows from financial investments and derivatives and negative changes in working capital. These negative items were partly offset by lower tax payments, positive changes in cash flows from underlying operations and positive changes in other non-current items related to operating activities.
Statoil 2nd quarter 2010 6

Cash flows from underlying operations were NOK 41.6 billion in the second quarter of 2010 compared to NOK 37.8 billion in the same period last year. The NOK 3.8 billion increase was mainly due to increased income before tax. Cash flows used in investing activities amounted to NOK 16.5 billion in the second quarter of 2010 compared to NOK 19.6 billion in the same period last year. The decrease stems mainly from NOK 2.1 billion in higher proceeds from sale of assets.
First half 2010 In the first half of 2010, the net operating income was NOK 66.2 billion, compared to NOK 59.8 billion in the first half of 2009. The increase is mainly attributable to higher prices for liquids and higher volumes of gas sold, only partly offset by lower gas prices. Purchases (net of inventory variation) increased by 35%, mainly due to higher prices of liquids measured in NOK. Operating expenses increased by NOK 3.3 billion and selling, general and administration expenses increased by NOK 1.1 billion significantly affected by the NOK 3.8 billion provision for an onerous contract in the second quarter 2010. Depreciation, amortisation and net impairment losses increased by 6% in the first half of 2010 compared to same periode last year, mainly due to higher equity volumes produced. Exploration expenses were down 30 % compared to first half of 2009 mainly because of lower drilling activity, and were only partly offset by increased drilling costs and pre-santioning costs. In the first half of 2010, impairment losses net of reversals (NOK 3.1 billion), lower fair value of derivatives (NOK 1.1 billion), underlift (NOK 0.2 billion) and other accruals (NOK 5.1 billion) negatively impacted net operating income, while higher values of products in operational storage (NOK 0.4 billion) and gain on sale of assets (NOK 0.2 billion) had a positive impact on net operating income. Adjusted for these items and effects of eliminations (NOK 0.2 billion), adjusted earnings were NOK 75.3 billion in the first half of 2010. In the first half of 2009, lower fair value of derivatives (NOK 0.6 billion), impairment charges net of reversals (NOK 5.7 billion) and underlift (NOK 0.5 billion) negatively impacted net operating income, while higher values of products in operational storage (NOK 1.7 billion), gain on sale of assets (NOK 0.5 billion) and other accruals (NOK 1.4 billion) had a positive impact on net operating income for the second quarter of 2009. Adjusted for these items and effects of eliminations (NOK 2.2 billion), adjusted earnings was NOK 65.2 billion in the first half of 2009. The 15% increase in adjusted earnings from the first half of 2009 to the first half of 2010 was primarily caused by the increase in liquids prices and the higher volumes of gas sold, and was only partly offset by lower gas prices and increased exploration expenses due to higher drilling activity and expensing of capitalised exploration costs previous years. Adjusted exploration expenses increased by 18% due to higher drilling costs, expensing of capitalised exploration cost from previous years and increased pre-sanctioning costs. Adjusted depreciation, amortisation and impairment expenses increased by 2% mainly because of higher production volumes. Other contributing factors to the increase in adjusted earnings were a 3% decrease in adjusted operating expenses and a 6% decrease in adjusted selling, general and administrative expense. Net financial items amounted to a loss of NOK 2.5 billion in the first half of 2010, compared to a loss of NOK 8.7 billion in first half of 2009. The loss in the first half of 2010 was primarily due to foreign exchange losses of NOK 5.8 billion, partly offset by fair value gains on interest rate swap positions related to the interest rate management of external loans of NOK 3.9 billion. The loss in the first half of 2009 was mainly due to losses on interest rate swap positions related to the interest rate mangement of NOK 6.0 billion, a loss related to impairment of the investment in the Pernis refinery of NOK 1.1 billion and net foreign exchange losses of NOK 1.6 billion. The fair value gains on interest rate swap positions are caused by decreasing USD interest rates during the six month period ended 30 June 2010. The net foreign exchange losses mainly relate to currency swap positions used for liquidity management, due to an increase in USDNOK currency rates during the first half of 2010. Adjusted for these factors, foreign exchange effects on the financial income and impairment of assets, net financial items before tax would amount to approximately a loss of NOK 0.8 billion for the period. In the first half of 2009 adjusted net financial items before tax was a gain of NOK 0.1 billion.
Adjustedearningsaftertaxbysegment Secondquarter
2010 2009
Taxon Adjusted Taxon Adjusted Adjusted adjusted earnings Adjusted adjusted earnings(inNOKbillion) earnings earnings aftertax earnings earnings aftertax
E&PNorway 29.1 21.5 7.6 20.7 15.1 5.6
InternationalE&P 2.9 1.5 1.4 2.8 0.9 1.9
NaturalGas 3.3 2.5 0.8 4.2 3.3 0.8
Manufacturing&Marketing 0.7 0.2 0.5 1.4 0.9 0.5
Other 0.5 0.1 0.3 0.2 0.3 (0.1)
Adjustedearnings[11] 36.4 25.9 10.6 29.2 20.4 8.8
Netfinancialitems Firsthalf2010
Interest Netforeign Interest Netbefore Estimatedtax Netafter(inNOKbillion) income exchange expense tax effect tax
FinancialitemsaccordingtoIFRS 1.3 (5.8) 2.0 (2.5) 2.2 (0.3)
Foreignexchange(FX)impacts(incl.derivatives) 0.0 5.8 5.8
Interestrate(IR)derivatives (4.1) (4.1)
Subtotal 0.0 5.8 (4.1) 1.7 (1.7) (0.0)
FinancialitemsexcludingFXandIRderivatives 1.3 0 (2.1) (0.8) 0.5 (0.3)
Compositionoftaxexpenseandeffectivetaxrateinthefirsthalfof2010 Beforetax Tax Taxrate Aftertax
Adjustedearnings 75.3 (52.5) 70% 22.8
Adjustments 9.1 (0.8) 8% 8.4
Netoperatingincome 66.2 (51.8) 78% 14.4
Financialitems (2.5) 2.2 91% (0.2)
Total 63.7 (49.5) 78% 14.2
Income taxes were NOK 49.5 billion in the first half of 2010, equivalent to a tax rate of 77.7%, compared to NOK 47.1 billion in the first half of 2009, equivalent to a tax rate of 92.2%. The decrease in tax rate was mainly due to high tax rate in the first half of 2009 caused by higher taxable income than consolidated accounting income in companies that are taxable in other currencies than the functional currency.
Statoil 2nd quarter 2010 7

Adjustedearningsaftertaxbysegment Secondquarter
2010 2009
Taxon Adjusted Taxon Adjusted Adjusted adjusted earnings Adjusted adjusted earnings(inNOKbillion) earnings earnings after-tax earnings earnings after-tax
E&PNorway 29.1 21.5 7.6 20.7 15.1 5.6
InternationalE&P 2.9 1.5 1.4 2.8 0.9 1.9
NaturalGas 3.3 2.5 0.8 4.2 3.3 0.8
Manufacturing&Marketing 0.7 0.2 0.5 1.4 0.9 0.5
Other 0.5 0.1 0.3 0.2 0.3 (0.1)
Adjustedearnings[11] 36.4 25.9 10.6 29.2 20.4 8.8
Firsthalfyear2010 Interest Netforeign Interest Netbefore Estimatedtax Netafter(inNOKbillion) income exchange expense tax effect tax
FinancialitemsaccordingtoIFRS 1.3 (5.8) 2.0 (2.5) 2.2 (0.3)
Foreignexchange(FX)impacts(incl.derivatives) 0.0 5.8 5.8
Interestrate(IR)derivatives (4.1) (4.1)
Subtotal 0.0 5.8 (4.1) 1.7 (1.7) (0.0)
FinancialitemsexcludingFXandIRderivatives 1.3 0 (2.1) (0.8) 0.5 (0.3)
Compositionoftaxexpenseandeffectivetaxrateinthefirsthalfof2010 Beforetax Tax Taxrate Aftertax
Adjustedearnings 75.3 (52.5) 70% 22.8
Adjustments 9.1 (0.8) 8% 8.4
Netoperatingincome 66.2 (51.8) 78% 14.4
Financialitems (2.5) 2.2 91% (0.2)
Total 63.7 (49.5) 78% 14.2
Adjusted earnings after tax excludes the effects of net financial items and tax on financial items, and in the first half of 2010 adjusted earnings after tax were NOK 22.8 billion, up from NOK 19.1 billion in the same period last year. The adjusted tax rate on adjusted earnings was 70% and 71% in the first half of 2010 and 2009, respectively.
Adjustedearningsaftertaxbysegment Firsthalf
2010 2009
Taxon Adjusted Taxon Adjusted Adjusted adjusted earnings Adjusted adjusted earnings(inNOKbillion) earnings earnings aftertax earnings earnings aftertax
E&PNorway 58.2 43.1 15.1 50.4 37.3 13.1
InternationalE&P 7.3 3.4 3.9 3.1 1.2 1.9
NaturalGas 7.9 5.7 2.2 9.2 6.9 2.2
Manufacturing&Marketing 1.7 0.5 1.2 3.0 1.4 1.6
Other 0.3 (0.3) 0.5 (0.4) (0.7) 0.3
Group 75.3 52.5 22.8 65.2 46.2 19.1
Secondquarter Firsthalfyear YearHSE 2010 2009 2010 2009 2009
Totalrecordableinjuryfrequency 3.6 4.1 4.0 4.4 4.1
Seriousincidentfrequency 1.3 2.0 1.3 2.2 1.9
Accidentaloilspills(number) 111 102 189 204 435
Accidentaloilspills(cubicmetres) 6 20 12 49 170
In the first half of 2010, net income was NOK 14.2 billion compared to NOK 4.0 billion in the same period last year. The significant increase is mainly due to increased operating income caused by higher revenues from liquids and gas sales, reduced loss on net financial items and a lower effective tax rate, and was only partly offset by higher operating expenses due to a provision for an onerous contract. In the first half of 2010 earnings per share based on net income amounted to NOK 4.63, compared to NOK 1.18 in the first half of 2009. Cash flows provided by operations amounted to NOK 47.9 billion in the first half of 2010, increased by NOK 9.2 billion from the same period last year. The increase was mainly due to lower income tax payment and positive changes in cash flows from underlying operations and other non-current items related to operating activities. These positive items were partly offset by negative changes in working capital. Cash flows from underlying operations were NOK 91.3 billion in the first half of 2010, compared to NOK 88.9 billion in the same period last year. The NOK 2.4 billion increase was mainly due to increased income before tax party offset by lower non-cash effects from currency losses. Cash flows used in investing activities decreased by NOK 3.7 billion compared to the same period last year, mainly due to NOK 2.7 billion more in proceeds from sales of assets.
Statoil 2nd quarter 2010 8
OUTLOOKStatoil's guidance for equity production is in the range of 1,925 to 1,975 mboe per day in 2010 and between 2,060 and 2,160 mboe per day in 2012 [13]. The expected volumes exclude any potential impacts of Opec cuts. Commercial considerations related to gas sales activities, operational regularity, the timing of new capacity coming on stream and gas offtake represent the most significant risks related to the production guidance. Planned turnarounds in 2010 are estimated to have a negative impact on the equity production of around 50 mboe per day for the full year and around 120 mboe per day, quarterly effect, in the third quarter of 2010. Capital expenditures for 2010, excluding acquisitions and capital leases, are estimated to be around USD 13 billion. Unit production cost for 2010 equity volumes is estimated to be NOK 35-36 per boe, which is on par with 2009. The company will continue to mature the large portfolio of exploration assets and expects an exploration activity level in 2010 of around USD 2.3 billion.

We anticipate that commodity prices will continue to be volatile and that gas market will be challenging in the near term. Refining margins have improved slightly recently, but we anticipate that they will remain at a low level, at least in the near term. These forward-looking statements reflect current views about future events and are, by their nature, subject to significant risks and uncertainties because they relate to events and depend on circumstances that will occur in the future. See "Forward-Looking Statements" below.
Statoil 2nd quarter 2010 9
RISK UPDATE
INDICATIVE EFFECTS ON 2010 RESULTS
Net income effectNet operating income effect before tax
Exchange rate: USDNOK +0.50 (P&L effect excl finance)
Gas price: + NOK 0.50/scm
Oil price: + USD 10/bbl
(NOK billion)
The sensitivity analysis shows the estimated 12 months effect
of changes in parameters. The changes in parameters do not
have the same probability.
7
20
3
15
6
21
Risk factors The results of operations largely depend on a number of factors, most significantly those that affect the price obtained in NOK for products sold. Specifically, such factors include the level of liquids and natural gas prices, trends in the exchange rates, liquids and natural gas production volumes, which in turn depend on entitlement volumes under profit sharing agreements and available petroleum reserves, Statoil's, as well as our partners' expertise and co-operation in recovering oil and natural gas from those reserves, and changes in Statoil's portfolio of assets due to acquisitions and disposals. The illustration shows how certain changes in crude oil prices (a substitute for liquids prices), natural gas contract prices and the USDNOK exchange rate, if sustained for a full year, could impact our net operating income in 2010. Changes in commodity prices, currency and interest rates may result in income or expense for the period as well as changes in the fair value of derivatives in the balance sheet. The illustration is not intended to be exhaustive with respect to risks that have or may have a material impact on the cash flows and results of operation. See the annual report for 2009 and the 2009 Annual Report on Form20-F for a more detailed discussion of the risks to which Statoil is exposed.
Financial risk management Statoil has policies in place to manage risk for commercial and financial counterparties by the use of derivatives and market activities in general. Statoil has so far had only limited exposure towards distressed parties and instruments. Only insignificant counterparty losses have been incurred so far. The group's exposure towards financial counterparties is considered to have an acceptable risk profile. The markets for short- and long-term financing are currently considered to function comfortably for borrowers with Statoil's credit standing and general characteristics. However, under the current circumstances uncertainty still exists. Funding costs for short maturities are generally at historically low levels. Long-term funding costs are at attractive levels. With regard to liquidity management, the focus is on finding the right balance between risk and reward and most funds are currently placed in short term certificates with minimum single A-rating, or with banks with minimum single A-rating. In accordance with our internal credit rating policy, we assess counterparty credit risk annually and assess counterparties identified as high risk more frequently. The internal credit ratings reflect our assessment of the counterparties' credit risk.

HEALTH, SAFETY AND THE ENVIRONMENT (HSE)
Second quarter The total recordable injury frequency was 3.6 in the second quarter of 2010 compared to 4.1 in the second quarter of 2009. The serious incident frequency improved from 2.0 in the second quarter of 2009 to 1.3 in the second quarter of 2010. The volume of oil spills decreased from 20 cubic metres in the second quarter of 2009 to 6 cubic metres in the second quarter of 2010. The number of accidental oil spills in the second quarter of 2010 was at the same level as for the second quarter of 2009.
First half 2010 The total recordable injury frequency was 4.0 in the first half year of 2010 compared to 4.4 in the first half year of 2009. The serious incident frequency rate improved from 2.2 in the first half year of 2009 to 1.3 in the first half year of 2010. The volume of oil spills decreased from 49 cubic metres in the first half year of 2009 to 12 cubic metres in the first half year of 2010. The number of accidental oil spills in the first half year of 2010 decreased compared to the first half year of 2009.
Adjustedearningsaftertaxbysegment Firsthalf
2010 2009
Taxon Adjusted Taxon Adjusted Adjusted adjusted earnings Adjusted adjusted earnings(inNOKbillion) earnings earnings after-tax earnings earnings after-tax
E&PNorway 58.2 43.1 15.1 50.4 37.3 13.1
InternationalE&P 7.3 3.4 3.9 3.1 1.2 1.9
NaturalGas 7.9 5.7 2.2 9.2 6.9 2.2
Manufacturing&Marketing 1.7 0.5 1.2 3.0 1.4 1.6
Other 0.3 (0.3) 0.5 (0.4) (0.7) 0.3
Group 75.3 52.5 22.8 65.2 46.2 19.1
Secondquarter Firsthalfyear YearHSE 2010 2009 2010 2009 2009
Totalrecordableinjuryfrequency 3.6 4.1 4.0 4.4 4.1
Seriousincidentfrequency 1.3 2.0 1.3 2.2 1.9
Accidentaloilspills(number) 111 102 189 204 435
Accidentaloilspills(cubicmetres) 6 20 12 49 170
Statoil 2nd quarter 2010 10

E&P NORWAY E&PNORWAY
IFRSincomestatement Secondquarter Firsthalf Fullyear(inNOKbillion) 2010 2009 Change 2010 2009 Change 2009
Totalrevenuesandotherincome 43.0 34.0 27% 85.1 76.9 11% 158.7
Operatingexpenses 5.7 6.0 (4%) 12.0 11.6 3% 23.4
Selling,generalandadministrativeexpenses 0.0 0.2 (96%) 0.0 0.0 12% 0.1
Depreciation,amortisationandimpairment 6.4 5.8 9% 12.5 11.8 5% 25.7
Explorationexpenses 1.3 1.4 (7%) 2.4 2.8 (15%) 5.2
Totalexpenses 13.4 13.4 (0%) 26.9 26.3 2% 54.3
Netoperatingincome 29.6 20.6 44% 58.2 50.6 15% 104.3
Adjustedearnings[11] Secondquarter Firsthalf Fullyear(inNOKbillion) 2010 2009 Change 2010 2009 Change 2009
Totalrevenuesandotherincomeadjusted 42.7 34.6 23% 85.1 77.4 10% 157.8
Operatingexpensesadjusted 5.9 6.5 (9%) 12.0 12.4 (3%) 24.3
Selling,generalandadministrative
expensesadjusted 0.0 0.2 (96%) 0.0 0.0 12% 0.1
Depreciation,amortisationand
impairmentadjusted 6.4 5.8 9% 12.5 11.8 5% 25.7
Explorationexpensesadjusted 1.3 1.4 (7%) 2.4 2.8 (15%) 5.2
Adjustedearnings[11] 29.1 20.7 41% 58.2 50.4 15% 102.6
Secondquarter Firsthalf FullyearOperationaldata 2010 2009 Change 2010 2009 Change 2009
Prices:
Liquidsprice(USD/bbl) 73.6 53.0 39% 73.6 47.4 55% 57.8
Liquidsprice(NOK/bbl) 459.1 344.5 33% 444.6 317.3 40% 363.0
Transferpricenaturalgas(NOK/scm) 1.17 1.32 (11%) 1.15 1.64 (30%) 1.38
Liftings:
Liquids(mboeperday) 700 685 2% 736 781 (6%) 778
Naturalgas(mboeperday) 709 617 15% 739 684 8% 666
Totalliquidsandgasliftings
(mboeperday) 1,409 1,302 8% 1,475 1,465 1% 1,444
Production:
Entitlementliquids(mboeperday) 723 729 (1%) 750 780 (4%) 784
Entitlementnaturalgas(mboeperday) 709 617 15% 739 684 8% 666
Totalentitlementliquidsandgas
production(mboeperday) 1,432 1,346 6% 1,488 1,464 2% 1,450
E&PNORWAY
IFRSincomestatement Secondquarter Firsthalf Fullyear(inNOKbillion) 2010 2009 Change 2010 2009 Change 2009
Totalrevenuesandotherincome 43.0 34.0 27% 85.1 76.9 11% 158.7
Operatingexpenses 5.7 6.0 (4%) 12.0 11.6 3% 23.4
Selling,generalandadministrativeexpenses 0.0 0.2 (96%) 0.0 0.0 12% 0.1
Depreciation,amortisationandimpairment 6.4 5.8 9% 12.5 11.8 5% 25.7
Explorationexpenses 1.3 1.4 (7%) 2.4 2.8 (15%) 5.2
Totalexpenses 13.4 13.4 (0%) 26.9 26.3 2% 54.3
Netoperatingincome 29.6 20.6 44% 58.2 50.6 15% 104.3
Adjustedearnings[11] Secondquarter Firsthalf Fullyear(inNOKbillion) 2010 2009 Change 2010 2009 Change 2009
Totalrevenuesandotherincomeadjusted 42.7 34.6 23% 85.1 77.4 10% 157.8
Operatingexpensesadjusted 5.9 6.5 (9%) 12.0 12.4 (3%) 24.3
Selling,generalandadministrative
expensesadjusted 0.0 0.2 (96%) 0.0 0.0 12% 0.1
Depreciation,amortisationand
impairmentadjusted 6.4 5.8 9% 12.5 11.8 5% 25.7
Explorationexpensesadjusted 1.3 1.4 (7%) 2.4 2.8 (15%) 5.2
Adjustedearnings[11] 29.1 20.7 41% 58.2 50.4 15% 102.6
Secondquarter Firsthalf FullyearOperationaldata 2010 2009 Change 2010 2009 Change 2009
Prices:
Liquidsprice(USD/bbl) 73.6 53.0 39% 73.6 47.4 55% 57.8
Liquidsprice(NOK/bbl) 459.1 344.5 33% 444.6 317.3 40% 363.0
Transferpricenaturalgas(NOK/scm) 1.17 1.32 (11%) 1.15 1.64 (30%) 1.38
Liftings:
Liquids(mboeperday) 700 685 2% 736 781 (6%) 778
Naturalgas(mboeperday) 709 617 15% 739 684 8% 666
Totalliquidsandgasliftings
(mboeperday) 1,409 1,302 8% 1,475 1,465 1% 1,444
Production:
Entitlementliquids(mboeperday) 723 729 (1%) 750 780 (4%) 784
Entitlementnaturalgas(mboeperday) 709 617 15% 739 684 8% 666
Totalentitlementliquidsandgas
production(mboeperday) 1,432 1,346 6% 1,488 1,464 2% 1,450
Statoil 2nd quarter 2010 11

Second quarter Solid performance with high production in the quarter.
All five exploration wells drilled in the period were discoveries. Well control incident at Gullfaks C well C-06 in May, production resumed in July.
OPERATIONAL REVIEW Average daily production of liquids decreased from 729 mboe per day in the second quarter of 2009 to 723 mboe per day in the second quarter of 2010. The decrease in liquids production was mainly related to decline on several fields and operational issues at Gullfaks. The decrease was partly offset by lower production loss due to fewer maintenance turnarounds in the second quarter of 2010. Average daily production of gas increased from 617 mboe per day in the second quarter of 2009 to 709 mboe per day in the second quarter of 2010. The increase was mainly related to higher gas offtake and partly due to increased production due to fewer turnarounds in the second quarter of 2010. Average daily lifting of liquids increased from 685 mboe per day in the second quarter of 2009 to 700 mboe per day in the same quarter of 2010. Exploration expenditure (including capitalised exploration expenditure) was NOK 1.3 billion in the second quarter of 2010 compared to NOK 2.6 billion in the second quarter of 2009, due to decreased drilling activity. In the second quarter of 2010, five exploration and appraisal wells have been completed, all with discoveries. In the second quarter of 2009, 14 exploration and appraisal wells were completed, of these 12 were discoveries. Adjusted exploration expenses were NOK 1.3 billion in the second quarter of 2010, compared to NOK 1.4 billion in the second quarter of 2009. On 19 May a well control incident with loss of drilling fluid occurred at Gullfaks C causing the production to shut down on both Gullfaks C and the satellite fields Gimle and Tordis. A plan to manage the incident was implemented and barriers in the well were re-established allowing for production to resume on14 July without any environmental spills or safety being compromised.
FINANCIAL REVIEW In the second quarter of 2010, net operating income for E&P Norway was NOK 29.6 billion compared to NOK 20.6 billion in the second quarter of 2009. The increase is mainly attributable to higher oil prices. In the second quarter of 2010, unrealised gain on derivatives (NOK 1.3 billion) had a positive impact on net operating income, while underlift (NOK 0.7 billion) negatively impacted net operating income. Adjusted for these items, adjusted earnings were NOK 29.1 billion in the second quarter of 2010. In the second quarter of 2009, adjusted earnings were NOK 20.7 billion. The increase was mainly due to an increase in E&P Norway's realised price of liquids measured in NOK, which positively impacted the adjusted earnings by NOK 7.5 billion and an increase in the production of gas which positively impacted adjusted earnings by NOK 1.8 billion. This was partly offset by a lower transfer sales price of natural gas that negatively impacted adjusted earnings by NOK 1.2 billion and a decrease in oil production that negatively impacted adjusted earnings by NOK 0.2 billion. In addition, other income was NOK 0.1 billion higher, selling, general and administrative costs were NOK 0.2 billion lower. Exploration expenses were NOK 0.1 billion lower. Depreciation, amortisation and impairment were NOK 0.6 billion higher mainly due to investments on mature fields and high depreciation due to increased production and new fields. Operating expenses were NOK 0.6 billion lower mainly due to a decrease in processing/transportation costs and lower operating plant costs.
First half 2010
OPERATIONAL REVIEW Average daily production of liquids decreased from 780 mboe per day in the first half of 2009 to 750 mboe per day in the first half of 2010. The decrease in liquids production was mainly related to expected declines on several fields. The decrease was partly offset by Kvitebjørn being back in production and new production from Tyrihans. Average daily production of gas increased from 684 mboe per day in the first half of 2009 to 739 mboe per day in the first half of 2010. The increase of gas production is mainly due to build-up of production at Ormen Lange, Kvitebjørn being back in production and higher gas offtake. Average daily lifting of liquids decreased from 781 mboe per day in the first half of 2009 to 736 mboe per day in the first half of 2010. Exploration expenditure (including capitalised exploration expenditure) was NOK 2.5 billion in the first half of 2010 compared to NOK 5.1 billion in the first half of 2009, due to decreased drilling activity. In the first half of 2010, nine exploration and appraisal wells have been completed, eight wells were discoveries. In 2009, 26 exploration and appraisal wells were completed, of these 22 were discoveries. Adjusted exploration expenses were NOK 2.4 billion in the first half of 2010 compared to NOK 2.8 billion in the first half of 2009.
Statoil 2nd quarter 2010 12

FINANCIAL REVIEW In the first half of 2010, the net operating income for E&P Norway was NOK 58.2 billion compared to NOK 50.6 billion in the first half of 2009. Unrealised gain on derivatives (NOK 1.1 billion) positively impacted net operating income. A change in future settlement related to a sale of a licence share (NOK 0.1 billion) and underlift (NOK 1.0 billion) negatively impacted net operating income. Adjusted for these items, adjusted earnings were NOK 58.2 billion in the first half of 2010. In the first half of 2009, adjusted earnings were NOK 50.4 billion. The increase was mainly due to an increase in E&P Norway's realised price of liquids measured in NOK, which positively impacted the adjusted earnings by NOK 17.2 billion and an increase in produced natural gas volumes, which positively contributed with NOK 2.6 billion. This was partly offset by a lower transfer sales price for natural gas that negatively impacted adjusted earnings by NOK 10.8 billion and a decrease in oil production that negatively impacted adjusted earnings by NOK 1.7 billion. Other income was NOK 0.5 billion higher. Depreciation, amortisation and impairment were NOK 0.6 billion higher mainly due to higher investments, increased production and new fields coming on stream. Exploration expenses were NOK 0.4 billion lower. Operating expenses were NOK 0.4 billion lower mainly due to a decrease in processing/transportations costs and lower operating plant costs.
Important events since last quarter: Exploration activity in the period included five discoveries: PL128 Fossekall (1 April), PL473 Flyndretind (13 May), PL212 Snadd Nord (10 June),
PL001B Draupne appraisal well (26 April) and PL0018 Draupne appraisal sidetrack (9 May). Tyrihans C-3 H well was completed, the highest contributor to Statoil's share production of 20 mboe per day in Statoil for 2010. Well control incident occurred at Gullfaks C 19 May with well C-06. Production resumed on 14 July 2010. Tie-in agreement concluded between Sleipner and Gudrun. On 13 June the Gjøa platform was towed out on its northward journey. On 16 June the Norwegian Parliament (Stortinget) approved the plan for development and operation (PDO) for Gudrun. On 22 July the Norwegian Parliament (Stortinget) approved the plan for development and operation (PDO) for Marulk.
Statoil 2nd quarter 2010 13

INTERNATIONAL E&P INTERNATIONALE&P
IFRSincomestatement Secondquarter Firsthalf Fullyear(inNOKbillion) 2010 2009 Change 2010 2009 Change 2009
Totalrevenuesandotherincome 11.3 10.7 5% 25.1 18.8 33% 41.8
Purchase,netofinventoryvariation (0.0) 0.6 >(100)% 0.0 0.7 (99%) 1.1
Operatingexpenses 2.0 1.8 13% 4.3 3.3 30% 6.7
Selling,generalandadministrativeexpenses 0.8 0.6 39% 1.5 1.5 2% 2.8
Depreciation,amortisationandimpairment 3.8 3.6 5% 7.6 7.6 0% 17.1
Explorationexpenses 2.3 3.0 (25%) 4.4 6.9 (36%) 11.5
Totalexpenses 8.8 9.5 (7%) 17.8 20.0 (11%) 39.2
Netoperatingincome 2.5 1.2 >100% 7.3 (1.1) >100% 2.6
Adjustedearnings[11] Secondquarter Firsthalf Fullyear(inNOKbillion) 2010 2009 Change 2010 2009 Change 2009
Totalrevenuesandotherincomeadjusted 12.1 10.9 11% 24.7 19.1 29% 42.2
Purchase,netofinventory
variationadjusted (0.0) 0.6 >(100)% 0.0 0.7 (99%) 1.1
Operatingexpensesadjusted 2.2 1.8 24% 4.0 3.2 24% 6.6
Selling,generalandadministrative
expensesadjusted 0.8 0.6 39% 1.5 1.5 2% 2.8
Depreciation,amortisation
andimpairmentadjusted 3.9 4.2 (7%) 7.7 7.9 (2%) 16.4
Explorationexpensesadjusted 2.4 1.0 >100% 4.2 2.8 52% 6.1
Adjustedearnings[11] 2.9 2.8 3% 7.3 3.1 >100% 9.2
Secondquarter Firsthalf FullyearOperationaldata 2010 2009 Change 2010 2009 Change 2009
Prices:
Liquidsprice(USD/bbl) 75.2 55.2 36% 74.9 48.5 54% 58.4
Liquidsprice(NOK/bbl) 468.9 358.5 31% 452.8 324.4 40% 366.5
Liftings:
Liquids(mboeperday) 242 283 (14%) 274 269 2% 267
Naturalgas(mboeperday) 75 80 (7%) 78 80 (2%) 74
Totalliquidsandgasliftings
(mboeperday) 317 362 (13%) 352 349 1% 341
Production:
Entitlementliquids(mboeperday)[6] 258 303 (15%) 273 288 (5%) 283
Entitlementnaturalgas(mboeperday) 75 80 (7%) 78 80 (2%) 74
Totalentitlementliquidsandgas
production(mboeperday) 333 383 (13%) 351 368 (4%) 357
Totalequitygasproduction
(mboeperday) 100 91 10% 108 100 8% 94
Totalequityliquidsproduction
(mboeperday) 425 408 4% 433 395 9% 418
Totalequityliquidsandgas
production(mboeperday) 525 499 5% 541 495 9% 512
INTERNATIONALE&P
IFRSincomestatement Secondquarter Firsthalf Fullyear(inNOKbillion) 2010 2009 Change 2010 2009 Change 2009
Totalrevenuesandotherincome 11.3 10.7 5% 25.1 18.8 33% 41.8
Purchase,netofinventoryvariation (0.0) 0.6 >(100)% 0.0 0.7 (99%) 1.1
Operatingexpenses 2.0 1.8 13% 4.3 3.3 30% 6.7
Selling,generalandadministrativeexpenses 0.8 0.6 39% 1.5 1.5 2% 2.8
Depreciation,amortisationandimpairment 3.8 3.6 5% 7.6 7.6 0% 17.1
Explorationexpenses 2.3 3.0 (25%) 4.4 6.9 (36%) 11.5
Totalexpenses 8.8 9.5 (7%) 17.8 20.0 (11%) 39.2
Netoperatingincome 2.5 1.2 >100% 7.3 (1.1) >100% 2.6
Adjustedearnings[11] Secondquarter Firsthalf Fullyear(inNOKbillion) 2010 2009 Change 2010 2009 Change 2009
Totalrevenuesandotherincomeadjusted 12.1 10.9 11% 24.7 19.1 29% 42.2
Purchase,netofinventory
variationadjusted (0.0) 0.6 >(100)% 0.0 0.7 (99%) 1.1
Operatingexpensesadjusted 2.2 1.8 24% 4.0 3.2 24% 6.6
Selling,generalandadministrative
expensesadjusted 0.8 0.6 39% 1.5 1.5 2% 2.8
Depreciation,amortisation
andimpairmentadjusted 3.9 4.2 (7%) 7.7 7.9 (2%) 16.4
Explorationexpensesadjusted 2.4 1.0 >100% 4.2 2.8 52% 6.1
Adjustedearnings[11] 2.9 2.8 3% 7.3 3.1 >100% 9.2
Secondquarter Firsthalf FullyearOperationaldata 2010 2009 Change 2010 2009 Change 2009
Prices:
Liquidsprice(USD/bbl) 75.2 55.2 36% 74.9 48.5 54% 58.4
Liquidsprice(NOK/bbl) 468.9 358.5 31% 452.8 324.4 40% 366.5
Liftings:
Liquids(mboeperday) 242 283 (14%) 274 269 2% 267
Naturalgas(mboeperday) 75 80 (7%) 78 80 (2%) 74
Totalliquidsandgasliftings
(mboeperday) 317 362 (13%) 352 349 1% 341
Production:
Entitlementliquids(mboeperday)[6] 258 303 (15%) 273 288 (5%) 283
Entitlementnaturalgas(mboeperday) 75 80 (7%) 78 80 (2%) 74
Totalentitlementliquidsandgas
production(mboeperday) 333 383 (13%) 351 368 (4%) 357
Totalequitygasproduction
(mboeperday) 100 91 10% 108 100 8% 94
Totalequityliquidsproduction
(mboeperday) 425 408 4% 433 395 9% 418
Totalequityliquidsandgas
production(mboeperday) 525 499 5% 541 495 9% 512
Statoil 2nd quarter 2010 14

INTERNATIONALE&P
IFRSincomestatement Secondquarter Firsthalf Fullyear(inNOKbillion) 2010 2009 Change 2010 2009 Change 2009
Totalrevenuesandotherincome 11.3 10.7 5% 25.1 18.8 33% 41.8
Purchase,netofinventoryvariation (0.0) 0.6 >(100)% 0.0 0.7 (99%) 1.1
Operatingexpenses 2.0 1.8 13% 4.3 3.3 30% 6.7
Selling,generalandadministrativeexpenses 0.8 0.6 39% 1.5 1.5 2% 2.8
Depreciation,amortisationandimpairment 3.8 3.6 5% 7.6 7.6 0% 17.1
Explorationexpenses 2.3 3.0 (25%) 4.4 6.9 (36%) 11.5
Totalexpenses 8.8 9.5 (7%) 17.8 20.0 (11%) 39.2
Netoperatingincome 2.5 1.2 >100% 7.3 (1.1) >100% 2.6
Adjustedearnings[11] Secondquarter Firsthalf Fullyear(inNOKbillion) 2010 2009 Change 2010 2009 Change 2009
Totalrevenuesandotherincomeadjusted 12.1 10.9 11% 24.7 19.1 29% 42.2
Purchase,netofinventory
variationadjusted (0.0) 0.6 >(100)% 0.0 0.7 (99%) 1.1
Operatingexpensesadjusted 2.2 1.8 24% 4.0 3.2 24% 6.6
Selling,generalandadministrative
expensesadjusted 0.8 0.6 39% 1.5 1.5 2% 2.8
Depreciation,amortisation
andimpairmentadjusted 3.9 4.2 (7%) 7.7 7.9 (2%) 16.4
Explorationexpensesadjusted 2.4 1.0 >100% 4.2 2.8 52% 6.1
Adjustedearnings[11] 2.9 2.8 3% 7.3 3.1 >100% 9.2
Secondquarter Firsthalf FullyearOperationaldata 2010 2009 Change 2010 2009 Change 2009
Prices:
Liquidsprice(USD/bbl) 75.2 55.2 36% 74.9 48.5 54% 58.4
Liquidsprice(NOK/bbl) 468.9 358.5 31% 452.8 324.4 40% 366.5
Liftings:
Liquids(mboeperday) 242 283 (14%) 274 269 2% 267
Naturalgas(mboeperday) 75 80 (7%) 78 80 (2%) 74
Totalliquidsandgasliftings
(mboeperday) 317 362 (13%) 352 349 1% 341
Production:
Entitlementliquids(mboeperday)[6] 258 303 (15%) 273 288 (5%) 283
Entitlementnaturalgas(mboeperday) 75 80 (7%) 78 80 (2%) 74
Totalentitlementliquidsandgas
production(mboeperday) 333 383 (13%) 351 368 (4%) 357
Totalequitygasproduction
(mboeperday) 100 91 10% 108 100 8% 94
Totalequityliquidsproduction
(mboeperday) 425 408 4% 433 395 9% 418
Totalequityliquidsandgas
production(mboeperday) 525 499 5% 541 495 9% 512
Second quarter Revenues were positively impacted by 31% increase in liquids prices measured in NOK.
Equity production increased 5% compared to second quarter last year. Entitlement production decreased by 13% compared to second quarter last year. Substantial increase in exploration expenses compared to second quarter last year. Drilling moratorium in Gulf of Mexico imposing a temporary shutdown of all drilling operations in deepwater GoM.
OPERATIONAL REVIEW Average daily entitlement production of liquids and gas was 333 mboe per day in the second quarter of 2010, compared to 383 mboe per day in the second quarter of 2009. There was an average negative Production Sharing Agreement (PSA) effect on entitlement production of 192 mboe per day in the second quarter of 2010, compared to 116 mboe in the second quarter of 2009. The increase in PSA effect was due to change in profit tranches for some of our fields in Angola, some positive PSA adjustments in second quarter 2009 related to previous periods and higher prices in second quarter of 2010 leading to reduced entitlement shares. Average daily equity production of liquids increased from 408 mboe per day in the second quarter of 2009 to 425 mboe per day in the second quarter of 2010. The increase in liquids production was mainly related to start-up on Tahiti in the Gulf of Mexico in the second quarter of 2009, Thunder Hawk in Gulf of Mexico which came on stream in third quarter 2009 and Agbami field in Nigeria due to ramp-up in 2009. Average daily equity production of gas increased from 91 mboe per day in the second quarter of 2009 to 100 mboe per day in the second quarter of 2010. The increase was mainly related to In Salah in Algeria due to higher nominations and Marcellus in USA due to more wells entering production. This was partly offset by decreased production from Independence Hub in Gulf of Mexico. Average daily lifting of liquids and gas decreased from 362 mboe per day in the second quarter of 2009 to 317 mboe per day in the second quarter of 2010. Exploration expenditure (including capitalised exploration expenditure) was NOK 2.5 billion in the second quarter of 2010 compared to NOK 1.4 billion the second quarter of 2009. There has been an increase in both drilling cost and pre-sanctioning cost. Adjusted exploration expenses were NOK 2.4 billion in the second quarter of 2010, compared to NOK 1.0 billion in the second quarter of 2009. The increase was mainly related to an increase in drilling cost, expensing of capitalized exploration cost from previous years and an increase in pre-sanctioning cost. In the second quarter of 2010, three exploration and appraisal wells were completed, and two wells were announced as discoveries. A number of completed wells have encountered hydrocarbons but need more thorough evaluation before final conclusions on potential commerciality can be made.
Statoil 2nd quarter 2010 15

In May, a six month drilling moratorium was imposed in US deepwater Gulf of Mexico following the Deepwater Horizon accident in April. At the time the moratorium was established, Statoil was participating in the drilling of five wells and is the operator of two rigs in the Gulf of Mexico. The drilling moratorium will, if sustained, significantly affect Statoil's exploration in the area. We are working with suppliers and partners to redeploy the rigs, therefore, Statoil has not recognised any provision for onerous contracts related to this in the second quarter of 2010.
FINANCIAL REVIEW In the second quarter of 2010, net operating income for International E&P was NOK 2.5 billion compared to NOK 1.2 billion in the same period last year. In the second quarter of 2010, reversal of past impairments of NOK 0.2 billion (NOK 0.1 billion on exploration and NOK 0.1 billion on depreciation and amortisation) and underlift of NOK 0.1 billion (due to an adjustment on operating expenses) positively impacted net operating income. An adjustment on total revenues and other income of NOK 0.7 billion connected to accruals for disputed cost recovery audits related to prior years negatively impacted net operating income. In the second quarter 2009, impairment losses on exploration (NOK 2.0 billion) and underlift (NOK 0.2 billion) negatively impacted net operating income, and reversals of past impairments on depreciation and amortisation (NOK 0.6 billion) had a positive impact on net operating income. Adjusted for these items, adjusted earnings in the second quarter of 2010 and 2009 were NOK 2.9 billion and NOK 2.8 billion, respectively. The increase was mainly due to a 28% increase in realised liquids and gas prices measured in NOK impacting adjusted earnings by NOK 2.6 billion, a decrease in depreciation, amortisation and impairment expenses by NOK 0.3 billion and a decrease in operational expenses (including Purchases, net of inventory) of NOK 0.2 billion compared to the second quarter of 2009. The increase was partly offset by reduced entitlement production negatively impacting adjusted earnings by NOK 1.5 billion, NOK 1.4 billion increase in exploration expenses and an increase in selling, general and administrative cost by NOK 0.2 billion in the second quarter of 2010 compared to the second quarter of 2009.
First half 2010
OPERATIONAL REVIEW Average daily entitlement production of liquids and gas was 351 mboe per day in the first half of 2010, compared to 368 mboe per day in the first half of 2009. There was an average negative PSA effect on entitlement production of 190 mboe per day in the first half of 2010, compared to 127 mboe in the first half of 2009. The increase in PSA effect in the first half of 2010 compared to the first half of 2009 can be ascribed to the same factors as for the quarters. Average daily equity production of liquids increased from 395 mboe per day in the first half of 2009 to 433 mboe per day in the first half of 2010. The increase in liquid production was mainly related to Tahiti in the Gulf of Mexico which started production in the second quarter 2009 and ramp-up of production from the Agbami field in Nigeria. The increase was partly offset by decreased production from declining fields, and Lufeng due to shut down in 2009. Average daily equity gas production increased from 100 mboe per day in the first half of 2009 to 108 mboe per day in the first half of 2010. The increase is mainly related to higher gas production from ramping up production from Marcellus in the US. Average daily lifting of liquids and gas increased from 349 mboe per day in the first half of 2009 to 352 mboe per day in the first half of 2010. Exploration expenditure was NOK 5.0 billion in the first half of 2010 compared to NOK 4.1 billion in the first half of 2009. The increase was due to increased drilling cost and increased pre-sanctioning cost. Adjusted exploration expenses were NOK 4.2 billion in the first half of 2010, compared to NOK 2.8 billion in the first half of 2009. The 52% increase was mainly due to the increase in exploration expenditure as explained above and expensing of capitalized exploration from previous years. In the first half of 2010, nine exploration and appraisal wells were completed and three wells were announced as discoveries.
FINANCIAL REVIEW Net operating income for International E&P in the first half of 2010 was NOK 7.3 billion, compared to negative NOK 1.1 billion in the first half of 2009. In the first half of 2010, impairment losses on exploration (NOK 0.2 billion) and an adjustment on total revenues and other income (NOK 0.7 billion) negatively impacted net operating income, while reversal of past impairments on depreciation and amortisation (NOK 0.1 billion) and overlift (NOK 0.8 billion) had a positive effect on net operating income. In the first half of 2009, impairment losses on exploration (NOK 4.1) and underlift (NOK 0.4 billion) negatively impacted net operating income, while reversal of past impairments on depreciation and amortisation (NOK 0.3 billion) had a positive effect on net operating income. Adjusted for these items, adjusted earnings in the first half of 2010 and 2009, were NOK 7.3 billion and NOK 3.1 billion respectively. The increase was mainly due to a 35% increase in realised liquids and gas prices measured in NOK positively impacting adjusted earnings by NOK 6.3 billion. The increase was partly offset by a 4% reduction in entitlement production negatively impacting the adjusted earnings by NOK 1.2 billion and NOK 1.4 billion increased exploration expenses.
Statoil 2nd quarter 2010 16

Important events since last quarter: On 27 May a six month drilling moratorium was imposed in US deepwater Gulf of Mexico following the Deepwater Horizon accident in April. This
significantly affects Statoil's exploration activity in the area. On 21 May Statoil announced that it has agreed to sell 40% of the Peregrino field offshore Brazil to Sinochem Group. Statoil maintains 60% ownership and the operatorship of the field which is set to start production in early 2011. On 7 June the Energy Ministers of Turkey and Azerbaijan signed an Intergovernmental Declaration that acknowledged the recent commercial agreements regarding Shah Deniz. The agreements involve increased prices for Shah Deniz Phase 1 with retroactive effect from August 2008, agreed market gas prices and volumes for the second phase of the project, as well as the transit of Azerbaijani gas through Turkey. On 1 July the Agbami Equity Determination Process was completed increasing Statoil's share from 18.85% to 20.21% effective from 1 July.
Statoil 2nd quarter 2010 17

NATURAL GAS NATURALGAS
IFRSincomestatement Secondquarter Firsthalf Fullyear(inNOKbillion) 2010 2009 Change 2010 2009 Change 2009
Totalrevenuesandotherincome 18.7 22.1 (15%) 43.0 56.3 (24%) 98.6
Purchase,netofinventoryvariation 15.0 12.8 18% 29.9 36.6 (18%) 62.1
Operatingexpenses 5.7 3.6 59% 9.8 7.6 28% 14.4
Selling,generalandadministrativeexpenses 2.0 0.3 >100% 2.1 0.4 >100% 0.8
Depreciation,amortisationandimpairment 0.5 0.5 6% 0.9 0.9 7% 2.8
Totalexpenses 23.2 17.1 36% 42.7 45.5 (6%) 80.1
Netoperatingincome (4.5) 5.1 >(100)% 0.3 10.9 (97%) 18.5
Adjustedearnings[11] Secondquarter Firsthalf Fullyear(inNOKbillion) 2010 2009 Change 2010 2009 Change 2009
Totalrevenuesandotherincomeadjusted 22.7 21.2 7% 46.2 54.6 (15%) 95.9
Purchase,netofinventory
variationadjusted 15.0 12.8 17% 29.9 36.6 (18%) 62.1
Operatingexpensesadjusted 3.5 3.6 (3%) 7.1 7.6 (7%) 14.4
Selling,generalandadministrative
expensesadjusted 0.3 0.3 9% 0.5 0.4 25% 0.8
Depreciation,amortisation
andimpairmentadjusted 0.5 0.5 (3%) 0.9 0.9 0% 2.1
Adjustedearnings[11] 3.3 4.2 (21%) 7.8 9.2 (15%) 16.5
Secondquarter Firsthalf FullyearOperationaldata 2010 2009 Change 2010 2009 Change 2009
NaturalgassalesStatoil
entitlement(bcm) 11.0 9.6 15% 22.7 21.1 7% 41.4
Naturalgassales
(third-partyvolumes)(bcm) 2.8 1.7 61% 5.3 3.4 56% 8.4
Naturalgassales(bcm) 13.8 11.3 22% 27.9 24.5 14% 49.7
Naturalgassalesoncommission 0.4 0.3 27% 0.8 0.7 12% 1.3
Naturalgasprice(NOK/scm) 1.61 1.82 (12%) 1.62 2.21 (27%) 1.90
Transferpricenaturalgas(NOK/scm) 1.17 1.32 (11%) 1.15 1.64 (30%) 1.38
Regularityatdeliverypoint 100% 100% 0% 100% 100% 0% 100%
NATURALGAS
IFRSincomestatement Secondquarter Firsthalf Fullyear(inNOKbillion) 2010 2009 Change 2010 2009 Change 2009
Totalrevenuesandotherincome 18.7 22.1 (15%) 43.0 56.3 (24%) 98.6
Purchase,netofinventoryvariation 15.0 12.8 18% 29.9 36.6 (18%) 62.1
Operatingexpenses 5.7 3.6 59% 9.8 7.6 28% 14.4
Selling,generalandadministrativeexpenses 2.0 0.3 >100% 2.1 0.4 >100% 0.8
Depreciation,amortisationandimpairment 0.5 0.5 6% 0.9 0.9 7% 2.8
Totalexpenses 23.2 17.1 36% 42.7 45.5 (6%) 80.1
Netoperatingincome (4.5) 5.1 >(100)% 0.3 10.9 (97%) 18.5
Adjustedearnings[11] Secondquarter Firsthalf Fullyear(inNOKbillion) 2010 2009 Change 2010 2009 Change 2009
Totalrevenuesandotherincomeadjusted 22.7 21.2 7% 46.2 54.6 (15%) 95.9
Purchase,netofinventory
variationadjusted 15.0 12.8 17% 29.9 36.6 (18%) 62.1
Operatingexpensesadjusted 3.5 3.6 (3%) 7.1 7.6 (7%) 14.4
Selling,generalandadministrative
expensesadjusted 0.3 0.3 9% 0.5 0.4 25% 0.8
Depreciation,amortisation
andimpairmentadjusted 0.5 0.5 (3%) 0.9 0.9 0% 2.1
Adjustedearnings[11] 3.3 4.2 (21%) 7.8 9.2 (15%) 16.5
Secondquarter Firsthalf FullyearOperationaldata 2010 2009 Change 2010 2009 Change 2009
NaturalgassalesStatoil
entitlement(bcm) 11.0 9.6 15% 22.7 21.1 7% 41.4
Naturalgassales
(third-partyvolumes)(bcm) 2.8 1.7 61% 5.3 3.4 56% 8.4
Naturalgassales(bcm) 13.8 11.3 22% 27.9 24.5 14% 49.7
Naturalgassalesoncommission 0.4 0.3 27% 0.8 0.7 12% 1.3
Naturalgasprice(NOK/scm) 1.61 1.82 (12%) 1.62 2.21 (27%) 1.90
Transferpricenaturalgas(NOK/scm) 1.17 1.32 (11%) 1.15 1.64 (30%) 1.38
Regularityatdeliverypoint 100% 100% 0% 100% 100% 0% 100%
Second quarter Natural gas sales volumes increased by 22% to a total of 13.8 billion standard cubic metres in the second quarter of 2010, due to high offtake
on long term contracts and higher sales in liquid markets. Increased forward prices caused significant losses in the fair value of derivatives.
OPERATIONAL REVIEW Natural gas sales volumes in the second quarter of 2010 were 13.8 billion standard cubic metres (bcm), compared to 11.3 bcm in the second quarter of 2009, an increase of 22%. Of total gas sales in the second quarter of 2010, entitlement gas amounted to 11.0 bcm gas and 1.1 bcm was related to the
Statoil 2nd quarter 2010 18

Norwegian State's direct financial interest (SDFI) share of US gas sales. In the second quarter of 2009, 9.6 bcm of total sales was entitlement gas and 0.6 bcm was the SDFI share of US gas sales. The 22% increase in gas volumes from the second quarter of 2009 to the second quarter of 2010 is due to an increase in both entitlement and third party volumes related to high customer off-take in the second quarter of 2010 and increased short term sale in liquid markets where prices have been relatively high. In the second quarter of 2010 the volume weighted average sales price was NOK 1.61 per bcm (USD 7.03 per million British thermal units), compared to NOK 1.82 per scm (USD 7.39 mmbtu) in the second quarter of 2009, a decrease of 12%. The decrease in price from the second quarter of 2009 to the second quarter of 2010 is mainly due to high oil prices in 2008 leading to high oil-indexed gas prices in 2009 and an increased share of total gas sales income exposed to liquid market prices in second quarter of 2010 compared to second quarter of 2009.
FINANCIAL REVIEW In the second quarter of 2010 the net operating income for Natural Gas was negative NOK 4.5 billion, compared to NOK 5.1 billion in the second quarter of 2009. Increased volumes, compared to second quarter 2009, were offset by a decrease in the volume weighted average sales price. A provision for an onerous contract related to a re-gasification terminal in the US in second quarter 2010, in addition to a Mark to Market loss on derivatives also significantly adversely affected the result for the second quarter 2010. The net operating income in the second quarter 2010 was adversely impacted by a NOK 3.7 billion loss on derivatives, a NOK 3.8 billion provision for an onerous contract related to Cove Point, and an asset impairment of NOK 0.2 billion. Considering the effects of these items, adjusted earnings were NOK 3.3 billion in the second quarter of 2010, compared to NOK 4.2 billion in the second quarter of 2009. The decrease of NOK 0.9 billion is mainly due to a lower margin from trading in the second quarter 2010 compared to second quarter of last year. Adjusted earnings in Processing and Transport were NOK 1.8 billion both in the second quarter of 2010 and in the second quarter 2009. Processing and Transport revenue, fixed operating expenses and depreciation were at the same level in the second quarter of 2009 and 2010. Adjusted earnings in Marketing and Trading were NOK 1.5 billion in the second quarter of 2010, compared to NOK 2.4 billion in the second quarter of 2009. Marketing and Trading revenues increased by NOK 1.5 billion, mainly due to higher volumes sold, partly offset by lower gas sales prices. In addition, the purchase net of inventory variation increased by NOK 2.2 NOK billion. The resulting decrease in net operating income of Marketing and Trading is mainly caused by lower contribution from trading when comparing second quarter of 2009 and second quarter of 2010.
First half 2010
OPERATIONAL REVIEW Natural gas sales volumes for the first half of 2010 were 27.9 bcm, compared to 24.5 bcm in the first half of 2009, an increase of 14%. Of total gas sales for the first half of 2010, there was 22.7 bcm of entitlement gas and 2.1 bcm from the SDFI's share of US gas sales, while in the first half of 2009, 21.1 bcm was entitlement gas and 1.3 bcm was the SDFI share of US gas sales. In the first half of 2010 the volume weighted average sales price was NOK 1.62 per scm (USD 7.07 per million British thermal units), compared to NOK 2.21 per scm (USD 8.71 mmbtu) in the first half of 2009, a decrease of 27%. The decrease in price from the first half of 2009 to the first half of 2010 is mainly due to high oil prices in 2008 leading to high oil-indexed gas prices in 2009 and an increased share of total gas sales income exposed to liquid market prices in second quarter of 2010 compared to second quarter of 2009.
FINANCIAL REVIEW For the first half of 2010 net operating income was NOK 0.3 billion, compared to NOK 10.9 billion in the first half of 2009. The overall net operating income in the period was affected by a NOK 3.2 billion loss on derivatives and a NOK 4.3 billion provision related to an onerous contract in connection with a re-gasification terminal in the US. Adjusted earnings were NOK 7.8 billion in the first half of 2010, compared to NOK 9.2 billion in the first half of 2009. The decrease was mainly due to a 27% lower volume weighted average sales price reducing the marketing and trading margins. This is partly offset by a 14% increase in volumes sold. The operating expenses decreased in the first half of 2010 compared to the first half 2009, mostly related to lower cost of transporting our natural gas in the first quarter of 2010. Adjusted earnings in Processing and Transport were NOK 3.5 billion in the first half of 2010, compared to NOK 4.0 billion in the first half of 2009. Processing and Transport revenue decreased by NOK 0.4 billion, while fixed operating expenses and depreciation increased by NOK 0.1 billion. The lower Gassled income compared to first half 2009 derives in part from regularity problems due to the closure of a compressor at Kårstø, which led to tariff relief for the shippers. Adjusted earnings in Marketing and Trading were NOK 4.3 billion in the first half of 2010, compared to NOK 5.2 billion in the first half of 2009. Marketing and Trading revenue decreased by NOK 8.1 billion, mainly due to lower gas sales prices, partly offset by higher gas sales volumes. In addition, the cost of goods decreased by NOK 6.7 billion from the first half of 2009 to the first half of 2010. A positive volume deviation comparing first half 2010 with first half 2009, is more than offset by a negative margin deviation due to decreased sales prices and lower contribution from trading in the first half of 2010 compared to the first half of 2009.
Statoil 2nd quarter 2010 19

Important events since last quarter On 7 June the Energy Ministers of Turkey and Azerbaijan signed an Intergovernmental Declaration that acknowledged the recent commercial
agreements regarding Shah Deniz. The agreement involves increased prices for Shah Deniz Phase 1 with retroactive effect from August 2008, agreed market gas prices and volumes for the second phase of the project, as well as the transit of Azerbaijani gas through Turkey.
Statoil 2nd quarter 2010 20
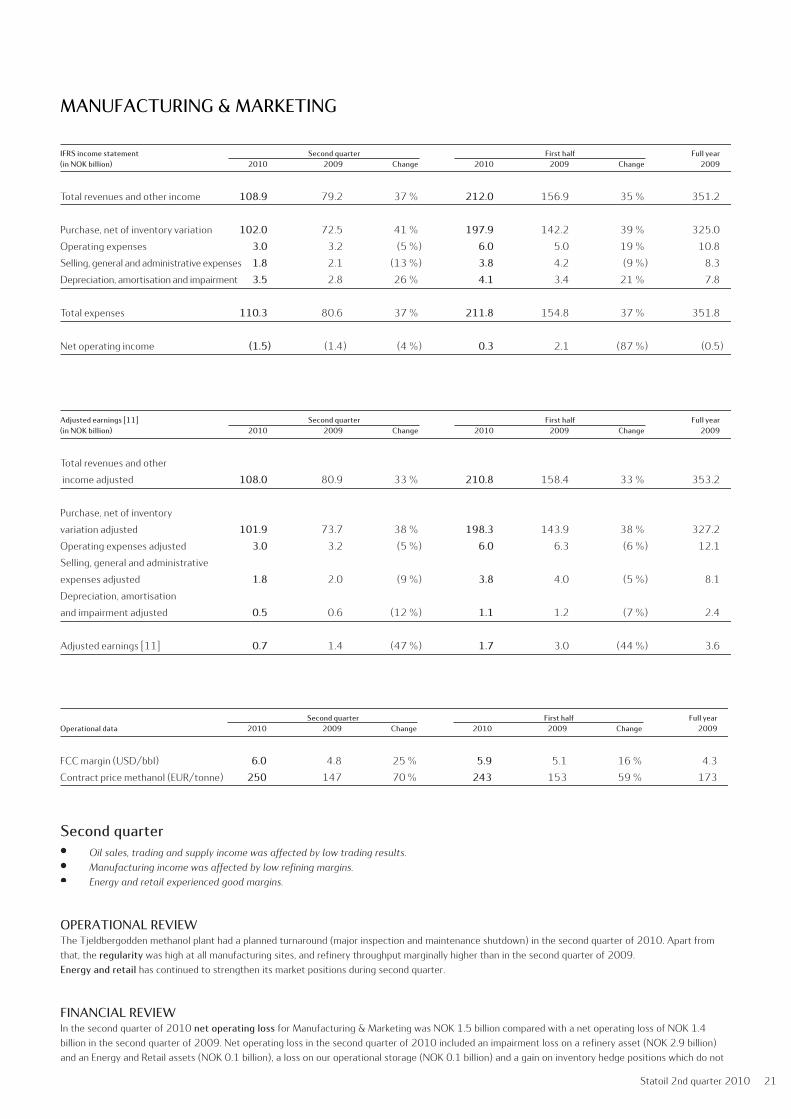
MANUFACTURING & MARKETING MANUFACTURING&MARKETING
IFRSincomestatement Secondquarter Firsthalf Fullyear(inNOKbillion) 2010 2009 Change 2010 2009 Change 2009
Totalrevenuesandotherincome 108.9 79.2 37% 212.0 156.9 35% 351.2
Purchase,netofinventoryvariation 102.0 72.5 41% 197.9 142.2 39% 325.0
Operatingexpenses 3.0 3.2 (5%) 6.0 5.0 19% 10.8
Selling,generalandadministrativeexpenses 1.8 2.1 (13%) 3.8 4.2 (9%) 8.3
Depreciation,amortisationandimpairment 3.5 2.8 26% 4.1 3.4 21% 7.8
Totalexpenses 110.3 80.6 37% 211.8 154.8 37% 351.8
Netoperatingincome (1.5) (1.4) (4%) 0.3 2.1 (87%) (0.5)
Adjustedearnings[11] Secondquarter Firsthalf Fullyear(inNOKbillion) 2010 2009 Change 2010 2009 Change 2009
Totalrevenuesandother
incomeadjusted 108.0 80.9 33% 210.8 158.4 33% 353.2
Purchase,netofinventory
variationadjusted 101.9 73.7 38% 198.3 143.9 38% 327.2
Operatingexpensesadjusted 3.0 3.2 (5%) 6.0 6.3 (6%) 12.1
Selling,generalandadministrative
expensesadjusted 1.8 2.0 (9%) 3.8 4.0 (5%) 8.1
Depreciation,amortisation
andimpairmentadjusted 0.5 0.6 (12%) 1.1 1.2 (7%) 2.4
Adjustedearnings[11] 0.7 1.4 (47%) 1.7 3.0 (44%) 3.6
Secondquarter Firsthalf FullyearOperationaldata 2010 2009 Change 2010 2009 Change 2009
FCCmargin(USD/bbl) 6.0 4.8 25% 5.9 5.1 16% 4.3
Contractpricemethanol(EUR/tonne) 250 147 70% 243 153 59% 173
MANUFACTURING&MARKETING
IFRSincomestatement Secondquarter Firsthalf Fullyear(inNOKbillion) 2010 2009 Change 2010 2009 Change 2009
Totalrevenuesandotherincome 108.9 79.2 37% 212.0 156.9 35% 351.2
Purchase,netofinventoryvariation 102.0 72.5 41% 197.9 142.2 39% 325.0
Operatingexpenses 3.0 3.2 (5%) 6.0 5.0 19% 10.8
Selling,generalandadministrativeexpenses 1.8 2.1 (13%) 3.8 4.2 (9%) 8.3
Depreciation,amortisationandimpairment 3.5 2.8 26% 4.1 3.4 21% 7.8
Totalexpenses 110.3 80.6 37% 211.8 154.8 37% 351.8
Netoperatingincome (1.5) (1.4) (4%) 0.3 2.1 (87%) (0.5)
Adjustedearnings[11] Secondquarter Firsthalf Fullyear(inNOKbillion) 2010 2009 Change 2010 2009 Change 2009
Totalrevenuesandother
incomeadjusted 108.0 80.9 33% 210.8 158.4 33% 353.2
Purchase,netofinventory
variationadjusted 101.9 73.7 38% 198.3 143.9 38% 327.2
Operatingexpensesadjusted 3.0 3.2 (5%) 6.0 6.3 (6%) 12.1
Selling,generalandadministrative
expensesadjusted 1.8 2.0 (9%) 3.8 4.0 (5%) 8.1
Depreciation,amortisation
andimpairmentadjusted 0.5 0.6 (12%) 1.1 1.2 (7%) 2.4
Adjustedearnings[11] 0.7 1.4 (47%) 1.7 3.0 (44%) 3.6
Secondquarter Firsthalf FullyearOperationaldata 2010 2009 Change 2010 2009 Change 2009
FCCmargin(USD/bbl) 6.0 4.8 25% 5.9 5.1 16% 4.3
Contractpricemethanol(EUR/tonne) 250 147 70% 243 153 59% 173
Second quarter Oil sales, trading and supply income was affected by low trading results.
Manufacturing income was affected by low refining margins. Energy and retail experienced good margins.
OPERATIONAL REVIEW The Tjeldbergodden methanol plant had a planned turnaround (major inspection and maintenance shutdown) in the second quarter of 2010. Apart from that, the regularity was high at all manufacturing sites, and refinery throughput marginally higher than in the second quarter of 2009. Energy and retail has continued to strengthen its market positions during second quarter.
FINANCIAL REVIEW In the second quarter of 2010 net operating loss for Manufacturing & Marketing was NOK 1.5 billion compared with a net operating loss of NOK 1.4 billion in the second quarter of 2009. Net operating loss in the second quarter of 2010 included an impairment loss on a refinery asset (NOK 2.9 billion) and an Energy and Retail assets (NOK 0.1 billion), a loss on our operational storage (NOK 0.1 billion) and a gain on inventory hedge positions which do not
Statoil 2nd quarter 2010 21
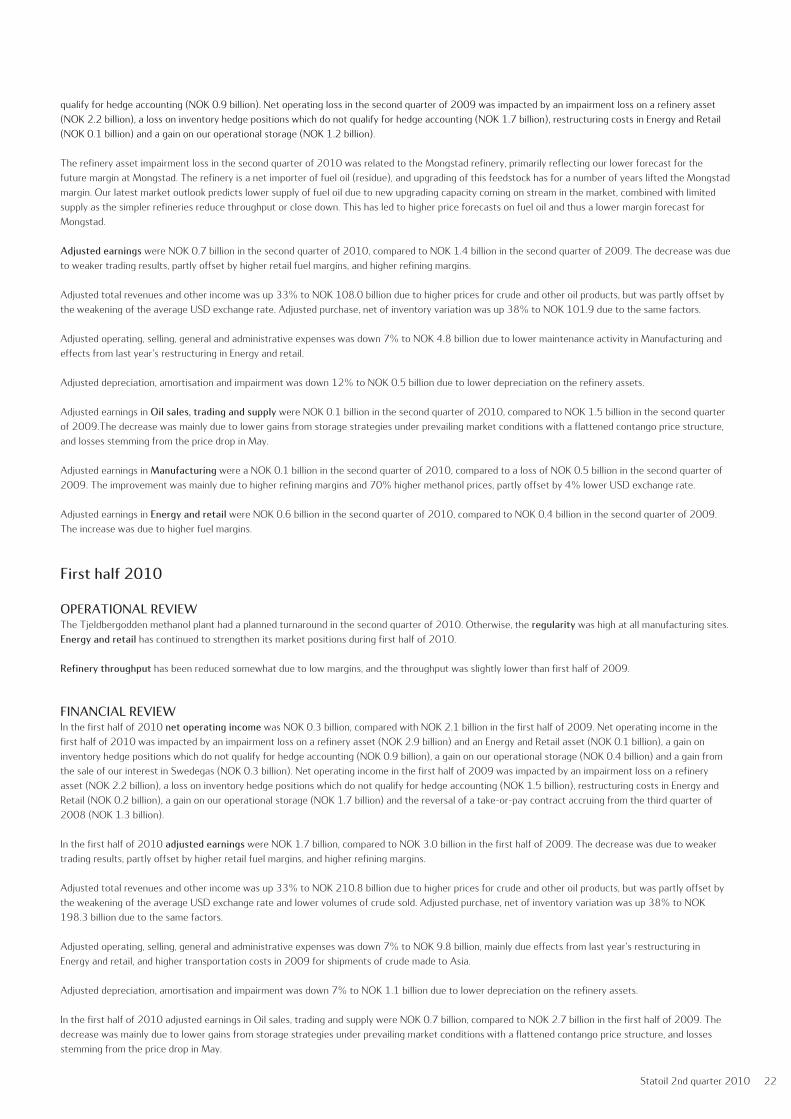
qualify for hedge accounting (NOK 0.9 billion). Net operating loss in the second quarter of 2009 was impacted by an impairment loss on a refinery asset (NOK 2.2 billion), a loss on inventory hedge positions which do not qualify for hedge accounting (NOK 1.7 billion), restructuring costs in Energy and Retail (NOK 0.1 billion) and a gain on our operational storage (NOK 1.2 billion). The refinery asset impairment loss in the second quarter of 2010 was related to the Mongstad refinery, primarily reflecting our lower forecast for the future margin at Mongstad. The refinery is a net importer of fuel oil (residue), and upgrading of this feedstock has for a number of years lifted the Mongstad margin. Our latest market outlook predicts lower supply of fuel oil due to new upgrading capacity coming on stream in the market, combined with limited supply as the simpler refineries reduce throughput or close down. This has led to higher price forecasts on fuel oil and thus a lower margin forecast for Mongstad. Adjusted earnings were NOK 0.7 billion in the second quarter of 2010, compared to NOK 1.4 billion in the second quarter of 2009. The decrease was due to weaker trading results, partly offset by higher retail fuel margins, and higher refining margins. Adjusted total revenues and other income was up 33% to NOK 108.0 billion due to higher prices for crude and other oil products, but was partly offset by the weakening of the average USD exchange rate. Adjusted purchase, net of inventory variation was up 38% to NOK 101.9 due to the same factors. Adjusted operating, selling, general and administrative expenses was down 7% to NOK 4.8 billion due to lower maintenance activity in Manufacturing and effects from last year's restructuring in Energy and retail. Adjusted depreciation, amortisation and impairment was down 12% to NOK 0.5 billion due to lower depreciation on the refinery assets. Adjusted earnings in Oil sales, trading and supply were NOK 0.1 billion in the second quarter of 2010, compared to NOK 1.5 billion in the second quarter of 2009.The decrease was mainly due to lower gains from storage strategies under prevailing market conditions with a flattened contango price structure, and losses stemming from the price drop in May. Adjusted earnings in Manufacturing were a NOK 0.1 billion in the second quarter of 2010, compared to a loss of NOK 0.5 billion in the second quarter of 2009. The improvement was mainly due to higher refining margins and 70% higher methanol prices, partly offset by 4% lower USD exchange rate. Adjusted earnings in Energy and retail were NOK 0.6 billion in the second quarter of 2010, compared to NOK 0.4 billion in the second quarter of 2009. The increase was due to higher fuel margins.
First half 2010
OPERATIONAL REVIEW The Tjeldbergodden methanol plant had a planned turnaround in the second quarter of 2010. Otherwise, the regularity was high at all manufacturing sites. Energy and retail has continued to strengthen its market positions during first half of 2010. Refinery throughput has been reduced somewhat due to low margins, and the throughput was slightly lower than first half of 2009.
FINANCIAL REVIEW In the first half of 2010 net operating income was NOK 0.3 billion, compared with NOK 2.1 billion in the first half of 2009. Net operating income in the first half of 2010 was impacted by an impairment loss on a refinery asset (NOK 2.9 billion) and an Energy and Retail asset (NOK 0.1 billion), a gain on inventory hedge positions which do not qualify for hedge accounting (NOK 0.9 billion), a gain on our operational storage (NOK 0.4 billion) and a gain from the sale of our interest in Swedegas (NOK 0.3 billion). Net operating income in the first half of 2009 was impacted by an impairment loss on a refinery asset (NOK 2.2 billion), a loss on inventory hedge positions which do not qualify for hedge accounting (NOK 1.5 billion), restructuring costs in Energy and Retail (NOK 0.2 billion), a gain on our operational storage (NOK 1.7 billion) and the reversal of a take-or-pay contract accruing from the third quarter of 2008 (NOK 1.3 billion). In the first half of 2010 adjusted earnings were NOK 1.7 billion, compared to NOK 3.0 billion in the first half of 2009. The decrease was due to weaker trading results, partly offset by higher retail fuel margins, and higher refining margins. Adjusted total revenues and other income was up 33% to NOK 210.8 billion due to higher prices for crude and other oil products, but was partly offset by the weakening of the average USD exchange rate and lower volumes of crude sold. Adjusted purchase, net of inventory variation was up 38% to NOK 198.3 billion due to the same factors. Adjusted operating, selling, general and administrative expenses was down 7% to NOK 9.8 billion, mainly due effects from last year's restructuring in Energy and retail, and higher transportation costs in 2009 for shipments of crude made to Asia. Adjusted depreciation, amortisation and impairment was down 7% to NOK 1.1 billion due to lower depreciation on the refinery assets. In the first half of 2010 adjusted earnings in Oil sales, trading and supply were NOK 0.7 billion, compared to NOK 2.7 billion in the first half of 2009. The decrease was mainly due to lower gains from storage strategies under prevailing market conditions with a flattened contango price structure, and losses stemming from the price drop in May.
Statoil 2nd quarter 2010 22

In the first half of 2010 adjusted earnings in Manufacturing were NOK 0.1 billion, compared to a loss of NOK 0.3 billion in the first half of 2009. The increase was mainly due to 16% higher refining margins and 59% higher methanol prices, partly offset by 10% lower USD exchange rate. In the first half of 2010 adjusted earnings in Energy and retail were NOK 1.0 billion, compared to NOK 0.6 billion in the first half of 2009. The increase was due to higher fuel margins.
Statoil 2nd quarter 2010 23
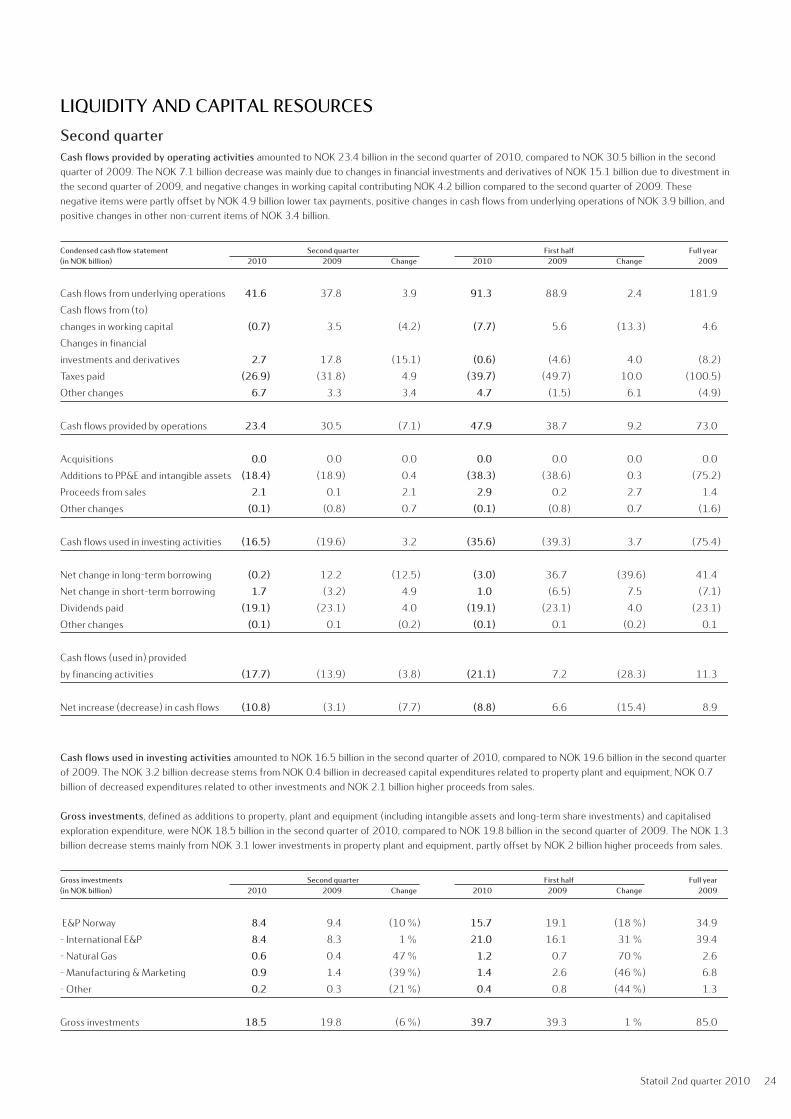
LIQUIDITY AND CAPITAL RESOURCES
Second quarter Cash flows provided by operating activities amounted to NOK 23.4 billion in the second quarter of 2010, compared to NOK 30.5 billion in the second quarter of 2009. The NOK 7.1 billion decrease was mainly due to changes in financial investments and derivatives of NOK 15.1 billion due to divestment in the second quarter of 2009, and negative changes in working capital contributing NOK 4.2 billion compared to the second quarter of 2009. These negative items were partly offset by NOK 4.9 billion lower tax payments, positive changes in cash flows from underlying operations of NOK 3.9 billion, and positive changes in other non-current items of NOK 3.4 billion.
Condensedcashflowstatement Secondquarter Firsthalf Fullyear(inNOKbillion) 2010 2009 Change 2010 2009 Change 2009
Cashflowsfromunderlyingoperations 41.6 37.8 3.9 91.3 88.9 2.4 181.9
Cashflowsfrom(to)
changesinworkingcapital (0.7) 3.5 (4.2) (7.7) 5.6 (13.3) 4.6
Changesinfinancial
investmentsandderivatives 2.7 17.8 (15.1) (0.6) (4.6) 4.0 (8.2)
Taxespaid (26.9) (31.8) 4.9 (39.7) (49.7) 10.0 (100.5)
Otherchanges 6.7 3.3 3.4 4.7 (1.5) 6.1 (4.9)
Cashflowsprovidedbyoperations 23.4 30.5 (7.1) 47.9 38.7 9.2 73.0
Acquisitions 0.0 0.0 0.0 0.0 0.0 0.0 0.0
AdditionstoPP&Eandintangibleassets (18.4) (18.9) 0.4 (38.3) (38.6) 0.3 (75.2)
Proceedsfromsales 2.1 0.1 2.1 2.9 0.2 2.7 1.4
Otherchanges (0.1) (0.8) 0.7 (0.1) (0.8) 0.7 (1.6)
Cashflowsusedininvestingactivities (16.5) (19.6) 3.2 (35.6) (39.3) 3.7 (75.4)
Netchangeinlong-termborrowing (0.2) 12.2 (12.5) (3.0) 36.7 (39.6) 41.4
Netchangeinshort-termborrowing 1.7 (3.2) 4.9 1.0 (6.5) 7.5 (7.1)
Dividendspaid (19.1) (23.1) 4.0 (19.1) (23.1) 4.0 (23.1)
Otherchanges (0.1) 0.1 (0.2) (0.1) 0.1 (0.2) 0.1
Cashflows(usedin)provided
byfinancingactivities (17.7) (13.9) (3.8) (21.1) 7.2 (28.3) 11.3
Netincrease(decrease)incashflows (10.8) (3.1) (7.7) (8.8) 6.6 (15.4) 8.9
Grossinvestments Secondquarter Firsthalf Fullyear(inNOKbillion) 2010 2009 Change 2010 2009 Change 2009
E&PNorway 8.4 9.4 (10%) 15.7 19.1 (18%) 34.9
-InternationalE&P 8.4 8.3 1% 21.0 16.1 31% 39.4
-NaturalGas 0.6 0.4 47% 1.2 0.7 70% 2.6
-Manufacturing&Marketing 0.9 1.4 (39%) 1.4 2.6 (46%) 6.8
-Other 0.2 0.3 (21%) 0.4 0.8 (44%) 1.3
Grossinvestments 18.5 19.8 (6%) 39.7 39.3 1% 85.0
Reconciliationofcashflowtogrossinvestments Secondquarter Firsthalf Fullyear(inNOKbillion) 2010 2009 2010 2009 2009
Cashflowstoinvestments 16.5 19.6 35.6 39.3 75.4
Proceedsfromsalesofassets 2.1 0.1 2.9 0.2 1.4
Financiallease 0.2 0.0 1.4 0.0 6.9
Otherchangesinnon-currentloansgrantedandJVbalances (0.3) 0.1 (0.2) (0.2) 1.3
Grossinvestments 18.5 19.8 39.7 39.3 85.0
Cash flows used in investing activities amounted to NOK 16.5 billion in the second quarter of 2010, compared to NOK 19.6 billion in the second quarter of 2009. The NOK 3.2 billion decrease stems from NOK 0.4 billion in decreased capital expenditures related to property plant and equipment, NOK 0.7 billion of decreased expenditures related to other investments and NOK 2.1 billion higher proceeds from sales. Gross investments, defined as additions to property, plant and equipment (including intangible assets and long-term share investments) and capitalised exploration expenditure, were NOK 18.5 billion in the second quarter of 2010, compared to NOK 19.8 billion in the second quarter of 2009. The NOK 1.3 billion decrease stems mainly from NOK 3.1 lower investments in property plant and equipment, partly offset by NOK 2 billion higher proceeds from sales.
Condensedcashflowstatement Firstquarter Fullyear(inNOKbillion) 2010 2009 Change 2009
Cashflowsfromunderlyingoperations 49.6 51.1 (1.5) 181.9
Cashflowsfrom(to)changesinworkingcapital (7.0) 2.2 (9.1) 4.6
Changesinfinancialinvestmentsandderivatives (3.3) (22.4) 19.1 (8.2)
Taxespaid (12.8) (17.9) 5.1 (100.5)
Otherchanges (2.0) (4.7) 2.7 (4.9)
Cashflowsprovidedbyoperations 24.5 8.2 16.3 73.0
AdditionstoPP&Eandintangibleassets (19.9) (19.8) (0.1) (75.2)
Proceedsfromsales 0.7 0.1 0.6 1.4
Otherchanges 0.0 0.0 0.0 (1.6)
Cashflowsusedininvestingactivities (19.1) (19.7) 0.5 (75.4)
Netchangeinlong-termborrowing (2.7) 24.4 (27.2) 41.4
Netchangeinshort-termborrowing (0.6) (3.2) 2.6 (7.1)
Dividendspaid 0.0 0.0 0.0 (23.1)
Otherchanges (0.0) (0.0) 0.0 0.1
Cashflows(usedin)orprovidedbyfinancingactivities (3.4) 21.1 (24.5) 11.3
Netincrease(decrease)incashflows 2.0 9.7 (7.7) 8.9
Grossinvestments Secondquarter Firsthalf Fullyear(inNOKbillion) 2010 2009 Change 2010 2009 Change 2009
E&PNorway 8.4 9.4 (10%) 15.7 19.1 (18%) 34.9
-InternationalE&P 8.4 8.3 1% 21.0 16.1 31% 39.4
-NaturalGas 0.6 0.4 47% 1.2 0.7 70% 2.6
-Manufacturing&Marketing 0.9 1.4 (39%) 1.4 2.6 (46%) 6.8
-Other 0.2 0.3 (21%) 0.4 0.8 (44%) 1.3
Grossinvestments 18.5 19.8 (6%) 39.7 39.3 1% 85.0
Reconciliationofcashflowtogrossinvestments Firstquarter Fullyear(inNOKbillion) 2010 2009 2009
Cashflowstoinvestments 19.1 19.7 75.4
Proceedsfromsalesofassets 0.7 0.1 1.4
Financiallease 1.7 0.0 6.9
Otherchangesinnon-currentloansgrantedandJVbalances (0.3) (0.3) 1.3
Grossinvestments 21.2 19.5 85.0
Statoil 2nd quarter 2010 24

Cash flows used in investing activities and gross investments have been reconciled in the table below.
Condensedcashflowstatement Secondquarter Firsthalf Fullyear(inNOKbillion) 2010 2009 Change 2010 2009 Change 2009
Cashflowsfromunderlyingoperations 41.6 37.8 3.9 91.3 88.9 2.4 181.9
Cashflowsfrom(to)
changesinworkingcapital (0.7) 3.5 (4.2) (7.7) 5.6 (13.3) 4.6
Changesinfinancial
investmentsandderivatives 2.7 17.8 (15.1) (0.6) (4.6) 4.0 (8.2)
Taxespaid (26.9) (31.8) 4.9 (39.7) (49.7) 10.0 (100.5)
Otherchanges 6.7 3.3 3.4 4.7 (1.5) 6.1 (4.9)
Cashflowsprovidedbyoperations 23.4 30.5 (7.1) 47.9 38.7 9.2 73.0
Acquisitions 0.0 0.0 0.0 0.0 0.0 0.0 0.0
AdditionstoPP&Eandintangibleassets (18.4) (18.9) 0.4 (38.3) (38.6) 0.3 (75.2)
Proceedsfromsales 2.1 0.1 2.1 2.9 0.2 2.7 1.4
Otherchanges (0.1) (0.8) 0.7 (0.1) (0.8) 0.7 (1.6)
Cashflowsusedininvestingactivities (16.5) (19.6) 3.2 (35.6) (39.3) 3.7 (75.4)
Netchangeinlong-termborrowing (0.2) 12.2 (12.5) (3.0) 36.7 (39.6) 41.4
Netchangeinshort-termborrowing 1.7 (3.2) 4.9 1.0 (6.5) 7.5 (7.1)
Dividendspaid (19.1) (23.1) 4.0 (19.1) (23.1) 4.0 (23.1)
Otherchanges (0.1) 0.1 (0.2) (0.1) 0.1 (0.2) 0.1
Cashflows(usedin)provided
byfinancingactivities (17.7) (13.9) (3.8) (21.1) 7.2 (28.3) 11.3
Netincrease(decrease)incashflows (10.8) (3.1) (7.7) (8.8) 6.6 (15.4) 8.9
Grossinvestments Secondquarter Firsthalf Fullyear(inNOKbillion) 2010 2009 Change 2010 2009 Change 2009
E&PNorway 8.4 9.4 (10%) 15.7 19.1 (18%) 34.9
-InternationalE&P 8.4 8.3 1% 21.0 16.1 31% 39.4
-NaturalGas 0.6 0.4 47% 1.2 0.7 70% 2.6
-Manufacturing&Marketing 0.9 1.4 (39%) 1.4 2.6 (46%) 6.8
-Other 0.2 0.3 (21%) 0.4 0.8 (44%) 1.3
Grossinvestments 18.5 19.8 (6%) 39.7 39.3 1% 85.0
Reconciliationofcashflowtogrossinvestments Secondquarter Firsthalf Fullyear(inNOKbillion) 2010 2009 2010 2009 2009
Cashflowstoinvestments 16.5 19.6 35.6 39.3 75.4
Proceedsfromsalesofassets 2.1 0.1 2.9 0.2 1.4
Financiallease 0.2 0.0 1.4 0.0 6.9
Otherchangesinnon-currentloansgrantedandJVbalances (0.3) 0.1 (0.2) (0.2) 1.3
Grossinvestments 18.5 19.8 39.7 39.3 85.0
Cash flows used in financing activities in the second quarter of 2010 amounted to NOK 17.7 billion, compared to NOK 13.9 billion in the second quarter of 2009. The NOK 3.8 billion change was mainly related to change in long term borrowings of NOK 12.5 billion, due to new bonds issued in 2009, partly offset by change in dividends paid by NOK 4.0 billion and change in short term borrowings by NOK 4.9 billion. Gross financial liabilities (non-current financial liabilities and current financial liabilities) were NOK 107.9 billion at 30 June 2010, compared to NOK 102.2 billion at 30 June 2009. The NOK 5.7 billion increase was mainly caused by increased non-current financial liabilities of NOK 5.7 billion due to increase in financial leases of NOK 7.3 billion, mainly relating to a FPSO lease and an energy plant currently in the construction phase. Net financial liabilities [10] were NOK 85.3 billion at 30 June 2010, compared to NOK 75.6 billion at 30 June 2009. The change of NOK 9.7 billion was mainly related to an increase in gross financial liabilities of NOK 5.7 billion, in combination with a decrease in cash, cash equivalents and current financial investments of NOK 2.9 billion. The net debt to capital employed ratio [1] was 29.2 % at 30 June 2010, compared to 28.3% at 30 June 2009. The 0.9% increase was mainly related to an increase of net financial liabilities of NOK 9.7 billion, in combination with an increase in capital employed of NOK 25.3 billion. In the calculation of net interest-bearing debt, we make certain adjustments, which make net interest-bearing debt and the net debt to capital employed ratio non-GAAP financial measures. For an explanation and calculation of the ratio, see the following section: Use and reconciliation of non-GAAP financial measures.[2] Cash, cash equivalents and current financial investments amounted to NOK 26.7 billion at 30 June 2010, compared to NOK 29.7 billion at 30 June 2009. The NOK 2.9 billion decrease reflects the high activity level related to investments during 2009 and the first half of 2010. Cash and cash equivalents were NOK 18.8 billion at 30 June 2010, compared to NOK 24.5 billion at 30 June 2009. Current financial investments, which are part of our cash management, amounted to NOK 7.9 billion at 30 June 2010, compared to NOK 5.2 billion at 30 June 2009. Current items (total current assets less total current liabilities) increased by NOK 3.4 billion from negative NOK 7.2 billion at 30 June 2009 to negative NOK 3.7 billion at 30 June 2010. The change was due to an increase in current liabilities such as trade and other payables of NOK 5.9 billion, accounts payable related parties of NOK 1.3 billion, taxes payable of NOK 6.0 billion, derivatives financial instruments of NOK 2.2 billion and a decrease in current assets such as derivatives financial instruments of NOK 3.4 billion and cash and cash equivalents of NOK 5.6 billion, partly offset by an increase in working capital such as inventories of NOK 3.9 billion, trade and other receivables of NOK 21.4 billion and financial investments of NOK 2.7 billion.
First half 2010 Cash flows provided by operating activities amounted to NOK 47.9 billion in the first half of 2010, compared to NOK 38.7 billion in the first half of 2009. The NOK 9.2 increase was mainly due to NOK 2.4 billion increased cash flow from underlying operations, positive changes in other non-current items of NOK 6.1 billion, changes in financial investments and derivatives contributing NOK 4.0 billion and NOK 10.0 billion lower tax payments. These changes were partly offset by negative changes in working capital contributing NOK 13.3 billion. Cash flows used in investing activities amounted to NOK 35.6 billion in the first half of 2010, compared to NOK 39.3 billion in the first half of 2009. The NOK 3.7 billion decrease stems from NOK 0.3 billion in decreased capital expenditures related to property plant and equipment, NOK 0.7 billion decreased expenditures related to other investments and NOK 2.7 billion higher proceeds from sales. Gross investments amounted to NOK 39.7 billion in the first half of 2010 compared to NOK 39.3 billion in the first half of 2009. The NOK 0.4 billion increase stems from NOK 2.7 billion increased capitalisation of leases and NOK 2.7 billion higher proceeds from sales. These effects were partly offset by lower investments in property plant and equipment of NOK 3.7 billion. Cash flow used in financing activities in the first half of 2010 amounted to NOK 21.1 billion, compared to positive NOK 7.2 billion for the first half of 2009. The NOK 28.3 billion change was mainly related to change in long-term borrowings of NOK 41.1, due to new bonds issued in 2009, partly offset by change in dividends paid by NOK 4.0 billion and change in short term borrowings of NOK 7.5 billion.
Statoil 2nd quarter 2010 25

USE AND RECONCILIATION OF NON-GAAP FINANCIAL MEASURESNon-GAAP financial measures are defined as numerical measures that either exclude or include amounts that are not excluded or included in the comparable measures calculated and presented in accordance with GAAP (i.e. IFRS). For more information on our use of non-GAAP financial measures, see report section - Financial performance - Use and reconciliation of Non-GAAP measures in Statoil's 2009 Annual Report on Form 20-F. The following financial measures may be considered non-GAAP financial measures: Adjusted earnings
Adjusted earnings after tax Adjusted production cost Net debt to capital employed ratio
Adjusted earnings begins with net operating income and adjusts for certain items affecting the income for the period in order to separate out effects that management considers may not to be specifically related to Statoil's underlying operational performance in the individual reporting period. Management considers adjusted earnings to be a supplemental measure to Statoil's IFRS measures that provides an indication of Statoil's underlying operational performance in the period and facilitates a better understanding of operational trends between the periods. Adjusted earnings exclude the following items: Adjustments are made for changes in the unrealised fair value of derivatives not accounted for as hedges. Statoil uses derivatives to manage certain
exposures to fluctuations in foreign currency, interest rates or commodity prices. However, when hedge accounting is not applied the unrealised fair value adjustment for derivatives is not matched by a similar adjustment for the exposure being managed. As a result, only the realised gains and losses on derivatives are reflected in adjusted earnings. The gains and losses on derivatives are then reflected in the period in which they impact our cash flows and generally match the associated cash flow of the exposure being managed. Over/underlift is accounted for using the sales method and therefore revenues are reflected in the period the product is sold rather than in the period it is produced. The over/underlift position depends on a number of factors related to our lifting programme and that the way it corresponds to our entitlement share of production. The effect on the income for the period is therefore adjusted, to show earnings based upon the production for the period which management believes better reflects operational performance. Operational storage includes inventories held in the refining and retail operations which are accounted for at the lower of cost and net realisable value. An adjustment is made in the cost of goods sold for changes in the value of inventories during the period held (holding gains or losses) to align to the product pricing. Impairment and reversal of impairment are excluded from adjusted earnings since they affect the economics of an asset for the lifetime of that asset, not only the period in which it is impaired or the impairment is reversed. (Impairment and reversal of impairment can impact both the Exploration expenses and the Depreciation, amortisation and impairment line item.) Gain or loss from sale of assets is eliminated from the measure since the gain or loss does not give an indication of future performance or periodic performance; such a gain or loss is related to the cumulative value creation from the time the asset is acquired until it is sold. Other items of income and expense are also adjusted when the impact on income in the period are not reflective of Statoil's underlying operational performance in the reporting period. Such items may be unusual or infrequent transactions but they may also include transaction that are significant which would not necessarily qualify as either usual or infrequent. Other items can include transactions such as provisions related to reorganisation, early retirement, etc.
A new functional currency in the parent company and certain subsidiaries has resulted in reduced currency gains and losses included in net financial items. While taxes payable (and current tax expense) are unaffected by this change, taxable income exceeded consolidated IFRS income before tax by approximately NOK 24.5 billion in the first nine months of 2009, thus contributing to a high tax rate for the first nine months of 2009. The measure adjusted earnings after tax excludes net financial items (the principle line items impacted by the change in functional currency) and the associated tax effects on net financial items. It is based on adjusted earnings less the tax effects on all elements included in adjusted earnings (or calculated tax on operating income and on each of the adjusting items using an estimated marginal tax rate). Management considers adjusted earnings after tax, which reflects a normalised tax charge associated with its operational performance excluding the impact of financing, to be a supplemental measure to Statoil's net income. Certain net USD denominated financial positions are held by group companies that have a USD functional currency that is different from the currency in which the taxable income is measured. As currency exchange rates change between periods, the basis for measuring net financial items for IFRS will change disproportionally with taxable income which includes exchange gains and losses from translating the net USD denomiated financial positions into the currency of the applicable tax return. Therefore, effective tax rate may be significantly higher or lower than the statutory tax rate for any given period. Management considers that adjusted earnings after tax provides a better indication of the taxes associated with underlying operational performance in the period (excluding financing), and therefore better faciliates a comparison between periods. However, the adjusted taxes included in adjusted earnings after tax should not be considered indicative of the amount of current or total tax expense (or taxes payable) for the period. Adjusted earnings and adjusted earnings after tax should be considered additional measures rather than substitutes for net operating income and net income, which are the most directly comparable IFRS measures. There are material limitations associated with the use of adjusted earnings and adjusted earnings after tax compared with the IFRS measures since they do not include all the items of revenues/gains or expenses/losses of Statoil which are needed to evaluate its profitably on an overall basis. Adjusted earnings and adjusted earnings after tax are only intended to be indicative of the underlying developments in trends of our on-going operations for the production, manufacturing and marketing of our products and exclude pre and post tax impacts of net financial items. We reflect such underlying development in our operations by eliminating the effects of certain items that may not be directly associated with the period's operations or financing. However, for that reason, adjusted earnings and adjusted earnings after tax are not complete measures of profitability. The measures should therefore not be used in isolation.
Statoil 2nd quarter 2010 26

Adjusted earnings equal the sum of net operating income less all applicable adjustments. Adjusted earnings after tax equals the sum of net operating income less income tax in business areas and adjustments to operating income taking the applicable marginal tax into consideration. See the tables in the following section for details. Production cost per barrel is based on operating expenses related to production of oil and gas. The following is a reconciliation of overall operating expenses to operating expenses exclusively related to production of oil and gas volumes:
Reconcilliationofoveralloperating Forthethreemonthsended
expensestoproductioncost 2010 2009
(inNOKbillion) 30Jun 31Mar 31Dec 30Sep 30Jun
Operatingexpenses,StatoilGroup 15.6 15.7 15.7 13.3 14.0
Deductionsofcostsnotrelevanttoproductioncostcalculation
1)BusinessAreasnon-upstream 7.9 7.1 7.6 6.1 6.3
Totaloperatingexpensesupstream 7.7 8.6 8.0 7.1 7.7
2)Operationover/underlift (0.4) 0.6 0.3 (0.7) (0.1)
3)Transportationpipeline/vesselupstream 1.1 1.2 1.0 1.3 1.4
4)Miscellaneousitems 0.4 0.4 (0.1) 0.0 0.1
Totaloperatingexpensesupstreamexcl.over/underlift&transportation 6.6 6.5 6.7 6.4 6.4
Totalproductioncostslast12months 26.2 26.0 25.0 24.6 24.3
5)Granegaspurchase 0.2 0.2 0.2 0.2 0.2
6)Restructuringcostsfromthemerger 0.0 0.0 (0.3) 0.0 0.0
7)Changeinownershipinterest 0.0 0.0 0.0 0.1 (0.2)
Totaloperatingexpensesupstreamforadjustedcostperbarrelcalculation 6.3 6.2 6.7 6.1 6.4
Entitlementproduction EquityproductionProductioncostsummary 30June 30June(inNOKperboe) 2010 2009 2010 2009
Calculatedproductioncost 40.1 38.0 36.3 35.0
Calculatedproductioncost,excludingrestructuringcostfromthemerger 40.5 40.6 36.7 37.3
Calculatedproductioncost,excludingrestructuringandgasinjectioncost 38.8 38.7 35.2 35.6
Reconcilliationofoveralloperating Forthethreemonthsended
expensestoproductioncost 2010 2009
(inNOKbillion) 30-Jun 31-Mar 31-Dec 30-Sep 30-Jun
Operatingexpenses,StatoilGroup 15.6 15.7 15.7 13.3 14.0
Deductionsofcostsnotrelevanttoproductioncostcalculation
1)BusinessAreasnon-upstream 7.9 7.1 7.6 6.1 6.3
Totaloperatingexpensesupstream 7.7 8.6 8.0 7.1 7.7
2)Operationover/underlift (0.4) 0.6 0.3 (0.7) (0.1)
3)Transportationpipeline/vesselupstream 1.1 1.2 1.0 1.3 1.4
4)Miscellaneousitems 0.4 0.4 (0.1) 0.0 0.1
Totaloperatingexpensesupstreamexcl.over/underlift&transportation 6.6 6.5 6.7 6.4 6.4
Totalproductioncostslast12months 26.2 26.0 25.0 24.6 24.3
5)Granegaspurchase 0.2 0.2 0.2 0.2 0.2
6)Restructuringcostsfromthemerger 0.0 0.0 (0.3) 0.0 0.0
7)Changeinownershipinterest 0.0 0.0 0.0 0.1 (0.2)
Totaloperatingexpensesupstreamforadjustedcostperbarrelcalculation 6.3 6.2 6.7 6.1 6.4
Entitlementproduction EquityproductionProductioncostsummary 30June 30June(inNOKperboe) 2010 2009 2010 2009
Calculatedproductioncost 40.1 38.0 36.3 35.0
Calculatedproductioncost,excludingrestructuringcostfromthemerger 40.5 40.6 36.7 37.3
Calculatedproductioncost,excludingrestructuringandgasinjectioncost 38.8 38.7 35.2 35.6
The calculated net debt to capital employed ratio is viewed by the company as providing a more complete picture of the group's current debt situation than gross interest-bearing debt. The calculation uses balance sheet items related to total debt and adjusts for cash, cash equivalents and current financial investments. Further adjustments are made for different reasons: - Since different legal entities in the group lend to projects and others borrow from banks, project financing through external bank or similar institution will not be netted in the balance sheet and will over-report the debt stated in the balance sheet compared to the underlying exposure in the group. Similarly, certain net interest-bearing debt incurred from activities pursuant to the Marketing Instruction of the Norwegian government is off-set against receivables on the SDFI. - Some interest-bearing elements are classified together with non-interest bearing elements, and are therefore included when calculating the net interest-bearing debt. The table below reconciles net interest-bearing debt, capital employed and the net debt to capital employed ratio to the most directly comparable financial measure or measures calculated in accordance with IFRS.
Statoil 2nd quarter 2010 27

Calculationofcapitalemployedandnetdebttocapitalemployedratio 30June Fullyear(inNOKbillion,exceptpercentages) 2010 2009 2009
Totalshareholders’equity 205.6 189.0 198.3
Non-controllinginterests 1.3 2.4 1.8
Totalequityandminorityinterest(A) 207.0 191.4 200.1
Short-termdebt 12.0 12.0 8.1
Long-termdebt 95.9 90.2 96.0
Grossinterest-bearingdebt 107.9 102.2 104.1
Cashandcashequivalents 18.8 24.5 24.7
Currentfinancialinvestments 7.9 5.2 7.0
Cashandcashequivalentsandcurrentfinancialinvestments 26.7 29.7 31.7
Netdebtbeforeadjustments(B1) 81.1 72.5 72.4
Otherinterest-bearingelements 6.4 5.6 5.0
Marketinginstructionadjustment (1.5) (1.6) (1.4)
Adjustmentforprojectloan (0.7) (0.9) (0.7)
Netinterest-bearingdebt(B2) 85.3 75.6 75.3
Normalisationforcash-buildupbeforetaxpayment(50%oftaxpayment) 0.0 0.0 0.0
Netinterest-bearingdebt(B3) 85.3 75.6 75.3
Calculationofcapitalemployed:
Capitalemployedbeforeadjustmentstonetinterest-bearingdebt(A+B1) 288.1 263.9 272.5
Capitalemployedbeforenormalisationforcashbuild-upfortaxpayment(A+B2) 292.3 266.9 275.4
Capitalemployed(A+B3) 292.3 266.9 275.4
Calculatednetdebttocapitalemployed:
Netdebttocapitalemployedbeforeadjustments(B1/(A+B1)) 28.2% 27.5% 26.6%
Netdebttocapitalemployedbeforenormalisationfortaxpayment(B2/(A+B2) 29.2% 28.3% 27.3%
Netdebttocapitalemployed(B3/(A+B3)) 29.2% 28.3% 27.3%
Statoil 2nd quarter 2010 28

Reconciliation of adjusted earnings to net operating incomeThe table specifies the adjustments made to each of the profit and loss line item included in the net operating income subtotal. Statoil group
Itemsimpactingnetoperatingincome Secondquarter Firsthalf(inNOKbillion) 2010 2009 Change 2010 2009 Change
Netoperatingincome 26.6 24.3 9% 66.2 59.8 11%
Totalrevenuesandotherincome 3.7 2.9 25% 2.0 2.4 (19%)
Changeinfairvalueofderivatives 2.4 (1.2) >100% 2.0 (0.9) >100%
Inefficienthedgeofinventories (0.9) 1.7 >(100)% (0.9) 1.5 >(100)%
Impairmentofinvestments 0.2 0.0 - 0.2 0.0 -
Reversalofimpairmentofinvestments 0.0 (0.3) >100% (0.2) (0.3) 37%
Over/underlift 1.1 1.4 (26%) 0.0 0.3 >(100)%
Gain/Lossonsalesofassets 0.0 0.0 - (0.3) 0.0 -
Provisions 0.7 0.0 - 0.7 0.0 -
Eliminations 0.2 1.3 (85%) 0.4 1.8 (78%)
Purchasenetofinventoryvariation 0.1 (1.2) >100% (0.4) (1.7) 76%
Operationalstorageeffects 0.1 (1.2) >100% (0.4) (1.7) 76%
Operatingexpenses 1.6 (0.6) >100% 2.8 (1.6) >100%
Over/underlift (0.4) (0.3) (35%) 0.2 0.2 17%
Otheradjustments 0.0 0.0 - 0.0 (0.3) >100%
Accrualfortakeofpaycontract 0.0 0.0 - 0.0 (1.3) >100%
Eliminations (0.2) 0.0 - (0.2) 0.4 >(100)%
Gain/Lossonsalesofassets 0.0 (0.2) >(100)% 0.1 (0.5) >100%
Increasedprovision 2.2 0.0 - 2.7 0.0 -
Selling,generalandadministrativeexpenses 1.7 0.1 >100% 1.7 0.2 >100%
Otheradjustments 0.0 0.1 (100%) 0.0 0.2 (100%)
Increasedprovision 1.7 0.0 - 1.7 0.0 -
Depreciation,amortisationandimpairment 2.9 1.6 81% 2.9 1.9 53%
Impairment 3.0 2.2 36% 3.0 2.6 15%
Reversalofimpairment (0.1) (0.6) 83% (0.1) (0.7) 86%
Explorationexpenses (0.1) 2.0 >(100)% 0.2 4.1 (95%)
Impairment 1.1 2.0 (45%) 1.4 4.1 (66%)
Reversalofimpairment (1.2) 0.0 - (1.2) 0.0 -
Sumofadjustments 9.8 4.9 >100% 9.1 5.4 69%
Adjustedearnings 36.4 29.2 25% 75.3 65.2 15%
Statoil 2nd quarter 2010 29

Reconciliation of adjusted earnings after tax to net income
Reconciliationofadjustedearningsaftertaxtonetincome(inNOKbillion) Secondquarter Firsthalf 2010 2009 2010 2009
Netoperatingincome(NOI) A 26.6 24.3 66.2 59.8
TaxonNOI 24.2 20.0 51.8 46.5
NOIaftertax C=A-B 2.4 4.3 14.4 13.3
Adjustments D 9.8 4.9 9.1 5.4
Taxonadjustments E 1.7 0.4 0.8 (0.3)
Adjustedearningsaftertax F=C+D-E 10.6 8.8 22.8 19.1
Netfinancialitems G (0.8) (4.8) (2.5) (8.7)
Taxonnetfinancialitems H (1.4) (0.4) (2.2) 0.7
Netincome I=C+G-H 3.1 0.0 14.2 4.0
Statoil 2nd quarter 2010 30

END NOTES 1. See table under report section "Net debt to capital employed ratio" for a reconciliation of capital employed. Statoil's third quarter 2009 interim
consolidated financial statements have been prepared in accordance with IFRS. Comparative financial statements for previous periods presented have also been prepared in accordance with IFRS. 2. For a definition of non-GAAP financial measures, see report section "Use and reconciliation of non-GAAP measures". 3. The Group's average liquids price is a volume-weighted average of the segment prices of crude oil, condensate and natural gas liquids (NGL), including a margin for oil sales, trading and supply. 4. FCC margin is an in-house calculated refinery margin benchmark intended to represent a 'typical' upgraded refinery with an FCC (fluid catalytic cracking) unit located in the Rotterdam area based on Brent crude. 5. A total of 13.2 mboe per day in the second quarter of 2010 and 15.4 mboe in the second quarter of 2009 represent our share of production in an associated company which is accounted for under the equity method. These volumes have been included in the production figure, but excluded when computing the over/underlift position. The computed over/underlift position is therefore based on the difference between produced volumes excluding our share of production in an associated company and lifted volumes. 6. Liquids volumes include oil, condensate and NGL, exclusive of royalty oil. 7. Lifting of liquids corresponds to sales of liquids for E&P Norway and International E&P. Deviations from the share of total lifted volumes from the field compared to the share in the field production are due to periodic over- or underliftings. 8. The production cost is calculated by dividing operational costs related to the production of oil and natural gas by the total production of liquids and natural gas, excluding our share of operational costs and production in an associated company as described in end note 5. 9. Equity volumes represent produced volumes under a Production Sharing Agreement (PSA) contract that correspond to Statoil's ownership percentage in a particular field. Entitlement volumes, on the other hand, represent the Statoil share of the volumes distributed to the partners in the field, which are subject to deductions for, among other things, royalty and the host government's share of profit oil. Under the terms of a PSA, the amount of profit oil deducted from equity volumes will normally increase with the cumulative return on investment to the partners and/or production from the licence. As a consequence, the gap between entitlement and equity volumes will likely increase in times of high liquids prices. The distinction between equity and entitlement is relevant to most PSA regimes, whereas it is not applicable in most concessionary regimes such as those in Norway, the UK, Canada and Brazil. 10. Net financial liabilities are non-current financial liabilities and current financial liabilities reduced by cash, cash equivalents and current financial investments. Net interest-bearing debt is normalised by excluding 50% of the cash build-up related to tax payments due in the beginning of February, April, June, August, October and December each year. 11. These are non-GAAP figures. See report section "Use and reconciliation of non-GAAP measures" for details. 12. Transactions with the Norwegian State. The Norwegian State, represented by the Ministry of Petroleum and Energy (MPE), is the majority shareholder of Statoil and also holds major investments in other entities. This ownership structure means that Statoil participates in transactions with many parties that are under a common ownership structure and therefore meet the definition of a related party. Statoil purchases liquids and natural gas from the Norwegian State, represented by SDFI (The States Direct Financial Interest). In addition, Statoil is selling the State's natural gas production in its own name, but for the Norwegian State's account and risk as well as related expenditures refunded by the State. All transactions are considered to be on a normal arms-length basis and are presented in the financial statements. 13. The production guidance for 2012 reflects our estimates of proved reserves calculated in accordance with US Securities and Exchange Commission (SEC) guidelines and additional production from other reserves not included in proved reserves estimates.
Statoil 2nd quarter 2010 31

FORWARD-LOOKING STATEMENTSThis Operating and Financial Review contains certain forward-looking statements that involve risks and uncertainties. In some cases, we use words such as "anticipate", "continue", "estimate", "expect", "intend", "likely", "may", "plan", "should", "will" and similar expressions to identify forward-looking statements. All statements other than statements of historical fact, including, among others, statements such as those regarding: expected equity production; regularity, efficiency and productivity goals for future operations and projects; our future financial position; our future market position; business strategy; expected changes in ownership interests and structures; expected project development expenditures; plans for future development (including redevelopment) and operation of projects; reserve information; reserve recovery factors; entitlement volumes; future ability to utilise and develop our expertise; oil and gas production forecasts; future composition of our exploration and project portfolios; exploration expenditure; expected exploration and development activities and plans; planned turnarounds; expected unit production cost for equity volumes; expected refining margins; expected gap between entitlement and equity volumes; expected impact of contractual arrangements on equity volumes; expected production and capacity of projects; projected impact of laws and regulations (including taxation laws); the impact of the uncertain world economy; expected capital expenditures; our expected ability to obtain short term and long term financing; our ability to manage our risk exposure; the projected levels of risk exposure with respect to financial counterparties; our ability to obtain financing at attractive funding cost levels; the expected impact of currency and interest rate fluctuations (including USD/NOK exchange rate fluctuations) on our financial position; oil, gas and alternative fuel price levels and volatility; oil, gas and alternative fuel supply and demand; the markets for oil, gas and alternative fuel; projected operating costs; the completion of acquisitions, disposals and other contractual arrangements; and the obtaining of regulatory and contractual approvals, are forward-looking statements. You should not place undue reliance on these forward-looking statements. Our actual results could differ materially from those anticipated in the forward-looking statements for many reasons, including the risks described above in "Risk update". These forward-looking statements reflect current views with respect to future events and are, by their nature, subject to significant risks and uncertainties because they relate to events and depend on circumstances that will occur in the future. There are a number of factors that could cause actual results and developments to differ materially from those expressed or implied by these forward-looking statements, including levels of industry product supply, demand and pricing; currency exchange rates; interest rates; trading activities; the political and economic policies of Norway and other oil-producing countries; general economic conditions; political stability and economic growth in relevant areas of the world; global political events and actions, including war, terrorism and sanctions; changes in laws and governmental regulations; the lack of necessary transportation infrastructure when a field is in a remote location; the timing of bringing new fields on stream; material differences from reserves estimates; an inability to find and develop reserves; adverse changes in tax regimes; the development and use of new technology; geological or technical difficulties; operational problems; security breaches; the actions of competitors; our ability to successfully exploit growth opportunities; the actions of field partners; industrial actions by workers; failing to attract and retain senior management and skilled personnel; failing to meet our ethical and social standards; operational catastrophes; security breaches; natural disasters and adverse weather conditions and other changes to business conditions; and other factors discussed elsewhere in this report. Additional information, including information on factors that may affect Statoil's business, is contained in Statoil's 2009 Annual Report on Form 20-F filed with the U.S. Securities and Exchange Commission, which can be found on Statoil's website at www.statoil.com. Although we believe that the expectations reflected in the forward-looking statements are reasonable, we cannot assure you that our future results, level of activity, performance or achievements will meet these expectations. Moreover, neither we nor any other person assumes responsibility for the accuracy and completeness of the forward-looking statements. Unless we are required by law to update these statements, we will not necessarily update any of these statements after the date of this review, either to make them conform to actual results or changes in our expectations.
Statoil 2nd quarter 2010 32

Financial statements2nd quarter 2010 CONSOLIDATED STATEMENT OF INCOME
For the three months For the six months For the year ended ended 30 June ended 30 June 31 December 2010 2009 2010 2009 2009(in NOK million) (unaudited) (unaudited) (unaudited) (unaudited)
REVENUESANDOTHERINCOME
Revenues 129,204 104,629 257,867 217,260 462,292
Netincomefromassociatedcompanies 53 590 652 610 1,778
Otherincome (27) 29 426 133 1,363
Totalrevenuesandotherincome 129,230 105,248 258,945 218,003 465,433
OPERATINGEXPENSES
Purchases[netofinventoryvariation] (64,902) (46,622) (122,325) (90,734) (205,870)
Operatingexpenses (15,552) (14,003) (31,294) (27,952) (56,860)
Selling,generalandadministrativeexpenses (4,295) (3,059) (6,902) (5,796) (10,321)
Depreciation,amortisationandnetimpairmentlosses (14,310) (12,830) (25,448) (24,001) (54,056)
Explorationexpenses (3,571) (4,421) (6,793) (9,681) (16,686)
Totaloperatingexpenses (102,630) (80,935) (192,762) (158,164) (343,793)
Netoperatingincome 26,600 24,313 66,183 59,839 121,640
FINANCIALITEMS
Netforeignexchangegains(losses) (3,288) (130) (5,821) (1,630) 1,993
Interestincomeandotherfinancialitems 420 1,776 1,308 2,234 3,708
Interestandotherfinanceexpenses 2,083 (6,438) 2,044 (9,311) (12,451)
Netfinancialitems (785) (4,792) (2,469) (8,707) (6,750)
Incomebeforetax 25,815 19,521 63,714 51,132 114,890
Incometax (22,758) (19,495) (49,520) (47,137) (97,175)
Netincome 3,057 26 14,194 3,995 17,715
Attributableto:
Equityholdersofthecompany 3,623 77 14,732 3,744 18,313
Non-controllinginterest(Minorityinterest) (566) (51) (538) 251 (598)
3,057 26 14,194 3,995 17,715
Earningspershareforincomeattributable
toequityholdersofthecompany-basicanddiluted 1.14 0.02 4.63 1.18 5.75
Dividenddeclaredandpaidperordinaryshare 6.00 7.25 6.00 7.25 7.25
Weightedaveragenumberofordinarysharesoutstanding 3,182,704,054 3,184,206,4463,182,943,356 3,184,516,025 3,183,873,643
SeenotestothequarterlyConsolidatedfinancialstatements.
Statoil 2nd quarter 2010 33

CONSOLIDATED STATEMENT OF COMPREHENSIVE INCOME
For the three months For the six months For the year ended ended 30 June ended 30 June 31 December 2010 2009 2010 2009 2009(in NOK million) (unaudited) (unaudited) (unaudited) (unaudited)
Netincome 3,057 26 14,194 3,995 17,715
Foreigncurrencytranslationdifferences 7,309 (302) 11,009 (5,733) (13,637)
Actuarialgains(losses)onemployeeretirementbenefitplans 104 751 888 (399) 3,191
Changeinfairvalueofavailableforsalefinancialassets 565 0 565 (66) (66)
IncometaxeffectonincomeandexpenserecogniseddirectlyinOCI (121) 92 (762) 201 (742)
Othercomprehensiveincome 7,857 541 11,700 (5,997) (11,254)
Totalcomprehensiveincome 10,914 567 25,894 (2,002) 6,461
Attributableto:
Equityholdersoftheparentcompany 11,480 618 26,432 (2,253) 7,059
Non-controllinginterest (566) (51) (538) 251 (598)
10,914 567 25,894 (2,002) 6,461
Statoil 2nd quarter 2010 34

CONSOLIDATED BALANCE SHEET
At 30 June At 31 December At 30 June 2010 2009 2009(in NOK million) (unaudited) (unaudited)
ASSETS
Non-current assets
Property,plantandequipment 352,963 340,835 332,588
Intangibleassets 64,546 54,253 59,195
Investmentsinassociatedcompanies 10,801 10,056 12,031
Deferredtaxassets 1,813 1,960 1,921
Pensionassets 5,544 2,694 28
Financialinvestments 14,639 13,267 12,920
Derivativefinancialinstruments 21,496 17,644 15,615
Financialreceivables 5,386 5,747 4,362
Totalnon-currentassets 477,188 446,456 438,660
Current assets
Inventories 22,629 20,196 18,743
Tradeandotherreceivables 65,019 58,895 58,070
Currenttaxreceivable 568 179 1,368
Derivativefinancialinstruments 4,733 5,369 8,111
Financialinvestments 7,925 7,022 5,211
Cashandcashequivalents 18,815 24,723 24,452
Totalcurrentassets 119,689 116,384 115,955
Assetsheldforsale 15,156 0 0
TOTALASSETS 612,033 562,840 554,615
Statoil 2nd quarter 2010 35

CONSOLIDATED BALANCE SHEET
At 30 June At 31 December At 30 June 2010 2009 2009(in NOK million) (unaudited) (unaudited)
EQUITYANDLIABILITIES
Equity
Sharecapital 7,972 7,972 7,972
Treasuryshares (14) (15) (12)
Additionalpaid-incapital 41,622 41,732 41,466
Additionalpaid-incapitalrelatedtotreasuryshares (820) (847) (684)
Retainedearnings 141,731 145,909 128,750
Otherreserves 15,142 3,568 11,472
Statoilshareholders’equity 205,633 198,319 188,964
Non-controllinginterest(Minorityinterest) 1,332 1,799 2,403
Totalequity 206,965 200,118 191,367
Non-current liabilities
Financialliabilities 95,898 95,962 90,181
Derivativefinancialinstruments 5,922 1,657 1,244
Deferredtaxliabilities 74,643 76,322 72,190
Pensionliabilities 21,333 21,142 22,028
Assetsretirementobligations,otherprovisionsandotherliabilities 68,742 55,834 54,515
Totalnon-currentliabilities 266,538 250,917 240,158
Current liabilities
Tradeandotherpayables 61,785 59,801 58,689
Currenttaxpayable 54,238 40,994 48,204
Financialliabilities 11,958 8,150 11,971
Derivativefinancialinstruments 6,433 2,860 4,226
Totalcurrentliabilities 134,414 111,805 123,090
Liabilitiesheldforsale 4,116 0 0
Totalliabilities 405,068 362,722 363,248
TOTALEQUITYANDLIABILITIES 612,033 562,840 554,615
SeenotestothequarterlyConsolidatedfinancialstatements.
Statoil 2nd quarter 2010 36

CONSOLIDATED STATEMENT OF CHANGES IN EQUITY
Other reserves
Additional Available Additional paid-in for sale Currency Statoil Non- Treasury paid-in capital related Retained financial translation shareholders’ controlling(unaudited, in NOK million) Share capital shares capital to treasury shares earnings assets adjustments equity interest Total
At1January2010 7,972(15) 41,732 (847) 145,909 0 3,568 198,319 1,799 200,118
Netincomefortheperiod 14,732 14,732 (538) 14,194
Othercomprehensiveincome 126565 11,009 11,700 11,700
Dividendpaid (19,095) (19,095) (19,095)
Otherequitytransactions 1 (110) 27 59 (23) 71 48
At30June2010 7,972 (14) 41,622 (820) 141,731 565 14,577 205,633 1,332 206,965
Other reserves
Additional Available Additional paid-in for sale Currency Statoil Non- Treasury paid-in capital related Retained financial translation shareholders’ controlling(unaudited, in NOK million) Share capital shares capital to treasury shares earnings assets adjustments equity interest Total
At1January2009 7,972 (9) 41,450 (586) 147,998 49 17,205 214,079 1,976 216,055
Netincomefortheperiod 3,744 3,744 251 3,995
Othercomprehensiveincome (215)(49) (5,733)(5,997) (5,997)
Dividendpaid (23,085) (23,085) (23,085)
Otherequitytransactions (3)16 (98)308 223 176 399
At30June2009 7,972 (12) 41,466 (684) 128,750 0 11,472 188,964 2,403 191,367
Statoil 2nd quarter 2010 37

CONSOLIDATED STATEMENT OF CASH FLOWS
For the six months For the year ended 30 June ended 31 December 2010 2009 2009(in NOK million) (unaudited) (unaudited)
OPERATINGACTIVITIES
Incomebeforetax 63,714 51,132 114,890
Adjustmentstoreconcilenetincometonetcashflowsprovidedbyoperatingactivities:
Depreciation,amortisationandnetimpairmentlosses 25,448 24,001 54,056
Explorationexpenditureswrittenoff 2,049 4,877 6,998
(Gains)lossesonforeigncurrencytransactionsandbalances 252 8,792 6,512
(Gains)lossesonsalesofassetsandotheritems (213) 84 (526)
Changesinworkingcapital(otherthancashandcashequivalents):
•(Increase)decreaseininventories (2,433) (3,592) (5,045)
•(Increase)decreaseintradeandotherreceivables (5,640) 11,941 11,036
•Increase(decrease)intradeandotherpayables 416 (2,713) (1,365)
(Increase)decreaseincurrentfinancialinvestments (903) 4,536 2,725
(Increase)decreaseinnetderivativefinancialinstruments 260 (9,183) (10,951)
Taxespaid (39,698) (49,700) (100,473)
(Increase)decreaseinnon-currentitemsrelatedtooperatingactivities 4,672 (1,455) (4,856)
Cashflowsprovidedbyoperatingactivities 47,924 38,720 73,001
INVESTINGACTIVITIES
Additionstoproperty,plantandequipment (30,862) (33,808) (67,152)
Explorationexpenditurescapitalised (2,655) (4,412) (7,203)
Additionsinotherintangibles (4,809) (428) (795)
Changeinnon-currentloansgrantedandothernon-currentitems (136) (842) (1,636)
Proceedsfromsaleofassets 858 172 1,430
Prepaymentreceivedrelatedtotheheldforsaletransaction 1,995 0 0
Cashflowsusedininvestingactivities (35,609) (39,318) (75,356)
FINANCINGACTIVITIES
Newnon-currentborrowings 30 41,143 46,318
Repaymentofnon-currentborrowings (2,989) (4,470) (4,905)
Distribution(to)/fromnon-controllinginterests 71 176 421
Dividendpaid (19,095) (23,085) (23,085)
Treasurysharespurchased (161) (75) (343)
Netcurrentborrowings,bankoverdraftsandother 1,027 (6,483) (7,115)
Cashflowsprovidedby(usedin)financingactivities (21,117) 7,206 11,291
Netincrease(decrease)incashandcashequivalents (8,802) 6,608 8,936
Effectofexchangeratechangesoncashandcashequivalents 2,894 (794) (2,851)
Cashandcashequivalentsatthebeginningoftheperiod 24,723 18,638 18,638
Cashandcashequivalentsattheendoftheperiod 18,815 24,452 24,723
SeenotestothequarterlyConsolidatedfinancialstatements.
Statoil 2nd quarter 2010 38

1 ORGANISATION AND BASIS OF PREPARATION
General information and organisation Statoil ASA, originally Den Norske Stats Oljeselskap AS, was founded in 1972 and is incorporated and domiciled in Norway. The address of its registered office is Forusbeen 50, N-4035 Stavanger, Norway. Statoil's business consists principally of the exploration, production, transportation, refining and marketing of petroleum and petroleum-derived products. Statoil ASA is listed on the Oslo Stock Exchange (Norway) and the New York Stock Exchange (USA). As of 1 January 2009, all Statoil's oil and gas activities and net assets on the Norwegian Continental Shelf (NCS) are owned by Statoil Petroleum AS, a 100% owned operating subsidiary. Statoil Petroleum AS is the co-obligor of certain debt securities of the parent company Statoil ASA that are registered under the US Securities Act of 1933, and has irrevocably assumed and agreed to perform the payment and covenant obligations for these debt securities. The company also is co-obligor or guarantor of certain other debt obligations of Statoil ASA. Basis of preparation These interim financial statements are prepared in accordance with International Accounting Standard 34 Interim Financial Reporting as issued by the International Accounting Standards Board and as adopted by the European Union. The interim financial statements do not include all of the information and footnotes required by International Financial Reporting Standards (IFRS) for a complete set of financial statements. These interim financial statements should be read in conjunction with the annual financial statements. A detailed description of the accounting policies used is included in the Statoil annual financial statements for 2009. With effect from 1 January 2010 Statoil adopted certain revised and amended accounting standards and improvements to IFRSs as further outlined in the Significant accounting principles note disclosure to Statoil's financial statements for 2009. None of these revised standards or amendments have significantly impacted the interim financial statements for the first half of 2010, nor have there been any other significant changes in accounting policies compared to the annual financial statements. The financial statements provide, in the opinion of management, a fair presentation of the financial position, results of operations and cash flows for the dates and periods covered. Interim period results are not necessarily indicative of results of operations or cash flows for an annual period. The functional currency of the entities in the Statoil group is determined based on the nature of each company's primary economic environment in which it operates. The functional currency of the parent company Statoil ASA is USD. The presentation currency for the Statoil group is NOK. The interim financial statements are unaudited. Use of estimates The preparation of financial statements in conformity with IFRS requires management to make judgments, estimates and assumptions that affect the application of policies and reported amounts of assets and liabilities, income and expenses. The estimates and associated assumptions are based on historical experience and various other factors that are believed to be reasonable under the circumstances, the result of which form the basis for making the judgments about carrying values of assets and liabilities that are not readily apparent from other sources. Actual results may differ from these estimates. The estimates and underlying assumptions are reviewed on an ongoing basis, considering the current and expected future market conditions. Change in accounting estimates are recognised in the period in which the estimate is revised if the revision affects only that period or in the period of the revision and future periods if the revision affects both current and future periods. Commercial factors affecting the financial statements Statoil is exposed to a number of underlying economic factors, such as liquids prices, natural gas prices, refining margins, foreign exchange rates, interest rates, as well as financial instruments with fair values derived from changes in these factors, which affect the overall results for each period. In addition the results of Statoil are influenced in each period by the level of production, which in the short term may be influenced by for example maintenance programmes. In the long term, the results are impacted by the success of exploration and field development activities.
Statoil 2nd quarter 2010 39

2 SEGMENTSStatoil manages its operations in four operating segments; Exploration and Production Norway, International Exploration and Production, Natural Gas and Manufacturing and Marketing. The Exploration and Production Norway and International Exploration and Production segments explore for, develop and produce crude oil and natural gas. The Natural Gas segment transports and markets natural gas and natural gas products. Manufacturing and Marketing is responsible for petroleum refining operations and the marketing and sale of crude oil and refined petroleum products except for natural gas and natural gas products. The "Other" section consists of the activities of Corporate services, Corporate centre, Group Finance, Technology & New energy and Projects. The "Eliminations" section encompasses elimination of inter-segment sales and related unrealised profits mainly from the sale of crude oil and products. Inter-segment revenues are at estimated market prices. Operating segments align with internal management reporting to the Group's chief operating decision maker, defined as the Corporate Executive Committee (CEC). The operating segments are determined based on differences in the nature of their operations, products, services and geographical location of the activity. The measure of segment profit is Net operating income. Financial items and tax expense are not allocated to the operating segments. The measurement basis for the net operating income for each operating segment follows the accounting principles used in the financial statements.
Statoil 2nd quarter 2010 40

International Exploration and Exploration and Manufacturing(in NOK million) Production Norway Production Natural Gas and Marketing Other Eliminations Total
Threemonthsended
30June2010
RevenuesthirdpartyandOtherincome 1,824 1,368 17,964 108,064 168 (211) 129,177
Revenuesinter-segment 41,156 9,670 958 738 517 (53,039) 0
Netincomefromassociatedcompanies 10 231 (228) 65 (25) 0 53
Totalrevenuesandotherincome 42,990 11,269 18,694 108,867 660 (53,250) 129,230
Netoperatingincome 29,625 2,457 (4,473) (1,460) 469 (18) 26,600
AdditionstoIntangibleassets
andProperty,plantandequipment* 8,450 8,396 591 846 226 0 18,509
Threemonthsended
30June2009
RevenuesthirdpartyandOtherincome 986 3,018 21,499 78,916 239 0 104,658
Revenuesinter-segment 32,954 7,452 352 199 560 (41,517) 0
Netincomefromassociatedcompanies 29 231 269 65 (4) 0 590
Totalrevenuesandotherincome 33,969 10,701 22,120 79,180 795 (41,517) 105,248
Netoperatingincome 20,601 1,187 5,054 (1,398) 177 (1,308) 24,313
AdditionstoIntangibleassets
andProperty,plantandequipment* 9,392 8,296 768 1,840 285 0 20,581
Sixmonthsended
30June2010
RevenuesthirdpartyandOtherincome 2,118 3,434 41,766 210,817 369 (211) 258,293
Revenuesinter-segment 82,963 21,149 1,243 1,096 987 (107,438) 0
Netincomefromassociatedcompanies 28 542 21 107 (46) 0 652
Totalrevenuesandotherincome 85,109 25,125 43,030 212,020 1,310 (107,649) 258,945
Netoperatingincome 58,230 7,308 321 268 243 (187) 66,183
AdditionstoIntangibleassets
andProperty,plantandequipment* 15,657 21,027 1,233 1,377 422 0 39,716
Sixmonthsended
30June2009
RevenuesthirdpartyandOtherincome 88 5,407 55,548 155,777 573 0 217,393
Revenuesinter-segment 76,771 13,087 680 986 1,059 (92,583) 0
Netincomefromassociatedcompanies 41 343 113 136 (23) 0 610
Totalrevenuesandotherincome 76,900 18,837 56,341 156,899 1,609 (92,583) 218,003
Netoperatingincome 50,597 (1,132) 10,879 2,091 (427) (2,169) 59,839
AdditionstoIntangibleassets
andProperty,plantandequipment* 19,132 16,079 1,106 2,996 750 0 40,063
*excludingmovementsduetochangesinabandonmentandremovalobligations.
Statoil 2nd quarter 2010 41

In the Natural Gas segment an onerous contract provision of NOK 3.8 billion was recognised in the second quarter of 2010 (year to date NOK 4.4 billion) related to certain capacity contracts. The basis for the provision is expectation of low future utilisation of the capacity. In the Manufacturing and Marketing segment an impairment loss of NOK 2.9 billion was recognised in the second quarter of 2010 related to a refinery (NOK 2.2 billion in the second quarter of 2009). See note 5 Intangible assets and Property, plant and equipment for further information on impairments. In the Manufacturing and Marketing segment a provision of NOK 1.3 billion related to a take or pay contract was reversed and consequently reduced Operating expenses in the first quarter of 2009.
Statoil 2nd quarter 2010 42
3 FINANCIAL ITEMSIncluded in Interest and other finance expenses are fair value gains on interest rate swap positions, which are used to manage the interest rate risk on external loans, of NOK 2.9 billion for the three months ending 30 June 2010 and NOK 3.9 billion for the six months ending 30 June 2010. The fair value gains are caused by decreased interest rates. Correspondingly, fair value losses of NOK 4.0 billion due to increasing interest rates were included in Interest and other finance expenses for the three months ending 30 June 2009 and NOK 6.1 billion for the six months ending 30 June 2009.
4 INCOME TAX
For the three months For the six months For the year ended ended 30 June ended 30 June 31 December(in NOK million) 2010 2009 2010 2009 2009
Incomebeforetax 25,815 19,521 63,714 51,132 114,890
Incometax (22,758) (19,495) (49,520) (47,137) (97,175)
Equivalenttoataxrateof 88.2% 99.9% 77.7% 92.2% 84.6%
Property, plant Intangible(in NOK million) and equipment assets
Balanceat31December2009 340,835 54,253
Additions 38,733 7,464
Transfers 427 (427)
Disposals (327) (13)
Heldforsale* (15,046) (110)
Expensedexplorationexpenditurespreviouslycapitalised 0 (2,049)
Depreciation,amortisationandnetimpairmentlosses (25,395) (53)
Effectofforeigncurrencytranslationadjustments 13,736 5,481
Balanceat30June2010 352,963 64,546
*Seenote7Assets held for saleformoreinformation.
For the three months For the six months ended 30 June ended 30 June(in NOK million) 2010 2009 2010 2009
Depreciation,amortisationandnetimpairmentlosses 2,996 2,162 2,996 2,493
Explorationexpenses 1,123 2,006 1,396 4,146
Impairmentlosses 4,119 4,168 4,392 6,639
Depreciation,amortisationandnetimpairmentlosses (90) (543) (90) (543)
Explorationexpenses (1,169) 0 (1,169) 0
Reversalofimpairmentlosses (1,259) (543) (1,259) (543)
Netimpairmentlosses 2,860 3,625 3,133 6,096
(in NOK millions) 30 June 2010
Property,plantandequipment 15,046
Intangibleassets 110
Totalnon-currentassetsheldforsale 15,156
Financialliabilities 3,605
Assetretirementobligation,otherprovisionsandotherliabilities 511
Totalnon-currentliabilitiesheldforsale 4,116
The tax rates in the second quarter of 2010 and for the first half of 2010 were primarily influenced by operating losses and impairment losses in entities which are subject to lower than average tax rates. This was partly offset by foreign exchange losses in entities that are taxable in other currencies than the functional currency. These foreign exchange losses are tax deductiable, but do not impact the income statement of these entities. The tax rates in the second quarter of 2009 and for the first half of 2009 were primarily influenced by significant taxable foreign exchange gains in entities that are taxable in other currencies than the functional currency. These taxable foreign exchange gains do not impact the income statement of these entities. The tax rates were also influenced by relatively high income from the Norwegian Continental Shelf, which is subject to higher than average tax rates, and impairments in entities which are subject to lower than average tax rates.
5 INTANGIBLE ASSETS AND PROPERTY, PLANT AND EQUIPMENT
Property, plant Intangible(in NOK million) and equipment assets
Balanceat31December2009 340,835 54,253
Additions 38,733 7,464
Transfers 427 (427)
Disposals (327) (13)
Heldforsale* (15,046) (110)
Expensedexplorationexpenditurespreviouslycapitalised 0 (2,049)
Depreciation,amortisationandnetimpairmentlosses (25,395) (53)
Effectofforeigncurrencytranslationadjustments 13,736 5,481
Balanceat30June2010 352,963 64,546
*Seenote7Assets held for saleformoreinformation.
For the three months For the six months ended 30 June ended 30 June(in NOK million) 2010 2009 2010 2009
Depreciation,amortisationandnetimpairmentlosses 2,996 2,162 2,996 2,493
Explorationexpenses 1,123 2,006 1,396 4,146
Impairmentlosses 4,119 4,168 4,392 6,639
Depreciation,amortisationandnetimpairmentlosses (90) (543) (90) (543)
Explorationexpenses (1,169) 0 (1,169) 0
Reversalofimpairmentlosses (1,259) (543) (1,259) (543)
Netimpairmentlosses 2,860 3,625 3,133 6,096
(NOK millions) 30 June 2010
Property,plantandequipment 15,046
Intangibleassets 110
Totalnon-currentassetsheldforsale 15,156
Financialliabilities 3,605
Assetretirementobligation,otherprovisionsandotherliabilities 511
Totalnon-currentliabilitiesheldforsale 4,116
In assessing the need for impairment of the carrying amount of a potentially impaired asset, the asset's carrying amount is compared to its recoverable amount. The recoverable amount is the higher of fair value less costs to sell and estimated value in use. When preparing a value in use calculation the estimated future cash flows are adjusted for risks specific to the asset and discounted using a real post-tax discount rate adjusted for asset specific

differences, such as tax rates and horizon of cash flows. The discount rate is 6.5% real after tax in a 28% tax regime and is derived from Statoil's weighted average cost of capital. Impairment losses and reversal of impairment losses are presented as Exploration expenses and Depreciation, amortisation and net impairment losses on the basis of their nature as exploration assets (intangible assets) and development and producing assets (property, plant and equipment and intangible assets), respectively. The table below shows the net impairment losses recognised in the reporting period.
Property, plant Intangible(in NOK million) and equipment assets
Balanceat31December2009 340,835 54,253
Additions 38,733 7,464
Transfers 427 (427)
Disposals (327) (13)
Heldforsale* (15,046) (110)
Expensedexplorationexpenditurespreviouslycapitalised 0 (2,049)
Depreciation,amortisationandnetimpairmentlosses (25,395) (53)
Effectofforeigncurrencytranslationadjustments 13,736 5,481
Balanceat30June2010 352,963 64,546
For the three months For the six months ended 30 June ended 30 June(in NOK million) 2010 2009 2010 2009
Depreciation,amortisationandnetimpairmentlosses 2,996 2,162 2,996 2,493
Explorationexpenses 1,123 2,006 1,396 4,146
Impairmentlosses 4,119 4,168 4,392 6,639
Depreciation,amortisationandnetimpairmentlosses (90) (543) (90) (543)
Explorationexpenses (1,169) 0 (1,169) 0
Reversalofimpairmentlosses (1,259) (543) (1,259) (543)
Netimpairmentlosses 2,860 3,625 3,133 6,096
(NOK millions) 30 June 2010
Property,plantandequipment 15,046
Intangibleassets 110
Totalnon-currentassetsheldforsale 15,156
Financialliabilities 3,605
Assetretirementobligation,otherprovisionsandotherliabilities 511
Totalnon-currentliabilitiesheldforsale 4,116
Impairment losses of NOK 2.9 billion and NOK 2.2 billion was recognised in the second quarter of 2010 and the second quarter of 2009 respectively, related to refineries in the Manufacturing and Marketing segment. The basis for the impairment losses are value in use estimates triggered by decreasing expectations on refining margins. The impairment losses and reversal of impairment losses recognised as exploration expenses in the three and six months periods presented, mainly relate to exploration and production assets in the Gulf of Mexico, which have been recognised by the International Exploration and Production segment.
Statoil 2nd quarter 2010 43
6 PROVISIONS, COMMITMENTS, CONTINGENT LIABILITIES AND CONTINGENT ASSETSStatoil has in the first half of 2010 entered into certain new operational lease contracts for a number of drilling rigs, which contribute to an increase in the group's total future leasing commitments as of second quarter end. The new drilling rig contracts involve future minimum lease payments of NOK 12 billion and have terms ranging from 6 months to 5 years. During the normal course of its business Statoil is involved in legal proceedings, and several unresolved claims are currently outstanding. The ultimate liability or asset, respectively, in respect of such litigation and claims cannot be determined at this time. Statoil has provided in its financial statements for probable liabilities related to litigation and claims based on the Company's best judgement. Statoil does not expect that the financial position, results of operations or cash flows will be materially affected by the resolution of these legal proceedings.

7 ASSETS HELD FOR SALEOn 21 May 2010 Statoil entered into an agreement with Sinochem Group to sell 40% of the Peregrino assets offshore Brazil. Following the transaction Statoil will hold a 60% ownership share and together with Sinochem jointly control the Peregrino assets. Statoil will remain operator of the field which is set to start production in early 2011. Sinochem Group will pay a total of USD 3.1 billion in cash for the 40% share of the assets, through acquisition of shares in various Statoil entities. The transaction is subject to governmental approvals in Brazil and China. The consideration is based on an economic date of 1 January 2010 and is subject to adjustments for working capital and for a proportional share of operational and capital expenditures incurred in the period between the economic date and the date for final closing of the transaction. As at 1 January 2010, the net carrying amount of the Peregrino assets was NOK 21.4 billion (100%). The transaction will be recognised in the International Exploration and Production segment when it has been completed. On the basis of the agreement, the carrying amount of non-current assets and liabilities relating to the 40% ownership share to be divested has been classified as held for sale in the Consolidated balance sheet. The table below shows the assets and liabilities presented as held for sale:
For the three months For the six months For the year ended ended 30 June ended 30 June 31 December(in NOK million) 2010 2009 2010 2009 2009
Incomebeforetax 25,815 19,521 63,714 51,132 114,890
Incometax (22,758) (19,495) (49,520) (47,137) (97,175)
Equivalenttoataxrateof 88.2% 99.9% 77.7% 92.2% 84.6%
Property, plant Intangible(in NOK million) and equipment assets
Balanceat31December2009 340,835 54,253
Additions 38,733 7,464
Transfers 427 (427)
Disposals (327) (13)
Heldforsale* (15,046) (110)
Expensedexplorationexpenditurespreviouslycapitalised 0 (2,049)
Depreciation,amortisationandnetimpairmentlosses (25,395) (53)
Effectofforeigncurrencytranslationadjustments 13,736 5,481
Balanceat30June2010 352,963 64,546
*Seenote7Assets held for saleformoreinformation.
For the three months For the six months ended 30 June ended 30 June(in NOK million) 2010 2009 2010 2009
Depreciation,amortisationandnetimpairmentlosses 2,996 2,162 2,996 2,493
Explorationexpenses 1,123 2,006 1,396 4,146
Impairmentlosses 4,119 4,168 4,392 6,639
Depreciation,amortisationandnetimpairmentlosses (90) (543) (90) (543)
Explorationexpenses (1,169) 0 (1,169) 0
Reversalofimpairmentlosses (1,259) (543) (1,259) (543)
Netimpairmentlosses 2,860 3,625 3,133 6,096
(in NOK millions) 30 June 2010
Property,plantandequipment 15,046
Intangibleassets 110
Totalnon-currentassetsheldforsale 15,156
Financialliabilities 3,605
Assetretirementobligation,otherprovisionsandotherliabilities 511
Totalnon-currentliabilitiesheldforsale 4,116
Statoil 2nd quarter 2010 44
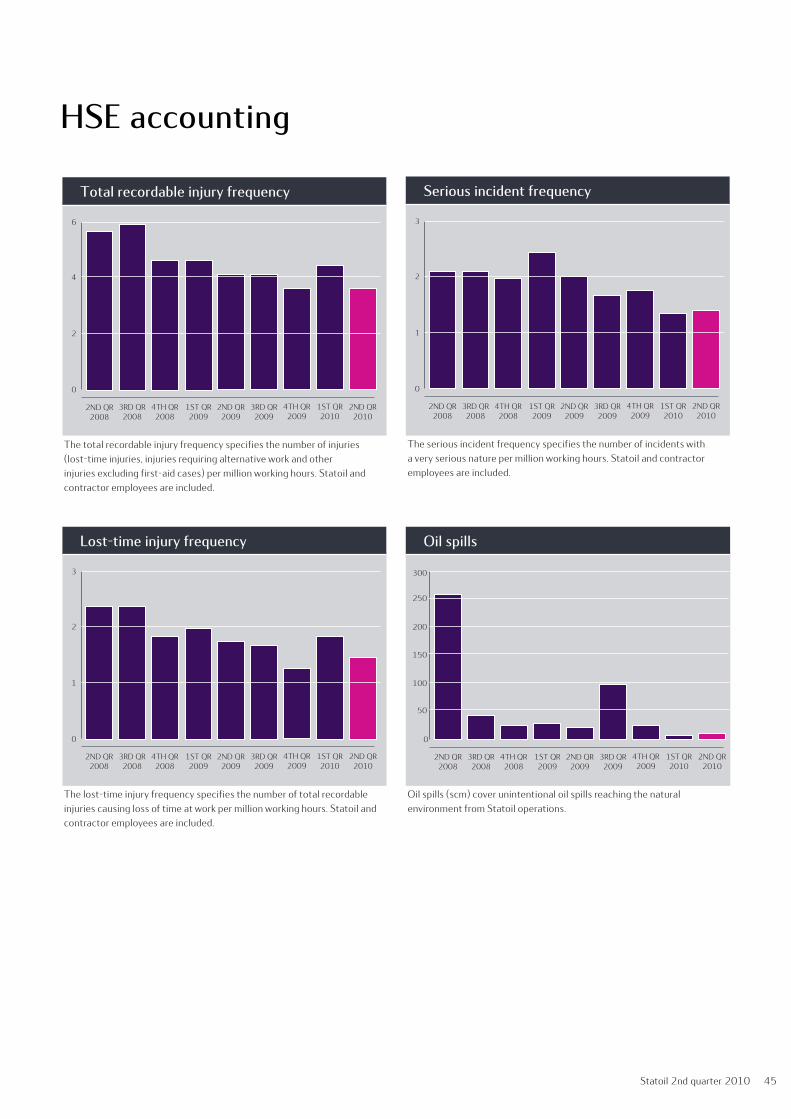
HSE accounting
Total recordable injury frequency
0
2
4
6
2ND QR2008
3RD QR2008
4TH QR2008
1ST QR2009
2ND QR2009
3RD QR2009
4TH QR2009
1ST QR2010
2ND QR2010
Serious incident frequency
0
1
2
3
2ND QR2008
3RD QR2008
4TH QR2008
1ST QR2009
2ND QR2009
3RD QR2009
4TH QR2009
1ST QR2010
2ND QR2010
Lost-time injury frequency
0
1
2
3
2ND QR2008
3RD QR2008
4TH QR2008
1ST QR2009
2ND QR2009
3RD QR2009
4TH QR2009
1ST QR2010
2ND QR2010
Oil spills
0
100
200
300
2ND QR2008
3RD QR2008
4TH QR2008
1ST QR2009
2ND QR2009
3RD QR2009
4TH QR2009
250
150
50
1ST QR2010
2ND QR2010
The total recordable injury frequency specifies the number of injuries (lost-time injuries, injuries requiring alternative work and other injuries excluding first-aid cases) per million working hours. Statoil and contractor employees are included.
The serious incident frequency specifies the number of incidents with a very serious nature per million working hours. Statoil and contractor employees are included.
The lost-time injury frequency specifies the number of total recordable injuries causing loss of time at work per million working hours. Statoil and contractor employees are included.
Oil spills (scm) cover unintentional oil spills reaching the natural environment from Statoil operations.
Statoil 2nd quarter 2010 45

Statement on financial complianceBoard and management confirmation Today, the Board of Directors, the Chief Executive Officer and the Chief Financial Officer reviewed and approved the Statoil ASA consolidated financial statements as of 30 June 2010. To the best of our knowledge, we confirm that: the Statoil ASA consolidated financial statements for the first half of 2010 have been prepare in accordance with IFRSs and IFRICs as adopted by the
European Union (EU), IFRSs as issued by the International Accounting Standards Board (IASB) and additional Norwegian disclosure requirements in the Norwegian Accounting Act, and that the information presented in the financial statements gives a true and fair view of the company's and the group's assets, liabilities, financial position and results for the period viewed in their entirety, and that the information presented in the financial statements gives a true and fair view of the development, performance, financial position, principle risks and uncertanties of the group.
Statoil 2nd quarter 2010 46