Financial statements 2014 briefing - Investors Uponor...Financial statements 2014 briefing Jyri...
37
Financial statements 2014 briefing Jyri Luomakoski President and CEO Uponor Corporation Posco Green Building in Yeonsu, Republic of South Korea, features Uponor heating and cooling system with ceiling comfort panels
Transcript of Financial statements 2014 briefing - Investors Uponor...Financial statements 2014 briefing Jyri...

Financial statements 2014 briefing Jyri Luomakoski President and CEO Uponor Corporation
Posco Green Building in Yeonsu, Republic of South Korea, features Uponor heating and cooling system with ceiling comfort panels
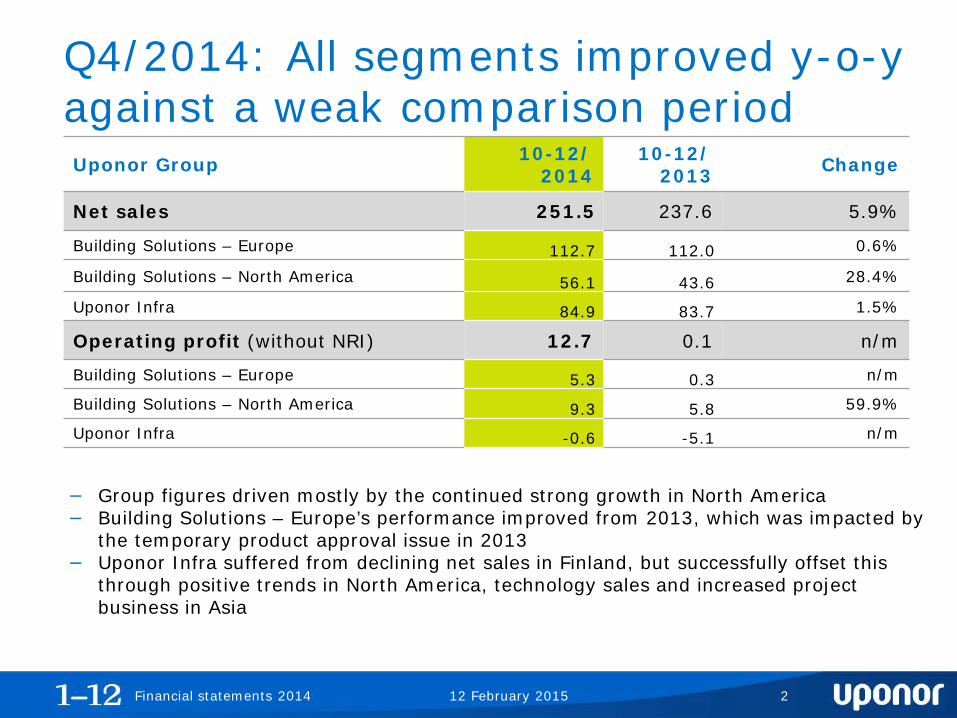
Q4/2014: All segments improved y-o-y against a weak comparison period
12 February 2015
Uponor Group 10-12/ 2014
10-12/ 2013 Change
Net sales 251.5 237.6 5.9%
Building Solutions – Europe 112.7 112.0 0.6%
Building Solutions – North America 56.1 43.6 28.4%
Uponor Infra 84.9 83.7 1.5%
Operating profit (without NRI) 12.7 0.1 n/m
Building Solutions – Europe 5.3 0.3 n/m
Building Solutions – North America 9.3 5.8 59.9%
Uponor Infra -0.6 -5.1 n/m
− Group figures driven mostly by the continued strong growth in North America − Building Solutions – Europe’s performance improved from 2013, which was impacted by
the temporary product approval issue in 2013 − Uponor Infra suffered from declining net sales in Finland, but successfully offset this
through positive trends in North America, technology sales and increased project business in Asia
Financial statements 2014 2
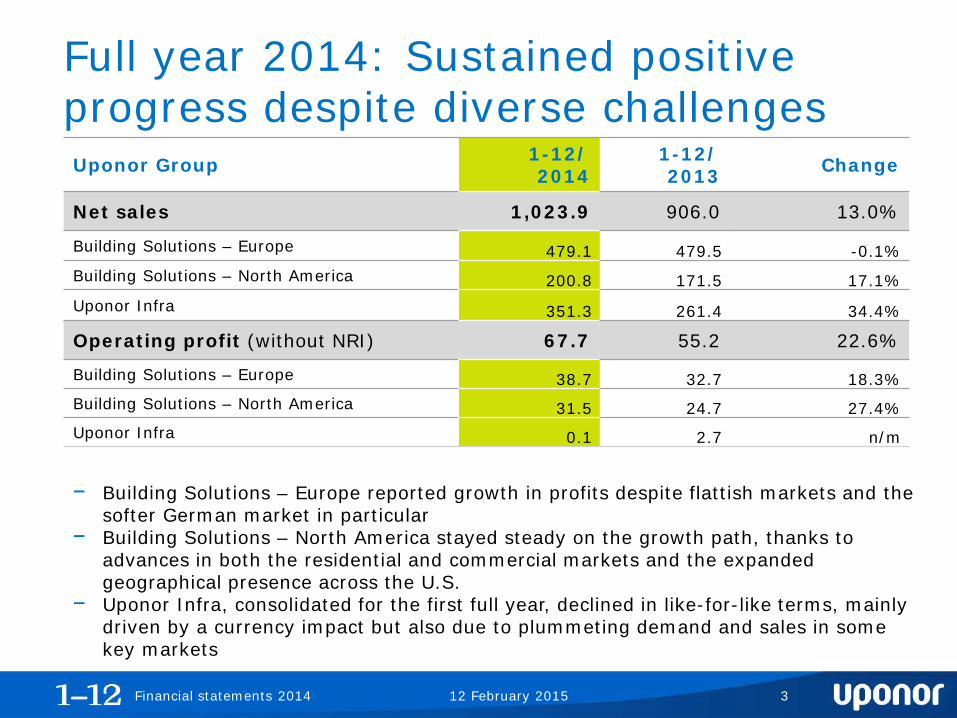
Full year 2014: Sustained positive progress despite diverse challenges
12 February 2015
Uponor Group 1-12/ 2014
1-12/ 2013 Change
Net sales 1,023.9 906.0 13.0%
Building Solutions – Europe 479.1 479.5 -0.1% Building Solutions – North America 200.8 171.5 17.1% Uponor Infra 351.3 261.4 34.4%
Operating profit (without NRI) 67.7 55.2 22.6%
Building Solutions – Europe 38.7 32.7 18.3% Building Solutions – North America 31.5 24.7 27.4% Uponor Infra 0.1 2.7 n/m
− Building Solutions – Europe reported growth in profits despite flattish markets and the softer German market in particular
− Building Solutions – North America stayed steady on the growth path, thanks to advances in both the residential and commercial markets and the expanded geographical presence across the U.S.
− Uponor Infra, consolidated for the first full year, declined in like-for-like terms, mainly driven by a currency impact but also due to plummeting demand and sales in some key markets
Financial statements 2014 3

Developments by segment: Building Solutions – Europe
12 February 2015
47%
Financial statements 2014
• Renovation driving brisk growth in Finland despite the overall weak building market
• The unique seamless aluminium composite pipe (SACP) launch started in major markets after a successful launch in Iberia in 2013
• Good progress in Russia so far, despite political and economical crisis affecting Russia and parts of Eastern Europe
• New Central European distribution centre relocation on time and in budget, targeting cost savings, customer service improvements and lower environmental footprint from Q2/2015 onwards
• Softening German demand in H2/2014 after a strong weather-supported H1, as a contrast to improvements in some neighbouring markets
4

Developments by segment: Building Solutions – North America
12 February 2015
• Continued market share gain in the single-family residential market
• Good continued penetration into the commercial segments of the market, especially plumbing, in the hospitality, institutional, and apartment segments
• Execution of the manufacturing expansion to meet demand growth
19%
Financial statements 2014 5

Developments by segment: Uponor Infra
12 February 2015
• Execution of original integration plan, the targeted benefits already visible
• Rapid reaction as a response to the weak developments in Finland
• Stabilisation of distributor relationships • Market share loss to alternative
business models continued • Offering integration harmonisation
still ongoing
34%
Financial statements 2014 6

Sustainable progress in CSR targets
12 February 2015
• Sustainability and environmental management ambitions are key drivers for a ‘greener’ construction industry
• Uponor engages with various professional bodies, incl. partners, customers, suppliers, trade organisations
• Uponor’s targets for 2015 have been renewed and extend to 2020
Financial statements 2014
Environmental target 2020 Progress by 2014
Reduce CO2 emissions by 20% Achieved a 15% reduction from 2009
100% green electricity German production 100% certified green electricity
Continued improvement from the current 130g/km fleet average target
New fleet in 2014 at 124g/km, below EU targets
Zero waste to landfill Already reduced to below 5%
7

Financial statements Q4 and FY/2014 Riitta Palomäki CFO Uponor Corporation
St. Mary’s Cathedral, Hildesheim, Germany, utilises Uponor Ecoflex Thermo Twin system to transport heating energy

January – December 2014 Key figures
12 February 2015 Financial statements 2014
M€ 1-12 1-122014 2013
Net sales, continuing operations 1,023.9 906.0
Operating profit, continuing operations 63.4 50.2
Operating profit margin, continuing operations 6.2% 5.5% 0.7% pts
Earnings per share (diluted), € 0.50 0.38
Return on equity, % (p.a.) 12.3% 10.8% 1.5% pts
Return on investment, % (p.a.) 14.2% 12.5% 1.7% pts
Net interest bearing liabilities 82.0 96.9
Gearing, % 27.6% 33.7% -6.1%pts
Net working capital of Net sales, % (p.a.) 10.6% 12.1% -1.5%pts
Average number of employees, continuing operations 4,127 3,649
Number of employees, end of period, continuing operations 3,982 4,141
+13.1%
-3.8%
ChangeY/Y
+13.0%
+26.3%
+31.6%
-15.4%
9

October – December 2014 Income statement
Financial statements 2014
• All segments reported net sales growth. In local currency, net sales grew by 5.7%.
• Operating profit w/o NRI at €12.7m (Q4/2013: €0.1m). All segments improved profitability.
12 February 2015 10
M€ 10-12 10-12 Change2014 2013 Y/Y
Continuing operationsNet sales 251.5 237.6 +5.9%
Cost of goods sold 168.3 165.6 +1.7%
Gross profit 83.2 72.0 +15.4% - % of net sales 33.1% 30.3% +2.7% pts
Other operating income 0.3 0.5Expenses 71.7 76.3 -6.1%
Operating profit 11.8 -3.8 n/m - % of net sales 4.7% -1.6% +6.3% pts
Financial expenses, net 0.2 2.1 -95.0%Share of result in associated companies 0.2 0.1
Profit before taxes 11.8 -5.8 n/m
Profit for the period 8.3 -5.7 n/m
EBITDA 21.3 5.3 n/m
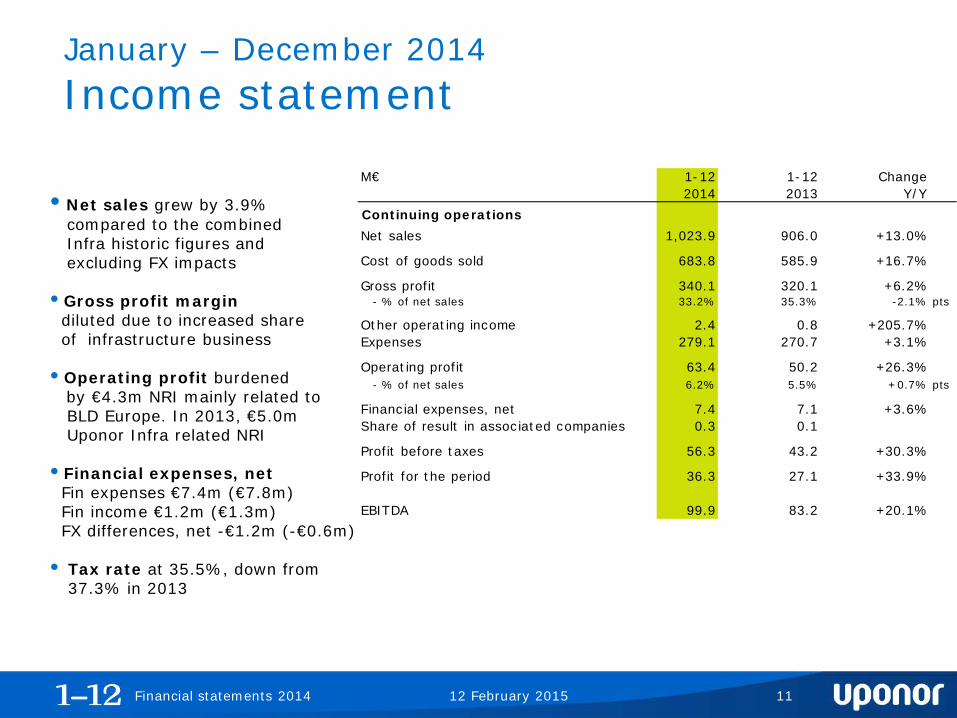
January – December 2014 Income statement
12 February 2015 Financial statements 2014
M€ 1-12 1-12 Change2014 2013 Y/Y
Continuing operationsNet sales 1,023.9 906.0 +13.0%
Cost of goods sold 683.8 585.9 +16.7%
Gross profit 340.1 320.1 +6.2% - % of net sales 33.2% 35.3% -2.1% pts
Other operating income 2.4 0.8 +205.7%Expenses 279.1 270.7 +3.1%
Operating profit 63.4 50.2 +26.3% - % of net sales 6.2% 5.5% +0.7% pts
Financial expenses, net 7.4 7.1 +3.6%Share of result in associated companies 0.3 0.1
Profit before taxes 56.3 43.2 +30.3%
Profit for the period 36.3 27.1 +33.9%
EBITDA 99.9 83.2 +20.1%
• Net sales grew by 3.9% compared to the combined Infra historic figures and excluding FX impacts
• Gross profit margin diluted due to increased share of infrastructure business
• Operating profit burdened by €4.3m NRI mainly related to BLD Europe. In 2013, €5.0m Uponor Infra related NRI • Financial expenses, net Fin expenses €7.4m (€7.8m) Fin income €1.2m (€1.3m) FX differences, net -€1.2m (-€0.6m)
• Tax rate at 35.5%, down from
37.3% in 2013
11
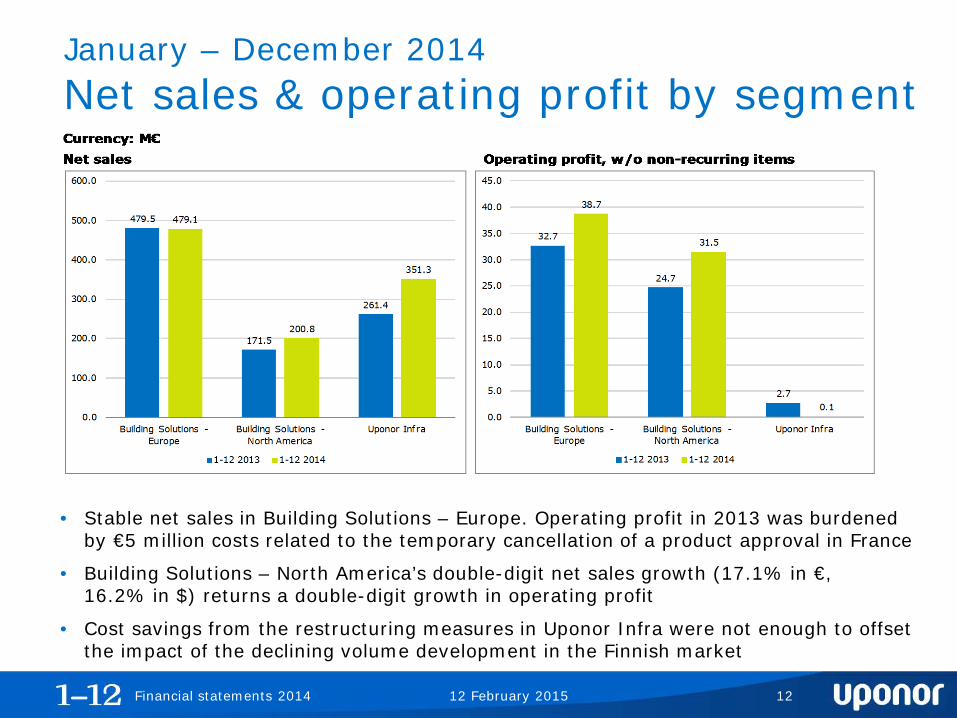
January – December 2014 Net sales & operating profit by segment
12 February 2015 Financial statements 2014
• Stable net sales in Building Solutions – Europe. Operating profit in 2013 was burdened by €5 million costs related to the temporary cancellation of a product approval in France
• Building Solutions – North America’s double-digit net sales growth (17.1% in €, 16.2% in $) returns a double-digit growth in operating profit
• Cost savings from the restructuring measures in Uponor Infra were not enough to offset the impact of the declining volume development in the Finnish market
12
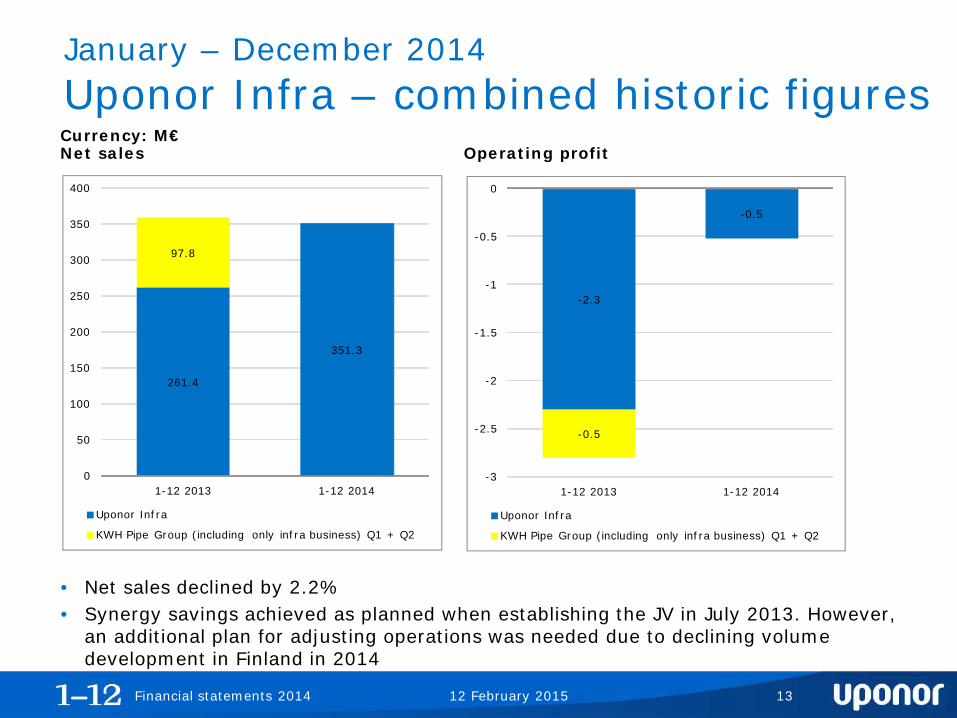
January – December 2014 Uponor Infra – combined historic figures
12 February 2015 Financial statements 2014
• Net sales declined by 2.2% • Synergy savings achieved as planned when establishing the JV in July 2013. However,
an additional plan for adjusting operations was needed due to declining volume development in Finland in 2014
13
Currency: M€Net sales Operating profit
261.4
351.3
97.8
0
50
100
150
200
250
300
350
400
1-12 2013 1-12 2014
Uponor Infra
KWH Pipe Group (including only infra business) Q1 + Q2
-2.3
-0.5
-0.5
-3
-2.5
-2
-1.5
-1
-0.5
0
1-12 2013 1-12 2014
Uponor Infra
KWH Pipe Group (including only infra business) Q1 + Q2

January – December 2014 Net sales development by key markets
12 February 2015 Financial statements 2014
Not
e: C
ount
ries
are
sor
ted
by F
Y201
4 ne
t sa
les
Growth% in EUR 25.7 -1.8 8.3 8.9 51.6 2.8 8.2 11.2
% in Curr. 24.8 14.6 61.1 9.710.410.3
19.613.0
9.533.5
114.8
145.3
93.8
79.9
36.6 33.4 39.230.9 32.1
22.6
183.1
143.1144.5
124.9
86.3
55.1
44.0
35.7
30.029.1 28.1
185.4179.9
141.8135.1
94.1
83.5
48.6 36.6
35.9 31.5 30.7
206.2
0
20
40
60
80
100
120
140
160
180
200
220
USA Germany Finland Sweden Canada Denmark Norway UK Netherlands Russia Others
Jan-Dec 2012 Jan-Dec 2013 Jan-Dec 2014
M€
FX additionally supporting the strong
growth in the USA Q4/2014 Germany and
Finland continue to decline
14
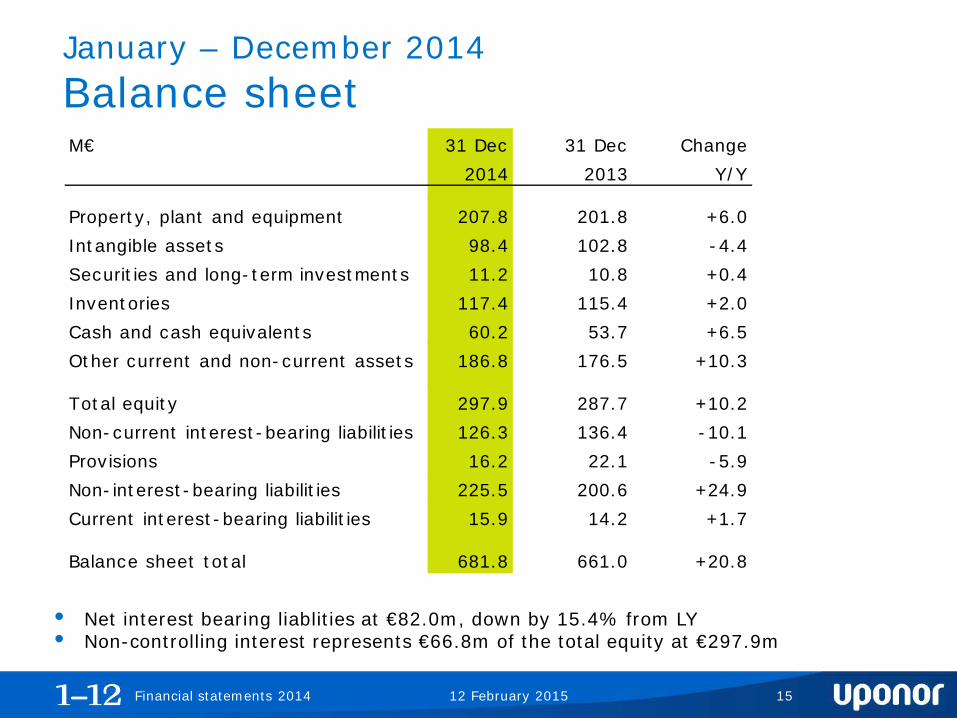
January – December 2014 Balance sheet
12 February 2015 Financial statements 2014
M€ 31 Dec 31 Dec Change2014 2013 Y/Y
Property, plant and equipment 207.8 201.8 +6.0Intangible assets 98.4 102.8 -4.4Securities and long-term investments 11.2 10.8 +0.4Inventories 117.4 115.4 +2.0Cash and cash equivalents 60.2 53.7 +6.5Other current and non-current assets 186.8 176.5 +10.3
Total equity 297.9 287.7 +10.2Non-current interest-bearing liabilities 126.3 136.4 -10.1Provisions 16.2 22.1 -5.9Non-interest-bearing liabilities 225.5 200.6 +24.9Current interest-bearing liabilities 15.9 14.2 +1.7
Balance sheet total 681.8 661.0 +20.8
• Net interest bearing liablities at €82.0m, down by 15.4% from LY • Non-controlling interest represents €66.8m of the total equity at €297.9m
15
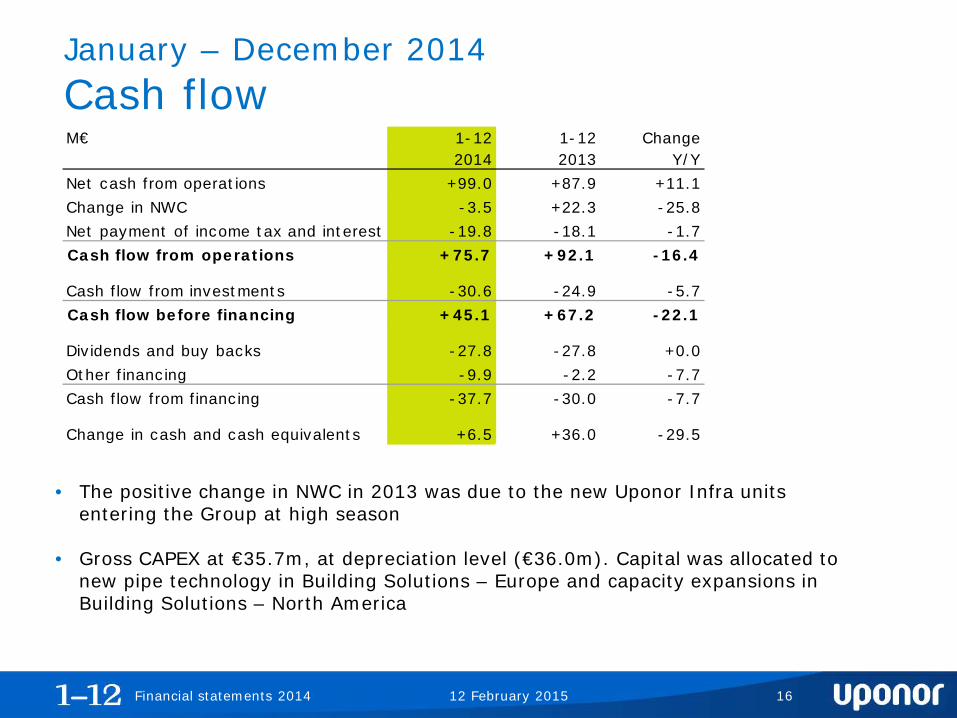
January – December 2014 Cash flow
12 February 2015
Financial statements 2014
M€ 1-12 1-12 Change2014 2013 Y/Y
Net cash from operations +99.0 +87.9 +11.1Change in NWC -3.5 +22.3 -25.8Net payment of income tax and interest -19.8 -18.1 -1.7Cash flow from operations +75.7 +92.1 -16.4
Cash flow from investments -30.6 -24.9 -5.7Cash flow before financing +45.1 +67.2 -22.1
Dividends and buy backs -27.8 -27.8 +0.0Other financing -9.9 -2.2 -7.7Cash flow from financing -37.7 -30.0 -7.7
Change in cash and cash equivalents +6.5 +36.0 -29.5
• The positive change in NWC in 2013 was due to the new Uponor Infra units entering the Group at high season
• Gross CAPEX at €35.7m, at depreciation level (€36.0m). Capital was allocated to new pipe technology in Building Solutions – Europe and capacity expansions in Building Solutions – North America
16

12 February 2015
January – December 2014 Capital structure development
Financial statements 2014
Average gearing across quarters at 45.8, down from 57.9 in 2013 and in line with the long-term target between 30 and 70
17
12 February 2015
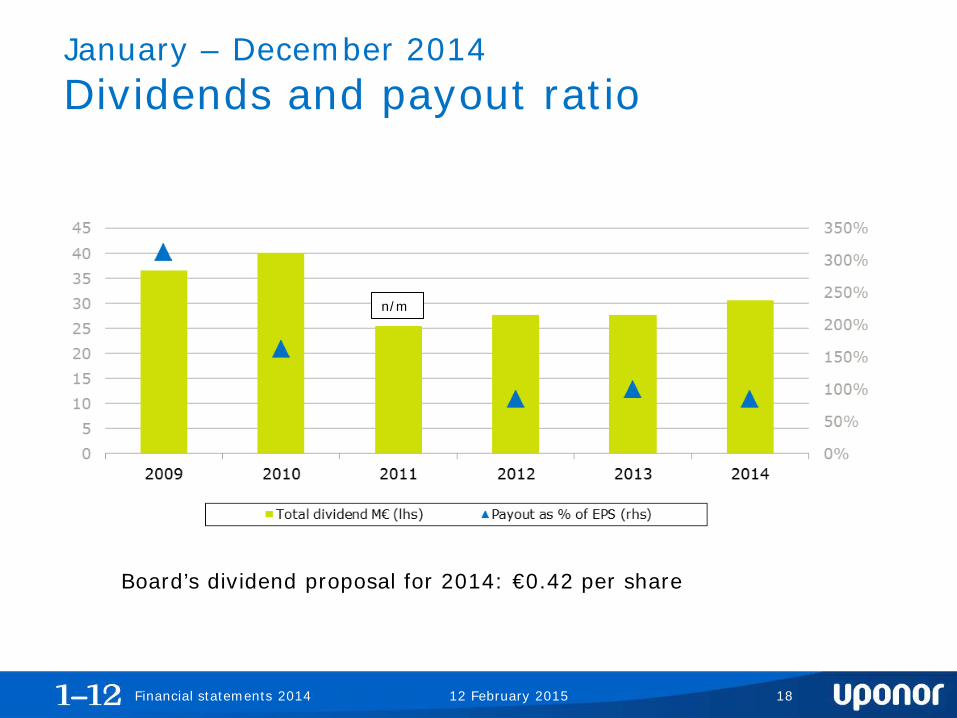
January – December 2014 Dividends and payout ratio
Board’s dividend proposal for 2014: €0.42 per share
18 Financial statements 2014
n/m
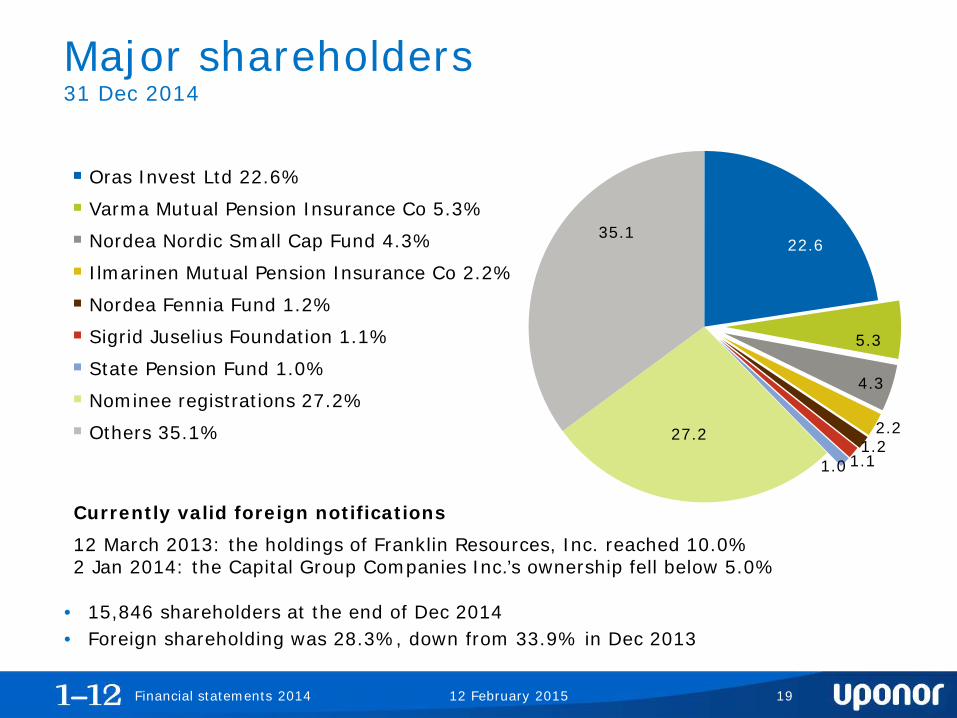
• 15,846 shareholders at the end of Dec 2014 • Foreign shareholding was 28.3%, down from 33.9% in Dec 2013
5.3
2.2 1.2
1.1
35.1 22.6
27.2
Oras Invest Ltd 22.6%
Varma Mutual Pension Insurance Co 5.3%
Sigrid Juselius Foundation 1.1%
Nordea Nordic Small Cap Fund 4.3%
Nordea Fennia Fund 1.2%
Ilmarinen Mutual Pension Insurance Co 2.2%
Nominee registrations 27.2%
Others 35.1%
State Pension Fund 1.0% 4.3
1.0
Major shareholders 31 Dec 2014
Currently valid foreign notifications
12 March 2013: the holdings of Franklin Resources, Inc. reached 10.0% 2 Jan 2014: the Capital Group Companies Inc.’s ownership fell below 5.0%
12 February 2015 19 Financial statements 2014
Outlook for the future Jyri Luomakoski President and CEO Uponor Corporation
The Weholite ‘infra tunnel’ in a new city district in Linköping, Sweden collects pipes and cables in one easy-to-maintain tunnel

Leading indicators in major markets
12 February 2015
Indicator % change YTD
Data through
Trend since Q3 update
USA Housing starts1) +5% December 2014
Germany Housing permits +4% November 2014
Finland Housing starts -21% October 2014
Sweden Housing starts +23% September 2014
Canada Housing starts1) -3% December 2014
Denmark Housing starts +12% September 2014
UK Housing starts2) +15% September 2014
Norway Housing permits -10% December 2014
Netherlands Housing permits +45% October 2014
Russia Construction output -5% November 2014
1) Seasonally adjusted, annualised rate vs. same month in 2013; 2) England only
Financial statements 2014 21

Strategic agenda for the future
12 February 2015 Financial statements 2014
• Uponor has focussed considerable effort in recent years on strengthening its foothold in key markets ― intensifying partnerships in the value chain ― enhancing the product and services offering in order to fulfil the
diversified needs of customers and partners ― further expanding towards a more sustainable building industry
• Internal strengthening ― customer service ― new offering development ― supply chain and distribution ― environmental footprint
• Investment in platforms for future growth ― securing supply and customer service capacity in growing markets,
such as North America ― ensuring the optimal allocation of resources in areas that enable short
and long term growth ― at the same time, a sharp eye on focus, cost-efficiency and cash flow
22

Uponor’s guidance for 2015 The Group’s net sales and operating profit (excluding any non-recurring items) are expected to improve from 2014
Guidance for 2015
12 February 2015
• The economic outlook in Uponor’s key markets is likely to remain twofold in 2015: ― demand for building solutions is expected to remain lively in North
America ― Europe is expected to remain flat, although supported by growing
confidence in a gradual revival of the European economy • The scenario is subject to risks, some of which are geopolitical
• Assuming that no major risks materialise, Uponor issues the following guidance for 2015:
Financial statements 2014 23

The text may contain forward-looking statements, which are based on the present business scope and the management’s present expectations and beliefs about the future. The actual result may differ materially from such statements.
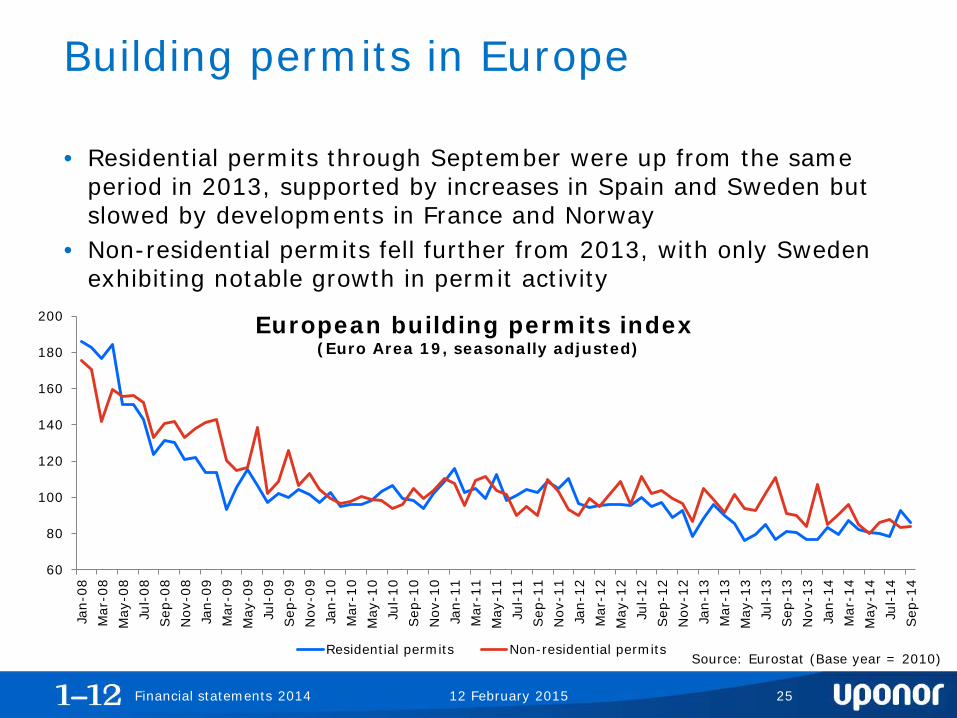
Building permits in Europe
• Residential permits through September were up from the same period in 2013, supported by increases in Spain and Sweden but slowed by developments in France and Norway
• Non-residential permits fell further from 2013, with only Sweden exhibiting notable growth in permit activity
60
80
100
120
140
160
180
200
Jan-
08M
ar-0
8M
ay-0
8Ju
l-08
Sep
-08
Nov
-08
Jan-
09M
ar-0
9M
ay-0
9Ju
l-09
Sep
-09
Nov
-09
Jan-
10M
ar-1
0M
ay-1
0Ju
l-10
Sep
-10
Nov
-10
Jan-
11M
ar-1
1M
ay-1
1Ju
l-11
Sep
-11
Nov
-11
Jan-
12M
ar-1
2M
ay-1
2Ju
l-12
Sep
-12
Nov
-12
Jan-
13M
ar-1
3M
ay-1
3Ju
l-13
Sep
-13
Nov
-13
Jan-
14M
ar-1
4M
ay-1
4Ju
l-14
Sep
-14
Residential permits Non-residential permitsSource: Eurostat (Base year = 2010)
European building permits index (Euro Area 19, seasonally adjusted)
12 February 2015 Financial statements 2014 25
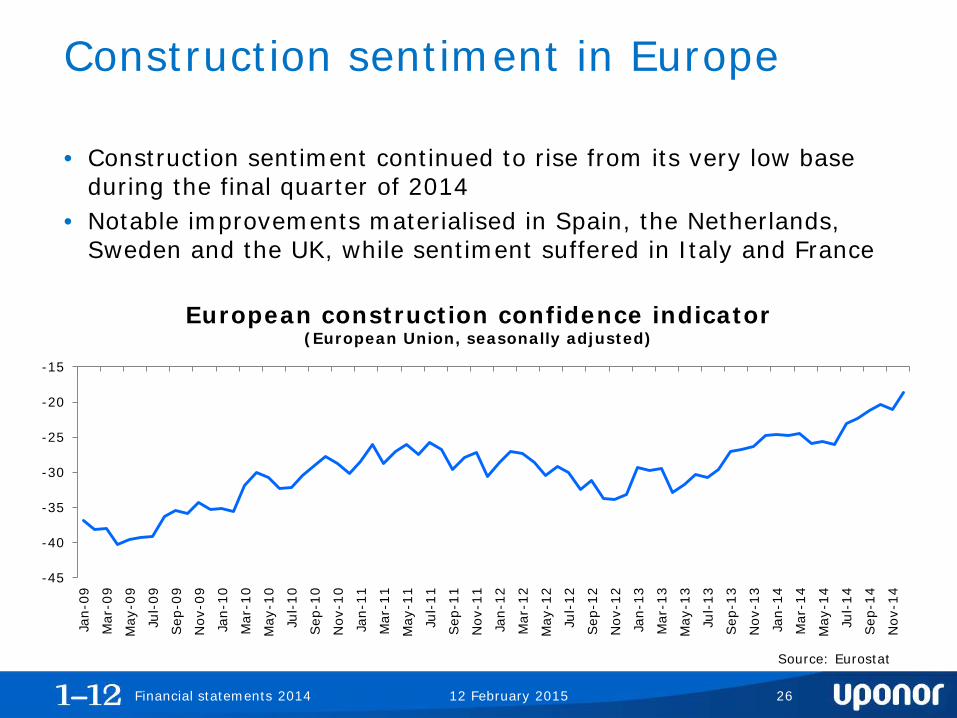
Construction sentiment in Europe
• Construction sentiment continued to rise from its very low base during the final quarter of 2014
• Notable improvements materialised in Spain, the Netherlands, Sweden and the UK, while sentiment suffered in Italy and France
European construction confidence indicator (European Union, seasonally adjusted)
Source: Eurostat
-45
-40
-35
-30
-25
-20
-15
Jan-
09
Mar
-09
May
-09
Jul-
09
Sep
-09
Nov
-09
Jan-
10
Mar
-10
May
-10
Jul-
10
Sep
-10
Nov
-10
Jan-
11
Mar
-11
May
-11
Jul-
11
Sep
-11
Nov
-11
Jan-
12
Mar
-12
May
-12
Jul-
12
Sep
-12
Nov
-12
Jan-
13
Mar
-13
May
-13
Jul-
13
Sep
-13
Nov
-13
Jan-
14
Mar
-14
May
-14
Jul-
14
Sep
-14
Nov
-14
12 February 2015 Financial statements 2014 26
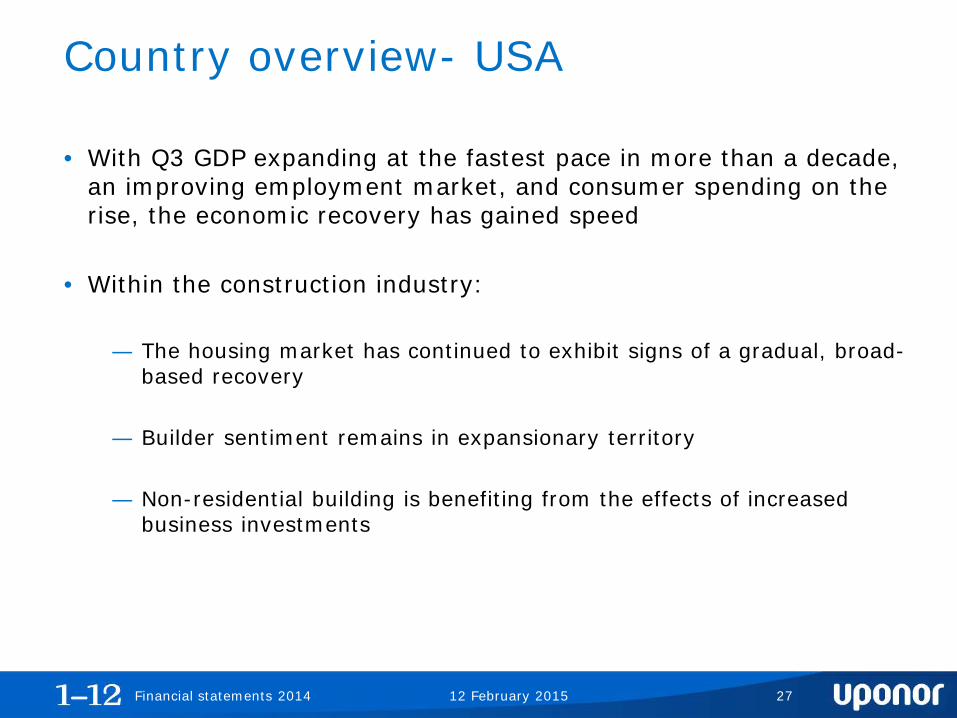
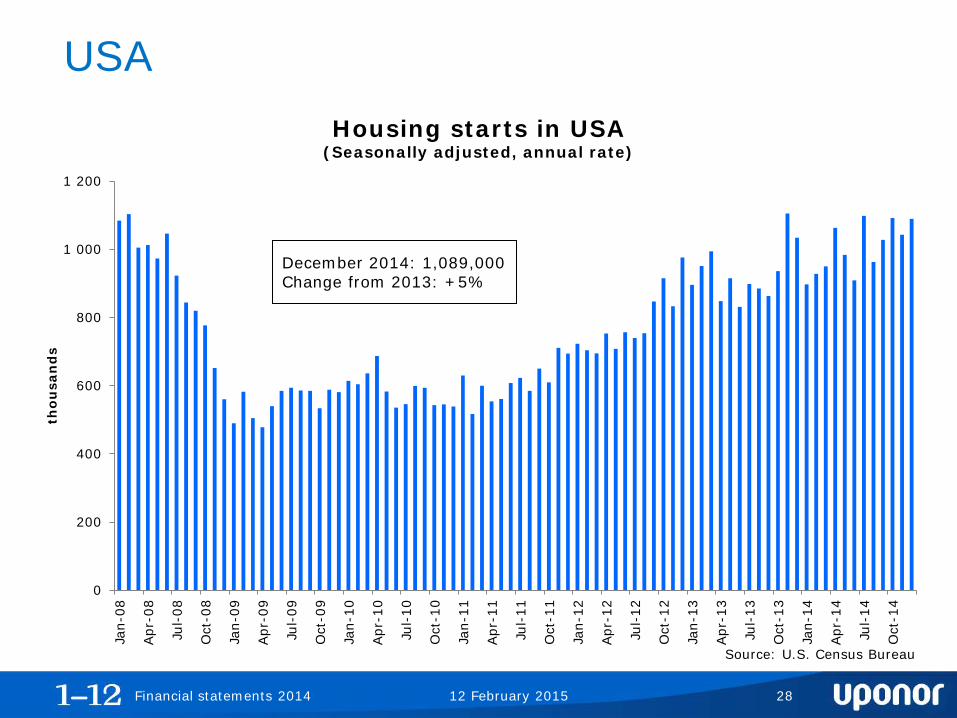
Country overview- USA
• With Q3 GDP expanding at the fastest pace in more than a decade, an improving employment market, and consumer spending on the rise, the economic recovery has gained speed
• Within the construction industry: ― The housing market has continued to exhibit signs of a gradual, broad-
based recovery
― Builder sentiment remains in expansionary territory
― Non-residential building is benefiting from the effects of increased business investments
12 February 2015 Financial statements 2014 27
0
200
400
600
800
1 000
1 200
Jan-
08
Apr
-08
Jul-
08
Oct
-08
Jan-
09
Apr
-09
Jul-
09
Oct
-09
Jan-
10
Apr
-10
Jul-
10
Oct
-10
Jan-
11
Apr
-11
Jul-
11
Oct
-11
Jan-
12
Apr
-12
Jul-
12
Oct
-12
Jan-
13
Apr
-13
Jul-
13
Oct
-13
Jan-
14
Apr
-14
Jul-
14
Oct
-14
thou
san
ds
USA
December 2014: 1,089,000 Change from 2013: +5%
Housing starts in USA (Seasonally adjusted, annual rate)
Source: U.S. Census Bureau
12 February 2015 Financial statements 2014 28

Country overview- Germany
• Softening demand from the rest of the Eurozone has weakened industrial activity, but consumer spending and a strong employment market appear to be supporting economic growth
• Within the construction industry: ― Construction sentiment has fallen since earlier in the year, but remains
at a good level
― Residential construction continues to outperform the non-residential segment
― The growth rates witnessed earlier in the year have slowed significantly
12 February 2015 Financial statements 2014 29
100 000
120 000
140 000
160 000
180 000
200 000
220 000
240 000
260 000
8 000
10 000
12 000
14 000
16 000
18 000
20 000
22 000
24 000
26 000
28 000Ja
n-08
Apr
-08
Jul-
08
Oct
-08
Jan-
09
Apr
-09
Jul-
09
Oct
-09
Jan-
10
Apr
-10
Jul-
10
Oct
-10
Jan-
11
Apr
-11
Jul-
11
Oct
-11
Jan-
12
Apr
-12
Jul-
12
Oct
-12
Jan-
13
Apr
-13
Jul-
13
Oct
-13
Jan-
14
Apr
-14
Jul-
14
Oct
-14
rolli
ng
12
-mon
th t
otal
mon
thly
am
oun
t
Monthly (lhs) Rolling 12-month total (rhs)
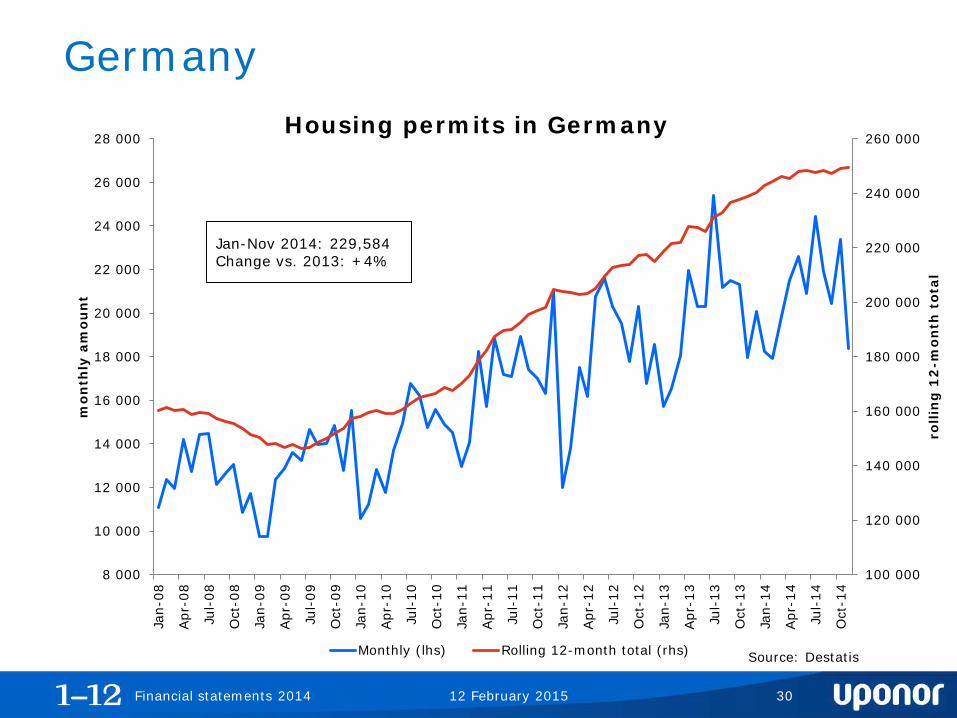
Germany Housing permits in Germany
Jan-Nov 2014: 229,584 Change vs. 2013: +4%
Source: Destatis
12 February 2015 Financial statements 2014 30
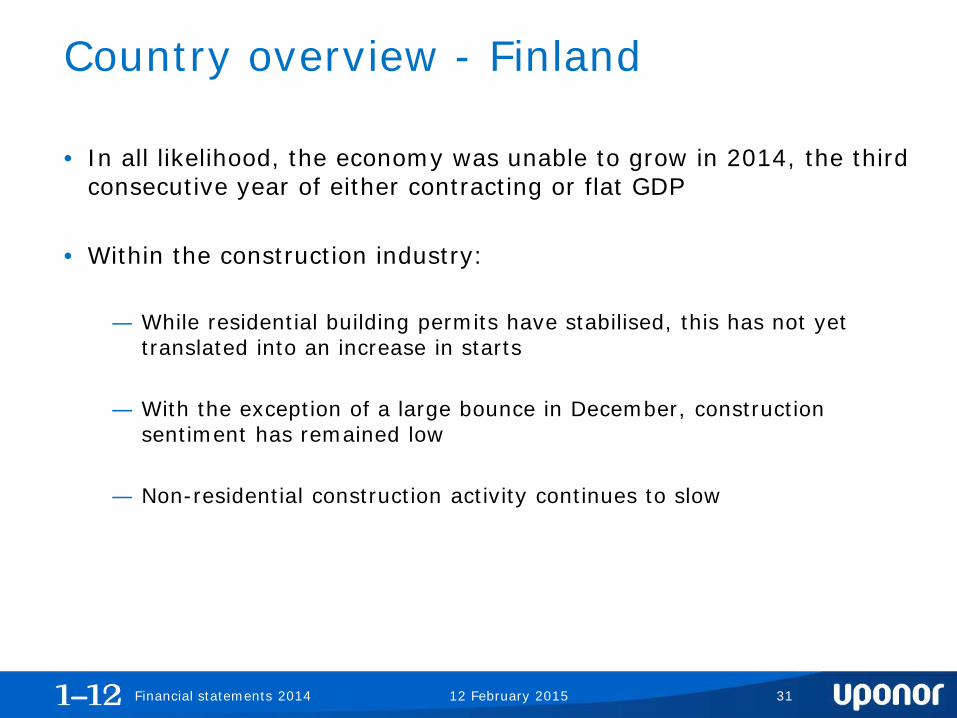
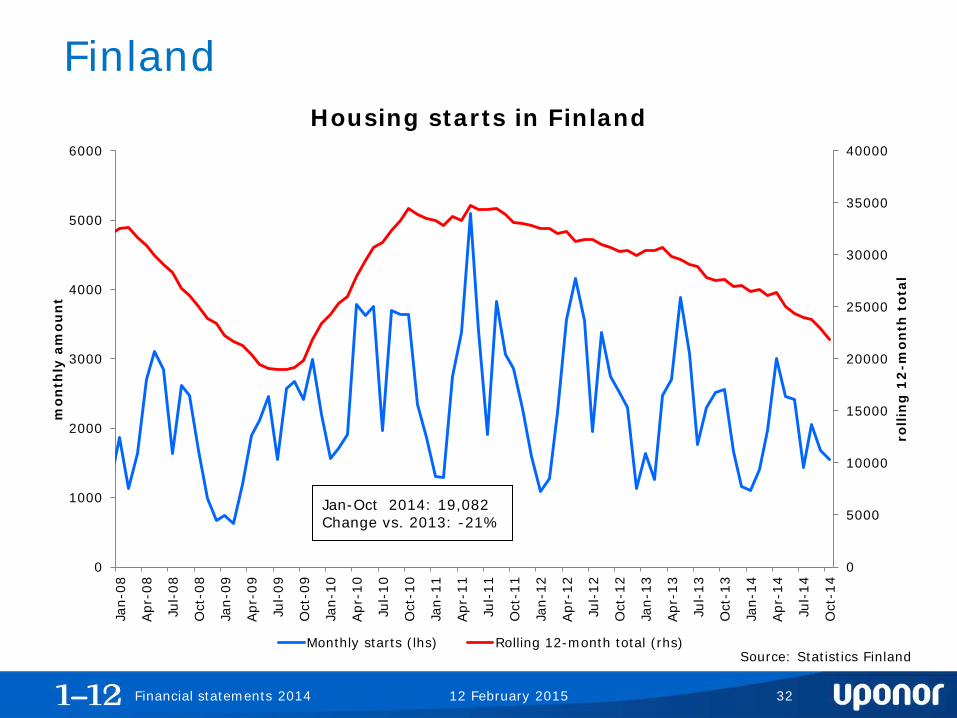
Country overview - Finland
• In all likelihood, the economy was unable to grow in 2014, the third consecutive year of either contracting or flat GDP
• Within the construction industry: ― While residential building permits have stabilised, this has not yet
translated into an increase in starts
― With the exception of a large bounce in December, construction sentiment has remained low
― Non-residential construction activity continues to slow
12 February 2015 Financial statements 2014 31
0
5000
10000
15000
20000
25000
30000
35000
40000
0
1000
2000
3000
4000
5000
6000
Jan-
08
Apr
-08
Jul-
08
Oct
-08
Jan-
09
Apr
-09
Jul-
09
Oct
-09
Jan-
10
Apr
-10
Jul-
10
Oct
-10
Jan-
11
Apr
-11
Jul-
11
Oct
-11
Jan-
12
Apr
-12
Jul-
12
Oct
-12
Jan-
13
Apr
-13
Jul-
13
Oct
-13
Jan-
14
Apr
-14
Jul-
14
Oct
-14
rolli
ng
12
-mon
th t
otal
mon
thly
am
oun
t
Monthly starts (lhs) Rolling 12-month total (rhs)
Finland
Source: Statistics Finland
Housing starts in Finland
Jan-Oct 2014: 19,082 Change vs. 2013: -21%
12 February 2015 Financial statements 2014 32
Country overview- Sweden
• While weakening demand from abroad has negatively impacted exports, the economy continues to expand at a healthy pace
• Within the construction industry: ― Sentiment within the industry remained positive throughout the final
months of the year
― Housing starts have continued to rise and are well above average levels
― The non-residential and civil engineering segments are both robust
12 February 2015 Financial statements 2014 33
Sweden Housing starts in Sweden
Source: Statistics Sweden
0
5 000
10 000
15 000
20 000
25 000
30 000
35 000
40 000
0
2 000
4 000
6 000
8 000
10 000
12 000
Q1 Q2 Q3 Q4 Q1 Q2 Q3 Q4 Q1 Q2 Q3 Q4 Q1 Q2 Q3 Q4 Q1 Q2 Q3 Q4 Q1 Q2 Q3 Q4 Q1 Q2 Q3
2008 2009 2010 2011 2012 2013 2014
rolli
ng
4-q
uar
ter
tota
l
qu
arte
rly
amo
un
t
Quarterly (lhs) Rolling 4-quarter total (rhs)
Q1-Q3 2014: 25,900 Change vs. 2013: +23%
12 February 2015 Financial statements 2014 34

0
50
100
150
200
250
300
Jan-
08M
ar-0
8M
ay-0
8Ju
l-08
Sep
-08
Nov
-08
Jan-
09M
ar-0
9M
ay-0
9Ju
l-09
Sep
-09
Nov
-09
Jan-
10M
ar-1
0M
ay-1
0Ju
l-10
Sep
-10
Nov
-10
Jan-
11M
ar-1
1M
ay-1
1Ju
l-11
Sep
-11
Nov
-11
Jan-
12M
ar-1
2M
ay-1
2Ju
l-12
Sep
-12
Nov
-12
Jan-
13M
ar-1
3M
ay-1
3Ju
l-13
Sep
-13
Nov
-13
Jan-
14M
ar-1
4M
ay-1
4Ju
l-14
Sep
-14
Nov
-14
thou
san
ds
Canada
Source: CMHC/ Statistics Canada
Housing starts in Canada (Seasonally adjusted, annual rate)
Dec 2014: 180560 Change vs. 2013: -3%
12 February 2015 Financial statements 2014 35

0
5 000
10 000
15 000
20 000
25 000
30 000
0
500
1 000
1 500
2 000
2 500
3 000
3 500
4 000
Jan-
08
Apr
-08
Jul-
08
Oct
-08
Jan-
09
Apr
-09
Jul-
09
Oct
-09
Jan-
10
Apr
-10
Jul-
10
Oct
-10
Jan-
11
Apr
-11
Jul-
11
Oct
-11
Jan-
12
Apr
-12
Jul-
12
Oct
-12
Jan-
13
Apr
-13
Jul-
13
Oct
-13
Jan-
14
Apr
-14
Jul-
14
rolli
ng
12
-mon
th t
otal
mon
thly
am
oun
t
Monthly (lhs) Rolling 12-month total (rhs)
Denmark Housing starts in Denmark
(Seasonally adjusted)
Source: Statistics Denmark
Jan-Sept 2014: 8,553 Change vs. 2013: +12%
12 February 2015 Financial statements 2014 36

0
5 000
10 000
15 000
20 000
25 000
30 000
35 000
0
500
1 000
1 500
2 000
2 500
3 000
3 500
Jan-
08
Apr
-08
Jul-
08
Oct
-08
Jan-
09
Apr
-09
Jul-
09
Oct
-09
Jan-
10
Apr
-10
Jul-
10
Oct
-10
Jan-
11
Apr
-11
Jul-
11
Oct
-11
Jan-
12
Apr
-12
Jul-
12
Oct
-12
Jan-
13
Apr
-13
Jul-
13
Oct
-13
Jan-
14
Apr
-14
Jul-
14
Oct
-14
rolli
ng
12
-mon
th t
otal
mon
thly
am
oun
t
Monthly (lhs) Rolling 12-month total (rhs)
Norway Housing permits in Norway
Source: Statistics Norway
Jan-Dec 2014: 27,130 Change vs. 2013: -10%
12 February 2015 Financial statements 2014 37