
Financial Stability Review - Europa
173
Financial Stability Review May 2015
Transcript of Financial Stability Review - Europa

Financial Stability Review
May 2015

Contents
Foreword 4
Overview 5
1 Macro-financial and credit environment 16
1.1 Euro area recovery regaining momentum 16
Box 1 Accommodative monetary policy and euro area financial stability 19
Box 2 Lower oil prices and their implications for financial stability in the euro area 27
1.2 Benign sovereign financing conditions, but underlying vulnerabilities remain 30
1.3 Improving financing conditions in the non-financial private sector underpin decreasing fragmentation 34
Box 3 Statistical valuation metrics for residential property markets 44
2 Financial markets 47
2.1 Money market rates hit historical lows as country fragmentation declines 47
2.2 Despite an uptick in volatility, bond yields remain low and equity prices are higher 49
Box 4 Commonality of bid-ask spreads in euro area bond markets 51
3 Euro area financial institutions 59
3.1 Banking and insurance sector face several challenges, while expansion in activity outside the regulatory perimeter continues 60
Box 5 Measuring the cost of bank equity in the euro area 61
Box 6 Evaluating the drivers of forbearance and underprovisioning 66
Box 7 Synthetic leverage in the investment fund sector 92
3.2 Assessing the resilience of euro area financial institutions through scenario analysis 99
Box 8 Measuring the propagation of macro-financial shocks at the level of individual euro area financial institutions 107
3.3 Continued progress in regulatory and macroprudential policy implementation 112

Financial Stability Review, May 2015 3
Special features 124
A A framework for analysing and assessing cross-border spillovers from macroprudential policies 124
B Bank profitability challenges in euro area banks: the role of cyclical and structural factors 134
C Resolving the legacy of non-performing exposures in euro area banks 146
Statistical annex 155
Abbreviations 172

Financial Stability Review, May 2015 4
Foreword
The Financial Stability Review (FSR) reviews developments relevant for financial stability, in addition to identifying and prioritising main risks and vulnerabilities for the euro area financial sector. It does so to promote awareness of these risks among policy-makers, the financial industry and the public at large, with the ultimate goal of promoting financial stability. The ECB defines financial stability as a condition in which the financial system – intermediaries, markets and market infrastructures – can withstand shocks without major disruption in financial intermediation and in the effective allocation of savings to productive investment.
The FSR also plays an important role in the ECB’s new macroprudential and microprudential tasks. With the establishment of the Single Supervisory Mechanism (SSM), the ECB was entrusted with the macroprudential tasks and tools provided for under EU law. The FSR, by providing a financial system-wide assessment of risks and vulnerabilities, provides key input to the ECB’s macroprudential policy analysis. Such a euro area system-wide dimension is an important complement to microprudential banking supervision, which is more focused on the soundness of individual institutions. At the same time, whereas the ECB’s new roles in the macroprudential and microprudential realms rely primarily on banking sector instruments, the FSR continues to focus on risks and vulnerabilities of the financial system at large, including – in addition to banks – shadow banking activities including non-bank financial intermediaries, financial markets and market infrastructures.
In addition to its usual overview of current developments relevant for euro area financial stability, this Review includes eight boxes and three special features aimed at deepening the ECB’s financial stability analysis and basis for macroprudential policy-making. A first special feature presents a framework for evaluating cross-border spillover channels stemming from implemented macroprudential measures. A second examines the main drivers of euro area banks’ profitability over the last years, including bank-specific, industry-specific, macroeconomic and various structural factors. A third outlines issues related to non-performing exposures in the euro area banking system and their prospective resolution.
The Review has been prepared with the involvement of the ESCB/SSM Financial Stability Committee. This committee assists the decision-making bodies of the ECB, including the Supervisory Board, in the fulfilment of their tasks.
Vítor Constâncio Vice-President of the European Central Bank

Financial Stability Review, May 2015 5
Overview
Euro area financial system stress has remained low over the past six months, despite a certain increase in global financial market volatility. Broad-based indicators of financial market and banking system risk have generally fluctuated at low levels and stood in mid-May around the marks observed before the outbreak of the sovereign debt crisis (see Chart 1). The low overall level of financial system stress in the euro area reflected an improving real economic outlook supported by ECB action allaying deflation fears that threatened to be harmful to both price and financial stability. Notwithstanding the generally positive financial market sentiment, intermittent bouts of market tension have continued to afflict global financial markets – spanning foreign exchange, commodities and, most recently, bonds. The recurrent incidence and amplitude of such bouts of market tension have suggested a tendency for pronounced sharp asset price sensitivity to investor sentiment.
Euro area financial and economic indicators continue to signal a stark dichotomy in risk-taking (see Chart 2). The prices of financial assets in most segments have continued to rise, not only in the euro area, but also in most advanced economies. The sharp increases in asset prices relative to the fundamentals have pushed valuations up, particularly in the fixed income market, but increasingly also in markets for other financial assets. Nonetheless, a broad-based stretch in euro area asset valuations is not evident. Moreover, the recent increases in asset prices have been accompanied neither by growing leverage in the banking sector nor by rapid private sector credit expansion.
In sharp contrast to the rise in financial risk-taking, economic risk-taking in the euro area is clearly lagging. This is vividly illustrated by the contrast between appreciating financial asset prices and a low level of real investment, which still remains below that of 2008, after a much more marked fall than those seen after previous recessions. Indeed, the prospect of an environment of low nominal growth remains the major factor underlying current challenges for financial
Chart 1 Low levels of euro area financial market, sovereign and bank stress
Composite indicators of systemic stress in financial markets and sovereign bond markets, and the probability of default of two or more banking groups (Jan. 2011 – May 2015)
Sources: Bloomberg and ECB calculations. Notes: “Probability of default of two or more LCBGs” refers to the probability of simultaneous defaults in the sample of 15 large and complex banking groups (LCBGs) over a one-year horizon.
Chart 2 High financial risk-taking, sovereign yields near zero and subdued credit growth coupled with low economic risk-taking
Euro area sovereign and corporate bond yields, real fixed investment and bank lending to non-financial corporations (Jan. 2008 – Apr. 2015, index: Jan. 2008 = 100, percentages per annum)
Sources: Thomson Reuters Datastream and ECB. Note: The iBoxx euro corporate bond all maturity index is employed.
0.0
0.1
0.2
0.3
0.4
0.5
0.6
0.7
0
4
8
12
16
20
24
28
Jan-11 Jul-11 Jan-12 Jul-12 Jan-13 Jul-13 Jan-14 Jul-14 Jan-15
probability of default of two or more LCBGs (percentageprobability; left-hand scale)
composite indicator of systemic stress in financial markets(right-hand scale)
composite indicator of systemic stress in sovereign bondmarkets (right-hand scale)
Finalisation of the Nov. 2014 FSR
0
1
2
3
4
5
6
7
8
9
40
50
60
70
80
90
100
110
120
130
2008 2009 2010 2011 2012 2013 2014 2015
bank credit to corporatesreal fixed investmentEURO STOXX indexeuro area corporate bond yields (right-hand scale)
Finalisation of the Nov. 2014 FSR

Financial Stability Review, May 2015 6
stability in the euro area. While monetary policy can support the conditions for economic growth, other macroeconomic policies – such as structural reforms – are needed to underpin sustainable economic growth of the euro area.
Financial system vulnerabilities continue to stem not only from the financial markets, but also from financial institutions, spanning banks, insurers and – increasingly – the shadow banking sector. Following the successful completion of the comprehensive assessment exercise, recent financial disclosures suggest that euro area banks’ capital positions have continued to improve, profitability has increased marginally and asset quality deterioration has slowed down. Still, profitability remains weak and the return on equity (ROE) continues to remain below the cost of capital for many banks. Looking ahead, a further reduction of problem assets is needed as high non-performing loans dampen banks’ potential lending capacity and, by extension, their ability to build up capital buffers. Despite the solid profitability reported so far, euro area insurers are facing growing challenges as the low-yield environment has tested their traditional reliance on fixed income assets as a means of generating portfolio returns. Last but not least, the shadow banking sector continues to grow robustly – and is in many ways changing into an important provider of funds to the real economy. As this process has accelerated, the systemic importance of this sector has increased concomitantly. Taken together, the rapid growth of this less regulated sector, the large systemic footprints of a number of entities, a more widespread use of synthetic leverage and the increasing prevalence of demandable equity imply that the potential for systemic impacts is increasing.
Financial stability concerns also stem from outside the realm of the financial sector. Despite much needed improvement in both fiscal settings and the institutional framework since the height of the euro area sovereign debt crisis, debt sustainability challenges remain for euro area sovereigns – especially for those that remain highly indebted and therefore vulnerable to economic and financial shocks. On the side of the non-financial private sector, indebtedness of the euro area corporate sector continues to remain elevated, in contrast to household indebtedness which has fallen slightly and remains low compared with many advanced economy peers.
In this environment, four risks emerge as key for euro area financial stability over the next year and a half (see Table 1). While each risk is tied to a specific scenario, the risks are all clearly intertwined and
would, if they were to materialise, have the potential to be mutually reinforcing. Each risk is tackled in turn below.
Table 1 Key risks to euro area financial stability
pronounced systemic risk medium-level systemic risk potential systemic risk
Current level (colour) and
recent change (arrow)*
1. Abrupt reversal of compressed global risk premia amplified by low secondary market liquidity
2. Weak profitability prospects for banks and insurers in a low nominal growth environment, amid slow progress in resolving problem assets
3. Rise of debt sustainability concerns in the sovereign and corporate sectors amid low nominal growth
4. Prospective stress and contagion effects in a rapidly growing shadow banking sector
* The colour indicates the cumulated level of risk, which is a combination of the probability of materialisation and an estimate of the likely systemic impact of the identified risk over the next year and a half, based on the judgement of the ECB’s staff. The arrows indicate whether the risk has increased since the previous FSR.

Financial Stability Review, May 2015 7
Risk 1: Abrupt reversal of compressed global risk premia amplified by low secondary market liquidity
Asset prices in the financial markets of most advanced economies have increased further as global risk-free rates remain low and risk premia have fallen further. In the euro area, sovereign bond yields across the entire maturity spectrum fell to historical lows and, in some cases, even entered into negative territory. Corporate bond markets have also benefited from the buoyant market sentiment. Fragmentation has eased, maturities have lengthened, yields have declined across most rating buckets and credit spreads have narrowed. However, while risk appetite among global investors has clearly increased, discrimination persists with respect to lower credit quality within the high-yield segment. Similarly, euro area stock prices have risen to multi-year highs amid strong portfolio inflows.
The expanded asset purchase programme launched by the ECB in March has helped to diminish risks to price stability. It has also brought benefits for financial stability in the form of higher nominal growth prospects, which are critical for lowering imbalances and reducing the likelihood of risks materialising in the financial system. Notwithstanding these benefits, unintended negative consequences require close monitoring, especially any possibility of financial risk-taking becoming excessive.
Monetary policy actions of the ECB, both conventional and unconventional, have clearly reduced stress and fragmentation in euro area sovereign bond markets throughout the last years (see Chart 3). In many Member States, long-term bond yields stood at historically low levels in mid-May, and intra-euro area spreads narrowed substantially, also resulting in very low term premia. Clearly, any implied deviation from long-term norms might very well prove to be transitory, so that it is important that investors have sufficient buffers and/or hedges to cope with any prospective normalisation of yields over the years ahead, either from global or from euro area-specific changes in financial risk sentiment.
Apart from the direct impact of ECB purchases on sovereign bonds, portfolio rebalancing effects extending to other asset classes have been visible as well. In particular, euro area stock prices have
Chart 3 Marked fall in bond yields during the recent phase of monetary easing
ECB’s main refinancing rate and the developments in sovereign bond yields for euro area countries (Jan. 1999 – Apr. 2015; percentages; yellow area represents the 25th-75th percentile)
Sources: Thomson Reuters Datastream and ECB calculations. Note: The grey areas refer to the periods from April 2001 to June 2003, from September 2008 to May 2009 and from October 2011 to April 2015.
Chart 4 Stock prices broadly in line with fundamentals in the euro area, valuations somewhat stretched for US stock prices
Cyclically adjusted price/earnings (CAPE) ratios for the euro area and the United States (Jan. 1983 – May 2015; yellow area represents the 25th-75th percentile)
Sources: Thomson Reuters Datastream and Robert Shiller’s homepage. (http://www.econ.yale.edu/~shiller/data.htm) and ECB calculations. Notes: The cyclically adjusted price/earnings ratios for the euro area are imputed from Datastream’s stock market indices. The US CAPE is taken from Robert Shiller’s homepage.
0
1
2
3
4
5
6
7
8
1999 2001 2003 2005 2007 2009 2011 2013 2015
developments in euro area sovereign bond yields during monetarypolicy easing
ECB’s main refinancing rate
0
10
20
30
40
50
60
1983 1985 1987 1990 1992 1995 1997 1999 2002 2004 2007 2009 2012 2014
euro area CAPEUS CAPE

Financial Stability Review, May 2015 8
continued to increase rapidly. Standard valuation metrics suggest that deviations with respect to historical norms have been limited, remaining below the somewhat elevated stock market valuations prevailing in the United States (see Chart 4). In the field of tangible assets, the recovery of euro area residential and commercial property markets has continued and is becoming more broad-based across countries. Valuation metrics for the euro area as a whole suggest that residential property prices are broadly in line with fundamentals, but moved further away from their long-term average for prime commercial property given continued strong price increases.
Amid some signs of compressed risk premia, the risk of relatively low market liquidity becoming a potential amplifier of stress remains. Broad market liquidity measures for secondary fixed income markets indicate a deterioration of conditions. While bid-ask spreads have fallen considerably from their crisis peaks, turnover ratios show a steady decline across most market segments and the average deal size traded on the largest inter-dealer trading system for euro area government bonds has fallen sharply. Complementing these data-based signals, market intelligence also indicates reduced confidence among large banks with respect to their ability to make markets during periods of stress.
Two main triggers can be identified that could reverse the current favourable market conditions in the euro area. First, yields on longer-dated bonds remain vulnerable to an increase in global benchmarks for term premia, notably those in the United States. In particular, a faster than expected withdrawal of US monetary policy accommodation harbours some potential to translate into higher risk premia, even in the euro area. Second, global investor sentiment continues to remain sensitive to changes in the economic outlook, geopolitical tensions and emerging market risks, notably related to the BRIC countries (Brazil, Russia, India and China) that had operated as a key driver of global economic growth in the last few years.
Any possible emergence of country, sector and institution-specific challenges would call for the activation of macroprudential policies, as monetary policy retains a necessary focus on price stability.
Risk 2: Weak profitability prospects for banks and insurers in a low nominal growth environment, amid slow progress in resolving problem assets
Euro area banks continue to be challenged by relatively weak profitability. Although profitability improved somewhat, on average, in 2014, thanks to lower funding costs and a moderate decline in loan loss provisions, euro area banks continue to lag behind most US peers and European banks outside the euro area. Subdued profitability prevailing over the past few years has been driven by a confluence of factors, including bank-specific characteristics, banking sector structures and cyclical developments.
The profitability of euro area banks remains characterised by substantial cross-country heterogeneity. The sharp fall in output and demand in some more vulnerable euro area countries at the height of the sovereign debt crisis and the still fragile

Financial Stability Review, May 2015 9
recovery continue to weigh on asset quality and dampen profitability – contrasting with the situation in other euro area countries (see Chart 5 and Chart 6). One striking difference between the two groups is the development of non-performing loans (NPLs). In more vulnerable countries, the stock of NPLs remained high during the crisis, and a clear cyclical turning point has not yet been reached. In other euro area countries, the share of NPLs in total loans is significantly lower, and has even declined slightly over the past two years.
Chart 6 …while the cyclical downturn in certain countries has contributed to a high outstanding stock of non-performing assets
Return on equity (ROE), non-performing loans (NPLs) and GDP growth for vulnerable countries during the crisis (2006-2014; annual percentage changes (GDP); median NPLs as a share of total loans, median ROE)
Sources: SNL Financial, Eurostat and ECB calculations. Note: Vulnerable euro area countries include Spain, Italy, Portugal, Greece, Cyprus and Slovenia.
Euro area banks’ profitability will benefit from the ECB’s expanded asset purchase programme as it supports nominal growth, improves asset valuations and effectively rules out debt deflation. These benefits notwithstanding, net interest margins are expected to remain under pressure as a result of the low interest rate environment and flattening yield curves. Bank profitability might therefore be squeezed further if banks cannot compensate for this by increasing loan volumes and/or reducing credit risk.
Weak profitability has meant that the return on equity for many euro area banks has remained below the cost of equity. Over the past six months, however, the gap between actual and required returns has narrowed somewhat, driven both by a slightly lower cost of equity and by the modest improvement in profitability (see Chart 7). Somewhat higher confidence with respect to the outlook for euro area banks is also confirmed by the slight increase in overall price-to-book ratios (see Chart 8). This somewhat more optimistic assessment is probably linked to the higher transparency regarding banks’ financial conditions provided by the ECB’s comprehensive assessment, which revealed only limited capital shortfalls among
-6
-4
-2
0
2
4
6
-20
-15
-10
-5
0
5
10
15
20
2006 2007 2008 2009 2010 2011 2012 2013 2014
NPLs (left-hand scale)ROE (left-hand scale)GDP (right-hand scale)
Chart 5 Non-performing loans broadly stable in the majority of euro area countries…
Return on equity (ROE), non-performing loans (NPLs) and GDP growth in non-vulnerable countries (2006-2014; annual percentage changes (GDP); median NPLs as a share of total loans, median ROE)
Sources: SNL Financial, Eurostat and ECB calculations. Note: Euro area countries excluding Spain, Italy, Portugal, Greece, Cyprus and Slovenia.
-6
-4
-2
0
2
4
6
-20
-15
-10
-5
0
5
10
15
20
2006 2007 2008 2009 2010 2011 2012 2013 2014
NPLs (left-hand scale)ROE (left-hand scale)GDP (right-hand scale)

Financial Stability Review, May 2015 10
euro area banks. This notwithstanding, valuation levels are still far from those prevailing prior to the crisis and euro area banks trade at a significant discount relative to their US peers. The still substantial risk premia investors demand for holding euro area bank securities mainly reflect uncertainties regarding banks’ expected future cash flows, but also structural factors such as possible litigation costs and some reservations about banks’ ability to cope with new, stricter regulatory requirements. Challenges in meeting investors’ required returns – as expressed by the cost of equity (COE) – may cause banks to face restraints when attempting to raise new equity, which in turn hampers their ability to extend credit to the real economy.
Chart 8 Slightly higher valuations of euro area banks in 2015, but they still trade at a discount vis-à-vis their US peers
Price-to-book ratio for euro area and US banks (Jan. 2007– May 2015, grey area represents the difference between the United States and the euro area)
Source: Thomson Reuters Datastream.
A continuing legacy from the sovereign debt crisis is a large and, in some countries, still increasing stock of non-performing loans. Further progress in removing impediments to the supply of bank credit – including faster NPL resolution – is necessary to improve credit conditions, which should be also supported by the ECB’s targeted monetary policy measures. The resolution of systemic NPL problems requires a comprehensive strategy that encompasses necessary improvements in the operational environment and the selection of appropriate resolution strategies. In this respect, it can be concluded that tailored approaches – based on a thorough understanding of the country-specific dimensions of the NPL problem – that are driven as much as possible by the private sector may be most appropriate. The efforts to resolve the stocks of NPLs in parts of the euro area should be carefully designed so as to avoid an undue negative impact on bank capitalisation and to minimise moral hazard.
-0.5
0.0
0.5
1.0
1.5
2.0
2.5
3.0
2007 2008 2009 2010 2011 2012 2013 2014 2015
euro areaUnited States
Chart 7 Still substantial gap between euro area banks’ cost of equity and the return on equity
Cost of equity (COE) and return on equity (ROE) for a large sample of listed euro area banks (Q1 1999 – Q4 2014, percentages)
Sources: Bloomberg, Thomson Reuters Datastream, Consensus Economics and ECB calculations. Note: Based on the sample of 33 euro area banks included in the EURO STOXX index.
-20
-15
-10
-5
0
5
10
15
20
25
1999 2001 2003 2005 2007 2009 2011 2013
interquartile range ROE interquartile range COE median ROE median COE

Financial Stability Review, May 2015 11
While the comprehensive assessment ensured that significant banks in the euro area have sufficient capital levels, progress needs to continue in parts of the banking system to address remaining fragilities and uncertainties. While efforts to adjust business models continue, further measures need to be taken by banks to restore sustainable profitability. The actions required are likely to differ across banks or national banking sectors depending, for instance, on the size and complexity of institutions or on the structural features of the banking sector in question. With regard to the first aspect, several banks are endeavouring to streamline their business models by refocusing on activities where they have both sufficient economies of scale and better profit margins. In addition, there are signs that overcapacity in, or a high fragmentation of, certain banking markets could hinder the recovery of profitability, suggesting that consolidation could bring some benefits for profitability, at least in some parts of the euro area banking sector.
The prevailing low-yield environment also poses challenges for the insurance sector. A prolonged period of low interest rates can dampen both investment income and the profitability of new policies sold. This is particularly relevant for those entities seeking sustained portfolio returns to match their liabilities, with limited scope for portfolio diversification (either geographical or across asset classes). In this vein, such market conditions pose a significant challenge for some insurance companies’ profitability in the medium term, with the potential to erode capital positions in the long run. The impact of the low interest rate environment is particularly relevant for those life insurers that have locked in high return guarantees and have large asset/liability duration gaps.
Risk 3: Rise of debt sustainability concerns in the sovereign and corporate sectors amid low nominal growth
Debt sustainability in the euro area non-financial sector remains a concern. Although the financial sector has reduced its leverage in the wake of the sovereign debt crisis, the aggregate indebtedness for the remaining sectors of the economy remains high (see Chart 9). Debt sustainability challenges are imminent in the sovereign and non-financial corporate sectors, given a combination of elevated levels of indebtedness, still weak economic growth prospects and the environment of low inflation. At the same time, the cost of issuance and investor appetite on sovereign and non-financial corporate debt markets remain favourable across most euro area countries, while downside risks to economic growth have diminished thanks to recent monetary policy decisions and the lower oil prices.
Chart 9 Euro area debt remains elevated
Euro area debt-to-GDP ratios (households, non-financial corporations and general government) (Q1 2000 – Q4 2014)
Sources: Eurostat and ECB. Notes: Based on ESA 2010 standards, except for general government debt from Q1 2000 to Q4 2005, for which the ESA 1995 has been used. Non-financial corporate debt is unconsolidated, comprising loans (incl. intra-sectoral loans), debt securities and pension reserves. For the household sector, the series ends in Q3 2014. For the remaining series, the last data points are for Q4 2014.
0
20
40
60
80
100
120
2000 2002 2004 2006 2008 2010 2012 2014
non-financial corporationsgeneral governmenthouseholds

Financial Stability Review, May 2015 12
Prevailing financial market conditions clearly provide support for debt servicing capacity. At the same time, fiscal positions remain precarious in some countries. Sovereign risks emanating from Greece, in particular, have increased sharply owing to heightened political uncertainty over the past six months, while the banking sector in Greece has witnessed substantial deposit outflows, a loss of access to the wholesale funding market and deteriorating asset quality. Financial market reactions to the developments in Greece have been muted to date, but in the absence of a quick agreement on structural implementation needs, the risk of an upward adjustment of the risk premia demanded on vulnerable euro area sovereigns could materialise. More broadly, uncertainties relating to sovereign debt sustainability are likely to persist over the medium term as government debt-to-GDP ratios are projected to stay at elevated levels in several countries. At the same time, damaging feedback mechanisms between sovereigns and the banking sector which were at the heart of the euro area strains over the last few years appear less likely to play as destructive a role amid institutional improvements, including notably lowered contingent liabilities from the banking sector through new bail-in tools created by the Bank Recovery and Resolution Directive (BRRD), as well as through the entry into
force of the SRM Regulation.
The ratio of non-financial corporate debt to GDP also remains high, by both historical and international standards (see Chart 10). The pace of deleveraging has been slow, and indebtedness has been hovering well above the levels of past episodes of recession. The weak nominal growth environment and firms’ increased recourse to market-based debt financing in recent years are some of the factors that explain this persistence.
Triggers for the materialisation of risks from high non-financial sector indebtedness are manifold. They could stem from unexpected developments in Greece triggering an adjustment of risk premia, lower than expected domestic nominal growth or a sudden slowdown in global growth prospects. Just as importantly, benign financial market conditions may obscure the urgency of fiscal and structural reforms. If key reforms were to be delayed, a reassessment of sentiment towards euro area sovereigns is possible. Such a reassessment would probably also pose debt sustainability concerns for non-financial firms.
Risk 4: Prospective stress and contagion effects in a rapidly growing shadow banking sector
The investment fund sector has grown rapidly over the past five years. The assets of the sector increased by €4.0 trillion, or more than 70%, between 2009 and 2014 to
Chart 10 Slow deleveraging in the corporate sector
Paths for corporate debt ratios during banking crises and average cycles in 20 advanced economies (percentage of nominal GDP)
Sources: Eurostat, European Commission, IMF and ECB. Notes: In order to ensure cross-country comparability, figures are shown on a fully consolidated basis. Accordingly, corporate debt includes loans net of intra-sectoral loans, debt securities and pension reserves. The dashed dark blue line shows the average profile of corporate debt ratios during five systemic banking crises in advanced economies: Spain in 1977, Norway in 1987, Finland in 1991, Sweden in 1991 and Japan in 1992. In each case, the period T represents the peak in GDP growth. The dashed yellow line shows the mean path for debt ratios across cycles in 20 advanced economies as from the 1970s. The shaded grey area shows the interquartile range of those “normal” cycles. For the euro area and the United States, T represents the peaks in GDP growth in the first quarter of 2008.
20
30
40
50
60
70
80
90
100
110
120
T-8 T T+8 T+16 T+24 T+32 T+40
systemic crises “average” cycleeuro area (current) United States (current)

Financial Stability Review, May 2015 13
reach €9.4 trillion. From a financial stability perspective, concerns about the risks posed by investment funds relate to the implications for the wider financial system and the real economy arising from the sector’s increasing role in credit intermediation and capital markets (see Chart 11). Possible channels of risk contagion and amplification include correlated asset exposures as well as mutual contractual obligations in securities lending and derivatives markets. Concerns are that shadow banking entities could be part of future systemic events, also on account of their increased size and remaining opaqueness.
The greater the leverage, liquidity mismatch and size of certain intermediaries, the more likely they are to amplify shocks and impose externalities on other parts of the financial system, such as those resulting from fire sales of demandable equity. Bond funds have the potentially highest market impact owing to their large size, the significant proportion of illiquid assets they hold on their balance sheets and their somewhat higher leverage in comparison with other investment funds (see Chart 12).
Chart 12 Bond and real estate funds most likely to amplify shocks and impose externalities on the system
Liquidity mismatch and leverage among euro area money market and investment funds (data as of Q4 2014; x-axis: leverage (total assets/shares and units issued); y-axis: liquidity mismatch (shares and units issued/liquid assets))
Sources: ECB and ECB calculations. Note: Bubble size: total assets in EUR trillions.
One of the main vulnerabilities stemming from the investment fund sector is the potential the sector has to amplify liquidity shortages in periods of financial stress. In fact, so-called liquidity spirals could be triggered if funds were to be confronted with high redemptions or increased margin requirements, as these could result in forced selling on markets with low liquidity. With these liquidity conditions, initial asset price adjustments would be amplified, triggering further redemptions and margin calls, thereby fuelling such negative liquidity spirals.
Usage of implicit leverage among investment funds may contribute further to systemic stress. Regardless of the size of underlying cash positions in assets,
Equity funds €2.3 trillion
Bond funds €3.0 trillion
Mixed funds €2.1 trillion
Real estate funds
€0.4 trillion
Hedge funds €0.2 trillion
Other funds €0.5 trillion
MMFs€0.9 trillion
0.0
0.5
1.0
1.5
2.0
2.5
3.0
3.5
4.0
4.5
5.0
1.00 1.10 1.20 1.30
Shar
es is
sued
to li
quid
ass
ets
Leverage
Chart 11 Steady increase in the euro area shadow banking sector suggests that vulnerabilities are likely to have been growing more in this segment
Assets of selected euro area financial sectors (Q4 2008 – Q4 2014; index: Q4 2008 = 100)
Sources: ECB and ECB calculations.
20
60
100
140
180
220
260
Dec-2008 Dec-2009 Dec-2010 Dec-2011 Dec-2012 Dec-2013 Dec-2014
shadow banks: hedge fundsshadow banks: investment funds (excl. money market funds)shadow banks: overallbanks

Financial Stability Review, May 2015 14
contingent commitments created by positions in swaps, futures and other derivative positions can augment overall exposures to asset classes, and hence create “synthetic leverage” (see Box 8). Although data gaps make a solid quantitative understanding of prospective financial stability risks difficult, some qualitative indications suggest that synthetic leverage could be a larger concern than balance sheet leverage and cash-equivalent reporting suggest. High levels of synthetic leverage in the sector can be a source of concern since they can create individual or aggregate distress, which can propagate through direct linkages and information contagion, given the opacity of measurement and reporting, while margining and haircut practices in derivatives markets and securities financing transactions used to add synthetic leverage are pro-cyclical and may lead to negative liquidity spirals.
The key trigger for spillovers from the investment fund industry to the rest of the financial system would be significant decreases in asset prices that could cause sector-wide redemptions. Large-scale outflows cannot be ruled out in the event of adverse economic or policy surprises over the medium term. The market impact of large-scale outflows could be aggravated by strategic complementarities among fund investors, in particular as a result of first-mover advantages and of asset managers being forced to adjust portfolios in a timely manner.
Policy considerations
A comprehensive overhaul of the regulation of the financial sector triggered by the financial crisis has continued to make progress, with most key building blocks nearing completion. For banks, a few remaining key elements of the new regulatory framework are still subject to finalisation and calibration, including parts of the liquidity regulation, leverage ratio provisions and securitisation rules, as well as measures aimed at increasing loss-absorption capacities, thereby addressing the too-big-to-fail problem of global systemically important banks (G-SIBs). For insurers, the implementation of the Solvency II Directive remains the key stream of work for regulators. Several steps have been taken to also strengthen the resilience of financial infrastructures, as well as to reflect upon policies needed to complement a growing shadow banking sector.
The finalisation of the ongoing initiatives will significantly reduce the regulatory uncertainty regarding capital and liquidity rules for banks and other financial institutions, and will contribute to strengthening the resilience and loss-absorption capacity of the whole financial system. Importantly, the implementation of the measures is subject to thorough impact assessments, thus ensuring that the regulatory framework is designed and calibrated in a way that supports the stable provision of financial services over the whole financial cycle.
Building on these regulatory initiatives, a number of euro area countries have already announced and also implemented targeted macroprudential measures. Based on newly acquired mandates and using the growing set of available instruments, macroprudential policy action has a key role to play in both attenuating financial cycles and enhancing the resilience of the financial system.

Financial Stability Review, May 2015 15
More generally, ongoing advances continue in two broad initiatives at the European level to improve the soundness of the financial system – aimed at the banking sector and beyond. First, significant progress has been made in establishing a banking union in Europe, given that the Single Supervisory Mechanism (SSM) became operational on 4 November 2014 and that the Single Resolution Mechanism (SRM) was put in place on 1 January 2015. The Single Resolution Board (SRB) has also been established and will start working on the elaboration of resolution plans and related tasks, as most of the provisions in the SRM Regulation will only apply as from 1 January 2016. Second, as a complementary element to the banking union, the establishment of a capital markets union has been identified as one of the main policy priorities in the years to come. Both initiatives, combined with a variety of targeted regulatory and prudential measures, should contribute to ensuring a more resilient and robust financial system in Europe.

Financial Stability Review, May 2015 16
1 Macro-financial and credit environment
Macro-financial conditions have brightened somewhat in the euro area, in the context of a continued shift in global growth momentum from emerging to advanced economies. While euro area growth prospects remain weak by international standards, the risks surrounding the economic outlook have become more balanced on account of recent monetary policy decisions, lower oil prices and the weaker euro exchange rate. Within the euro area, a broadening of improved financial market sentiment has contrasted with continued real fragmentation at the country level, despite some further progress made in terms of rebalancing. This suggests a fragile equilibrium with underlying risks, including several at the global level. In particular, the prospect of diverging monetary policy trends in major advanced economies, ongoing geopolitical tensions and major adjustments in global commodity markets have the potential to reignite risk aversion vis-à-vis countries, markets and asset classes, which could trigger an unwinding of global search-for-yield flows.
In the public sector, euro area sovereign stress has remained contained despite a flare-up of sovereign tensions at the country level. Sovereign financing conditions have improved further in terms of both pricing and duration, supported by additional unconventional measures recently launched by the Eurosystem. Sovereign risks nonetheless remain in the current still fragile growth environment, with related challenges for several countries in durably restoring the sustainability of public finances in the context of a prolonged period of low nominal growth as well as waning fiscal and structural reform efforts.
Amid this macro-financial environment, financing conditions have continued to ease for the euro area non-financial private sector, as unconventional measures by the Eurosystem gain hold and help reduce persistent financial fragmentation across countries and firm sizes. A strengthening economic recovery should contribute to improving income and earnings prospects for households and non-financial corporations, which together with the favourable interest rate environment should help support the ongoing process of balance sheet repair associated with elevated indebtedness in several euro area countries. At the same time, the recovery of euro area residential and commercial property markets is continuing and becoming more broad-based across countries and market segments amid continued favourable financing conditions and an improving economic outlook. Heterogeneity in property markets across countries appears to have declined, but developments continue to diverge strongly at the country and regional levels in terms of prices and valuations in both the residential and commercial market segments.
1.1 Euro area recovery regaining momentum
The economic recovery in the euro area has been gaining momentum, though remaining generally weak by international standards. A pick-up in aggregate euro area economic growth appears to have taken hold towards the end of 2014 driven by

Financial Stability Review, May 2015 17
domestic demand. Strengthened private consumption has benefited from further easing financing conditions, while favourable real disposable income developments on the back of lower energy prices have translated into improved purchasing power, economic sentiment and confidence (see Chart 1.1). The euro area recovery has, however, continued to lag developments in other major advanced economies given the ongoing process of balance sheet repair as well as continued (albeit diminishing) real and financial fragmentation across countries. In particular, economic output in the euro area has, on average, remained below its pre-crisis level amid varying trends in vulnerable and other euro area countries (see Chart 1.2).
The latest economic indicators, including survey data and the flash GDP estimate for the first quarter of 2015, suggest that the euro area economy has gained additional momentum since the end of 2014. Looking ahead, the euro area economic recovery is expected to strengthen further in 2015 and beyond, driven by both domestic and external demand. First and foremost, support stems from the Eurosystem’s recently launched accommodative non-standard monetary policy measures, in particular the expanded asset purchase programme (see Box 1), but lower oil prices, continued benign financing conditions, a weaker euro and a lower fiscal drag will underpin economic activity in the near and medium terms. Against this backdrop, the March 2015 ECB staff macroeconomic projections for the euro area envisage a more favourable growth path than the December 2014 Eurosystem projections. Accordingly, real GDP is forecast to expand at a rate of 1.5% in 2015 which is expected to accelerate further to 1.9% in 2016 and 2.1% in 2017.
While remaining on the downside, the risks surrounding the economic outlook for the euro area have become more balanced on account of the recent monetary policy decisions, lower oil prices and the lower euro exchange rate. Over the short to medium term, several factors continue to weigh on the underlying euro area
growth momentum, including heightened geopolitical tensions across the globe, the ongoing process of balance sheet adjustment in the financial and non-financial private sectors as well as still adverse labour market conditions in vulnerable euro area economies. At the same time, a rather slow pace of implementation of structural reforms may weigh on the pace of the recovery in some euro area countries, especially those where the commitment to reforms has fallen most.
Chart 1.1 Economic sentiment has improved considerably in the euro area since the beginning of 2015…
Economic sentiment indicator, consumer confidence and Purchasing Managers’ Index in the euro area (Jan. 2006 – Apr. 2015; points; diffusion index: 50+ = expansion)
Sources: Eurostat and European Commission.
Chart 1.2 …but developments in the euro area economy continue to lag those seen in other advanced economies
GDP levels in the euro area, the United States and the United Kingdom (Q1 2006 – Q4 2014; index: Q2 2009 = 100)
Sources: Eurostat and ECB calculations. Note: Vulnerable euro area countries comprise Cyprus, Greece, Ireland, Italy, Portugal, Slovenia and Spain.
30
35
40
45
50
55
60
65
-40
-30
-20
-10
0
10
20
30
2006 2007 2008 2009 2010 2011 2012 2013 2014 2015
economic sentiment indicator (left-hand scale)consumer confidence (left-hand scale)composite output PMI (right-hand scale)
94
96
98
100
102
104
106
108
110
112
114
2006 2007 2008 2009 2010 2011 2012 2013 2014
euro area United StatesUnited Kingdom vulnerable euro area countriesother euro area countries

Financial Stability Review, May 2015 18
Chart 1.4 Labour market conditions have continued to improve in the euro area, but unemployment remains high
Developments in the number of unemployed, unemployment rate and unemployment expectations in the euro area (Jan. 2005 – Apr. 2015; percentages; percentage balances; number in tens of thousands; three-month moving averages)
Sources: Eurostat, European Commission and ECB calculations. Note: An increase (decrease) of the indicator on unemployment expectations corresponds to less (more) optimistic expectations.
Despite the improved growth outlook for the euro area as a whole, real fragmentation across countries – albeit somewhat lower than during the euro area sovereign debt crisis – remains a cause for concern, amid some recent signs of a renewed widening in cross-country divergence of growth rates (see Chart 1.3). Similarly, labour market conditions have shown some signs of improvement (see Chart 1.4), but developments continue to differ considerably within the euro area, as high unemployment rates in more vulnerable countries, such as Greece and Spain, contrast with relatively benign labour market conditions in other euro area economies, for example Austria and Germany. This heterogeneity continues to highlight inter alia the need for employment-enhancing structural reforms with a view to fostering a broad-based and inclusive economic recovery.
Overall competitiveness, as captured, for instance, in the current account balances of more vulnerable euro area countries, has improved considerably since the
onset of the crisis. A large part of the underlying current account adjustment has been of a non-cyclical nature and is therefore likely to be sustained. Efforts to restore competitiveness are ongoing within the euro area, even if – after six years of
7.0
7.6
8.2
8.8
9.4
10.0
10.6
11.2
11.8
12.4
-20
-10
0
10
20
30
40
50
60
70
2005 2006 2007 2008 2009 2010 2011 2012 2013 2014 2015
euro area recessionmonthly change in the number of unemployed (left-hand scale)unemployment expectations over next 12 months (left-hand scale)unemployment rate (right-hand scale)
Chart 1.3 Improving economic growth prospects in the euro area, but developments continue to diverge both within the euro area and across advanced economies
Evolution of forecasts for real GDP growth in the euro area and selected other advanced economies for 2015 (Jan. 2014 – May 2015; percentage change per annum, minimum-maximum range)
Sources: Consensus Economics and ECB calculations. Note: The chart shows the minimum, maximum, median and interquartile distribution across the 11 euro area countries surveyed by Consensus Economics (Austria, Belgium, Finland, France, Germany, Greece, Ireland, Italy, the Netherlands, Portugal and Spain).
Chart 1.5 Continued improvements in relative prices and costs in most euro area countries
Decomposition of the change in the real effective exchange rate (Q4 2009 – Q4 2014; percentages)
Source: ECB. Notes: The real effective exchange rate is deflated by unit labour costs. A decline corresponds to a real depreciation, i.e. an improvement in competitiveness.
0.0
0.5
1.0
1.5
2.0
2.5
3.0
3.5
4.0
Jan-14 Apr-14 Jul-14 Oct-14 Jan-15 Apr-15
euro areaUnited StatesUnited KingdomJapan
-27-24-21-18-15-12-9-6-30369
12
GR ES IE CY PT SI IT NL FR DE FI LT SK LU BE MT AT EE LV
nominal effective exchange rate relative costs - extra-euro arearelative costs - intra-euro area real effective exchange rate

Financial Stability Review, May 2015 19
observed efforts towards rebalancing – in 2014 the current account adjustment slowed down or reversed partially in some vulnerable euro area economies. This can be partly explained by the recovery of domestic demand, which was only partly offset by the impacts of continued adjustments in relative prices and costs (see Chart 1.5). Looking ahead, the near-term outlook for external rebalancing will be shaped by two conflicting forces. On the one hand, the cyclical upturn in economic activity in vulnerable euro area economies may exert downward pressures on current account balances, while, on the other hand, transitory factors – in particular the recent weakening of the euro and lower oil prices – should support external rebalancing. The longer-term prospects for external rebalancing depend on a number of determinants, such as the reallocation of resources towards high-productivity firms, which requires the continuation of structural reforms to help enhance the euro area’s medium-term growth potential and reduce the real fragmentation across the euro area.
Box 1 Accommodative monetary policy and euro area financial stability
Amid concerns that inflation would remain too low for a prolonged period, implying risks to medium-term price stability, the ECB’s Governing Council has implemented a number of monetary policy measures since June 2014 to provide further monetary policy accommodation to the euro area economy.1 Most recently, in March 2015 the expanded asset purchase programme (APP) was launched encompassing a set of euro-denominated investment-grade public sector securities. In addition, the expanded APP integrates the existing purchase programmes for asset-backed securities (ABSPP) and covered bonds (CBPP3) that were launched in autumn 2014. Under this expanded programme,
which is intended to be carried out at least until the end of September 2016, the combined monthly purchases will amount to €60 billion per month or €1,140 billion in total. As there had been market expectations for some time of a purchase programme and because its size exceeded expectations, it has already produced a substantial easing of broad financial conditions, which is expected to support price stability and foster financial stability in the euro area. At the same time, unintended side effects on financial stability cannot be ruled out as very accommodative monetary conditions stimulate not only economic risk-taking – as intended – but may also lead to excessive financial risk-taking. It should be borne in mind that the prices of financial assets traded across borders are affected not only by the ECB’s monetary policy stance, but also by global monetary conditions, which have remained very accommodative for some years now, as reflected e.g. in central bank
1 For details, see the Overview section of Economic Bulletin, Issue 2/2015, ECB.
Chart A Abundant central bank liquidity provision
Central bank balance sheets (total assets in local currency; index: Q1 2007 = 100)
Sources: Haver Analytics, ECB and ECB calculations.
0
100
200
300
400
500
600
2007 2009 2011 2013 2015
euro areaJapanUnited States

Financial Stability Review, May 2015 20
balance sheet sizes (see Chart A) and general reductions in market interest rates. In this environment, financial stability has to be monitored closely to inform the potential activation of macroprudential policy instruments best suited to addressing in a targeted manner associated risks specific to particular countries, sectors or institutions.
From the viewpoint of the main prevailing risks for financial stability, a lack of ECB monetary policy action would have been detrimental not only to the maintenance of price stability, but also to the safeguarding of financial stability in the euro area. Not taking additional action could have triggered a further reduction of inflation expectations with a direct impact on real interest rates, thus leading to an unwarranted tightening of financial conditions and ultimately lower nominal growth. In this sense, the ECB’s expanded APP should be beneficial for financial stability in the euro area. First, in pursuit of price stability, the further easing of the monetary policy stance strengthens aggregate demand via improved confidence and lower real interest rates, increasing capacity utilisation and supporting money and credit growth. Second, it also helps to alleviate the real debt burdens of households, firms and governments, which otherwise could have been subject to adverse debt dynamics with ramifications for financial stability.2 In addition, rising asset prices improve the net worth of firms and households, enhancing borrowers’ creditworthiness and thereby providing scope for banks to further ease their credit standards without endangering financial stability. Lastly, the ECB’s monetary policy measures provide additional funding cost relief for banks via targeted longer-term refinancing operations (TLTROs) and a reduction in long-term government bond yields, which are the basis for the pricing of a large variety of assets and loan contracts. This will support banks’ essential financial intermediation function for the real economy.
Notwithstanding these financial stability benefits, an accommodative monetary policy stance geared towards maintaining price stability can, in principle, lead to potential risks to financial stability that supervision and macroprudential policy have to address.3 For example, the direct reduction in interest rates of asset classes purchased by the Eurosystem and other asset classes indirectly affected via portfolio rebalancing activities boosts asset and collateral values, by increasing the net present value of future cash flows, as well as income and profits. This fact provides the potential for increased risk tolerance or reduced levels of risk perception and would be reflected in lower risk premia and lower volatility. Greater appetite for risk in the presence of abundantly available liquidity may have the potential to push certain asset prices to values that are not justified by their fundamental values, a development that could be amplified by herding behaviour of investors in an environment of over-optimistic beliefs. Notably, in the residential property sector, which has been at the heart of many previous episodes of financial distress, such developments would be accompanied by strong credit growth. Therefore, there is a need to monitor risk-taking behaviour and specifically asset price growth that is accompanied by increased leverage as such developments could amplify the risk of an abrupt asset price correction. If such developments were to be widespread, they would lead to instability in the financial system, thereby hampering monetary policy transmission and ultimately price stability.
2 See the box entitled “Financial stability challenges posed by very low rates of consumer price inflation”,
Financial Stability Review, ECB, May 2014. 3 For theoretical arguments, see Borio, C. and Zhu, H., “Capital regulation, risk-taking and monetary
policy: A missing link in the transmission mechanism?”, Journal of Financial Stability, Vol. 8, 2012, pp. 236-251. Empirical evidence is provided in e.g. Altunbas, Y., Gambacorta, L. and Marqués-Ibáñez, D., “Do bank characteristics influence the effect of monetary policy on bank risk?”, Working Paper Series, No 1427, ECB, 2012 and references therein.

Financial Stability Review, May 2015 21
Chart B Stylised financial cycle estimates suggest limited broad-based excesses in euro area credit or asset prices
b) Residential property prices x-axis: phase of cycle y-axis: deviation from long-term level
d) Benchmark bond yields x-axis: phase of cycle y-axis: deviation from long-term level
Sources: ECB and ECB calculations. Notes: Based on the computations in Schüler, Y., Hiebert, P. and Peltonen, T., “Characterising financial cycles across Europe: One size does not fit all”, Working Paper Series, ECB (forthcoming). The charts show the cyclical position of ten euro area countries (AT, BE, DE, ES, FI, FR, IE, IT, NL and PT), denoted by red dots, and the euro area aggregate (yellow dot) for credit and property prices for Q3 2014 (Q4 2014 for total credit in the euro area and for house prices in FI, IE and NL) and for equity prices and benchmark bond yields for Q4 2014 (Q3 2014 for benchmark bond yields in PT). Historical minima, maxima and averages are country-specific. The cycle is shown in a stylised fashion divided into its four phases: 1. growth/level below trend and deviating further from trend; 2. growth/level below trend and increasing towards the trend; 3. growth/level above trend and deviating further from trend; and 4. growth/level above trend and declining towards the trend. The cycles are based on the following measurements: panel a): quarterly percentage change in real total credit to the non-financial private sector; panel b): quarterly percentage change in real residential property prices; panel c): index of real equity prices; and panel d): real ten-year government bond yields. Real concepts are deflated by annual HICP inflation.
To date, broad-based risks stemming from excessive risk-taking or asset price developments are contained in the euro area. Estimates of financial cycle sub-components generally provide additional evidence for that assessment (see Chart B), though financial asset prices in some countries appear to have been drifting away from historical norms at the end of 2014. Most notably, the credit cycle component (see Chart B, panel a) estimated for the euro area and euro area countries does not support the view of a credit-driven asset price boom. All countries experience cyclical real credit growth rates below their long-term average, but in a number of euro area
1 2
3 4
historicalmax
historicalmin
historical
average
1 2
3 4
historicalmax
historicalmin
historical
average
a) Total credit x-axis: phase of cycle y-axis: deviation from long-term growth
c) Equity prices x-axis: phase of cycle y-axis: deviation from long-term level
1 2
3 4
historicalmax
historicalmin
historical
average
1 2
3 4
historicalmax
historicalmin
historical
average

Financial Stability Review, May 2015 22
countries credit growth has started to recover even if remaining below its long-term value. These developments are also confirmed by the growth rates for loans to the non-financial private sector, notably mortgage lending, and are reflected in the cyclical component of real residential property prices (see Chart B, panel b). With regard to financial asset prices, equity prices are in an upswing phase of the cycle (see Chart B, panel c), but are still close to associated long-run values, while long-term real interest rates have come down further and appear to be below long-run values in almost all euro area countries (see Chart B, panel d).
With financial cycles and business cycles not always synchronised across countries in the euro area, the price stability-oriented monetary policy stance influencing all sectors of the euro area economy needs to be complemented by policy measures that can be used in a targeted manner to address country, sector or institution-specific systemic risks. Macroprudential policy, comprising a set of granular measures in this vein, provides the most appropriate instruments for staving off risks to financial stability and containing systemic risks to support monetary policy that is clearly focused on fulfilling its price stability mandate. This requires close monitoring not only of asset markets, but also of regulated financial institutions (i.e. banks, insurance corporations and pension funds) and the less regulated non-bank financial sector, as well as broader financial developments in the non-financial private sector. Indeed, since the beginning of 2014 a number of macroprudential policy instruments have been implemented in euro area countries, including the activation of capital instruments available under the Capital Requirements Directive IV and the Capital Requirements Regulation, as well as other instruments available under national legislation, such as loan-to-value limits. Notably, a number of these measures address the property sector – for example, in terms of adjustments to the risk weights applicable to property lending, as well as loan-to-value and loan-to-income limits.
All in all, while the recent further substantial easing of the monetary policy stance may contribute to financial stability in the euro area by increasing nominal growth, any potential for unintended adverse ramifications requires close monitoring. However, to date, such unintended consequences appear to be contained for the euro area as a whole. Any possible emergence of major side-effects in specific sectors and countries would call for the activation of macroprudential policy instruments, as monetary policy retains a necessary focus on maintaining price stability.
The global economy has also continued on a muted growth trajectory, but developments remain uneven across countries and regions. While economic dynamics in advanced economies have gained some additional traction, emerging economies have lost further momentum even if remaining the main engine of global growth. The highly accommodative monetary policy stance in advanced economies – though showing potential for increased divergence – has continued to provide vital support to the global recovery. While global growth is expected to recover gradually further on the back of lower oil prices and continued policy support, risks to the global outlook remain tilted to the downside. In particular, a sharp repricing of risk with ensuing corrections in asset prices, a potential disorderly unwinding of capital flows and sharp exchange rate movements along the path to normalisation of macroeconomic policies in key advanced economies remain causes for concern. In addition, heightened geopolitical risks (e.g. Russia), persistent macroeconomic vulnerabilities and/or financial imbalances in major advanced and emerging

Financial Stability Review, May 2015 23
economies, as well as less buoyant growth prospects for emerging markets, may stand in the way of a more forceful global recovery.
Regarding the main global economic regions, economic momentum in many advanced economies outside the euro area continued to firm gradually as highly accommodative monetary policies continue to support favourable financial conditions, while headwinds from private sector deleveraging, slack in labour markets and fiscal consolidation have started to wane in several countries. Recent trends indicate a continued recovery ahead, supported in particular by lower oil prices, but the pace of progress varies across countries. In this context, the uncertainty about the path of monetary policies across advanced economies represents a key source of risk, as a multi-speed economic recovery translates into divergent monetary policies. A faster than expected normalisation of interest rates in some advanced economies may increase volatility and trigger abrupt adjustments in currency markets that may spill over to other financial market segments and, eventually, weigh on global growth. In particular, a rise in US bond yields could lead to a wider repricing of risky assets and a rise in bond yields globally. At the same time, risks related to geopolitical tensions remain elevated, still harbouring the potential for adverse growth effects going forward.
In the United States, the expansion in economic activity slowed in the first quarter of 2015, in part due to temporary factors such as adverse weather conditions and port disruptions, but also due to the appreciation of the US dollar that is weighing on export performance and to a decline in mining and oil sector investment given the drop in oil prices. However, economic fundamentals remain supportive and economic activity is also underpinned by benign financial conditions. Financial stress indicators have continued to hover at all-time lows, pointing to a possible underpricing of risk by market participants. Looking ahead, economic growth is expected to remain robust supported by lower oil prices, accommodative monetary policy, the ongoing recovery in labour and housing markets as well as fading headwinds from fiscal policy and household balance sheet repair. Downside risks to the growth outlook include a faster than expected normalisation of interest rates, a further appreciation of the US dollar and looming vulnerabilities in the non-financial corporate sector. While the near-term fiscal outlook has improved, long-term fiscal imbalances, if unaddressed, may trigger a reassessment of sovereign risk going forward.
In Japan, the recovery in economic activity remains overall tepid. After returning to positive growth in the previous quarter, real GDP gained traction in the first quarter of 2015 largely on account of a higher contribution of private inventories. The rebound in domestic demand from the protracted slump following the April 2014 VAT hike has remained modest thus far, while net exports contributed negatively to growth. Looking ahead, growth is expected to continue on its moderate recovery path, partly supported by lower oil prices, a weak yen and continued accommodative monetary policies. At the same time, the government’s decision to postpone the planned second VAT hike to April 2017 and to provide additional fiscal stimulus should imply a lower fiscal drag on growth in 2015-16. Risks to the Japanese economy remain tilted to the downside amid increasing fiscal risks and key challenges with a view to ensuring long-term public debt sustainability. Given banks’ significant sovereign

Financial Stability Review, May 2015 24
exposure (around 17% of total assets), a repricing of risk in financial markets and the related potential increase in government bond yields could harm the profitability and solvency of some financial institutions.
Economic activity in the United Kingdom has gathered further momentum in 2014, despite some softening towards the end of the year. Economic activity was driven by
robust domestic demand on the back of improving labour market conditions, buoyant housing market developments, an accommodative monetary policy stance and declining macroeconomic uncertainty. According to preliminary estimates, the economy decelerated in early 2015. Looking ahead, risks to growth are broadly balanced. On the upside, low energy prices and stronger wage growth might support private consumption, while continued favourable credit conditions might stimulate business investment. On the downside, however, the need for further balance sheet repair in both the private and public sectors as well as the lagged effect of the appreciation of the pound sterling could weigh on economic activity. In addition, a potential correction in residential housing markets may affect the debt-servicing capacities of highly indebted households, while a possible referendum on EU membership following the outcome of the May 2015 general election is likely to heighten political uncertainty.
In general, emerging markets have lost further momentum on the back of heightened geopolitical tensions, unfolding adjustments of domestic and/or external imbalances and lower oil prices which adversely affected most oil-exporting emerging economies. Economic trends continued to diverge across the emerging market universe, with upbeat sentiment in central and eastern Europe contrasting with relatively muted economic dynamics in emerging Asia and Latin America (see Chart 1.6). Despite some positive stimuli for oil-importing emerging economies, the future growth trajectory in some countries is likely to be restrained by the limited scope for monetary and fiscal policy support as well as prevalent infrastructure bottlenecks and capacity constraints that weigh on potential output. In other countries, which are highly dependent on capital inflows, activity is likely to be dampened, as economies rebalance in response to tighter financial conditions and the expected adjustment of US monetary policy. Against the backdrop of the recent broad-based appreciation of the
Chart 1.6 Economic prospects diverge considerably across emerging market regions
Economic surprise indices across emerging economies (Jan. 2008 – May 2015; deviation from median forecasts; six-month moving averages)
Sources: Citigroup and Bloomberg. Notes: Deviations are weighted by their impact on foreign exchange markets. Central and eastern Europe, Middle East and Africa comprises Turkey, South Africa, Poland, the Czech Republic and Hungary. Asia-Pacific includes China, Hong Kong, India, Indonesia, South Korea, Malaysia, the Philippines, Singapore, Taiwan and Thailand, while Latin America covers Brazil, Mexico, Chile, Colombia and Peru.
Chart 1.7 A large share of gross external debt is denominated in US dollars in many emerging market economies
Currency decomposition of gross external debt (Q3 2014; percentage of GDP)
Sources: World Bank and ECB calculations.
-125
-100
-75
-50
-25
0
25
50
75
2008 2009 2010 2011 2012 2013 2014 2015
central and eastern Europe, Middle East and AfricaAsia-PacificLatin America
0
10
20
30
40
50
60
70
Kaza
khst
an
Chi
le
Turk
ey
Sout
h A
frica
Thai
land
Rus
sia
Mex
ico
Sout
h K
orea
Peru
Arge
ntin
a
Col
ombi
a
Indi
a
Phili
ppin
es
total external debttotal foreign currency-denominated external debttotal USD-denominated external debt

Financial Stability Review, May 2015 25
US dollar, concerns regarding potential currency mismatches on sovereign and corporate balance sheets in emerging markets have resurfaced (see Chart 1.7). That said, net foreign currency exposures appear to have declined across emerging markets over the past decade, inter alia given the increased issuance of domestic currency-denominated debt. This may render emerging markets overall less vulnerable to major downward exchange rate pressures vis-à-vis the US dollar, even if aggregate figures may hide pockets of risk at the country and/or sector levels.
The economic recovery continued in most emerging European economies, notably the EU countries in central and eastern Europe, driven by robust domestic demand that is supported by EU structural fund inflows and strengthening purchasing power of consumers amid very low inflation and declining energy prices. To date, the impact of the Ukraine-Russia crisis on the region has remained relatively contained, despite the pronounced (also oil price-driven) downturn of the Russian economy. A possible further escalation of the Ukraine-Russia conflict as well as the duration and scope of EU sanctions against Russia and potential retaliatory measures remain the main downside risks to the region’s economic outlook. At the same time, the ongoing economic recovery in the euro area is expected to underpin economic activity in the region via improved export prospects. That said, in several countries domestic demand continues to be constrained by a still incomplete process of balance sheet repair in the private and public sectors, which is often further exacerbated by existing legacy currency mismatches, in particular on household balance
sheets. In the context of the latter, several countries (e.g. Hungary, Croatia) have taken measures to alleviate the pressure on unhedged borrowers in the aftermath of the Swiss National Bank’s decision to remove the EUR/CHF exchange rate cap in January 2015 (see Chart 1.8). This could put additional pressure on banks which in many countries still continue to be challenged by legacy asset quality problems. In spite of the ongoing economic recovery, credit growth remained muted in most countries given the still elevated level of non-performing loans and the ongoing (albeit slowing) deleveraging by foreign banks amid continued efforts to adjust towards a more self-sustained and domestically funded business model.
Economic conditions remained subdued in emerging Asia in 2014, in particular driven by developments in China where corrections in property markets weighed on investment activity. Looking ahead, economic momentum is expected to strengthen somewhat in the region driven by the overall positive impact of lower oil prices, stronger foreign demand from key advanced economies as well as further monetary easing in several countries, notably in India and China. Still, regional growth dynamics will fall short of the momentum seen in previous years. Risks to activity in the region remain tilted to the downside and relate to possible stronger than expected
Chart 1.8 Swiss franc exposures are sizeable in some EU countries, suggesting heightened credit risk
Net Swiss franc exposure of the non-monetary financial institution sector (Q4 2014; percentage of GDP)
Sources: ECB, Eurostat and ECB calculations. Notes: Figures for Croatia also comprise Swiss franc-indexed loans. The net Swiss franc exposure is calculated as the difference between the Swiss franc-denominated deposits of and the Swiss franc-denominated loans to the non-monetary financial institution sector.
-12
-10
-8
-6
-4
-2
0
HU CY AT PL HR GR SI FR DK DE LV

Financial Stability Review, May 2015 26
exchange rate adjustments linked to divergent monetary policies in advanced economies, as well as the uncertainty surrounding the monetary policy normalisation in the United States. Moreover, a major slowdown of the Chinese economy may trigger additional knock-on effects for other Asian economies with close trade and financial links to China where high credit growth and leverage as well as a strongly expanding shadow banking sector indicate risks to financial stability.
Economic activity in Latin America remained weak in 2014, while growth became more uneven across countries. Several countries have lost momentum or dipped into outright recession, in particular commodity exporters which saw their terms of trade deteriorate sharply as a result of lower commodity prices (e.g. Brazil, Venezuela). In other countries (e.g. Mexico), activity has remained solid, buttressed by strong foreign (US) demand. Overall, risks remain skewed to the downside and mainly relate to a further tightening of external financing conditions and to a disorderly rebalancing of the Chinese economy, on which commodity exporters in the region are strongly dependent. Also, fiscal challenges in oil-exporting economies, coupled with heightened political risks and underlying structural vulnerabilities in some countries, may act as a drag on growth.
In sum, the recovery of the global economy is expected to continue at a moderate pace, but will remain uneven across countries and regions. Risks to the outlook have diminished somewhat, but remain tilted to the downside as long-standing and newly emerging underlying vulnerabilities continue to pose a threat to recovery across the globe, with inherent fragilities being partly masked by continued benign financial market sentiment. Alongside persistent real and financial global imbalances, which remain high in a historical context despite having narrowed since the onset of the global crisis, the ongoing geopolitical tensions represent a continued cause for concern – not only the tensions in the context of the ongoing Ukraine-Russia crisis, but also those relating to other parts of the world (e.g. the Middle East). Moreover, the – mainly supply side-driven – sharp adjustments in commodity markets (see Chart 1.9), while likely having a net positive effect on the global economy, may contribute to heightened volatility in global financial markets and challenge the macro-fiscal stability of major oil-exporting emerging economies (see Box 2), thereby triggering potential shifts in investor sentiment vis-à-vis and negative
Chart 1.9 Commodity markets stabilise following sharp corrections in some market segments
Selected commodity price developments (Dec. 2005 – May 2015; index: Dec. 2005 = 100)
Source: Bloomberg.
Chart 1.10 Bond and equity flows to the euro area and other advanced economies continue to rise
Equity and bond flows to advanced and emerging market economies (Jan. 2008 – May 2015; index: Jan. 2008 = 100)
Source: EPFR. Note: Bonds include both sovereign and corporate bonds.
0
100
200
300
400
500
600
2005 2006 2007 2008 2009 2010 2011 2012 2013 2014
oil gold platinumwheat silver copper
50
75
100
125
150
175
200
225
2008 2010 2012 2014
eastern Europe, the Middle East and Africa
Asia
Latin America
other advanced economies
vulnerable euro area countries
other euro area countries
50
75
100
125
150
175
200
225
2008 2010 2012 2014
Bonds Equities
Financial Stability Review, May 2015 27
spillovers across emerging economies. Lastly, as evidenced by the temporary bouts of emerging market volatility in 2013 and 2014 (see Chart 1.10), the risk of a disorderly and broad-based unwinding of global search-for-yield flows in the context of the prospective exit from unconventional monetary policies by some major central banks in advanced economies remains a cause for concern. In the event of an abrupt US monetary policy tightening, emerging economies that rely heavily on short-term foreign financing might be particularly exposed to liquidity risk. As in previous sell-off episodes, countries that rely on short-term external financing are particularly exposed to capital flow reversal risks.
All in all, important macro-financial risks to euro area financial stability relate to global factors, including the ongoing geopolitical tensions, the uneven distributional effects of lower oil prices and the diverging monetary policies in major advanced economies. All these factors, beyond raising uncertainties regarding the pace and sustainability of the economic recovery in emerging and advanced economies, may trigger renewed tensions in global financial markets and a potential unwinding of global search-for-yield flows. At the same time, macro-financial risks also continue to originate from within the euro area in a still fragile, low nominal growth environment. In particular, continued real and financial fragmentation, as well as the ongoing balance sheet repair in both the private and public sectors in several countries, continue to weigh on euro area growth momentum.
Box 2 Lower oil prices and their implications for financial stability in the euro area
The oil market has seen an upheaval since mid-2014, exhibiting a more than 50% peak-to-trough drop in prices (see Chart A). Despite a relatively benign global volatility environment and some recovery since early 2015, going forward, prices are likely to remain below the highs observed after the 2009 recovery, in particular given the supply and price elasticity of North American unconventional oil. The net impact on the global economy, including the euro area, is expected to be beneficial on average given positive growth effects, but its distribution will be clearly asymmetric between oil-exporting and oil-importing economies (see Chart B). Oil-exporting emerging economies4 seem particularly vulnerable given less diversified economic structures and high oil dependency, notwithstanding varying levels of fiscal space and reserves to cope with related challenges. In this environment, the direct linkages of euro area banks require monitoring from a financial stability perspective. Such linkages comprise the exposure, investment and ownership channels, including petrodollar flows in the form of debt and/or equity funding.
4 According to the US Energy Information Administration, the world’s largest net oil-exporting emerging
economies in 2013 with exports of more than 1,000 barrels a day were, in descending order, Saudi Arabia, Russia, the United Arab Emirates, Kuwait, Iraq, Nigeria, Venezuela, Qatar, Angola, Kazakhstan, Algeria and Iran.

Financial Stability Review, May 2015 28
Chart B Persistent low oil prices may challenge the macro-fiscal stability of major oil exporters
Forecast fiscal balance and fiscal break-even oil price of major oil-exporting emerging economies (2015 forecasts, percentage of GDP and US dollars per barrel)
Sources: Bloomberg, Deutsche Bank and IMF. Note: The size of the bubble represents the general government debt as a percentage of GDP.
On the assets side of euro area bank balance sheets, BIS data suggest a rather modest and manageable exposure to oil-exporting emerging economies. Nonetheless, the variability across country-specific exposures is evident and can lead to the emergence of pockets of localised risk. Under a tail-risk scenario, these pockets of risk could be amplified by broader shifts in investor sentiment, with spillovers across emerging markets and a negative feedback loop with the world economy, and could implicitly affect euro area financial stability. That said, euro area banks’ claims on the world’s major oil-exporting emerging economies amounted on average to some 2.5% of their total foreign claims as at end-2014, with Portugal and Austria having the largest relative exposures. These countries were the most exposed also relative to their GDP (see Chart C). The countries to which euro area banks are exposed the most are Russia, Saudi Arabia and the United Arab Emirates.
Similarly, euro area banks’ direct exposure to the oil and gas sector appears to be relatively small and concentrated in a few institutions. Zooming in on the syndicated loan market, euro area banks arrange about one-fifth of the USD 1.8 trillion global syndicated loan market for oil and gas (about half of the share of North American banks). French banks (BNP Paribas, Crédit Agricole and Société Générale), followed by Deutsche Bank and ING, appear to be the most active in absolute terms. However, the level of exposure concentration seems limited, with the share of oil and gas in total syndicated loan commitments exceeding 15% only for ABN AMRO, Natixis and BBVA (see Chart D). The regional distribution of oil and gas borrowers appears almost equally divided between the Americas (50%) and Europe, the Middle East and Africa (44%).
Algeria
Angola Iran
Iraq
Kazakhstan
Kuwait
Nigeria
Qatar
Russia
Saudi Arabia
United Arab Emirates
Venezuela
0102030405060708090
100110120130140
-25 -20 -15 -10 -5 0 5 10 15
YTD oil price (Brent)
Fisc
al b
reak
-eve
n oi
l pric
e
Fiscal balance
Chart A Sharp drop in oil prices amid a relatively benign global volatility environment
Developments in the oil price and the VIX index (Jan. 1986 – Apr. 2015; US dollars per barrel, percentages)
Source: Bloomberg.
-75
-50
-25
0
25
50
75
100
125
150
1986 1990 1994 1998 2002 2006 2010 2014
oil price drop from peak to troughoil price (Brent crude oil)VIX index

Financial Stability Review, May 2015 29
Chart D Syndicated loan commitments to the oil and gas sector are small and concentrated in a few institutions
Syndicated loan commitments of major euro area banks (outstanding amounts due after 1 March 2015; USD billions, percentages)
Sources: Dealogic and ECB calculations.
On the liabilities side of euro area bank balance sheets, investment risks may emerge to the extent that petrodollars represent a source of funding (see Chart E). In the event of limited alternative funding sources (e.g. wholesale), decelerating petrodollar inflows or even potential outflows could result in balance sheet pressures which, in turn, could trigger asset divestments and downward pressure on prices. Ownership risks may arise via the equity stakes of investors from oil-exporting economies (often sovereign wealth funds) in euro area banks (see Table A). Notwithstanding the generally long-term nature of this type of investment, divestments may be triggered by a prolonged period of low oil prices and the related need for a major rebalancing in home countries.
All in all, the direct transmission channels of lower oil prices to euro area banks would suggest only limited associated challenges to euro area financial stability. Nevertheless, country and sector-specific exposure concentrations as well as banks’ funding profiles should be monitored carefully, especially as any related vulnerabilities can be amplified by indirect effects stemming from a fragile global growth environment, policy asymmetries in advanced economies and geopolitical tensions.
0
6
12
18
24
30
36
0
10
20
30
40
50
60BN
P P
arib
as
Cré
dit A
gric
ole
Soci
été
Gén
éral
e
Deu
tsch
e Ba
nk
ING
BBVA
Nat
ixis
Uni
Cre
dit
ABN
AM
RO
Sant
ande
r
Inte
sa S
anpa
olo
Rab
oban
k
Com
mer
zban
k
KfW
DZ
Bank
Asia
Americas
Europe, Middle East and Africa
syndicated loans to oil and gas firms as a percentage of total assets(right-hand scale)syndicated loans to oil and gas firms as a percentage of totalsyndicated loans to non-financial corporations (right-hand scale)
Chart C Euro area banks’ overall exposures to oil-exporting economies seem relatively modest, but cross-country heterogeneity is high
Claims of BIS reporting banks on major oil-exporting economies (Q4 2014; percentage of GDP, immediate borrower basis)
Sources: BIS consolidated banking statistics and ECB calculations. Note: Values are reported on an immediate borrower basis instead of the ultimate risk basis given better data coverage. Figures comprise total exposures to the sovereign as well as the financial and non-financial private sectors. Other Gulf and central Asian countries include Kazakhstan, Kuwait, Iraq, Iran and Qatar, while other African countries comprise Algeria and Nigeria. Russian exposure data for Austria refer to the latest observation point from the third quarter of 2012. The euro area average is the average value of the eleven countries shown in the chart.
0
1
2
3
4
5
6
PT AT FR ES NL IT DE BE GR IE FI
other Gulf and central Asian countries
other African countries
Venezuela
Angola
United Arab Emirates
Russia
Saudi Arabia
euro area average

Financial Stability Review, May 2015 30
Table A Investors from oil-exporting economies have shown interest in acquiring stakes in euro area banks in the aftermath of the financial crisis
Selected ownership stakes held by investors from oil-exporting countries in selected euro area banks (2014; EUR billions, percentage of capital)
Sources: Banks’ annual reports. Note: Data for Alpha Bank are on a full warrant basis as of June 2013.
1.2 Benign sovereign financing conditions, but underlying vulnerabilities remain
Sovereign stress conditions have remained relatively benign against the background of the expanded asset purchase programme, with the composite indicator of systemic stress in sovereign bond markets still considerably below the levels seen at the height of the euro area sovereign debt crisis in 2011-12 (see Chart 1.11). The aggregate indicator, however, conceals substantial divergence in sovereign stress across countries. In particular, default risk expectations have increased sharply in Greece amid heightened political uncertainty.
At the same time, fiscal deficits in the euro area continued to decline. The 2014 aggregate euro area fiscal deficit fell to 2.4% of GDP, from 2.9% in 2013. Fiscal conditions have improved in many countries, including former programme countries, as well as Germany and the Netherlands, while stabilising in other major euro area economies, such as France and Italy. According to the European Commission’s spring forecast, the aggregate euro area fiscal deficit is projected to decline further to 2.0% of GDP in 2015 and 1.7% of GDP in 2016, largely driven by positive cyclical developments.
Despite the overall improvement in fiscal conditions in the euro area in recent years, sovereign risks remain elevated amid incomplete adjustment. Despite the progress of
Bank Owner Country Investment volume
Deutsche Bank (DE)
Paramount Holdings Services Qatar
1.75 billion / 5.8%
Alpha Bank (GR)
Paramount Holdings Services Qatar n.a. / 9%
BIL (LU) Precision Capital Qatar n.a. / 90%
UniCredit (IT)
Aabar Investments Abu Dhabi 1.0 billion / 5.0%
UniCredit (IT)
Central Bank of Libya Libya 0.6 billion / 2.9%
Chart E Increasing, but still relatively low importance of oil exporters as a funding source for euro area banks
BIS reporting banks’ liabilities to major oil-exporting emerging markets (Q1 2000 – Q4 2014; USD billions, percentages)
Source: BIS. Notes: Liabilities comprise loans and deposits. Gulf countries include Kuwait, Iraq, Iran, Qatar, the United Arab Emirates and Saudi Arabia. African countries comprise Algeria, Angola and Nigeria, while the Commonwealth of Independent States (CIS) and Latin American countries cover Russia and Kazakhstan as well as Venezuela, respectively.
0.0
0.5
1.0
1.5
2.0
2.5
3.0
3.5
4.0
4.5
5.0
0
25
50
75
100
125
150
175
200
225
250
2000 2002 2004 2006 2008 2010 2012 2014
Latin American countriesAfrican countriesCIS countriesGulf countriesshare in total liabilities (right-hand scale)

Financial Stability Review, May 2015 31
the last years, structural balances are expected to remain well below the medium-term objective set by individual euro area countries in the context of the Stability and Growth Pact (see Chart 1.12). In fact, the concrete implementation of reform and consolidation commitments appears to have dwindled, while also proceeding at an uneven pace across countries. For the euro area as a whole, the fiscal stance is expected to remain neutral given the lack of further intensification of consolidation efforts, as reflected by the flat profile of the euro area structural budget balance since 2013 at about 1% of GDP, following major consolidation efforts in 2011 and 2012. Further progress with fiscal consolidation is needed to anchor long-term public debt sustainability and restore fiscal buffers.
Chart 1.12 …highlighting the need for sustainable public finance settings at the national level
Structural balances and medium-term fiscal objectives across the euro area (2011-2014; 2015; percentage of GDP)
Source: European Commission’s spring 2015 economic forecast.
Notwithstanding these challenges to public finances, the unwinding of financial sector support is expected to contribute to the improvement of fiscal balances in many countries. In this context, following major one-off events in 2014 in Austria, Cyprus, Portugal and Slovenia, support to the financial sector is expected to decrease in almost all euro area countries in 2015 and 2016, with many countries already starting to recover at least part of the liquidity and/or capital support provided to financial institutions during the crisis. Going forward, bail-in and bank resolution arrangements based on the provisions of the Bank Recovery and Resolution Directive and the Single Resolution Mechanism should limit the future potential for contingent liabilities of any given country vis-à-vis its banking sector.
-6
-5
-4
-3
-2
-1
0
1
2
IE FR ES BE MT SI CY SK PT LT EA NL IT AT GR FI LV EE DE LU
2011-14 structural balance2015 structural balancemedium-term objective
Chart 1.11 Sovereign tensions contained in most (but not all) euro area countries…
Composite indicator of systemic stress in euro area sovereign bond markets (Jan. 2005 – Apr. 2015)
Sources: ECB and ECB calculations. Notes: Aggregation of country indicators capturing several stress features in the corresponding government bond markets (changing default risk expectations, risk aversion, liquidity risk and uncertainty) for vulnerable (Greece, Ireland, Italy, Portugal and Spain) and other (Austria, Belgium, Germany, Finland, France and the Netherlands) countries. The range reflects the maximum and minimum across the entire set of the above-mentioned countries. For further details on the CISS methodology, see Hollo, D., Kremer, M. and Lo Duca, M., “CISS – a composite indicator of systemic stress in the financial system”, Working Paper Series, No 1426, ECB, March 2012.
0.0
0.2
0.4
0.6
0.8
1.0
2005 2006 2007 2008 2009 2010 2011 2012 2013 2014 2015
minimum-maximum range vulnerable euro area countrieseuro area average other euro area countries

Financial Stability Review, May 2015 32
Against this backdrop, structural reforms remain a key ingredient for bolstering economic recovery and reducing interest rate-growth differentials, thereby mitigating public debt sustainability concerns. On average, the euro area public debt-to-GDP ratio has reached 94.2% of GDP in 2014, and it is projected by the European Commission to fall to 92.5% of GDP by 2016. Having said that, compared with earlier projections, reduced fiscal efforts and slower than expected output growth have in the last few years contributed to the continuous shifts of the peak debt-to-GDP level over time (see Chart 1.13), which may undermine market confidence in public debt sustainability.
In terms of the evolution of public debt levels, the outlook has slightly improved after the adoption of the expanded asset purchase programme, thanks to somewhat lower interest payments and higher expected nominal growth. Still, the picture is rather heterogeneous at the country level. Ten euro area countries are forecast to reduce their debt ratios over the 2014-16 horizon, in particular on account of primary surpluses, but in most cases also driven by positive interest rate-growth differentials (see Chart 1.14). Regarding public debt sustainability, the most important risks across the euro area relate to complacency in terms of fiscal adjustment and structural reforms, a slower than expected recovery in economic activity and a prolonged period of low inflation. Such developments would impede the debt servicing abilities of sovereigns, in particular of those which currently face heightened market optimism and downward rigidities in fiscal positions. While the Eurosystem’s expanded asset purchase programme addresses the risk of a too prolonged period of low inflation (see Box 1), it may have the unintended consequence of reducing governments’ incentives to undertake the necessary structural reforms or fiscal adjustments in countries where they are needed. Against this background, maintaining an appropriate level of fiscal discipline and continuing reform efforts is key.
Chart 1.13 Reduced fiscal effort and lower than expected output growth lead to a shift of debt peak forecasts over time...
Public debt forecasts for the euro area (2012-2016; percentage of GDP; different lines indicate different forecast vintages)
Source: European Commission (different forecast vintages). Note: The impact of the transition to the European System of Accounts 2010 between the spring 2014 forecast and the autumn 2014 forecast is eliminated by assuming a common debt ratio in 2012 for all vintages equal to the value reported in the winter 2015 forecast. From this common starting value, in the pre-ESA 2010 forecast vintages the debt ratio follows the profile specific to each forecast vintage.
Chart 1.14 …but developments at the country level are fairly heterogeneous
Changes in public debt levels across the euro area (2014-2016; percentage points of GDP)
Source: European Commission’s spring 2015 forecast.
90.5
91.5
92.5
93.5
94.5
95.5
2012 2013 2014 2015 2016
spring 2013 autumn 2013 winter 2014spring 2014 autumn 2014 winter 2015
-10
-8
-6
-4
-2
0
2
4
6
8
FI ES FR LU AT CY SI LV NL SK BE EE IT EA MT LT GR IE DE PT
interest rate-growth differential primary deficitdeficit-debt adjustment change in debt 2014-16
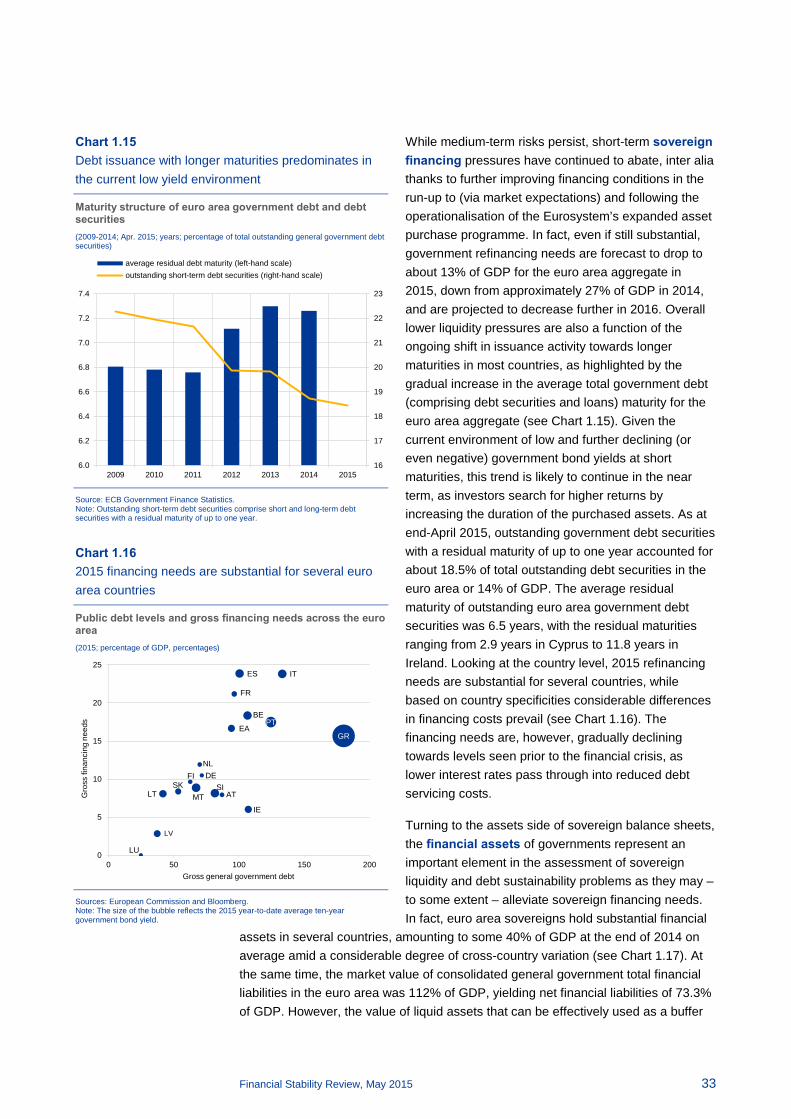
Financial Stability Review, May 2015 33
While medium-term risks persist, short-term sovereign financing pressures have continued to abate, inter alia thanks to further improving financing conditions in the run-up to (via market expectations) and following the operationalisation of the Eurosystem’s expanded asset purchase programme. In fact, even if still substantial, government refinancing needs are forecast to drop to about 13% of GDP for the euro area aggregate in 2015, down from approximately 27% of GDP in 2014, and are projected to decrease further in 2016. Overall lower liquidity pressures are also a function of the ongoing shift in issuance activity towards longer maturities in most countries, as highlighted by the gradual increase in the average total government debt (comprising debt securities and loans) maturity for the euro area aggregate (see Chart 1.15). Given the current environment of low and further declining (or even negative) government bond yields at short maturities, this trend is likely to continue in the near term, as investors search for higher returns by increasing the duration of the purchased assets. As at end-April 2015, outstanding government debt securities with a residual maturity of up to one year accounted for about 18.5% of total outstanding debt securities in the euro area or 14% of GDP. The average residual maturity of outstanding euro area government debt securities was 6.5 years, with the residual maturities ranging from 2.9 years in Cyprus to 11.8 years in Ireland. Looking at the country level, 2015 refinancing needs are substantial for several countries, while based on country specificities considerable differences in financing costs prevail (see Chart 1.16). The financing needs are, however, gradually declining towards levels seen prior to the financial crisis, as lower interest rates pass through into reduced debt servicing costs.
Turning to the assets side of sovereign balance sheets, the financial assets of governments represent an important element in the assessment of sovereign liquidity and debt sustainability problems as they may – to some extent – alleviate sovereign financing needs. In fact, euro area sovereigns hold substantial financial
assets in several countries, amounting to some 40% of GDP at the end of 2014 on average amid a considerable degree of cross-country variation (see Chart 1.17). At the same time, the market value of consolidated general government total financial liabilities in the euro area was 112% of GDP, yielding net financial liabilities of 73.3% of GDP. However, the value of liquid assets that can be effectively used as a buffer
Chart 1.15 Debt issuance with longer maturities predominates in the current low yield environment
Maturity structure of euro area government debt and debt securities (2009-2014; Apr. 2015; years; percentage of total outstanding general government debt securities)
Source: ECB Government Finance Statistics. Note: Outstanding short-term debt securities comprise short and long-term debt securities with a residual maturity of up to one year.
Chart 1.16 2015 financing needs are substantial for several euro area countries
Public debt levels and gross financing needs across the euro area (2015; percentage of GDP, percentages)
Sources: European Commission and Bloomberg. Note: The size of the bubble reflects the 2015 year-to-date average ten-year government bond yield.
16
17
18
19
20
21
22
23
6.0
6.2
6.4
6.6
6.8
7.0
7.2
7.4
2009 2010 2011 2012 2013 2014 2015
average residual debt maturity (left-hand scale)outstanding short-term debt securities (right-hand scale)
ITES
PT
FR
EA
SIDE
GR
SKFI
ATLT MT
LV
LU0
5
10
15
20
25
0 50 100 150 200
Gro
ss fi
nanc
ing
need
s
Gross general government debt
IE
NL
BE

Financial Stability Review, May 2015 34
to finance the rollover of government liabilities varies across countries, ranging from 2.2% of GDP in France to some 18.2% of GDP in Slovenia. Shares and other equity accounted for the largest part of financial assets in most euro area countries, suggesting that privatisation of state-owned assets could play an important role in mitigating debt sustainability concerns provided that privatisation proceeds (see Chart 1.18) are used to retire public debt.
Chart 1.18 …while privatisation revenues may help alleviate debt sustainability concerns
Privatisation revenues in the euro area (1998-2014; percentage of GDP)
Sources: ECB Government Finance Statistics and ECB calculations. Note: The yellow line indicates the average value over the period 1995-2014.
1.3 Improving financing conditions in the non-financial private sector underpin decreasing fragmentation
The income and earnings dynamics of the euro area non-financial private sector have shown recent signs of improvement, though remaining muted and largely mirroring the euro area macroeconomic environment. The income situation of households has seen real disposable income growth accelerating amid low inflation outturns, while distance-to-distress indicators capturing household balance sheet risks suggest that overall credit risks related to household balance sheets in the euro area are much less pronounced than at the height of the euro area sovereign debt crisis (see Chart 1.19). A continued recovery of the euro area household sector is expected, buttressed by overall improving labour market conditions, even if the situation continues to be weak in more vulnerable euro area countries, thereby still weighing on households’ income prospects. That said, households’ expectations regarding their employment and financial situations have become more optimistic with the economic recovery regaining momentum. This perception is also corroborated by observed improvements in household net worth (see Chart 1.20). For the first time since end-2011, holding gains on housing assets have been mildly
0
0.1
0.2
0.3
0.4
0.5
0.6
0.7
0.8
1998 2000 2002 2004 2006 2008 2010 2012 2014
Chart 1.17 Available short-term liquid financial assets may help cushion possible sudden financing needs…
Structure of euro area governments’ financial assets (Q4 2014; percentage of GDP)
Sources: Eurostat, national sources and ECB calculations. Note: Other assets classified as short-term include short-term debt securities, short-term loans and monetary gold.
0102030405060708090
100110120130140
FI LU SI AT IE EE PT GR FR EA NL CY DE ES MT LV BE LT IT SK
long-term debt securities other assets classified as short-termother accounts receivable shares and other equitymedium and long-term loans currency and depositstotal assets

Financial Stability Review, May 2015 35
positive in recent quarters in accordance with the observed gradual strengthening in housing market dynamics at the aggregate euro area level. These developments should help alleviate balance sheet pressures of stressed households with outstanding debt obligations.
Chart 1.20 …but improving net worth of households helps mitigate balance sheet pressures
Change in the net worth of euro area households (Q1 2007 – Q4 2014; four-quarter moving sums; percentage of gross disposable income)
Sources: ECB, Bloomberg, Thomson Reuters Datastream and ECB calculations. Notes: Other flows in non-financial assets include mainly holding gains and losses on real estate (including land). Other flows in financial assets and liabilities include mainly holding gains and losses on shares and other equity, while changes in net worth due to net saving comprise net saving, net capital transfers received and the discrepancy between the non-financial and the financial accounts. Based on the standards of the European System of Accounts 2010 (ESA 2010).
Corporate balance sheet risks have remained limited against the backdrop of improving growth prospects, historically low funding costs and low probabilities of default. However, estimated sectorial distance to distress signals somewhat increasing credit risks towards year-end 2014 as market volatility has edged up (see Chart 1.21). The earnings-generating capacity of euro area non-financial corporations has improved slightly, driven by the gradual economic recovery, yet corporate profitability has remained muted, with non-financial corporations’ gross operating surplus remaining broadly unchanged over the course of 2014. Being a function of overall economic developments, corporate earnings in the euro area are expected to rise as the economic recovery gathers pace.
These developments, combined with an environment of low interest rates, have brought the interest payment burden of households and non-financial firms to new record lows (see Chart 1.22). Borrowers, however, have seen some rise in their real debt burden amid recent low inflation outturns, in particular (but not only) in countries with still ongoing relative price adjustments. Looking ahead, the ongoing balance sheet repair should help offset the risks related to an eventual normalisation of interest rates and the ensuing rise in debt servicing costs. This might challenge borrowers in those countries where loans with floating rates or rates with rather short fixation periods are more widespread. A higher debt service burden for borrowers in
-40
-30
-20
-10
0
10
20
30
40
50
60
2007 2008 2009 2010 2011 2012 2013 2014
other flows in non-financial assetsother flows in financial assets and liabilitieschange in net worth due to net savingchange in net worth
Chart 1.19 Risks related to household balance sheets remain at elevated levels…
Households’ distance to distress in the euro area (Q1 2005 – Q4 2014; number of standard deviations from estimated default point)
Sources: ECB, Bloomberg, Thomson Reuters Datastream and ECB calculations. Notes: A lower reading for distance to distress indicates higher credit risk. The chart shows the median, minimum, maximum and interquartile distribution across 11 euro area countries for which historical time series cover more than one business cycle. For details on the indicator, see Box 7 in Financial Stability Review, ECB, December 2009.
0
5
10
15
20
25
30
2005 2006 2007 2008 2009 2010 2011 2012 2013 2014

Financial Stability Review, May 2015 36
a rising interest rate environment is, however, likely to be partly offset by the positive impact of a pick-up in economic dynamics on households’ and firms’ income and earnings situation.
Chart 1.22 Interest payment burdens of households and non-financial corporations have touched record lows
Interest payment burden of the euro area non-financial private sector (Q1 2007 – Q4 2014; four-quarter moving sums; percentages)
Sources: ECB and Eurostat. Note: Based on ESA 2010 standards.
More favourable income and earnings prospects notwithstanding, legacy balance sheet concerns continue to constrain the non-financial private sector in the euro area, particularly firms. On average, euro area household indebtedness stood at slightly above 60% of GDP at end-2014, a figure which – while not remarkable by international standards – remains high by historical standards and has declined only marginally since the peak in mid-2010 despite weak loan dynamics. Muted household income growth over the past years and adverse labour market conditions in several countries, combined with lengthy insolvency regimes, have tended to inhibit a swift deleveraging. The level of indebtedness of the non-financial corporate sector was more elevated at 107% of GDP (on an unconsolidated basis, excluding trade credit) or 83% of GDP on a fully consolidated basis (see Chart 1.23). On average, corporate indebtedness remains elevated by historical and international standards, including benchmarks as defined in European macroeconomic surveillance, both on a consolidated and unconsolidated basis.
More generally, balance sheet repair has continued to be gradual, given weak nominal GDP growth and non-financial corporations’ increased recourse to market-based funding in recent years. The estimated debt overhang of euro area households and firms – i.e. the difference between (estimated) benchmark and actual debt-to-GDP levels – declined further over the course of 2014, reaching levels which imply some residual deleveraging needs (see Chart 1.24). Still, the aggregate euro area household and corporate debt figures continue to mask sizeable heterogeneity
02468101214161820
0123456789
10
2007 2008 2009 2010 2011 2012 2013 2014
net interest payments-to-gross operating surplus ratio of non-financialcorporations (left-hand scale)gross interest payments-to-gross operating surplus ratio of non-financialcorporations (right-hand scale)households' interest income as a percentage of gross disposable income(left-hand scale)households' interest expenditures as a percentage of gross disposableincome (left-hand scale)
Chart 1.21 Corporate balance sheet risks remain lower than during the euro area sovereign debt crisis
Non-financial corporations’ distance to distress in the euro area (Q1 2005 – Q4 2014; number of standard deviations from estimated default point)
Sources: Eurostat and ECB. Notes: A lower reading for distance to distress indicates higher credit risk. The chart shows the median, minimum, maximum and interquartile distribution across 11 euro area countries for which historical time series cover more than one business cycle. For details on the indicator, see Box 7 in Financial Stability Review, ECB, December 2009.
0
5
10
15
20
25
30
35
2005 2006 2007 2008 2009 2010 2011 2012 2013 2014

Financial Stability Review, May 2015 37
across countries, implying that in some countries the possible remaining deleveraging needs could imply a drag on growth going forward. Particularly in terms of corporate deleveraging, the pace of adjustment differed markedly across the euro area, with deleveraging being more forceful in countries which had accumulated large amounts of debt prior to the crisis, e.g. Ireland and Spain. The same is true for deleveraging at the sector level, where overindebted sectors, such as construction and real estate services, continue to deleverage more strongly than less-indebted ones such as industry or trade.
Chart 1.24 Debt overhang is gradually easing in the non-financial private sector
Excess level of corporate and household debt in the euro area (Q1 2006 – Q4 2014; percentage of real GDP)
Sources: ECB and ECB calculations. Notes: The loan gaps denote the deviation of actual loans from the levels that would have resulted from reference paths for loan growth calculated on the basis of assumptions for “trend” developments in the model determinants weighed together with the estimated long-run model elasticities. For the model and methodology underlying the calculation of loan gaps in more detail, see Annex 6 of Chapter 7 in Enhancing Monetary Analysis edited by Papademos, L. and Stark, J., 2010.
Bank lending flows to the non-financial private sector have remained muted overall given the ongoing process of balance sheet repair in both the financial and non-financial sectors. However, the underlying short-term dynamics of bank lending have shown incipient signs of a recovery on the back of strengthening demand and receding supply-side constraints (see Chart 1.25). On average, bank lending to euro area households has remained subdued, mirroring continued sluggish dynamics of household income, high levels of unemployment, remaining deleveraging needs and housing market weakness in some more vulnerable euro area countries. That said, this relatively lacklustre aggregate picture masks rather heterogeneous developments at the country level, with annual growth rates ranging from some -10% in Ireland to over +10% in Slovakia. Turning to the components of bank lending by purpose, modest annual growth in loans for house purchase has been offset by a continued (albeit decelerating) drop in consumer loans and other types of lending.
0
10
20
30
40
50
60
0
5
10
15
20
25
30
2006 2007 2008 2009 2010 2011 2012 2013 2014
non-financial corporations' real loan gap(benchmark real GDP, left-hand scale)household real loan gap(benchmark real GDP, left-hand scale)non-financial corporations' real loan gap(benchmark loan stock, right-hand scale)household real loan gap(benchmark loan stock, right-hand scale)
Chart 1.23 Non-financial corporations’ indebtedness continued to edge down, but is still elevated by international and historical standards
Corporate debt ratios in the euro area and benchmark debt levels (Q1 2006 – Q4 2014; percentage of GDP)
Sources: Eurostat and ECB. Notes: Fully consolidated debt includes loans net of intra-sectoral loans, debt securities and pension reserves. Partly consolidated debt includes trade credit in addition to the instruments included in consolidated debt, while unconsolidated debt also includes intra-sectoral loans. The MIP benchmark refers to the European Commission´s macroeconomic imbalance procedure, with the 133% of GDP limit for fully consolidated non-financial private sector debt split between firms and households based on their average past shares in the stock of non-financial private sector debt. The BIS benchmark refers to the threshold after which debt is found to have a significant adverse impact on growth.
70
80
90
100
110
120
130
140
2006 2007 2008 2009 2010 2011 2012 2013 2014
non-financial corporate debt (unconsolidated)non-financial corporate debt (unconsolidated, excl. trade credit)non-financial corporate debt (partially consolidated)non-financial corporate debt (fully consolidated)BIS benchmark (unconsolidated)MIP benchmark (fully consolidated)

Financial Stability Review, May 2015 38
Looking ahead, the April 2015 euro area bank lending survey suggests further improvements in households’ financing conditions, as reflected by the continued easing of credit standards on loans to households, in particular for consumer loans and other lending, and the further net increase in demand for all loan categories. Supply-side constraints appear to be easing particularly for consumer loans and other lending to households given increased competitive pressures, but banks’ higher risk tolerance has also contributed to the net easing of credit standards. By contrast, banks tightened slightly their credit standards in net terms for loans to households for house purchase. While competition continued to be the dominant factor contributing to an easing of credit standards on housing loans, banks’ risk tolerance contributed marginally to the overall net tightening of credit standards for housing loans. On the demand side, improving consumer confidence, the low general level of interest rates, more favourable housing market
prospects and increased financing needs for spending on durable consumer goods have translated into a continued net increase in demand for housing loans and consumer credit.
The net external financing of euro area non-financial corporations has stabilised at modest levels in early 2015, after recovering in 2014 (see Chart 1.26). The decline in new bank loans to non-financial corporations, albeit strongly decelerating over the course of 2014, was more than compensated for by funds obtained from other funding sources. The issuance of debt securities strengthened again towards the end of 2014 and in early 2015, after moderating in late summer and early autumn last year, with the latter partly explained by easing access to bank credit. The issuance of quoted shares has increased considerably in recent quarters amid improved stock market sentiment. That said, bank funding substitution has still remained limited to larger firms and mainly those which are domiciled in countries with more developed capital markets (e.g. Germany, France), while small and medium-sized enterprises (SMEs) and large firms located in more vulnerable countries remained more
dependent on bank funding. Going forward, alongside improving supply and demand-side conditions, targeted Eurosystem measures to revive lending, i.e. the targeted longer-term refinancing operations or the asset-backed securities and covered bond purchase programmes, should promote the recovery of credit going forward, while at
Chart 1.25 Bank lending to the euro area non-financial private sector has shown signs of recovery
Bank lending to the euro area non-financial private sector (Jan. 2010 – Mar. 2015; annual percentage changes; percentages)
Source: ECB. Note: Data have been adjusted for loan sales and securitisation.
Chart 1.26 External financing conditions for euro area non-financial corporations continued to improve
External financing of euro area non-financial corporations (Q1 2006 – Q1 2015; EUR billions; four-quarter moving flows)
Sources: Eurostat, ECB, Dealogic and ECB calculations.
-6
-4
-2
0
2
4
2010 2011 2012 2013 2014 2015
3-month growth of loans to households3-month growth of loans to non-financial private sector3-month growth of loans to non-financial corporationsannual growth of loans to householdsannual growth of loans to non-financial private sectorannual growth of loans to non-financial corporate sector
-200-100
0100200300400500600700800900
2006 2007 2008 2009 2010 2011 2012 2013 2014 2015
loans from non-monetary financial institutionsnet issuance of quoted sharesnet issuance of debt securitiesloans from monetary financial institutionstotal

Financial Stability Review, May 2015 39
the same time contributing to a further decrease in funding costs for non-financial firms in the euro area.
That said, the results of the latest euro area bank lending survey suggest that underwriting terms for corporate loans have continued to improve, driven in particular by banks’ lower cost of funds and alleviating balance sheet constraints as well as increased competition. Across firm sizes, credit standards were eased on loans to both large firms and SMEs. However, according to the ECB’s latest survey on access to finance of enterprises in the euro area, banks’ willingness to grant a loan continues to be somewhat higher for large firms (see Chart 1.27). This is also corroborated by the fact that the success of large firms when applying for a bank loan was higher than for SMEs, indicating overall better access to finance of large firms compared with SMEs. Demand for corporate loans in the euro area continued to rise, but cross-country heterogeneity has remained considerable. Financing needs related to inventories and working capital and in particular the low general level of interest rates contributed strongly to the demand for loans to enterprises. The issuance of debt securities by non-financial corporations and firms’
internal financing capacity contributed negatively to loan demand.
Corporate liquidity buffers have remained high at some 30% of GDP in the euro area, suggesting that alongside external funding sources non-financial firms can also rely on internal funds as a financing source. That said, these high liquidity buffers may reflect a lack of investment opportunities but also precautionary motives (i.e. mitigating the risk of limited access to external financing in the future) in the context of a low opportunity cost of holding liquid assets and perceived risks associated with access to bank funding in some countries. Still, firming economic growth prospects coupled with waning uncertainty regarding the prevalent business conditions could unlock these resources and may help make an important contribution to financing the economic recovery.
Funding costs of the euro area non-financial private sector have continued to decline across most business lines, maturities and funding sources. In fact, the composite cost-of-borrowing indicators for euro area households and non-financial corporations have continued to drop (see Chart 1.28), with a decreasing wedge between non-financial firms located in vulnerable and other euro area countries since the height of the euro area sovereign debt crisis. Still, fragmentation in financing conditions persists, with the impacts of the latest standard and non-standard monetary policy measures yet to be fully passed through.
Chart 1.27 Easier access to funding for large firms as well as small and medium-sized enterprises…
Financing conditions of euro area SMEs in comparison with large firms (H1 2009 – H1 2014; net percentages of respondents; changes over the past six months)
Source: ECB calculations based on the survey on access to finance of enterprises (SAFE). Note: The level of interest rates and collateral requirements are presented using an inverted scale.
-60
-50
-40
-30
-20
-10
0
10
20
30
40
50
'09 '10 '11 '12 '13 '14 '09 '10 '11 '12 '13 '14 '09 '10 '11 '12 '13 '14
Willingness of banks toprovide credit
Level of interest rates Collateral requirements
large firmssmall and medium-sized enterprises
Improving financing conditions
Deteriorating financing conditions

Financial Stability Review, May 2015 40
Chart 1.29 Nominal funding costs for euro area households have reached record lows in all lending categories…
Euro area nominal bank lending rates on new loans to households (Jan. 2007 – Mar. 2015; percentages)
Source: ECB.
More specifically, nominal financing costs for euro area households have reached their lowest levels since the start of the reporting of harmonised euro area bank lending rates in 2003 for all categories of lending (see Chart 1.29), while real funding costs tended to edge up at the turn of 2014-15 due to lower inflation outturns. Likewise, non-financial corporations’ overall nominal financing costs have continued to fall across all external financing sources, supported by a low interest rate environment as well as further improving financial market conditions and a better economic growth outlook following the announcement and implementation of the Eurosystem’s expanded asset purchase programme. In particular, the cost of market-based debt has reached record lows amid lower corporate default expectations and the ongoing search for yield. Bank lending rates declined further across the maturity spectrum as the monetary policy measures taken since June 2014 took hold, but lending rates continue to vary across countries and firm sizes, with still less favourable conditions faced by small firms, particularly in more vulnerable countries. The cost of equity for firms has dropped since the end of 2014 (see
0
1
2
3
4
5
6
7
8
9
2007 2008 2009 2010 2011 2012 2013 2014 2015
consumer lendinglending for house purchaseother lending
Chart 1.28 ...is accompanied by lower funding costs for both non-financial corporations and households
Composite indicators of the nominal cost of bank borrowing for euro area households (for house purchase) and non-financial corporations, the ECB policy rate and EONIA (Jan. 2005 – Mar. 2015; percentages)
Sources: ECB and ECB calculations. Notes: The indicator for the total cost of lending is calculated by aggregating short and long-term rates using a 24-month moving average of new business volumes. For methodological details on the construction of the cost-of-borrowing indicator, see “Assessing the retail bank interest rate pass-through in the euro area at times of financial fragmentation”, Monthly Bulletin, ECB, August 2013.
Chart 1.30 …as have euro area non-financial corporate funding costs
Nominal cost of external financing of euro area non-financial corporations (Jan. 2007 – Apr. 2015; percentages)
Sources: ECB, Merrill Lynch, Thomson Reuters Datastream and ECB calculations. Notes: The overall cost of financing for non-financial corporations is calculated as a weighted average of the cost of bank lending, the cost of market-based debt and the cost of equity, based on their respective amounts outstanding derived from the euro area accounts. The cost of equity estimates are based on a three-stage dividend discount model.
-1
0
1
2
3
4
5
6
7
2005 2006 2007 2008 2009 2010 2011 2012 2013 2014 2015
non-financial corporations in vulnerable euro area countriesnon-financial corporations in other euro area countrieshouseholds in vulnerable euro area countrieshouseholds in other euro area countriesminimum bid rate in main refinancing operationsEONIA
0
1
2
3
4
5
6
7
8
9
10
2007 2008 2009 2010 2011 2012 2013 2014 2015
overall cost of financing cost of market-based debtshort-term bank lending rate long-term bank lending ratecost of quoted equity

Financial Stability Review, May 2015 41
Chart 1.30), touching pre-crisis levels amid ebullient equity markets, falling equity risk premia and higher expected dividend payouts in many countries.
The overall development of euro area property markets remained muted in the second half of 2014, albeit amid growing signs of a firming recovery in a number of countries. After almost three years of price declines, residential property markets have exhibited a moderate growth path at the aggregate euro area level. Euro area commercial property markets have also continued their recovery, while underlying price trends in the prime and non-prime market segments have continued to diverge considerably (see Chart 1.31).
Despite signs that the recovery is becoming more broad-based across countries, particularly in the commercial property segment, cross-country heterogeneity remains high in both the residential and commercial property realms. This largely relates to signs that a major multi-year correction in the aftermath of the global financial crisis is nearing completion for many euro area countries. Indeed, country-level data indicate a strong rebound in residential and prime commercial property price growth in a number of
countries, notably Ireland, the Netherlands and Spain (see Chart 1.32). By contrast, property prices continued to drop in countries such as Cyprus, Greece and Slovenia, in particular in the residential segment.
Given their inherent granularity, property price aggregates at the country level might not fully capture divergent underlying regional price trends, most notably in situations where strong house price growth in supply-constrained metropolitan areas contrasts with subdued price developments in other regions. In fact, price growth in the capital city/largest cities has exceeded the corresponding price changes at the national level in several countries in recent years, in particular in Austria, Germany and Ireland (see Chart 1.33), highlighting the risk that strong house price growth could potentially ripple out to surrounding areas. The potential for this is, however, likely to be limited in many countries at the current juncture, given favourable supply-side conditions outside large cities and/or newly adopted macroprudential measures which aim to rein in any potential house price exuberance going forward (e.g. in Ireland). So far the ongoing housing market recovery or the regional buoyancy of euro area residential property markets has not translated into rapid credit growth. Pent-up demand from domestic cash buyers in the current low yield environment as well as the presence of alternatively financed foreign buyers in certain (mainly high-priced) market segments, in particular in large cities, may help explain these developments.
Chart 1.31 In line with the overall economy, euro area residential and commercial property prices continued to recover
Euro area commercial and residential property values and the economic cycle (Q1 2005 – Q4 2014; percentage change per annum)
Sources: Eurostat, ECB, experimental ECB estimates based on IPD and national data, and Jones Lang Lasalle.
-8
-6
-4
-2
0
2
4
6
8
10
-20
-15
-10
-5
0
5
10
15
20
25
2005 2006 2007 2008 2009 2010 2011 2012 2013 2014
GDP (right-hand scale)residential property pricescommercial property pricesprime commerical property prices
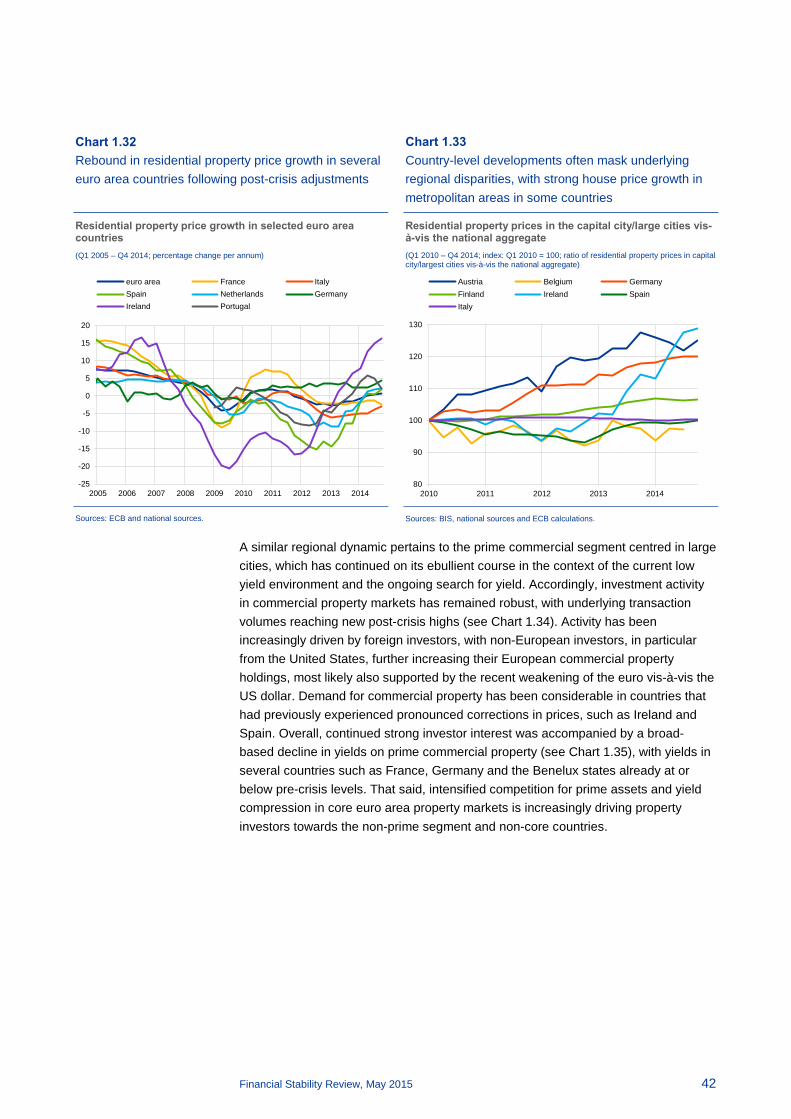
Financial Stability Review, May 2015 42
Chart 1.33 Country-level developments often mask underlying regional disparities, with strong house price growth in metropolitan areas in some countries
Residential property prices in the capital city/large cities vis-à-vis the national aggregate (Q1 2010 – Q4 2014; index: Q1 2010 = 100; ratio of residential property prices in capital city/largest cities vis-à-vis the national aggregate)
Sources: BIS, national sources and ECB calculations.
A similar regional dynamic pertains to the prime commercial segment centred in large cities, which has continued on its ebullient course in the context of the current low yield environment and the ongoing search for yield. Accordingly, investment activity in commercial property markets has remained robust, with underlying transaction volumes reaching new post-crisis highs (see Chart 1.34). Activity has been increasingly driven by foreign investors, with non-European investors, in particular from the United States, further increasing their European commercial property holdings, most likely also supported by the recent weakening of the euro vis-à-vis the US dollar. Demand for commercial property has been considerable in countries that had previously experienced pronounced corrections in prices, such as Ireland and Spain. Overall, continued strong investor interest was accompanied by a broad-based decline in yields on prime commercial property (see Chart 1.35), with yields in several countries such as France, Germany and the Benelux states already at or below pre-crisis levels. That said, intensified competition for prime assets and yield compression in core euro area property markets is increasingly driving property investors towards the non-prime segment and non-core countries.
80
90
100
110
120
130
2010 2011 2012 2013 2014
Austria Belgium GermanyFinland Ireland SpainItaly
Chart 1.32 Rebound in residential property price growth in several euro area countries following post-crisis adjustments
Residential property price growth in selected euro area countries (Q1 2005 – Q4 2014; percentage change per annum)
Sources: ECB and national sources.
-25
-20
-15
-10
-5
0
5
10
15
20
2005 2006 2007 2008 2009 2010 2011 2012 2013 2014
euro area France ItalySpain Netherlands GermanyIreland Portugal

Financial Stability Review, May 2015 43
Chart 1.35 Yields on prime commercial property across euro area countries have dropped further amid continued signs of search for yield
Yields on prime commercial property in the euro area (Q1 2007 – Q1 2015; percentages, maximum, minimum, interquartile distribution and average)
Source: Jones Lang Lasalle. Note: The euro area countries covered are Austria, Belgium, Finland, France, Germany, Ireland, Italy, Luxembourg, the Netherlands, Portugal and Spain.
Valuation metrics for the euro area as a whole suggest that residential property prices are broadly in line with fundamentals, but moved further away from their long-term average for prime commercial property given continued strong price increases (see Chart 1.36). However, these aggregates harbour heterogeneous developments across countries, while similar disparities may emerge at the regional level, as reflected by signs of overvaluation of residential property in some large cities in Austria and Germany. It needs to be stressed though that valuation estimates are surrounded by a high degree of uncertainty as they do not capture country-level aspects, such as fiscal treatment or other structural market specificities (see Box 3).
All in all, the recovery in euro area residential and commercial property markets is ongoing and should gather further momentum on the back of favourable financing conditions and improving economic growth prospects. However, the outlook for euro area residential and commercial property markets remains vulnerable from two angles. First, adverse economic shocks could reverse improvements seen in many countries and market segments and would further challenge those investors and borrowers who are already confronted with difficulties. Second, any disruption to financing conditions through, for instance, increased global risk aversion could affect the debt servicing capacity of both households and commercial property investors via the more limited availability and higher cost of funding, thereby contributing to rising rollover risks and aggravating the interest payment burden. Against the backdrop of a strong rebound in some countries and asset classes, price developments should be carefully monitored in the current low yield environment with the related search for yield in some market segments.
2
3
4
5
6
7
8
9
2007 2008 2009 2010 2011 2012 2013 2014 2015
Chart 1.34 Buoyant developments in euro area prime commercial property markets have continued
Commercial property price changes and investment values in the euro area (Q1 2009 – Q4 2014; average of price changes in Austria, France, Germany, Ireland, the Netherlands and Spain)
Sources: DTZ Research, ECB, experimental ECB estimates based on IPD and national data, and Jones Lang Lasalle. Note: Four-quarter moving average of investment volumes.
-25
-20
-15
-10
-5
0
5
10
15
20
25
30
0
2
4
6
8
10
12
14
16
18
20
22
2009 2010 2011 2012 2013 2014
transaction volume (left-hand scale)overall market (right-hand scale)prime property (right-hand scale)

Financial Stability Review, May 2015 44
Chart 1.36 Valuation estimates for euro area residential property prices are in line with fundamentals, but they are above their long-term average for prime commercial property
Estimated over/undervaluation of residential and prime commercial property prices in the euro area (Q1 2002 – Q4 2014; percentages; euro area average, minimum-maximum range of valuation estimates)
Prime commercial property
Sources: Jones Lang Lasalle, ECB and ECB calculations. Notes: Valuation estimates for residential property prices are based on four different valuation methods: the price-to-rent ratio, the price-to-income ratio and two model-based methods. For details of the methodology, see Box 3 in Financial Stability Review, ECB, June 2011. For further details on valuation estimates for prime commercial property, see Box 6 in Financial Stability Review, ECB, December 2011.
Box 3 Statistical valuation metrics for residential property markets
Misaligned asset prices are among the key root causes of financial instability. This pertains particularly to residential property assets upon which the bulk of bank lending is secured. However, measures of the degree of house price misalignments from fundamentals are surrounded by a high degree of uncertainty. This reflects the challenge of adequately capturing the complex interaction of housing, rental and mortgage markets, as well as data constraints and measurement issues. In a cross-country setting, the challenge of identifying misalignments is made all the more difficult by the substantial heterogeneity in structural market characteristics across countries. Commonly used metrics are two statistical-based indicators, the house price-to-rent and house price-to-income indicators. This box assesses the usefulness of these statistical indicators when applied across euro area countries.
House price valuation metrics can provide useful information and a means of benchmarking developments against historical norms. In a cross-country setting, they can also provide a comparative framework for assessing imbalances in housing markets. From the policy perspective, such metrics entail a consistent benchmark to indicate whether further in-depth analysis is warranted at the country level at which point fuller cognisance can be taken of country specificities. Commonly used cross-country housing valuation metrics for this purpose can be broken down into two broad strands.
The first strand comprises statistical indicators and is the main focus of this box. This includes an indicator that relates house prices to rents based on an arbitrage assumption. Accordingly, if house prices rise beyond what is justified by fundamentals then households will postpone purchasing a house and rent instead, thereby producing downward pressure on house prices. The validity of this assumption rests on households having a viable alternative in the rental market. The extent to which this holds differs across euro area countries and largely depends on the scale and composition of national rental and owner-occupied markets. While on average rental markets only account for about 30% of the overall euro area housing sector, this differs considerably across
-20
-10
0
10
20
30
40
2002 2004 2006 2008 2010 2012 2014
Residential property
-20
-10
0
10
20
30
40
2002 2004 2006 2008 2010 2012 2014

Financial Stability Review, May 2015 45
countries (see Chart A). Further complicating this, rents may not always be set at market rates given considerable regulation of the sector. Last but not least, the house price-to-rent indicator typically assumes a constant long-term average, but there may be important structural breaks arising from policy changes. For these reasons, the house price-to-rent indicator, although commonly used as a benchmark for house price valuation, may not be a reliable metric for assessing valuations in some euro area countries.
Another statistical indicator relates house prices to income. Similar to the house price-to-rent ratio, such indicators are generally related to their long-term average. If the ratio lies above its long-term average, prospective buyers may find purchasing a home, and servicing the associated debt, more difficult, which should reduce demand and lead to downward pressures on house prices. Given a strong prevalence of mortgage financing, such indicators are often transformed into “affordability” measures, which are adjusted to reflect the prevailing average interest rate on bank loans for house purchase.
The affordability ratio can be adjusted for interest rate developments in a number of ways. An interest rate variable, derived from a standard annuity formula, can be incorporated directly into the affordability ratio5. Alternatively,
house prices can be regressed on income and mortgage interest rates and the residuals can be taken as the valuation estimates. To allow for the non-linear effect of interest rates on housing demand, the regression equation could be supplemented by a quadratic polynomial on interest rates. By way of illustration, house prices in the euro area as a whole appear moderately undervalued in 2014 when interest rates are taken on board (either by an annuity-based or a regression-based approach) rather than broadly in line with fundamentals as suggested by the basic house price-to-income indicator (see Chart B).
A separate strand relates house prices to a broader set of fundamental driving factors through multivariate regression analysis. While relating house prices to rents and incomes offers intuitive appeal and ease of construction, such measures might fail to capture important fundamental factors, notably those relating to the supply side of the housing market. In addition, given the symbiosis between housing and mortgage markets, developments in mortgage credit to households should be jointly modelled with house prices. That said, the fundamental factors themselves may be fragile. This is especially relevant in the case of mortgage credit6, as an assessment of
5 The ratio is constructed as follows: r/(1-(1+r)^(-T))*(house price index)/(income index) where T is the
mortgage term and r is the nominal mortgage interest rate. Typically, a mortgage term of 20 years and a fixed mortgage interest rate are assumed. The interest rate-adjusted affordability indicator is then calculated as the deviation in percentage terms of the ratio from its long-term average.
6 Muellbauer, J., “When is a housing market overheated enough to threaten stability?”, Discussion Paper Series, No 623, Department of Economics, University of Oxford, 2012.
Chart A Rental markets are relatively small in several euro area countries
Tenure status in euro area countries (2013; percentages)
Sources: European Commission SILC Survey and ECB calculations.
0
10
20
30
40
50
60
70
80
90
100
LT SK LV EEMTES SI GRPTCY FI IT LU BE IE NL EAFR ATDE
tenant, rent at reduced price or freetenant, rent at market priceowner
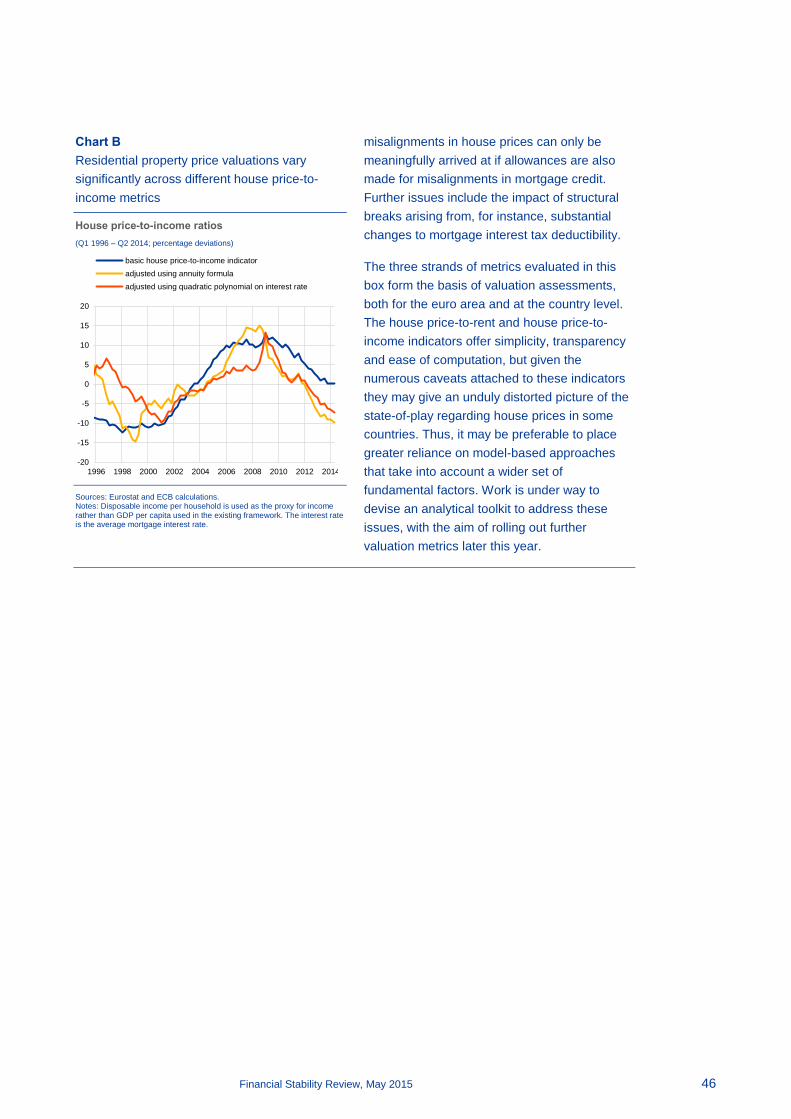
Financial Stability Review, May 2015 46
misalignments in house prices can only be meaningfully arrived at if allowances are also made for misalignments in mortgage credit. Further issues include the impact of structural breaks arising from, for instance, substantial changes to mortgage interest tax deductibility.
The three strands of metrics evaluated in this box form the basis of valuation assessments, both for the euro area and at the country level. The house price-to-rent and house price-to-income indicators offer simplicity, transparency and ease of computation, but given the numerous caveats attached to these indicators they may give an unduly distorted picture of the state-of-play regarding house prices in some countries. Thus, it may be preferable to place greater reliance on model-based approaches that take into account a wider set of fundamental factors. Work is under way to devise an analytical toolkit to address these issues, with the aim of rolling out further valuation metrics later this year.
Chart B Residential property price valuations vary significantly across different house price-to-income metrics
House price-to-income ratios (Q1 1996 – Q2 2014; percentage deviations)
Sources: Eurostat and ECB calculations. Notes: Disposable income per household is used as the proxy for income rather than GDP per capita used in the existing framework. The interest rate is the average mortgage interest rate.
-20
-15
-10
-5
0
5
10
15
20
1996 1998 2000 2002 2004 2006 2008 2010 2012 2014
basic house price-to-income indicatoradjusted using annuity formulaadjusted using quadratic polynomial on interest rate

Financial Stability Review, May 2015 47
2 Financial markets
Global financial markets have been characterised by intermittent resurgences in volatility in particular market segments (notably foreign exchange, commodity and, more recently, bond markets) and geographical regions (notably emerging markets). In the euro area, improving economic conditions accompanied by monetary policy measures contributed to dampening financial market volatility, with an associated increased appetite among investors for euro area assets, despite some flare-up of tensions at the country level. In money and credit markets, yields fell further, issuance increased, maturities lengthened, and country fragmentation declined amid reduced credit spreads and improved market access for entities of more vulnerable euro area countries. Euro area equity prices rose to seven-year highs and issuance increased in most of the more vulnerable euro area countries.
While current benign financial market conditions have a fundamental counterpart in the form of improving economic prospects, their breadth across asset classes and regions underscores the widespread nature of an ongoing search for yield in global financial markets. Faced with a prolonged period of low nominal growth, the current environment of increased financial risk-taking has so far had a limited real economic counterpart. If it continues for a protracted period of time, it could result in a build-up of imbalances. For the euro area, the prospects for asset price misalignments appear to differ across individual market segments and have a limited counterpart in credit growth. At the same time, as the search for yield continues in a global context, an incipient build-up of systemic risk could ensue from both strategic factors (most notably the incentive to shift from fundamental-driven to momentum-driven investment decisions) and amplification mechanisms (for instance, in the form of a low level of secondary market liquidity amplifying price reversals, as well as elevated duration exposures). Such mechanisms could be triggered by a re-evaluation of economic fundamentals underpinning asset valuations, resulting for example from tensions in emerging markets, political uncertainty in the euro area or a sharp adjustment in market expectations regarding the future path of monetary policy across major economies (notably including a monetary policy tightening widely anticipated by financial markets for the United States).
2.1 Money market rates hit historical lows as country fragmentation declines
Developments in euro area money markets have been characterised by a further compression of rates as well as a decline in fragmentation in secured segments. At the same time, there have been contained bouts of stress in certain segments amid increased financial market volatility. A higher than expected level of excess liquidity, as well as the announcement and implementation of further non-standard measures, put downward pressure on the money market curve. Rates in both the secured and unsecured segments fell to record lows. In response to declining rates, investors

Financial Stability Review, May 2015 48
have shown an increased willingness to take on duration and foreign exchange rate exposure, but remain cautious as regards credit risk.7 Nonetheless, fragmentation has declined amid improved access for the entities of more vulnerable countries to secured markets and a slight compression of credit spreads.
The pass-through of negative rates has been less pronounced in the unsecured money market segment where access is more favourable for higher-rated entities. The three-month EURIBOR, which is used as a reference for commercial and financial transactions, fell into negative territory. EURIBOR futures are also currently quoted at slightly negative levels; however, regulatory and economic considerations could maintain longer-dated EURIBOR rates at positive levels. The EONIA rate remained broadly stable at a level above the ECB’s deposit facility rate. At the same time, market contacts report that rates for certain banks are drifting towards, if not below, levels where it may become unprofitable for them to trade. This may result in a decline in trading volumes.
Rates in the secured money market segment fell deeper into negative territory and country fragmentation declined. The compression in rates was most pronounced at longer maturities and for entities from more vulnerable euro area countries. Access to repo markets has improved for Spanish and Italian banks using domestic collateral. Repo volumes collateralised with Spanish public sector assets and cleared via LCH.Clearnet increased to a record high and spreads narrowed further, amid better access to foreign funds and lower haircuts by central clearing counterparties. The first Italian bank joined Eurex GC Pooling, an encouraging sign that banks from vulnerable countries are again managing to diversify their funding sources especially towards international providers of liquidity.
Notwithstanding these improvements, volatility in global financial markets translated into temporary bouts of stress in certain segments. Sharp adjustments in commodity markets and exchange rates contributed to
a rise in global risk aversion. Price adjustments in riskier assets resulted in the closing-out of positions in short-term interest rate future markets to offset losses in other market segments. On certain occasions, in particular following the decision by the Swiss National Bank to abandon its euro ceiling, EURIBOR futures positions were closed to offset foreign exchange losses. While these short periods of tension did not translate into broad money market stress (see Chart 2.1), they indicate that
7 For example, money market fund managers responded to the challenge of a negative rate environment
by either creating new funds taking more duration risk or engaging in FX swaps which still enable them to generate positive returns.
Chart 2.1 Increased volatility in the euro area money market evident in a slight uptick in market-based measures of stress but conditions remain relatively calm
Spreads between unsecured interbank lending and overnight index swap rates (Jan. 2007 – May 2015; basis points; three-month maturities)
Sources: Bloomberg and ECB calculations.
euro area
UK
US
0
50
100
150
200
250
300
350
400
2007 2008 2009 2010 2011 2012 2013 2014 2015
GBP USD EUR
Finalisation of the Nov 2014 FSR
0
10
20
30
17 Nov. 17 Feb.
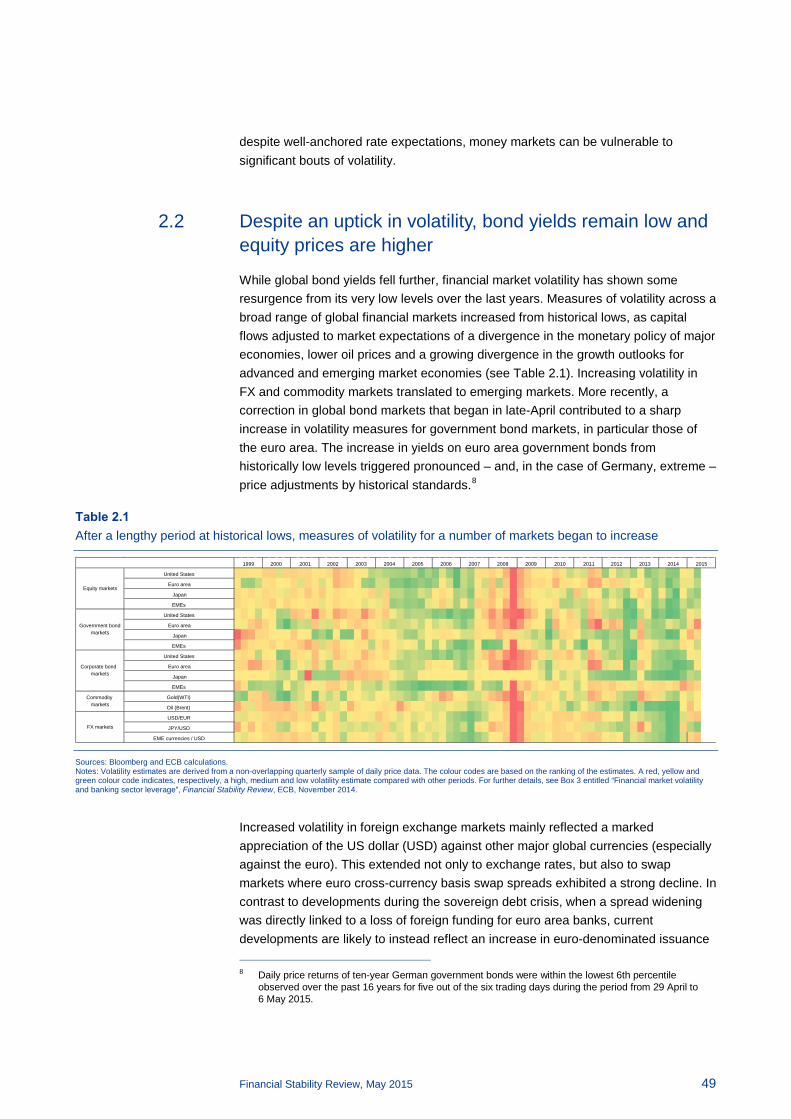
Financial Stability Review, May 2015 49
despite well-anchored rate expectations, money markets can be vulnerable to significant bouts of volatility.
2.2 Despite an uptick in volatility, bond yields remain low and equity prices are higher
While global bond yields fell further, financial market volatility has shown some resurgence from its very low levels over the last years. Measures of volatility across a broad range of global financial markets increased from historical lows, as capital flows adjusted to market expectations of a divergence in the monetary policy of major economies, lower oil prices and a growing divergence in the growth outlooks for advanced and emerging market economies (see Table 2.1). Increasing volatility in FX and commodity markets translated to emerging markets. More recently, a correction in global bond markets that began in late-April contributed to a sharp increase in volatility measures for government bond markets, in particular those of the euro area. The increase in yields on euro area government bonds from historically low levels triggered pronounced – and, in the case of Germany, extreme – price adjustments by historical standards.8
Table 2.1 After a lengthy period at historical lows, measures of volatility for a number of markets began to increase
Sources: Bloomberg and ECB calculations. Notes: Volatility estimates are derived from a non-overlapping quarterly sample of daily price data. The colour codes are based on the ranking of the estimates. A red, yellow and green colour code indicates, respectively, a high, medium and low volatility estimate compared with other periods. For further details, see Box 3 entitled “Financial market volatility and banking sector leverage”, Financial Stability Review, ECB, November 2014.
Increased volatility in foreign exchange markets mainly reflected a marked appreciation of the US dollar (USD) against other major global currencies (especially against the euro). This extended not only to exchange rates, but also to swap markets where euro cross-currency basis swap spreads exhibited a strong decline. In contrast to developments during the sovereign debt crisis, when a spread widening was directly linked to a loss of foreign funding for euro area banks, current developments are likely to instead reflect an increase in euro-denominated issuance 8 Daily price returns of ten-year German government bonds were within the lowest 6th percentile
observed over the past 16 years for five out of the six trading days during the period from 29 April to 6 May 2015.
United States
Euro area
Japan
EMEs
United States
Euro area
Japan
EMEs
United States
Euro area
Japan
EMEs
Gold(WTI)
Oil (Brent)
USD/EUR
JPY/USD
EME currencies / USD
201520142005 2006 2007 2008 2009 2012 20132011
FX markets
20101999 2000 2001 2002
Commodity markets
Corporate bond markets
Equity markets
Government bond markets
2003 2004

Financial Stability Review, May 2015 50
by US firms following a pronounced narrowing in euro credit spreads. As a result, euro-denominated issuance has become more attractive for US institutions with access to the euro market.
The combination of volatile FX and commodity markets contributed to stress in certain emerging markets. Volatility in FX and commodity markets quickly spread to credit and equity markets in regions with a high reliance on USD funding and commodity exports. Following a sharp appreciation of the US dollar and a decline in commodity prices, USD liabilities rose while USD revenues from commodity exports fell, reducing the natural exchange rate hedge for these regions. These more challenging financial conditions raised credit risk concerns, resulting in further capital outflows (see Chart 2.2). Tensions across all markets eased somewhat from February as commodity prices stabilised and market participants pushed back their expectations regarding the timing of US policy rate increases. However, capital flows remain sensitive to concerns regarding the growth outlook for Brazil, China and Russia and changing market expectations regarding the future path of global monetary policy.
Fixed income markets of advanced economies witnessed some sharp intraday movements which raised concerns that price adjustments were being
amplified by low levels of secondary market liquidity. Indeed, broad measures of market liquidity for euro area markets seem to indicate that secondary market liquidity is low compared with the pre-crisis era. While bid-ask spreads relative to their mid-point prices have fallen considerably from crisis peaks, they remain slightly above pre-crisis levels (see Chart 2.3). Moreover, turnover ratios showed a steady decline across most market segments, while the average deal size traded on the largest inter-dealer trading system for euro area government bonds (MTS) has shrunk by 33% on average (see Chart 2.4).
Recent developments raise more general concerns that market liquidity, while plentiful on aggregate, might be prone to insufficiency in certain key bond market segments during periods of stress (see Box 4). Market liquidity in sovereign and, to a larger extent, corporate bond markets depends on the ability and willingness of market-makers to respond to temporary imbalances. Worryingly, the ECB’s SESFOD survey reports reduced confidence among large banks in their ability to act as a market-maker in periods of stress.9 At the same time, balance sheet statistics imply a reduced capacity to act as market-makers. Euro area banks’ inventories of non-financial corporate bonds have fallen by a third since the onset of the global financial
9 See the December 2014 ECB “Survey on credit terms and conditions in euro-denominated securities
financing and over-the-counter derivatives markets” (SESFOD).
Chart 2.2 Strong inflows to euro area markets, but appreciation of the US dollar creates challenging conditions in emerging markets
Flows into bonds and equities by region, index of notional stock (Nov. 2014 – May 2015; index: 12 Nov. 2014 = 100)
Sources: Bloomberg and ECB calculations. Note: Vulnerable countries refer to Cyprus, Greece, Ireland, Italy, Portugal, Slovenia and Spain.
95
100
105
110
12-Nov 12-Feb 12-May
vulnerable euro area countries
non-vulnerable euro area countries
other advanced countries
emerging economies
95
100
105
110
12-Nov 12-Feb 12-May
Bonds Equities

Financial Stability Review, May 2015 51
crisis. While banks’ holdings of government debt securities have increased since 2008, this has been driven, to a large extent, by growth in held-to-maturity and available-for-sale portfolios rather than trading portfolios.
Chart 2.4 …but data on turnover ratios and average deal size for the sovereign bond markets indicate lower liquidity compared with the pre-crisis period
Turnover ratios and average deal size for euro area government bonds traded on MTS (turnover ratios; average deal sizes; 100 = average over period from Dec. 2004 to July 2007)
Sources: Mercato dei Titoli di Stato (MTS) and ECB calculations.
Box 4 Commonality of bid-ask spreads in euro area bond markets
Low secondary market liquidity and the potential for it to evaporate across market segments during periods of stress represent sources of systemic risk. In an environment of low liquidity, market shocks are amplified and propagated at a faster rate. While many measures indicate that global market liquidity is abundant on aggregate, its distribution within the financial system is not uniform. Broad liquidity measures for secondary fixed income markets indicate a deterioration in conditions (see Section 2.2). This development, alongside reports from large banks of reduced confidence in their ability to act as market-makers during stressed periods, raises concerns regarding the potential for liquidity to evaporate precisely at the moment when it is needed most.10 One means of measuring the propensity for systemic liquidity stress is to separate bond market liquidity into elements common across all market segments (such as investors’ risk perception and appetite for risk or general financial conditions) and elements that are largely idiosyncratic. This box analyses common factors of bid-ask spreads in euro area bond markets, thereby focusing on one particular aspect of liquidity, notably the “tightness” dimension.11
10 See, e.g., “Market-making and proprietary trading: industry trends, drivers and policy implications”,
CGFS Papers, No 52, Committee on the Global Financial System, 2014. 11 For a definition of the different dimensions of liquidity, see Kyle, A., “Continuous auctions and insider
trading”, Econometrica, Vol. 53, 1985, pp. 1315-1335.
0
50
100
150
200
AT BE DE ES FI FR GR IE IT NL
PT
Aug. 2007 to Apr. 2010 (banking crisis)May 2010 to July 2012 (sovereign crisis)Aug. 2012 to May 2015 (post-OMT)
Turnover ratios (indexed to pre-crisis period
Dec. 2004 to July 2007)
0
20
40
60
80
100
120
AT BE DE ES FI FR GR IE IT NL
PT
Average deal size(indexed to pre-crisis period
Dec. 2004 to July 2007)
Chart 2.3 Bid-ask spreads suggest an improvement in liquidity conditions since mid-2012…
Bid-ask spread over mid-point for selected euro area bond markets (Jan. 2005 – May 2015; basis points)
Sources: iBoxx and ECB calculations.
0.0
1.0
2.0
2005 2009 2013
DE ES FRIT NL
0.0
2.0
4.0
2005 2009 2013
Non-financials
0.0
0.5
1.0
2005 2009 2013
Sovereign Financials

Financial Stability Review, May 2015 52
More specifically, a principal component analysis applied to normalised bid-ask spreads across a number of euro area market segments, including large vulnerable (Spanish and Italian) and non-vulnerable (German, French and Dutch) sovereign and corporate bond markets, provides two striking results. First, two factors explain roughly 80% of the variation in bid-ask spreads across all market segments over the past decade (see Chart A). Second, the importance of these factors in driving liquidity conditions shifts from calm periods to periods of market distress (see Charts A and B). It appears that correlations of individual market segments and the common factors display characteristic patterns (see Chart B). One factor is positively correlated with all market segments, but it moves from the second principal component during the pre-crisis period (Stage I) to the first principal component at the onset of the global financial crisis (Stage II). Another factor mirroring the first displays opposing correlations with different segments, also changing over time; it moves from the first to the second principal component.12
Chart B Liquidity-driving forces shift from calm periods to periods of market distress
Correlations of first and second principal components with normalised bid-ask spreads (correlations)
Sources: iBoxx and ECB calculations. Notes: Stage I refers to the pre-crisis period from January 2004 to May 2007; Stage II refers to the period from June 2007 to mid-March 2009; Stage III refers to the period from mid-March 2009 to November 2009; Stage IV refers to the period from December 2009 to July 2012; and Stage V refers to the period from August 2012 to February 2015.
A possible way of explaining this predominant factor which drives liquidity conditions across markets in the same direction is to relate it to risk aversion. Before the onset of the global financial crisis, the explanatory power of this possible “risk aversion” factor – as reflected by the second principal component in Stage I – was relatively low (20-30%). It strengthened and is captured by the first principal component from the onset of the global financial crisis (Stage II onwards). At the height of the financial crisis – when risk aversion measures reached unprecedented levels following
12 It should be noted that the analysis considers non-overlapping sample periods, suggesting that the
interpretation of principal components may change over time.
-1.00
-0.50
0.00
0.50
1.00
Stage I Stage II Stage III Stage IV Stage V
financials, large non-vulnerable financials, large vulnerablesovereigns, large non-vulnerable sovereigns, large vulnerablenon-financials, large non-vulnerable non-financials, large vulnerable
-0.50
0.00
0.50
1.00
Stage I Stage II Stage III Stage IV Stage V
Correlations of first principal component with variables
Correlationsof second principal component with variables
Factor that is strongly positively correlated to all variables gains importance from onset of the financial crisis
Chart A Strong commonality in liquidity-driving forces, especially in periods of market distress
Principal component analysis of bid-ask spreads across selected euro area bond markets (Jan. 2004 – Feb. 2015; percentages)
Sources: iBoxx and ECB calculations. Notes: Stage I refers to the period from January 2004 to May 2007 (pre-crisis); Stage II refers to the period from June 2007 to mid-March 2009 (global financial crisis); Stage III refers to the period from mid-March 2009 to November 2009 (signs of tentative recovery in global economy); Stage IV refers to the period from December 2009 to July 2012 (sovereign debt crisis); and Stage V refers to the period from August 2012 to February 2015.
0
20
40
60
80
100
H12004
H12006
H12008
H12010
H12012
H1
percentage of variation explained by first and secondprincipal componentspercentage of variation explained by first principalcomponentpercentage of variation explained by second principalcomponentcrisis periods
0
20
40
60
80
100
Q3 Q12015
Stage I
Stage III
Stage IV Stage VStage II
2014

Financial Stability Review, May 2015 53
the collapse of Lehman Brothers – the factor explained over 90% of the variation in bid-ask spread movements across euro area markets. Its explanatory power was also elevated (above 80%) during the euro area sovereign debt crisis, peaking in the first half of 2012, a period during which the yields on ten-year Spanish and Italian government bonds rose to exceptionally high levels. More recently, the percentage of variation in bid-ask spread movements explained by a risk aversion factor rose sharply (to over 70%) in the second half of 2014, a period of increasing global uncertainty amid rising geopolitical tensions, concerns regarding Greece, and sharp adjustments in US Treasury and foreign exchange markets. However, the explanatory power of this factor has fallen to its lowest level since the global financial crisis emerged.
Mirroring this development, the explanatory power of another factor, possibly associated with risk-seeking affected market liquidity predominantly before the onset of the global financial crisis, has declined in recent years; it seems to have moved from the first (Stage I) to the second (Stages II to V) principal component. Since the onset of the global crisis, bid-ask spreads for sovereign markets, when compared with financial and non-financial corporates, appear to be inversely related to this factor, suggesting that a rebalancing of portfolios affected market liquidity. During the sovereign debt crisis (Stage IV), this rebalancing channel was concentrated mainly on non-vulnerable sovereigns and non-financial corporations from vulnerable markets. Financial institutions and vulnerable sovereigns were only marginally correlated with this factor throughout the sovereign debt crisis. More recently (Stage V), this factor starts to correlate more strongly with non-financials from non-vulnerable markets and has become stronger in explaining liquidity conditions (see Chart A).
Altogether, the analysis depicts strong commonality in forces driving the “tightness” dimension of liquidity across euro area secondary bond markets, with the two predominant factors possibly related to risk aversion and risk-seeking. In light of recent shifts in the main factors, it can be argued that risk-seeking may play a greater role in determining market liquidity amid a lower propensity for risk aversion to affect all markets simultaneously. Not least since risk-seeking is shown to be important for only a few market segments, pockets of illiquidity have become more likely. Thus, there is a key need to monitor the fragmentation of liquidity in bond markets, also given that bond yields in many segments are well below historical norms and banks report declining confidence in their ability to act as market-makers.
Despite bouts of market tension, there was a further compression of yields across global government bond markets. Prior to the recent correction that began in late-April, yields in some markets had fallen to unprecedented negative levels and multi-century lows. Such declines occurred amid an easing of monetary policy by a large number of major central banks – including the ECB and the central banks of Sweden, Switzerland, Denmark, Canada, Australia, China and a number of other emerging market economies. Despite recent yield increases, the government bonds of a number of euro area countries, Japan, Switzerland, Denmark and Sweden still traded at yields below zero at mid-May.
Market expectations of a divergence in monetary policy cycles between the euro area and the United States contributed to a rise in volatility across market segments and a widening of the ten-year US Treasury-Bund spread to its highest level since 1990 (see Table 2.1 and Chart 2.5). Nonetheless, movements in these markets remain strongly correlated. Developments in yields on US long-term bonds appeared to lag

Financial Stability Review, May 2015 54
those in yields on German government bonds following the ECB’s launch of the public sector purchase programme (PSPP). This trend contrasts with a historical regularity whereby developments in the United States tend to lead those in other regions.
Despite recent increases in long-term bond yields, both US and euro area yield curves remain relatively flat, prompting some concerns regarding compressed term premia (see Chart 2.6). In particular, the compressed level of US term premia has raised concerns about a sharp increase, which could translate globally, should market expectations regarding the future path of US monetary policy change suddenly. Market and survey-based expectations for the future path of US policy rate increases are currently below the forecasts of most members of the Federal Open Market Committee. Past experience suggests that developments in US term premia can have widespread ramifications for global markets – extending also to the euro area.
Chart 2.6 Relatively flat yield curve raises some concerns regarding compressed term premia
Spread between yields on ten-year and two-year US and euro area government bonds (Jan. 2001 – May 2015; percentages)
Sources: Bloomberg and ECB calculations.
Within euro area government bond markets, developments were supported by improving economic conditions (see Section 1) as well as expectations and subsequent announcements of a sovereign bond purchase programme by the ECB (see Box 1). These developments contributed to a decline in yields, a compression of intra-euro area spreads and a flattening of yield curves across all markets, except Greece, that were only partially offset by the bond market correction that began in late April (see Chart 2.7).
Yields on euro area government bonds fell further in most jurisdictions, but their prolonged decline was interrupted in late-April by a noteworthy correction. Market reports suggest a multitude of factors behind the recent correction, including concerns that the protracted decline in yields had overshot, the triggering of stop-loss
-1
0
1
2
3
2001 2003 2005 2007 2009 2011 2013 2015
euro area
United States
Chart 2.5 Ten-year US Treasury-Bund spread reaches a twenty-five-year high amid diverging monetary policy cycles
Yields on ten-year US and German government bonds and the ten-year Treasury-Bund spread (Jan. 1988 – May 2015; percentages; basis points)
Sources: Bloomberg and ECB calculations.
-200
-100
0
100
200
300
400
0
2
4
6
8
10
1988 1991 1994 1997 2000 2003 2006 2009 2012 2015
Treasury-Bund spread (right-hand scale)GermanyUnited States

Financial Stability Review, May 2015 55
levels, high net bond issuance and improved economic data. There appears to be a broad consensus among analysts that recent price adjustments were amplified by relatively poor secondary market liquidity and the limited capacity of market-makers to absorb shocks.
Chart 2.8 The proportion of outstanding government bonds trading at negative yields reached unprecedented levels across euro area markets
Proportion of outstanding euro area government bonds trading at negative yields (left-hand scale) and maturity at which yields trade negatively (right-hand scale) (15 May 2015; percentages; maturity in years)
Sources: Bloomberg and ECB calculations.
Intra-euro area spreads compressed further, in particular at longer maturities. While this is reflective of an improving economic outlook in light of recent ECB actions, it might also reflect an increased willingness among investors to accept higher credit and duration risk in order to avoid negative rates.13 Following further reductions, more of the yields on the outstanding stock of euro area government bonds have fallen into negative territory (see Chart 2.8). For example, on 15 May the German yield curve traded at a negative yield out to a four-year maturity, while roughly a third of the stocks of Dutch, Finnish and Austrian government bonds were trading at negative yields.
Developments in Greece contrasted with broader euro area trends as yields increased and spreads vis-à-vis Germany widened. The lengthy and uncertain process of negotiations between the newly formed Greek government and its creditors contributed to bouts of extreme volatility in Greek markets. Contagion from Greece to other euro area markets was limited; indeed it triggered only minor volatility in sovereign yields and also in the credit default swap levels of Portugal, Italy and Spain (see Chart 2.7). While there were short-lived intermittent rises in the 13 The average duration of euro area government bond portfolios has risen above long-run averages (for
the period from January 1999 to March 2015), significantly so for AAA and AA-rated portfolios (1.5 years above long-run averages). Strong demand for longer-term debt of lower-rated sovereigns was evident in Ireland’s well-received auction for its first 30-year bond in February 2015.
0
1
2
3
4
5
6
7
0%
20%
40%
60%
80%
100%
DE NL FI AT FR BE SK SI LT IE
YearsProportion
>0%
from -0.2% to 0%
<-0.2%
longest maturity with yields <0% (right-hand scale)
longest maturity with yields < -0.2% (right-hand scale)
Chart 2.7 Contagion from Greek stress was largely contained and spreads for vulnerable sovereigns vis-à-vis the Bund fell to new lows
Spreads between yields on selected ten-year euro area government bonds and the yield on the Bund (Jan. 2007 – May 2015; basis points)
Sources: Bloomberg and ECB calculations.
0
500
1000
1500
2000
2500
3000
3500
4000
4500
5000
0
200
400
600
800
1000
1200
1400
1600
2007 2009 2011 2013 2015
ES IT PT IE GR (rhs)
0
300
600
900
1200
1500
0
100
200
300
400
500
15 Nov. 15 Apr.
Publication of the Nov. 2014 FSR

Financial Stability Review, May 2015 56
correlation between sovereign yields for these countries and those of Greece, a broad-based rally in the context of positive sentiment related to the PSPP saw spreads of Irish, Italian, Portuguese and Spanish ten-year bonds vis-à-vis the Bund fall to fresh lows for the period following the onset of the sovereign debt crisis.
Developments in euro area non-financial corporate bond markets were similar to those in sovereign bond markets: country fragmentation eased, maturities lengthened, yields declined across most rating categories, in some cases to negative levels, and credit spreads tightened.14 Euro area non-financial corporate (NFC) bonds continued to attract strong demand following an impressive performance in 2014: both the investment-grade and high-yield segments recorded equity-like total returns of 8% and 6% respectively. Investors showed an increased appetite for duration, credit risk and product risk in euro NFC debt markets, but exercised some caution regarding lower-rated issues within the high-yield segment.
Bond issuance remained strong as firms took advantage of benign market conditions to lock in low rates at longer maturities. Yields declined across most rating categories and maturities of new issues lengthened further to 8.7 years for investment-grade bonds and to 8 years for high-yield bonds. However, market observers do not report any meaningful leveraging among euro area corporates. The share of callable bonds within new issues has also increased, driven by a strong growth in issuance by higher rated firms. Another noteworthy feature of recent developments in euro-denominated markets is the rise in issuance by companies from outside the euro area, in particular US firms.15 Given narrower credit spreads on euro-denominated debt, US NFCs can issue debt in euro that is swapped back into US dollars at a lower cost than directly issuing in US dollars.
The investment-grade bond market remained particularly robust with limited volatility. Strong investor demand was evident in a further compression of yields
and an additional increase in the weighted average maturity of investment-grade portfolios (see Chart 2.9). Yields on the euro-denominated securities of certain higher-rated corporates declined to negative levels, an unprecedented occurrence. As credit spreads between euro area and US markets widened, US firms took advantage of relatively benign conditions and increased their issuance of euro-denominated bonds. Fragmentation within euro markets fell as indices for vulnerable euro area countries outperformed those of non-vulnerable countries, resulting in a convergence of credit spreads within the euro area. While this development suggests
14 See Section 3 for a detailed discussion on financial corporate bond markets. 15 US firms accounted for one-fifth of euro-denominated bonds issued by NFCs in the first quarter of 2015,
compared with 9% in the first quarter of 2014.
Chart 2.9 Strong demand for investment-grade bonds evident in a compression of yields and increased maturity of portfolios
Yield and weighted average maturity of euro area non-financial corporate investment-grade index (Jan. 1999 – May 2015; percentages; years)
Sources: Bloomberg, Merrill Lynch and ECB calculations.
4.5
5.0
5.5
6.0
6.5
0
2
4
6
8
1999 2001 2003 2005 2007 2009 2011 2013 2015
yield (left-hand scale)weighted average maturity (right-hand scale)
Percentages Years

Financial Stability Review, May 2015 57
that the sovereign drag, which has weighed on corporate markets since 2010, has diminished, pair-wise correlations indicate that movements in corporate and sovereign bond yields remain highly correlated.16 An increased willingness among investors to take on product risk was evident in a significant increase in share of callable bonds in new issues. In the first quarter of 2015, almost half of the issuance in the investment grade sector was in callable bonds (up from 25% in 2014).
Chart 2.11 Issuance of euro area leveraged loans reached a seven-year high in 2014 and outpaced high-yield bond issuance
Issuance of high-yield bonds and leveraged loans by euro area non-financial corporations (2005 – Q2 2015; EUR billions)
Sources: Dealogic and ECB calculations. Note: Data for 2015 refer to the period up to 8 May.
Investor appetite for high-yield bonds improved in 2015, following significant outflows in the second half of last year. Yields compressed across most rating segments and issuance increased (see Chart 2.10 and Chart 2.11). Global investors poured a record amount of cash into European high-yield bonds in the week following the ECB’s announcement of the PSPP.17 While risk appetite among global investors has clearly increased, greater discrimination against lower credit quality within the high-yield segment continues. Investors appear more willing to search for yield within non-standard structures issued by firms with a B rating and above rather than expose themselves to firms with weak credit profiles. Lower-rated firms have faced some difficulties in accessing the market, while bond indices show further increases in yields on bonds rated CCC or below (see Chart 2.10).18 At the same time, the share
16 Dynamic conditional correlations and one-year rolling correlations between non-financial corporate and
sovereign bond indices for vulnerable and non-vulnerable countries remain elevated, having strengthened since mid-2012. Correlations for vulnerable countries are above average. See Box 3 entitled “Co-movements in euro area bond market indices”, Financial Stability Review, ECB, May 2014.
17 An inflow of over €1 billion into European high-yield bond funds was recorded for the week ending 28 January 2015. It is the largest weekly inflow since J.P. Morgan began recording such data in 2011 and significant higher than median weekly inflows of €95 million over the past four years.
18 Certain issuers opted to discontinue their issuance process amid low demand from investors.
0
50
100
150
200
250
2005 2006 2007 2008 2009 2010 2011 2012 2013 2014 2015Q1
high-yield bond issuanceleveraged loan issuance
Chart 2.10 Increased risk appetite evident in a compression of yields but investors remain cautious as regards lower-rated bonds
Yields on corporate bond indices by rating category (Jan. 1999 – May 2015; percentages)
Sources: Bloomberg and ECB calculations.
0
10
20
30
40
50
60
70
80
0
5
10
15
20
25
30
35
40
1999 2002 2005 2008 2011 2014
AA A BBB B CCC (right-hand scale)
0
5
10
15
0
2
4
6
15 Nov. 15 Feb. 15 May.
Publication of theNov. 2014 FSR

Financial Stability Review, May 2015 58
of callable bonds in total high-yield bonds issued remained relatively high at 75% in the first quarter of 2015 (compared with an average of 50% for the past seven years).
Issuance of leveraged loans by euro area firms reached a seven-year high in 2014 and remains strong in 2015, while price indices rose further (see Chart 2.11). A deterioration in underwriting standards is evident in the increasing proportion of highly indebted issuers, below-average coverage ratios and growth in the covenant-lite segment. In the first four months of 2015, roughly half of European leveraged loan issuers had a debt/EBITDA ratio of 5 and above (compared with an average of a third of issuers over the past eighteen years). Interest coverage ratios for highly leveraged institutions, including high-yield bond issuers, are below long-run averages despite the low interest rate environment. This raises concerns that rising interest rates could create difficulties for firms and investors. Institutional investors have the largest exposures to recent issues as ongoing bank deleveraging and increased regulation have contributed to lower demand for leveraged finance products from banks (see Chart 2.12).
Euro area equity markets outperformed their global counterparts, soaring to seven-year highs amid strong
portfolio inflows driven by positive economic data, more accommodative monetary policy and a weaker euro. Global investment flows into euro area equity markets have been relatively strong (see Chart 2.2). Although stock prices retraced some of their gains in recent weeks amid heightened financial market volatility, the EURO STOXX 50 index still recorded a year-to-date increase of 15%. The rally in share prices was equally pronounced for NFCs and banks, although large financial institutions outperformed. The median year-to-date gain on share prices of large and complex banking groups exceeded those of the broader EURO STOXX Banks index by nine percentage points.
While the recovery in euro area stock prices since mid-2012 has been impressive, standard valuation metrics for the euro area stock market do not signal widespread imbalances. The EURO STOXX 50 index remains 25% below its 2007 peak and commonly used metrics of stock market exuberance, such as the cyclically adjusted price/earnings ratio, remain close to their long-run averages and below pre-crisis peaks (see Chart 4 in the Overview section).
Chart 2.12 Banks have been replaced by institutional investors as the dominant investor in European leveraged loan markets
Percentage of leveraged loans purchased on the primary market by investor type (1999-2015; percentage of securities issued)
Source: S&P Capital IQ’s LCD. Note: Data for 2015 refer to the period up to 8 May. Given the lack of primary issuance, LCD did not track enough observations to compile a meaningful sample for 2009. As a result, data are unavailable for 2009.
0%
10%
20%
30%
40%
50%
60%
70%
80%
90%
100%
1999 2001 2003 2005 2007 2009 2011 2013 2015
securities firms institutional investorsnon-European banks European banks

Financial Stability Review, May 2015 59
3 Euro area financial institutions
Euro area financial institutions have made further progress in dealing with legacy issues from the financial crisis. At the same time, the range of challenges to be faced has differed across the banking, insurance and rapidly growing shadow banking sectors.
Building on the ECB’s comprehensive assessment exercise, euro area banks have strengthened their balance sheets further, and continued with their efforts to adjust business models to an evolving operating environment. At the same time, the challenges in the operating environment are still sizeable, while progress remains uneven across institutions. Persistently weak profitability and the large stock of legacy problem assets both continue to weigh on banks’ capacity to simultaneously build up capital buffers and provide credit to the real economy, which will eventually have systemic consequences. Despite survey-based signs of a broader easing of credit standards, there is still a risk that bank-based credit intermediation remains subdued, in particular in vulnerable countries that are most in need of a recovery of lending.
Similar to banks, insurers are continuing to adjust to challenges to their operating environment, especially to that of generating returns in a low-yield environment. Low yields on investment create a headwind for earnings and could prompt firms to take on more credit risk in fixed income investment portfolios, leaving them more exposed to a potential reassessment of risk premia.
While the euro area banking and insurance sectors have struggled in the aftermath of the crisis, the non-bank financial sector has continued to experience a secular growth trend, benefiting from financial disintermediation amid an expansion of non-money market investment funds. This has implied a growing systemic footprint of such firms and a potentially destabilising role of non-bank entities in asset price adjustments and liquidity spirals, with potential for contagion to the broader financial system. While the need for monitoring this growing segment of financial institutions is clear, a lack of comprehensive and harmonised reporting makes assessing specific risks difficult, including those related to synthetic leverage and to securities financing transactions.
Against the background of these developments, progress has continued apace in the area of financial sector regulation, with most key building blocks nearing completion. Some key elements of the new regulatory framework that are still subject to finalisation and calibration include parts of the liquidity regulation, leverage ratio provisions, securitisation rules and measures aimed at increasing the total loss-absorption capacity of global systemically important banks (G-SIBs). The finalisation of the ongoing initiatives will significantly reduce the remaining regulatory uncertainty and will contribute to strengthening the resilience of the financial system. In addition, there has been significant progress in the implementation of a banking union in Europe, given the Single Supervisory Mechanism (SSM) and the Single Resolution

Financial Stability Review, May 2015 60
Mechanism (SRM) that became operational on 4 November 2014 and 1 January 2015 respectively.
3.1 Banking and insurance sector face several challenges, while expansion in activity outside the regulatory perimeter continues
3.1.1 Weak bank profitability persists and progress in dealing with the legacy of problem assets remains slow19
Euro area banks have made further progress in strengthening their balance sheets, while adapting to an evolving regulatory and a challenging operating environment. These efforts notwithstanding, the sector is facing continued challenges on at least two fronts. First, bank profitability remains low, or even negative, in large parts of the euro area banking sector, so that organic capital growth is limited in a period in which many banks are still adjusting to higher capital requirements. Profitability remains under pressure on account of elevated loan loss provisions (mainly banks in vulnerable euro area countries) and subdued revenue growth in an environment of low nominal growth and flat yield curves. A second challenge, particularly pressing for banks in vulnerable countries, relates to the large stock of problem assets. While asset quality deterioration has continued to decelerate, non-performing loan ratios remain above 10% for around half of the significant banking groups (SBGs) in the euro area, and progress in writing off bad loans remains slow. Overall, weak profitability and the large stock of low-return legacy assets continue to weigh on banks’ capacity to simultaneously build up capital buffers and provide credit to the real economy.
Euro area banks’ financial condition
A confluence of cyclical and structural factors continues to impair the profitability of large euro area banks, which has generally not kept up with that of their global peers (see Chart 3.1). Admittedly, cyclical headwinds across regions differ, with euro area bank developments depressed by a still fragile and uneven economic recovery, and a flat yield curve environment is putting pressure on net interest margins. Ultimately, banks’ return on equity has remained below their cost of equity, despite some decline in the latter (see Box 5), which points to a structural need for further balance sheet adjustment.
19 The analysis in this sub-section is based on 93 significant banking groups (SBGs) and 18 large and
complex banking groups (LCBGs) in the euro area. For details on the bank sample, see Box 5 in the November 2013 Financial Stability Review.
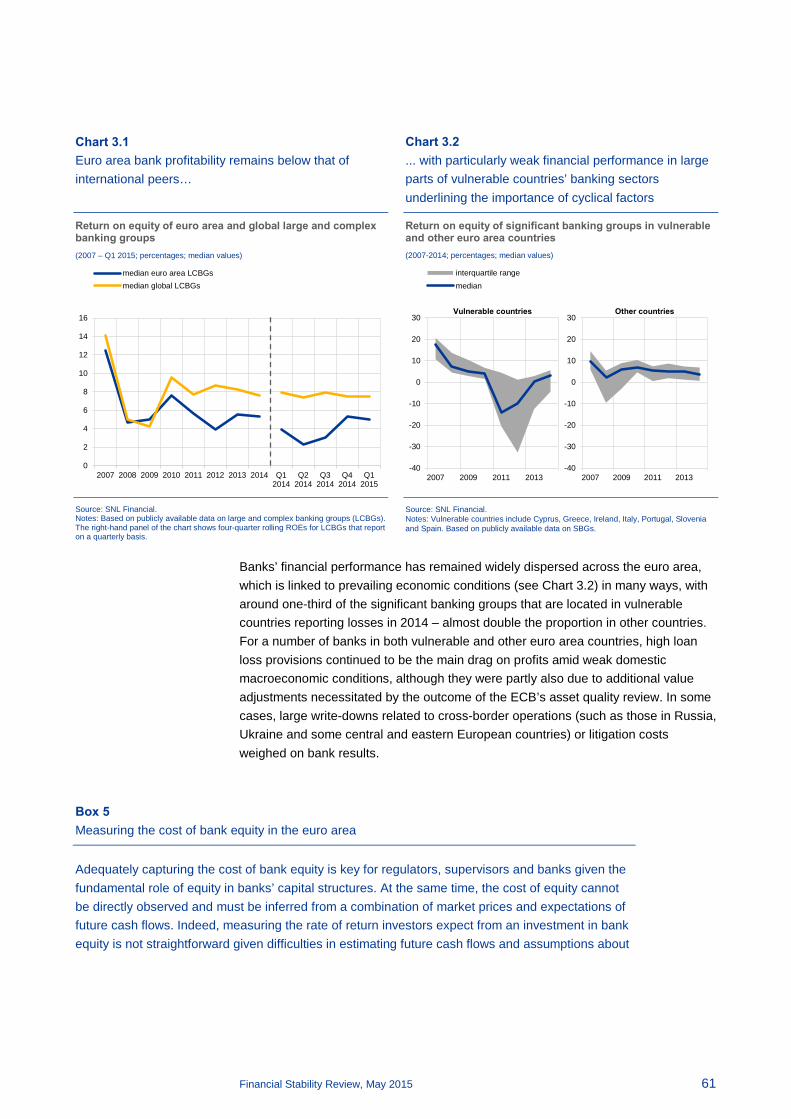
Financial Stability Review, May 2015 61
Chart 3.2 ... with particularly weak financial performance in large parts of vulnerable countries’ banking sectors underlining the importance of cyclical factors
Return on equity of significant banking groups in vulnerable and other euro area countries (2007-2014; percentages; median values)
Source: SNL Financial. Notes: Vulnerable countries include Cyprus, Greece, Ireland, Italy, Portugal, Slovenia and Spain. Based on publicly available data on SBGs.
Banks’ financial performance has remained widely dispersed across the euro area, which is linked to prevailing economic conditions (see Chart 3.2) in many ways, with around one-third of the significant banking groups that are located in vulnerable countries reporting losses in 2014 – almost double the proportion in other countries. For a number of banks in both vulnerable and other euro area countries, high loan loss provisions continued to be the main drag on profits amid weak domestic macroeconomic conditions, although they were partly also due to additional value adjustments necessitated by the outcome of the ECB’s asset quality review. In some cases, large write-downs related to cross-border operations (such as those in Russia, Ukraine and some central and eastern European countries) or litigation costs weighed on bank results.
Box 5 Measuring the cost of bank equity in the euro area
Adequately capturing the cost of bank equity is key for regulators, supervisors and banks given the fundamental role of equity in banks’ capital structures. At the same time, the cost of equity cannot be directly observed and must be inferred from a combination of market prices and expectations of future cash flows. Indeed, measuring the rate of return investors expect from an investment in bank equity is not straightforward given difficulties in estimating future cash flows and assumptions about
-40
-30
-20
-10
0
10
20
30
2007 2009 2011 2013
interquartile rangemedian
Vulnerable countries
-40
-30
-20
-10
0
10
20
30
2007 2009 2011 2013
Other countries
Chart 3.1 Euro area bank profitability remains below that of international peers…
Return on equity of euro area and global large and complex banking groups (2007 – Q1 2015; percentages; median values)
Source: SNL Financial. Notes: Based on publicly available data on large and complex banking groups (LCBGs). The right-hand panel of the chart shows four-quarter rolling ROEs for LCBGs that report on a quarterly basis.
0
2
4
6
8
10
12
14
16
2007 2008 2009 2010 2011 2012 2013 2014 Q12014
Q22014
Q32014
Q42014
Q12015
median euro area LCBGsmedian global LCBGs

Financial Stability Review, May 2015 62
the retention of earnings; a high degree of uncertainty is therefore intrinsic to any estimate of the cost of equity, irrespective of the methodology employed.20
Chart B After peaking in mid-2011, the cost of bank equity is now on a declining path
Euro area banks’ cost of equity: cross-sectional distribution of individual estimates and European Banking Authority’s survey (modal bracket) (Jan. 2000 – Mar. 2015; interquartile range and 10th/90th percentiles; percentages)
Sources: Bloomberg, Thomson Reuters Datastream, European Banking Authority (EBA) and ECB calculations. Notes: Cross-sectional distribution of individual cost of equity estimates for a sample of 33 listed euro area banks included in the EURO STOXX index. The EBA survey series maps the risk assessment questionnaire figure with the largest number of respondents.
One means of inferring the cost of bank equity is by combining insights from the capital asset pricing model and the dividend discount model (CAPM and DDM respectively). Such an approach can be applied to a portfolio of large and listed euro area banks, by imputing the equity risk premium for the whole equity market via the DDM and by projecting this onto individual banks via their respective CAPM beta, thus yielding bank-specific equity risk premia.21
The (time-varying) equity risk premium is computed using a two-stage version of the DDM. Dividend growth in the first period is derived from the Institutional Brokers’ Estimate System (I/B/E/S), assuming that dividends are a constant fraction of earnings. In the second period, dividend growth converges to the long-term growth expectations for the whole economy over a period of ten years.22
Next, bank-specific betas are estimated through the CAPM where the “market portfolio” is proxied by the EURO STOXX index. The choice of using the euro area market as the pricing factor in the
20 “Valuing stock markets and the equity risk premium”, Monthly Bulletin, ECB, November 2008. 21 The portfolio includes 33 euro area banks included in the EURO STOXX index. These banks account
for approximately 55% of euro area banks’ total assets and 85% of those of listed banks. 22 Fuller, R.J. and Hsia, C., “A simplified common stock valuation model”, Financial Analysts Journal,
Vol. 40, No 5, 1984, pp. 49-56. In this model, H = 5, the number of years for which “abnormal” growth rate forecasts are available as reported in the I/B/E/S database. Within ten years, the forecasted growth rate of earnings transits smoothly to the forecasted long-term growth rate (of GDP) as reported by Consensus Economics forecasts.
0
2
4
6
8
10
12
14
16
18
2000 2002 2004 2006 2008 2010 2012 2014
interquartile range 10th/90th percentilesmedian EBA survey
Chart A Banks’ equity premia have become the main driver of the cost of equity
Euro area banks’ cost of equity and components (Jan. 2000 – Mar. 2015; percentages)
Sources: Bloomberg, Thomson Reuters Datastream, Consensus Economics and ECB calculations. Notes: Cost of equity computed for the portfolio of 33 euro area banks included in the EURO STOXX index. Inflation expectations are measured using point forecasts of CPI inflation five to ten years ahead (arithmetic mean of individual estimates) and are derived from Consensus Economics forecasts; the real risk-free rate is given by the interest rate on ten-year inflation-linked bonds.
0
2
4
6
8
10
12
14
16
2000 2002 2004 2006 2008 2010 2012 2014
inflation expectationsreal risk-free ratebank equity risk premium

Financial Stability Review, May 2015 63
CAPM is motivated by the (virtual) absence of currency risk and the low cross-border transaction costs that characterise the currency union. Betas are estimated with standard linear regression, on short rolling windows of one year of daily data.23
According to model estimates, the beta for the portfolio of listed banks was fairly stable between 2000 and the first half of 2007, ranging between 1.0 and 1.2. Since the eruption of the financial crisis, the quantity of risk carried by bank shares (i.e. banks’ beta) constantly increased until it reached 1.7 in the second half of 2012. Consequently, banks’ equity premia (orange area in Chart A representing a “beta-amplified” version of the market equity premium) became the main driver of the cost of equity after the crisis, while the risk-free rate continued to drop. The real risk-free rate, which has recently turned negative, contributed to keeping the real and nominal cost of equity subdued in the most recent period. In the last part of the sample, banks’ equity premia declined, possibly as a reflection of banks’ deleveraging processes. Results for most individual banks currently lie within the 8% to 10% range, i.e. broadly in line with estimates from surveys of financial sector practitioners (Chart B).24
Diverging national developments in the cost of bank equity can be gauged by applying the CAPM to national portfolios of listed banks, weighting each bank by its market capitalisation. Prior to the global financial crisis, the banking sectors of the largest four euro area economies enjoyed similar levels of cost of equity. Following the peak observed after the collapse of Lehman Brothers in November 2008, the cost of equity diverged along country lines (Chart C), displaying considerable fragmentation in recent years. While signs of a gradual reversal to pre-crisis levels can be observed, it is hard to predict where a stable resting point for banks’ cost of equity will lie. To the extent that reductions in bank leverage can contribute to containing bank risk and reducing the cost of equity, less-leveraged institutions may experience cheaper equity market access. Nevertheless, in the face of low banking sector
profitability and limited progress in leverage ratios (see Chart 3.12), developments in the cost of bank equity continue to require close monitoring in terms of financial stability.
23 Fama, E. and MacBeth, J., “Risk, Return, and Equilibrium: Empirical Tests”, Journal of Political
Economy, Vol. 81, No 3, 1973, pp. 607-636. 24 The majority of respondents to the latest EBA risk assessment questionnaire (December 2014) reported
cost of equity estimates in the range of 8-10%, while they reported a 10-12% range in all previous waves. These ranges, presented in Chart B as black squares, embrace a large part of the cross-sectional distribution of our estimates for individual banks.
Chart C National developments in banks’ cost of equity diverged after 2008
Cost of bank equity in selected euro area countries (Jan. 2000 – Mar. 2015; percentages)
Sources: Bloomberg, Thomson Reuters Datastream and ECB. Notes: 10 banks are included in the German portfolio of banks, 18 in the French, 18 in the Italian and 10 in the Spanish. Cut-off date: February 2015.
0
2
4
6
8
10
12
14
16
2000 2002 2004 2006 2008 2010 2012 2014
Germany FranceItaly Spain

Financial Stability Review, May 2015 64
Chart 3.4 ... mainly on account of declining funding costs
Interest spread and its drivers for euro area significant banking groups (2009-2014; percentages; median values)
Sources: SNL Financial and ECB calculations. Notes: Vulnerable countries include Cyprus, Greece, Ireland, Italy, Portugal, Slovenia and Spain. Based on publicly available data on SBGs.
Looking at the main drivers of bank profits, operating income, while still subdued, showed some improvement in 2014 as a whole. This was due mainly to an increase in net interest income (see Chart 3.3), in particular in vulnerable countries (median growth of 6%). This in turn could be attributed to the fact that funding costs declined
more rapidly than asset yields as banks in vulnerable countries benefited from a compression of sovereign bond yields and the resulting decreases in both deposit and wholesale funding costs (see Chart 3.4). At the same time, net interest income for banks in other countries increased only marginally.
Looking forward, further improvements in net interest income may be difficult to sustain in an environment of low interest rates and flat yield curves since associated declines in asset yields are less likely to be compensated for by a further fall in funding costs. In fact, data for a sub-sample of quarterly reporting SBGs indicate that, for the majority of these banks, net interest margins narrowed somewhat in the first quarter of 2015.
Against this background, there are signs that banks are stepping up their efforts to diversify income streams by increasing fee revenues. In fact, the median ratio of net fee and commission income to total assets for SBGs showed an increase in 2014 and data for a sub-sample of quarterly reporting SBGs suggest that this
0.0
0.5
1.0
1.5
2.0
2.5
-3
-2
-1
0
1
2
3
4
5
2009 2010 2011 2012 2013 2014 2009 2010 2011 2012 2013 2014
cost of fundsasset yieldinterest spread (right-hand scale)
Vulnerable countries Other countries
Chart 3.3 Net interest income increased, particularly for banks in vulnerable countries...
Net interest income growth of euro area significant banking groups (2009-2014; percentages; median growth rates)
Source: SNL Financial. Notes: Vulnerable countries include Cyprus, Greece, Ireland, Italy, Portugal, Slovenia and Spain. Based on publicly available data on SBGs.
Chart 3.5 Diverse developments in non-interest income in 2014, with an increase in fee income contrasting with a decrease in trading income
Ratios of net fee and commission income and trading income to total assets for significant banking groups in the euro area (2007 – Q1 2015; percentages; median values)
Source: SNL Financial. Notes: Based on publicly available data on SBGs. The right-hand panel of the chart shows annualised quarterly figures for SBGs that report on a quarterly basis.
-8
-6
-4
-2
0
2
4
6
8
2009 2010 2011 2012 2013 2014
vulnerable countriesother countries
-0.2
-0.1
0.0
0.1
0.2
0.3
0.4
0.5
0.6
0.7
0.8
2007 2008 2009 2010 2011 2012 2013 2014 Q12014
Q22014
Q32014
Q42014
Q12015
fee income/total assetstrading income/total assets

Financial Stability Review, May 2015 65
improvement may have continued in the first quarter of 2015 (see Chart 3.5). A decomposition of fee income for a sub-sample of SBGs suggests that the improvement, at least for some banks, could be attributed to increasing asset management-related fees, possibly also reflecting these banks’ active strategies of cross-selling between commercial banking and asset management units. At the same time, trading income decreased in the second half of 2014, and in the year as
a whole, due to subdued trading activity in particular in fixed income markets. However, data for a sub-sample of quarterly reporting SBGs show a rebound in trading income around the turn of the year (see Chart 3.5), with trading performance improving in fixed income and currency as well as in equity markets.
Overall, the median growth of euro area SBGs’ operating income was over 2% in 2014 as a whole. However, profitability was not supported by broad-based improvements in cost efficiency. While a number of banks have announced, or are implementing, cost-cutting plans, progress has been moderate so far, with the median ratio of operating costs to total assets remaining broadly unchanged at 1.3%, year on year, in 2014.
Loan loss provisions continued to be a drag on bank profitability in the second half of 2014, although provisioning levels showed significant heterogeneity across banks. In particular, credit risk costs of banks in vulnerable countries remained at elevated levels against a weak macroeconomic backdrop (see Chart 3.6), while some of the increase in the fourth quarter of 2014 was related to value adjustments necessitated by the asset quality review (see Box 6). In other countries, provisioning costs remained stable in 2014, except for those of banks that booked large provisions on their foreign exposures, especially on those in troubled emerging market economies, and in central and eastern European (CEE) countries. Looking at more recent developments, data for a sub-sample of SBGs reporting quarterly results suggest some moderation in loan loss provisions in the first quarter of 2015.
Taking a longer-term view, loan loss provisions tend to move together with GDP growth (see Chart 3.7), although empirical evidence also points to a delay in loan loss recognition by euro area banks in the early phase of the global financial crisis, particularly in vulnerable countries (see Box 6 in the May 2014 FSR).
Chart 3.6 Loan loss provisions remained elevated in vulnerable countries...
Loan loss provisions of euro area significant banking groups (2007-2014; percentage of total loans; median values)
Source: SNL Financial. Notes: Vulnerable countries include Cyprus, Greece, Ireland, Italy, Portugal, Slovenia and Spain. Based on publicly available data on SBGs.
Chart 3.7 ... reflecting strong cyclical patterns in bank provisioning
Relationship between euro area banks’ loan loss provisions and GDP growth (2000-2013; percentages; median values)
Sources: Bloomberg, SNL Financial and ECB calculations. Notes: Based on publicly available data on SBGs. GDP growth is shown on an inverted scale.
0.0
0.4
0.8
1.2
1.6
2.0
2.4
2007 2008 2009 2010 2011 2012 2013 2014
vulnerableother
-5.0
-4.0
-3.0
-2.0
-1.0
0.0
1.0
2.0
3.0
4.0
5.00.0
0.2
0.4
0.6
0.8
1.0
1.2
1.4
1.6
2000 2002 2004 2006 2008 2010 2012
loan loss provisions (% of total loans)GDP growth

Financial Stability Review, May 2015 66
Box 6 Evaluating the drivers of forbearance and underprovisioning
Forbearance (or the renegotiation of a loan contract in the event that a borrower fails, or is likely to fail, to fulfil its obligations) is not captured on balance sheets and is therefore not straightforward to measure. It is closely related to underprovisioning, which – alongside forbearance – also includes insufficient provisioning for declared non-performing exposures (NPEs) as a main element.
The ECB’s comprehensive assessment contributed to highlighting possible pockets of forbearance and underprovisioning. The results of the comprehensive assessment can be used as proxy variables for these concepts, to the extent that changes to NPEs act as a suitable proxy for forbearance, and the adjustments to loan loss provisions (LLPs) can be a measure of underprovisioning.25 Chart A illustrates the connection between these two concepts.
Regression analysis using these two measures as endogenous variables can provide an insight into the main drivers of forbearance and underprovisioning. The regression analysis has to take into account specific features of these variables, namely potentially clustered deviations at the country level (via clustered standard errors) and truncation of the endogenous variables.26 The analysis is conducted on variables normalised by bank size to make the measures comparable across banks.
The explanatory variables can be grouped as macroeconomic variables, indicators for the quality of banking supervision, measures of collateral valuation, balance sheet-based measures of bank profitability, balance sheet-based measures of bank weakness and market-based measures of bank weakness. Using this categorisation, the variables are aligned with commonly suspected drivers of underprovisioning and forbearance. While the endogenous variables were published in October 2014, the explanatory variables are lagged, referring to end of 2013 for balance sheet data, averages from 2011 to 2013 for macro-economic data and averages over 2013 for market based data.
25 While the changes to NPEs and forbearance also include the results of the harmonisation of non-
performing loan definitions, the asset quality review (AQR) adjustment to LLPs captures precisely the underprovisioning in European banks.
26 The AQR adjustment to LLPs is taken to be non-negative and the adjustments to NPEs can also assume negative values. Therefore, Tobit methodology is used instead of ordinary least squares in the regressions involving the AQR adjustment to LLPs.
Chart A Adjustments to non-performing exposures strongly correlated with adjustments to loan loss provisions
Scatter plot of normalised adjustments to NPEs and normalised adjustments to LLPs (basis points)
Source: ECB.
AT
BE
CY
DE
EE
ES
FIFR
GR
IE
ITLV
LU
MTNL
SK
SIR² = 0.62
0
1
2
-0.5 0.5 1.5 2.5 3.5 4.5
Adju
stm
ent t
o LL
Ps/to
tal a
sset
s
Adjustments to NPEs/total assets

Financial Stability Review, May 2015 67
Charts B, C and D illustrate the correlations between some of the explanatory variables with the highest univariate explanatory powers and the endogenous variables. High sovereign yields indicate weak backstops and a bad business environment for banks. Credit default swap (CDS) spreads reflect market perceptions of banks’ weakness, while the impaired loan ratio is a key measure of the quality of the banks’ loan books based on balance sheet information.
Multivariate regression analysis27 confirms these relationships, revealing both their statistical and economic significance and robustness against different specifications. Overall, the empirical results suggest that weak macroeconomic conditions, moral hazard, a low valuation of collateral and individual bank weakness are the key drivers of forbearance and underprovisioning.
Chart D Market-based measures of bank weakness can also draw attention to pockets of forbearance and underprovisioning
Scatter plot of CDS spreads, adjustments to NPEs and adjustments to LLPs (CDS spreads measured in basis points, y-axis in basis points)
Sources: ECB and Bloomberg.
27 The results of a detailed empirical analysis can be found in Homar, T., Kick, H. and Salleo, C., “What
drives forbearance? Evidence from the ECB’s comprehensive assessment”, Working Paper Series, ECB (forthcoming).
R² = 0.39
R² = 0.12
-1
0
1
2
3
4
5
6
7
1.5 2 2.5 3 3.5
Adju
stm
ents
to L
LPs/
tota
l ass
ets
and
Adju
stm
ents
to N
PEs/
tota
l ass
ets
Log(CDS spreads)
adjustments to LLPs/total assets versus CDS spreadsadjustments to NPEs/total assets versus CDS spreads
Chart B Sovereign yields can be indicative of forbearance and underprovisioning in a country’s banking sector
Scatter plot of sovereign yields, adjustments to NPEs and adjustments to LLPs (x-axis in percentage points, y-axis in basis points)
Sources: ECB and Bloomberg.
Chart C Balance sheet-based measures of bank weakness contain significant information about forbearance and underprovisioning
Scatter plot of normalised adjustments to NPEs and normalised adjustments to LLPs (y-axis in basis points)
Sources: ECB, SNL and Bankscope
R² = 0.49
R² = 0.18
-2
0
2
4
6
8
0 2 4 6 8 10 12
Adju
stm
ents
to L
LPs/
tota
l ass
ets
and
Adju
stm
ents
to N
PEs/
tota
l ass
ets
Sovereign yields
adjustments to LLPs/total assets versus sovereign yieldsadjustments to NPEs/total assets versus sovereign yields
R² = 0.13
R² = 0.17
-4
-2
0
2
4
6
8
0 0.1 0.2 0.3 0.4 0.5
Adju
stm
ents
to L
LPs/
tota
l ass
ets
and
Adju
stm
ents
to
NPE
s/to
tal a
sset
s
Impaired loan ratio
adjustments to LLPs/total assets versus impaired loansadjustments to NPEs/total assets versus impaired loans

Financial Stability Review, May 2015 68
Putting these results in a financial stability context, forbearance may be warranted for individual counterparties in the event of temporary liquidity-related problems. But it is not appropriate if: (i) it is used to deal with structural issues such as credit-related problems; or (ii) it becomes systemic, as widespread use entails externalities in the form of adverse selection. Likewise, underprovisioning can avoid excessive pro-cyclicality of capital requirements in a downturn; however, if widespread, it contributes to balance sheet opaqueness and ultimately undermines confidence in the banking sector as a whole. The findings here can provide guidance on where to expect pockets of forbearance and underprovisioning, based on publicly available information.
Looking ahead, loan loss provisions are expected to fall in 2015 and beyond, but the normalisation of the cost of credit risk and its impact on overall profitability will depend very much on the pace of economic recovery. It should be noted that in the United States, much of the improvement in bank profits between 2009 and 2013 was due to a substantial decline in loan loss provisions amid improving macroeconomic conditions (see Special Feature B).
Looking beyond the impact of cyclical developments, the recovery of euro area bank profitability will also be dependent on structural factors. For instance, the tightening of corporate lending spreads (see Chart S.3.6) suggests that competition is increasing, or remains intense, in banking markets. In some cases, there are signs that overcapacity could hinder the recovery of profitability as weaker/less efficient banks distort competition, thereby making it difficult for other banks to reprice loans. In fact, there is some empirical evidence that EU/euro area banks operating in less concentrated markets tended to be less profitable in the period between 1991 and 2013 (see Special Feature B). This suggests that consolidation in some of the least concentrated banking markets in the euro area could bring some benefits for profitability through increasing cost and/or revenue synergies. In this respect, initiatives taken at a national level to improve corporate governance in some segments of the euro area banking sector – such as the proposed reform of popolari banks in Italy – could help create a more favourable environment for mergers.
Another factor that will influence banks’ return to a path of sustainable profit is the speed at which they adapt their business models to new realities and regulatory requirements. Before the crisis, euro area banks exhibited a higher leverage, on average, than their global peers – although some of this was related to prevailing institutional settings such as mortgage balance sheet retention and the degree to which corporate finance is bank-based (rather than market-based). Nevertheless, an implication has been that banks’ adjustment to higher capital requirements has contributed to lowering their return on equity. Efforts to adjust bank business models continue, although progress has remained uneven across banks. In response to market pressures, but also as a consequence of increasing (regulatory) costs of complexity, some banks are endeavouring to rationalise their strategies by focusing on business activities/geographical regions in which they have sufficient economies of scale and better profit margins.
In this respect, banks also made further progress in divesting/running off assets separated in their non-core units in 2014. That said, this process is far from

Financial Stability Review, May 2015 69
complete and losses booked by non-core units still weighed on overall profitability and reduced the pre-tax profits of some large and complex banking groups (LCBGs) by 40-60% in 2014. In a similar vein, the retrenchment in foreign operations continued in 2014, albeit at a slowing pace, as some banks sought selectively to increase their foreign presence, possibly also reflecting limited growth opportunities
in domestic markets. However, taking a longer-term view, for a sub-sample of SBGs that report on the geographical breakdown of their loan portfolios, the median share of non-domestic loans decreased from 32% in 2007 to 27% in 2014.
The deterioration of the asset quality of euro area banks slowed in the second half of 2014. While loan quality trends diverged across vulnerable countries, there are signs of improvement – ranging from a slower increase in non-performing loans (Italy, Portugal and Cyprus) to a reversal of worsening asset quality (Spain and Ireland). While domestic macroeconomic conditions are the main driver of asset quality for most banks, mainly affecting exposures to corporates and to small and medium-sized enterprises (SMEs), some cross-border banking groups in the euro area remain exposed to the potential resurfacing of emerging market stress. The coverage of non-performing loans (NPLs) by loan loss reserves remained broadly unchanged on average in 2014 (see Chart 3.8), although this hides diverging trends across banks.
While banks in some countries (e.g. Ireland) made substantial progress in writing off and/or disposing of non-performing loans, the average write-off rate remains rather moderate at 0.6% (see Chart 3.9), and lags well behind that experienced in the United States, which peaked at 3.1% in 2009.
Notwithstanding the slowdown or reversal of NPL inflows, the large stock of legacy problem assets remains a burden on some banking sectors and may impair their ability to restore lending (for details on NPL-related issues, see Special Feature C). For instance, the ratio of net NPLs to equity remains above 50% for around two-fifths of the euro area SBGs, leaving these institutions more exposed to possible further increases in loan losses. NPLs also act as a drag on profits – as they do not accrue interest income, while dealing with assets entails operational costs – so that banks with higher NPLs tend to charge higher interest rates on loans. Previous crisis episodes
Chart 3.8
Non-performing loan ratios continued to increase in vulnerable countries, albeit at a slowing pace...
Non-performing (impaired) loan and coverage ratios of euro area significant banking groups (2007-2014; percentages; median values)
Source: SNL Financial. Notes: The coverage ratio is defined as the ratio of loan loss reserves to non-performing (impaired) loans. Vulnerable countries include Cyprus, Greece, Ireland, Italy, Portugal, Slovenia and Spain. Based on publicly available data on SBGs.
Chart 3.9 ... but write-off ratios still indicate only moderate progress in resolving problem assets
Write-off rates on loans of euro area monetary financial institutions to the non-financial private sector (Jan. 2007 – Mar. 2015; percentages)
Source: ECB.
0
10
20
30
40
50
60
70
80
0
2
4
6
8
10
12
14
16
18
2007 2008 2009 2010 2011 2012 2013 2014
coverage ratio - vulnerable countries (right-hand scale)coverage ratio - other countries (right-hand scale)NPL ratio - vulnerable countries (left-hand scale)NPL ratio - other countries (left-hand scale)
0.0
0.2
0.4
0.6
0.8
1.0
1.2
1.4
1.6
1.8
2007 2008 2009 2010 2011 2012 2013 2014 2015
loans to non-financial corporationsloans to households for house purchaseconsumer credittotal loans

Financial Stability Review, May 2015 70
suggest that timely NPL resolution is crucial for restoring credit growth.
In some countries, the disposal of NPLs is also being hindered by the lengthy foreclosure procedures that lead to a wide bid-ask spread between banks and potential buyers of distressed assets. While steps have been taken to improve the legal framework governing the resolution of NPLs in several countries, it may take considerable time before these changes take full effect.
Chart 3.11 … with capital increases showing a higher contribution than risk-weighted assets changes in 2014
Contribution of changes in capital and risk-weighted assets to phased-in common equity Tier 1 capital ratios (2012-2014; percentage points)
Sources: SNL Financial and ECB calculations. Notes: Based on publicly available data on SBGs. Changes in risk-weighted assets are shown with negative sign, i.e. a decline in risk-weighted asset indicates a positive contribution to the capital ratios.
Euro area banks continued to strengthen their solvency positions in the second half of 2014. As a result, the median phased-in (transitional) common equity Tier 1 (CET1) capital ratio of SBGs rose to 12.8%, from 12% in mid-2014. Similarly, fully loaded Basel III CET1 capital ratios of SBGs also improved in the second half of 2014, rising from 11% in mid-2014 to 11.5% at the end of the year (see Chart 3.10). The strategies to improve capital ratios differed somewhat across banks, but the general pattern shifted towards more capital-raising, away from reductions of risk-weighted assets (see Chart 3.11). Following an average increase in risk-weighted assets in the first quarter of 2014, largely due to the implementation of the rules set out in the Capital Requirements Directive (CRD IV) and/or the Capital Requirements Regulation (CRR) as of 1 January 2014, risk-weighted assets declined in the second half of the year, thereby also contributing to improving capital ratios in this period. More recently, some banks have completed large-scale capital-raising exercises or announced plans to improve their capital ratios further in the coming months, in part also to address capital shortfalls identified in the ECB’s comprehensive assessment exercise.
-10
-8
-6
-4
-2
0
2
4
6
8
-15 -10 -5 0 5 10 15
20132014
CT1 capital
RW
A
Chart 3.10 Risk-weighted capital ratios remained stable or increased on a fully loaded basis…
Core Tier 1/common equity Tier 1 capital ratios of significant banking groups in the euro area (2008-2014; percentages; 10th and 90th percentile and interquartile range distribution across SBGs)
Source: SNL Financial. Note: Based on publicly available data on SBGs.
0
2
4
6
8
10
12
14
16
18
20
2008 2009 2010 2011 2012 2013 2014 2013 H12014
2014
median for SBGsmedian for LCBGs
CT1/phased-in CET1 ratios Fully-loadedCET1 ratios

Financial Stability Review, May 2015 71
Mirroring developments in risk-weighted capital ratios, euro area banks’ leverage ratios also continued to improve in 2014. The median fully loaded Basel III leverage ratio for LCBGs stood at 3.7% at the end of 2014, although it varied somewhat across institutions (see Chart 3.12).
Notwithstanding progress in the strengthening of capital positions, regulatory requirements for bank capital continue to evolve, which is likely to have implications for banks’ capital management and business planning in the period ahead. First, concerns remain with respect to the consistency of risk-weighted asset calculations made using the internal ratings-based method. This has caused regulators to consider policy proposals in this area, and work by the Basel Committee on reducing variability in risk-weighted assets continues (see Section 3.3.2).
Second, several national differences exist in the euro area with regard to the current definition of regulatory capital, not least due to different phasing-in rules for certain capital deductions, including those related to
goodwill and other intangible assets, deferred tax assets (DTAs) or holdings of participations in other financial sector entities. Nevertheless, legislative changes in some countries (Greece, Italy, Portugal and Spain) allow certain DTAs to be converted into assets that are guaranteed by the government, i.e. deferred tax credits (DTCs), which do not need to be deducted from CET1 capital. Such legislative initiatives may stem from factors specific to these countries – such as a less favourable tax treatment of loan impairment charges, as compared with that in the majority of other euro area countries where loan loss provisions are immediately deductible from taxes.
Third, while the implementation of the new regulatory framework is nearing completion in most areas, some elements have yet to be finalised, including the calibration of requirements for the leverage ratio and the total loss-absorption capacity. Overall, further progress in all of the areas of capital regulation highlighted above is of key importance for the further strengthening of banks’ resilience. At the same time, the evolving regulatory requirements may have implications for banks’ capital management and could incentivise some banks to keep higher buffers, given the remaining uncertainty, which in turn could lead to some cautiousness in their risk-taking behaviour.
Credit risk and bank lending conditions
Credit risk conditions for the euro area banking sector have remained broadly unchanged since the finalisation of the November 2014 FSR. The economic recovery
Chart 3.12 Leverage ratios also improved, although further progress may be needed in the case of some LCBGs
Fully loaded Basel III leverage ratios for selected euro area LCBGs (end–2014; percentages)
Source: SNL Financial. Notes: Based on publicly available data on LCBGs. The horizontal line shows the average for 40 Group 1 banks subject to the Basel III monitoring exercise of the EBA. Group 1 banks are those with Tier 1 capital in excess of €3 billion and are internationally active.
0
1
2
3
4
5
6
7
euro area LCBGs (end-2014)average for Group 1 banks in the EU (June 2014)

Financial Stability Review, May 2015 72
is progressing at a moderate pace against the background of the continued risk of a prolonged period of low nominal growth. This implies heightened income and earnings risks for households and non-financial corporations (NFCs), which – coupled with legacy balance sheet issues and ongoing corrections in the property markets of some countries – have a negative impact on borrowers’ debt servicing capacities.
Chart 3.14 … with SME loan books accounting for most defaulted exposures, in particular in vulnerable countries
Share of defaulted exposures per type of credit exposure (end-2013; percentage of total exposures; median, 10th and 90th percentile and interquartile range distribution across SBGs)
Source: EBA. Note: Specialised lending includes project financing, commercial real estate loans and other forms of asset-based finance (e.g. shipping loans).
Data for euro area SBGs show that credit risk exposures are, on average, accounted for roughly equally by residential mortgages, loans to non-financial corporations (excluding SMEs) and loans to SMEs. However, the shares vary significantly across banks, due to their different specialisations (see Chart 3.13). Loan quality in these segments likewise varies greatly across banks in the euro area, with the median share of defaulted SME exposures in vulnerable and other countries standing at 21% and 5% respectively at end-2013 (see Chart 3.14).
For some euro area banks, credit risks also emanate from their significant cross-border exposures. Indeed, some SBGs remain highly exposed to emerging market economies (EMEs), with the ratio of their EME-related exposures to common equity exceeding 300%, in particular to countries in “developing Europe”. Against the background of ongoing geopolitical tensions, a few euro area banks with exposures to the most vulnerable EMEs (including Russia and Ukraine) incurred high credit losses on these exposures in 2014, and face the risk of further asset quality deterioration in the period ahead.
0
5
10
15
20
25
30
35
40
45
Loan
sto
SM
Es
Loan
s to
corp
orat
es
Spec
ialis
edle
ndin
g
Oth
er re
tail
lend
ing
Res
iden
tial
mor
tgag
es
Spec
ialis
edle
ndin
g
Loan
sto
SM
Es
Oth
er re
tail
lend
ing
Loan
s to
corp
orat
es
Res
iden
tial
mor
tgag
es
Vulnerable countries Other countries
Chart 3.13 Credit risk exposures of euro area SBGs are concentrated in corporate, SME and residential property segments…
Breakdown of euro area SBGs’ credit exposures by type (end-2013; percentage of total exposures; median, 10th and 90th percentile and interquartile range distribution across SBGs)
Source: EBA. Notes: Specialised lending includes project financing, commercial real estate loans and other forms of asset-based finance (e.g. shipping loans).Total exposure is the sum of corporate and retail exposures (i.e. it excludes equity, securitisation and other non-credit obligation assets).
0
10
20
30
40
50
60
70
80
Residentialmortgages
Loans tocorporates(excludingSMEs andspecialised
lending)
Loans to SMEs Other retaillending
Specialisedlending tocorporates

Financial Stability Review, May 2015 73
Turning to bank lending conditions, the results of the ECB’s bank lending survey of April 2015 suggest continued signs of easing credit standards, although with some differences across different loan types (see Chart 3.15). In fact, the further net easing of credit standards for corporate loans and consumer credit contrasted with a slight net tightening of those for housing loans. With regard to differences across firms of different size, credit standards have eased more strongly for SMEs than for large firms. Looking at country-level developments, the easing of credit standards for non-financial corporations could be observed in most of the largest euro area economies, while credit conditions/standards have become more diverse for housing loans. Credit demand was reported to have increased further, albeit to varying degrees across different loan types, with a continued strong increase in demand for housing loans contrasting with an only moderate increase in demand for corporate loans.
Overall, these survey results provide tentative signs of a possible turnaround in the credit cycle. It should be noted, however, that despite substantial improvements, credit standards for loans to non-financial corporations are still tight by historical standards.
Despite continued signs of recovery, bank lending to the non-financial private sector in the euro area remained muted. Lending to non-financial corporations continued to contract, albeit at a gradually slowing pace (see Chart 3.16). By contrast, lending to households has remained broadly stable since the last FSR. Developments differed significantly across the euro area (see Chart S.1.14), where continued significant declines in lending to the non-financial private sector in more vulnerable countries (e.g. Greece, Ireland, Portugal and Spain) contrasted with a moderate expansion of lending in other countries, such as Germany or France.
Chart 3.16 Lending to the non-financial private sector continues to contract, but at a slowing pace
GDP growth and credit growth to households and NFCs in the euro area (Q1 2003 – Q1 2015; annual percentage changes)
Sources: ECB and Eurostat.
-10
-5
0
5
10
15
20
2003 2005 2007 2009 2011 2013 2015
loans to householdsloans to non-financial corporationsloans to non-financial private sectorreal GDP growth
Chart 3.15 Lending standards have eased further for corporate loans
Credit standards for loans to the non-financial private sector (Q1 2003 – Q1 2015; weighted net percentages)
Source: ECB.
-20
-10
0
10
20
30
40
50
60
70
80
2003 2005 2007 2009 2011 2013 2015
corporate loansconsumer credithousing loans

Financial Stability Review, May 2015 74
At the same time, legacy balance sheet issues continue to be a challenge in several countries. While write-off rates on monetary financial institutions’ loans to non-financial corporations remained on an upward path, with those on housing loans gradually increasing as well, albeit from a far lower level, the pace of writing off bad loans remains moderate, on average, with significant differences across countries. In fact, write-offs throughout 2014 were relatively modest in Italy and Portugal, which stood in contrast with significant increases in Ireland and, to a lesser extent, Spain.
Overall, this highlights the need for a more pro-active stance of both banks and authorities in dealing with the issue of the large stock of NPLs (see also Special Feature C). While the asset quality review/comprehensive assessment has helped dispel doubts regarding the soundness of banks’ balance sheets, further steps are necessary to ensure that the legal framework in place facilitates a timely and low-cost resolution of non-performing loans and enables a smooth interaction between banks and their distressed borrowers. Regarding the possible implications of NPL resolution, if managed carefully, it can create significant benefits in terms of freeing bank capital and boosting credit expansion. At the same time, NPL disposals should be carefully calibrated to avoid a significant (temporary) reduction in capital, for instance, by setting the price for disposals too low.
Funding liquidity risk
Market-based bank funding conditions have remained very favourable, with spreads continuing to stand at, or close to, multi-year lows in most bank debt markets. This notwithstanding, spreads on both senior unsecured and subordinated debt have edged up since early March, due to the resurfacing of tensions around Greece (see Chart 3.17). At the same time, spreads on covered bonds issued by banks in vulnerable countries narrowed further, maintaining the positive pricing momentum triggered by the ECB’s announcement of its third covered bond purchase programme (CBPP3).
Bank debt issuance has slowed in gross terms since the third quarter of 2014 (see Chart 3.18), primarily due to a drop in senior debt issuance. This can partly be attributed to lower refinancing needs and the replacement of some of the senior debt with long-dated central bank borrowing through the targeted longer-term refinancing operations (TLTROs). At the same time, covered bond issuance picked up somewhat, also
supported by the ECB’s CBPP3, and the benign market environment also allowed issuers to lock in very low yields for longer durations. This is evidenced by the lengthening of the average maturity of newly issued covered bonds since the fourth quarter of 2014 for issuers from both vulnerable and other euro area countries (see Chart 3.19).
Chart 3.17 Bank debt spreads remained low
Spreads on banks’ senior debt, subordinated debt and covered bonds (Jan. 2010 – May 2015; basis points)
Sources: ECB and Markit. Notes: Covered bond spreads for vulnerable countries are calculated as averages for Ireland, Italy, Portugal and Spain.
0
100
200
300
400
500
600
700
800
2010 2011 2012 2013 2014 2015
EUR senior debtEUR covered bondsEUR covered bonds - vulnerable countriesEUR subordinated debt

Financial Stability Review, May 2015 75
Chart 3.19 Banks continue to lengthen the maturity of new covered bond issues in order to benefit from low funding costs
Average maturity and yield of covered bonds issued by euro area banks (2009 – May 2015; years; percentages)
Source: Dealogic. Notes: Based on non-retained issuance with a deal value of at least €500 million. Figures for 2015 refer to the period between January and May.
At the same time, subordinated debt issuance has remained robust as banks are stepping up their efforts to adapt their funding structures to new regulatory requirements, which was supported by strong investor demand for higher-yielding bank debt. The composition of new subordinated debt issuance has shifted towards Tier 2 instruments (see Chart 3.20), partly in response to total loss-absorbing capital (TLAC) requirements. The issuance of additional Tier 1 capital instruments also recovered in the first quarter of the year, although it remained below the level recorded for the same period last year.
Spreads have also tightened in the markets for asset-backed securities (ABSs) after the launch of the ECB’s asset-backed securities purchase programme (ABSPP), including those for securitisations in vulnerable countries. At the same time, issuance of ABSs by euro area banks remains moderate, with non-retained issuance standing at €11 billion until mid-May, which was, however, broadly in line with the average
issuance volume over the same period in the last five years.
Turning to structural changes in bank funding, the shift away from wholesale funding towards deposit funding continued with an acceleration of deposit growth since the last quarter of 2014 that was accompanied by further negative net flows of
0.0
0.5
1.0
1.5
2.0
2.5
3.0
3.5
4.0
5.0
5.5
6.0
6.5
7.0
7.5
8.0
8.5
9.0
2009 2010 2011 2012 2013 2014 2015
yield (right-hand scale)maturity (left-hand scale)
Chart 3.18 Debt issuance by euro area banks has slowed somewhat since mid-2014
Gross issuance of medium and long-term debt by euro area banks (Jan. 2010 – Apr. 2015; 12-month flows; EUR billions)
Source: Dealogic. Note: Excludes retained deals and government-guaranteed issuance.
Chart 3.20 Subordinated debt issuance remains strong, driven by banks’ efforts to adapt to new regulatory requirements and strong investor demand
Issuance of subordinated debt by euro area banks (Jan. 2011 – Apr. 2015; three-month moving sum; EUR billions)
Source: Dealogic.
0
100
200
300
400
500
600
2010 2011 2012 2013 2014 2015
senior unsecured debtcovered bondssubordinated debt
0
2
4
6
8
10
12
14
16
18
20
22
24
2011 2012 2013 2014 2015
Tier 1Tier 2

Financial Stability Review, May 2015 76
wholesale funding (see Chart 3.21), including net redemptions of debt securities. Deposits increased mainly in core countries over the past six months, while they increased only slightly in the vulnerable countries. At the same time, reliance on Eurosystem funding has declined somewhat since late 2014 (continuing the trend since early 2013) as new borrowing through TLTROs was more than offset by final repayments of funds raised through the three-year LTROs. Funding difficulties in Greece had no negative repercussions in other vulnerable countries where average deposit growth turned positive in early 2015, reaching 1.9% in February.
Structural funding vulnerabilities abated further, as deposit growth continued to outpace loan growth for most euro area SBGs. As a result, the median loan-to- deposit ratio of SBGs declined to 114% at the end of 2014 from 117% a year earlier (see Chart 3.22). This improvement is consistent with the progress made by European banks in meeting new Basel III requirements on stable funding. In fact, according to the EBA’s latest Basel III monitoring report, in June 2014 about 67% of the large, internationally active banks and 85% of the other EU banks subject to the monitoring exercise already met the required minimum net stable funding ratio (NSFR) of 100%. That said, the dispersion of structural funding ratios (including loan-to-deposit ratios) remains significant even if it has narrowed since mid-2014.
Chart 3.22 … resulting in a reduction of structural funding vulnerabilities
Loan and deposit growth and the loan-to-deposit ratio of euro area SBGs (2007-2014; percentages; median values)
Source: SNL Financial.
Euro area banks also continued to build up liquidity buffers, thus making steady progress in meeting regulatory liquidity requirements. According to the latest Basel III monitoring report, 82% of the EU banks subject to the monitoring exercise showed a liquidity coverage ratio (LCR) of more than 100% in June 2014, while the overall (gross) shortfall in relation to the 100% threshold dropped to €115 billion, from €154 billion at the end of 2013. In addition to the impact of the recalibration of the LCR framework, this progress could be attributed to banks’ structural adjustments on both
0
20
40
60
80
100
120
140
160
-10
-5
0
5
10
15
20
2007 2008 2009 2010 2011 2012 2013 2014
loan-to-deposit ratio (right-hand scale)loan growth (left-hand scale)deposit growth (left-hand scale)
Chart 3.21 Deposit growth has picked up since mid-2014, while wholesale funding continued to decline…
Twelve-month flows in main liabilities of the euro area banking sector (2010 – Mar. 2015; EUR billions)
Source: ECB. Note: Excludes retained deals and government-guaranteed issuance.
-2,000
-1,500
-1,000
-500
0
500
1,000
1,500
2,000
2010 2011 2012 2013 2014 2015
Eurosystem fundingforeign depositscapital and reserveswholesale funding (euro area)private sector deposits (euro area)total assets (excl. remaining assets)

Financial Stability Review, May 2015 77
the asset and the liability side, as represented by an increase in high-quality liquid assets (including government bonds) and a decrease of net outflows of short-term funding respectively.
Looking at longer-term funding challenges, the implementation of bail-in rules as from 2016 and the draft TLAC proposal put forward by the Financial Stability Board (FSB) are also shaping banks’ funding strategies. With regard to potential implications of bail-ins, rating agencies have published their revised methodologies to account for the reduction in systemic support, resulting in downgrades of some banks. Where future TLAC requirements for G-SIBs are concerned, based on current FSB proposals, a particular challenge confronting euro area banks is that structural subordination (i.e. senior debt issued by holding companies) does not seem to be a feasible option, as is the case for US, UK and Swiss banks that have holding companies, whereas statutory subordination in the case of euro area banks is limited by the principle of “no creditor worse off” set out in the Bank Recovery and Resolution Directive (BRRD).28 Overall, once the FSB’s proposal has been finalised, addressing TLAC requirements will be an important challenge for euro area G-SIBs in coming years, with possible implications for profitability via increased funding costs.
Market and operational risks
Looking at the main sources of market risk, euro area banks remain most exposed to adverse movements in interest rates and/or credit spreads, given the composition of their securities portfolios. Banks’ interest rate risk has remained material against the background of high exposures to debt instruments, in particular sovereign debt. Since the finalisation of the November 2014 FSR, the slope of the euro area government bond yield curve has remained broadly unchanged, due to the significant yield increase at the long end of the curve since mid-April (see Chart S.2.5). Against this backdrop, euro area banks remain vulnerable to a potential reassessment of risk premia in global markets, in particular through their direct exposures to higher-yielding debt instruments, via possible valuation losses on their sovereign bond exposures, depending on the duration and accounting treatment of these portfolios, as well as on the extent to which their positions are hedged.
Looking at banks’ interest rate risk exposures, the median share of debt securities in SBGs’ assets stood at 18% at end-2014, broadly unchanged from a year earlier (see Chart 3.23). Banks’ reliance on interest income from debt securities has been on an upward trend since 2008. In fact, the median share of interest income earned on debt securities increased from 17% in 2008 to 23% in 2014, with around one-tenth of the SBGs earning at least 50% of their interest income from debt securities. Regarding the composition of debt holdings, bonds issued by euro area sovereigns account for around 6% of the total assets of euro area monetary financial institutions (MFIs), albeit with significant dispersion across countries. In fact, sovereign bond
28 National legislation such as that proposed in Germany can provide for a statutory subordination of
senior unsecured debt instruments relative to other senior liabilities.

Financial Stability Review, May 2015 78
holdings, expressed as a percentage of total assets, remain well above their pre-crisis levels in some euro area countries (see Chart 3.24), leaving banks in those countries vulnerable to adverse movements in sovereign yields. With respect to other fixed income exposures, euro area MFIs’ holdings of euro area non-financial corporate debt remained stable at 0.5% of total assets in the second half of 2014, but were still more than 40% below the peak level recorded in mid-2008. This suggests that the direct impact of a sharp adjustment of risk premia on euro area corporate bonds would be contained at the aggregate level. However, some banks with material exposures to high-yield or corporate bonds of EMEs could be more negatively affected in such a scenario.
Chart 3.24 … with significant cross-country dispersion in sovereign bond holdings
MFIs’ holdings of sovereign debt in selected euro area countries (Jan. 2003 – Mar. 2015; percentage of total assets)
Sources: SNL Financial and ECB calculations. Note: Based on publicly available data on SBGs.
Euro area banks’ exposures to equity markets remained contained, on average, with the median share of SBGs’ equity holdings standing just below 1% at end-2014. Significant heterogeneity across banks of different size remains, with some LCBGs having increased their exposures to this asset class since the end of 2012. This could be related, in part, to the fact that low equity market volatility tends to compress backward-looking risk measures, such as the value at risk (VaR), as illustrated by the broadly stable or decreasing equity VaRs of large banks in 2014, thereby inducing some banks to increase their exposures.
Regarding operational risks, information technology-related risks are increasingly moving into the focus of both banks and supervisors. Banks have to deal with an increased vulnerability to higher-impact IT-related disruptions, given the wider use of information technology in retail payment systems (mobile and online banking) and the increasingly complex and interconnected systems of institutions. At the same time, the risks of cyber attacks are on the rise, given that cyber threats are becoming
0
2
4
6
8
10
12
14
16
2003 2005 2007 2009 2011 2013 2015
Italy Spain FranceGermany euro area
Chart 3.23 Bond market exposures remain stable, but vary significantly across banks…
Debt holdings of euro area SBGs (2007-2014; percentage of total assets; median, 10th and 90th percentile and interquartile range distribution across SBGs)
Sources: SNL Financial and ECB calculations. Note: Based on publicly available data on SBGs.
0
5
10
15
20
25
30
35
40
2007 2008 2009 2010 2011 2012 2013 2014

Financial Stability Review, May 2015 79
more complex and intense. In fact, an EBA survey found that most banks see the increased sophistication and complexity of these threats as a major challenge, and are taking actions that include increased spending on cyber security and resilience, as well as the strengthening of governance and business continuity plans. Similarly, supervisors are stepping up their efforts to address cyber security concerns by requiring institutions to reinforce IT controls and audits, carrying out targeted on-site inspections of IT security systems or initiating cyber security tests.
3.1.2 Euro area insurance sector: lower yields on investment create headwind for earnings
The prevailing low-yield environment poses a significant challenge for some insurance companies’ profitability over the medium term, with the potential to erode capital positions in the long run. The impact of the low interest rate environment is mostly relevant for life insurers and varies across both jurisdictions and companies, depending on the business mix. This relates mainly to interest rate sensitivity as a consequence of a combination of (i) asset/liability duration gaps, (ii) long-term investment return guarantees/policyholder bonuses and (iii) a lack of policy diversification/surrender penalties.
Life insurers offering relatively high minimum guarantees29 – as holds true of many firms in central and northern Europe – have faced the strongest headwinds in the environment of low returns on the fixed income assets at the heart of their balance sheets. On the other hand, non-life insurers appear to be focusing increasingly on pricing, thereby reducing their dependence on investment returns. The low interest rate environment is also inducing insurers to take more risks so as to maintain returns, thereby contributing to the general trend of a search for yield. For example, there is evidence of more infrastructure financing, and of shifts towards higher-yield but lower-quality bonds, in fixed income investment portfolios.
Challenges to the sector were underscored by mixed performance in the 2014 stress test undertaken by the European Insurance and Occupational Pensions Authority (EIOPA), which concluded that in the medium to long term, a continuation of the current low (or lower) yield conditions exposes some insurers to the risk of not meeting promises to policyholders. Clearly, euro area insurers are continuing to adjust to such challenges, as well as to the common risk-sensitive and market-consistent regime under Solvency II.
Financial condition of large insurers30
Large euro area insurance corporations continued to report healthy profitability, supported by buoyant financial markets, asset re-risking, generalised cost-cutting 29 Minimum guarantees are often set by governments and regulators. 30 The analysis is based on a varying sample of 21 listed insurers and reinsurers with total combined
assets of about €4.9 trillion in 2014, which represent around 78% of the assets in the euro area insurance sector. Quarterly data were only available for a sub-sample of these insurers.

Financial Stability Review, May 2015 80
throughout the industry and solid premium growth of both life and non-life insurers in the last quarter of 2014 and the first quarter of 2015 (see Chart 3.25, Chart 3.26 and Chart S3.22 in the statistical annex). On the life insurance side, while low economic growth has traditionally hampered activity in this segment, such pressures may be mitigated by demand for retirement, savings and health solutions also during economic downturns. Indeed, growth in life premiums remains positive overall, albeit in a context of substantial country fragmentation. On the non-life insurance side, premiums – mainly personal property and motor insurance – also remained stable. In general, non-life premiums are more stable than life premiums as many types of non-life insurance are mandatory. Overall premium growth of globally active insurers also benefited from positive business developments in emerging markets.
Chart 3.26 … supported by buoyant financial markets and solid underwriting performance in recent quarters
Growth of gross premiums written for a sample of large euro area insurers (2012 – Q1 2015; percentage, 10th and 90th percentiles, interquartile distribution and median)
Sources: Bloomberg, individual institutions’ financial reports and ECB calculations.
In the absence of large-scale loss events, combined ratios (i.e. incurred losses and expenses as a proportion of premiums earned) remained stable (see Chart S.3.23), with the median standing below 100% for the last three years, favoured by benign loss developments in the last quarter of 2014.
While reported profitability was robust, challenges have emerged in investment returns, which continued to decrease in the last quarters. Such challenges appear to be linked to the prevailing environment of low interest rates (see Chart 3.25). This is especially true for some life insurance companies, due to a higher reliance on investment income as their guaranteed business is that exposed most to a prolonged period of low interest rates.
While the capital positions of the large euro area insurers have been relatively stable over the last few years (see Chart S.3.24 in the statistical annex), the current low-yield environment has put pressure on the capital bases of small to medium-sized life
-25
-20
-15
-10
-5
0
5
10
15
20
25
12 13 14 Q314
Q414
Q115
-25
-20
-15
-10
-5
0
5
10
15
20
25
12 13 14 Q314
Q414
Q115
Life insurance Non-life insurance
Chart 3.25 Investment income suffers from low interest rates, but profitability remains stable…
Investment income and return on equity for a sample of large euro area insurers (2008 – Q1 2015; percentages; 10th and 90th percentiles, interquartile distribution and median)
Sources: Bloomberg, individual institutions’ financial reports and ECB calculations. Notes: Investment income excludes unrealised gains and losses.
0
1
2
3
4
08 09 10 11 12 13 14 Q314
Q414
Q115
Investment income (% of total assets)
-10
-5
0
5
10
15
08 09 10 11 12 13 14 Q314
Q414
Q115
Return on equity (%)

Financial Stability Review, May 2015 81
insurers, which tend to hold less diversified portfolios, including the potential for large duration mismatches between assets and liabilities. Indeed, the recent EIOPA 2014 stress test found that while the top 30 European insurers have Solvency II ratios of above 100%, 14% of the core stress participants (representing 3% of total assets in the sample) have a solvency capital requirement ratio below this threshold.31 This demonstrates that the vulnerability of some insurers becomes visible in market-based valuations. A potential sharp unwinding of risk premia (credit spreads increasing) would have a substantial impact on insurance companies via decreasing asset values, given their high exposures to fixed income securities – in particular corporate bonds – on the asset side.
The EIOPA 2014 stress test also suggested that some euro area insurers – particularly life insurers that offer guarantees and have implied duration mismatches between assets and liabilities – are vulnerable under scenarios with coincident stress to both the asset and the liability side of balance sheets – for instance, adverse price developments in assets held by an insurance company (e.g. losses on sovereign
holdings), combined with an increase of liabilities due to lower interest rates (which damages the ability of insurers to match their liabilities).
Insurance sector outlook: market indicators and analyst views
The European insurance equity index has outperformed the overall stock market significantly since the third quarter of 2014 (see Chart S.3.30 and Chart 3.32). Despite the challenging operating environment that may constrain capital in the long term, waning euro area country fragmentation, high capital gains on bond holdings and the release of excess capital as a result of lower claims given falling inflation have boosted share prices. Market-based indicators suggest a relatively favourable outlook for next year (see Chart 3.27). Credit spreads on insurance bonds remain stable at low levels, which reflects the positive view of large insurers’ performance (see Chart S.3.28).
31 The solvency capital requirement (SCR) is a formula-based figure calibrated to ensure that all
quantifiable risks are taken into account. The SCR is the capital required to ensure that the insurance company will be able to meet its obligations over the next 12 months, with a probability of at least 99.5% (see “EIOPA insurance stress test 2014”, EIOPA, 28 November 2014).
Chart 3.27 Despite the challenging environment, market-based indicators suggest a stable outlook for euro area insurers
Earnings per share of selected euro area insurers and real GDP growth (Q1 2002 – 2016)
Sources: ECB, Thomson Reuters and ECB calculations.
-7-6-5-4-3-2-1012345
2002 2004 2006 2008 2010 2012 2014 2016
actual earnings per share (EUR)real GDP growth (percentage change per annum)earnings per share forecast for 2015 and 2016 (EUR)real GDP growth forecast for 2015 and 2016 (percentage change per annum)

Financial Stability Review, May 2015 82
Notwithstanding such strong equity performance in the past, analysts expect profitability challenges to remain significant, especially for life insurance companies in a low interest rate environment. Life insurers that have sold products with guaranteed returns are expected either to increase their premiums charged from customers or to reallocate their portfolios towards more risky assets – as it is becoming difficult to write profitable spread business that is attractive to policyholders. On the non-life insurance side, better combined ratio margins, and higher and more stable returns on equity, are expected.
Investment risk
Large euro area insurers have been gradually re-risking their investment portfolios in response to low yields on portfolios traditionally dominated by fixed income instruments. Indeed, such pressures are inherent in rolling over assets – implying a need to reinvest at lower yields, or to seek alternative, less traditional investments. In practice, this has involved two mechanisms: rotation within fixed income portfolios and an extension of duration risk. This re-risking has been done on an incremental basis as assets are rolled over and new money is reinvested with a greater weighting towards higher-yielding bonds (see Chart 3.29)32, rather than by liquidating balance sheet assets. Contrary to the signals of the investment uncertainty map (see Chart 3.31), exposures to sovereign bonds and covered bonds have increased over the past year, whereas exposures to structured credit have fallen, with slight movements in other asset classes as well (see Chart 3.28). At a sectoral level, the trend towards investment in illiquid assets (e.g. securitisations, corporate loans, real estate loans, infrastructure investments33 and mortgage loans) is accelerating, although only slightly, in some cases facilitated by recent changes in the calibration of the future Solvency II regulatory regime.
32 Rating downgrades have probably also contributed to pushing down the ratings of holdings. 33 With respect to long-term investment by insurers in the infrastructure sector, the following three
investment vehicles seem to be the most popular: (i) direct project finance (bonds, loans or equity), (ii) infrastructure investment funds (listed and unlisted) and (iii) infrastructure loan securitisation vehicles.
Chart 3.28 Investment portfolios still dominated by fixed income securities...
Investment portfolio split of selected euro area insurers (2011-2014; percentage of total investments; weighted averages)
Sources: JPMorgan Cazenove, individual institutions’ financial reports and ECB calculations. Note: Based on available data for 15 large euro area insurers and reinsurers.
Chart 3.29 … with lower rated bond exposures increasing
Bond investments of selected large euro area insurers split by rating category
(2011-2014; percentage of total investment portfolio; weighted averages)
Sources: JPMorgan Cazenove, individual institutions’ financial reports and ECB calculations. Note: Based on available data for 15 large euro area insurers and reinsurers.
0%
5%
10%
15%
20%
25%
30%
35%
40%
45%
50%
Gov
ernm
ent
bond
s
Cor
pora
tebo
nds
Equi
ty
ABSs
Rea
les
tate
Oth
er
2011 2012 2013 2014
0%
5%
10%
15%
20%
25%
30%
35%
40%
45%
AAA AA A BBB Non-investmentgrade
Unrated
2011 2012 2013 2014

Financial Stability Review, May 2015 83
Investments in government bonds – in some cases, with a high domestic sovereign focus – continue to be the most important element of most portfolios. Further decomposition of sovereign bond exposures in terms of geographical orientation (see Chart 3.30) shows that large euro area insurers have recently increased their total amounts outstanding of exposures to vulnerable euro area countries and other jurisdictions (with emerging economies’ bond markets accounting for an increasing share), while decreasing their exposures to other euro area countries. However, these aggregate exposures conceal a high degree of heterogeneity at the country and company level. For instance, exposures to Greece and Portugal have fallen by 95% and 37% respectively since 2011, while the recent decrease in exposures to higher-rated euro area countries has been driven mainly by a reduction of German sovereign bond exposures.
Insurers may act pro-cyclically34 with their asset allocation, given a prospect of commonality in behaviour due to common exposures and business models, the increased use of asset managers,
benchmarks and mechanical investment rules and regulation. Insurers reacting pro-cyclically may also contribute to the building-up of risk in periods of financial exuberance, in which risk (such as credit and liquidity risk) is under-priced, by taking on more risk. In addition, life insurers are major users of interest rate swaps. Apart from increased counterparty and liquidity risks, derivatives activity may contribute to pro-cyclicality in some cases. For example, when risk-free rates are falling, insurers may increase their demand for interest rate swaps (as receivers of fixed interest rates) to insulate themselves against further falls, which could push rates down further.
34 See, for example, “Procyclicality and structural trends in investment allocation by insurance companies
and pension funds: A Discussion Paper by the Bank of England and the Procyclicality Working Group”, Bank of England, July 2014.
Chart 3.30 Sovereign exposures remain high, with increases in debt issued by emerging market economies and vulnerable euro area countries
Geographical split of the government bond holdings of selected large euro area insurers (2011-2014; EUR billions)
Sources: JPMorgan Cazenove, individual institutions’ financial reports and ECB calculations. Notes: Vulnerable countries are Spain, Italy, Portugal, Greece and Ireland. Non-vulnerable countries are Germany, France, Belgium, Netherlands and Luxembourg. Based on available data for 15 large euro area insurers and reinsurers.
0
50
100
150
200
250
300
350
400
450
500
Vulnerablecountries
Non-vulnerablecountries
United Kingdomand United States
Others
2011 2012 2013 2014

Financial Stability Review, May 2015 84
Chart 3.31 Investment uncertainty map shows potential for corrections in several markets
Investment uncertainty map for the euro area (Jan. 1999 – Apr. 2015)
Sources: ECB, Bloomberg, JPMorgan Chase & Co., Moody’s, Jones Lang LaSalle and ECB calculations. Notes: Each indicator is compared with its “worst” level since January 1999. “Government bond markets” represent the euro area ten-year government bond yield and the option-implied volatility of German ten-year government bond yields, “Corporate bond markets” A-rated corporate bond spreads and speculative-grade corporate default rates, “Stock markets” the level and the price/earnings ratio of the Dow Jones EURO STOXX 50 index, “Structured credit” the spreads of residential and commercial mortgage-backed securities, and “Commercial property markets” commercial property values and value-to-rent ratios.
Other activity
Reliance on carry trades to generate profits – whereby the insurer offers a guarantee to a customer and tries to invest that money in a bond (or any other asset class) to obtain higher returns so as to earn a spread – has been challenged by declining risk-free interest rate and credit spreads. If the duration of companies’ assets and liabilities were completely matched, the primary impact from lower yields would be on the profitability of new business. Euro area insurers are still managing to write new business as they are continuing to reduce the guaranteed rates on such business, but margins will continue to decline as interest rates fall further.
Pressures in non-life insurance arise mainly from retail business, in particular motor and property insurance. Intense competition – also from non-insurance companies – is likely to continue to weigh on profitability. Aggressive pricing and uncontrolled growth are factors that can endanger the continuity of the provision of insurance coverage by driving competitors out of business and diminishing the natural substitutability across the different providers of insurance cover. In addition, aggressive pricing can result in under-reserving building up unnoticed over time.
In life insurance, new business presents options in terms of changes in product design or changes in the mix of business to counteract the effect of low interest rates. Enhanced asset management operations allows fee-based revenue streams to be tapped that help to diversify earnings away from underwriting performance and spread-based investment income, because they are also less capital-intensive than designing guaranteed products that place the expense of hedging on the insurer’s balance sheet. Life insurance corporations have already started to focus on these options, with increased sales of unit-linked products without guarantees, while also
Government bond markets
Corporate bond markets
Structured credit
Commercial property markets
greater than 0.9 between 0.7 and 0.8
between 0.8 and 0.9 below 0.7 data not available
11 12 13 14 151099 00 01 02 03 04 05 06 07 08 09

Financial Stability Review, May 2015 85
exploring new lines of business and improving analytics35 to better cope with the low-yield environment.
Involvement in non-traditional and non-insurance activities36 remains limited at the euro area aggregate level. These activities imply material liquidity transformation, maturity mismatch, leverage, complex risks and financial system interconnectedness, all of which make insurers particularly pro-cyclical and vulnerable to financial risks, especially in the event of a financial crisis where insurers might face correlated and larger than expected losses, and be confronted with liquidity pressures that potentially amplify external shocks. Although credit intermediation activities by euro area insurers are not extensive, they are not insignificant in some countries, nor are they insignificant when taken together. The extension of credit to households and corporates is only significant in the Netherlands, Belgium and Germany. In these countries, loans account for more than 5% of insurers’ total financial assets. However, these loans (mainly mortgages) are not significant when compared with the total credit extended in these countries. Sales of credit protection are also reported to have increased slightly in recent times.
The reinsurance industry has benefited from a decline in overall losses in 2014, and from the fact that the insured losses caused by global natural disasters were the lowest recorded since 2009. This prolonged period of relatively benign catastrophe activity – combined with continued inflows of new capital – has had a further dampening effect on reinsurance rates, especially those in catastrophe business. Reinsurance pricing – which is, in turn, an important driver of primary commercial insurance pricing – had declined by 10-15% at the beginning of the 2015 renewal period. Weakening rates are affecting all lines of reinsurance business and all regions. Whilst demand for reinsurance cover has increased in the wake of rate cuts in 2014, this has partly been offset by the fact that large insurance groups are centralising their purchasing of reinsurance, leading to an increase in retentions (i.e. purchases of less reinsurance).
35 As is the case in many other sectors, “big data” – extremely large data sets that may be analysed
computationally to reveal patterns, trends and associations – is becoming increasingly important to insurers’ profitability and competitiveness, particularly for customer service, pricing and fraud detection. For example, big data is starting to feature in health insurance, with products such as wristbands that monitor policyholders’ physical activity providing data for pricing that more accurately reflects each customer’s individual risk profile. In non-life insurance telematics, data are already widely used in motor insurance.
36 These activities include, among others, financial guarantee insurance and direct lending.

Financial Stability Review, May 2015 86
Catastrophe bond issuance reached a record high of USD 8 billion in 2014, reflecting increasing investors’ appetite in this sector. The ongoing search for yield in the current environment continues to make it attractive for alternative capital37 to flow into the reinsurance industry, in particular through insurance-linked products (see Chart 3.32), which in turn drives down the price of the insured risks (even though the risks themselves may not have changed materially). The increased issuance of these types of products creates tighter links between reinsurers and financial markets, potentially resulting in some degree of opaqueness where it is not entirely clear who holds the risk. This also makes the reinsurance market vulnerable to pro-cyclical behaviour on the part of investors. In addition, insurance-linked securities may lead to the building-up of tail risk for investors who are not aware of, let alone appropriately able to manage, this risk. For instance, longevity risk transfer exposes investors to relatively unknown risks. In the euro area, the absolute volumes, although increasing sharply, are currently still modest.
Although cyber insurance products have been around for over a decade, general awareness has only recently increased after a number of high-profile breaches. Cyber insurance has been conceived to mitigate losses of business income caused by damage stemming from a cyber attack. New data protection legislation is in the pipeline across Europe,38 with the potential to increase demand for cyber insurance in the near future. Lack of expertise and an inadequate understanding of cyber risks by both underwriters and policyholders remain a major obstacle to even greater growth in this field. Cyber attacks differ from traditional insurable risks in that their scale and, consequently, the associated financial loss could be significantly higher and more widespread than in the case of any other risk that is insured today. Aggregation risk should be particularly closely monitored as the cross-border nature of cyber attacks undermines geographical diversification through reinsurance.
The potential use of captive reinsurance39 for capital arbitrage is regarded as a prominent risk to financial stability that emerged in the United States last year. 40 In
37 Alternative capital accounted for USD 60 billion of the global property catastrophe limit at the end of
2014, accounting for 18% of the global catastrophe limit, up from 15% in 2013, according to Guy Carpenter.
38 In 2013, the European Commission proposed an EU Network Information Security Directive to put in place a cyber security strategy for “critical infrastructure operators” which provides a framework for the implementation of a common level of data and network security across the EU. The regulations include breach and incident notification obligations.
39 Captive reinsurance companies are affiliates of insurers that are not subject to the same prudential reserve and capital requirements as a primary insurer. Captive reinsurance companies are created for the purpose of assuming insurance risk that is transferred from a regulated insurance affiliate.
40 2014 Annual Report, Office of Financial Research, US Department of the Treasury, December 2014.
Chart 3.32 Reinsurance prices continue to fall, driven by (among other factors) inflows of alternative capital attracted by outperforming catastrophe bond returns
Cumulative return profiles, broken down by market asset class and reinsurance pricing (Q1 2002 – Q1 2015; index: Q1 2002 =100)
Sources: Bloomberg, Guy Carpenter and ECB calculations. Notes: The series for pricing ends Q4 2014. S&P 500 and EURO STOXX are used as benchmark indices for US and euro area stocks respectively. The Guy Carpenter World Property Catastrophe RoL Index tracks changes in property catastrophe reinsurance premium rates on a worldwide basis.
100
120
140
160
0
100
200
300
400
2002 2004 2006 2008 2010 2012 2014
pricing (right-hand scale)catastrophe bonds (left-hand scale)US stocks (left-hand scale)hedge funds (left-hand scale)commodities (left-hand scale)euro area stocks (left-hand scale)euro area insurers (left-hand scale)

Financial Stability Review, May 2015 87
the euro area, group supervision and strict rules on the equivalence of supervisory regimes outside the euro area should prevent regulatory arbitrage. However, euro area insurance groups with subsidiaries in the United States could benefit from shifting risks to captive reinsurance subsidiaries of that US subsidiary, if the solvency regime of the United States is considered equivalent for the next decade. Evidence of such activities exists and warrants close monitoring. Finally, capital arbitrage may also occur in the application of macroprudential tools in the banking sector. Instances could emerge where activities and risks targeted by the use of such tools in the banking sector could migrate to insurers either directly or indirectly via funding or credit instruments. Incentives to move risks between entities, especially within financial conglomerates, cannot be ruled out due to differences between Solvency II and the CRD IV.
3.1.3 Euro area non-bank entities
The role of non-bank entities in credit intermediation, and their links to the wider financial system, has strengthened amid historically low nominal rates and an ongoing search for yield. Using the broad definition of shadow banking by the Financial Stability Board (FSB), assets of non-bank financial entities in the euro area have more than doubled over the past decade, to reach €23.5 trillion by December 2014.41 Since 2009, the shadow banking entities have increased their share in the total assets of the financial sector from 33% to 37%, while – in parallel – credit institutions have seen their share in intermediation shrink from 55% to 49% of the approximately €60 trillion of total financial system assets in the euro area. This strong growth, and the increasing role of the non-bank entities in the euro area’s financial system, warrants closer scrutiny of structural and cyclical developments in these entities, including risks to financial stability.42
Growth of the non-bank financial sector has gathered pace again in recent years, following the global financial crisis and a shift to market-based funding. The expansion of the non-money market investment fund
sector has been the main source of growth of the shadow banking sector. Notably, at
41 The broad measure of euro area shadow banking entities refers to money market funds (MMFs) and
other financial intermediaries (OFIs), which include all non-monetary financial institutions apart from insurance corporations and pension funds. This measure is akin to the broad measure proposed by the FSB in its mapping exercise. The FSB defines shadow banking as “credit intermediation that involves entities and activities outside the regular banking system” (see “Shadow Banking: Scoping the Issues”, FSB, 12 April 2011, p. 3.).
42 The approach to monitoring shadow banking entities in the euro area was previously introduced in the Special Feature entitled “Structural features of the wider euro area financial system”, Banking Structures Report, ECB, October 2014, pp. 28-45.
Chart 3.33 Expansion of non-bank entities in the euro area driven mainly by growth in the investment fund sector
Broad euro area shadow banking assets (Mar. 1999 – Dec. 2014; EUR trillions)
Sources: ECB and ECB calculations. Note: A breakdown of statistical data for MMFs, other funds, and financial vehicle corporations (FVCs) is available only from the indicated dates onwards.
0
6
12
18
24
1999 2002 2005 2008 2011 2014
shadow banking sector for which no breakdown availablefinancial vehicle corporationsnon-money market investment fundsmoney market funds
Dec. 2008:Other funds
Data availabilitytimeline
Mar. 2006:MMFs
Dec. 2009:FVCs
December 2014EUR 23.5 trillion
September 2007EUR 17 trillionMarch 1999
EUR 9 trillionMarch 2003EUR 10 trillion

Financial Stability Review, May 2015 88
the same time, money market funds and financial vehicle corporations have declined in volume terms. The broad shadow banking aggregate continued to grow strongly over the past six months, at an annualised rate of 14% (see Chart 3.33).
While it is difficult to discern a direct replacement of bank credit by non-bank financial intermediation in the euro area, the growing role of non-bank entities in the financial sector there implies that the systemic relevance of these entities is increasing and that the potential for difficulties, should they emerge, within non-bank financial entities to reverberate to the wider financial system is growing. As the non-bank financial entities have strong direct and indirect links with the traditional banking sector, there are concerns that shadow banking entities could be part of future systemic events. Possible channels of risk contagion and amplification include correlated asset exposures, as well as mutual contractual obligations in derivatives markets, and securities lending and financing transactions. Where the direct links are concerned, euro area non-bank entities are important providers of bank funding and hold roughly 10% of bank debt securities. Conversely, euro area banks’ direct exposures to non-bank entities amount to 8% of the aggregate balance sheet of MFIs. In addition, banks can provide liquidity backstops, indemnification or credit lines to non-banks in times of stress.
Two factors are particularly relevant from a financial stability perspective. First, there is a growing concern about the potentially destabilising role of non-bank entities in sharp price adjustments in asset markets. While key vulnerabilities result from liquidity transformation and the pro-cyclical provision of liquidity to financial markets, solvency concerns are somewhat muted due to a high share of equity in some relevant parts of the sector. Second, while important data collection projects are underway, the ability of the authorities to monitor specific risks remains limited. For
instance, the use of leverage embedded in derivatives positions, as well as in securities lending and financing transactions, is difficult to monitor, but market intelligence suggests that these activities have become widespread in the non-bank financial sector.
The investment fund sector
The rapid expansion of non-money market investment funds (non-MMFs) has been the main driver of growth in the non-bank financial sector and accounts for a significant proportion of its assets. The sector has expanded by almost 30% since 2010, excluding valuation effects. Assets managed by investment funds other than MMFs have increased by €4.0 trillion (74%) over the past five years, and by €660 billion (7.5%) in the past six months, to reach €9.4 trillion in the fourth quarter of 2014. The bulk of these funds are domiciled in Luxembourg, Germany, Ireland, France and the Netherlands, where the concentration of assets
Chart 3.34 Significant growth and further concentration of assets under management in key locations
Fund assets by location and type (Dec. 2009 – Dec. 2014; percentage of total assets)
Sources: ECB and ECB calculations. Notes: The columns refer to fund assets by location and type. The first and second rows represent the situation in 2009 and in 2014, respectively.
31%
8%
20%
19%
8%
14%
LU IE DEFR NL other
35%
16%18%
13%
8%10%
28%
32%
25%
6% 2%7%
equity bond mixedreal estate hedge other
27%
33%
25%
5%3%
7%

Financial Stability Review, May 2015 89
under management in key locations has increased further since 2009 (see Chart 3.34).
From a financial stability perspective, concerns relate to investment funds’ increasing role in credit intermediation and capital markets, and the implications for the wider financial system and the real economy. The fire-sale properties of demandable equity, the explicit or implicit leverage and the large footprint of some individual funds and asset management companies43 provide channels for contagion and risk amplification to the wider financial system. Industry-wide risks could be triggered, for instance, by a crisis of confidence in one or more large asset management companies and the funds they manage. Since almost all large asset management companies in the euro area are owned by banks or bank holding companies, reputational problems in the asset management arm could spill over to the parent company, or vice versa.
The greater the leverage, liquidity mismatch and size of certain intermediaries, the more likely investment funds are to amplify shocks and impose externalities on other parts of the financial system.44 Bond funds, real estate funds and hedge funds, in particular, have a potentially high impact. The bond fund sector is large in size (€3 trillion), holds a significant proportion of illiquid assets and plays an important role as provider of marginal liquidity in secondary bond markets. Smaller in size, real estate funds likewise engage in liquidity transformation with a focus on investment in assets that are highly illiquid. The hedge fund sector domiciled in the euro area appears to
be relatively small. However, hedge funds within and outside the euro area are important providers of market liquidity, especially in the less liquid asset markets. Hedge funds also rely more heavily on bank funding than other types of funds.
The market impact of the sector is high, in particular for euro area secondary bond markets, as investment funds hold a relevant and growing proportion of the debt securities of euro area banks, governments and non-financial corporates (see Chart 3.35). In the less liquid non-financial corporate markets, more than 25% of debt securities outstanding are now held by investment funds, a share that has increased significantly not only over the last few years, but also in the recent past. In the much larger markets for government and bank debt securities, investment funds still hold relevant shares of 12% and 9% respectively. Any large-scale portfolio rebalancing among investment funds could therefore result in significant
43 See Box 2 entitled “Structural and systemic risk features of euro area investment funds”, Financial
Stability Review, ECB, November 2014, pp. 43-46. 44 Chart 12 in the Overview illustrates three key metrics that determine contributions to systemic risk,
i.e. size, leverage and liquidity mismatch, for each investment fund sub-sector.
Chart 3.35 Rising share of investment funds in euro area bond markets
Share of outstanding euro area debt securities issues held by euro area (non-MMF) investment funds
Sources: ECB and ECB calculations.
0%
5%
10%
15%
20%
25%
30%
MFI debt securities Government debtsecurities
Non-financial corporatedebt securities
Q4 2009Q4 2013Q4 2014

Financial Stability Review, May 2015 90
swings in asset prices and market liquidity, possibly increasing funding costs for key euro area sectors.
Market intelligence suggests that crowded trades and search for high beta have made certain segments of the bond markets susceptible to bouts of low liquidity and the repricing of risk. Herding among fund managers and the unwinding of crowded trades is a relevant vulnerability in this context. Other factors include performance benchmarking and a rising share of passive investments that may aggravate herding among asset managers, especially in times of high uncertainty.
Concerns have been rising over the past few years that, given the growing size of the investment fund sector,45 large-scale fund outflows could adversely affect market liquidity, leading to structurally declining liquidity in some market segments and correlated exposures of funds (see Section 2.2). In the past, substantial outflows could be observed, in particular after major market events and sustained periods of stress. Following debt sustainability concerns in the euro area in August 2011, for instance, funds experienced comparably large outflows that amounted to more than 15% of the total assets for European high-yield institutional funds.46
Any future large-scale fund outflows could be aggravated by strategic complementarities among funds’ investors that result from first-mover advantages. Run-like risks arise from the issuance of callable equity used to fund relatively illiquid portfolios. Investment funds that invest in thinly traded assets face higher asset liquidation costs, but may also find it much harder to price their shares efficiently. While redemption fees or “swing-pricing” can mitigate risks associated with first-mover advantages, they cannot rule out that investors may wish to redeem their shares, also on a large scale.
Even though active portfolio management may enhance market liquidity under normal market conditions, investment funds could consume, rather than provide, liquidity under stressed conditions. Since large-scale outflows cannot be ruled out in the wake of economic and policy surprises, asset managers may be forced to replenish their liquidity buffers, to adjust portfolios within a short time span or to suspend the redemption of shares, thereby affecting market liquidity and exposing other market participants to spillover effects. Some asset managers may be further constrained in their ability to bridge acute periods of stress by internal investment policies and regulatory caps that prevent them from holding on to assets that are falling in value. Any outflows will probably add to existing sell-off pressures, even if they may not initially be caused by fund outflows.
A further concern relates to the growing use of leverage in the investment fund sector. Since average leverage ratios of investment funds are more than ten times smaller than those of banks, solvency risks seem to be limited – even when considering the more highly leveraged real estate and hedge funds. Comparing 45 About 60% of investment funds in the euro area are governed by regulations on undertakings for
collective investment in transferable securities (UCITS) and very probably offer shares redeemable on a daily basis, with this proportion varying across countries and sub-sectors. Likewise, non-UCITS funds can have liquidity mismatches, although redemption gates often mitigate the run risk of individual funds.
46 According to EPFR aggregate monthly net flow data for funds domiciled in western Europe.

Financial Stability Review, May 2015 91
balance sheet leverage in the investment fund sector to banks clearly shows how differently these two sectors intermediate credit and perform liquidity and maturity transformation. Banks are funded mainly by callable debt, i.e. deposits and notes, in addition to longer-dated liabilities, while investment funds issue predominantly callable equity. Therefore, balance sheet leverage ratios are relatively low for investment funds.
However, leverage differs greatly among the various entities and there may be pockets of high leverage in parts of the investment fund sector where it is potentially destabilising, but masked by the aggregate figures. For instance, some hedge fund strategies are known to involve high leverage, such as relative-value and global macro strategies.47 Leverage may be high and growing, in particular for funds not governed by the UCITS regulations which limit the use of debt funding.
Data from the ECB’s investment fund statistics show that balance sheet leverage has been on an upward trend since 2013, in particular in the case of hedge funds and bond funds (see Chart 3.36). This is also due to a relative increase in the balance sheet item which captures remaining assets and liabilities, including accrued interest and derivatives positions. Further data suggest that the use of derivatives is especially high and growing not only among hedge funds, but also among bond funds in comparison with other types of investment funds.
Swaps, futures and other derivatives allow investment funds to gain exposures to asset classes even without having them fully funded. In addition to balance sheet leverage, contingent commitments from such transactions create “synthetic leverage”. Although the UCITS Directive regulates leverage, it is possible under the current regulatory framework to gain exposures synthetically. Depending on the metric used,
such exposures can imply higher leverage than suggested by headline ratios (see Box 7). While solvency concerns play a lesser role than in banks, synthetic leverage can add to liquidity spirals, especially in times of distress, due to the high volatility of synthetically created exposures and the pro-cyclical nature of margining requirements associated with them.
Data availability still limits the ability of authorities to monitor synthetic leverage from a financial stability perspective, i.e. taking into account both on-balance-sheet and off-balance-sheet exposures. The European Securities and Markets Authority (ESMA), which is tasked with harmonising reporting practices, can request access to supervisory data from national authorities. However, supervision of investment funds remains vested de facto in national authorities, and statistical data on exposures and
47 See “Hedge Fund Survey”, Financial Conduct Authority, March 2014, p. 22.
Chart 3.36 Headline leverage in parts of the investment fund sector on an upward trend since 2013
Total assets to shares/units issued (Q4 2009 – Q4 2014; ratio)
Sources: ECB and ECB calculations.
1.00
1.05
1.10
1.15
1.20
1.25
1.30
1.35
1.40
2009Q4 2010Q4 2011Q4 2012Q4 2013Q4 2014Q4
equity funds bond fundsmixed funds real estate fundshedge funds other fundsmoney market funds

Financial Stability Review, May 2015 92
synthetic leverage in the investment fund industry are not collected in a systemic manner at the European level.
Box 7 Synthetic leverage in the investment fund sector
Excessive leverage is a key contributor to systemic stress. At the same time, measuring leverage has become more complex as financial innovation has given rise to contingent commitments not being captured ex ante by traditional leverage ratios. Such “synthetic leverage” can stem from derivative instruments or securities financing transactions that create exposures contingent on the future value of an underlying asset, which becomes evident, for instance, when a derivative position’s value moves strongly, potentially creating a profit or loss.
For the banking sector, concern relates to whether leverage embedded in derivative positions is adequately captured in capital ratios and whether regulatory arbitrage is possible by creating leverage synthetically. However, synthetic leverage is also relevant for the investment fund sector, which is subject to a different set of prudential rules. While solvency concerns in this sector are less prevalent due to a broad equity investor base, synthetic leverage can still play a role in fuelling liquidity spirals given pro-cyclical margining48 and collateralisation practices. Moreover, as most sizeable asset management companies in Europe are owned by banks,49 i.e. providing services or products to investment funds, synthetic leverage may play a role in amplifying shocks and transmitting them to the wider financial system.
A common way to capture synthetic leverage is by calculating cash-equivalent portfolios.50 Estimates of the market value of that equivalent portfolio are set in relation to the equity position to gauge synthetic leverage incurred. An important factor for calculating cash-equivalent portfolios is the calculation of exposures taking into account relevant netting sets. The definition of these is not trivial as many contracts differ in maturity, coupons or other contractual details. Some assets entering the netting sets may not be perfectly correlated; others potentially offset each other but have differing counterparty exposures.
The key regulations that govern leverage in the investment fund sector in the European Union are (i) the Undertakings for Collective Investment in Transferable Securities (UCITS) Directive and (ii) the Alternative Investment Fund Managers Directive (AIFMD). Under the UCITS Directive, funds have to comply with strict limits on leverage. Depending on the type of investment strategy, UCITS have to use a different method and comply with the limits applicable to that method.51 For basic investment strategies, UCITS should use the “commitment approach” under which derivatives exposures are converted into equivalent positions. The resulting “global exposure” comprises
48 The risks arising from pro-cyclicality in margining and haircut practices are described in detail in “The
role of margin requirements and haircuts in procyclicality”, CGFS Papers, No 36, Committee on the Global Financial System, March 2010.
49 See Box 2 entitled “Structural and systemic risk features of euro area investment funds” in Financial Stability Review, ECB, November 2014.
50 See Breuer, P., “Measuring off-balance-sheet leverage”, Journal of Banking and Finance, Vol. 26 (2-3), 2002, pp. 223-242.
51 The methods for calculating leverage are set out in the implementing Directive 2010/43/EU and further detailed in “CESR’s Guidelines on Risk Measurement and Calculation of Global Exposure and Counterparty Risk for UCITS”, 28 July 2010.

Financial Stability Review, May 2015 93
equivalent positions after netting and reinvested cash collateral. Global exposure must not exceed the fund’s total net asset value (NAV).52 For more complex investment strategies, UCITS should use the value at risk (VaR) and again, depending on the type of investment strategy, different types of VaR and limits should be used. UCITS are further limited in the amount they can borrow, i.e. with a limit of up to 10% of their assets on a temporary basis.53
Chart Leverage can be higher than what headline ratios suggest
Reporting options, exposure limits and synthetic leverage in investment funds (arrows reflect perceived risk exposures for a given portfolio under different reporting options)
Notes: 1) Under the UCITS Directive, a fund may not borrow more than 10% of its assets on a temporary basis. 2) Under the UCITS Directive, global exposure after netting may not be higher than the fund’s net asset value (NAV). 3) Maximum potential loss for a confidence interval, assuming a certain probability distribution for historical observations. 4) Sum of gross exposures, i.e. portfolio equivalents for derivatives, excluding cash; metric to be reported under the UCITS Directive and the AIFMD. 5) Maximum potential loss over a 20-day period at a 99% confidence interval; restrictions apply to UCITS. 6) Other limits may be binding, including counterparty exposure for UCITS.
Whereas the UCITS Directive limits the use of leverage, the AIFMD does not set any hard limits. Under the AIFMD, asset managers have to report the leverage of the funds they manage according to the commitment approach and the “gross method”, which use slightly different definitions of leverage than the methods applied under the UCITS Directive.54 The AIFMD also foresees the possibility for national authorities to impose limits on the leverage employed by an AIFM under its jurisdiction.55
An illustration of how funds’ perceived risk exposures can vary for a given portfolio is depicted in the chart above, depending on which of the reporting methods is used. The first panel relates to the
52 This limit is set out in Article 51(3) of the UCITS Directive, 2009/65/EC. 53 This limit is set out in Article 83 of the UCITS Directive, 2009/65/EC. 54 The methods for calculating leverage under the AIFMD are set out in Directive 2011/61/EU and further
detailed in the supplementing Regulation (EU) No 231/2013. 55 ESMA can issue advice to national authorities on measures that it believes should be taken, such as
the imposition of leverage limits.
Net asset value
Commitment approach2) VaR approach3)
Exposure gained synthetically
Global exposure < Net asset value Absolute VaR5)
< 20% NAV
Gross method4)
Relative VaR5)
< 2 x VaRof benchmark
portfolio
No limits apply6)
Net asset value
Direct invest-ments
Net asset value
Remaining assets incl. derivatives
On-balance-sheet leverage1)
Assets Liabilities
Net asset value
Net asset value
Perc
eive
d ex
posu
re
Actual exposure limits depend on volatility of the
underlying assets
Borrowings < 10% total assets

Financial Stability Review, May 2015 94
UCITS Directive, which limits a fund’s balance sheet leverage by restricting the amount of debt it can hold. The second panel considers cash-equivalent portfolios under the commitment approach. The commitment approach allows for the netting and hedging of equivalent derivative positions with opposite directions, making it a less conservative measure of leverage. The VaR approach56 in the third panel captures a different dimension of synthetic leverage, notably the volatility in portfolio values it creates. Limits may or may not be stricter depending on the volatility of the underlying assets. The last panel shows the gross method, for which netting and hedging are not allowed, making it a more conservative calculation of leverage.
While these qualitative indications suggest that the amount of leverage could be a larger concern than balance sheet leverage and cash-equivalent reporting suggest, remaining data gaps prevent a definitive quantification of prospective financial stability risks. Although reporting obligations provide information on effective leverage, data on leverage in the investment fund sector are not yet readily available in the official statistics and are not collected with a view to monitoring systemic risks.57 This suggests scope for a more systematic collection of statistical data on exposures and synthetic leverage in the investment fund sector, not least given the rapidly growing importance of this sector in the euro area.
Money market funds
The assets of the euro area money market fund (MMF) sector have shrunk from a peak of nearly €1.3 trillion in early 2009 to €835 billion in mid-2014. More recently, the sector has been growing again, namely by more than €100 billion in the period from June 2014 to December 2014. Growth in the second half of 2014 was driven predominantly by MMFs domiciled in Ireland and, to a lesser extent, by funds in Luxembourg, whereas funds in France shrank slightly in volume terms.
The consolidation of the MMF sector has continued as the number of these funds has more than halved since the global financial crisis, from around 1,600 before 2007 to slightly above 700 in December 2014, while the average fund size has increased by more than 70% over this period. Euro area MMFs remain highly interdependent with the euro area banking sector as around 73% of euro area money market fund exposures are to MFIs. The geographical concentration of the euro area MMF sector is high, with France, Ireland and Luxembourg accounting for up to 96% of the total money market fund sector.
56 Depending on the type of investment strategy, different types of VaR and limits should be used. Under
one option, funds reporting absolute VaR need to comply with a maximum VaR limit of 20% of their NAV, calculated over a one-month holding period at a 99% confidence interval. UCITS funds may further opt to report relative VaR, where the maximum VaR needs to be less than twice the VaR of the reference portfolio.
57 Information collected by competent authorities at the national level can be shared with other EU authorities, such as ESMA or the ESRB. Moreover, EMIR establishes a comprehensive reporting regime for derivative transactions and positions, from which, in principle, the funds’ derivatives exposures can be derived and used for monitoring purposes.

Financial Stability Review, May 2015 95
The maturity mismatch of euro area MMFs is limited by definition as both assets and liabilities are largely short-term in nature.58 Moreover, money market funds have only limited leverage as they are largely funded through shares/units issued, rather than through debt. From a financial stability perspective, concerns relate mainly to liquidity mismatch and the role of money market funds in funding the regular banking system.
Money market funds may experience difficulties in meeting redemption claims and would add to sell-off pressures in short-term debt markets if there were large-scale outflows in a stress scenario. A lack of liquid assets could prove problematic, as – under the most conservative measure, which would include deposits at MFIs, government debt securities and equity as liquid assets – only around 20% of the balance sheet can be deemed liquid. Under a very broad definition of liquid assets, which also includes all (short-term) debt securities, this would increase to almost 90%, which is still less than the sum total of short-term liabilities. First-mover advantages can become a concern, depending on which asset valuation methods are used and how regularly the net asset value (NAV) is checked and adjusted.
There is a high degree of interdependence with the regular euro area banking system as more than 40% of money market funds’ assets take the form of loans to euro area MFIs or holdings of euro area MFI debt securities. Bank debt securities remain by far the most important asset class held, accounting for three-quarters of the MMF balance sheet. At the end of 2014, euro area money market funds held €220 billion of euro area bank debt and €250 billion of non-euro area bank debt (see Chart 3.37). Moreover, US money market funds have been a key source of US dollar funding for euro area banks, which could prove problematic in the case of sudden outflows from these funds.
The investor base of MMFs differs significantly across countries. While French money market funds are almost exclusively euro area investors, the aggregate euro area money market fund balance sheet data suggest a sizeable reliance on non-euro area investors. Investors in Irish funds and, to a lesser extent, those in
Luxembourgish funds are largely non-euro area residents. The regional differences in the money market fund investor bases are mirrored by regional differences in MMF assets. The Irish money market funds – and, to a lesser extent, also Luxembourgish money market funds – invest mainly in non-euro area bank debt or in loans to non-euro area MFIs, with Irish funds having strong links to UK banks. French money market funds are invested almost exclusively in the euro area.
58 The maturity restrictions of money market funds covered in the statistics on which this analysis is based
are set out in Article 2(d) of Regulation (EU) No 1071/2013 of the European Central Bank of 24 September 2013 concerning the balance sheet of the monetary financial institutions sector (recast) (ECB/2013/33).
Chart 3.37 Large and rising share of non-euro area investors in euro area MMFs
Composition of assets of, and investors in, euro area money market funds (EUR billions)
Sources: ECB and ECB calculations.
0
200
400
600
800
1,000
1,200
1,400
euroarea
non-euroarea
euroarea
non-euroarea
euroarea
non-euroarea
euroarea
non-euroarea
euroarea
non-euroarea
euroarea
non-euroarea
non-euro area investors euro area investorsloans other loans MFIdebt securities other debt securities governmentdebt securities banks
December 2006 December 2009 December 2014

Financial Stability Review, May 2015 96
Regional differences in types of investment fund are also important from a regulatory perspective. The proposal that constant net asset value (CNAV) money market funds should hold capital equivalent to 3% of their total assets raised concerns about a further shrinkage of the MMF industry and its impact on euro area banks. While on aggregate, somewhat more than 40% of the industry’s assets under management are invested by CNAV money market funds, European CNAV funds are all based in Ireland (two-thirds) and Luxembourg (one-third). As a rule, such funds also have a larger non-euro area investor base than variable net asset value (VNAV) funds. While such CNAV funds may be more vulnerable to runs,59 it is at the same time plausible that a withdrawal of non-euro area investors would impact mainly funds that are largely invested in non-euro area assets (non-euro area bank debt and loans to non-euro area MFIs).
In the euro area, MMFs hold quite a sizeable proportion of the short-term debt securities issued by both euro area banks (33%) and NFCs (52%), although the absolute amounts of NFC debt held by MMFs are much smaller than those of financials. The relative shares of holdings fluctuate significantly and have recently shifted from credit institutions to securities issued by non-bank corporates, also due to seasonal effects (see Chart 3.38). MMFs are important providers of liquidity in these markets, and their rebalancing of portfolios or withdrawal of funds may contribute to liquidity risk.
Financial vehicle corporations
Assets held by financial vehicle corporations (FVCs) have shrunk by 30% since the end of 2009, when reporting of the series started.60 The decline in FVC assets can be explained by a weakening of loan origination and securitisation activity by euro area credit institutions over the past few years (see Chart 3.39), which in turn was largely driven by a reduced securitisation of loans to households.
59 See, for example, the Recommendation of the European Systemic Risk Board (ESRB) on market funds
of December 2012 and the proposed recommendations of the US Financial Stability Oversight Council (FSOC) regarding money market mutual fund reform of November 2012.
60 See “The case for a better functioning securitisation market in the European Union”, Joint Discussion Paper, Bank of England/ECB, May 2014 (available at: https://www.ecb.europa.eu/pub/pdf/other/ecb-boe_case_better_functioning_securitisation_marketen.pdf).

Financial Stability Review, May 2015 97
Chart 3.39 Securitisation activity in the euro area still subdued
Quarterly transaction volume by sector of the originated loan (Q1 2010 – Q4 2014; EUR billions)
Sources: ECB and ECB calculations.
With €1.9 trillion of assets, this sector is still a sizeable and important component of the euro area’s non-bank financial entities. FVCs remain an important channel for intermediating credit to euro area households. More than 10% of all MFI loans extended to euro area households are securitised through FVCs. For the Netherlands and Ireland, nearly one-third of all MFI loans to households are securitised through FVCs. Broken down by assets, most FVCs are located in countries that have experienced either a banking sector crisis or a house price collapse, or both.
FVCs are strongly interlinked with euro area banks; loans originated by euro area credit institutions account for 71% (nearly €1 trillion) of the FVC balance sheet. Securitised loans originated by euro area non-MFIs amounted to €279 billion by the end of 2014 (see Chart 3.40).
FVCs are generally set up to transfer credit risk from sponsors to investors. They engage in liquidity transformation, but do not necessarily carry a maturity mismatch. The FVCs take illiquid loans on their balance sheets and issue securities that are marketable or can be pledged by holders as collateral to obtain liquidity.
-80
-60
-40
-20
0
20
40
60
80
2010 2011 2012 2013 2014
non-euro area euro area NFCs euro area ICPFseuro area government euro area MFIs
Chart 3.38 MMFs are important investors in euro area corporate short-term debt
MMFs’ holdings of short-term euro area debt securities relative to total short-term debt securities issued by monetary financial institutions and non-financial corporations (Q2 2006 – Q4 2014; percentages)
Sources: ECB and ECB calculations.
Chart 3.40 Liquidity mismatch limited as FVCs are largely funded by longer-term debt
Assets and liabilities of FVCs (Dec. 2009 – Dec. 2014; EUR trillions)
Sources: ECB and ECB calculations. Note: Excludes other liabilities, i.e. (i) any differences between the nominal amount of principal outstanding of securitised loans and the transaction value paid by the FVC in purchasing such loans; (ii) financial derivatives liabilities subject to on-balance-sheet recording according to national rules; and (iii) accrued interest payable on loans and deposits and other amounts payable not related to the FVC’s main business.
20
30
40
50
60
2006 2007 2008 2009 2010 2011 2012 2013 2014
credit institutionsnon-financial corporates
0
0.5
1
1.5
2
2.5
euroarea
non-euroarea
Remainingassets
Liabilities euroarea
non-euroarea
Remainingassets
Liabilities
capital and reserves loansdebt securities > 1yr debt securities < 1yrsecurities other than shares securitised loans orig. by non-EA residentsother securitised assets securitised loans orig. by other EAsecuritised loans orig. by EA MFIs
December 2009 December 2014

Financial Stability Review, May 2015 98
A large proportion (approximately 75%) of the total assets of FVCs are longer-term assets, and this share has remained stable throughout the crisis. However, most of the FVC balance sheets (€1.4 trillion) are financed through the issuance of longer-term debt securities (with an original maturity of more than one year), so that the maturity mismatch of assets and liabilities on FVC balance sheets appears to be limited on aggregate.
Owing to their heavy reliance on debt financing and large holdings of private sector loans, FVCs have much higher levels of leverage and illiquid assets than other non-bank entities. Capital and reserves represent less than 2% of the FVC balance sheet; 8% of funding comes from loans, and the remainder from the issuance of debt securities, most with an original maturity in excess of one year. Assets of these entities are 40 times greater than their capital and reserves, while the share of illiquid assets in their total assets reaches 89%. Available data suggest a notable rise in the issuance of short-term liabilities, while at the same time the relative share of liquid assets has shrunk (see Chart 3.41). A large proportion of the FVCs in the euro area tend to match the maturity of their assets and liabilities, but it cannot be excluded that a growing proportion of the sector engages in maturity transformation.
Remaining non-bank entities
While the ECB’s recent data collection and classification exercise with respect to balance sheet data on investment funds and FVCs has provided detailed data and facilitated a better surveillance of the euro area non-bank financial sector, granular statistics are still not available for more than 50% of the sector’s assets. Following the recent reclassification under the ESA 2010, some limited information on the size, asset composition and geographical distribution of this
“residual” has become available (see Chart 3.42). Two-thirds of these residual assets are held in the Netherlands and Luxembourg. In the Dutch case, they are likely to be held by special financial institutions (SFIs), since De Nederlandsche Bank estimates that such entities account for two-thirds of the broad Dutch shadow banking sector.61 61 See “Dutch shadow banking sector smaller than it seems at first sight”, DNBulletin, De Nederlandsche
Bank, 29 November 2012.
Chart 3.41 Liquidity transformation among FVCs increasing
FVCs’ short-term liabilities and liquid assets (Q4 2009 – Q4 2014; percentage of total assets)
Sources: ECB and ECB calculations. Note: Short-term liabilities include debt securities issued with an original maturity of less than one year; liquid assets include deposits at MFIs, debt securities with an original maturity of less than one year and equity (excluding securitisation fund units issued by other FVCs).
Chart 3.42 Large parts of the non-bank financial sector remain in the shadows
Assets held by non-bank financial entities (Dec. 2014; EUR trillions)
Sources: ECB and ECB calculations.
0
2
4
6
8
10
12
14
2009 2010 2011 2012 2013 2014
short-term liabilitiesliquid assets
0
1
2
3
4
5
6
7
8
LU NL IE DE FR IT BE Othereuro areacountries
MMFs and non-MMFsFVCsresidual OFIs

Financial Stability Review, May 2015 99
SFIs are set up by corporations (mainly non-financial corporations) for tax purposes, to attract external funding and facilitate intra-group transactions. Although classified as falling within the OFI sector, the bulk of these SFIs do not engage in shadow banking activities. In the case of Luxembourg and Belgium, the residual includes a significant proportion of holding companies and other entities not engaged in shadow banking activities that have very limited financial links to the banking sector.
Limited balance sheet statistics would add some weight to the assumption that most of the residual entities are SFIs or holding companies: half of their assets are loans, the bulk of which are extended to euro area NFCs, and the other half largely comprises equities, possibly held by dedicated holding companies for which no breakdown is available. SFIs issue debt securities and provide credit to firms, while holding companies do not undertake operations, but hold shares of other companies. The residual component also includes other entities, e.g. broker-dealers, if not consolidated in bank balance sheets. In addition to a more targeted monitoring of sectors with a known composition, the residual must be monitored as part of the broad shadow banking aggregate.
3.2 Assessing the resilience of euro area financial institutions through scenario analysis
This section provides a quantitative assessment of four macro-financial scenarios that map the main systemic risks identified in the analysis presented in the previous sections of this FSR (see Table 3.1). The baseline scenario used in the assessment is derived from the Winter Economic Forecast of the European Commission. The assessment of the impact of macro-financial shocks on euro area financial institutions is based on a macroprudential simulation exercise involving top-down stress-testing tools.62 The four risks are summarised below:
(i) the risk of global financial market turbulence – reflected in a sharp increase of risk premia, amplified by low market liquidity, leading to falling stock and corporate bond prices, and to lower euro area external demand;
(ii) bank profitability and asset quality risk linked to further deterioration in credit quality – materialising through negative shocks to aggregate demand in a number of EU countries amid a negative price shock originating from commodity markets, which contribute to negative nominal growth;
(iii) the risk of renewed tensions in euro area sovereign debt markets due to rising concerns about debt sustainability – materialising through an increase in long-term interest rates and declining stock prices; and
62 The tools employed are: (i) a forward-looking solvency analysis, similar to a top-down stress test, for
euro area banks; and (ii) a forward-looking analysis of the assets and liabilities side of the euro area insurance sector. For a more detailed description of the tools, see Henry, J. and Kok, C. (eds.), “A macro stress-testing framework for systemic risk analysis”, Occasional Paper Series, No 152, ECB, October 2013, as well as “A macro stress testing framework for bank solvency analysis”, Monthly Bulletin, ECB, August 2013.

Financial Stability Review, May 2015 100
(iv) the risk of an adjustment in the shadow banking sector – propagated to the euro area banking sector through lower asset valuation, a reduced access and an increased cost of market-based financing, which puts constraints on the loan supply and reduces the value of bank bonds.
The materialisation of the first and second risks, identified as medium-level systemic risks, is considered more likely than the materialisation of the third and fourth risks, which are deemed to be potential systemic risks.
Table 3.1 Mapping main systemic risks into adverse macro-financial scenarios
Risk Scenario Key assumptions driving impact on GDP
Abrupt reversal of compressed global risk premia amplified by low secondary market liquidity
Global risk aversion scenario
Shocks to risk aversion and investor confidence worldwide fuelling stock price declines, widening of corporate bond spreads, and lower euro area foreign demand
Weak profitability prospects for banks and insurers in a low nominal growth environment, amid slow progress in resolving problem assets
Weak bank operating environment scenario
Shocks to private investment and consumption
Rise of debt sustainability concerns in the sovereign and corporate sectors amid low nominal growth
Sovereign debt crisis scenario
Renewed rise in sovereign bond yields to elevated levels and stock price declines
Prospective stress and contagion effects in a rapidly growing shadow banking sector
Shadow banking spillover scenario
Reversal of the improvement in euro area bank funding conditions, leading to higher money market rates and funding cost to the real economy
Global risk aversion scenario
The first adverse scenario reflects the risk of an abrupt reversal of investor confidence and risk aversion worldwide. In the risk aversion scenario, a negative confidence and stock price-driven shock emanating from the United States is assumed. Simultaneously, adverse effects are assumed to materialise in major emerging markets, namely a financial market shock accompanied by a slowdown of potential GDP growth. These shocks, in turn, would lead to a recession in the United States and a sharp slowdown in key emerging market economies, and would – via trade and confidence spillovers – have negative implications for the global economic outlook. This effect also includes the impact of derived increases in oil and other commodity prices. In addition, the reversal of the search for yield is assumed to lead to a marked worldwide increase in corporate bond spreads from their current low levels.
In this scenario, the shock to US stock prices amounts to -18% in the fourth quarter of 2014, with stock prices assumed to remain at this distance to the baseline until end-2016. The shock to corporate bond prices, in turn, corresponds, on average, to a haircut of around -4% on banks’ corporate bond holdings. The resulting negative impact on the EU’s external demand, derived with the NiGEM model,63 amounts to -7.4% by end-2016, relative to the baseline.
63 While NiGEM is used to capture the spillovers from trade endogenously through its trade variables, it
does not feature endogenous mechanisms for direct financial spillovers via e.g. confidence channels. Therefore, a GVAR model, as well as judgement, is used to estimate the financial spillovers from the US equity price shock to the global economy. For details on the GVAR model, see Dees, S., di Mauro, F., Pesaran, M.H. and Smith, L.V., “Exploring the International Linkages of the Euro Area: A Global VAR Analysis”, Journal of Applied Econometrics, Vol. 22, 2007, pp. 1-38.

Financial Stability Review, May 2015 101
The impact of the global shock on the euro area economies is subsequently derived using stress-test elasticities (STEs).64 The scenario translates into an overall drop in real euro area GDP, to 3.1% below baseline levels by end-2016. The real economic impact differs considerably across countries (ranging from -1.0% to -5.7% deviation from baseline levels at the end of 2016), depending, in particular, on their respective export orientation and sensitivity to commodity price shocks.
Weak bank operating environment scenario
In order to capture the risks related to weak profitability and the slow resolution of asset quality issues, this scenario involves country-specific negative shocks to aggregate demand in the form of an imposed slowdown in fixed investment and private consumption. Prices of oil and other commodities are assumed to remain strongly depressed with respect to the baseline scenario, which, on one hand, supports real economic growth, but on the other, puts an additional downward pressure on inflation and increases, in real terms, the debt-servicing burden of the non-financial sector. The negative inflation further reinforces the contraction of aggregate demand, as consumption and investment are deferred in expectation of lower future prices.
The impact of the weak euro area bank operating environment scenario has again been derived using the STE model framework. Overall, the real euro area GDP stands -1.8% below the baseline level by end-2016. The real economic impact differs considerably across euro area countries (ranging from -1.0% to -5.6% deviation from baseline levels at the end of 2016).
Sovereign debt crisis scenario
The sovereign debt crisis scenario envisages a renewed increase in euro area sovereign bond yields to elevated levels, as well as expected co-movements of other asset prices (stock prices, in particular). The bond yield shocks have been calibrated at a 1% probability level for the aggregate euro area sovereign credit spreads. To that end, a non-parametric simulation approach has been employed to simulate the joint forward distribution of bond yields and stock prices over a horizon of 60 business days. The underlying sample covers the period between 3 August 2012 and March 2015, with the starting point chosen so as to account for the significant regime change that was likely to have been introduced by the ECB’s announcement regarding OMTs on 2 August 2012. However, this sample may not be fully informative for future developments, as – going forward – the low yields of euro area sovereign bonds would be further supported by the expanded asset purchase programme of the ECB. This approach may also not fully reflect the tail risks related to the recent political developments in Greece.
64 Stress-test elasticities are a multi-country, EU-wide simulation tool. STEs are based on impulse
response functions (from ESCB central banks’ models) of endogenous variables to pre-defined exogenous shocks. The STEs furthermore incorporate intra-EU trade spillovers.

Financial Stability Review, May 2015 102
Long-term government bond yields are assumed to increase, and to retain a constant spread over the baseline over the horizon until the end of 2016. The adverse spread over the baseline for the euro area as a whole equals 50 basis points (nominal GDP, weighted average). The implied increase in government bond yields in all countries ranges from 2 to 155 basis points, with the most pronounced impact projected for Cypriot, Greek, Hungarian and Portuguese sovereigns.
The slope of national yield curves relative to the national ten-year benchmark bond yields (at the cut-off date of 31 December 2014) is used to transpose the simulated shock to maturities other than ten years. It is furthermore assumed that interest rates for all maturities remain at such higher levels until the end of 2016.
Next to the implied shocks to government bond yields, the resulting shock to stock prices derived from the simulation ranges from -1.5% to -25% across the euro area countries, with the strongest negative impact observed in Austria, France, Greece and Portugal. The weighted average impact on stock prices across the euro area countries amounts to -12%.
Finally, based on estimated regressions of credit default swap (CDS) spreads on long-term government bond yields, country-specific shocks to CDS spreads have been determined by the calibrated shocks to ten-year government bond yields.
The rise in sovereign bond yields, or declines in the prices of these bonds, along with other related asset price shocks, has three main effects on banks’ profit and loss accounts.
First, it implies marking-to-market valuation losses on banks’ sovereign exposures in the trading book, as well as in the portfolios of exposures designated as available for sale (AFS) or at fair value through profit or loss. End-2016 transitory provisions of the Capital Requirements Regulation (CRR) are applied with respect to the phasing-out of the prudential filters related to unrealised losses on AFS exposures.65 By contrast, sovereign exposures not subject to marking to market are not stressed.
Second, the increase in sovereign credit spreads, via its impact on money market rates and CDS spreads, raises the cost of banks’ funding.
Third, the country-specific shocks to interest rates and stock prices have direct implications for the macroeconomic outlook, which in turn affects banks’ credit risk.
The effect of these assumptions on GDP is derived using the STEs: by end-2016, euro area-wide real GDP stands at -0.2% below baseline levels.
65 The valuation haircuts are calibrated to the new levels of government bond yields, using the sovereign
debt haircut methodology applied in the EBA/SSM 2014 stress-test exercise, and assuming that 40% of the mark-to-market loss on the available-for-sale sovereign debt exposures would be deducted from regulatory capital. The exemption from the phase-out of the AFS prudential filters, provided in the CRR, is assumed not to be applicable.

Financial Stability Review, May 2015 103
Shadow banking spillover scenario
The shadow banking spillover scenario considers the spillovers from the non-bank financial sector to the EU banking sector via the funding channel and lower asset valuations. The loss of confidence in the shadow banking sector triggered by an abrupt drop in returns on investment in that sector would lead to a reversal of the improvement in euro area banks’ funding conditions, as observed since mid-2013, especially in the countries where the sovereign remains under stress. This would manifest itself through a set of shocks to money market interest rates, asset prices and credit costs for the private sector in the EU Member States. Banks are assumed to maintain access to market-based funding; however, they would be able to do so only at materially higher funding spreads.
The impact of distress in the non-bank financial sector on asset prices has been calibrated using statistical simulations which start with an assumption that returns on investment in the non-bank financial sector would fall abruptly. That initial drop in the valuation of the shadow banking sector would correspond to the 1% probability level. The response of other asset prices, notably stock prices and bond prices, would be consistent with that initial drop. The valuation of exposures held by banks in the portfolios subject to marking to market would be depressed, with negative effects on banks’ capital.
Owing to the role of non-bank financial institutions as providers of wholesale funding to the EU banking sector, the loss of confidence in these institutions would trigger a reduction of the funding available to banks. This would, in turn, cause a deterioration of bank funding conditions and affect the banking sector through three channels.
First, a shock of 80 basis points to the three-month EURIBOR captures the risk of worsening conditions in money markets. It emerges in the fourth quarter of 2014, and persists for the duration of the scenario.
Second, banks affected by funding constraints are assumed to increase the cost of extending credit to the private sector and to limit the supply thereof. To account for this effect, a set of country-specific shocks to the cost of corporate credit (via the user costs of capital) and to interest margins on loans to households (via the financial wealth of households) is considered.66
Third, the rolling-over of maturing wholesale funding at higher spreads directly erodes the net interest margins of the banks.
The effect of these assumptions on GDP is derived using the STEs: by end-2016, euro area-wide real GDP stands -0.3% below baseline levels.
Table 3.2 summarises the scenarios in terms of their resulting impact on euro area GDP, expressed in percentage point deviations from baseline growth rates (along
66 The country-specific shocks are calibrated taking into account the plausible further fragmentation of
funding markets (and differentiation in credit conditions for the private sector) across EU Member States. In addition, funding of the non-financial sector by the shadow banking sector may be curtailed; this transmission channel is not taken into account in this scenario due to data and model limitations.

Financial Stability Review, May 2015 104
with the deviations from baseline GDP levels at end-2016).67 The baseline scenario is aligned with the 2015 Winter forecast of the European Commission. The impact of the adverse scenarios is assumed to start generating stress as from the fourth quarter of 2014.
Table 3.2 Overall impact on euro area GDP growth under the baseline scenario and adverse shocks
2013 2014 2015 2016 Q4 2016
Baseline (EC Winter forecast, annual growth rates in percent) -0.5 0.8 1.3 1.9
percentage point dev. from baseline growth
% dev. from baseline level
Global risk aversion scenario -0.1 -1.6 -1.5 -3.1%
Weak bank operating environment scenario -0.1 -1.1 -0.7 -1.8%
Sovereign debt crisis scenario 0.0 -0.1 -0.1 -0.2%
Shadow banking spillover scenario 0.0 -0.1 -0.2 -0.3%
Solvency results for euro area large and complex banking groups
The impact on bank solvency is broken down into that on individual profit and loss results, on the one hand, and that stemming from cross-institutional contagion, on the other.
The impact of the four scenarios on the profit and loss accounts of large and complex banking groups (LCBGs) in the euro area68 (and on solvency positions) is obtained from a projection of the main variables that determine banks’ solvency, such as the credit risk parameters, profits and risk-weighted assets. Having computed the effects of the various shocks on the above-mentioned balance sheet components, the overall impact is expressed in terms of changes to banks’ common equity Tier 1 (CET1) capital ratios.
Under the baseline scenario, the LCBGs’ aggregate CET1 capital ratio is projected to decrease from 11.4% in the third quarter of 2014 to 11.3% by end-2016 (see Chart 3.43). The positive retained earnings (contribution of 3.0 percentage points to the aggregate CET1 capital ratio) are more than sufficient to absorb the flow of impairment charges on loans and other financial assets (contribution of -1.6 percentage points to the aggregate CET1 capital ratio). However, the concurrent increase in risk-weighted assets and other effects – related mainly to the gradual phasing-in of the requirements set out in the Capital Requirements Directive IV (CRD IV) – lead to an overall decline in the CET1 capital ratio.
67 The percentage point deviations from baseline growth and the percentage deviation from baseline
levels are two different ways of presenting the same scenario profile. The percentage deviations from baseline levels at the end of the horizon broadly correspond to a simple sum of the percentage point deviations from growth rates along the horizon.
68 The LCBGs include 16 euro area banking groups. The assessment uses data collected in the course of the ECB comprehensive assessment exercise of 2014, updated, where feasible, with publicly available data on bank capital positions at the end of 2014.

Financial Stability Review, May 2015 105
Chart 3.44 The global shock scenario and the weak bank operating environment scenario have the strongest adverse impact
Average CET1 capital ratios of euro area LCBGs under the baseline and adverse scenarios (2014-2016; percentages, average of euro area LCBGs)
Sources: Individual institutions’ financial reports, EBA, ECB and ECB calculations.
The end-2016 impact on banks’ solvency positions under the adverse scenarios is illustrated below (see Chart 3.44). Of all four distinct scenarios, the global shock scenario and the weak bank operating environment scenario have the strongest adverse impact on euro area banks’ solvency positions: the aggregate CET1 capital ratio of LCBGs is projected to fall by about 2.4 percentage points to 9.0% by end-2016. The sovereign debt crisis scenario, in spite of the limited impact on GDP, implies that the banks’ aggregate CET1 capital ratio would drop to 9.2%, similar to the outcome of the shadow banking spillover scenario. The limited variability of the impact of the scenarios is to some extent driven by the significant contribution of other effects, which are related – as under the baseline scenario – mainly to the transition to the CRD IV capital regime. In addition, the methodological assumptions of this exercise are largely consistent with the EBA’s EU-wide stress-test exercise, which implies that several items in the banks’ profit and loss accounts are projected using historical values.69
The drop in the capital ratio with respect to the result of the baseline scenario is driven mainly by the reduction of pre-provision profits, which are projected to contribute between 1.9 and 2.2 percentage points to the aggregate CET1 capital ratio. This reduction would be most pronounced under the global risk aversion scenario. Loan losses are projected to increase to between 1.9 and 2.0 percentage
69 For example, cumulative net trading income is projected as an average net trading income over the
most recent five years, less two standard deviations of net trading income. Similarly, operating expenses are held constant over the projection horizon.
11.4 11.3
9.0 9.0 9.2 9.2
5
6
7
8
9
10
11
12
Q3
2014
Base
line
at e
nd-
2016
Glo
bal r
isk
aver
sion
sce
nario
Wea
k ba
nkop
erat
ing
envi
ronm
ent
scen
ario
Sove
reig
n de
btcr
isis
sce
nario
Shad
ow b
anki
ngsp
illove
r sce
nario
Adverse shocks
Chart 3.43 Relatively modest impact on CET1 capital ratios under the baseline scenario
Average contribution of changes in profits, loan losses and risk-weighted assets to the CET1 capital ratios of euro area LCBGs under the baseline scenario (percentage of CET1 capital ratio and percentage point contribution)
Sources: Individual institutions’ financial reports, EBA, ECB and ECB calculations.
11.4 11.3
+3.0
-0.3
-1.6
0
2
4
6
8
10
12
14
16
CET
1 ca
pita
lra
tio, Q
3 20
14
Prof
its
Loan
loss
es
Ris
k-w
eigh
ted
asse
ts
Oth
er e
ffect
s
CET
1 ca
pita
lra
tio, e
nd-2
016

Financial Stability Review, May 2015 106
points of the CET1 capital ratio,70 and an increase in risk-weighted assets would reduce the CET1 capital ratio by between 1.1 and 1.3 percentage points.
Adverse shocks to individual banks’ solvency positions can lead to contagion effects via interbank liabilities. This can happen if, for example, the failure of a bank to comply with a threshold capital level would imply losses for interbank creditors – resulting in additional system-wide losses. In the absence of detailed data on interbank exposures, publicly available information and dynamic network modelling are used to simulate instances where a financial institution can cause contagious effects throughout the financial system.71
The interbank contagion results are derived by applying such a methodology to the four adverse shocks considered above (see Chart 3.45).72 For the simulated networks with the strongest contagion effects, the system-wide CET1 capital ratio falls by about 0.27 percentage point in some countries under the global risk aversion scenario. Contagion effects are more muted under the other three scenarios. Although the aggregate capital levels recorded under the four
scenarios are similar, the group of vulnerable banks that fuel the propagation of interbank contagion differs, leading to these material differences in the contagion effects. Moreover, should the banks respond to capital pressure by shedding assets at fire-sale prices, the impact on the CET1 capital ratio would be larger.
70 This result is to some extent driven by the assumption, also consistent with the EBA’s stress-testing
methodology, that the probabilities of default would not decrease over the stress-test horizon, even if the model result would suggest otherwise.
71 The exercise is based on a sample of banks participating in the ECB’s 2014 comprehensive assessment. Interbank exposure networks are generated randomly on the basis of banks’ interbank placements and deposits, taking into account the geographical breakdown of banks’ activities. For a more detailed description of the methodology, see Hałaj, G. and Kok, C., “Assessing interbank contagion using simulated networks”, Working Paper Series, No 1506, ECB, 2013, and Computational Management Science (10.1007/s10287-013-0168-4).
72 Two limitations on the maximum exposure that is allowed vis-à-vis an individual counterparty are embedded into the network simulators, following the prescriptions in Article 111 of Directive 2006/48/EC. First, an interbank exposure of each bank cannot exceed 25% of its regulatory capital. Second, the sum total of the interbank exposures of a bank, individually exceeding 10% of its capital, cannot be higher than 800% of its capital.
Chart 3.45 Impact of interbank contagion on bank capital ratios
Reduction of the CET1 capital ratio of euro area banks due to interbank contagion: dispersion across simulations (basis points of CET1 capital ratio; box: interquartile range, bars: 10th-90th percentile range)
Sources: Individual institutions’ financial reports, EBA, ECB and ECB calculations.
0
5
10
15
20
25
30
Global risk aversionscenario
Weak bankoperating
environmentscenario
Sovereign debtcrisis scenario
Shadow bankingspillover scenario

Financial Stability Review, May 2015 107
Box 8 Measuring the propagation of macro-financial shocks at the level of individual euro area financial institutions
The global financial crisis has highlighted that impaired financial institutions can significantly propagate aggregate or institution-specific stress to the overall economy. With financial contagion a key conduit of these impacts, data at the individual firm level are crucial to account for both cross-firm and macro-financial linkages. While traditional stress-testing methods offer considerable insights into these interdependencies, their findings can be complemented by the use of reduced-form models that exploit past empirical regularities. One such framework, drawing on the infinite-dimensional vector autoregressive (IVAR) framework of Chudik and Pesaran, includes both firm-level risk indicators and a global set of macroeconomic variables.73 This approach offers a means of linking firm-level default probabilities to aggregate international macro-financial variables.
Chart B A US equity shock has strong real and financial spillovers to the euro area economy
Impact of a negative US equity shock (20% decline) on euro area equity prices and economic activity (percentage points)
Note: Economic activity is measured by industrial production (monthly data).
Firm-level dynamics during the crisis suggest a strong role for heterogeneity. On aggregate, default probabilities tended to peak towards the end of 2008 during the period following the Lehman Brothers bankruptcy (see Chart A).74 At the same time, some firms experienced stronger distress
73 See Chudik, A. and Pesaran, H., “Infinite dimensional VARs and factor models”, Journal of
Econometrics, Vol. 163, 2011, pp. 4-22, and Al-Haschimi, A., Dées, S., di Mauro, F. and Jančoková, M., “Linking distress of financial institutions to macro-financial shocks”, Working Paper Series, No 1749, ECB, 2014.
74 Due to the lack of harmonised bankruptcy data, the exercise presented here is based on 12-month-ahead default probability measures obtained from the Kamakura Corporation for 35 euro area financial firms (banks and insurance companies). Altogether, the firms selected capture more than three-quarters of all assets in the Kamakura database for financial firms in the eight largest euro area countries.
-35
-30
-25
-20
-15
-10
-5
0
1 year 2 years 3 years 5 years
activityequity prices
Chart A Financial stress at 35 large financial firms in the euro area has varied widely over the last 15 years
Default probabilities for 35 firms in the sample (July 1999 – Dec. 2012; log-odd ratio transformation, monthly data)
Source: Kamakura. Notes: As the default probabilities (DP) are defined on the interval [0; 1], a log-odd transformation is used for firm i �𝑥𝑖,𝑡� defined on the interval (−∞; +∞) for each firm: 𝑥𝑖,𝑡 = ln ( 𝐷𝑃𝑖,𝑡
1−𝐷𝑃𝑖,𝑡).
-7
-6
-5
-4
-3
-2
-1
1999 2001 2003 2005 2007 2009 2011
min-maxmedian

Financial Stability Review, May 2015 108
during the euro area sovereign tensions in early 2012, while other firms showed high stress episodes in the early 2000s.
Building on this evidence, the international transmission of shocks can be assessed within the global IVAR framework of Al-Haschimi et al. through the lens of two simulations: (i) a simulated decline in US equity prices by 20% (which is close to the decline in stock prices observed following the Lehman Brothers bankruptcy); and (ii) the impact of a shock to the default probabilities of global systemically important financial institutions (G-SIFIs) – each presented in turn below.
Chart D Financial stress in euro area G-SIFIs has significant spillover effects on other large euro area banks
Impact of a one-standard-deviation shock to the default probabilities of the G-SIFIs on euro area financial institutions’ default probabilities (absolute change in log-odd ratio)
Notes: Default probability in log-odd ratio transformation (see the notes to Chart A). The diamonds show the peak median response of each firm over the first 60 months. The bars denote the 10th-90th percentile ranges around these peaks. The left panel corresponds to the default probabilities of the 10 G-SIFIs in the sample. The right panel corresponds to the default probabilities of the next largest 15 financial institutions. The x-axis shows the number of each firm, the firms being sorted from the largest by assets to the smallest. Firm 13 is a G-SIFI.
Results from the first simulation suggest that a 20% decline in US equity prices has a strong international spillover effect on the euro area economy and financial institutions. Euro area equity prices decline and the shock to US equities also affects real variables, with euro area industrial production declining by 3.4% after one year and remaining 4.2% below the level reached without the shock after five years (see Chart B). Importantly, the adverse financial shock in the United States has sizeable spillover effects on euro area financial institutions, albeit with marked heterogeneity among the responses across firms. A negative shock to equity prices in the United States has an adverse impact on the default probabilities of euro area financial firms that is of an economically significant magnitude when considering recent historical episodes such as the financial crisis (see Chart C). Moreover, the results show that the model can capture significant spillovers between financial firms, as the transmission of the macro-financial shocks to the financial institutions is amplified by the cross-firm linkages.
-0.05
0.00
0.05
0.10
0.15
0.20
0.25
0.30
10 15 19 23
median, others
-0.05
0.00
0.05
0.10
0.15
0.20
0.25
0.30
1 2 3 4 5 6 7 8 9 13
median, G-SIFIs
Chart C The US equity shock also leads to a significant rise in financial stress in euro area G-SIFIs
Impact of a negative US equity shock (20% decline) on the default probability of euro area financial institutions (absolute change in log-odd ratio)
Notes: Default probability in log-odd ratio transformation (see the notes to Chart A). The bars denote min-max ranges. The diamond shows the median of the response distribution among the 35 financial firms.
0.0
0.2
0.4
0.6
0.8
1.0
1.2
1.4
1.6
1.8
2.0
1 year 2 years 3 years 5 years
median

Financial Stability Review, May 2015 109
The second simulation suggests that a shock to the default probabilities of the euro area G-SIFIs yields significant and heterogeneous impacts on other institutions (see Chart D). There is a positive and statistically significant spillover of firm-level distress from the G-SIFIs to the majority of – typically larger – financial institutions. By contrast, some smaller firms lack statistically significant responses in their default probabilities.75 Notably, the median responses of some of the largest non-G-SIFI financial institutions are of a similar order of magnitude to the responses of the G-SIFIs themselves, while other financial firms experience a much more muted spillover or contagion effects from the distress of G-SIFIs. This points to the importance of using firm-level data to capture essential differences in institution-specific responses to financial stress.
All in all, these applications of the methodology suggest heterogeneous impacts of common shocks, as do the applications to systemically important institutions. An analysis of firm-level data is essential in this regard, as assessments using aggregate banking sector-level indicators fail to differentiate between the varied impacts of both common and idiosyncratic shocks. With such firm-specific risk, the considerable granularity in the current macroprudential toolkit appears well suited to assessing financial stability risks, with a capacity to strengthen the resilience of the financial system accordingly.
Assessing the resilience of euro area insurers
The assessment of the impact of the main euro area financial stability risks on large euro area insurers is conducted using publicly available data for 11 major euro area insurance groups up to the fourth quarter of 2014. It relies on a market-consistent approach to the quantification of risks, and is applied to insurance corporations, to both assets and liabilities. Due to the lack of sufficiently granular data, this impact assessment aims to spell out the main risks in economic terms, rather than trying to gauge the impact in terms of prudential solvency ratios.
The following market, credit and underwriting risks are assessed: (i) an increase in interest rates; (ii) a fall in equity and property prices; (iii) a deterioration of the creditworthiness of borrowers through a widening of credit spreads for marketable instruments; (iv) an increase in lapse rates;76 and (v) an increase in loss rates on loan portfolios. This assessment uses two scenarios that are most relevant for insurers – the global risk aversion scenario and the sovereign debt crisis scenario – as well as a joint scenario which combines individual scenarios used in the banking
75 Note that in Chart D, the responses of the largest 25 firms are shown to improve readability. The
impulse responses of the remaining ten smallest firms all have positive peak median responses, but about half are not statistically significant. This is likely due to smaller financial institutions being relatively more affected by local shocks, which are not explicitly modelled in this framework (for full results, see Al-Haschimi et al., loc. cit., 2014).
76 The lapse rate is defined as the fraction of contracts terminated prematurely by policyholders.

Financial Stability Review, May 2015 110
section to illustrate the adverse effects of a scenario in which all the previously described shocks materialise at the same time (see Table 3.3).77
Against this background, the risks for insurance companies are transmitted through three channels, namely through (i) valuation effects on financial securities and liabilities owing to changes in sovereign yields and swap rates, (ii) sales of assets due to unforeseen payments resulting from increased lapse rates and (iii) changes in the credit quality of loan portfolios.
Table 3.3 Main parameters for the assessment of euro area insurers
Baseline Global risk aversion Sovereign risk resurgence Joint scenario
Average euro area increase in short-term interest rates (basis points) 0 80 80 80
Average euro area increase in long-term government bond yields (basis points) 0 7 50 57
Average add-on in credit yields of corporate bonds (basis points) 0 167 0 167
Shock to equity prices (%) 0 -15 -12 -26
Average add-on in lapse rates (%) 0 1.1 0 2.2
Average cumulative loss rates on the loan portfolios over two years (%) 0.18 0.58 0.54 0.59
In this context, a number of simplifying assumptions had to be made for this exercise.
First, decreases in market values of insurance corporations’ holdings of shares, bonds and property are assumed to occur instantaneously, before institutions have an opportunity to adjust their portfolios. This implies that no hedging or other risk-mitigation measures78 were taken into account; consequently, losses may be overestimated.
Second, available granular data (e.g. on investment in sovereign bonds, broken down by jurisdiction, on investment in corporate bonds and on loans, broken down by credit ratings, and on liabilities and debt assets, broken down by maturity) were used wherever possible, but broad aggregates of financial investments were used in some instances.
Third, all income and expenses related to the underwriting business are assumed to be fixed. For example, reduced demand for insurance products is not taken into account, and each maturing contract is expected to be replaced, so that the underwriting income of each insurer remains constant. The underwriting component of income is stressed only in the form of increasing lapse rates (see Table 3.4).
77 However, it is important to stress that some of the shocks envisioned under the individual scenarios
would cancel out to a certain extent, for instance, oil and commodity prices which are assumed to increase under the global risk aversion scenario and to fall relative to the baseline under the weak bank operating environment scenario. Under the joint scenario, the euro area’s real GDP would fall below the baseline by, overall, -5.4% by end-2016.
78 For example, interest rate risk hedging, asset-liability matching techniques and counter-cyclical premia (to dampen the effect of temporary adverse interest rate shocks through offsetting changes in the valuation of liabilities).

Financial Stability Review, May 2015 111
Table 3.4 Technical assumptions regarding the individual risk drivers of insurers’ balance sheets Risk drivers Technical assumptions
Credit risk Credit risk assessment carried out using (i) breakdowns by rating or region, depending on data availability, and (ii) loss rate starting levels, which are stressed using the same methodology as applied for assessing the resilience of euro area banks.
Interest rate risk transmission
Sensitivities to interest rate changes computed for each interest-rate-sensitive asset and liability exposure. Relevant yield curves used to project asset and liability cash flow streams, to calculate internal rates of return, and to discount the cash flows using yield curve shocks.
Haircut definition Haircuts for debt securities derived from changes in the value of representative securities implied by the increase in interest rates under each shock and uniformly applied across the sample of large euro area insurers. Valuation haircuts to government bond portfolios estimated on the basis of representative euro area sovereign bonds across maturities. Haircuts for corporate bonds derived from a widening of credit spreads.
Lapse risk Lapse risk quantified by projecting insurers’ cash flows over a two-year horizon, assuming a static composition of contracts and the reinvestment of maturing assets without a change in the asset allocation. Lapse rates linked to macroeconomic variables79. Unexpected component of lapses80 leads to surrender payments81. In case of negative cash flows from surrender payments, the insurer is obliged to use cash reserves or sell assets to meet obligations. Lapse risk equals the cash or other assets needed to cover surrender payments.
Other assumptions specific to the sensitivity of investment income
Investment income earned from reinvested assets shocked on the basis of investment income earned at the beginning of the simulation horizon. All other assets assumed to earn the initial investment income throughout the simulation horizon. Maturing fixed income assets reinvested retaining the initial asset composition. Underwriting business component of operating profit assumed to remain constant throughout the simulation horizon. No distribution of dividends assumed.
Although the degree of vulnerability to the materialisation of macro-financial risks is heterogeneous across individual insurance groups, the results of this assessment confirm the importance of interest rate risk for the euro area insurance sector as the most important driver of the decline in net asset values across all adverse scenarios (see Chart 3.46). This result is particularly severe under the global risk aversion and the joint scenarios. Indeed, under these two scenarios, the interest rate risk implies a decline of 3.6% and 2.1% respectively in net asset values expressed as a percentage of total assets. Insurance companies also experience the most significant changes in their total net asset values under these two scenarios – with average total declines amounting to 5% and 6% respectively of their total assets. These results are mainly driven by the increase in interest rates, and by the flattening of the yield curve, combined with the shorter average duration of insurance companies’ assets with respect to the duration of their
liabilities. Indeed, these factors cause insurers’ assets to decrease faster than their liabilities, and thus lead to a decline of their net asset value as a percentage of total assets.
79 Sensitivities of lapse rates to GDP and unemployment were derived by taking the mean of a number of
elasticity values, collected from the literature (e.g. Honegger, R. and Mathis, C., “Duration of life insurance liabilities and asset liability management”, Working Paper, Actuarial Approach for Financial Risks (AFIR), 1993; Kim, C., “Report to the policyholder behaviour in the tail subgroups project”, Technical Report, Society of Actuaries, 2005; and Smith, S., “Stopping short? Evidence on contributions to long-term savings from aggregate and micro data”, Discussion Paper, Financial Markets Group, London School of Economics, 2004) and from ECB calculations.
80 The unexpected component of lapses is defined as the difference between the projected lapse rate and the average lapse rate reported by large European insurers.
81 It is assumed that 50% of the total amount represented by the extra lapse rates has to be paid (due to the existence of penalties in the contracts, which lower the insurers’ risk).
Chart 3.46 Insurers vulnerable to interest rate risk
Change in the net asset values of large euro area insurers under different scenarios (Q4 2014 – Q4 2016; percentage of total assets)
Sources: Individual institutions’ financial reports and ECB calculations
-4.0%
-3.5%
-3.0%
-2.5%
-2.0%
-1.5%
-1.0%
-0.5%
0.0%
Baseline Global Sovereign Joint
credit risk interest rate risk
lapse risk equity risk
property risk

Financial Stability Review, May 2015 112
Credit risk appears to be the second most relevant vulnerability for insurance companies. At the aggregate level, it implies an average change of between -1% and -1.7% in the insurers’ net asset values across the adverse scenarios. This outcome is driven mainly by corporate credit risk.
Variations in equity price losses are largely related to the heterogeneous severity of the equity shocks applied across the adverse scenarios. The negative impact of the adverse equity price shocks ranges from 0.3% of total assets under the sovereign scenario to about 0.6% under the joint scenario.82 Finally, lapse risk-related losses are higher under the joint scenario, amounting to about 0.7% of total assets.
In addition to the scenarios considered in this report, which correspond to the main risks to financial stability in the euro area, euro area insurers would be vulnerable to a low interest rate environment. This is confirmed by the results of the EIOPA 2014 stress test,83 which indicate that the impact of a low-yield scenario – while not as severe as that of a stress on asset values – would pose a challenge to insurers, in particular in some jurisdictions.
3.3 Continued progress in regulatory and macroprudential policy implementation
3.3.1 Macroprudential policy measures
This section considers the macroprudential measures that have been implemented in a number of euro area countries since November 2014. The measures introduced by the countries concerned can be grouped into three categories, real estate measures, systemic risk measures and reciprocation of measures.
Real estate measures
Real estate measures have been adopted with the aim of addressing undesirable developments in domestic property markets. Real estate typically represents a large proportion of banks’ credit exposures, and of households’ assets, thus making imbalances in this sector particularly important in terms of financial stability. In this regard, Ireland introduced limits on loan-to-value (LTV) and loan-to-income (LTI) ratios in order to increase the resilience of banks and households to property market risks.
In January 2015, the Central Bank of Ireland announced the introduction of new regulations on mortgage lending, following a public consultation process. The measures introduce proportionate limits on LTV and LTI ratios for both primary-dwelling-house (PDH) and buy-to-let (BTL) mortgages. The underlying rationale for
82 Owing to data availability, gross equity exposures (gross of unit-linked exposures) were used and,
consequently, the equity risk may be overestimated. 83 See “EIOPA insurance stress test 2014”, EIOPA, 28 November 2014.

Financial Stability Review, May 2015 113
the regulations is the need to increase the resilience of Irish households and banks to residential real estate, in the context of the high exposure of these sectors to property, and given the fact that a significant share of new lending is taking place at high LTVs and there have been sharp movements in house prices. Furthermore, the objective of these regulations is to reduce the risk of adverse bank credit and house price spirals. There are different limits for different categories of buyers. For non-first-time buyers of PDHs, a limit of 80% LTV applies on new mortgage lending. For first-time buyers of PDHs, a limit of 80-90% LTV applies, depending on the value of the property. Different approaches have been taken for first-time buyers of lower-value properties and for other borrowers, so that access to credit for first-time buyers is not overly restricted, while at the same time the effectiveness of the regulations is maintained. For BTL mortgages, a limit of 70% LTV applies. Furthermore, there is a LTI limit of 3.5 times gross annual income, which applies to all new lending for PDH purposes. The proportionate caps allow a certain percentage of new lending above each of these limits, providing an appropriate balance between allowing sufficient flexibility yet maintaining prudent lending standards. The rationale behind adopting limits on LTV and LTI together is that the two measures complement each other, with the LTI addressing the borrower’s loan affordability and the LTV addressing the lender’s losses in the event of default. The Central Bank of Ireland also views such thresholds as a way of ensuring a greater degree of safety around the mortgage business. The regulations were introduced through legislation adopted in February 2015.
Systemic risk measures
A number of member countries have recently taken decisions on the level of a countercyclical capital buffer. This buffer is an instrument provided for in the Capital Requirements Regulation/Capital Requirements Directive IV (CRR/CRD IV). The requirement of a countercyclical capital buffer aims to achieve the broader macroprudential goal of protecting the banking sector against periods of excessive aggregate credit growth that have often been associated with the build-up of system-wide risk. It requires banks to increase capital at times when credit is growing rapidly. The buffer can be released when the economic cycle turns. As from January 2016, all Member States will be required to decide on banks’ capital buffers on a quarterly basis (with Finland, Latvia and Slovakia having decided to implement this requirement as from the beginning of 2015).
In March 2015, Finland decided to set the countercyclical capital buffer at 0%. The decision of the Financial Supervisory Authority (FSA) is based on the analysis of the key indicators of systemic risk. In particular, although the credit-to-GDP ratio has exceeded its long-term trend, other important indicators for setting the countercyclical buffer – e.g. developments in housing prices, lending and the external balance of the economy – do not signal a rise in systemic risk. With protracted weak economic activity, credit growth has already subsided significantly.
In April 2015, Slovakia decided to set the countercyclical buffer rate at 0%. In its decision, Národná banka Slovenska argued that, over the past few years,

Financial Stability Review, May 2015 114
developments across the main leading indicators for setting the countercyclical capital buffer did not suggest that an increase in the rate was warranted. However, Národná banka Slovenska also highlighted that aggregate credit growth masks substantial divergence. While lending to the corporate sector in 2014 contracted for the third consecutive year, lending to the household sector continued to accelerate in the fourth quarter, with a year-on-year growth of 12%, albeit from a relatively low basis. In Slovakia’s view, under these circumstances and at this stage, other, more targeted macroprudential measures (such as those in Národná banka Slovenska’s recommendation of October 2014), rather than the countercyclical capital buffer, appear to be more appropriate.
In April 2015, Latvia decided to keep the countercyclical buffer rate at 0%. According to the Financial and Capital Market Commission’s calculations, the deviation of the credit-to-GDP ratio from its long-term trend remains significantly negative, and the buffer guide calculated in accordance with Capital Requirements Regulation is 0%. In fact, credit has been contracting since mid-2009, as a result of both demand and supply-side factors, and may act as a drag on the economic recovery and bank profitability going forward. After having fallen substantially in 2009, residential property prices have been recovering at a moderate pace and remain well below the pre-crisis level.
Reciprocation of macroprudential measures
In accordance with the Capital Requirements Regulation, reciprocation of a macroprudential measure refers to the application of the measure by other countries for bank activities in the country that initially adopted that measure. Lack of reciprocation may open up the possibility of regulatory arbitrage by cross-border banking groups that are able to shift their activities between group entities across borders and as a result, reduce the effectiveness of the macroprudential measure (see also Special Feature A that discusses cross-border spillover channels). With few exceptions, reciprocation by other Member States is typically voluntary.
In December 2014, De Nederlandsche Bank (DNB) notified its decision to reciprocate the measure on residential mortgage lending adopted by the Nationale Bank van België/Banque Nationale de Belgique (NBB). In December 2013, NBB had introduced a 5-percentage point add-on to the risk weights of Belgian residential mortgage loans calculated by banks that apply the internal ratings-based (IRB) approach. This was prolonged in March 2014. In NBB’s assessment, the main reasons for introducing the measure were the significantly lower capital requirements applicable to residential mortgages for credit institutions relying on the IRB approach than for those applying the Basel II framework. DNB decided to apply the same measure to mortgages on residential real estate issued through branches of Dutch banks located in Belgium. Given the fact that the activities of branches of Dutch Banks in Belgium are limited, the impact of the measures is expected to be very small. Most activities of Dutch banks in Belgium are performed through subsidiaries, which are already subject to NBB supervision.

Financial Stability Review, May 2015 115
3.3.2 Regulatory framework
This section provides an overview of a number of regulatory initiatives in the banking, insurance and market spheres that are of primary importance for enhancing financial stability in the EU. Importantly, in addition to strengthening the resilience and loss-absorption capacity of the whole financial system, the finalisation of the ongoing initiatives will significantly reduce the regulatory uncertainty regarding capital and liquidity rules for banks and other financial institutions as well.
Regulatory initiatives for the banking sector
The key elements of the prudential standards for banks and banking groups operating at the global level, as well as the framework for the supervisory review and evaluation process, are set out in the international capital and liquidity standards (Basel III) developed by Basel Committee on Banking Supervision (BCBS). These standards are implemented in the EU via the Capital Requirements Regulation/Capital Requirements Directive IV (CRR/CRD IV). Importantly, the prudential rules are generally applicable to all credit institutions and investment firms in the EU. While the comprehensive overhaul of banking regulation triggered by the financial crisis is coming to an end, certain remaining elements of Basel III and the CRR/CRD IV framework are still subject to finalisation and calibration, including parts of the liquidity regulation, the leverage ratio provisions and the securitisation rules.
The EU has been making significant progress with regard to the implementation of the international framework for liquidity regulation. In January 2015, the EU published the Delegated Act in the Official Journal for the liquidity coverage ratio (LCR).84 The final calibration of the LCR reflects a number of EU specificities in relation to the definition of high-quality liquid assets and the importance of banks for the financing of the real economy. In the EU, the LCR will enter into force in October 2015, with a starting level of 60%, and will be phased-in gradually to reach 100% in 2018.85 At the current juncture, the impact of the LCR on the functioning of markets, and on the real economy, appears to be largely muted. This is supported by the evidence provided in a report published by the European Banking Authority (EBA) in January 2015, and may be related to the compliance of the majority of banks with the LCR.86
As regards the net stable funding ratio (NSFR), the Basel Committee published a final document in October 2014, which introduced changes with regard to the treatment of short-term financing transactions with financial counterparties, as well as
84 See Commission Delegated Regulation (EU) 2015/61 of 10 October 2014 to supplement Regulation
(EU) No 575/2013 of the European Parliament and the Council with regard to liquidity coverage requirement for Credit Institutions, Official Journal of the European Union, L 11, 17 January 2015, pp. 1-36.
85 Under the Basel agreement, the LCR would need to reach 100% as of 1 January 2019. However, the European Commission may delay full implementation by one year, subject to a report by the EBA in June 2016 (see Article 461 of the CRR).
86 See “Second Report on impact assessments for liquidity measures under Article 509(1) of the CRR”, European Banking Authority, December 2014.

Financial Stability Review, May 2015 116
for derivative exposures and initial margins.87 With respect to the latter, the BCBS agreed to conduct a quantitative analysis in view of the ongoing implementation of regulatory requirements for the margining of derivatives. In the EU, the CRR mandates the EBA to conduct a comprehensive impact and calibration assessment of the NSFR, which it will submit to the Commission by the end of 2015.
The ECB is supporting the direction and work on liquidity regulation at the international and the European level. The need for liquidity regulation is one of the main lessons learnt from the financial crisis when many banks recorded significant shortcomings in their liquidity risk management. The insufficient holdings of liquid assets and excessive maturity mismatches in the balance sheets of some banks contributed considerably to the spreading of stress and instability throughout the financial system. The ECB is actively involved in the assessment of the market impact of the NSFR, with a view to understanding its impact on the transmission of monetary policy and the interaction with other regulatory standards, as well as the cumulative effects of regulation on banks and markets.
Work on the leverage ratio is progressing on various fronts. The Basel Committee is currently working on final aspects regarding the definition of the leverage ratio and will consider the calibration this year, with a view to migrating to Pillar 1 treatment on 1 January 2018. At the European level, the EBA has started work on its report on the impact and calibration of the leverage ratio. This will include the question as to whether the leverage ratio should differ for institutions following different business models. If introduced as a binding requirement in Pillar 1 and calibrated correctly, the leverage ratio will be a useful complementary measure for reinforcing capital requirements. The aim is to ensure systemic stability and allow the authorities responsible for macroprudential supervision to address risks stemming from the build-up of excessive leverage.
With regard to securitisation, work on simple, transparent and standardised securitisation has gained momentum this year, after the European Commission had announced in its work programme for 2015 that it will develop an EU framework for such instruments. The Commission launched a public consultation in mid-February, to seek input on the key components of such a framework; the ECB responded to this consultation together with Bank of England at the end of February. The ECB supports the Commission’s proposal to implement such a framework, as this would encourage the revival of the European securitisation markets in a sustainable manner and would support banks’ diversification of funding sources, their continued lending to the economy and a better allocation of risk in the EU financial system.
In parallel to the ongoing initiatives on the finalisation of Basel III – CRR/CRD IV, the BCBS has embarked on a strategic review of the capital framework in response to concerns about excessive complexity and a potential lack of comparability regarding banks’ capital ratios across jurisdictions, and across institutions more broadly. This work will consider the costs and benefits of basing regulatory capital requirements on banks’ own models for credit, market, and operational risk.
87 See “Basel III: the net stable funding ratio”, Basel Committee, October 2014.

Financial Stability Review, May 2015 117
Options under consideration in this context include measures that increase transparency, as well as restrictions on modelling so as to increase the consistency of the capital framework. One potential strategy for reform would start from the premise that models can be repaired, and would therefore focus on seeking enhancements to them. By way of an alternative on the other extreme, one could start with the premise that models have fundamental shortcomings and must somehow be replaced. The final recommendations of the strategic review will probably fall between these two poles, in a “hybrid” approach. This will result in models being retained and enhanced where they work well, but where models do not work well, their use will be ruled out and alternative means of risk-weighting assets will be found.
The ECB is supportive of the ongoing work undertaken by the BCBS in this context. From a macroprudential perspective, it will be important that the strategic review – in addition to reducing the variability and increasing the comparability of capital ratios across institutions – also duly takes into account systemic considerations. Two areas of particular importance in this regard are that the review also aims to (i) address the variability of capital requirements over the cycle (pro-cyclicality) and (ii) ensure that the application of models does not result in a potential underestimation of risks and, consequently, a decline in the overall level of capital at the systemic level.
Furthermore, in a separate work stream, the BCBS has initiated work on risks linked to sovereign exposures that both the ECB and international standard-setting bodies consider an issue that needs, ideally, to be addressed at a global level. The ECB supports the potential revision of the regulatory framework by the BCBS in a careful, holistic and gradual manner. The work at the international level can, to a large extent, build on the analysis carried out by European Systemic Risk Board (ESRB), which published a full-fledged report on this issue on 10 March 2015. The report provides an overview of the current regulatory framework for sovereign and government-related exposures, the specific risks, the scale of banks’ and insurers’ exposures to sovereigns and explores a wide range of policy options to address these risks.
Finally, misconduct risk is also considered an area where regulatory measures may need to be taken. The past years since the financial crisis have revealed a range of cases where banks’ conduct has fallen far below the standards that authorities and citizens deem acceptable. These indicators of cultural problems in elements of the banking sector have induced authorities and private sector parties to seek ways of improving conduct, and restoring trust where this has been undermined. The ECB supports such work, in particular that within the ESRB and the Financial Stability Board (FSB), which will help bring a structured approach to authorities’ efforts to address these issues. An internationally coordinated approach to enforcement action and enforcement strategies that benefit from the lessons of global best practices will be the way to most effectively change undesirable behaviour and to set the right framework of incentives to promote sound cultures within banks.
In terms of specific measures, the ECB would highlight the important recommendations within the ESRB report – which represent a sound basis to build upon. The Supervisory Review and Evaluation Process (“Pillar II”) provided for under the Single Supervisory Mechanism (SSM) will include an analysis of banks’ corporate

Financial Stability Review, May 2015 118
governance and risk appetite – and this will influence microprudential choices on the use of supervisory tools to address misconduct risk. For instance, this could include measures to enhance risk management arrangements, enhance corporate governance structures, or to impose additional capital requirements. Going forward, further consideration will be given to the appropriate treatment of misconduct risk in stress tests. Work will soon begin in both the ESRB and the EBA to develop a methodology for banks to calculate the potential impact of misconduct risks within such stress-test exercises. The ECB supports these initiatives and will contribute to taking them forward wherever relevant.
Table 3.5 Selected new legislation and proposals for legislative provisions on the banking sector in the EU
Initiative Description Current status
Bank Recovery and Resolution Directive (BRRD)
The BRRD sets out a framework for the resolution of credit institutions and investment firms, with harmonised tools and
powers relating to prevention, early intervention and resolution for all EU Member States.
The BRRD entered into force on 2 July 2014. Several Member States have now transposed the BRRD into national legislation and are applying the framework. However, the bail-in provisions will only
be applicable as of 1 January 2016, at the latest.
Deposit Guarantee Scheme Directive (DGS Directive)
The DGS Directive deals mainly with the harmonisation and simplification of rules and criteria applicable to deposit
guarantees, a faster pay-out, and an improved financing of schemes for all EU Member States.
The DGS Directive entered into force on 2 July 2014. Member States will have to transpose most provisions into national
legislation by 3 July 2015, and in full by 31 May 2016.
Single Resolution Mechanism Regulation (SRM Regulation)
The SRM Regulation establishes a single system, with a single resolution board and single bank resolution fund, for an efficient
and harmonised resolution of banks within the SSM.
The SRM is governed by two main legal texts: the SRM Regulation, which covers the main aspects of the mechanism, and an Intergovernmental Agreement (IGA) relating to some
specific aspects of the Single Resolution Fund (SRF).
The SRM Regulation entered into force on 19 August 2014 and became applicable 1 January 2015. The Single Resolution Board
has been set up and is operational, however most resolution functions (including the SRF) will apply as from 1 January 2016.
The IGA on the SRF was signed by all Member States (except the United Kingdom and Sweden) on 21 May 2014, and has now been
ratified by several national parliaments.
Regulation on structural measures The proposed Regulation would introduce restrictions on certain activities and sets out rules on structural separation, with the aim
of improving the resilience of EU credit institutions.
The European Commission’s proposal was published on 29 January 2014. Discussions are on-going in the European Parliament and the
Council of the EU. The ECB’s legal opinion on the proposal was published on 19 November 2014.
As of 1 January 2015, the Bank Recovery and Resolution Directive (BRRD) will have to be implemented by all Member States. The BRRD establishes common and efficient tools and powers for managing failures of credit institutions and investment firms in an orderly manner throughout the EU. In particular, the BRRD introduces the bail-in tool88 that will be of paramount importance for the aim to shift the cost of bank failures from the taxpayer to, first and foremost, the shareholders and creditors of the failing bank.
One key reform on the regulatory agenda is addressing the too-big-to-fail problem of global systemically important banks (G-SIBs). The FSB has developed a proposal on the total loss-absorbing capacity (TLAC) for G-SIBs in resolution. An international agreement on a TLAC requirement should help to increase the resolvability of G-SIBs without recourse to public funds, formally by setting minimum standards on the amounts and characteristics of capital and eligible debt that G-SIBs must issue. This would ensure that there is sufficient loss-absorbing capacity within G-SIBs when they fail, thereby underpinning the efficient application of the bail-in tool. Designed as a minimum Pillar I requirement, with a possibility for case-by-case (Pillar II) top-up,
88 However, Member States only need to apply the bail-in tool as of 1 January 2016 at the latest.

Financial Stability Review, May 2015 119
TLAC introduces a robust standard that ensures a global level playing field for these large and internationally active banks.
The TLAC proposal has been subject to public consultation and is currently undergoing a comprehensive impact assessment, before being finalised in time for the November meeting of the G20. The outcome of the impact assessment should inform the final international standard on TLAC. Finalisation of the design and calibration of the TLAC proposal will be crucial with respect to significantly reducing the regulatory uncertainty regarding bail-in requirements for G-SIBs and tackling the issue of too big to fail.
In the EU, a requirement for own funds and eligible liabilities (MREL) has been set out in the BRRD.89 While TLAC will only apply to G-SIBs, MREL is applicable to all banks. Although some features of MREL and TLAC differ, the introduction of TLAC would, in the ECB’s view, not be inconsistent with the provisions of the BRRD. The BRRD allows the introduction of a harmonised minimum requirement that takes account of, inter alia, international standards. It will thus be possible to address differences between TLAC and MREL via the BRRD review clause in 2016, and thereby to ensure consistency and to contribute further towards reducing much of the regulatory uncertainty regarding bail-in requirements and minimum requirements for loss-absorbing capacity in banks.
Significant progress has been made in the setting-up of a banking union in Europe. The first pillar of the banking union, the Single Supervisory Mechanism (SSM) became operational on 4 November 2014, while the second pillar of the banking union, the Single Resolution Mechanism (SRM) became operational on 1 January 2015. The Single Resolution Board has been established, and has started to work on the elaboration of resolution plans and related tasks. It must be noted, however, that most of the provisions in the SRM Regulation only apply as from 1 January 2016 and later. Cooperation between the ECB and the SRB has already started on a number of issues, and the Vice-Chair of the Supervisory Board has also been designated by the ECB to be its permanent observer at the meetings of the SRB.
Finally, the European Commission presented its proposal for a Regulation on structural measures for EU credit institutions on 29 January 2014. The ECB’s Opinion on that proposal was published on 19 November 2014. The ECB considers the possibility of separating a bank’s business activities in two separate entities as beneficial, i.e. as an instrument into be part of the supervisor’s toolkit that can facilitate both effective supervision and resolution. Moreover, the ECB welcomes the flexibility of the provisions in the draft proposal, which leaves the decision to separate an institution to the competent authority. To the extent that such separation is effective, i.e. that the entities are no longer too big to fail, the proposal will reduce systemic risk. Moreover, the separation also offers the possibility to impose specific macroprudential requirements on the separated entities, which may further facilitate a reduction of systemic risk. 89 Under the BRRD, Member States are required to ensure that institutions meet an MREL for bail-ins.
The main differences between the TLAC proposal and MREL were described in the November 2014 FSR.

Financial Stability Review, May 2015 120
The aim of the current Latvian Presidency is to attain agreement in the Council in the summer of 2015, with trialogue negotiations starting in the second half of 2015.
Regulatory initiatives for financial markets and infrastructures
In addition to initiatives in the area of banking regulation, several steps have also been taken to strengthen the resilience of financial infrastructures.
The ECB Regulation on oversight requirements for systemically important payment systems entered into force on 12 August 2014. Four payment systems are subject to this Regulation: TARGET2 (operated by the Eurosystem), EURO1 and STEP2-T (both operated by EBA Clearing), and CORE (FR) (operated by STET). These systemically important payment systems will have to comply with the requirements of the Regulation by August 2015.
Table 3.6 Selected new legislation and legislative proposals for financial markets and infrastructure in the EU
Initiative Description Current status
ECB Regulation on oversight requirements for systemically important payment
systems
The Regulation aims at ensuring the efficient management of all types of risk that systemically important payment systems (SIPSs) face, together
with sound governance arrangements, objective and open access, as well as the efficiency and effectiveness of SIPSs.
The Regulation entered into force on 12 August 2014.
European Market Infrastructure Regulation
(EMIR)
The Regulation aims to bring more safety and transparency to the over-the-counter derivatives market and sets out rules for, inter alia, central
counterparties and trade repositories.
The Regulation entered into force on 16 August 2012.
Regulation on improving the safety and efficiency of securities settlement in the EU and on central securities depositories (CSD
Regulation)
The Regulation introduces an obligation of dematerialisation for most securities, harmonised settlement periods for most transactions in such securities, settlement discipline measures and common rules for central
securities depositories.
The Regulation entered into force on 17 September 2014.
Implementation and drafting of technical standards is in progress.
Review of the Markets in Financial Instruments Directive and Regulation
(MiFID II/MiFIR)
The legislation will apply to investment firms, market operators and services providing post-trade transparency information in the EU. It is set
out in two pieces of legislation: a directly applicable regulation dealing, inter alia, with transparency and access to trading venues, and a
directive governing authorisation and the organisation of trading venues and investor protection
The Directive 2014/65/EU on markets in financial instruments (MiFID II) and the Regulation (EU) No
600/2014 on markets in financial instruments (MiFIR) were both published on the Official Journal of the EU on
12 June 2014.
Proposal for a Money Market Fund Regulation (MMF Regulation) i
The proposal addresses the systemic risks posed by this type of investment entity by introducing new rules aimed at strengthening their liquidity profile and stability. It also sets out provisions that seek, inter alia, to enhance their management and transparency, as well as to
standardise supervisory reporting obligations.
The European Commission’s proposal was published in September 2013. The ECON Committee of the European
Parliament adopted its position on 26 February while discussions are still on-going in the Council, the ECB
adopted its position on 21 May 2014.
Proposal for a Regulation on reporting and transparency of securities financing
transactions
The proposal contains measures aimed at increasing the transparency of securities lending and repurchase agreements through the obligation to
report all transactions to a central database. This seeks to facilitate regular supervision and to improve transparency towards investors and
on re-hypothecation arrangements.
The European Commission’s draft proposal was published in January 2014. The ECB expressed its
support, in principle, of the proposal in its legal opinion of 24 June 2014. The Council of the EU adopted its general
approach on 14 November 2014, and the ECON Committee of the European Parliament adopted its report
on 24 March 2015.
In the aftermath of the financial crisis, the Leaders of the G20 issued a declaration at the 2009 Pittsburgh meeting that called for improvements to over-the-counter (OTC) derivatives markets. One of the EU’s main legislative initiatives to implement the G20 mandate is the European Market Infrastructure Regulation (EMIR), the implementation of which has continued to make progress. The Regulation seeks to bring more stability, transparency and efficiency to derivatives markets by requiring, inter alia, that standard derivative contracts be cleared through central counterparties (CCPs), and that all European derivative transactions be reported to trade

Financial Stability Review, May 2015 121
repositories. It fosters regulatory certainty and market confidence by subjecting all European CCPs and trade repositories to the same stringent rules and rigorous supervisory regime. The European Securities and Markets Authority (ESMA) is in the process of consulting on various proposals for implementing the central clearing requirement to OTC derivatives. The first products to be subject to this requirement – which should enter into force gradually as from mid-2015 – will be certain classes of interest rate derivatives.
The Regulation on improving securities settlement in the EU and on central securities depositories (the CSD Regulation) entered into force on 17 September 2014. The aim of the Regulation is to increase the safety and efficiency of securities settlement and settlement infrastructures (i.e. central securities depositories) in the EU. It harmonised settlement periods for most transactions in such securities as from 1 January 2015 (T+2) and introduced, inter alia, settlement discipline measures and common rules for CSDs. ESMA and the EBA are currently in the process of drafting, in close cooperation with the members of the European System of Central banks (ESCB), technical standards that have to be submitted to the Commission before end-June 2015.
In the field of shadow banking, the FSB has continued with its work on the deliverables laid out in the roadmap on “Transforming Shadow Banking into Resilient Market-based Financing”, published on 14 November 2014.90 Milestones attained in the last six months include:
(i) the publication in November 2014 of the consultation document on standards and processes for global securities financing data collection and aggregation that are relevant for financial stability monitoring and policy responses; and
(ii) the publication in January 2015 of the consultation document on the assessment methodologies for identifying non-bank non-insurer global systemically important financial institutions (NBNI G-SIFIs), extending the SIFI framework that currently covers banks and insurers to other financial institutions.
Looking forward, the FSB has identified the need for further work on financial stability risks emerging from market-based intermediation through asset management entities as a priority task in 2015. The ECB actively supports this work, given the growing importance of this part of the financial system and the need to extend the regulatory toolkit to mitigate risks to stability in other parts of the financial system.
Regulatory initiatives for the insurance sector
The implementation of the Solvency II Directive is still the key stream of work for regulators. The Solvency II regime introduces, for the first time, a harmonised and risk-sensitive prudential framework for insurance firms in the European Economic
90 See the FSB press release of 14 November 2014 (available at:
http://www.financialstabilityboard.org/2014/11/progress-report-on-transforming-shadow-banking-into-resilient-market-based-financing/).
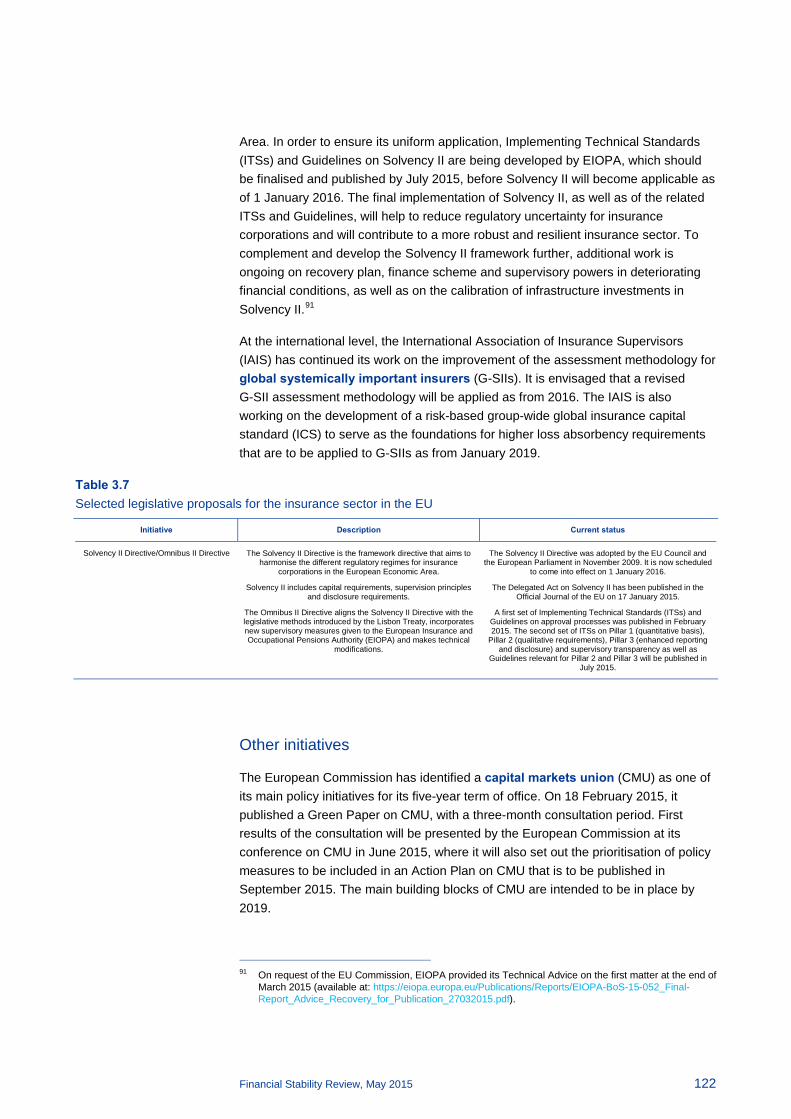
Financial Stability Review, May 2015 122
Area. In order to ensure its uniform application, Implementing Technical Standards (ITSs) and Guidelines on Solvency II are being developed by EIOPA, which should be finalised and published by July 2015, before Solvency II will become applicable as of 1 January 2016. The final implementation of Solvency II, as well as of the related ITSs and Guidelines, will help to reduce regulatory uncertainty for insurance corporations and will contribute to a more robust and resilient insurance sector. To complement and develop the Solvency II framework further, additional work is ongoing on recovery plan, finance scheme and supervisory powers in deteriorating financial conditions, as well as on the calibration of infrastructure investments in Solvency II.91
At the international level, the International Association of Insurance Supervisors (IAIS) has continued its work on the improvement of the assessment methodology for global systemically important insurers (G-SIIs). It is envisaged that a revised G-SII assessment methodology will be applied as from 2016. The IAIS is also working on the development of a risk-based group-wide global insurance capital standard (ICS) to serve as the foundations for higher loss absorbency requirements that are to be applied to G-SIIs as from January 2019.
Table 3.7 Selected legislative proposals for the insurance sector in the EU
Initiative Description Current status
Solvency II Directive/Omnibus II Directive The Solvency II Directive is the framework directive that aims to harmonise the different regulatory regimes for insurance
corporations in the European Economic Area.
Solvency II includes capital requirements, supervision principles and disclosure requirements.
The Omnibus II Directive aligns the Solvency II Directive with the legislative methods introduced by the Lisbon Treaty, incorporates new supervisory measures given to the European Insurance and Occupational Pensions Authority (EIOPA) and makes technical
modifications.
The Solvency II Directive was adopted by the EU Council and the European Parliament in November 2009. It is now scheduled
to come into effect on 1 January 2016.
The Delegated Act on Solvency II has been published in the Official Journal of the EU on 17 January 2015.
A first set of Implementing Technical Standards (ITSs) and Guidelines on approval processes was published in February 2015. The second set of ITSs on Pillar 1 (quantitative basis),
Pillar 2 (qualitative requirements), Pillar 3 (enhanced reporting and disclosure) and supervisory transparency as well as
Guidelines relevant for Pillar 2 and Pillar 3 will be published in July 2015.
Other initiatives
The European Commission has identified a capital markets union (CMU) as one of its main policy initiatives for its five-year term of office. On 18 February 2015, it published a Green Paper on CMU, with a three-month consultation period. First results of the consultation will be presented by the European Commission at its conference on CMU in June 2015, where it will also set out the prioritisation of policy measures to be included in an Action Plan on CMU that is to be published in September 2015. The main building blocks of CMU are intended to be in place by 2019.
91 On request of the EU Commission, EIOPA provided its Technical Advice on the first matter at the end of
March 2015 (available at: https://eiopa.europa.eu/Publications/Reports/EIOPA-BoS-15-052_Final-Report_Advice_Recovery_for_Publication_27032015.pdf).

Financial Stability Review, May 2015 123
CMU has the potential to complement the banking union, strengthen Economic and Monetary Union and foster financial stability. If properly implemented, CMU can be expected to mark a significant leap forwards toward deeper financial integration. Hence, it would support a smooth transmission of monetary policy throughout the euro area. In addition, the CMU agenda can contribute to enhanced financial stability by creating deeper cross-border markets with increased risk-sharing across the EU (thereby enhancing capital markets’ ability to cushion shocks) and increasing the resilience of the financial system through the creation of alternative sources of funding for the economy (thereby reducing the economy’s dependence on bank funding in periods of bank deleveraging).
While deeper cross-border markets with increased risk-sharing across the EU can contribute to enhanced financial stability, increased financial integration can also have a negative impact on it. Deeper integration can exacerbate the size and speed of contagion. Moreover, increased market-based financing that is triggered by the development of CMU may lead to the building-up of systemic risks in this part of the economy, which is typically less regulated and information on which is still lacking. Therefore, the development of capital markets could imply new sources of idiosyncratic and systemic risks. As the CMU agenda is being pursued, attention should therefore be devoted to safeguarding financial stability by providing authorities with the tools necessary to deal with the build-up of risks in market-based activities outside the regulated banking sector.

Financial Stability Review, May 2015 124
Special features
A A framework for analysing and assessing cross-border spillovers from macroprudential policies92
Macroprudential measures implemented in individual Member States may have cross-border or cross-sectoral repercussions. This special feature discusses cross-border spillover channels. To limit negative spillover effects, macroprudential instruments should be applied consistently across countries, and reciprocity agreements must be applied transparently.
Introduction
Macroprudential policy measures within the EU are generally designed to address specific, systemic, financial stability risks in individual Member States, including those stemming from specific sectors or even individual financial institutions.93 They should enhance financial stability in the long term, as lowering the probability of a systemic crisis in one EU (or euro area) Member State means there is less risk of contagion in the others. However, macroprudential policy may generate unintended negative cross-border or cross-sectoral spillovers in the short term, owing to regulatory arbitrage by financial institutions. Policy instruments should therefore be designed to reap the benefits of positive spillovers in terms of increased financial stability, while also seeking to contain potential negative spillovers.
Conceptual issues of macroprudential spillovers
In order to analyse the cross-border effects of macroprudential measures, three main aspects of spillovers need to be considered.
The first is the direction of cross-border spillovers: do spillovers from macroprudential measures mainly affect conditions abroad or are foreign financial institutions able to circumvent national macroprudential policy, i.e. are they inward or outward spillovers?
Outward spillover means that other countries are affected by a macroprudential policy action carried out by an individual Member State. These spillovers may then require the affected country, or countries, to adopt their own macroprudential policies to counter these effects. Coordination between countries is thus important, and
92 Prepared by Stephan Fahr and Dawid Żochowski. 93 ECB staff, in particular in the context of the ESRB’s expert group on cross-border spillovers and
reciprocity, are working on developing a framework for analysing spillovers from macroprudential policies and are gathering data-based evidence on the relative importance of various identified transmission channels. The expert group intends to build on these findings to develop recommendations on reciprocity for macroprudential policies.

Financial Stability Review, May 2015 125
reciprocity arrangements may be called for in instances where these spillovers have a material knock-on effect.
On the other hand, inward, or “waterbed”, spillovers occur where foreign financial institutions circumvent macroprudential policy that does not apply to them by exploiting arbitrage opportunities. One such example is where branches of foreign banks increase lending as a result of tighter credit standards or capital requirements imposed on domestic banks, since branches – in the absence of reciprocity arrangements – are not bound by domestic macroprudential policy measures. This leads to “leakages” of macroprudential policy.
In the United Kingdom, Aiyar, Calomiris and Wieladek94 find evidence that macroprudential regulation does leak across UK financial sub-sectors and unregulated institutions take up the business from the regulated institutions. Ongena, Popov and Udell95 further find for eastern Europe that regulatory conditions in the country of the parent institution also influence the risk-taking behaviour of the parts abroad, thereby indicating spillover effects.
A second aspect of spillovers is that they can have positive or negative effects on systemic risk in the affected country. Whether the spillovers are beneficial or detrimental may depend on the relative position of financial cycles across countries. During a credit boom, a tightening macroprudential policy can generate outward spillovers which may pose additional financial stability risks to the foreign country if it is also in a boom phase. Conversely, the same outward spillovers would stabilise the financial system if the foreign country is experiencing a phase of excessive deleveraging. The degree of synchronisation of financial cycles across countries is therefore of relevance when assessing spillovers.
Third, the magnitude and reach of spillovers also depends on whether macroprudential instruments are applied at the solo, sub-consolidated or consolidated balance sheet level, as well as on what exposures they cover. The incentives for banks to adjust their asset portfolios or their funding composition vary significantly based on this, especially for large cross-border banks. Similarly, incentives for conducting cross-border arbitrage may differ, depending on whether measures are applied only to domestic exposures or to all exposures.
If an exposure-based measure is applied at the solo level, it is typically applicable in a geographically confined area to which the affected individual institutions are exposed. The main aim of such a measure may therefore not only be to improve the banking sector’s resilience, but also to counter excessive risk-taking or lending by financial institutions in a geographically confined area. Conversely, if capital buffers are applied at the consolidated level, i.e. at group level, the measures also affect the activities of groups’ branches and subsidiaries located in foreign countries, which, in turn, influences the credit supply in those countries. The main rationale behind these
94 Aiyar, S., Calomiris, C.W. and Wieladek, T., “Does Macroprudential Regulation Leak? Evidence from a
UK Policy Experiment”, Journal of Money, Credit and Banking, 46 (1), 2014. 95 Ongena, S., Popov, A. and Udell, G.F., “When the Cat’s Away the Mice Will Play: Does Regulation At
Home Affect Bank Risk Taking Abroad?”, Journal of Financial Economics, 108(3), 2013, pp. 727-750.

Financial Stability Review, May 2015 126
additional buffers at consolidated level may thus be to strengthen the resilience of the banking groups, irrespective of the impact on lending and economic activity. At the same time, such a measure applied at consolidated level may lead to outward spillovers and its specific effects in different countries will depend on the internal decision of the banking groups on how to allocate capital and liquidity buffers across their substructures.
With these conceptual categories in mind, the following section describes the main transmission channels of macroprudential instruments.
Spillover channels
There are several channels of propagation through which macroprudential policy action can have cross-border effects. Some propagation channels may be particularly relevant for one macroprudential instrument, but negligible for another. Yet other channels may exist theoretically, but have little quantitative impact in practice. This section identifies the possible channels of propagation and classifies them in terms of the main ways they operate, namely: (i) cross-border adjustment of lenders’ risk exposures; (ii) a change in networks and the associated potential for contagion; (iii) regulatory arbitrage; (iv) a change in the functioning of the monetary transmission mechanism; and/or (v) trade effects (see Table A.1).
Table A.1 Channels of cross-border spillover from macroprudential policy Channel Transmission Description 1. Cross-border risk adjustments
A. Adjustments of cross-border credit exposures
Macroprudential policy affects banks’ cross-border portfolio allocation in that banks change their holdings of foreign credit exposures, be they in the form of cross-border direct lending or securities exposures or through subsidiaries or branches active in the other country.
B. Adjustments of cross-border securitisation activity
Macroprudential policy may alter banks’ incentives to transfer credit risk to another country, for instance by encouraging/discouraging the originate-to-distribute business model, which may also rely on international funding sources.
C. Access to cross-border capital markets
Access to capital markets and the related ability/willingness to raise funds may be an important facilitating/mitigating factor for deleveraging, which affects the second-round effects of shocks.
2.Network formation and potential for contagion
D. Adjustments of cross-border liquidity/funding lines
Macroprudential policy may affect banks’ instrument mix on the liability side, in particular in terms of reliance on cross-border funding, e.g. subordinated loans and liquidity (interbank and repo markets). This, in turn, affects the network structure of the system, which is an important factor determining contagion.
E. Adjustment of asset prices
Macroprudential policies may change the demand for certain financial assets and thus their prices. Asset prices, in turn, may affect banks’ portfolio choices: overvaluation can invite pro-cyclical risk-taking, while extreme downward price adjustments can lead to portfolio rebalancing and spur fire sales.
F. Common exposures Macroprudential policies, in particular the introduction of large exposure limits, can make banks’ portfolio composition more granular, thereby reducing common exposures to certain sectors within the system, for instance to sovereign risk. This in turn increases the system’s resilience to sectoral shocks and decreases the potential for cross-border contagion as a result.
3. Regulatory arbitrage
G. Capital regulatory arbitrage
Increasing capital requirements may alter incentives for circumventing the regulatory restrictions by actively shifting capital within the group, by shedding capital-intensive activity off the balance sheet to special purpose vehicles, or by opening (or converting subsidiaries into) branches in jurisdictions where capital requirements are higher.
H. Liquidity regulatory arbitrage
Liquidity restrictions could lead to liquid assets being moved abroad, mostly in the form of intragroup transfers, without, however, changing the liquidity position of the entire banking group.
I. Shadow banking activity
Stricter regulation of banks could also lead to “waterbed effects” by paving the way for credit growth in a non-regulated (shadow) banking sector. As the shadow banking system operates more strongly internationally, liquidity conditions can easily be transmitted across borders. On the other hand, macroprudential instruments targeting financial markets and non-bank financial institutions can help prevent such leakages and ensure consistency in regulation across sectors.
4. Altering monetary transmission
J. Relative cost of lending
Macroprudential policy can affect the relative cost of lending in a cross-border context. This may reinforce or weaken the monetary policy transmission depending on whether monetary and macroprudential policy work in tandem or in opposite directions. Macroprudential policy may provide a more targeted instrument to account for different cross-country positions in the financial cycle.
K. Changing term structure
Amending bank liquidity and funding requirements or restricting investment funds’ liquidity mismatch may affect the term structure of the yield curve. In a cross-border context, this may lead to a different level of propagation of monetary policy across countries owing to the relative importance of demand for and supply of longer-term assets, as well as through differing expectations about their timing.
5. Trade effects J. Foreign trade By influencing credit, macroprudential policy may affect economic activity, which in turn could lead to changes in foreign trade activity by altering exports and imports.
K. Relative prices of tradable and non-tradable goods
Housing cannot be traded across borders. However, macroprudential policy can change the relative prices of certain tradable and non-tradable goods and in this way affect foreign trade patterns.

Financial Stability Review, May 2015 127
In practice, not all channels are equally important in determining the level of cross-border spillover of macroprudential policy. The channels that operate by altering incentives for financial institutions to adjust either the asset or liability side of their balance sheets (see channels 1 to 3 in Table A.1) are likely to be more pronounced than indirect channels that alter monetary policy transmission or relative goods prices (see channels 4 and 5 in Table A.1).
Table A.2 Cross-border spillover channels and their potential importance by macroprudential policy instrument
Risk adjustment Network and contagion
Regulatory arbitrage
Monetary policy
Lega
l bas
is /
cons
olid
atio
n
Cro
ss-b
orde
r loa
n or
igin
atio
n ou
twar
d sp
illove
r
Cro
ss-b
orde
r loa
n or
igin
atio
n in
war
d sp
illove
r
Secu
ritis
atio
n ac
tivity
(cro
ss-
bord
er ri
sk s
hifti
ng)
Cap
ital s
treng
then
ing
(rai
se
capi
tal i
n in
tern
atio
nal m
arke
ts)
Cro
ss-b
orde
r por
tfolio
ex
posu
res
(ass
ets,
liab
ilitie
s)
Cro
ss-b
orde
r ass
et p
rice
effe
cts
(por
tfolio
reba
l., w
ealth
ef
fect
s)
Intra
grou
p ca
pita
l man
agem
ent
Intra
grou
p liq
uidi
ty
man
agem
ent
Shift
in a
ctiv
ity fr
om a
ffect
ed to
un
affe
cted
ban
k/no
n-ba
nks
Alte
ring
rela
tive
cros
s-bo
rder
co
st o
f len
ding
Cap
ital i
nstru
men
ts
Global systemically important institution buffer (G-SII)/ Other systemically important institution buffer (O-SII)
consolidated level
Systemic risk buffer/ Other systemically important institution buffer (O-SII)
consolidated level
sub-consolidated/ solo level (exposure-based)
Counter-cyclical buffers consolidated level
Leverage ratio consolidated level
Sect
oral
cho
ice
Sector-specific capital buffers, large exposure restrictions
exposure-based
Risk weights Loss given defaults
exposure-based
Loan-to-value, loan-to-income, debt-to-income, debt-servicing-to-income (on new loans)
exposure-based
Liqu
idity
pos
ition
s
Liquidity coverage ratio, liquidity charges consolidated level
Net stable funding ratio consolidated level
Loan-to-deposit
consolidated level
solo level
Note: The importance of channels was decided based on expert judgement.
Degree of importance of the channels for spillovers
Potentially strong transmission
Potentially medium-strong transmission
Potentially weak-medium transmission
Transmission channel considered to be weak or absent

Financial Stability Review, May 2015 128
Moreover, the relative importance of the different channels also depends on the specific macroprudential instrument activated. In general, domestic considerations are likely to be the main factor in determining whether a macroprudential instrument is activated. In addition, cross-border effects occurring through different channels may be of relevance when choosing a specific measure (see Table A.2). Capital and sector-specific measures have potentially important effects on banks’ cross-border lending to the real economy (cross-border corporate and household lending) as they lead to a change in lending incentives, causing banks to readjust their outstanding loan portfolios. The adjustment need not be done exclusively through a change in quantities, but may also involve a change in relative cross-border lending costs. Measures that are applied to specific bank exposures or even borrowers, such as caps on loan-to-value or debt-service-to-income ratios, are less prone to negative spillovers, as the possibility for arbitrage is limited.96 Yet, they may still induce portfolio adjustments, as these measures affect the demand for loans and the riskiness of the exposure and, therefore, the relative risk-adjusted price of credit risk between the portfolios affected and unaffected by the measures. By contrast, liquidity-based measures tend to have stronger effects on interbank relationships (interbank lending). Overall, all types of measure could have an impact on the non-bank sector, but there is a particularly strong potential for spillover when it comes to liquidity-based measures.
Potential for spillovers
Potentially the most important channels of propagation are the risk adjustment channel, the network formation channel and the arbitrage channel. Implied spillover risks depend on the structure of financial institutions and their cross-border exposures. A range of datasets are available, covering either locational or consolidated data, which may be used to gauge different aspects of the cross-border phenomenon.97
As regards the risk adjustment channel, locational statistics indicate that countries whose banking sectors are reliant on sizeable deposit funding relative to the size of the economy, such as Luxembourg, Cyprus, Ireland, Malta and Finland, are large cross-border net lenders to other countries (see Chart A.1). These countries’ banking sectors are thereby potentially more vulnerable to external shocks to their asset portfolios, but outward spillovers to other countries may also result when macroprudential instruments are applied to those banking sectors.
96 Indeed, recent research suggests that exposure-based measures, such as caps on loan-to-value and
debt-to-income ratios, could be more efficient as macroprudential tools than capital-based measures (see Żochowski, D., “Macroprudential policy in a monetary union”, ECB, forthcoming).
97 Locational data, developed for monetary policy purposes, can be used to assess the extent of direct cross-border lending and borrowing, while consolidated data can be used to measure cross-border exposures, including via branches and subsidiaries.

Financial Stability Review, May 2015 129
Chart A.2 Cross-border lending in south-eastern Europe is largely funded by Austrian banks
Non-MFI cross-border loans as a share of total bank assets in the borrowing country
Source: ECB MFI statistics (balance sheet items). Notes: The arrows represent values from September 2014 and the colour of each arrow represents the percentage change since September 2011. The percentage next to the country node denotes each country’s share of foreign loans in total loans (node size adjusted proportionally).
While a perspective from the lender’s side indicates possible financial hubs, a perspective from the borrower’s side may reveal vulnerabilities linked to the borrower’s reliance on banks in specific other countries. If macroprudential measures are changed in the lending country, the borrower country may be strongly affected. The locational data indicate that lending to the real sector in south-eastern Europe stems to a large degree from Austria (see Chart A.2). The Austrian banking sector is thereby an important provider of cross-border loans and may either easily provide additional lending when south-eastern European countries tighten macroprudential policies through inward spillovers or be strongly affected by macroprudential measures applied to Austrian banks. For a full assessment, the legal structure (e.g. branches or subsidiaries) of the banking sector needs to be fully mapped.
While available data sources for locational statistics provide detailed information on the cross-border aspects of lending flows and cross-border exposures, they do not distinguish between the real sector and non-bank financial institutions (such as investment funds or insurance companies). Furthermore, they do not distinguish between the activities of foreign subsidiaries of banking groups and those of their branches. The importance of the risk adjustment channel, however, may be linked to large banking groups that adjust their activity across borders by optimising the consolidated balance sheet to the changing regulatory conditions through their subsidiaries and branches. As indicated, the distinction between branches and subsidiaries is relevant as only branches are subject to the regulatory conditions of their host country.
Chart A.1 Banking sectors with excess deposit funding are large cross-border net lenders
Non-MFI cross-border loans as a share of total bank assets in the lending country
Source: ECB MFI statistics (balance sheet Items). Notes: The arrows represent values from September 2014 and the colour of each arrow represents the percentage change since September 2011. The percentage next to the country node denotes each country’s share of foreign loans in total loans (node size adjusted proportionally).

Financial Stability Review, May 2015 130
Chart A.4 Foreign branches exhibit the greatest amount of activity in northern European countries
Foreign branches’ total assets as a percentage of GDP
Source: EBA. Note: Based on 2013 transparency exercise with EEA counterparties.
Comparing the relative importance of subsidiaries or branches across EU countries reveals that banking activity by foreign banks is predominantly conducted via subsidiaries. The ratio of foreign subsidiaries’ assets to GDP is largest in Ireland, Belgium, Luxembourg, Denmark, Finland, Estonia, Latvia, the Czech Republic, Slovakia, Croatia, Bulgaria and Cyprus, where it exceeds 50% (see Chart A.3). The same ratio for branches reveals that assets in foreign branches exceed 30% of GDP in Ireland, the United Kingdom, Belgium, Estonia and Cyprus (see Chart A.4). A large share of branches could imply spillovers through adjustments to the relative macroprudential stance of the home and host country. Branches are subject to the macroprudential policy in the home country of the bank and are therefore prone to divert lending towards the host country if macroprudential policy is tighter in the home country. Although subsidiaries are subject to the regulatory conditions in the host country, a large share of subsidiaries in one country can indicate substantial potential for regulatory arbitrage through two main channels. Inward spillovers would result from circumvention of the macroprudential measures when financial intermediation that previously took place via subsidiaries is shifted to branches or if subsidiaries are converted into branches. In addition, these spillovers may occur if lending in the country is substituted with direct lending from the home country of the banking group. In either case, the financial intermediation would no longer fall within the realm of macroprudential policy in the host country. Nevertheless, in some countries the high share of branches is explained by their function as intermediary for international financial transactions with limited relevance for domestic activity, but data limitations make these distinctions difficult at the current stage.
In addition to the impact that cross-border lending to the real economy and branch activity have on financial stability, cross-border interbank activity also paves the way for the formation of networks that facilitate contagion between financial institutions in
Chart A.3 Foreign subsidiaries exhibit the greatest amount of activity in the smaller EU countries
Foreign subsidiaries’ total assets as a percentage of GDP
Source: EBA. Note: Based on 2013 transparency exercise with EEA counterparties.

Financial Stability Review, May 2015 131
times of systemic stress. More gradual, yet still sizeable, adjustments may take place when macroprudential policy is changed, especially in the case of liquidity measures, as these encourage banks to adjust liquidity positions across entities.
Chart A.6 … which are possibly involved in maturity transformation
Interbank cross-border loans as a percentage of borrowers’ total assets
Source: ECB MFI statistics (balance sheet items). Notes: The arrows represent values from September 2014, and the colour of each arrow represents the percentage change from the respective values in September 2011. The percentage denotes each country’s share of foreign loans in total loans. The node size is proportional to this percentage. The reference period is September 2014
Locational data identifies the United Kingdom as an important interbank hub: in many European countries, cross-border interbank lending is dominated by lending to banks located in the United Kingdom.98 In addition to the United Kingdom, Sweden, Austria and Greece also appear to act as local hubs (see Chart A.5). These hubs are not only important in terms of the share of interbank lending of which they are the recipients, but are also relevant in terms of the liquidity they provide to the banking sectors in neighbouring countries (see Chart A.6). For example, a large share of interbank loans from neighbouring countries is directed to Sweden and Austria, and these two countries, in turn, provide a sizeable volume of funding back to banks in their neighbouring countries. If equity participation structures between banks in “hub countries” are also considered, this leads to the conclusion that “hub countries” are involved in maturity transformation, e.g. subsidiaries provide short-term loans to the parent company, while the parent provides more stable long-term funding to its subsidiaries.
In addition to cross-border lending to the real economy and branch activities, the risk adjustment channel can also come into effect via banks’ exposures to foreign
98 The predominance of the United Kingdom is partly due to intragroup activity, as many European banks
have subsidiaries located in London that specialise in international banking services, and these subsidiaries need funding from the parent companies to provide these services.
Chart A.5 Local interbank hubs emerge…
Interbank cross-border loans as a percentage of cross-border interbank lending
Source: ECB MFI statistics (balance sheet items). Notes: The arrows represent values from September 2014 and the colour of each arrow represents the percentage change from the respective values in September 2011. The percentage denotes each country’s share of foreign loans in total loans. The node size is proportional to this percentage. The reference period is September 2014

Financial Stability Review, May 2015 132
sovereign risk. Such linkages played a very prominent role in the spread of the recent sovereign debt crisis, for example. Locational data indicate that, in addition to some idiosyncratic links, Belgian banks hold large amounts of German government bonds, Irish banks hold a significant amount of UK debt, while Austrian banks tend to keep sovereign bonds of neighbouring countries (see Chart A.7).
Chart A.8 Shadow banks pose challenges for the efficient conduct of macroprudential policy
Share of banking sector assets in total financial sector assets
Sources: EBA, ECB. Notes: The arrows represent values from the end of 2013. Shadow banking assets here include not only assets of euro area financial vehicle corporations, money market funds and non-money market investment funds, but also assets of insurance corporations and pension funds. The reference period is the first quarter of 2014.
The potential for cross-sectoral leakage of macroprudential policy measures can be assessed by the ability of other sectors to take over banking sector activities. This can be measured by the relative size of the non-MFI financial sector, including the shadow banking sector, which is largest in Luxembourg, the Netherlands and Ireland (see Chart A.8). The relative importance of the shadow banking sector in these countries is partly due to tax incentives, which means that there tends to be a greater emphasis on international rather than domestic financial intermediation. Furthermore, while the assets of the non-bank financial institutions are concentrated in these three countries, the activities of the shadow banking sector, in particular, are only marginally constrained by borders. The global and implicitly pan-European reach of this sector poses challenges for the efficient conduct of macroprudential policy, which has been focused on banking so far, precisely because of leakages or waterbed effects.
Concluding remarks
Macroprudential policies are intended to increase the resilience of financial market participants and to smooth financial cycles. In a financially integrated monetary
Chart A.7 The post-crisis cross-border bank/sovereign nexus has weakened
Sovereign bond holdings as a share of total bank assets
Source: 2014 comprehensive assessment database. Notes: The arrows represent sovereign holdings as a share of the lending country’s total assets. The reference period is the end of 2013.

Financial Stability Review, May 2015 133
union, there is a large potential for these macroprudential policies to spill over across borders. Moreover, it can be difficult to assess these spillovers, not only because their magnitude depends on the type of instrument used, the level of synchronisation of the financial cycles and the level of consolidation, but also because data may be incomplete, especially for historical developments. With the ECB’s new macroprudential powers, cross-border analysis is highly relevant for assessing the impact of specific instruments, particularly if a consistent macroprudential approach is to be ensured within the Single Supervisory Mechanism (SSM). The ECB therefore monitors the extent of cross-border exposures, the changing network links and the adjustments made in response to macroprudential policies that have been implemented. When using existing datasets, the ECB also identifies data gaps and seeks to close these over time through data collection initiatives. Here, the availability of supervisory data collected by the SSM is an important step towards achieving a harmonised reporting standard. This should also facilitate the analysis of regulatory capital and liquidity arbitrage.
The ECB, as a supervisor for SSM countries, is in an ideal position to develop expertise on data issues. In parallel, the ESRB and its expert group on cross-border spillovers and reciprocity are developing recommendations for a lenient and transparent reciprocity framework.
To ultimately counter spillovers, macroprudential instruments need to be applied consistently across countries and reciprocity agreements must be applied transparently. So far, only one reciprocity arrangement has been implemented on a voluntary basis, partly due to the fact that a number of activated macroprudential instruments relate to capital surcharges for systemically important banks and are entity-based, and therefore do not require reciprocity. Going forward, as different and more exposure-based measures are taken, more countries will need to follow the example of the Dutch authorities, who have reciprocated a measure taken by the Nationale Bank van België/Banque Nationale de Belgique, if a level playing field is to be achieved in the Single Market (see Section 3.3).

Financial Stability Review, May 2015 134
B Bank profitability challenges in euro area banks: the role of cyclical and structural factors99
Weak profitability among euro area banks is one key risk to financial stability. This special feature examines the main drivers influencing banks’ profitability, including bank-specific, macroeconomic and structural factors. The empirical part of the special feature finds that challenges appear to be mainly of a cyclical nature, although there may also be material structural impediments to reigniting bank profitability.
Introduction
Weak bank profitability has been highlighted as a key risk for euro area financial stability in recent issues of the Financial Stability Review. The relevance of low bank profitability for financial stability is at least twofold. First, bank capital represents the first line of defence against unexpected shocks. Therefore, the inability of banks to build capital buffers by retaining earnings hampers their shock-absorption capacity. Second, persistently low profitability could incentivise banks to take on undue risks in order to generate higher returns, which can lead to increased financial fragility going forward.
Looking at the main drivers of weak profitability in the euro area, it has been argued that the recent weakness of bank performance can be explained by both cyclical and structural factors, although views somewhat differ on their relative importance.100 Against this background, this special feature aims to identify the main determinants of bank profitability in the EU, with special emphasis on distinguishing between cyclical and structural factors.
The article is structured as follows. First, some stylised facts about the profit developments of euro area banks are presented, also in comparison with US banks. Second, the article discusses the main determinants of bank profitability and, third, it presents an empirical analysis based on a large sample of EU banks. The fourth section concludes.
Developments in bank profitability in the euro area and in non-euro area peer countries – a long-term view
In the first decade of this century, until the 2008 financial crisis, bank profitability in the euro area, other EU countries and the United States followed broadly the same trends. A notable difference, however, was that US banks significantly outperformed EU peers in terms of return on assets (ROA) (see Chart B.1), while profitability levels 99 Prepared by Christoffer Kok, Csaba Móré and Cosimo Pancaro. 100 For instance, the IMF’s October 2014 Global Financial Stability Report argues that structural
weaknesses in bank profitability afflict around 75% of euro area banks – far worse than other peer advanced economies. At the same time, most empirical studies find a significant positive relationship between the business cycle and bank profitability (see below for references on European banks).

Financial Stability Review, May 2015 135
were more comparable across regions when measured by return on equity (ROE) (see Chart B.2).101
Chart B.2 Weak profitability has persisted in the euro area over the past few years, particularly in vulnerable countries
Return on equity of banks in vulnerable and other euro area countries and the United States (2003-2013; percentages; median values)
Sources: Bloomberg, SNL Financial and ECB calculations. Notes: In this chart, vulnerable euro area countries include Cyprus, Ireland, Italy, Portugal, Slovenia and Spain, while other euro area countries include Austria, Belgium, Finland, France, Germany and the Netherlands.
Since 2009, however, euro area and US bank profitability has been on diverging paths, with US banks showing a rebound in bank earnings, contrasting with a more persistent weakness in bank profits in the euro area, particularly in vulnerable countries (see Chart B.2). Arguably, cyclical differences explain much of this divergence, as euro area banks’ profitability remained under pressure against a weak macroeconomic backdrop that was prolonged by the sovereign debt crisis (see Chart B.3). By contrast, US banks benefited from a more favourable macroeconomic environment, with most of the improvement in US bank profits being linked to declining loan loss provisions (see Chart B.4).
Focusing on euro area developments, the impact of cyclical factors on bank profitability may have also been exacerbated by other factors of a more structural nature. In fact, bank profitability remained weak in those euro area countries that did not experience a recession in 2012-13. This suggests that structural factors such as deleveraging and de-risking of balance sheets or overcapacity in certain domestic banking markets could have also hindered the recovery of euro area banks’ profitability, albeit to varying degrees across countries and individual institutions.
101 The difference between ROA and ROE measures can be mainly attributed to the higher balance sheet
leverage of EU, and particularly euro area, banks compared with US peers. It can also be attributed to differences in accounting standards, in particular with regard to the netting and offsetting of derivatives, which is limited under IFRS in comparison with US GAAP.
-20
-15
-10
-5
0
5
10
15
20
2003 2004 2005 2006 2007 2008 2009 2010 2011 2012 2013
vulnerable euro area other euro areaUnited States
Chart B.1 EU and US bank profitability has been on diverging paths since the financial crisis
Return on assets of euro area, other EU and US banks (2003-2013; percentages)
Sources: Bloomberg, SNL Financial and ECB calculations. Note: Weighted averages for a fixed sample of euro area, non-euro area EU and US banks.
-0.4
-0.2
0.0
0.2
0.4
0.6
0.8
1.0
1.2
1.4
2000 2002 2004 2006 2008 2010 2012
euro area other EUUnited States

Financial Stability Review, May 2015 136
Chart B.4 … with loan loss provisioning showing strong pro-cyclical patterns
Relationship between banks’ loan loss provisions and GDP growth in the euro area and the United States (2000-2013; solid lines for the euro area and dotted lines for the United States; percentages)
Sources: Bloomberg, Eurostat, SNL Financial and ECB calculations. Notes: Loan loss provisions as a percentage of total loans. GDP growth is shown on an inverted scale.
Main factors influencing bank profitability
A large body of empirical studies has investigated the role of different factors influencing bank performance. Based on these studies, determinants of bank profitability can be broadly categorised into three groups: (i) bank-specific factors, (ii) macroeconomic factors, and (iii) structural factors.
Bank-specific factors Bank-specific determinants of profitability typically include factors controlled by bank management, such as bank size, efficiency, risk management, capital and diversification or business strategy.
The evidence from the empirical literature investigating the impact of bank size on profitability is inconclusive. The proponents of size benefits argue that larger banks are likely to have a higher degree of product and loan diversification than smaller banks and should benefit from economies of scale, which in turn leads to higher profits.102 Other studies suggest that the size/profitability relationship may be either non-linear103 or, even if large banks are more efficient than small ones, profitability benefits derive from emulating industry best practice in terms of technology and
102 See, for instance, Shehzad, C.T., De Haan, J. and Scholtens, B., “The relationship between size,
growth and profitability of commercial banks”, Applied Economics, Vol. 45, 2013, pp. 1751-1765. See also Smirlock, M., “Evidence on the (non) relationship between concentration and profitability in banking”, Journal of Money, Credit, and Banking, Vol. 17, No 1, 1985, pp.69-83.
103 See Goddard, J., Molyneux, P. and Wilson, J. O., “Dynamics of Growth and Profitability in Banking”, Journal of Money, Credit and Banking, Vol. 36, No 6, 2004, pp. 1069-1090.
-5-4-3-2-10123450.0
0.20.40.60.81.01.21.41.6
loan loss provisions (left-hand scale)GDP growth (right-hand scale)
-4-3-2-10123450.0
0.51.01.52.02.53.03.54.0
2000 2002 2004 2006 2008 2010 2012
Chart B.3 Cyclical differences explain much of the divergence between euro area and US banks’ profitability…
Relationship between bank profitability and GDP growth in the euro area and the United States (2000-2013; solid lines for the euro area and dotted lines for the United States; percentages)
Sources: Bloomberg, Eurostat, SNL Financial and ECB calculations.
-5-4-3-2-1012345
-0.4-0.20.00.20.40.60.8
return on assets (left-hand scale)GDP growth (right-hand scale)
-4-3-2-1012345
-0.20.00.20.40.60.81.01.21.4
2000 2002 2004 2006 2008 2010 2012

Financial Stability Review, May 2015 137
management structure, rather than from increasing the size of the bank.104 It has also been argued that economies of scale only exist for smaller banks and that larger banks suffer from diseconomies of scale owing, for example, to agency costs, overhead costs of bureaucratic processes and other costs related to managing large banks.105
A number of studies conclude that operational efficiency is an important driver of bank profitability. Most studies find that higher efficiency – typically measured by cost-to-income or cost-to-assets ratios – positively affects bank profitability.106
Bank capitalisation (or capital management) is another important factor influencing profitability, according to a number of studies. Existing literature suggests that the impact of bank capital on profitability is ambiguous, although the majority of studies find a positive relationship. On the one hand, banks with higher capital ratios tend to face lower funding costs owing to lower prospective bankruptcy costs.107 On the other hand, higher capitalisation can be associated with lower risk-taking, which in turn leads to lower (expected) returns.108
Risk management and the level of risk are among the most important bank-specific factors determining performance. Empirical evidence suggests that higher credit risk – measured by non-performing loan or provisioning ratios – is associated with lower bank profitability.109 These results reflect the fact that banks exposed to higher-risk loans incur higher loan losses, which translate into lower bank returns.
A number of recent studies have investigated the impact of diversification on bank performance. While some studies identified a “diversification premium”, implying that banks with more diversified revenue streams are more profitable,110 others found that the higher share of non-interest income is likely to be associated with lower and/or more volatile bank profitability.111 Another view is that the impact of income diversification on profits is non-linear, i.e. diversification benefits accumulate only up to a certain degree.112
104 See Berger, A. and Humphrey, D., “Efficiency of financial institutions: International survey and
directions for future research”, European Journal of Operational Research, Vol. 98, 1997, pp. 175-212. 105 See Tregenna, F., “The fat years: the structure and profitability of the US banking sector in the pre-crisis
period”, Cambridge Journal of Economics, Vol. 33, 2009, pp. 609-632. 106 See, among others, Molyneux, P. and Thornton, J., “Determinants of European bank profitability: a
note”, Journal of Banking and Finance, 16, 1992, pp. 1173-1178. 107 See Berger, A. N., “The profit-structure relationship in banking-tests of market-power and efficient-
structure hypotheses”, Journal of Money, Credit and Banking, Vol. 27, 1995, pp. 404-431. 108 See Goddard et al. (op. cit.) for evidence on a negative relationship. 109 See Bikker, J.A. and Hu, H., “Cyclical patterns in profits, provisioning and lending of banks and
procyclicality of the new Basel capital requirements”, BNL Quarterly Review, 221, 2002, pp. 143-175. 110 See Carbo Valverde, S. and Rodriguez Fernandez, F., “The determinants of bank margins in European
banking”, Journal of Banking and Finance, Vol. 31, 2007, pp. 2043-2063. 111 See Stiroh, K., “Diversification in banking: is noninterest income the answer?”, Journal of Money, Credit
and Banking, 36, 2004, pp. 853-882. 112 See Gambacorta, L., Scatigna, M. and Yang, J., “Diversification and bank profitability: a nonlinear
approach”, Applied Economics Letters, Vol. 21, 2014, pp. 438-441.

Financial Stability Review, May 2015 138
A recent strand of research focuses on the identification of bank business models and the comparison of bank performance and risk across these business models.113 Results from these studies suggest that retail (or diversified retail) banks tend to outperform banks with other business models, such as wholesale and investment banks.
Furthermore, some bank-level studies investigate the relationship between ownership type and bank performance, with results varying according to the geographical region and/or time period under investigation. More recent evidence for European banks suggests that mutual banks and government-owned banks exhibit lower profitability than privately-owned banks.114
Macroeconomic factors A number of studies incorporate macroeconomic variables into the analysis in order to examine cyclical patterns in bank performance and behaviour. It is generally found that bank profitability tends to be pro-cyclical, driven in particular by the cyclical patterns in lending and other financial intermediation activities and loan loss provisions.115 First, an increase in economic activity through higher demand for bank intermediation services (including lending and securities underwriting, advisory services and trading activities) will tend to increase banks’ net interest income and income generated from fees and commissions. Second, weaker economic activity contributes to a worsening of bank asset quality and higher loan loss provisioning, thus exerting a negative influence on bank profits.
Among other macroeconomic factors, inflation as well as the level and the term structure of interest rates are thought to have an impact on bank profitability. In particular, the slope of the yield curve is expected to positively influence bank profits via higher interest income (a wider margin) from maturity transformation activities.116 The effects may, however, differ across banks depending on their interest rate sensitivity.
Structural factors Turning to structural factors affecting bank profitability, industry structure is the most frequently examined variable in this respect.117 Two alternative hypotheses exist on the relationship between market structure (market concentration) and bank profitability. The “structure-conduct-performance” hypothesis argues that more concentrated markets lead to collusive behaviour, giving banks the opportunity to earn monopolistic profits. By contrast, the “efficient structure” hypothesis states that
113 See, for instance, Gambacorta, L. and van Rixtel, A., “Structural bank regulation initiatives: approaches
and implications”, BIS Working Papers, No 412, 2013. 114 See Iannotta, G., Nocera, G. and Sironi, A., “Ownership structure, risk and performance in the
European banking industry”, Journal of Banking and Finance, 31, 2007, pp. 2127-2149. 115 See Albertazzi, U. and Gambacorta, L., “Bank profitability and the business cycle”, Journal of Financial
Stability, Vol. 5, 2009, pp. 393-409. 116 See, for example, Greenspan, A., “Risk and uncertainty in monetary policy”, speech at the meeting of
the American Economic Association, San Diego, California, 3 January 2004. 117 For a recent study, see Mirzaei, A., Moore, T. and Liu, G., “Does market structure matter on banks’
profitability and stability? Emerging vs. advanced economies”, Journal of Banking and Finance, Vol. 37, 2013, pp. 2920-2937.

Financial Stability Review, May 2015 139
the positive relationship between profitability and concentration can be driven by efficiency, in that more efficient banks gain market share and improve profitability.
Evidence on the impact of capital market orientation on bank profitability is ambiguous.118 A possible explanation for a positive relationship could be that in a financial system geared towards more capital market financing, banks may be forced to focus more strongly on profitability objectives.119 Among other factors of a more structural nature, the supervisory regimes (i.e. the stringency with which supervisory power is applied) could also be expected to have an impact on banks’ performance. The empirical evidence is, however, ambiguous.120
Determinants of EU banks’ profitability: an empirical assessment
In the following, an empirical analysis is conducted to shed further light on the main determinants of EU banks’ profitability, focusing on the different factors highlighted in the previous section, namely (i) bank-specific characteristics, (ii) macroeconomic and financial conditions, and (iii) structural market features.121 The empirical analysis is based on a large sample of 98 EU banks.122 In the analysis, profitability is measured by ROA.123
118 For evidence on the lack of relationship between bank performance and capital market orientation in
countries that are more developed financially, see Demirguc-Kunt, A. and Huizinga, H., “Financial Structure and Bank Profitability”, Policy Research Working Papers, No 2430, World Bank, 2000. Other studies find that a higher degree of capital market orientation is associated with higher bank profitability; see, for example, Beckmann, R., “Profitability of Western European banking systems: panel evidence on structural and cyclical determinants”, Deutsche Bundesbank Discussion Papers, No 17/2007; and Gropp, R., Kok, C. and Lichtenberger, J., “The dynamics of bank spreads and financial structure”, Quarterly Journal of Finance, Vol. 4, No 4, 2014.
119 Llewellyn, D., “Competition and Profitability in European Banking: Why Are British Banks So Profitable?”, Economic Notes, Vol. 3, 2005, pp. 279-311.
120 For example, while Barth et al. (2006) find no relationship between “official supervisory power” and bank profitability, Maddaloni and Peydro (2011) find that supervisory power affects bank lending standards and loan supply; see Barth, R., Caprio Jr., G. and Levine, R., Rethinking Bank Regulation: Till Angels Govern, Cambridge University Press, New York, 2006; and Maddaloni, A. and Peydro, J.-L., “Bank risk-taking, securitization, supervision and low interest rates: evidence from US and euro area lending standards”, Review of Financial Studies, Vol. 24, 2011, pp. 2121-2165.
121 The banking data were taken from Bloomberg. The macroeconomic variables were sourced from the World Bank's World Development Indicator database. The structural indicators are from the Banking Structural Statistical Indicators database.
122 In the analysis, we use an unbalanced panel of annual data from 1994 to 2014 for a sample of European banks established in 19 European countries, based on banks’ consolidated financial statements. The 19 countries taken into account in the analysis are Austria, Belgium, Cyprus, Denmark, Finland, France, Germany, Greece, Hungary, Ireland, Italy, Luxembourg, Netherlands, Poland, Portugal, Slovenia, Spain, Sweden and the United Kingdom. The most represented countries are Germany (20 banks), Italy (12 banks) and France (9 banks). There is only one bank each from Finland, Ireland, Hungary and Poland in the sample. The selection of banks included in the sample was constrained by limited data availability. The coverage of banks tends to increase over time, i.e. the most recent years typically have the widest coverage. The dataset includes 98 banks after the implementation of some outlier filtering. More specifically, banks for which less than five years of observations were available were dropped from the sample.
123 The ROA is computed as the ratio of net income over average total assets.

Financial Stability Review, May 2015 140
A dynamic modelling approach is adopted in order to account for the potential time persistence of profitability.124 The main feature of a dynamic panel data specification is the inclusion of the lagged dependent variable among the regressors of the estimated model:125
∆𝑦𝑖𝑡 = 𝛼∆𝑦𝑖𝑡−1 + 𝛽∆𝑿𝑡 + ∆𝜀𝑖𝑡
where 𝛥yit is the first difference of the main variable of interest (i.e. ROA) and Δyit−1is the first difference of the lagged dependent variable for each individual bank i at time t. Furthermore, 𝚫𝐗t is a vector (k x 1) containing the first difference additional k explanatory variables and Δεit is the first difference of the zero-mean bank-specific error term. Notably, in all the estimated specifications of the model, the bank-specific variables are treated as endogenous, while the other regressors are treated as exogenous.
More specifically, the bank-specific variables included in the model as regressors, in addition to the lag of the dependent variable, are: (i) the bank size, which captures the effect of scale efficiency and is measured as the logarithm of the bank’s total assets; (ii) equity over total assets as a proxy for the solvency position; (iii) loan loss provisions over total loans as a proxy for credit risk; (iv) loan growth126; (v) a measure of cost efficiency defined as operating expenses over total assets; (vi) the retail ratio defined as the ratio of customer deposits plus net customer loans over total assets127; and (vii) a measure of income diversification, defined as the share of non-interest income over total revenue. The latter two variables are used as proxies for the bank’s business model.
The macroeconomic variables included in the model as independent variables are: (i) real GDP growth, (ii) the inflation rate, and (iii) the credit extended by the banking system to the private sector as a ratio to GDP.
As regards the structural indicators, two variables capturing the degree of concentration of each country’s banking sector are included: (i) the Herfindahl
124 For example, Berger et al. (2000) argue that banks’ profitability tends to be persistent over time, mainly
owing to imperfect market competition and limited informational transparency in the banking markets; see Berger, A. N., Bonime, S. D., Covitz, D. M. and Hancock, D., “Why are bank profits so persistent? The roles of product market competition, informational opacity, and regional/macroeconomic shocks”, Journal of Banking and Finance, Vol. 24, 2000, pp.1203-1235.
125 The inclusion of a lagged dependent variable in a panel framework might yield biased and inconsistent estimates owing to the correlation between the lagged dependent variables and the error terms. This is referred to as dynamic panel bias; see Nickell, S., “Biases in dynamic models with fixed effects”, Econometrica, Vol. 49, 1981, pp. 1417-1426; and Kiviet, J., “On bias, inconsistency, and efficiency of various estimators in dynamic panel data model”, Journal of Econometrics, Vol. 68, 1995, pp. 53-78. To address this issue and to tackle the possible endogeneity of the bank-specific explanatory variables owing to their possible correlation with the error term, equation (1) is estimated using the generalised method of moments (GMM), as proposed by Arellano and Bond (1991). In this context, the explanatory variables are instrumented by using “internal” instruments; see Arellano, M. and Bond, S. R., “Some tests of specification for panel data: Monte Carlo evidence and an application to employment equations”, Review of Economic Studies, Vol. 58, 1991, pp. 277-297.
126 Loan loss provisions over total loans and loan growth could be also categorised as cyclical factors, particularly when considered at an aggregate level.
127 See Martel, M.M., van Rixtel, A., and Mota, E.G., “Business models of international banks in the wake of the 2007-2009 global financial crisis”, Banco de Espana Revista de Estabilidad Financiera, No 22, 2012; and Gambacorta, L. and van Rixtel, A. (op. cit.).

Financial Stability Review, May 2015 141
index128, and (ii) the top-five bank concentration (CR5) index, defined as the market share of the top five institutions in terms of assets. Furthermore, an indicator of the official supervisory power, sourced from Barth, Caprio and Levine,129 is also included. This indicator measures the extent to which official supervisory authorities have the authority to take specific actions to prevent and correct problems.
Finally, time dummies are also included among the explanatory variables to ensure the absence of correlation across banks in their idiosyncratic error terms.
Table B.1 shows the regression results for six different specifications based on the explanatory variables discussed above. Throughout the different specifications, all the estimated coefficients display the expected signs when significant.
It is found that the lagged dependent variable is not a significant regressor, which suggests only weak persistence of profitability over time. This result could be driven by the marked decline in ROA experienced by European banks in recent years owing, in particular, to the headwinds stemming from the financial crisis.
Bank size is found to be negatively and significantly related to banks’ returns, suggesting that larger institutions over the sample period have been less profitable. This could be explained by the more complex and, thus, more costly structure often characteristic of larger banks.130
Furthermore, the results indicate that, on average, a higher capital ratio is positively and significantly associated with higher profitability. This could reflect the fact that well-capitalised banks have more room for manoeuvre to seek profit opportunities.
Not surprisingly, an increase in the ratio of operating expenses over total assets tends to be negatively related to bank profitability.
The estimated coefficient of the retail ratio, which is meant to assess the relative importance of banks’ retail business activities, is generally positive and significant. This seems to suggest that more traditional banks tend to have higher returns on assets. This is also corroborated by the fact that the share of non-interest income over total revenue has a negative sign, in line with the results from Stiroh.131 Therefore, greater reliance on non-interest income in general seems to be associated with comparatively weaker bank profitability. This finding could be especially driven
128 The Herfindahl index is defined as the sum of the squares of bank sizes measured as market shares in
terms of assets. 129 In Barth et al. (op. cit.), the authors provide a database of bank regulatory and supervisory policies in
180 countries from 1999 to 2011 based on an extensive survey. 130 However, it is important to note that bank size is significant only at 10% in three of the six specifications
and it is not significant when the top-five bank concentration index and the official supervisory power indicators are added. This might indicate that the evidence on the relationship between bank size and profitability is not conclusive.
131 Stiroh, K., op. cit.

Financial Stability Review, May 2015 142
by the income generated by risky, highly volatile and unreliable trading activities that for some banks represent a primary source of non-interest income.132
Loan growth is positively and significantly related to ROA, suggesting that, all other things being equal, an expansion of the loan book might create new business opportunities for banks and, thus, be associated with higher incomes.
Loan loss provisions are negatively and significantly related to banks’ profitability. This negative relationship might be explained by the fact that worsening asset quality is accompanied by rising forgone interest and costs of provisions. Hence, banks might enhance their profitability by strengthening their risk management policies and, in particular, by enhancing their screening and monitoring of credit risk.
Table B.1 Regression results – determinants of EU banks’ return on assets
(1) (2) (3) (4) (5) (6)
Bank-specific factors
Return on assets (lagged one period) -0.156 (-0.179)
-0.149 (-0.173)
-0.188 (-0.184)
-0.188 (-0.179)
-0.212 (-0.166)
-0.188 (-0.174)
Bank size -1.238* (-0.714)
-1.128* (-0.625)
-1.269* (-0.700)
-1.07 (-0.717)
-0.624 (-0.782)
-1.624** (-0.808)
Equity-to-total-asset ratio 0.375** (-0.182)
0.377** (-0.159)
0.348** (-0.166)
0.368** (-0.168)
0.370* (-0.210)
0.289* (-0.173)
Loan loss provisions over total loans -0.538** (-0.263)
-0.466* (-0.269)
-0.469* (-0.260)
-0.511* (-0.265)
-0.739** (-0.311)
-0.471* (-0.260)
Loan growth (bank level) 0.002** (-0.001)
0.002* (-0.001)
0.002* (-0.001)
0.002* (-0.001)
0.002** (-0.001)
0.003** (-0.001)
Efficiency measure (cost-to-income ratio) -0.261* (-0.156)
-0.173 (-0.141)
-0.175 (-0.185)
-0.169 (-0.166)
-0.116 (-0.138)
-0.0094 (-0.144)
Retail ratio 0.037* (-0.019)
0.036 (-0.022)
0.077** (-0.031)
0.068** (-0.026)
0.046 (-0.030)
0.081** (-0.036)
Diversification measure -0.007 (-0.006)
-0.006 (-0.005)
-0.006 (-0.005)
-0.007 (-0.005)
-0.009 (-0.006)
-0.007* (-0.004)
Macroeconomic factors
Inflation rate
0.024 (-0.044)
0.073 (-0.056)
Real GDP growth
0.159*** (-0.051)
0.166*** (-0.047)
Credit-to-GDP ratio (%)
0.012** (-0.005)
0.0193** (-0.008)
Structural factors
Herfindahl index for credit institutions (total assets)
0.215** (-0.090)
0.270*** (-0.097)
Shares of the five largest credit institutions (CR5)
0.061** (-0.026)
Supervisory power index
0.078 (-0.093)
0.035 (-0.040)
Number of observations 989 959 898 892 793 793
Heteroskedasticity and autocorrelation robust standard errors in parentheses
* p<0.10; ** p<0.05; *** p<0.01
As regards macroeconomic variables, while the inflation rate is not significant, both real GDP growth and the credit extended by the banking system to the private sector over GDP are positively and significantly related to banks’ ROA.
132 This finding, however, may be contaminated by the inclusion of the global financial crisis years, which
had a historically strong negative impact on trading income and which may not be reflective of a “standard” financial cycle impact.

Financial Stability Review, May 2015 143
As regards the banking sector structural factors, both concentration indexes exhibit a positive and significant relationship with ROA. This finding suggests that in a highly concentrated banking system, banks are either more efficient or in a better position to exploit their market power to operate with higher intermediation margins and thus obtain higher returns.
Finally, the estimated coefficient of the official supervisory power indicator has a positive sign. While the coefficient is not statistically significant (at the 10% probability level), this may nevertheless indicate that more stringent supervision improves bank performance, possibly reflecting stronger incentives for good risk management and more adequate capital buffers.133
Chart B.5 displays a decomposition of the average contribution of the different explanatory factors to bank profitability over time.134 It can be observed that, until 2008, banking factors were the most important contributors to the evolution of ROA, while macroeconomic factors were also important and mostly made a positive contribution to bank profit generation. From 2009 onwards, however, the developments in bank profits seem to have been mainly driven by macroeconomic factors together with unobserved “other” factors135 that likely reflect the extraordinary losses and rises in funding costs resulting from the financial and sovereign debt crises.
One way of using the empirical analysis to assess EU banks’ low profitability levels observed in recent years is to measure how the indicators of the identified bank profitability determinants stand at the current juncture compared with their historical averages.
In this respect, Chart B.6 illustrates that, from a historical perspective, the main factors currently
suppressing European banks’ profitability are of a cyclical nature. Indeed, compared with their historical averages, GDP growth is currently very low and, at an aggregate level, loan growth is subdued and loan loss provisions are historically high. At the same time, other bank-specific determinants and structural indicators are broadly in line with their historical averages.
133 Here it is worth mentioning that throughout all the specifications, the Hansen test of over-identifying
restrictions confirms that the (internal) instruments are valid, and the Arellano-Bond test rejects significant second-order serial correlation in the error term. These test results indicate the overall validity of the GMM approach. Furthermore, the Wald test indicates that all the estimated coefficients are jointly significant.
134 Model specification (6) in Table B.1 was re-estimated including only the significant explanatory factors. Then, the newly estimated coefficients, which are consistent in significance and sign with those reported for specification (6) in Table B.1, are used to derive the decomposition of the average contribution to bank profitability reported in Chart B.5.
135 The “other” category reflects the contribution of the time-fixed effects and the model residual, i.e. unobserved explanatory factors that are not captured by the variables included in the model.
Chart B.5 Bank-specific factors were important in the pre-crisis period, while since 2008 profits have been mainly driven by macroeconomic and “crisis-related” (other) factors
Decomposition of the average contribution of the explanatory factors to bank profitability over time
-1.5
-1.0
-0.5
0.0
0.5
1.0
1.5
1999 2001 2003 2005 2007 2009 2011 2013
macroeconomic factors structural factors
banking factors other
ROA first difference

Financial Stability Review, May 2015 144
Following a similar approach, the presented analysis may contribute to improving the understanding of European banks underperformance compared with their international peers.
Chart B.7 The importance of cyclical developments for EU bank profitability is confirmed when comparing it with that of their US peers
Current state of EU banks’ profitability determinants against their US peers (US measures normalised to 100) (end-2013; ratios and percentages)
Sources: Bloomberg, Eurostat, SNL Financial and ECB calculations. Notes: The US-based indicators have been normalised to 100. Current values of the EU-based indicators are measured in terms of deviations from the US indicators. 24 large US banks are considered.
This is explored in Chart B.7, which shows the current indicators of bank profitability determinants in Europe as compared with the United States.136 It can be seen that cyclical indicators in Europe are substantially less conducive to bank profit generation than in the United States. As regards the less cyclical indicators, the picture is more mixed. While, on average, US banks are better capitalised (on a leverage ratio basis) and operate with a higher retail ratio than their EU peers, their operating expense ratios are slightly higher and their dependence on non-interest income is also somewhat more pronounced than in Europe. Bank size and concentration indices are broadly similar, on average, in the two regions.
Concluding remarks
This article has provided evidence that European banks’ profitability is determined by a confluence of factors, including bank-specific characteristics, macroeconomic factors and structural market features.
136 In this context, it is important to mention that the variables included in Chart B.7 are significant
explanatory factors only for European banks’ profitability since the regression analysis uses data for European banks only.
size (-)
equity ratio (+)
LLP over total loans (-)
loan growth (+)
inefficiency (-)
retail ratio (+)
diversification (-)
real GDP growth (+)
credit over GDP (+)
CR5 (+)
-100-50
050
100150200250300
EU banks 2013US banks 2013
Chart B.6 Currently, EU bank profitability is mainly being suppressed by weak cyclical factors
Current state of EU banks’ profitability determinants against historical benchmarks (sample average) (1994-2013; ratios and percentages)
Sources: Bloomberg, Eurostat, SNL Financial and ECB calculations. Notes: The historical averages have been normalised to 100. Current values of the indicators are measured in terms of deviations from historical averages.
size (-)
equity ratio (+)
LLP over total loans (-)
loan growth (+)
inefficiency (-)
retail ratio (+)diversification
(-)
real GDP growth (+)
credit over GDP (+)
Herfindahl index (+)
CR5 (+)
-50
0
50
100
150
200
sample average2013 average

Financial Stability Review, May 2015 145
However, the main challenges that EU banks face in terms of their profit generation capacity appear to be mostly of a cyclical nature, although there may also be some material bank-specific and structural impediments. At the same time, some of the recent policy initiatives at the European level, such as the banking union, which is already well advanced, as well as the initiatives to foster a capital markets union in the EU, may help to alleviate a number of both cyclical and structural factors currently depressing bank profits.

Financial Stability Review, May 2015 146
C Resolving the legacy of non-performing exposures in euro area banks137
The weight of non-performing exposures (NPEs) on the balance sheets of European banks is a cause for concern for policy-makers; yet resolving the issue presents a number of challenges. This special feature presents an overview of the scale of the NPE problem, highlights several operational aspects that are critical for effectively resolving the problem, and outlines the merits of various resolution strategies.
Introduction
Financial crises or prolonged economic contractions often trigger a rapid and substantial increase in non-performing exposures (NPEs) on banks’ balance sheets, as asset valuations decrease and borrowers become unable to service their debt. In the European context, macro-financial stresses over recent years have resulted in a significant stock of NPEs: the 130 largest euro area banks held close to €900 billion of impaired assets at the end of 2013. More recent data, though not comparable across countries, indicate that the figure has risen since then.
A number of different approaches are available to address the NPE problem and these are presented here. Strategies vary between on- and off-balance sheet approaches, with the former involving the internal workout of NPEs by the banks concerned, supported by regulatory guidance on provisioning, loan restructuring and the protection of borrowers, whereas the latter may involve outright sales to private investors, or a centralised workout, possibly by a government-sponsored asset management company. Regardless of the approach, the legal and judicial frameworks must be conducive to the swift and efficient resolution of NPEs.
The resolution of systemic NPE problems requires a comprehensive strategy, encompassing necessary improvements in the operational environment and the selection of appropriate resolution strategies. Recent experience shows that tailored approaches, based on a thorough understanding of the country-specific dimensions of the NPE problem and driven as much as possible by the private sector, are the most effective means to tackling system-wide surges in NPEs. Depending on the prevailing circumstances, it may be that the state’s role is best confined to contributing to an operational environment that facilitates NPE resolution, although in other cases, greater intervention may be warranted.
Non-performing exposures in the euro area banking sector
The measurement of NPEs in Europe has long suffered from a lack of harmonisation and transparency. Prior to the financial crisis, there was no single, harmonised EU-wide definition of NPEs. In addition, banks could use loopholes in existing national 137 Prepared by Maciej Grodzicki, Dimitrios Laliotis, Miha Leber, Reiner Martin, Edward O’Brien and Piotr
Zboromirski.

Financial Stability Review, May 2015 147
definitions to conceal forbearance. As a result, policy-makers and external stakeholders alike faced difficulties in trying to establish a true picture of credit quality in EU banks, both within and across jurisdictions.
The European Banking Authority (EBA) has only recently adopted a common definition of an NPE, which fully harmonises the disclosure of such exposures, including, in particular, forborne exposures.138 The ECB’s 2014 comprehensive assessment used a simplified version of the EBA’s NPE definition and found that – following adjustments made to the classification of loans in the course of that exercise – significant euro area banks held NPEs totalling €879 billion at the end of 2013, equivalent to about 9% of euro area GDP.139 These aggregate results mask, however, considerable heterogeneity across euro area countries: NPEs as a share of total banking sector assets range from 4% to 57% across national banking sectors (see Chart C.1).
High shares of NPEs constitute a serious macroprudential problem and are likely to have far-reaching macroeconomic consequences. First, a large stock of NPEs indicates that households and non-
financial firms are excessively indebted and impaired, which may depress consumption and investment, and thus delay economic recovery. Second, scarce resources in the banking sector, capital, funding, as well as operational capacity, are absorbed by legacy assets and cannot be deployed to support new viable investment projects. This, in turn, may lengthen the period of subdued economic activity, further aggravating the NPE problem for the banking sector and the economy as a whole.
Key aspects of the operational environment for NPE resolution
A supportive operational environment is a necessary precondition for effective NPE resolution. This environment is rather complex, involving a large number of stakeholders, including banks, supervisors, various ministries, consumer protection authorities, as well as non-governmental bodies, such as banking associations.
138 See EBA final draft Implementing Technical Standards on Supervisory reporting on forbearance and
non-performing exposures under Article 99(4) of Regulation (EU) No 575/2013 (https://www.eba.europa.eu/documents/10180/449824/EBA-ITS-2013-03+Final+draft+ITS+on+Forbearance+and+Non-performing+exposures.pdf).
139 Significant in this context refers to banks which, under the criteria of the Single Supervisory Mechanism Regulation, are directly supervised by the ECB.
Chart C.1 NPEs in individual countries
NPE ratio as determined by the ECB’s comprehensive assessment (Dec. 2013; percentage of total exposures)
Source: ECB calculations. Notes: The NPE ratio was aggregated from bank-level data using total exposures to retail and corporate customers as weights. AQR stands for asset quality review.
0
10
20
30
40
50
60
70
CY GR IE SI PT IT MT ES AT LT LV BE DE EE SK FR LU NL FI
Post-AQR NPE ratioPre-AQR NPE ratio

Financial Stability Review, May 2015 148
The operational environment tends to be quite country-specific. Generally speaking, however, it will normally encompass a number of key “building blocks”, the two most important of which are reviewed below.140
Legal framework and efficient judicial system A key aspect of the operational environment needed for successful NPE resolution is an effective legal framework and judicial system. Experience shows that these systems are often unable to cope efficiently with a substantial increase in the number of defaulting credits and may thus represent a major impediment for efficient NPE resolution.
For corporate NPEs, insolvency legislation in many euro area countries tends to emphasise liquidation rather than the restructuring of viable businesses. Moreover, corporate bankruptcy procedures are usually very protracted, which render the rehabilitation of viable distressed debtors less likely and can destroy the value of a company’s assets. Voluntary, out-of-court workout frameworks, based on the consent of a binding majority of creditors, can thus in many cases offer a useful alternative to lengthy judicial procedures, court backlogs and a lack of experienced insolvency judges and practitioners. Moreover, the implementation of fast-track judicial procedures is a necessary addition to support the functioning of out-of-court workout frameworks.
With respect to household NPEs, an effective personal insolvency regime is important, so that the right incentives are provided for debtors and the number of judicial procedures is minimised. The insolvency regime should enable banks to foreclose on NPE collateral within a reasonable timeframe, while remaining cognisant of social considerations and providing cooperative borrowers with restructuring alternatives. Out-of-court dispute resolution mechanisms, consumer protection initiatives and debt counselling programmes can enhance the fairness and accessibility of the process. These are important in order to ensure that the political appetite for resolving less socially-sensitive NPE portfolios is not undermined.
Support from the sovereign Another important aspect influencing the operational environment for NPE resolution is the willingness and ability of the sovereign to support the process. Fiscal limitations often play an important role here. Countries experiencing protracted economic downturns may lack the fiscal space to recapitalise their banking systems should the capital losses arising from NPE resolution exceed the available buffers.141
There are also important political and legal constraints to the support that the sovereign can render to the banking sector. Besides possible national limitations, which tend to be linked to political considerations, the EU state aid framework restricts a state’s ability to provide support for the NPE resolution process. The
140 Other important elements of the operational environment relate to the development and/or improvement
of the functioning of NPE markets and real estate markets by, for example, optimising taxation-related incentives and decreasing real estate transaction costs.
141 Furthermore, the sovereign should provide the right incentives to the banking sector in cases where distressed debtors also have significant tax debts. The ranking of the sovereign versus private sector claims and possible restructuring of tax debts play a key role in this context.

Financial Stability Review, May 2015 149
requirements of the Bank Recovery and Resolution Directive (BRRD) may make state support less attractive for certain portions of the banking sector.
Ensuring a supportive operational environment for NPE resolution is a key role for the state, regardless of the specific nature of the NPE problem. Where circumstances allow, this should be the extent of the sovereign support and private sector solutions should dominate. However, in some cases, the role of the sovereign may be broader, encompassing capital support.
Different approaches to tackle the NPE problem
The various available approaches to tackle NPEs can be categorised as either on-balance-sheet or off-balance-sheet resolution, although both types of approach may be usefully employed in parallel. In the former, the risk related to future recoveries remains with the originating bank. In the latter, the bulk of the risk may be transferred to another entity.
On-balance-sheet approaches A priori, the resolution of NPEs is a normal part of the banking business. Nonetheless, banks are usually not well prepared for widespread, systemic deteriorations in credit quality and typically lack the necessary capacity and expertise when confronted with a large-scale problem. As a result, investments in human resources, organisational processes and information systems are needed to develop or upgrade in-house capacities. Practice from euro area countries suggests that it can take up to three years to implement sufficiently strong improvements in banks’ internal workout capacity for dealing with systemic NPE problems. This highlights the importance of reacting quickly to a growing NPE problem and of implementing pre-impairment monitoring. Moreover, achieving sufficiently strong enhancements in workout capacity often requires a considerable push from the competent authorities to avoid widespread and excessive forbearance.
An appropriate starting point for enhancing internal workout processes is a diagnostic exercise for NPE-related operations, to determine which areas need improvement and which measures should be prioritised. Banks can conduct such an exercise on their own initiative or they may need to be incentivised by the competent authorities to do so. Following up on such an exercise, banks should develop clear quantitative objectives, or “key performance indicators”, including both operational variables (e.g. staffing indicators or case numbers) and financial variables (e.g. default rates or migration rates from performing to non-performing loan categories).
Competent authorities may provide guidelines on the specific tools and strategies employed by the banks. Such guidelines should not be overly prescriptive. However, they should also not give leeway for excessive forbearance. Meaningful portfolio segmentation of the NPE stock should normally be part of the requirements, given that specific solutions should always be tailored to individual portfolios. Solutions should also be tailored to the duration of arrears. From the very early stage of arrears, decision-making should be based on a viability assessment of the borrower,

Financial Stability Review, May 2015 150
to minimise the risk that forbearance be extended to non-viable entities, which should instead be swiftly resolved.
Competent authorities may also want to provide clear and appropriate guidance on the minimum expected degree of conservatism in NPE provisioning and the prudent recognition of losses. This pertains, in particular, to assumptions regarding collateral valuation, timing of recovery cash flows and discount rates. While such guidance may initially increase the capital needs of banks with large NPE stocks, it has a number of important benefits. First, it helps to prevent “extend and pretend” approaches by banks and the negative macroeconomic consequence of forbearance at a systemic level. Second, it provides buffers for sustainable loan restructuring and, third, it helps to restore market confidence in banks’ financial reporting, which in turn may reduce banks’ funding costs and facilitate capital increases, if needed.142
If on-balance-sheet solutions are dominant and large exposures are left on the balance sheets of originating banks, there may be a need for coordination of actions among lenders. Otherwise, incentives for lenders are often misaligned owing to differences in collateralisation and seniority of their exposures, which may lead to very different recovery rates for the same borrower. Without such coordination, a minority of creditors may block a sustainable solution leading to socially suboptimal outcomes.
There are two options to overcome these kinds of “coordination failure”: (i) privately-led coordination; and (ii) public sector-led coordination, which can both ensure that banks’ collective incentives are better aligned and ensure a proactive approach. Ideally, the privately-led approach, which can involve a banking association or a third party as a hub supporting negotiations between creditors and debtors, should be applied.
On-balance-sheet approaches to NPE resolution can be supported by partial risk transfer, either to the private sector (e.g. synthetic securitisations) or to the public sector (e.g. asset protection schemes). In such cases, part of the tail risk is transferred to a third party. However, the bank remains responsible for servicing the NPEs and for the resulting losses up to a given threshold.
Off-balance-sheet approaches Off-balance-sheet approaches, using various means of asset separation, have been shown to be an effective policy response to a build-up of NPEs under specific conditions. Asset separation may be achieved with public sector support, through the provision of guarantees, for example, or by private means, in its simplest form, through the direct sale of assets.
142 In nearly all circumstances, the sustainable restructuring of a loan implies a reduction in its net present
value and, consequently, in the book value. A bank which has not built up provision buffers to absorb this reduction would be dis-incentivised to engage in sustainable restructuring, and would prefer short-term “extend-and-pretend” forbearance.

Financial Stability Review, May 2015 151
Asset management companies143, often referred to as “bad banks”, have, in numerous cases, been established to manage assets that were removed from banks’ balance sheets. Historically, asset management companies were established to manage assets that remained in the case of a bank failure (a single bank case) or to address system-wide, but asset-class-specific, distress. In recent years, examples of the latter include the NAMA in Ireland and SAREB in Spain, both established to deal with legacy assets arising from distress among commercial real estate assets, as well as BAMC in Slovenia, which was established to deal with impaired corporate loans.
While it remains premature to draw lessons from these relatively recent experiences, in particular for BAMC, the track record of these asset management companies, combined with the outcomes of other historical examples, suggests that they can be an effective means for dealing with particular types of NPE. Through the separation of assets, participating banks’ funding and liquidity conditions can be improved, concerns around asset quality can be ameliorated to a large extent, coordination problems can be resolved, and the feedback loop that may have emerged between funding and solvency problems can be reversed. In addition, participating banks’ operational capacity is relieved.
Since 2009 the ECB has published a number of documents outlining some relevant criteria for consideration in asset separation and the establishment of asset management companies.144 In particular, asset management companies may be desirable where market prices and collateral values are depressed; where banks have lost access to funding markets; where banks lack the capacity to manage NPEs on the balance sheet; where economies of scale can be achieved by pursuing an off-balance-sheet approach; where credit origination may be improved by asset separation; and, finally, where adverse incentives are at play, affecting banks’ willingness to pursue creditors. Transparent and clear eligibility criteria for the selection of assets for separation must be laid down, in advance and in accordance with the policy objective. In addition, the asset management company must have reasonable prospects of being effective in working out the NPEs. This implies that it must have sufficient legal empowerments to foreclose on loan assets and to seize underlying collateral. It must also be able to quickly obtain all relevant information concerning the creditor and the collateral.
An important constraint in the establishment of asset management companies is the European state aid conditionality145, as revised in August 2013, and the associated provisions of the BRRD, which became effective in January 2015. They come into
143 This term should not be confused with the “asset management industry”, which manages financial
investments on behalf of clients. 144 ECB, Guiding principles for bank asset support schemes, February 2009; and O’Brien, E. and Wezel,
T., “Asset support schemes in the euro area”, Financial Stability Review, May 2013. 145 Pricing of NPEs and underlying collateral is often challenging in a distressed environment due to the
illiquidity of the asset markets and heightened economic uncertainty. Asset prices are therefore lower than the long-term economic value of the assets. The transfer at market prices would crystallise the losses and therefore may not be desirable from a macroprudential perspective. In any event, the transfer pricing methodology, used in the absence of prices derived from a liquid market, may give the authorities some discretion to reduce the negative impact of the asset transfers on the participating institutions.

Financial Stability Review, May 2015 152
play when transfer prices of assets are set at the long-term economic value of the assets, which is higher than the estimated market value of assets. According to these rules, banks benefiting from state aid support are in principle required to bail in shareholders and subordinated creditors. These conditions, designed to reduce the risk that taxpayers’ money is used to support the financial sector through burden-sharing with private creditors of troubled banks, effectively limit the role of asset management companies to periods of acute crisis and effectively deny banks and national authorities the potential to harness the available benefits of such schemes outside such a context.
An alternative off-balance-sheet approach for dealing with NPEs is the direct sale of assets onto a “secondary” NPE market, where specialised investors may provide the necessary know-how and capital to facilitate the resolution of at least some types of NPE. If, however, specific asset classes are systemically impaired, for example in the aftermath of a housing bubble, asset sales become more challenging. It may not be possible to avoid fire sales and banks’ management may be unwilling or unable to realise the significant capital losses that are associated with sales at fire-sale prices.
Investor interest in distressed assets usually increases once the prospects for economic recovery become clear and uncertainty about the long-term value of assets subsides. Besides these economic considerations, the acquisition of NPE portfolios by specialised investors is often held back by legal and regulatory impediments, which authorities should review as part of the NPE resolution process. Possible impediments in this respect may include rules for the transfer of credit contracts, licensing requirements for the type of companies involved and targeted tax (dis)incentives. Therefore, measures to support the development of an NPE market are of the utmost importance, in order to support the direct sale of selected NPE portfolios.
Towards a comprehensive strategy for NPE resolution
The resolution of systemic NPE problems requires a comprehensive strategy, encompassing the necessary improvements in the operational environment and the selection of the appropriate approaches to be employed. While the impediments in the operational environment have to be removed before an effective NPE resolution process can get underway, the work on the identification, selection and implementation of approaches must start in parallel.
The identification of the best NPE resolution approaches requires a thorough understanding of: (i) current NPE resolution solutions applied and their effectiveness; (ii) the characteristics of NPE portfolios; (iii) the condition of distressed debtors; and (iv) the condition of lenders and their capacity to absorb future losses. In order to reach that understanding, a wide range of “non-standard” information may be needed, e.g. an external review of banks’ internal workout practices and a system-wide asset quality review and stress test, to remove possible uncertainty about point-in-time and forward-looking asset values.

Financial Stability Review, May 2015 153
More specifically, a range of factors need to be considered before deciding on how to implement the favoured approaches. The most important determining factors include the following.
• The composition and heterogeneity of NPE portfolios. This is important when deciding between on- and off-balance-sheet approaches. If NPEs are concentrated in a specific asset class and include large ticket non-core assets, and a high proportion of debtors has become gone concern, so that recoveries would be made mainly from assets, an off-balance-sheet solution (e.g. an asset management company) may be most appropriate. Conversely, if NPEs are very heterogeneous, carving out NPEs may not be the optimal solution. Moreover, large stocks of SME and retail NPEs are typically better addressed using on-balance-sheet solutions.
• The state of the real estate market. This may be a big impediment in the resolution of NPEs, preventing the large-scale liquidation of collateral in a systemic crisis. A depressed real estate market has a strong impact on the bid-ask spread in the pricing of NPEs collateralised with real estate, which in turn increases the capital cost of NPE disposals and reduces the incentives of banks to do so voluntarily.
• Consumer protection and social issues. These aspects play an important role in the resolution of owner-occupied real estate. Moreover, if not properly addressed, social concerns may be used to prevent a successful NPE workout, even for portfolios that are not normally considered to be socially sensitive.
• The level of concentration in the banking system and the size of individual institutions. This is an important determinant for the effectiveness of coordination among banks and whether the banks can build sufficient internal capacity to resolve NPEs. In more concentrated banking sectors with relatively large institutions, it tends to be easier to work out NPEs internally. That said, a significant presence of common/interconnected borrowers may favour centralised, off-balance-sheet solutions, as the pooling of debt increases the negotiation power vis-à-vis the debtor. An important factor for dealing with common borrowers and ensuring a coordinated NPE resolution process is the presence of a strong and competent central coordination entity.
• The availability of private capital for the establishment of off-balance-sheet solutions. The absence of private capital makes the establishment of an asset management company more problematic: first, owing to the fiscal impact of a fully publicly-owned off-balance-sheet scheme; second, owing to possible governance concerns associated with a fully state-controlled asset management company; and third, owing to the possible complications arising from EU state aid rules and the BRRD.
• Moral hazard. This is a very delicate issue in the NPE resolution process. In situations where more drastic restructuring solutions may be considered (e.g. partial debt forgiveness), banks face a material risk of performing exposures being contaminated as well. This implies, first, a need to apply such

Financial Stability Review, May 2015 154
solutions only very selectively and with clear and stringent eligibility requirements. Second, banks could reduce the risk of contagion by implementing an organisational separation of performing and non-performing portfolios.
Ultimately, the decision about the best-suited NPE resolution approach (i.e. on- or off-balance-sheet approach, single approach only or combination of approaches, private sector only or with public sector involvement) will depend on the size and complexity of the NPE problem, which in turn tends to be related to the origin of the financial crisis in the country concerned (e.g. a burst real estate bubble versus a prolonged recession).
A combination of different solutions, driven as much as possible by the private sector, may be the most appropriate approach. First, a multi-pronged approach appears better suited to deal with the multifaceted nature of the NPE problem in most countries. Second, it minimises the fiscal costs, the moral hazard problems that may be associated with substantial state involvement, and the additional complexity arising from EU state aid rules and the BRRD. This general guidance notwithstanding, the complexity and heterogeneity of the NPE problem across euro area countries will normally call for tailored, country-specific solutions.
Irrespective of the selected approaches to deal with systemic NPE problems, strengthening the banks’ internal workout capacity is always highly advisable. First, there will always be NPE segments that are better dealt with within banks, rather than being carved out, e.g. owner-occupied real estate. Second, strengthening internal bank NPE resolution capacity helps to prevent new episodes of systemic NPE formation, as banks will be able to act at an earlier stage of the NPE build-up process and provide solutions before the default. In this respect, improvements in the strategies, processes and tools to deal with early arrears are as important as the tools to deal with more long-term arrears that are usually a consequence of a prolonged crisis period.

S1Financial Stability Review, May 2015
Statistical annex
1 Macro-financial and credit environment
Chart S.1.1Actual and forecast real GDP growth
(Q1 2004 - Q1 2015; annual percentage changes)
-20
-16
-12
-8
-4
0
4
8
12
16
--
-20
-16
-12
-8
-4
0
4
8
12
16
euro areaeuro area - forecast for 2015
United StatesUnited States - forecast for 2015
2004 2005 2006 2007 2008 2009 2010 2011 2012 2013 2014 2015
Sources: Eurostat and European Commission (AMECO, Spring 2015 forecast).Note: The hatched area indicates the minimum-maximum range across euro areacountries (2015 Q1 data covers DE, GR, FR, NL and AT).
Chart S.1.2Actual and forecast unemployment rates
(Jan. 2004 - Mar. 2015; percentage of the labour force)
2
4
6
8
10
12
14
16
18
20
2004 2005 2006 2007 2008 2009 2010 2011 2012 2013 2014 2015
22
24
26
28
2
4
6
8
10
12
14
16
18
20
22
24
26
28
euro areaeuro area - forecast for 2015
United StatesUnited States - forecast for 2015
-
-
Sources: Eurostat and European Commission (AMECO, Spring 2015 forecast).Note: The hatched area indicates the minimum-maximum range across euro area countries.
Chart S.1.3Citigroup Economic Surprise Index
(1 Jan. 2008 - 15 May 2015)
euro areaUnited KingdomUnited StatesJapan
-200
-150
-100
-50
0
50
100
150
200
2008 2009 2010 2011 2012 2013 2014 Feb Mar Apr2015
-200
-150
-100
-50
0
50
100
150
200
Source: Bloomberg.Note: A positive reading of the index suggests that economic releases have, on balance, been more positive than consensus expectations.
Chart S.1.4Exchange rates
(1 Jan. 2007 - 15 May 2015; units of national currency per euro)
USDGBPJPY (divided by 100)CHF
0.60
0.80
1.00
1.20
1.40
1.60
1.80
2008 2010 2012 2014 Feb Mar Apr2015
0.60
0.80
1.00
1.20
1.40
1.60
1.80
Sources: Bloomberg and ECB calculations.

S2Financial Stability Review, May 2015
Chart S.1.5Quarterly changes in gross external debt
(Q4 2014; percentage of GDP)
-10
-8
-6
-4
-2
0
2
4
6
8
10
FI
general government (left-hand scale)MFIs (left-hand scale)other sectors 1 (left-hand scale)gross external debt 2 (right-hand scale)+
BEDE
EEIE ES
GR FRIT
CYLV
MTNL
ATPT
SISK
0
120
240
360
480
600
720
840
960
1080
1200
Source: ECB.Notes: For Luxembourg, in Q3 2014 quarterly changes were 0.3% for general government, 16.9% for MFIs and 22.9% for other sectors. Gross external debt was 5,796% of GDP.No sectoral breakdown is available for Q4 2014 for IE, CY and MT.For Austria the quarterly changes in Q4 2014 were mostly driven by a reclassifi cation of one big company from MFI to the government sector.1) Non-MFIs, non-fi nancial corporations and households.2) Gross external debt as a percentage of GDP.
Chart S.1.6Current account balances in selected external surplus and deficit economies(1997 - 2020; USD billions)
-1,000
-500
0
500
1,000
1,500
1998-1,000
-500
0
500
1,000
1,500
euro areaUnited StatesJapan
Chinaoil exporters
2000 2002 2004 2006 2008 2010 2012 2014 2016 2018 2020
Source: IMF World Economic Outlook.Notes: Oil exporters refers to the OPEC countries, Indonesia, Norway and Russia.Figures for 2015 to 2020 are forecasts.
Chart S.1.7Current account balances (in absolute amounts) in selected external surplus and deficit economies(1997 - 2020; percentage of world GDP)
0.0
0.5
1.0
1.5
2.0
2.5
3.0
3.5
4.0
1998
all large surplus/deficit economiesUnited StatesChina
2000 2002 2004 2006 2008 2010 2012 2014 2016 2018 20200.0
0.5
1.0
1.5
2.0
2.5
3.0
3.5
4.0
Source: IMF World Economic Outlook.Notes: All large surplus/defi cit economies refers to oil exporters, the EU countries,the United States, China and Japan. Figures for 2015 to 2020 are forecasts.
Chart S.1.8Foreign exchange reserve holdings
(Feb. 2010 - Feb. 2015; percentage of 2009 GDP)
2014
advanced economiesemerging Asia
CEE/CISLatin America
2010 2011 2012 20130
25
50
75
100
125
150
175
0
25
50
75
100
125
150
175
Sources: Bloomberg, IMF World Economic Outlook and IMF International Financial Statistics.Note: CEE/CIS stands for central and eastern Europe and the Commonwealth of Independent States.

S3Financial Stability Review, May 2015
Chart S.1.9General government deficit/surplus (+/-)
(percentage of GDP)
- -
- -
- -- -
-- -
-- - -
- - - -
four-quarter moving sum in Q4 2014European Commission forecast for 2015European Commission forecast for 2016
-
SKFI
EA BE EE GR FR CY LU NL PTDE IE ES IT LV MT AT SI
-2
0
2
4
6
8
10
-2
0
2
4
6
8
10
Sources: National data, European Commission (AMECO, Spring 2015 forecast) andECB calculations.Notes: Euro area data refer to the Euro 19. Data for four-quarter moving sum refer to accumulated defi cit/surplus in the relevant quarter and the three previous quarters expressed as a percentage of GDP. For LU, annual GDP for 2014 supplied in the context of the Excessive Defi cit Procedure was used.
Chart S.1.10General government gross debt
(percentage of GDP, end of period)
- --
-
-
-
- --
-
- -- - -
--
- -
SKFI
EA BE EE GR FR CY LU NL PTDE IE ES IT LV MT AT SI
of which held by non-residentsgross debt at end-Q4 2014
European Commission forecast for 2015European Commission forecast for 2016
0
20
40
60
80
100
120
140
160
200
180
0
20
40
60
80
100
120
140
160
200
180
Sources: National data, European Commission (AMECO, Spring 2015 forecast) and ECB calculations.Notes: Euro area data refer to the Euro 19. Information on government debt held by non-residents is not available for IE, CY and MT. For LU, annual GDP for 2014 supplied in the context of the Excessive Defi cit Procedure was used.
Chart S.1.11Household debt-to-gross disposable income ratio
(percentage of disposable income)
SK
2007 debtchange in debt between 2007 and 2013
EAUK
USJP
DEBE EE
GRES
FRIT
CYLV
NLAT
PTSI FI
-50
-25
0
25
50
75
100
125
150
175
200
225
250
275
-50
-25
0
25
50
75
100
125
150
175
200
225
250
275
Sources: ECB, Eurostat, US Bureau of Economic Analysis and Bank of Japan.Notes: For Estonia initial debt data refer to 2008, while change in debt refers to 2008 and 2013. For Malta initial debt data refer to 2009, while change in debt refers to 2009 and 2013. For Japan, change in debt refers to 2007 and 2012. Data for LU are not available. The fi gures are based on ESA 2010 methodology.
Chart S.1.12Household debt-to-total financial assets ratio
(Q1 2009 - Q4 2014; percentages)
2009
euro areaUnited Kingdom
United StatesJapan
2010 2011 2012 2013 201410
30
50
70
90
10
30
50
70
90
Sources: ECB and ECB calculations, Eurostat, US Bureau of Economic Analysis and Bank of Japan.Notes: The hatched/shaded areas indicate the minimum-maximum and interquartile ranges across euro area countries. The fi gures are based on ESA 2010 methodology.

S4Financial Stability Review, May 2015
Chart S.1.13Corporate debt-to-GDP and leverage ratios
(percentages)
- -- -
- - - --
- - - - -- - - - - - - -
FISK
2007 debt (left-hand scale)change in debt between 2007 and 2013 (left-hand scale)
2013 leverage (right-hand scale)
EAUK
US DEBEJP
IEEE
ESGR
ITFR
LVCY
MTLU
ATNL
SIPT
-50
0
50
100
150
200
250
300
350
400
450
500
-10
0
10
20
30
40
50
60
70
80
90
100
Sources: ECB, Eurostat, US Bureau of Economic Analysis and Bank of Japan.Notes: The fi gures for Japan are based on ESA 95 methodology.For Estonia initial debt data refer to 2008, while change in debt refers to 2008 and 2013. For Malta initial debt data refer to 2009, while change in debt refers to 2009 and 2013.
Chart S.1.14Annual growth of MFI credit to the private sector in the euro area(Jan. 2006 - Mar. 2015; percentage change per annum)
2014
euro area
2006 2007 2008 2009 2010 2011 2012 2013-20
-10
0
10
20
30
40
-20
-10
0
10
20
30
40
Sources: ECB and ECB calculations.Notes: MFI sector excluding the Eurosystem. Credit to the private sector includes loans to and debt securities held by non-MFI residents excluding general government; MFI holdings of shares, which are part of the defi nition of credit used for monetary analysis purposes, are excluded. The hatched/shaded areas indicate the minimummaximum and interquartile ranges across euro area countries.
Chart S.1.15Changes in credit standards for residential mortgage loans(Q1 2003 - Q2 2015; percentages)
-30
-20
-10
0
10
40
70
60
50
30
20
-30
-20
-10
0
10
20
70
60
40
30
50
2004 2006 2008 2010 2012 2014
euro area (loans to households for house purchase)United States (all residential mortgage loans)United States (prime residential mortgage loans)United States (non-traditional residential mortgage loans)United Kingdom (secured credit to households)
Sources: ECB, Federal Reserve System and Bank of England.Notes: Weighted net percentage of banks contributing to the tightening of standards over the past three months. Data for the United Kingdom refer to the net percentage balances for secured credit availability to households and are weighted according to the market share of the participating lenders. Data are only available from the second quarter of 2007 and have been inverted for the purpose of this chart. For the United States, the data series for all residential mortgage loans was discontinued owing to a split into the prime, non-traditional and sub-prime market segments from the April 2007 survey onwards. From the January 2015 survey, prime and non-traditional mortgages are proxied by new mortgage categories introduced in the Senior Loan Offi cer Opinion Survey (SLOOS).
Chart S.1.16Changes in credit standards for loans to smalland medium-sized enterprises(Q1 2003 - Q2 2015; percentages)
-30
-10
-20
0
10
20
40
30
-30
-20
-10
0
20
10
30
40
2004 2006 2008 2010 2012 2004
euro area (loans to small and medium-sized enterprises)United States (commercial and industrial loans to small enterprises)United Kingdom (small and medium-sized enterprises)
Sources: ECB, Federal Reserve System and Bank of England.Notes: Weighted net percentage of banks contributing to the tightening of standards over the past three months. Data for the United Kingdom refer to the net percentage balances for corporate credit availability and are weighted according to the market share of the participating lenders. Data are only available from the second quarter of 2007 and have been inverted for the purpose of this chart.

S5Financial Stability Review, May 2015
Chart S.1.17Changes in residential property prices
(Q1 1999 - Q4 2014; annual percentage changes)
-60
-40
-20
0
20
40
60
-60
-40
-20
0
20
40
60
2000 2002 2004 2006 2008 2010 2012 2014
euro area United States
Sources: National data and ECB calculations.Notes: The target defi nition for residential property prices is total dwellings (whole country), but there are national differences. The hatched/shaded areas indicate the minimum-maximum and interquartile ranges across euro area countries. Euro area data refer to the Euro 19.
Chart S.1.18Changes in commercial property prices
(Q1 2006 - Q4 2014; capital value; annual percentage changes)
2014
euro area
2006 2007 2008 2009 2010 2011 2012 2013-60
-50
-40
-30
-20
-10
0
10
20
30
40
-60
-50
-40
-30
-20
-10
0
10
20
30
40
Sources: Experimental ECB estimates based on IPD data and national data for DE, DK, GR and IT.Notes: The hatched/shaded areas indicate the minimum-maximum and interquartile ranges across euro area countries, except DE, EE, CY, LT, LU, LV, MT, SI, SK and FI. Data for GR are for the offi ce property sector only. Euro area data refer to the Euro 19.

S6Financial Stability Review, May 2015
2 Financial markets
Chart S.2.1Global risk aversion indicator
(3 Jan. 2000 - 15 May 2015)
-4
-2
0
2
4
6
8
10
12
-4
-2
0
2
4
6
8
10
12
2014 Apr.2015
2000 2002 2004 2006 2008 2010 2012 Feb. Mar.
Sources: Bloomberg, Bank of America Merrill Lynch, UBS, Commerzbank and ECB calculations.Notes: The indicator is constructed as the first principal component of five currently available risk aversion indicators. A rise in the indicator denotes an increase of risk aversion. For further details about the methodology used, see “Measuring investors’ risk appetite”, Financial Stability Review, ECB, June 2007.
Chart S.2.2Financial market liquidity indicator for the euroarea and its components(4 Jan. 1999 - 15 May 2015)
-6
-5
-4
-3
-2
-1
0
1
2
3
-6
-5
-4
-3
-2
-1
0
1
2
3
composite indicatorforeign exchange, equity and bond marketsmoney market
2014 Apr.2015
2000 2002 2004 2006 2008 2010 2012 Feb. Mar.
Sources: ECB, Bank of England, Bloomberg, JPMorgan Chase & Co., Moody’s KMVand ECB calculations.Notes: The composite indicator comprises unweighted averages of individual liquidity measures, normalised from 1999 to 2006 for non-money market components and over the period 2000 to 2006 for money market components. The data shown have been exponentially smoothed. For more details, see Box 9 in Financial Stability Review, ECB, June 2007.
Chart S.2.3Spreads between interbank rates and repo rates
(3 Jan. 2003 - 15 May 2015; basis points; one-month maturity; 20-day moving average)
-50
0
50
100
150
200
250
300
-50
0
50
100
150
200
250
300
EURGBP
USDJPY
2014 Apr.2015
2004 2006 2008 2010 2012 Feb. Mar.
Sources: Thomson Reuters, Bloomberg and ECB calculations.Notes: Due to the lack of contributors, the series for GBP stopped in October 2013. The series for EUR stopped on 2 January 2015 due to the discontinuation of the underlying Eurepo index.
Chart S.2.4Spreads between interbank rates and overnightindexed swap rates(1 Jan. 2007 - 15 May 2015; basis points: Three-month maturity)
-50
0
50
100
150
200
250
300
350
400
-50
0
50
100
150
200
250
300
350
400
EURGBP
USDJPY
2008 2010 2012 2014 Feb. Mar. Apr.2015
Sources: Thomson Reuters, Bloomberg and ECB calculations.

S7Financial Stability Review, May 2015
Chart S.2.5Slope of government bond yield curves
(2 Jan. 2006 - 15 May 2015; basis points)
euro area (AAA-rated bonds)euro area (all bonds)United KingdomUnited States
2006 2008 2010 2012 20142015
Feb. Mar. Apr.-100
0
100
200
300
400
-100
0
100
200
300
400
Sources: ECB, Bank for International Settlements, Bank of Englandand Federal Reserve System.Notes: The slope is defi ned as the difference between ten-year and one-year yields. For the euro area and the United States, yield curves are modelled using the Svensson model; a variable roughness penalty model is used to model the yield curve for the United Kingdom.
Chart S.2.6Sovereign credit default swap spreads for euro area countries(1 Jan. 2007 - 15 May 2015; basis points; senior debt; five-year maturity)
median
2014 Apr.2015
2008 2010 2012 Feb. Mar.0
600
1200
1800
2400
3000
4200
3600
0
600
1200
1800
2400
3000
4200
3600
Sources: Thomson Reuters and ECB calculations.Notes: The hatched/shaded areas indicate the minimum-maximum and interquartile ranges across national sovereign CDS spreads in the euro area. Following the decision by the International Swaps and Derivatives Association that a credit event had occurred, Greek sovereign CDSs were not traded between 9 March and 11 April 2012. Due to the lack of contributors, the Greek sovereign CDS spread is not available between 1 March and 21 May 2013. For presentational reasons, this chart has been truncated.
Chart S.2.7iTraxx Europe five-year credit default swap indices
(1 Jan. 2007 - 15 May 2015; basis points)
iTraxx EuropeiTraxx Europe High VolatilityiTraxx Europe Crossover Index (sub-investment-grade reference)
2008 2010 2012 2014 Feb. Mar. Apr.2015
0
200
400
600
800
1,000
1,200
0
200
400
600
800
1,000
1,200
Source: Bloomberg.
Chart S.2.8Spreads over LIBOR of selected European AAA-rated asset-backed securities(26 Jan. 2007 - 15 May 2015; basis points)
RMBS spread rangeauto loansconsumer loanscommercial mortgage-backed securities
2014 Apr.2015
2008 2010 2012 Feb. Mar.0
300
600
900
1200
1500
1800
2100
2400
0
300
600
900
1200
1500
1800
2100
2400
Source: JPMorgan Chase & Co.Note: In the case of residential mortgage-backed securities (RMBSs), the spread range is the range of available individual country spreads in GR, IE, ES, IT, NL, PT and UK.

S8Financial Stability Review, May 2015
Chart S.2.9Price/earnings ratio for the euro area stock market
(3 Jan. 2005 - 15 May 2015; ten-year trailing earnings)
main indexbanking sectornon-financial corporationsinsurance sector
2014 Apr.2015
2006 2008 2010 2012 Feb. Mar.0
5
10
15
20
25
30
0
5
10
15
20
25
30
Sources: Thomson Reuters and ECB calculations.Note: The price/earnings ratio is based on prevailing stock prices relative to an average of the previous ten years of earnings.
Chart S.2.10Equity indices
(2 Jan. 2001 - 15 May 2015; index: Jan. 2001 = 100)
Standard & Poor’s 500 indexStandard & Poor’s 500 Banks indexKBW Bank Sector indexDow Jones EURO STOXX 50 indexDow Jones EURO STOXX Banks index
2002 2004 2006 2008 2010 2012 2014 Feb. Mar. Apr.2015
0
20
40
60
80
100
120
140
160
180
0
20
40
60
80
100
120
140
160
180
Source: Bloomberg.
Chart S.2.11Implied volatilities
(2 Jan. 2001 - 15 May 2015; percentages)
Standard & Poor’s 500 indexKBW Bank Sector indexDow Jones EURO STOXX 50 indexDow Jones EURO STOXX Banks index
2014 Apr.2015
2002 2004 2006 2008 20102012 Feb. Mar.0
20
40
60
80
100
120
140
0
20
40
60
80
100
120
140
Sources: Bloomberg and Thomson Reuters Datastream.
Chart S.2.12Payments settled by the large-value payment systemsTARGET2 and EURO1(Jan. 2004 - Mar. 2015; volumes and values)
2014
volume EURO1 (thousands, left-hand scale)volume TARGET2 (thousands, left-hand scale)value EURO1 (billions, right-hand scale)value TARGET2 (billions, right-hand scale)
2004 2005 2006 2007 2008 2009 2010 2011 2012 2013100
150
200
250
300
350
400
450
500
0
500
1000
1500
2000
2500
3000
3500
Source: ECB.Notes: TARGET2 is the real-time gross settlement system for the euro. TARGET2 is operated in central bank money by the Eurosystem. TARGET2 is the biggest large-value payment system (LVPS) operating in euro. The EBA CLEARING Company’s EURO1 is a euro-denominated net settlement system owned by private banks, which settles the fi nal positions of its participants via TARGET2 at the end of the day. EURO1 is the second-biggest LVPS operating in euro.

S9Financial Stability Review, May 2015
Chart S.2.13Volumes and values of foreign exchange trades settled via the Continuous Linked Settlement Bank(Jan. 2004 - Apr. 2015; volumes and values)
2014
volume of transactions (thousands, left-hand scale)value of transactions (billions equivalent, right-hand scale)
2004 2005 2006 2007 2008 2009 2010 2011 2012 20130
100
200
300
400
500
600
0
500
1000
1500
2000
2500
Source: ECB.Notes: The Continuous Linked Settlement Bank (CLS) is a global fi nancial market infrastructure which offers payment-versus-payment (PvP) settlement of foreign exchange (FX) transactions. Each PvP transaction consists of two legs. The fi gures above count only one leg per transaction. CLS transactions are estimated to cover about 60% of the global FX trading activity.
Chart S.2.14Value of securities held in custody by CSDs and ICSDs
(2013; EUR trillions; settlement in all currencies)
81 2 3 4 5 6 72
3
4
5
6
7
8
9
10
11
2
3
4
5
6
7
8
9
10
11
Source: ECB.Notes: CSDs stands for central securities depositories and ICSDs for international central securities depositories. 1 - Euroclear Bank (BE);2 - Clearstream Banking Frankfurt - CBF (DE); 3 - Euroclear France;4 - Clearstream Banking Luxembourg - CBL; 5 - CRESTCo (UK);6 - Monte Titoli (IT); 7 - Iberclear (ES); 8 - Remaining 40 CSDs in the EU.
Chart S.2.15Value of securities settled by CSDs and ICSDs
(2013; EUR trillions; settlement in all currencies)
81 5 3 4 7 6 20
50
100
150
200
250
300
350
0
50
100
150
200
250
300
350
Source: ECB.Note: See notes of Chart S.2.14.
Chart S.2.16Value of transactions cleared by central counterparties
(2013; EUR trillions)
61 2 3 4 50
100
200
300
0
100
200
300
Source: ECB.Notes: 1 - EUREX Clearing AG (DE); 2 - ICE Clear Europe (UK); 3 - LCHClearnet Ltd; 4 - LCH Clearnet SA (FR); 5 - CC&G (IT); 6 - Others.The chart includes outright and repo transactions, and fi nancial and commodityderivatives.

S10Financial Stability Review, May 2015
3 Financial institutions
Chart S.3.1Return on shareholders’ equity for euro area significant banking groups(2011 - Q1 2015; percentages; 10th and 90th percentile and interquartile range distribution across significant banking groups)
-60
-50
-40
-30
-20
-10
0
10
20
-60
-50
-40
-30
-20
-10
0
10
20
median for euro area large and complex banking groupsmedian for global large and complex banking groups
2011 2013 Q1 14 Q3 14 Q1 152012 2014 Q2 14 Q4 14
Sources: SNL Financial and ECB calculations.Notes: Includes publicly available data for signifi cant banking groups that report annual fi nancial statements and a subset of those banks that report on a quarterly basis. Quarterly fi gures are annualised.
Chart S.3.2Return on risk-weighted assets for euro area significant banking groups(2011 - Q1 2015; percentages; 10th and 90th percentile and interquartile range distribution across significant banking groups)
-6
-5
-4
-3
-2
-1
0
1
2
3
-6
-5
-4
-3
-2
-1
0
1
2
3
median for euro area large and complex banking groupsmedian for global large and complex banking groups
2011 2013 Q1 14 Q3 14 Q1 152012 2014 Q2 14 Q4 14
Sources: SNL Financial and ECB calculations.Notes: Includes publicly available data for signifi cant banking groups that report annual fi nancial statements and a subset of those banks that report on a quarterly basis. Quarterly fi gures are annualised.
Chart S.3.3Breakdown of operating income for euro area significant banking groups(2011 - Q1 2015; percentage of total assets; weighted average)
-1.0
-0.5
0.0
0.5
1.0
1.5
2.0
2.5
3.0
-1.0
-0.5
0.0
0.5
1.0
1.5
2.0
2.5
3.0
loan loss provisions net interest incomenet fee and commission income net trading incomenet other operating income
2011 2013 Q1 14 Q3 14 Q1 152012 2014 Q2 14 Q4 14
Sources: SNL Financial and ECB calculations.Notes: Includes publicly available data for signifi cant banking groups that report annual fi nancial statements and a subset of those banks that report on a quarterly basis. Quarterly results are annualised. Annual and quarterly indicators are based on common samples of 62 and 20 signifi cant banking groups in the euro area, respectively.
Chart S.3.4Diversification of operating income for euro area significant banking groups(2011 - Q1 2015; individual institutions’ standard deviation dispersion; 10th and 90th percentile and interquartile range distribution across significant banking groups)
12
16
20
24
28
32
36
40
12
16
20
24
28
32
36
40
median for euro area large and complex banking groupsmedian for global large and complex banking groups
2011 2013 Q1 14 Q3 14 Q1 152012 2014 Q2 14 Q4 14
Sources: SNL Financial and ECB calculations.Notes: Includes publicly available data for signifi cant banking groups that report annual fi nancial statements and a subset of those banks that report on a quarterly basis.A value of “0” means full diversifi cation, while a value of “50” means concentration on one source only. Annual and quarterly indicators are based on common samples of 65 and 21 signifi cant banking groups in the euro area, respectively.

S11Financial Stability Review, May 2015
Chart S.3.5Actual and forecast earnings per share for euro area significant banking groups(Q1 2008 - Q3 2015; EUR)
-5.0
-4.0
-3.0
-2.0
-1.0
0.0
1.0
2.0
-5.0
-4.0
-3.0
-2.0
-1.0
0.0
1.0
2.0
2015
median for significant banking groupsmedian for euro area large and complex banking groups
2008 2009 2010 2011 2012 2013 2014
Sources: SNL Financial and ECB calculations.Note: The shaded area indicates the interquartile ranges across the diluted earnings per share of selected significant banking groups in the euro area.
Chart S.3.6Lending and deposit spreads of euro area MFIs
(Jan. 2005 - Mar. 2015; percentage points)
-3
-2
-1
0
1
2
3
4
-3
-2
-1
0
1
2
3
4
2014
lending to householdslending to non-financial corporationsdeposits with agreed maturity by non-financial corporationsdeposits with agreed maturity by households
2005 2006 2007 2008 2009 2010 2011 2012 2013
Sources: ECB, Thomson Reuters and ECB calculations.Notes: Lending spreads are calculated as the average of the spreads for the relevant breakdowns of new business loans, using volumes as weights. The individual spreads are the difference between the MFI interest rate for new business loans and the swap rate with a maturity corresponding to the loan category’s initial period of rate fi xation. For deposits with agreed maturity, spreads are calculated as the average of the spreads for the relevant breakdowns by maturity, using new business volumes as weights. The individual spreads are the difference between the swap rate and the MFI interest rate on new deposits, where both have corresponding maturities.
Chart S.3.7Net loan impairment charges for euro area significant banking groups(2011 - Q1 2015; percentage of net interest income; 10th and 90th percentile and interquartile range distribution across significant banking groups)
0
30
60
90
120
150
180
210
0
30
60
90
120
150
180
210
2011 2013 Q1 14 Q3 14 Q1 152012 2014 Q2 14 Q4 14
median for euro area large and complex banking groupsmedian for global large and complex banking groups
Sources: SNL Financial and ECB calculations.Note: Includes publicly available data for signifi cant banking groups that report annual fi nancial statements and a subset of those banks that report on a quarterly basis.
Chart S.3.8Total capital ratios for euro area significant banking groups(2011 - Q1 2015; percentages; 10th and 90th percentile and interquartile range distribution across significant banking groups)
8
10
12
14
16
18
20
22
24
8
10
12
14
16
18
20
22
24
median for euro area large and complex banking groupsmedian for global large and complex banking groups
2011 2013 Q1 14 Q3 14 Q1 152012 2014 Q2 14 Q4 14
Sources: SNL Financial and ECB calculations.Note: Includes publicly available data for signifi cant banking groups that report annual fi nancial statements and a subset of those banks that report on a quarterly basis.

S12Financial Stability Review, May 2015
Chart S.3.9Core Tier 1 capital ratios for euro area significant banking groups
(2011 - Q1 2015; percentages; 10th and 90th percentile and interquartile range distribution across significant banking groups)
median for euro area large and complex banking groupsmedian for global large and complex banking groups
6
8
10
12
14
16
18
20
6
8
10
12
14
16
18
20
20112012 2014
2013 Q1 14 Q3 14Q2 14 Q4 14
Q1 15
Sources: SNL Financial and ECB calculations.Note: Includes publicly available data for significant banking groups that report annual financial statements and a subset of those banks that report on a quarterly basis.
Chart S.3.10Contribution of components of the core Tier 1 capital ratios to changes for euro area significant banking groups(2011 - Q1 2015; percentages)
-1.5
-1.0
-0.5
0.0
0.5
1.0
1.5
7
8
9
10
11
12
13
-
-- -
- - - - -
2011 2013 Q1 14 Q3 14 Q1 152012 2014 Q2 14 Q4 14
risk-weighted assets (left-hand scale)core Tier 1 capital (left-hand scale)core Tier 1 ratio (mean; right-hand scale)
Sources: SNL Financial and ECB calculations.Note: Includes publicly available data for signifi cant banking groups that report annual fi nancial statements and a subset of those banks that report on a quarterly basis. Annual and quarterly indicators are based on common samples of 57 and 21 signifi cant banking groups in the euro area, respectively.
Chart S.3.11Non-performing loan ratios for euro area significant banking groups(2011 - Q1 2015; percentages; 10th and 90th percentile and interquartile range distribution across significant banking groups)
0
5
10
15
20
25
30
35
0
5
10
15
20
25
30
35
median for euro area large and complex banking groupsmedian for global large and complex banking groups
20112012 2014
2013 Q1 14 Q3 14Q2 14 Q4 14
Q1 15
Sources: SNL Financial and ECB calculations.Notes: Includes publicly available data for signifi cant banking groups that report annual fi nancial statements and a subset of those banks that report on a quarterly basis. The non-performing loan ratio is defi ned as the ratio of impaired customer loans to total customer loans.
Chart S.3.12Leverage ratios for euro area significant banking groups(2011 - Q1 2015; percentages; 10th and 90th percentile and interquartile range distribution across significant banking groups)
0
2
4
6
8
10
12
0
2
4
6
8
10
12
median for euro area large and complex banking groupsmedian for global large and complex banking groups
20112012 2014
2013 Q1 14 Q3 14Q2 14 Q4 14
Q1 15
Sources: SNL Financial and ECB calculations.Notes: Includes publicly available data for signifi cant banking groups that report annual fi nancial statements and a subset of those banks that report on a quarterly basis. Leverage is defi ned as the ratio of shareholders’ equity to total assets.

S13Financial Stability Review, May 2015
Chart S.3.13Risk-adjusted leverage ratios for euro area significant banking groups(2011 - Q1 2015; percentages; 10th and 90th percentile and interquartile range distribution across significant banking groups)
4
6
8
10
12
14
16
18
20
22
4
6
8
10
12
14
16
18
20
22
median for euro area large and complex banking groupsmedian for global large and complex banking groups
20112012 2014
2013 Q1 14 Q3 14Q2 14 Q4 14
Q1 15
Sources: SNL Financial and ECB calculations.Notes: Includes publicly available data for signifi cant banking groups that report annual fi nancial statements and a subset of those banks that report on a quarterly basis. Risk-adjusted leverage is defi ned as the ratio of shareholders’ equity to risk-weighted assets.
Chart S.3.14Liquid assets ratios for euro area significant banking groups(2011 - 2014; percentage of total assets; 10th and 90th percentile and interquartile range distribution across significant banking groups)
0
5
10
15
20
25
30
35
40
45
0
5
10
15
20
25
30
35
40
45
median for euro area large and complex banking groupsmedian for global large and complex banking groups
2011 20132012 2014
Sources: SNL Financial and ECB calculations.Notes: Includes publicly available data for signifi cant banking groups that report annual fi nancial statements. Liquid assets comprise cash and cash equivalents as well as trading securities. Quarterly data are not included on account of the inadequate availability of interim results on the date of publication.
Chart S.3.15Customer loan-to-deposit ratios for euro area significant banking groups(2011 - Q1 2015; multiple; 10th and 90th percentile and interquartile range distribution across significant banking groups)
0.5
1.0
1.5
2.0
2.5
3.0
0.5
1.0
1.5
2.0
2.5
3.0
median for euro area large and complex banking groupsmedian for global large and complex banking groups
20112012 2014
2013 Q1 14 Q3 14Q2 14 Q4 14
Q1 15
Sources: SNL Financial and ECB calculations.Note: Includes publicly available data for signifi cant banking groups that report annual fi nancial statements and a subset of those banks that report on a quarterly basis.
Chart S.3.16Interbank borrowing ratio for euro area significant banking groups(2011 - Q1 2015; percentage of total assets; 10th and 90th percentileand interquartile range distribution across significant banking groups)
0
5
10
15
20
25
0
5
10
15
20
25
median for euro area large and complex banking groupsmedian for global large and complex banking groups
20112012 2014
2013 Q1 14 Q3 14Q2 14 Q4 14
Q1 15
Sources: SNL Financial and ECB calculations.Note: Includes publicly available data for signifi cant banking groups that report annual fi nancial statements and a subset of those banks that report on a quarterly basis.

S14Financial Stability Review, May 2015
Chart S.3.17Ratios of short-term funding to loans for euro area significant banking groups(2011 - Q1 2015; percentages; 10th and 90th percentile and interquartile range distribution across significant banking groups)
0
10
20
30
40
50
60
0
10
20
30
40
50
60
20112012
median for euro area large and complex banking groupsmedian for global large and complex banking groups
2013 Q1 14 Q3 14 Q1 152014 Q2 14 Q4 14
Sources: SNL Financial and ECB calculations.Notes: Includes publicly available data for signifi cant banking groups that report annual fi nancial statements and a subset of those banks that report on a quarterly basis. Interbank funding is used as the measure of short-term funding.
Chart S.3.18Issuance profile of long-term debt securities by euroarea significant banking groups(Apr. 2014 - Oct. 2015; EUR billions)
-80
-60
-40
-20
0
20
40
60
-80
-60
-40
-20
0
20
40
60
51024102
corporate bonds medium-term notesasset-backed instruments net issuance
Sources: Dealogic DCM Analytics and ECB calculations.Notes: Net issuance is the total gross issuance minus scheduled redemptions. Dealogic does not trace instruments after their redemption, so that some of the instruments may have been redeemed early. Asset-backed instruments encompass asset-backed and mortgage-backed securities, as well as covered bond instruments.
Chart S.3.19Maturity profile of long-term debt securities for euro area significant banking groups(Jan. 2006 - Apr. 2015; EUR billions)
up to 1 yearover 1 and up to 2 yearsover 2 and up to 5 yearsover 5 and up to 10 yearsmore than 10 years
0
200
400
600
800
1000
1200
1400
1600
1800
0
200
400
600
800
1000
1200
1400
1600
1800
2006 2008 2010 2012 2014 2014 2015
Sources: Dealogic DCM Analytics and ECB calculations.Notes: Data refer to all amounts outstanding at the end of the corresponding month. Long-term debt securities include corporate bonds, medium-term notes, covered bonds, asset-backed securities and mortgage-backed securities with a minimum maturity of 12 months.
Chart S.3.20Issuance of syndicated loans and bonds by euro area banks(Q1 2004 - Q1 2015; EUR billions)
0
50
100
150
200
250
300
350
0
50
100
150
200
250
300
350
2004 2005 2006 2007 2008 2009 2010 2011 2012 2013 2014
bonds (excluding covered bonds, ABSs and MBSs)covered bondssyndicated loans granted to banksABSs and MBSs
Sources: Dealogic DCM Analytics and Loan Analytics and ECB calculations.

S15Financial Stability Review, May 2015
Chart S.3.21Investment income and return on equity for a sampleof large euro area insurers(2012 - Q1 2015; percentages; 10th and 90th percentile and interquartile rangedistribution)
1.0
1.3
1.5
1.8
2.0
2.3
2.5
2.8
3.0
20122013
0
2
4
6
8
10
12
14
16
Investment income(percentage of total assets)
Return onshareholders’ equity (percentages)
2014 Q1 15 2013 Q4 14Q4 14 2012 2014 Q1 15
Sources: Bloomberg, individual institutions’ reports and ECB calculations.Note: Based on available fi gures for 21 euro area insurers and reinsurers.
Chart S.3.22Gross-premium-written growth for a sample of large euro area insurers(2010 - Q1 2015; percentage change per annum; 10th and 90th percentile and interquartile range distribution)
-20
-15
-10
-5
0
5
10
15
20
-20
-15
-10
-5
0
5
10
15
20
20102011
2012 2014 Q4 142013 Q3 14 Q1 15
Sources: Bloomberg, individual institutions’ reports and ECB calculations.Note: Based on available figures for 21 euro area insurers and reinsurers.
Chart S.3.23Distribution of combined ratios for a sample of large euro area insurers(2010 - Q1 2015; percentages; 10th and 90th percentile and interquartile range distribution)
86
88
90
92
94
96
98
100
102
104
106
86
88
90
92
94
96
98
100
102
104
106
20102011
2012 2014 Q4 142013 Q3 14 Q1 15
Sources: Bloomberg, individual institutions’ reports and ECB calculations.Note: Based on available fi gures for 21 euro area insurers and reinsurers.
Chart S.3.24Capital distribution for a sample of large euro area insurers(2010 - Q1 2015; percentage of total assets; 10th and 90th percentile and interquartile range distribution)
5
10
15
20
25
30
35
5
10
15
20
25
30
35
20102011
2012 2014 Q4 142013 Q3 14 Q1 15
Sources: Bloomberg, individual institutions’ reports and ECB calculations.Notes: Capital is the sum of borrowings, preferred equity, minority interests, policyholders’ equity and total common equity. Data are based on available figures for 21 euro area insurers and reinsurers.

S16Financial Stability Review, May 2015
Chart S.3.25Investment distribution for a sample of large euro area insurers(H2 2013 - H2 2014; percentage of total investments; minimum, maximum and interquartile distribution)
0
10
20
30
40
50
60
70
80
0
10
20
30
40
50
60
70
80
H213
Governmentbonds
Corporatebonds
Structuredcredit
Commercialproperty
H214 H114 H213 H214 H114 H213 H214H114 H213 H214 H114 H213 H214 H114
Equity
Sources: Individual institutions’ fi nancial reports and ECB calculations.Notes: Equity exposure data exclude investments in mutual funds. Data are based on available fi gures for 14 euro area insurers and reinsurers.
Chart S.3.26Expected default frequency for banking groups
(Jan. 2005 - Apr. 2015; percentages; weighted average)
0
1
2
3
4
5
20050
1
2
3
4
5
euro area significant banking groupseuro area large and complex banking groupsglobal large and complex banking groups
2006 2007 2008 2009 2010 2011 2012 2013 2014
Sources: Moody’s KMV and ECB calculations.Note: The weighted average is based on the amounts of non-equity liabilities.
Chart S.3.27Credit default swap spreads for euro area significant banking groups(1 Jan. 2008 - 15 May 2015; basis points; senior debt; five-year maturity)
median for euro area significant banking groupsmedian for euro area large and complex banking groupsmedian for global large and complex banking groups
0
400
800
1200
1600
2000
2400
2800
2008 Feb2015
0
400
800
1200
1600
2000
2400
2800
2009 2010 2011 2012 2013 2014 Mar Apr
Sources: Thomson Reuters, Bloomberg and ECB calculations.Note: The hatched/shaded areas indicate the minimum-maximum and interquartile ranges across the CDS spreads of selected large banks. For presentational reasons, this chart has been truncated.
Chart S.3.28Credit default swap spreads for a sample of large euro area insurers(3 Jan. 2007 - 15 May 2015; basis points; senior debt; five-year maturity)
median
0
100
200
300
400
500
600
0
100
200
300
400
500
600
20142015
2008 2010 2012 AprFeb Mar
Sources: Thomson Reuters, Bloomberg and ECB calculations.Note: The hatched/shaded areas indicate the minimum-maximum and interquartile ranges across the CDS spreads of selected large insurers.

S17Financial Stability Review, May 2015
Chart S.3.29Stock performance of euro area significant banking groups(3 Jan. 2007 - 15 May 2015; index: 2 Jan. 2007 = 100)
median for euro area significant banking groupsmedian for euro area large and complex banking groupsmedian for global large and complex banking groups
0
20
40
60
80
100
120
140
160
180
0
20
40
60
80
100
120
140
160
180
20142015
2008 2010 2012 Feb Mar Apr
Sources: Thomson Reuters, Bloomberg and ECB calculations.Note: The hatched/shaded areas indicate the minimum-maximum and interquartile ranges across equities of significant banking groups.
Chart S.3.30Stock performance of a sample of large euro area insurers(3 Jan. 2007 - 15 May 2015; index: 2 Jan. 2007 = 100)
median
0
50
100
150
200
250
300
0
50
100
150
200
250
300
20142015
2008 2010 2012 Feb Mar Apr
Sources: Thomson Reuters, Bloomberg and ECB calculations.Note: The hatched/shaded areas indicate the minimum-maximum and interquartile ranges across equities of selected large insurers.

Abbreviations Countries AT Austria
BE Belgium
BG Bulgaria
CH Switzerland
CY Cyprus
CZ Czech Republic
DK Denmark
DE Germany
EE Estonia
IE Ireland
ES Spain
FI Finland
FR France
GR Greece
HR Croatia
HU Hungary
IT Italy
JP Japan
LT Lithuania
LU Luxembourg
LV Latvia
MT Malta
NL Netherlands
PL Poland
PT Portugal
RO Romania
SE Sweden
SI Slovenia
SK Slovakia
UK United Kingdom
US United States
Others ABCP asset-backed commercial paper
ABS asset-backed security
ARM adjustable rate mortgage
AuM assets under management
BCBS Basel Committee on Banking Supervision
BIS Bank for International Settlements
BLS bank lending survey
BRRD Bank Recovery and Resolution Directive
CAPM capital asset pricing model
CBPP covered bond purchase programme
CCP central counterparty
CDO collateralised debt obligation
CDS credit default swap
CET1 common equity Tier 1
CISS composite indicator of systemic stress
CLO collateralised loan obligation
CMBS commercial mortgage-backed security
CPI Consumer Price Index
CRD Capital Requirements Directive
CRR Capital Requirements Regulation
CSD central securities depository
CT1 core Tier 1
DGS deposit guarantee scheme
DSGE dynamic stochastic general equilibrium (model)
EBA European Banking Authority
EDF expected default frequency
EEA European Economic Area
EFSF European Financial Stability Facility
EFSM European Financial Stabilisation Mechanism
EIOPA European Insurance and Occupational Pensions Authority
EMEs emerging market economies
EMIR European Market Infrastructure Regulation
EMU Economic and Monetary Union
EONIA euro overnight index average
EPS earnings per share
ESA 2010 European System of Accounts 2010
ESAs European Supervisory Authorities
ESFS European System of Financial Supervision
ESM European Stability Mechanism
ESMA European Securities and Markets Authority
ESRB European Systemic Risk Board
ETF exchange-traded fund
EU European Union
EUR euro
EURIBOR euro interbank offered rate
FiCoD Financial Conglomerates Directive
FMIs financial market infrastructures
FSI financial stress index
FSR Financial Stability Review
FVA fair value accounting
FX foreign exchange
G-SIB global systemically important bank
G-SII global systemically important institution/insurer
HICP Harmonised Index of Consumer Prices
ICPFs insurance corporations and pension funds
IFRS International Financial Reporting Standards
IMF International Monetary Fund

JPY Japanese yen
LBO leveraged buyout
LCBG large and complex banking group
LCR liquidity coverage ratio
LGD loss given default
LTD loan-to-deposit (ratio)
LTI loan-to-income (ratio)
LTV loan-to-value (ratio)
MBS mortgage-backed security
MFI monetary financial institution
MMF money market fund
MReit mortgage real estate investment trust
MRO main refinancing operation
NAV net asset value
NFC non-financial corporation
NiGEM National institute Global Economic Model
NPE non-performing exposure
NPL non-performing loan
OECD Organisation for Economic Co-operation and Development
OFIs other financial intermediaries
OIS overnight index swap
OMTs Outright Monetary Transactions
O-SIIs other systemically important institutions
OTC over-the-counter
P/E price/earnings (ratio)
PD probability of default
RMBS residential mortgage-backed security
ROA return on assets
ROE return on equity
RWA risk-weighted assets
SBG significant banking group
SIFI systemically important financial institution
SIPS systemically important payment system
SIV structured investment vehicle
SMEs small and medium-sized enterprises
SMP Securities Markets Programme
SPV special-purpose vehicle
SRM Single Resolution Mechanism
SSM Single Supervisory Mechanism
SWF sovereign wealth fund
TLTRO targeted longer-term refinancing operation
USD US dollar
VaR value at risk
© European Central Bank, 2015 Postal address 60640 Frankfurt am Main, Germany Telephone +49 69 1344 0 Internet www.ecb.europa.eu All rights reserved. Reproduction for educational and non-commercial purposes is permitted provided that the source is acknowledged. Unless otherwise stated, this document uses data available as at 15 May 2015. ISSN 1830-2025 (epub and online) EU catalogue number QB-XU-15-001-EN-E (epub) EU catalogue number QB-XU-15-001-EN-N (online)