
Financial Stability Review - European Central Bank · Financial Stability Review, November 2019 –...
129
Financial Stability Review November 2019
Transcript of Financial Stability Review - European Central Bank · Financial Stability Review, November 2019 –...

Financial Stability Review
November 2019

Financial Stability Review, November 2019 – Contents
1
Contents
Foreword 3
Overview 4
1 Macro-financial and credit environment 15
1.1 Weaker economic outlook amid elevated uncertainty 15
1.2 Near-term sovereign debt sustainability concerns mitigated by favourable financing conditions 19
1.3 Euro area households’ resilience supported by low interest rates 22
1.4 Emerging pockets of corporate sector vulnerabilities 25
1.5 Diverging residential and commercial real estate cycles 29
Box 1 Explaining cross-border transactions in euro area commercial real estate markets 31
2 Financial Markets 34
2.1 Rally in safer asset markets 34
2.2 Riskier asset prices reliant on low rates 39
Box 2 Valuations in corporate bond and equity markets 43
3 Euro area banking sector 48
3.1 Increased challenges to the profitability of the sector 48
Box 3 Implications of bank misconduct costs for bank equity returns and valuations 54
Box 4 Climate risk-related disclosures of banks and insurers and their market impact 64
3.2 Evaluating the resilience of the euro area banking sector 72
Box 5 The ECB’s new euro area banking sector macro-micro model 73
4 Non-bank financial sector 78
4.1 Non-banks increased risk-taking while facing profitability challenges in the low interest rate environment 78
Box 6 Investment funds and the transmission of the global financial cycle to the euro area 80
Financial Stability Review, November 2019 – Contents
2
4.2 Euro area bond funds continue to expand and increase liquidity risk 86
Box 7 Portfolio rebalancing by euro area investment funds following outflows 88
4.3 Stable outlook for euro area insurers, despite the challenge from low yields 92
5 Macroprudential policy issues 97
5.1 Activating macroprudential instruments to counter vulnerabilities in the euro area financial system 97
Box 8 Macroprudential policy and powers within the Eurosystem 99
5.2 Tackling structurally weak bank profitability 102
5.3 Developing macroprudential measures to enhance the resilience of euro area capital market financing 103
5.4 Responding to climate change-related financial stability risks 106
Special features 107
Euro area bank profitability: where can consolidation help? 107 A
Assessing the systemic footprint of euro area banks 119 B
Financial Stability Review, November 2019 – Foreword
3
Foreword
The Financial Stability Review (FSR) assesses developments relevant for financial stability, including identifying and prioritising the main sources of systemic risk and vulnerabilities for the euro area financial system. It does so to promote awareness of these systemic risks among policymakers, the financial industry and the public at large, with the ultimate goal of promoting financial stability.
Financial stability can be defined as a condition in which the financial system – which comprises financial intermediaries, markets and market infrastructures – is capable of withstanding shocks and the unravelling of financial imbalances. This mitigates the likelihood of disruptions in the financial intermediation process that are systemic, that is, severe enough to trigger a material contraction of real economic activity.
The FSR also plays an important role in relation to the ECB’s microprudential and macroprudential competences. By providing a financial system-wide assessment of risks and vulnerabilities, the Review provides key input to the ECB’s macroprudential policy analysis. Such a euro area system-wide dimension is an important complement to microprudential banking supervision, which is more focused on the soundness of individual institutions. While the ECB’s roles in the macroprudential and microprudential domains have a predominant banking sector focus, the FSR examines the risks and vulnerabilities of the financial system at large, including – in addition to banks – activities involving non-bank financial intermediaries.
In addition to its usual overview of current developments relevant for euro area financial stability, this Review includes two special features aimed at deepening the ECB’s financial stability analysis and broadening the basis for macroprudential policymaking. The first special feature focuses on the weakest performers in the euro area banking sector and evaluates the scope for bank consolidation to be a remedy for bank profitability challenges. The second discusses ways in which the measurement of the systemic footprint of euro area banks can be complemented with a set of new indicators.
The Review has been prepared with the involvement of the ESCB Financial Stability Committee, which assists the decision-making bodies of the ECB in the fulfilment of their tasks.
Luis de Guindos Vice-President of the European Central Bank
Financial Stability Review, November 2019 – Overview
4
Overview
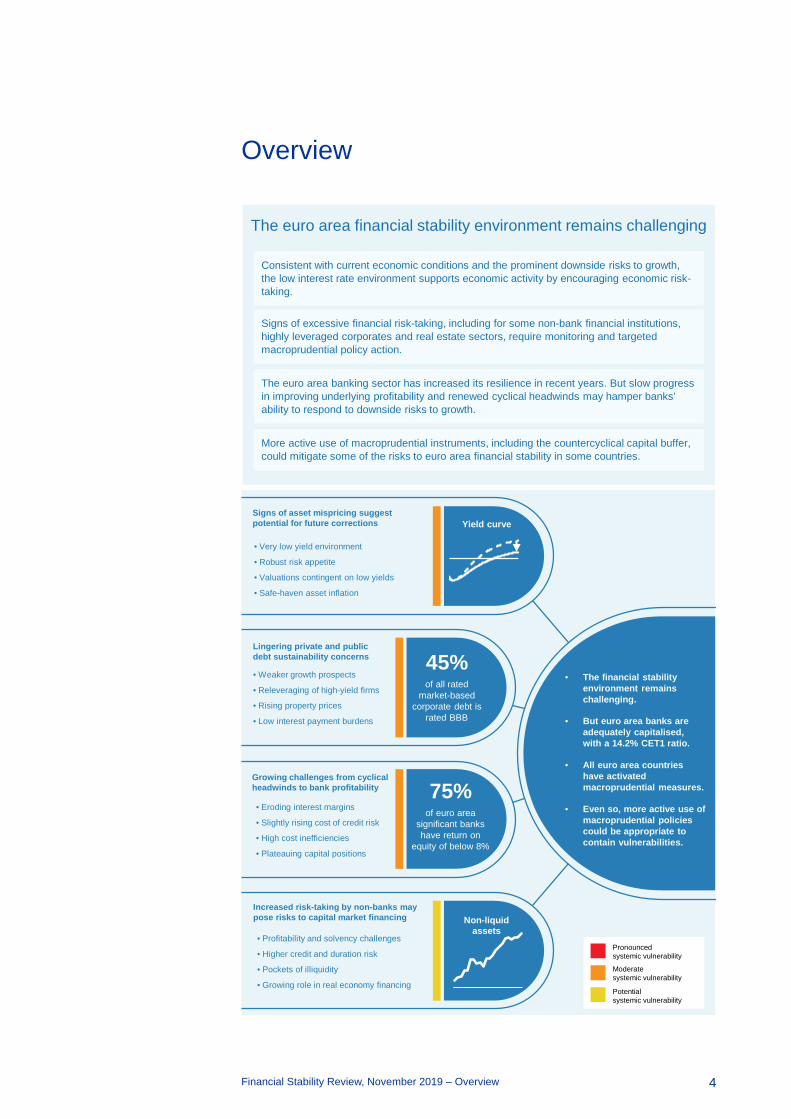
The euro area financial stability environment remains challenging
Consistent with current economic conditions and the prominent downside risks to growth, the low interest rate environment supports economic activity by encouraging economic risk-taking.
Signs of excessive financial risk-taking, including for some non-bank financial institutions, highly leveraged corporates and real estate sectors, require monitoring and targeted macroprudential policy action.
The euro area banking sector has increased its resilience in recent years. But slow progress in improving underlying profitability and renewed cyclical headwinds may hamper banks’ ability to respond to downside risks to growth.
More active use of macroprudential instruments, including the countercyclical capital buffer, could mitigate some of the risks to euro area financial stability in some countries.
Lingering private and public debt sustainability concerns
• Weaker growth prospects
• Releveraging of high-yield firms
• Rising property prices
• Low interest payment burdens
Signs of asset mispricing suggest potential for future corrections
• Very low yield environment
• Robust risk appetite
• Valuations contingent on low yields
• Safe-haven asset inflation
Increased risk-taking by non-banks may pose risks to capital market financing
• Profitability and solvency challenges
• Higher credit and duration risk
• Pockets of illiquidity
• Growing role in real economy financing
Growing challenges from cyclical headwinds to bank profitability
• Eroding interest margins
• Slightly rising cost of credit risk
• High cost inefficiencies
• Plateauing capital positions
Pronouncedsystemic vulnerability
Moderatesystemic vulnerability
Potentialsystemic vulnerability
• The financial stability environment remains challenging.
• But euro area banks are adequately capitalised, with a 14.2% CET1 ratio.
• All euro area countries have activated macroprudential measures.
• Even so, more active use of macroprudential policies could be appropriate to contain vulnerabilities.
Non-liquid assets
45%of all rated
market-based corporate debt is
rated BBB
75%of euro area
significant banks have return on
equity of below 8%
Yield curve
Financial Stability Review, November 2019 – Overview
5
Amid prominent downside risks to economic growth, low interest rates support economic risk-taking and near-term debt sustainability
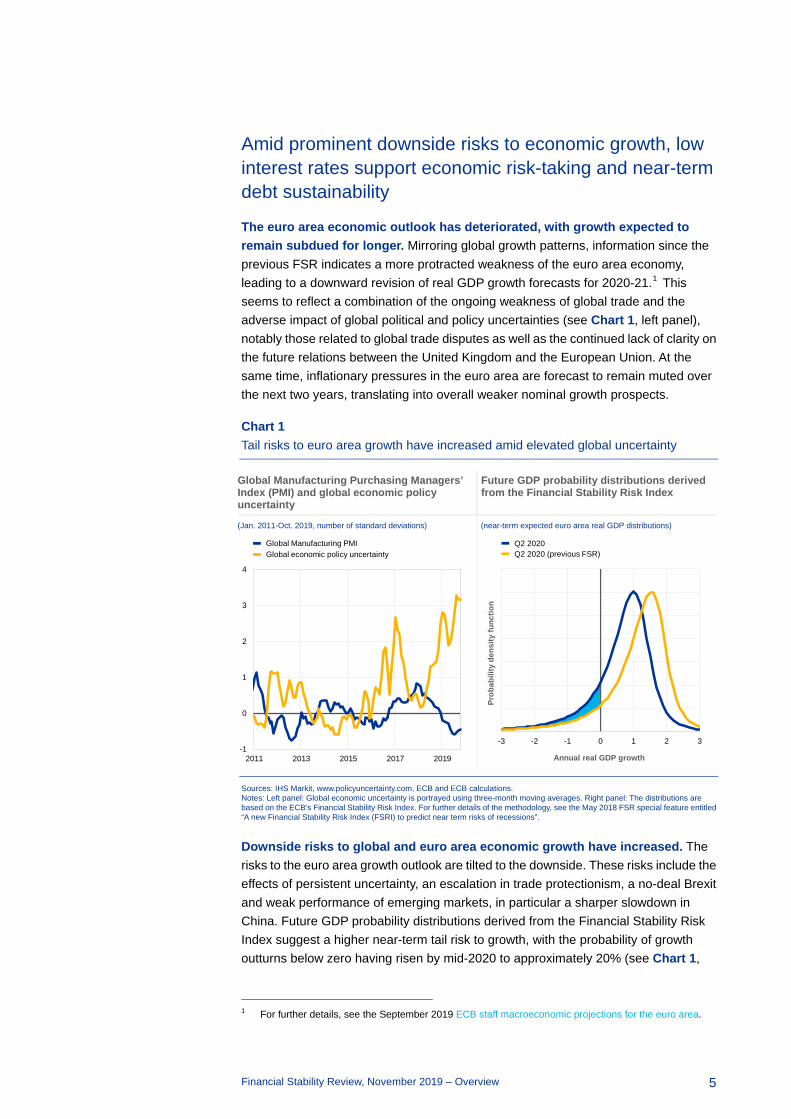
The euro area economic outlook has deteriorated, with growth expected to remain subdued for longer. Mirroring global growth patterns, information since the previous FSR indicates a more protracted weakness of the euro area economy, leading to a downward revision of real GDP growth forecasts for 2020-21.1 This seems to reflect a combination of the ongoing weakness of global trade and the adverse impact of global political and policy uncertainties (see Chart 1, left panel), notably those related to global trade disputes as well as the continued lack of clarity on the future relations between the United Kingdom and the European Union. At the same time, inflationary pressures in the euro area are forecast to remain muted over the next two years, translating into overall weaker nominal growth prospects.
Chart 1 Tail risks to euro area growth have increased amid elevated global uncertainty
Global Manufacturing Purchasing Managers’ Index (PMI) and global economic policy uncertainty
Future GDP probability distributions derived from the Financial Stability Risk Index
(Jan. 2011-Oct. 2019, number of standard deviations) (near-term expected euro area real GDP distributions)
Sources: IHS Markit, www.policyuncertainty.com, ECB and ECB calculations. Notes: Left panel: Global economic uncertainty is portrayed using three-month moving averages. Right panel: The distributions are based on the ECB’s Financial Stability Risk Index. For further details of the methodology, see the May 2018 FSR special feature entitled “A new Financial Stability Risk Index (FSRI) to predict near term risks of recessions”.
Downside risks to global and euro area economic growth have increased. The risks to the euro area growth outlook are tilted to the downside. These risks include the effects of persistent uncertainty, an escalation in trade protectionism, a no-deal Brexit and weak performance of emerging markets, in particular a sharper slowdown in China. Future GDP probability distributions derived from the Financial Stability Risk Index suggest a higher near-term tail risk to growth, with the probability of growth outturns below zero having risen by mid-2020 to approximately 20% (see Chart 1,
1 For further details, see the September 2019 ECB staff macroeconomic projections for the euro area.
2011 2013 2015 2017 2019-1
0
1
2
3
4
Global Manufacturing PMIGlobal economic policy uncertainty
-3 -2 -1 0 1 2 3
Prob
abili
ty d
ensi
ty fu
nctio
n
Q2 2020Q2 2020 (previous FSR)
Annual real GDP growth

Financial Stability Review, November 2019 – Overview
6
right panel), in line with growing near-term recession risks suggested by market-based indicators (see Chart 2.7, right panel).
Risk-free rates have fallen, reflecting accommodative monetary policies and policy expectations. Action taken by the ECB’s Governing Council and the US Federal Open Market Committee in their respective September meetings extended market expectations that short-term rates would remain low. Since May benchmark yields in the United States and the euro area have declined sharply, with both short-term rate expectations and term premia reaching multi-year lows over the summer (see Chart 2, left panel). Global sovereign yield curves have flattened and shifted downwards (see Chart 2, right panel), with the yields up to ten years of many euro area sovereigns turning negative.
Chart 2 Downward pressure on global bond yields at all maturities has intensified in the United States and the euro area since the May 2019 FSR
Estimated term premia in the euro area and the United States
German and US yield curves in May and November 2019
(1 Jan. 2013-12 Nov. 2019, percentages) (years, percentages)
Sources: Federal Reserve Bank of New York and Bloomberg.
Favourable financing conditions continue to mitigate sovereign risks at the current juncture. However, if economic conditions worsen significantly, underlying fiscal vulnerabilities may come to the fore again in those euro area countries with more fragile public finances. Similarly, renewed political and policy uncertainties could trigger a reassessment of sovereign risk and reignite pressures on more vulnerable sovereigns. In view of the weakening economic outlook and the continued prominence of downside risks, there is a strong case for governments with fiscal space to act in an effective and timely manner. In euro area countries with high debt levels and only limited or no fiscal room for manoeuvre, fiscal policy can support economic recovery through a more growth-friendly composition of public finances. Shifting expenditure to the most growth-enhancing categories or the tax burden to less distortive taxes can positively affect output growth and strengthen fiscal buffers.
-1.5
-1.0
-0.5
0.0
0.5
1.0
1.5
2.0
2013 2014 2015 2016 2017 2018 2019
Euro areaUnited States
-1.0
-0.5
0.0
0.5
1.0
1.5
2.0
2.5
3.0
0 5 10 15 20 25 30
Yiel
d
Maturity
German yield curve (May 2019)German yield curve (November 2019)US yield curve (May 2019)US yield curve (November 2019)
Financial Stability Review, November 2019 – Overview
7
Asset valuations, reliant on low interest rates, could face future corrections
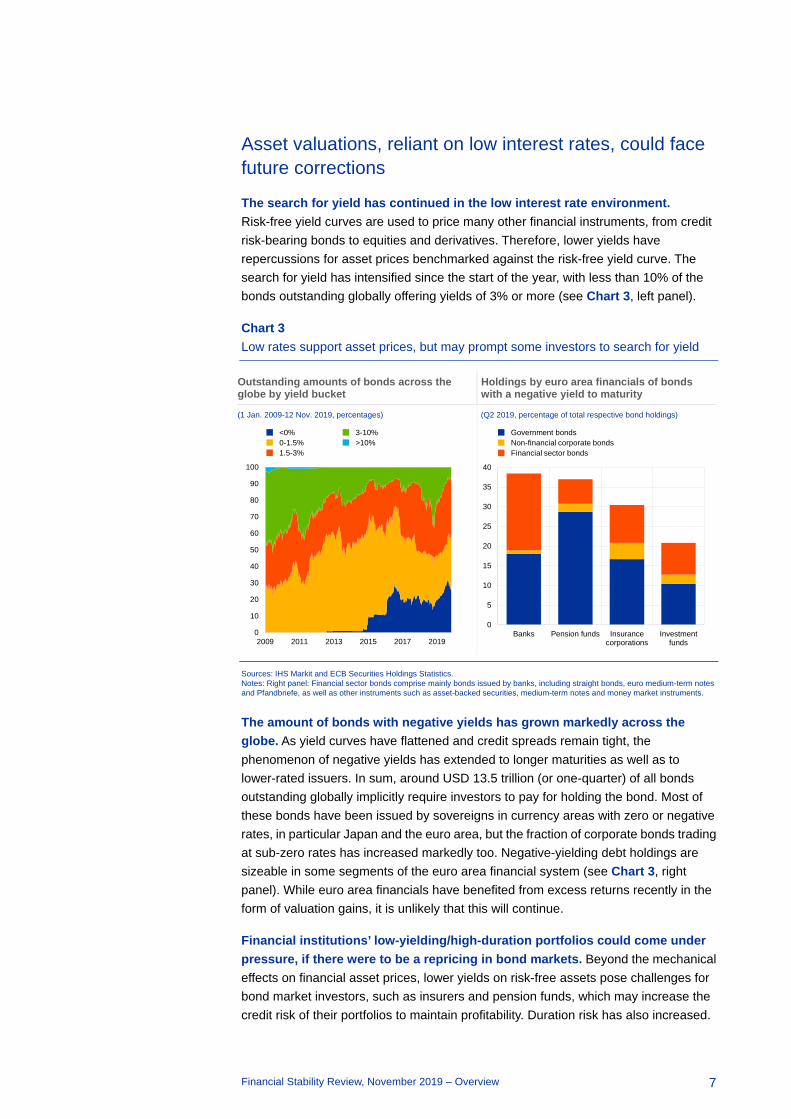
The search for yield has continued in the low interest rate environment. Risk-free yield curves are used to price many other financial instruments, from credit risk-bearing bonds to equities and derivatives. Therefore, lower yields have repercussions for asset prices benchmarked against the risk-free yield curve. The search for yield has intensified since the start of the year, with less than 10% of the bonds outstanding globally offering yields of 3% or more (see Chart 3, left panel).
Chart 3 Low rates support asset prices, but may prompt some investors to search for yield
Outstanding amounts of bonds across the globe by yield bucket
Holdings by euro area financials of bonds with a negative yield to maturity
(1 Jan. 2009-12 Nov. 2019, percentages) (Q2 2019, percentage of total respective bond holdings)
Sources: IHS Markit and ECB Securities Holdings Statistics. Notes: Right panel: Financial sector bonds comprise mainly bonds issued by banks, including straight bonds, euro medium-term notes and Pfandbriefe, as well as other instruments such as asset-backed securities, medium-term notes and money market instruments.
The amount of bonds with negative yields has grown markedly across the globe. As yield curves have flattened and credit spreads remain tight, the phenomenon of negative yields has extended to longer maturities as well as to lower-rated issuers. In sum, around USD 13.5 trillion (or one-quarter) of all bonds outstanding globally implicitly require investors to pay for holding the bond. Most of these bonds have been issued by sovereigns in currency areas with zero or negative rates, in particular Japan and the euro area, but the fraction of corporate bonds trading at sub-zero rates has increased markedly too. Negative-yielding debt holdings are sizeable in some segments of the euro area financial system (see Chart 3, right panel). While euro area financials have benefited from excess returns recently in the form of valuation gains, it is unlikely that this will continue.
Financial institutions’ low-yielding/high-duration portfolios could come under pressure, if there were to be a repricing in bond markets. Beyond the mechanical effects on financial asset prices, lower yields on risk-free assets pose challenges for bond market investors, such as insurers and pension funds, which may increase the credit risk of their portfolios to maintain profitability. Duration risk has also increased.
0
10
20
30
40
50
60
70
80
90
100
2009 2011 2013 2015 2017 2019
<0%0-1.5%1.5-3%
3-10%>10%
0
5
10
15
20
25
30
35
40
Banks Pension funds Insurancecorporations
Investmentfunds
Government bondsNon-financial corporate bondsFinancial sector bonds
Financial Stability Review, November 2019 – Overview
8
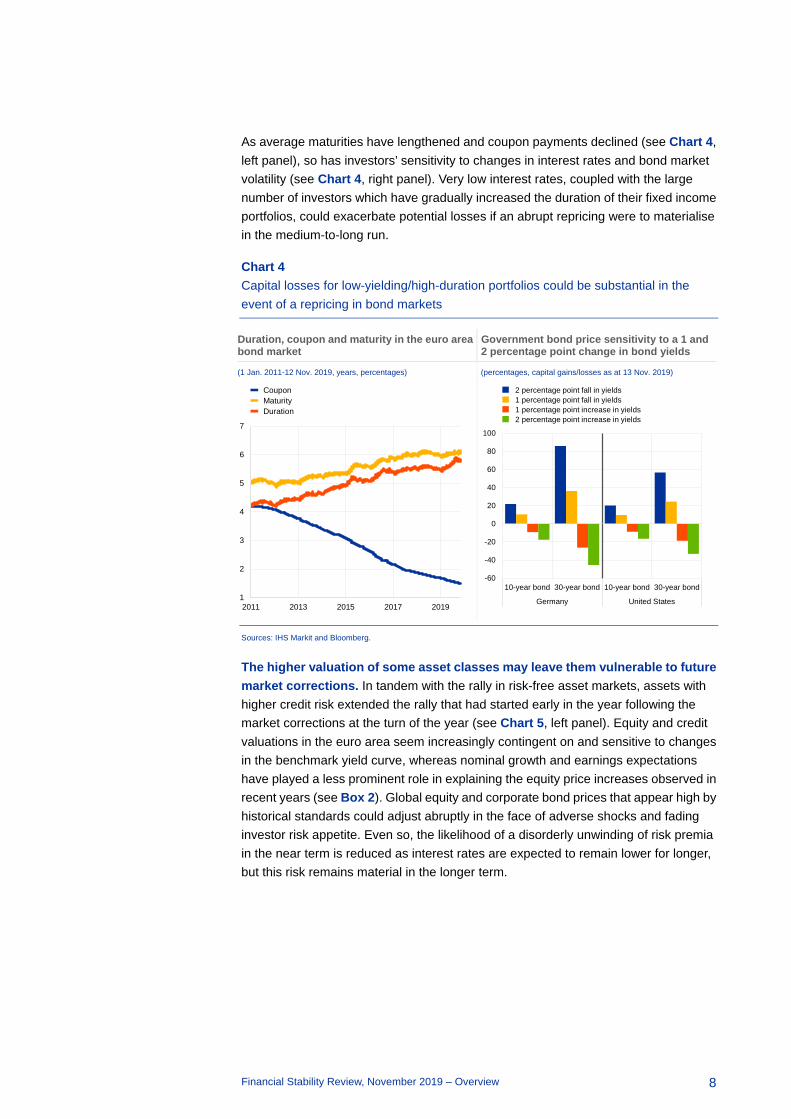
As average maturities have lengthened and coupon payments declined (see Chart 4, left panel), so has investors’ sensitivity to changes in interest rates and bond market volatility (see Chart 4, right panel). Very low interest rates, coupled with the large number of investors which have gradually increased the duration of their fixed income portfolios, could exacerbate potential losses if an abrupt repricing were to materialise in the medium-to-long run.
Chart 4 Capital losses for low-yielding/high-duration portfolios could be substantial in the event of a repricing in bond markets
Duration, coupon and maturity in the euro area bond market
Government bond price sensitivity to a 1 and 2 percentage point change in bond yields
(1 Jan. 2011-12 Nov. 2019, years, percentages) (percentages, capital gains/losses as at 13 Nov. 2019)
Sources: IHS Markit and Bloomberg.
The higher valuation of some asset classes may leave them vulnerable to future market corrections. In tandem with the rally in risk-free asset markets, assets with higher credit risk extended the rally that had started early in the year following the market corrections at the turn of the year (see Chart 5, left panel). Equity and credit valuations in the euro area seem increasingly contingent on and sensitive to changes in the benchmark yield curve, whereas nominal growth and earnings expectations have played a less prominent role in explaining the equity price increases observed in recent years (see Box 2). Global equity and corporate bond prices that appear high by historical standards could adjust abruptly in the face of adverse shocks and fading investor risk appetite. Even so, the likelihood of a disorderly unwinding of risk premia in the near term is reduced as interest rates are expected to remain lower for longer, but this risk remains material in the longer term.
1
2
3
4
5
6
7
2011 2013 2015 2017 2019
CouponMaturityDuration
-60
-40
-20
0
20
40
60
80
100
10-year bond 30-year bond 10-year bond 30-year bond
Germany United States
2 percentage point fall in yields1 percentage point fall in yields1 percentage point increase in yields2 percentage point increase in yields
Financial Stability Review, November 2019 – Overview
9
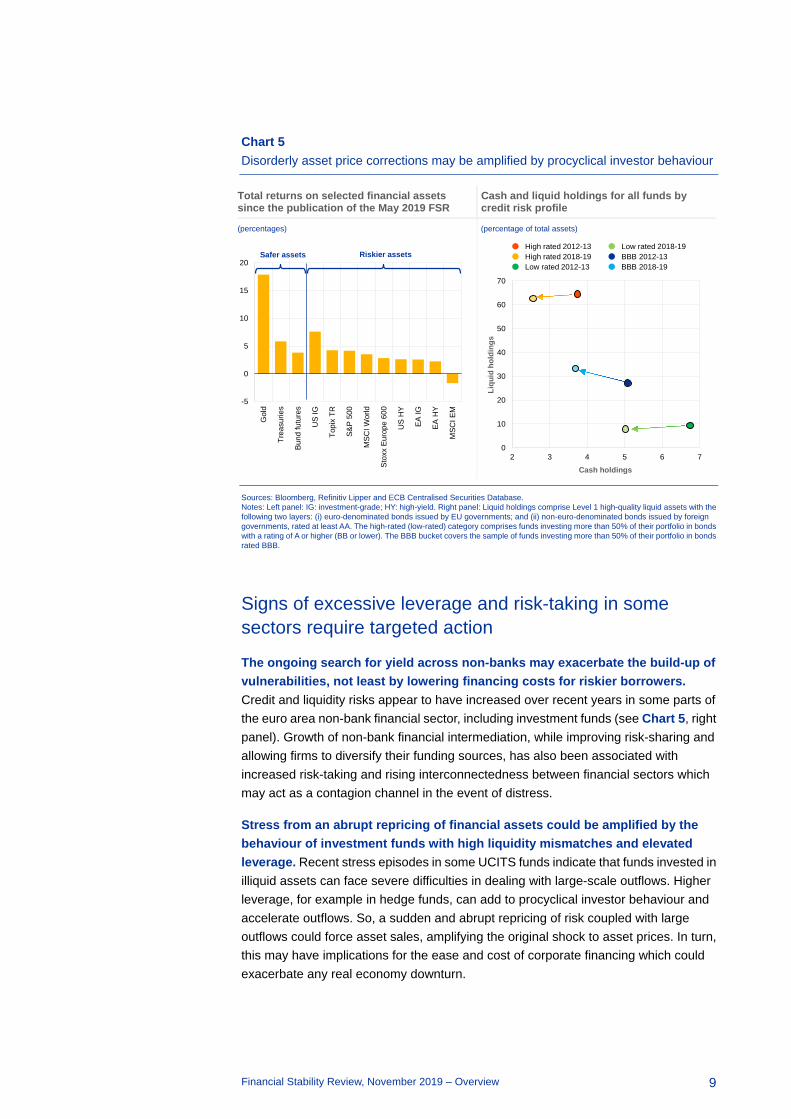
Chart 5 Disorderly asset price corrections may be amplified by procyclical investor behaviour
Total returns on selected financial assets since the publication of the May 2019 FSR
Cash and liquid holdings for all funds by credit risk profile
(percentages) (percentage of total assets)
Sources: Bloomberg, Refinitiv Lipper and ECB Centralised Securities Database. Notes: Left panel: IG: investment-grade; HY: high-yield. Right panel: Liquid holdings comprise Level 1 high-quality liquid assets with the following two layers: (i) euro-denominated bonds issued by EU governments; and (ii) non-euro-denominated bonds issued by foreign governments, rated at least AA. The high-rated (low-rated) category comprises funds investing more than 50% of their portfolio in bonds with a rating of A or higher (BB or lower). The BBB bucket covers the sample of funds investing more than 50% of their portfolio in bonds rated BBB.
Signs of excessive leverage and risk-taking in some sectors require targeted action
The ongoing search for yield across non-banks may exacerbate the build-up of vulnerabilities, not least by lowering financing costs for riskier borrowers. Credit and liquidity risks appear to have increased over recent years in some parts of the euro area non-bank financial sector, including investment funds (see Chart 5, right panel). Growth of non-bank financial intermediation, while improving risk-sharing and allowing firms to diversify their funding sources, has also been associated with increased risk-taking and rising interconnectedness between financial sectors which may act as a contagion channel in the event of distress.
Stress from an abrupt repricing of financial assets could be amplified by the behaviour of investment funds with high liquidity mismatches and elevated leverage. Recent stress episodes in some UCITS funds indicate that funds invested in illiquid assets can face severe difficulties in dealing with large-scale outflows. Higher leverage, for example in hedge funds, can add to procyclical investor behaviour and accelerate outflows. So, a sudden and abrupt repricing of risk coupled with large outflows could force asset sales, amplifying the original shock to asset prices. In turn, this may have implications for the ease and cost of corporate financing which could exacerbate any real economy downturn.
-5
0
5
10
15
20G
old
Trea
surie
s
Bund
futu
res
US
IG
Topi
x TR
S&P
500
MSC
I Wor
ld
Stox
x Eu
rope
600
US
HY
EA IG
EA H
Y
MSC
I EM
Safer assets Riskier assets
0
10
20
30
40
50
60
70
2 3 4 5 6 7
Liqu
id h
oldi
ngs
Cash holdings
High rated 2012-13High rated 2018-19Low rated 2012-13
Low rated 2018-19BBB 2012-13BBB 2018-19

Financial Stability Review, November 2019 – Overview
10
Beyond supporting economic growth, low funding costs might also lead to higher leverage among riskier firms. The lower and flatter term structure has reduced significantly market-based funding costs for corporates, facilitating higher levels of leverage. In particular, the share of high-yield and lower-rated investment-grade issuances – many involving highly leveraged firms – has risen in recent years. The tendency among firms to increase leverage and secure low financing costs is also reflected in the changing maturity and credit risk structure of corporate bond issuance (see Chapter 2). In general, highly leveraged firms are more likely to be downgraded during economic downturns than their less leveraged counterparts. Downgrade risk has increased in view of a deteriorating economic outlook, indicating higher funding costs and possible rollover risks going forward, primarily for the very large lower-rated investment-grade segment (see Chart 6, left panel), where downgrades are associated with a distinct increase in average credit spreads.
Chart 6 Pockets of vulnerability in the non-financial corporate sector as well as property markets warrant close monitoring
Outstanding euro area corporate debt by issuer rating and changes since 2007
Growth in residential property prices and mortgage lending in the euro area
(2007, 2018, € trillions, percentages) (Q3 2015-Q2 2019, 4-year annual percentage changes)
Sources: S&P Global Market Intelligence, ECB and ECB calculations. Notes: Left panel: Downgraded/upgraded debt refers to corporate debt that was rated higher/lower than BBB in 2007. New entrants refer to firms that entered the market/obtained a BBB rating after 2007. Right panel: The bubble size indicates the household debt-to-GDP ratio. Dark blue bubbles indicate countries that have applied borrower-based macroprudential measures such as collateral or income-based limits. Light blue bubbles refer to countries which have applied risk weights to residential property exposures. Countries coloured grey have applied both types of measures. Measures related to the countercyclical capital, systemic risk or O-SII buffers are not captured. White bubbles indicate countries which have not applied any macroprudential residential real estate measures.
Developments in euro area property markets warrant monitoring in a prolonged low interest rate environment. Buttressed by the low interest rate environment, the euro area residential real estate sector continued its gradual expansion. The recently issued ESRB warnings and recommendations with regard to residential real estate vulnerabilities suggest that continued strong price dynamics, coupled with relatively buoyant mortgage lending growth and high household indebtedness, represent key vulnerabilities in a number of countries (see Chart 6, right panel). Alongside decreasing transaction volumes, commercial real estate price growth has shown signs
BBB
HY
A and above 1.2
0.54
0.48
0.1
0.70
0.95
2018
2007
Downgraded37.5%
Unchanged28.3%
New entrants(since 2007)
29.7%
Upgraded4.6%
AT
BE
CY
DE
EE
ES
FI
FRGR
IE
IT
LT
LU
LV
MT
NL
PT
SI SK
-2
0
2
4
6
8
10
-6 -3 0 3 6 9 12 15 18
4-ye
ar a
nnua
l rea
l res
iden
tial r
eal e
stat
e pr
ice
grow
th
4-year annual real mortgage lending growth

Financial Stability Review, November 2019 – Overview
11
of slowing, indicating that the commercial real estate cycle may be turning. Valuations also seem stretched following a strong upswing, supported by the search for yield by foreign investors, in particular US investment funds. Being more sensitive to changes in global financial conditions, foreign investors might make domestic commercial real estate markets more exposed to a sharp or disorderly adjustment (see Box 1).
Targeted macroprudential policy measures are in place to address vulnerabilities in the banking sector and real estate markets, but the toolkit for non-banks needs to be further developed. Where available and warranted, macroprudential policy can increase the resilience of the financial sector while containing the build-up of financial imbalances. For example, various macroprudential instruments, such as capital buffer requirements for banks or controls on the terms of lending, can help mitigate risks to financial stability in property markets at the country level. Most euro area countries have already introduced such measures, but given its macroprudential mandate, the ECB is also monitoring property market developments with a view to assessing the appropriateness of capital-based national macroprudential measures in accordance with the SSM Regulation (see Chapter 5). As for non-bank financial institutions, the macroprudential toolkit is still in its infancy and needs to be further developed. Thus, pockets of vulnerability outside the traditional banking system cannot be effectively addressed by the macroprudential measures taken to date.
While the banking sector is resilient to near-term risks, challenges from a more subdued profitability outlook remain
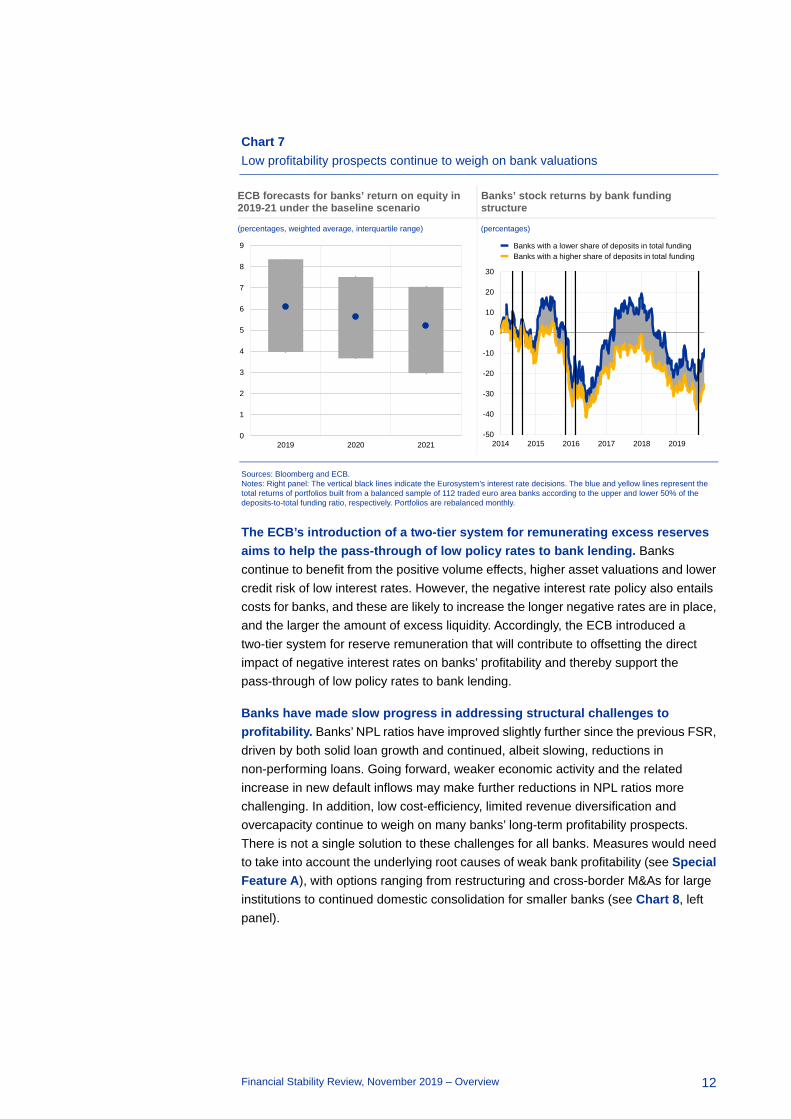
Bank profitability concerns remain prominent. Bank profitability prospects have weakened against the backdrop of the deteriorating growth outlook (see Chart 7, left panel) and the low interest rate environment, especially for banks also facing structural cost and income challenges (see Special Feature A). Reflecting these concerns, euro area banks’ market valuations remain depressed with an average price-to-book ratio of around 0.6. Alongside structural factors, such as legacy non-performing loan (NPL) problems and cost-efficiency, banks’ funding structure appears to have also played a role in shaping market perceptions of banks (see Chart 7, right panel). Moreover, misconduct costs continue to be an additional factor weighing on bank equity valuations (see Box 3), while inconsistent disclosures may be making it difficult for markets to price banks’ climate-related risks (see Box 4).
Financial Stability Review, November 2019 – Overview
12
Chart 7 Low profitability prospects continue to weigh on bank valuations
ECB forecasts for banks’ return on equity in 2019-21 under the baseline scenario
Banks’ stock returns by bank funding structure
(percentages, weighted average, interquartile range) (percentages)
Sources: Bloomberg and ECB. Notes: Right panel: The vertical black lines indicate the Eurosystem’s interest rate decisions. The blue and yellow lines represent the total returns of portfolios built from a balanced sample of 112 traded euro area banks according to the upper and lower 50% of the deposits-to-total funding ratio, respectively. Portfolios are rebalanced monthly.
The ECB’s introduction of a two-tier system for remunerating excess reserves aims to help the pass-through of low policy rates to bank lending. Banks continue to benefit from the positive volume effects, higher asset valuations and lower credit risk of low interest rates. However, the negative interest rate policy also entails costs for banks, and these are likely to increase the longer negative rates are in place, and the larger the amount of excess liquidity. Accordingly, the ECB introduced a two-tier system for reserve remuneration that will contribute to offsetting the direct impact of negative interest rates on banks’ profitability and thereby support the pass-through of low policy rates to bank lending.
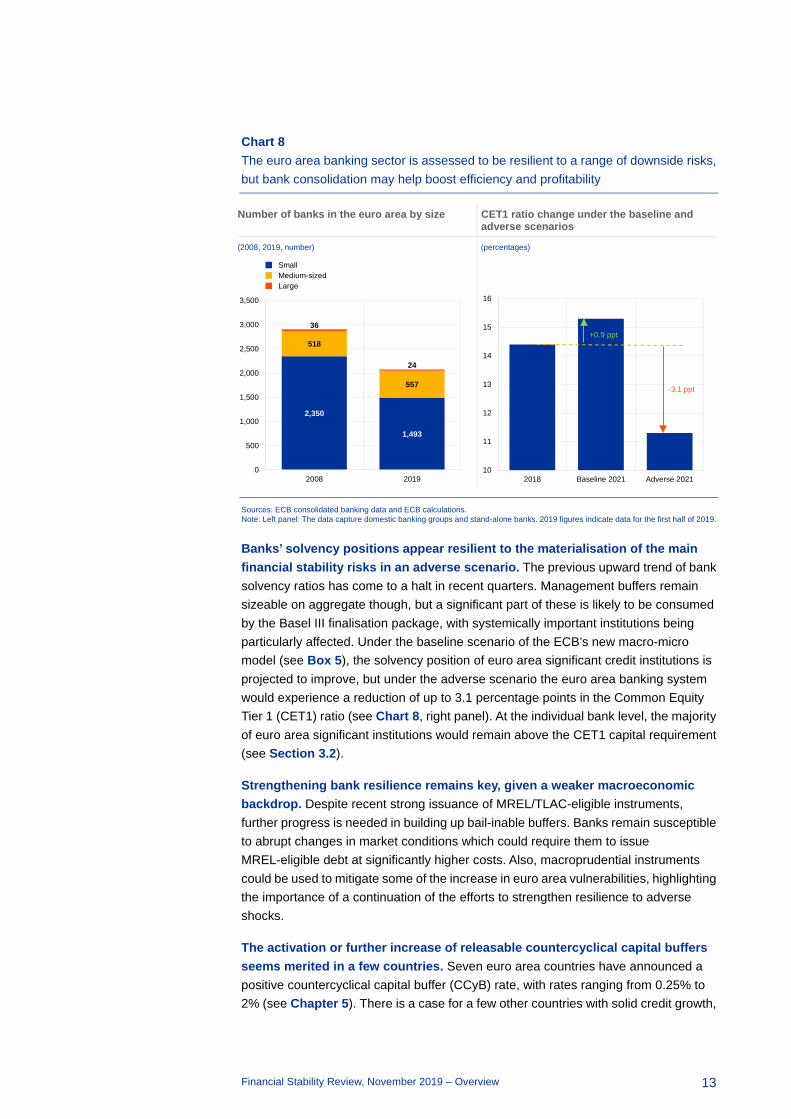
Banks have made slow progress in addressing structural challenges to profitability. Banks’ NPL ratios have improved slightly further since the previous FSR, driven by both solid loan growth and continued, albeit slowing, reductions in non-performing loans. Going forward, weaker economic activity and the related increase in new default inflows may make further reductions in NPL ratios more challenging. In addition, low cost-efficiency, limited revenue diversification and overcapacity continue to weigh on many banks’ long-term profitability prospects. There is not a single solution to these challenges for all banks. Measures would need to take into account the underlying root causes of weak bank profitability (see Special Feature A), with options ranging from restructuring and cross-border M&As for large institutions to continued domestic consolidation for smaller banks (see Chart 8, left panel).
0
1
2
3
4
5
6
7
8
9
2019 2020 2021-50
-40
-30
-20
-10
0
10
20
30
2014 2015 2016 2017 2018 2019
Banks with a lower share of deposits in total fundingBanks with a higher share of deposits in total funding
Financial Stability Review, November 2019 – Overview
13
Chart 8 The euro area banking sector is assessed to be resilient to a range of downside risks, but bank consolidation may help boost efficiency and profitability
Number of banks in the euro area by size CET1 ratio change under the baseline and adverse scenarios
(2008, 2019, number) (percentages)
Sources: ECB consolidated banking data and ECB calculations. Note: Left panel: The data capture domestic banking groups and stand-alone banks. 2019 figures indicate data for the first half of 2019.
Banks’ solvency positions appear resilient to the materialisation of the main financial stability risks in an adverse scenario. The previous upward trend of bank solvency ratios has come to a halt in recent quarters. Management buffers remain sizeable on aggregate though, but a significant part of these is likely to be consumed by the Basel III finalisation package, with systemically important institutions being particularly affected. Under the baseline scenario of the ECB’s new macro-micro model (see Box 5), the solvency position of euro area significant credit institutions is projected to improve, but under the adverse scenario the euro area banking system would experience a reduction of up to 3.1 percentage points in the Common Equity Tier 1 (CET1) ratio (see Chart 8, right panel). At the individual bank level, the majority of euro area significant institutions would remain above the CET1 capital requirement (see Section 3.2).
Strengthening bank resilience remains key, given a weaker macroeconomic backdrop. Despite recent strong issuance of MREL/TLAC-eligible instruments, further progress is needed in building up bail-inable buffers. Banks remain susceptible to abrupt changes in market conditions which could require them to issue MREL-eligible debt at significantly higher costs. Also, macroprudential instruments could be used to mitigate some of the increase in euro area vulnerabilities, highlighting the importance of a continuation of the efforts to strengthen resilience to adverse shocks.
The activation or further increase of releasable countercyclical capital buffers seems merited in a few countries. Seven euro area countries have announced a positive countercyclical capital buffer (CCyB) rate, with rates ranging from 0.25% to 2% (see Chapter 5). There is a case for a few other countries with solid credit growth,
2,350
1,493
518
557
36
24
0
500
1,000
1,500
2,000
2,500
3,000
3,500
2008 2019
SmallMedium-sizedLarge
10
11
12
13
14
15
16
2018 Baseline 2021 Adverse 2021
+0.9 ppt
-3.1 ppt

Financial Stability Review, November 2019 – Overview
14
increasing debt levels and signs of an underpricing of risks to consider activating the CCyB. In general, a greater availability of a releasable buffer in the form of a CCyB would be useful in the euro area. Unlike structural capital requirements, the CCyB can be released in a downturn and can provide banks with room to avoid the excessive deleveraging that turns a stress episode into a crisis. This would call for a rebalancing of the current capital requirements towards a more prominent role for the CCyB.
Identified vulnerabilities could unravel in the medium-to-long run
There remain four key vulnerabilities for euro area financial stability. These are (i) mispricing of some financial assets; (ii) high public and private sector indebtedness in several countries; (iii) hampered bank intermediation capacity in view of banks’ subdued profitability outlook; and (iv) increased risk-taking in the non-bank financial sector. While bank profitability challenges appear to have increased since the previous FSR, the likelihood of the other three vulnerabilities materialising in the near term appears largely unchanged, not least as the low interest rate environment mitigates many of the possible triggers for corrections over the short-to-medium term. Beyond the near-term horizon, however, there is a risk that the identified vulnerabilities could unravel in a disorderly manner. Macroprudential policies can help contain many of these vulnerabilities and should be used more actively in some countries. But further progress is still needed to develop macroprudential tools for non-banks.

Financial Stability Review, November 2019 – Macro-financial and credit environment
15
1 Macro-financial and credit environment
1.1 Weaker economic outlook amid elevated uncertainty
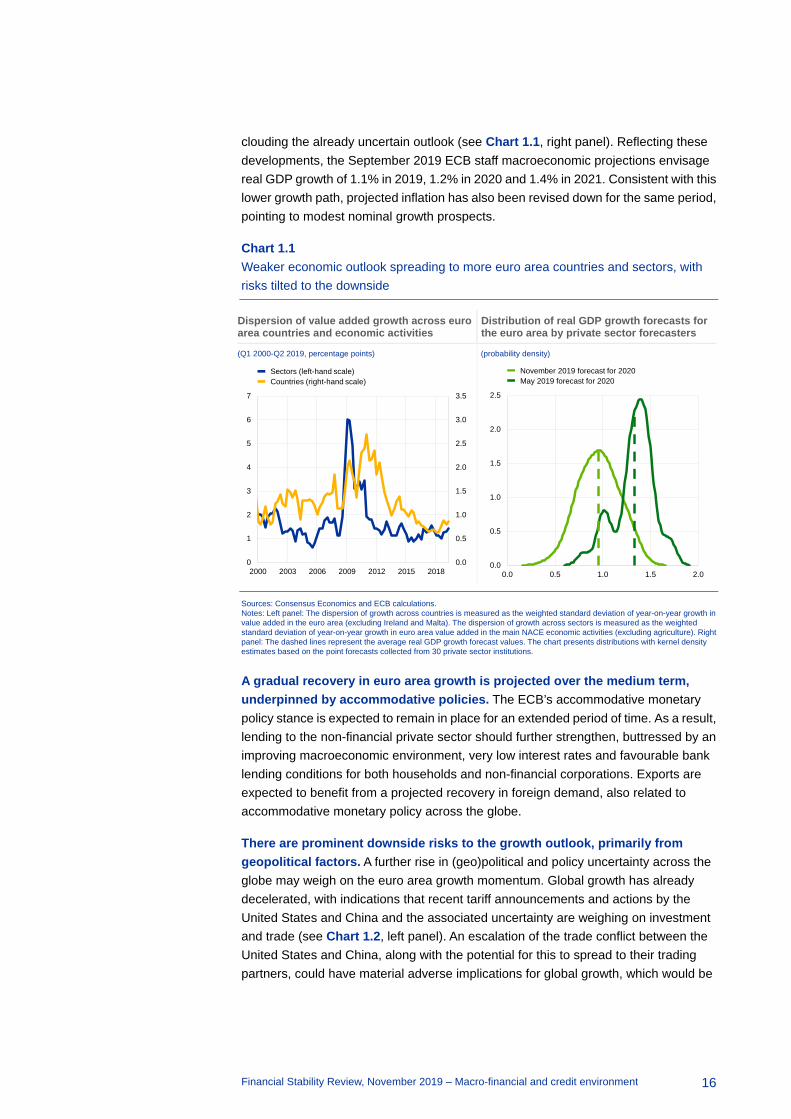
Euro area economic growth is expected to remain subdued in the near term. Real GDP growth remained moderate in the first half of 2019 and survey-based data suggest a slight deceleration in the second half of 2019. Much of the slowdown stems from the current weakness of international trade in an environment of elevated and prolonged global political and policy uncertainty, which has had a particularly adverse impact on the manufacturing sector. Since the start of the year, the weakness has spread to more countries and sectors within the euro area (see Chart 1.1, left panel),
Releveraging of high-yield firms
Weaker growth prospects
Low interest payment burdens
Lingering private and public debt sustainability concerns
• Weaker growth prospects
• Releveraging of high-yield firms
• Rising property prices
• Low interest payment burdens
2020 real GDP growth
-0.4 ppt
1.2%
Rising property prices
4%
2016 2017 2018
Leverage of HY firms
45%of all rated market-
based corporate debt is rated BBB
2011 2019
NFCs
Households
Gross interest paymentsHouse price growth (ytd)
Financial Stability Review, November 2019 – Macro-financial and credit environment
16
clouding the already uncertain outlook (see Chart 1.1, right panel). Reflecting these developments, the September 2019 ECB staff macroeconomic projections envisage real GDP growth of 1.1% in 2019, 1.2% in 2020 and 1.4% in 2021. Consistent with this lower growth path, projected inflation has also been revised down for the same period, pointing to modest nominal growth prospects.
Chart 1.1 Weaker economic outlook spreading to more euro area countries and sectors, with risks tilted to the downside
Dispersion of value added growth across euro area countries and economic activities
Distribution of real GDP growth forecasts for the euro area by private sector forecasters
(Q1 2000-Q2 2019, percentage points) (probability density)
Sources: Consensus Economics and ECB calculations. Notes: Left panel: The dispersion of growth across countries is measured as the weighted standard deviation of year-on-year growth in value added in the euro area (excluding Ireland and Malta). The dispersion of growth across sectors is measured as the weighted standard deviation of year-on-year growth in euro area value added in the main NACE economic activities (excluding agriculture). Right panel: The dashed lines represent the average real GDP growth forecast values. The chart presents distributions with kernel density estimates based on the point forecasts collected from 30 private sector institutions.
A gradual recovery in euro area growth is projected over the medium term, underpinned by accommodative policies. The ECB’s accommodative monetary policy stance is expected to remain in place for an extended period of time. As a result, lending to the non-financial private sector should further strengthen, buttressed by an improving macroeconomic environment, very low interest rates and favourable bank lending conditions for both households and non-financial corporations. Exports are expected to benefit from a projected recovery in foreign demand, also related to accommodative monetary policy across the globe.
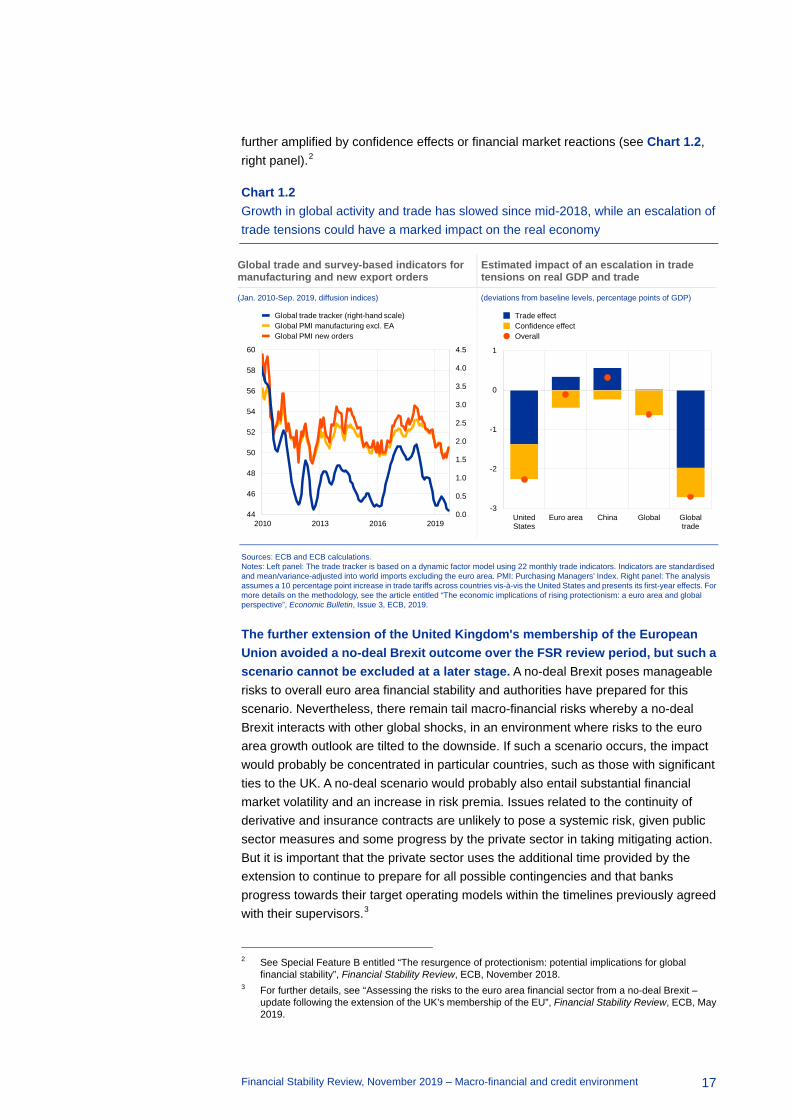
There are prominent downside risks to the growth outlook, primarily from geopolitical factors. A further rise in (geo)political and policy uncertainty across the globe may weigh on the euro area growth momentum. Global growth has already decelerated, with indications that recent tariff announcements and actions by the United States and China and the associated uncertainty are weighing on investment and trade (see Chart 1.2, left panel). An escalation of the trade conflict between the United States and China, along with the potential for this to spread to their trading partners, could have material adverse implications for global growth, which would be
0.0
0.5
1.0
1.5
2.0
2.5
3.0
3.5
0
1
2
3
4
5
6
7
2000 2003 2006 2009 2012 2015 2018
Sectors (left-hand scale)Countries (right-hand scale)
0.0
0.5
1.0
1.5
2.0
2.5
0.0 0.5 1.0 1.5 2.0
November 2019 forecast for 2020May 2019 forecast for 2020
Financial Stability Review, November 2019 – Macro-financial and credit environment
17
further amplified by confidence effects or financial market reactions (see Chart 1.2, right panel).2
Chart 1.2 Growth in global activity and trade has slowed since mid-2018, while an escalation of trade tensions could have a marked impact on the real economy
Global trade and survey-based indicators for manufacturing and new export orders
Estimated impact of an escalation in trade tensions on real GDP and trade
(Jan. 2010-Sep. 2019, diffusion indices) (deviations from baseline levels, percentage points of GDP)
Sources: ECB and ECB calculations. Notes: Left panel: The trade tracker is based on a dynamic factor model using 22 monthly trade indicators. Indicators are standardised and mean/variance-adjusted into world imports excluding the euro area. PMI: Purchasing Managers’ Index. Right panel: The analysis assumes a 10 percentage point increase in trade tariffs across countries vis-à-vis the United States and presents its first-year effects. For more details on the methodology, see the article entitled “The economic implications of rising protectionism: a euro area and global perspective”, Economic Bulletin, Issue 3, ECB, 2019.
The further extension of the United Kingdom's membership of the European Union avoided a no-deal Brexit outcome over the FSR review period, but such a scenario cannot be excluded at a later stage. A no-deal Brexit poses manageable risks to overall euro area financial stability and authorities have prepared for this scenario. Nevertheless, there remain tail macro-financial risks whereby a no-deal Brexit interacts with other global shocks, in an environment where risks to the euro area growth outlook are tilted to the downside. If such a scenario occurs, the impact would probably be concentrated in particular countries, such as those with significant ties to the UK. A no-deal scenario would probably also entail substantial financial market volatility and an increase in risk premia. Issues related to the continuity of derivative and insurance contracts are unlikely to pose a systemic risk, given public sector measures and some progress by the private sector in taking mitigating action. But it is important that the private sector uses the additional time provided by the extension to continue to prepare for all possible contingencies and that banks progress towards their target operating models within the timelines previously agreed with their supervisors.3
2 See Special Feature B entitled “The resurgence of protectionism: potential implications for global
financial stability”, Financial Stability Review, ECB, November 2018. 3 For further details, see “Assessing the risks to the euro area financial sector from a no-deal Brexit –
update following the extension of the UK’s membership of the EU”, Financial Stability Review, ECB, May 2019.
0.0
0.5
1.0
1.5
2.0
2.5
3.0
3.5
4.0
4.5
44
46
48
50
52
54
56
58
60
2010 2013 2016 2019
Global trade tracker (right-hand scale)Global PMI manufacturing excl. EAGlobal PMI new orders
-3
-2
-1
0
1
UnitedStates
Euro area China Global Globaltrade
Trade effectConfidence effectOverall
Financial Stability Review, November 2019 – Macro-financial and credit environment
18
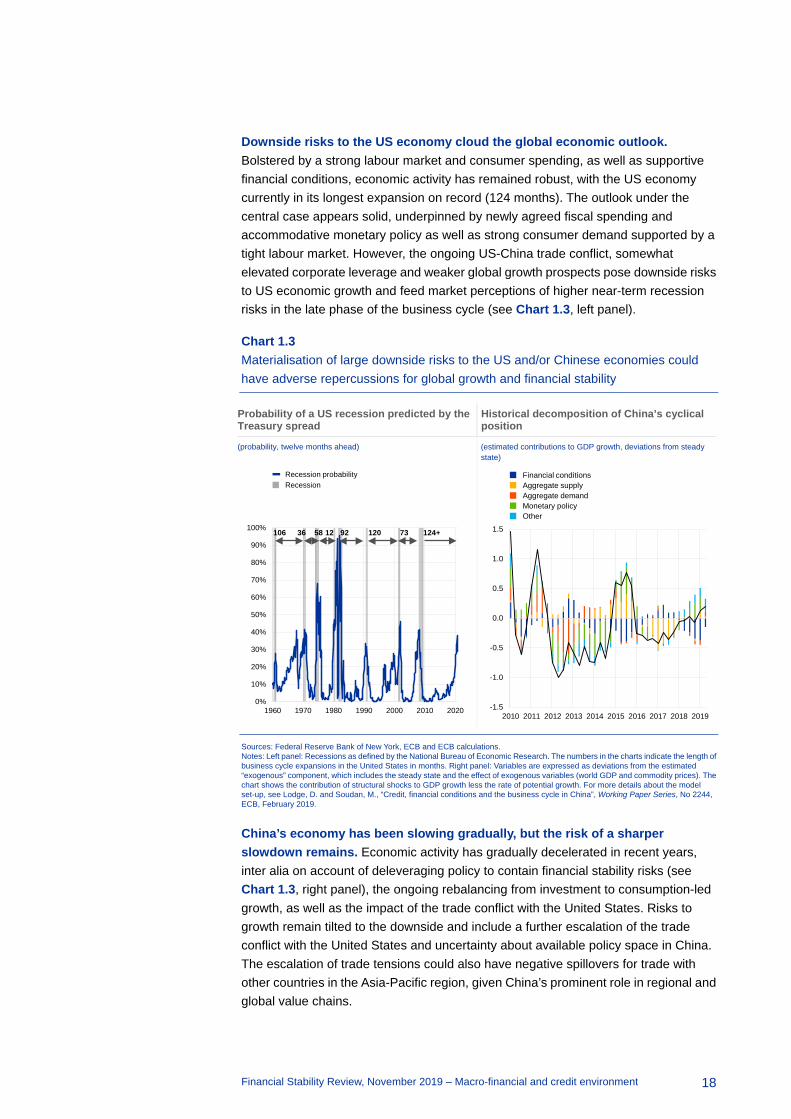
Downside risks to the US economy cloud the global economic outlook. Bolstered by a strong labour market and consumer spending, as well as supportive financial conditions, economic activity has remained robust, with the US economy currently in its longest expansion on record (124 months). The outlook under the central case appears solid, underpinned by newly agreed fiscal spending and accommodative monetary policy as well as strong consumer demand supported by a tight labour market. However, the ongoing US-China trade conflict, somewhat elevated corporate leverage and weaker global growth prospects pose downside risks to US economic growth and feed market perceptions of higher near-term recession risks in the late phase of the business cycle (see Chart 1.3, left panel).
Chart 1.3 Materialisation of large downside risks to the US and/or Chinese economies could have adverse repercussions for global growth and financial stability
Probability of a US recession predicted by the Treasury spread
Historical decomposition of China’s cyclical position
(probability, twelve months ahead) (estimated contributions to GDP growth, deviations from steady state)
Sources: Federal Reserve Bank of New York, ECB and ECB calculations. Notes: Left panel: Recessions as defined by the National Bureau of Economic Research. The numbers in the charts indicate the length of business cycle expansions in the United States in months. Right panel: Variables are expressed as deviations from the estimated “exogenous” component, which includes the steady state and the effect of exogenous variables (world GDP and commodity prices). The chart shows the contribution of structural shocks to GDP growth less the rate of potential growth. For more details about the model set-up, see Lodge, D. and Soudan, M., “Credit, financial conditions and the business cycle in China”, Working Paper Series, No 2244, ECB, February 2019.
China’s economy has been slowing gradually, but the risk of a sharper slowdown remains. Economic activity has gradually decelerated in recent years, inter alia on account of deleveraging policy to contain financial stability risks (see Chart 1.3, right panel), the ongoing rebalancing from investment to consumption-led growth, as well as the impact of the trade conflict with the United States. Risks to growth remain tilted to the downside and include a further escalation of the trade conflict with the United States and uncertainty about available policy space in China. The escalation of trade tensions could also have negative spillovers for trade with other countries in the Asia-Pacific region, given China’s prominent role in regional and global value chains.
0%
10%
20%
30%
40%
50%
60%
70%
80%
90%
100%
1960 1970 1980 1990 2000 2010 2020
12036 58106 92 124+7312
Recession probabilityRecession
-1.5
-1.0
-0.5
0.0
0.5
1.0
1.5
2010 2011 2012 2013 2014 2015 2016 2017 2018 2019
Financial conditionsAggregate supplyAggregate demand Monetary policyOther

Financial Stability Review, November 2019 – Macro-financial and credit environment
19
The materialisation of these risks to global and euro area economic growth could create challenges for financial stability. A more severe and protracted economic downturn could weaken corporate profits and household incomes, putting pressure on the ability of households and companies to service debts. Given the high level of indebtedness lingering particularly in the non-financial sector in some countries, this could further squeeze consumption and investment spending or lead to losses for lenders. Similarly, government finances, particularly for some vulnerable countries, could come under renewed stress. A severe global downturn could also be amplified by existing vulnerabilities in the financial system, if it were to prompt sharp adjustments in asset prices and a disorderly unwinding of global search-for-yield flows.
1.2 Near-term sovereign debt sustainability concerns mitigated by favourable financing conditions
Despite a deteriorating macroeconomic environment, public debt positions appear manageable currently. In line with the slowdown of the economy, the euro area aggregate fiscal stance has become slightly expansionary over 2019 and is expected to remain so over the medium term (see Chart 1.4, left panel). Although still at an elevated level exceeding 85% of GDP, public debt is projected to remain on aggregate on a downward trajectory, reflecting in part a favourable interest rate-growth differential associated with favourable financing conditions. In view of the weakening economic outlook and the continued prominence of downside risks, governments with fiscal space should act in an adequate, effective and timely manner (see Chart 1.4, right panel). In high-debt countries, governments need to pursue prudent policies that will create the conditions for automatic stabilisers to operate freely. All countries should intensify efforts to achieve a more growth-friendly composition of public finances.

Financial Stability Review, November 2019 – Macro-financial and credit environment
20
Chart 1.4 A mildly expansionary fiscal stance provides some support to economic activity, but a number of countries have more fiscal space available
Fiscal stance and output gap across the euro area
Estimates of fiscal space in individual euro area countries
(2006-21, percentage of GDP) (2020, percentage of GDP)
Sources: European Commission, ECB and ECB calculations. Notes: Left panel: The fiscal stance is measured by the change in the cyclically adjusted primary budget balance. Right panel: The blue bars indicate the estimated distance of structural fiscal balances from country-specific medium-term objectives in 2020. The yellow dots indicate the distance of general government debt-to-GDP ratios from the 60% of GDP threshold as defined by the Maastricht criteria.
Sovereign risk is mitigated by favourable financing conditions and accumulated liquidity buffers. Supported by the renewed Eurosystem asset purchase programme, pricing conditions for the vast majority of euro area countries have remained benign. Taking advantage of low rates, countries with higher sovereign risk have prolonged their debt maturity profile, reducing to some extent the vulnerability to abrupt changes in market sentiment. Moreover, the financial assets accumulated by euro area sovereigns, particularly liquid assets in the form of cash and debt securities, should help withstand potential temporary market stress.
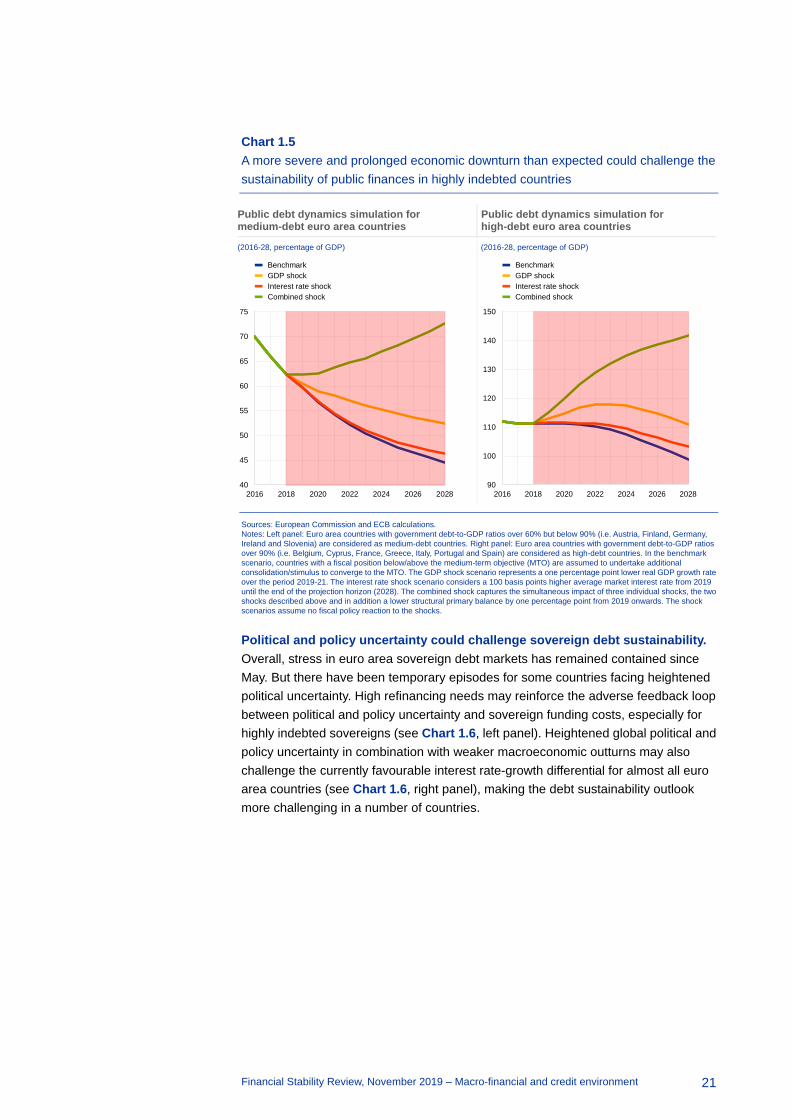
Under a more severe and protracted economic downturn scenario, risks to debt sustainability would increase, particularly in highly indebted countries. Both medium and high-debt countries’ positions are vulnerable to a more pronounced or prolonged economic slowdown (see Chart 1.5). Furthermore, if a severe economic slowdown caused risk premia to increase, this could exacerbate the economic downturn, with an adverse impact on debt dynamics. The combined effect of lower growth and higher premia, accompanied by fiscal relaxation, could potentially compromise debt sustainability for both groups, with the deterioration of their debt paths above any public debt sustainability benchmark (see Chart 1.5).
-2.0
-1.5
-1.0
-0.5
0.0
0.5
1.0
1.5
2.0
2006 2009 2012 2015 2018 2021
Change in output gapFiscal stance
-5.2 -120
-90
-60
-30
0
30
60
90
-4
-3
-2
-1
0
1
2
3
GR IT PT BE FR CY ES EA AT SI DE IE FI NL
SK MT LT LV LU EE
Lack
of f
isca
l spa
ceFi
scal
spa
ce
Distance to MTO in 2020 (lhs)Distance to 60% of GDP threshold in 2020
(right-hand scale)
Financial Stability Review, November 2019 – Macro-financial and credit environment
21
Chart 1.5 A more severe and prolonged economic downturn than expected could challenge the sustainability of public finances in highly indebted countries
Public debt dynamics simulation for medium-debt euro area countries
Public debt dynamics simulation for high-debt euro area countries
(2016-28, percentage of GDP) (2016-28, percentage of GDP)
Sources: European Commission and ECB calculations. Notes: Left panel: Euro area countries with government debt-to-GDP ratios over 60% but below 90% (i.e. Austria, Finland, Germany, Ireland and Slovenia) are considered as medium-debt countries. Right panel: Euro area countries with government debt-to-GDP ratios over 90% (i.e. Belgium, Cyprus, France, Greece, Italy, Portugal and Spain) are considered as high-debt countries. In the benchmark scenario, countries with a fiscal position below/above the medium-term objective (MTO) are assumed to undertake additional consolidation/stimulus to converge to the MTO. The GDP shock scenario represents a one percentage point lower real GDP growth rate over the period 2019-21. The interest rate shock scenario considers a 100 basis points higher average market interest rate from 2019 until the end of the projection horizon (2028). The combined shock captures the simultaneous impact of three individual shocks, the two shocks described above and in addition a lower structural primary balance by one percentage point from 2019 onwards. The shock scenarios assume no fiscal policy reaction to the shocks.
Political and policy uncertainty could challenge sovereign debt sustainability. Overall, stress in euro area sovereign debt markets has remained contained since May. But there have been temporary episodes for some countries facing heightened political uncertainty. High refinancing needs may reinforce the adverse feedback loop between political and policy uncertainty and sovereign funding costs, especially for highly indebted sovereigns (see Chart 1.6, left panel). Heightened global political and policy uncertainty in combination with weaker macroeconomic outturns may also challenge the currently favourable interest rate-growth differential for almost all euro area countries (see Chart 1.6, right panel), making the debt sustainability outlook more challenging in a number of countries.
40
45
50
55
60
65
70
75
2016 2018 2020 2022 2024 2026 2028
BenchmarkGDP shockInterest rate shockCombined shock
90
100
110
120
130
140
150
2016 2018 2020 2022 2024 2026 2028
BenchmarkGDP shockInterest rate shockCombined shock

Financial Stability Review, November 2019 – Macro-financial and credit environment
22
Chart 1.6 Heightened political instability may exacerbate sovereign risk, with potentially negative repercussions on public debt sustainability
Political stability index, gross financing needs and sovereign indebtedness
Sovereign indebtedness and interest rate-growth differential in the euro area
(2018, index, percentage of GDP) (percentage of GDP)
Sources: European Commission, World Bank and ECB calculations. Notes: Left panel: The red lines represent sample averages for gross financing needs and the political stability index, while the size of the bubbles is proportionate to the level of sovereign debt as a percentage of GDP. The political stability index combines the views of a large number of enterprise, citizen and expert survey respondents and covers inter alia government stability, internal and external conflict, and demonstrations and social unrest. Gross financing needs are calculated as the sum of the headline deficit, long-maturity securities issued by the end of the latest calendar year, the stock of short-term securities outstanding at the end of the latest calendar year and repayments of official loans for post-programme countries.
Weaker than expected economic growth and renewed political and policy uncertainty could lead to an intensification of sovereign risks. Notwithstanding the continuation of the favourable financing conditions and the accumulation of fiscal buffers, a significant deterioration of the macroeconomic outlook could make public debt sustainability in the most indebted countries more challenging. A further rise in political and policy uncertainty would exacerbate sovereign risk in many indebted countries.
1.3 Euro area households’ resilience supported by low interest rates
Household incomes have been largely insulated from the recent growth slowdown, but there are some signs of waning consumer confidence. Household real disposable income has continued its expansion in 2019, underpinned by employment gains and robust wage growth (see Chart 1.7, left panel). Employment growth continued to be broad-based across countries and sectors, although survey-based indicators point to some deceleration, especially in the manufacturing sector. Wage dynamics have remained solid, shaped by the still favourable labour market outlook. Furthermore, household net worth has benefited from substantial gains on financial asset and real estate holdings following the stock market recovery since December 2018 and as a result of the still favourable housing market
AT
BE
CY
DE
EE
ES
MT
FR
GR
IE
IT
LTLU
LVFI
NL
PT
SI
SK
0
5
10
15
20
25
30
35
0 10 20 30 40 50 60
Higher political instability
Hig
her r
efin
anci
ng ri
sk
-4
-2
0
2
4
6
8
0 50 100 150 200
2006-182019-20
Sovereign indebtedness
Inte
rest
rate
-gro
wth
diff
eren
tial

Financial Stability Review, November 2019 – Macro-financial and credit environment
23
developments (see Chart 1.7, left panel). While consumer confidence has remained broadly resilient to the slowdown, there are some signs that households have become more pessimistic about employment (see Chart 1.7, right panel).
Chart 1.7 Despite the weakening economy, solid income generation continues to mitigate risks, although with some signs of waning consumer confidence
Gross disposable income and contributions to euro area household net worth
Consumer confidence and households’ expectations about the economic situation and unemployment prospects over the next 12 months
(Q1 2011-Q2 2019, percentage of gross disposable income, annual flows, annual percentage growth)
(Jan. 2011-Sep. 2019, percentage balances)
Sources: ECB, European Commission and ECB calculations. Notes: Left panel: Other changes in non-financial assets mainly include holding gains and losses on real estate (including land). Other changes in financial assets and liabilities mainly include holding gains and losses on shares and other equity, while the change in net worth due to net saving comprises net saving, net capital transfers received and the discrepancy between the non-financial and financial accounts. Right panel: Unemployment prospects are presented using an inverted scale, i.e. an increase (decrease) of the indicator corresponds to more (less) optimistic expectations.
Bank lending to households has remained robust, with continued divergence across countries and types of loans. Aggregate bank loan growth has remained on its gradual upward trend, but with variation across euro area countries, reflecting different economic conditions and real estate cycles. There has also been some divergence between mortgage and consumer lending. More specifically, solid mortgage lending dynamics in the euro area continued to be supported by further improvements in labour markets, broadly resilient consumer confidence, and favourable financing conditions reflected in lower interest rates and supportive credit standards (see Chart 1.8, left panel). By contrast, growth of consumer credit has gradually decelerated, in line with the slowdown in spending on durable goods, which tends to be more sensitive to the business cycle, albeit showing signs of stabilisation in recent months (see Chart 1.8, left panel). Interest rates for consumer credit have remained stable, although banks have slightly tightened lending standards in recent quarters (see Chart 1.8, right panel).
-3
-2
-1
0
1
2
3
4
-20-16-12
-8-4048
121620242832
2011 2013 2015 2017 2019
Change in net worthChange in net worth due to net savingOther changes in financial assets and liabilitiesOther changes in non-financial assetsReal disposable income (right-hand scale)
-10
0
10
20
30
40
50
60-40
-35
-30
-25
-20
-15
-10
-5
0
5
2011 2013 2015 2017 2019
Unemployment expectations over next year (right-hand scale)Economic situation expectations over next yearConsumer confidence

Financial Stability Review, November 2019 – Macro-financial and credit environment
24
Chart 1.8 Continued credit extension to households, although with moderation and credit standard tightening in the consumer loan segment
Bank lending to households: dynamics and lending rates by type of loan
Credit standards for household loans
(Jan. 2011-Jun. 2019, annual percentage growth, percentages) (Q1 2011-Q3 2019, weighted net percentages, actual)
Sources: ECB and ECB calculations. Notes: Left panel: Loans are adjusted for loan sales and securitisation. Right panel: Credit standards refer to the net percentage of banks contributing to a tightening of credit standards. A negative (positive) number for credit standards represents an easing (tightening).
Household indebtedness has been stable at the euro area aggregate level, but this reflects deleveraging in some countries and releveraging in others. Euro area household debt has recently stabilised at around 95% of disposable income and 58% of GDP, close to pre-crisis levels. There is however considerable heterogeneity across euro area countries. While household debt is less than 40% of disposable income in Latvia and Lithuania, it stands at around 200% of disposable income in the Netherlands. Debt dynamics have also varied across euro area countries. For example, households in Spain, Portugal, the Netherlands and Ireland have deleveraged markedly over the last three years, supported inter alia by improvements in income, while France has seen continued releveraging on account of buoyant mortgage lending over the same period (see Chart 1.9, left panel).
Risks to household debt sustainability have been contained by the low level of interest rates, but would increase in the event of a severe slowdown. While the debt burden for households in some countries is still elevated, their repayment capacity has continued improving. Interest payments as a share of disposable income have fallen below 2.5%, given robust incomes and the low interest rate environment. With the expected continuation of the low interest rate environment, coupled with a shift in many countries towards longer mortgage rate fixation periods, risks to households’ repayment capacity appear benign (see Chart 1.9, right panel). If however the economic slowdown is more severe and protracted, this could weigh on household incomes or lead to a sharp correction in some countries’ property markets. This could put pressure on households’ debt repayment capacity over the longer horizon.
-4
-2
0
2
4
6
8
2011 2013 2015 2017 2019
Consumer creditLending for house purchaseInterest rate on consumer credit Interest rate on loans for house purchase
-15
-10
-5
0
5
10
15
20
25
30
2011 2013 2015 2017 2019
Credit standards - house purchaseCredit standards - consumer credit

Financial Stability Review, November 2019 – Macro-financial and credit environment
25
Chart 1.9 While some countries have high household debt levels, debt repayments across the euro area are generally low
Debt-to-disposable income ratio across selected euro area economies
Gross interest payments-to-disposable income ratio across selected euro area economies
(Q1 2001-Q2 2019, percentage of disposable income) (Q1 2001-Q2 2019, percentage of disposable income)
Sources: Eurostat, ECB and ECB calculations. Notes: Debt is defined as total loans granted to households by all institutional sectors. Gross interest payments are before FISIM allocation. The selected countries are France, Germany, Greece, Ireland, Italy, the Netherlands, Portugal and Spain.
1.4 Emerging pockets of corporate sector vulnerabilities
Slower economic growth has led to a continued deceleration in corporate profits. Business sentiment in the euro area has weakened sharply as the economic outlook has softened, and competition in domestic and foreign markets has increased (see Chart 1.10, left panel). Growth in corporate profits and retained earnings has moderated (see Chart 1.10, right panel). At the aggregate level, corporates finance their expansion primarily with retained earnings, so slower profit growth currently may affect future business investment and the long-term profit outlook.
0
50
100
150
200
250
2001 2004 2007 2010 2013 2016 2019
Euro areaMinimum-maximum country range
0
2
4
6
8
10
12
14
2001 2004 2007 2010 2013 2016 2019
Euro areaMinimum-maximum country range

Financial Stability Review, November 2019 – Macro-financial and credit environment
26
Chart 1.10 Corporate profits and retained earnings have been decelerating in the euro area
Weakening economy, higher competition and decelerating profits
Decelerating corporate retained earnings
(Q1 2011-Q3 2019, percentage balances, percentage of gross value added)
(Q1 2001-Q2 2019, annual percentage growth)
Sources: ECB, Eurostat, European Commission and ECB calculations. Notes: Left panel: Competitive position in the EU and non-EU markets is based on quarterly surveys of managers conducted by the European Commission. Gross operating surplus includes mixed income and is expressed as a share of gross value added, with the last data point for June 2019. Right panel: The country range includes France, Germany, Italy and Spain, while the euro area average covers all the euro area countries and is weighted by GDP.
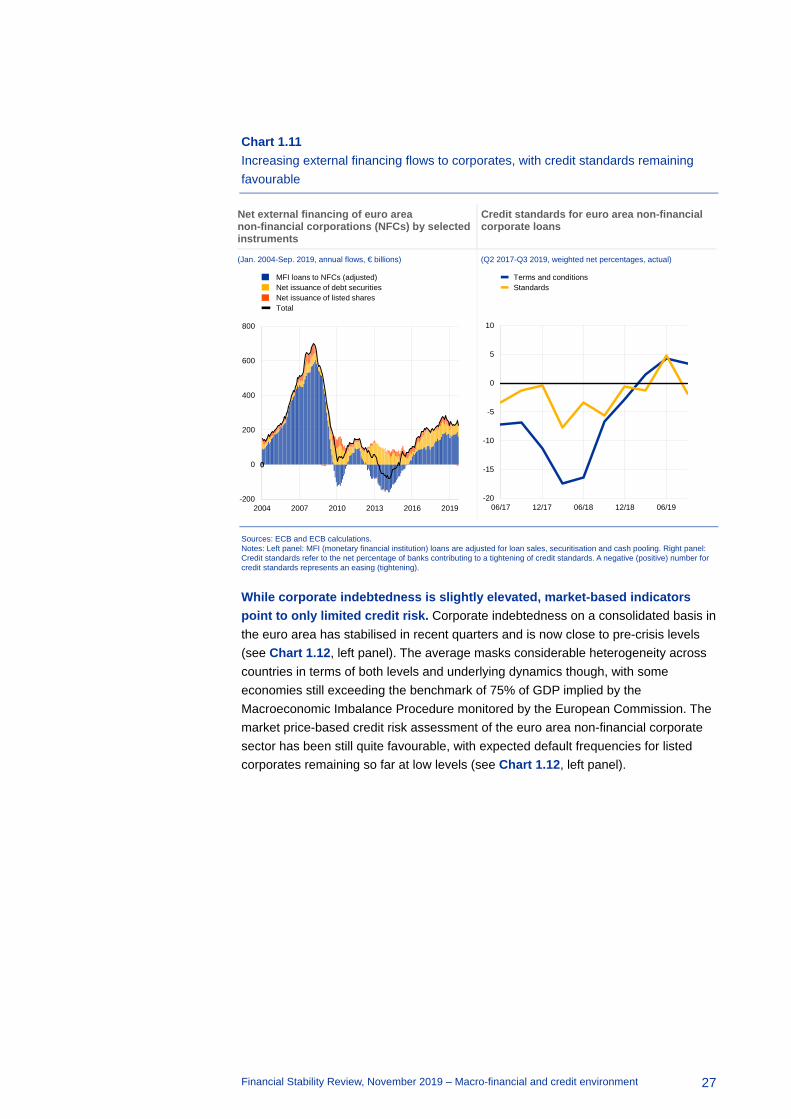
External financing to the corporate sector has increased, with credit standards remaining favourable. Despite recent growth, external financing to corporates remains below its mid-2018 level (see Chart 1.11, left panel). The lower level of external financing reflects the ongoing weakness of the economy, especially in manufacturing and trade, and the resulting lower financing needs of corporates. Bank lending to corporates in the services sector has remained robust, whereas lending to manufacturing and trade sectors has deteriorated. Credit standards to corporates remain favourable, although banks have recently tightened credit terms and conditions (see Chart 1.11, right panel), which is consistent with slower economic growth. Beyond bank lending, net issuance of debt securities has increased in the third quarter of 2019, but remains below the levels observed in 2017 (see Chart 1.11, left panel), with the issuance being concentrated in the investment-grade segment. Underpinned by accommodative monetary policy, favourable financing conditions for both bank and non-bank lending have provided an important incentive for corporates to continue their expansion.
44.0
44.4
44.8
45.2
45.6
46.0
46.4
-20
-15
-10
-5
0
5
10
15
2011 2013 2015 2017 2019
Competitive position in EU marketsCompetitive position in non-EU markets
Gross operating surplus (right-hand scale)Overall industry confidence
-25
-15
-5
5
15
25
35
2001 2004 2007 2010 2013 2016 2019
Euro areaMinimum-maximum country range
Financial Stability Review, November 2019 – Macro-financial and credit environment
27
Chart 1.11 Increasing external financing flows to corporates, with credit standards remaining favourable
Net external financing of euro area non-financial corporations (NFCs) by selected instruments
Credit standards for euro area non-financial corporate loans
(Jan. 2004-Sep. 2019, annual flows, € billions) (Q2 2017-Q3 2019, weighted net percentages, actual)
Sources: ECB and ECB calculations. Notes: Left panel: MFI (monetary financial institution) loans are adjusted for loan sales, securitisation and cash pooling. Right panel: Credit standards refer to the net percentage of banks contributing to a tightening of credit standards. A negative (positive) number for credit standards represents an easing (tightening).
While corporate indebtedness is slightly elevated, market-based indicators point to only limited credit risk. Corporate indebtedness on a consolidated basis in the euro area has stabilised in recent quarters and is now close to pre-crisis levels (see Chart 1.12, left panel). The average masks considerable heterogeneity across countries in terms of both levels and underlying dynamics though, with some economies still exceeding the benchmark of 75% of GDP implied by the Macroeconomic Imbalance Procedure monitored by the European Commission. The market price-based credit risk assessment of the euro area non-financial corporate sector has been still quite favourable, with expected default frequencies for listed corporates remaining so far at low levels (see Chart 1.12, left panel).
0
-200
0
200
400
600
800
2004 2007 2010 2013 2016 2019
MFI loans to NFCs (adjusted)Net issuance of debt securitiesNet issuance of listed sharesTotal
-20
-15
-10
-5
0
5
10
06/17 12/17 06/18 12/18 06/19
Terms and conditionsStandards

Financial Stability Review, November 2019 – Macro-financial and credit environment
28
Chart 1.12 Slightly elevated corporate debt levels are cushioned by favourable financing conditions and significant liquidity buffers, as reflected in expectations of low credit risk
Gross debt and expected default frequency (EDF) of euro area non-financial corporations
Non-financial corporate liquidity buffers and cost of funding
(Q1 2003-Q2 2019, percentage of GDP, percentages, median country values)
(Q1 2003-Q2 2019, percentages, ratio)
Sources: ECB, Moody’s CreditEdge and ECB calculations. Notes: Left panel: Consolidated non-financial corporate debt is defined as the sum of total loans granted to and debt securities issued by non-financial corporations net of inter-company loans. Expected default frequency of non-financial corporations is for one year ahead. Right panel: Liquid assets are defined as the sum of currency and deposits, short-term securities and mutual fund shares over gross value added; interest coverage ratio is defined as the ratio of gross operating surplus over gross interest payments; and gross interest payments are expressed as a share of gross value added. Gross interest payments are before FISIM allocation.
Risks to corporate debt sustainability are also mitigated by favourable financing conditions and large liquidity buffers. Debt servicing capacity is supported by record-low gross interest payments and high interest coverage ratios in most countries (see Chart 1.12, right panel). Furthermore, corporates have accumulated substantial liquidity buffers in the form of liquid assets, which together with the low debt servicing costs would allow corporates to withstand temporary funding stress without resorting to abrupt deleveraging. Moreover, the shift towards more market-based funding allows corporates to mitigate the consequences of a hypothetical stress episode originating from the banking system, although this source of funding could at the same time become subject to a reversal in investor sentiment. All of the above factors reduce in particular rollover risks, making corporate debt more resilient to shocks.
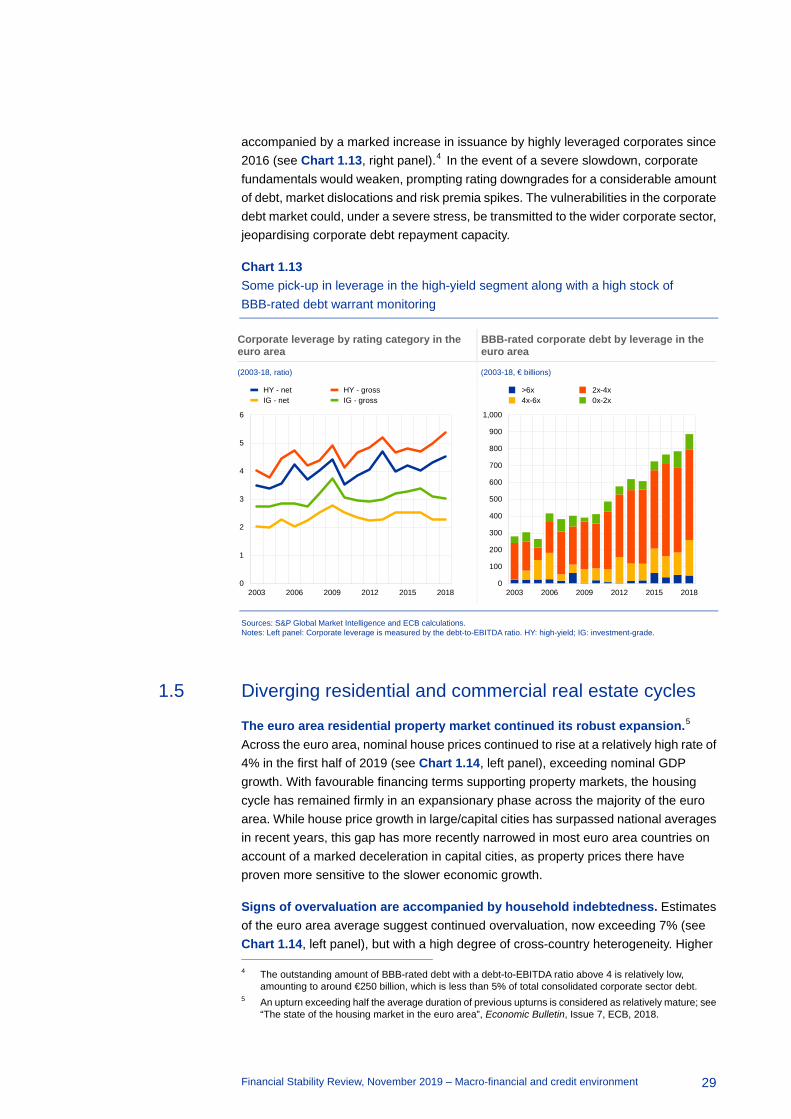
While risks remain contained generally, the vulnerability of highly leveraged corporates warrants monitoring. High-yield corporates are estimated to have increased their gross and net leverage, while investment-grade corporates have slightly deleveraged. Even so, leverage in both groups remains above pre-crisis levels (see Chart 1.13, left panel). Given that both markets and rating agencies tend to discriminate between corporates with high and low levels of leverage during economic downturns, risk premia could increase significantly under a severe growth slowdown scenario (see Chapter 2, Box 2). In addition, within the segment of investment-grade corporates in the euro area, the issuance of BBB-rated entities has significantly increased in terms of outstanding amounts over the last five years. This has been
0.0
0.5
1.0
1.5
2.0
2.5
0
20
40
60
80
100
120
140
2003 2007 2011 2015 2019
Euro area consolidated gross debt to GDP ratioInterquartile rangeEDF (right-hand scale)
0
5
10
15
20
25
30
35
40
45
50
0
2
4
6
8
10
12
2003 2005 2007 2009 2011 2013 2015 2017 2019
Liquid assets (right-hand scale)Interest coverage ratioGross interest paymentsLending rate
Financial Stability Review, November 2019 – Macro-financial and credit environment
29
accompanied by a marked increase in issuance by highly leveraged corporates since 2016 (see Chart 1.13, right panel).4 In the event of a severe slowdown, corporate fundamentals would weaken, prompting rating downgrades for a considerable amount of debt, market dislocations and risk premia spikes. The vulnerabilities in the corporate debt market could, under a severe stress, be transmitted to the wider corporate sector, jeopardising corporate debt repayment capacity.
Chart 1.13 Some pick-up in leverage in the high-yield segment along with a high stock of BBB-rated debt warrant monitoring
Corporate leverage by rating category in the euro area
BBB-rated corporate debt by leverage in the euro area
(2003-18, ratio) (2003-18, € billions)
Sources: S&P Global Market Intelligence and ECB calculations. Notes: Left panel: Corporate leverage is measured by the debt-to-EBITDA ratio. HY: high-yield; IG: investment-grade.
1.5 Diverging residential and commercial real estate cycles
The euro area residential property market continued its robust expansion.5 Across the euro area, nominal house prices continued to rise at a relatively high rate of 4% in the first half of 2019 (see Chart 1.14, left panel), exceeding nominal GDP growth. With favourable financing terms supporting property markets, the housing cycle has remained firmly in an expansionary phase across the majority of the euro area. While house price growth in large/capital cities has surpassed national averages in recent years, this gap has more recently narrowed in most euro area countries on account of a marked deceleration in capital cities, as property prices there have proven more sensitive to the slower economic growth.
Signs of overvaluation are accompanied by household indebtedness. Estimates of the euro area average suggest continued overvaluation, now exceeding 7% (see Chart 1.14, left panel), but with a high degree of cross-country heterogeneity. Higher 4 The outstanding amount of BBB-rated debt with a debt-to-EBITDA ratio above 4 is relatively low,
amounting to around €250 billion, which is less than 5% of total consolidated corporate sector debt. 5 An upturn exceeding half the average duration of previous upturns is considered as relatively mature; see
“The state of the housing market in the euro area”, Economic Bulletin, Issue 7, ECB, 2018.
0
1
2
3
4
5
6
2003 2006 2009 2012 2015 2018
HY - netIG - net
HY - grossIG - gross
0
100
200
300
400
500
600
700
800
900
1,000
2003 2006 2009 2012 2015 2018
>6x4x-6x
2x-4x0x-2x

Financial Stability Review, November 2019 – Macro-financial and credit environment
30
valuation estimates are accompanied by a high level of household indebtedness (see Chart 1.14, right panel) and robust mortgage loan origination in some countries.6
Chart 1.14 Buoyant residential real estate prices amid growing vulnerabilities in some countries
Residential real estate (RRE) prices and valuation estimates for the euro area as a whole
Valuation estimates of RRE prices and the household debt-to-disposable income ratio in the euro area
(annual percentage changes and percentages) (2018, percentages)
Sources: ECB and ECB calculations. Notes: Left panel: The broad average valuation estimate is based on four different valuation methods: the price-to-rent ratio, the price-to-income ratio, an asset pricing approach and an estimated Bayesian vector autoregression (BVAR) model. The narrow estimate is the simple average of the price-to-income ratio and the BVAR valuation. For details of the methodology, see Box 3 in Financial Stability Review, ECB, June 2011, and Box 3 in Financial Stability Review, ECB, November 2015. Right panel: Dark red = pronounced risk, orange = medium risk, yellow = low risk, blue = no exposures to RRE risks. For details, see Vulnerabilities in the residential real estate sectors of the EEA countries, European Systemic Risk Board, September 2019. Overall, estimates from the valuation models are subject to considerable uncertainty and should be interpreted with caution. Alternative valuation measures can point to lower/higher estimates of overvaluation.
The commercial real estate cycle has continued to moderate. Survey-based data suggest that the current euro area commercial real estate (CRE) cycle is either at its peak or has already entered a downturn phase (see Chart 1.15, left panel). Countries that were less affected by the crisis (e.g. Austria, France and Germany) generally appear to be at or past the peak, while those that were more affected by the crisis (e.g. Cyprus, Greece and Spain) are still deemed to be in an upturn phase. Led by developments in the prime segment, euro area CRE price growth has still been positive, albeit clearly moderating. While prices are estimated to have grown beyond fundamentals in the past, the current dynamics seem to be below those that would be implied by fundamentals (see Chart 1.15, right panel). Transaction volumes in recent quarters have remained strong, but have decreased from peak levels in line with a maturing market cycle. The strength in transaction volumes has coincided with the increased activity of non-domestic investors, making the CRE sector vulnerable to shifts in global financial conditions (see Box 1).
6 For details, see Vulnerabilities in the residential real estate sectors of the EEA countries, European
Systemic Risk Board, September 2019.
-6
-4
-2
0
2
4
6
8
10
-15
-10
-5
0
5
10
15
2000 2003 2006 2009 2012 2015 2018
RRE price index (right-hand scale)RRE overvaluation (narrow measure)RRE valuation estimate (broad measure)
AT
BE
CY
DEEE
ES
FI
FRGR
IE
ITLT
LU
LV
MT
NL
PT
SI
SK
-30
20
70
120
170
220
-20 -10 0 10 20 30
Hou
seho
ld d
ebtt
(% o
f inc
ome)
RRE overvaluation (average of HP and econometric model)

Financial Stability Review, November 2019 – Macro-financial and credit environment
31
Chart 1.15 CRE prices have moderated recently in a maturing CRE cycle
Perception of the current phase of the CRE cycle in the euro area
Actual and model-based prediction of CRE price growth
(percentages) (annual percentage changes)
Sources: RICS Global Commercial Property Monitor and ECB calculations. Notes: Left panel: The RICS Global Commercial Property Monitor is a quarterly guide to the trends in the commercial property investment and occupier markets. Respondents are asked to compare conditions over the latest three months with the previous three months, and to give their views as to the outlook. Right panel: The observed value shows CRE price growth using the median annual growth rate for a country sample covering Austria, Belgium, France, Germany, Ireland, Italy, the Netherlands, Portugal and Spain. The solid yellow line shows the growth rates using the average of the price dynamics predicted by 45 different models. The dashed lines depict the predictions using the 10% and 90% quantiles.
Risks to financial stability stemming from real estate markets have increased. With the low-rate environment expected to remain in place for an extended period of time and the outlook for the labour market being robust, mortgage lending growth could accelerate and exert further upward pressure on RRE prices. However, worse than expected macroeconomic outcomes and/or tighter financing conditions in terms of both the availability and the cost of funding could adversely affect the debt servicing capacity of households and commercial property investors, with investors from outside the euro area being particularly sensitive to changes in global financial conditions. Reflecting these risks, a number of countries have activated or strengthened policies that aim to limit the weakening of lending standards.
Box 1 Explaining cross-border transactions in euro area commercial real estate markets
Prepared by Barbara Jarmulska and Dorota Ścibisz
The upswing in euro area commercial real estate (CRE) markets in recent years has reflected, in part, a strong appetite from international investors, including US investment funds. Since 2013 transactions in euro area CRE markets have more than doubled, alongside a 20% increase in prices (15% in real terms) and a decline in average yields from 5.2% to 3.5%. In parallel, the share of transactions by foreign investors increased to 54% in 2018, from an average of 49% in 2013 when a particularly strong pick-up in transaction volumes started. Furthermore, the role of investment funds in foreign transactions increased to 63% in 2018 from 48% in 2013 (see Chart A, left panel), with around 40% of these on average originating from the United States.
0%
10%
20%
30%
40%
50%
60%
70%
80%
90%
100%
2016 2017 2018 2019
BottomUpturnPeakDownturn
-5
0
5
10
15
20
25
2012 2013 2014 2015 2016 2017 2018 2019
Observed Prediction 10% quantile of predictions 90% quantile of predictions

Financial Stability Review, November 2019 – Macro-financial and credit environment
32
Chart A Foreign CRE transaction inflows into euro area countries increased substantially in the recent upswing, while CRE yields in the euro area were until recently higher than in the United States
Sources: Real Capital Analytics, Jones Lang LaSalle and ECB calculations. Notes: Left panel: Transaction volumes are calculated as four-quarter moving sums. Foreign transactions include purchases from other euro area countries and non-euro area countries. Other investors include banks, pension funds, insurance companies, non-bank financial institutions and private investors (e.g. developers, high net worth individuals, corporate investors, cooperative investors). Right panel: US yields reflect the office market, which is the largest CRE sector and is treated as a proxy for the entire US CRE market.
The higher share of foreign investors could make domestic CRE markets more exposed to a sharp or disorderly adjustment as exuberance fades. Generally, a higher share of foreign investments implies better risk sharing across countries, but foreign investors might be more sensitive to changes in global financial conditions and could be more likely to rebalance away from euro area CRE markets if relative returns shift. This could prompt an abrupt shift in the CRE market. In particular, the volume of property purchased by investment funds tends to be relatively volatile, and funds may also be pressured into selling CRE portfolios in the event of shifts in investor sentiment resulting in increased redemptions. Given the volatility that could be generated by an abrupt flight of foreign investors away from euro area CRE markets, this box investigates what factors have supported the attractiveness of euro area CRE and might prompt a reversal, focusing on purchases by foreign investment funds. Data availability limits the analysis to investment funds domiciled in the United States, the United Kingdom and the euro area, which on average together accounted for close to 80% of annual CRE purchases by funds in the euro area over the review period. Funds domiciled in Asia, which have an almost 10% average share in funds’ euro area CRE market purchases, are not covered.
An analysis of recent trends in CRE markets suggests that search-for-yield behaviour could have been a significant driver of foreign transactions. Examining the relationship between transactions, yields and fundamentals for CRE markets for a panel of euro area countries, the United States and the United Kingdom between 2007 and 2018 shows that CRE investors invest abroad if yields are higher there than at home7 (see Chart A, right panel). This behaviour seems to have contributed to the strength of cross-border transaction flows into euro area CRE markets. Comparing actual transaction volumes with a simulation of how transaction volumes would have evolved if yields were the same in all countries (see Chart B, left panel) suggests that since 2010 there has been an
7 The same relationship also holds when yields are replaced with spreads between yields and risk-free
rates (risk premia), suggesting that cross-border transaction flows are driven also by risk-taking behaviour by investors.
CRE transaction volumes in the euro area by investor origin
CRE yields in the euro area and the United States
(Q1 2008-Q4 2018, € billions) (2007-18, percentage points)
0
20
40
60
80
100
120
140
2008 2009 2010 2011 2012 2013 2014 2015 2016 2017 2018
DomesticForeign - investment fundsForeign - other investors
-1.5
-1.0
-0.5
0.0
0.5
1.0
-2
0
2
4
6
8
2007 2008 2009 2010 2011 2012 2013 2014 2015 2016 2017 2018
Euro area prime CRE yields US prime CRE yieldsDifference between euro area and US prime CRE yields
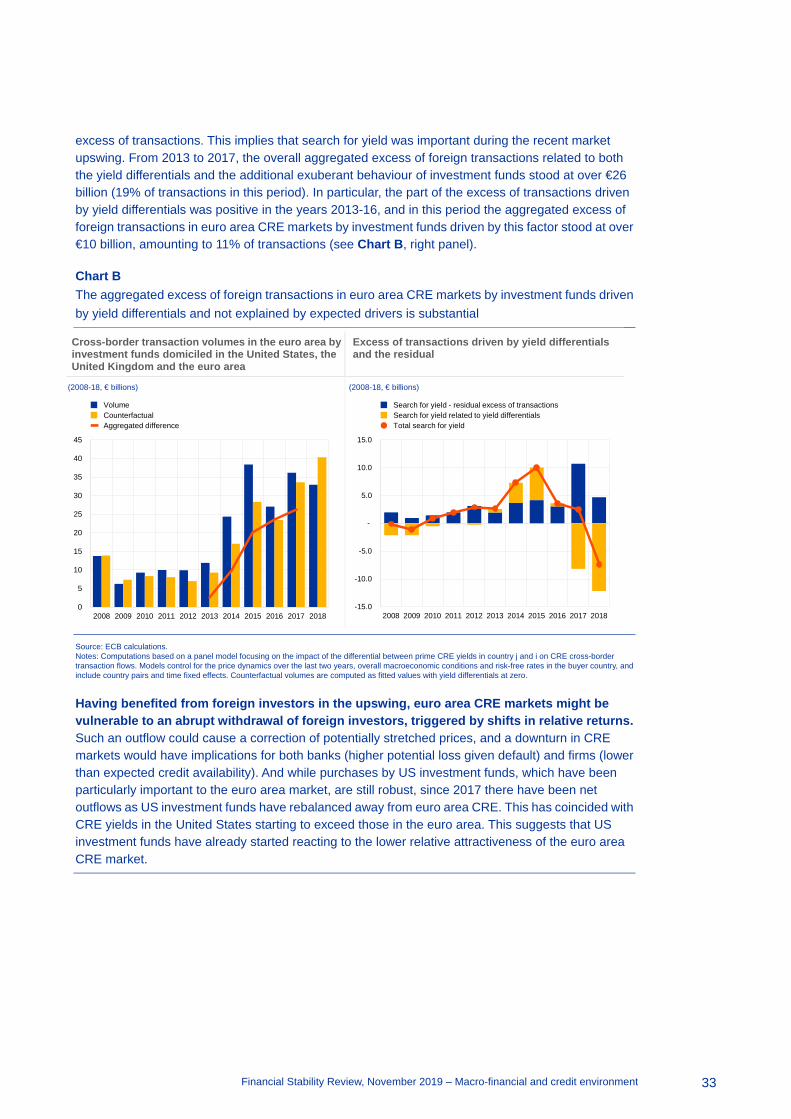
Financial Stability Review, November 2019 – Macro-financial and credit environment
33
excess of transactions. This implies that search for yield was important during the recent market upswing. From 2013 to 2017, the overall aggregated excess of foreign transactions related to both the yield differentials and the additional exuberant behaviour of investment funds stood at over €26 billion (19% of transactions in this period). In particular, the part of the excess of transactions driven by yield differentials was positive in the years 2013-16, and in this period the aggregated excess of foreign transactions in euro area CRE markets by investment funds driven by this factor stood at over €10 billion, amounting to 11% of transactions (see Chart B, right panel).
Chart B The aggregated excess of foreign transactions in euro area CRE markets by investment funds driven by yield differentials and not explained by expected drivers is substantial
Source: ECB calculations. Notes: Computations based on a panel model focusing on the impact of the differential between prime CRE yields in country j and i on CRE cross-border transaction flows. Models control for the price dynamics over the last two years, overall macroeconomic conditions and risk-free rates in the buyer country, and include country pairs and time fixed effects. Counterfactual volumes are computed as fitted values with yield differentials at zero.
Having benefited from foreign investors in the upswing, euro area CRE markets might be vulnerable to an abrupt withdrawal of foreign investors, triggered by shifts in relative returns. Such an outflow could cause a correction of potentially stretched prices, and a downturn in CRE markets would have implications for both banks (higher potential loss given default) and firms (lower than expected credit availability). And while purchases by US investment funds, which have been particularly important to the euro area market, are still robust, since 2017 there have been net outflows as US investment funds have rebalanced away from euro area CRE. This has coincided with CRE yields in the United States starting to exceed those in the euro area. This suggests that US investment funds have already started reacting to the lower relative attractiveness of the euro area CRE market.
Cross-border transaction volumes in the euro area by investment funds domiciled in the United States, the United Kingdom and the euro area
Excess of transactions driven by yield differentials and the residual
(2008-18, € billions) (2008-18, € billions)
0
5
10
15
20
25
30
35
40
45
2008 2009 2010 2011 2012 2013 2014 2015 2016 2017 2018
VolumeCounterfactualAggregated difference
-15.0
-10.0
-5.0
-
5.0
10.0
15.0
2008 2009 2010 2011 2012 2013 2014 2015 2016 2017 2018
Search for yield - residual excess of transactionsSearch for yield related to yield differentialsTotal search for yield

Financial Stability Review, November 2019 – Financial Markets
34
2 Financial Markets
2.1 Rally in safer asset markets
Benchmark yield curves have moved downwards significantly since May, including further shifts into negative territory. For the first time in history, large segments of the yield curves of euro area sovereigns with high credit ratings are in negative territory (see Chart 2.1, left panel). A deteriorating economic outlook and various monetary easing measures in the United States and the euro area have helped to extend the downward trend in global bond yields that started at the beginning of 2019. The decline in euro area long-term yields can be attributed both to
Robust risk appetite
Very low yield environment
Valuations contingent on low yields
Signs of asset mispricing suggest potential for future corrections
• Very low yield environment
• Robust risk appetite
• Valuations contingent on low yields
• Safe-haven asset inflation
Safe-haven asset inflation
$13.5 trnof negative
yielding debtacross the globe
50%of euro area equity
price appreciation since 2012 explained by
lower discount rates
Euro area equity prices (ytd)
+23%
Gold price (ytd)
+15%
Yield curve

Financial Stability Review, November 2019 – Financial Markets
35
lower expectations about the future path of short-term rates and to lower term premia (see Chart 2.1, right panel), reflecting lower nominal growth expectations as well as the mix of conventional and unconventional measures announced by the ECB’s Governing Council following its September meeting.8 Also the US Federal Open Market Committee lowered its target rate three times over the review period, adding to the global downward trend in benchmark bond yields. In addition, several cyclical and structural factors continued to depress term premia across the globe, including persistent policy uncertainties as well as ample global private and official demand for and an increasingly limited supply of safe assets.
Chart 2.1 Euro area yield curves largely negative as term premia and rate expectations declined
Euro area, German and US yield curves Change in euro area and US ten-year benchmark yields
(y-axis: yield per annum; x-axis: years to maturity) (basis points)
Sources: Refinitiv, ECB and Federal Reserve Bank of New York. Notes: Left panel: “Current” refers to yield curves on 15 November 2019. The yellow lines reflect the market value-weighted average yield curve of all euro area sovereign issuers. Right panel: The chart shows the change since 29 May 2019. Latest observation: 10 November 2019. OIS: overnight index swap.
Negative-yielding bonds are mainly those bonds with higher credit ratings and shorter maturities. Sovereign issuers make up most of the approximately USD 13 trillion of negative-yielding bonds outstanding. This is unsurprising as over sovereigns are the main issuers of highly rated bonds in currency areas with negative policy rates, such as the euro area and Japan. As yield curves have flattened, the phenomenon of negative yields has extended to very long maturities for highly rated sovereign (see Chart 2.2, left panel). Moreover, as these bonds serve as benchmarks for the yields of bonds denominated in the same currency, but issued by private borrowers, negative yields have extended to significant parts of the euro area corporate bond market (see Section 2.2).
Higher demand for alternative safe stores of liquidity suggests investors are seeking substitutes for negative-yielding cash and bonds. Most prominently, the price of gold has become highly correlated with the share of negative-yielding bonds
8 See the press release of 12 September 2019 on the ECB’s website.
-1.0
-0.5
0.0
0.5
1.0
1.5
2.0
2.5
3.0
0 5 10 15 20 25
Germany at end-May 2019 (dashed) and current (solid)All euro area sovereign issuers at end-May 2019 (dashed) and current (solid)United States at end-May 2019 (dashed) and current (solid) current
-35 -25 -15 -5
US Treasury
Euro area OIS
Total yield changeExpectations about short ratesTerm premium
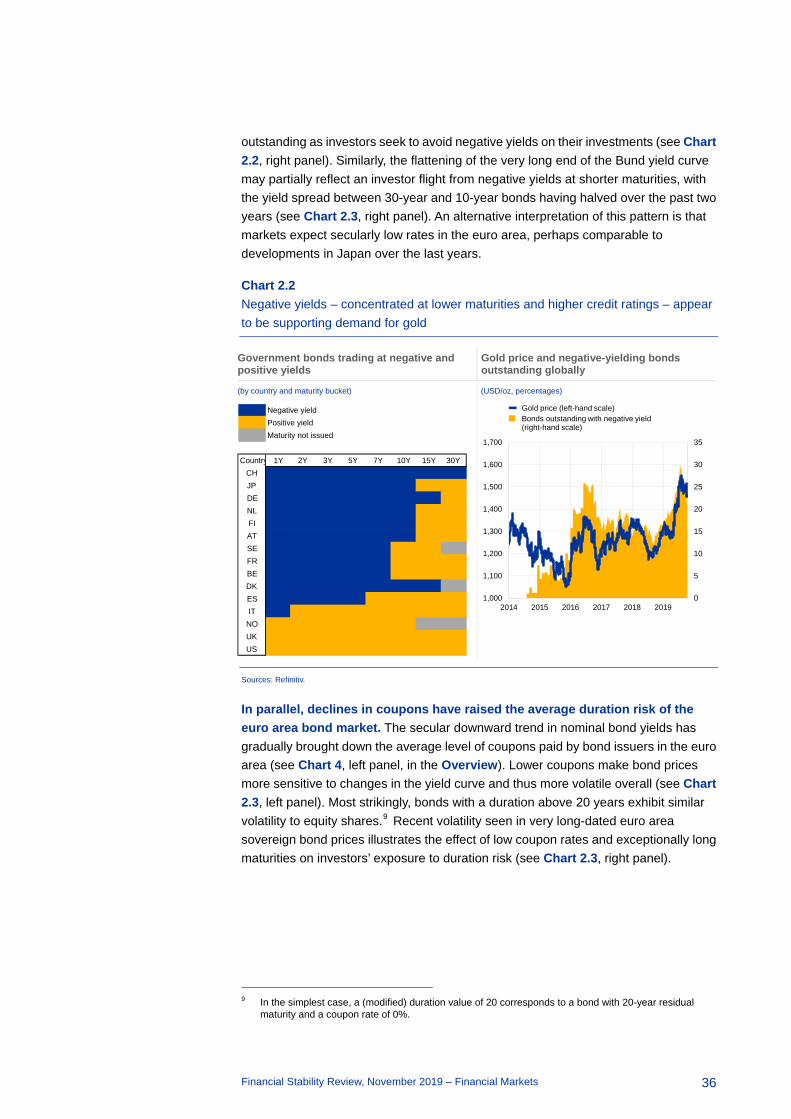
Financial Stability Review, November 2019 – Financial Markets
36
outstanding as investors seek to avoid negative yields on their investments (see Chart 2.2, right panel). Similarly, the flattening of the very long end of the Bund yield curve may partially reflect an investor flight from negative yields at shorter maturities, with the yield spread between 30-year and 10-year bonds having halved over the past two years (see Chart 2.3, right panel). An alternative interpretation of this pattern is that markets expect secularly low rates in the euro area, perhaps comparable to developments in Japan over the last years.
Chart 2.2 Negative yields – concentrated at lower maturities and higher credit ratings – appear to be supporting demand for gold
Government bonds trading at negative and positive yields
Gold price and negative-yielding bonds outstanding globally
(by country and maturity bucket) (USD/oz, percentages)
Sources: Refinitiv.
In parallel, declines in coupons have raised the average duration risk of the euro area bond market. The secular downward trend in nominal bond yields has gradually brought down the average level of coupons paid by bond issuers in the euro area (see Chart 4, left panel, in the Overview). Lower coupons make bond prices more sensitive to changes in the yield curve and thus more volatile overall (see Chart 2.3, left panel). Most strikingly, bonds with a duration above 20 years exhibit similar volatility to equity shares.9 Recent volatility seen in very long-dated euro area sovereign bond prices illustrates the effect of low coupon rates and exceptionally long maturities on investors’ exposure to duration risk (see Chart 2.3, right panel).
9 In the simplest case, a (modified) duration value of 20 corresponds to a bond with 20-year residual
maturity and a coupon rate of 0%.
Negative yieldPositive yieldMaturity not issued
Country 1Y 2Y 3Y 5Y 7Y 10Y 15Y 30YCHJPDENLFIATSEFRBEDKESIT
NOUKUS
0
5
10
15
20
25
30
35
1,000
1,100
1,200
1,300
1,400
1,500
1,600
1,700
2014 2015 2016 2017 2018 2019
Gold price (left-hand scale)Bonds outstanding with negative yield (right-hand scale)
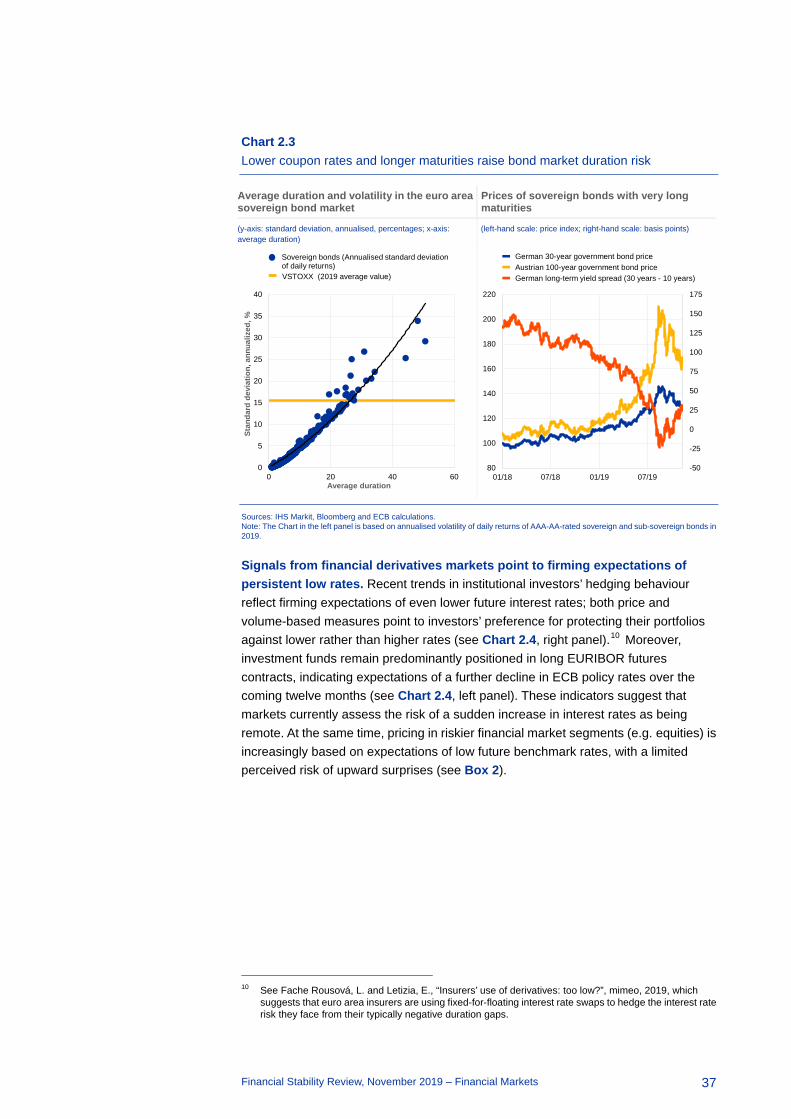
Financial Stability Review, November 2019 – Financial Markets
37
Chart 2.3 Lower coupon rates and longer maturities raise bond market duration risk
Average duration and volatility in the euro area sovereign bond market
Prices of sovereign bonds with very long maturities
(y-axis: standard deviation, annualised, percentages; x-axis: average duration)
(left-hand scale: price index; right-hand scale: basis points)
Sources: IHS Markit, Bloomberg and ECB calculations. Note: The Chart in the left panel is based on annualised volatility of daily returns of AAA-AA-rated sovereign and sub-sovereign bonds in 2019.
Signals from financial derivatives markets point to firming expectations of persistent low rates. Recent trends in institutional investors’ hedging behaviour reflect firming expectations of even lower future interest rates; both price and volume-based measures point to investors’ preference for protecting their portfolios against lower rather than higher rates (see Chart 2.4, right panel).10 Moreover, investment funds remain predominantly positioned in long EURIBOR futures contracts, indicating expectations of a further decline in ECB policy rates over the coming twelve months (see Chart 2.4, left panel). These indicators suggest that markets currently assess the risk of a sudden increase in interest rates as being remote. At the same time, pricing in riskier financial market segments (e.g. equities) is increasingly based on expectations of low future benchmark rates, with a limited perceived risk of upward surprises (see Box 2).
10 See Fache Rousová, L. and Letizia, E., “Insurers’ use of derivatives: too low?”, mimeo, 2019, which
suggests that euro area insurers are using fixed-for-floating interest rate swaps to hedge the interest rate risk they face from their typically negative duration gaps.
0
5
10
15
20
25
30
35
40
0 20 40 60
Stan
dard
dev
iatio
n, a
nnua
lized
, %
Average duration
Sovereign bonds (Annualised standard deviation of daily returns)VSTOXX (2019 average value)
-50
-25
0
25
50
75
100
125
150
175
80
100
120
140
160
180
200
220
01/18 07/18 01/19 07/19
German 30-year government bond priceAustrian 100-year government bond priceGerman long-term yield spread (30 years - 10 years)

Financial Stability Review, November 2019 – Financial Markets
38
Chart 2.4 Positioning in interest rate derivatives points to consensus on “low-for-long” interest rates
Quantiles of the net-over-gross positioning of investment funds
OIS/Bund spread at the ten-year maturity
(rates per annum) (prices)
Sources: EMIR data and Haver Analytics. Notes: The left chart shows net-over-gross positions of individual investors in the market for EURIBOR futures with a residual maturity of more than one year. The size of the bubbles is proportional to the size of individual portfolios in terms of the gross notional amount. The right chart shows on the right-hand scale the ratio of euro area insurance companies’ positions in fixed-for-floating plain-vanilla EURIBOR and OIS swaps over their positions in floating-for-fixed swaps of the same type (positions are measured by notional values). The time series start only in mid-2018, owing to quality and availability limitations of EMIR (European Market Infrastructure Regulation) data prior to this.
Euro money markets remained unaffected by an episode of extreme volatility in US repo rates. A spike in the US secured overnight financing rate (SOFR) made the headlines in September as high demand for liquidity coincided with a decline in deposits as US corporate tax payments fell due (see Chart 2.5, left panel). The funding strains prompted the Federal Reserve to assume a more active role in the repo market and to provide additional liquidity by means of Treasury bill purchases.
However, collateral shortages in the euro area repo market could ensue from the announced expansion of the ECB’s public sector purchase programme. Measures of collateral scarcity in the repo market have declined over recent quarters owing inter alia to a smoother functioning of, and higher participation in, the ECB’s securities lending programme, which includes the possibility to post cash as collateral. For example, the wedge between the average repo rate and those rates charged for transactions collateralised by Bunds has declined, although scarcity around quarter-ends remains evident (see Chart 2.5, right panel). These benign trends are confirmed by survey-based evidence on liquidity in euro area collateral markets.11 That said, highly rated collateral required for some repo operations might become increasingly scarce in the context of expanding Eurosystem sovereign bond purchases further restraining the tradable amount of these assets.
11 See the results of the September 2019 survey on credit terms and conditions in euro-denominated
securities financing and over-the-counter derivatives markets (SESFOD).
Lower rates expected
Neutral
Higher rates expected
October 2019May 2019December 2018
% investors 0.0
0.2
0.4
0.6
0.8
1.0
1.2
1.4
1.6
-20
-10
0
10
20
30
40
50
07/14 07/15 07/16 07/17 07/18 07/19
Bund/OIS spread (10-year maturity)(left-hand scale)Insurers’ fixed-for-floating positions in EURIBOR futures (right-hand scale)

Financial Stability Review, November 2019 – Financial Markets
39
Financial institutions should step up their preparations for the phasing-out of the EONIA benchmark rate to reduce operational and legal risks in euro area money markets. The €STR benchmark rate was introduced in October 2019 to replace EONIA rates which are still used to price significant amounts of outstanding derivatives and other financial instruments. The publication of EONIA will cease in January 2022. By then, market participants are required to replace the benchmark in existing derivative contracts to avoid the risk of legal disputes between counterparties over the appropriate benchmark.
Chart 2.5 US repo market stress did not spill over to other currency areas
US money market rates Average and Bund-backed repo rates
(percentages) (percentages)
Sources: Refinitiv and ECB money market statistical reporting (MMSR) dataset.
2.2 Riskier asset prices reliant on low rates
Equity and corporate bond prices continued to appreciate, despite short-lived fluctuations in response to uncertainty surrounding trade tariffs. Announcements of additional US tariffs on Chinese goods prompted a sell-off in equity and credit markets in late July. But declines were once more quickly reversed, extending the rally that had started in January (see Chart 2.6). Similarly, foreign exchange markets and UK financial markets proved sensitive to the possibility of a no-deal Brexit in October, until governments agreed to an extension of the United Kingdom’s membership in the European Union. The strong performance of equities, corporate bonds and lower-rated sovereign bonds this year has so far surpassed measures of expected earnings growth or business sentiment (see Section 1.1).
0
1
2
3
4
5
6
08/18 11/18 02/19 05/19 08/19 11/19
SOFREffective federal funds rateTarget range
0
2
4
6
8
10
12
14
16
18
20
-0.8
-0.8
-0.7
-0.7
-0.6
-0.6
-0.5
-0.5
-0.4
01/18 07/18 01/19 07/19
Average repo rate (all collateral assets)Special repo rate (collateralised with German Bunds)Spread
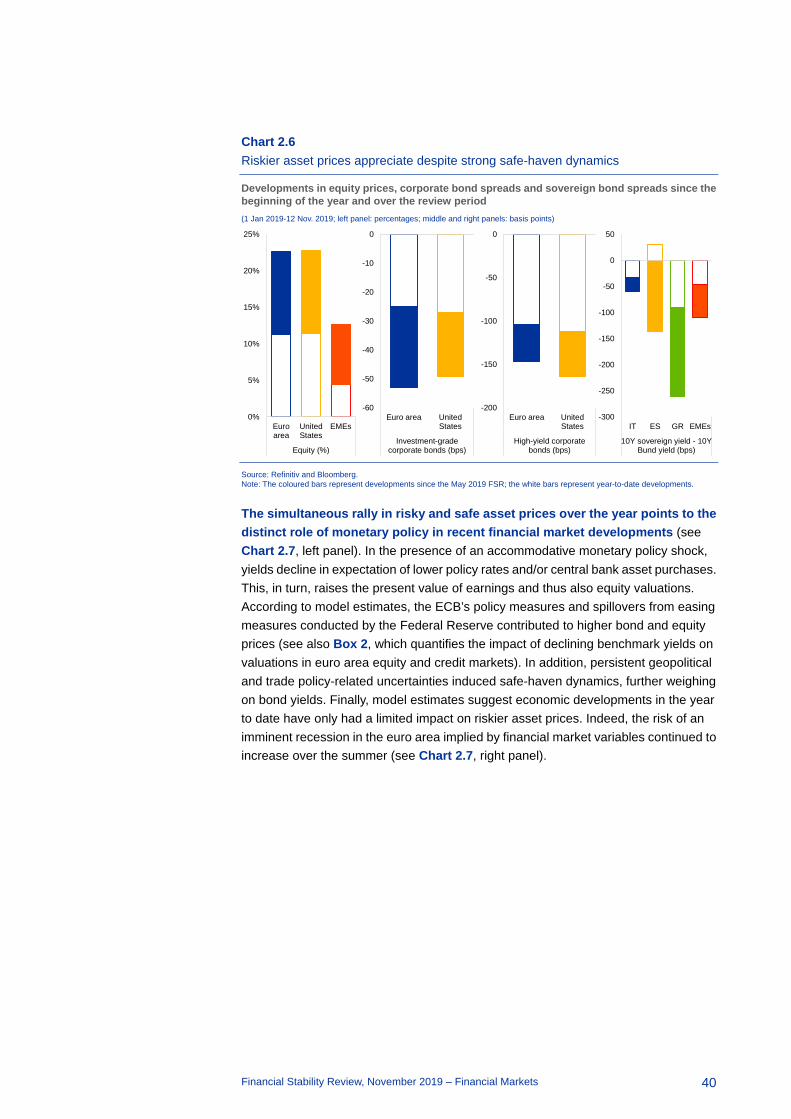
Financial Stability Review, November 2019 – Financial Markets
40
Chart 2.6 Riskier asset prices appreciate despite strong safe-haven dynamics
Developments in equity prices, corporate bond spreads and sovereign bond spreads since the beginning of the year and over the review period (1 Jan 2019-12 Nov. 2019; left panel: percentages; middle and right panels: basis points)
Source: Refinitiv and Bloomberg. Note: The coloured bars represent developments since the May 2019 FSR; the white bars represent year-to-date developments.
The simultaneous rally in risky and safe asset prices over the year points to the distinct role of monetary policy in recent financial market developments (see Chart 2.7, left panel). In the presence of an accommodative monetary policy shock, yields decline in expectation of lower policy rates and/or central bank asset purchases. This, in turn, raises the present value of earnings and thus also equity valuations. According to model estimates, the ECB’s policy measures and spillovers from easing measures conducted by the Federal Reserve contributed to higher bond and equity prices (see also Box 2, which quantifies the impact of declining benchmark yields on valuations in euro area equity and credit markets). In addition, persistent geopolitical and trade policy-related uncertainties induced safe-haven dynamics, further weighing on bond yields. Finally, model estimates suggest economic developments in the year to date have only had a limited impact on riskier asset prices. Indeed, the risk of an imminent recession in the euro area implied by financial market variables continued to increase over the summer (see Chart 2.7, right panel).
0%
5%
10%
15%
20%
25%
Euroarea
UnitedStates
EMEs
Equity (%)
-60
-50
-40
-30
-20
-10
0
Euro area UnitedStates
Investment-gradecorporate bonds (bps)
-200
-150
-100
-50
0
Euro area UnitedStates
High-yield corporatebonds (bps)
-300
-250
-200
-150
-100
-50
0
50
IT ES GR EMEs
10Y sovereign yield - 10YBund yield (bps)
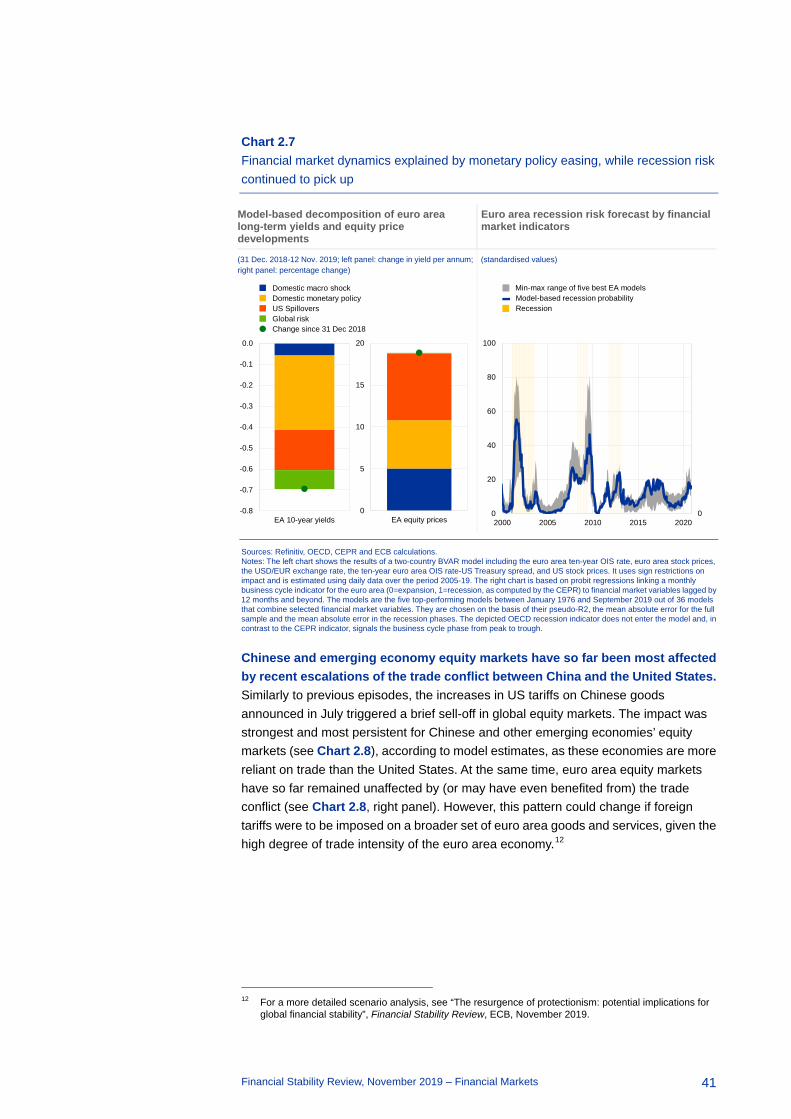
Financial Stability Review, November 2019 – Financial Markets
41
Chart 2.7 Financial market dynamics explained by monetary policy easing, while recession risk continued to pick up
Model-based decomposition of euro area long-term yields and equity price developments
Euro area recession risk forecast by financial market indicators
(31 Dec. 2018-12 Nov. 2019; left panel: change in yield per annum; right panel: percentage change)
(standardised values)
Sources: Refinitiv, OECD, CEPR and ECB calculations. Notes: The left chart shows the results of a two-country BVAR model including the euro area ten-year OIS rate, euro area stock prices, the USD/EUR exchange rate, the ten-year euro area OIS rate-US Treasury spread, and US stock prices. It uses sign restrictions on impact and is estimated using daily data over the period 2005-19. The right chart is based on probit regressions linking a monthly business cycle indicator for the euro area (0=expansion, 1=recession, as computed by the CEPR) to financial market variables lagged by 12 months and beyond. The models are the five top-performing models between January 1976 and September 2019 out of 36 models that combine selected financial market variables. They are chosen on the basis of their pseudo-R2, the mean absolute error for the full sample and the mean absolute error in the recession phases. The depicted OECD recession indicator does not enter the model and, in contrast to the CEPR indicator, signals the business cycle phase from peak to trough.
Chinese and emerging economy equity markets have so far been most affected by recent escalations of the trade conflict between China and the United States. Similarly to previous episodes, the increases in US tariffs on Chinese goods announced in July triggered a brief sell-off in global equity markets. The impact was strongest and most persistent for Chinese and other emerging economies’ equity markets (see Chart 2.8), according to model estimates, as these economies are more reliant on trade than the United States. At the same time, euro area equity markets have so far remained unaffected by (or may have even benefited from) the trade conflict (see Chart 2.8, right panel). However, this pattern could change if foreign tariffs were to be imposed on a broader set of euro area goods and services, given the high degree of trade intensity of the euro area economy.12
12 For a more detailed scenario analysis, see “The resurgence of protectionism: potential implications for
global financial stability”, Financial Stability Review, ECB, November 2019.
-0.8
-0.7
-0.6
-0.5
-0.4
-0.3
-0.2
-0.1
0.0
EA 10-year yields
Domestic macro shockDomestic monetary policyUS SpilloversGlobal riskChange since 31 Dec 2018
0
5
10
15
20
EA equity prices00
20
40
60
80
100
2000 2005 2010 2015 2020
Min-max range of five best EA modelsModel-based recession probabilityRecession
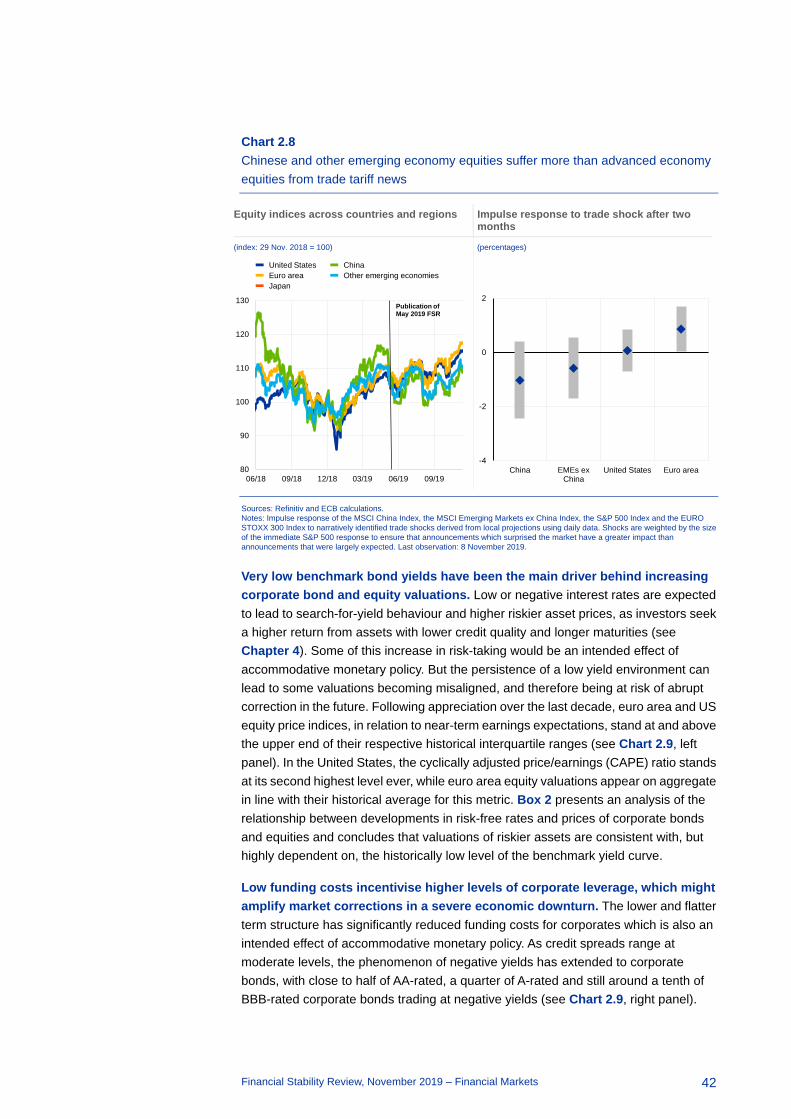
Financial Stability Review, November 2019 – Financial Markets
42
Chart 2.8 Chinese and other emerging economy equities suffer more than advanced economy equities from trade tariff news
Equity indices across countries and regions Impulse response to trade shock after two months
(index: 29 Nov. 2018 = 100) (percentages)
Sources: Refinitiv and ECB calculations. Notes: Impulse response of the MSCI China Index, the MSCI Emerging Markets ex China Index, the S&P 500 Index and the EURO STOXX 300 Index to narratively identified trade shocks derived from local projections using daily data. Shocks are weighted by the size of the immediate S&P 500 response to ensure that announcements which surprised the market have a greater impact than announcements that were largely expected. Last observation: 8 November 2019.
Very low benchmark bond yields have been the main driver behind increasing corporate bond and equity valuations. Low or negative interest rates are expected to lead to search-for-yield behaviour and higher riskier asset prices, as investors seek a higher return from assets with lower credit quality and longer maturities (see Chapter 4). Some of this increase in risk-taking would be an intended effect of accommodative monetary policy. But the persistence of a low yield environment can lead to some valuations becoming misaligned, and therefore being at risk of abrupt correction in the future. Following appreciation over the last decade, euro area and US equity price indices, in relation to near-term earnings expectations, stand at and above the upper end of their respective historical interquartile ranges (see Chart 2.9, left panel). In the United States, the cyclically adjusted price/earnings (CAPE) ratio stands at its second highest level ever, while euro area equity valuations appear on aggregate in line with their historical average for this metric. Box 2 presents an analysis of the relationship between developments in risk-free rates and prices of corporate bonds and equities and concludes that valuations of riskier assets are consistent with, but highly dependent on, the historically low level of the benchmark yield curve.
Low funding costs incentivise higher levels of corporate leverage, which might amplify market corrections in a severe economic downturn. The lower and flatter term structure has significantly reduced funding costs for corporates which is also an intended effect of accommodative monetary policy. As credit spreads range at moderate levels, the phenomenon of negative yields has extended to corporate bonds, with close to half of AA-rated, a quarter of A-rated and still around a tenth of BBB-rated corporate bonds trading at negative yields (see Chart 2.9, right panel).
80
90
100
110
120
130
06/18 09/18 12/18 03/19 06/19 09/19
United StatesEuro areaJapan
ChinaOther emerging economies
Publication of May 2019 FSR
-4
-2
0
2
China EMEs exChina
United States Euro area
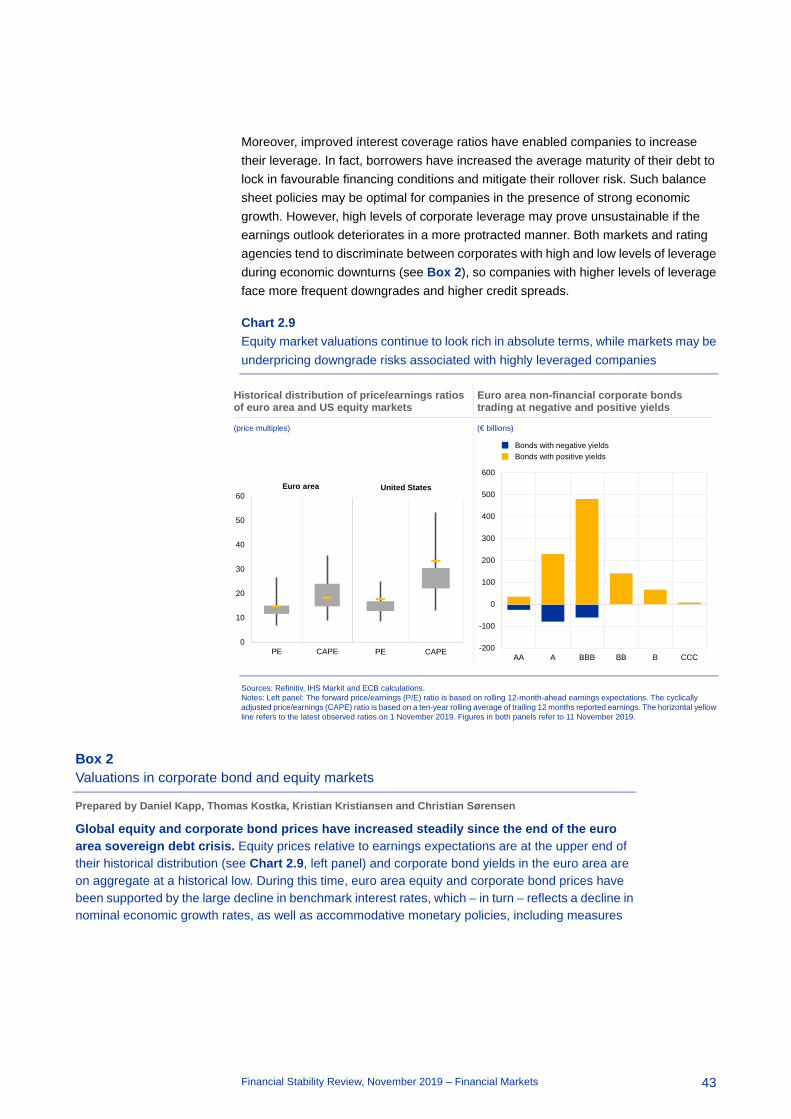
Financial Stability Review, November 2019 – Financial Markets
43
Moreover, improved interest coverage ratios have enabled companies to increase their leverage. In fact, borrowers have increased the average maturity of their debt to lock in favourable financing conditions and mitigate their rollover risk. Such balance sheet policies may be optimal for companies in the presence of strong economic growth. However, high levels of corporate leverage may prove unsustainable if the earnings outlook deteriorates in a more protracted manner. Both markets and rating agencies tend to discriminate between corporates with high and low levels of leverage during economic downturns (see Box 2), so companies with higher levels of leverage face more frequent downgrades and higher credit spreads.
Chart 2.9 Equity market valuations continue to look rich in absolute terms, while markets may be underpricing downgrade risks associated with highly leveraged companies
Historical distribution of price/earnings ratios of euro area and US equity markets
Euro area non-financial corporate bonds trading at negative and positive yields
(price multiples) (€ billions)
Sources: Refinitiv, IHS Markit and ECB calculations. Notes: Left panel: The forward price/earnings (P/E) ratio is based on rolling 12-month-ahead earnings expectations. The cyclically adjusted price/earnings (CAPE) ratio is based on a ten-year rolling average of trailing 12 months reported earnings. The horizontal yellow line refers to the latest observed ratios on 1 November 2019. Figures in both panels refer to 11 November 2019.
Box 2 Valuations in corporate bond and equity markets
Prepared by Daniel Kapp, Thomas Kostka, Kristian Kristiansen and Christian Sørensen
Global equity and corporate bond prices have increased steadily since the end of the euro area sovereign debt crisis. Equity prices relative to earnings expectations are at the upper end of their historical distribution (see Chart 2.9, left panel) and corporate bond yields in the euro area are on aggregate at a historical low. During this time, euro area equity and corporate bond prices have been supported by the large decline in benchmark interest rates, which – in turn – reflects a decline in nominal economic growth rates, as well as accommodative monetary policies, including measures
0
10
20
30
40
50
60
PE CAPE
Euro area
PE CAPE
United States
-200
-100
0
100
200
300
400
500
600
AA A BBB BB B CCC
Bonds with negative yieldsBonds with positive yields

Financial Stability Review, November 2019 – Financial Markets
44
that brought down the short and the long end of the yield curve.13 This box presents model-based estimates of the drivers of price developments in euro area equity and credit markets and draws conclusions for prospective risks associated with asset valuations, in particular under more adverse economic conditions.
The decline in benchmark yields has been one of the main drivers of asset price increases in euro area equity and corporate bond markets. According to ECB staff valuation models, falling discount rates have played a major role in the appreciation of euro area equity prices over the past seven years (see Chart A, left panel). In fact, according to a dividend discount model, half of the increase in aggregate equity prices since the end of the euro area sovereign debt crisis can be attributed to lower benchmark yields, which inflate the present value of future earnings. The remainder is shared between higher dividend payments, an improved earnings outlook and a more favourable risk sentiment. Likewise, the historically low levels of corporate bond yields are largely due to their negative benchmark rate (see Chart A, right panel). Aggregate credit spreads, accounting for changes in rating and maturity structure, are currently broadly in line with historical averages, after increasing somewhat from the compressed levels observed in 2017.
Chart A Equity price inflation and corporate bond yields reflect to a significant extent the decline in benchmark yields
Sources: Refinitiv, IHS Markit and ECB calculations. Notes: Left panel: The decomposition is based on a dividend discount model. The model includes share buybacks, discounts future cash flows with interest rates of appropriate maturity, and includes five expected dividend growth horizons. See Economic Bulletin, Issue 4, ECB, 2018, for more details. The cumulative change is calculated between 1 January 2014 and 13 September 2019 (weekly data). Right panel: The excess bond premium is the deviation of corporate credit spreads from the measured default and duration risk of the issuer. See ECB Working Paper No 1930, July 2016, for more details. The cumulative change is calculated between January 2014 and August 2019 (monthly data).
With increasingly limited scope for euro area benchmark rates to decline to the extent seen over recent years, equity and credit valuations are becoming more sensitive to deteriorations in the macroeconomic outlook or in investor risk appetite. The key role of declining
13 All else equal, equity prices tend to increase and corporate bond yields drop (corporate bond prices
increase) if risk-free rates decline. This relationship is to some extent mechanical. Equity prices reflect changes in discount rates via changes in the net present value of future payouts to shareholders. Likewise, corporate bonds are usually priced using the risk-free yield curve as a benchmark, adding a credit spread which captures the issuer’s credit risk. Beyond these mechanical effects, lower risk-free rates could work by compressing the risk premia associated with these asset classes (namely the equity risk premium and the excess bond premium) as investors increase their demand for riskier assets to maintain a certain absolute return on their portfolios.
Decomposition of the change in euro area non-financial equity prices since June 2012
Decomposition of current non-financial corporate (NFC) bond yields
(percentages, percentage point contributions) (yield per annum, percentage point contributions)
0
25
50
75
Total price changeDiscount rateDividends/Buybacks
Equity risk premiumExpected earnings
-2
-1
0
1
2
3
4
5
AA A BBB BB B
NFC bond yieldBenchmark yield Compensation for default
and duration risk
Excess bond premium
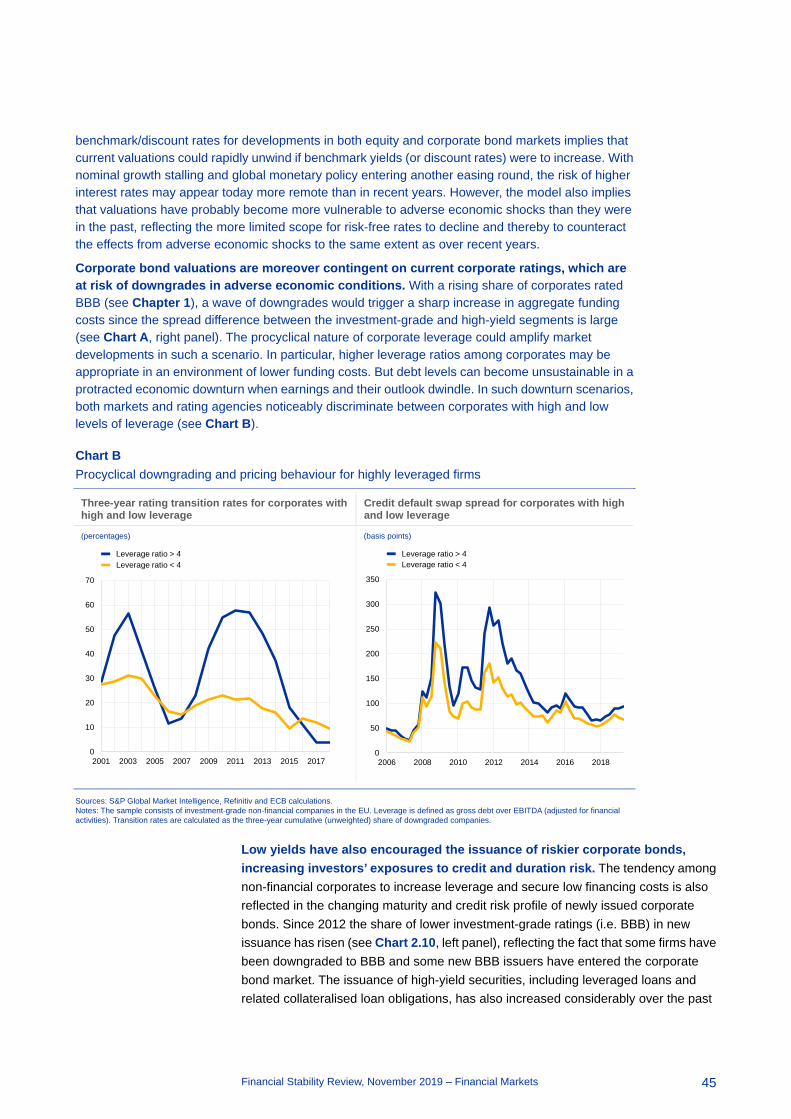
Financial Stability Review, November 2019 – Financial Markets
45
benchmark/discount rates for developments in both equity and corporate bond markets implies that current valuations could rapidly unwind if benchmark yields (or discount rates) were to increase. With nominal growth stalling and global monetary policy entering another easing round, the risk of higher interest rates may appear today more remote than in recent years. However, the model also implies that valuations have probably become more vulnerable to adverse economic shocks than they were in the past, reflecting the more limited scope for risk-free rates to decline and thereby to counteract the effects from adverse economic shocks to the same extent as over recent years.
Corporate bond valuations are moreover contingent on current corporate ratings, which are at risk of downgrades in adverse economic conditions. With a rising share of corporates rated BBB (see Chapter 1), a wave of downgrades would trigger a sharp increase in aggregate funding costs since the spread difference between the investment-grade and high-yield segments is large (see Chart A, right panel). The procyclical nature of corporate leverage could amplify market developments in such a scenario. In particular, higher leverage ratios among corporates may be appropriate in an environment of lower funding costs. But debt levels can become unsustainable in a protracted economic downturn when earnings and their outlook dwindle. In such downturn scenarios, both markets and rating agencies noticeably discriminate between corporates with high and low levels of leverage (see Chart B).
Chart B Procyclical downgrading and pricing behaviour for highly leveraged firms
Sources: S&P Global Market Intelligence, Refinitiv and ECB calculations. Notes: The sample consists of investment-grade non-financial companies in the EU. Leverage is defined as gross debt over EBITDA (adjusted for financial activities). Transition rates are calculated as the three-year cumulative (unweighted) share of downgraded companies.
Low yields have also encouraged the issuance of riskier corporate bonds, increasing investors’ exposures to credit and duration risk. The tendency among non-financial corporates to increase leverage and secure low financing costs is also reflected in the changing maturity and credit risk profile of newly issued corporate bonds. Since 2012 the share of lower investment-grade ratings (i.e. BBB) in new issuance has risen (see Chart 2.10, left panel), reflecting the fact that some firms have been downgraded to BBB and some new BBB issuers have entered the corporate bond market. The issuance of high-yield securities, including leveraged loans and related collateralised loan obligations, has also increased considerably over the past
Three-year rating transition rates for corporates with high and low leverage
Credit default swap spread for corporates with high and low leverage
(percentages) (basis points)
0
10
20
30
40
50
60
70
2001 2003 2005 2007 2009 2011 2013 2015 2017
Leverage ratio > 4Leverage ratio < 4
0
50
100
150
200
250
300
350
2006 2008 2010 2012 2014 2016 2018
Leverage ratio > 4Leverage ratio < 4

Financial Stability Review, November 2019 – Financial Markets
46
five years. That said, more recently there have been tentative signs of this pattern reversing, perhaps reflecting the deterioration in the economic outlook. In addition, corporates have been increasingly issuing at longer maturities since 2012 to secure low financing costs (see Chart 2.10, right panel). As a result, the changing structure of the corporate bond market exposes investors’ portfolios to higher credit and duration risk (see Chapter 4).
Chart 2.10 Corporates increasingly issue lower-rated and longer-maturity bonds
Euro area corporate bond issuance by credit rating
Euro area corporate bond issuance by maturity bucket
(percentages, ratings) (percentages, years to maturity)
Source: ECB Centralised Securities Database. Note: The shares include euro-denominated non-financial corporate bonds issued by resident and foreign borrowers.
Lower yields can also spur demand for less liquid assets, raising the likelihood of events where market liquidity is scarce and adverse price movements are amplified. Institutional investors have recently increased their holdings of illiquid assets since they are often associated with higher and positive returns (see Chapter 4). While aggregate measures of bond market liquidity currently show few signs of stress, two recent episodes illustrate how rapidly it might evaporate in the event of high market volatility (see Chart 2.11).14
14 For more details on the liquidity squeeze in the Italian BTP market in May 2018, see the box entitled
“Liquidity conditions in the Italian sovereign bond markets since May”, Financial Stability Review, ECB, November 2018.
0%
10%
20%
30%
40%
50%
60%
70%
80%
90%
100%
2010 2012 2014 2016 2018
A
BB
BBB
AAA-AAABBBHigh-yieldWeighted average rating (right-hand scale)
0
2
4
6
8
10
12
14
0%
10%
20%
30%
40%
50%
60%
70%
80%
90%
100%
2010 2012 2014 2016 2018
1-5y5-10y10-15y>15yWeighted average maturity, 4-quarter moving average (right-hand scale)

Financial Stability Review, November 2019 – Financial Markets
47
Chart 2.11 Recent episodes indicate that bond market liquidity could dry up rapidly in some markets
Indicators of sovereign bond market liquidity around 29 May 2018
Indicators of corporate bond market liquidity around 15 December 2018
(rates per annum) (prices)
Sources: IHS Markit, EuroMTS, MarketAxess and ECB calculations. Notes: Indicators are normalised to a scale from 0 (high liquidity) to 1 (low liquidity). “During event” (red solid line) denotes the average value on 29 May 2018 (left chart) and 15 December 2018 (right chart). “Before event” (black dashed line) is the average value in the six months before these dates. “After event” (black solid line) is the average value in the six months after these dates. Indicators are colour-coded according to the primary liquidity dimension that they measure: tightness (blue), immediacy (orange), depth (green), breadth (red) and resilience (yellow). “MEC” is short for market efficiency coefficient.

Financial Stability Review, November 2019 – Euro area banking sector
48
3 Euro area banking sector
3.1 Increased challenges to the profitability of the sector
Banks’ profitability weakened further by cyclical factors
Euro area banks’ profitability remained low in the first half of 2019 amid a challenging macroeconomic environment. Following a modest improvement in 2018, the aggregate return on equity (ROE) of euro area significant institutions (SIs) worsened slightly in the twelve months to June 2019, falling to less than 6%. A
Slightly rising cost of credit risk
Eroding interest margins
High cost inefficiencies
Growing challenges from cyclical headwinds to bank profitability
• Eroding interest margins
• Slightly rising cost of credit risk
• High cost inefficiencies
• Plateauing capital positions
Plateauing capital positions
75%of euro area
significant banks have a return on
equity of below 8%
60.566.9
2009 2018
Cost-to-income ratio
2012 2019
Loan-deposit margin
2.6
2.0
6.15.6
2019 2020
Return on equity
2015 2019
CET1 ratio
13.3%
14.2%
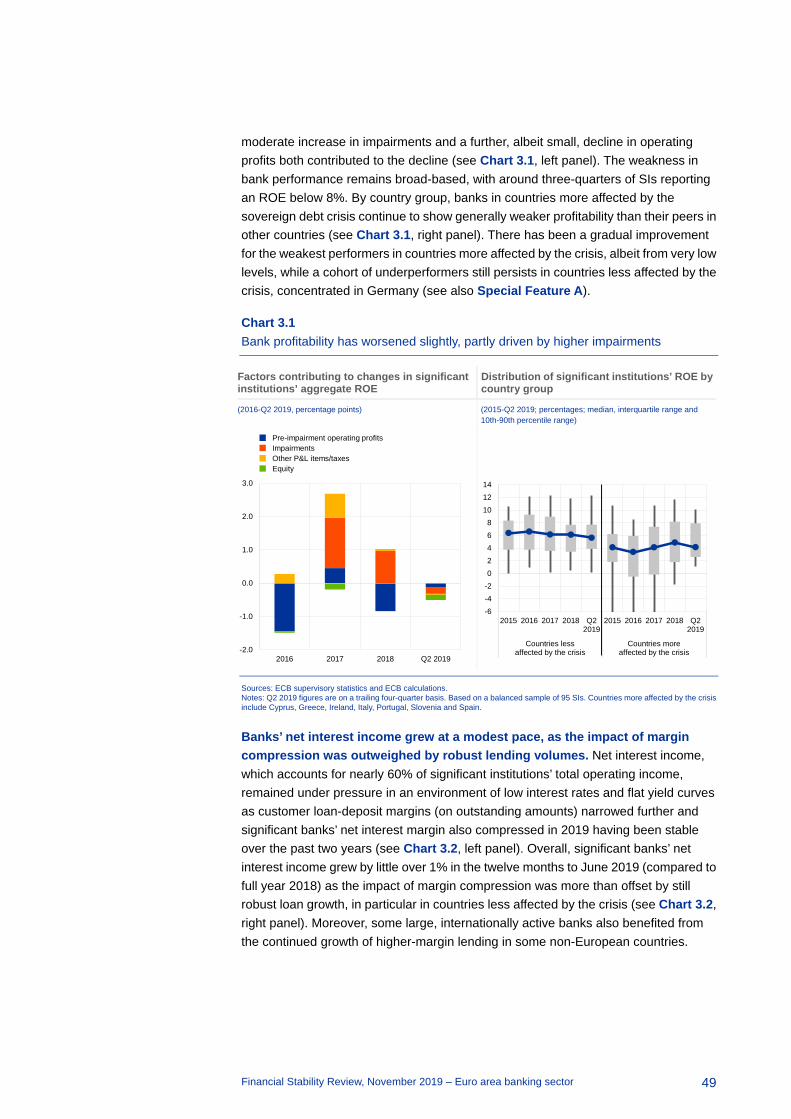
Financial Stability Review, November 2019 – Euro area banking sector
49
moderate increase in impairments and a further, albeit small, decline in operating profits both contributed to the decline (see Chart 3.1, left panel). The weakness in bank performance remains broad-based, with around three-quarters of SIs reporting an ROE below 8%. By country group, banks in countries more affected by the sovereign debt crisis continue to show generally weaker profitability than their peers in other countries (see Chart 3.1, right panel). There has been a gradual improvement for the weakest performers in countries more affected by the crisis, albeit from very low levels, while a cohort of underperformers still persists in countries less affected by the crisis, concentrated in Germany (see also Special Feature A).
Chart 3.1 Bank profitability has worsened slightly, partly driven by higher impairments
Factors contributing to changes in significant institutions’ aggregate ROE
Distribution of significant institutions’ ROE by country group
(2016-Q2 2019, percentage points) (2015-Q2 2019; percentages; median, interquartile range and 10th-90th percentile range)
Sources: ECB supervisory statistics and ECB calculations. Notes: Q2 2019 figures are on a trailing four-quarter basis. Based on a balanced sample of 95 SIs. Countries more affected by the crisis include Cyprus, Greece, Ireland, Italy, Portugal, Slovenia and Spain.
Banks’ net interest income grew at a modest pace, as the impact of margin compression was outweighed by robust lending volumes. Net interest income, which accounts for nearly 60% of significant institutions’ total operating income, remained under pressure in an environment of low interest rates and flat yield curves as customer loan-deposit margins (on outstanding amounts) narrowed further and significant banks’ net interest margin also compressed in 2019 having been stable over the past two years (see Chart 3.2, left panel). Overall, significant banks’ net interest income grew by little over 1% in the twelve months to June 2019 (compared to full year 2018) as the impact of margin compression was more than offset by still robust loan growth, in particular in countries less affected by the crisis (see Chart 3.2, right panel). Moreover, some large, internationally active banks also benefited from the continued growth of higher-margin lending in some non-European countries.
-2.0
-1.0
0.0
1.0
2.0
3.0
2016 2017 2018 Q2 2019
Pre-impairment operating profitsImpairmentsOther P&L items/taxesEquity
-6-4-202468
101214
2015 2016 2017 2018 Q22019
2015 2016 2017 2018 Q22019
Countries lessaffected by the crisis
Countries moreaffected by the crisis
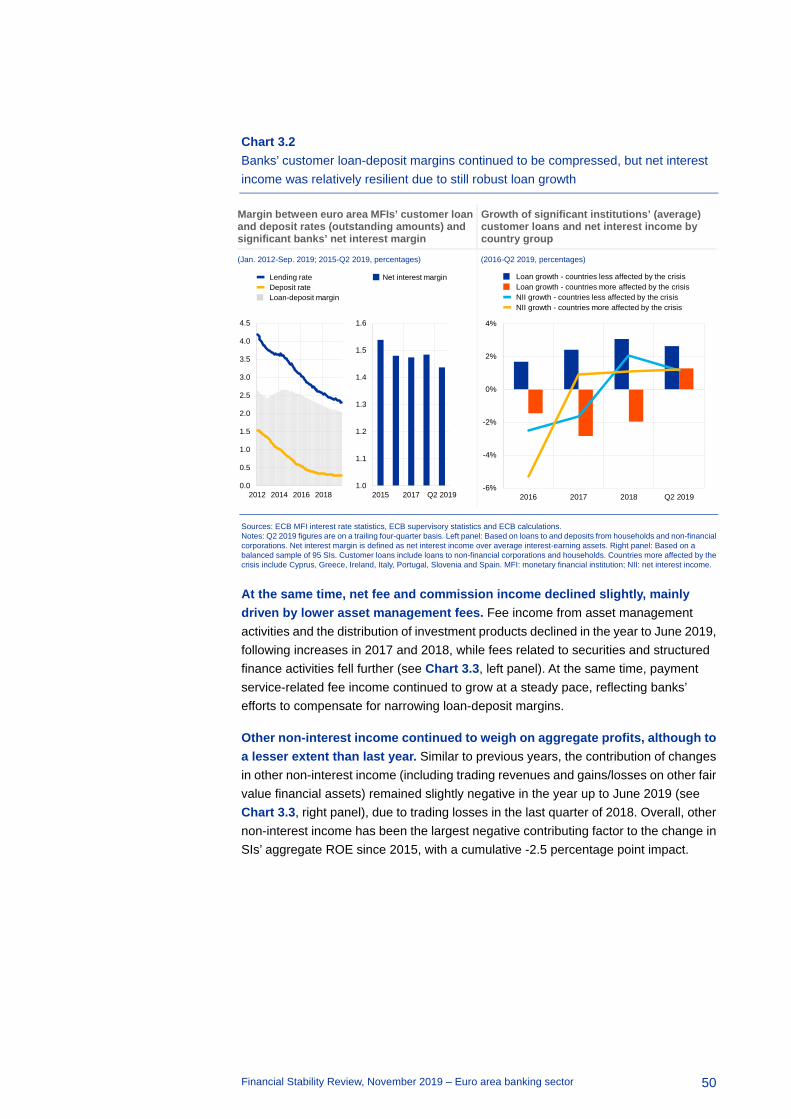
Financial Stability Review, November 2019 – Euro area banking sector
50
Chart 3.2 Banks’ customer loan-deposit margins continued to be compressed, but net interest income was relatively resilient due to still robust loan growth
Margin between euro area MFIs’ customer loan and deposit rates (outstanding amounts) and significant banks’ net interest margin
Growth of significant institutions’ (average) customer loans and net interest income by country group
(Jan. 2012-Sep. 2019; 2015-Q2 2019, percentages) (2016-Q2 2019, percentages)
Sources: ECB MFI interest rate statistics, ECB supervisory statistics and ECB calculations. Notes: Q2 2019 figures are on a trailing four-quarter basis. Left panel: Based on loans to and deposits from households and non-financial corporations. Net interest margin is defined as net interest income over average interest-earning assets. Right panel: Based on a balanced sample of 95 SIs. Customer loans include loans to non-financial corporations and households. Countries more affected by the crisis include Cyprus, Greece, Ireland, Italy, Portugal, Slovenia and Spain. MFI: monetary financial institution; NII: net interest income.
At the same time, net fee and commission income declined slightly, mainly driven by lower asset management fees. Fee income from asset management activities and the distribution of investment products declined in the year to June 2019, following increases in 2017 and 2018, while fees related to securities and structured finance activities fell further (see Chart 3.3, left panel). At the same time, payment service-related fee income continued to grow at a steady pace, reflecting banks’ efforts to compensate for narrowing loan-deposit margins.
Other non-interest income continued to weigh on aggregate profits, although to a lesser extent than last year. Similar to previous years, the contribution of changes in other non-interest income (including trading revenues and gains/losses on other fair value financial assets) remained slightly negative in the year up to June 2019 (see Chart 3.3, right panel), due to trading losses in the last quarter of 2018. Overall, other non-interest income has been the largest negative contributing factor to the change in SIs’ aggregate ROE since 2015, with a cumulative -2.5 percentage point impact.
0.0
0.5
1.0
1.5
2.0
2.5
3.0
3.5
4.0
4.5
2012 2014 2016 2018
Lending rateDeposit rateLoan-deposit margin
1.0
1.1
1.2
1.3
1.4
1.5
1.6
2015 2017 Q2 2019
Net interest margin
-6%
-4%
-2%
0%
2%
4%
2016 2017 2018 Q2 2019
Loan growth - countries less affected by the crisisLoan growth - countries more affected by the crisisNII growth - countries less affected by the crisisNII growth - countries more affected by the crisis
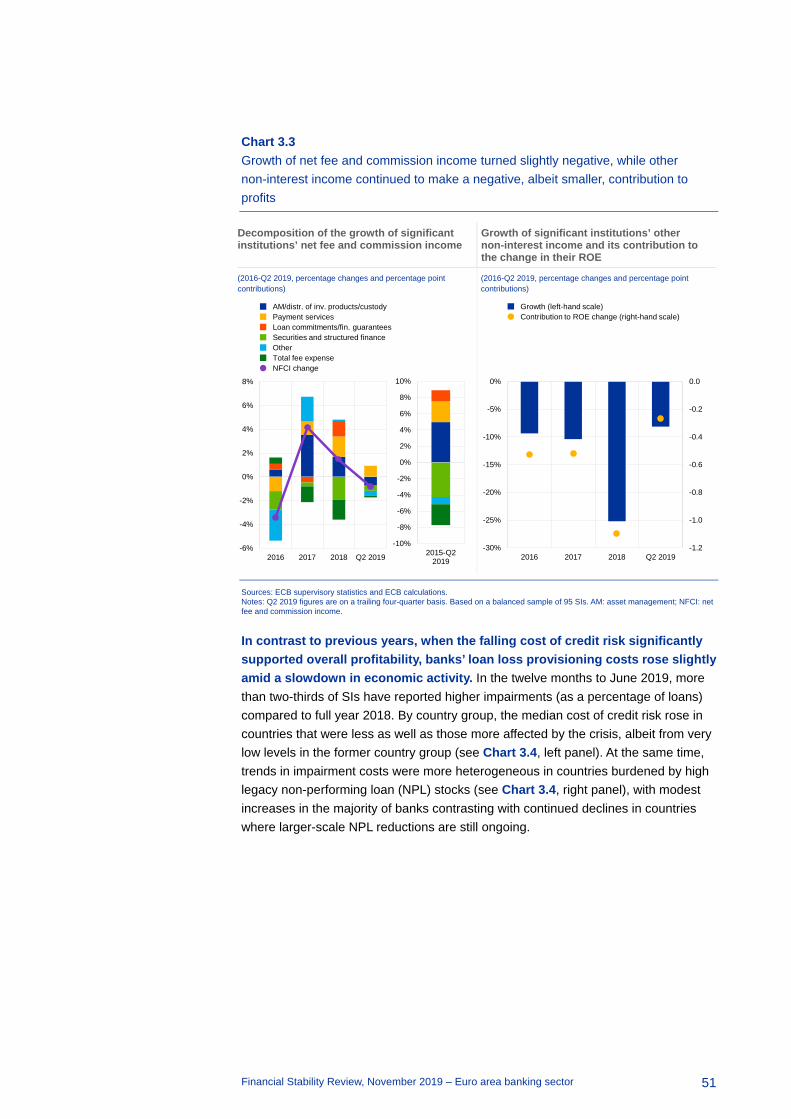
Financial Stability Review, November 2019 – Euro area banking sector
51
Chart 3.3 Growth of net fee and commission income turned slightly negative, while other non-interest income continued to make a negative, albeit smaller, contribution to profits
Decomposition of the growth of significant institutions’ net fee and commission income
Growth of significant institutions’ other non-interest income and its contribution to the change in their ROE
(2016-Q2 2019, percentage changes and percentage point contributions)
(2016-Q2 2019, percentage changes and percentage point contributions)
Sources: ECB supervisory statistics and ECB calculations. Notes: Q2 2019 figures are on a trailing four-quarter basis. Based on a balanced sample of 95 SIs. AM: asset management; NFCI: net fee and commission income.
In contrast to previous years, when the falling cost of credit risk significantly supported overall profitability, banks’ loan loss provisioning costs rose slightly amid a slowdown in economic activity. In the twelve months to June 2019, more than two-thirds of SIs have reported higher impairments (as a percentage of loans) compared to full year 2018. By country group, the median cost of credit risk rose in countries that were less as well as those more affected by the crisis, albeit from very low levels in the former country group (see Chart 3.4, left panel). At the same time, trends in impairment costs were more heterogeneous in countries burdened by high legacy non-performing loan (NPL) stocks (see Chart 3.4, right panel), with modest increases in the majority of banks contrasting with continued declines in countries where larger-scale NPL reductions are still ongoing.
-6%
-4%
-2%
0%
2%
4%
6%
8%
2016 2017 2018 Q2 2019
AM/distr. of inv. products/custodyPayment servicesLoan commitments/fin. guaranteesSecurities and structured financeOtherTotal fee expenseNFCI change
-10%
-8%
-6%
-4%
-2%
0%
2%
4%
6%
8%
10%
2015-Q22019
-1.2
-1.0
-0.8
-0.6
-0.4
-0.2
0.0
-30%
-25%
-20%
-15%
-10%
-5%
0%
2016 2017 2018 Q2 2019
Growth (left-hand scale)Contribution to ROE change (right-hand scale)

Financial Stability Review, November 2019 – Euro area banking sector
52
Chart 3.4 The cost of credit risk rose in most countries that were less affected by the crisis, albeit from low levels, with more heterogeneous patterns in countries burdened by high legacy NPL stocks
Distribution of significant institutions’ impairments-to-customer loans ratio in countries less affected by the crisis
Distribution of significant institutions’ impairments-to-customer loans ratio in countries more affected by the crisis
(2015-Q2 2019; percentages; median and interquartile range) (2015-Q2 2019; percentages; median and interquartile range)
Sources: ECB supervisory statistics and ECB calculations. Notes: Ratio of impairments on financial assets to customer loans (non-financial corporation and household loans). Q2 2019 figures are on a trailing four-quarter basis. Based on a balanced sample of 95 SIs. Countries more affected by the crisis include Cyprus, Greece, Ireland, Italy, Portugal, Slovenia and Spain.
Structural factors continue to weigh on banks’ profitability
Euro area banks have made little progress overall in improving their cost-efficiency since the global financial crisis. Having steadily risen between 2009 and 2012, euro area banks’ aggregate cost-to-assets and cost-to-income ratios have remained stubbornly elevated above ten-year average levels (see Chart 3.5, left panel). Euro area banks’ cost-to-income ratios are also elevated relative to international peers: their costs absorbed 66% of income in 2018 versus only 57% in the United States. More recently, significant institutions’ cost ratios have shown little sign of improvement. While SIs’ median cost-to-income ratio stabilised in the twelve months to June 2019, dispersion across banks remains wide (see Chart 3.5, right panel), with one-third of SIs exhibiting cost-to-income ratios at or above 70%. On a cost-to-assets basis, banks in the best-performing quartile achieved some cost-efficiency gains, but the median cost-to-assets ratio remained broadly flat and signalled no improvements in efficiency since 2015 (see Chart 3.5, right panel).
Given the difficulties in growing revenues, a number of banks have sought to optimise cost structures and invest in digitalisation, but these efforts require time to yield net benefits. While headcount and branch reductions have lowered the cost-to-assets ratio at some banks, in general the relationship was weak in the period 2012-18 (see Chart 3.6, left panel). This suggests that cost savings from branch rationalisation and staff layoffs could be offset by restructuring costs or the need to
-0.1
0.0
0.1
0.2
0.3
0.4
0.5
0.6
2015 2016 2017 2018 Q2 2019
MedianInterquartile range
0.0
0.5
1.0
1.5
2.0
2.5
2015 2016 2017 2018 Q2 2019
MedianInterquartile range

Financial Stability Review, November 2019 – Euro area banking sector
53
spend more on digital platforms. In fact, a decomposition of changes in operating costs for a sub-sample of 50 SIs shows that IT expenses were the most important factor increasing operating costs in the period between 2014 and 2018 (see Chart 3.6, right panel). Similarly, IT investment spending, as proxied by capitalised software costs, has shown a steady upward trend in the last few years. For a sub-sample of 49 SIs, capitalised software balances (expressed as a percentage of operating costs) rose from 7% in 2012 to 12% in 2018. As capitalised software is typically amortised over 3-5 years, higher investment spending will also add to banks’ future operating expenses through increased amortisation. At the same time, digitalisation provides room for longer-term efficiency gains and for exploiting new business opportunities.
Chart 3.5 Euro area banks have overall made little progress in improving their cost-efficiency since the global financial crisis
Euro area banks’ aggregate cost-to-income and cost-to-assets ratios
Distribution of significant institutions’ cost-to-income and cost-to-assets ratios
(2009-Q2 2019, percentages) (2015-Q2 2019; percentages; median, interquartile range and 10th-90th percentile range)
Sources: ECB consolidated banking data, ECB supervisory statistics and ECB calculations. Note: The cost-to-assets ratio is calculated with average assets in the denominator.
A further challenge for banks relates to operational risks stemming from IT disruption and cyber threats. The 2019 risk assessment by ECB Banking Supervision identified cybercrime and IT disruptions as one of the top-three key risk drivers affecting the euro area banking system.15 While significant institutions have so far not reported any major incident, cyberattacks could lead to material financial losses or can affect banks negatively through confidence channels.
Banks’ inability to improve cost-efficiency over a longer period could be related to structural impediments. Empirical studies have found that euro area banks’ cost inefficiencies can be mostly attributed to persistent inefficiencies, suggesting that long-term structural factors play a significantly bigger role in bank efficiency than time-varying factors.16 In fact, there is some evidence of excess capacity in the euro
15 See ECB Banking Supervision: Risk Assessment for 2019, ECB Banking Supervision, 2019. 16 See Huljak, I., Martin, R. and Moccero, D., “The cost-efficiency and productivity growth of euro area
banks”, Working Paper Series, No 2305, ECB, August 2019.
56
58
60
62
64
66
68
2009
2011
2013
2015
2017
Q2
2019
Cost-to-income ratio10-year average
1.15
1.20
1.25
1.30
1.35
1.40
1.45
1.50
1.55
2009
2011
2013
2015
2017
Q2
2019
Cost-to-assets ratio10-year average
30
40
50
60
70
80
90
2015 2017 Q22019
Cost-to-income ratio
0.00.20.40.60.81.01.21.41.61.82.02.22.4
2015 2017 Q22019
Cost-to-assets ratio
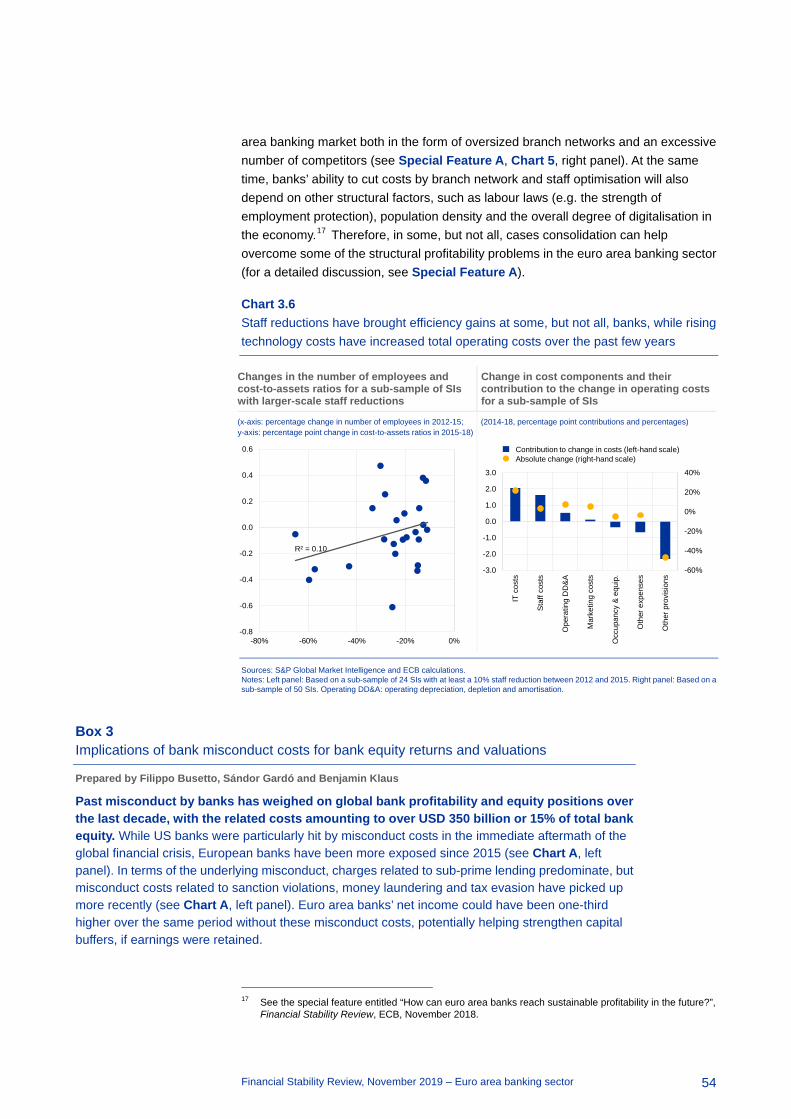
Financial Stability Review, November 2019 – Euro area banking sector
54
area banking market both in the form of oversized branch networks and an excessive number of competitors (see Special Feature A, Chart 5, right panel). At the same time, banks’ ability to cut costs by branch network and staff optimisation will also depend on other structural factors, such as labour laws (e.g. the strength of employment protection), population density and the overall degree of digitalisation in the economy.17 Therefore, in some, but not all, cases consolidation can help overcome some of the structural profitability problems in the euro area banking sector (for a detailed discussion, see Special Feature A).
Chart 3.6 Staff reductions have brought efficiency gains at some, but not all, banks, while rising technology costs have increased total operating costs over the past few years
Changes in the number of employees and cost-to-assets ratios for a sub-sample of SIs with larger-scale staff reductions
Change in cost components and their contribution to the change in operating costs for a sub-sample of SIs
(x-axis: percentage change in number of employees in 2012-15; y-axis: percentage point change in cost-to-assets ratios in 2015-18)
(2014-18, percentage point contributions and percentages)
Sources: S&P Global Market Intelligence and ECB calculations. Notes: Left panel: Based on a sub-sample of 24 SIs with at least a 10% staff reduction between 2012 and 2015. Right panel: Based on a sub-sample of 50 SIs. Operating DD&A: operating depreciation, depletion and amortisation.
Box 3 Implications of bank misconduct costs for bank equity returns and valuations
Prepared by Filippo Busetto, Sándor Gardó and Benjamin Klaus
Past misconduct by banks has weighed on global bank profitability and equity positions over the last decade, with the related costs amounting to over USD 350 billion or 15% of total bank equity. While US banks were particularly hit by misconduct costs in the immediate aftermath of the global financial crisis, European banks have been more exposed since 2015 (see Chart A, left panel). In terms of the underlying misconduct, charges related to sub-prime lending predominate, but misconduct costs related to sanction violations, money laundering and tax evasion have picked up more recently (see Chart A, left panel). Euro area banks’ net income could have been one-third higher over the same period without these misconduct costs, potentially helping strengthen capital buffers, if earnings were retained.
17 See the special feature entitled “How can euro area banks reach sustainable profitability in the future?”,
Financial Stability Review, ECB, November 2018.
R² = 0.10
-0.8
-0.6
-0.4
-0.2
0.0
0.2
0.4
0.6
-80% -60% -40% -20% 0%
-60%
-40%
-20%
0%
20%
40%
-3.0
-2.0
-1.0
0.0
1.0
2.0
3.0
IT c
osts
Staf
f cos
ts
Ope
ratin
g D
D&A
Mar
ketin
g co
sts
Occ
upan
cy &
equ
ip.
Oth
er e
xpen
ses
Oth
er p
rovi
sion
s
Contribution to change in costs (left-hand scale)Absolute change (right-hand scale)

Financial Stability Review, November 2019 – Euro area banking sector
55
Misconduct costs may also affect bank stock returns and market valuations. They do this both directly, via adverse reputational effects, and indirectly, through heightened provisioning needs, higher compliance costs and, thus, lower profit expectations.18 This relationship appears to hold within individual countries, signalling that investors discriminate based on misconduct costs after controlling for common macro-financial factors (see Chart A, right panel).
Chart A European banks’ balance sheets and equity valuations have been more affected by misconduct costs in recent years than those of their US peers
Sources: Authors’ compilation based on publicly available information from regulatory, bank and law firm notices and Bloomberg. Notes: Left panel: Misconduct costs comprise damages, fines, settlements and litigation costs above USD 1 million for a sample of 26 global banks headquartered in the United States (8), the United Kingdom (5), Switzerland (2) and the euro area (11). Sub-prime-related charges cover misconduct costs related to the issuance, structuring, marketing and sale of residential mortgage-backed securities and collateralised debt obligations, and to the underwriting, origination and servicing of mortgage loans. Unsound bank practices include the mis-selling of payment protection insurance, disclosure, reporting and compliance failures, as well as investment advice failings. Market price manipulation comprises fraudulent behaviour in interest rate, foreign exchange, swap, gold and silver price fixing. Sanctions, money laundering and tax evasion reflect the failure to comply with international sanctions, anti-money laundering failures and banks’ involvement in or assistance of tax evasion.
Analysis of a unique dataset of major global banks’ misconduct costs indicates that financial penalties have a large impact on euro area banks’ expected equity returns. Eight euro area banks included in the sample, of which seven are classified as global systemically important banks, were affected by misconduct costs between January 2008 and September 2019. The data contain information on all fines with a minimum threshold of USD 100 million and their settlement date, with the rationale being that higher fines are more likely to trigger stock market reactions than smaller ones. Both full-sample and rolling-window panel regressions are employed to estimate the impact of misconduct costs on euro area bank equity returns, controlling for other bank-specific factors.19 In the overall sample, standardised coefficients indicate that a one standard deviation increase in misconduct costs is associated with a 0.2 standard deviation drop in equity returns. The impact of
18 See, for example, Koster, H. and Pelster, M., “Financial penalties and bank performance”, Journal of
Banking and Finance, No 79, 2017; Delis, M. D., Staikouras, P. K. and Tsoumas, C., “Formal enforcement actions and bank behaviour”, Management Science, Vol. 63, No 4, 2016; Armour, J., Mayer, C. and Polo, A., “Regulatory Sanctions and Reputational Damage in Financial Markets”, Oxford Legal Studies Research Paper No 62/2010; and Report on misconduct risk in the banking sector, European Systemic Risk Board, July 2015.
19 The exercise captures the market reaction at the date when the settlement is disclosed, but not whether and to what extent expectations were already priced in by market participants.
Global banks’ misconduct costs by geographical area and type of misconduct since the global financial crisis
Global banks’ cumulative misconduct costs relative to total equity and average price-to-book ratios for 2008-19
(Q1 2008-Q3 2019, USD billions, percentage of total) (2008-19, percentage of average total equity, ratio)
0%
10%
20%
30%
40%
50%
60%
70%
80%
90%
100%
11 13 15 17 19
Sub-prime-relatedchargesUnsound bank practicesMarket price manipulationSanctions/money laundering/tax evasion
0
10
20
30
40
50
60
70
80
08 10 12 14 16 18
US banksUK banksEuro area banksSwiss banks
0.4
0.6
0.8
1.0
1.2
1.4
1.6
0 10 20 30 40 50
Pric
e-to
-boo
k ra
tio
Misconduct costs
Euro areaUnited KingdomSwitzerlandUnited States

Financial Stability Review, November 2019 – Euro area banking sector
56
misconduct costs on stock returns has been comparable to that of NPL stocks, while being markedly lower than that of bank size and leverage (see Chart B, left panel). A rolling-window regression indicates that the relationship between misconduct costs and stock returns was stronger during the crisis than in the following years (see Chart B, right panel). Even though time fixed effects remove at least parts of the impact of business cycle dynamics, the larger coefficient at the beginning of the sample likely indicates that investors are more concerned about penalties during times of stress.
Chart B Euro area bank stock returns appear to be sensitive to misconduct costs, while also being driven by other bank-specific variables
Sources: Bloomberg and authors’ calculations. Notes: Left panel: All variables are standardised before running the regression to make results comparable across variables. The independent variables are: (1) PENALTY: total financial penalties relative to total assets; (2) CAP: equity/total assets; (3) SIZE: log of total assets; (4) NPL: non-performing loans/total loans; (5) FUND: deposits/total funding; (6) BETA: banks’ equity beta from a market model of monthly returns, where the market is represented by the local market index; and (7) GDP: year-on-year real GDP growth. The panel regression also includes additional controls such as bank profitability, the price-to-book ratio, operating expenses and risk-weighted assets. Right panel: The coefficients are based on a six-year rolling-window panel regression with bank-specific control variables, and bank and time fixed effects. Heteroscedasticity-robust standard errors are computed. Solid lines represent coefficient estimates, while dashed lines indicate the 90% confidence intervals.
As past misconduct cases are uncovered, conduct redress may put further pressure on euro area bank valuations. This highlights the importance of implementing good governance practices and sound internal controls, the monitoring of which has been a top priority of the Single Supervisory Mechanism in recent years. Swift investigation and closure of misconduct cases could help dispel at least part of the uncertainty surrounding euro area bank profitability prospects and keep reputational damage associated with misconduct costs in check. Regulators and supervisors should monitor banks to ensure that they adopt behaviours and internal practices with the aim of limiting the potential for misconduct.
Banks’ profitability prospects weakened amid expectations of a more challenging macro-financial environment
According to their own forecasts, significant institutions expect weaker profitability this year before recovering in 2021.20 Based on the results of the 20 For details, see “Profitability: banks expect to remain under pressure”, Supervision Newsletter, ECB,
November 2019.
Factors explaining changes in euro area banks’ stock returns based on overall sample
Rolling-window coefficients of misconduct costs for euro area banks’ stock returns
(2008-18, normalised coefficients) (point estimates and confidence intervals)
-2.0
-1.5
-1.0
-0.5
0.0
0.5
1.0
SIZE CAP NPL PENALTY FUND BETA GDP
Confidence intervalPoint estimate
-2.5
-2.0
-1.5
-1.0
-0.5
0.0
2008-13 2009-14 2010-15 2011-16 2012-17 2013-18

Financial Stability Review, November 2019 – Euro area banking sector
57
SSM’s latest annual profitability forecast exercise, the median ROE of SIs was expected to dip just below 6% in 2019 and then gradually recover to 7% by 2021 (see Chart 3.7, left panel). On average, underperforming banks have projected stronger improvements in their profitability.
However, these projections, based on end-2018 economic assumptions, do not factor in the significant downward revisions in macroeconomic forecasts this year. Downward revisions to GDP growth forecasts and, in particular, a marked downward shift in interest rate expectations for 2020-21 relative to those embedded in banks’ projections (see Chart 3.7, right panel) have rendered SIs’ revenue and thus profitability expectations too optimistic.
Chart 3.7 Banks project some improvement in their profitability until 2021, but growth and interest rate expectations have fallen since these projections were made
Distribution of significant institutions’ ROE projections for 2019-21
Interest rate assumptions underlying banks’ profitability projections compared with those in official macroeconomic forecasts
(2018 (actual), 2019-21 (forecasts); percentages; median and interquartile, 10th-90th percentile and 5th-95th percentile ranges)
(2019-21, interest rate projections/assumptions underlying bank ROE and official macroeconomic projections)
Sources: SSM profitability forecast exercise and ECB/Eurosystem macroeconomic projections. Note: Banks’ ROE projections were provided in December 2018.
Market expectations of future bank profitability have already been downgraded this year, in line with weaker revenue growth expectations. Bank market valuations remain depressed, reflecting continuing concerns over the outlook for banks’ profitability. Bank stock prices have underperformed the broad market in the year to date, with market perceptions of banks linked to changes in growth and interest rate expectations (see Chart 3.8, left panel). Since May 2019, analysts have further revised down 2020-21 profit forecasts for listed banks and currently project only a slight improvement in the median ROE in the next two years from lower levels in 2019 (see Chart 3.8, right panel). These downgrades were mainly driven by the lowering of revenue expectations, in anticipation of weaker economic growth and lower-for-longer interest rates (see Chart 3.8, right panel). In international comparison, the median
6.2%
5.8% 6.1%
7.1%
-2%
0%
2%
4%
6%
8%
10%
12%
14%
16%
2018 2019 2020 2021
SSM median projection (this year)SSM median projection (last year)
-0.8%
-0.6%
-0.4%
-0.2%
0.0%
0.2%
0.4%
0.6%
2019 2020 2021
3-month EURIBOR (banks'projections - median)3-month EURIBOR (Dec.18 Eurosystem staff projections)3-month EURIBOR (Sep.19 ECB staff projections)
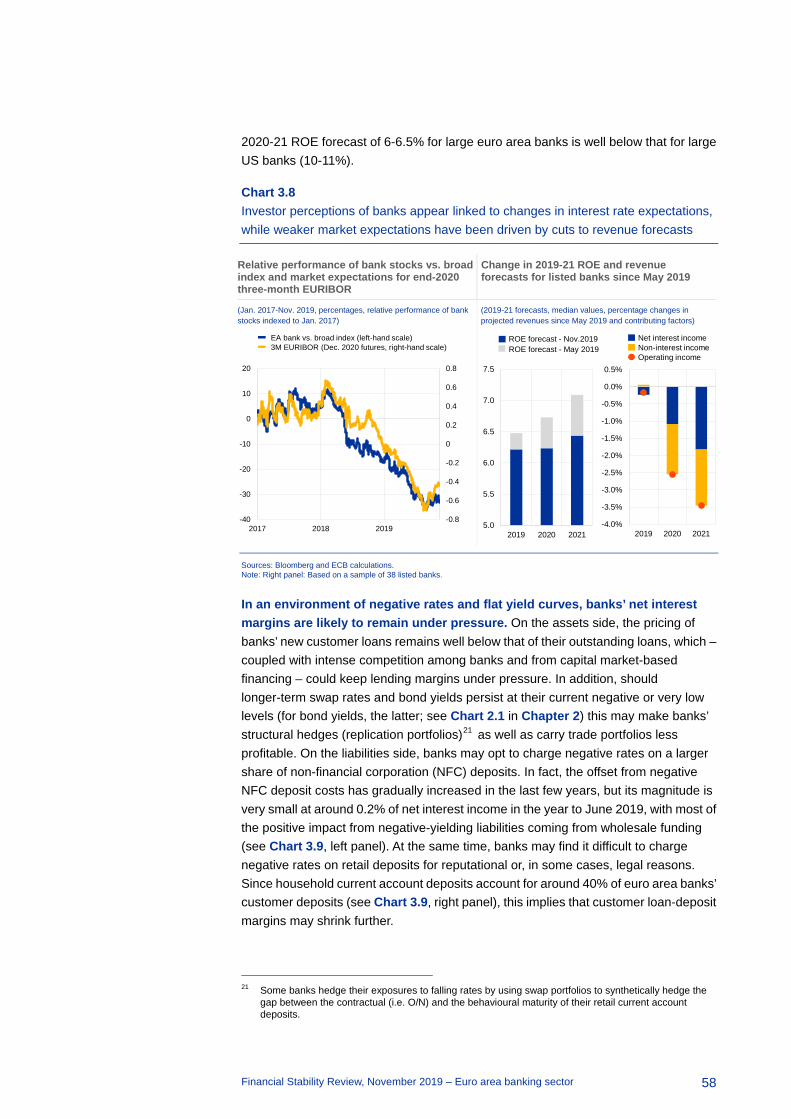
Financial Stability Review, November 2019 – Euro area banking sector
58
2020-21 ROE forecast of 6-6.5% for large euro area banks is well below that for large US banks (10-11%).
Chart 3.8 Investor perceptions of banks appear linked to changes in interest rate expectations, while weaker market expectations have been driven by cuts to revenue forecasts
Relative performance of bank stocks vs. broad index and market expectations for end-2020 three-month EURIBOR
Change in 2019-21 ROE and revenue forecasts for listed banks since May 2019
(Jan. 2017-Nov. 2019, percentages, relative performance of bank stocks indexed to Jan. 2017)
(2019-21 forecasts, median values, percentage changes in projected revenues since May 2019 and contributing factors)
Sources: Bloomberg and ECB calculations. Note: Right panel: Based on a sample of 38 listed banks.
In an environment of negative rates and flat yield curves, banks’ net interest margins are likely to remain under pressure. On the assets side, the pricing of banks’ new customer loans remains well below that of their outstanding loans, which – coupled with intense competition among banks and from capital market-based financing – could keep lending margins under pressure. In addition, should longer-term swap rates and bond yields persist at their current negative or very low levels (for bond yields, the latter; see Chart 2.1 in Chapter 2) this may make banks’ structural hedges (replication portfolios)21 as well as carry trade portfolios less profitable. On the liabilities side, banks may opt to charge negative rates on a larger share of non-financial corporation (NFC) deposits. In fact, the offset from negative NFC deposit costs has gradually increased in the last few years, but its magnitude is very small at around 0.2% of net interest income in the year to June 2019, with most of the positive impact from negative-yielding liabilities coming from wholesale funding (see Chart 3.9, left panel). At the same time, banks may find it difficult to charge negative rates on retail deposits for reputational or, in some cases, legal reasons. Since household current account deposits account for around 40% of euro area banks’ customer deposits (see Chart 3.9, right panel), this implies that customer loan-deposit margins may shrink further.
21 Some banks hedge their exposures to falling rates by using swap portfolios to synthetically hedge the
gap between the contractual (i.e. O/N) and the behavioural maturity of their retail current account deposits.
-0.8
-0.6
-0.4
-0.2
0
0.2
0.4
0.6
0.8
-40
-30
-20
-10
0
10
20
2017 2018 2019
EA bank vs. broad index (left-hand scale)3M EURIBOR (Dec. 2020 futures, right-hand scale)
-4.0%
-3.5%
-3.0%
-2.5%
-2.0%
-1.5%
-1.0%
-0.5%
0.0%
0.5%
2019 2020 2021
Net interest incomeNon-interest incomeOperating income
5.0
5.5
6.0
6.5
7.0
7.5
2019 2020 2021
ROE forecast - Nov.2019ROE forecast - May 2019

Financial Stability Review, November 2019 – Euro area banking sector
59
Chart 3.9 Banks may find it difficult to pass through negative rates to retail deposits and are more likely to charge negative rates on a larger share of NFC deposits
Contribution of negative-yielding liabilities to significant institutions’ net interest income by country group
Share of household current account deposits in customer deposits in euro area countries
(2016-Q2 2019, percentage of net interest income) (Sep. 2019, percentages)
Sources: ECB MFI balance sheet statistics, ECB supervisory statistics and ECB calculations. Notes: Left panel: Q2 2019 figures are on a trailing four-quarter basis. Based on a balanced sample of 91 SIs. The income from household deposits with negative rates is negligible (0.02% of net interest income). Countries more affected by the crisis include Cyprus, Greece, Ireland, Italy, Portugal, Slovenia and Spain. Right panel: Customer deposits are the sum of household and corporate deposits.
At the same time, low rates will continue to support the growth of lending volumes and the introduction of a two-tier system for central bank deposits provides at least a partial offset to margin pressure in the near term. Steady growth in bank lending has helped so far to offset the impact of compressed margins, in particular in countries less affected by the crisis, with loan growth expected to further benefit from low borrowing costs. Furthermore, the two-tier system for reserve remuneration will provide some offset to margin pressures for banks with high excess liquidity, while the more favourable terms of TLTRO III could slightly benefit the larger users of central bank funding.
Overall, the prospect of weaker economic growth and lower interest rates is likely to weigh further on profitability expectations for euro area banks in the period ahead. Baseline ROE projections using the ECB’s top-down stress-testing framework point to a gradual decline in bank profitability over the next two years, implying a nearly 1 percentage point cumulative drop in euro area banks’ aggregate ROE by 2021. This is mainly driven by the diminishing contribution of core revenues (net interest income and net fee and commission income) to ROE, while the net impact of changes in loan impairment costs is projected to be broadly neutral over the forecast horizon (see Chart 3.22 in Section 3.2).
0%
1%
2%
3%
4%
2016 Q2 2019 2016 Q2 2019 2016 Q2 2019
All countries Countries moreaffected by the
crisis
Countries lessaffected by the
crisis
Central banksCredit institutionsOther financial corporationsNon-financial corporationsHouseholdsDebt securities issued
0
10
20
30
40
50
60
70
ES FI LU SI MT IT IE DE LT GR AT SK LV EA EE PT CY FR BE NL

Financial Stability Review, November 2019 – Euro area banking sector
60
Asset quality improvement continued, although at a slowing rate
The improvement in banks’ asset quality continued in the first half of 2019, but at a slowing pace. Significant institutions’ aggregate NPL ratio has declined further since end-2018, but the reduction of NPL stocks has decelerated somewhat (see Chart 3.10, left panel).22 The risk-reduction process has continued in high-NPL countries (see Chart 3.10, right panel), although the rate of progress since 2015 has varied significantly, which is reflected in a wide range of NPL ratios in this country group. While in some countries NPL ratios are below 8% (Ireland, Italy and Slovenia), they are still at double-digit levels in other countries, with Greece lagging behind in the risk-reduction process.
Chart 3.10 NPL reductions continued, although at a slower pace
Significant institutions’ aggregate NPL ratio and cumulative NPL change since 2015
Significant institutions’ NPL ratios in high-NPL countries
(Q4 2015-Q2 2019, percentages, index: Q4 2015 = 100) (Q4 2016-Q2 2019, percentages)
Sources: ECB supervisory statistics and ECB calculations. Note: Based on a balanced sample of 95 SIs.
At the same time, weaker cyclical conditions led to a net increase in “underperforming” assets, signalling worsening asset quality further ahead. Net flows into the Stage 2 category, which includes loans that are still performing but show signs of significant credit risk deterioration, picked up in late 2018 and early 2019, although they dropped to low levels in the second quarter of 2019 (see Chart 3.11, left panel).
22 This is partly due to a change in the scope of one banking group in the first quarter of 2019, which led to
a one-off increase in NPLs in this group.
0
20
40
60
80
100
120
0
1
2
3
4
5
6
7
8
Q42015
Q22016
Q42016
Q22017
Q42017
Q22018
Q42018
Q22019
NPL ratio (left-hand scale)NPL change indexed to 2015 (right-hand scale)
0
5
10
15
20
25
30
35
40
45
50
0
5
10
15
20
25
Q4 2016 Q2 2017 Q4 2017 Q2 2018 Q4 2018 Q2 2019
CY (right-hand scale)GR (right-hand scale)IE
ITPTSI
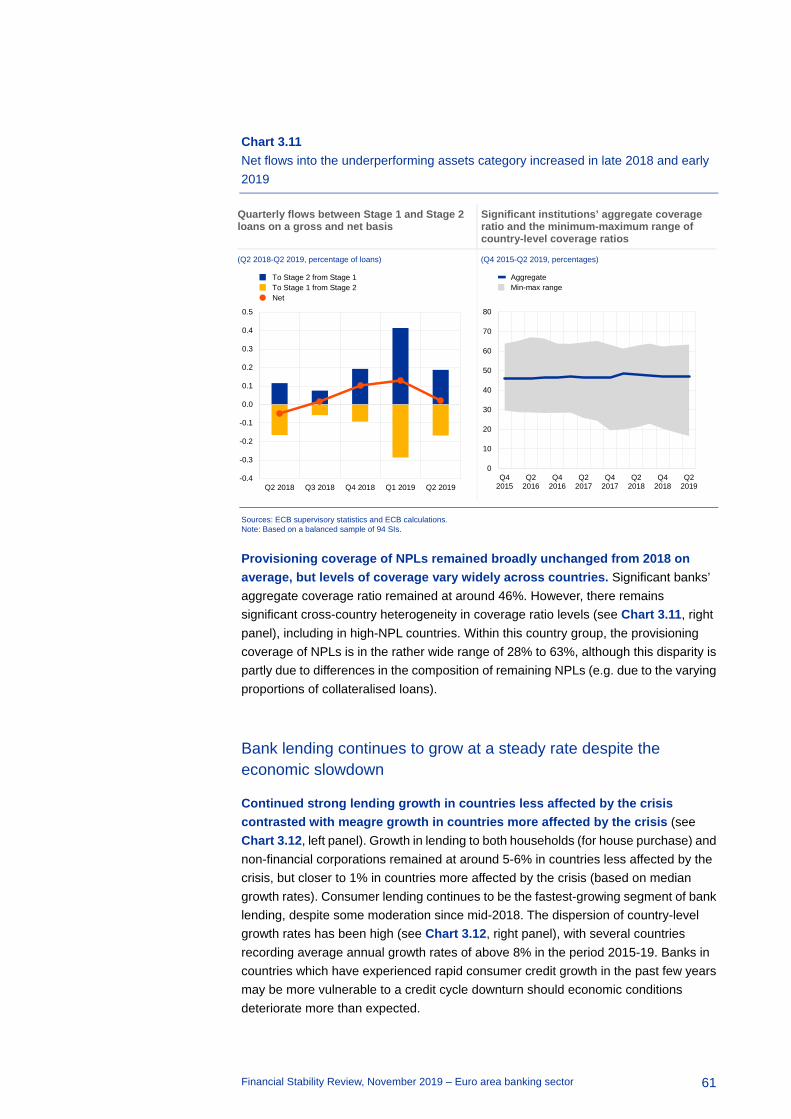
Financial Stability Review, November 2019 – Euro area banking sector
61
Chart 3.11 Net flows into the underperforming assets category increased in late 2018 and early 2019
Quarterly flows between Stage 1 and Stage 2 loans on a gross and net basis
Significant institutions’ aggregate coverage ratio and the minimum-maximum range of country-level coverage ratios
(Q2 2018-Q2 2019, percentage of loans) (Q4 2015-Q2 2019, percentages)
Sources: ECB supervisory statistics and ECB calculations. Note: Based on a balanced sample of 94 SIs.
Provisioning coverage of NPLs remained broadly unchanged from 2018 on average, but levels of coverage vary widely across countries. Significant banks’ aggregate coverage ratio remained at around 46%. However, there remains significant cross-country heterogeneity in coverage ratio levels (see Chart 3.11, right panel), including in high-NPL countries. Within this country group, the provisioning coverage of NPLs is in the rather wide range of 28% to 63%, although this disparity is partly due to differences in the composition of remaining NPLs (e.g. due to the varying proportions of collateralised loans).
Bank lending continues to grow at a steady rate despite the economic slowdown
Continued strong lending growth in countries less affected by the crisis contrasted with meagre growth in countries more affected by the crisis (see Chart 3.12, left panel). Growth in lending to both households (for house purchase) and non-financial corporations remained at around 5-6% in countries less affected by the crisis, but closer to 1% in countries more affected by the crisis (based on median growth rates). Consumer lending continues to be the fastest-growing segment of bank lending, despite some moderation since mid-2018. The dispersion of country-level growth rates has been high (see Chart 3.12, right panel), with several countries recording average annual growth rates of above 8% in the period 2015-19. Banks in countries which have experienced rapid consumer credit growth in the past few years may be more vulnerable to a credit cycle downturn should economic conditions deteriorate more than expected.
-0.4
-0.3
-0.2
-0.1
0.0
0.1
0.2
0.3
0.4
0.5
Q2 2018 Q3 2018 Q4 2018 Q1 2019 Q2 2019
To Stage 2 from Stage 1To Stage 1 from Stage 2Net
0
10
20
30
40
50
60
70
80
Q42015
Q22016
Q42016
Q22017
Q42017
Q22018
Q42018
Q22019
AggregateMin-max range

Financial Stability Review, November 2019 – Euro area banking sector
62
Chart 3.12 Bank lending remains heterogeneous in different parts of the euro area
Median annual growth rate of housing and NFC loans by country group
Distribution of country-level annual growth rates of consumer loans
(Jan. 2012-Sep. 2019, percentages) (Jan. 2012-Sep. 2019 percentages, median, interquartile range and 10th-90th percentile range)
Source: ECB. Note: Countries more affected by the crisis include Cyprus, Greece, Ireland, Italy, Portugal, Slovenia and Spain.
Despite the slowdown in economic activity in 2019, reported credit risk measures did not signal a deterioration in borrower creditworthiness. Following a small pick-up in late 2018, the aggregate probability of default and expected loss ratio for banks’ total IRB (internal ratings-based) portfolio resumed their downward trend in the first half of 2019 (see Chart 3.13, left panel). Expected loss ratios reflected still benign credit risk, although the downward trend came to a halt for most IRB loan portfolios (see Chart 3.13, right panel). At the same time, there are some signs that banks are not adjusting their pricing to changes in expected credit losses, which could make their profitability vulnerable to a turn in the credit cycle (see Chart A.6, left panel).
At the same time, the latest reported changes in bank lending standards appear to show signs of a maturing credit cycle. According to the ECB’s bank lending survey, credit standards eased slightly for NFC loans in the third quarter of 2019, following some net tightening in the previous quarter. Changes in credit standards in different segments of household lending diverged somewhat in the third quarter, with a continued net tightening of standards for consumer loans (in particular in Spain) contrasting with a slight net easing for housing loans. The tightening of standards for consumer loans was mainly driven by lower risk tolerance and increased risk perceptions with regard to these loans. In mortgage lending, while there has been no broad-based shift to higher loan-to-value bands over the past few years, this is in part due to a further rise in property valuations as well as the increased rate of renegotiations in some countries.
-10
-8
-6
-4
-2
0
2
4
6
8
2012 2013 2014 2015 2016 2017 2018 2019
Countries less affected by the crisis - NFC loansCountries less affected by the crisis - housing loansCountries more affected by the crisis - NFC loansCountries more affected by the crisis - housing loans
-15
-10
-5
0
5
10
15
20
2012 2013 2014 2015 2016 2017 2018 2019
MedianInterquartile range10th-90th percentile range

Financial Stability Review, November 2019 – Euro area banking sector
63
Chart 3.13 Credit risk measures reported by banks remain at subdued levels despite a slowdown in the economy and a weaker macroeconomic outlook
Probability of default and expected loss ratio for total IRB credit portfolios
Expected loss ratios for different IRB credit portfolios
(Q1 2017-Q2 2019, percentages) (2015-H1 2019, percentages)
Sources: ECB supervisory statistics and ECB calculations. Notes: EL: expected loss; IRB: internal ratings-based; PD: probability of default; RRE: residential real estate; SMEs: small and medium-sized enterprises. Excludes defaulted exposures.
Growing awareness of the financial stability risks related to climate change has increased the need to develop ways of monitoring banks’ exposure to high-carbon sectors (see also Box 4). While the most significant risks to financial and economic stability arise from failure to address climate risk, banks may also be vulnerable to risks from a slow transition to an economy with lower emissions.23 One indicator of such risks is banks’ exposures to high carbon-emitting firms that would be vulnerable if the transition to a low-carbon economy is delayed and disorderly. Data on the distribution of euro area bank exposures to NFCs and their respective emission intensities suggest that transition risk may have declined more recently (see Chart 3.14, left panel). From 2014 to 2017, banks’ NFC portfolios appear to have become greener, as suggested by the distributions leaning increasingly to the left and the euro area weighted average emission intensity (vertical lines) moving from around 434 to 355. While these NFCs have marginally reduced their carbon emissions over time, most of the change is associated with banks showing a certain degree of lending discrimination against high polluters. This can be observed by looking at how the weighted average emission intensity moves when comparing the exposure data from different periods, while the emission data remain constant.
Over a longer time horizon, evidence from syndicated loans points towards increased transition risk for a number of large banks. As a complementary approach, evidence from syndicated loans for a sample of large banks was used to
23 See Giuzio, M., Krusec, D., Levels, A., Melo, A. S., Mikkonen, K. and Radulova, P., “Climate change and
financial stability”, Financial Stability Review, ECB, May 2019.
0.24
0.25
0.26
0.27
0.28
0.29
0.3
0.31
0.32
0.90
0.95
1.00
1.05
1.10
1.15
1.20
Q1 2017 Q3 2017 Q1 2018 Q3 2018 Q1 2019
PD total (left-hand scale)EL ratio - total (right-hand scale)
0
0.1
0.2
0.3
0.4
0.5
0.6
0.7
0.8
0.9
2015 2016 2017 2018 H1 2019
EL ratio - large NFCsEL ratio - RREEL ratio - SMEsEL ratio - consumer loans

Financial Stability Review, November 2019 – Euro area banking sector
64
assess longer-term trends in transition risk.24 Looking at changes in exposures during the past ten years reveals that while the carbon content of syndicated loans has decreased for some banks, many are displayed above the 45-degree line, which represents proportionate developments in both lending and emissions (see Chart 3.14, right panel). In other words, the carbon intensity of syndicated loans, and therefore the related transition risk, has increased for these banks.
Chart 3.14 Evidence from syndicated loans points towards increased transition risk over a longer time horizon, but this risk has shown signs of decline more recently
Distribution of emission intensity for NFCs in the large exposures dataset
Change in syndicated lending to high-carbon sectors and the related firm-specific emissions for the 19 largest euro area lenders
(2014-17) (2009-19, index, four-year moving averages)
Sources: Dealogic, Refinitiv, ECB supervisory statistics (large exposures) and ECB calculations. Notes: Left panel: Coverage for the emission intensity dataset is around €1.4 trillion (2,200 companies) of total NFC large exposures of €2.4 trillion (5,500 companies). Exp: exposures; Em: emissions. Right panel: Syndicated loans arranged by the 19 largest banks in the euro area. The size of the bubbles denotes the average size of lending to the high-carbon sectors in 2018-19. Both lending and emissions are expressed as four-year moving averages. The carbon-intensive sectors comprise chemicals, construction and building, machinery, metal and steel, mining, oil and gas, and utilities and transport.
Box 4 Climate risk-related disclosures of banks and insurers and their market impact
Prepared by Sante Carbone, Margherita Giuzio and Katri Mikkonen
Scarce and inconsistent information on the climate-related risk embedded in assets makes the pricing of climate risk difficult for investors and authorities.25 Recent studies have found that environmental disclosures can affect the market valuation of non-financial businesses operating in sectors that are sensitive to the risks related to the transition to a low-carbon economy.26 But the
24 Syndicated lending is a suitable alternative because firms with high carbon emissions are typically large
borrowers, the loans of which are often syndicated. See, for example, Weyzig, F., Kupper, B., van Gelder, J. W. and van Tilburg, R., “The Price of Doing Too Little Too Late – The impact of the carbon bubble on the EU financial system”, report prepared for the Greens/EFA Group, European Parliament, February 2014.
25 See Giuzio, M., Krusec, D., Levels, A., Melo, A. S., Mikkonen, K. and Radulova, P., “Climate change and financial stability”, Financial Stability Review, ECB, May 2019, pp. 120-133.
26 See, for example, Bolton, P. and Kacperczyk, M., “Do Investors Care about Carbon Risk?”, mimeo, June 2019; Hsu, P-H., Li, K. and Tsou, C-Y., “The Pollution Premium”, mimeo, November 2018; and Alessi, L., Ossola, E. and Panzica, R., “The greenium matters: Evidence on the pricing of climate risk”, JCR Working Papers in Economics and Finance, 2019/12.
0
1
2
3
4
0 1 2 3 4
Emissions index, 2009-19
Lending volume to CO2-intensive sectors, 2009-19
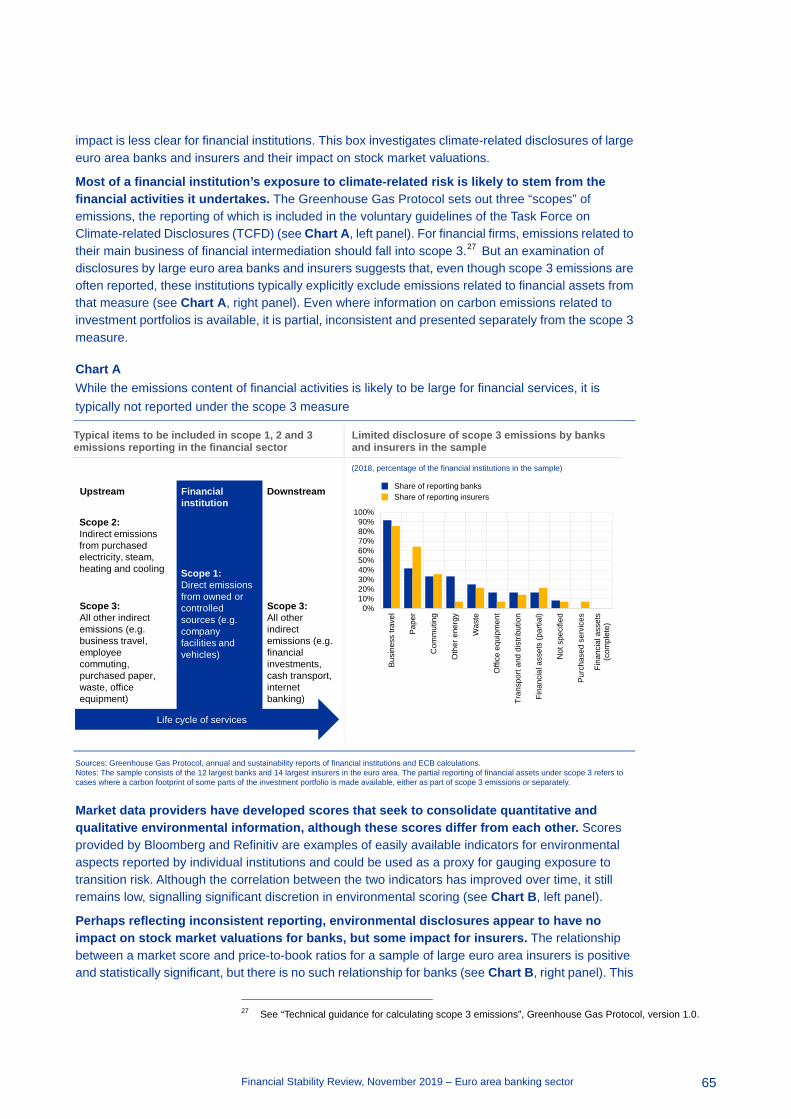
Financial Stability Review, November 2019 – Euro area banking sector
65
impact is less clear for financial institutions. This box investigates climate-related disclosures of large euro area banks and insurers and their impact on stock market valuations.
Most of a financial institution’s exposure to climate-related risk is likely to stem from the financial activities it undertakes. The Greenhouse Gas Protocol sets out three “scopes” of emissions, the reporting of which is included in the voluntary guidelines of the Task Force on Climate-related Disclosures (TCFD) (see Chart A, left panel). For financial firms, emissions related to their main business of financial intermediation should fall into scope 3.27 But an examination of disclosures by large euro area banks and insurers suggests that, even though scope 3 emissions are often reported, these institutions typically explicitly exclude emissions related to financial assets from that measure (see Chart A, right panel). Even where information on carbon emissions related to investment portfolios is available, it is partial, inconsistent and presented separately from the scope 3 measure.
Chart A While the emissions content of financial activities is likely to be large for financial services, it is typically not reported under the scope 3 measure
Sources: Greenhouse Gas Protocol, annual and sustainability reports of financial institutions and ECB calculations. Notes: The sample consists of the 12 largest banks and 14 largest insurers in the euro area. The partial reporting of financial assets under scope 3 refers to cases where a carbon footprint of some parts of the investment portfolio is made available, either as part of scope 3 emissions or separately.
Market data providers have developed scores that seek to consolidate quantitative and qualitative environmental information, although these scores differ from each other. Scores provided by Bloomberg and Refinitiv are examples of easily available indicators for environmental aspects reported by individual institutions and could be used as a proxy for gauging exposure to transition risk. Although the correlation between the two indicators has improved over time, it still remains low, signalling significant discretion in environmental scoring (see Chart B, left panel).
Perhaps reflecting inconsistent reporting, environmental disclosures appear to have no impact on stock market valuations for banks, but some impact for insurers. The relationship between a market score and price-to-book ratios for a sample of large euro area insurers is positive and statistically significant, but there is no such relationship for banks (see Chart B, right panel). This
27 See “Technical guidance for calculating scope 3 emissions”, Greenhouse Gas Protocol, version 1.0.
Typical items to be included in scope 1, 2 and 3 emissions reporting in the financial sector
Limited disclosure of scope 3 emissions by banks and insurers in the sample
(2018, percentage of the financial institutions in the sample)
Life cycle of services
Scope 1: Direct emissions from owned or controlled sources (e.g. company facilities and vehicles)
Scope 2: Indirect emissions from purchased electricity, steam, heating and cooling
Scope 3: All other indirect emissions (e.g. business travel, employee commuting, purchased paper, waste, office equipment)
Scope 3: All other indirect emissions (e.g. financial investments, cash transport, internet banking)
Upstream Financial institution
Downstream
0%10%20%30%40%50%60%70%80%90%
100%
Busi
ness
trav
el
Pape
r
Com
mut
ing
Oth
er e
nerg
y
Was
te
Offi
ce e
quip
men
t
Tran
spor
t and
dis
tribu
tion
Fina
ncia
l ass
ets
(par
tial)
Not
spe
cifie
d
Purc
hase
d se
rvic
es
Fina
ncia
l ass
ets
(com
plet
e)
Share of reporting banksShare of reporting insurers

Financial Stability Review, November 2019 – Euro area banking sector
66
result might reflect greater investor scrutiny of insurers owing to their higher exposure to physical climate-change risk, given insurance liabilities.28 The limited evidence of financial institutions actively reducing the carbon content of their financial portfolios supports the conclusion that market discipline is possibly not effective in curbing transition risk.29
Chart B Environmental market scores are highly dispersed and seem to matter more for the valuation of insurers than banks
Sources: Bloomberg, Refinitiv EIKON, S&P Global Market Intelligence and Dealogic. Notes: Left panel: The Bloomberg and Refinitiv environmental scores can take values between 0 and 100, whereby a higher value indicates a better performance in terms of environmental variables. Left panel: The full unbalanced sample consists of 49 banks and 23 insurers in the European Union and the United States. Right panel: The sub-sample used in the estimation consists of 16 EU insurers and 12 EU banks. Standards errors are clustered and robust. An Arellano-Bond estimator is used and controls include institution-specific variables (e.g. ROE, total debt, EBITDA, total expenses, total assets, dividend payout ratio, NPL ratio, Tier 1 capital ratio, solvency coverage ratio and premium growth when applicable) and market-specific variables (e.g. stock market volatility, long-term bond yields and GDP forecasts).
Mandatory and harmonised firm-level reporting would allow better pricing and monitoring of financial institutions’ exposures to climate-related risks. The European Commission’s green taxonomy and the Regulation on environmental, social and governance disclosures of financial institutions are important steps towards understanding the sustainability of economic activities and will help financial institutions in classifying their own financial exposures.30 Further work will include the development of technical disclosure standards by the European Supervisory Authorities. Additional steps will however be needed to improve the understanding of climate change-related transition risks to financial institutions. Enhancing the proposed taxonomy to include brown assets would constitute an important advancement which would support the monitoring of the financial
28 Physical risk refers to the effects of global warming, such as a higher occurrence of extreme weather
events or a rise in the sea level, which can have a major impact on the occurrence of health, property or catastrophe insurance events. The result is also congruent with the recent evidence of an impact on equity prices from green products on the liability, but not the asset side of insurance companies. See Jakubik, P. and Uguz, S., “Impact of green bond policies on insurers: evidence from the European equity market”, Financial Stability Report, European Insurance and Occupational Pensions Authority, June 2019.
29 See Chart 3.14 on large exposures and evidence from syndicated loans, and Chart A.3 in Giuzio et al. (2019) op. cit. with regard to developments in insurance exposures to the most policy-sensitive sectors.
30 See the Taxonomy Technical Report by the EU Technical Expert Group on Sustainable Finance, June 2019, and the Regulation on environmental, social and governance disclosures of financial institutions (endorsed on 18 April 2019).
Correlations of environmental scores by Bloomberg and Refinitiv
Environmental score and the price-to-book ratios of European banks and insurers
(2009-18) (2009-18, illustration of results of a generalised method of moments regression)
0
10
20
30
40
50
60
70
80
90
0 20 40 60 80 100
Ref
initi
v EI
KO
N s
core
Bloomberg environmental score
200920152018
0.0
0.2
0.4
0.6
0.8
1.0
1.2
1.4
1.6
1.8
2.0
60 70 80 90 100
Pric
e-to
-boo
k ra
tio
Refinitiv EIKON score
Emissions score versus price-to-book ratio, EU banksEmissions score versus price-to-book ratio, EU insurers

Financial Stability Review, November 2019 – Euro area banking sector
67
system’s exposure to climate-related risk. The ECB will continue its efforts to develop methods to gauge exposures to transition risk in the balance sheets of financial institutions.
Funding challenges abated somewhat amid lower funding costs and improved bond market access
Banks’ wholesale funding costs have declined in the year to date across the credit hierarchy. This was driven by further accommodative monetary policy actions, which pushed down risk-free rates across the maturity spectrum, including at the longer end, as well as receding risk aversion/increasing search for yield by investors which led to a decline in the risk premia on bank debt. As a result, spreads on bank debt tightened across all seniorities, reaching levels close to the early 2018 trough (see Chart 3.15).
Chart 3.15 Bank funding conditions eased further
Average spreads on different debt instruments Spreads of non-preferred senior bonds in selected countries
(Jan. 2018-Nov. 2019, z-spreads in basis points) (Jan. 2018-Nov. 2019, z-spreads in basis points)
Sources: IHS Markit and ECB calculations. Note: Z-spreads are defined as the difference (in basis points) between the yield to maturity of a bank’s bond and the yield of a maturity-matched euro swap.
Banks’ access to bond markets has improved this year, but banks differ in terms of their progress in MREL debt issuance. By debt type, issuance was strong for both non-preferred and preferred senior debt (see Chart 3.16, left panel) as banks took advantage of very low or, in some cases, negative yields. Moreover, the issuer base broadened as some banks with lower credit quality also regained access to debt markets even if at high cost. Looking over a longer period, however, there remains significant heterogeneity across banks in terms of their ability to issue MREL-eligible debt. In particular, global systemically important banks are the most advanced in building up their bail-in buffers. At the same time, MREL debt issuance by smaller and weaker credit quality banks still lags behind (see Chart 3.16, right panel).
0
50
100
150
200
250
300
350
01/18 04/18 07/18 10/18 01/19 04/19 07/19 10/19
EUR Tier 2EUR senior bail-inEUR senior preferredEUR covered
0
50
100
150
200
250
300
350
400
450
01/18 04/18 07/18 10/18 01/19 04/19 07/19 10/19
GermanyItalySpainFrance
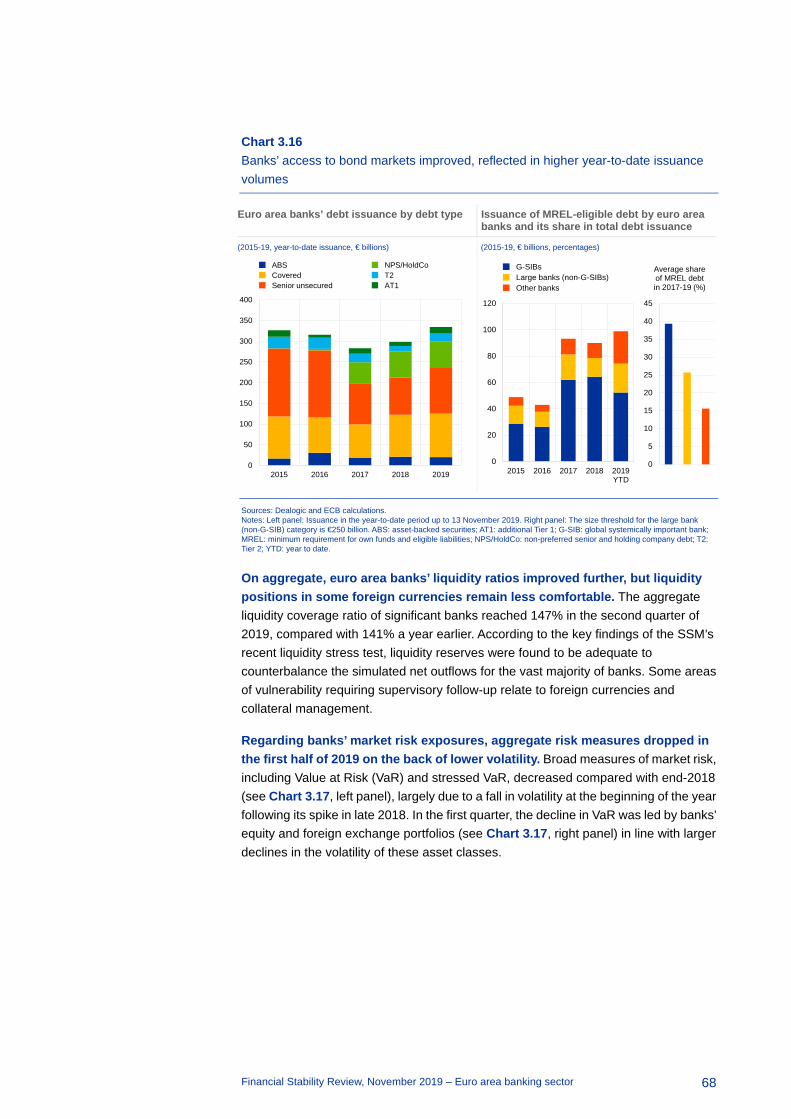
Financial Stability Review, November 2019 – Euro area banking sector
68
Chart 3.16 Banks’ access to bond markets improved, reflected in higher year-to-date issuance volumes
Euro area banks’ debt issuance by debt type Issuance of MREL-eligible debt by euro area banks and its share in total debt issuance
(2015-19, year-to-date issuance, € billions) (2015-19, € billions, percentages)
Sources: Dealogic and ECB calculations. Notes: Left panel: Issuance in the year-to-date period up to 13 November 2019. Right panel: The size threshold for the large bank (non-G-SIB) category is €250 billion. ABS: asset-backed securities; AT1: additional Tier 1; G-SIB: global systemically important bank; MREL: minimum requirement for own funds and eligible liabilities; NPS/HoldCo: non-preferred senior and holding company debt; T2: Tier 2; YTD: year to date.
On aggregate, euro area banks’ liquidity ratios improved further, but liquidity positions in some foreign currencies remain less comfortable. The aggregate liquidity coverage ratio of significant banks reached 147% in the second quarter of 2019, compared with 141% a year earlier. According to the key findings of the SSM’s recent liquidity stress test, liquidity reserves were found to be adequate to counterbalance the simulated net outflows for the vast majority of banks. Some areas of vulnerability requiring supervisory follow-up relate to foreign currencies and collateral management.
Regarding banks’ market risk exposures, aggregate risk measures dropped in the first half of 2019 on the back of lower volatility. Broad measures of market risk, including Value at Risk (VaR) and stressed VaR, decreased compared with end-2018 (see Chart 3.17, left panel), largely due to a fall in volatility at the beginning of the year following its spike in late 2018. In the first quarter, the decline in VaR was led by banks’ equity and foreign exchange portfolios (see Chart 3.17, right panel) in line with larger declines in the volatility of these asset classes.
0
50
100
150
200
250
300
350
400
2015 2016 2017 2018 2019
ABSCoveredSenior unsecured
NPS/HoldCoT2AT1
0
20
40
60
80
100
120
2015 2016 2017 2018 2019YTD
G-SIBsLarge banks (non-G-SIBs)Other banks
0
5
10
15
20
25
30
35
40
45
Average share of MREL debt in 2017-19 (%)
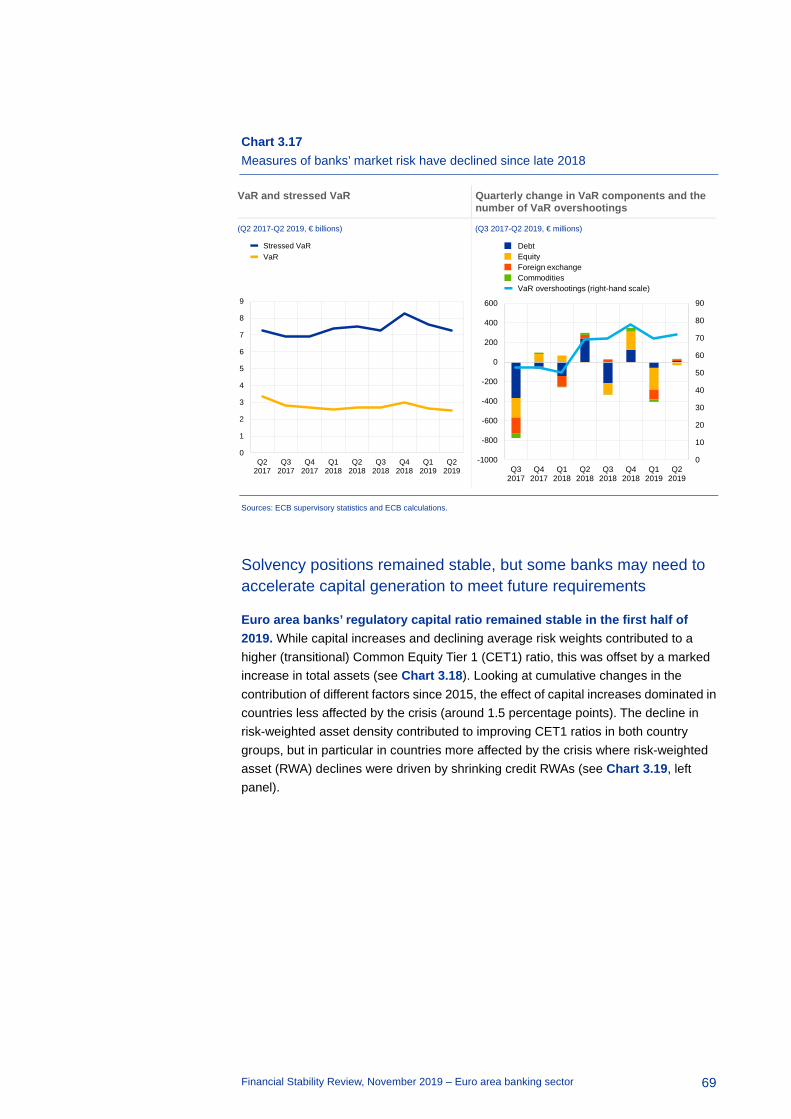
Financial Stability Review, November 2019 – Euro area banking sector
69
Chart 3.17 Measures of banks’ market risk have declined since late 2018
VaR and stressed VaR Quarterly change in VaR components and the number of VaR overshootings
(Q2 2017-Q2 2019, € billions) (Q3 2017-Q2 2019, € millions)
Sources: ECB supervisory statistics and ECB calculations.
Solvency positions remained stable, but some banks may need to accelerate capital generation to meet future requirements
Euro area banks’ regulatory capital ratio remained stable in the first half of 2019. While capital increases and declining average risk weights contributed to a higher (transitional) Common Equity Tier 1 (CET1) ratio, this was offset by a marked increase in total assets (see Chart 3.18). Looking at cumulative changes in the contribution of different factors since 2015, the effect of capital increases dominated in countries less affected by the crisis (around 1.5 percentage points). The decline in risk-weighted asset density contributed to improving CET1 ratios in both country groups, but in particular in countries more affected by the crisis where risk-weighted asset (RWA) declines were driven by shrinking credit RWAs (see Chart 3.19, left panel).
0
1
2
3
4
5
6
7
8
9
Q22017
Q32017
Q42017
Q12018
Q22018
Q32018
Q42018
Q12019
Q22019
Stressed VaRVaR
0
10
20
30
40
50
60
70
80
90
-1000
-800
-600
-400
-200
0
200
400
600
Q32017
Q42017
Q12018
Q22018
Q32018
Q42018
Q12019
Q22019
DebtEquityForeign exchangeCommoditiesVaR overshootings (right-hand scale)

Financial Stability Review, November 2019 – Euro area banking sector
70
Chart 3.18 Capital ratios remained stable, but there are still significant differences across banks regarding their ability to build up capital
Banks’ aggregate transitional CET1 ratios by country group
Decomposition of changes in banks’ transitional CET1 ratio
(2015-H1 2019, percentages) (2015-H1 2019, 2018-H1 2019, percentage points)
Sources: ECB supervisory statistics and ECB calculations. Notes: Based on a balanced sample of 94 SIs. Countries more affected by the crisis include Cyprus, Greece, Ireland, Italy, Portugal, Slovenia and Spain. RWA density is defined as the ratio of risk-weighted assets (RWAs) to total assets.
Regarding capital generation, significant heterogeneity remains across countries and banks. On average, banks’ organic capital build-up (through retained earnings) remains lower in countries more affected by the crisis, although the contribution of retained earnings has increased since 2015 (see Chart 3.19, right panel).
Capital requirements increased as of 2019, but banks’ management capital buffers appear comfortable relative to current minimum requirements. The increase in capital requirements was driven by the completion of the phasing-in of the capital conservation buffer and the G-SII buffer, together with the continued phasing-in of other structural buffers (O-SII buffer and systemic risk buffer). As a result, euro area banks’ management capital buffers decreased compared with end-2018 but, on aggregate, remain in comfortable territory at around 3% of risk-weighted assets (see Chart 3.20, left panel). That said, management buffers are distributed heterogeneously across banks and countries.
8
9
10
11
12
13
14
15
16
2015 2016 2017 2018 H1 2019
All countriesCountries less affected by the crisisCountries more affected by the crisis
-1.5
-1.0
-0.5
0.0
0.5
1.0
1.5
2.0
2.5
Euro area Euro area Countries lessaffected bythe crisis
Countriesmore affectedby the crisis
2018-H1 2019 2015-H1 2019
CET1 capitalTotal assets
RWA densityCET1 ratio change
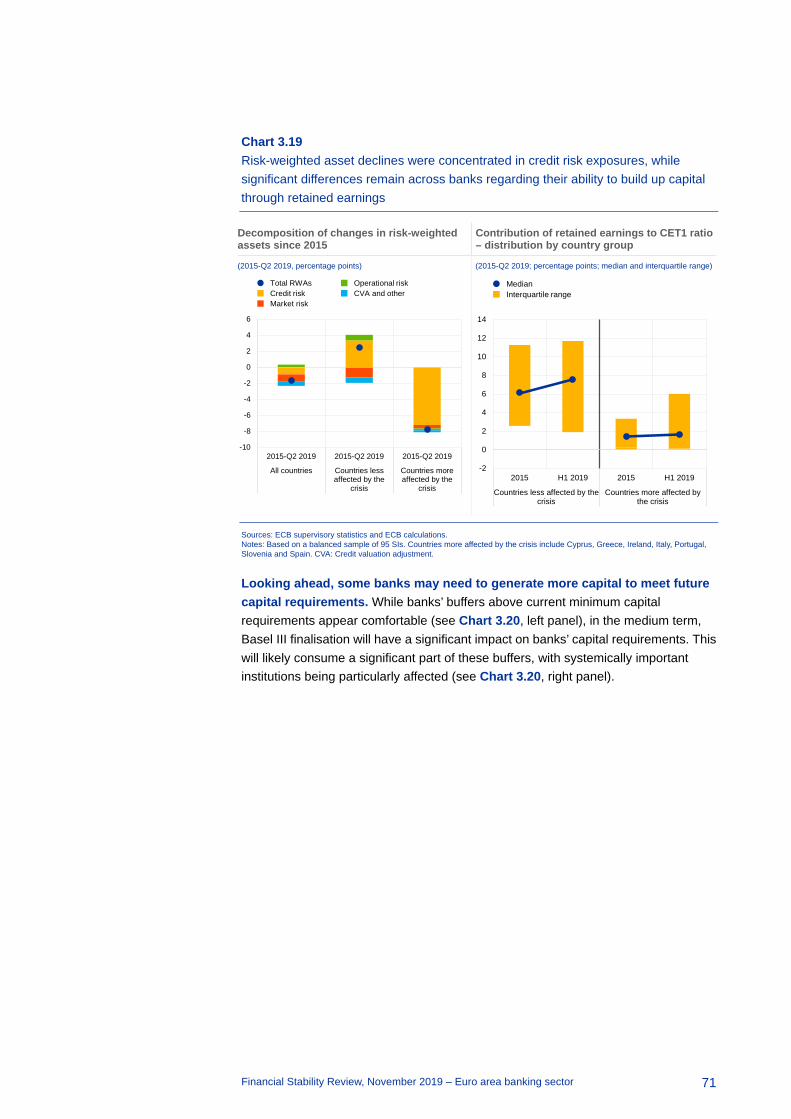
Financial Stability Review, November 2019 – Euro area banking sector
71
Chart 3.19 Risk-weighted asset declines were concentrated in credit risk exposures, while significant differences remain across banks regarding their ability to build up capital through retained earnings
Decomposition of changes in risk-weighted assets since 2015
Contribution of retained earnings to CET1 ratio – distribution by country group
(2015-Q2 2019, percentage points) (2015-Q2 2019; percentage points; median and interquartile range)
Sources: ECB supervisory statistics and ECB calculations. Notes: Based on a balanced sample of 95 SIs. Countries more affected by the crisis include Cyprus, Greece, Ireland, Italy, Portugal, Slovenia and Spain. CVA: Credit valuation adjustment.
Looking ahead, some banks may need to generate more capital to meet future capital requirements. While banks’ buffers above current minimum capital requirements appear comfortable (see Chart 3.20, left panel), in the medium term, Basel III finalisation will have a significant impact on banks’ capital requirements. This will likely consume a significant part of these buffers, with systemically important institutions being particularly affected (see Chart 3.20, right panel).
-10
-8
-6
-4
-2
0
2
4
6
2015-Q2 2019 2015-Q2 2019 2015-Q2 2019
All countries Countries lessaffected by the
crisis
Countries moreaffected by the
crisis
Total RWAsCredit riskMarket risk
Operational riskCVA and other
-2
0
2
4
6
8
10
12
14
2015 H1 2019 2015 H1 2019
Countries less affected by thecrisis
Countries more affected bythe crisis
MedianInterquartile range

Financial Stability Review, November 2019 – Euro area banking sector
72
Chart 3.20 Basel III finalisation will have a significant impact on large banks’ capital requirements
Capital requirements and management buffers of euro area significant institutions
Composition of Tier 1 capital requirement and expected Basel III impact for three groups of banks
(Q4 2017-Q2 2019, percentage of RWAs) (Q1 2019, percentage of RWAs)
Sources: ECB supervisory statistics, EBA report on “Basel III reforms: impact study and key recommendations”, national notifications, SREP decisions and ECB calculations. Notes: Left panel: Capital decomposition based on a balanced sample of 104 SIs. All capital requirements are weighted by RWAs. Right panel: The sample includes 117 SIs of which 8 G-SIBs, 71 O-SIIs and 38 others.. For this sample of banks, the estimation of the Basel III impact (up to 2027) is based on an approximation using the projected increases in Tier 1 requirements presented in the EBA report. The assessment does not take into account other potential increases in Tier 1 requirements which are not related to the finalisation of Basel III. P2G and T2 shortfall will be additive as of January 2020. AT1: additional Tier 1; CBR: combined buffer requirement; CCoB: capital conservation buffer; CCyB: countercyclical capital buffer; EBA: European Banking Authority; G-SII: global systemically important institution; O-SII: other systemically important institution; P2G: Pillar 2 guidance; P2R: Pillar 2 requirement; SRB: systemic risk buffer; SREP: Supervisory Review and Evaluation Process; T2: Tier 2.
3.2 Evaluating the resilience of the euro area banking sector
This section assesses the solvency and profitability of euro area credit institutions under a baseline and an adverse scenario. The assessment covers over 90 large and medium-sized euro area banks in the 19 euro area countries. It uses the ECB’s new macro-micro model (see Box 5), in which banks’ balance sheets change in response to economic conditions, and the collective impact of bank responses on the broader economy is included. The dynamic balance sheet approach increases the realism of the assessment and contrasts with the stress-test exercises coordinated by the European Banking Authority (EBA) and ECB Banking Supervision, where the size and structure of banks’ assets do not change over the scenario horizon. Beyond that, the results presented in this section are not comparable with those from the supervisory stress test of the EBA and ECB Banking Supervision because of methodological, scenario and sample differences.
0%
2%
4%
6%
8%
10%
12%
14%
Q4 2017 Q4 2018 Q2 2019
Pillar 1P2RCCoBG-SII/O-SII/SRBCCyB (country)P2G (up to AT1/T2 shortfall)AT1/T2 shortfall (excess of P2G)P2G (excess of AT1/T2 shortfall)Buffer over minimum requirements
0%
2%
4%
6%
8%
10%
12%
14%
16%
18%
G-SIIs O-SIIs Others
Tier 1 requirementP2RCBRP2G and T2 shortfallExpected Basel III impact

Financial Stability Review, November 2019 – Euro area banking sector
73
Box 5 The ECB’s new euro area banking sector macro-micro model
The new macro-micro model was created for the purpose of macroprudential stress testing of the banking sector.31 It is a large-scale, multi-bank and multi-country, semi-structural model. The dynamics of each euro area economy are modelled separately, although they are interconnected via trade linkages.
The model focuses on the banking book of banks’ balance sheets. Lending to the non-financial private sector is broken down by country and sector, i.e. non-financial corporations, residential mortgages and consumer lending. Banking book exposures to sovereigns and other financial institutions are also covered. The initial structure of banks’ balance sheets is sourced from the stress-test templates of the 2018 EU-wide stress-test exercise. For each of these portfolios, the model estimates loan performance under different macroeconomic conditions, projecting the transition of loans across the three stages of impairment under IFRS 9, loss given default and loss rates. Risk weights are modelled at the same level of granularity. Banks adjust their loan volumes in response to loan demand conditions, while taking account of the loan maturity structure, their capital position, their profitability or the quality of their assets. The same set of factors matters also for the setting of banks’ lending margins.
On the liabilities side, the model separates customer deposits and wholesale funding. The deposits are broken down into deposits of sovereigns, other financial institutions, non-financial corporations and households, and for the latter two also into term and sight deposits, each of those following their own supply function depending on economic conditions. Wholesale funding closes the remaining funding gap. The interest rates on deposits depend mostly on economic conditions and monetary policy rates, while wholesale funding costs respond to the perceived counterparty risk of the credit institution, which – in turn – is linked to its capitalisation and asset quality. Finally, banks also adjust the average debt maturity in response to changes in the yield curve.
Regarding profits and losses, the framework captures the dynamics of net interest income, loan loss provisioning and net fee and commission income. Other P&L components, such as dividend income, follow simple dynamic rules linking them, for instance, to the evolution of total assets of banks. Trading book assets, the market risk capital surcharge, banks’ dividend holdings and the operational risk capital surcharge follow similar simplified dynamics. Furthermore, banks adjust their profit distribution policies to retain their management buffer over regulatory requirements.
Amplification effects from banks’ adjustments to the real economy are captured in the model. In stressed conditions, banks’ solvency ratios deteriorate and can fall below the regulatory capital ratios. This can occasionally trigger deleveraging and feed back to the real economy as a negative credit supply shock, amplifying the adversity of the initial macroeconomic scenario.
The baseline and adverse scenarios
The baseline scenario is characterised by positive but subdued economic growth. The baseline scenario is based on the September 2019 ECB staff macroeconomic projection exercise, in which real GDP growth was projected to be 1.1% in 2019, before gradually increasing to 1.4% in 2021 (see Chart 3.21). In 31 The model is applied to the ECB macroprudential stress test conducted since 2018. See Budnik, K.,
Balatti, M., Dimitrov, I., Groß, J., Hansen, I., di Iasio, G., Kleemann, M., Reichenbachas, T., Sanna, F., Sarychev, A., Siņenko, N. and Volk, M., “Macroprudential stress test of the euro area banking system”, Occasional Paper Series, No 226, ECB, July 2019.

Financial Stability Review, November 2019 – Euro area banking sector
74
comparison to the June 2019 Eurosystem staff projections, real GDP growth in the baseline scenario has been revised down in 2019 and 2020, by 0.1 and 0.2 percentage points, respectively. This reflects the weakness in global trade and continued global uncertainties weighing on business expectations. The projections of short-term and long-term interest rates were revised down by 20-40 basis points and 40-80 basis points, respectively, up to the end of 2021.
Chart 3.21 Weaker economic conditions in the baseline scenario and a significant deterioration in the adverse scenario
In the adverse scenario, euro area GDP declines significantly in 2020 and 2021 (percentages)
Sources: Eurosystem and ECB staff macroeconomic projections, and ECB calculations.
The adverse scenario represents a tail event, consistent with the main systemic risks to the euro area materialising. The macro-micro model simulates several thousand combinations of macro-financial shocks sourced from their historical distributions. The final adverse scenario is selected as the one most consistent with the main systemic risks. This approach means that the scenario is constructed within the model, rather than by employing the methodology used for the EBA stress-test scenarios.32
Global macroeconomic conditions deteriorate significantly and risks are repriced in the adverse scenario. The risk of a protracted deterioration in the global economic environment is linked to a progressing intensification of trade tensions. In addition, reflecting a generalised risk repricing and heightened private and public sector debt sustainability concerns, the scenario involves a sharp correction of house prices in countries where there are signs of overvaluation, as well as increasing government bond yields in countries where political uncertainty or debt sustainability concerns are high.
32 For a more detailed description of the scenario design employed in the EBA banking sector stress tests,
see Henry, J. and Kok, C. (eds.), “A macro stress testing framework for assessing systemic risks in the banking sector”, Occasional Paper Series, No 152, ECB, October 2013.
-2
-1.5
-1
-0.5
0
0.5
1
1.5
2
2.5
2018 2019 2020 2021
GDP growth
June 2019September 2019Adverse
0
2
4
6
8
10
12
2018 2019 2020 2021
Unemployment rate
-0.7
-0.6
-0.5
-0.4
-0.3
-0.2
-0.1
0
2018 2019 2020 2021
Three-month EURIBOR
0
0.5
1
1.5
2
2.5
2018 2019 2020 2021
Ten-year governmentbond yield
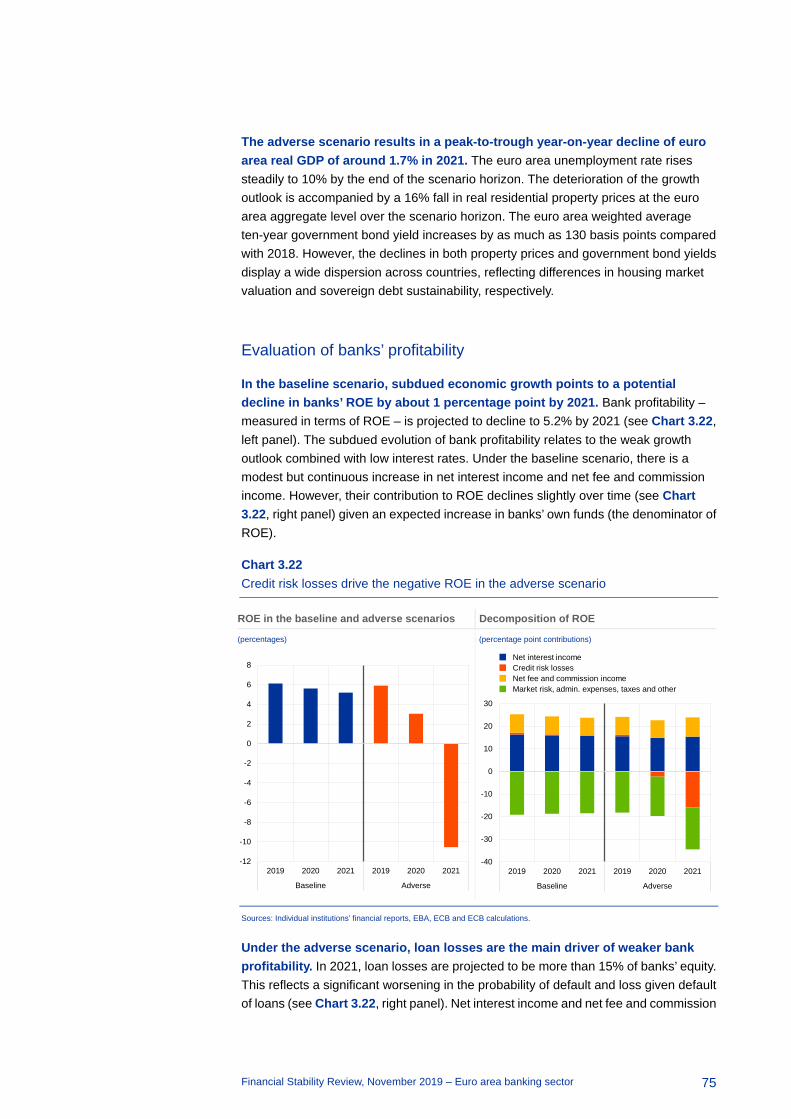
Financial Stability Review, November 2019 – Euro area banking sector
75
The adverse scenario results in a peak-to-trough year-on-year decline of euro area real GDP of around 1.7% in 2021. The euro area unemployment rate rises steadily to 10% by the end of the scenario horizon. The deterioration of the growth outlook is accompanied by a 16% fall in real residential property prices at the euro area aggregate level over the scenario horizon. The euro area weighted average ten-year government bond yield increases by as much as 130 basis points compared with 2018. However, the declines in both property prices and government bond yields display a wide dispersion across countries, reflecting differences in housing market valuation and sovereign debt sustainability, respectively.
Evaluation of banks’ profitability
In the baseline scenario, subdued economic growth points to a potential decline in banks’ ROE by about 1 percentage point by 2021. Bank profitability – measured in terms of ROE – is projected to decline to 5.2% by 2021 (see Chart 3.22, left panel). The subdued evolution of bank profitability relates to the weak growth outlook combined with low interest rates. Under the baseline scenario, there is a modest but continuous increase in net interest income and net fee and commission income. However, their contribution to ROE declines slightly over time (see Chart 3.22, right panel) given an expected increase in banks’ own funds (the denominator of ROE).
Chart 3.22 Credit risk losses drive the negative ROE in the adverse scenario
ROE in the baseline and adverse scenarios Decomposition of ROE
(percentages) (percentage point contributions)
Sources: Individual institutions’ financial reports, EBA, ECB and ECB calculations.
Under the adverse scenario, loan losses are the main driver of weaker bank profitability. In 2021, loan losses are projected to be more than 15% of banks’ equity. This reflects a significant worsening in the probability of default and loss given default of loans (see Chart 3.22, right panel). Net interest income and net fee and commission
-12
-10
-8
-6
-4
-2
0
2
4
6
8
2019 2020 2021 2019 2020 2021
Baseline Adverse
-40
-30
-20
-10
0
10
20
30
2019 2020 2021 2019 2020 2021
Baseline Adverse
Net interest incomeCredit risk lossesNet fee and commission incomeMarket risk, admin. expenses, taxes and other

Financial Stability Review, November 2019 – Euro area banking sector
76
income likewise decline, which is however counterbalanced by a marked reduction in banks’ own funds, implying broadly stable contributions in ROE terms.
Implications for bank lending
Lending to the non-financial private sector is expected to remain modest in the baseline scenario, but to decline significantly in the adverse scenario. The subdued loan growth under the baseline scenario reflects weak economic conditions and low bank profitability. Under the adverse scenario, however, lending volumes are expected to materially contract in both 2020 and 2021 (see Chart 3.23). Lower credit demand and the contraction of credit supply hit lending segments differently. Lending to NFCs appears the most sensitive to changing economic conditions and the deterioration of banks’ own situation.
Chart 3.23 NFC credit decreases the most in the adverse scenario
Difference in growth in lending to the non-financial private sector between the adverse and baseline scenarios broken down into sectoral contributions (percentage point contributions)
Sources: Individual institutions’ financial reports, EBA, ECB and ECB calculations.
Banks’ solvency
Under the baseline scenario, the solvency position of the significant euro area credit institutions is projected to improve. The aggregate CET1 capital ratio is projected to increase by about 0.9 percentage points to 15.3% by the end of 2021 (see Chart 3.24). The improvement in banks’ capital ratios relates to high earnings retention as well as some reduction in average risk weights over the three-year horizon. The overall contribution of risk-weighted assets is nevertheless negative owing to an increase in exposure amounts (e.g. due to positive loan growth) that outweighs the positive effect of declining risk weights.
-3.5
-3.0
-2.5
-2.0
-1.5
-1.0
-0.5
0.0
2019 2020 2021
Non-financial corporationsHouseholds - house purchaseHouseholds - consumer credit

Financial Stability Review, November 2019 – Euro area banking sector
77
Chart 3.24 Under the baseline scenario, banks’ solvency position would improve
Drivers of the CET1 ratio change under the baseline scenario
Drivers of the CET1 ratio change under the adverse scenario
(percentages, percentage point contributions) (percentages, percentage point contributions)
Sources: Individual institutions’ financial reports, EBA, ECB and ECB calculations. Notes: “P&L” denotes the contribution of banks’ profits or losses to the change in the CET1 ratio. “Dividends” denotes the contribution of paid-out dividends. “RWA” is the contribution of a change in risk-weighted assets. “Other” accounts for other changes that drive the difference in the CET1 ratio.
In the adverse scenario, the CET1 ratio of the euro area banking system could fall by up to 3.1 percentage points. The aggregate CET1 ratio falls from 14.4% to 11.3% by 2021 in the adverse scenario described above.33 The amount of CET1, which is a useful indicator of the severity of the capital shortfall in an assessment involving a dynamic balance sheet assumption, falls by 8.7% in the scenario. The reduction in banks’ capitalisation reflects a contraction in banks’ P&L, driven primarily by rising loan losses (see Chart 3.24) and an increase in risk exposure amounts. Overall, the decline in the CET1 ratio under the adverse scenario reflects that the deterioration of asset quality and increasing economic risk outweigh the effect of banks’ deleveraging.
That said, the euro area banking sector is still assessed to be resilient to the materialisation of the main financial stability risks.34 The majority of euro area significant institutions remain above their CET1 capital requirement composed of Pillar 1 requirements, Pillar 2 requirements, combined buffer requirements and Pillar 2 guidance. Banks accounting for about 19% of euro area total banking sector assets would, however, see their regulatory capital buffers diminish.35
33 This solvency assessment differs from that of previous issues of the FSR, as the dynamic balance sheet
assumption and banks’ heterogeneous responses to stress replace the constant balance sheet assumption and banks’ homogeneous reactions. This change will, in general, result in lower capital depletion as measured by CET1 ratios and higher capital depletion as measured by CET1 volumes. These differences are discussed in more detail in Budnik, K., Balatti, M., Dimitrov, I., Groß, J., Hansen, I., di Iasio, G., Kleemann, M., Reichenbachas, T., Sanna, F., Sarychev, A., Siņenko, N. and Volk, M., “Macroprudential stress test of the euro area banking system”, Occasional Paper Series, No 226, ECB, July 2019.
34 These results are not comparable with the EBA 2018 stress-test results due to differences in methodology, scenarios and starting points, as well as the exclusion of operational risk and parts of market risk from this analysis.
35 These results do not take into account that under the adverse scenario macroprudential buffers might be used to cushion incurred losses.
14.4
15.3
7
9
11
13
15
17
19
2018 P&L Dividends RWA Other 2021
14.4
11.3
7
9
11
13
15
17
19
2018 P&L Dividends RWA Other 2021
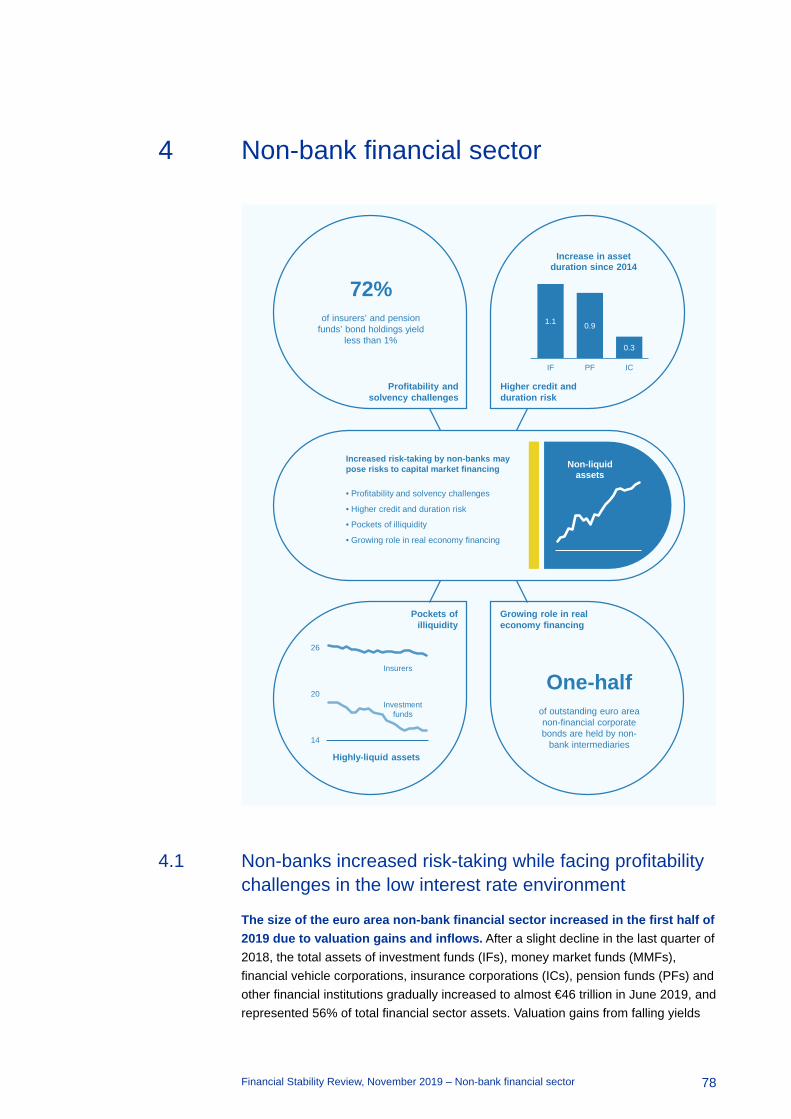
Financial Stability Review, November 2019 – Non-bank financial sector
78
4 Non-bank financial sector
4.1 Non-banks increased risk-taking while facing profitability challenges in the low interest rate environment
The size of the euro area non-bank financial sector increased in the first half of 2019 due to valuation gains and inflows. After a slight decline in the last quarter of 2018, the total assets of investment funds (IFs), money market funds (MMFs), financial vehicle corporations, insurance corporations (ICs), pension funds (PFs) and other financial institutions gradually increased to almost €46 trillion in June 2019, and represented 56% of total financial sector assets. Valuation gains from falling yields
Higher credit and duration risk
Profitability and solvency challenges
Growing role in real economy financing
Pockets of illiquidity
Increased risk-taking by non-banks may pose risks to capital market financing
• Profitability and solvency challenges
• Higher credit and duration risk
• Pockets of illiquidity
• Growing role in real economy financing
72%of insurers’ and pension
funds’ bond holdings yield less than 1%
One-halfof outstanding euro area non-financial corporate bonds are held by non-
bank intermediaries14
20
26
Highly-liquid assets
Investment funds
Insurers
1.1 0.9
0.3
IF PF IC
Increase in asset duration since 2014
Non-liquid assets
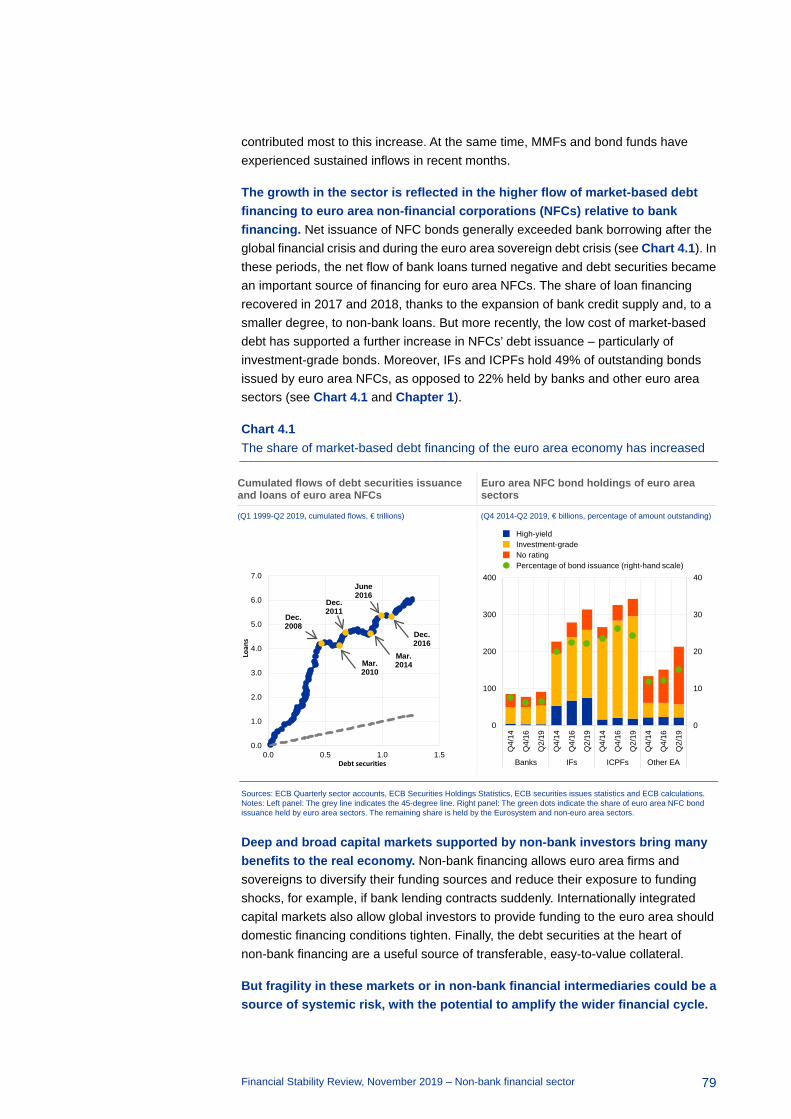
Financial Stability Review, November 2019 – Non-bank financial sector
79
contributed most to this increase. At the same time, MMFs and bond funds have experienced sustained inflows in recent months.
The growth in the sector is reflected in the higher flow of market-based debt financing to euro area non-financial corporations (NFCs) relative to bank financing. Net issuance of NFC bonds generally exceeded bank borrowing after the global financial crisis and during the euro area sovereign debt crisis (see Chart 4.1). In these periods, the net flow of bank loans turned negative and debt securities became an important source of financing for euro area NFCs. The share of loan financing recovered in 2017 and 2018, thanks to the expansion of bank credit supply and, to a smaller degree, to non-bank loans. But more recently, the low cost of market-based debt has supported a further increase in NFCs’ debt issuance – particularly of investment-grade bonds. Moreover, IFs and ICPFs hold 49% of outstanding bonds issued by euro area NFCs, as opposed to 22% held by banks and other euro area sectors (see Chart 4.1 and Chapter 1).
Chart 4.1 The share of market-based debt financing of the euro area economy has increased
Cumulated flows of debt securities issuance and loans of euro area NFCs
Euro area NFC bond holdings of euro area sectors
(Q1 1999-Q2 2019, cumulated flows, € trillions) (Q4 2014-Q2 2019, € billions, percentage of amount outstanding)
Sources: ECB Quarterly sector accounts, ECB Securities Holdings Statistics, ECB securities issues statistics and ECB calculations. Notes: Left panel: The grey line indicates the 45-degree line. Right panel: The green dots indicate the share of euro area NFC bond issuance held by euro area sectors. The remaining share is held by the Eurosystem and non-euro area sectors.
Deep and broad capital markets supported by non-bank investors bring many benefits to the real economy. Non-bank financing allows euro area firms and sovereigns to diversify their funding sources and reduce their exposure to funding shocks, for example, if bank lending contracts suddenly. Internationally integrated capital markets also allow global investors to provide funding to the euro area should domestic financing conditions tighten. Finally, the debt securities at the heart of non-bank financing are a useful source of transferable, easy-to-value collateral.
But fragility in these markets or in non-bank financial intermediaries could be a source of systemic risk, with the potential to amplify the wider financial cycle.
0.0
1.0
2.0
3.0
4.0
5.0
6.0
7.0
0.0 0.5 1.0 1.5
Loan
s
Debt securities
Dec.2008
Mar. 2010
Mar.2014
June2016
Dec.2016
Dec.2011
0
10
20
30
40
0
100
200
300
400
Q4/
14
Q4/
16
Q2/
19
Q4/
14
Q4/
16
Q2/
19
Q4/
14
Q4/
16
Q2/
19
Q4/
14
Q4/
16
Q2/
19
Banks IFs ICPFs Other EA
High-yieldInvestment-gradeNo ratingPercentage of bond issuance (right-hand scale)
Financial Stability Review, November 2019 – Non-bank financial sector
80
Investor flows and higher demand for risky assets by non-banks could have a procyclical effect on prices of euro area assets and amplify the build-up of vulnerabilities in upswings. Non-banks have increased their exposure to highly indebted segments of the corporate and government sectors in recent years. Also, the upturn in euro area commercial real estate markets has reflected, in part, a strong appetite for such assets from global investment funds (see Box 1). In the event of an economic downturn or a sudden correction in risk premia, higher credit and liquidity risk as well as leverage may compromise non-banks’ ability to absorb shocks. Furthermore, despite improving risk sharing, a larger share of non-bank financial intermediation also potentially increases interconnectedness across the financial system. This could amplify the effects of any downturn, leading to a reduction in funding flows to the real economy more broadly. Finally, portfolio flows of investment funds actively searching for yield worldwide may increase volatility in global capital flows, with asset reallocations by international investment funds playing an important role in transmitting global financial conditions to the euro area (see Box 6).
Box 6 Investment funds and the transmission of the global financial cycle to the euro area
Prepared by Christoph Kaufmann
As the role of investment funds in financing the global economy has grown, so has their role in cross-border capital flows and the global financial cycle. Movements of asset prices have become more synchronised across countries since the early 1990s, indicating that a global financial cycle has emerged. US monetary policy is often considered as one of the main drivers of this cycle.36 Up to the mid-2000s, banks’ cross-border flows played a key role in the global synchronisation of financial conditions. Since then, portfolio flows of investment funds actively searching for yield in financial markets worldwide have increased.37
Funds adjust their global asset allocation as investors respond to return differentials and fund performance or as they change their risk-taking. For example, after a loosening in monetary conditions in one region, global investors tend to reallocate away from assets there towards other regions where assets have a higher expected return. This might also imply that investment funds rebalance their portfolios towards riskier market segments. In addition, monetary conditions can affect fund returns through changes in valuations and thus influence cross-border investment fund flows, since there is evidence of a positive relationship between fund flows and past returns.38
This box investigates the role of international investment funds in the transmission of global financial conditions to the euro area. The analysis is based on a structural Bayesian vector autoregression (BVAR) model and uses unexpected changes in US monetary policy, obtained from a standard Cholesky shock identification scheme, as an illustrative example of a shock to global financial conditions. The one-year US Treasury rate is used to measure the monetary policy stance,
36 For an overview of the literature on the global financial cycle, see, among others, Shin, H. S., “The
second phase of global liquidity and its impact on emerging economies”, remarks at the 2013 Federal Reserve Bank of San Francisco Asia Economic Policy Conference, November 2013; Miranda-Agrippino, S. and Rey, H., “US monetary policy and the global financial cycle”, NBER Working Paper No 21722, National Bureau of Economic Research, November 2015; and Bruno, V. and Shin, H. S., “Capital flows and the risk-taking channel of monetary policy”, Journal of Monetary Economics, Vol. 71, 2015, pp. 119-132.
37 See, for example, Global Financial Stability Report, IMF, October 2019. 38 See, for example, Financial Stability Review, ECB, November 2017, Box 6, pp. 104-107; and Goldstein,
I., Jiang, H. and Ng, D., “Investor flows and fragility in corporate bond funds”, Journal of Financial Economics, Vol. 126(3), 2017, pp. 592-613.

Financial Stability Review, November 2019 – Non-bank financial sector
81
as it can better capture variations in US monetary policy than changes in the federal funds rate because of the effective lower bound.
The baseline specification of the model considers five macro-financial variables. These include: flows from investment funds domiciled outside the euro area towards different segments of euro area bond markets, debt issuance by euro area non-financial corporations, the VIX volatility index as a measure of global risk aversion, the US dollar/euro exchange rate, and the one-year US Treasury rate. This model is augmented with further variables, including the euro area monetary policy stance, interest rate differentials between the United States and the euro area, and indices for bond and equity markets. The analysis is based on monthly data from April 2007 until March 2019, capturing the growing importance of investment funds and market-based finance over this period.
The results provide evidence of global spillovers to euro area financial conditions via the investment fund sector. After an easing of global financial conditions, investment funds tend to increase their purchases of euro area bonds. These portfolio inflows are particularly strong in riskier market segments, such as corporate and high-yield bonds, while funds investing in safer sovereign bonds experience outflows (see Chart A, panels a-c). For example, 12 months after the shock, foreign investment fund flows to euro area high-yield bonds are estimated to increase by 3.9%. At the same time, issuance of debt securities by euro area non-financial corporations is estimated to increase by 1.6% in the 12 months after the shock (see Chart A, panel d). This may suggest that euro area financing conditions improve after an easing in global financial conditions, proxied by US monetary policy developments.
Chart A Investment fund flows to the euro area and securities issuance increase after a global financial easing
Impulse responses to a 1% loosening shock in US monetary policy (x-axis: months after the initial interest rate reduction; y-axis: percentage change)
Sources: ECB staff estimates based on data from the ECB and EPFR Global. Notes: Impulse responses to an accommodative US monetary policy shock inducing a transitory 1% reduction of the one-year US Treasury rate derived from a structural BVAR model with recursive identification. The charts show median responses of the posterior distribution (blue lines) with 70% (blue-shaded areas) and 90% (grey-shaded areas) credibility intervals. The model includes the following variables: debt securities issuance by euro area non-financial corporations (NFCs); measures of flows from investment funds domiciled outside the euro area towards corporate/sovereign/high-yield bonds in the euro area; the one-year US Treasury rate (serving as a monetary policy indicator); the VIX volatility index; and the US dollar/euro exchange rate. For the shock identification, the variables are ordered in the same way, reflecting the assumption that quantities move faster than prices. All results are robust to alternative orderings and monetary policy measures including the shadow federal funds rate (see Wu, J. C. and Xia, F. D., “Measuring the macroeconomic impact of monetary policy at the zero lower bound”, Journal of Money, Credit and Banking, Vol. 48(2-3), 2016, pp. 253-291).
0
1
2
3
4
5
0 5 10 15 20 25 30 35
a) Fund flows to EA corporate bonds
-2
-1.5
-1
-0.5
0
0 5 10 15 20 25 30 35
b) Fund flows to EA sovereign bonds
-2-101234567
0 5 10 15 20 25 30 35
c) Fund flows to EA high-yield bonds
-1
0
1
2
3
4
0 5 10 15 20 25 30 35
d) Debt securities issuance by EA NFCs
Financial Stability Review, November 2019 – Non-bank financial sector
82
These results continue to hold when the model controls for other variables. These include monetary policy in the euro area, as well as short and long-term interest rate differentials between the United States and the euro area. Further analysis shows that bond and equity indices rise in both regions after the US monetary policy shock. Also, euro area equity markets experience inflows from non-domestic investment funds and there is increased equity issuance in the euro area.39
Such spillovers of global financial conditions could affect risks to euro area financial stability. The analysis has shown that a loosening of global financial conditions can lead to inflows to riskier segments of euro area bond markets and increased debt issuance by euro area non-financial corporations. This could raise financial stability concerns if it leads to excessive risk-taking by investment funds or too much borrowing by relatively risky non-financial corporates in the euro area.
The profitability of non-banks faces strong headwinds in a prolonged period of low interest rates
As yields have fallen, non-bank financial intermediaries hold a growing share of low-yielding bonds, which decreases their investment income in the medium term and encourages risk-taking. Over 70% of ICPFs’ bond portfolios are composed of securities with a yield to maturity of below 1%, compared with 50% at the end of 2018 (see Chart 4.2). Most of these bonds have high credit quality – being rated between AAA and A – and low residual maturity. One-third of investment funds’ bond holdings have a yield to maturity below 1%, up from 18% in 2018, reflecting their relatively higher credit risk profile compared with insurers. At the same time, higher-yielding bonds – securities with a yield to maturity above 3% – represent only 22% of funds’ bond holdings and 2% of ICPFs’ bond holdings. As these assets mature, non-banks will face a trade-off between replacing them with similar securities with lower yields or increasing the riskiness of their portfolio.
Non-banks’ holdings of bonds trading at negative yields have more than doubled since December 2018 and amounted to 26% of their bond portfolio in June 2019. The share of bonds yielding negative rates increased significantly in the first half of 2019 (see Chapter 2). Most of these securities are highly rated euro area government bonds with a residual maturity of between 3 and 15 years. But some financial bonds issued by highly rated banks – such as euro medium-term notes and Pfandbriefe – are also trading at negative rates, alongside some NFC and longer-term government bonds. ICPFs are more exposed than investment funds to negative-yielding bonds, given the lower risk profile of their debt holdings (see Chart 4.3). This will affect their investment income over the medium term. Should they decide to avoid investing in negative-yielding bonds while keeping a similar risk profile, their investment universe would shrink significantly.
39 The analysis does not study substitution effects of NFC debt financing between debt securities and bank
loans. It also does not assess the total impact on NFC external financing.
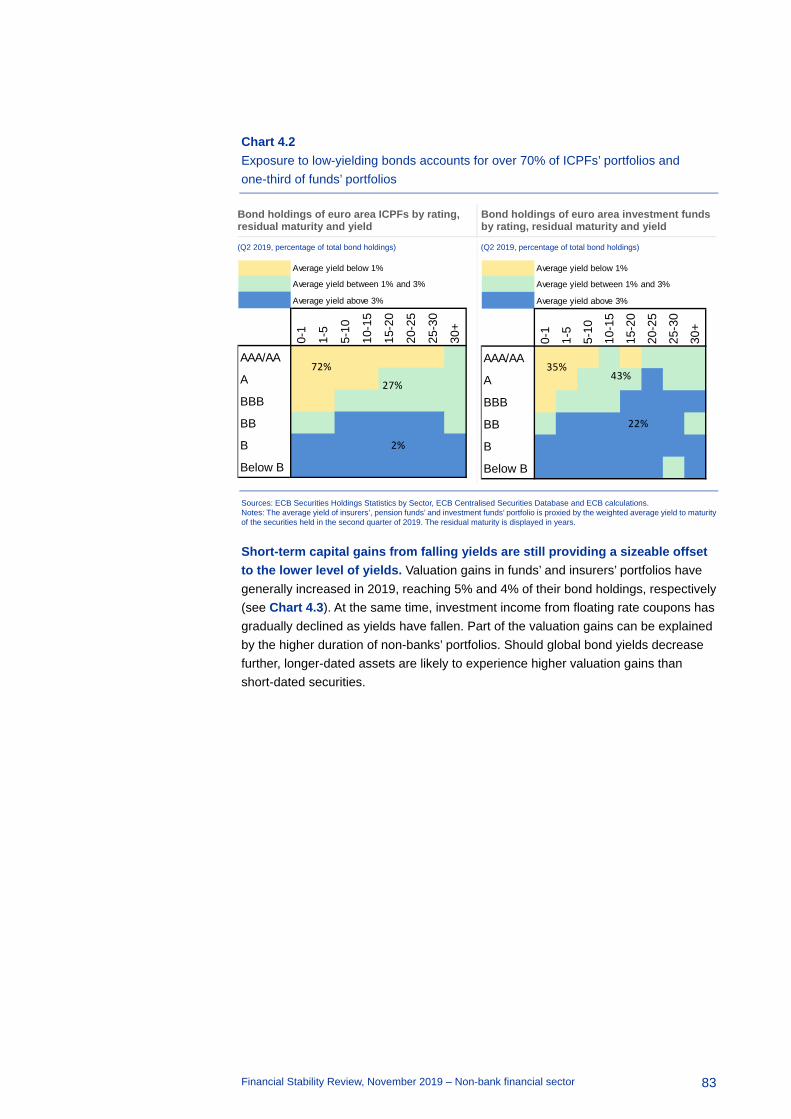
Financial Stability Review, November 2019 – Non-bank financial sector
83
Chart 4.2 Exposure to low-yielding bonds accounts for over 70% of ICPFs’ portfolios and one-third of funds’ portfolios
Bond holdings of euro area ICPFs by rating, residual maturity and yield
Bond holdings of euro area investment funds by rating, residual maturity and yield
(Q2 2019, percentage of total bond holdings) (Q2 2019, percentage of total bond holdings)
Sources: ECB Securities Holdings Statistics by Sector, ECB Centralised Securities Database and ECB calculations. Notes: The average yield of insurers’, pension funds’ and investment funds’ portfolio is proxied by the weighted average yield to maturity of the securities held in the second quarter of 2019. The residual maturity is displayed in years.
Short-term capital gains from falling yields are still providing a sizeable offset to the lower level of yields. Valuation gains in funds’ and insurers’ portfolios have generally increased in 2019, reaching 5% and 4% of their bond holdings, respectively (see Chart 4.3). At the same time, investment income from floating rate coupons has gradually declined as yields have fallen. Part of the valuation gains can be explained by the higher duration of non-banks’ portfolios. Should global bond yields decrease further, longer-dated assets are likely to experience higher valuation gains than short-dated securities.
Average yield below 1%
Average yield between 1% and 3%
Average yield above 3%0-
1
1-5
5-10
10-1
5
15-2
0
20-2
5
25-3
0
30+
AAA/AA
A
BBB
BB
B
Below B
72%
27%
2%
Average yield below 1%
Average yield between 1% and 3%
Average yield above 3%
0-1
1-5
5-10
10-1
5
15-2
0
20-2
5
25-3
0
30+
AAA/AA
A
BBB
BB
B
Below B
35%43%
22%

Financial Stability Review, November 2019 – Non-bank financial sector
84
Chart 4.3 26% of non-banks’ bond holdings are invested in securities trading at a negative yield, which provides short-term capital gains but adversely affects investment income
Exposure to bonds with a negative yield to maturity
Valuation gains and investment income of IFs’ and ICs’ bond portfolios over time
(Q2 2019; left-hand scale: € trillions; right-hand scale: percentage of total bond holdings)
(2014-Q2 2019, percentage of total bond holdings)
Sources: ECB Securities Holdings Statistics by Sector, ECB Centralised Securities Database and ECB calculations. Notes: Right panel: Valuation gains/losses are computed as the difference between changes in the market value and changes in the nominal value of bond holdings in the previous four quarters. Income from coupons is computed as the sum of coupons received in the previous four quarters.
Exposure of non-banks to credit, liquidity and exchange rate risk has increased
Profitability challenges have encouraged non-banks to increase their exposure to riskier and less liquid securities. Both investment funds and insurers have increased investments in BBB and high-yield bonds to boost investment returns (see Chart 4.4). Investment fund holdings of high-yield and BBB securities now stand at around 20% and 34%, respectively, of their total bond portfolio, compared with 15% and 29% at the end of 2013. Similarly, insurers’ holdings of high-yield and BBB securities account for 3% and 37% of their total bond holdings, compared with 4% and 27% at the end of 2013. Given the associated credit and liquidity risk, elevated and increasing exposure of non-bank financial intermediaries to such assets could result in greater losses, should, for example, the corporate credit cycle turn. And possible downgrades from BBB to sub-investment-grade ratings pose a risk in terms of forced asset sales due to investment mandate restrictions. Finally, given the rising exposure to US securities, this risk may be further amplified by the elevated leverage in parts of the US corporate sector and weaker global growth prospects.
The search for yield is also driving an increase in non-banks’ exposures to emerging market economies. Emerging economy assets represent a small but increasing share of non-banks’ bond holdings – 9% for investment funds and 1% for insurers (see Chart 4.4). This represents a channel for inward spillovers triggered, for
0
5
10
15
20
25
30
35
40
45
0.0
0.2
0.4
0.6
0.8
1.0
1.2
1.4
1.6
1.8
Banks PFs ICs IFs
Government bondsNon-financial corporate bondsFinancial sector bondsPercentage of total bond holdings (right-hand scale)
-6
-4
-2
0
2
4
6
8
10
12
14
2014
2015
2016
2017
2018
2019
Q2
2014
2015
2016
2017
2018
2019
Q2
IFs ICs
Valuation changeIncome from fixed rate couponsIncome from floating rate couponsIncome from other couponsNet income
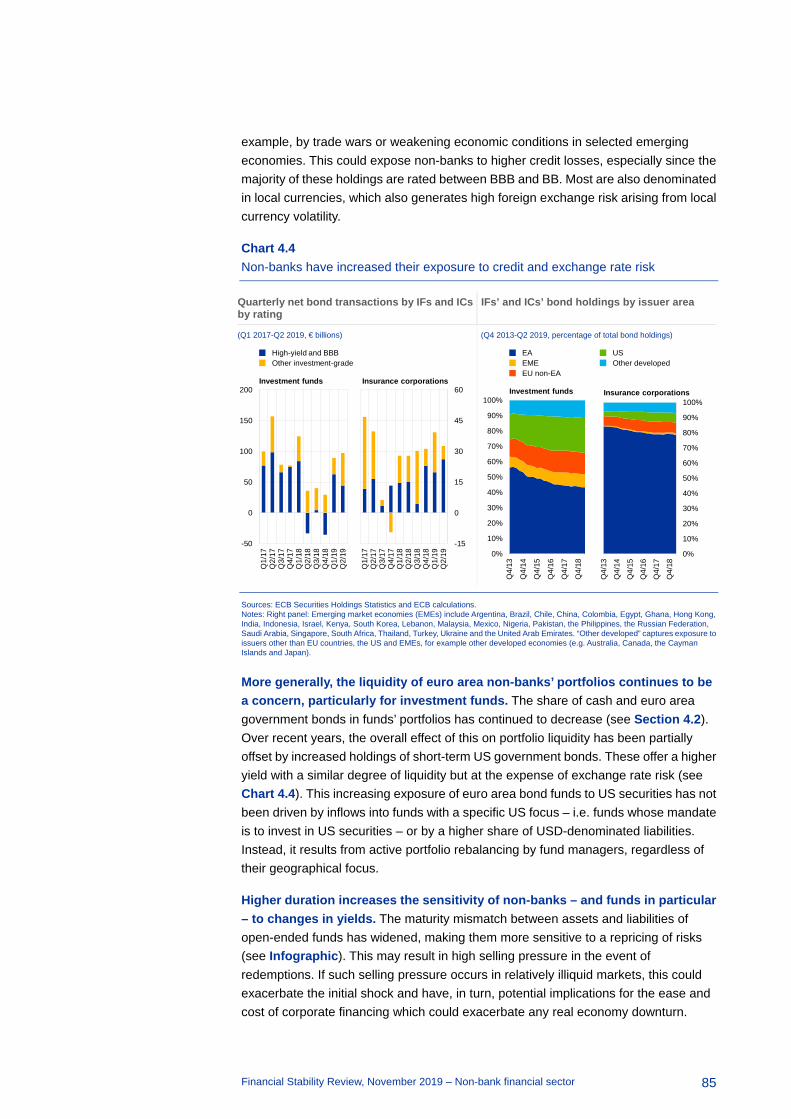
Financial Stability Review, November 2019 – Non-bank financial sector
85
example, by trade wars or weakening economic conditions in selected emerging economies. This could expose non-banks to higher credit losses, especially since the majority of these holdings are rated between BBB and BB. Most are also denominated in local currencies, which also generates high foreign exchange risk arising from local currency volatility.
Chart 4.4 Non-banks have increased their exposure to credit and exchange rate risk
Quarterly net bond transactions by IFs and ICs by rating
IFs’ and ICs’ bond holdings by issuer area
(Q1 2017-Q2 2019, € billions) (Q4 2013-Q2 2019, percentage of total bond holdings)
Sources: ECB Securities Holdings Statistics and ECB calculations. Notes: Right panel: Emerging market economies (EMEs) include Argentina, Brazil, Chile, China, Colombia, Egypt, Ghana, Hong Kong, India, Indonesia, Israel, Kenya, South Korea, Lebanon, Malaysia, Mexico, Nigeria, Pakistan, the Philippines, the Russian Federation, Saudi Arabia, Singapore, South Africa, Thailand, Turkey, Ukraine and the United Arab Emirates. “Other developed” captures exposure to issuers other than EU countries, the US and EMEs, for example other developed economies (e.g. Australia, Canada, the Cayman Islands and Japan).
More generally, the liquidity of euro area non-banks’ portfolios continues to be a concern, particularly for investment funds. The share of cash and euro area government bonds in funds’ portfolios has continued to decrease (see Section 4.2). Over recent years, the overall effect of this on portfolio liquidity has been partially offset by increased holdings of short-term US government bonds. These offer a higher yield with a similar degree of liquidity but at the expense of exchange rate risk (see Chart 4.4). This increasing exposure of euro area bond funds to US securities has not been driven by inflows into funds with a specific US focus – i.e. funds whose mandate is to invest in US securities – or by a higher share of USD-denominated liabilities. Instead, it results from active portfolio rebalancing by fund managers, regardless of their geographical focus.
Higher duration increases the sensitivity of non-banks – and funds in particular – to changes in yields. The maturity mismatch between assets and liabilities of open-ended funds has widened, making them more sensitive to a repricing of risks (see Infographic). This may result in high selling pressure in the event of redemptions. If such selling pressure occurs in relatively illiquid markets, this could exacerbate the initial shock and have, in turn, potential implications for the ease and cost of corporate financing which could exacerbate any real economy downturn.
-50
0
50
100
150
200
Q1/
17Q
2/17
Q3/
17Q
4/17
Q1/
18Q
2/18
Q3/
18Q
4/18
Q1/
19Q
2/19
High-yield and BBBOther investment-grade
Investment funds
-15
0
15
30
45
60
Q1/
17Q
2/17
Q3/
17Q
4/17
Q1/
18Q
2/18
Q3/
18Q
4/18
Q1/
19Q
2/19
Insurance corporations
0%
10%
20%
30%
40%
50%
60%
70%
80%
90%
100%
Q4/
13
Q4/
14
Q4/
15
Q4/
16
Q4/
17
Q4/
18
EAEMEEU non-EA
USOther developed
Investment funds
0%
10%
20%
30%
40%
50%
60%
70%
80%
90%
100%
Q4/
13
Q4/
14
Q4/
15
Q4/
16
Q4/
17
Q4/
18
Insurance corporations
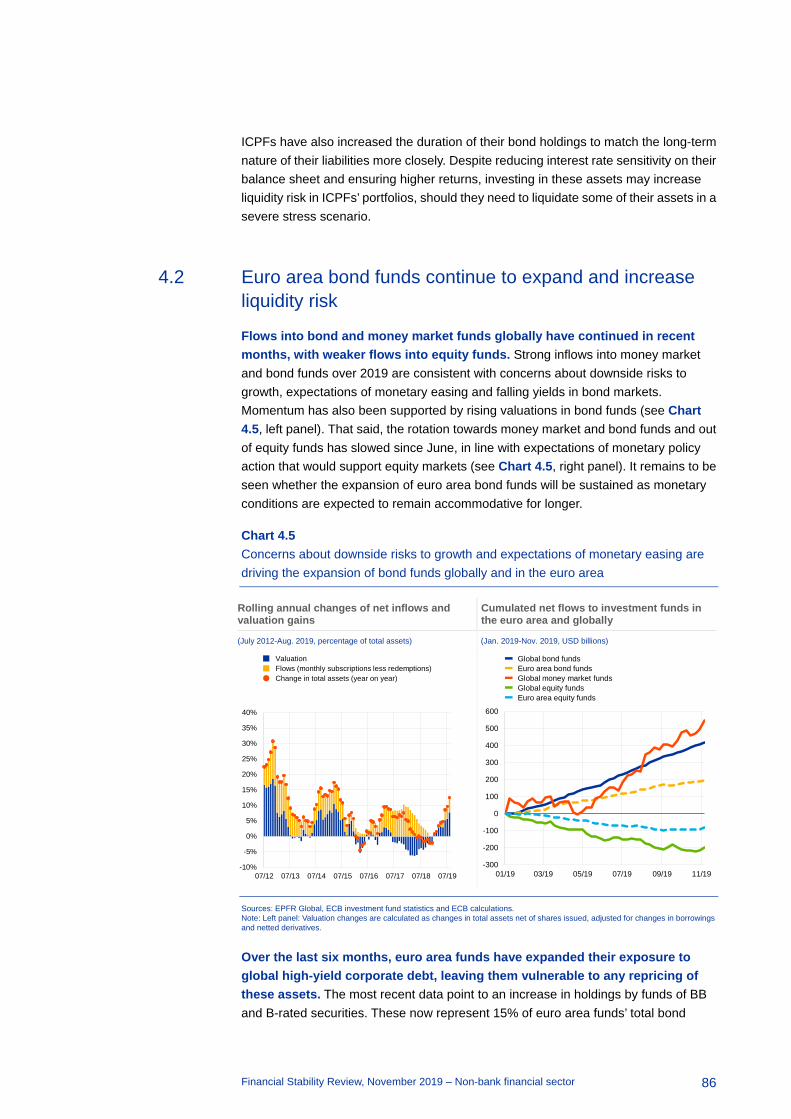
Financial Stability Review, November 2019 – Non-bank financial sector
86
ICPFs have also increased the duration of their bond holdings to match the long-term nature of their liabilities more closely. Despite reducing interest rate sensitivity on their balance sheet and ensuring higher returns, investing in these assets may increase liquidity risk in ICPFs’ portfolios, should they need to liquidate some of their assets in a severe stress scenario.
4.2 Euro area bond funds continue to expand and increase liquidity risk
Flows into bond and money market funds globally have continued in recent months, with weaker flows into equity funds. Strong inflows into money market and bond funds over 2019 are consistent with concerns about downside risks to growth, expectations of monetary easing and falling yields in bond markets. Momentum has also been supported by rising valuations in bond funds (see Chart 4.5, left panel). That said, the rotation towards money market and bond funds and out of equity funds has slowed since June, in line with expectations of monetary policy action that would support equity markets (see Chart 4.5, right panel). It remains to be seen whether the expansion of euro area bond funds will be sustained as monetary conditions are expected to remain accommodative for longer.
Chart 4.5 Concerns about downside risks to growth and expectations of monetary easing are driving the expansion of bond funds globally and in the euro area
Rolling annual changes of net inflows and valuation gains
Cumulated net flows to investment funds in the euro area and globally
(July 2012-Aug. 2019, percentage of total assets) (Jan. 2019-Nov. 2019, USD billions)
Sources: EPFR Global, ECB investment fund statistics and ECB calculations. Note: Left panel: Valuation changes are calculated as changes in total assets net of shares issued, adjusted for changes in borrowings and netted derivatives.
Over the last six months, euro area funds have expanded their exposure to global high-yield corporate debt, leaving them vulnerable to any repricing of these assets. The most recent data point to an increase in holdings by funds of BB and B-rated securities. These now represent 15% of euro area funds’ total bond
-10%
-5%
0%
5%
10%
15%
20%
25%
30%
35%
40%
07/12 07/13 07/14 07/15 07/16 07/17 07/18 07/19
ValuationFlows (monthly subscriptions less redemptions)Change in total assets (year on year)
-300
-200
-100
0
100
200
300
400
500
600
01/19 03/19 05/19 07/19 09/19 11/19
Global bond fundsEuro area bond fundsGlobal money market fundsGlobal equity fundsEuro area equity funds

Financial Stability Review, November 2019 – Non-bank financial sector
87
holdings (see Chart 4.6, left panel). BBB securities – the lowest-rated type of investment-grade debt – also form nearly one-third of these funds’ total bond portfolio. High leverage and downside risks to earnings in some parts of the non-financial corporate sector globally create a risk of widespread downgrades. If downgrades from BBB to sub-investment-grade ratings were to occur, this might trigger forced asset sales if institutional investors’ investment mandate restrictions come into play.
Chart 4.6 Investment funds have increased their exposures to lower-rated and less liquid assets
Breakdown of debt securities held by euro area investment funds by credit rating
Euro area investment funds’ holdings of government debt securities
(Q4 2013-Q2 2019, percentage of total debt securities holdings)
(Q4 2013-Q2 2019, percentage of total debt securities holdings)
Sources: ECB Securities Holdings Statistics by Sector and ECB calculations. Note: The analysis is based on the nominal amounts of euro and foreign currency-denominated securities, including “alive” and “non-alive” securities. Both panels include all types of investment funds domiciled in the euro area, except money market funds.
An increase in exposure to credit risk has coincided with a decline in the liquidity of euro area investment fund bond portfolios. In particular, the share of euro area government bonds has decreased, while the share of US government debt has risen – partially compensating for the decline in euro area government bond holdings (see Chart 4.6, right panel). While both euro area and US government bonds are highly liquid assets, the latter could expose euro area funds to exchange rate risk if exposures are unhedged. As a result of shifts in portfolio assets, the overall share of highly liquid bonds in funds’ bond portfolios has declined from almost 40% in 2013 to 30% by the end of 2018 (see Chart 4.7 left panel).
Furthermore, euro area investment funds have reduced their cash holdings. In addition to facilitating in- and outflows, cash is usually held to meet margin calls in securities lending and derivative transactions. Euro area bond funds hold less cash as a percentage of total assets compared with the average in the period from 2009 to 2014. This reduction in cash holdings can be observed across all types of bond funds (see Chart 4.7). In the high-yield segment, lower cash holdings are correlated with lower holdings of other liquid assets such as government bonds (see Chart 5 in the Overview). In the investment-grade segment, the share of government bond holdings has increased while cash holdings have declined.
0%
10%
20%
30%
40%
50%
60%
70%
80%
90%
100%
Q4/13 Q4/14 Q4/15 Q4/16 Q4/17 Q4/18
AAA-ABBBBB
BLower than BNo rating
0
5
10
15
20
25
30
35
Q4/13 Q4/14 Q4/15 Q4/16 Q4/17 Q4/18
US government bond holdingsEuro area government bond holdings
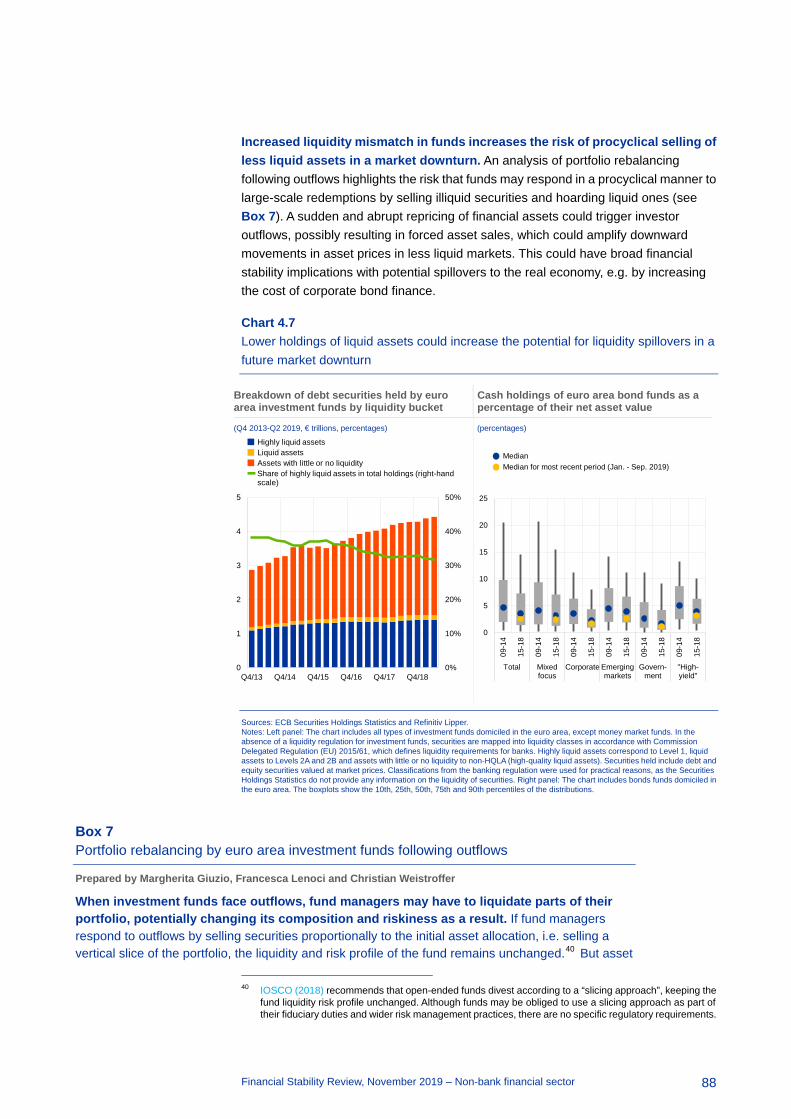
Financial Stability Review, November 2019 – Non-bank financial sector
88
Increased liquidity mismatch in funds increases the risk of procyclical selling of less liquid assets in a market downturn. An analysis of portfolio rebalancing following outflows highlights the risk that funds may respond in a procyclical manner to large-scale redemptions by selling illiquid securities and hoarding liquid ones (see Box 7). A sudden and abrupt repricing of financial assets could trigger investor outflows, possibly resulting in forced asset sales, which could amplify downward movements in asset prices in less liquid markets. This could have broad financial stability implications with potential spillovers to the real economy, e.g. by increasing the cost of corporate bond finance.
Chart 4.7 Lower holdings of liquid assets could increase the potential for liquidity spillovers in a future market downturn
Breakdown of debt securities held by euro area investment funds by liquidity bucket
Cash holdings of euro area bond funds as a percentage of their net asset value
(Q4 2013-Q2 2019, € trillions, percentages)
(percentages)
Sources: ECB Securities Holdings Statistics and Refinitiv Lipper. Notes: Left panel: The chart includes all types of investment funds domiciled in the euro area, except money market funds. In the absence of a liquidity regulation for investment funds, securities are mapped into liquidity classes in accordance with Commission Delegated Regulation (EU) 2015/61, which defines liquidity requirements for banks. Highly liquid assets correspond to Level 1, liquid assets to Levels 2A and 2B and assets with little or no liquidity to non-HQLA (high-quality liquid assets). Securities held include debt and equity securities valued at market prices. Classifications from the banking regulation were used for practical reasons, as the Securities Holdings Statistics do not provide any information on the liquidity of securities. Right panel: The chart includes bonds funds domiciled in the euro area. The boxplots show the 10th, 25th, 50th, 75th and 90th percentiles of the distributions.
Box 7 Portfolio rebalancing by euro area investment funds following outflows
Prepared by Margherita Giuzio, Francesca Lenoci and Christian Weistroffer
When investment funds face outflows, fund managers may have to liquidate parts of their portfolio, potentially changing its composition and riskiness as a result. If fund managers respond to outflows by selling securities proportionally to the initial asset allocation, i.e. selling a vertical slice of the portfolio, the liquidity and risk profile of the fund remains unchanged.40 But asset
40 IOSCO (2018) recommends that open-ended funds divest according to a “slicing approach”, keeping the
fund liquidity risk profile unchanged. Although funds may be obliged to use a slicing approach as part of their fiduciary duties and wider risk management practices, there are no specific regulatory requirements.
0%
10%
20%
30%
40%
50%
0
1
2
3
4
5
Q4/13 Q4/14 Q4/15 Q4/16 Q4/17 Q4/18
Highly liquid assetsLiquid assetsAssets with little or no liquidityShare of highly liquid assets in total holdings (right-hand scale)
0
5
10
15
20
2509
-14
15-1
8
09-1
4
15-1
8
09-1
4
15-1
8
09-1
4
15-1
8
09-1
4
15-1
8
09-1
4
15-1
8
Total Mixedfocus
Corporate Emergingmarkets
Govern-ment
"High-yield"
MedianMedian for most recent period (Jan. - Sep. 2019)
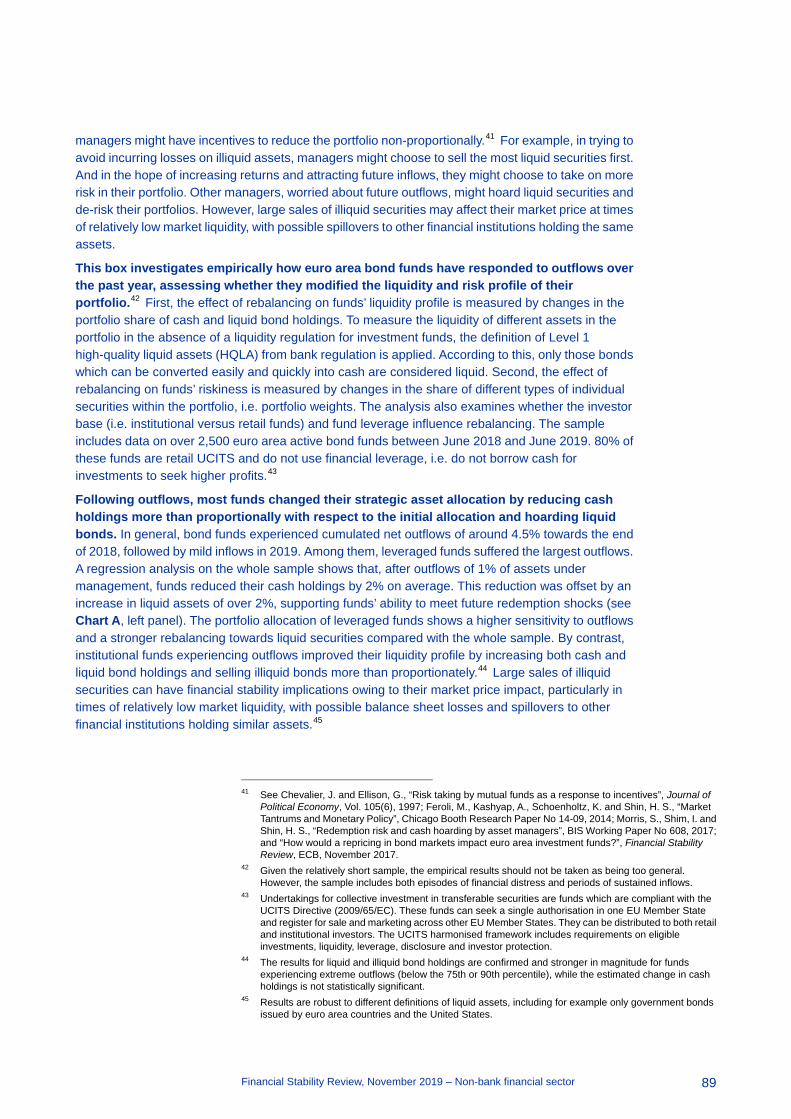
Financial Stability Review, November 2019 – Non-bank financial sector
89
managers might have incentives to reduce the portfolio non-proportionally.41 For example, in trying to avoid incurring losses on illiquid assets, managers might choose to sell the most liquid securities first. And in the hope of increasing returns and attracting future inflows, they might choose to take on more risk in their portfolio. Other managers, worried about future outflows, might hoard liquid securities and de-risk their portfolios. However, large sales of illiquid securities may affect their market price at times of relatively low market liquidity, with possible spillovers to other financial institutions holding the same assets.
This box investigates empirically how euro area bond funds have responded to outflows over the past year, assessing whether they modified the liquidity and risk profile of their portfolio.42 First, the effect of rebalancing on funds’ liquidity profile is measured by changes in the portfolio share of cash and liquid bond holdings. To measure the liquidity of different assets in the portfolio in the absence of a liquidity regulation for investment funds, the definition of Level 1 high-quality liquid assets (HQLA) from bank regulation is applied. According to this, only those bonds which can be converted easily and quickly into cash are considered liquid. Second, the effect of rebalancing on funds’ riskiness is measured by changes in the share of different types of individual securities within the portfolio, i.e. portfolio weights. The analysis also examines whether the investor base (i.e. institutional versus retail funds) and fund leverage influence rebalancing. The sample includes data on over 2,500 euro area active bond funds between June 2018 and June 2019. 80% of these funds are retail UCITS and do not use financial leverage, i.e. do not borrow cash for investments to seek higher profits.43
Following outflows, most funds changed their strategic asset allocation by reducing cash holdings more than proportionally with respect to the initial allocation and hoarding liquid bonds. In general, bond funds experienced cumulated net outflows of around 4.5% towards the end of 2018, followed by mild inflows in 2019. Among them, leveraged funds suffered the largest outflows. A regression analysis on the whole sample shows that, after outflows of 1% of assets under management, funds reduced their cash holdings by 2% on average. This reduction was offset by an increase in liquid assets of over 2%, supporting funds’ ability to meet future redemption shocks (see Chart A, left panel). The portfolio allocation of leveraged funds shows a higher sensitivity to outflows and a stronger rebalancing towards liquid securities compared with the whole sample. By contrast, institutional funds experiencing outflows improved their liquidity profile by increasing both cash and liquid bond holdings and selling illiquid bonds more than proportionately.44 Large sales of illiquid securities can have financial stability implications owing to their market price impact, particularly in times of relatively low market liquidity, with possible balance sheet losses and spillovers to other financial institutions holding similar assets.45
41 See Chevalier, J. and Ellison, G., “Risk taking by mutual funds as a response to incentives”, Journal of
Political Economy, Vol. 105(6), 1997; Feroli, M., Kashyap, A., Schoenholtz, K. and Shin, H. S., “Market Tantrums and Monetary Policy”, Chicago Booth Research Paper No 14-09, 2014; Morris, S., Shim, I. and Shin, H. S., “Redemption risk and cash hoarding by asset managers”, BIS Working Paper No 608, 2017; and “How would a repricing in bond markets impact euro area investment funds?”, Financial Stability Review, ECB, November 2017.
42 Given the relatively short sample, the empirical results should not be taken as being too general. However, the sample includes both episodes of financial distress and periods of sustained inflows.
43 Undertakings for collective investment in transferable securities are funds which are compliant with the UCITS Directive (2009/65/EC). These funds can seek a single authorisation in one EU Member State and register for sale and marketing across other EU Member States. They can be distributed to both retail and institutional investors. The UCITS harmonised framework includes requirements on eligible investments, liquidity, leverage, disclosure and investor protection.
44 The results for liquid and illiquid bond holdings are confirmed and stronger in magnitude for funds experiencing extreme outflows (below the 75th or 90th percentile), while the estimated change in cash holdings is not statistically significant.
45 Results are robust to different definitions of liquid assets, including for example only government bonds issued by euro area countries and the United States.
Financial Stability Review, November 2019 – Non-bank financial sector
90
Chart A Funds reduced cash and illiquid bond holdings following outflows, while increasing residual maturity and reacting procyclically to rating changes
Estimated sensitivity of cash and bond holdings to outflows by fund type
Estimated change in portfolio weight as a function of residual bond maturity and credit quality
(percentage change in cash, liquid bond and illiquid bond holdings following 1% outflows)
(percentage change in portfolio weight, shaded bars are non-statistically significant coefficients)
Sources: Refinitiv Lipper, ECB Centralised Securities Database and ECB calculations. Notes: The analysis is based on Lipper monthly data on euro area active bond funds and covers the period June 2018-June 2019. The sample is split according to funds’ investor base and use of leverage. Retail UCITS funds that do not use leverage make up 80% of the sample. The left panel shows the percentage change in funds’ holdings of cash, liquid bonds and illiquid bonds following 1% outflows. Bonds are classified according to the Basel Liquidity Coverage Ratio requirements for HQLA. Liquid bonds comprise Level 1 euro-denominated bonds issued by European governments and non-euro-denominated government bonds rated at least AA. The right panel shows the average change in portfolio weight (x-axis) as a function of bond characteristics (y-axis). A positive change in weight indicates the percentage increase in nominal holdings of a bond (i) having a residual maturity one year longer than the median (Maturity) and (ii) experiencing a one-notch upgrade in its rating (Change in rating).
Funds also changed their tactical asset allocation following outflows by increasing their relative holdings of bonds with longer maturity and bonds undergoing a rating upgrade. Controlling for the initial asset allocation, the empirical evidence shows that funds altered their portfolio weights according to individual bond characteristics, such as residual maturity and recent changes in credit rating. On average, funds increased their relative holdings of securities with longer residual maturity (see Chart A, right panel). In particular, leveraged and institutional funds increased the portfolio weight of longer-term bonds by 6% and 2%, respectively. Increasing residual maturity also increases duration risk of the portfolio, which makes funds more vulnerable to changes in interest rates. If credit ratings changed over the past month, funds reacted procyclically by purchasing securities which underwent a rating upgrade and selling securities which were downgraded. By contrast, the portfolio allocation of leveraged funds is not sensitive to changes in credit ratings.
In an overall sense, following outflows between June 2018 and June 2019, euro area bond funds increased their duration risk by increasing residual maturities and reducing cash holdings. At the same time, they de-risked their portfolio in response to rating downgrades and improved their overall liquidity profiles by selling illiquid securities and hoarding more liquid ones. The observed rebalancing patterns should support the funds’ ability to meet future redemption shocks, especially for funds offering daily redemptions, but highlight the risk of a procyclical response, including possible liquidity spillovers. By selling illiquid assets and hoarding liquid ones, funds may contribute to a shortage of market liquidity at a time when it is most needed, also by other market participants. The procyclical behaviour with respect to rating changes may amplify any repricing in the event of more widespread downgrades coinciding with large outflows. In turn, this may exacerbate the effects of any downturn on the real economy through higher borrowing costs.
-10
-8
-6
-4
-2
0
2
4
6
8
10
Whole sample Leveraged Institutional
Change in cash holdingsChange in liquid bond holdingsChange in illiquid bond holdings
-5 0 5
Change in rating
Maturity
Whole sampleLeveragedInstitutional

Financial Stability Review, November 2019 – Non-bank financial sector
91
Despite the decline in highly liquid assets and cash holdings, the majority of funds offering daily redemptions maintain liquidity buffers to manage stressed market conditions. Asset managers typically maintain liquid asset holdings, credit lines and cash to accommodate outflows under normal and stressed conditions. Furthermore, mutual funds regulated under the UCITS46 Directive are subject to requirements regarding eligible assets, leverage, portfolio concentration and counterparty risk and are prohibited from investing more than 10% of their portfolio in unlisted securities. These regulatory requirements aim to ensure sufficient portfolio liquidity, reliable valuation and adequate (liquidity) risk management.
Nevertheless, recent cases have highlighted that funds invested in illiquid assets could face severe difficulties in dealing with large-scale outflows. Over the past one and a half years, three UCITS fund managers have faced such stress, illustrating potential liquidity mismatches in mutual funds which offer daily redemptions and invest in illiquid assets. In June 2019, the UK asset manager Woodford had to suspend redemptions of its UCITS equity fund, when the manager could no longer meet redemption requests after most of its liquid assets had been depleted. Similarly, bond funds managed by H2O linked to the French bank Natixis experienced substantial outflows in June and July 2019, triggered by a loss in confidence and uncertainty surrounding the liquidity of the underlying portfolios. In another case in 2018, one of the largest Swiss asset managers, GAM, had to suspend redemptions in one of its funds as withdrawals exceeded the fund’s ability to raise cash at short notice.
A loss in confidence and uncertainty about underlying exposures probably contributed to the acceleration of outflows in these cases. While the outflows were triggered by idiosyncratic events, in all three cases they seem to have been magnified by a loss in confidence and uncertainty about the liquidity of the underlying portfolios. Stress in the three cases nevertheless had no systemic repercussions, also because of the benign market environment, which allowed managers to liquidate assets without significant losses to investors. Although the extent to which leverage and derivatives played a role in the outflows is unclear, the funds manged by GAM and H2O had relatively large average derivative exposures, according to the funds’ investor prospectuses.
Synthetic leverage among some UCITS bond funds tends to increase the procyclicality of investor flows, especially in a market downturn. Empirical evidence shows that investors in leveraged funds react more strongly to past negative performance compared with investors in unleveraged funds.47 Leverage can thus add to procyclical investor behaviour and accelerate outflows, even if the amount of leverage is not excessive among UCITS funds in general (see Chart 4.8, left panel). Changes to the UCITS framework adopted in 2010 established the use of the absolute Value-at-Risk (VaR) approach as a regulatory limit under certain conditions, in addition 46 Undertakings for collective investment in transferable securities. 47 Molestina Vivar, L., Wedow, M. and Weistroffer, C., “Is leverage driving procyclical investor flows?
Assessing investor behaviour in UCITS bond funds”, Macroprudential Bulletin, Issue 9, ECB, October 2019. This article argues that investors in leveraged funds have greater incentives to redeem early, relative to investors in unleveraged funds, i.e. to avoid internalising costs from additional securities sales. Besides sales to accommodate redemption requests, leveraged funds need to sell additional assets, for instance, to keep leverage constant and unwind derivative positions to cover margin calls and higher haircuts on leveraged positions during stress periods.
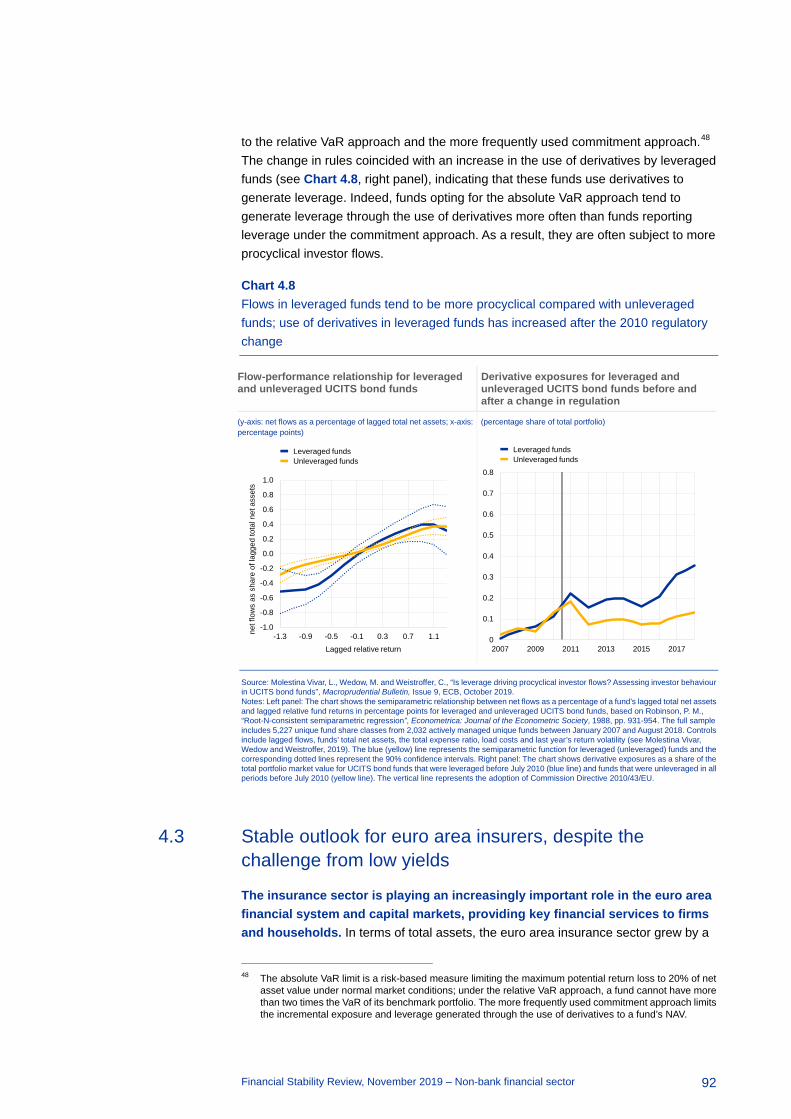
Financial Stability Review, November 2019 – Non-bank financial sector
92
to the relative VaR approach and the more frequently used commitment approach.48 The change in rules coincided with an increase in the use of derivatives by leveraged funds (see Chart 4.8, right panel), indicating that these funds use derivatives to generate leverage. Indeed, funds opting for the absolute VaR approach tend to generate leverage through the use of derivatives more often than funds reporting leverage under the commitment approach. As a result, they are often subject to more procyclical investor flows.
Chart 4.8 Flows in leveraged funds tend to be more procyclical compared with unleveraged funds; use of derivatives in leveraged funds has increased after the 2010 regulatory change
Flow-performance relationship for leveraged and unleveraged UCITS bond funds
Derivative exposures for leveraged and unleveraged UCITS bond funds before and after a change in regulation
(y-axis: net flows as a percentage of lagged total net assets; x-axis: percentage points)
(percentage share of total portfolio)
Source: Molestina Vivar, L., Wedow, M. and Weistroffer, C., “Is leverage driving procyclical investor flows? Assessing investor behaviour in UCITS bond funds”, Macroprudential Bulletin, Issue 9, ECB, October 2019. Notes: Left panel: The chart shows the semiparametric relationship between net flows as a percentage of a fund’s lagged total net assets and lagged relative fund returns in percentage points for leveraged and unleveraged UCITS bond funds, based on Robinson, P. M., “Root-N-consistent semiparametric regression”, Econometrica: Journal of the Econometric Society, 1988, pp. 931-954. The full sample includes 5,227 unique fund share classes from 2,032 actively managed unique funds between January 2007 and August 2018. Controls include lagged flows, funds’ total net assets, the total expense ratio, load costs and last year’s return volatility (see Molestina Vivar, Wedow and Weistroffer, 2019). The blue (yellow) line represents the semiparametric function for leveraged (unleveraged) funds and the corresponding dotted lines represent the 90% confidence intervals. Right panel: The chart shows derivative exposures as a share of the total portfolio market value for UCITS bond funds that were leveraged before July 2010 (blue line) and funds that were unleveraged in all periods before July 2010 (yellow line). The vertical line represents the adoption of Commission Directive 2010/43/EU.
4.3 Stable outlook for euro area insurers, despite the challenge from low yields
The insurance sector is playing an increasingly important role in the euro area financial system and capital markets, providing key financial services to firms and households. In terms of total assets, the euro area insurance sector grew by a
48 The absolute VaR limit is a risk-based measure limiting the maximum potential return loss to 20% of net
asset value under normal market conditions; under the relative VaR approach, a fund cannot have more than two times the VaR of its benchmark portfolio. The more frequently used commitment approach limits the incremental exposure and leverage generated through the use of derivatives to a fund’s NAV.
-1.0
-0.8
-0.6
-0.4
-0.2
0.0
0.2
0.4
0.6
0.8
1.0
-1.3 -0.9 -0.5 -0.1 0.3 0.7 1.1net f
low
s as
sha
re o
f lag
ged
tota
l net
ass
ets
Lagged relative return
Leveraged fundsUnleveraged funds
0
0.1
0.2
0.3
0.4
0.5
0.6
0.7
0.8
2007 2009 2011 2013 2015 2017
Leveraged funds Unleveraged funds
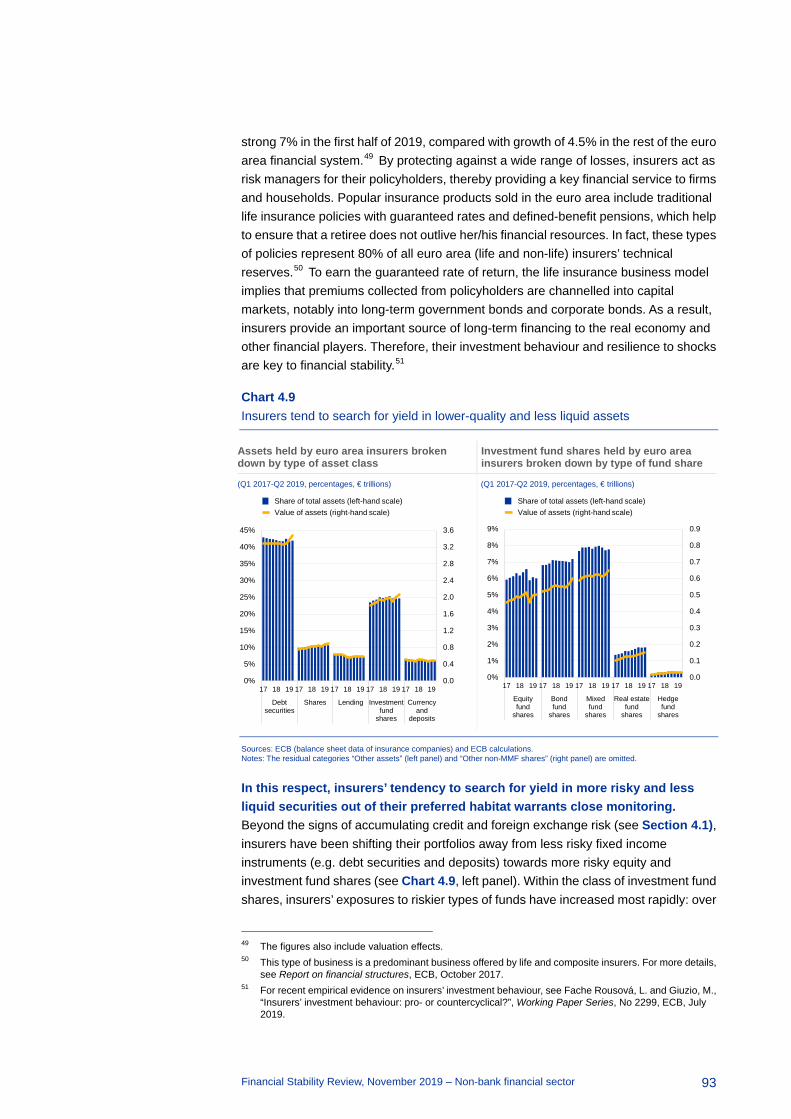
Financial Stability Review, November 2019 – Non-bank financial sector
93
strong 7% in the first half of 2019, compared with growth of 4.5% in the rest of the euro area financial system.49 By protecting against a wide range of losses, insurers act as risk managers for their policyholders, thereby providing a key financial service to firms and households. Popular insurance products sold in the euro area include traditional life insurance policies with guaranteed rates and defined-benefit pensions, which help to ensure that a retiree does not outlive her/his financial resources. In fact, these types of policies represent 80% of all euro area (life and non-life) insurers’ technical reserves.50 To earn the guaranteed rate of return, the life insurance business model implies that premiums collected from policyholders are channelled into capital markets, notably into long-term government bonds and corporate bonds. As a result, insurers provide an important source of long-term financing to the real economy and other financial players. Therefore, their investment behaviour and resilience to shocks are key to financial stability.51
Chart 4.9 Insurers tend to search for yield in lower-quality and less liquid assets
Assets held by euro area insurers broken down by type of asset class
Investment fund shares held by euro area insurers broken down by type of fund share
(Q1 2017-Q2 2019, percentages, € trillions) (Q1 2017-Q2 2019, percentages, € trillions)
Sources: ECB (balance sheet data of insurance companies) and ECB calculations. Notes: The residual categories “Other assets” (left panel) and “Other non-MMF shares” (right panel) are omitted.
In this respect, insurers’ tendency to search for yield in more risky and less liquid securities out of their preferred habitat warrants close monitoring. Beyond the signs of accumulating credit and foreign exchange risk (see Section 4.1), insurers have been shifting their portfolios away from less risky fixed income instruments (e.g. debt securities and deposits) towards more risky equity and investment fund shares (see Chart 4.9, left panel). Within the class of investment fund shares, insurers’ exposures to riskier types of funds have increased most rapidly: over
49 The figures also include valuation effects. 50 This type of business is a predominant business offered by life and composite insurers. For more details,
see Report on financial structures, ECB, October 2017. 51 For recent empirical evidence on insurers’ investment behaviour, see Fache Rousová, L. and Giuzio, M.,
“Insurers’ investment behaviour: pro- or countercyclical?”, Working Paper Series, No 2299, ECB, July 2019.
0.0
0.4
0.8
1.2
1.6
2.0
2.4
2.8
3.2
3.6
0%
5%
10%
15%
20%
25%
30%
35%
40%
45%
17 18 19 17 18 19 17 18 19 17 18 19 17 18 19
Debtsecurities
Shares Lending Investmentfund
shares
Currencyand
deposits
Share of total assets (left-hand scale)Value of assets (right-hand scale)
0.0
0.1
0.2
0.3
0.4
0.5
0.6
0.7
0.8
0.9
0%
1%
2%
3%
4%
5%
6%
7%
8%
9%
17 18 19 17 18 19 17 18 19 17 18 19 17 18 19
Equityfund
shares
Bondfund
shares
Mixedfund
shares
Real estatefund
shares
Hedgefund
shares
Share of total assets (left-hand scale)Value of assets (right-hand scale)

Financial Stability Review, November 2019 – Non-bank financial sector
94
the last three years, the holdings of hedge fund shares almost doubled, while those of real estate funds increased by two-thirds (see Chart 4.9, right panel). Market intelligence also suggests an increasing appetite for investment in other alternative asset classes such as private equity, loans and infrastructure investments, with demand sometimes exceeding supply.52
Chart 4.10 Solid profitability results contributed to an improvement in market valuations, though challenges remain, particularly for life insurers
Return on equity and total return on average investments
Stock prices and price-to-book ratios
(2016-Q2 2019; percentages; median, interquartile range and 10th-90th percentile range)
(daily observations between 1 Jan. 2019 and 13 Nov. 2019, stock prices indexed to 100 on 1 Jan. 2019)
Sources: S&P Global Market Intelligence, Refinitiv and ECB calculations. Notes: Left panel: Quarterly data for return on equity and total return on average investments are annualised and based on a sample of 22 large euro area insurers. The horizontal line marks zero. Right panel: Price-to-book ratios are computed as the weighted average of the price-to-book ratios of the individual constituents of the underlying stock price index. The vertical line indicates the publication date of the May 2019 FSR.
While the increasing exposure to credit and liquidity risks renders insurers more vulnerable to potential shocks, it supports their profitability. In fact, large euro area insurers reported solid profitability results in the first half of 2019 (see Chart 4.10, left panel). Specifically, the return on equity for the median company exceeded 11%, which was supported by strong underwriting results and the continued focus on cost optimisation. Another positive factor was an improvement in investment income, which generated fairly good returns of around 3-4% for the median company. Valuation gains on insurers’ portfolios driven by a strong rebound in equity prices at the beginning of 2019 and declining yields throughout the first half of 2019 contributed positively to this improvement. Finally, insurers benefited from benign insured losses from natural catastrophes, though the rising trend in the number of catastrophes
52 For insurers’ search for yield in alternative assets, see the box entitled “Insurers’ investment in alternative
assets”, Financial Stability Review, ECB, May 2019.
-5
-3
-1
1
3
5
7
9
11
13
15
2016 2017 Q118
Q218
Q318
Q418
Q119
Q219
Return on equity Total return on average investments
0.6
0.7
0.8
0.9
1.0
1.1
1.2
1.3
1.4
1.5
1.6
1.7
90
95
100
105
110
115
120
125
130
135
140
01/19 04/19 07/19 10/19
Life insurance - stock price index (left-hand scale)Non-life insurance - stock price index (left-hand scale)Reinsurance - stock price index (left- hand scale)Life insurance - price-to-book ratio (right-hand scale)Non-life insurance - price-to-book ratio (right-hand scale)Reinsurance - price-to-book ratio (right-hand scale)

Financial Stability Review, November 2019 – Non-bank financial sector
95
points to some of the ongoing challenges that climate change poses to the insurance sector.53
Solid profitability contributed to the strong appreciation of non-life and reinsurers’ equity prices over the review period (see Chart 4.10, right panel). Since the end of May, equity valuations for these two market segments have risen by 12% and 18% respectively. The gains were also reflected in improving price-to-book ratios, which have been hovering at levels well above 1.
For life insurers, very low and further declining yields have weighed on their market valuations. The price-to-book ratio of life insurers has remained at a low level of below 0.85 over recent years. Historically, the price-to-book ratios of euro area life and non-life insurers co-moved at similar levels. However, when long-term yields started to decline significantly, the price-to-book ratios of life and non-life insurers began to diverge, resulting in a widening gap over time (see Chart 4.11, left panel). This reflects that traditional life insurance business, offering guaranteed-rate policies, typically has a negative duration gap (i.e. liabilities with a longer duration than assets).54 This has two implications when yields decline. First, when assets and liabilities are revalued, liabilities increase by more, owing to their higher duration (“balance sheet channel”). Second, as assets mature their proceeds will, other things being equal, be reinvested in lower-yielding assets, often at yields below the guaranteed rates on existing business (“investment channel”).55
In the first half of 2019, Solvency Capital Requirement (SCR) ratios declined as the effect of falling yields propagated through the balance sheet channel (see Chart 4.11, right panel). Specifically, the median SCR ratio for the sample of large euro area insurers dropped by around 10 percentage points, from above 220% during most of 2018 to around 210% in the first half of 2019. Although these figures remain well above the regulatory requirement of 100%, further declines in solvency positions can be expected in the third quarter of 2019 as yields moved to unprecedentedly low levels in September. In particular, the yield curve used for discounting technical provisions for insurance obligations in euro – which represent the bulk of euro area insurers’ liabilities – moved into negative territory up to a maturity of 16 years.56 Many large euro area insurers in the sample shown in the right panel of Chart 4.11 tend to be active in both life and non-life insurance business and thus represent the position of a well-diversified insurer. But pure life insurers – which are typically small and
53 Insured losses from natural catastrophes in the first half of 2019 reached around USD 15 billion, which is
below the 30-year average of USD 18 billion. At the same time, the number of natural catastrophe events in the first half of 2019 (370) significantly exceeded the 30-year average (300), highlighting the steadily rising trend in the frequency of natural catastrophes discussed in the May 2019 FSR. See Natural catastrophe review for the first half of 2019, Munich Re, July 2019, and “Climate change and financial stability”, Financial Stability Review, ECB, May 2019, Special Feature A.
54 A negative duration gap is a typical characteristic of life insurers that underwrite policies with a very long length (e.g. 20-30 years). Most non-life and reinsurance policies do not have such a long duration and, therefore, non-life insurers and reinsurers are less affected by the low-yield environment.
55 See Chart 4.12 in the May 2019 FSR and the related discussion. 56 This curve is published every month by EIOPA. It is based on liquid swap and government bond rates,
and then adjusted to include counterparty default risk (see EIOPA’s website).
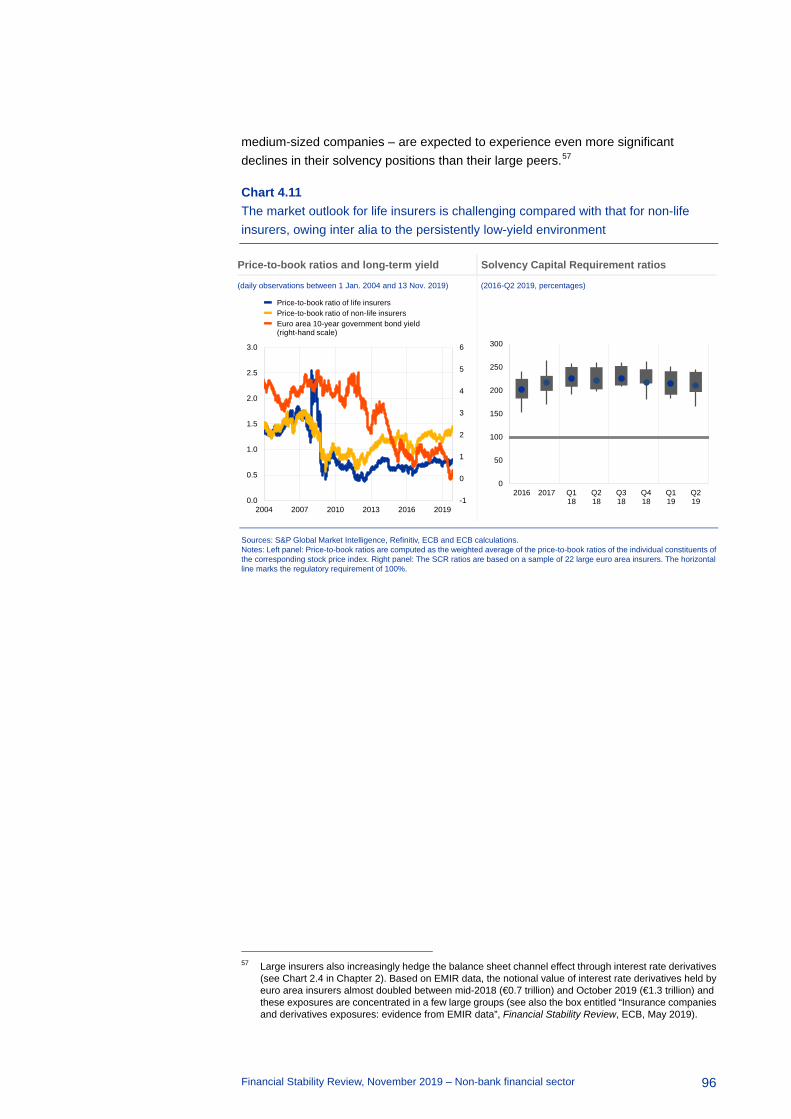
Financial Stability Review, November 2019 – Non-bank financial sector
96
medium-sized companies – are expected to experience even more significant declines in their solvency positions than their large peers.57
Chart 4.11 The market outlook for life insurers is challenging compared with that for non-life insurers, owing inter alia to the persistently low-yield environment
Price-to-book ratios and long-term yield Solvency Capital Requirement ratios
(daily observations between 1 Jan. 2004 and 13 Nov. 2019) (2016-Q2 2019, percentages)
Sources: S&P Global Market Intelligence, Refinitiv, ECB and ECB calculations. Notes: Left panel: Price-to-book ratios are computed as the weighted average of the price-to-book ratios of the individual constituents of the corresponding stock price index. Right panel: The SCR ratios are based on a sample of 22 large euro area insurers. The horizontal line marks the regulatory requirement of 100%.
57 Large insurers also increasingly hedge the balance sheet channel effect through interest rate derivatives
(see Chart 2.4 in Chapter 2). Based on EMIR data, the notional value of interest rate derivatives held by euro area insurers almost doubled between mid-2018 (€0.7 trillion) and October 2019 (€1.3 trillion) and these exposures are concentrated in a few large groups (see also the box entitled “Insurance companies and derivatives exposures: evidence from EMIR data”, Financial Stability Review, ECB, May 2019).
-1
0
1
2
3
4
5
6
0.0
0.5
1.0
1.5
2.0
2.5
3.0
2004 2007 2010 2013 2016 2019
Price-to-book ratio of life insurersPrice-to-book ratio of non-life insurersEuro area 10-year government bond yield (right-hand scale)
0
50
100
150
200
250
300
2016 2017 Q118
Q218
Q318
Q418
Q119
Q219
Financial Stability Review, November 2019 – Macroprudential policy issues
97
5 Macroprudential policy issues
5.1 Activating macroprudential instruments to counter vulnerabilities in the euro area financial system
All euro area countries have used macroprudential measures to strengthen lending standards or bank resilience in recent years. Regulatory reforms since the global financial crisis have put in place a number of macroprudential instruments that authorities in the SSM area can use to protect financial stability (see Box 8). In recent years, many authorities, responding to exuberance in real estate markets and/or growing vulnerabilities in the household sector, have put in place measures to ensure prudent mortgage lending standards (see Chart 5.1). These include limits on loan-to-value (LTV) ratios, limits on debt service-to-income (DSTI) ratios, maturity limits and amortisation requirements.58 Other authorities have opted for measures targeted at banks’ real estate exposures. These include risk weight floors and risk weight add-ons, which require banks to hold more capital in relation to selected real estate exposures. More recently, and consistent with the cyclical risk indicators increasing from low levels (see Chart 5.2, left panel), some countries have set positive countercyclical capital buffer (CCyB) rates, taking into account domestic conditions.
58 The definitions and designs of these borrower-based instruments differ across countries. With this caveat
in mind, LTV limits have mostly been set in the range of 80-90%, DSTI limits in the range of 30-50%, and maturity limits in the range of 25-35 years.
Many euro area countries have implemented macroprudential measures to mitigate risks and build resilience in recent years. More active use of the CCyB could be considered in a few countries where conditions allow.
More progress is required on macroprudential measures to enhance the resilience of capital market financing and mitigate risks in funds.
Measuring financial stability risks from climate change also requires better disclosure from firms and frameworks for risk assessment.
Potential barriers to banking sector consolidation should be studied further, given the ongoing structurally low bank profitability.
Signs of slowing in the commercial real estate cycle call for increasing resilience of bank exposures to this sector.
Further measures to support prudent lending standards are warranted in some residential real estate markets to contain risk-taking.
More broadly, the need to increase availability of releasable buffers calls for a rebalancing in the composition of current capital requirements towards a greater role for the CCyB.

Financial Stability Review, November 2019 – Macroprudential policy issues
98
Specifically, seven countries have announced a positive CCyB.59 Rates announced for the CCyB range from 0.25% in Luxembourg and Germany to 2% in Slovakia. Finally, all euro area countries are in the process of phasing in, or have already phased in, buffers for significant institutions (O-SII and G-SII buffers).60
Chart 5.1 Use of macroprudential policy instruments has increased across the euro area
Sources: ECB and ESRB. Notes: Borrower-based measures include non-legally binding measures. For Luxembourg, the targeted capital measure refers to a risk weight floor on mortgage exposures for banks following the internal ratings-based (IRB) approach on the basis of a 2016 recommendation of the Systemic Risk Committee. Systemic institution and risk buffers include G-SII (global systemically important institution) and O-SII (other systemically important institution) buffers and any systemic risk buffer (SyRB), the date refers to the earlier of either activation of SyRB or start of phase- in of G-SII or O-SII buffer..
59 The CCyB is intended to address the risks from the build-up of vulnerabilities over the financial cycle and
can be released when risks materialise. The release has the potential to alleviate pressures on bank capital positions which could generate excessive bank deleveraging during downturns.
60 The ECB methodology, introduced in 2016, envisages that the O-SII buffers should comply with a floor and that these buffers should be fully in place by 1 January 2022 at the latest.
2011 2012 2013 2014 2015 2016 2017 2018 2019 Specific measures
CY
DE
ES
FR
GR
IT
LV
PT
SI
LT
LU
MT
NL
SK
AT
BE
EE
FI
IE
LTV + DSTI + Maturity limits
CCyB: 0.5%
LTV + DSTI limits
CCYB: 0.25%
LTV + DSTI + Maturity limits
LTV + Maturity limits
CCyB: 1%
DSTI limit
LTV + DSTI + Maturiry limits
CCyB: 1%
CCyB: 1%
LTV + LTI limit
CCyB: 0.25%
LTV + DSTI limits
LTV + DSTI + Maturity limits
LTV + DSTI + Maturity limits
LTV + DSTI + Maturity limits
LTV + DSTI + Maturity limits
LTV + DSTI + Maturity limits
CCyB: 2.0%
Borrower-based measures (e.g. LTV limits)Targeted capital measures (e.g. risk weight add-on)Structural buffers: Systemic institution (G/OSIII) and Systemic Risk buffersCountercyclical capital buffer (announced rates)
Financial Stability Review, November 2019 – Macroprudential policy issues
99
Box 8 Macroprudential policy and powers within the Eurosystem61
The Single Supervisory Mechanism (SSM) Regulation assigns macroprudential responsibilities to both national authorities and the ECB. According to Article 5 of the Regulation, whenever appropriate or deemed required, national authorities shall implement macroprudential measures and the ECB has the power to set higher requirements than those implemented by national authorities for the instruments covered by the Capital Requirements Directive (CRD) and the Capital Requirements Regulation (CRR). Following recent amendments of the CRD and the CRR,62 these instruments include:
• The countercyclical capital buffer (CCyB; Article 130 and Articles 135 to 140 of the CRD): this buffer is designed to increase resilience during periods of excessive credit growth and to counter procyclicality in the financial system.
• The capital buffers for global systemically important institutions (G-SIIs) and other systemically important institutions (O-SIIs) (Article 131 of the CRD): the G-SII buffer is mandatory for banks identified as having global systemic importance. The O-SII buffer allows authorities to require institutions that are systemically important at the national or EU level to maintain a higher capital buffer.63 When both measures are activated, the higher of them applies.
• The systemic risk buffer (SyRB; Articles 133 and 134 of the CRD): this buffer is designed to prevent and mitigate macroprudential or systemic risks not covered by the CRR or by the CCyB or G/O-SII buffers. The SyRB is a flexible instrument that can be applied to all or a sub-set of banks as well as to sectoral exposures located in the Member State that sets the buffer.
• Other macroprudential instruments included in the CRR, notably real-estate risk weights and loss given default floors (Articles 124 and 164 of the CRR), as well as various capital and liquidity-based measures, large exposure limits and disclosure requirements listed under national flexibility measures (Article 458 of the CRR).
The asymmetric nature of the powers assigned to the ECB reflects its role as a backstop to national authorities. The powers support the ECB in taking action should national authorities not implement macroprudential measures in an adequate and timely fashion. The framework embodies an expectation that national authorities will be proactive in reacting to the specific conditions being experienced in their country at any particular time. The ECB and the national authorities in the SSM engage in broad discussions on the use of macroprudential instruments, both at analytical and policy level. The discussions between the ECB and the national authorities serve to assess the adequacy of the macroprudential stance across the SSM area and not only in any one individual Member State.
The ECB’s ultimate decision-making body, the Governing Council, is responsible for macroprudential policy decisions. The Governing Council works closely with the Supervisory Board on macroprudential matters and benefits from the Supervisory Board’s knowledge of the banking system. The Macroprudential Forum, composed of the members of the Governing Council and the Supervisory Board, operates as a platform for regular discussion at the highest level, bringing together the micro- and the macroprudential perspectives across the SSM. The Financial Stability Committee is the European System of Central Banks’ main technical committee supporting the ECB
61 See Macroprudential Bulletin, Issue 1 / 2016, ECB, March 2016, for a more detailed description of the
macroprudential framework. 62 Directive (EU) 2019/878 (“CRD V”) and Regulation (EU) 2019/876 (“CRR II”). 63 Subject to authorisation by the European Commission, the O-SII buffer can be set above 3% of the total
risk exposure amount.

Financial Stability Review, November 2019 – Macroprudential policy issues
100
in the area of macroprudential policy. It includes high-level representatives from the national central banks and supervisory authorities of the SSM Member States. They meet to discuss macroprudential measures and advise the Governing Council on macroprudential concerns and potential policy responses, including the preparation of draft proposals on the use of macroprudential tools for the banking sector. The European Systemic Risk Board, on which all central banks, national supervisory authorities in the EEA, as well as relevant EU institutions are represented, looks in depth at systemic risk across the financial system and the possible ways of mitigating it at the EU level.
These measures have helped to contain risks to euro area financial stability and strengthen the capacity of euro area banks to absorb losses. In countries that have applied borrower-based measures, standards on new lending appear to have been preserved in line with the tolerance specified by authorities.64 Furthermore, as highlighted in recent assessments by national authorities, borrower-based measures have improved the expected resilience of borrowers and banks in adverse scenarios.65 Authorities that have activated the CCyB have also increased their ability to smooth the provision of credit to the real economy should systemic risk materialise.
But in some countries, there is merit in further strengthening those capital buffers that can be released if risks materialise.66 It is uncertain whether banks would tolerate limits on their distribution of profits as a result of breaching buffer requirements, or whether they would deleverage and restrict provision of credit to the real economy. By contrast, the CCyB creates macroprudential space that authorities can use in a severe downturn to avoid incentives for banks to deleverage, and the costly contagion to the real economy that could follow.
The activation or further increase of CCyBs may be considered in a few countries, where conditions allow. Further increases in the CCyB67 could be desirable in a few countries observing solid credit growth, rising debt levels and broader signals of risk underpricing in connection with the low-yield environment. Within the boundaries of the national frameworks transposing the CRD, the CCyB could be more actively used in a few countries where favourable macro-financial conditions support the accumulation of capital buffers via retained earnings or issuance of new equity. Furthermore, management buffers – that is, the excess of capital over regulatory requirements – could also facilitate the absorption of higher CCyB rates.68 Overall, prevailing macro-financial conditions and the ability of banks to accumulate capital should be taken into account when activating the CCyB.
In general, the greater availability of releasable buffers in the euro area – in the form of the CCyB – would be useful to help sustain credit in a downturn. While 64 See, for example, the reports on the macroprudential measures implemented by the Banco de Portugal
and the Central Bank of Ireland. 65 See the special feature entitled “An analysis of changes in the riskiness of new loans to households”,
Financial Stability Report, Národná banka Slovenska, May 2019. The Central Bank of Ireland has also found borrower-based measures to be an effective tool to raise borrower and bank resilience.
66 The benefits of the build-up and subsequent release of the CCyB were discussed in Special Feature C of the May 2019 ECB Financial Stability Review.
67 Further increases in the CCyB could be achieved by increasing the overall combined buffer requirement (CBR, i.e. the sum of all regulatory buffers) or by redistributing capital across the CBR.
68 In some countries (e.g. Ireland and Lithuania), the CCyB has been activated early in the credit cycle in order to increase resilience to and build insurance against macro-financial shocks.

Financial Stability Review, November 2019 – Macroprudential policy issues
101
banks have improved their capital positions in recent years, only a small fraction of bank capital requirements are in the form of the CCyB, which authorities can release in the event of systemic stress (see Chart 5.2, right panel). This would call for a rebalancing of the current composition of capital requirements towards a more prominent role for the CCyB.
Chart 5.2 Despite a drifting up of cyclical risk, the countercyclical capital buffer still only forms a tiny fraction of euro area banks’ capital requirements
Euro area systemic risk indicator (SRI) and contributing factors
Common Equity Tier 1 (CET1) requirements, and macroprudential and management buffers
(Q1 2008-Q2 2019, deviation from historical median in multiples of standard deviation)
(percentages and percentage point contributions)
Sources: ECB, Eurostat and ECB calculations. Notes: Left panel: The construction of the SRI is described in ECB Occasional Paper No 219, February 2019. Right panel: The minimum requirements include Pillar 1 CET1 minima, the Pillar 2 requirement and CET1 capital to meet shortfalls for Tier 1 and Tier 2 minima. Structural buffers refer to buffers that are not meant to be released during periods of bank distress. These include the capital conservation buffer, SyRBs, G-SII buffers and O-SII buffers.
Further targeted measures should be deployed to address risks in residential real estate (RRE) markets. The ESRB69 recently identified a number of EU countries with medium-term vulnerabilities in the RRE sector. In the euro area, two countries received ESRB warnings (Germany and France), while four countries received ESRB recommendations (Belgium, Finland, Luxembourg and the Netherlands), following ESRB warnings in 2016. Vulnerabilities in all these countries originate from trends in mortgage lending, dynamics of RRE prices and fragilities in the household sector. While the weaker economic outlook might increase household income uncertainty, the low interest rate environment could induce higher risk-taking and a loosening of lending standards. In such a situation, guidance on sound lending standards or the pre-emptive tightening of borrower-based measures with appropriate exemptions could help contain a potential build-up of risks without being overly intrusive on lending 69 See “Vulnerabilities in the residential real estate sectors of the EEA countries”, European Systemic Risk
Board, September 2019, and the related press release. The key vulnerabilities highlighted by the ESRB assessment are of a medium-term nature and relate to high or rising household indebtedness and the ability of households to repay their mortgage debt, the growth of mortgage lending and the loosening of lending standards, and the valuation or price dynamics of residential real estate.
-0.8
-0.6
-0.4
-0.2
0.0
0.2
0.4
0.6
2008 2010 2012 2014 2016 2018
Credit componentRRE price-to-income ratioEquity marketDebt service ratioCurrent accountSRI benchmark
0%
2%
4%
6%
8%
10%
12%
14%
16%
2018 With announced CCyB ratesas of November 2019
Minimum requirementsStructural buffersCCyB releasable under systemic stressManagement buffers

Financial Stability Review, November 2019 – Macroprudential policy issues
102
policies. Finally, targeted macroprudential risk weight policies could be used in countries where real estate vulnerabilities are already elevated, in order to strengthen bank resilience over the real estate cycle.
In countries where there are signs of the commercial real estate (CRE) cycle turning, banks’ CRE exposures must be adequately capitalised. Following an upswing in many euro area CRE markets in recent years, there are now signs of weakening market activity and decelerating price dynamics (see Chapter 1). The weaker outlook for economic growth and downside risks might lead to a sharper adjustment in the market. This could have implications for banks and firms via the “collateral” channel. Specifically, LTV ratios on existing loans might increase in a scenario of price declines, thereby increasing the potential losses for banks. In addition, firms using CRE assets as collateral might face lower than expected credit availability. Although direct and equity-funded investment has often played a more important role than bank credit in the latest expansionary CRE cycle, banks are vulnerable to losses on their existing exposures to this sector. Therefore, at this stage of the cycle it is important that banks in countries exposed to CRE risks remain resilient to adverse shocks.
5.2 Tackling structurally weak bank profitability
The euro area banking sector has faced low profitability, characterised by high costs, overcapacity and limited revenue diversification, since 2012. On aggregate, euro area banks’ return on equity is expected to remain low, limiting the sector’s ability to increase resilience through retained earnings (see Chapter 3). Some of the reasons for this are cyclical, such as the drag from high levels of non-performing loans in some countries and the compression of net interest margins in a very low interest rate environment. But analysis suggests that the low profitability of euro area banks, compared with other jurisdictions, can be primarily attributed to the structural issues of low cost-efficiency and limited revenue diversification.70 A banking system operating with significant overcapacity is also vulnerable to weak competitors driving down lending standards and an underpricing of risk.
Consolidation could be a useful strategy in some cases. In fragmented banking systems with many underperforming and very small banks, consolidation within their domestic system could improve the performance of the sector (see Special Feature A). Given the very low pricing power of smaller institutions, this type of consolidation should not give rise to local monopolies or too-big-to-fail problems. But for the largest banks that perform poorly, bank-level restructuring and cross-border consolidation appear more appropriate. Cross-border consolidation could allow valuable parts of bank franchise to be retained and could offer income diversification to an acquirer, while partly avoiding the increase in market power which would ensue if large institutions were to consolidate domestically.
70 See Andersson, M., Kok, C., Mirza, H., Móré, C. and Mosthaf, J., “How can euro area banks reach
sustainable profitability in the future?”, Financial Stability Review, ECB, November 2018.

Financial Stability Review, November 2019 – Macroprudential policy issues
103
But there may be barriers to this consolidation, from both market practices and regulation, which need further examination. The low level of consolidation in the euro area banking sector, particularly across borders, suggests that barriers to consolidation do exist. Integration costs and complexities of mergers of larger banks, and the challenges associated with moving into new markets, heavily influence the business case for cross- or intra-border mergers. And there may be some regulatory considerations. For example, regulatory restrictions on the cross-border flow of capital and liquidity across entities within a single banking group which is located in different euro area countries may affect the potential for a cross-border merger to yield economies of scale and scope. Potential uncertainty about the regulatory and supervisory requirements faced by the merged entity may further discourage cross-border consolidation. Mergers of large institutions may lead to a mechanical increase in capital requirements for systemic risk, in the form of O-SII or G-SII buffer rates. This may often be a warranted increase that helps mitigate the risk from a larger systemic footprint. But there is a case for reviewing whether the scoring methodologies for O-SIIs and G-SIIs sufficiently recognise the implications of cross-border mergers. While the banking union agenda addresses some of these issues, further investigation and potentially different responses seem warranted to avoid creating a disincentive to cross-border consolidation within the euro area.
5.3 Developing macroprudential measures to enhance the resilience of euro area capital market financing
The development of deep, liquid, integrated and resilient capital markets in the euro area benefits the economy and financial stability. The share of euro area companies’ financing coming from capital markets and euro area non-banks has grown significantly over the last decade (see Chapter 4). Diversifying the sources of financing for businesses – and reducing reliance on banks – should enhance the resilience of credit flows to shocks that primarily affect one part of the financial system. The parallel growth of the European investment fund sector has also helped euro area investors spread their holdings across countries and achieve better diversification than they would through direct holdings of assets.71 A successful capital markets union should foster deep and resilient EU capital markets, helping unlock their potential for the economy.72
But excessive risk and leverage in non-banks tends to be procyclical, potentially amplifying cycles in capital markets and contagion of stress to the wider financial system. Capital markets are only as resilient as the participants that intermediate them. There are indications of pockets of increasing risk-taking, leverage and liquidity risk in non-banks, including investment funds and insurance companies, as institutional investors search for yield (see Chapter 4). Procyclical risk-taking by non-bank financial institutions may, in turn, amplify any cyclical underpricing of risk
71 See the special feature entitled “Integrating euro area corporate bond markets: benefits and potential
financial stability challenges”, Financial integration in Europe, ECB, May 2018. 72 See Cœuré, B., “European capital markets: priorities and challenges”, speech at the International Swaps
and Derivatives Association, Frankfurt, 25 June 2019.

Financial Stability Review, November 2019 – Macroprudential policy issues
104
and the impact of sharp investor outflows or losses on asset prices. Such asset price amplification may have potential implications for the ease and cost of corporate financing which could exacerbate any stress or downturn. More broadly, the ongoing search for yield may also intensify the build-up of vulnerabilities, not least by lowering current financing costs for riskier borrowers.
Currently, authorities lack adequate macroprudential tools to act ex-ante against the build-up of risks in non-banks in upswings. Despite the growing importance of non-banks for real economy financing and the accumulation of risks posed by this sector, the development of macroprudential approaches to addressing systemic risk from the non-bank financial sector is still in its infancy.
In particular, better approaches are needed to manage the systemic risks posed by the mismatch between the liquidity of investment funds’ assets and the liquidity offered to investors through redemption policies. This difference increases the risk of forced asset sales draining liquidity in capital markets or affecting other institutions. And while managers of individual funds should manage liquidity risk in the best interests of their own investors, they are unlikely to take full account of the system-wide impact of their actions.
A number of measures have been proposed that could be effective in limiting the systemic risk posed by liquidity mismatches in investment funds, at the current juncture and in the future. While a number of tools are available to asset managers and authorities in the EU to mitigate liquidity risk in individual funds, the suspension of redemptions is the only policy instrument available to date which could be used explicitly to mitigate systemic risks from synchronised fund outflows ex-post.73 Both the Financial Stability Board (FSB) and the ESRB have argued for further guidance on the use of this power by authorities in exceptional circumstances. However, from a macroprudential perspective, it is also important to limit the build-up of vulnerabilities before risks materialise. In particular, it would be valuable to develop additional liquidity management tools aimed at more closely aligning redemption terms with the liquidity of funds’ assets.74
Liquidity requirements for insurers could also be enhanced, amid some signs of increasing liquidity risk. While credit and market risk are explicitly covered in the capital requirements under the Solvency II framework, this is less so for liquidity risk. In this respect, EIOPA’s proposal to enhance the quantitative reporting under Solvency II to better capture liquidity risk is a welcome step that could help develop a more comprehensive framework.75 One further possibility to mitigate the build-up of risks would be to require insurers to hold an explicitly defined liquidity buffer.76 While it is important to first define liquidity metrics which exploit enhanced reporting, such a
73 Article 46 of the Alternative Investment Fund Managers Directive and Article 98(2)(j) of the UCITS
Directive allow authorities to suspend redemptions if this is “in the interest of the shareholder or in the interest of the public”.
74 See “Macroprudential liquidity tools for investment funds – A preliminary discussion”, Macroprudential Bulletin, ECB, October 2018.
75 See Other potential macroprudential tools and measures to enhance the current framework, European Insurance and Occupational Pensions Authority, July 2018, Section 6.
76 See Macroprudential provisions, measures and instruments for insurance, European Systemic Risk Board, November 2018.

Financial Stability Review, November 2019 – Macroprudential policy issues
105
buffer could, for instance, be calibrated based on cash inflows (e.g. premium and coupon/maturity payments) and cash outflows (e.g. policyholder benefits, costs, commissions and margin calls) under a stress scenario. Similarly, insurers could be required to run well-defined liquidity stress tests.77 There may also be a case for authorities to have discretionary powers to intervene in the event of exceptional liquidity outflows, for example if many policyholders terminate their insurance policies simultaneously.
Restrictions on leverage could also reduce the systemic risk posed by the fund sector in future upswings. UCITS funds have to comply with binding leverage restrictions under EU law. This exerts some control over excess leverage, although the extent of that control varies considerably depending on which methodological approach is applied. For example, funds using an “absolute VaR” approach have tended to use more leverage than funds using alternative exposure metrics, suggesting greater fragility of these funds.78 For alternative investment funds, the constraints on leverage are even less consistent. Leverage in some alternative funds is much higher than the average79 and the providers of this leverage are often unknown, making it difficult to assess how stress in leveraged funds may propagate in the financial system. In principle, authorities in the EU can impose macroprudential leverage limits on any type of alternative fund, but these tools need to be operationalised, as recommended by the ESRB early last year.80 This would enable authorities to restrict leverage when necessary, for example when system-wide leverage is deemed to reach excessive levels in upswings.
Globally consistent measures of fund leverage would facilitate global financial stability monitoring. Following a consultation paper in 2019, the International Organization of Securities Commissions (IOSCO) is expected to publish, in early 2020, its final report on the operationalisation of the FSB’s recommendation to develop consistent measures of leverage in funds. As already stated by the ESRB,81 for IOSCO to meet the objective of harmonised reporting of leverage, a core set of measures would need to be identified and applied in a consistent way globally.82 These core measures would need to enable consistent monitoring of whether funds are using borrowing or derivatives and the potential losses and liquidity demands that those funds could face. This is particularly relevant for the EU, which already has leverage metrics, as there may be significant pockets of leverage in funds domiciled outside the EU, to which the euro area financial system could be exposed.
77 For the recent enhancement of the regulatory requirements in the United Kingdom, see “Liquidity risk
management for insurers”, Supervisory Statement 5/19, Prudential Regulation Authority, September 2019.
78 See Molestina Vivar, L., Wedow, M. and Weistroffer, C., “Is leverage driving procyclical investor flows? Assessing investor behaviour in UCITS bond funds”, Macroprudential Bulletin, ECB, October 2019.
79 See ESMA Annual Statistical Report on EU Alternative Investment Funds 2019, European Securities and Markets Authority, March 2019, p. 6.
80 See the Recommendation of the European Systemic Risk Board of 7 December 2017 on liquidity and leverage risks in investment funds (ESRB/2017/6), published on 14 February 2018.
81 See Recommendation ESRB/2017/6, op. cit. 82 Complete flexibility in the use of metrics would mean that it would remain nearly impossible to make
meaningful comparisons of fund leverage across jurisdictions.

Financial Stability Review, November 2019 – Macroprudential policy issues
106
5.4 Responding to climate change-related financial stability risks
As the recognition of the impact of climate risk on the financial sector grows, so does the need for better climate risk measurement and monitoring. Progress has been made in understanding how the financial system may be vulnerable to the physical risk of climate change and to risks from a slow response to the need for a transition to an economy with lower carbon emissions. But authorities with financial stability mandates still face significant gaps in the availability of comprehensive and reliable disclosures (see Box 4) and the reporting of carbon emission-related data, as well as gaps in risk management and stress-testing frameworks.
A roadmap for countering financial stability risks from climate change has been agreed and is being implemented internationally. Central banks and financial authorities globally and within the EU are stepping up efforts on: (i) monitoring climate risks; (ii) developing taxonomies; (iii) promoting disclosures; and (iv) incorporating climate-related risks into prudential frameworks (see Table 5.1). The Network for Greening the Financial System (NGFS), a group of global central banks, supervisors and international organisations,83 set out a series of high-level recommendations to policymakers in 2018.84 And at the European level, the European Commission is developing a number of regulatory proposals to support disclosure and monitoring. The ESRB, together with the Eurosystem, is developing approaches to include climate-related risk in risk monitoring and assessments.
Table 5.1 Initiatives with a focus on financial stability from the European Commission’s action plan on financing sustainable growth
2018 action plan (and proposals)
Monitoring climate-related risks Including climate risk scenarios in stress-test exercises (ESRB proposal)
Developing frameworks for risk monitoring
Developing taxonomies Introducing an EU classification system (taxonomy) for sustainable economic activities (European Commission proposal)
Promoting disclosures New regulation regarding climate disclosures and introduction of low-carbon benchmarks (European Commission proposal)
Prudential frameworks Enhancing the inclusion of climate risks in the risk management practices of EU banks
Source: ECB based on the European Commission’s action plan.
83 See “First Progress Report”, NGFS, October 2018. The ECB is a member of the NGFS. To date, the
NGFS comprises over 40 members and observers. Other global initiatives include the launch of the Sustainable Insurance Forum in 2016 and the activities of the International Association of Insurance Supervisors related to climate risk.
84 A first publication to this end is the technical supplement report “Macroeconomic and financial stability - Implications of climate change”, NGFS, July 2019.
Financial Stability Review, November 2019 – Special features
107
Special features
Euro area bank profitability: where can consolidation help? A
Prepared by Desislava Andreeva, Maciej Grodzicki, Csaba Móré and Alessio Reghezza85
Low aggregate bank profitability in the euro area, which weakens the resilience of the euro area banking sector, is partly explained by the persistent underperformance of a sub-set of banks. These banks all stand out in terms of elevated cost-to-income ratios. But there also appear to be three distinct groups: (i) banks struggling with legacy asset problems; (ii) banks with weak income-generation capacity; and (iii) banks suffering from a combination of cost and revenue-side problems. The common cost inefficiency problem seems most pronounced for the largest and smallest banks. Three strategies, all of which should reduce overcapacity, could address the root causes, while avoiding increasing market power or the systemic footprint of institutions which are already systemically important. For some banks, the focus should be on targeting continued high stocks of NPLs. But in systems with many weak-performing small banks, consolidation within their domestic system could improve performance. Finally, a combination of bank-level restructuring and cross-border M&A activity could help reduce the costs and diversify the revenues of large banks that are performing poorly.
Introduction
Weak bank profitability has been identified as a risk to euro area financial stability since mid-2012 and analysed in several issues of the FSR. Retained bank profits form the first line of defence to absorb losses and build up capital positions. In recent years the euro area banking system has seen return on equity below the estimated cost of equity. Previous ECB analysis has examined the potential drivers of low profitability – including cyclical and structural factors.86 This work has found that cyclical constraints, such as large stocks of legacy assets, have been important since the crisis, and the low interest rate environment has also constrained bank profitability. Yet, over time, structural issues such as poor cost-efficiency, overcapacity, competitive dynamics and insufficient income diversification have come to the forefront.
A banking system operating with significant overcapacity is prone to unhealthy market dynamics. Weak competitors might follow “gambling for resurrection” strategies and undercut the margins of healthier players. In a situation of fierce competition, banks may be able to cover their variable costs, but not their fixed costs, thus depressing investment in digitalisation and in the adjustment of business models.
85 Input by Michał Adam, Sándor Gardó, Mariusz Jarmużek, Benjamin Klaus and Julian Metzler is gratefully
acknowledged. 86 See Andersson, M., Kok, C., Mirza, H., Móré, C. and Mosthaf, J., “How can euro area banks reach
sustainable profitability in the future?”, Financial Stability Review, ECB, November 2018.

Financial Stability Review, November 2019 – Special features
108
In turn, the resilience and longer-term prospects of the industry may deteriorate. At the same time, there is no clear exit mechanism for poorly performing, but marginally profitable and adequately capitalised banks, which may not be attractive as takeover targets. There is a natural comparison with zombie firms, which earn low returns and suffer from poor productivity, leading to weaker aggregate economic performance.87
Structural changes in the banking sector need to be part of the solution to the weak bank profitability problem. First, banks themselves can address structural inefficiencies to improve their performance. In fact, the set of profitable banks in the euro area have been found to have done exactly this: they have diversified their income sources, improved their cost-efficiency and invested in digital technologies. Second, consolidation in the banking sector may allow banks to use economies of scale and scope, which in principle should bring about improved profitability. Cross-border mergers, while less likely to produce cost savings or economies of scale, would have an additional benefit of improved risk diversification and, thus, more resilient profitability.88 Finally, authorities need to support the process, not least by removing obstacles to cross-border M&As and other factors hampering the progress towards addressing overcapacity in the sector. This special feature furthers this discussion by examining the issues faced by the weakest-performing banks in the euro area and by drawing out implications for possible solutions.
Who are the underperformers?
Persistent underperformance by a sub-set of banks explains much of the weakness in overall euro area bank profitability. While the median significant institution (SI) earned a return on equity close to 6% between 2015 and 2018, about one quarter of institutions achieved less than 3%. The cohort of underperforming significant institutions is identified as those which recorded a below-median return on equity in at least three years between 2015 and 2018. Stronger cyclical momentum, as well as a reduction in non-performing loans (NPLs) and leaner cost structures, have led to some improvement in profitability of weaker performers; however, their returns are consistently below estimates of their cost of equity (see Chart A.1, left panel).
These underperforming banks are heterogeneous in terms of their location and business model. By geographical location, banks from countries more affected by the crisis (including Italy and Spain) and from Germany are over-represented relative to their share in the total number of significant institutions (see Chart A.1, right panel). Moreover, the group is heterogeneous across multiple standard metrics of balance sheet strength and efficiency (e.g. regulatory capital ratios, NPL ratios and cost-to-income ratios).
87 See Banerjee, R. and Hofmann, B., “The rise of zombie firms: causes and consequences”, BIS Quarterly
Review, September 2018, and Caballero, R., Hoshi, T. and Kashyap, A., “Zombie lending and depressed restructuring in Japan”, American Economic Review, Vol. 98, No 5, 2008, pp. 1943-1977.
88 See de Guindos, L., “Euro area banks: the profitability challenge”, keynote speech at the ABI Annual Conference, Rome, 25 June 2019, and Enria, A., “Is less more? Profitability and consolidation in the European banking sector”, presentation at the CIRSF Annual International Conference, Lisbon, 4 July 2019.
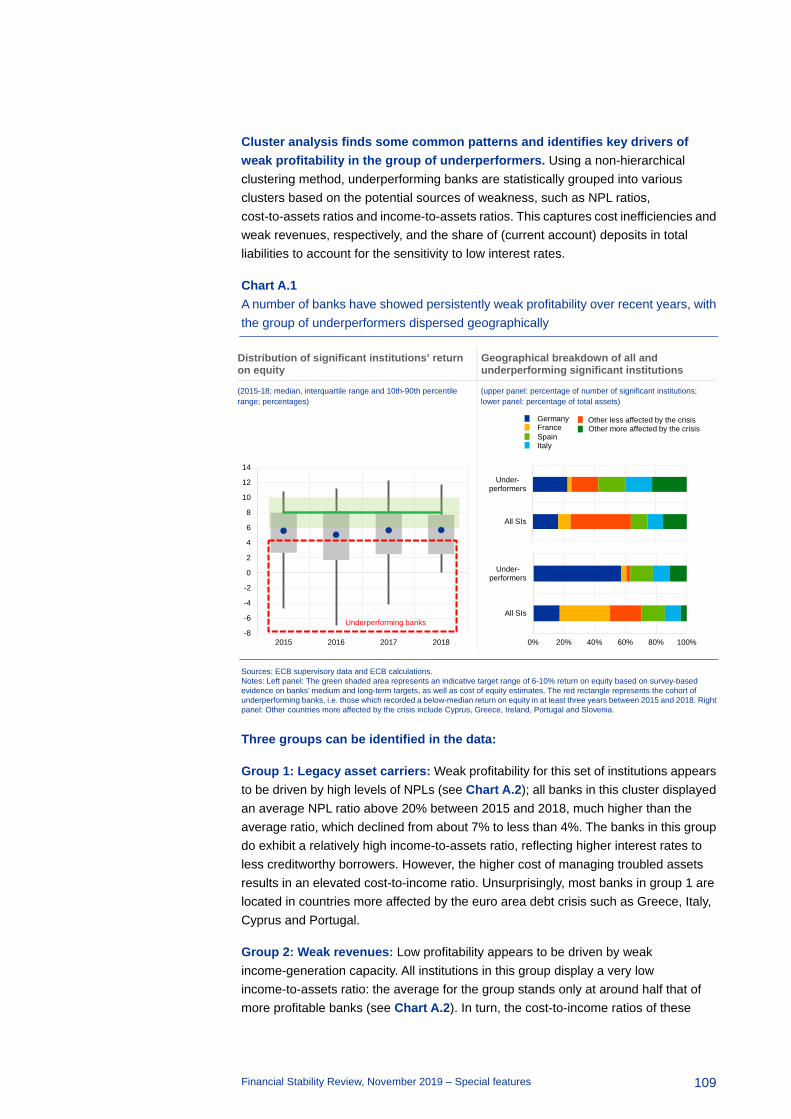
Financial Stability Review, November 2019 – Special features
109
Cluster analysis finds some common patterns and identifies key drivers of weak profitability in the group of underperformers. Using a non-hierarchical clustering method, underperforming banks are statistically grouped into various clusters based on the potential sources of weakness, such as NPL ratios, cost-to-assets ratios and income-to-assets ratios. This captures cost inefficiencies and weak revenues, respectively, and the share of (current account) deposits in total liabilities to account for the sensitivity to low interest rates.
Chart A.1 A number of banks have showed persistently weak profitability over recent years, with the group of underperformers dispersed geographically
Distribution of significant institutions’ return on equity
Geographical breakdown of all and underperforming significant institutions
(2015-18; median, interquartile range and 10th-90th percentile range; percentages)
(upper panel: percentage of number of significant institutions; lower panel: percentage of total assets)
Sources: ECB supervisory data and ECB calculations. Notes: Left panel: The green shaded area represents an indicative target range of 6-10% return on equity based on survey-based evidence on banks’ medium and long-term targets, as well as cost of equity estimates. The red rectangle represents the cohort of underperforming banks, i.e. those which recorded a below-median return on equity in at least three years between 2015 and 2018. Right panel: Other countries more affected by the crisis include Cyprus, Greece, Ireland, Portugal and Slovenia.
Three groups can be identified in the data:
Group 1: Legacy asset carriers: Weak profitability for this set of institutions appears to be driven by high levels of NPLs (see Chart A.2); all banks in this cluster displayed an average NPL ratio above 20% between 2015 and 2018, much higher than the average ratio, which declined from about 7% to less than 4%. The banks in this group do exhibit a relatively high income-to-assets ratio, reflecting higher interest rates to less creditworthy borrowers. However, the higher cost of managing troubled assets results in an elevated cost-to-income ratio. Unsurprisingly, most banks in group 1 are located in countries more affected by the euro area debt crisis such as Greece, Italy, Cyprus and Portugal.
Group 2: Weak revenues: Low profitability appears to be driven by weak income-generation capacity. All institutions in this group display a very low income-to-assets ratio: the average for the group stands only at around half that of more profitable banks (see Chart A.2). In turn, the cost-to-income ratios of these
-8
-6
-4
-2
0
2
4
6
8
10
12
14
2015 2016 2017 2018
Underperforming banks
All SIs
Under-performers
GermanyFrance
Other less affected by the crisis
SpainItaly
Other more affected by the crisis
0% 20% 40% 60% 80% 100%
All SIs
Under-performers
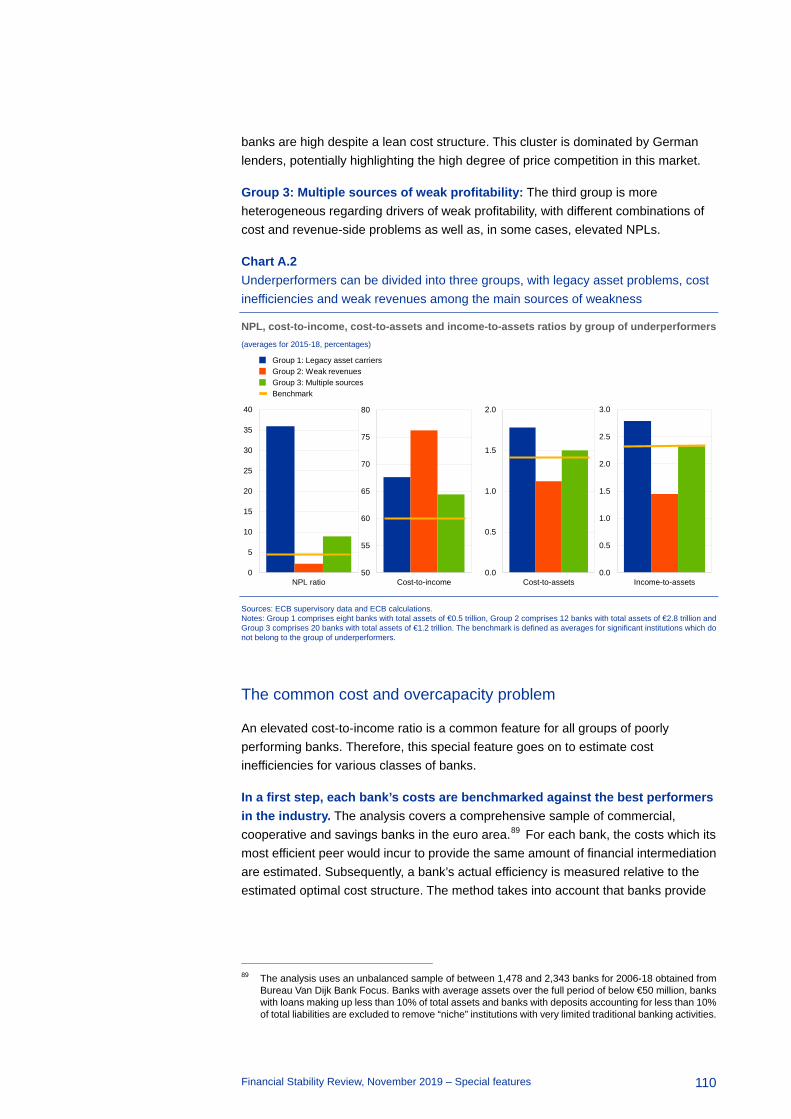
Financial Stability Review, November 2019 – Special features
110
banks are high despite a lean cost structure. This cluster is dominated by German lenders, potentially highlighting the high degree of price competition in this market.
Group 3: Multiple sources of weak profitability: The third group is more heterogeneous regarding drivers of weak profitability, with different combinations of cost and revenue-side problems as well as, in some cases, elevated NPLs.
Chart A.2 Underperformers can be divided into three groups, with legacy asset problems, cost inefficiencies and weak revenues among the main sources of weakness
NPL, cost-to-income, cost-to-assets and income-to-assets ratios by group of underperformers (averages for 2015-18, percentages)
Sources: ECB supervisory data and ECB calculations. Notes: Group 1 comprises eight banks with total assets of €0.5 trillion, Group 2 comprises 12 banks with total assets of €2.8 trillion and Group 3 comprises 20 banks with total assets of €1.2 trillion. The benchmark is defined as averages for significant institutions which do not belong to the group of underperformers.
The common cost and overcapacity problem
An elevated cost-to-income ratio is a common feature for all groups of poorly performing banks. Therefore, this special feature goes on to estimate cost inefficiencies for various classes of banks.
In a first step, each bank’s costs are benchmarked against the best performers in the industry. The analysis covers a comprehensive sample of commercial, cooperative and savings banks in the euro area.89 For each bank, the costs which its most efficient peer would incur to provide the same amount of financial intermediation are estimated. Subsequently, a bank’s actual efficiency is measured relative to the estimated optimal cost structure. The method takes into account that banks provide
89 The analysis uses an unbalanced sample of between 1,478 and 2,343 banks for 2006-18 obtained from
Bureau Van Dijk Bank Focus. Banks with average assets over the full period of below €50 million, banks with loans making up less than 10% of total assets and banks with deposits accounting for less than 10% of total liabilities are excluded to remove “niche” institutions with very limited traditional banking activities.
0.0
0.5
1.0
1.5
2.0
2.5
3.0
Income-to-assets0
5
10
15
20
25
30
35
40
NPL ratio
Group 1: Legacy asset carriersGroup 2: Weak revenuesGroup 3: Multiple sourcesBenchmark
50
55
60
65
70
75
80
Cost-to-income0.0
0.5
1.0
1.5
2.0
Cost-to-assets

Financial Stability Review, November 2019 – Special features
111
financial intermediation services beyond lending and face different input costs.90 This enables a comparison of the results across business models and across countries in the euro area where the labour markets remain largely fragmented along national borders and wages vary across countries.
Banks with total assets of more than €30 billion as well as particularly small lenders exhibit pronounced cost inefficiencies. After a period of persistent decline between 2012 and 2016, the average cost-efficiency of euro area banks improved from 2016 to 2018 from 76% to 81% (see Chart A.3, left panel). However, the dispersion around the mean remains elevated and skewed towards lower efficiency levels. While cost inefficiencies can be found for banks across all sizes, they appear particularly pronounced for banks belonging to the very bottom and very top 25% in terms of size (see the 5th percentile, Chart A.3). Moreover, the average efficiency of banks with more than €30 billion of total assets and those in the smallest size category is also lower.
Chart A.3 Cost inefficiency is most pronounced among the smallest and the very large banks
Evolution of cost efficiency over time Cost efficiency by bank size in 2018
(2006-18, relative to frontier, percentages) (2018, relative to frontier, percentages)
Sources: Bureau Van Dijk Bank Focus and ECB calculations. Notes: Based on a stochastic frontier analysis for euro area commercial banks, cooperative banks and savings banks. A value of 80% implies that the most efficient banks would be able to provide the same amount of financial intermediation services at just 80% of the cost. The group of banks with total assets above €30 billion comprises 108 institutions, and the remaining top 25% comprises 290, the 2nd quartile 368, the 3rd quartile 372 and the bottom 25% 344. While the estimations have been carried out for a pooled sample of banks, the results also hold when the frontier is estimated separately for different bank types.
Small commercial and savings banks and large cooperative banks seem to operate with particularly sub-optimal cost structures. Chart A.4 presents the cost (in)efficiency metric by bank type. Two patterns emerge. First, commercial banks as a group appear less efficient. This finding, however, may be distorted by the complex range of financial services offered by these banks. As some of them are only
90 The method captures banks’ ability to intermediate funds using labour and fixed assets into bank loans
and other investments. The estimation follows Huljak, I., Martin, R. and Moccero, D., “The cost-efficiency and productivity growth of euro area banks”, Working Paper Series, No 2305, ECB, August 2019, but without decomposing efficiency into a persistent and residual component.
65%
70%
75%
80%
85%
90%
2006 2008 2010 2012 2014 2016 2018
MeanInterquartile range
Median
50%
55%
60%
65%
70%
75%
80%
85%
90%
SI Large Medium Small Very small
TA>30bn Other top25%
2ndquartile
3rd quartile Bottom25%
Interquartile rangeMean
Median5th percentile

Financial Stability Review, November 2019 – Special features
112
imperfectly captured in the analysis,91 cost inefficiencies may be overstated. Second, cost inefficiencies among the smallest banks appear significantly elevated for the group of commercial and savings banks compared with larger peers. By contrast, it is the largest cooperative banks that exhibit lower cost-efficiency.
Chart A.4 Cooperative, commercial and savings banks differ in terms of cost efficiency
(2018; x-axis: banks by type and size; y-axis: bank efficiency, relative to frontier; percentages)
Sources: Bureau Van Dijk Bank Focus and ECB calculations. Note: Based on a stochastic frontier analysis for the universe of euro area commercial banks, cooperative banks and savings banks.
Recent empirical evidence suggests that euro area banks across all size categories also operate on an inefficient scale. Cross-country studies of euro area banks generally seem to support the existence of economies of scale for all size categories,92 but they are particularly strong for the largest banks (see Chart A.5, left panel93). Moreover, some researchers point to information technology as a possible source of economies of scale in banking.94
But improving operational efficiency could be impeded by structural features of the euro area banking market. The ECB has long noted that the operations of many euro area banks should become leaner, more digital and more agile to reduce costs and boost profitability.95 However, the stickiness of the cost base of euro area banks may reflect a deeper market structure issue. There is evidence of overcapacity in the euro area banking market, which manifests itself with two reinforcing phenomena: an excess of physical banking infrastructure and an excess number of competitors (see 91 For example, financial guarantees or other services which are not fully reflected in the balance sheet
would not be included as an output of financial intermediation in the estimated trans-log cost function, but the associated costs would still be fully considered. As a result, bank efficiency may be underestimated.
92 See Dijkstra, M., “Economies of scale and scope in the European banking sector 2002-2011”, Amsterdam Center for Law & Economics Working Paper No 2013-11, 2013; Beccalli, E., Anolli, M. and Borello, G., “Are European banks too big? Evidence on economies of scale”, Journal of Banking and Finance, Vol. 58, 2015, pp. 232-246; and Huljak, I., Martin, R. and Moccero, D., “The cost-efficiency and productivity growth of euro area banks”, Working Paper Series, No 2305, ECB, August 2019.
93 Note that the group of listed banks included in the analysis of Beccalli et al. (op. cit.) corresponds to the group of large banks included in this analysis or Huljak et al. (op. cit.).
94 See, for example, Boot, A. W. A., “Consolidation and Strategic Positioning in Banking with Implications for Europe”, in Brookings-Wharton Papers on financial services, Washington: Brookings Institution Press, 2003, pp. 37-83.
95 See, for instance, de Guindos, L., “Euro area banking sector – current challenges”, speech at the Annual General Meeting of the Foreign Bankers’ Association, Amsterdam, 15 November 2018.
50%
60%
70%
80%
90%
100%
TA>3
0bn
Oth
er to
p 25
%
2nd
quar
tile
3rd
quar
tile
Botto
m 2
5%
TA>3
0bn
Oth
er to
p 25
%
2nd
quar
tile
3rd
quar
tile
Botto
m 2
5%
TA>3
0bn
Oth
er to
p 25
%
2nd
quar
tile
3rd
quar
tile
Botto
m 2
5%
Commercial Cooperative Savings
Interquartile rangeMedian
Mean
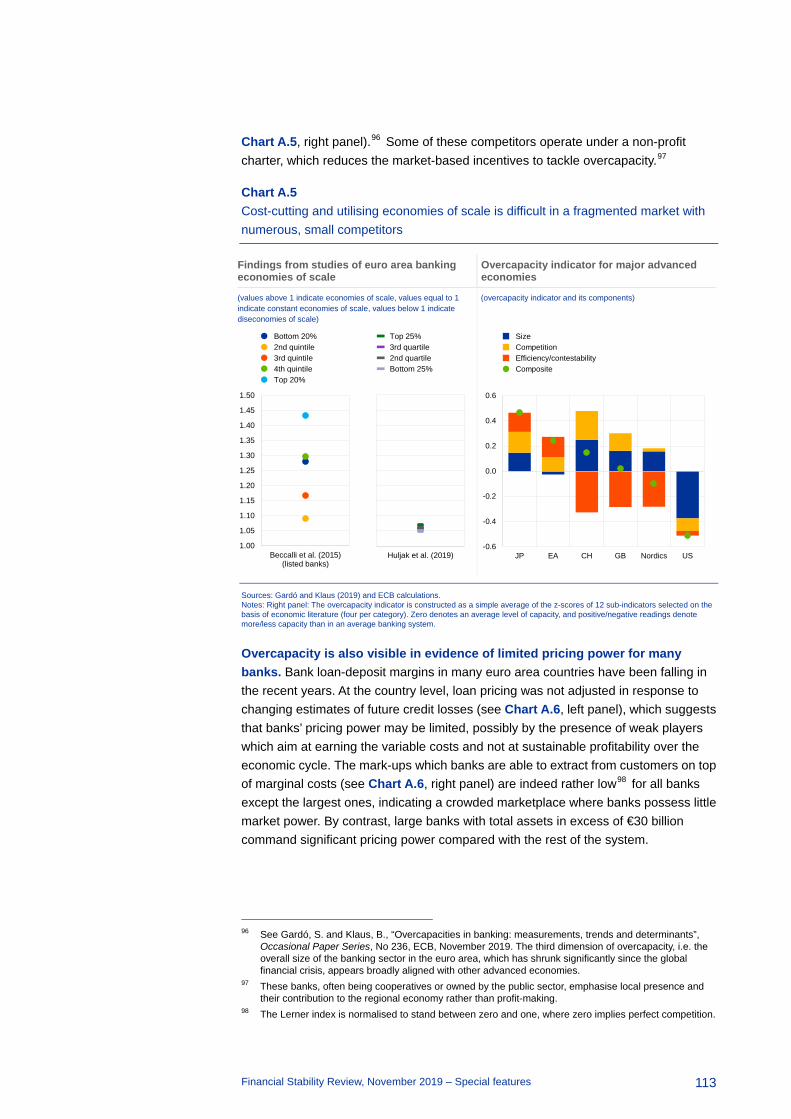
Financial Stability Review, November 2019 – Special features
113
Chart A.5, right panel).96 Some of these competitors operate under a non-profit charter, which reduces the market-based incentives to tackle overcapacity.97
Chart A.5 Cost-cutting and utilising economies of scale is difficult in a fragmented market with numerous, small competitors
Findings from studies of euro area banking economies of scale
Overcapacity indicator for major advanced economies
(values above 1 indicate economies of scale, values equal to 1 indicate constant economies of scale, values below 1 indicate diseconomies of scale)
(overcapacity indicator and its components)
Sources: Gardó and Klaus (2019) and ECB calculations. Notes: Right panel: The overcapacity indicator is constructed as a simple average of the z-scores of 12 sub-indicators selected on the basis of economic literature (four per category). Zero denotes an average level of capacity, and positive/negative readings denote more/less capacity than in an average banking system.
Overcapacity is also visible in evidence of limited pricing power for many banks. Bank loan-deposit margins in many euro area countries have been falling in the recent years. At the country level, loan pricing was not adjusted in response to changing estimates of future credit losses (see Chart A.6, left panel), which suggests that banks’ pricing power may be limited, possibly by the presence of weak players which aim at earning the variable costs and not at sustainable profitability over the economic cycle. The mark-ups which banks are able to extract from customers on top of marginal costs (see Chart A.6, right panel) are indeed rather low98 for all banks except the largest ones, indicating a crowded marketplace where banks possess little market power. By contrast, large banks with total assets in excess of €30 billion command significant pricing power compared with the rest of the system.
96 See Gardó, S. and Klaus, B., “Overcapacities in banking: measurements, trends and determinants”,
Occasional Paper Series, No 236, ECB, November 2019. The third dimension of overcapacity, i.e. the overall size of the banking sector in the euro area, which has shrunk significantly since the global financial crisis, appears broadly aligned with other advanced economies.
97 These banks, often being cooperatives or owned by the public sector, emphasise local presence and their contribution to the regional economy rather than profit-making.
98 The Lerner index is normalised to stand between zero and one, where zero implies perfect competition.
1.00
1.05
1.10
1.15
1.20
1.25
1.30
1.35
1.40
1.45
1.50
Beccalli et al. (2015)(listed banks)
Bottom 20%2nd quintile3rd quintile4th quintileTop 20%
Huljak et al. (2019)
Top 25%3rd quartile2nd quartileBottom 25%
-0.6
-0.4
-0.2
0.0
0.2
0.4
0.6
JP EA CH GB Nordics US
SizeCompetitionEfficiency/contestabilityComposite
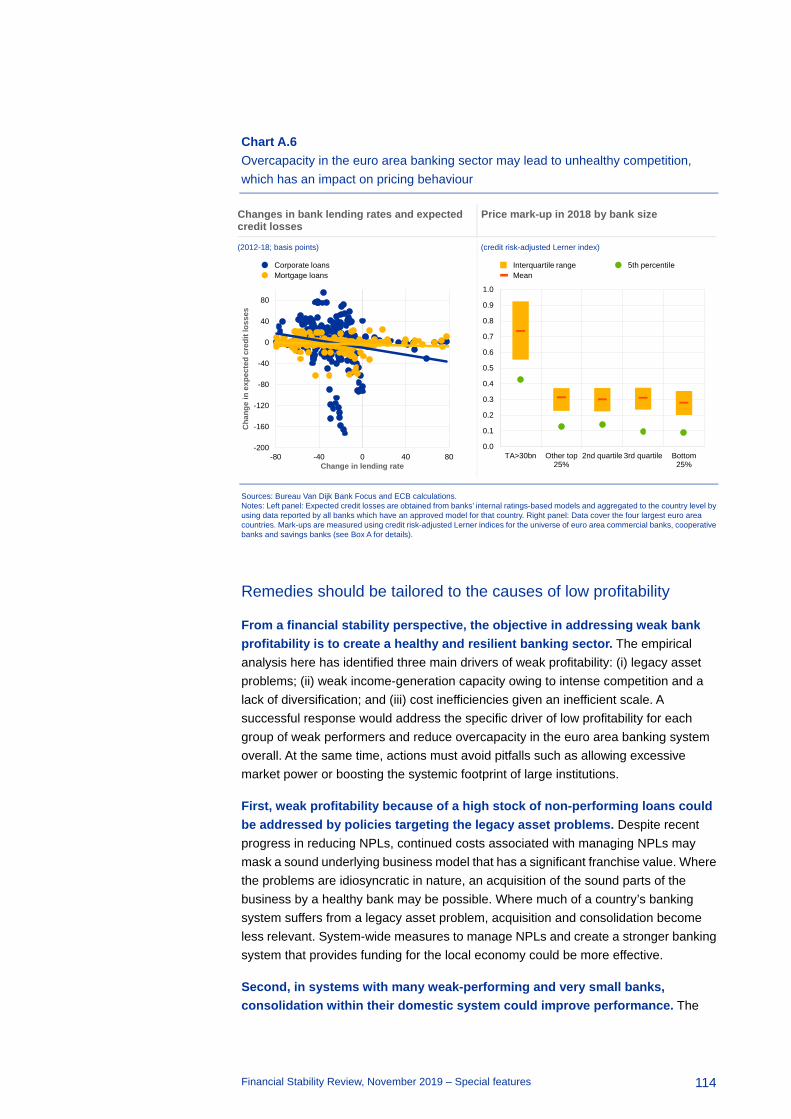
Financial Stability Review, November 2019 – Special features
114
Chart A.6 Overcapacity in the euro area banking sector may lead to unhealthy competition, which has an impact on pricing behaviour
Changes in bank lending rates and expected credit losses
Price mark-up in 2018 by bank size
(2012-18; basis points) (credit risk-adjusted Lerner index)
Sources: Bureau Van Dijk Bank Focus and ECB calculations. Notes: Left panel: Expected credit losses are obtained from banks’ internal ratings-based models and aggregated to the country level by using data reported by all banks which have an approved model for that country. Right panel: Data cover the four largest euro area countries. Mark-ups are measured using credit risk-adjusted Lerner indices for the universe of euro area commercial banks, cooperative banks and savings banks (see Box A for details).
Remedies should be tailored to the causes of low profitability
From a financial stability perspective, the objective in addressing weak bank profitability is to create a healthy and resilient banking sector. The empirical analysis here has identified three main drivers of weak profitability: (i) legacy asset problems; (ii) weak income-generation capacity owing to intense competition and a lack of diversification; and (iii) cost inefficiencies given an inefficient scale. A successful response would address the specific driver of low profitability for each group of weak performers and reduce overcapacity in the euro area banking system overall. At the same time, actions must avoid pitfalls such as allowing excessive market power or boosting the systemic footprint of large institutions.
First, weak profitability because of a high stock of non-performing loans could be addressed by policies targeting the legacy asset problems. Despite recent progress in reducing NPLs, continued costs associated with managing NPLs may mask a sound underlying business model that has a significant franchise value. Where the problems are idiosyncratic in nature, an acquisition of the sound parts of the business by a healthy bank may be possible. Where much of a country’s banking system suffers from a legacy asset problem, acquisition and consolidation become less relevant. System-wide measures to manage NPLs and create a stronger banking system that provides funding for the local economy could be more effective.
Second, in systems with many weak-performing and very small banks, consolidation within their domestic system could improve performance. The
-200
-160
-120
-80
-40
0
40
80
-80 -40 0 40 80
Cha
nge
in e
xpec
ted
cred
it lo
sses
Change in lending rate
Corporate loansMortgage loans
0.0
0.1
0.2
0.3
0.4
0.5
0.6
0.7
0.8
0.9
1.0
TA>30bn Other top25%
2nd quartile 3rd quartile Bottom25%
Interquartile rangeMean
5th percentile
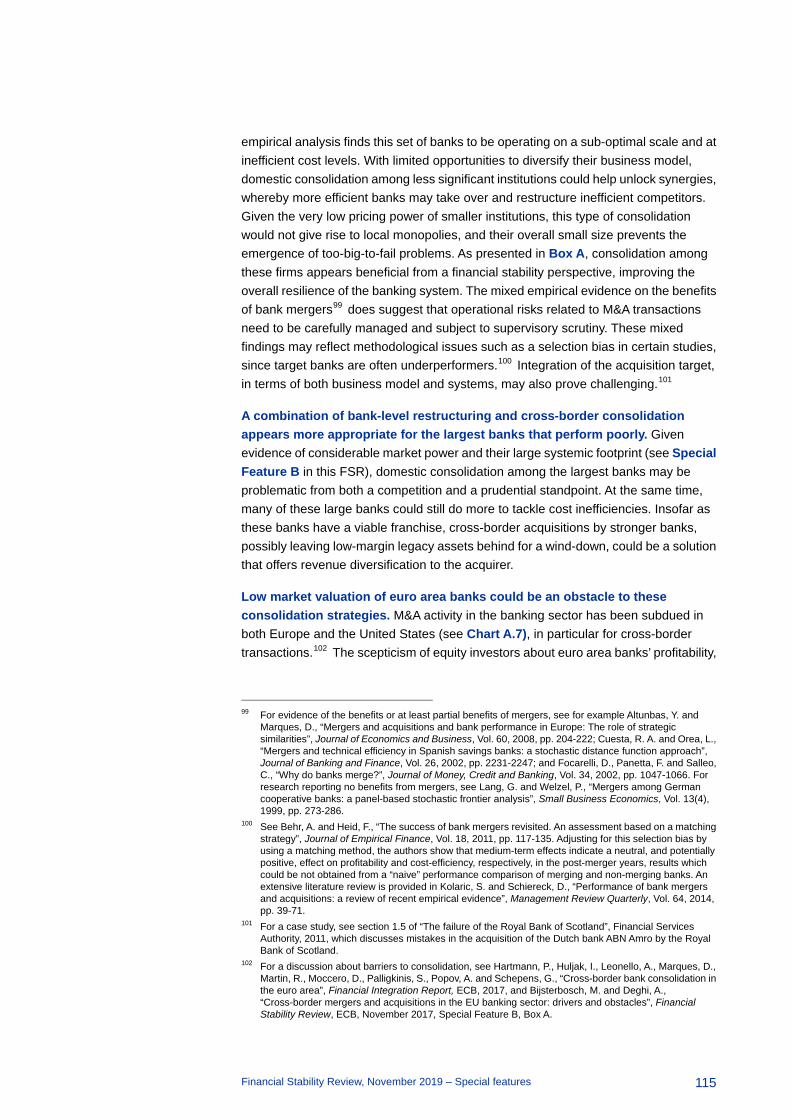
Financial Stability Review, November 2019 – Special features
115
empirical analysis finds this set of banks to be operating on a sub-optimal scale and at inefficient cost levels. With limited opportunities to diversify their business model, domestic consolidation among less significant institutions could help unlock synergies, whereby more efficient banks may take over and restructure inefficient competitors. Given the very low pricing power of smaller institutions, this type of consolidation would not give rise to local monopolies, and their overall small size prevents the emergence of too-big-to-fail problems. As presented in Box A, consolidation among these firms appears beneficial from a financial stability perspective, improving the overall resilience of the banking system. The mixed empirical evidence on the benefits of bank mergers99 does suggest that operational risks related to M&A transactions need to be carefully managed and subject to supervisory scrutiny. These mixed findings may reflect methodological issues such as a selection bias in certain studies, since target banks are often underperformers.100 Integration of the acquisition target, in terms of both business model and systems, may also prove challenging.101
A combination of bank-level restructuring and cross-border consolidation appears more appropriate for the largest banks that perform poorly. Given evidence of considerable market power and their large systemic footprint (see Special Feature B in this FSR), domestic consolidation among the largest banks may be problematic from both a competition and a prudential standpoint. At the same time, many of these large banks could still do more to tackle cost inefficiencies. Insofar as these banks have a viable franchise, cross-border acquisitions by stronger banks, possibly leaving low-margin legacy assets behind for a wind-down, could be a solution that offers revenue diversification to the acquirer.
Low market valuation of euro area banks could be an obstacle to these consolidation strategies. M&A activity in the banking sector has been subdued in both Europe and the United States (see Chart A.7), in particular for cross-border transactions.102 The scepticism of equity investors about euro area banks’ profitability,
99 For evidence of the benefits or at least partial benefits of mergers, see for example Altunbas, Y. and
Marques, D., “Mergers and acquisitions and bank performance in Europe: The role of strategic similarities”, Journal of Economics and Business, Vol. 60, 2008, pp. 204-222; Cuesta, R. A. and Orea, L., “Mergers and technical efficiency in Spanish savings banks: a stochastic distance function approach”, Journal of Banking and Finance, Vol. 26, 2002, pp. 2231-2247; and Focarelli, D., Panetta, F. and Salleo, C., “Why do banks merge?”, Journal of Money, Credit and Banking, Vol. 34, 2002, pp. 1047-1066. For research reporting no benefits from mergers, see Lang, G. and Welzel, P., “Mergers among German cooperative banks: a panel-based stochastic frontier analysis”, Small Business Economics, Vol. 13(4), 1999, pp. 273-286.
100 See Behr, A. and Heid, F., “The success of bank mergers revisited. An assessment based on a matching strategy”, Journal of Empirical Finance, Vol. 18, 2011, pp. 117-135. Adjusting for this selection bias by using a matching method, the authors show that medium-term effects indicate a neutral, and potentially positive, effect on profitability and cost-efficiency, respectively, in the post-merger years, results which could be not obtained from a “naive” performance comparison of merging and non-merging banks. An extensive literature review is provided in Kolaric, S. and Schiereck, D., “Performance of bank mergers and acquisitions: a review of recent empirical evidence”, Management Review Quarterly, Vol. 64, 2014, pp. 39-71.
101 For a case study, see section 1.5 of “The failure of the Royal Bank of Scotland”, Financial Services Authority, 2011, which discusses mistakes in the acquisition of the Dutch bank ABN Amro by the Royal Bank of Scotland.
102 For a discussion about barriers to consolidation, see Hartmann, P., Huljak, I., Leonello, A., Marques, D., Martin, R., Moccero, D., Palligkinis, S., Popov, A. and Schepens, G., “Cross-border bank consolidation in the euro area”, Financial Integration Report, ECB, 2017, and Bijsterbosch, M. and Deghi, A., “Cross-border mergers and acquisitions in the EU banking sector: drivers and obstacles”, Financial Stability Review, ECB, November 2017, Special Feature B, Box A.
Financial Stability Review, November 2019 – Special features
116
reflected in low market valuations103, is pointing to sizeable dilution if new equity needs to be raised in the acquisition process. This may be unacceptable to shareholders, de facto impeding consolidation.
On the regulatory side, completing the euro area banking union should facilitate further consolidation. National rules and requirements, e.g. related to liquidity and capital requirements for subsidiaries, may act as a disincentive to cross-border consolidation. In order to be efficient, cross-border banks need to conduct liquidity and capital management at the consolidated level, and to face as few national options and discretions as possible. Establishing a European deposit insurance scheme and completing the crisis management framework is also an essential part of completing the banking union. Finally, removing further barriers, implied for example by differences in national policy concerning insolvency and taxation, and by divergent regulations of national capital markets, would also assist in fostering bank consolidation.
Chart A.7 M&A activity in the euro area banking sector has been very subdued since the global financial crisis
Value of bank mergers and acquisitions in the euro area
Value of bank mergers and acquisitions in the United States
(2000-19, € billions) (2000-19, € billions)
Source: Dealogic. Note: 2019 data are up to mid-September.
103 See Grodzicki, M., Rodriguez d’Acri, C. and Vioto, D., “Recent developments in banks’ price-to-book
ratios and their determinants”, Financial Stability Review, ECB, May 2019.
0
50
100
150
200
250
2000
2001
2002
2003
2004
2005
2006
2007
2008
2009
2010
2011
2012
2013
2014
2015
2016
2017
2018
2019
DomesticCross-borderOutward EU
Inward EUOutward non-EUInward non-EU
0
50
100
150
200
250
2000
2001
2002
2003
2004
2005
2006
2007
2008
2009
2010
2011
2012
2013
2014
2015
2016
2017
2018
2019
DomesticOutward USInward US

Financial Stability Review, November 2019 – Special features
117
Box A Market power, competitiveness and financial stability of the euro area banking sector
Prepared by Ivan Huljak, Alessio Reghezza and Costanza Rodriguez d’Acri
The competitiveness of a banking sector affects its resilience, with implications for financial stability and long-term economic welfare.104 A healthy level of competition should enhance efficiency and promote product innovation, lowering interest rates and, in turn, reducing firms’ borrowing costs and probability of default. An aggressively competitive market can lead banks to take on too much risk, while also squeezing their margins and undermining their resilience. Combining measures of competitiveness and stability of the euro area banking sector can shed light on whether the current level of competition is enhancing or potentially undermining financial stability.105
Since 2001 the increase in the market power of the median euro area bank has been overall positive for financial stability. Market power is the ability of a firm to set prices above its marginal costs,106 and a higher level of market power for most banks in a system generally suggests a less competitive system as a whole. It can be measured with the adjusted Lerner index, which is the difference between prices (measured using interest income and fee and commission income) and marginal costs (measured as a function of labour, fixed and funding costs) expressed as a ratio of prices. Higher values of the index are associated with stronger market power and reflect weaker competition. According to the adjusted Lerner index, banks’ market power increased after the global financial crisis and has stabilised in recent years, driven by a larger drop in marginal costs compared with bank prices. At the same time, bank stability in the euro area, measured using the distance to default, has improved after the significant drop experienced during the financial crisis (see Chart A, left panel).
Using the past relationship between these competition and stability metrics as a guide suggests that consolidation among smaller banks would not have negative consequences for financial stability in the euro area. An econometric analysis suggests that the relationship between competition and bank stability has an inverted U-shape in the euro area (see Chart A, right panel). This implies that there is indeed an optimal level of competition from a bank stability perspective, which can be estimated to correspond to the Lerner index standing close to 0.5 (given estimation uncertainty). Specifically, increasing market power up to that level would lead to a more stable banking sector as measured by the Z-score, while – beyond that level – higher market power would lead to a decline in the Z-score and thus a more fragile banking sector. However, while the distribution of the adjusted Lerner index has flattened and its mean shifted to the right as market power increased for euro area banks (see Chart A, right panel), only some banks in the tail display levels of market power that could be characterised by a negative relationship with bank stability (e.g. with an adjusted Lerner index above 0.5; see Chart 6 in this special feature).
104 For an overview of the related literature, see Marcus, A. J., “Deregulation and Bank Financial Policy”,
Journal of Banking and Finance, Vol. 8, 1984, pp. 557-632; Keeley, M., “Deposit Insurance, Risk and Market Power in Banking”, American Economic Review, Vol. 80, 1990, pp. 1183-1200; Allen, F. and Gale, D., “Competition and Financial Stability”, Journal of Money, Credit and Banking, Vol. 36, 2000, pp. 453-480; Boyd, J. H. and De Nicoló, G., “The Theory of Bank Risk Taking and Competition Revisited”, Journal of Finance, Vol. 60, 2005, pp. 1329-1343; and Jiménez, G., Lopez, J. and Saurina, J., “How does competition affect bank risk-taking?”, Journal of Financial Stability, Vol. 9(2), 2013, pp. 185-195.
105 When competition increases in a highly competitive banking sector, banks respond by taking on more risk: competition-fragility prevails. When markets are highly concentrated, asset quality and borrowing costs fall: competition-stability prevails. See Martinez-Miera, D. and Repullo, R., “Does Competition Reduce the Risk of Bank Failure?”, Review of Financial Studies, Vol. 23, 2010, pp. 3638-3664.
106 A firm has strong market power when the price elasticity of demand is low because demand is not affected much by price variations, and vice versa.
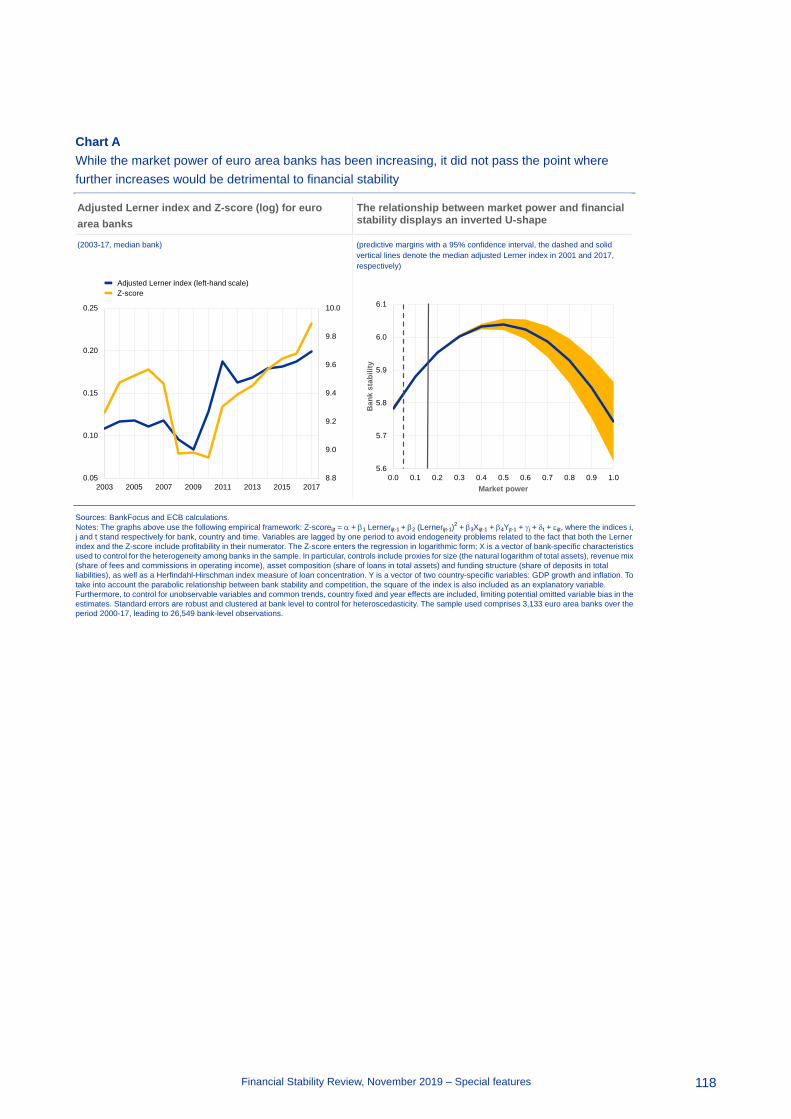
Financial Stability Review, November 2019 – Special features
118
Chart A While the market power of euro area banks has been increasing, it did not pass the point where further increases would be detrimental to financial stability
Sources: BankFocus and ECB calculations. Notes: The graphs above use the following empirical framework: Z-scoreijt = α + β1 Lernerijt-1 + β2 (Lernerijt-1)
2 + β3Xijt-1 + β4Yjt-1 + γj + δt + εijt, where the indices i, j and t stand respectively for bank, country and time. Variables are lagged by one period to avoid endogeneity problems related to the fact that both the Lerner index and the Z-score include profitability in their numerator. The Z-score enters the regression in logarithmic form; X is a vector of bank-specific characteristics used to control for the heterogeneity among banks in the sample. In particular, controls include proxies for size (the natural logarithm of total assets), revenue mix (share of fees and commissions in operating income), asset composition (share of loans in total assets) and funding structure (share of deposits in total liabilities), as well as a Herfindahl-Hirschman index measure of loan concentration. Y is a vector of two country-specific variables: GDP growth and inflation. To take into account the parabolic relationship between bank stability and competition, the square of the index is also included as an explanatory variable. Furthermore, to control for unobservable variables and common trends, country fixed and year effects are included, limiting potential omitted variable bias in the estimates. Standard errors are robust and clustered at bank level to control for heteroscedasticity. The sample used comprises 3,133 euro area banks over the period 2000-17, leading to 26,549 bank-level observations.
Adjusted Lerner index and Z-score (log) for euro area banks
The relationship between market power and financial stability displays an inverted U-shape
(2003-17, median bank) (predictive margins with a 95% confidence interval, the dashed and solid vertical lines denote the median adjusted Lerner index in 2001 and 2017, respectively)
8.8
9.0
9.2
9.4
9.6
9.8
10.0
0.05
0.10
0.15
0.20
0.25
2003 2005 2007 2009 2011 2013 2015 2017
Adjusted Lerner index (left-hand scale)Z-score
5.6
5.7
5.8
5.9
6.0
6.1
0.0 0.1 0.2 0.3 0.4 0.5 0.6 0.7 0.8 0.9 1.0
Ban
k st
abili
ty
Market power
Financial Stability Review, November 2019 – Special features
119
Assessing the systemic footprint of euro area banks B
Prepared by Michał Adam, Paul Bochmann, Maciej Grodzicki, Luca Mingarelli, Mattia Montagna, Costanza Rodriguez d’Acri and Martina Spaggiari
This special feature discusses several ways in which the measurement of banks’ systemic footprint can be complemented with new indicators. The international approach is largely mechanical, but is intended to be complemented by expert judgement. The proposed additional systemic footprint measures may help macroprudential authorities in exercising that judgement. Using loan-level data matched with individual corporate balance sheet information allows macroprudential authorities to gain a better understanding of how a bank’s failure may affect employment and economic activity. Similar data, used in a model of network contagion, help assess the impact of a bank’s failure on the rest of the system. While the measures proposed in this special feature are not embedded in O-SII or G-SII scores, some evidence suggests that the concepts discussed have informed decisions of macroprudential authorities.
Introduction
Large and complex banks can cause harm to the wider economy if they become distressed or fail. The extent and type of disruption that the distress or failure of an individual bank could cause to the financial system and economy is its systemic footprint. Mitigating the risks posed by systemically important banks, with large footprints, has been a key part of the post-crisis regulatory reforms. This has included establishing processes at the global and local levels to identify systemically important banks and set higher loss-absorbing capital requirements107 for them to protect the financial system from the effect of their failure.
This special feature considers how new metrics can support the assessment of the systemic importance of individual banks. The economic costs of a bank’s distress or failure stem from, among other things, its size, complexity, substitutability or business model. As such, there is no single metric that captures systemic importance. In line with the definition of financial stability, measures of systemic importance should capture the impact on the real economy, including lending and economic growth. They should also account for the knock-on effects on other financial institutions and core financial markets.108 Regulators have been relying on indicator-based scoring approaches to this end, which, however, may not give a full picture of the underlying dimensions of systemic importance. As more granular data on banks’ exposures to the economy and to other financial institutions become available, it becomes possible to develop new metrics of systemic importance to complement existing measures. 107 See Reducing the moral hazard posed by systemically important financial institutions, Financial Stability
Board, 20 October 2010. 108 See “Measurement challenges in assessing financial stability”, Financial Stability Review, ECB,
December 2005; “Identifying large and complex banking groups for financial system stability assessment”, Financial Stability Review, ECB, December 2006; and “The concept of systemic risk”, Financial Stability Review, ECB, December 2009.

Financial Stability Review, November 2019 – Special features
120
Regulatory approaches to assessing systemic importance
Every year, under the aegis of the Financial Stability Board (FSB), the Basel Committee on Banking Supervision (BCBS) coordinates the identification of global systemically important banks (G-SIBs).109 The methodology approximates the impact of a bank’s failure with a score, which is defined as a weighted average of twelve indicators grouped within five categories: size, complexity, cross-border activity, interconnectedness and substitutability. Each indicator is presented in comparison to values for selected global banks.110 The categories are equally weighted in the final score. Any bank with an overall score of at least 130 basis points is automatically designated as a G-SIB, and receives an additional capital requirement that increases step-wise with the score. In 2018, 29 banks were identified as G-SIBs globally, of which eight were headquartered in the euro area.
Within the European Union, national authorities designate systemically important banks and set capital buffers for them. In October 2012 the BCBS also published a principles-based framework for dealing with domestic systemically important banks.111 The European Union implemented this framework in the Capital Requirements Directive (CRD IV) and the European Banking Authority adopted guidelines that recommend to the national macroprudential authorities the approach to follow for the identification of systemically important banks at the domestic level.112 In line with the Single Supervisory Mechanism (SSM) Regulation, the ECB can object to decisions taken by national authorities, or set higher requirements for other systemically important institutions (O-SIIs) identified by national authorities in SSM countries.
While the mechanical scoring approach offers simplicity, transparency and predictability, it needs to be complemented with informed judgement. For example, the interconnectedness dimension of the G-SIB scoring methodology is proxied with stocks of intra-financial sector claims and liabilities, and securities issued. But a shortcoming of this approach is the lack of distinction between secured and unsecured instruments, or between types of financial sector counterparties. So, the resulting systemic footprint ranking may not present a full picture of the underlying risks. A mechanical scoring approach may also not be sufficient to understand the amplification mechanisms or interactions between financial sector agents.
Alternative metrics can support policymakers in exercising expert judgement. The use of expert judgement is expected to be rare, and the supporting evidence must be compelling. The case for additional evidence may be particularly strong for the interconnectedness and substitutability dimensions of the scores, which cover a broad
109 See Global systemically important banks: Assessment methodology and the additional loss absorbency
requirement, BCBS, November 2011 (subsequently amended in 2013 and 2018). 110 The sample consists of the 75 largest global banks (as determined by the Basel III leverage ratio
exposure measure), along with all banks that were designated as G-SIBs in the previous year. 111 See A framework for dealing with domestic systemically important banks, BCBS, October 2012. 112 That approach takes into account the general criteria specified in the CRD IV and the criteria set out in
the BCBS framework for dealing with domestic systemically important banks. See Guidelines on the criteria to determine the conditions of application of Article 131(3) of Directive 2013/36/EU (CRD) in relation to the assessment of other systemically important institutions, European Banking Authority, EBA/GL/2014/10, December 2014.

Financial Stability Review, November 2019 – Special features
121
range of concepts and possible transmission channels of a bank’s systemic footprint. It could be less relevant for more straightforward dimensions such as size and cross-border activity.
Advances in measuring the systemic footprint
The increased availability of granular data on bilateral and common exposures of financial institutions opens up new ways to measure the systemic footprint. As discussed in the May 2019 FSR, data on large exposures and securities holdings of euro area banks provide a new perspective on contagion risks within the banking sector, and links to and from the real economy.113 These loan-level data on exposures can provide new information on: (i) the impact of a bank’s failure on the real economy; and (ii) the impact of a bank’s failure on the rest of the financial system.
The importance of a bank’s lending to employment and economic value added can be analysed through granular data on loans to individual companies. The underlying economic intuition is that, should a bank fail or be in distress, its impact on the real economy would, in the first instance, manifest itself through lending relationships with non-financial firms. The bank’s borrowers may struggle to replace lost relationships, and to roll over or top up financing obtained from this particular bank. In turn, they may be forced to cut output and employment. As companies differ in terms of labour intensity and productivity per unit of finance, not only the size but also the portfolio composition of a bank determine its relevance to the real economy.114 In principle, similar concepts may also be applied to lending to consumers and help quantify the possible impact of bank distress on consumption, should granular data be available.
Indices assessing employment and revenue relevance can capture these additional aspects of a bank’s economic importance. The employment relevance of a bank’s lending to non-financial businesses is measured by matching each credit exposure of a bank with balance sheet data of borrowing firms.115 The loan amount is then divided by the total liabilities and equity of the borrower. This share in the firm’s funding structure is then multiplied by the number of employees of the borrower, and summed over all the exposures of a bank, thus measuring the number of jobs that would be directly affected by the default of the bank. Revenue relevance is measured in a similar fashion, by using revenues instead of employment data, thus measuring the amount of economic turnover that could potentially be disrupted by the distress of the bank.
Employment and revenue relevance measures do provide more information on economic importance than total assets of the bank alone (see Chart B.1).
113 See Covi, G., Montagna, M. and Torri, G., “Economic shocks and contagion in the euro area banking
sector: a new micro-structural approach”, Financial Stability Review, ECB, May 2019. 114 See Gabaix, X., “The Granular Origins of Aggregate Fluctuations”, Econometrica, Vol. 79(3),
pp. 733-772, May 2011, for a rigorous approach to computing granular contributions of corporations to GDP volatility.
115 Owing to limited data availability, the examples presented in this special feature only use large exposures; however, the indices can be computed using a full set of exposure-level data.

Financial Stability Review, November 2019 – Special features
122
Generally, banks with more total assets also have higher employment and revenue relevance measures. But in extreme cases, two banks with similar total assets could differ, in terms of relevance for employment, by as much as a factor of one hundred. Such differences suggest that the economic impact of bank failures cannot be completely captured by measures which do not take into account counterparties’ characteristics. Instead, granular information about individual corporations and institutions, directly related to banks’ balance sheets, as well as the role played by these counterparties in the real economy, is crucial to gauge how macroeconomic variables are affected by systemic financial shocks and to link a single institution’s distress to real variables such as GDP growth and unemployment.
Chart B.1 Economic importance of banks is correlated with size, but with wide dispersion
Revenue relevance index (RRI) and total assets for a set of EU banks
Labour market relevance index (LMRI) and total assets for a set of EU banks
(x-axis: € billions; y-axis: € thousands) (x-axis: € billions; y-axis: number of employees)
Sources: ECB calculations based on ECB and Bureau Van Dijk data. Notes: As both indices are computed based on the large exposure database for firms whose balance sheet and employment data are available, comparability across banks may be affected by varying shares of large exposures in the total lending portfolio. To improve readability, the charts have logarithmic scales. Data in both charts refer to exposures of a set of EU banks in the last quarter of 2015 and 2019.
Granular data on exposures to other banks and financial institutions can enhance the understanding of the impact of a bank’s distress on its counterparties. Bilateral exposures between financial institutions can be used to construct a network, and the topology of that network can help identify the most important participants of an interbank network.116,117 This may be done on the basis of out-degree and in-degree, which measure the number and value of interbank loans originated and interbank deposits collected by a given bank. PageRank is an indicator of the relative importance not only of a specific bank, but also of its interbank lenders and borrowers. In the past, owing to data constraints, such models were often calibrated using simulated networks. Granular large exposure data have removed some of these constraints and have made it possible to distinguish between various 116 See Glasserman, P. and Young, H. P., “Contagion in Financial Networks”, Journal of Economic Literature,
Vol. 54(3), 2016, pp. 779-831. 117 See Bisias, D., Flood, M. D., Lo, A. W. and Valavanis, S., “A Survey of Systemic Risk Analytics”, Office of
Financial Research Working Paper, U.S. Department of the Treasury, 2012.
1
100
10000
1000000
0.1 1 10 100 1000 10000
Ban
k R
RI
Total assets
20192015
1
100
10000
1000000
0.01 0.1 1 10 100 1000
Ban
k LM
RI
Total assets
20192015
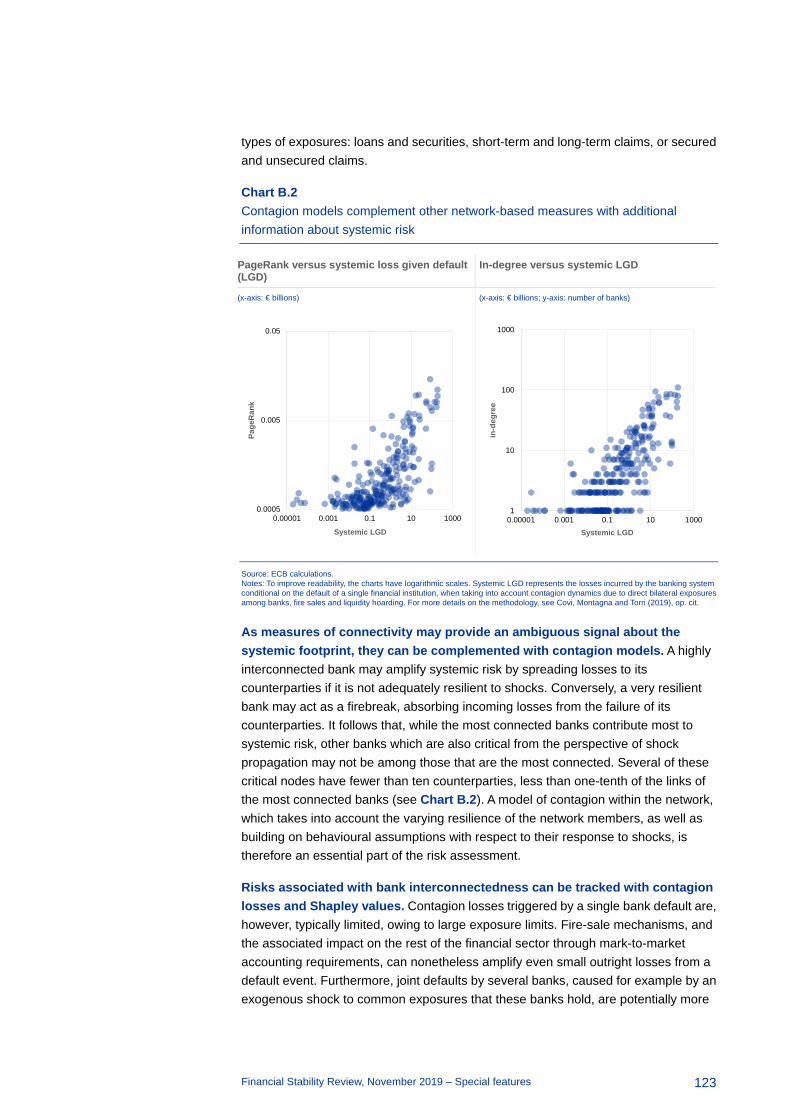
Financial Stability Review, November 2019 – Special features
123
types of exposures: loans and securities, short-term and long-term claims, or secured and unsecured claims.
Chart B.2 Contagion models complement other network-based measures with additional information about systemic risk
PageRank versus systemic loss given default (LGD)
In-degree versus systemic LGD
(x-axis: € billions) (x-axis: € billions; y-axis: number of banks)
Source: ECB calculations. Notes: To improve readability, the charts have logarithmic scales. Systemic LGD represents the losses incurred by the banking system conditional on the default of a single financial institution, when taking into account contagion dynamics due to direct bilateral exposures among banks, fire sales and liquidity hoarding. For more details on the methodology, see Covi, Montagna and Torri (2019), op. cit.
As measures of connectivity may provide an ambiguous signal about the systemic footprint, they can be complemented with contagion models. A highly interconnected bank may amplify systemic risk by spreading losses to its counterparties if it is not adequately resilient to shocks. Conversely, a very resilient bank may act as a firebreak, absorbing incoming losses from the failure of its counterparties. It follows that, while the most connected banks contribute most to systemic risk, other banks which are also critical from the perspective of shock propagation may not be among those that are the most connected. Several of these critical nodes have fewer than ten counterparties, less than one-tenth of the links of the most connected banks (see Chart B.2). A model of contagion within the network, which takes into account the varying resilience of the network members, as well as building on behavioural assumptions with respect to their response to shocks, is therefore an essential part of the risk assessment.
Risks associated with bank interconnectedness can be tracked with contagion losses and Shapley values. Contagion losses triggered by a single bank default are, however, typically limited, owing to large exposure limits. Fire-sale mechanisms, and the associated impact on the rest of the financial sector through mark-to-market accounting requirements, can nonetheless amplify even small outright losses from a default event. Furthermore, joint defaults by several banks, caused for example by an exogenous shock to common exposures that these banks hold, are potentially more
0.0005
0.005
0.05
0.00001 0.001 0.1 10 1000
Page
Ran
k
Systemic LGD
1
10
100
1000
0.00001 0.001 0.1 10 1000
in-d
egre
e
Systemic LGD

Financial Stability Review, November 2019 – Special features
124
sizeable (see Chart B.3). Shapley values, originating in game theory and portfolio management, decompose the losses from a joint default by multiple banks into the individual banks’ contributions to systemic risk.
These measures, which use bank exposure data, can be complemented by market-based information. Co-movements in market prices of firms’ equity and debt have often been proposed in the literature as proxies for potential contagion risk, partly owing to the accessibility of market data. Some of these measures, such as SRISK and MES, also incorporate limited information about balance sheet structure and the resilience of intermediaries, and are more closely aligned with the results of the scoring approaches than measures using solely market price data such as ΔCoVaR (see Chart B.3). Overall, market-based measures could provide insights into risk perception by key market participants, which itself may be a vulnerability of specific banks, in particular during periods of heightened market uncertainty.
Chart B.3 Contagion losses and market-based measures offer another perspective on contributions of individual banks to systemic risk
Shapley values and contagion losses from individual bank default
SRISK, ΔCoVaR and G-SIB scores
(€ billions) (x-axis: basis points; y-axis: normalised values)
Source: ECB calculations. Notes: Left panel: Sample of 12 euro area G-SIBs and near G-SIBs. Loss measures include losses from fire sales. Right panel: Sample of all listed euro area banks in the group of 75 global banks for which G-SIB scores are available. SRISK and ΔCoVaR have been normalised by dividing by each respective maximum value.
These advances notwithstanding, further work is necessary to investigate other aspects of bank interconnectedness and substitutability. Beyond the tools discussed here, the assessment of bank substitutability should take the competitive landscape of the banking system and available balance sheet, liquidity and operational capacity into account. It should also consider the role of a specific firm in banking markets and key market infrastructures. With respect to interconnectedness, a more systemic view of the links between systemic banks and the rest of the financial system would also be beneficial for understanding their systemic footprint.
0
10
20
30
40
50
60
70
0 50 100 150 200
Shap
ley
valu
es
Losses from individual bank default
201820162014
0.0
0.2
0.4
0.6
0.8
1.0
1.2
0 100 200 300 400
SRIS
K a
nd Δ
CoV
aR, n
orm
alis
ed
G-SIB scores
SRISK end-2017ΔCoVaR end-2017

Financial Stability Review, November 2019 – Special features
125
Scope for application to structural capital buffer-setting
The indicators discussed in this special feature may be relevant for setting capital buffers for systemically important banks. Although they are not used in scoring approaches, they carry new information about a bank’s systemic importance. As such, they may in principle contain useful information for the calibration of bank-specific structural macroprudential capital buffers. In particular, such indicators may help operationalise the expert judgement exercised by macroprudential authorities.118
Judgements exercised by national authorities in the euro area are already implicitly taking some of these elements into account. The European Systemic Risk Board has documented the wide dispersion of O-SII capital buffers, and of the O-SII designation practices.119 To show that this variation may be explained by potential contagion generated by O-SIIs, principal component analysis has been applied to O-SII scores and other indicators of systemic relevance of 108 euro area O-SIIs to identify common trends. The resulting principal components were then used as predictors of the O-SII buffer rates in an ordered probit set-up. The first principal component, capturing the O-SII score, and the component corresponding to contagion losses (see Chart B.4, left panel) are found to be statistically significant in these regressions. The impact of contagion losses on the setting of buffer rates is positive, although their weight is much lower than that of O-SII scores. For example, the probability that an O-SII would receive a buffer rate of 1.75% or 2.0% increases by about 5 percentage points when the systemic LGD moves from the 25th to the 75th percentile of the distribution (see Chart B.4, right panel). It also confirms that contagion losses provide fresh information to policymakers, which is not embedded in the O-SII score.
118 Among the euro area countries, Luxembourg has included indicators of interconnectedness between
banks and investment funds in its O-SII methodology. See Gehrend, M., “Bank-investment fund interconnections and systemically important institutions in Luxembourg”, Revue de stabilité financière, Banque centrale du Luxembourg, 2017.
119 For example, the share of bank assets held by O-SIIs varies between countries from about one-third to over 90%. See Final report on the use of structural macroprudential instruments in the EU, European Systemic Risk Board, 2018.

Financial Stability Review, November 2019 – Special features
126
Chart B.4 Contagion losses provide new information about systemic relevance that is not embedded in the O-SII score, and more contagious banks face higher capital buffers
Principal component analysis of bank O-SII scores, country factors and bank features
Probability distribution of O-SII buffer rates conditional on a bank’s features
(factor loadings of principal components) (x-axis: percentage points)
Source: ECB calculations. Notes: Right panel: Probability distributions are obtained using an ordered probit model that uses the three principal components presented in the left panel as explanatory variables for the level of the O-SII buffer. These distributions are generated for a bank with the value of each component set to the in-sample median, with the exception of the respective O-SII score and contagion component which are set to either the 25th or the 75th percentile of the observed distribution.
Contagion models may also inform the distribution of additional capital within the banking system. Given the extent of common exposures and interlinkages, changes to the capital requirements of each individual bank can affect the stability of their counterparties and the entire system. Network contagion models could enable regulators to assess more clearly how the distribution of capital requirements amongst banks could reduce the probability of contagion spreading in a stress event.
An illustrative exercise shows that the reallocation of capital may lead to a considerable reduction in systemic risk. Assuming that the regulators have set a sufficient amount of capital for the system as a whole,120 the actual distribution of capital amongst banks could be set so as to minimise probability-weighted system-wide losses. With buffers allowed to change in increments of 25 basis points, a grid search algorithm can help to find the distribution of capital buffers that minimises systemic risk.121 This exercise shows that higher aggregate capital buffers decrease the level of contagion and systemic risk in the system, but the relationship between these variables is far from linear, and the distribution of capital influences total systemic risk. Above a certain level of aggregate capital requirements, the marginal gain in terms of reducing systemic risk becomes negligible (see Chart B.5), showing that the distribution of capital requirements may in such circumstances be more relevant from a contagion perspective than the total level of requirements. This exercise does not, however, account for the costs of imposing higher aggregate 120 This might be done on the basis of aggregate cost-benefit analysis, for example using the approach
employed in An assessment of the long-term economic impact of stronger capital and liquidity requirements, BCBS, August 2010.
121 See Covi, Montagna and Torri (2019), op. cit.
-0.4
-0.2
0.0
0.2
0.4
0.6
0.8
Subs
core
:si
ze
Subs
core
:im
porta
nce
Subs
core
:co
mpl
exity
Subs
core
:in
terc
onne
cted
ness
Mar
ket
conc
entra
tion
Bank
ing
sect
or s
ize
Mar
ket s
hare
Con
tagi
on lo
sses
O-SII score componentCountry componentContagion component
0.0
0.1
0.2
0.3
0.4
0.5
0.6
0.25-0.50 0.75-1.00 1.25-1.50 1.75-2.00
Prob
abili
ty
O-SII buffer buckets
O-SII score: 25th percentileO-SII score: 75th percentileContagion loss: 25th percentileContagion loss: 75th percentile

Financial Stability Review, November 2019 – Special features
127
capital requirements, which may be sizeable and could lead to net effects being negative.
Chart B.5 Allocation of capital to systemic banks influences distribution of contagion losses
(€ billions)
Source: ECB calculations. Notes: Realisations of systemic risk represent contagion losses to the banking system estimated using 50,000 iterations in a Monte Carlo simulation of bank failures. The yellow line corresponds to the efficient frontier, where no further reduction in systemic risk can be achieved for a given aggregate amount of capital.
8.0
8.5
9.0
9.5
10.0
10.5
11.0
11.5
12.0
12.5
13.0
10 20 30 40
Ave
rage
sys
tem
ic lo
sses
aris
ing
from
co
ntag
ion
give
n ne
utra
l sce
nario
Realisations of systemic riskLowest achievable level of systemic risk
Total regulatory capital requirement

© European Central Bank, 2019
Postal address 60640 Frankfurt am Main, Germany Telephone +49 69 1344 0 Website www.ecb.europa.eu
All rights reserved. Reproduction for educational and non-commercial purposes is permitted provided that the source is acknowledged.
For specific terminology please refer to the ECB glossary (available in English only).
PDF ISSN 1830-2025, QB-XU-19-002-EN-N HTML ISSN 1830-2025, QB-XU-19-002-EN-Q