FINANCIAL STABILITY REPORT - bsp.gov.ph · 2017 financial stability report page 1 financial...
72
FINANCIAL STABILITY REPORT
Transcript of FINANCIAL STABILITY REPORT - bsp.gov.ph · 2017 financial stability report page 1 financial...
FINANCIAL STABILITY
REPORT


FINANCIAL STABILITY REPORT

2017 FINANCIAL STABILITY REPORT Prepared by: OFFICE OF SYSTEMIC RISK MANAGEMENT Technical Secretariat of the Financial Stability Coordination Council Bangko Sentral ng Pilipinas 5th Floor Multi-storey Building, BSP Complex A. Mabini Street, Malate 1004 Manila, Philippines June 2018

2017 FINANCIAL STABILITY REPORT
Page 1
FINANCIAL STABILITY COORDINATION COUNCIL
TABLE OF CONTENTS LIST OF CHARTS i LIST OF TABLES ii LIST OF ACRONYMS, ABBREVIATIONS AND SYMBOLS iii MESSAGE FROM THE BSP GOVERNOR AND FSCC CHAIRMAN v
EXECUTIVE SUMMARY AND FINANCIAL STABILITY ASSESSMENT 1
CHAPTER 1: PURSUING FINANCIAL STABILITY IN THE PHILIPPINES 3 1.1. Financial stability as a collaborative and coordinated effort 3
1.2. Foundations of systemic risk and financial stability 4
BOX ARTICLE 1. The black swan and the limits of decision theory 5 1.3. The FSCC’s approach to financial stability and its reform agenda 8
BOX ARTICLE 2. Some lessons from the GFC 11
CHAPTER 2: GLOBAL AND DOMESTIC DEVELOPMENTS 13 2.1. Global and regional developments 13
2.2. Domestic developments 15
BOX ARTICLE 3. The evolving Philippine financial system 19
CHAPTER 3: CURRENT RISKS IN THE FINANCIAL SYSTEM 21 Repricing, refinancing and repayment risks (3Rs) 21
3.1. Developments in the credit market 21
BOX ARTICLE 4. Household debt: estimating indebtedness 23 through the FIES data
3.2. Impact of changing market prices 24
BOX ARTICLE 5. Understanding crisis episodes through the eyes 25 of Minsky and Vercelli
CHAPTER 4: FINANCIAL STABILITY ISSUES IN ONGOING WORK 29
4.1. ASEAN integration 29
4.2. Fintech 35 BOX ARTICLE 6. The financial trilemma model 36
CHAPTER 5: MOVING FORWARD: MORE DATA AND BETTER TOOLS 45
5.1. Data enhancements on issues already identified 45
5.2. Rejoinder on data requirements 48
5.3. Concluding thoughts 56
BIBLIOGRAPHY 57

2017 FINANCIAL STABILITY REPORT
Page 2
FINANCIAL STABILITY COORDINATION COUNCIL
The material in the 2017 Financial Stability Report was finalized in June 2018. Meanwhile, the world
map in the front cover is created by Freepik and was modified accordingly.
Reproduction for educational and non-commercial purposes is permitted provided that the source
is duly acknowledged.

2017 FINANCIAL STABILITY REPORT
Page 3
FINANCIAL STABILITY COORDINATION COUNCIL
LIST OF CHARTS
MAIN CHAPTERS Figure 1 Coverage of the 2017 FSR 2 Figure 1.1 The Financial Stability Coordination Council 3 Figure 1.2 Comingling of risks 6 Figure 1.3 Analytical framework for financial stability 8 Figure 1.4 The 4Cs model 9 Figure 1.5 The first building block – the fundamental components 9 Figure 1.6 The second building block – from short-term to long-term financing 10 Figure 1.7 The third building block – developing contingent markets 10 Figure 2.1 Real GDP growth rates of selected ASEAN countries 15 Figure 2.2 Cumulative foreign portfolio flows 16 Figure 2.3 Stock market indices of selected Asian countries 16 Figure 2.4 Average true range of PSE index 16 Figure 2.5 PDEx trade volume 17 Figure 2.6 Spot exchange rates of ASEAN currencies 17 Figure 2.7 Volatilities of selected ASEAN currencies 17 Figure 2.8 Overnight Reference Rate 17 Figure 2.9 Philippine yield curve 18 Figure 3.1 Total loan portfolio 21 Figure 3.2 Banks’ sources and uses of funds 21 Figure 3.3 Foreign borrowings of Philippine banks 21 Figure 3.4 PSE debt-to-equity ratio 22 Figure 3.5 Philippine corporate bonds 22 Figure 3.6 Consumer loans 22 Figure 3.7 Providers of household loans 24 Figure 3.8 Banking system’s investment accounts 24 Figure 3.9 Non-performing loans 24 Figure 3.10 Cross-border claims on NFCs and banks 26 Figure 3.11 Top five recipients of incremental loans (by economic activity) 26 Figure 3.12 Inventories of real estate firms 27 Figure 3.13 Residential Real Estate Price Index 27 Figure 4.1 GDP growth of selected regions 29 Figure 4.2 GDP growth of ASEAN vs. rest of the world 29 Figure 4.3 Gross domestic saving of selected regions 30 Figure 4.4 Gross domestic saving of ASEAN vs. rest of the world 30 Figure 4.5 Comparative saving rate 30 Figure 4.6 Intra-ASEAN imports 31 Figure 4.7 Intra-ASEAN exports 31 Figure 4.8 Rodrik’s Globalization Trilemma 34 Figure 4.9 Transaction value of fintech markets in the Philippines 38 Figure 4.10 Estimated gaps between financial needs and formal supply in the Philippines 40 Figure 5.1 Proposed macroprudential tools 51 Figure 5.2 Volatility of selected GS benchmark tenors 52 Figure 5.3 Actual vs. hypothetical YTM of GS 53 Figure 5.4 Financial market infrastructure 54
i

2017 FINANCIAL STABILITY REPORT
Page 4
FINANCIAL STABILITY COORDINATION COUNCIL
BOX ARTICLES Figure A Selected balance sheet accounts of the banking system 19 Figure B Total assets of the insurance industry 19 Figure C Government-issued LCY and FCY bonds 19 Figure D Total household debt 23 Figure E Debt participation by income quintile 23 Figure F Stylized “Minsky cycle” of the Financial Instability Hypothesis 25 Figure G Shoenmaker’s Financial Trilemma vs. Impossible Trinity 36
LIST OF TABLES
Table 2.1 IMF economic growth projections 13 Table 2.2 Gross domestic saving of top ten jurisdictions 15 Table 2.3 Portfolio investments of various jurisdictions by destination 15 Table 4.1 Nominal GDP of selected countries vs. ASEAN 32 Table 4.2 Gross domestic saving of selected regions 32 Table 4.3 Top intra-ASEAN trade by rank of commodity group 32 Table 4.4 Top extra-ASEAN trade by rank of commodity group 32 Table 4.5 IMF’s index for financial development, financial institutions 34
and financial markets Table 4.6 Value analysis of blockchain for investment banks 39 Table 4.7 Operational risks of fintech to financial stability 42 Table 4.8 Macrofinancial risks of fintech to financial stability 42
ii

2017 FINANCIAL STABILITY REPORT
Page 5
FINANCIAL STABILITY COORDINATION COUNCIL
LIST OF ACRONYMS, ABBREVIATIONS and SYMBOLS
ADB - Asian Development Bank AEC - ASEAN Economic Community AFC - Asian financial crisis AFIF - ASEAN Financial Integration Framework AFS - Available-for-sale AML - Anti-Money Laundering AMS - ASEAN Member States ASEAN - Association of Southeast Asian Nations ASEAN-5 - Indonesia, Malaysia, Philippines, Singapore, and Thailand BCLMV - Brunei, Cambodia, Lao PDR, Myanmar, and Vietnam BII - Borrowers’ Interconnectedness Index BIS - Bank for International Settlements BSP - Bangko Sentral ng Pilipinas BST - Black Swan Theory CET 1 - Common Equity Tier 1 CCyB - Countercyclical Capital Buffer CFS - Consumer Finance Survey CoVaR - Conditional Value-at-Risk CTF - Counter Terrorist Financing DEBT - Debt-to-Earnings-of-Borrowers’ Test DLT - Distributed ledger technology DOF - Department of Finance D-SIBs - Domestic Systemically Important Banks EU - European Union ESRB - European Systemic Risk Board FCY - Foreign currency FIES - Family Income and Expenditure Survey FIH - Financial Instability Hypothesis Fintech - Financial technology FMI - Financial market infrastructure FNA - Financial network analysis FPI - Foreign portfolio investment FSB - Financial Stability Board FSCC - Financial Stability Coordination Council FSD - Financial Surveillance Dashboard FSR - Financial Stability Report FX - Foreign exchange GDP - Gross domestic product GFC - Global financial crisis HFT - Held-for-trading HTM - Held-to-maturity IC - Insurance Commission IEC - Information-education-communication IDR - Indonesian rupiah ILBs - Inflation-Linked Bonds IMF - International Monetary Fund IT - Information technology LCY - Local currency
iii
2017 FINANCIAL STABILITY REPORT
Page 6
FINANCIAL STABILITY COORDINATION COUNCIL
MtM - Marked-to-market MOU - Memorandum of Understanding New ASEAN - Brunei, Cambodia, Lao PDR, Myanmar, and Vietnam NFCs - Non-financial corporations NPLs - Non-performing loans OFR - Office of Financial Research OSRM - Office of Systemic Risk Management PDIC - Philippine Deposit Insurance Corporation PHP - Philippine peso PMI - Purchasing Manager’s Index PSA - Philippine Statistics Authority PSE - Philippine Stock Exchange PwC - PricewaterhouseCoopers SEC - Securities and Exchange Commission SRC - Securities Regulation Code STRIPS - Separate Trading of Registered Interest and Principal of
Securities UITF - Unit investment trust fund UK - United Kingdom US - United States USD - US dollar US Fed - US Federal Reserve VCs - Virtual currencies WDI - World Development Indicator
iv

2017 FINANCIAL STABILITY REPORT
Page 7
FINANCIAL STABILITY COORDINATION COUNCIL
MESSAGE FROM THE BSP GOVERNOR and FSCC CHAIRMAN
he collective experience of the global economy with the financial crisis of 2008 has made the pursuit of financial stability a compelling policy objective. Yet as much as
financial stability has become the central message among standard-setting institutions and policymakers, its actual execution is a distinct challenge for financial authorities. This is so because the greatest lesson from the global financial crisis (GFC) is that our markets are defined by a complex web of linkages among markets, institutions, products, infrastructures, and agents. Yet, these linkages are not readily evident from available data which then hamper our appreciation of how risks are evolving.
The work of the Financial Stability Coordination Council (FSCC) is thus focused on the various aspects of interconnectedness. Our mindset is to recognize issues where the risks cut across the financial market as well as the real economy. As many scholars have pointed out, it is no longer sufficient that we ensure regulated financial institutions are individually strong and operate in a safe and sound manner. Instead, financial stability is achieved when we can effectively manage the amplifying effects of risks that run through a complex network of interconnected market agents and transactions.
This task is by no means trivial. This requires a more holistic view of markets and the use of newer analytical tools within significant data limitations. Nonetheless, one of the things apparent to policymakers is the vital role that communication plays in achieving financial stability. After all, a well-functioning financial market, which is the hallmark of financial stability, is not possible when stakeholders are not able to make informed choices. A key tool for communicating financial stability concerns is the dissemination of the Financial Stability Report (FSR) to a broad set of constituencies. The FSR should be able to objectively recognize where strengths have been gained and assess where vulnerabilities warrant attention. Aside from enhancing transparency, we view the FSR as an instrument for fostering coordinated action among financial regulators, the fiscal authority, the market, and the public. This ensures that financial stability is a collective responsibility. Understandably, data are a critical element of our work, ranging from the known-knowns to the unknown-unknowns. This presents a communication challenge when we deliver the financial stability message. In this context, the FSR is like completing a puzzle of thousand pieces. Some parts we know, some parts are still blank and the final view is the enigma that is financial stability.
This is also why our FSR is focused more on themes than a narrative of the situation from industry to industry. We see these “themes” as the key elements of the puzzle that could otherwise derail stability. In this 2017 FSR, we specifically focus on how the provision of products and services is affected by higher debt servicing amidst volatile market prices. We take the opportunity to discuss the financial stability aspects of financial technology (fintech) and the efforts towards regional integration. We offer some policies for consideration that can preempt the possible build up of systemic risks from these themes.
NESTOR A. ESPENILLA, JR.
BSP Governor and FSCC Chairman
v

2017 FINANCIAL STABILITY REPORT
Page 8
FINANCIAL STABILITY COORDINATION COUNCIL
Financial stability is achieved when the governance framework
of the market and its financial infrastructure enable and
ensure the smooth functioning of the financial system
conducive to sustainable and equitable economic growth.
– FSCC definition
vi

2017 FINANCIAL STABILITY REPORT
Page 1
FINANCIAL STABILITY COORDINATION COUNCIL
EXECUTIVE SUMMARY AND FINANCIAL STABILITY ASSESSMENT
t its core, financial stability is preemptive in nature because it needs to mitigate the build up of system-wide dislocations before these vulnerabilities take concrete form. With financial markets constantly evolving,
it is however not clear what past data can tell about future conditions. Adding another layer of complication is the fact that there are competing measures of systemic risk while a unique set of financial stability indicators has yet to be defined. These issues notwithstanding, financial stability is clearly understood to reflect a “well-functioning” financial market, addressing the financial needs of stakeholders and avoiding distortions. This view of the overall market will then require a holistic appreciation of the market situation in various segments of the market. Since these segments may be experiencing different pressure points, judgment is often essential in the overall assessment of systemic risks. This is the reason why the FSR focuses more on thematic topics. While the market landscape is a useful baseline, the focus is on risks and vulnerabilities that may derail further growth as well as raise issues that may potentially have systemic implications. The section on current risks shows how the outstanding debt level has grown rapidly, particularly in the post-GFC period. Whether the build up of debt is already an issue is still open for discussion. Yet, what is clear is that interest rates are rising and emerging market currencies have been depreciating versus the United States dollar (USD). These must mean that debt servicing is now at a higher cost than in the past, separate from the issue of having more outstanding debt. This is our central financial stability issue. The opportunity to discuss fintech and Association of Southeast Asian Nations (ASEAN) financial integration is taken. There is no doubt that fintech provides benefits over paper-based face-to-face transactions. This gain is especially of value to an economy such as the Philippines which is segregated both geographically and by demographic factors. Nevertheless, the assessment for fintech thus far has focused on micro risks, e.g., credit and liquidity, among others. The prevailing view is that its financial stability risks are limited, but this is also premised on the understanding that fintech remains a small portion of market activity. The intention is to allow fintech to develop further. One should be mindful of a key lesson from the GFC that systemic risks may arise from seemingly smaller shocks because accounting for the amplifying effects of interconnectedness was neglected. Regulatory sandboxes and constant dialogues among stakeholders are critical to ensure that one remains vigilant of the downside risks from the “disruptive” side of fintech. Similar to fintech, the business case is compelling for the integration of the financial markets among member states of the ASEAN. The region continues to outpace global growth, it saves at a higher rate than the rest of the world and it is home to a vast base of millennials who are tech-savvy and drive retail markets. With much of ASEAN’s savings actually deployed out of the region, financial integration should provide a better and more organized platform for retaining such savings and funding the region’s growth even more. Yet, higher levels of cross-border interconnectedness will also provide another possible venue for contagion risk. More generally, the previous works of Dani Rodrik and Dirk Schoenmaker, respectively, suggest that there may be trade-offs between sovereign policy, regional integration and financial stability. This section presents a discussion of the issues as it is certainly relevant to the current work of various committees on ASEAN integration. In an effort to be succinct and to present this FSR in a clear non-technical narrative, box articles are used to situate the relevant underlying concepts. Hyman Philip Minsky’s work is discussed to shed light on the

2017 FINANCIAL STABILITY REPORT
Page 2
FINANCIAL STABILITY COORDINATION COUNCIL
link between credit and long periods of stability. The Bangko Sentral ng Pilipinas’ (BSP) analysis of household debt is likewise included to give an added perspective beyond corporate exposures. Inputs from the Securities and Exchange Commission (SEC), Insurance Commission (IC) and Philippine Deposit Insurance Corporation (PDIC) are reflected in the box article on recent developments in the financial system while two other box articles – one on the Black Swan Theory (BST) of Nassim Nicholas Taleb and another on the lessons from the GFC – give added foundation to the nuances of financial stability analysis.
The key message of financial stability is that financial markets represent a complex network of interlinked agents and transactions. Keeping the financial market “well-functioning” requires that the risks arising from the interconnectedness are recognized and mitigated. Some of these linkages in this FSR are highlighted and this is evident in Figure 1.
The work that lies ahead is also highlighted. Part of this is generating better data and most likely, more granular information. The use of quantitative techniques and models to give a better handle of brewing risks is explored while the issues that need to be resolved through policy intervention are flagged. Interspersed throughout this FSR is the point that continuing communication with stakeholders is essential. On the whole, the state of the markets is much more dynamic than last year. The term VUCA1 – interestingly, originally a military terminology but has since been used in common parlance – epitomizes the collective view of the uncertainties. While there may not be any concrete indication yet of a systemic vulnerability in the Philippine financial system, one can reasonably argue that the components that build up into systemic risk are always present. One is well reminded that systemic risk refers to those risks to the system (introduced by external shocks or from financial institutions, payments and settlement systems, among others) as well as by the system itself (arising from the interaction among market agents). In this sense, the task is to make sure that those risk components do not comingle to a notable level that can trigger structural weaknesses. This is as good as any time for preemptive macroprudential policies to be considered.
1 volatile, uncertain, complex, and ambiguous.
Figure 1: Coverage of the 2017 FSR
Source: BSP Office of Systemic Risk Management (OSRM)
2017 FINANCIAL STABILITY REPORT
Page 3
FINANCIAL STABILITY COORDINATION COUNCIL
PURSUING FINANCIAL STABILITY IN THE PHILIPPINES
FSRs have been the main means of communicating the authorities’ assessment of the overall risks to the financial market. According to Born et. al. (2013), the central banks of England, Sweden and Norway began publishing their FSRs as early as 1996 while Correa et. al. (2017) noted that most jurisdictions began publishing around the turn of the millennium. Today, around 65 jurisdictions publish an FSR.
1.1. Financial stability as a collaborative and coordinated effort
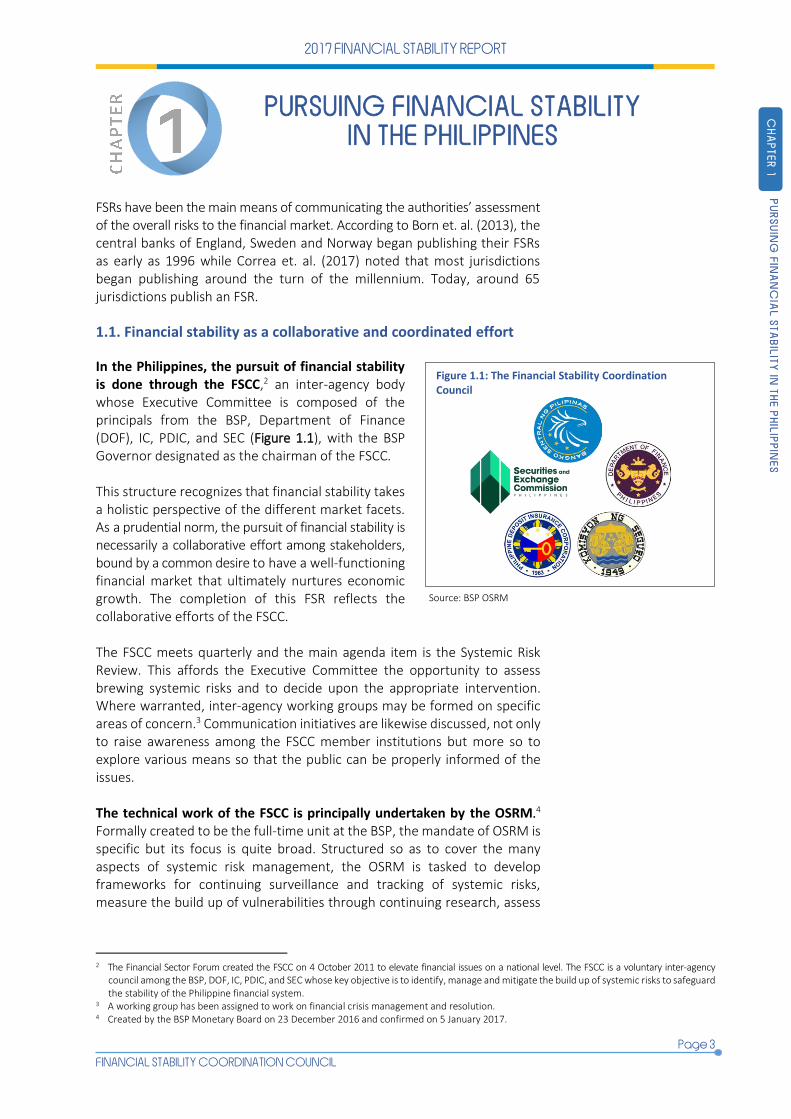
In the Philippines, the pursuit of financial stability is done through the FSCC,2 an inter-agency body whose Executive Committee is composed of the principals from the BSP, Department of Finance (DOF), IC, PDIC, and SEC (Figure 1.1), with the BSP Governor designated as the chairman of the FSCC. This structure recognizes that financial stability takes a holistic perspective of the different market facets. As a prudential norm, the pursuit of financial stability is necessarily a collaborative effort among stakeholders, bound by a common desire to have a well-functioning financial market that ultimately nurtures economic growth. The completion of this FSR reflects the collaborative efforts of the FSCC. The FSCC meets quarterly and the main agenda item is the Systemic Risk Review. This affords the Executive Committee the opportunity to assess brewing systemic risks and to decide upon the appropriate intervention. Where warranted, inter-agency working groups may be formed on specific areas of concern.3 Communication initiatives are likewise discussed, not only to raise awareness among the FSCC member institutions but more so to explore various means so that the public can be properly informed of the issues. The technical work of the FSCC is principally undertaken by the OSRM.4 Formally created to be the full-time unit at the BSP, the mandate of OSRM is specific but its focus is quite broad. Structured so as to cover the many aspects of systemic risk management, the OSRM is tasked to develop frameworks for continuing surveillance and tracking of systemic risks, measure the build up of vulnerabilities through continuing research, assess
2 The Financial Sector Forum created the FSCC on 4 October 2011 to elevate financial issues on a national level. The FSCC is a voluntary inter-agency
council among the BSP, DOF, IC, PDIC, and SEC whose key objective is to identify, manage and mitigate the build up of systemic risks to safeguard the stability of the Philippine financial system.
3 A working group has been assigned to work on financial crisis management and resolution. 4 Created by the BSP Monetary Board on 23 December 2016 and confirmed on 5 January 2017.
CH
AP
TE
R 1
P
UR
SU
ING
FIN
AN
CIA
L S
TA
BIL
ITY
IN T
HE
PH
ILIP
PIN
ES
Figure 1.1: The Financial Stability Coordination Council
Source: BSP OSRM

2017 FINANCIAL STABILITY REPORT
Page 4
FINANCIAL STABILITY COORDINATION COUNCIL
systemic implications of national, regional and global policy initiatives to the domestic financial system, and recommend and/or implement policy options, positions, communication plans, advocacy initiatives, and learning programs related to financial stability. The OSRM has also been designated to provide technical inputs and administrative support to the FSCC. The formulation of the Systemic Risk Review and any analysis of brewing issues in-between meetings are done by the OSRM. The interface with other agencies on FSCC-related initiatives, e.g., on real estate and debt issues among others, is likewise managed by the OSRM.
1.2. Foundations of systemic risk and financial stability
Pursuing a financial stability agenda is challenged by the lack of absolute standards. It may surprise many but there is, in fact, no single definition of “systemic risk” [see Office of Financial Research (OFR), 2012]. Although the term has been in common use, recent work (Zigrand, 2014) finds it necessary to define what comprises a “system” and what risks are relevant for this purpose. This is certainly material to the financial stability agenda which is anchored on mitigating the build up and emergence of systemic risk. Without a clear definition for the latter, it is not entirely unexpected that there is also no universal definition for “financial stability.” The rarity of financial crises of global proportions makes it challenging to establish standards that are more universal rather than to a specific market event. And with financial markets becoming much more complex and interconnected, systemic risks – however defined – could originate from different sources while a seemingly contained market dislocation could still escalate into a full-fledged crisis. Box Article 1 talks about expecting the unexpected under the BST. Nonetheless, while different jurisdictions have employed their own definition [Bank for International Settlements (BIS), 2009], there is unanimity on the need to heed the lessons from the GFC if one is to address identified gaps and anticipate possible future vulnerabilities, ensuring in the process that a safer and better financial market architecture was set. Authorities now accept that previous metrics of stability (i.e., low market volatility, rising asset prices) can cultivate instability in the future.5 Box Article 2 further discusses key lessons from the GFC.
A key lesson from the crisis is that the interconnectedness of financial market elements can amplify the build up of systemic risks once a shock is introduced. This lesson reflects several critical ideas. First, there is a fallacy of composition because the “health” of the system relies not only on individually strong financial institutions but also on the linkages between the financial institutions. Market dominance may arise because some institutions are more efficient or better positioned than others but this situation could also magnify the distribution of any ill effects if there is a shock at these dominant institutions. This is the basic reason why the global
5 See for example Danielsson, Valenzuala and Zer (2018).

2017 FINANCIAL STABILITY REPORT
Page 5
FINANCIAL STABILITY COORDINATION COUNCIL
Financial history shows that surprises are inherently normal. On the upside, it has driven innovation and development of financial systems. Recently, the use of technology in banking is becoming more pervasive and may even be called a fundamental necessity to compete in today’s digitally-connected environment. Attendant to the digitization of finance is the emergence of new financial products, services and delivery channels which allow market players to take advantage of new avenues of growth.
However, the evolution of the finance industry is identical to the emergence of new risks and payoff structures. This box article highlights the need for preemptive policy action in pursuit of financial stability despite incomplete and imperfect data. Underlying concepts in the Black Swan Theory
The BST by Nassim Nicholas Taleb (2010) focuses on atypical events called black swans that have three distinguishing characteristics:
1. rarity – observed data do not show the possibility of its occurrence; 2. high impact; and 3. retrospective predictability – the event is determined to be conspicuous after it happened.
The BST is anchored on the problem of induction, where judgment is based on assumptions derived from historical accounts. The “shock” therefore is relative to the “inductivists’” expectations. The BST argues that the “inductivists” inappropriately extend what they see to what they cannot see since there is no reliable past information to anchor future expectations. By doing so, “inductivists” assume that risk is reasonably ascertained by the available historical accounts. This process underestimates randomness and overestimates the power of quantitative modelling and therefore creates a false sense of security. Where risk is unidentified and uncertain, it is referred to as “unknown unknowns” and is a critical consideration in financial stability analysis. The BST offers a systematic view of risk and payoff structures as an attempt to set limits to what is both unknown and consequential. Under this risk and payoff structures, black swans refer to those with risks that are generally unknown and unpredictable with a potential for large consequences. The black swan domain is particularly important in financial stability analysis where data gaps are more common rather than exception, which magnify the problem of connecting invisible dots on the build up and transmission of systemic risks. From a financial stability perspective, the recognition of black swans emphasizes the importance of understanding the comingling of risks. Aggregate or system-wide risk is not merely the sum of individual risks. This interdependence of risks is consistent with the BSP’s view of financial stability which treats comingled risks as the object of possible systemic risks. Such comingling of risks emphasizes the need to understand how risks cut across financial and real sectors and how retail transactions can contribute to the build up of systemic vulnerabilities. Precautionary principle: When to take action
Precaution is important when evidence-based analysis does not hint of black swans. The “unknowability, uncertainty and unpredictability” (Taleb et. al., 2014) of black swans imply that policy actions have to rely more on the analytical than the empirical, more so when it comes to systemic risk. Since the financial system is a social franchise that delivers a public good to the broader economy, the precautionary principle suggests that policy action may be taken on the grounds of social responsibility even though empirical support may be lacking (Taleb et. al., 2014). This is particularly true in the pursuit of financial stability because one should expect data to be incomplete or missing but such limitation should not prevent preemptive financial stability analysis. Takeaways for financial stability work
In summary, two main points are raised in this box article. One has to accept that the information relevant to the pursuit of financial stability will always be incomplete and imperfect. Insightful analysis, market intelligen ce and judgment calls are staple in the conduct of systemic risk assessments. With respect to financial stability work, preemptive policy action is a key element. Regulators have to accept that policy actions related to mitigating the build up of systemic risk may have to rely more on the analytical than the empirical.
BOX ARTICLE 1 The black swan and the limits of decision theory

2017 FINANCIAL STABILITY REPORT
Page 6
FINANCIAL STABILITY COORDINATION COUNCIL
standards for banking impose a capital surcharge on banks which are deemed to be “systemically important.” Second, small effects can eventually create large consequences because of the way market agents are interconnected. Referred to as the Butterfly Effect,6 seemingly small and contained shocks can escalate into systemic dislocations because the effects can spillover from institution to institution and from market to market. This is more evident in the financial market because it is a network of crisscrossing time-sensitive transactions, suggesting that vulnerabilities will require remedying a thread of complex interlinked financial transactions. This is also a useful reminder that systemic risk is not about the scale of the initial shock or of the vulnerable institution, but rather how the shock can eventually create system-wide dislocations.
It is important to appreciate that interconnectedness itself is not automatically the concern, i.e., a more interconnected market is not necessarily worse than a less interconnected market. The issue is how the network of connections are structured. This is so because the linkages (i.e., the distribution and dispersion) within a network define the channels where risks work themselves through the network and how these risks can “comingle” to create other risks (Figure 1.2).
Such “comingling” of risks is nurtured by the way market players interact in a financial system. This is the third point relative to interconnectedness. It suggests that systemic risks arise because of the way the system itself is structured and not just because there is an external force that has introduced a shock. In economic language, the former is referred to as “endogenous risks” (i.e., literally within the system) as opposed to the latter which are “exogenous risks.” Rather than viewing systemic risk as something that is caused by an external force such as natural or man-made disasters, endogenous risk is “based on the idea that everything that takes place in a financial system is
caused by the interaction of all the players in the market, whether financial institutions, traders, regulators or policymakers, who are all pursuing their own objectives.”7 The way these individual economic agents react to particular events potentially creates a vicious cycle of reactions and feedback that eventually leads into a crisis. This is a critical element of the financial stability agenda because one can, conceptually, alter the way the system is structured to mitigate internally-driven risks, but external shocks are not typically within one’s control.
Financial stability may be the current focus but it is actually an older concept. While much of what one focuses on today in the financial stability sphere is the result of the GFC, one should also not lose sight of the fact that its defining principles were outlined even before the mortgage meltdown that instigated the 2008-2009 global recession.
6 The Butterfly Effect is the idea that small things can have non-linear impacts, i.e., the flap of a butterfly’s wings may cause a tornado. 7 As described by the Systemic Risk Centre. Retrieved on 31 May 2018 from http://www.systemicrisk.ac.uk/endogenous-risk.
Figure 1.2: Comingling of risks
Source: BSP OSRM

2017 FINANCIAL STABILITY REPORT
Page 7
FINANCIAL STABILITY COORDINATION COUNCIL
Specifically, the seminal work of Schinasi (2004) identifies five key principles of financial stability:
a. The core of financial stability is a smooth-functioning financial system that allocates resources and transparently prices financial risks.
b. Financial stability encompasses the different aspects of finance and of the financial system and must require an overlying governance framework among stakeholders as well as the smooth functioning of payment systems throughout the economy.
c. Financial stability entails surveillance, analysis, policy, and communication that prevent the build up of systemic risks and initiate remedial actions when such risks materialize.
d. Decisive to a financial stability framework is a clear understanding that financial stability is not only defined by the extent of the potential impact. Specifically, a disturbance in any component of the financial system is not a threat to financial stability if there is no expected damage to the real economy.
e. A critical point is that financial stability is not a stationary and static state that can be defined by absolute parameters. Instead, it occurs along a continuum so that the same conditions may either be more or less stable at different points in time.
Stated differently, financial stability covers (Houben et. al., 2004):
“… all (of these) sources of risks and vulnerabilities, which require systematic monitoring of individual parts of the financial system (financial markets, institutions and infrastructure) and the real economy (households, firms and the public sector). The analysis must also take into account cross-sector and cross-border linkages because imbalances often arise due to a combination of weaknesses from different sources.”
The above statement takes a nuanced view. While it promotes monitoring the individual parts of the financial system, it does not overlook the importance of and the risks that may arise from their linkages. It is thus not surprising that the post-GFC global reform agenda strengthen individual financial institutions while other reform components are directed at enhancing the financial system. Invariably, the lesson from the GFC was that the understanding of macrofinancial markets and the linkages between agents were not aligned with the risks that arose out of the financial system. Change became necessary, not only to respond to the vulnerabilities that became apparent, but more so because the approach towards market governance was outmoded by the complexity of the markets that one operates in. This explains why the reforms are not “tweaks” of the old system but rather an extensive remodeling of the underlying financial market architecture. It would be difficult – and unwise – to try to separate the reforms to institutions from the reforms of the system. After all, as Zigrand (2014) noted, “systemic risk comprises the risk to the proper functioning of the system as
2017 FINANCIAL STABILITY REPORT
Page 8
FINANCIAL STABILITY COORDINATION COUNCIL
well as the risk created by the system.” The first part can be thought of as pertaining to the institutions and the auxiliary support mechanisms (such as payments and settlements systems, and consumer protection mechanisms). It would be difficult to imagine how a system can be strong if the component institutions and/or auxiliary support mechanisms are deemed to be weak. Yet, as argued above, the converse – strong institutions and stable support mechanisms necessarily leading to strong system – is not a given. This is the point of the second portion of the quote from Zigrand, that is, the system can generate risks once the endogenous interactions work themselves throughout the system. From the perspective of the financial stability agenda, the distinction between microprudential and macroprudential may not be as clean and binding. Both are relevant to mitigating the build up of systemic risk and this speaks of the necessary collaboration between financial authorities on one hand, and between the financial authorities and the financial stability authority on the other hand. 1.3. The FSCC’s approach to financial stability and its reform
agenda
The FSCC’s approach towards financial stability takes into consideration all of the above. The FSCC recognizes that there is no universal definition either for systemic risk or for financial stability. Yet, this does not detract from the FSCC’s view that a state of financial stability must require that the financial system is “performing well” and that this, in turn, contributes to further economic expansion. Taking the interaction among agents as a broad reflection of market governance, the FSCC operates on the formal definition: “Financial stability is achieved when the governance
framework of the market and its financial infrastructure enable and ensure the smooth functioning of the financial system conducive to sustainable and equitable economic growth.”
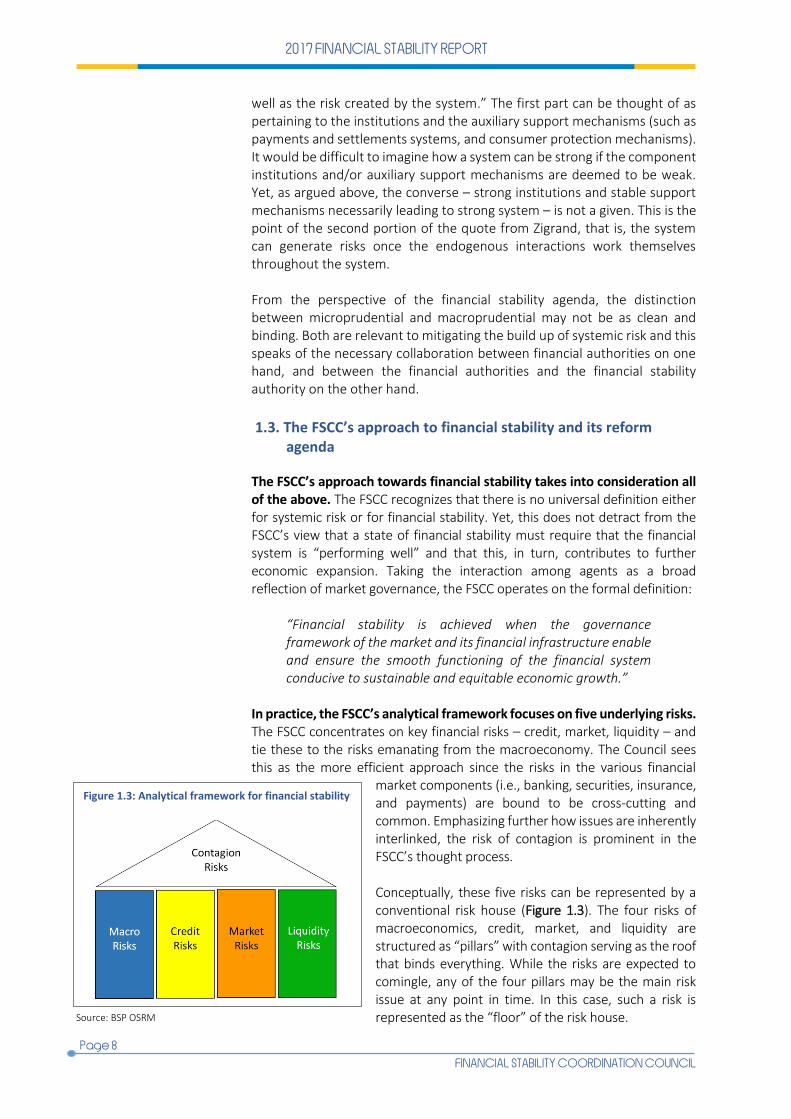
In practice, the FSCC’s analytical framework focuses on five underlying risks. The FSCC concentrates on key financial risks – credit, market, liquidity – and tie these to the risks emanating from the macroeconomy. The Council sees this as the more efficient approach since the risks in the various financial
market components (i.e., banking, securities, insurance, and payments) are bound to be cross-cutting and common. Emphasizing further how issues are inherently interlinked, the risk of contagion is prominent in the FSCC’s thought process. Conceptually, these five risks can be represented by a conventional risk house (Figure 1.3). The four risks of macroeconomics, credit, market, and liquidity are structured as “pillars” with contagion serving as the roof that binds everything. While the risks are expected to comingle, any of the four pillars may be the main risk issue at any point in time. In this case, such a risk is represented as the “floor” of the risk house.
Figure 1.3: Analytical framework for financial stability
Source: BSP OSRM
2017 FINANCIAL STABILITY REPORT
Page 9
FINANCIAL STABILITY COORDINATION COUNCIL
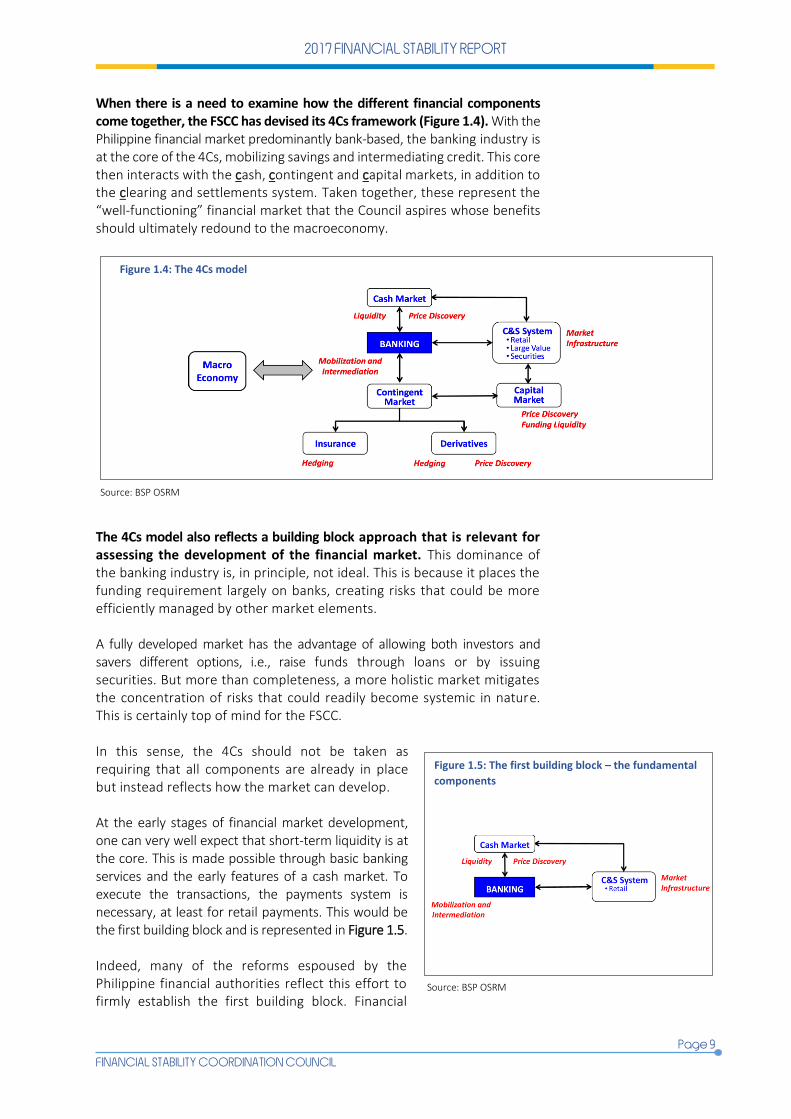
When there is a need to examine how the different financial components come together, the FSCC has devised its 4Cs framework (Figure 1.4). With the Philippine financial market predominantly bank-based, the banking industry is at the core of the 4Cs, mobilizing savings and intermediating credit. This core then interacts with the cash, contingent and capital markets, in addition to the clearing and settlements system. Taken together, these represent the “well-functioning” financial market that the Council aspires whose benefits should ultimately redound to the macroeconomy.
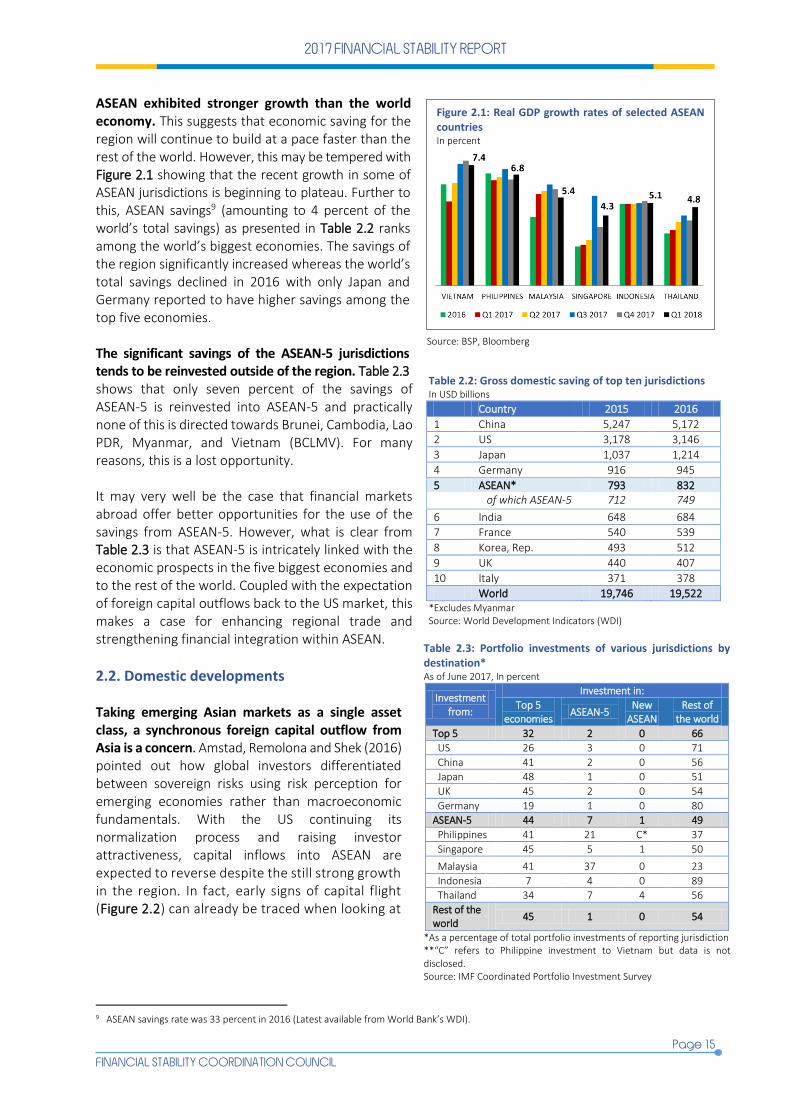
The 4Cs model also reflects a building block approach that is relevant for assessing the development of the financial market. This dominance of the banking industry is, in principle, not ideal. This is because it places the funding requirement largely on banks, creating risks that could be more efficiently managed by other market elements. A fully developed market has the advantage of allowing both investors and savers different options, i.e., raise funds through loans or by issuing securities. But more than completeness, a more holistic market mitigates the concentration of risks that could readily become systemic in nature. This is certainly top of mind for the FSCC. In this sense, the 4Cs should not be taken as requiring that all components are already in place but instead reflects how the market can develop. At the early stages of financial market development, one can very well expect that short-term liquidity is at the core. This is made possible through basic banking services and the early features of a cash market. To execute the transactions, the payments system is necessary, at least for retail payments. This would be the first building block and is represented in Figure 1.5. Indeed, many of the reforms espoused by the Philippine financial authorities reflect this effort to firmly establish the first building block. Financial
Figure 1.5: The first building block – the fundamental
components
Source: BSP OSRM
Source: BSP OSRM
Figure 1.4: The 4Cs model

2017 FINANCIAL STABILITY REPORT
Page 10
FINANCIAL STABILITY COORDINATION COUNCIL
inclusion provides to a wider scope of constituents better and more efficient access to liquidity. The reform of the National Retail Payment System can be seen streamlining the payments system, specifically moving the economy from cash-based transactions to the more risk-efficient electronic means of settlement and transfer.
As the economy further develops, the need for long-term funding becomes more urgent. In practice, banks can provide this even though much of their funding comes from short-term funds. This creates a clear and present danger for banks – taking on short-term callable liabilities that would be otherwise extinguished by long-term illiquid assets. This is where the development of both the capital market and the clearing and settlement systems becomes highly relevant. Schematically, this is represented in Figure 1.6. Several ongoing reforms reflect the FSCC’s efforts consistent with the second building block. Fundamental developments in the capital market are already unfolding. From institutionalizing depth and liquidity in the government securities market to price transparency, these reforms are meant to further develop a holistic market and, correspondingly, spread the underlying risks. A Payment Systems Act is likewise being considered by Congress. As these risks are fully scoped, hedging facilities are essential. This is the third building block (Figure 1.7) which focuses on the contingent markets. Physical risks (insurance) and financial risks (hedging and derivatives) can be better managed by specialist institutions. This is a necessary support mechanism in a healthy financial system. On the whole, the FSCC takes a holistic view of risks that can pose systemic dislocations but is also pragmatic in the timing and sequencing of its reform initiatives.
Figure 1.6: The second building block – from short-
term to long-term financing
Source: BSP OSRM
Figure 1.7: The third building block – developing
contingent markets
Source: BSP OSRM

2017 FINANCIAL STABILITY REPORT
Page 11
FINANCIAL STABILITY COORDINATION COUNCIL
The difficulties in the United States (US) mortgage market quickly escalated into a worldwide distress that was simply referred to as the GFC. Given the “surprise” nature of the GFC, standard-setting bodies, multilateral agencies and other various institutions were quickly thrust into asking what went wrong, and from there, defining the reform agenda, both to further stabilize the markets and prevent the next global crisis. This box article presents two of the critical lessons from the GFC to provide important insights on how the market has been reshaped by reforms and how policymakers now view market oversight as an input to the pursuit of financial stability.
On interconnectedness
The significance of interconnectedness in amplifying crises was well discussed in economics even before the breakout of the GFC. In the aftermath of the Asian financial crisis (AFC), financial liberalization was argued to have played a critical role in amplifying the fragilities of domestic financial systems (Montes, 1998, and Kumar and Debroy, 1999). In the new millennium, financial integration further expanded through increased capital account openness as well as intensified trade interconnectedness that lengthened global supply chains and made production processes more closely integrated. According to Claessens et. al. (2010), while financial integration fostered global risk sharing, competition and efficiency, the increased cross-border exposures also caused highly correlated risks among economies. The heightened interconnectedness in the financial system was also due to financial innovation. An example would be the dramatic growth of the derivatives market in the years prior to the GFC. Because derivative instruments “derive” value from other assets, their very nature creates a ripple effect of shocks to underlying instruments. The increased interconnectedness that developed over the years alongside globalization and innovation built amplifying mechanisms, the strength of which in exacerbating booms and busts was underestimated (Dudley, 2009). This implies that regulation and risk management practices that focus on silos or individual fragments of the system would not be able to address the vulnerabilities of the entire system. The fallacy of composition
Towards the end of 2008 and early 2009, precautionary behavior in households resulted in reduced private consumption and increased saving. In isolation, that may be viewed as a reasonable individual household response to an ongoing crisis. Widespread precautionary saving behavior, however, aggravated the situation by amplifying the transmission of shocks both at the domestic and international levels. This micro-macro fallacy is analogous to banking system supervision in the run-up to the GFC. Hanson, Kasyap and Stein (2011) offered a specific example in the context of capital regulation. As they see it, raising the required capital adequacy ratios, while improving individual bank resiliency, may increase the vulnerability of the system if many banks reduce lending to shrink assets instead of raising new equity, resulting in a credit crunch.
Another factor that increases system-level vulnerability is the presence and concentration of common exposures among banks. For instance, if credit is commonly exposed to, and heavily concentrated in the real estate sector, shocks to this sector may result in simultaneous failures of the exposed banking institutions. There is also empirical evidence suggesting that shocks from parent banks are transmitted to foreign subsidiaries (Jeon et. al., 2012). The way forward
The GFC emphasized that there are significant gaps in the understanding of markets and the handling of financial risks. This is principally why there is specific emphasis on the surveillance and mitigation of systemic risks well before there are concrete signs of market failure. This systemic view encompasses “stand-alone” risks but more so those risks that “comingle.” This aggregate and cross-cutting view of potential vulnerabilities, the specific path that risks take when evolving as well as the challenges with data now represent the norm for prudential oversight of the system. Such should be the fundamental considerations in the design and implementation of policies with financial stability implications.
BOX ARTICLE 2 Some lessons from the GFC

2017 FINANCIAL STABILITY REPORT
Page 12
FINANCIAL STABILITY COORDINATION COUNCIL

2017 FINANCIAL STABILITY REPORT
Page 13
FINANCIAL STABILITY COORDINATION COUNCIL
GLOBAL AND DOMESTIC DEVELOPMENTS
The GFC revealed how regulatory frameworks and policy approaches existing at that time either overlooked or underestimated the build up of systemic vulnerabilities amid seemingly sound financial institutions and relatively strong macroeconomic fundamentals. This gave impetus to a “new normal” in central banking, where the agenda for global reforms has “financial stability” at the center stage. As mentioned in Chapter 1, there is now greater recognition that “systemic-ness” is not an issue of scale but of interconnectedness. Monitoring the possible emergence of systemic risks therefore requires recognizing how the parts and pieces of the financial system come together and not just evaluating each component on its own. In the context of the latest global and domestic developments, this chapter focuses on global growth and how relevant it is to the domestic economy, capital flows and how it affects the financial markets, and financial prices and how these reflect risks. The chapter also includes Box Article 3 which discusses the current condition of the Philippine financial system.
2.1. Global and regional developments Recent estimates showed continued global growth. Table 2.1 presents the growth projections for 2018 and 2019 based on the International Monetary Fund (IMF) World Economic Outlook (July 2018), where the higher world growth is largely dependent on the five biggest economies [i.e., US, China, Japan, Germany, and the United Kingdom (UK)]. Challenges, however, may be looming over the near term. The latest FSRs of several jurisdictions have suggested that the key risks include elevated sovereign debt levels, global repricing of risk premia, constrained debt servicing capacity of households and corporates, reversal of foreign capital flows, volatilities in financial markets, and the new challenges brought on by fintech. Moreover, the five biggest economies, which account for roughly half of the projected global growth, have on their own well-documented domestic challenges so that overall risks appear to be generally skewed to the upside. Specifically, the following issues pose challenges to growth forecasts and thus, warrant close monitoring:
Table 2.1: IMF economic growth projections In percent
Actual Growth projections
2016
January 2018 July 2018
2017 2018 2019 2018 2019
World 3.2 3.7 3.9 3.9 3.9 3.9
Big five economies
US 1.5 2.3 2.7 2.5 2.9 2.7
China 6.7 6.9 6.6 6.4 6.6 6.4
Japan 1.0 1.7 1.2 0.9 1.0 0.9
Germany 1.9 2.5 2.3 2.0 2.2 2.1
UK 1.8 1.7 1.5 1.5 1.4 1.5
Euro area 1.8 2.4 2.2 2.0 2.2 1.9
ASEAN
ASEAN-5* 4.9 5.3 5.3 5.3 5.3 5.3
Singapore 2.0 3.6 n.a. n.a. n.a. n.a. *The IMF defined ASEAN-5 to include Indonesia, Malaysia, Philippines, Thailand, and Vietnam.
CH
AP
TE
R 2
G
LO
BA
L A
ND
DO
ME
ST
IC D
EV
EL
OP
ME
NT
S

2017 FINANCIAL STABILITY REPORT
Page 14
FINANCIAL STABILITY COORDINATION COUNCIL
The higher growth projection for the US is largely due to changes in its fiscal policy [i.e., tax cuts and an almost USD300 billion increase in federal spending (Cowan and Becker, 2018)]. While fiscal expansion is seen to boost growth in the short-term, a larger federal budget deficit in the long-term will exert upward pressures on both prices and interest rates.
As the US remains influential in the global financial markets, developments in the US monetary policy stance are likely to be felt across the globe. Already, the US Federal Reserve (US Fed) is expected to further make two more rate hikes in 2018. This would trigger a rebalancing towards the US dollar, both as a matter of economic strength and because of a safe haven herd-like behavior8 in global investments.
China’s transition towards an economy that is driven by services and consumption is a tricky balance between deleveraging and avoiding a sharp economic slowdown. Fears of a trade war with the US are rekindled after the US took back its announcement of putting on hold tariffs on Chinese imports. With the US planning to impose 25 percent tariffs on USD50 billion worth of Chinese exports, China threatened to retaliate with tariffs on USD50 billion worth of US exports (Chandran, 2018). Also, a recent corporate default highlights the growing refinancing risks in China as USD2.7 trillion of its USD4 trillion bond market is set to mature over the next five years.
First quarter economic figures reveal slower-than-expected growth across Europe. Germany’s growth, in particular, slowed from the previous quarter’s 0.6 percent to 0.3 percent due to a decline in government spending and trade (Nienaber, 2018). Meanwhile, recent estimates of the cost of the Brexit show that the UK may be economically worse off. The risk of not reaching an agreement with the European Union (EU) puts a strain on UK’s major sectors in terms of trade. Without an open trade and investment agreement with the EU, the UK faces the risk of being subject to the rules of the World Trade Organization, which is relatively costlier than the UK’s present trade scenario.
Growth estimates for Japan is a concern as the country’s gross domestic product (GDP) is found to have shrunk by 0.2 percent (Baird, 2018), substantiating the IMF’s weaker growth forecast for 2018. The inflation rate dropped from 1.1 percent to 0.6 percent in April (way below its 2 percent target), which shifted the view of the market that the Bank of Japan will begin to normalize its monetary policy.
8 Herd behavior manifests when people follow the actions or decisions of others instead of using their own information or making independent
decisions. An example of which is the herd behavior of investors that lead to the stock market bubbles (Banerjoe, 1992).
2017 FINANCIAL STABILITY REPORT
Page 15
FINANCIAL STABILITY COORDINATION COUNCIL
ASEAN exhibited stronger growth than the world economy. This suggests that economic saving for the region will continue to build at a pace faster than the rest of the world. However, this may be tempered with Figure 2.1 showing that the recent growth in some of ASEAN jurisdictions is beginning to plateau. Further to this, ASEAN savings9 (amounting to 4 percent of the world’s total savings) as presented in Table 2.2 ranks among the world’s biggest economies. The savings of the region significantly increased whereas the world’s total savings declined in 2016 with only Japan and Germany reported to have higher savings among the top five economies. The significant savings of the ASEAN-5 jurisdictions tends to be reinvested outside of the region. Table 2.3 shows that only seven percent of the savings of ASEAN-5 is reinvested into ASEAN-5 and practically none of this is directed towards Brunei, Cambodia, Lao PDR, Myanmar, and Vietnam (BCLMV). For many reasons, this is a lost opportunity. It may very well be the case that financial markets abroad offer better opportunities for the use of the savings from ASEAN-5. However, what is clear from Table 2.3 is that ASEAN-5 is intricately linked with the economic prospects in the five biggest economies and to the rest of the world. Coupled with the expectation of foreign capital outflows back to the US market, this makes a case for enhancing regional trade and strengthening financial integration within ASEAN.
2.2. Domestic developments Taking emerging Asian markets as a single asset class, a synchronous foreign capital outflow from Asia is a concern. Amstad, Remolona and Shek (2016) pointed out how global investors differentiated between sovereign risks using risk perception for emerging economies rather than macroeconomic fundamentals. With the US continuing its normalization process and raising investor attractiveness, capital inflows into ASEAN are expected to reverse despite the still strong growth in the region. In fact, early signs of capital flight (Figure 2.2) can already be traced when looking at
9 ASEAN savings rate was 33 percent in 2016 (Latest available from World Bank’s WDI).
Table 2.2: Gross domestic saving of top ten jurisdictions In USD billions
Country 2015 2016
1 China 5,247 5,172
2 US 3,178 3,146
3 Japan 1,037 1,214
4 Germany 916 945
5 ASEAN* 793 832 of which ASEAN-5 712 749
6 India 648 684
7 France 540 539
8 Korea, Rep. 493 512
9 UK 440 407
10 Italy 371 378
World 19,746 19,522 *Excludes Myanmar Source: World Development Indicators (WDI)
Source: BSP, Bloomberg
Figure 2.1: Real GDP growth rates of selected ASEAN countries In percent
Table 2.3: Portfolio investments of various jurisdictions by destination* As of June 2017, In percent
Investment from:
Investment in:
Top 5 economies
ASEAN-5 New
ASEAN Rest of
the world
Top 5 32 2 0 66
US 26 3 0 71
China 41 2 0 56
Japan 48 1 0 51
UK 45 2 0 54
Germany 19 1 0 80
ASEAN-5 44 7 1 49
Philippines 41 21 C* 37
Singapore 45 5 1 50
Malaysia 41 37 0 23
Indonesia 7 4 0 89
Thailand 34 7 4 56
Rest of the world
45 1 0 54
*As a percentage of total portfolio investments of reporting jurisdiction **“C” refers to Philippine investment to Vietnam but data is not disclosed. Source: IMF Coordinated Portfolio Investment Survey

2017 FINANCIAL STABILITY REPORT
Page 16
FINANCIAL STABILITY COORDINATION COUNCIL
BSP-registered foreign portfolio investments (FPIs). Peso depreciation, in part, can be attributed to outflows in both stocks and government securities as new supply of foreign currency in the economy declines. From January 2017 to May 2018, BSP-registered FPIs recorded a cumulative inflow of USD617 million. This may be misleading because this is largely due to an inflow of USD1,250 million in peso-denominated debt instruments in March 2018 alone. In fact, cumulative net outflows in investments in the Philippine Stock Exchange (PSE) amounted to USD839 million while investments in government securities registered net inflows of only USD155 million, which would amount to a net outflow of USD684 million. Taking out the March 2018 figure, FPIs would have instead registered a cumulative net outflow of about USD633 million, with the difference of about USD51 million due to the 2017 net inflow of peso-denominated debt instruments, unit investment trust fund (UITF) and peso time deposits with at least 90 days of tenor. Further to this, capital outflows are reflected in the Philippine stock market. Figure 2.3 shows that the PSE composite index experienced a drop from its peak in end-January 2018. This downturn is not unique to the Philippines as other stock market indices have also declined. Meanwhile, Figure 2.4 shows volatility in the local equities market as the average true range exhibited an increasing trend with more pronounced swings at the intervals and having steep ascents as well as shorter and sharper downturns. This implies greater losses as abrupt declines become more frequent. In addition, trading of government securities has also decelerated. Figure 2.5 shows latest data from the Philippine Dealing & Exchange Corp. (PDEx) where trade volumes have stayed depressed since October 2017 (with the exception of January 2018). The normalization of the monetary stance in the US has significantly affected the Indonesian rupiah (IDR) and the Philippine peso (PHP). Figure 2.6 shows that both the PHP/USD and IDR/USD currency pairs began depreciating in the early part of 2018. Capital outflows, as earlier discussed, have contributed to the peso depreciation. This is also the case for Indonesia as
Figure 2.3: Stock market indices of selected Asian countries January 2017 = 1
Source: Bloomberg
Figure 2.2: Cumulative foreign portfolio flows In USD millions
*Includes other peso-denominated debt instruments. Peso time deposits with at least 90 days tenor and UITF Source: BSP website
Figure 2.4: Average true range* of PSE index
*The true range for a day is defined as the greatest of the three values: (1) current high less current low; (2) previous close less current low; or (3) current high less previous close. Source: Bloomberg

2017 FINANCIAL STABILITY REPORT
Page 17
FINANCIAL STABILITY COORDINATION COUNCIL
Bloomberg10 reported that global funds have dumped a net of USD2.3 billion of the country’s sovereign bonds while shares experienced a rout of USD1.2 billion. In addition, renewed fears of a trade war shift investor sentiment away from emerging markets and this is reflected in the declining stock indices in Figure 2.3. The above developments also manifest in the apparently more volatile movements in 2018 for most ASEAN-5 countries (Figure 2.7). Secondary market rates are clearly rising . Several ASEAN countries (i.e., Malaysia, Singapore and most recently, the Philippines and Indonesia11) have tightened their own monetary stance following the increase in the US Fed’s policy rate. This marks the seventh increase since December 2015.12 The market view is that the US Fed is not yet done with raising rates, with at least two more rate hikes expected within 2018.
10 Suhartono and Carson (May 2018). 11 The Bank of Indonesia raised rates on 17 May 2018 and again in an out-of-cycle meeting on 30 May 2018. 12 First increase was on 16 December 2015, second on 14 December 2016, third on 15 March 2017, fourth on 14 June 2017, fifth on 13 December
2017, sixth on 21 March 2018, and seventh on 14 June 2018.
Figure 2.6: Spot exchange rates of ASEAN currencies January 2017 as base period
Figure 2.5: PDEx trade volume In PHP billions
Source: Bloomberg
Figure 2.7: Volatilities of selected ASEAN currencies Against USD*
*The daily volatility is computed as the 10-day rolling standard deviation of ln 𝑓𝑥 𝑟𝑎𝑡𝑒𝑡 𝑓𝑥 𝑟𝑎𝑡𝑒𝑡−1 . Source: Bloomberg and OSRM staff computation
Source: BSP
Figure 2.8: Overnight Reference Rate In percent
Source: Bloomberg
2017 FINANCIAL STABILITY REPORT
Page 18
FINANCIAL STABILITY COORDINATION COUNCIL
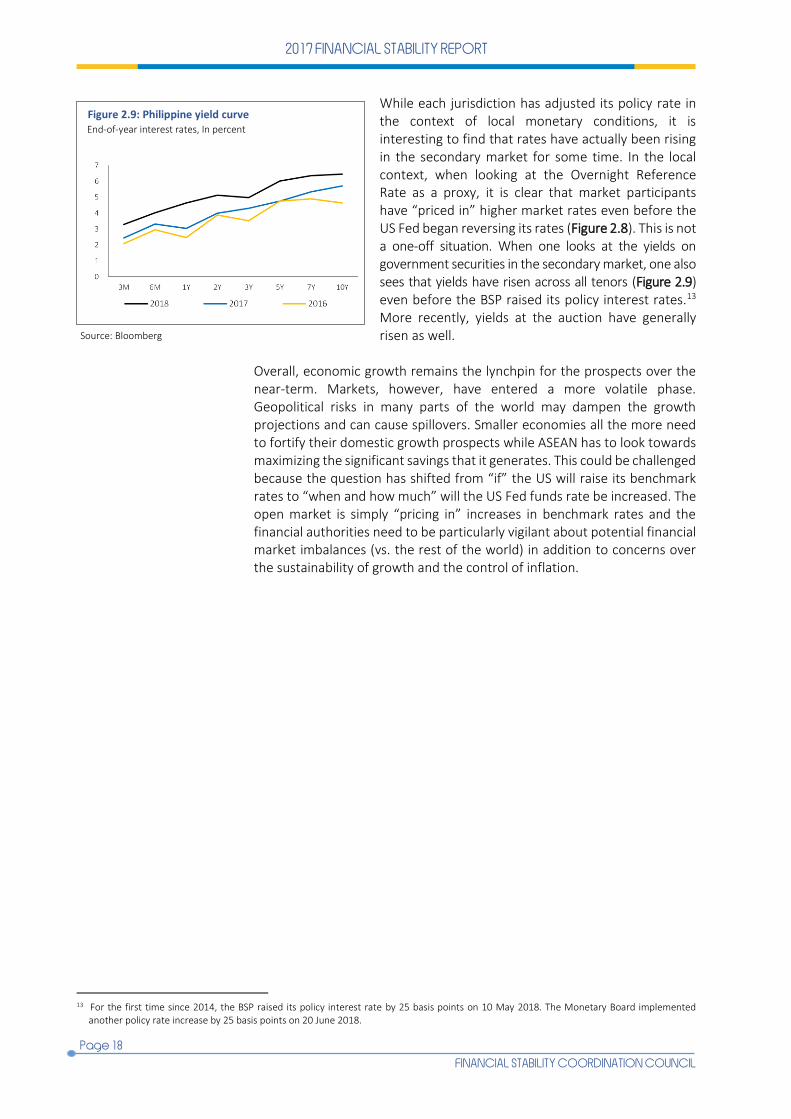
While each jurisdiction has adjusted its policy rate in the context of local monetary conditions, it is interesting to find that rates have actually been rising in the secondary market for some time. In the local context, when looking at the Overnight Reference Rate as a proxy, it is clear that market participants have “priced in” higher market rates even before the US Fed began reversing its rates (Figure 2.8). This is not a one-off situation. When one looks at the yields on government securities in the secondary market, one also sees that yields have risen across all tenors (Figure 2.9) even before the BSP raised its policy interest rates.13 More recently, yields at the auction have generally risen as well.
Overall, economic growth remains the lynchpin for the prospects over the near-term. Markets, however, have entered a more volatile phase. Geopolitical risks in many parts of the world may dampen the growth projections and can cause spillovers. Smaller economies all the more need to fortify their domestic growth prospects while ASEAN has to look towards maximizing the significant savings that it generates. This could be challenged because the question has shifted from “if” the US will raise its benchmark rates to “when and how much” will the US Fed funds rate be increased. The open market is simply “pricing in” increases in benchmark rates and the financial authorities need to be particularly vigilant about potential financial market imbalances (vs. the rest of the world) in addition to concerns over the sustainability of growth and the control of inflation.
13 For the first time since 2014, the BSP raised its policy interest rate by 25 basis points on 10 May 2018. The Monetary Board implemented
another policy rate increase by 25 basis points on 20 June 2018.
Source: Bloomberg
Figure 2.9: Philippine yield curve End-of-year interest rates, In percent

2017 FINANCIAL STABILITY REPORT
Page 19
FINANCIAL STABILITY COORDINATION COUNCIL
The Philippine financial system continues to experience growth against a backdrop of strengthening domestic economy. Political reforms, i.e., tax reforms and greater infrastructure spending, are projected to drive the domestic growth in 2018 as these lead to higher spending by both the government and households. The domestic economy is also seen to gain from the momentum of global economic recovery, based on the upward revisions of growth projections by third party analysts. However, despite the positive outlook for the Philippines, there are internal and external developments that pose downside risks to the domestic financial system. This box article gives an overview of the current condition of the Philippine financial system.14 It discusses the initiatives being pursued by the four regulatory agencies (BSP, IC, PDIC, and SEC) to maintain the smooth functioning of the financial system, in support of the country’s economic performance.
Signs of growth in the domestic market
In recent years, growth in financial intermediation is observed in the three major segments of the Philippine financial system. The Philippine banking system has been consistently posting double-digit asset growth since January 2016. Latest data show that total resources of the banking system amounted to PHP15.3 trillion as of end-March 2018, an 11.3 percent increase from the previous year’s level of PHP13.8 trillion. This asset growth trend is mirrored by the growth in liabilities (Figure A). Meanwhile, total assets of the insurance industry more than doubled from 2008 to 2016. Although there was a two-year slowdown after 2013, the growth rebounded in 2016, posting an 11.2 percent increase (Figure B). Moreover, there has been a steady increase in the industry’s revenues relative to GDP after the GFC, with a break in the year proceeding typhoon Yolanda in 2013. The life insurance segment continues to be the driver of the insurance companies’ revenues. The securities market has also exhibited growth. The bond market, in particular, is comprised mostly of peso-denominated government issued securities, to which outstanding amount as of end-March 2018 grew by 7.1 percent to reach USD117.2 billion (Figure C). The equities market, on the other hand, registered 12 additional companies with the PSE in the past three years, bringing the total listed companies to 268, equivalent to PHP17.31 trillion market capitalization as of end-October 2017.
Regulatory landscape
Alignment with global standards
The BSP has released Circular No. 975 in October 2017 to streamline the requirements on the issuance of bonds and commercial papers by banks and quasi-banks and Circular Nos. 984 and 985 in December 2017 in furtherance of liberalizing the foreign exchange (FX) regulatory
14 This box article benefitted from the contributions of the IC, PDIC and SEC.
BOX ARTICLE 3 The evolving Philippine financial system
Source: IC
Source: BSP website
Source: Asian Bonds Online
0%
3%
6%
9%
12%
15%
18%
0
200
400
600
800
1,000
1,200
1,400
Volume (LHS) YoY Growth (RHS)
Figure B: Total assets of the insurance industryIn PHP billions

2017 FINANCIAL STABILITY REPORT
Page 20
FINANCIAL STABILITY COORDINATION COUNCIL
framework. It has also set the target to 01 September 2018 for banks to comply with the revised rules on liquidity risk management anchored on the Principles for Sound Liquidity Risk Management and Supervision under the Basel III reform agenda. A key priority of the IC is the adoption of international reporting practices. The IC is preparing for the implementation of the Philippine Financial Reporting Standards by the Financial Reporting Standards Council that will be applied to insurance companies. For subsidiaries and branches of Global Systemically Important Insurers operating in the Philippines, the IC requires keeping reserves to pay policyholders in the event of insolvency and has set the guidelines for the orderly acquisition, merger, consolidation, sale of insurance portfolio, and exit from the domestic insurance business should another financial crisis global in scale triggers a sell-off. The SEC has been proposing amendments to the Securities Regulation Code (SRC) and the Corporation Code as well as supporting the bills on regulating Collective Investment Schemes to enhance local regulations and conform to international best practices. Considering the rising popularity of cryptocurrency, the SEC is also studying the ideal regulatory treatment of virtual currencies (VCs) from the perspective of investor protection. For internet-based scams, the SEC coordinates with the Philippine National Police and the National Bureau of Investigation which possess the resources and expertise to assist in the investigation of cybercrimes committed by online organizations. For its part, the PDIC has entered into a cross-border partnership by way of a Memorandum of Understanding (MOU) with eight deposit insurance agencies from Asia, the UK and the US. The MOU fosters enhanced cooperation through exchange of information, prompt response to technical inquiries, effective support for exchange of experts and staff, conduct of bilateral meetings, and other collaborations to the extent permitted by each country’s laws, rules and regulations. Deepening capital markets
Various financial products have been introduced to the different segments of the domestic market aimed at providing alternative options for raising funds or for investing money. These include (1) dollar -denominated securities, (2) exchange-traded funds, (3) green bonds (upcoming), (4) Personal Equity and Retirement Account, (5) PHP government fund forward, (6) public-private partnership shares, and (7) real estate investment trust. Furthermore, the SEC has initiated reforms on minimum public ownership, repurchase agreements and shelf registration that underscore the need for improved liquidity in the market and the importance of price discovery. The SEC is also finalizing its rules governing the crowdfunding market. Meanwhile, the BSP, Bureau of the Treasury and SEC, with the support of the DOF, rolled out in August 2017 the roadmap to accelerate the development of the Philippine debt market. The three agencies, which comprise the Capital Market Working Group, agreed to prioritize deepening of the local bond market, creating reliable financial benchmarks and valuation of financial instruments, and establishing an integrated financial market infrastructure (FMI). Strengthening surveillance
The BSP has recently completed the requirements of becoming a BIS-reporting country. This will allow access to detailed information on cross-border exposures of other countries to the Philippines. The BSP through the FSCC has also initiated collaborations with the Housing and Land Use Regulatory Board to develop a maiden reportorial template targeted to real estate companies. To further its conduct of surveillance and understanding of the underlying developments in the insurance industry, the IC is in the process of building a database from the quarterly reports required from insurance companies and developing analytical tools for data mining purposes. Currently, the SEC is proposing the creation of a unit for handling the rules, regulations, policies, and guidelines concerning anti-money laundering (AML) and counter terrorist financing (CTF) for covered entities. With the implementation of the 2015 Revised Implementing Rules and Regulations of the SRC, the SEC intends to amend and update its guidelines on the preparation of the AML manual of covered entities. Additionally, the SEC aims to prepare an audit plan and program regarding the conduct of regular audits on covered entities, focusing on the compliance with AML/CTF requirements.

2017 FINANCIAL STABILITY REPORT
Page 21
FINANCIAL STABILITY COORDINATION COUNCIL
CURRENT RISKS IN THE FINANCIAL SYSTEM
Repricing, refinancing and repayment risks (3Rs)
Several jurisdictions have pointed to various sources of risks that heighten financial stability concerns. The normalization of US monetary policy creates the incentive for global capital flows to be directed towards the US, affecting asset and currency prices along the way. A slowdown in global growth and deceleration of international trade will undermine the growth of many economies. Higher debt levels across countries will continue to leave economies vulnerable to the changes in the growth outlook and the (continuing) rise in interest rates. The risks flagged by other jurisdictions highlight the fact that global developments largely affect the domestic economies. The impact, however, is much more significant for a small and open economy such as the Philippines which is a price taker, rather than a price setter. As discussed in Chapter 2, there are risks with rising Philippine interest rates and a local currency (LCY) that continues to depreciate against the US dollar. Drivers of growth are shifting from quarter to quarter and the authorities need to be cognizant of the factors that could derail the growth momentum. All of these market changes have to be understood in the context of repricing, refinancing and repayment risks.
3.1. Developments in the credit market Local intermediation continues to be peso-funded but with some support from foreign currency (FCY) sources. The total loan portfolio of the banking system increased significantly over the years (Figure 3.1) and is principally funded by peso deposits. Looking at the spot and forward rates in the currency and interest rate markets, the incentive would have been to borrow in Philippine peso and to invest these in US dollar instruments. Yet, this is not the case and instead, banks have increased their FCY debts to augment the growth in domestic currency loans (Figure 3.2). This can be validated in Figure 3.3 which shows that borrowings of Philippine banks from BIS-reporting
CH
AP
TE
R 3
C
UR
RE
NT
RIS
KS
IN T
HE
FIN
AN
CIA
L S
YS
TE
M
Source: BSP website
Figure 3.1: Total loan portfolio In PHP billions
*Includes peso account and regular banking unit and excludes FCDU Source: Financial Reporting Package
Figure 3.2: Banks’ sources and uses of funds* For the one year period Dec 2016 to Dec 2017, In PHP billions
Source: BIS
Figure 3.3: Foreign borrowings of Philippine banks In USD billions
2017 FINANCIAL STABILITY REPORT
Page 22
FINANCIAL STABILITY COORDINATION COUNCIL
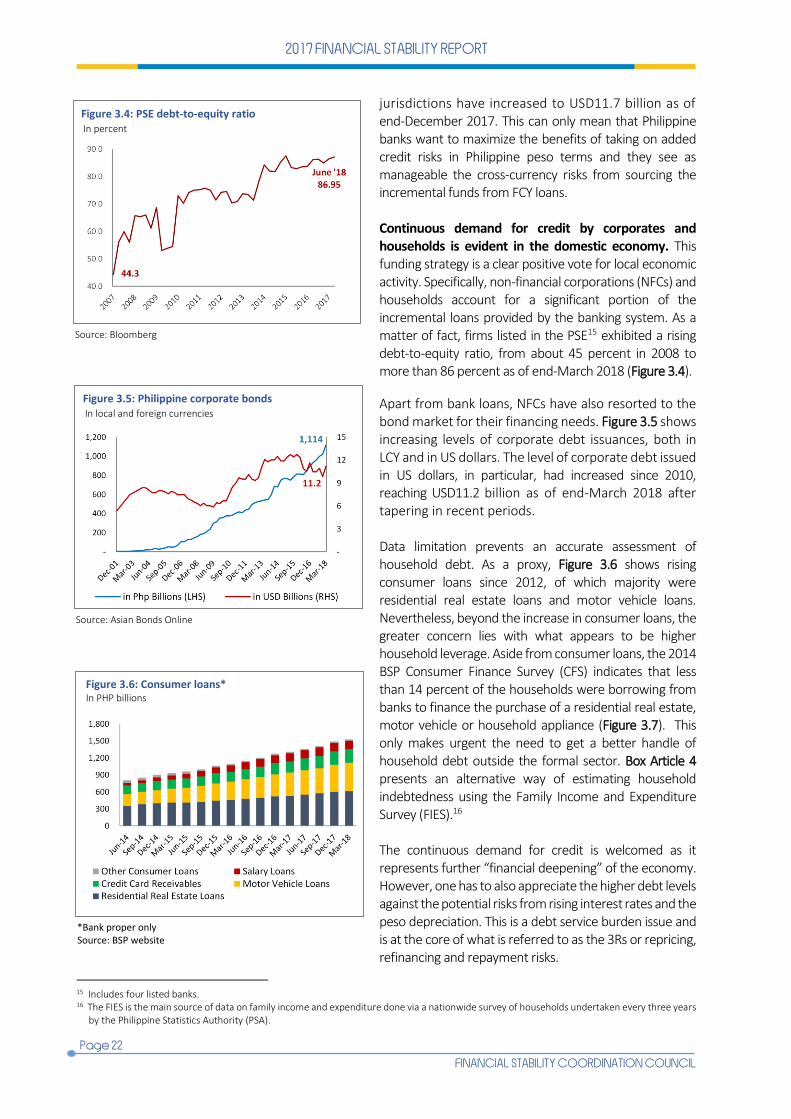
jurisdictions have increased to USD11.7 billion as of end-December 2017. This can only mean that Philippine banks want to maximize the benefits of taking on added credit risks in Philippine peso terms and they see as manageable the cross-currency risks from sourcing the incremental funds from FCY loans. Continuous demand for credit by corporates and households is evident in the domestic economy. This funding strategy is a clear positive vote for local economic activity. Specifically, non-financial corporations (NFCs) and households account for a significant portion of the incremental loans provided by the banking system. As a matter of fact, firms listed in the PSE15 exhibited a rising debt-to-equity ratio, from about 45 percent in 2008 to more than 86 percent as of end-March 2018 (Figure 3.4).
Apart from bank loans, NFCs have also resorted to the bond market for their financing needs. Figure 3.5 shows increasing levels of corporate debt issuances, both in LCY and in US dollars. The level of corporate debt issued in US dollars, in particular, had increased since 2010, reaching USD11.2 billion as of end-March 2018 after tapering in recent periods. Data limitation prevents an accurate assessment of household debt. As a proxy, Figure 3.6 shows rising consumer loans since 2012, of which majority were residential real estate loans and motor vehicle loans. Nevertheless, beyond the increase in consumer loans, the greater concern lies with what appears to be higher household leverage. Aside from consumer loans, the 2014 BSP Consumer Finance Survey (CFS) indicates that less than 14 percent of the households were borrowing from banks to finance the purchase of a residential real estate, motor vehicle or household appliance (Figure 3.7). This only makes urgent the need to get a better handle of household debt outside the formal sector. Box Article 4 presents an alternative way of estimating household indebtedness using the Family Income and Expenditure Survey (FIES).16 The continuous demand for credit is welcomed as it represents further “financial deepening” of the economy. However, one has to also appreciate the higher debt levels against the potential risks from rising interest rates and the peso depreciation. This is a debt service burden issue and is at the core of what is referred to as the 3Rs or repricing, refinancing and repayment risks.
15 Includes four listed banks. 16 The FIES is the main source of data on family income and expenditure done via a nationwide survey of households undertaken every three years
by the Philippine Statistics Authority (PSA).
Source: Bloomberg
Figure 3.4: PSE debt-to-equity ratio In percent
Source: Asian Bonds Online
Figure 3.5: Philippine corporate bonds In local and foreign currencies
*Bank proper only Source: BSP website
Figure 3.6: Consumer loans* In PHP billions

2017 FINANCIAL STABILITY REPORT
Page 23
FINANCIAL STABILITY COORDINATION COUNCIL
Consumer loan data from the banking sector are usually employed as proxy for household debt. The 2014 CFS, however, indicated that less than 14 percent of Philippine households sourced their debt from the formal sector. With the majority of households obtaining debt from the informal sector, there is impetus for financial stability policymakers to find alternative (and more credible) sources of household credit information. This box article will provide a complementary view of the household debt situation in the Philippines through the information obtained from the FIES. In particular, it represents stylized facts of the debt dynamics of indebted households. Insights from the FIES
Household indebtedness, derived from the expenditure accounts of FIES, is relatively low at PHP185 billion or 8.4 percent of indebted households’ income (Figure D). Household indebtedness is also growing at a moderately steady pace of around 6.5 percent annually. Notwithstanding the seemingly low degree of household indebtedness, the FIES data also indicate a close to zero financial margin (i.e., the residual income after accounting for debt servicing and living cost expenses) for a significant portion of the households. This implies low annual savings and difficulty in making ends meet (Persson, 2009). In 2015, around 20.6 percent of indebted households have negative to zero financial margins while an additional 11.7 percent have financial margins of less than PHP10,000. Thin financial margins of indebted households suggest vulnerability to tighter financing conditions and increased likelihood of default. Another noteworthy result from the FIES is that the second most accessible debt to households, next to cash loans, are loans granted to persons outside the family. These types of loan, which can be considered as debt sourced from informal markets, are prevalent in the portfolio of lower income households. Given thin financial margins of this household segment, creditors are exposed to counterparty payment default risk. More affluent households, on the other hand, had higher exposures to more expensive long-term debt, such as real estate and vehicle loans. These loans make them more vulnerable to movements in interest and FX rates, and are thus, subject to higher repayment, refinancing and repricing risks.
A decomposition of debt data among income quintiles showed that more affluent households (i.e., fifth quintile) had higher debt participation and, as anticipated, higher average debt compared to their counterparts (Figure E). Said biased access poses a measurement challenge in capturing total household debt since the underrepresentation of wealthy households in the FIES sampling design results in underestimation of household expenditures and debt. Addressing data gaps on household debt
While the FIES offers an alternative glimpse of the country’s household debt profile, additional information is required to more accurately capture the financial vulnerabilities of households. The conduct of a survey formulated to estimate household indebtedness is needed for a better appreciation of the current debt dynamics. The enhanced data would allow for a balance sheet approach analysis. The design of the new survey should incorporate improvements over the observed weaknesses of the FIES such as including wealthier households in the sample.
BOX ARTICLE 4 Household debt: estimating indebtedness through the FIES data
Source: PSA and OSRM staff computations
Source: PSA and OSRM staff computations

2017 FINANCIAL STABILITY REPORT
Page 24
FINANCIAL STABILITY COORDINATION COUNCIL
3.2. Impact of changing market prices The low interest rate environment greatly encouraged the search for yield as greater risks were taken in exchange for higher returns. However, the change in market prices (i.e., rising interest rates and depreciating peso against the US dollar) could trigger negative outcomes which, if not properly addressed, would amplify into systemic consequences. Banks face marked-to-market (MtM) losses from rising interest rates. Higher market rates affect trading since existing holders of tradable securities are taking MtM losses as a result. While some banks have resorted to reclassifying their available-for-sale (AFS) securities into held-to-maturity (HTM), some PHP845.8 billion in AFS (as of end-March 2018) are still subject to MtM losses (Figure 3.8). Furthermore, the shift to HTM would take away market liquidity since these securities could no longer be traded prior to their maturity. The higher debt levels must now be managed against rising interest rates and peso depreciation. Several studies17 suggest that higher levels of debt relative to economic output generally leave the financial system to be more vulnerable. In particular, debt servicing capacity of highly leveraged borrowers becomes progressively more sensitive to drops in income and sales as well as increases in interest rates. For a given shock, higher debt could result in a higher probability of default. As deleveraging starts to unfold, consumption and investment fall, ultimately affecting economic growth (Cecchetti et. al., 2011). Box Article 5, meanwhile, provides a discussion of how Hyman Philip Minsky argued that a long period of economic growth could translate into unsustainable leverage for overly optimistic borrowers. The concern on the sustainability of debt is magnified by the increasing level of delinquent loans. The non-performing loans (NPLs) level of the banking system was generally declining at the onset of the GFC but has increased since late 2015 (Figure 3.9). The rising amount of NPLs does not, however, suggest that the credit market is already at the point of imminent collapse. Instead, it is simply pointing out that classifying an account as “non-performing” is already an ex post facto indicator of a borrower’s payment capacity which could eventually weigh on the balance sheet of lending banks, the magnitude of which is unknown in advance.
17 Dell’Ariccia, Igan and Laeven (2012),IMF (2011) and Schularick and Taylor (2012).
Figure 3.7: Providers of household loans Percent share of survey respondents
Source: 2014 CFS
Source: BSP FSD
Figure 3.8: Banking system’s investment accounts In PHP billions
Source: BSP
Figure 3.9: Non-performing loans In PHP billions
Source: FRP

2017 FINANCIAL STABILITY REPORT
Page 25
FINANCIAL STABILITY COORDINATION COUNCIL
Hyman Philip Minsky’s name resounded among both policymakers and academicians in the aftermath of the GFC. To understand the posthumous accolade given to Minsky and his seminal work (Minsky, 1992) on the Financial Instability Hypothesis (FIH), this box article demonstrates the important points of the FIH and discusses the policy insights that can be drawn from it. The extended work by Alessandro Vercelli (2009) is used as an example that bridges Minsky’s qualitative theoretical model and characteristics of real-life financial crises such as the GFC.18 Minsky’s theory on instability
The FIH argues that a stable economy experiencing a protracted period of economic growth will eventually transit to being comprised of financial relations that make for an unstable system. This is so because economic agents become (overly) optimistic about profitability being assured by the prolonged economic growth. This sense of security encourages them to engage more and more in debt financing as well as in speculative investments. Their increasing leverage eventually becomes unsustainable and affects the viability of investments, causing their optimism to turn into pessimism and loss of confidence. What follows is a vicious cycle of deleveraging, falling asset prices and drying up of the credit market. (Figure F).
Vercelli’s extension
According to Vercelli, an economy undergoes a financial cycle. To illustrate, an economy where most financial units are highly liquid is used as a starting point. As the economy grows, these financial units invest their cash in risky assets to increase their profitability and also start borrowing money to finance their investments. Gambling on the future, they continue to increase their exposure and invest in riskier assets, heightening their risk of becoming insolvent. At this point, financial units are in a predicament: any shock to the economy may force them to declare bankruptcy. Thus, they begin to deleverage and reduce the risk of insolvency. They continue doing so until they succeed in rebuilding excess cash inflows. The improved liquidity position will encourage financial units to invest their cash holdings in risky assets, triggering a new financial cycle. An economy is said to be undergoing a Minsky process when the aggregate cash outflows exceeds aggregate cash inflows and financial units are at risk of becoming insolvent. The starting point of a Minsky process is called a Minsky moment. Instability in the economy
When the economy experiences periods of prolonged growth, financial units significantly improve their expectations and reduce their perception of risk. At some point, some of these financial units are pushed to insolvency and become highly distressed and have an excessive perception of risk. They start deleveraging simultaneously to improve their position. But such herd-like behavior reduces asset prices, causing them to deleverage further at prices far below the fair market value. The economy was initially stable but the heightened vulnerability of financial units to insolvency drives the economy to instability. A Minsky meltdown ensues unless authorities intervene to arrest a chain reaction of financial units going bankrupt rapidly. Concluding remarks
Several prominent decision-makers have referred to the GFC as a Minsky meltdown. That reference signals a shift in the way regulators view economic prosperity and crisis episodes. Monitoring potential sources of systemic risk is now a key component of major central banks across the globe. Post-GFC, the reality is that the Minsky framework can be used for contemporaneous policy issues.
18 There are other schools of thought that offer insights on the GFC, one of which is the Austrian School that is extensively discussed in the work
by Van den Hauwe (2014).
BOX ARTICLE 5 Understanding crisis episodes through the eyes of Minsky and Vercelli
Source: European Systemic Risk Board’s (ESRB) presentation on Contracts and Systemic Risks in Europe by L. Amorello (2016)
Figure F: Stylized “Minsky cycle” of the Financial
Instability Hypothesis

2017 FINANCIAL STABILITY REPORT
Page 26
FINANCIAL STABILITY COORDINATION COUNCIL
The banking system, as the principal provider of credit in the economy, indeed, is the most vulnerable to the potential default of borrowers. While the actual impact is yet to be assessed due to absence of granular information on borrowers’ income and the resulting debt servicing capacity, this warrants possible preemptive intervention given that market conditions tilt the risks to the upside.
NFCs have brought down their USD borrowings but bank borrowings have pushed up overall debt. While the USD debt of NFCs has actually tapered to USD17.1 billion at the end of 2017 (Figure 3.10), the higher USD borrowings of banks effectively raise the overall debt servicing of Philippine corporates. This is not an immediate concern and depends on the deployment of the funds. However, unless the borrowers are generating USD incomes sufficient to cover debt servicing, on balance, the higher overall debt puts pressure on USD liquidity in the country.
Concentration of credit to specific sectors amplifies credit concerns. As of end-March 2018, about 60 percent
of loans were extended to five of the 21 economic activities, i.e., Real Estate Activities; Electricity, Gas, Steam and Air-Conditioning Supply; Loans for Household Consumption; Wholesale and Retail Trade; and Manufacturing (Figure 3.11). While there is recognition that outstanding balances across economic activities continue to expand, this fairly heavy concentration makes the banking system prone to risks that could influence the five economic activities. This is a concern because, already, it is noted that four of these economic sectors (except for Electricity, Gas, Steam and Air-Conditioning Supply) account for almost 70 percent of the NPLs of the banking system.
Particularly for the real estate industry, balance sheet data of major real estate developers19 show a collective increase in real estate inventories since 2013 (Figure 3.12). Colliers International Philippines Research has reported that there is an expected additional supply in the different
19 Based on the annual consolidated audited financial statements of 19 major Philippine listed real estate companies from 2013 to 2017.
Source: BIS
Figure 3.10: Cross-border claims on NFCs and banks In USD billions
Figure 3.11: Top five recipients of incremental loans (by economic activity) In PHP billions
Source: BSP website
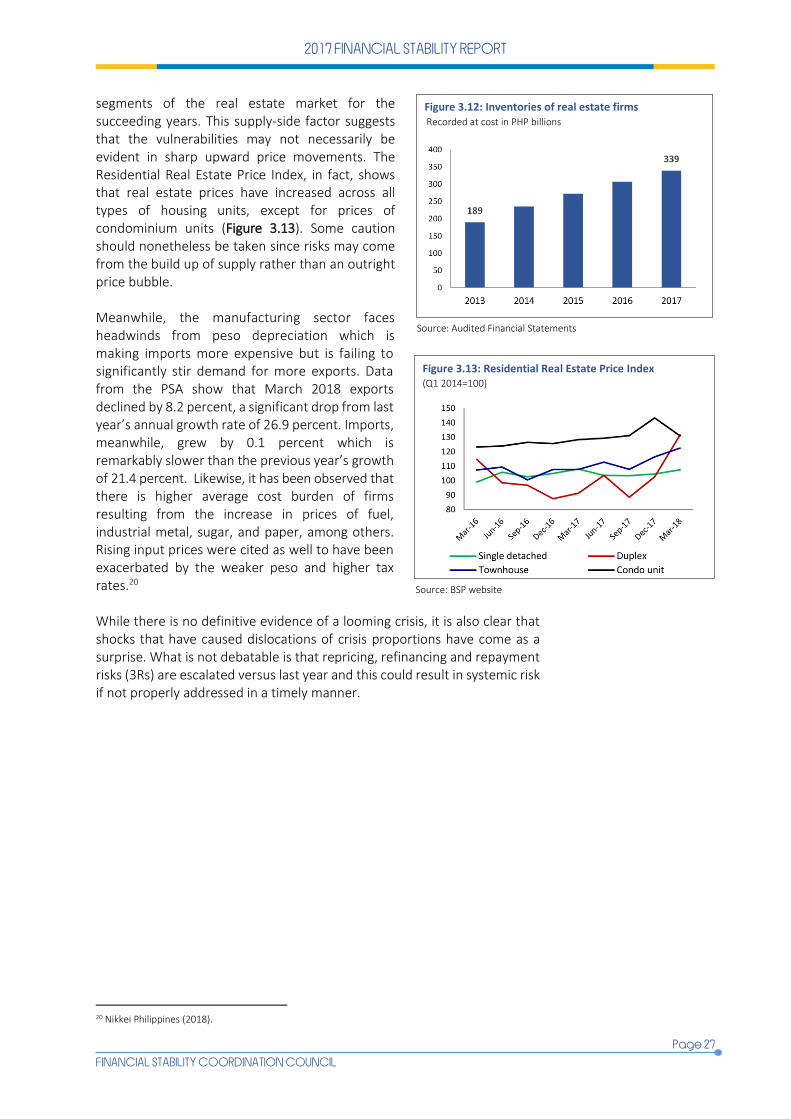
2017 FINANCIAL STABILITY REPORT
Page 27
FINANCIAL STABILITY COORDINATION COUNCIL
segments of the real estate market for the succeeding years. This supply-side factor suggests that the vulnerabilities may not necessarily be evident in sharp upward price movements. The Residential Real Estate Price Index, in fact, shows that real estate prices have increased across all types of housing units, except for prices of condominium units (Figure 3.13). Some caution should nonetheless be taken since risks may come from the build up of supply rather than an outright price bubble. Meanwhile, the manufacturing sector faces headwinds from peso depreciation which is making imports more expensive but is failing to significantly stir demand for more exports. Data from the PSA show that March 2018 exports declined by 8.2 percent, a significant drop from last year’s annual growth rate of 26.9 percent. Imports, meanwhile, grew by 0.1 percent which is remarkably slower than the previous year’s growth of 21.4 percent. Likewise, it has been observed that there is higher average cost burden of firms resulting from the increase in prices of fuel, industrial metal, sugar, and paper, among others. Rising input prices were cited as well to have been exacerbated by the weaker peso and higher tax rates.20 While there is no definitive evidence of a looming crisis, it is also clear that shocks that have caused dislocations of crisis proportions have come as a surprise. What is not debatable is that repricing, refinancing and repayment risks (3Rs) are escalated versus last year and this could result in systemic risk if not properly addressed in a timely manner.
20 Nikkei Philippines (2018).
Source: Audited Financial Statements
Figure 3.12: Inventories of real estate firms Recorded at cost in PHP billions
Source: BSP website
Figure 3.13: Residential Real Estate Price Index (Q1 2014=100)

2017 FINANCIAL STABILITY REPORT
Page 28
FINANCIAL STABILITY COORDINATION COUNCIL
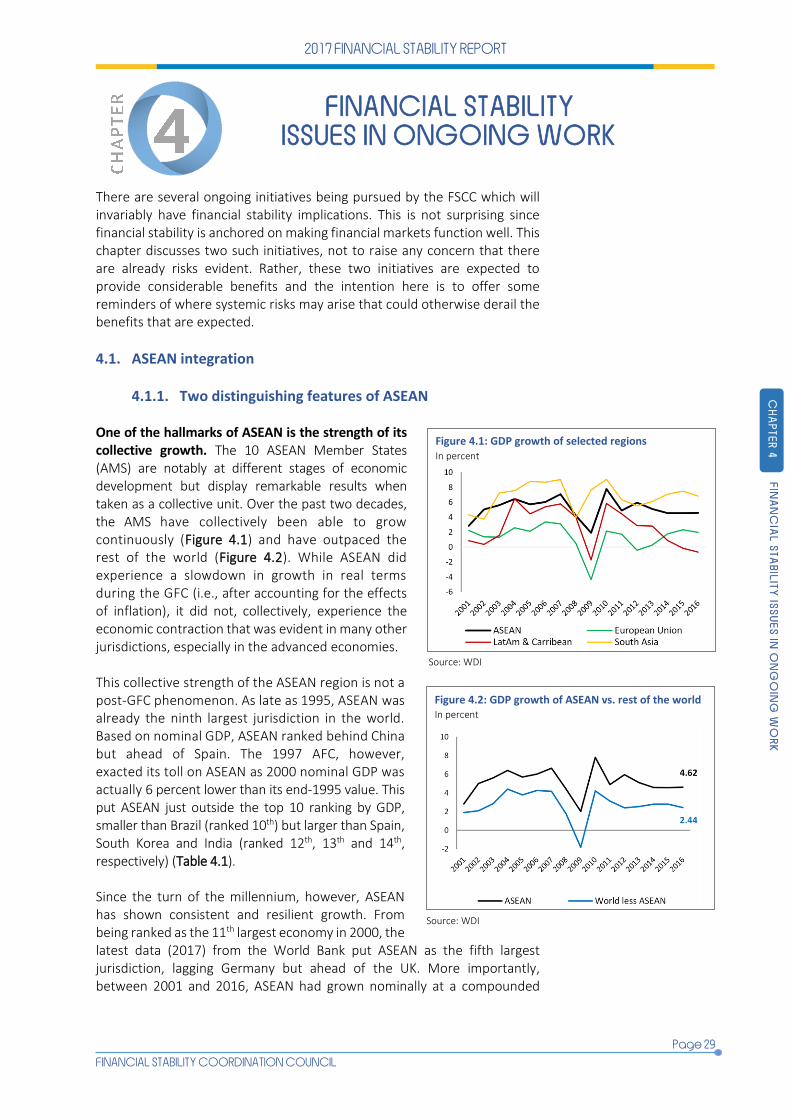
2017 FINANCIAL STABILITY REPORT
Page 29
FINANCIAL STABILITY COORDINATION COUNCIL
FINANCIAL STABILITY ISSUES IN ONGOING WORK
There are several ongoing initiatives being pursued by the FSCC which will invariably have financial stability implications. This is not surprising since financial stability is anchored on making financial markets function well. This chapter discusses two such initiatives, not to raise any concern that there are already risks evident. Rather, these two initiatives are expected to provide considerable benefits and the intention here is to offer some reminders of where systemic risks may arise that could otherwise derail the benefits that are expected.
4.1. ASEAN integration
4.1.1. Two distinguishing features of ASEAN One of the hallmarks of ASEAN is the strength of its collective growth. The 10 ASEAN Member States (AMS) are notably at different stages of economic development but display remarkable results when taken as a collective unit. Over the past two decades, the AMS have collectively been able to grow continuously (Figure 4.1) and have outpaced the rest of the world (Figure 4.2). While ASEAN did experience a slowdown in growth in real terms during the GFC (i.e., after accounting for the effects of inflation), it did not, collectively, experience the economic contraction that was evident in many other jurisdictions, especially in the advanced economies. This collective strength of the ASEAN region is not a post-GFC phenomenon. As late as 1995, ASEAN was already the ninth largest jurisdiction in the world. Based on nominal GDP, ASEAN ranked behind China but ahead of Spain. The 1997 AFC, however, exacted its toll on ASEAN as 2000 nominal GDP was actually 6 percent lower than its end-1995 value. This put ASEAN just outside the top 10 ranking by GDP, smaller than Brazil (ranked 10th) but larger than Spain, South Korea and India (ranked 12th, 13th and 14th, respectively) (Table 4.1). Since the turn of the millennium, however, ASEAN has shown consistent and resilient growth. From being ranked as the 11th largest economy in 2000, the latest data (2017) from the World Bank put ASEAN as the fifth largest jurisdiction, lagging Germany but ahead of the UK. More importantly, between 2001 and 2016, ASEAN had grown nominally at a compounded
Source: WDI
Figure 4.1: GDP growth of selected regions In percent
Source: WDI
Figure 4.2: GDP growth of ASEAN vs. rest of the world In percent
CH
AP
TE
R 4
4
34
4 F
INA
NC
IAL
ST
AB
ILIT
Y IS
SU
ES
IN O
NG
OIN
G W
OR
K
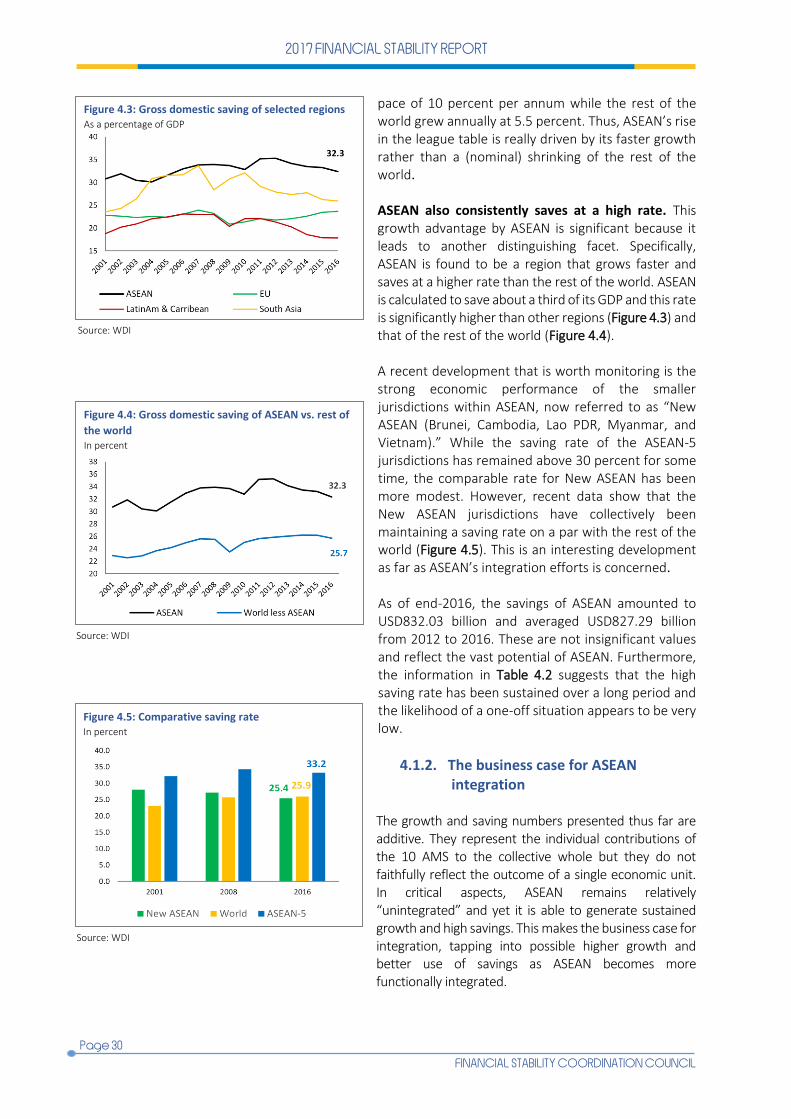
2017 FINANCIAL STABILITY REPORT
Page 30
FINANCIAL STABILITY COORDINATION COUNCIL
pace of 10 percent per annum while the rest of the world grew annually at 5.5 percent. Thus, ASEAN’s rise in the league table is really driven by its faster growth rather than a (nominal) shrinking of the rest of the world. ASEAN also consistently saves at a high rate. This growth advantage by ASEAN is significant because it leads to another distinguishing facet. Specifically, ASEAN is found to be a region that grows faster and saves at a higher rate than the rest of the world. ASEAN is calculated to save about a third of its GDP and this rate is significantly higher than other regions (Figure 4.3) and that of the rest of the world (Figure 4.4). A recent development that is worth monitoring is the strong economic performance of the smaller jurisdictions within ASEAN, now referred to as “New ASEAN (Brunei, Cambodia, Lao PDR, Myanmar, and Vietnam).” While the saving rate of the ASEAN-5 jurisdictions has remained above 30 percent for some time, the comparable rate for New ASEAN has been more modest. However, recent data show that the New ASEAN jurisdictions have collectively been maintaining a saving rate on a par with the rest of the world (Figure 4.5). This is an interesting development as far as ASEAN’s integration efforts is concerned. As of end-2016, the savings of ASEAN amounted to USD832.03 billion and averaged USD827.29 billion from 2012 to 2016. These are not insignificant values and reflect the vast potential of ASEAN. Furthermore, the information in Table 4.2 suggests that the high saving rate has been sustained over a long period and the likelihood of a one-off situation appears to be very low.
4.1.2. The business case for ASEAN integration
The growth and saving numbers presented thus far are additive. They represent the individual contributions of the 10 AMS to the collective whole but they do not faithfully reflect the outcome of a single economic unit. In critical aspects, ASEAN remains relatively “unintegrated” and yet it is able to generate sustained growth and high savings. This makes the business case for integration, tapping into possible higher growth and better use of savings as ASEAN becomes more functionally integrated.
Source: WDI
Figure 4.3: Gross domestic saving of selected regions As a percentage of GDP
Source: WDI
Figure 4.4: Gross domestic saving of ASEAN vs. rest of
the world In percent
Source: WDI
Figure 4.5: Comparative saving rate In percent

2017 FINANCIAL STABILITY REPORT
Page 31
FINANCIAL STABILITY COORDINATION COUNCIL
Intra-ASEAN trade is rather limited. From the trade perspective, one can readily validate that ASEAN trades a larger portion with the rest of the world than with other ASEAN jurisdictions. On average, intra-ASEAN imports is only at 22 percent (Figure 4.6) while intra-ASEAN exports is only slightly higher at 24 percent (Figure 4.7). These are not at the levels that one expects from a high growth “region” and raising these percentages is a key target of the integration initiative. It may be possible that the low trade figures reflect some measure of comparative advantage with the rest of the world. However, one can look at Table 4.3 and Table 4.4 and it becomes immediately clear that ASEAN typically exports what it imports, regardless of whether the goods are sourced from or directed to ASEAN or outside ASEAN. Interestingly, the mix of traded items is alike between intra-ASEAN and extra-ASEAN trade. This suggests that there is, in fact, scope for enhancing intra-regional trade. ASEAN also exhibits limited intra-regional investment flows. Unfortunately, not only is external trade limited between ASEAN members but portfolio investments as well. ASEAN-5 jurisdictions account for 92.1 percent of the savings of ASEAN as a whole and this is not unexpected since ASEAN-5 contributes the bulk of ASEAN GDP.21 What is surprising, nonetheless, is the fact that only 7 percent of the savings of ASEAN-5 is reinvested in ASEAN-5 and practically none is deployed to New ASEAN (see Table 2.3 in Chapter 2).
Given the amount of ASEAN savings, this is a significant opportunity cost. It likely reflects that the capital markets within ASEAN are still in their early stages of development and are not yet in a position to provide the investment vehicles to absorb such funds. Interestingly, however, capital flows into and out of ASEAN have been volatile. This is rather ironic because ASEAN’s deployment of its savings to the rest of the world has been fairly steady. This only further strengthens the case for an integrated ASEAN financial market that has the components in place to absorb and redirect funds where best warranted.
The aspiration of ASEAN to reap the gains of an integrated financial market is embodied in the ASEAN Financial Integration Framework (AFIF), which is itself engrained into the so-called ASEAN Economic Community (AEC). Cognizant of these opportunities, the vision of an integrated AEC has been laid out, within which is a framework for the integration of the region’s financial markets. The stated objective of AFIF is to: (1) liberalize financial services including the integration of banking systems in ASEAN; (2) liberalize the capital account in the Balance of Payments; (3) develop a regional capital market; and (4) harmonize payments and settlements systems.
21 As of end-2016, ASEAN-5 accounted for 87.6 percent of total ASEAN GDP. What is interesting is that this figure is actually lower than
the 95 percent in 1995 and 91.7 percent as of 2000. This declining percentage should be seen as positive since the gap between ASEAN-5 and New ASEAN is narrowing.
Source: WDI
Figure 4.6: Intra-ASEAN imports In percent of total imports
Source: WDI
Figure 4.7: Intra-ASEAN exports In percent of total exports

2017 FINANCIAL STABILITY REPORT
Page 32
FINANCIAL STABILITY COORDINATION COUNCIL
Table 4.2. Gross domestic saving of selected regions In percent
Region 2010 2011 2012 2013 2014 2015 2016 Average*
ASEAN 35.2 35.3 34.1 33.5 33.2 32.3 32.4 32.9
EU 21.3 22.0 21.7 22.0 22.6 23.4 23.6 22.5
Latin America & Carribean 22.0 22.1 21.3 20.2 18.5 17.8 17.8 20.8
Middle East & North Africa 38.0 41.1 40.9 39.0 35.7 28.1 27.5 35.3
South Asia 32.0 29.1 27.9 27.3 27.7 26.2 25.9 28.6
World less ASEAN 24.9 25.6 25.9 26.1 26.2 26.2 25.7 24.8
World 25.2 25.9 26.1 26.3 26.4 26.4 25.9 25.0
*from 2001 to 2016 Source: WDI, as of 28 June 2018
Table 4.1: Nominal GDP of selected countries vs. ASEAN In USD billions
Rank 1995 2000 2008 2017
1 US 7,664 US 10,285 US 14,719 US 19,391
2 Japan 5,449 Japan 4,888 Japan 5,038 China 12,328
3 Germany 2,592 Germany 1,950 China 4,598 Japan 4,872
4 France 1,601 UK 1,648 Germany 3,752 Germany 3,677
5 UK 1,335 France 1,362 France 2,918 ASEAN 2,767
6 Italy 1,171 China 1,211 UK 2,891 UK 2,622
7 Brazil 769 Italy 1,142 Italy 2,391 India 2,597
8 China 735 Canada 742 Brazil 1,696 France 2,583
9 ASEAN 653 Mexico 708 Russia 1,661 Brazil 2,056
10 Spain 613 Brazil 655 Spain 1,635 Italy 1,935
11 Canada 604 ASEAN 614 ASEAN 1,560 Canada 1,653
Source: WDI, as of 28 June 2018
Table 4.3: Top intra-ASEAN trade by rank of commodity group As of November 2016
Intra-ASEAN Exports Intra-ASEAN Imports
Electrical machinery & equipment Electrical machinery & equipment
Mineral fuels, mineral oils & products of their distillation Mineral fuels, mineral oils & products of their distillation
Nuclear reactors, boilers, machinery, & mechanical appliances Nuclear reactors, boilers, machinery, & mechanical appliances
Vehicles other than railway or tramway rolling stock Vehicles other than railway or tramway rolling stock
Plastics & articles thereof Plastics & articles thereof
Optical, photographic, cinematographic, other instruments Natural or cultured pearls, precious or semi-precious stones
Organic chemicals Organic chemicals
Natural or cultured pearls, precious or semi-precious stones Optical, photographic, cinematographic, other instruments
Articles of iron or steel Articles of iron or steel
Rubber & articles thereof Animal or vegetable fats & oils
Animal or vegetable fats & oils Rubber & articles thereof
Source: ASEAN
Table 4.4: Top extra-ASEAN trade by rank of commodity group As of November 2016
Extra-ASEAN Exports Extra-ASEAN Imports
Electrical machinery & equipment Electrical machinery & equipment
Nuclear reactors, boilers, machinery, & mechanical appliances Nuclear reactors, boilers, machinery, & mechanical appliances
Mineral fuels, mineral oils & products of their distillation Mineral fuels, mineral oils & products of their distillation
Animal or vegetable fats & oils Iron & steel
Optical, photographic, cinematographic, & other instruments Plastics & articles thereof
Vehicles other than railway or tramway rolling stock Vehicles other than railway or tramway rolling stock
Plastics & articles thereof Optical, photographic, cinematographic & other instruments
Rubber & articles thereof Natural or cultured pearls, precious or semi-precious stones
Articles of apparel & clothing accessories, knitted or crocheted Articles of iron or steel
Natural or cultured pearls, precious or semi-precious stones Organic chemicals
Source: ASEAN

2017 FINANCIAL STABILITY REPORT
Page 33
FINANCIAL STABILITY COORDINATION COUNCIL
These are ambitious individual objectives but the success of AFIF rests on achieving a fair measure in all of them. There must be a pipeline for the movement and transfer of funds within the region and this is where a harmonized Payment and Settlement Systems is necessary. This will allow ASEAN banks to operate with less reliance on outside-ASEAN correspondent banks while an integrated capital market can indeed provide the repository for the savings that ASEAN generates. While the operations in the financial market are the central focus, these gains must likewise be reflected in the “macroeconomic books” of the jurisdictions themselves. To move the agenda forward, AFIF has set broad thrusts by 2020. A key element is a semi-integrated single banking market within ASEAN that allows for a process where ASEAN-5 and the New ASEAN jurisdictions progress at their own pace. Aside from integration itself, financial stability and financial inclusion are key pillars of the AEC Blueprint, underpinned by a shared goal of capacity building.
4.1.3. Challenges of integration in a diverse community The apparent benefits notwithstanding, regional integration has its distinct challenges. Part of these reflect the nature of ASEAN while other challenges arise from integration itself. From the standpoint of achieving financial stability, these challenges have to be properly appreciated to avoid the pitfalls that can impinge on the functioning of financial markets. The AMS are at different stages of financial market development. ASEAN is defined by its diversity, providing differentiated economic opportunities to different stakeholders. However, integration does involve harmonization so that different jurisdictions can come together under a unified framework. The extent of diversity then presents a natural challenge under the premise of harmonization. Since financial markets have many dimensions and are geared for the specific characteristics of the local economy, it is going to be difficult to have some definitive measure, let alone one that allows for cross-country comparisons. Yet, a recent working paper (Svirydzenka, 2016) attempts to measure financial development by looking at the aspects of depth, access and efficiency at the level of financial institutions and of financial markets. The paper provides a metric that is used in ranking ASEAN jurisdictions (Table 4.5). The metrics may still be open to further discussion but what is relevant for purposes of this section is how distinctly different the average scores are between ASEAN-5 jurisdictions and the New ASEAN. If we look only at the relative values, ASEAN-5 jurisdictions are nearly thrice more financially developed than the New ASEAN countries. According to this metric, the financial markets in ASEAN-5 are substantially more developed although the financial institutions, perhaps surprisingly, are not as different from the New ASEAN. Different regulatory frameworks are in place which could impact on the risks being monitored. The last result on financial institutions will likely
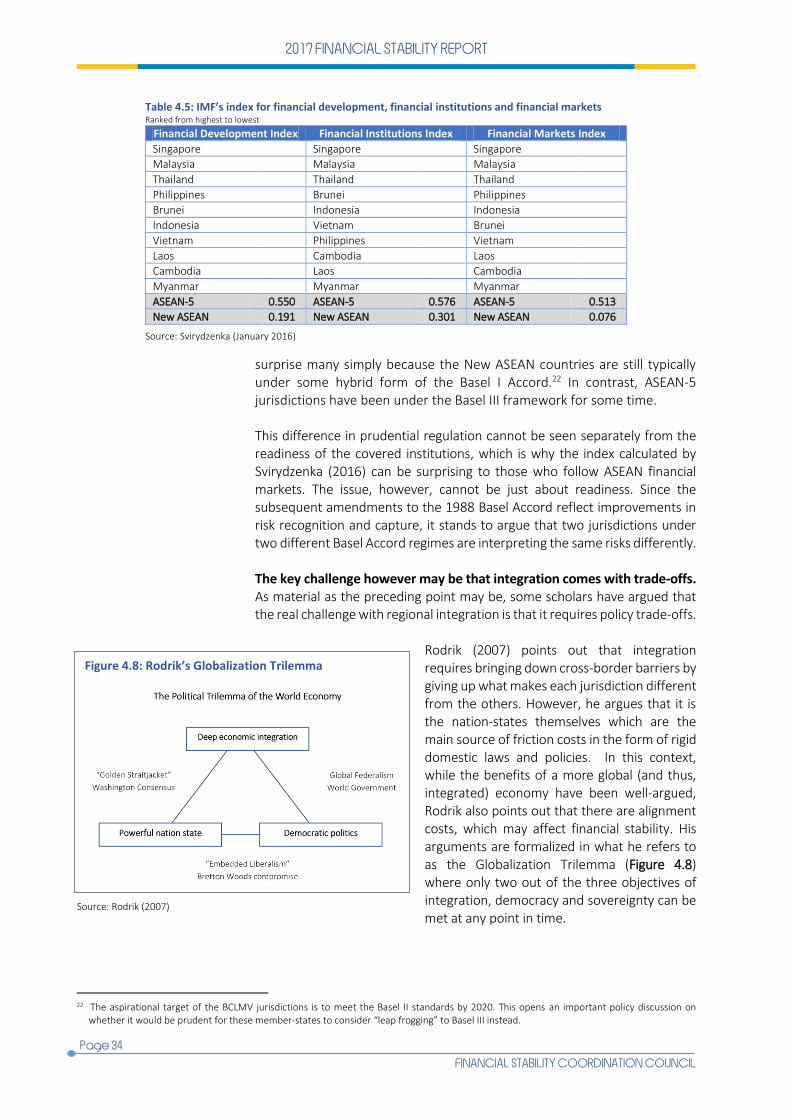
2017 FINANCIAL STABILITY REPORT
Page 34
FINANCIAL STABILITY COORDINATION COUNCIL
surprise many simply because the New ASEAN countries are still typically under some hybrid form of the Basel I Accord.22 In contrast, ASEAN-5 jurisdictions have been under the Basel III framework for some time. This difference in prudential regulation cannot be seen separately from the readiness of the covered institutions, which is why the index calculated by Svirydzenka (2016) can be surprising to those who follow ASEAN financial markets. The issue, however, cannot be just about readiness. Since the subsequent amendments to the 1988 Basel Accord reflect improvements in risk recognition and capture, it stands to argue that two jurisdictions under two different Basel Accord regimes are interpreting the same risks differently. The key challenge however may be that integration comes with trade-offs. As material as the preceding point may be, some scholars have argued that the real challenge with regional integration is that it requires policy trade-offs.
Rodrik (2007) points out that integration requires bringing down cross-border barriers by giving up what makes each jurisdiction different from the others. However, he argues that it is the nation-states themselves which are the main source of friction costs in the form of rigid domestic laws and policies. In this context, while the benefits of a more global (and thus, integrated) economy have been well-argued, Rodrik also points out that there are alignment costs, which may affect financial stability. His arguments are formalized in what he refers to as the Globalization Trilemma (Figure 4.8) where only two out of the three objectives of integration, democracy and sovereignty can be met at any point in time.
22 The aspirational target of the BCLMV jurisdictions is to meet the Basel II standards by 2020. This opens an important policy discussion on
whether it would be prudent for these member-states to consider “leap frogging” to Basel III instead.
Table 4.5: IMF’s index for financial development, financial institutions and financial markets Ranked from highest to lowest
Financial Development Index Financial Institutions Index Financial Markets Index
Singapore Singapore Singapore
Malaysia Malaysia Malaysia
Thailand Thailand Thailand
Philippines Brunei Philippines
Brunei Indonesia Indonesia
Indonesia Vietnam Brunei
Vietnam Philippines Vietnam
Laos Cambodia Laos
Cambodia Laos Cambodia
Myanmar Myanmar Myanmar
ASEAN-5 0.550 ASEAN-5 0.576 ASEAN-5 0.513
New ASEAN 0.191 New ASEAN 0.301 New ASEAN 0.076
Source: Svirydzenka (January 2016)
Figure 4.8: Rodrik’s Globalization Trilemma
Source: Rodrik (2007)
2017 FINANCIAL STABILITY REPORT
Page 35
FINANCIAL STABILITY COORDINATION COUNCIL
The effect of integration on financial stability is directly tackled in the paradigm by Schoenmaker (see Box Article 6). Rodrik’s trade-off is consistent with the Financial Trilemma posited by Schoenmaker (2011). Thinking of the integration process in Europe, Schoenmaker phrases the issue in terms of the amount that national authorities must spend to intervene against a failing bank. Financial stability and financial integration come into the model when thinking of banks that are active in the cross-border markets. As financial stability gains traction, it actually provides a collective benefit to several authorities in different jurisdictions. This creates what economists refer to as a “public good” rather than the usual context of a private good. Since everyone covets the benefits that stability brings, it has this unintended consequence that a national regulator on its own has less incentive to bear the cost of stabilization at the national level, i.e., the national authority expects that other authorities elsewhere will adjust so that cross-border stability is again attained. Financial stability in the Schoenmaker paradigm is compatible with integration. Nonetheless, this requires a high level of collaboration among jurisdictions, both to harmonize within the vision of the integrated market while maintaining financial stability. This necessarily means though that the national authorities must give up their national policies which are seen as not aligned with the integrated market. If authorities will insist on national regulation that is independent of the integration process, Schoenmaker describes this as a situation of financial instability. This is precisely his conclusion in the case of Europe where he argues that its financial integration initiative, coupled with own-country financial policies for financial supervision and crisis management, has led to financial instability. Sustaining high growth and high saving will define ASEAN. Challenges aside, ASEAN has long been defined by its record of growth and high rate of saving. The case for ASEAN integration – improving intra-regional trade and portfolio investments while retaining the significant amounts of saving – will ultimately be assessed by ASEAN’s ability to further enhance growth and better manage its saving. As pointed out above, there are non-trivial challenges to successful integration. Among others, the policy trade-offs suggested by Rodrik and Schoenmaker, respectively, are material because these involve the incentives of stakeholders. From the standpoint of financial stability, one has to be reminded that financial stability moves outward, from a well-functioning domestic market and can be extended to a stronger and holistic regional market. How this can be executed is the challenge.
4.2. Fintech The case for using financial technology is supported by the 2015 review of the Philippines by the Better-Than-Cash Alliance. Its report estimated the volume of monthly financial transactions at about 2.66 billion, with an
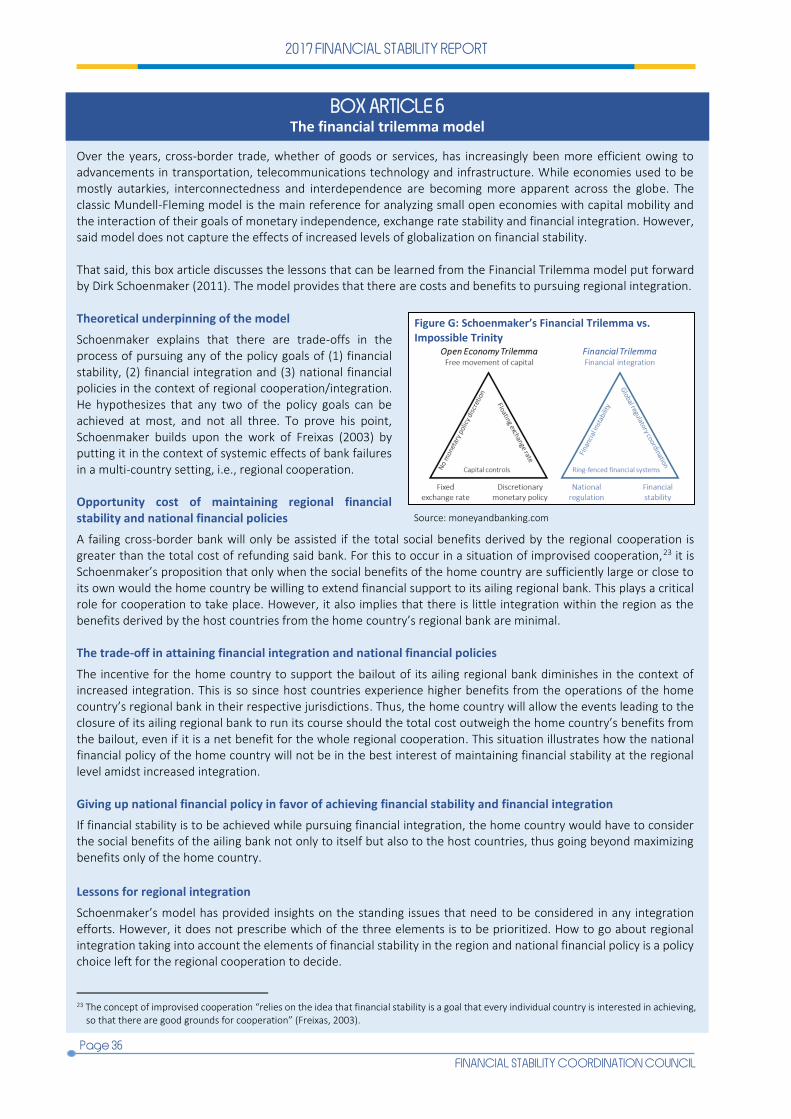
2017 FINANCIAL STABILITY REPORT
Page 36
FINANCIAL STABILITY COORDINATION COUNCIL
Over the years, cross-border trade, whether of goods or services, has increasingly been more efficient owing to advancements in transportation, telecommunications technology and infrastructure. While economies used to be mostly autarkies, interconnectedness and interdependence are becoming more apparent across the globe. The classic Mundell-Fleming model is the main reference for analyzing small open economies with capital mobility and the interaction of their goals of monetary independence, exchange rate stability and financial integration. However, said model does not capture the effects of increased levels of globalization on financial stability. That said, this box article discusses the lessons that can be learned from the Financial Trilemma model put forward by Dirk Schoenmaker (2011). The model provides that there are costs and benefits to pursuing regional integration. Theoretical underpinning of the model
Schoenmaker explains that there are trade-offs in the process of pursuing any of the policy goals of (1) financial stability, (2) financial integration and (3) national financial policies in the context of regional cooperation/integration. He hypothesizes that any two of the policy goals can be achieved at most, and not all three. To prove his point, Schoenmaker builds upon the work of Freixas (2003) by putting it in the context of systemic effects of bank failures in a multi-country setting, i.e., regional cooperation. Opportunity cost of maintaining regional financial stability and national financial policies
A failing cross-border bank will only be assisted if the total social benefits derived by the regional cooperation is greater than the total cost of refunding said bank. For this to occur in a situation of improvised cooperation,23 it is Schoenmaker’s proposition that only when the social benefits of the home country are sufficiently large or close to its own would the home country be willing to extend financial support to its ailing regional bank. This plays a critical role for cooperation to take place. However, it also implies that there is little integration within the region as the benefits derived by the host countries from the home country’s regional bank are minimal. The trade-off in attaining financial integration and national financial policies
The incentive for the home country to support the bailout of its ailing regional bank diminishes in the context of increased integration. This is so since host countries experience higher benefits from the operations of the home country’s regional bank in their respective jurisdictions. Thus, the home country will allow the events leading to the closure of its ailing regional bank to run its course should the total cost outweigh the home country’s benefits from the bailout, even if it is a net benefit for the whole regional cooperation. This situation illustrates how the national financial policy of the home country will not be in the best interest of maintaining financial stability at the regional level amidst increased integration. Giving up national financial policy in favor of achieving financial stability and financial integration
If financial stability is to be achieved while pursuing financial integration, the home country would have to consider the social benefits of the ailing bank not only to itself but also to the host countries, thus going beyond maximizing benefits only of the home country. Lessons for regional integration
Schoenmaker’s model has provided insights on the standing issues that need to be considered in any integration efforts. However, it does not prescribe which of the three elements is to be prioritized. How to go about regional integration taking into account the elements of financial stability in the region and national financial policy is a policy choice left for the regional cooperation to decide.
23 The concept of improvised cooperation “relies on the idea that financial stability is a goal that every individual country is interested in achieving,
so that there are good grounds for cooperation” (Freixas, 2003).
BOX ARTICLE 6 The financial trilemma model
Source: moneyandbanking.com
Figure G: Schoenmaker’s Financial Trilemma vs. Impossible Trinity

2017 FINANCIAL STABILITY REPORT
Page 37
FINANCIAL STABILITY COORDINATION COUNCIL
estimated value of PHP3,095 billion. However, about 99 percent of the transactions and 92 percent of the values were paper-based, i.e., in cash or by checks. On the other hand, data from the Philippine Clearing House Corporation show that it processed about 7,000 checks per day at an average value of PHP135 million in 2016. These figures affirm the vast potential for digitalization. From the regulator’s standpoint, a shift to more electronic means of payment reduces the cost of sustaining and replenishing currency in circulation. From the perspective of those receiving checks, electronic clearing and digital imaging reduce the lag between the transaction and the finality of payment. And for the public at large, digital finance can bridge the transacting parties across the archipelago while providing new product opportunities. Fintech then offers a promising alternative and enhancement to the status quo. The gains, however, should still be understood alongside any potential costs. Comparisons have been made with the boom during the dot-com period and the popular question being asked is whether it is really different this time.24 This level of open discussion is necessary given the widespread influence that fintech is expected to provide. These points are raised in this section.
4.2.1. Fintech as a game changer Technology cuts across socio-economic differences and geographical distance. The archipelagic structure of the Philippine economy guarantees that the movement of funds across provinces/regions under the older methods will likely incur additional costs. The physical separation of the source of the funds and its intended recipients would require additional time to validate the payment or fund transfer instruction before the process of actually remitting the funds can commence. At the very least, there is that period when the funds being paid or remitted are no longer under the ownership of the sender but also cannot yet be withdrawn by the intended recipient. This is clearly inefficient and creates opportunity costs to both the sender and the recipient. The better alternative is to “transfer purchasing power” (i.e., suitable proof that the recipient can access the funds being paid/sent) rather than “transport the instrument of payment” (i.e., checks issued or cash being remitted). This alternative is possible because a newer means of delivery presented itself, that is, the better and greater use of technology, more specifically the digitalization of finance. Quite literally, the transfer of funds and the settlement of obligations are a few computer clicks away, regardless of the geographical distance between transacting parties. Fintech in this sense is an equalizer of economic opportunities because providers can offer their products and services to financial consumers anywhere regardless of where these providers may be based.
24 Reinhart and Rogoff (2009).

2017 FINANCIAL STABILITY REPORT
Page 38
FINANCIAL STABILITY COORDINATION COUNCIL
The ubiquitous world wide web (www) certainly has played a transformational role. But the underlying impetus is not the www highway but rather the fact that the computing technology has become scalable and portable. What used to be done by mainframe servers can now be executed on smart phones and phablets. More importantly, the availability of these services is agnostic of the demographic background of the parties. This universal accessibility defines fintech. As the 2017 Financial Stability Board (FSB) report noted, “the emergence of technology-enabled innovation in financial services is the result of a confluence of drivers [and] customer preferences, particularly amongst millennials and ‘digital natives’ with regard to convenience, speed and cost of financial services are increasingly important.” This plays well to the case of the Philippines which has, on one hand, a vast pool of millenials and “digital natives” as an integral component of the Philippine economy that is a driver of the demand for fintech services (Figure 4.9) and, on the other hand, an archipelagic economy that is structurally suited to tap the equalizing benefits of fintech.
Fintech is expected to lower operating costs. Speed and convenience are useful gains in and of themselves but consumers remain conscious of the bottom line. The portability and scalability of technology are necessary conditions for boosting the appeal of fintech but the critical element is that the computing power has become readily available and affordable. This combination of availability and affordability, coupled with scalability and portability, is the confluence of factors that provides the business case of fintech. Legacy systems that are already in place are now competing with more mobile, right-sized but equally potent platforms. McKinsey’s 2015 report noted that two units of iPhone 6s “have more memory capacity than the International Space Station.” This is an astonishing detail and has very serious cost implications. The FSB (2017) reiterated this point by arguing that fintech startups have a business opportunity competing with established institutions which may still be operating on older and more expensive information technology (IT) systems. PricewaterhouseCoopers (PwC) (2016) alluded to the benefit of
Figure 4.9: Transaction value of fintech markets in the Philippines In USD millions
Source: Statista, May 2018

2017 FINANCIAL STABILITY REPORT
Page 39
FINANCIAL STABILITY COORDINATION COUNCIL
fintech by having a lower cost for providing services to customers, specifically those who are underbanked. Presumably, the point of the PwC is that scalable banking services provided through fintech are now made available for those “financially excluded” because the brick-and-mortar costs of bank branching are dispensed with. The Accenture (2017) report shows a specific case of how the blockchain technology could transform the investment banking business (Table 4.6). This last point is also made in the McKinsey 2015 report. McKinsey quantifies this further by estimating that “fintech lenders have up to a 400 bps cost advantage over banks, because they have no physical distribution costs.” Considering the general level of interest rates at the time of the McKinsey report, a four percentage cost differential practically makes other alternatives unviable. This is not to suggest that fintech cost advantages are only meant for banks. There is much that is happening in the insurtech25 space, from modifying distribution channels, use of data from devices to price premiums based on customer behavior, customization of policies, to auto-underwriting of risks. In the securities markets, the use of Distributed Ledger Technology (DLT) is actively being discussed, in part because of perceived cost savings. This is not to say that this is a given [see BIS (2017) on DLT in payments system] but the fact remains that cost efficiencies are a natural discourse when it comes to fintech in general. The expectation is that any cost saving ultimately accrues to the end-user because this will ultimately be the constituent that defines present and future demand.
4.2.2. The market potential of fintech Time-series estimates for the potential size of the fintech market are difficult to secure. Perhaps, the information is deemed “private and confidential” and known only to the fintech start-ups themselves. But it is also possible that scoping the market is just difficult because fintech not only creates a new market but also potentially displaces the older products and services. This is the “disruptiveness” of fintech that can be taken as akin to any other financial risk which is subject to proper risk management. This last point though raises issues about governance and oversight (see the following section) which is essential to the ongoing discourse. What is known, nonetheless, are the estimates for the Philippines from the Better-Than-Cash Alliance diagnostic, i.e., fintech has the potential to take up 2.63 billion transactions a month (i.e., 99 percent of the 2.66 billion total financial transactions) at a recorded value of PHP2,847 billion (which is the 92 percent of their estimate of PHP3,095 billion).
25 Newest term used to describe the blending of insurance and technology.
Table 4.6: Value analysis of blockchain for investment banks
Description Potential cost savings
Central Finance Reporting 70%
Compliance 30-50%
Centralized Operations 50%
Business Operations 50% Source: Accenture (2017) Source: WDI

2017 FINANCIAL STABILITY REPORT
Page 40
FINANCIAL STABILITY COORDINATION COUNCIL
These just replace the paper-based transactions with digital solutions. One can reasonably expect that the activity will likely increase as the economy continues to grow and as fintech addresses demand-supply gaps under conventional financial services. Based on the work by the Asian Development Bank (ADB) (2017), these gaps can be quite substantive (Figure 4.10).
4.2.3. What we need to look out for in order to sustain the gains
Governance and oversight is critical. As with any segment of the financial market, governance standards for fintech entities and an oversight framework for suitable financial technology will be critical. More so the case of fintech since the entities that provide fintech applications need not be financial institutions. This obviously raises the issue of which authority, if any, should supervise fintech entities and how the appropriateness of fintech solutions can be vetted. If one were to take fintech providers as IT-type entities, what then would be the governing prudential framework for their participation in the financial market? If you take them instead as “closer” to being financial institutions, will a risk-based capital framework also be applicable? In either case, one can readily see the mismatch between the supervisory approaches that are based on stereotypical entity forms rather than the regulation of the business activity itself (regardless of the entity providing it). At present, several existing prudential guidelines established for financial institutions and financial markets appear to be applicable to fintech entities. Quoting from the FSB (2017) report: “The Standard-Setting Bodies have also issued guidelines and
standards for the financial sector that are relevant for fintech. For example, the Basel Committee’s Core Principles are relevant for assessing innovations in banking and the interaction between banks and fintech firms; the IOSCO Objectives and Principles are relevant for applications of fintech in securities markets; the IAIS Insurance Core Principles are relevant for the range of fintech applications in insurance (InsurTech); and the CPMI-IOSCO PFMI are relevant to fintech applications in payments, clearing and settlement.”
Source: ADB (2017)
Figure 4.10: Estimated gaps between financial needs and formal supply in the Philippines

2017 FINANCIAL STABILITY REPORT
Page 41
FINANCIAL STABILITY COORDINATION COUNCIL
While the standards are “relevant,” the task is to clarify that these indeed apply to fintech entities. This effectively takes the view that fintech entities should be supervised based on their business activity and not necessarily their corporate structure, i.e., whether they have secured and been granted a license by the appropriate financial authority. While many jurisdictions have established their own regulatory framework, the approach for the supervision of fintech entities can still be an open issue. The IMF (2017) weighs in by noting that “new technologies may require jurisdictions to revise rules governing ownership and contractual rights and obligations.” This is certainly important because it highlights the point that an entity as important as one that is authorized to directly interact with financial consumers for their current and future requirements cannot remain outside prudential norms (even though it is not known yet what prudential norms should really apply in this case). The basic principle why there is a need to supervise and regulate financial firms is that they have the advantage of information over depositors on one hand and borrowers on the other, which allows for conflicts of interest to arise especially when rights and obligations over money are involved. This principle of governance and consumer protection should apply to a fintech entity as well, even in those cases where the fintech provider only operates one side of the financial market, i.e., either as a lending platform or as a mobilizer of funding. This gap is amplified by the possibility that fintech startups may engage in activities that extends beyond their current practice. For instance, the FSB (2017) cited the following examples:
a. if the fintech lending platform uses its own balance sheet to fund loans, leading to maturity mismatches;
b. if fintech digital wallets start managing their own books, holding onto and investing client funds, creating liquidity mismatches; and
c. if fintech equity crowdfunding platforms borrow funds in order to finance temporary holdings of bond or equity issuance, generating a leveraged position in the process.
None of these three scenarios are far-fetched because they can, in fact, be envisioned as operational adjustments from improving the fintech service. Yet, these take them that much closer to becoming a conventional financial institution and the open issue that still remains is how these entities should be supervised. This needs to be resolved sooner rather than later with some explicit policy statement. Possible financial stability risks. The last point only reaffirms that there will always be some measure of risk in the financial market as well as from entities that provide financial products and services. However, one has to also accept that as fintech applications expand, the authorities need to assess its possible contribution to systemic risks. As finance is “digitalized” through structured networks and platforms, the possibility for contagion from fintech bottlenecks and glitches is easy to imagine.

2017 FINANCIAL STABILITY REPORT
Page 42
FINANCIAL STABILITY COORDINATION COUNCIL
The FSB (2017) makes the point that systemic risks are not yet evident from fintech because of the current limited extent of its use. This is reassuring and a concern. The latter is because it is now known (from the GFC) that systemic risks can arise from smaller shocks. The key driver is the amplification effects within a network and in many ways, this is applicable to fintech. One can consider the framework for Domestic Systemically Important
Banks (D-SIBs) as a reference. This looks at the four main aspects of size,
interconnectedness, substitutability, and complexity as measures of
“systemic-ness.” This can very well be the case of fintech, both for its
providers and for the “disruptive” technology that is being offered to the
market.
The IMF (2016, 2017), FSB (2017), OFR (2017), and BIS (2017) have issued
seminal papers that frame the systemic risk discussion for fintech, VCs and
DLT. They flag various issues so that the authorities can address them in
advance. The FSB (2017) report, for example, highlights the operational
risks that can lead to financial stability concerns (Table 4.7), separate from
fintech’s macrofinancial risks that can cause financial stability issues (Table
4.8).
Table 4.7: Operational risks of fintech to financial stability
Potential risk Link to financial stability
Cyber security-related issues As fintech increases the interconnectedness of financial markets, the market becomes more susceptible to cyber-attacks. Any breach to the system causes not only financial losses but also compromised data integrity.
Third party reliance Disruptions to third party fintech services that link together multiple systemically important institutions or markets are more likely to pose system-wide risks.
Legal and regulatory risk Some fintech activities are not covered by existing legal and regulatory frameworks, which can lead to fintech firms becoming involved in unfair business practices.
Business risk of critical financial market institutions
Disruptions or failures in payment and settlement services can potentially put an already distressed firm into a downward spiral.
Table 4.8: Macrofinancial risks of fintech to financial stability
Potential risk Link to financial stability
Contagion Fintech firms interact directly with households and businesses. Thus, sizeable unexpected losses incurred by a single fintech platform could translate to losses of the entire sector interacting with it. Increased exposure to cyber risks, along with the advent of artificial intelligence, may also proliferate contagion.
Procyclicality Due to the reliance on similar algorithms, risk models of fintech firms tend to be highly correlated. As a consequence, fintech firms could be prone to procyclical dynamics in terms of flashing larger swings in investor sentiment, triggering greater herding behavior, amplifying swings in asset prices, and impairing network effects.
Excess volatility At its core, fintech is designed to boost the speed of transaction and services. This could create or intensify excess volatility in the system. More broadly, in a competitive environment, the speed and ease of switching between service providers could make the financial system excessively sensitive to news, therefore, piling up volatility.
Source: FSB (2017)
Source: FSB (2017)
2017 FINANCIAL STABILITY REPORT
Page 43
FINANCIAL STABILITY COORDINATION COUNCIL
Moving forward, the preemptive nature of financial stability requires the continuous assessment of the possible build up of brewing interconnected risks in the fintech space. This will be no different from a credit overhang issue or a debt servicing concern through the 3Rs. From this perspective, better surveillance, improved understanding and greater collaboration are all essential.

2017 FINANCIAL STABILITY REPORT
Page 44
FINANCIAL STABILITY COORDINATION COUNCIL

2017 FINANCIAL STABILITY REPORT
Page 45
FINANCIAL STABILITY COORDINATION COUNCIL
MOVING FORWARD: MORE DATA AND BETTER TOOLS
It is clear that the pursuit of financial stability and the attendant management of systemic risks have become the preeminent prudential norm. It is equally as clear that these are challenged by the availability, more so, the absence of granular data. Since a key element of systemic risk is how the various elements interact with each other, measuring such risk is made difficult by the fact that it would not be evident by looking at the balance sheet of individual financial institutions. Even if it were, it would likely be dependent on the interplay of market conditions such that the measure of stability would change from one point in time to another. These challenges notwithstanding, it is all the more important to “quantify” financial stability. The intention is not to find a scalar measure that can assess stability but rather to advance with better evidence the appreciation of where the (changing) vulnerabilities may lie as market conditions evolve. This reiterates the longstanding view that it is not practical to define absolute thresholds where the system crosses from stability into instability. Instead, the aspiration is to have a collective view of cross-sectional and intertemporal measures that give regulatory authorities a pulse of where risks are being amplified. There may be no point to discussing future courses of action on systemic risk analysis if the data required are unavailable. The point of the global reforms is to make markets more transparent and, in this context, the data previously generated for monitoring of institutions and markets are now seen as insufficient for full systemic risk assessment. This is because the ready-now data cannot reflect the amplifying effects that come from interlinkages, i.e., data are specific to a variable but does not map out the channels of contagion.
5.1. Data enhancements on issues already identified Based on the risks that have already been identified, the FSCC continues to work on data requirements that may enhance systemic risk analysis. Specifically, the work over the immediate to intermediate term focuses on four key areas.
5.1.1. Formalizing FSCC’s measures of interconnectedness Assessing financial stability requires an assessment of the extent and nature of the interlinkages between different agents and their transactions. Unfortunately, the state of play is that there are competing ways for defining systemic risk (OFR, 2012) and that exclusive indicators of financial stability have yet to be devised (BIS, 2009). In this sense, formalizing how to measure interconnectedness and assess its impact becomes the primary task.
CH
AP
TE
R 5
6
4 5
MO
VIN
G F
OR
WA
RD
: MO
RE
DA
TA
AN
D B
ET
TE
R T
OO
LS

2017 FINANCIAL STABILITY REPORT
Page 46
FINANCIAL STABILITY COORDINATION COUNCIL
Baseline results can be generated using Financial Network Analysis (FNA) and then augmented by stress tests and/or simulations of shocks to the derived network. Direct networks define the pairwise relationships that are embedded in financial statements of the covered institutions. And from these, the relevant metrics are typically conveyed by individual and group centrality measures, structure identification techniques and network-stress test type of models. So-called indirect networks will also be considered to the extent that relevant market prices are available. Granger causality tests have been used in this context and the appeal of this approach is that the data are more frequent and current. Due care is warranted in interpreting financial networks. The seminal work of Allen and Gale (2000) shows that complete networks provide opportunities for improved diversification of risks, thus, enhancing financial stability. More recent papers, however, argue that financial networks have become so complex, leaving them more vulnerable when the system experiences shocks [Gai et. al. (2011), Caballero and Simsek (2013)]. From this perspective, the empirical task is not only to map and measure networks but also to determine the conditions that would allow to either mitigate or amplify risks. The focus then is to better understand how the network of agents is interlinked, i.e., the various assumptions that will eventually define the distribution and dispersion aspects of the network. Alongside FNA, various regression models will be pursued. Specifications that test for the comovement of identified factors could yield intuitive results of risk channels. On the other hand, models on default probabilities can be useful for measuring the dependence of institutions on the health of other institutions or against available measures of distress.
5.1.2. Parallel measures of vulnerability as a surveillance tool Continuous monitoring of the overall market will be done through the Financial Surveillance Dashboard (FSD). While this is already in place, the task is to continually calibrate and enhance to pick up relevant changes in the underlying market pulse, covering the real economy and the various financial submarkets. Individual indicators may be rising or falling sharply for idiosyncratic reasons but when taken collectively with other indicators, there should be a holistic narrative of the evolving fundamentals. This is consistent with the work of Adrian, Covitz and Liang (2014) and many other jurisdictions deploy a similar tool (see OFR and ESRB). The FSD should properly cover pricing and valuation of financial instruments since this is a key element of a well-functioning financial market. This will be a non-trivial task because several competing interests have to be differentiated.
For government security rates, these are measures of sovereign risk and the base for pricing all other instruments. However, there is also the need by the fiscal authorities to borrow at the least cost without the added responsibility of developing the financial market.

2017 FINANCIAL STABILITY REPORT
Page 47
FINANCIAL STABILITY COORDINATION COUNCIL
Stock market price-to-earnings ratios, on the other hand, have been persistently well past their textbook warning thresholds but there seems no evidence that investors believe the stock market to be overvalued. Whether this is a Minsky moment waiting to happen is certainly an important thought but the absence of clear-cut valuation measures for the market as a whole leaves the issue without an empirical resolution.
Carry trades would be another area that the FSD should be able to flag. However, several studies show that covered interest rate parity may no longer be binding in practice. This leaves open how to monitor this activity, particularly at a time when technology has made cross-border finance readily accessible.
Apart from the FSD, market-based systemic risk models such as SRISK26 and conditional value-at-risk (CoVaR)27 are worth exploring, subject to data limitations. This can be further augmented by enhancing the current uniform stress testing for banks28 to consider the normalization of US monetary policy and its impact on asset valuation and a bank’s liquidity position.
5.1.3. Debt repayment dynamics
As monetary policy in the advanced economies “normalize,” the resulting higher interest rate levels and, in some cases, the depreciation of Asian currencies versus the US dollar will definitely increase the cost of debt servicing. The challenge is that there is currently no regularly reported data on the debt repayment capabilities of both corporate and retail borrowers. Given the significant build up of debt when interest rate levels were below historical norms, this should be a critical concern. Periodic surveys may help but a more permanent solution is warranted because of the potential tenor of outstanding borrowings. At the corporate level, collaboration with the SEC should be explored so that debt servicing information is reported on a quarterly basis. There should be a balance between confidentiality and transparency so that the discussion from specific entities and specific transactions can be elevated to shift this to a system-wide view of vulnerabilities. At the household level, a national survey is warranted to establish the baseline of how much the current debt obligation of households is and how demographic factors play a role. This last point is necessary to have a better sense of the support for repayment in the event of market shocks.
26 SRISK measures the capital shortfall of a firm conditional on a severe market decline, and is a function of the firm’s size, leverage and risk
(Brownlees and Engle, 2017). 27 CoVaR, estimated through quantile regression, measures the expected loss in the financial system conditional on one financial institution being
in distress. However, model applicability is limited to financial institutions with high-frequency market data on returns (Adrian and Brunnermeier, 2016).
28 The Uniform Stress Testing for Banks involves simulating the impact of credit and market risks on the regulatory capital ratios of banks. For the credit stress test, an assumed 20 percent and 50 percent write-off are applied to bank exposures categorized by economic activity; by type of consumer finance loan; and, by conglomerate affiliation. For market risk, stress is applied to both the banking and trading books by imposing different magnitudes of parallel increases in both Philippine and US interest rate yield curves. The net open position is also revalued assuming different magnitudes of movement in the Philippine peso vis-à-vis the US dollar. To make the exercise more robust, combinations of changes in interest rates and movement in exchange rate are also considered.
2017 FINANCIAL STABILITY REPORT
Page 48
FINANCIAL STABILITY COORDINATION COUNCIL
5.1.4. Monitoring the network of payments transactions through the market infrastructure
One area where there is urgent work to be done on data and surveillance is that of the payments system. Since the electronic system for the payments of obligations and the transfers of funds is the backbone of a modern financial market, ensuring that contagion risks do not materialize within this network is central to the pursuit of financial stability. Information is made available through the data regularly submitted by banks. In addition, added information is simply picked up by the BSP either as the operator of the real-time gross settlement system or as the repository of the banks’ settlement accounts, i.e., the demand deposit accounts. However, this information has yet to be systematically analyzed for brewing systemic risks. Despite having a delivery-versus-payment protocol, there remains the potential for systemic risks. This is because the interlinked nature of trades allows the possibility that a failed trade will require an “unwinding” of transactions beyond the actual failed trade. Such unwinding can cause a systemic failure of finality of trades since the settlement of obligations and fund transfer are sensitive to their time of execution. Not having this space regularly assessed for its systemic risk implication is therefore a clear area of vulnerability that needs to be addressed urgently. Recent reforms on the needed infrastructure for financial transactions provide a reference of the information that the authorities need to monitor. Some of the information are already available but not analyzed, some are captured but not disaggregated in more useful form while other surveillance information are yet to be collected. All these suggest that much work needs to be done, beginning with an organized strategy and timeline for how and when the identified information will be generated and analyzed.
5.2. Rejoinder on data requirements The above work program involves more than just doing more things. It actually attempts to look at existing issues which are deemed to have systemic implications and then to drill down on the information and data requirements. This will invariably require more granular data than what is presently available while generating new data for those that is not readily available. On this point, stakeholders need to weigh in on financial stability discussions because there are trade-offs regarding the data. At one level, there is the need to balance the private cost of generating more information against the social benefit of having a more holistic view of market dynamics. For the covered institutions, the requirement to periodically make available more data comes at an expense. This is offset, in principle, by the ability of the financial authorities to process the extended information so that brewing risks are addressed in a timely
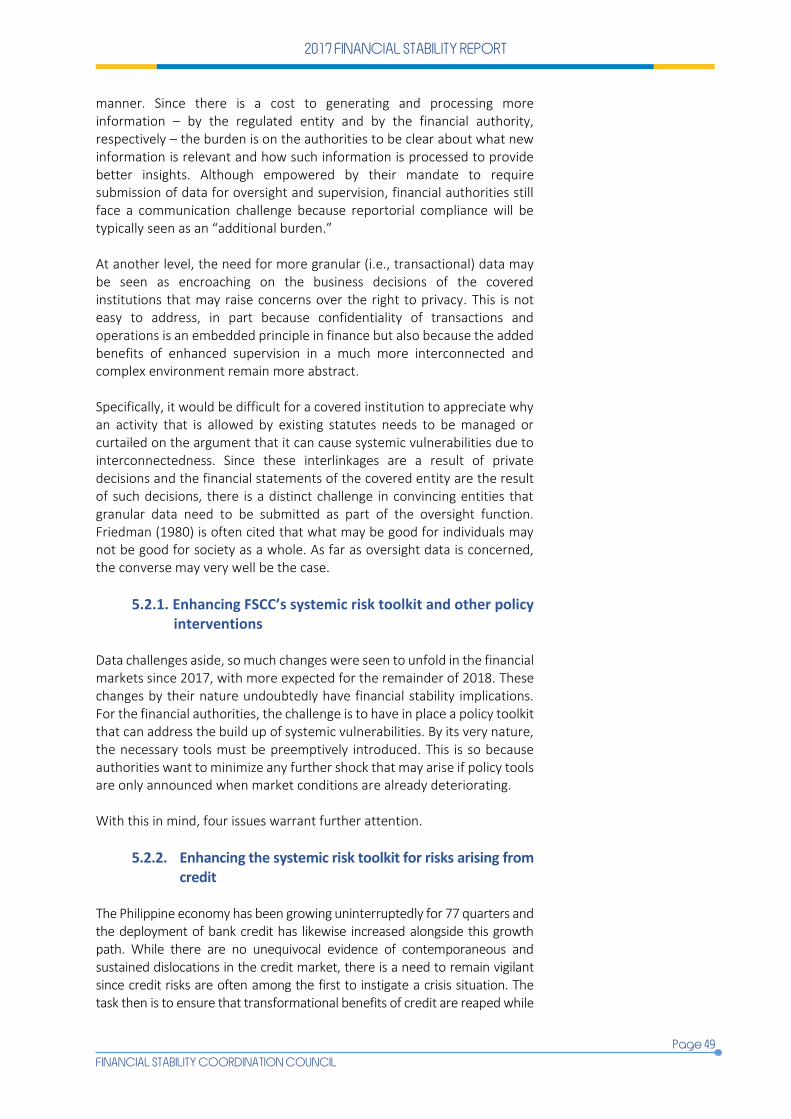
2017 FINANCIAL STABILITY REPORT
Page 49
FINANCIAL STABILITY COORDINATION COUNCIL
manner. Since there is a cost to generating and processing more information – by the regulated entity and by the financial authority, respectively – the burden is on the authorities to be clear about what new information is relevant and how such information is processed to provide better insights. Although empowered by their mandate to require submission of data for oversight and supervision, financial authorities still face a communication challenge because reportorial compliance will be typically seen as an “additional burden.” At another level, the need for more granular (i.e., transactional) data may be seen as encroaching on the business decisions of the covered institutions that may raise concerns over the right to privacy. This is not easy to address, in part because confidentiality of transactions and operations is an embedded principle in finance but also because the added benefits of enhanced supervision in a much more interconnected and complex environment remain more abstract. Specifically, it would be difficult for a covered institution to appreciate why an activity that is allowed by existing statutes needs to be managed or curtailed on the argument that it can cause systemic vulnerabilities due to interconnectedness. Since these interlinkages are a result of private decisions and the financial statements of the covered entity are the result of such decisions, there is a distinct challenge in convincing entities that granular data need to be submitted as part of the oversight function. Friedman (1980) is often cited that what may be good for individuals may not be good for society as a whole. As far as oversight data is concerned, the converse may very well be the case.
5.2.1. Enhancing FSCC’s systemic risk toolkit and other policy interventions
Data challenges aside, so much changes were seen to unfold in the financial markets since 2017, with more expected for the remainder of 2018. These changes by their nature undoubtedly have financial stability implications. For the financial authorities, the challenge is to have in place a policy toolkit that can address the build up of systemic vulnerabilities. By its very nature, the necessary tools must be preemptively introduced. This is so because authorities want to minimize any further shock that may arise if policy tools are only announced when market conditions are already deteriorating. With this in mind, four issues warrant further attention.
5.2.2. Enhancing the systemic risk toolkit for risks arising from credit
The Philippine economy has been growing uninterruptedly for 77 quarters and the deployment of bank credit has likewise increased alongside this growth path. While there are no unequivocal evidence of contemporaneous and sustained dislocations in the credit market, there is a need to remain vigilant since credit risks are often among the first to instigate a crisis situation. The task then is to ensure that transformational benefits of credit are reaped while

2017 FINANCIAL STABILITY REPORT
Page 50
FINANCIAL STABILITY COORDINATION COUNCIL
operating within prudential norms. With this in mind, three related interventions are being discussed with the market: Countercyclical Capital Buffer (CCyB), Debt-to-Earnings-of-Borrowers’ Test (DEBT) and Borrowers Interconnectedness Index (BII). A CCyB is proposed to be introduced, which can be complied with using Common Equity Tier (CET) 1 at an initial rate of zero percent. This is the “stressed time” counterpart of the Capital Conservation Buffer which was introduced as early as 2014. With the CCyB, the credit market is meant to be prevented from drying up during not-so-good times while also providing a means to curb credit growth if it is deemed as expanding at “too-strong” a pace. CCyB is a systemic risk tool because it focuses on the pace at which credit is expanding in the system while remaining agnostic of the specific counterparties of the banks. Furthermore, having the buffer set at zero percent should not cause any cost consequence to the banks as far as raising the minimum required CET 1 but having this in place now provides a trigger that can be instigated in the future should market conditions warrant. In the process, there is a tool that can counter the amplifying effects of the typical self-reinforcing behavior of curtailing credit during difficult market conditions (thus, furthering the weak market) or aggressively extending credit beyond economic fundamentals (thus, leading to a market bubble). Nonetheless, under no condition does the CCyB intend to set aside credit underwriting standards. DEBT, on the other hand, is a stress test that is similar to the test for the real estate sector (i.e., Real Estate Stress Test). DEBT evaluates the debt servicing capacity of bank borrowers under the hypothetical scenario of higher interest rates and/or a depreciation of the Philippine peso. While banks are expected to have determined the repayment capacity of their borrowers before the loan was approved, what DEBT contributes is setting a common threshold for debt payments under stressed market prices. Having the common threshold as a percentage of the income of borrowers – which is proposed to be 60 percent in this case – makes DEBT a prudential tool for systemic risk purposes. It essentially sets an informal buffer for the downside risk that market rates provide against the borrower at a time that the loan is being repriced, repaid or refinanced. Rather than an absolute cut-off though, banks would be given the opportunity to explain their credit underwriting for the specific borrowers who have a higher debt service ratio than the threshold. This discussion is between the bank and the microregulator. The third component is the BII. For the loan portfolio of each bank, credit concentration limits (i.e., Single Borrower’s Limit) are already in place. What BII contributes is the determination of whether the credit market in the aggregate has exposures that are concentrated to certain borrowers, i.e., BII will quantify if there are systemically important borrowers. The systemic risk is not focused on the concentration but rather on the likelihood of contagion risk that may potentially arise from said borrowers. This is a concern over the amplification effects of an interconnected system, similar to the Basel III
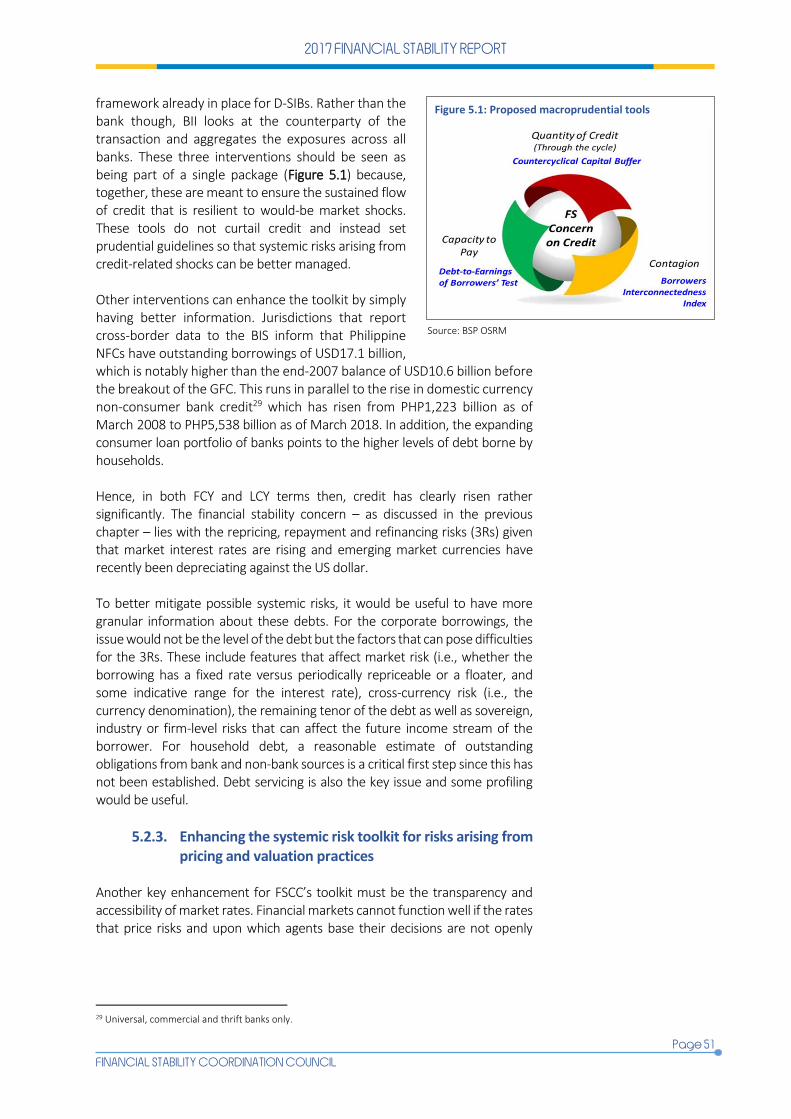
2017 FINANCIAL STABILITY REPORT
Page 51
FINANCIAL STABILITY COORDINATION COUNCIL
framework already in place for D-SIBs. Rather than the bank though, BII looks at the counterparty of the transaction and aggregates the exposures across all banks. These three interventions should be seen as being part of a single package (Figure 5.1) because, together, these are meant to ensure the sustained flow of credit that is resilient to would-be market shocks. These tools do not curtail credit and instead set prudential guidelines so that systemic risks arising from credit-related shocks can be better managed. Other interventions can enhance the toolkit by simply having better information. Jurisdictions that report cross-border data to the BIS inform that Philippine NFCs have outstanding borrowings of USD17.1 billion, which is notably higher than the end-2007 balance of USD10.6 billion before the breakout of the GFC. This runs in parallel to the rise in domestic currency non-consumer bank credit29 which has risen from PHP1,223 billion as of March 2008 to PHP5,538 billion as of March 2018. In addition, the expanding consumer loan portfolio of banks points to the higher levels of debt borne by households. Hence, in both FCY and LCY terms then, credit has clearly risen rather significantly. The financial stability concern – as discussed in the previous chapter – lies with the repricing, repayment and refinancing risks (3Rs) given that market interest rates are rising and emerging market currencies have recently been depreciating against the US dollar. To better mitigate possible systemic risks, it would be useful to have more granular information about these debts. For the corporate borrowings, the issue would not be the level of the debt but the factors that can pose difficulties for the 3Rs. These include features that affect market risk (i.e., whether the borrowing has a fixed rate versus periodically repriceable or a floater, and some indicative range for the interest rate), cross-currency risk (i.e., the currency denomination), the remaining tenor of the debt as well as sovereign, industry or firm-level risks that can affect the future income stream of the borrower. For household debt, a reasonable estimate of outstanding obligations from bank and non-bank sources is a critical first step since this has not been established. Debt servicing is also the key issue and some profiling would be useful.
5.2.3. Enhancing the systemic risk toolkit for risks arising from pricing and valuation practices
Another key enhancement for FSCC’s toolkit must be the transparency and accessibility of market rates. Financial markets cannot function well if the rates that price risks and upon which agents base their decisions are not openly
29 Universal, commercial and thrift banks only.
Source: BSP OSRM
Figure 5.1: Proposed macroprudential tools

2017 FINANCIAL STABILITY REPORT
Page 52
FINANCIAL STABILITY COORDINATION COUNCIL
transparent and directly accessible by all. This dual requirement cannot be compromised if attaining financial stability and mitigating systemic risks are explicitly the prudential objective. Nonetheless, fulfilling them is also fraught with challenges, particularly in an economy that is an archipelago and with its financial submarkets (i.e., across types – cash, capital and contingent markets – and across geographical locations) at different stages of development. The most basic component of this toolkit is to have a transactions-based yield curve that reflects actual secondary market rates. At present, there is notable volatility in the price-setting series used by the market (Figure 5.2). However, the market would be at risk if this
volatility is simply interpreted as a shortcoming of the pricing mechanism already in place. There are international standards for price benchmarks – both in response to the LIBOR incident as well as longstanding accounting guidelines on active markets – which would make it convenient to vet any system. This volatility is generally reflective of the uneven depth of marketable government securities at different benchmark tenors as well as the gap between rates on “done deals” and the subsequent bid rates posted by agents. To address these, the supply side of the market can benefit from a review while pricing guidelines among traders can be better enforced. The supply side is not readily improved by simply asking the national treasury to issue more securities across different tenors. From the standpoint of the government, there is a balance between developing the capital market (and setting the sovereign yield curve in the process) and the costs it must bear for issuing securities. Unless there is a clear use of the funds to be potentially raised by the new issuance, there is going to be an outright cost for carrying these new government securities. Nonetheless, a casual review of outstanding debt by remaining tenor points to the scope for issuing securities in tenors where there is relatively limited liquidity, perhaps coupled by some bond-exchange program between one tenor for another. This could be timely given the government’s funding requirements for its infrastructure build up initiative. Considering, however, that a few of the outstanding securities have significantly larger outstanding volumes, one possibility that can be considered independent of issuance is the creation of the Separate Trading of Registered Interest and Principal of Securities (STRIPS). Essentially, long-dated securities in tenors regardless of depth will be “reengineered” so that the periodic coupons and the principal will each be traded as separate securities. This rebalances market depth because a larger outstanding 10-year security that pays semi-annual coupons will essentially be redistributed as 21 separate non-amortizing bonds whose tenors range from six months to 10 years.
*10-day rolling standard deviation of PDST-R2 benchmark rates Source: Bloomberg
Figure 5.2: Volatility of selected GS benchmark tenors*

2017 FINANCIAL STABILITY REPORT
Page 53
FINANCIAL STABILITY COORDINATION COUNCIL
Taken together, the new issuance, the bond-exchange program and the STRIPS should create a more even distribution of securities, which should in principle also lead to firmer rates across the yield curve. Transparency can also be improved by introducing inflation-linked bonds (ILBs) which reward investors for taking tenor risk without the distortive effects of inflation. This develops the market and mitigates systemic risks because the pricing of ILBs is solely for postponing consumption (i.e., pricing time and liquidity). The intention is to properly price risks across tenor buckets. This may actually mean a non-smooth yield curve because, as it is today, the liquidity differs from tenor to tenor. Smoothening techniques are useful if liquidity is already institutionalized because these take away the “rough edges” of the yield curve without compromising the risk-return profile that is based on liquidity. One observes, for example, that more developed financial markets have fewer benchmark tenors, in part because one can reasonably expect funding and price liquidity for the tenors in between the benchmarks. However, when liquidity is fragmented and concentrated to a few issues or tenors, using smoothening techniques and methodologies run the risk of creating distortive prices for risks across tenors. One can then get an undue concentration (Figure 5.3) in one or a few tenors because they are “relatively cheap” but only because of the smoothening techniques used rather than because of market liquidity. Uniform accessibility to the market rates is as important as transparency, particularly in an economy that is segregated by demographics as much as geography. In the context of an envisioned holistic and functioning market, one can imagine that the price of credit for any tenor should be the same regardless of who the borrower is and from where the borrowing is initiated. Allowing market rates to be differentiated across tenors and geographic distance would only propagate fragmentation. It specifically suggests that funds are sourced and deployed within narrow geographical markets where the demand-supply dynamics – and thus the price of risk – differ from market to market. If sourcing and deploying funds from different markets are considered, any rate difference should eventually be eliminated. This is particularly the case as more electronic means of fund transfer and settlement of obligations (see succeeding section) are used. However, as a matter of basic policy for mitigating potential systemic dislocations, it is not enough to set transparency as the target. One needs to complement this with direct accessibility so that any arbitrage can be eliminated.
5.2.4. Mitigating systemic risk arising from FMIs One component that is essential for a well-functioning market is its underlying FMIs. That it is not so openly discussed is most likely a reflection of the highly technical and very specialized nature of the topic, which is thus often delegated to subject matter experts to ponder. Yet, financial transactions today would not
*Computed using zero curve rates on underlying security(ies) of corresponding PDST-R2 benchmark tenor rates Source: Bloomberg, Reuters and OSRM staff computation
Figure 5.3: Actual vs. hypothetical* YTM of GS As of 6 June 2018
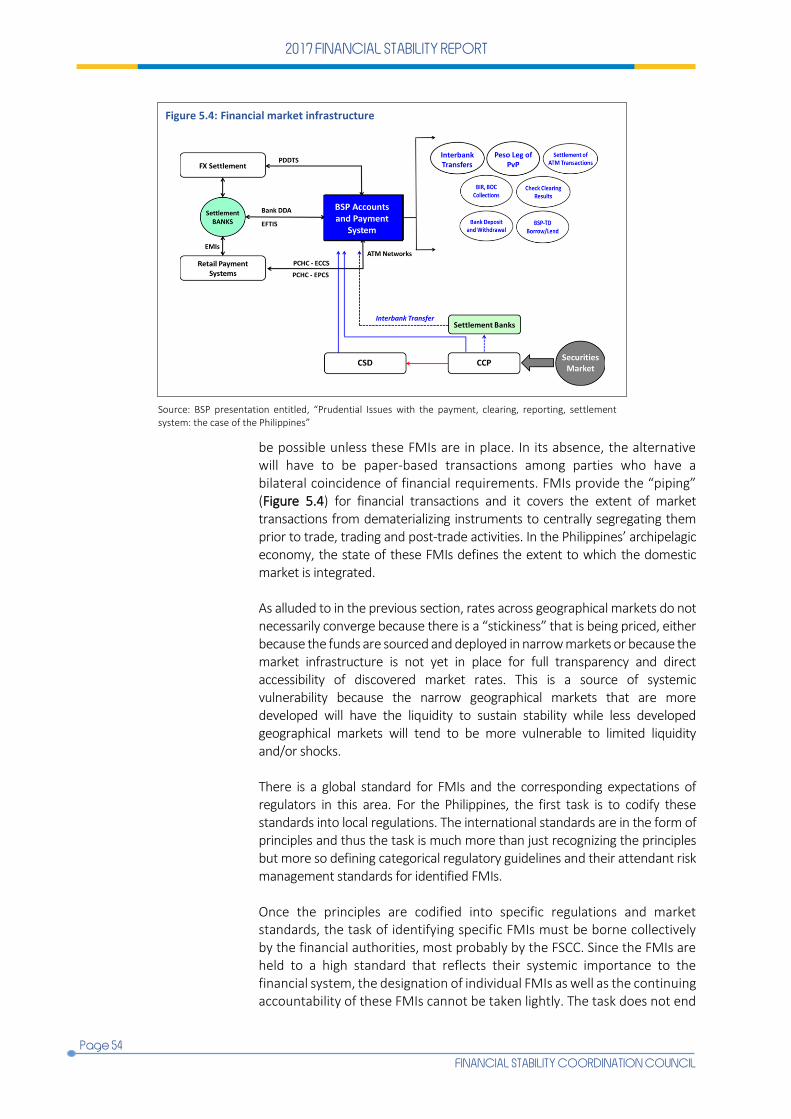
2017 FINANCIAL STABILITY REPORT
Page 54
FINANCIAL STABILITY COORDINATION COUNCIL
be possible unless these FMIs are in place. In its absence, the alternative will have to be paper-based transactions among parties who have a bilateral coincidence of financial requirements. FMIs provide the “piping” (Figure 5.4) for financial transactions and it covers the extent of market transactions from dematerializing instruments to centrally segregating them prior to trade, trading and post-trade activities. In the Philippines’ archipelagic economy, the state of these FMIs defines the extent to which the domestic market is integrated. As alluded to in the previous section, rates across geographical markets do not necessarily converge because there is a “stickiness” that is being priced, either because the funds are sourced and deployed in narrow markets or because the market infrastructure is not yet in place for full transparency and direct accessibility of discovered market rates. This is a source of systemic vulnerability because the narrow geographical markets that are more developed will have the liquidity to sustain stability while less developed geographical markets will tend to be more vulnerable to limited liquidity and/or shocks. There is a global standard for FMIs and the corresponding expectations of regulators in this area. For the Philippines, the first task is to codify these standards into local regulations. The international standards are in the form of principles and thus the task is much more than just recognizing the principles but more so defining categorical regulatory guidelines and their attendant risk management standards for identified FMIs. Once the principles are codified into specific regulations and market standards, the task of identifying specific FMIs must be borne collectively by the financial authorities, most probably by the FSCC. Since the FMIs are held to a high standard that reflects their systemic importance to the financial system, the designation of individual FMIs as well as the continuing accountability of these FMIs cannot be taken lightly. The task does not end
Source: BSP presentation entitled, “Prudential Issues with the payment, clearing, reporting, settlement system: the case of the Philippines”
Figure 5.4: Financial market infrastructure
2017 FINANCIAL STABILITY REPORT
Page 55
FINANCIAL STABILITY COORDINATION COUNCIL
with the designation since the monitoring of systemic risks requires a granular and continuing assessment of data generated by the FMIs, data that may not yet be defined. These are not trivial challenges but these must be addressed in however manner that the authorities find expedient. The added complication is the new facet provided by fintech, particularly DLT. While the established prudential norm is to adopt centralization, DLT turns the system on its head allowing for the trade ledger to be replicated across each member of the network. This is more than just a “new technology.” It potentially and fundamentally changes how markets are to operate and thus, supervised. This has to be a process which will take time to embed into the regulatory and operating fiber of the market. While regulatory sandboxes offer a learning-by-trial calibrated atmosphere, it would be useful to set even a broad roadmap so that stakeholders can be transparently guided. Specific outstanding policy issues such as settlement cycles, the interface between payment and settlement and the use of either central bank or commercial bank money can very well be addressed this early if there is already an established policy direction. The FSCC recognizes that the financial stability risks arising from fintech have yet to be fully outlined. At present, existing frameworks look at the microregulatory aspects (e.g., credit, liquidity and operational risks, among others) with the conclusion often made that financial stability risks are not yet present because of the limited extent to which fintech is used. This is comforting but a preemptive approach should remind authorities to be conscious that smaller shocks can still cause systemic dislocations through interconnectedness. This all the more highlights the need to establish a policy direction.
5.2.5. Using information-education-communication (IEC) initiatives to manage systemic risks
The transparency and accessibility standards that are set for market valuation would also apply to the range of activities that fall under IEC. The technical side of financial stability is difficult enough to convey but stakeholders are better positioned if they are at least made aware of the general messages arising from the periodic financial stability assessment. The challenge is that it is often difficult to convey the emergence of risks in a neutral manner, let alone the possibility of systemic risks. Nevertheless, several studies have shown that IEC initiatives are critical so that stakeholders do not exhibit erratic behavior when surprised by a sudden turn in market condition. Among the FSCC members, an organized program for IEC initiatives will be institutionalized. The specific activities will be differentiated across different constituents, from updates to the public through media
2017 FINANCIAL STABILITY REPORT
Page 56
FINANCIAL STABILITY COORDINATION COUNCIL
releases and issuance of research and publications to the periodic Systemic Risk Review which is discussed during FSCC meetings. The objective is to avoid surprises that leave the impression that the system has unknowingly morphed from a state of stability to one of instability. Such surprises cause further disruptions and there is clear benefit to being objective and more forthcoming. This breaks new ground as far as reporting financial stability risks is concerned, and this first publicly-released FSR is a start. 5.3. Concluding thoughts Financial stability is taken to be a concern over cross-cutting issues, with specific focus on how markets and agents are intrinsically interconnected within a network of transactions. This is certainly the approach that the FSCC takes in pursuing stability, anchored on a well-functioning financial market that provides impetus for stakeholders to improve the overall economic well-being. This collaboration is seen in this FSR through the contributions of the FSCC member agencies in the narrative of their respective sectors. This collaboration is also seen in handling cryptocurrencies which are used as a means of payment but do not confine to the traditional definition of money (as regulated by the central bank) but more of a security as overseen by the securities regulator. As ASEAN takes further steps in regional integration, there is a need to think collectively of how the banking, cash, contingent, and capital markets must link through the clearing and settlement system to effect the desired vision of integration. This improves intra-regional economic activity but it, by definition, must also increase potential vulnerabilities through cross-border linkages. For both within-country and cross-country exposures, collaboration is again critical via surveillance and analysis. What will be collectively learned of the elements of financial stability will be useful for stakeholders who need to make the best economic decision. This is a risk management issue and also one of communication. In this context, this FSR is the FSCC’s initial initiative for conveying the potential upsides and downsides of the market. Part of the challenge is to instill the appreciation that taking on risks can potentially be beneficial but exposure to unmanageable risks will certainly lead to some dislocations. It is hoped that the analytical discussions in this FSR have provided the readers with a critical balance of where opportunities lie and where vulnerabilities are waiting to pounce on the unprepared stakeholder.

2017 FINANCIAL STABILITY REPORT
Page 57
FINANCIAL STABILITY COORDINATION COUNCIL
BIBLIOGRAPHY Accenture. (2017). Banking on Blockchain: A Value Analysis for
Investment Banks. Retrieved from: https://www.accenture.com/t20171108T095421Z__w__/ph-en/_acnmedia/Accenture/Conversion-Assets/DotCom/Documents/Global/PDF/Consulting/Accenture-Banking-on-Blockchain.pdf#zoom=50.
Adrian, T. and Brunnermeier, M.K. (2016) CoVaR. The American
Economic Review.106.7, pp. 1705-1741 Adrian, T., Covitz, D. and Liang, N. (2014). Financial Stability
Monitoring. Federal Reserve Bank of New York Staff Reports. Staff Report No. 601.
Allen, F. and Gale, D. (2000). Bubbles and Crises. The Economic
Journal. pp. 236-255. Amorello, L. (2016). Contracts and Systemic Risk in Europe.
Presentation made at the University of Trieste on 21 April 2016.
Amstad, M., Remolona, E. and Shek, J. (January 2016). How do global
investors differentiate between sovereign risks? The new normal versus the old. BIS Working Papers No. 541. Basel: Switzerland.
Asian Development Bank Publications. (January 2017). Accelerating
Financial Inclusion in South-East Asia with Digital Finance. Retrieved from: https://www.adb.org/sites/default/files/publication/222061/financial-inclusion-se-asia.pdf.
Baird, C. (May 2018). Japan’s economy shrinks in first quarter of 2018
after two-year run of growth. Retrieved from https://www.japantimes.co.jp/news/2018/05/16/business/economy-business/japans-economy-shrank-first-time-quarter-two-years-growth-amid-weak-consumption/#.WyjGz7g_09g.
Bangko Sental ng Pilipinas. (2017). 2014 Consumer Finance Survey. Bank for International Settlements. (2009). 79th Annual Report. Basel:
Switzerland. Bank for International Settlements. (February 2017). Distributed
ledger technology in payment, clearing and sSettlement: An analytical framework. Committee on Payments and Market Infrastructures. Basel: Switzerland.
Banerjoe, A. (1992). A Simple Model of Herd Behavior. Quarterly
Journal of Economics, 107, pp. 797-817. Bisias, D., Flood, M., Lo, A.W., and Valavanis, S. (January 2012). A
Survey of Systemic Risk Analytics. Office of Financial Research. Working Paper No. 0001. US Department of the Treasury.
Born, B., Ehrmann, M. and Fratzcher, M. (2013). Central Bank
Communication on Financial Stability. Econ J, 124: 701–734. doi:10.1111/ecoj.12039
Brownlees, C. and Engle, R. (March 2017). SRISK: a conditional capital
pitfall measure of systemic risk. European Systemic Risk Board. Working Paper Series No. 37.
Caballero, R.J. and Simsek, ALP. (December 2013). Fire Sales in a
Model of Complexity. The Journal of Finance. Vol. LXVIII, No. 6, pp. 2549-2587.
Cecchetti, S., Mohanty, M.S. and Zampolli, F. (September 2011). The real effects of debt. BIS Working Papers No 352. Basel: Switzerland.
Chandran, N. (June 2018). Has a US-China trade war begun? Experts
weigh in. Retrieved from https://www.cnbc.com/2018/06/18/us-china-trade-war-fears-rise-after-trumps-new-tariffs.html.
Claessens, S., Dell’Ariccia, G., Igan D., and Laeven, L. (2010). Lessons
and Policy Implications from the Global Financial Crisis. IMF Working Paper 10/44. Washington, DC: IMF.
Colliers International. (November 2017). Colliers Quarterly
Philippines| Residential 3Q 2017. Retrieved from: http://www.colliers.com/-/media/files/marketing%20reports/3q2017_colliers_quarterly_residential_final.pdf?la=en-GB.
Correa, R. et. al. (2017). Sentiment in Central Banks’ Financial Stability
Reports. International Finance Discussion Papers 1203. Danielsson, J., Valenzuela, M. and Zer, I. (2018). Learning from History:
Volatility and Financial Crises. Systemic Risk Centre Discussion Paper No. 57. London: Systemic Risk Centre.
Dell'Ariccia, G., Igan, D., and Laeven, L. (2012). Credit Booms and
Lending Standards: Evidence from the Subprime Mortgage Market. Journal of Money, Credit and Banking, Vol. 44, No. 3, pp. 367-84.
Dudley, W. (2009). Some Lessons from the Crisis. Remarks at the
Institute of International Bankers Membership Luncheon, New York on 13 October 2009. Retrieved from: http://www.bis.org/review/r091014a.pdf.
Dunkley, E., and Wildau, G. (January 2018). China faces refinancing
crunch with $2.7tn of bonds bearing down. Retrieved from https://www.ft.com/content/fd4499c0-01aa-11e8-9650-9c0ad2d7c5b5.
Financial Stability Board. (June 2017). Financial Stability Implications
from Fintech: Supervisory and Regulatory Issues that Merit the Authorities’ Attention.
Freixas, X. (2003). Crisis Management in Europe. In: Kremers, J.,
Schoenmaker, D., Wierts, P. (Eds.), Financial Supervision in Europe. Edward Elgar, Cheltenham, pp. 102–119.
Friedman, M. (1980). Video recording: Money and Inflation, Harcourt
Brace Jovanovich, made by WQLN. Retrieved from https://wwww.youtube.com/watch?v=B_nGEj8wIP0.
Gai, P., Haldane, A. and Kapadia, S. (May 2011). Complexity,
concentration and contagion. Journal of Monetary Economics. 58(5), pp. 453-470.
Hanson, S., Kashyap, A., and Stein, J. (2011). A Macroprudential
Approach to Financial Regulation. Journal of Economic Perspectives, 25, 3–28.
He, D. et. al., (2016). Virtual Currencies and Beyond: Initial
Considerations. IMF Discussion Paper 16/03. Washington, DC: IMF.
He, D., et. al., (2017). Fintech and Financial Services: Initial
Considerations. IMF Discussion Paper 17/05. Washington, DC: IMF.

2017 FINANCIAL STABILITY REPORT
Page 58
FINANCIAL STABILITY COORDINATION COUNCIL
Hokans, J. and Bankable Frontiers Associates. (July 2015). Country Diagnostic: Philippines. Development Results Focused Research Program. Better-Than-Cash Alliance.
Houben A., Kakes, J. and Schinasi, G. (June 2004). Toward a
Framework for Safeguarding Financial Stability. IMF Working Paper 04/101. Washington, DC: IMF.
IHS Markit. (May 2018). Nikkei Philippines Manufacturing PMI. Ingves, S. (May 2011). Central Bank Governance and Financial
Stability. BIS Study Group Report. Basel: Switzerland. IMF. (2017). Global Financial Stability Report. Is Growth at Risk?
Washington, DC: IMF Jeon, B., Olivero, M., and Wu, J. (2012). Multinational banking and the
international transmission of financial shocks: Evidence from foreign bank subsidiaries. Journal of Banking & Finance 37 (2013) 952–972.
Kumar, R. and Debroy, B. (1999). The Asian Crisis: An Alternative View.
ADB Economic Staff Paper, No. 59. Manila: ADB. McKinsey & Company. (December 2015). Cutting Through the Fintech
Noise: Markers of Success, Imperatives for Banks. Minsky, H. (May 1992). The Financial Stability Hypothesis. Levy
Economics Institute Working Paper No. 74. Levy Economics Institute of Bard College. Annandale-on-Hudson, NY.
Montes, M. (1998). Global Lessons of the Economic Crisis in Asia. Asia
Pacific Issues, No. 35. Honolulu: East-West Center. Nienaber, M. (May 2018). German growth halves in first quarter on
weak trade. Retrieved from https://uk.reuters.com/article/uk-germany-economy-gdp/german-growth-halves-in-first-quarter-on-weak-trade-idUKKCN1IG0OC
Office of Financial Research. (2012). Annual Report. Office of Financial Research. (February 2017). Cybersecurity and
Financial Stability: Risk and Resilience. OFR Viewpoint. Persson, M. (2009). Household indebtedness in Sweden and
implications for financial stability – the use of household-level data. BIS Papers No. 46. Basel: Switzerland.
Philippine Clearing House Corporation. (2016). Check Clearing Stats-
2016. Retrieved from: https//pchc.com.ph/category/publication/.
Philippine Statistics Authority. 2000 – 2015. Family Income and
Expenditure Survey. PricewaterhouseCoopers. (March 2016). Blurred lines: How Fintech is
shaping Financial Services. Global Fintech Report. Reinhart, C.M. and Rogoff, K.S. (September 2009). This Time is
Different: Eight Centuries of Financial Folly. Princeton University Press.
Rodrik, D. (2007). The Globalization Paradox: Democracy and the Future of World Economy. The Political Trilemma of the World Economy. US: W.W. Norton & Company, Inc.
Schinasi, G.J. (October 2004). Defining Financial Stability. IMF Working
Paper. Washington, DC: IMF. Schoenmaker, D. (2009). The Trilemma of Financial Stability. Working
Paper. Finance Department. VU University: Amsterdam, Schoenmaker, D. (April 2011). The financial trilemma. Elsevier B.V.
Economic Letters Volume 111 Issue 1 Pages 57-59. Schularick, M. and Taylor, A. (2012). Credit Booms Gone Bust:
Monetary Policy, Leverage Cycles, and Financial Crises, 1870-2008. American Economic Review, American Economic Association, vol. 102(2), pages 1029-61.
Statista (May 2018). Total Transaction Value in the Digital Payments
Segment. Retrieved from: https://www.statista.com/outlook/295 /123/fintech/philippines.
Suhartono, H., and Carson, R. (May 2018). Indonesian Rate Hike May
Slow, Not Stop, Foreign Funds Exit. Retrieved from https://www.bloomberg.com/news/articles/2018-05-18/indonesian-rate-hike-may-slow-not-stop-foreign-funds-fleeing
Svirydzenka, K. (2016). Introducing a New Broad-based Index for
Financial Development. Strategy, Policy and Review Department. IMF Working Paper 16/5. Washington, DC; IMF.
Taleb, N., Bar-Yam, Y., Douady, R., Norman, J., and Read, R. (July
2014). The Precautionary Principle: Fragility and Black Swans from Policy Actions. NYU Extreme Risk Initiative Working Paper. pp. 1-24.
Taleb, N. (2010). The Black Swan: The Impact of the Highly
Improbable. New York: Random House. Van den Hauwe, L. (December 2014). Understanding Financial
Instability: Minsky versus the Austrians. Munich Personal RePEc Archive Paper No. 69077.
Vercelli, A. (October 2009). A Perspective on Minsky Moments: The
Core of the Financial Instability Hypothesis in Light of the Subprime Crisis. The Levy Economics Institute of Bard College Working Paper No. 579. Annandale-on-Hudson, NY.
Zigrand, J. (2014). Systems and Systemic Risk in Finance and
Economics. Systemic Risk Centre Special Paper No. 1. London: Systemic Risk Centre, London School of Economics.

2017 FINANCIAL STABILITY REPORT
Page 2
FINANCIAL STABILITY COORDINATION COUNCIL
2017 FINANCIAL STABILITY REPORT
Page 3
FINANCIAL STABILITY COORDINATION COUNCIL
OFFICE OF SYSTEMIC RISK MANAGEMENT Technical Secretariat of the FSCC
Bangko Sentral ng Pilipinas 5th Floor Multi-storey Building, BSP Complex,
A. Mabini Street, Malate, 1004 Manila, Philippines
Telephone No.: (+632) 7087490 I Fax No.: (+632) 3062448 E-mail: [email protected]