FINANCIAL STABILITY REPORT - BOT
52
FINANCIAL STABILITY REPORT September 2016 ISSN 1821 - 7761 CMSA
Transcript of FINANCIAL STABILITY REPORT - BOT

Financial Stability Report - September 2016
1
FINANCIAL STABILITY REPORT
September 2016
ISSN 1821 - 7761
C M S A

Financial Stability Report - September 2016
2

Financial Stability Report - September 2016
3
FINANCIAL STABILITY REPORT
September 2016
ISSN 1821-7761
For any inquiry and comments contactDirectorate of Financial Stability
Bank of Tanzania2 Mirambo Street 11884, Dar es Salaam
Tel: +255 22 223 3471/2Fax: +255 223 4076http://www.bot.go.tz
C M S A

Financial Stability Report - September 2016
4

Financial Stability Report - September 2016
i
TABLE OF CONTENTS
LIST OF CHARTS, TABLES AND BOXES ............................................................................ ii
LIST OF ACRONYMS ............................................................................................................ iv
FOREWORD ......................................................................................................................... v
EXECUTIVE SUMMARY ........................................................................................................ vi
1.0 MACROECONOMIC AND FINANCIAL ENVIRONMENT ........................................... 1
1.1 Global Economic Developments ................................................................................ 1
1.2 Domestic Macroeconomic and Financial Environment ................................................. 3
2.0 PERFORMANCE OF THE FINANCIAL SECTOR ....................................................... 10
2.1 Banking Sector ............................................................................................................. 10
2.2 Non-Banking Financial Sector ....................................................................................... 18
2.3 Cross-Sector Linkages in the Financial System ............................................................. 26
3.0 FINANCIAL SYSTEM INFRASTRUCTURE AND REGULATORY
DEVELOPMENTS ........................................................................................................ 28
3.1 Payment Systems ........................................................................................................ 28
3.2 Financial System Regulatory Developments ............................................................... 28
4.0 FINANCIAL SYSTEM RESILIENCE AND RECOMMENDATIONS ....................... 30
4.1 Financial System Resilience .......................................................................................... 30
4.2 Financial Stability Outlook ............................................................................................ 31
APPENDICES ....................................................................................................................... 32

Financial Stability Report - September 2016
ii
LIST OF CHARTS, TABLES AND BOXES
CHARTSChart 1.1: World GDP Growth Rates .................................................................................. 2Chart 1.2: Economic Growth in Sub-Saharan Africa and EAC ........................................ 3Chart 1.3: Interbank Cash Market Rate from January 2014 to September 2016 ................ 4Chart 1.4: Developments of TZS Against US Dollar (Jan 2010 =100) ................................ 4Chart 1.5: Domestic Inflation Developments .................................................................... 5Chart 1.6: Quarterly GDP Growth Rates .......................................................................... 5Chart 1.7: Quarterly GDP Growth Rates ............................................................................ 6Chart 1.8: Zanzibar Inflation Rate Developments ............................................................... 6Chart 1.9 (a): Household Income and Debt to Income Ratio .................................................. 7Chart 1.9 (b): Salary Earners Sources of Income .................................................................... 7Chart 1.10 (a): Outstanding and Disbursed Loans ...................................................................... 7Chart 1.10 (b): Interest Rate and Maturity Profile of Personal Loans ........................................ 7Chart 1.11: Average Residential Property Sale Price in selected location in Dar es Salaam .. 8Chart 1.12 Average Commercial Property Vacant Space .................................................... 9Chart 1.13: Real estate loan development ........................................................................... 9Chart 2.1: EAC Capital Levels ................................................................................................. 12Chart 2.2: Banks’ Profitability ................................................................................................... 13Chart 2.3: Trend in Non-Performing Loans and NPLs Ratios ................................................ 13Chart 2.4: Credit and Non-Performing Loans for Selected Economic Activities as at end September 2016 ........................................................................................ 14Chart 2.5: Annual Growth of Credit in Selected Economic Activities ..................................... 14Chart 2.6: Development of Different Categories of Non-Performing Loans ............................ 15Chart 2.7: EAC NPLs to Gross Loans ................................................................................... 15Chart 2.8: Direction of Non-Performing Loans ....................................................................... 16Chart 2.9: Future Expectations ................................................................................................. 17Chart 2.10: Measures of Risk Diversification ............................................................................. 17Chart 2.11: Development of Tanzania Net Open Position to Total Capital .............................. 18Chart 2.12: Dar es Salaam Stock Exchange Turnover Ratio ...................................................... 19Chart 2.13: Performance of the Dar es Salaam Stock Exchange ............................................... 19Chart 2.14: Dar es Salaam Stock Exchange Investors’ Participation ........................................ 20Chart 2.15: Market Performance for Government Bonds ........................................................... 21Chart 2.16: Insurance Penetration and Density .......................................................................... 22Chart 2.17: Investment Mix ........................................................................................................ 23Chart 3.1: Performance of Payment Systems ........................................................................... 28

Financial Stability Report - September 2016
iii
TABLESTable 1.1: Global Real GDP Growth and Projections ............................................................ 1Table 2.1: Selected Financial Soundness Indicators for the Banking System (In Percent) ...... 10Table 2.2: Capital Adequacy Analysis ...................................................................................... 11Table 2.3: Open Ended Collective Investment Schemes ......................................................... 21Table 2.4: Insurance Performance ............................................................................................ 23Table 2.5: Financial Soundness Indicators of the Insurance Sector (General and Life) .......... 24Table 2.6: Tanzania Mainland: Social Security Selected Financial Indicators ......................... 25Table 2.7: Tanzania Mainland: Social Security Portfolio Investment Mix ............................... 26Table 2.8: Financial Interconnectedness (Top Ten Banks) ....................................................... 27Table 4.1: Shock Calibration .................................................................................................... 30Table 4.2: Summary of Stress Testing Results ......................................................................... 31
BOXESBox 1.1: Household Sector Financial Conditions .................................................................. 7Box 1.2: Real Estate Sector Developments ........................................................................... 8Box 2.1: Loan Officers’ Opinion Survey ................................................................................ 16
APPENDICESAppendix 1: Global Economic Performance (Real growth rates in percent) ........................... 32Appendix 2: Annual GDP Performance by Economic Activity - Tanzania Mainland ................. 33Appendix 3: Annual GDP Performance by Economic Activity – Zanzibar ............................... 34Appendix 4: Quarterly Performance of Dar es Salaam Stock Exchange ................................... 35Appendix 5: Tanzania Mainland: Trend of Social Security Investment Portfolio ........................ 36

Financial Stability Report - September 2016
iv
LIST OF ACRONYMS
CMSA - Capital Market and Securities AuthorityDIB - Deposit Insurance BoardDSE - Dar es salaam Stock ExchangeEAC - East African CommunityEPOCA - Electronic and Postal CommunicationsFDI - Foreign Direct InvestmentFSR - Financial Stability Report GDP - Gross Domestic ProductGFC - Global Financial CrisisGPW - Gross Premium WrittenHHI - Hefindahl Hinchman Index IMF - International Monetary FundLHS - Left Hand SideMCB - Mufindi Community BankMFIs - Micro Finance InstitutionsMFS - Mobile Financial ServicesMNOs - Mobile Network OperatorsNPLs - Non- Performing LoansPSPF - Public Service Provident FundRHS - Right Hand SideROE - Return on Equity ROI - Return on Investment SACCOS - Savings and Credit Co-operative SocietiesSADC - Southern African Development CommunitySDC - Sovereign Debt CrisisSSRA - Social Security Regulatory Authority TBL - Tanzania Breweries LimitedTCC - Tanzania Cigarette Company LimitedTFSF - Tanzania Financial Stability ForumTIRA - Tanzania Insurance Regulatory AuthorityTISS - Tanzania Interbank Settlement SystemTOL - Tanzania Oxgen LimitedTPCC - Tanzania Portland Cement Company LimitedTRWA - Total Risk Weighted AssetsTZS - Tanzania ShillingUS - United States USD - United States Dollar

Financial Stability Report - September 2016
v
FOREWORD
The Bank of Tanzania with other members of the Tanzania Financial Stability Forum (TFSF)1 continue to commit efforts towards maintaining a strong financial system that is resilient to shocks and facilitates efficient financial intermediation in order to maintain confidence in the system and supports sustainable economic growth. To that end, the Forum members continue to monitor the financial system with a view to identifying risks and devising mitigation policy actions.
Since the last Financial Stability Report of March 2016, the financial sector remained sound and stable despite challenging market conditions both globally and domestically. Although share prices in the Dar es Salaam Stock Exchange (DSE) declined, non-residents continued to participate actively signifying investors’ positive outlook of the domestic market. Strong capital position cushioned the banking system against rising Non-Performing Loans (NPLs). However, this remains a concern, and the Bank has taken several measures to address this including close monitoring with a focus on sound lending standards and risk management practices aimed at bringing the overall NPLs ratio to around 5 percent in the medium-term.
During the period, the Bank started to implement the Payment Systems Licensing and Approval Regulations, 2015 that have provided a regulatory framework to support the ongoing financial innovations, while fostering stability of the financial system. The innovations will enable banks to intensify deposit mobilization efforts, thus reducing reliance on non-core source of funds, notably from public institutions.
The Bank is also spearheading efforts towards establishing a National Switch to facilitate interoperability for mobile banking and mobile payment systems. The move will complement the existing interoperability arrangements between Vodacom, Tigo/Zantel and Airtel in facilitating wallet-to-wallet transfer across networks. The interoperability will enhance efficiency of digital financial services and increase usage of mobile money.
Regarding social security sector, governance has been strengthened with a view to enhancing pension schemes sustainability and protect members’ benefits. This was done through issuance of the Social Security Schemes (Administrative Expenses) Guidelines, 2016 which, among others, limit annual administrative expenses of the sector to 10.0 percent of total annual contribution income. In the same vein, the Insurance Regulator has enforced timely remittance of premiums by brokers to insurance companies to foster liquidity positions of the sector.
It is my sincere anticipation that this Report will stimulate broad-based discussions and enhance awareness of risks among market participants.
Prof. Benno Ndulu,Governor and Chairman of TFSF
1 Composed of the Ministry of Finance and Planning-URT, Ministry of Finance and Planning-RGoZ, Capital Markets and Securities Authority, Tanzania Insurance Regulatory Authority, Social Security Regulatory Authority, Deposit Insurance Board and Bank of Tanzania.

Financial Stability Report - September 2016
vi
EXECUTIVE SUMMARY
Risks to global economic and financial environment moderated in the short run but remain elevated in the medium term. In the past nine months to September 2016, risks to global macro-financial environment subsided helped by recovery of commodity prices, and expectation for prolonged accommodative monetary policy in advanced economies. In addition, the impact on Brexit was minimum as markets adjusted swiftly. The outlook has weakened modestly with growth expected to slow down to 3.1 percent in 2016, a 0.1 percentage point below the April 2016 World Economic Outlook (WEO) projections. However, medium term risks are expected to intensify due to political and policy uncertainties surrounding the US post-presidential elections with potential increase in protectionism sentiments, UK’s future association with European Union and political process in the two largest economies (Germany and France) in the Euro area.
Weak global economic environment and delayed policy responses pose potential risk to growth in Sub-Saharan Africa (SSA). Growth in SSA deteriorated in the first three quarters of 2016, due to weak external environment characterized by low commodity prices, and tight global financial conditions which resulted in reduced access to international markets’ funding for the region. In addition, the subdued commodity prices continued to affect income of commodity rich countries, including the three largest economies of Angola, Nigeria and South Africa, with deficit widening leading to noticeable build-up of debts. This was compounded by delays in policy response to address fiscal and external imbalances, thus dampening regional growth, and its prospects to a level not observed since 1994, at 1.4 percent from 3.0 percent, which was projected in the April 2016 WEO. Recent tightening of monetary policy in the US may affect the regional securities markets and strengthening the US dollar against their currencies, thus adding more pressure on the already high fiscal burden.
Growth outlook in the EAC region remains strong albeit with elevated credit risk. In the first nine months of 2016, the region recorded an average growth of 5.3 percent, benefiting from low oil import bill, stable exchange rates and continued infrastructure investment, despite slow credit growth characterized by decline in asset quality. In addition, the immediate impact of Brexit on the EAC currencies, which appreciated sharply against GBP, was transitory and it was slowly reversing. However, expected strengthening of the US dollar following monetary policy normalization may put the region under renewed stress if it materialises. Risks to domestic economy moderated underpinned by conducive macro-economic environment but remain vulnerable to external shocks. In the six months to September 2016, inflation remained subdued averaging 5.0 percent compared with 5.8 percent in the corresponding period in 2015. In the same period, the current account deficit narrowed to USD 1,385.1 million compared to USD 2,480.0 million, which helped to stabilize the exchange rate. Enabling macroeconomic environment and relatively improved power supply supported growth momentum and financial sector to remain generally sound. Growth is projected to remain strong at 7.2 percent in 2016, fostered by ongoing infrastructure investments with buoyant export earnings, and declining import bill, while inflation is projected to remain at single digits’ level. However, the ongoing tightening of monetary policy in the US may expose the economy to exchange rate risks and heighten public and private dollar denominated debt burden.

Financial Stability Report - September 2016
vii
Risks stemming from household financial conditions increased, amplifying exposure of the banking sector to credit risks. The survey on household (salary earners as proxy) financial conditions, conducted by the Bank of Tanzania in October 2016 using information on personal loans for the period up to September 2016, gathered from 58 commercial banks revealed that personal loans increased relative to income (salary and other benefits) resulting to increased debt to income ratio, thus heightening banking sector exposure to credit risk.
Banking sector remained sound albeit exposed to increased non-performing loans. The banking sector remained strong with adequate capital and liquidity buffers above regulatory minimums, which helped the sector to strengthening its resilience against rising non-performing loans; the sector was also resilient even under various adverse but plausible shocks. Capital and liquidity ratios for the sector were 17.3 percent and 34.2 percent against regulatory requirements of 10.0 percent and 20.0 percent, respectively. The ratio of non-performing loans to gross loan increased to 9.1 percent as at end September 2016 from 7.5 percent in March 2016 with a large proportion provisioned to loans extended to trade, agriculture and manufacturing activities, as well as personal loans. It is worth noting that the increase in NPLs compelled banks to enhance their credit recovery efforts and tightening credit conditions as supported by Loan Officers’ Opinion Survey, conducted by the Bank of Tanzania in August 2016.
Risks in the equity market remained high attributable to decline in share prices. Domestic market capitalization decreased by 4.3 percent in six months to September 2016 as share prices of domestic companies notably SWISSPORT (13.0 percent), TPCC (12.0 percent), TBL (6.0 percent), TCC (3.0 percent), MCB (15.0 percent) and TOL (8.0 percent) declined associated with a relative decline in profitability. The decline in share prices continued to affect return on investments for social security schemes, insurance companies and collective investment schemes. However, this does not pose significant risks due to diversified investment portfolio of the schemes.
Insurance sector remained resilient as reflected by financial soundness indicators. The sector remained solvent with adequate liquidity and diversified investment portfolio. Capital adequacy, as measured by solvency ratio, was 62.7 percent for general insurers and 24.0 percent for life insurers, being above the minimum prudential requirement of 25.0 percent and 8.0 percent, respectively. This was attributed to relative profitability, and capital enhancement, which also boosted the sector’s ability to withstand adverse deviations of actuarial liabilities. The ratio of actuarial provisions to capital stood at 42.8 percent in September 2016 compared to 39.3 percent in September 2015, which were within the statutory maximum limit of 250.0 percent. On the other hand, liquidity ratio was 103.2 percent, which was above regulatory requirement of at least 95.0 percent; however, the sector remained exposed to liquidity risks due to high potential for late remittance of insurance premiums by brokers, who intermediate about 70 percent of the insurance business.
Social Security Sector improved in terms of operational efficiency amid a decline in return on investment. The sector’s operational efficiency increased as depicted by a decline in the ratio of administrative cost to contributions to 8.6 percent in June 2016 from 11.8 percent in December 2015. This improvement was associated with the sector’s re-alignment with the new Social Security Schemes (Administrative Expenses) Guidelines, 2016. The Guidelines, among others, limit annual administration expenses to 10.0 percent of total annual contribution income. However, the sector experienced a decline in investment return partly on account of a decrease in share prices in the equity market.

Financial Stability Report - September 2016
viii
In summary, risks to global economic environment were contained during the past six months to September 2016, aided by recovery of commodity prices, stable exchange rate environment and longer than expected accommodative monetary policy in advanced countries. As a result, global growth remained modest with stable financial markets thus posing low risk to domestic financial system and exchange rate. In contrast, the banking sector exposure to credit risk heightened as depicted by rising NPLs compounded by increase in personal loans relative to income whereas Non-Bank Financial Institutions were exposed to decline in relative share prices but its impact was moderate due to diversified investment portfolio. The identified risks presented in the financial stability risk map here under shows two areas of heightened risks, the household and banking sectors as explained by the reasons outlined earlier.
Financial Stability Risk Map
0.0
2.0
4.0
6.0
8.0
10.0Macro-economic risk
Households debt risk
Banking sector riskNon-banks sector risks
Capital Markets risk
2016Q1 2016Q3
Financial Stability Outlook In the next six months to March 2017, risks stemming from macroeconomic environment are expected to abate on account of moderate global growth and recovery of commodity prices. Strong capital base will cushion banks against potential risks while the ongoing credit recovery efforts and enhancement of credit standards are expected to improve the quality of banking sector assets. Measures taken by TIRA to address late remittance of premium by brokers to insurance companies will lower liquidity risk in the insurance sector. Share prices in the DSE are likely to adjust to normal trends while new listings of telecommunication companies and participation of EAC investors may create future potential improvement in the activities of the bourse in the medium term. In view of this outlook, the financial system is set to remain stable. However, the end of quantitative easing in the US may lead to potential capital reversals and increase cost of borrowing in the global financial markets thus warranting close monitoring.

Financial Stability Report - September 2016
1
1.0 MACROECONOMIC AND FINANCIAL ENVIRONMENT
1.1 Global Economic DevelopmentsGlobal economic and financial environment risks will intensify in the medium term despite short-term improvement. In the past nine months to September 2016, risks to global macro-financial environment were contained due to markets resilience to the downward pressure on global interest rates and improved market sentiment towards emerging markets, reduced concerns about China’s short-term policies to support growth and recovery of commodity prices. Global outlook slightly deteriorated reflecting sluggish growth in advanced economies, weak global trade, diminishing capital flows and Brexit contagion. Accordingly, in its October 2016 World Economic Outlook, the IMF revised global growth for 2016 downward to 3.1 percent from 3.2 percent projected in April 2016 (Table 1.1 and Chart 1.1). However, political and policy uncertainties, particularly in the US and some European countries (German and France) may weigh further growth prospects in the medium term.
In advanced economies, risks to growth remained moderate albeit policy and political uncertainty. During the period, growth momentum in the U.S has slowed restrained by weakness in investment demand, the impact of strong dollar in export-oriented industries and financial market volatility. In the Euro area domestic demand decelerated, corporate sector productivity and confidence slowed and the banking sector remained fragile partly reflecting low profitability, compounded by large stock of Non-Performing Loans (NPLs). The outlook weakened modestly with growth expected to slow down to 1.6 percent in 2016, a 0.3 percentage point below the April, 2016 WEO projections, with monetary policy remaining accommodative for a longer period than previously expected. Uncertainty surrounding the US post presidential elections, UK’s future association with European Union and political process in the two largest economies in the Euro area (Germany and France) could further derail growth prospects.
Table 1.1: Global Real GDP Growth and ProjectionsPercent
2010 2011 2012 2013 2014 2015
2016 2017
World 5.4 4.2 3.4 3.3 3.4 3.2 3.1 3.4Advanced Economies 3.1 1.7 1.2 1.1 1.8 2.1 1.6 1.8United States 2.5 1.6 2.2 1.5 2.4 2.6 1.6 2.2Euro Area 2.0 1.6 -0.8 0.3 0.9 2.0 1.7 1.5Japan 4.7 -0.5 1.7 1.6 -0.1 0.5 0.5 0.6United Kingdom 1.9 1.6 0.7 1.7 3.0 2.2 1.8 1.1Emerging Market & Developing Economies 7.5 6.3 5.2 5.0 4.6 4.0 4.2 4.6China 10.6 9.5 7.7 7.7 7.3 6.9 6.6 6.2India 10.3 6.6 5.6 6.6 7.2 7.6 7.6 7.6Sub-Saharan Africa 6.6 5.0 4.3 5.2 5.1 3.4 1.4 2.9South Africa 3.0 3.2 2.2 2.2 1.5 1.3 0.1 0.8
Projections
Source: IMF, World Economic Outlook, October 2016
Financial Stability Report - September 2016
2
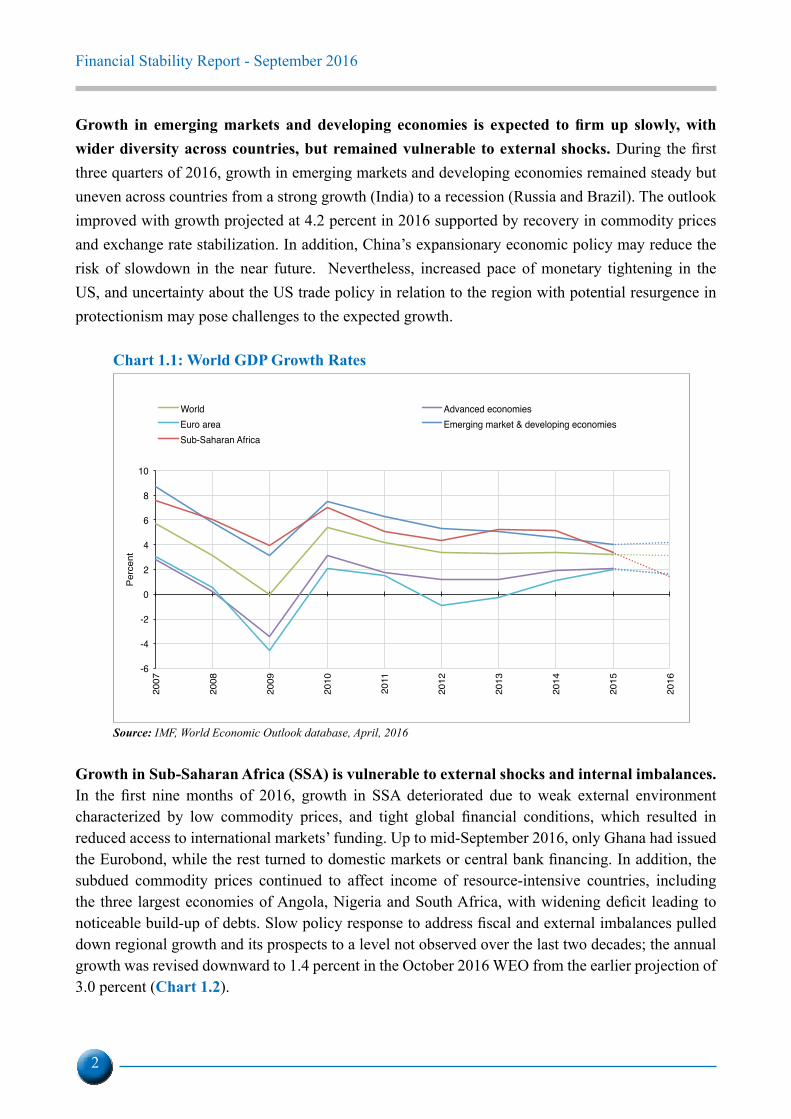
Growth in emerging markets and developing economies is expected to firm up slowly, with wider diversity across countries, but remained vulnerable to external shocks. During the first three quarters of 2016, growth in emerging markets and developing economies remained steady but uneven across countries from a strong growth (India) to a recession (Russia and Brazil). The outlook improved with growth projected at 4.2 percent in 2016 supported by recovery in commodity prices and exchange rate stabilization. In addition, China’s expansionary economic policy may reduce the risk of slowdown in the near future. Nevertheless, increased pace of monetary tightening in the US, and uncertainty about the US trade policy in relation to the region with potential resurgence in protectionism may pose challenges to the expected growth.
Chart 1.1: World GDP Growth Rates
-6
-4
-2
0
2
4
6
8
10
2007
2008
2009
2010
2011
2012
2013
2014
2015
2016
Perc
ent
World Advanced economiesEuro area Emerging market & developing economiesSub-Saharan Africa
Source: IMF, World Economic Outlook database, April, 2016
Growth in Sub-Saharan Africa (SSA) is vulnerable to external shocks and internal imbalances. In the first nine months of 2016, growth in SSA deteriorated due to weak external environment characterized by low commodity prices, and tight global financial conditions, which resulted in reduced access to international markets’ funding. Up to mid-September 2016, only Ghana had issued the Eurobond, while the rest turned to domestic markets or central bank financing. In addition, the subdued commodity prices continued to affect income of resource-intensive countries, including the three largest economies of Angola, Nigeria and South Africa, with widening deficit leading to noticeable build-up of debts. Slow policy response to address fiscal and external imbalances pulled down regional growth and its prospects to a level not observed over the last two decades; the annual growth was revised downward to 1.4 percent in the October 2016 WEO from the earlier projection of 3.0 percent (Chart 1.2).

Financial Stability Report - September 2016
3
Chart 1.2: Economic Growth in Sub-Saharan Africa and EAC
0
1
2
3
4
5
6
7
8
2009
2010
2011
2012
2013
2014
2015
2016
Per
cent
Sub-Sahara Africa Overall EAC
Source: IMF, World Economic Outlook database, April 2016
Growth outlook in the EAC region remain strong albeit with elevated credit risk. The EAC region continued to perform well in the first nine months of 2016, recording an average growth of 5.3 percent benefiting from low oil import bill, stable exchange rate and continued infrastructure investment. However, the region experienced slow credit growth amid decline in asset quality. The region also felt the immediate but transitory impact of Brexit as their currencies appreciated sharply against GBP, but the effect was slowly reversing. For example, the Tanzanian Shilling appreciated against GBP by 11.9 percent from TZS 3,207.58 in June 2016 to TZS 2,825.85 in September 2016. However, the overall impact to the domestic economy was small as the share of trade between Tanzania and UK is relatively small at 0.5 percent of total exports and 1.7 percent of imports.
1.2 Domestic Macroeconomic and Financial EnvironmentDomestic economy is expected to remain strong but vulnerable to external shocks. During the six months’ period to end September 2016, inflation remained subdued averaging 5.0 percent compared with 5.8 percent in the corresponding period in 2015. In the same period, the current account deficit narrowed to USD 1,385.1 million compared to USD 2,480 million recorded in the corresponding period in 2015, which aided stabilization of the exchange rate (Chart 1.4 and 1.5). Enabling macroeconomic environment and relatively improved power supply helped to maintain growth momentum and financial sector to remain generally sound (Chart 1.6). Few episodes of liquidity squeeze among banks were observed during the period, associated with seasonal movements of cash from banks to the public for crops purchase and enhanced public expenditure management, which were smoothened by monetary policy actions, thereby reducing the spread in the interbank cash market (Chart 1.3). Growth is projected to remain strong at 7.2 percent in 2016, anchored by ongoing infrastructure investments with buoyant export earnings, and declining import bill, while inflation is projected to remain at single digits’ level. However, the ongoing tightening of monetary policy in the US may expose the economy to exchange rate risks and heighten public and private dollar denominated debt burden.

Financial Stability Report - September 2016
4
Chart 1.3: Interbank Cash Market Rate from January 2014 to September 2016
0
7
13
20
27
34
40
-500
0
500
1000
1500
2000
2500
2-Ja
n-14
2-Fe
b-14
2-M
ar-1
42-
Apr-1
42-
May
-14
2-Ju
n-14
2-Ju
l-14
2-Au
g-14
2-Se
p-14
2-O
ct-1
42-
Nov
-14
2-D
ec-1
42-
Jan-
152-
Feb-
152-
Mar
-15
2-Ap
r-15
2-M
ay-1
52-
Jun-
152-
Jul-1
52-
Aug-
152-
Sep-
152-
Oct
-15
2-N
ov-1
52-
Dec
-15
2-Ja
n-16
2-Fe
b-16
2-M
ar-1
62-
Apr-1
62-
May
-16
2-Ju
n-16
2-Ju
l-16
2-Au
g-16
2-Se
p-16
IBC
M ra
te (%
)
Spre
ad
Spread IBCM rate
Source: Bank of Tanzania
Chart 1.4: Developments of TZS Against US Dollar (Jan 2010=100)
1,500
1,600
1,700
1,800
1,900
2,000
2,100
2,200
2,300
2-Ja
n-14
2-Fe
b-14
2-M
ar-1
42-
Apr-1
42-
May
-14
2-Ju
n-14
2-Ju
l-14
2-Au
g-14
2-Se
p-14
2-O
ct-1
42-
Nov-
142-
Dec-
142-
Jan-
152-
Feb-
152-
Mar
-15
2-Ap
r-15
2-M
ay-1
52-
Jun-
152-
Jul-1
52-
Aug-
152-
Sep-
152-
Oct
-15
2-No
v-15
2-De
c-15
2-Ja
n-16
2-Fe
b-16
2-M
ar-1
62-
Apr-1
62-
May
-16
2-Ju
n-16
2-Ju
l-16
2-Au
g-16
2-Se
p-16
TZS/
USD
Source: Bank of Tanzania

Financial Stability Report - September 2016
5
Chart 1.5: Domestic Inflation Developments
02468
1012141618
Sep-
12N
ov-1
2Ja
n-13
Mar
-13
May
-13
Jul-1
3Se
p-13
Nov
-13
Jan-
14M
ar-1
4M
ay-1
4Ju
l-14
Sep-
14N
ov-1
4Ja
n-15
Mar
-15
May
-15
Jul-1
5Se
p-15
Nov
-15
Jan-
16M
ar-1
6M
ay-1
6Ju
l-16
Sep-
16
Perc
ent
Headline Food Non-food
Source: National Bureau of Statistics and Bank of Tanzania
Chart 1.6: Quarterly GDP Growth RatesPercent
7.1
3.5
5.54.4
6.3 5.9
7.2
9.6
8.2
10.1
5.7
4.0
5.7 5.9
7.3
9.0
5.5
7.9
Q1 Q2 Q3 Q4 Q1 Q2 Q3 Q4 Q1 Q2 Q3 Q4 Q1 Q2 Q3 Q4 Q1 Q2
2012 2013 2014 2015 2016
Source: National Bureau of Statistics and Bank of Tanzania
Zanzibar economic growth moderated and projected to remain strong. In the first half of 2016, real GDP grew by an average of 5.6 percent compared with 9.9 percent registered in the similar period in 2015. The slowdown was primarily attributable to completion of various construction projects and decline in airtime usage, which affected construction and information and communication activities, respectively. Inflation was 4.0 percent in September, 2016 compared with 8.1 percent recorded in the corresponding period in 2015.

Financial Stability Report - September 2016
6
Chart 1.7: Quarterly GDP Growth Rates Percent
10.2
4.12.7
11.7
14.0
5.8
7.4
2.7
9.610.3
4.3
2.2
5.26.2
Q1 Q2 Q3 Q4 Q1 Q2 Q3 Q4 Q1 Q2 Q3 Q4 Q1 Q2
2013 2014 2015 2016
Source: Office of Chief Government Statistician (OCGS)
The current account deficit narrowed to USD 6.4 million in September 2016 from USD 182.4 million recorded in September 2015, driven by surge in exports of goods and services. This was attributed to increase in cloves exports, which went up by 49.4 percent coupled by decline in imports of goods and services by 26.4 percent.
Zanzibar economy is projected to grow by 6.3 percent in 2016, which is below the growth rate of 6.6 percent registered in 2015 due to among others, decrease in the growth rates of construction activities, information and communication, electric power supply and livestock while inflation is projected to remain at single digit level.
Chart 1.8: Zanzibar Inflation Rate Developments
-5
0
5
10
15
20
Sep-
12
Nov
-12
Jan-
13
Mar
-13
May
-13
Jul-1
3
Sep-
13
Nov
-13
Jan-
14
Mar
-14
May
-14
Jul-1
4
Sep-
14
Nov
-14
Jan-
15
Mar
-15
May
-15
Jul-1
5
Sep-
15
Nov
-15
Jan-
16
Mar
-16
May
-16
Jul-1
6
Sep-
16
Perc
ent
Headline Food Non-Food
Source: Office of Chief Government Statistician (OCGS).

Financial Stability Report - September 2016
7
Box 1.1: Household Sector Financial Conditions
Household financial conditions survey is one of macro-prudential tools that the Bank of Tanzania uses to monitor and identify vulnerabilities arising from the household sector. To achieve this objective, the Bank conducted a survey in October 2016 covering 58 selected banking institutions. The collected information covered income levels of salary earners (wages and other sources), their savings pattern, and borrowing which fall under personal loans category.
Survey Findings The information gathered from the survey revealed that the major source of borrowers’ income was salaries and wages, which constituted about 92.0 percent of sources of income. In the twelve months to September, 2016 personal loans increased relative to income growth, thus pushing upward the debt to income ratio (Chart 1.9 (a) and (b)). In addition, the results showed that personal savings declined and banks reduced the volume of new loans (Chart 1.10 (a) and (b)).
Chart 1.9 (a): Household Income and Debt to Income Ratio
Chart 1.9 (b):Salary Earners Sources of Income
6.2
6.4
6.6
6.8
7.0
7.2
7.4
7.6
7.8
8.0
8.2
0
50
100
150
200
250
300
350
2013 2014 2015 2016 (Sep)
Perc
ent
Billio
ns T
ZS
Salary earners' income (LHS) Debt to income ratio (RHS)
05
1015202530354045
Salarie
s and
Wag
es
Bussin
ess a
ctivitie
s
Pensio
n and
othe
r ben
efits
Dividen
ds
Remita
nces
from ab
road
Farming
and a
gricu
lture
Renta
incom
e
Perc
ent
Source: BoT Survey
Chart 1.10 (a): Outstanding and Disbursed Loans
Chart 1.10 (b) Interest Rate and Maturity Profile of Personal Loans
0
500
1000
1500
2000
2500
3000
2013 2014 2015 2016 (Sep)
Billio
ns T
ZS
Disbursed Outstanding
28.8 30.534.0
39.2
16 17 17 18
5
10
15
20
25
30
35
40
45
50
0
5
10
15
20
25
30
35
40
45
2013 2014 2015 2016 (Sep)
Perc
ent
Mon
ths
Maturity Interest rate (RHS)
0
500
1000
1500
2000
2500
3000
2013 2014 2015 2016 (Sep)
Billio
ns T
ZS
Disbursed Outstanding
28.8 30.534.0
39.2
16 17 17 18
5
10
15
20
25
30
35
40
45
50
0
5
10
15
20
25
30
35
40
45
2013 2014 2015 2016 (Sep)
Perc
ent
Mon
ths
Maturity Interest rate (RHS)
Source: BoT Survey

Financial Stability Report - September 2016
8
The survey findings suggest that banks are exposed to credit and liquidity risk due to increasing debt to income ratio and decline in personal savings, respectively. However, banks have taken mitigation measures including restructuring of non-performing loans and enhancement of lending standards which is also supported by the Loan Officers Opinion Survey conducted in August 2016
Box 1.2: Real Estate Sector Developments
In October 2016, the Bank of Tanzania conducted an interview with a leading real estate agent in the country - Dar Property -, complemented by secondary data with a view to assess property market conditions. Analysis of the information revealed that, selling prices for residential properties in prime areas exhibited a declining trend attributable to gradual increase in supply of properties, hence providing clients with a wider choice (Chart 1.11).
Chart 1.11: Average Residential Property Sale Price in selected location in Dar es Salaam
0
20
40
60
80
100
120
Masak
i
Oysterb
ay
Ada Esta
te
Msasa
ni
Upang
a
Mikoch
eni
Kawe
Mbezi B
each
Kijitony
ama
Sinza
USD
'000
/100
sqm
2013 2014 2015 2016(Sep)
Source: Dar Property
The information obtained from the agent further revealed that there was a rapid increase in vacant spaces for commercial properties (Chart 1.12). The findings are consistent with the mini survey results obtained from key real estate developers, conducted by the Bank in March 2016. The findings suggest that rental prices per square meter remained high, compelling some businesses to opt for outskirts. The increase in vacant space may affect returns on investment for financial institutions with large investment in commercial properties.

Financial Stability Report - September 2016
9
Chart 1.12 Average Commercial Property Vacant Space
1213
1215
21
37
0
5
10
15
20
25
30
35
40
2011 2012 2013 2014 2015 2016
Perc
ent
Source: Dar Property
It is worth noting that the ratio of real estate credit to total private sector credit was 4.64 percent or TZS 761.89 billion, implying low level of exposure by the banking sector. However, decline in property prices exposes the sector to credit risk through collateralized properties.
Chart 1.13: Real estate loan development
0
100
200
300
400
500
600
700
800
Mar
-10
Jun-
10Se
p-10
Dec
-10
Mar
-11
Jun-
11Se
p-11
Dec
-11
Mar
-12
Jun-
12Se
p-12
Dec
-12
Mar
-13
Jun-
13Se
p-13
Dec
-13
Mar
-14
Jun-
14Se
p-14
Dec
-14
Mar
-15
Jun-
15Se
p-15
Dec
-15
Mar
-16
Jun-
16Se
p-16
Billio
ns T
ZS
Source: Tanzania Mortgage Refinance Company Ltd, 2016

Financial Stability Report - September 2016
10
2.0 PERFORMANCE OF THE FINANCIAL SECTOR
Financial sector total assets increased by 1.9 percent to TZS 39,424.1 billion as at end September 2016, from March 2016 position. The banking sector continued to play a dominant role during the period, although, its market share slightly declined to 70.3 percent, from 71.4 percent. Meanwhile the share of Social Security increased to 27.0 percent from 26.0 percent, mainly on account of an increase in investment income and members’ contributions which were invested in favour of government securities. Insurance and collective investment schemes remained broadly unchanged at 2.0 percent and 0.7 percent, respectively.
2.1 Banking SectorDuring the period, the sector generally maintained relatively high level of capital and liquidity buffers above regulatory minimums despite an increase in non-performing loans in the recent quarters that reduced profitability (Table 2.1).
Table 2.1: Selected Financial Soundness Indicators for the Banking System (In Percent)
Indicator Statutory Requirement
2015 2016
Mar Jun Sep Dec Mar Jun Sep
1. CAPITAL ADEQUACY
Core Capital/TRWA Min 10.0 17.9 16.1 16.7 17.5 18.0 17.2 17.3
Total capital/TRWA Min 12.0 19.1 17.6 18.7 19.5 20.0 19.2 19.1
2. LIQUIDITY
Liquid Assets/Demand Liabilities Min 20.0 35.5 37.3 35.7 37.2 37.0 37.0 34.2
Total Loans/Customer Deposits 76.8 76.6 78.9 78.9 82.6 85.8 87.1
3. EARNINGS AND PROFITABILITY
Net Interest Margin (NIM) 67.5 65.9 67.1 67.0 65.6 68.0 69.3
Non-Interest Expenses/Gross Income 63.8 65.1 67.2 68.1 63.1 64.7 66.9
Personnel expenses to non-interest expenses 44.6 45.9 44.7 44.1 45.5 45.4 44.9
Return on Assets (PBT/Average Total Assets) 3.1 2.9 2.7 2.7 3.2 3.0 2.5
Return on Equity-ROE (PAT/Average Shareholders’ funds) 16.2 15.1 13.5 13.0 16.9 15.4 12.1
4. ASSET COMPOSITION AND QUALITY
Foreign Exchange Loans to Total Loans 37.5 38.6 37.8 38.0 37.8 36.7 36.1
Gross Non-Performing Loans to Gross Loans 5.0 acceptable 6.5 6.6 6.8 6.6 7.5 8.7 9.1
NPLs net of provisions/Total Capital 14.0 16.5 15.7 14.2 17.0 21.1 22.0
Large Exposures to Total Capital 137.0 124.0 126.8 124.1 128.7 128.6 125.3
Net Loans and advances to Total assets 53.3 53.2 54.6 54.7 55.1 56.2 56.5
5. SENSITIVITY TO MARKET RISK
FX Currency Denominated Assets/Total Assets 31.7 34.2 34.9 34.7 33.6 32.0 31.6
FX Currency Denominated Liabilities/Total Liabilities 37.6 39.8 39.6 39.7 38.9 37.8 38.9
Net Open Positions in FX/Total Capital 7.5 -2.1 -2.2 -2.4 1.3 -1.1 1.4 -2.4
Source: Bank of Tanzania

Financial Stability Report - September 2016
11
The sector continued to maintain adequate capital save for few banks. Core capital to risk weighted assets remained strong at 17.3 percent in September 2016, which was above the regulatory requirement of 10.0 percent. The strong capital buffer was partly attributable to capital enhancement by some banks through retained earnings and capital injections to match with risk appetite. Top ten banks, which accounted for about 68.3 percent of banking sector assets, maintained their capital above minimum regulatory requirements, while some of the small size banks maintained capital levels below the regulatory requirement (Table 2.2). It is worth noting that Kenya and Uganda maintained similar pattern of capital levels (Chart 2.1).
Table 2.2: Capital Adequacy AnalysisSelected Banks Sep-15 Mar-16 Sep-16 Percent Core Capital Total Capital Core Capital Total Capital Core Capital Total Capital
<8 8 8 7 7 8 8
8-10 1 1 1 0 1 2
10-12 6 5 3 3 2 2
12-14 3 2 5 5 8 6
>14 23 25 25 26 22 23
Large Banks
Sep-15 Mar-16 Sep-16
Percent Core Capital Total Capital Core Capital Total Capital Core Capital Total Capital
<8 0 0 0 0 0 0
8-10 0 0 0 0 0 0
10-12 0 1 0 0 0 0
12-14 3 0 1 1 2 2
>14 7 9 9 9 8 8
Medium Banks
Sep-15 Mar-16 Sep-16
Percent Core Capital Total Capital Core Capital Total Capital Core Capital Total Capital
<8 0 0 0 0 0 0
8-10 0 0 0 0 0 0
10-12 3 3 2 2 1 1
12-14 0 0 2 2 3 2
>14 7 7 6 6 6 7Small Banks
Sep-15 Mar-16 Sep-16
Percent Core Capital Total Capital Core Capital Total Capital Core Capital Total Capital
<8 8 8 7 7 8 8
8-10 1 1 1 0 1 2
10-12 3 1 1 1 1 1
12-14 0 2 2 2 3 2>14 9 9 10 11 8 8
Source: Bank of Tanzania

Financial Stability Report - September 2016
12
Chart 2.1: EAC Capital Levels
15161718192021222324
Mar-15
Apr-15
May-15
Jun-1
5Ju
l-15
Aug-15
Sep-15
Oct-15
Nov-15
Dec-15
Jan-1
6
Feb-16
Mar-16
Apr-16
May-16
Jun-1
6Ju
l-16
Aug-16
Sep-16
Perc
ent
Tanzania Kenya Uganda
Source: Bank of Tanzania
Liquidity risk remained low along with increasing access to non-deposit funding. The liquidity ratio was 34.2 percent at end September 2016, which was above regulatory requirement of 20.0 percent. On the other hand, loan-to-deposit-ratio continued to grow reaching 87.1 percent at end September 2016, a trend that was supported by alternative funding sources notably bond issuance and off shore borrowing.
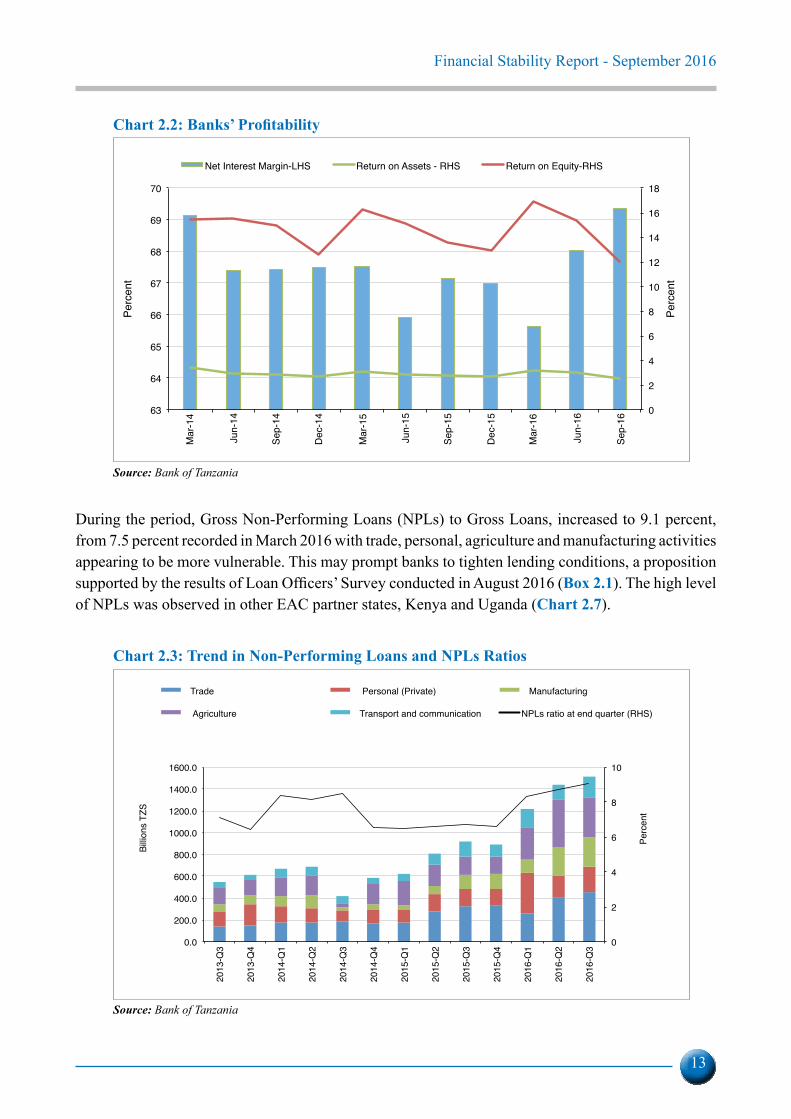
Profitability of the sector declined while cost of funding remained relatively stable. The level of profitability as reflected by the of ratio of Return on Equity and Return on Asset declined to 12.1 percent and to 2.5 percent as at end September 2016 from 16.9 percent and 3.2 percent recorded in March, 2016 respectively. The decline in profitability was mainly driven by rising NPLs and operational overheads since the cost of funding remained stable as reflected by Net Interest Margin (Chart 2.2). The increase in NPLs was partly attributed to decline in asset quality following reclassifications of restructured credit facility after four consecutive repayments and banking sector increased risk appetite.
Financial Stability Report - September 2016
13
Chart 2.2: Banks’ Profitability
0
2
4
6
8
10
12
14
16
18
63
64
65
66
67
68
69
70M
ar-1
4
Jun-
14
Sep-
14
Dec
-14
Mar
-15
Jun-
15
Sep-
15
Dec
-15
Mar
-16
Jun-
16
Sep-
16
Perc
ent
Perc
ent
Net Interest Margin-LHS Return on Assets - RHS Return on Equity-RHS
Source: Bank of Tanzania
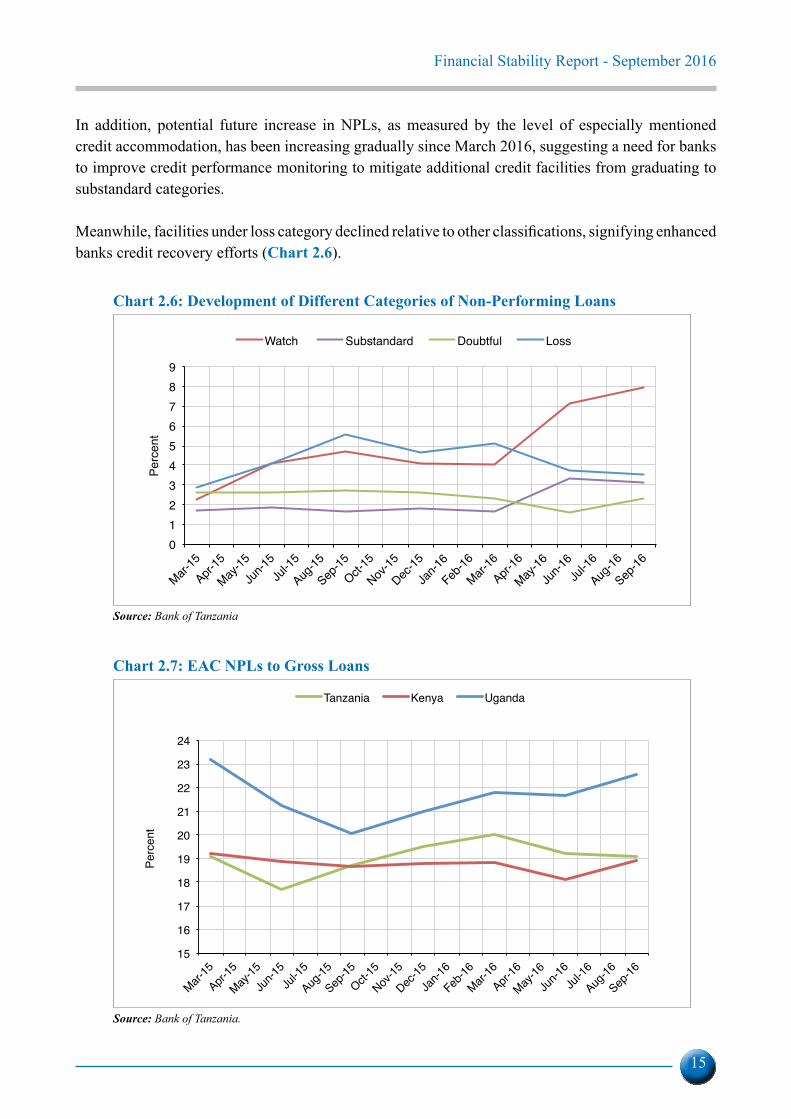
During the period, Gross Non-Performing Loans (NPLs) to Gross Loans, increased to 9.1 percent, from 7.5 percent recorded in March 2016 with trade, personal, agriculture and manufacturing activities appearing to be more vulnerable. This may prompt banks to tighten lending conditions, a proposition supported by the results of Loan Officers’ Survey conducted in August 2016 (Box 2.1). The high level of NPLs was observed in other EAC partner states, Kenya and Uganda (Chart 2.7).
Chart 2.3: Trend in Non-Performing Loans and NPLs Ratios
0
2
4
6
8
10
0.0
200.0
400.0
600.0
800.0
1000.0
1200.0
1400.0
1600.0
2013
-Q3
2013
-Q4
2014
-Q1
2014
-Q2
2014
-Q3
2014
-Q4
2015
-Q1
2015
-Q2
2015
-Q3
2015
-Q4
2016
-Q1
2016
-Q2
2016
-Q3
Perc
ent
Billi
ons
TZS
Trade Personal (Private) Manufacturing
Agriculture Transport and communication NPLs ratio at end quarter (RHS)
Source: Bank of Tanzania

Financial Stability Report - September 2016
14
Lending to agriculture and manufacturing activities which recorded relatively high level of NPLs declined while that of trade activity and personal loan slowed (Chart 2.5).
Chart 2.4: Credit and Non-Performing Loans for Selected Economic Activities as at end September 2016
0.0 5.0 10.0 15.0 20.0 25.0
Trade
Personal (Private)
Manufacturing
Agriculture
Transport and
Building & construction
Real Estate
Hotels and Restaurants
Tourism
Percent
Share of total NPLs Share of total lending
Source: Bank of Tanzania
Chart 2.5: Annual Growth of Credit in Selected Economic Activities
-20-10
010203040506070
Min
ing
and
Qua
rryin
g
Bui
ldin
g an
d Co
nstru
ctio
n
Rea
l Est
ate
Tra
nspo
rt an
d
Tra
de
Tou
rism
Hot
els
and
Rest
aura
nts
Pers
onal
Perc
ent
Mar-15 Sep-15 Mar-16 Sep-16
Source: Bank of Tanzania
Financial Stability Report - September 2016
15
In addition, potential future increase in NPLs, as measured by the level of especially mentioned credit accommodation, has been increasing gradually since March 2016, suggesting a need for banks to improve credit performance monitoring to mitigate additional credit facilities from graduating to substandard categories.
Meanwhile, facilities under loss category declined relative to other classifications, signifying enhanced banks credit recovery efforts (Chart 2.6).
Chart 2.6: Development of Different Categories of Non-Performing Loans
0123456789
Mar-15
Apr-15
May-15
Jun-1
5Ju
l-15
Aug-15
Sep-15
Oct-15
Nov-15
Dec-15
Jan-1
6
Feb-16
Mar-16
Apr-16
May-16
Jun-1
6Ju
l-16
Aug-16
Sep-16
Perc
ent
Watch Substandard Doubtful Loss
Source: Bank of Tanzania
Chart 2.7: EAC NPLs to Gross Loans
15
16
17
18
19
20
21
22
23
24
Mar-15
Apr-15
May-15
Jun-1
5Ju
l-15
Aug-15
Sep-15
Oct-15
Nov-15
Dec-15
Jan-1
6
Feb-16
Mar-16
Apr-16
May-16
Jun-1
6Ju
l-16
Aug-16
Sep-16
Perc
ent
Tanzania Kenya Uganda
Source: Bank of Tanzania.

Financial Stability Report - September 2016
16
Box 2.1: Loan Officers’ Opinion Survey
Loan Officers’ opinion survey is conducted annually by the Bank of Tanzania in order to analyse credit markets conditions, focusing on the direction of NPLs, credit recovery efforts and outlook. The main objective was to identify potential risks to the financial system and recommend mitigation policy actions. The survey was conducted in August, 2016 covering 39 selected commercial banks, 8 community banks, 74 Microfinance Institutions (MFIs) and Savings and Credit Co-operative Society (SACCOs) in Tanzania Mainland and Zanzibar.
Direction of Non- Performing Loans The survey results revealed that commercial banks credit risk exposure heightened for all activities, as reflected by the direction of NPLs (Chart 2.8). Banks cited that closure of some businesses, decline in trading activities, high operational cost and enhanced government expenditure control measures were the main drivers for the increase in NPLs. On the other hand, microfinance institutions had different opinion about credit risk exposure and cited multiple borrowing and diversion of loan proceeds to unintended objectives as the reasons for increased NPLs.
Chart 2.8: Direction of Non-Performing Loans
Commercial Banks Micro Finance Institutions
01020304050607080
Agricu
lture
Real e
state
Manufa
cturin
gTra
de
Trans
port a
nd
Building
and
Touri
sm
Person
al
Others
NPL
s In
dice
s
2014 2015 2016 Reference Point
01020304050607080
Agriculture
Real Estate
ManufacturingTrade
Transport and communication
Building and constructionTourism
PersonalOthers
NPL
s In
dice
s
2014 2015 2016 Reference Point
01020304050607080
Agricu
lture
Real e
state
Manufa
cturin
gTra
de
Trans
port a
nd
Building
and
Touri
sm
Person
al
Others
NPL
s In
dice
s
2014 2015 2016 Reference Point
01020304050607080
Agriculture
Real Estate
ManufacturingTrade
Transport and communication
Building and constructionTourism
PersonalOthers
NPL
s In
dice
s
2014 2015 2016 Reference Point
Source: Bank of Tanzania
Credit Recovery EffortsThe survey results revealed that commercial banks will continue to enhance credit recovery efforts through loan restructuring, strengthening recovery units, and taking stringent measures including foreclosure of collateral for all activities exhibiting growing NPLs. However, some banks pointed out court injunctions as hindrance to collateral foreclosure. For MFIs, a number of measure will be undertaken including closer credit monitoring, customers’ education on loan utilization and appropriate credit appraisal and evaluations.

Financial Stability Report - September 2016
17
Future ExpectationsBanks and MFIs credit market conditions expected to remain positive amid increasing cost of credit (Chart 2.9). Cost of funding and operational cost were cited as the contributing factors to increased cost of credit. The perception is expected to result in banks tightening terms of lending as a cushion against credit risk.
Chart 2.9: Future Expectations
Commercial Banks Micro Finance Institutions
0
20
40
60
80
100
120
Cos
t of c
redit
Dem
and f
or cre
dit
Num
ber o
f new
Term
s of lo
ans
Cred
it rec
overy
effor
ts
Dire
ction
of N
PL
Fu
ture
Exp
ect
atio
n I
nd
ice
s
2015 2016 Reference Point
0
10
20
30
40
50
60
70
80
90
100
Cost of credit
Demand for credit
Number of new customers
Terms of loans
Credit recovery efforts
Direction of NPL
Futu
re E
xpec
tatio
ns In
dice
s
2015 2016 Reference Point
0
20
40
60
80
100
120
Cos
t of c
redit
Dem
and f
or cre
dit
Num
ber o
f new
Term
s of lo
ans
Cred
it rec
overy
effor
ts
Dire
ction
of N
PL
Futu
re E
xpect
atio
n Indic
es
2015 2016 Reference Point
0
10
20
30
40
50
60
70
80
90
100
Cost of credit
Demand for credit
Number of new customers
Terms of loans
Credit recovery efforts
Direction of NPL
Futu
re E
xpec
tatio
ns In
dice
s
2015 2016 Reference Point
Source: Bank of Tanzania
Credit ConcentrationThe banking industry credit portfolio was diversified as reflected by a low ratio of aggregate large exposures to core capital which was 139.0 percent as at end September 2016, below the regulatory limit of 800.0 percent with a decreasing trend (Chart 2.10a). The trend suggests that most banks were lending mainly to small and medium scale borrowers.
Chart 2.10: Measures of Risk Diversification
a: Credit Concentration Risk b: Herfindahl Hirschman Index (HHI)
0
20
40
60
80
100
120
140
160
180
0
2,000
4,000
6,000
8,000
10,000
12,000
14,000
16,000
18,000
Sep-
11
Dec
-11
Mar
-12
Jun-
12
Sep-
12
Dec
-12
Mar
-13
Jun-
13
Sep-
13
Dec
-13
Mar
-14
Jun-
14
Sep-
14
Dec
-14
Mar
-15
Jun-
15
Sep-
15
Dec
-15
Mar
-16
Perc
ent
Billio
ns T
ZS
large exposures
Gross Loans
core capital
% of aggregate large exposures to core capital
% of aggregate large exposures to total credit facilities
800
850
900
950
Jun-
13
Aug-
13
Oct
-13
Dec
-13
Feb-
14
Apr-1
4
Jun-
14
Aug-
14
Oct
-14
Dec
-14
Feb-
15
Apr-1
5
Jun-
15
Aug-
15
Oct
-15
Dec
-15
Feb-
16
Apr-1
6
Jun-
16
Aug-
16
Inde
x
Total Assets Total Deposits Total Loans
0
20
40
60
80
100
120
140
160
180
0
2,000
4,000
6,000
8,000
10,000
12,000
14,000
16,000
18,000
Sep-
11
Dec
-11
Mar
-12
Jun-
12
Sep-
12
Dec
-12
Mar
-13
Jun-
13
Sep-
13
Dec
-13
Mar
-14
Jun-
14
Sep-
14
Dec
-14
Mar
-15
Jun-
15
Sep-
15
Dec
-15
Mar
-16
Perc
ent
Billio
ns T
ZS
large exposures
Gross Loans
core capital
% of aggregate large exposures to core capital
% of aggregate large exposures to total credit facilities
800
850
900
950
Jun-
13
Aug-
13
Oct
-13
Dec
-13
Feb-
14
Apr-1
4
Jun-
14
Aug-
14
Oct
-14
Dec
-14
Feb-
15
Apr-1
5
Jun-
15
Aug-
15
Oct
-15
Dec
-15
Feb-
16
Apr-1
6
Jun-
16
Aug-
16
Inde
x
Total Assets Total Deposits Total Loans
Source: Bank of Tanzania

Financial Stability Report - September 2016
18
The banking sector remained diversified in terms of deposits, loans and assets holdings. All market concentration levels for total assets, deposits and loans, as measured by the Herfindahl Hirschman Index (HHI), improved and were within the no concentration range between HHI of 100 and 1000. It is worth noting that the HHI approaches the upper limit, partly reflecting the structure of the banking sector in the country which is dominated by a few large banks (Chart 2.10b).
The banking sector exposure to foreign exchange risk remained low. The Net Open Position for foreign exchange exposure remained within the limit of 7.5 percent1, averaging -2.4 percent as at end September 2016 compared to -1.1 percent in March 2016. The movement implies that the proportion of foreign denominated liabilities increased more than foreign currency denominated assets. However, the stable exchange rate environment exhibited during the period cushion banks against foreign exchange risks from the increasing mismatch (Chart 2.11).
Chart 2.11: Development of Tanzania Net Open Position to Total Capital
-11
-7
-4
0
4
7
11
Mar-14 Jun-14 Sep-14 Dec-14 Mar-15 Jun-15 Sep-15 Dec-15 Mar-16 Jun-16 Sep-16
Perc
ent
Net Open Positions in FX/Total Capital Regulatory Limit
Source: Bank of Tanzania
2.2 Non-Banking Financial Sector
2.2.1 Capital Markets
Equity MarketThe DSE continued to experience slowdown in trading activity as reflected by decline in turnover. During the six months to September 2016, total turnover declined by 47.4 percent to 215.5 billion from TZS 409.7 billion despite DSE demutualization and listing of Mufindi Community Bank (MUCOBA) plc (Chart 2.12). Similarly, number of shares that exchanged hands dropped by 57.0 percent to TZS 68 million reflecting low level of liquidity in the capital market. The slowdown in activities and price in the market was associated with investors’ uncertainty in the post-election period and increase in US interest rate, resulting in increased investment returns in the US. The envisaged listing of telecommunication companies in the DSE may boost market activities in the medium term.
1 The Net Open Position was revised to 7.5 percent from 5.5 percent in August 2016.

Financial Stability Report - September 2016
19
Chart 2.12: Dar es Salaam Stock Exchange Turnover Ratio
0.00.20.40.60.81.01.21.4
0100200300400500600700
Sep-
12
Mar
-13
Sep-
13
Mar
-14
Sep-
14
Mar
-15
Sep-
15
Mar
-16
Sep-
16
Tim
es
Billio
ns T
ZS
Turnover (LHS) Turnover ratio (RHS)
Source: Dar es Salaam Stock Exchange
Total market capitalization increased amid declining domestic share prices. As at end September 2016, total market capitalization increased by 1.3 percent to TZS 21,579.6 billion driven by performance of the shares of cross listed companies. However, domestic market capitalization decreased by 4.3 percent as a result of decline in share prices of various domestic companies notably SWISSPORT (13.0 percent), TPCC (12.0 percent), TBL (6.0 percent), TCC (3.0 percent), MCB (15.0 percent) and TOL (8.0 percent). The observed decline in domestic share prices suggest that prices are adjusting to their normal trend but warrants monitoring.
Chart 2.13: Performance of the Dar es Salaam Stock Exchange
Stock market Share Indices
0
5
10
15
20
25
30
0
4,000
8,000
12,000
16,000
20,000
24,000
Sep
-11
Sep
-12
Sep
-13
Sep
-14
Sep
-15
Sep
-16
Per
cent
Bill
ion
TZS
Total Market capitalization (LHS)Domestic Market capitalization (LHS)Total Market capitalization/ Annual GDP (RHS)
-
5,000
10,000
15,000
20,000
25,000
Mar-12
Jun-1
2
Sep-12
Dec-12
Mar-13
Jun-1
3
Sep-13
Dec-13
Mar-14
Jun-1
4
Sep-14
Dec-14
Mar-15
Jun-1
5
Sep-15
Dec-15
Mar-16
Jun-1
6
Sep-16
Inde
x
Commercial Services(CS) Index Industrial & Allied IndexBanks, Finance & Investment Index Tanzania Share Index All Share Index
0
5
10
15
20
25
30
0
4,000
8,000
12,000
16,000
20,000
24,000
Sep
-11
Sep
-12
Sep
-13
Sep
-14
Sep
-15
Sep
-16
Per
cent
Bill
ion
TZ
S
Total Market capitalization (LHS)Domestic Market capitalization (LHS)Total Market capitalization/ Annual GDP (RHS)
-
5,000
10,000
15,000
20,000
25,000
Mar-12
Jun-1
2
Sep-12
Dec-12
Mar-13
Jun-1
3
Sep-13
Dec-13
Mar-14
Jun-1
4
Sep-14
Dec-14
Mar-15
Jun-1
5
Sep-15
Dec-15
Mar-16
Jun-1
6
Sep-16
Inde
x
Commercial Services(CS) Index Industrial & Allied IndexBanks, Finance & Investment Index Tanzania Share Index All Share Index
Source: Dar es Salaam Stock Exchange

Financial Stability Report - September 2016
20
Concentration risk remained elevated, as reflected by dominance of non-resident investors in the equity market. During the quarter ending September 2016, non-resident investors’ participation dominated both sides of the market, a behaviour not observed during the previous three quarters, whereby their dominance was limited on the buying side. This warrants monitoring, considering potential risks from abrupt exit.
Chart 2.14: Dar es Salaam Stock Exchange investors’ participation Percent
Buy-side Sell-side
36.726.7
8.7 13.4 11.5 10.2 6.8 6.913.4
63.373.4
91.4 86.6 88.5 89.8 93.2 93.186.6
Sep-
14
Dec
-14
Mar
-15
Jun-
15
Sep-
15
Dec
-15
Mar
-16
Jun-
16
Sep-
16Buying Local Investor Buying Foreign Investor
26.2
70.2
22.8
58.8
7.9
86.3
70.776.5
34.2
73.8
29.8
77.2
41.3
92.1
13.7
29.323.5
65.8
Sep-
14
Dec
-14
Mar
-15
Jun-
15
Sep-
15
Dec
-15
Mar
-16
Jun-
16
Sep-
16
Selling Local Investor Selling Foreign Investor
36.726.7
8.7 13.4 11.5 10.2 6.8 6.913.4
63.373.4
91.4 86.6 88.5 89.8 93.2 93.186.6
Sep-
14
Dec
-14
Mar
-15
Jun-
15
Sep-
15
Dec
-15
Mar
-16
Jun-
16
Sep-
16
Buying Local Investor Buying Foreign Investor
26.2
70.2
22.8
58.8
7.9
86.3
70.776.5
34.2
73.8
29.8
77.2
41.3
92.1
13.7
29.323.5
65.8Se
p-14
Dec
-14
Mar
-15
Jun-
15
Sep-
15
Dec
-15
Mar
-16
Jun-
16
Sep-
16
Selling Local Investor Selling Foreign Investor
Source: Dar es Salaam Stock Exchange
Bond MarketTrading activity in the bond market increased, amplified by cross boarder investments. In the six months to September 2016, government bonds traded in the secondary market increased by 40.0 percent to TZS 248.5 billion compared to preceding six months. The increase was partly on account of new entrant from other EAC Partner States, namely, Uganda National Social Security Fund which accounted for 20.0 percent of the trading, a positive development following capital account liberalization for the EAC residents (Chart 2.15).

Financial Stability Report - September 2016
21
Chart 2.15: Market Performance for Government Bonds
0
10
20
30
40
50
60
70
80
90
2-years 5-years 7-years 10-years 15-years
Billio
ns T
ZS
Six months to Mar 16 Six months to Sept 16
Source: Bank of Tanzania
Collective Investment Schemes net asset value continued to grow despite decline in share prices. The out turn is mainly explained by the performance of the Liquid Fund whose investments in fixed income securities outpaced the drop in the share prices which affected the remaining four Funds (Table 2.3).
Table 2.3: Open Ended Collective Investment Schemes
Scheme
Scheme Size Outstanding units (Millions) Net Asset Value (NAV) TZS Millions NAV Growth
Sep-15 Mar-16 Sep-16 Sep-15 Mar-16 Sep-16 Sept 15- Sept 16
Mar 16 Sept 16
Umoja Fund 466.0 465.0 452.1 217,884.5 218,867.9 217,838.4 0.0 -0.5
WekezaMaisha 11.3 11.4 11.6 3,444.5 3,526.2 3,668.4 6.5 4.0
Watoto Fund 180.1 10.6 10.6 2,733.0 2,924.9 2,986.5 18.9 2.1
Jikimu Fund 9.6 223.9 216.9 22,989.7 27,625.6 27,323.4 18.9 -1.1
Liquid Fund 4.8 18.8 33.6 638.4 2,658.5 5,064.7 693.4 90.5
Source: Capital Markets and Securities Authority
Financial Stability Report - September 2016
22
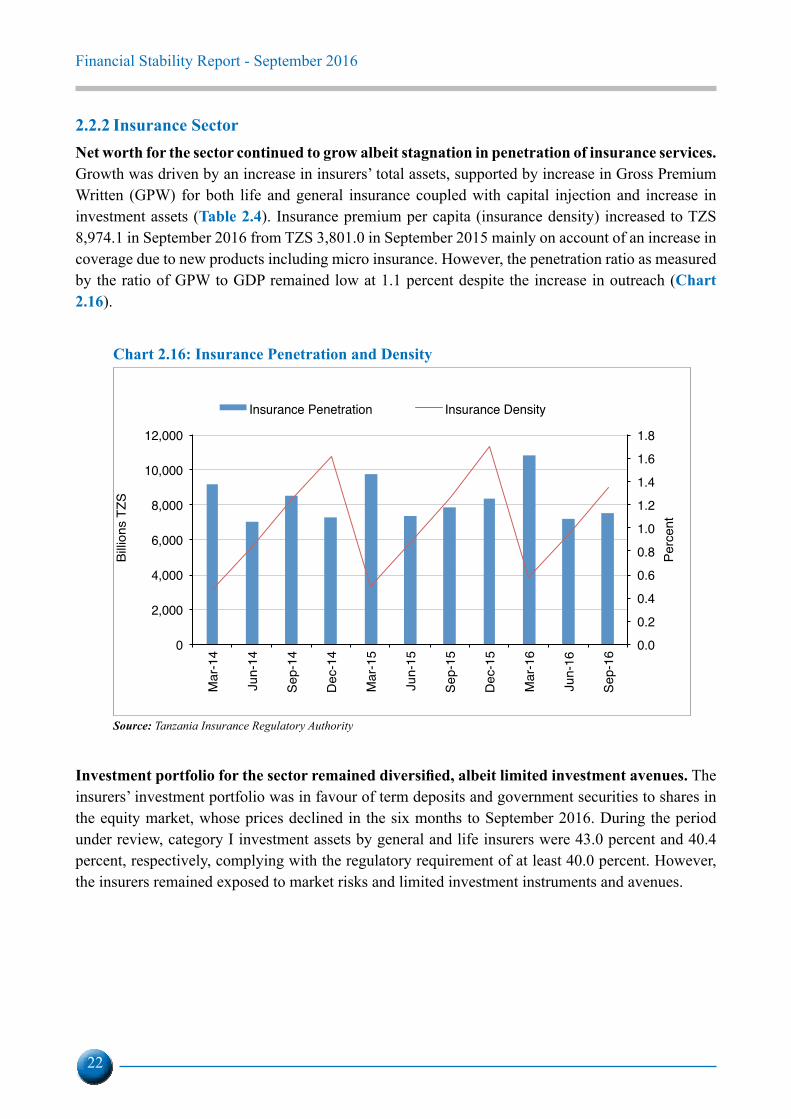
2.2.2 Insurance SectorNet worth for the sector continued to grow albeit stagnation in penetration of insurance services. Growth was driven by an increase in insurers’ total assets, supported by increase in Gross Premium Written (GPW) for both life and general insurance coupled with capital injection and increase in investment assets (Table 2.4). Insurance premium per capita (insurance density) increased to TZS 8,974.1 in September 2016 from TZS 3,801.0 in September 2015 mainly on account of an increase in coverage due to new products including micro insurance. However, the penetration ratio as measured by the ratio of GPW to GDP remained low at 1.1 percent despite the increase in outreach (Chart 2.16).
Chart 2.16: Insurance Penetration and Density
0.0
0.2
0.4
0.6
0.8
1.0
1.2
1.4
1.6
1.8
0
2,000
4,000
6,000
8,000
10,000
12,000
Mar
-14
Jun-
14
Sep-
14
Dec
-14
Mar
-15
Jun-
15
Sep-
15
Dec
-15
Mar
-16
Jun-
16
Sep-
16
Perc
ent
Billio
ns T
ZS
Insurance Penetration Insurance Density
Source: Tanzania Insurance Regulatory Authority
Investment portfolio for the sector remained diversified, albeit limited investment avenues. The insurers’ investment portfolio was in favour of term deposits and government securities to shares in the equity market, whose prices declined in the six months to September 2016. During the period under review, category I investment assets by general and life insurers were 43.0 percent and 40.4 percent, respectively, complying with the regulatory requirement of at least 40.0 percent. However, the insurers remained exposed to market risks and limited investment instruments and avenues.

Financial Stability Report - September 2016
23
Table 2.4: Insurance Performance Billions Percentage change
Particular Sep-14 Sep-15 Sep-16 Sep 14-Sep 15 Sep 15-Sep 16
Total Assets 605.3 703.7 795.0 16.3 13.0
Total Liabilities 387.4 460.7 522.8 18.9 13.5
Total Net Worth 217.9 242.7 272.3 11.4 12.2
Total Investments 379.6 437.6 492.5 15.3 12.5
Gross Premium Written Sep-14 Sep-15 Sep-16 Sep 14-Sep 15 Sep 15-Sep 16
General Insurance 383.0 411.3 449.6 7.4 9.3
Life Assurance 44.2 47.8 54.4 8.1 13.8
Total 427.2 459.1 504.0 7.5 9.8
Source: Tanzania Insurance Regulatory Authority.
Chart 2.17: Investment Mix Billions
223.5
53.5
77.1
52.3
26.3
2.6 2.3
237.5
102.7
79.3
41.5
27
2.4 2.0
Term Deposits Government securities
Real estate Shares Investments in related parties
Company bonds and debentures
Other investments
Sep-15 Sep-16
Source: Tanzania Insurance Regulatory Authority

Financial Stability Report - September 2016
24
Insurance sector performance is assessed using CARAMELS framework2 (Table 2.5).
Table 2.5: Financial Soundness Indicators of the Insurance Sector (General and Life)
Indicator Statutory Requirement Sep-15 Sep-16General Life General Life
1. Capital Ratios
Solvency Ratio General ≥ 25; Life ≥ 8 63.8 24.9 62.7 24.0Change in Capital and Reserves 15.2 -9.0 13.4 -4.02. Asset Quality RatiosRate of Return on Investment 9.3 5.0 7.0 2.0
Category I investment assets (Deposits in financial institutions and government securities) Min 40 41.4 32.8 43.0 40.43. Reinsurance Ratios
Retention RatioGeneral 30<RR<70; Life 50<RR<90 57.8 85.2 55.5 81.6
4. Actuarial Liabilities (General) Actuarial Provisions to Capital Ratio Max 250 39.3 42.85. Earnings Ratios (General) Return on Equity 9.5 8.36. Liquidity Ratios
Liquidity Ratio General ≥ 95; Life ≥ 50 108.0 54.9 103.2 60.9Total Receivables as % of Capital & Reserves Max 100 87.1 42.5 87.8 24.77. Loss Ratio 57.3 37.9 56.0 39.9Source: Tanzania Insurance Regulatory Authority
The sector remained adequately capitalised to shield against potential underwriting and operational losses. Capital adequacy, as measured by solvency ratio, was 62.7 percent for general insurers and 24.0 percent for life insurers, being above the minimum prudential requirement of 25.0 percent and 8.0 percent, respectively. This was attributed to profitability, and supervisory enforcement which requires the insurers to inject additional capital in order to enhance the ability of the sector to cushion against potential risks. In addition, capital enhancement boosted the sector’s ability to withstand adverse deviations of actuarial liabilities. The ratio of actuarial provisions to capital stood at 42.8 percent in September 2016 compared to 39.3 percent in September 2015, which were within the statutory maximum limit of 250.0 percent. The low ratio reflects the structure of the Tanzania insurance sector which is dominated by undertakings in shorter term contingent liabilities.
Meanwhile, the quality of assets declined as depicted by a decrease in return on investment (ROI) for both life and general insurers, partly associated with decline in real estate return, and share prices. ROI for both insurers declined to 2.0 percent and 7.0 percent at end September, 2016 from 5.0 percent and 9.3 percent recorded in 2015 respectively.
2 CARAMELS - Asset Quality, Reinsurance, Actuarial Liabilities, Management and Corporate Governance, Earnings, Liquidity, Self-Dealing and Related Parties.

Financial Stability Report - September 2016
25
General insurers remained liquid but exposed to high level of receivables. Liquidity ratios for general insurers declined to 103.2 percent in September 2016 from 108.0 percent recorded in September 2015 but remained above the prudential requirement. The decline was contributed by payment of compensations and decrease in earnings from investments. In addition, a shift of some policy holders to a lower cost insurance covers following the introduction of value added tax (VAT) may have contributed to the decline in liquidity levels. Furthermore, potential risks arising from late remittances of insurance premiums by brokers to insurers remained high as about 70 percent of insurance business is conducted through brokers. During the period the ratio of total receivables to capital and reserves stood at 87.8 percent against the regulatory maximum limit of 100 percent.
Insurance sector remained profitable supported by underwriting income. Return on Equity (ROE) for general insurers was 8.3 percent in September 2016, which account for 80.0 percent of total insurance business, supported by underwriting income which improved to TZS 3.6 billion compared to a loss of TZS 3.0 billion in the corresponding period of 2015. Further, General insurers’ claims ratio slightly decreased to 56.9 percent from 55.8 percent.
2.2.3 Social Security Sector
Tanzania Mainland The sector’s assets continued to grow despite a slight decline in investment return. Total asset of the sector rose by 7.0 percent from TZS 9,610.7 billion recorded in December, 2015 to 10,284.5 billion in June 2016. However, the social securities’ Return on Investment (ROI) was 1.3 percent in June 2016 compared to 1.6 percent in December 2015. This was attributable to a decline in share prices in the equity market and shares of unlisted companies which diluted the investment portfolio performance (Table 2.6).
The ratio of contribution income to benefit payments declined to 0.4 percent in June 2016 from 0.8 percent in December 2015. The decline was mainly due to delay in remittance of contributions by employers. On the other hand, dependency ratio as measured by pension contributors against pensioners stood at 14.5 percent.
Table 2.6: Tanzania Mainland: Social Security Selected Financial Indicators
Particular Sep-15 Dec-15 Mar-16 Jun-16
Contribution Income/Benefit Payments Percent 1.2 0.8 1.1 0.4
Return on Investment(Invested Return/Invested Assets) Percent 1.5 1.6 2.4 1.3
Administrative Cost/Contributions Percent 15.5 11.8 8.7 8.6
Dependency Ratio (Pension Contributors/pensioners Times 14.5 14.5
Source: Social Security Regulatory Authority

Financial Stability Report - September 2016
26
Funds increased investment appetite for government securities amid declining return on investment. In general, funds maintained investment portfolio mix, albeit increasing the proportion of holding government securities in the six months to June 2016. The increase coincided with a decline in the proportion of investment in equity suggesting either a decline in valuation or sale of shares which diluted the investment portfolio performance as depicted by a decline in ROI (Table 2.6 and 2.7).
Table 2.7: Tanzania Mainland: Social Security Portfolio Investment Mix
Particulars
Prudential Limit as
Percentage of Total Assets
Mar 15 Jun 15 Sep 15 Dec 15 Mar 16 Jun 16
Bank Deposits 35 9.6 10.0 10.9 8.0 8.4 8.8
Government Securities 20-70 20.1 18.9 18.2 18.2 20.3 23.0
Commercial Paper, Promissory notes and Corporate bonds
20 0.2 0.4 0.5 0.3 0.3 0.3
Loans to Government 10 19.3 21.7 21.8 21.7 21.0 20.6
Ordinary and Preference Share
20 10.8 9.5 9.4 9.1 8.8 7.6
Investments in Licensed Collective Investment Schemes
30 1.5 1.4 1.4 1.5 1.5 1.5
Real Estate 30 21.1 17.7 19.0 20.1 19.8 19.5
Loans to Corporates and Cooperative Societies
10 3.3 4.6 3.9 4.0 4.0 4.4
Infrastructure Investment 25 2.6 2.7 1.8 2.4 2.5 2.6
Other Assets 11.4 13.9 13.6 14.6 13.9 11.9
Total Assets ( Billions) 8,727.0 9,436.7 9,874.9 9,610.7 10,058.8 10,284.5Source: Social Security Regulatory Authority
2.3 Cross-Sector Linkages in the Financial System3
Deposits and borrowings among domestic banks remained fairly stable while placements with and borrowings from banks abroad increased. The increase in borrowing from banks abroad was partly to leverage liquidity shortage to support various economic activities. Pension funds and insurance companies continued to be the main institutional source of funding to the banking sector, but they form a small proportion of total deposits, thus posing limited exposure to liquidity risk (Table 2.8).
3 The analysis focuses on top ten banks which account for 68.3 percent of banking sector total assets.

Financial Stability Report - September 2016
27
Table 2.8: Financial Interconnectedness (Top Ten Banks)Billions TZS
Items Mar-15 Jun-15 Sep-15 Dec-15 Mar-16 Sep-16
Placements with Banks Abroad 598.8 751.0 1,125.6 931.8 654.9 964.0
Placements with Domestic Banks 412.5 441.5 405.3 325.5 618.2 481.4
Deposits from Pension Funds 236.1 286.7 314.7 357.3 195.7 268.4
Deposits from Insurance Companies 156.7 213.4 143.0 229.1 97.1 216.6
Borrowings from Domestic Banks 373.2 243.3 428.9 351.1 375.2 207.4
Deposits from Foreign Banks 107.6 108.2 198.4 497.6 314.9 861.4
Inter-bank Contingent Claims to Foreign Banks 235.9 262.4 225.1 251.9 369.4 369.4
Deposits from Mobile Network Operators 452.0 451.8 532.8 583.7 569.1 624.4
Source: Bank of Tanzania
Risks arising from the interconnectedness between mobile money platforms and the banking system continued to upsurge with the increase in number of banks linking their core banking systems with mobile money platforms so as to provide customers access to banking services through mobile devices. Some banks are also using the mobile money platform for agent banking operations which has also increased the linkage between mobile money operator and banks. However, with implementation of the Payment Systems Licensing and Approval Regulations, 2015, which became effective on 1st July 2016, the Bank has increased its capacity to timely identify potential operational risks and device mitigation actions.

Financial Stability Report - September 2016
28
3.0 FINANCIAL SYSTEM INFRASTRUCTURE AND REGULATORY DEVELOPMENTS
3.1 Payment SystemsLarge payment systems continued operating with minimal operational risks. The Tanzania Interbank Settlement System (TISS) which settles large value transactions in TZS and US dollar, operated smoothly throughout the six months to September 2016, save for minor interruptions experienced in August 2016 due to network outage. In addition, the system continued to operate efficiently with adequate liquidity enhanced through the Bank’s standby facilities. During the period, the system cleared a volume of 692,818 transactions valued at TZS 87,273.4 billion, representing a growth of 33.8 percent in value compared to the preceding six months (Chart 3.1).
Chart 3.1: Performance of Payment Systems
Total Values Transacted TISS Database and Server Availability
75
80
85
90
95
100
105
Jul-1
4
Aug-
14
Sep-
14
Oct
-14
Nov
-14
Dec
-14
Jan-
15
Feb-
15
Mar
-15
Apr-1
5
May
-15
Jun-
15
Jul-1
5
Aug-
15
Sep-
15
Perc
ent
Target LineActual Server AvailabilityActual Database AvailabilityAcceptable line (95.0)
0
20,000
40,000
60,000
80,000
100,000M
ar-1
3
Jun-
13
Sep-
13
Dec
-13
Mar
-14
Jun-
14
Sep-
14
Dec
-14
Mar
-15
Jun-
15
Sep-
15
Dec
-15
Mar
-16
Jun-
16
Sep-
16
Billi
ons
TZS
TISS Clearing Systems Retail Payment System
75
80
85
90
95
100
105
Jul-1
4
Aug-
14
Sep-
14
Oct
-14
Nov
-14
Dec
-14
Jan-
15
Feb-
15
Mar
-15
Apr-1
5
May
-15
Jun-
15
Jul-1
5
Aug-
15
Sep-
15
Perc
ent
Target LineActual Server AvailabilityActual Database AvailabilityAcceptable line (95.0)
0
20,000
40,000
60,000
80,000
100,000
Mar
-13
Jun-
13
Sep-
13
Dec
-13
Mar
-14
Jun-
14
Sep-
14
Dec
-14
Mar
-15
Jun-
15
Sep-
15
Dec
-15
Mar
-16
Jun-
16
Sep-
16
Billi
ons
TZS
TISS Clearing Systems Retail Payment System
Source: Bank of Tanzania
3.2 Financial System Regulatory Developments
3.2.1 Capital Markets
The Government made a decision to widen ownership of telecommunication companies by enacting the Finance Act, 2016 which amended Electronic and Postal Communications (EPOCA) by deleting the entire section 26 and introducing a new section. EPOCA requires network facilities, network service and application services providers registered in the country to offer 25.0 percent of their shares to the public and eventually list on the Dar es Salaam Stock Exchange (DSE), within six months from 1st July, 2016. The minimum of twenty-five local shareholding requirements shall be obtained through a public offer in accordance with Capital Markets and Securities Act.

Financial Stability Report - September 2016
29
3.2.2 Social Security SectorThe Social Security Regulatory Authority (SSRA) issued Social Security Schemes (Administrative Expenses) Guidelines, 2016 which, among others, limit annual administration expenses to 10.0 percent of total annual contribution income. This aims at ensuring expenses incurred by Social Security Schemes take into account the sustainability of the schemes and improvement of benefits payable to members.

Financial Stability Report - September 2016
30
4.0 FINANCIAL SYSTEM RESILIENCE AND RECOMMENDATIONS
4.1 Financial System Resilience
Banking Sector ResilienceThe Bank conducts on quarterly basis, stress test on the banking system balance sheet with the objective of assessing its resilience against adverse but plausible shocks. The process involved assessment of the impact of key risks, namely credit, interest and exchange rates, on capital for 41 selected banks. The size of applied shocks was determined basing on expert judgement and historical volatility (Table 4.1).
Table 4.1: Shock Calibration
Risk-type Type of Shock Shock Size (%) Channel
Credit Sectoral shocks to NPLs: Applies a different shock to the existing level of performing loans of the selected sectors, so that a proportion of them became NPLs.
Agriculture 4.3Trade 7.6Manufacturing 8.0Transport & Communication 6.7Personal 9.9Proportional increase in NPLs
7.1 Applies a uniform shock to the existing level of performing outstanding loans so that a proportion of them became NPLs
Interest Rate Nominal deposits rate Assess the effect of interest rate rise on banks’ existing performing loans
< 3 months 3.73-6 months 3.56-12 months 3.41-2yrs 3.32-3yrs 3.2>3 yrs 4.0
Exchange Rate
Assumed depreciation of selected currencies
Assesses the effect of depreciation on banks’ existing performing loans USD 3.2
EUR 2.9 GBP 7.9
Source: Bank of Tanzania
The resilience of the banking system was assessed against a defined benchmark of 12.0 percent capital adequacy ratio. For systemic and peer assessments, banks were classified into two groups: Major banks (top ten), Other banks (below top ten) and All banks (Table 4.2).

Financial Stability Report - September 2016
31
Table 4.2: Summary of Stress Testing Results
Classification of BanksBaseline (Pre-test)
Post-StressCredit risks
Interest rateExchange
rateSectorial Proportional
increase in NPLs
All Banks 16.2 14.7 14.0 13.4 15.1Major Banks 17.7 16.2 15.6 14.6 16.7Other Banks 12.3 10.7 10.0 10.4 10.8Reg. CAR 12.0 12.0 12.0 12.0 12.0No. of undercapitalized Major banks. 0 2 2 3 2No. of undercapitalized Other banks. 12 17 17 15 15
Source: Bank of Tanzania
The stress tests results revealed that, on aggregate level, the banking sector remained adequately capitalized, driven primary by strong capital position of the system as a whole. However, at individual level, two banks were affected by shocks in credit and exchange rate risks while three were affected by interest rate risk. This implies that they have to inject additional capital to absorb the shocks if they materialise.
4.2 Financial Stability OutlookIn the next six months to March 2017, risks stemming from macroeconomic environment are expected to abate on account of moderate global growth and recovery of commodity prices. Strong capital base will cushion banks against potential risks while the ongoing credit recovery efforts and enhancement of credit standards are expected to improve the quality of banking sector assets. Measures taken by TIRA to address late remittance of premium by brokers to insurance companies will lower liquidity risk in the insurance sector. Share prices in the DSE are likely to adjust to normal trends while envisaged new listings, notably by telecommunication companies and participation of EAC investors may create potential improvement in the activities of the bourse. In view of this outlook, the financial system is set to remain stable. However, the US monetary policy normalization may lead to potential capital reversals and increase cost of borrowing in the global financial markets thus warranting close monitoring.

Financial Stability Report - September 2016
32
APPENDICES
Appendix 1: Global Economic Performance (Real growth rates in percent)
2010 2011 2012 2013 2014 2015 2016 2017 2016 2017World output 5.4 4.2 3.4 3.3 3.4 3.2 3.1 3.4 -0.3 -0.2
Advanced economies 3.1 1.7 1.2 1.1 1.8 2.0 1.6 1.8 -0.5 -0.3USA 2.5 1.6 2.2 1.5 2.4 2.6 1.6 2.2 -1.0 -0.4Euro area 2.0 1.6 -0.8 0.3 0.9 1.5 1.7 1.5 0.0 -0.2Japan 4.7 -0.5 1.7 1.6 -0.1 0.6 0.5 0.6 -0.5 0.3United Kingdom 1.9 1.6 0.7 1.7 3.0 2.2 1.8 1.1 -0.4 -1.1
Emerging and Developing Economies 7.5 6.3 5.2 5.0 4.6 4.0 4.2 4.6 -0.1 -0.1
Emerging and Developing Asia
9.6 7.9 6.8 7.0 6.8 6.6 6.5 6.3 0.2 0.1
China 10.6 9.5 7.7 7.7 7.3 6.9 6.6 6.2 0.3 0.2India 10.3 6.6 5.1 6.9 7.3 7.3 7.6 7.6 0.1 0.1Asean-5 5.1 4.6 4.6 4.8 5.1 0.0 0.0
Sub-Saharan 6.6 5.0 4.3 5.2 5.1 3.4 1.4 2.9 -0.6 -0.8Excluding Nigeria and South Africa
6.2 5.9 5.2 6.4 5.7 4.7 3.9 4.9 n/a n/a
Nigeria 10.0 4.9 4.3 5.4 6.3 2.7 -1.7 0.6 n/a n/aSouth Africa 3.0 3.2 2.2 2.2 1.5 1.3 0.1 0.8 n/a n/aOil Exporting 8.5 4.6 3.8 5.7 5.9 2.6 -1.3 0.9 n/a n/aOil Importing 5.3 5.3 4.6 4.8 4.4 4.0 3.2 4.3 n/a n/a
SADC 4.2 4.3 3.7 4.2 3.5 2.7 1.6 1.4 n/a n/aExcluding South AfricaEAC Overall 7.4 6.9 4.6 5.8 5.9 5.8 6.1 6.3 n/a n/a
Kenya 8.4 6.1 4.5 5.7 5.3 5.6 6.0 6.1 n/a n/aRwanda 6.3 7.5 8.8 4.7 7.0 6.9 6.3 6.7 n/a n/aTanzania 6.4 7.9 5.1 7.3 7.0 7.0 7.2 7.2 n/a n/aUganda 7.7 6.8 2.6 3.9 4.9 5.0 4.9 5.5 n/a n/aBurundi 5.1 4.2 4.0 4.0 4.7 -4.1 -0.5 2.9 n/a n/a
Memorandum
Oil -0.9 -7.5 47.2 -31.6 -47.2 -15.4 17.9Nonfuel -1.2 -4.0 17.5 -9.4 -17.5 -2.7 0.9
Difference from July 2016 WEO projections
World Commodity prices (U.S. dollars)
Actual Projections
Source: IMF World Economic Outlook, October 2016

Financial Stability Report - September 2016
33
Appendix 2: Annual GDP Performance by Economic Activity - Tanzania MainlandEconomic Activity 2005 2006 2007 2008 2009 2010 2011 2013 2014 2015rSector Share in GDPGDP at market prices 100 100 100 100 100 100 100 100 100 100Agriculture and Fishing 29.1 28.4 26.8 27.3 27.2 26.3 25.2 23.8 23.0 23.0
Agriculture 27.3 26.7 25.2 25.7 25.7 24.8 23.8 22.5 21.8 21.8Crops 15.7 14.8 13.5 13.7 13.8 13.4 13.0 12.1 12.5 12.1
Fishing 1.7 1.7 1.6 1.6 1.5 1.5 1.4 1.3 1.3 1.3Industry and construction 19.4 19.7 20.2 20.4 20.0 20.5 21.3 21.5 22.2 22.2
Mining and quarrying 4.2 3.5 3.5 3.0 3.4 3.4 3.3 3.3 3.4 3.4Manufacturing 6.6 6.8 7.0 7.4 7.4 7.5 7.5 7.3 7.3 7.3Electricity Gas &Water 2.0 1.8 1.8 1.8 1.7 1.8 1.6 1.6 1.6 1.6Construction 6.7 7.6 7.9 8.2 7.5 7.8 8.9 9.3 9.9 9.9
Services 46.8 47.4 47.4 46.8 47.0 47.6 47.8 48.7 48.8 48.8Trade and repairs 9.1 9.5 9.9 10.0 9.7 10.0 10.4 10.0 10.2 10.2Hotels and restaurants 1.9 1.9 1.8 1.8 1.7 1.6 1.6 1.5 1.5 1.5Transport & Communications 8.1 8.4 8.2 8.1 8.7 9.4 9.2 10.2 10.6 10.6Financial & Insurance 2.2 2.5 2.8 3.2 3.6 3.8 4.0 4.0 4.1 4.1Real estate and business services 10.8 10.7 10.1 10.0 9.8 10.0 9.6 9.6 9.2 9.2Public administration & defense 8.5 8.1 8.1 7.2 6.8 6.1 6.5 6.8 6.6 6.6Education 3.0 3.0 3.2 3.3 3.4 3.4 3.3 3.3 3.3 3.3Health 1.6 1.7 1.6 1.6 1.7 1.6 1.6 1.7 1.7 1.7Other social and personal services 1.7 1.7 1.6 1.6 1.6 1.6 1.6 1.6 1.6 1.6less FISIM -1.0 -1.2 -1.2 -1.3 -1.4 -1.4 -1.6 -1.5 -1.5 -1.5Taxes on products 5.7 5.6 6.8 6.8 7.2 7.1 7.3 7.5 7.5 7.5
GDP Growth RateGDP at market prices (2007=100) 7.9 4.7 8.5 5.6 5.4 6.4 7.9 7.3 7.0 7.0Agriculture and Fishing 5.5 2.4 2.4 7.5 5.1 2.7 3.5 3.2 3.4 3.4
Agriculture 5.4 2.3 2.5 7.5 5.4 2.8 3.5 3.1 3.5 3.5Crops 6.6 -1.4 -1.5 7.8 5.5 3.7 4.8 4.0 3.5 4.0
Fishing 6.7 2.8 0.9 7.2 0.5 0.9 2.6 5.5 2.0 2.0Industry and construction 11.7 6.2 11.0 6.5 3.3 9.1 12.0 9.5 10.3 10.3
Mining and quarrying 16.0 -13.7 9.2 -9.8 18.7 7.3 6.3 3.9 9.4 9.4Manufacturing 9.4 8.4 11.5 11.4 4.7 8.9 6.9 6.5 6.8 6.8Electricity Gas &Water 6.2 -2.8 3.9 5.1 4.4 7.8 -2.9 8.1 6.8 6.8Construction 13.0 19.2 13.1 9.7 -3.8 10.3 22.9 14.6 14.1 14.1
Services 8.1 6.0 8.5 4.2 5.8 7.8 8.4 7.1 7.2 7.2Trade and repairs 5.8 9.4 12.9 6.5 2.7 10.0 11.3 4.5 10.0 10.0Hotels and restaurants 3.6 3.4 4.5 3.3 1.0 3.7 4.1 2.8 2.2 2.2Transport & Communications 10.8 7.9 6.0 4.6 12.9 15.4 5.9 12.7 10.6 10.6Finance & Insurance 8.3 19.1 21.7 18.8 18.4 12.6 14.8 6.2 10.8 10.8Real estate and business services 6.8 3.6 2.9 4.0 3.4 8.3 3.3 5.9 3.2 3.2Public administration & defence 13.6 -0.3 9.1 -6.3 -0.7 -5.0 15.9 7.8 3.9 3.9Education 4.0 7.7 13.2 9.5 9.2 6.4 5.6 4.3 4.8 4.8Health 7.8 9.9 7.0 5.5 7.4 3.3 5.3 8.8 8.1 8.1Other social and personal services 3.0 4.9 5.4 5.2 4.6 5.6 5.8 5.6 5.8 5.8less FISIM 10.1 23.4 11.7 6.8 20.0 7.9 22.6 0.1 9.7 9.7Taxes on products 7.8 3.5 31.0 4.8 12.8 3.8 12.1 14.2 7.7 7.7
Contribution to GDP growth rateGDP at market prices 100 100 100 100 100 100 100 100 100 100Agriculture and Fishing 20.5 14.7 7.9 36.1 25.9 11.5 11.6 10.9 11.6 11.6
Agriculture 19.0 13.6 7.8 34.1 25.7 11.3 11.1 9.9 11.2 11.2Crops 13.2 -4.8 -2.7 18.9 14.1 7.9 8.2 7.2 6.2 7.2
Fishing 1.5 1.1 0.2 2.1 0.1 0.2 0.5 1.0 0.4 0.4Industry and construction 27.6 25.8 25.7 23.7 12.5 28.5 31.2 27.6 31.9 31.9
Mining and quarrying 7.9 -12.3 3.8 -6.1 10.4 3.8 2.7 1.8 4.4 4.4Manufacturing 7.7 11.9 9.3 14.4 6.5 10.4 6.6 6.6 7.2 7.2Electricity Gas &Water 1.6 -1.2 0.9 1.6 1.4 2.2 -0.6 1.7 1.5 1.5Construction 10.4 27.4 11.8 13.8 -5.8 12.2 22.6 17.5 18.8 18.8
Services (RHS) 47.6 60.4 47.4 35.7 50.2 57.4 50.5 47.8 50.3 50.3Trade and repairs 6.8 18.4 14.5 11.5 5.0 15.2 14.4 6.3 14.3 14.3Hotels and restaurants 0.9 1.4 1.0 1.1 0.3 1.0 0.9 0.6 0.5 0.5Transport & Communications 10.7 13.8 5.9 6.8 19.4 20.9 7.1 17.0 15.6 15.6Financial & Insurance 2.3 9.1 6.5 9.5 10.8 7.1 7.1 3.4 6.2 6.2Real estate and business services 9.3 8.3 3.6 7.4 6.4 12.8 4.2 7.9 4.3 4.3Public administration 13.8 -0.6 8.7 -9.2 -1.0 -5.4 12.2 7.3 3.8 3.8Education 1.5 4.9 4.8 5.5 5.6 3.4 2.4 2.0 2.3 2.3Health 1.6 3.4 1.4 1.6 2.3 0.9 1.1 2.0 2.0 2.0Other social and personal services 0.7 1.8 1.1 1.5 1.4 1.4 1.2 1.2 1.3 1.3less FISIM -1.3 -5.1 -1.7 -1.5 -4.6 -1.8 -4.1 0.0 -2.0 -2.0Taxes on products 5.6 4.2 20.7 5.9 16.0 4.3 10.8 13.7 8.2 8.2
Source: National Bureau of Statistics

Financial Stability Report - September 2016
34
Appendix 3: Annual GDP Performance by Economic Activity – Zanzibar
Economic Activity 2005 2006 2007 2008 2009 2010 2011 2012 2013 2014 2015rSectoral Share in total GDPGDP at market prices 100 100 100 100 100 100 100 100 100 100 100Agriculture and Fishing 21.5 26.0 24.7 25.0 24.4 24.2 23.1 20.2 21.4 19.9 19.9
Agriculture 17.5 20.8 19.6 19.8 19.5 19.4 18.1 15.3 16.6 15.1 15.1Crops 13.3 14.6 13.5 13.8 13.7 13.7 12.7 9.9 11.4 9.9 9.9
Fishing 4.0 5.3 5.1 5.2 4.9 4.8 5.0 4.9 4.7 4.8 4.8Industry and construction 13.7 17.2 16.8 18.0 17.9 17.9 19.4 19.9 19.2 19.0 19.0
Mining and quarrying 0.8 1.1 1.1 1.3 1.4 1.4 1.5 1.7 1.5 1.5 1.5Manufacturing 5.0 8.9 8.5 8.1 8.0 7.9 7.8 7.7 7.7 7.9 7.9Electricity Gas &Water 1.6 0.8 0.8 0.7 0.7 0.7 0.7 0.8 0.7 0.7 0.7Construction 6.3 6.4 6.4 7.8 7.8 7.9 9.3 9.8 9.3 9.0 9.0
Services 49.3 47.6 49.4 49.0 49.6 49.9 49.5 49.4 48.3 49.6 49.6Trade & repairs 9.9 11.1 11.6 10.1 9.2 8.8 8.6 7.4 7.1 7.5 7.5Hotels & restaurants 7.7 8.9 8.8 7.9 7.5 7.3 7.9 7.7 7.8 7.8 7.8Transport & communication 8.1 4.9 6.4 7.0 6.8 7.8 8.1 8.8 8.2 8.7 8.7Financial intermediation 1.8 3.1 3.5 3.4 4.0 4.4 4.3 4.4 4.3 4.4 4.4Real estate & business services 1.0 6.4 6.4 6.5 6.5 6.6 6.4 6.6 6.6 6.6 6.6Public administration 13.5 8.0 7.7 9.0 10.6 10.2 9.5 10.1 9.9 10.3 10.3Other social and personal services 0.4 1.2 1.2 1.1 1.1 1.1 1.1 1.0 1.0 1.0 1.0Less FISIM 0.8 0.9 0.9 1.1 1.1 1.2 1.2 1.2 1.2 1.2Taxes on products 15.6 9.9 10.0 8.9 9.2 9.1 9.1 11.6 12.4 12.8 12.8
GDP Growth RateDP at market prices (2007=100) 4.9 99.8 5.7 4.2 6.2 4.3 9.3 4.9 7.2 7.0 6.8Agriculture and Fishing 2.9 99.7 0.2 5.5 3.8 3.3 4.7 -8.3 13.2 -0.4 -0.4
Agriculture -2.6 18.9 -5.8 1.3 -1.9 -0.5 -6.4 15.4 8.5 -9.4 -9.4Crops 1.6 99.7 -2.1 6.6 5.1 4.3 1.7 18.4 22.9 -7.2 -7.2
Fishing 6.3 99.7 2.4 5.4 1.9 1.5 13.9 2.5 3.6 8.9 8.9Industry and construction 6.6 99.7 3.5 11.6 5.4 4.6 18.4 7.5 3.4 6.0 6.0
Mining and quarrying 15.5 99.7 9.1 19.8 12.6 6.6 18.4 12.7 -3.6 4.9 4.9Manufacturing 2.4 99.6 0.5 -0.4 4.7 3.5 7.0 3.6 6.9 9.9 9.9Electricity Gas &Water 7.5 99.9 7.5 0.0 1.8 0.0 19.0 5.8 4.1 5.3 5.3Construction 8.8 99.8 6.3 27.6 5.2 5.7 29.8 9.9 1.9 3.0 3.0
Services 5.3 99.8 9.4 3.3 7.1 4.8 8.3 4.8 4.6 9.9 9.9Trade and repairs 14.8 99.7 9.9 -8.9 -3.1 -1.1 7.7 10.4 2.9 13.0 13.0Hotels and restaurants 39.9 99.7 4.5 -6.5 1.1 1.8 18.1 1.5 9.5 6.9 6.9Transport & Communications 9.8 99.9 37.4 14.7 3.1 19.2 14.2 13.7 0.0 13.3 13.3Finance & Insurance 13.7 -99.6 21.0 1.0 25.0 14.5 5.9 7.6 5.1 10.6 10.6Real estate and business services 4.7 98.4 4.8 6.8 5.9 5.7 6.6 6.8 7.7 7.5 7.5Public administration & defense 13.5 99.9 1.3 22.3 25.7 -0.1 1.7 12.0 5.2 10.8 10.8Other social and personal services 4.3 99.2 4.3 0.5 4.4 3.3 7.9 0.1 6.5 5.3 5.3less FISIM 21.0 5.2 28.1 8.6 15.7 4.8 10.8 11.4 11.4Taxes on products 4.9 99.8 6.5 -7.3 10.2 3.4 9.6 33.4 14.1 10.2 10.2
Contribution to GDP growth rateGDP at market prices 100 100 100 100 100 100 100 100 100 100 100Agriculture and Fishing 12.8 21.4 0.8 32.3 15.0 19.0 12.1 37.1 -1.3 19.9 19.9
Agriculture 7.7 17.5 -1.5 25.7 13.4 17.3 4.9 34.7 -7.3 15.1 15.1Crops 4.6 13.3 -5.4 21.3 11.3 13.8 2.5 31.4 -11.7 9.9 9.9
Fishing 5.1 4.0 2.3 6.6 1.6 1.7 7.1 2.4 6.0 4.8 4.8Industry and construction 18.3 13.7 10.6 46.6 15.5 19.1 35.2 9.5 16.5 19.0 19.0
Mining and quarrying 2.4 0.8 1.8 5.4 2.7 2.2 2.8 -0.8 1.0 1.5 1.5Manufacturing 2.5 5.0 0.8 -0.9 6.1 6.5 6.0 7.3 10.9 7.9 7.9Electricity Gas &Water 2.4 1.6 1.0 0.0 0.2 0.0 1.4 0.4 0.6 0.7 0.7Construction 11.0 6.3 7.0 42.1 6.6 10.4 25.0 2.6 4.0 9.0 9.0
Services (RHS) 53.3 49.3 77.4 38.4 54.9 54.6 43.3 30.6 66.7 48.3 48.3Trade and repairs 27.6 9.9 19.4 24.5 -4.9 -2.3 7.2 3.0 13.2 7.5 7.5Hotels and restaurants 47.2 7.7 7.0 13.5 1.3 3.2 14.2 10.1 7.8 7.8 7.8Transport & Communications 15.7 8.1 32.3 22.3 3.5 30.6 11.8 0.0 15.6 8.7 8.7Financial & Insurance 4.7 1.8 11.4 0.8 13.7 13.6 2.8 3.1 6.5 4.4 4.4Real estate and business services 0.9 0.9 5.4 10.4 6.2 8.7 4.7 7.0 7.1 6.6 6.6Public administration 45.6 13.5 1.8 40.7 37.0 -0.2 1.9 7.3 15.5 10.3 10.3Other social and personal services 0.3 0.4 0.9 0.1 0.8 0.9 0.9 0.9 0.8 1.0 1.0less FISIM -2.8 -1.1 -3.9 -2.1 -1.8 -1.7 -2.0 -1.2 -1.2Taxes on products 15.6 15.6 11.3 17.3 14.5 7.2 9.4 22.8 18.1 12.8 12.8
Source: National Bureau of Statistics

Financial Stability Report - September 2016
35
App
endi
x 4:
Qua
rter
ly P
erfo
rman
ce o
f Dar
es S
alaa
m S
tock
Exc
hang
e
Mar
-12
Jun-
12Se
p-12
Dec-
12M
ar-1
3Ju
n-13
Sep-
13De
c-13
Mar
-14
Jun-
14Se
p-14
Dec-
14M
ar-1
5Ju
n-15
Sep-
15De
c-15
Mar
-16
Jun-
16Se
p-16
Tota
l Mar
ket C
apita
lizat
ion
(TZS
Billio
ns)
11,7
76.6
12,7
72.8
12,9
48.4
13,1
97.3
13,5
15.8
14,0
57.9
14,8
42.0
16,4
64.3
17,3
00.7
18,9
02.2
22,5
76.3
22,0
90.4
22,7
43.3
23,7
21.5
22,1
66.4
20,4
94.7
21,3
08.2
21,7
28.6
21,5
79.6
Dom
estic
Mar
ket C
apita
lizat
ion
(TZS
Billio
ns)
2,59
5.0
2,53
5.6
2,71
1.0
3,00
5.1
3,32
3.3
3,86
5.6
4,30
8.6
5,97
9.8
6,17
5.8
7,49
0.0
11,0
21.8
9,92
5.5
10,2
35.9
9,92
7.1
9,80
9.9
9,52
7.9
8,47
0.4
7,91
2.1
8,10
3.0
Cros
s lis
ted
Mar
ket C
apita
lizat
ion
(TZS
Billio
ns)
9,18
1.6
10,2
37.2
10,2
37.4
10,1
92.3
10,1
92.6
10,1
92.3
10,5
33.4
10,4
84.5
11,1
24.8
11,4
12.2
11,5
54.5
12,1
64.9
12,5
07.4
13,7
94.4
12,3
56.5
10,9
66.8
12,8
37.8
13,8
16.5
13,4
76.6
GDP
(TZS
Billio
ns)
61,4
34.2
61,4
34.2
61,4
34.2
61,4
34.2
70,9
53.2
70,9
53.2
70,9
53.2
70,9
53.2
79,4
42.5
79,4
42.5
79,4
42.5
79,4
42.5
89,7
75.9
89,7
75.9
89,7
75.9
89,7
75.9
94,9
81.4
94,9
81.4
94,9
81.4
Tota
l Mar
ket C
apita
lizat
ion/
GDP
(Per
cent
)19
.220
.821
.121
.519
.019
.820
.923
.221
.823
.828
.427
.828
.626
.424
.722
.822
.422
.922
.7
% o
f dom
estic
liste
d Co
mpa
nies
22
.019
.920
.922
.824
.627
.529
.036
.335
.739
.648
.844
.945
.041
.844
.346
.539
.836
.437
.5
% o
f cro
ss lis
ted
Com
pani
es.
78.0
80.1
79.1
77.2
75.4
72.5
71.0
63.7
64.3
60.4
51.2
55.1
55.0
58.2
55.7
53.5
60.2
63.6
62.5
Mar
ket T
urn-
over
(TZS
Millio
ns)
10,1
46.1
10,1
45.8
12,9
00.8
15,2
64.5
10,4
23.9
34,9
33.6
40,0
51.3
167,
050.
822
,622
.542
,691
.517
3,28
4.2
143,
636.
227
7,31
6.9
283,
684.
022
2,24
8.6
286,
856.
912
2,81
6.3
101,
532.
211
3,93
6.3
Shar
e In
dice
s
All S
hare
Inde
x1,
325.
71,
437.
81,
457.
61,
485.
61,
521.
51,
582.
51,
607.
11,
866.
61,
958.
12,
172.
72,
172.
72,
519.
62,
596.
32,
726.
82,
531.
12,
333.
82,
432.
02,
482.
02,
477.
2
Tanz
ania
Sha
re In
dex
1,23
5.2
1,20
7.0
1,29
0.6
1,43
0.5
1,58
2.1
1,84
0.1
2,05
1.0
2,84
3.5
2,93
6.7
3,56
1.6
5,19
0.9
4,67
2.6
4,83
0.0
4,68
4.1
4,63
1.9
4,47
8.1
3,97
2.1
3,70
6.2
3,85
5.9
Bank
s, F
inan
ce &
Inve
stm
ent I
ndex
99
9.4
967.
499
7.6
1,17
0.6
1,34
3.0
1,86
0.1
2,02
0.0
2,51
0.9
3,54
1.1
3,50
2.8
3,79
0.1
3,45
2.3
3,44
4.0
3,40
9.8
6,19
4.5
5,96
4.1
2,64
3.2
2,11
7.6
2,77
4.1
Indu
stria
l & A
llied
(IA)
1,46
6.8
1,49
8.6
1,59
1.7
1,72
3.9
1,88
1.7
1,99
8.2
2,28
4.0
3,41
4.6
3,54
1.1
4,07
1.1
6,86
9.3
6,10
1.0
6,35
0.0
6,07
2.4
3,09
6.4
3,0 1
7.2
5,28
0.2
5,17
5.6
4,95
9.1
Com
mer
cial
Ser
vices
(CS)
-
--
--
-1,
890.
71,
998.
62,
007.
01,
721.
52,
509.
22,
973.
83,
635.
24,
016.
13,
974.
23,
953.
33,
932.
33,
559.
83,
538.
8
Sour
ce: D
ar e
s Sal
aam
Sto
ck E
xcha
nge

Financial Stability Report - September 2016
36
Appendix 5: Tanzania Mainland: Trend of Social Security Investment PortfolioPrudential Limit as Percentage of
Total Assets Mar-15 Jun-15 Sep-15 Dec-15 Mar-16 Jun-16 Sep-16
Bank Deposits 35 9.6 10.0 10.9 8.0 8.4 8.8 7.6
Government Debt 20-70 20.1 18.9 18.2 18.2 20.3 23.0 24.6
Commercial Paper, Promissory notes and Corporate bonds 20 0.2 0.4 0.5 0.3 0.3 0.3 0.3
Loans to Government 10 19.3 21.7 21.8 21.7 21.0 20.6 19.7
Ordinary and Preference Share 20 10.8 9.5 9.4 9.1 8.8 7.6 6.9
Investments in Licensed Collective Investment Schemes 30 1.5 1.4 1.4 1.5 1.5 1.5 1.6
Real Estate 30 21.1 17.7 19.0 20.1 19.8 19.5 19.6
Loans to Corporates and Cooperative Societies 10 3.3 4.6 3.9 4.0 4.0 4.4 4.4
Infrastructure Investment 25 2.6 2.7 1.8 2.4 2.5 2.6 2.7
Other Assets 11.4 13.9 13.6 14.6 13.9 11.9 12.9
Total Assets 8,727.0 9,436.7 9,874.9 9,610.7 10,058.8 10,284.5 10,658.5
Source: Bank of Tanzania

Financial Stability Report - September 2016
37

Financial Stability Report - September 2016
38

Financial Stability Report - September 2016
39

Financial Stability Report - September 2016
40
For any inquiry and comments contactDirectorate of Financial Stability Bank of Tanzania2 Mirambo Street 11884, Dar es SalaamTel: +255 22 223 3471/2Fax: +255 223 4076http://www.bot.go.tz