FINANCIAL STABILITY OVERSIGHT COUNCIL - Front page 2014... · financial stability oversight council...
147
FINANCIAL STABILITY OVERSIGHT COUNCIL 2014 A N N U A L R E P O R T WWW.FSOC.GOV
-
Upload
doankhuong -
Category
Documents
-
view
216 -
download
0
Transcript of FINANCIAL STABILITY OVERSIGHT COUNCIL - Front page 2014... · financial stability oversight council...

FINANCIAL STABILITY OVERSIGHT COUNCIL
2 0 1 4 A N N U A L R E P O R T
W W W.FSOC.GOV

F inanc ia l S tab i l i t y Ove rs ight Counc i l iiiiii
Financial Stability Oversight Council
The Financial Stability Oversight Council (Council) was established by the Dodd-Frank Wall
Street Reform and Consumer Protection Act (Dodd-Frank Act) and is charged with three
primary purposes:
1. To identify risks to the financial stability of the United States that could arise from the
material financial distress or failure, or ongoing activities, of large, interconnected bank
holding companies or nonbank financial companies, or that could arise outside the
financial services marketplace.
2. To promote market discipline, by eliminating expectations on the part of shareholders,
creditors, and counterparties of such companies that the U.S. government will shield
them from losses in the event of failure.
3. To respond to emerging threats to the stability of the U.S. financial system.
Pursuant to the Dodd-Frank Act, the Council consists of ten voting members and five
nonvoting members and brings together the expertise of federal financial regulators, state
regulators, and an insurance expert appointed by the President.
The voting members are:
• the Secretary of the Treasury, who serves as the Chairperson of the Council;
• the Chairman of the Board of Governors of the Federal Reserve System;
• the Comptroller of the Currency;
• the Director of the Bureau of Consumer Financial Protection;
• the Chairman of the Securities and Exchange Commission;
• the Chairperson of the Federal Deposit Insurance Corporation;
• the Chairperson of the Commodity Futures Trading Commission;
• the Director of the Federal Housing Finance Agency;
• the Chairman of the National Credit Union Administration; and
• an independent member with insurance expertise who is appointed by the President
and confirmed by the Senate for a six-year term.
The nonvoting members, who serve in an advisory capacity, are:
• the Director of the Office of Financial Research;
• the Director of the Federal Insurance Office;
• a state insurance commissioner designated by the state insurance commissioners;
• a state banking supervisor designated by the state banking supervisors; and
• a state securities commissioner (or officer performing like functions) designated by
the state securities commissioners.
The state insurance commissioner, state banking supervisor, and state securities commissioner
serve two-year terms.

2 0 1 4 F S O C / / Annual Reportiv
Statutory Requirements for the Annual Report
Section 112(a)(2)(N) of the Dodd-Frank Act requires that the annual report
address the following:
i. the activities of the Council;
ii. significant financial market and regulatory developments, including
insurance and accounting regulations and standards, along with an
assessment of those developments on the stability of the financial
system;
iii. potential emerging threats to the financial stability of the United
States;
iv. all determinations made under Section 113 or Title VIII, and the
basis for such determinations;
v. all recommendations made under Section 119 and the result of such
recommendations; and
vi. recommendations—
I. to enhance the integrity, efficiency, competitiveness, and stability
of United States financial markets;
II. to promote market discipline; and
III. to maintain investor confidence.
Approval of the Annual Report
This annual report was approved unanimously by the voting members of the
Council on May 7, 2014. Except as otherwise indicated, data cited in this report is
as of March 31, 2014.
Abbreviations for Federal Member Agencies of the Council
• Department of the Treasury (Treasury)
• Board of Governors of the Federal Reserve System (Federal Reserve)
• Office of the Comptroller of the Currency (OCC)
• Bureau of Consumer Financial Protection (CFPB)
• Securities and Exchange Commission (SEC)
• Federal Deposit Insurance Corporation (FDIC)
• Commodity Futures Trading Commission (CFTC)
• Federal Housing Finance Agency (FHFA)
• National Credit Union Administration (NCUA)
• Office of Financial Research (OFR)
• Federal Insurance Office (FIO)

vContents
Contents
1 Member Statement ...................................................... 1
2 Executive Summary ..................................................... 3
3 Annual Report Recommendations ............................... 73.1 Reforms to Address Structural Vulnerabilities ..........................................7
3.2 Heightened Risk Management and Supervisory Attention ........................8
4 Macroeconomic Environment .................................... 154.1 U.S. Economic Activity ..........................................................................15
4.2 Nonfinancial Balance Sheets .................................................................18
4.3 Government Finance .............................................................................23
BOX A: Macroeconomic and Financial Market Impacts of the Debt Ceiling and
Government Shutdown ...........................................................................25
BOX B: Detroit and Puerto Rico: Municipal Market Impact ...................................28
4.4 External Environment ............................................................................29
5 Financial Developments ............................................. 375.1 Asset Valuations ...................................................................................37
BOX C: The 2013 Bond Market Selloff, Market Liquidity, and
Broker-Dealer Balance Sheets ................................................................ 41
BOX D: Global Monetary Policy Actions ...............................................................48
5.2 Wholesale Funding Markets ..................................................................57
5.3 Bank Holding Companies and Depository Institutions ............................62
5.4 Nonbank Financial Companies ..............................................................71
BOX E: Concerns Related to Captive Reinsurance ...............................................75
BOX F: Carry Trade Strategies and Susceptibility to Shocks ................................80
5.5 Investment Funds .................................................................................81
5.6 Derivatives Infrastructure ......................................................................87

2 0 1 4 F S O C / / Annual Reportvi
6 Regulatory Developments; Council Activities ........... 916.1 Safety and Soundness ..........................................................................91
6.2 Financial Infrastructure, Markets, and Oversight................................... 99
6.3 Consumer and Investor Protection.......................................................102
6.4 Data Standards ..................................................................................105
6.5 Council Activities ................................................................................108
BOX G: Governance and Transparency .............................................................. 111
7 Potential Emerging Threats ......................................1137.1 Risk of Reliance Upon Short-Term Wholesale Funding ......................... 113
7.2 Developments in Financial Products, Services, and
Business Practices ............................................................................. 113
7.3 Risk-Taking Incentives of Large, Complex, Interconnected
Financial Institutions ........................................................................... 115
7.4 Reliance upon Reference Rates as a Vulnerability ................................ 117
7.5 Financial System Vulnerability to Interest Rate Volatility ....................... 118
7.6 Operational Risks ...............................................................................120
7.7 Foreign Economic and Financial Developments ...................................121
7.8 Data Gaps and Data Quality ................................................................123
Abbreviations ................................................................ 125
Glossary .........................................................................131
List of Charts ................................................................ 143

1Member S tatement
In accordance with Section 112(b)(2) of the Dodd-Frank Wall Street Reform and Consumer Protection
Act, for the reasons outlined in the annual report, I believe that additional actions, as described below,
should be taken to ensure financial stability and to mitigate systemic risk that would negatively affect
the economy: the issues and recommendations set forth in the Council’s annual report should be fully
addressed; the Council should continue to build its systems and processes for monitoring and responding
to emerging threats to the stability of the United States financial system, including those described in the
Council’s annual report; the Council and its member agencies should continue to implement the laws they
administer, including those established by, and amended by, the Dodd-Frank Act, through efficient and
effective measures; and the Council and its member agencies should exercise their respective authorities
for oversight of financial firms and markets so that the private sector employs sound financial risk
management practices to mitigate potential risks to the financial stability of the United States.
The Honorable John A. Boehner
Speaker of the House
United States House of Representatives
The Honorable Nancy Pelosi
Democratic Leader
United States House of Representatives
The Honorable Joseph R. Biden, Jr.
President of the Senate
United States Senate
The Honorable Harry Reid
Majority Leader
United States Senate
The Honorable Mitch McConnell
Republican Leader
United States Senate
1 Member Statement
Jacob J. Lew Secretary of the Treasury Chairperson, Financial Stability Oversight Council
Thomas J. Curry Comptroller of the Currency Office of the Comptroller of the Currency
Mary Jo White Chair Securities and Exchange Commission
Mark P. Wetjen Acting Chairman Commodity Futures Trading Commission
Debbie Matz Chairman National Credit Union Administration
Janet L. Yellen Chair Board of Governors of the Federal Reserve System
Richard Cordray Director Bureau of Consumer Financial Protection
Martin J. Gruenberg Chairman Federal Deposit Insurance Corporation
Melvin L. Watt Director Federal Housing Finance Agency
S. Roy Woodall, Jr. Independent Member with Insurance ExpertiseFinancial Stability Oversight Council

3E xecut i ve Summar y
Over the past year, the U.S. financial system continued to recover from the damage sustained during
the financial crisis. The regulatory reforms required by the Dodd-Frank Act and contemplated in The
Group of Twenty (G-20) agreements moved meaningfully towards completion. Although significant
risks remain, financial markets, institutions, and investor confidence showed resilience over the past
year amid challenging market conditions, including a period of heightened volatility in fixed income
markets, concerns about the U.S. debt ceiling, and pressure on emerging markets (EMs).
The regulatory community reached a number of key milestones in financial reform implementation,
including finalization of the Volcker Rule, bank capital rules, a supplementary leverage ratio for
the largest banks and bank holding companies (BHCs), enhanced prudential standards for the U.S.
operations of large foreign banks, and the advent of clearing, trading, and registration requirements
for swaps markets. Policy development continued with proposed rulemakings on money market fund
(MMF) reform, risk retention for securitizations, and requirements for short-term liquidity coverage for
large banking organizations. Also, there have been significant reductions in intraday credit exposures in
the tri-party repurchase agreement (repo) market and significant progress on the strategy for resolution
under the orderly liquidation authority (OLA). In addition, the Council designated three nonbank
financial companies for enhanced prudential standards and supervision by the Federal Reserve.
In what follows we summarize some of the key potential emerging threats and reforms identified by
the Council that are further described in this year’s annual report. In some cases, we call attention to
threats and reforms identified in previous reports.
Short-Term Wholesale Funding Markets
The influx of customer deposits in recent years has afforded banks the opportunity to reduce their
dependence on short term wholesale funding. Although the usage of commercial paper (CP), repo, time
deposit, and other sources of wholesale funding fell this past year, financial institutions without access
to customer deposits and prohibited from using customer cash and securities for proprietary purposes,
such as broker-dealers, remain dependent on wholesale markets for funding. Since the Council’s
inaugural annual report nearly three years ago, the structural vulnerabilities of the tri-party repo
markets have been highlighted. This past year witnessed important progress in tri-party repo reform.
For example, through supervisory authority, the Federal Reserve has worked with the two clearing banks
and market participants to greatly improve operational efficiencies and controls in the management
and transfer of tri-party repo collateral. As a result, intraday credit exposure was reduced below the
10 percent goal for one clearing bank while the other is expected to have less than 10 percent of this
exposure by the end of 2014.
In addition, reform efforts continue for MMFs, with the SEC releasing a proposed rulemaking in June
2013. Currently, the SEC is assessing comment letters and other data and information to determine
the best approach to prevent possible runs on MMFs in the event of a severe liquidity or credit shock to
MMFs, such as occurred during the financial crisis. Until structural reforms are adopted, the potential
for run risk remains significant. Similarly, the possibility of tri-party repo collateral fire sales still poses
significant risks for the financial system. Policymakers continue to examine ways to minimize potential
tri-party repo spillover effects if such fire sales were to occur.
2 Executive Summary

2 0 1 4 F S O C / / Annual Report4
Developments in Financial Products, Services, and Business Practices
The financial system is constantly evolving with the development of new products, services, and business
practices. These changes can occur for a variety of reasons, including improvements in technology, new
regulations, and competition. Financial evolution provides a number of benefits to the financial system.
However, along with these benefits come new challenges to supervisors and regulators. New products or
services are sometimes developed to circumvent regulation. New practices may move a regulated activity
outside of the regulatory perimeter either by moving the activity offshore or by moving it from a heavily
regulated entity to an entity that is less regulated. It is important to be alert to the potential adverse effects
that may arise with these changes. This is particularly relevant in the current environment, because the
changing financial landscape of the post-crisis world has fostered many developments in financial products,
services, and business practices.
Risk-Taking Incentives of Large, Complex, Interconnected Financial Institutions
Historically, when large, complex, interconnected financial institutions became distressed, official authorities
often intervened to maintain financial stability. Past support can engender expectations of future support,
and such expectations provide incentives for further increases in size, interconnectedness, and complexity.
They also can lead market participants to discount risk, giving these institutions incentives to take on
excessive risk. The Dodd-Frank Act addresses and attempts to mitigate the incentives and abilities of large,
complex, interconnected financial institutions to engage in excessive risk-taking.
During 2013, the largest U.S. financial institutions continued to reduce their complexity as well as their
interconnectedness in some dimensions. Additionally, rating agencies lowered their assessments of the
likelihood of government support. However, credit rating agency opinions continue to explicitly factor in the
possibility that the government will provide support to the largest banks if they become financially distressed.
The full implementation of the OLA, and the phasing in of enhanced prudential standards in coming
years, should help reduce remaining perceptions of government support for large, complex, interconnected
financial institutions.
Reforms of Reference Rates
Beginning in the second half of 2012, investigations reported multiple instances of systematic false reporting
and manipulation of widely used survey based benchmark interest rates, such as the London Interbank
Offered Rate (LIBOR) and Euro Interbank Offered Rate (EURIBOR) by reporting banks. Since the
Council’s 2013 annual report, additional financial institutions have been linked to manipulative activity.
Financial firms have paid fines and penalties in excess of $6 billion globally to settle charges related to
benchmark interest rates.
More recently, concerns have been raised about the integrity of certain foreign exchange (FX) rate
benchmarks. One important observation from the recent allegations in FX markets is that transactions-based
benchmarks can also be subject to improper behavior that distorts the benchmarks and adversely impacts
related markets, highlighting the need for stronger governance and oversight. These revelations erode public
confidence in benchmark interest rates and introduce potential risks to financial stability. Concerns about
manipulation in a range of markets show that a significant conflict of interest can exist between the private
individuals and firms operating in these markets and the need for fair benchmarks to promote financial
stability and efficient market functioning. The international community continues to move to reform the
governance process for financial benchmarks and enhance the integrity of related markets.

5
Financial System Vulnerability to Interest Rate Volatility
The prolonged period of low interest rates has led investors to extend maturities, purchase lower quality
credit, and increase leverage in a search for yield. As a result, higher-yielding strategies have experienced
substantial inflows of funds. Financial institutions also have responded to the low interest rate environment.
Banks have eased loan underwriting standards, while insurance companies and MMFs have moderately
increased the duration of their portfolios. Although interest rates have risen from historic lows, rates could
rise further and impose losses for the holders of fixed income assets. Additionally, since the majority of
leveraged lending is floating rate and borrowers are highly leveraged, a sharp increase in interest rates could
increase the risk of default of these borrowers and impose costs on their lenders. Of course, a continued low
rate environment also has risks. It continues to weigh on earnings of banks, insurance companies, pension
funds, and retirement funds, putting further pressure on them to pursue riskier investments in order to meet
their targeted returns.
Operational Risks
Market continuity and confidence were challenged this past year with an increase in outages and failures
resulting from technological and infrastructure vulnerabilities. Some of these incidents, as in the case
of the NASDAQ securities information processor outage which led to the suspension of trading, resulted
mainly from hardware and network connectivity problems. Other incidents involved software failures that
sent involuntary orders through automated trading systems, leading to large losses on trades that were never
intended to occur. Deliberate attempts to disrupt institutions, markets, or commerce also occurred, as in the
recent high-profile cyber-attack on Target that resulted in the theft of bank card and customer information.
As interconnected firms and financial markets become more dependent on complex technologies and
networks, the frequency, severity, and sophistication of such incidents are likely to rise.
Foreign Markets Risks
In 2013, domestic market participants remained concerned about the adverse consequences of financial
developments abroad. However, the areas from which these risks emanate have changed considerably. In
previous years, euro area stability was a key area of concern for global financial markets. Over the past year,
economic and financial conditions in the euro area have stabilized. At the same time, EMs have become a
focus of concern. Beginning in the late spring of 2013, emerging market economy (EME) exchange rates
and asset prices became much more volatile, and economic growth subsequently slowed in some EMEs. The
potential spillover effects to the United States of current levels of EME stress appear limited, but a substantial
worsening of EME stress is a risk.
Data Gaps and Data Quality
High quality and readily available access to financial data is critical for regulators, supervisors, and the
financial services industry. Access and comprehensiveness of data is limited and gaps exist. For example,
regulators lack sufficient data to thoroughly analyze all repo markets. They are still unable to effectively
monitor securities lending transactions and the reinvestment of cash collateral. In addition, some regulators
still face difficulties in accessing data stored at swap data repositories (SDRs). However, regulators have made
significant progress in addressing financial data gaps in recent years. They now collect real-time data from
various markets and institutions. There has also been progress in rolling out the legal entity identifier (LEI)
to identify parties to financial transactions as well as in the creation of SDRs or security-based swap data
repositories (SBSDRs). The widespread adoption of LEI both domestically and globally, together with the
work to enhance the consistency and availability of swaps data reported by swaps data repositories, would
improve the ability of regulators to monitor emerging risks in the financial system.
E xecut i ve Summar y

2 0 1 4 F S O C / / Annual Report6
Housing Finance Reform
Conditions in the housing and housing finance markets showed signs of improvement in 2013, although
challenges remain. House prices nationally experienced strong increases in the beginning of the year
with recent levels rising more moderately. Home purchasing levels rose modestly, while loan performance
also improved as fewer borrowers fell behind on their mortgages or missed their monthly payments. Amid
these improving market conditions, home equity lending also rose. The government-sponsored enterprises
(GSEs) still provide the majority of financing for borrowers, though they continue to reduce their mortgage
investment portfolios. In order to attract more private capital, the GSEs completed risk sharing transactions
associated with $75 billion in mortgages. Additionally, the GSEs worked to create significant infrastructure
improvements to support the securitization market. Legislative reform efforts also have continued with
legislation under consideration in the Senate and the House.

7Annua l Repor t Recommendat ions
3.1 Reforms to Address Structural Vulnerabilities
3.1.1 Reforms of Wholesale Funding Markets
Tri-party Repo
In its 2013 annual report, the Council highlighted three vulnerabilities in the tri-party repo market:
• Heavy reliance by market participants on intraday credit extensions from the clearing banks.
• Weakness in the credit and liquidity risk management practices of many market participants.
• Lack of a mechanism to ensure that tri-party repo investors do not conduct disorderly,
uncoordinated sales of their collateral immediately following a broker-dealer’s default.
Significant progress has been made over the past year in reducing market participants’ reliance on
intraday credit from the clearing banks. The share of volume funded intraday by the clearing banks
fell from 92 percent in December 2012 to under 20 percent in December 2013, and is projected to fall
below the Tri-Party Repo Infrastructure Reform Task Force’s goal of 10 percent by December 2014. Both
clearing banks have re-engineered the settlement process in ways that require much less intraday credit
extension and have increased the price of credit they still provide. Market participants now face stronger
incentives to manage their risk prudently; many dealers have extended the weighted-average maturity of
their tri-party repo funding thereby sharply reducing their rollover risk exposure.
General Collateral Finance (GCF) repo activity, which settles on the tri-party repo platform, is still
relatively reliant on clearing bank intraday credit to facilitate settlement. Improving the resiliency
of GCF repo settlement is a key focus of industry reform for 2014. The Council urges that market
participants work to extend improvements in the tri-party repo settlement process to GCF repo
settlement as soon as possible.
The risk of fire sales of collateral by creditors of a defaulted broker-dealer, many of whom may
themselves be vulnerable to runs in a stress event, remains an important financial stability concern given
the destabilizing effect such sales may have on markets and their potential to transmit risk across a wide
range of participants. The Council recognizes that regulatory reforms implemented since the crisis,
such as increases in the amount of capital, liquidity, and margin changes for U.S. broker-dealers, may
help to mitigate the risk of default. However, the Council advises all U.S. regulators of firms that rely
on this market for funding to assess whether additional steps may need to be taken to further increase
tri-party repo borrowers’ protection against funding runs in the broader context of liquidity regulation.
The Council also urges coordination between market participants and financial regulators to address
the risk of post-default fire sales of assets by tri-party repo investors.
3 Annual Report Recommendations

2 0 1 4 F S O C / / Annual Report8
Transparency
The Council recognizes that while activity has become more transparent in some areas of the wholesale
funding markets, such as GCF repo and tri-party repo, improvements are needed in other segments of the
market, notably bilateral repo and securities lending. Regulators and policymakers will have a growing need
for information as they attempt to monitor and assess how regulatory reforms are affecting wholesale funding
market functioning and how risks evolve in these markets. The Council recommends that all member
agencies continue to collaborate with the OFR to improve transparency in this area of the financial system.
Money Market Funds
In June 2013, the SEC proposed rules to reform the structure of MMFs in order to make them less susceptible
to runs. The SEC’s proposal includes two principal changes that could be adopted alone or in combination.
One alternative would require a floating net asset value (NAV) for prime institutional MMFs. The other
alternative would allow the use of liquidity fees and redemption gates in times of stress. The proposal also
includes additional diversification, disclosure, and stress testing measures that would apply under either
alternative. The SEC’s proposed reforms would supplement the MMF reforms adopted by the SEC in 2010
that were designed to improve the risk-limiting conditions on MMFs by, among other things, instituting
minimum liquidity requirements, reducing MMFs’ weighted-average maturities, and enhancing the credit
quality of holdings.
In November 2012, the Council, under Section 120 of the Dodd-Frank Act, issued a proposed
recommendation that the SEC implement structural reforms to mitigate the vulnerability of MMFs to runs.
That proposed recommendation included three alternatives for public consideration: (1) a floating NAV; (2)
a stable NAV with a NAV buffer of up to 1 percent and a minimum balance at risk of roughly 3 percent of a
shareholder’s account value; and (3) a stable NAV with a 3 percent NAV buffer in addition to other measures,
including more stringent diversification, liquidity, and disclosure requirements.
When making the proposed recommendation, the Council stated and reiterates today that the SEC, by virtue
of its institutional expertise and statutory authority, is best positioned to implement reforms to address the
risk that MMFs present to the economy. The Council does not expect that it would issue a final Section 120
recommendation to the SEC, if the SEC moves forward with meaningful structural reforms of MMFs. The
Council understands the SEC is currently in the process of reviewing public comments on its proposed
reforms, and the Council recommends that the SEC move forward and adopt structural reforms designed to
address MMF run risk.
The Council recommends that its member agencies examine the nature and impact of any structural reform
of MMFs that the SEC implements to determine whether the same or similar reforms are appropriate for
other cash-management vehicles, including non-Rule 2a-7 MMFs. Such an examination would provide for
consistency of regulation while also decreasing the possibility of the movement of assets to vehicles that are
susceptible to large-scale runs or otherwise pose a threat to financial stability.
3.1.2 Housing Finance Reform
In the past year, there were signs of considerable improvement in the residential housing market. Home
prices increased, delinquency rates declined, and home sales strengthened. However, the housing finance
system remains highly reliant on federal government support, with nearly 80 percent of newly originated
mortgages in 2013 carrying some form of government backing. The development and implementation of
broad reforms for the housing finance system that fosters the involvement of more private capital is critical.
Congress is actively debating the issue. The House Financial Services Committee approved legislation in July
2013, and members of the Committee have released additional proposals for consideration. In the Senate,
members of the Senate Banking Committee introduced legislation in June 2013; and leadership of the

9
Committee released a draft proposal in March 2014, which builds upon the earlier legislation. The Council
recommends that the Treasury, U.S. Department of Housing and Urban Development (HUD), and FHFA
continue to work with Congress and other stakeholders to develop and implement a broad plan to reform
the housing finance system. These efforts, along with some of those described below, should help to reduce
uncertainty in the housing finance market, provide access for creditworthy borrowers, and protect taxpayers.
Review of 2013 Recommendations and 2014 Goals
Since the Council’s 2013 annual report, member agencies have advanced reform in many ways, including:
• The GSEs achieved FHFA’s targets for risk-sharing transactions and reductions in their mortgage
investment portfolios in 2013. The GSEs engaged in multiple types of risk-sharing transactions
associated with $75 billion in mortgages. In addition, the GSEs met the target of disposing of 5 percent
of the less-liquid portion of their mortgage investment portfolios, while meeting the overall goal of 15
percent reduction.
• Member agencies made progress on finalizing the risk-retention rule, required by the Dodd-Frank Act,
by reviewing and inviting comments on a revised proposal in August 2013.
• FHFA and the GSEs continued to make progress on the development of a Common Securitization
Platform (CSP). These efforts included analyzing functions, testing capabilities, and establishing an
operating structure.
Notwithstanding the above, further progress needs to be made in 2014. Outlined below are steps Council
members plan to take in 2014 in order to help meet the Council’s housing finance goals.
Reducing the GSEs’ Footprint
In 2014, FHFA plans to continue encouraging the development of risk-sharing transactions in terms of
size, depth, and types of transactions. In addition, FHFA plans to continue efforts to reduce the size of the
GSEs’ retained investment portfolios with a focus on less-liquid assets. The Council recommends that FHFA
continue these efforts in order to help bring more private capital back into mortgage finance.
Facilitating Increased Private Mortgage Market Activity
New issue nonguaranteed mortgage issuance remains significantly depressed compared to historical
averages. A significant amount of work remains to foster increased levels of private activity in the mortgage
finance market. To help facilitate this, the Council recommends that the relevant agencies continue their
work to finalize the risk-retention rule, including the qualified residential mortgage (QRM) definition. More
broadly, FHFA, Treasury, HUD, CFPB, and Congress must continue to address the weaknesses that became
evident in the recent housing crisis by promoting the development of standards and best practices in the
mortgage market. While some testing of different approaches to better clarify representations and warranties,
enforcement mechanisms, and other terms has begun, the Council recommends continuing collaboration
and standardization among market participants and regulators in these areas.
Building a New Housing Finance Infrastructure
The GSEs have made progress toward developing and improving infrastructure through the CSP and
standardization in various aspects of the mortgage finance market. In October, the GSEs established a
joint venture, Common Securitization Solutions, LLC, which will own the CSP and related business and
operational functions. In 2014, FHFA plans to complete the scoping of the CSP’s functional requirements
and develop GSE/CSP integration plans. The Council recommends FHFA continue to explore changes to the
GSEs’ operations that would lead to a more efficient and sustainable mortgage market.
Annua l Repor t Recommendat ions

2 0 1 4 F S O C / / Annual Report10
3.1.3 Reforms Relating to Reference Rates
In its 2013 annual report, the Council recommended international cooperation for the development of high-
level principles for financial benchmark governance, controls, data sufficiency, and oversight. The Council
also recommended U.S. regulators cooperate with foreign regulators, international bodies, and market
participants to promptly identify alternative interest rate benchmarks anchored in observable transactions
and supported by appropriate governance structures, and to develop a plan to accomplish a transition to new
benchmarks while such alternative benchmarks were being identified. While some progress has been made,
more work is needed to achieve these recommendations.
In addition to achieving the aforementioned efforts, the Council recommends that U.S. regulators continue
to cooperate with foreign regulators and official sector bodies in their assessment of market practices and
benchmarks in the FX markets. The Council also recommends that U.S. agencies consider the International
Organization of Securities Commissions (IOSCO) principles into their ongoing assessment of financial
benchmarks in the United States. Finally, the Council recommends development of a plan to implement a
smooth and orderly transition to any new benchmarks.
3.2 Heightened Risk Management and Supervisory Attention
3.2.1 Developments in Financial Products, Services, and Business Practices
In recent years, the financial system has undergone significant changes resulting from technology,
competitive forces, and new regulations. While such changes and advancements can create significant
benefits, unforeseeable risks can potentially arise in new forms and venues. The Council recommends that
members and member agencies remain attentive to the potential implications for financial stability that may
arise from developments in financial products, business practices, and migration of activities in the
financial system.
Specifically in the case of nonbank mortgage servicing companies, a large amount of mortgage servicing
rights (MSRs) have been sold to nonbank mortgage servicing companies in recent years. These companies are
subject to regulation by the CFPB under federal consumer financial laws and are important counterparties
to the GSEs. Prudential standards at the state level consist of bonding and net worth requirements. The
Council recommends that, in addition to continued monitoring, state regulators work together to collaborate
on prudential and corporate governance standards to strengthen these companies, in collaboration with the
CFPB and FHFA, as may be deemed appropriate.
3.2.2 Capital, Liquidity, and Resolution
Capital and Liquidity
Considerable progress is being made on robust capital and liquidity planning at U.S. financial institutions.
The Federal Reserve continues to conduct its supervisory stress tests to ensure that the largest U.S. BHCs
have sufficient capital and rigorous forward-looking capital planning processes to enable banking firms
to continue operations throughout periods of severe stress. NCUA recently finalized a stress testing and
capital planning requirement for credit unions over $10 billion in assets. The Federal Reserve also recently
finalized enhanced prudential standards, including enhanced capital and liquidity standards, for the largest
domestic BHCs and foreign banking organizations (FBOs) with a U.S. banking presence. In July 2013, the
federal banking agencies finalized regulatory capital rules that implement Basel III reforms. The Council
recommends that the agencies continue to promote forward-looking capital and liquidity planning at large
BHCs, U.S. operations of FBOs, and other depositories.

11
While many different forms of funding are an integral part of the traditional banking model, firms should
diversify their funding base and place prudent limits on the volume of credit-sensitive, short-term liabilities.
On liquidity risk management, the Council recommends that supervisors and private sector risk managers
closely monitor the risks inherent in short-term funding of longer-term assets. In 2013, the federal banking
agencies proposed a liquidity coverage ratio (LCR) that would strengthen the liquidity position of large
banking firms. The Council recommends that the agencies continue to work expeditiously to finalize the
LCR and continue work on potential quantitative rules that would address longer-term liquidity needs for
banking organizations.
Resolution Planning
Resolution plans and the OLA, in conjunction with enhanced prudential standards, are critical elements of
Dodd-Frank Act reform. Effective resolution planning for the largest financial institutions is an important
tool to address the operational and legal complexity of these firms on an ongoing basis. All BHCs with total
consolidated assets of $50 billion or more and nonbank financial companies designated by the Council for
supervision by the Federal Reserve are required to develop, maintain, and periodically submit resolution
plans that would facilitate these entities’ resolution under the Bankruptcy Code. If the Federal Reserve and
the FDIC jointly determine that a resolution plan is not credible or would not facilitate an orderly resolution
under the Bankruptcy Code, then the company must resubmit the plan with revisions. If the company fails to
resubmit a credible plan that would result in an orderly resolution under the Bankruptcy Code, the Federal
Reserve and the FDIC may jointly impose more stringent capital, leverage, or liquidity requirements; growth,
activities, or operations restrictions; and, after two years and in consultation with the Council,
divestiture requirements.
In 2013, 11 financial institutions, including those with nonbank assets greater than $250 billion, submitted
the second submission of their resolution plans, including information responding to guidance provided
to the firms by the Federal Reserve and FDIC. Also in 2013, 120 additional firms submitted their initial
resolution plans. The Federal Reserve and FDIC are reviewing and analyzing all submissions received during
the year. The Council recommends that the Federal Reserve and FDIC continue to implement their authority
in a manner that fosters sound resolution planning and better prepares firms and authorities for a rapid and
orderly resolution under the Bankruptcy Code.
The United States has been working diligently to develop the capabilities needed for an orderly resolution
of a global systemically important financial institution (G-SIFI) using the OLA provided in the Dodd-Frank
Act. The FDIC issued a Federal Register notice for comment on the single point of entry (SPOE) strategy.
An important part of this effort has involved working with foreign counterparts to establish a framework for
effective cross-border cooperation in the event a G-SIFI requires resolution. The Council recommends that
the FDIC and Federal Reserve continue to work with international counterparts to identify and address issues
of mutual concern as the FDIC develops strategies for the orderly resolution of G-SIFIs.
3.2.3 Risk of Increased Interest Rate Volatility
Depository Institutions, Broker-Dealers, and Bank Holding Companies
While financial markets experienced a significant rise in interest rates this past year, the overall levels of rates
remain quite low by historical standards. The extension of the low interest rate period continued to weigh
on earnings of banks, credit unions, and broker-dealers, further incentivizing risk-seeking behavior such as
extending the duration of assets and easing lending standards. Duration extension and increased credit risk-
taking may increase short-term profits, but at the risk of potentially large losses in the event of a sudden yield
curve steepening, a large rise in rates, or a significant widening of credit spreads. The Council recommends
Annua l Repor t Recommendat ions

2 0 1 4 F S O C / / Annual Report12
that supervisors, regulators, and firm management continue to monitor and assess the growing risks resulting
from the continued search-for-yield behaviors as well as the risks from potential severe interest rate shocks.
Insurance Companies
Despite a significant rise in longer-term interest rates this past year, the insurance industry continued to
report investment margins that were below historic averages. If historically low interest rates persist, insurance
companies could face a challenge generating investment returns that are sufficient to meet the cash flow
demands of liabilities. Some insurers have extended portfolio durations or invested in lower credit quality
fixed income assets, or both. Some have also increased investments in commercial mortgage loans, equity
real estate, and alternative assets such as private equity funds and hedge funds, all of which are generally less
liquid than investment-grade fixed-income investments. Movement into longer-duration, lower-quality, and
less liquid assets increases the vulnerability of insurers to surges in interest rates. Life insurers, which typically
have investments in longer-duration fixed-income assets that are held to maturity to match long-tail liabilities,
are vulnerable to interest rate volatility if they have to sell such assets prior to maturity to meet liability cash
flow demands. The Council recommends that FIO and state insurance regulators continue to monitor and
assess interest rate risk resulting from severe interest rate shocks.
3.2.4 Operational Risk
Cybersecurity
The vulnerabilities posed by cross-sector dependencies and interconnected systems across firms, markets,
and service providers can lead to significant cybersecurity risks. These risks could impact economic security,
demanding a coordinated and collaborative government-wide commitment and partnership with the private
sector to promote infrastructure security and resilience.
The Council recommends that the Treasury continue to work with regulators, other appropriate government
agencies, and private sector financial entities to develop the ability to leverage insights from across the
government and other sources to inform oversight of the financial sector and to assist institutions, market
utilities, and service providers that may be targeted by cyber incidents. The Council recommends that
regulators continue to undertake awareness initiatives to inform institutions, market utilities, service
providers, and other key stakeholders of the risks associated with cyber incidents, and assess the extent to
which regulated entities are using applicable existing regulatory requirements and non-regulatory principles,
including the National Institute of Standards and Technology (NIST) Cybersecurity Framework.
The Council recommends that financial regulators continue their efforts to assess cyber-related
vulnerabilities facing their regulated entities and identify gaps in oversight that need to be addressed. The
Council also recognizes the overarching contribution the private sector makes to infrastructure cybersecurity
and urges continued expansion of this work to engage institutions of all sizes and their service providers.
The Council recommends that the Finance and Banking Information Infrastructure Committee, financial
institutions, and financial sector coordinating bodies establish, update, and test their crisis communication
protocols to account for cyber incidents and enable coordination, and with international regulators where
warranted, to assess and share information.
In addition, the Council recognizes the importance of removing legal barriers to information sharing
between public and private sector partners to enhance overall awareness of cyber threats, vulnerabilities, and
attacks, including through Congress’ passage of comprehensive cybersecurity legislation.

13
Market Infrastructure and Market Continuity
Operational risk includes the risk of malfunctions in the technology of automated markets. While such
malfunctions can have varying degrees of market impact, they can potentially erode market confidence and
affect the strength and resilience of the financial system. In the past year, there were several disruptions
in market infrastructure systems that are designed to facilitate the transmission of data and support other
automated trading systems.
During 2013, regulators took various approaches to continue to address infrastructure and automated-
trading system vulnerabilities. The Council notes that, although most of the concerns raised relate to
activities occurring on public and centralized exchanges and venues, such technology issues can have similar
ramifications in other markets, each of which rely on automated systems. The Council also recognizes that
alternative trading venues and methods may present operational and other risks by magnifying system-wide
complexity. These vulnerabilities may be heightened, particularly in fragmented markets, by high frequency
or low latency automated trading activities. As such, regulators should focus not only on centrally-traded
products, but also on a broader set of financial products and trading methods that trade off exchanges.
3.2.5 Data Quality and Comprehensiveness
Data standards are critical because they facilitate the sharing, exchange, comparison, and aggregation of
data for analysis and risk management, and because they reduce costs. Standards are particularly important
to assure quality in data collections. Data should be precisely defined and appropriately stored and protected.
Also, domestic and cross-border exchange of supervisory data among supervisors, regulators, and financial
stability authorities should be facilitated in a manner that safeguards the confidentiality and privacy of such
information. The Council recommends that regulators and market participants continue to work together to
improve the quality and comprehensiveness of financial data in the United States as well as globally.
The LEI is a valuable tool to precisely identify the parties to particular financial transactions, which is
essential for effective counterparty risk management and related purposes. The Council recommends that
members and member agencies continue to evaluate the use of the LEI and promote, where appropriate,
its use in reporting requirements and rulemakings. The Council notes that several of its member agencies
actively participate in the global Regulatory Oversight Council, which currently governs the LEI initiative.
The development of financial product identifiers, such as the unique mortgage identifier (UMI) is another
important step in improving the quality of financial data. The Council recommends that this important
work continues.
For derivatives markets, swaps must now be reported to new entities known as SDRs and SBSDRs. It
is important that these data be sufficiently standardized for effective analysis by regulators and with
appropriate aggregation and protection for public dissemination. In addition, regulators’ access to these data
remains a challenge both in the United States and globally. The Council recommends that members and
member agencies work with international regulators to promote high standards in derivatives data reporting
and recommends that impediments to U.S. authorities’ access to data stored at repositories be resolved.
Addressing data gaps also is critical. While regulators have broadened the scope of data they collect since
the crisis, significant gaps remain. Specifically, with respect to the repo and securities lending markets,
member agencies still do not have complete data encompassing these markets. The Council recommends that
members, member agencies and the OFR continue to work together to fill these data gaps. Also, following on
the OFR’s study on Asset Management and Financial Stability, which was prepared at the Council’s request,
the Council recommends that member agencies and the OFR discuss additional sources of data for that
industry, particularly with respect to the management of separate accounts.
Annua l Repor t Recommendat ions

15
4.1 U.S. Economic Activity
4.1.1 Real Gross Domestic Product
Economic growth picked up somewhat in
2013, with real gross domestic product (GDP)
expanding an estimated 2.6 percent following
a gain of 2 percent in 2012 (Chart 4.1.1). Some
of this modest acceleration owes to factors likely
to be temporary, such as an increased pace of
inventory investment. More persistent sources
of final demand strengthened in the second
half of the year. Consumer spending stepped
up modestly, reflecting improving labor market
conditions and rising equity and house prices.
In contrast, changes in federal fiscal policy had
a dampening effect on demand: the expiration
of the temporary payroll tax cut and income tax
increases for high-income households limited
consumer spending, together with sizable
reductions in federal government purchases,
particularly for defense, weighed negatively on
domestic demand. Additionally, by mid-year the
on-going recovery in the housing market slowed
in response to a rise in mortgage rates.
Consumption and Residential Investment
Real personal consumption expenditures
increased at a moderate pace of 2.33 percent
in 2013, supported by improvements in
labor market conditions, continued growth
in household net worth, improvements
in credit availability, and more optimistic
levels of consumer sentiment (Chart 4.1.2).
Nevertheless, consumer sentiment remains
below pre-crisis norms, labor under-utilization
continues to be elevated, and credit availability
remains limited for many households with
constrained financial resources or credit
history. Growth in real disposable income was
modest in 2013, in part reflecting the rise in
payroll and income taxes at the start of the year.
Housing activity continued to step up through
the first three quarters of 2013, supported by
4 Macroeconomic Environment
-4
-2
0
2
4
-4
-2
0
2
4
2006 2007 2008 2009 2010 2011 2012 2013
Source: BEA, Haver Analytics
As Of: 2013 Q4Percent
Note: Annual changes are Q4/Q4.
Percent
-4
-2
0
2
4
-4
-2
0
2
4
2006 2007 2008 2009 2010 2011 2012 2013
Source: BEA, Haver Analytics
As Of: 2013 Q4Percent
Note: Annual changes are Q4/Q4.
Percent
4.1.1 Change in Real Gross Domestic Product
4.1.2 Change in Real Personal Consumption Expenditures
0.0
0.1
0.2
0.3
0.4
0.5
0.0
0.5
1.0
1.5
2.0
2002 2004 2006 2008 2010 2012 2014
Source: Census Bureau, Haver Analytics
As Of: Mar-2014Millions of Units
Note: Seasonally adjusted at an annualized rate. Gray bar signifies NBER recession.
Millions of Units
Multifamily (right axis)
Single-family (left axis)
4.1.3 Private Housing Starts
Macroeconomic Env i ronment

2 0 1 4 F S O C / / Annual Report16
improving labor market conditions, pent-up
demand from depressed household formation
rates during the recession, and historically low
mortgage rates. Between June and August,
mortgage rates rose about 1 percentage point
and remained near this level for the rest of
2013. Following this increase, housing starts
(Chart 4.1.3) and sales of new and existing
homes all turned down in the fourth quarter,
although some of this may be due to adverse
weather conditions towards the end of the year.
For the year, housing demand was still likely
restrained by more conservative underwriting
standards, especially for individuals with lower
credit scores (see Section 5.1.4).
Business Fixed Investment
Real business fixed investment rose moderately
in 2013. Growth in business investment was
stronger in the second half of 2013 than in
the first half, supported by the acceleration in
business output and general economic activity,
and with earlier uncertainties around the
debt ceiling having faded (see Box A). Also,
supportive of business investment for the year
were favorable corporate financial conditions,
with high profitability, historically low interest
rates on corporate bonds, and improving
financial terms for business loans. However,
high vacancy rates and relatively tight financing
for building investment continue to weigh on
business investment in new structures.
Government Purchases
The contraction in real government purchases
at the federal level more than offset the small
gains in purchases at the state and local levels.
Real local and state government purchases
edged up slightly over the year, after declining
sharply in 2010 and 2011 and flattening out in
2012, mainly owing to improving budgetary
conditions driven by increases in tax revenues.
Real federal government purchases fell at a rate
of 6 percent over the year, after decreasing 2
percent in 2012, with large declines in defense
and nondefense spending reflecting the budget
caps, the sequestration, and the ongoing
drawdown in overseas military operations.
-1000
-800
-600
-400
-200
0
200
400
600
-1000
-800
-600
-400
-200
0
200
400
600
2006 2007 2008 2009 2010 2011 2012 2013 2014
Source: BLS, Haver Analytics
As Of: Mar-2014Thousands of Jobs
Note: Gray bar signifies NBER recession.
Thousands of Jobs
Monthly Change
3-Month Moving Average
3
6
9
12
3
6
9
12
1982 1987 1992 1997 2002 2007 2012
Source: BLS, Haver Analytics
As Of: Mar-2014Percent
Note: Gray bars signify NBER recessions.
Percent
62
63
64
65
66
67
68
62
63
64
65
66
67
68
1982 1987 1992 1997 2002 2007 2012
Source: BLS, Haver Analytics
As Of: Mar-2014Percent
Note: Gray bars signify NBER recessions.
Percent
4.1.5 Civilian Unemployment Rate
4.1.6 Labor Force Participation Rate
4.1.4 Net Change in Nonfarm Payroll Employment

17
Imports and Exports
Real exports of goods and services strengthened
in 2013, boosted by improving foreign GDP
growth in the second half of the year and by
strong sales of petroleum products—associated
with the boom in U.S. oil production—and
of agricultural goods. Imports increased for
the year as well, consistent with the pickup in
domestic aggregate demand. Altogether, net
exports made a small but positive contribution
to real GDP growth in 2013.
4.1.2 The Labor Market
The labor market continued to improve in 2013,
although it is far from having fully normalized.
Nonfarm payroll employment increased at an
average monthly rate of 194,250 jobs in 2013
(Chart 4.1.4), similar to the pace over the
previous two years. The private sector added
on average 197,000 jobs per month, while
government payrolls dropped at an average rate
of 3,000 per month.
These job gains helped reduce the
unemployment rate from 7.9 percent at the
end of 2012 to 6.7 percent in December 2013
(Chart 4.1.5). Nonetheless, the unemployment
rate remains elevated. Additionally, labor
force participation has continued to fall,
dropping another 0.6 percentage points since
the end of 2012 and bringing the decline since
the beginning of 2008 to just less than 3.25
percentage points (Chart 4.1.6).
In December 2013, 38 percent of unemployed
workers had been out of work for more than six
months (Chart 4.1.7). Much of the declining
trend in the labor force participation rate
may be due to ongoing demographic changes
related to the retirement of the baby boomers.
However, some may also be due to cyclical
factors, such as discouraged job seekers leaving
the work force.
The high rate of unemployment in the current
economic expansion has raised concerns that
the natural rate of unemployment may have
risen over the past few years in the United
States. However, the continued decline in the
0
10
20
30
40
50
0
10
20
30
40
50
1982 1987 1992 1997 2002 2007 2012
Source: BLS, Haver Analytics
As Of: Mar-2014Percent Percent
Note: Long-term unemployment as a percent of total unemployment. Gray bars signify NBER recessions.
20
22
24
26
28
20
22
24
26
28
2000 2003 2006 2009 2012
Source: Flow of Funds, Haver Analytics
As Of: 2013 Q4Percent
Note: Gray bars signify NBER recessions.
Percent
-100
-50
0
50
100
-100
-50
0
50
100
2000 2002 2004 2006 2008 2010 2012 2014
Source: SLOOS, Haver Analytics
As Of: Jan-2014Percent
Note: Gray bars signify NBER recessions.
Percent
Reporting Stronger Demand from Large and
Medium-Sized Firms
Reporting Tighter Standards for Large and
Medium-Sized Firms
4.2.1 Debt to Assets for Nonfinancial Corporations
4.2.2 Bank Business Lending Standards and Demand
4.1.7 Long-Term Unemployment
Macroeconomic Env i ronment

2 0 1 4 F S O C / / Annual Report18
rate of unemployment suggests the natural
rate may be normalizing. Wage growth for
those employed remains subdued by historical
standards.
4.2 Nonfinancial Balance Sheets
4.2.1 Nonfinancial Corporate Sector
In 2013, corporate balance sheets remained
strong as profits grew. Continued growth in
earnings supported further rises in the share
prices of nonfinancial corporations and allowed
them to boost capital (see Section 5.1.3).
Improved credit quality and corporate profits,
as well as the low level of interest rates and
declining spreads on corporate debt, supported
substantial gross borrowing in corporate bond
markets by nonfinancial firms (Chart 4.2.1).
Refinancing accounted for a record share and
volume of corporate leveraged loans, more than
doubling to $682 billion in 2013 from $283
billion in 2012. Total outstanding bank and
nonbank loans to the nonfinancial corporate
sector increased modestly in 2013. Commercial
and industrial (C&I) loans funded by banks
continued to rise. Bank respondents to the
Federal Reserve’s Senior Loan Officer Opinion
Survey on Bank Lending Practices (SLOOS)
reported stronger demand for C&I loans by
large and medium-sized firms for twelve of the
last seventeen quarters as well as some easing of
underwriting standards for sixteen of the last
seventeen quarters (Chart 4.2.2).
Available indicators of corporate credit
quality point to continued improvement. The
default rate on nonfinancial corporate bonds
continued to decline in 2013 (Chart 4.2.3), as
did delinquency rates on C&I loans
(Chart 4.2.4).
4.2.2 Noncorporate Business Sector
Compared to conditions in the corporate
sector, financial conditions in the noncorporate
business sector have improved at a slower
pace. This sector, composed primarily of small
businesses, accounts for slightly less than
one-third of total nonfinancial business debt
0
2
4
6
8
10
0
2
4
6
8
10
1981 1986 1991 1996 2001 2006 2011
Percent Percent
Source: Moody s Investors Service
Note: Default rates are annual rates calculated on a quarterly basis. Gray bars signify NBER recessions.
As Of: 2013 Q4
0
1
2
3
4
0
1
2
3
4
2000 2002 2004 2006 2008 2010 2012
Source: FDIC, Haver Analytics
As Of: 2013 Q4Percent
Note: Percent of total C&I loans. Gray bars signify NBER recessions.
Percent
0
10
20
30
40
50
60
70
80
90
100
0
10
20
30
40
50
60
70
80
90
100
1990 1994 1998 2002 2006 2010
Source: Flow of Funds, Haver Analytics
As Of: 2013 Q4Percent of Total Assets Percent of Total Assets
Other Assets
Cash and Securities
Nonresidential Real Estate
Accounts Receivable
Residential Real Estate
4.2.4 Noncurrent Commercial and Industrial Loans
4.2.5 Noncorporate Assets
4.2.3 Nonfinancial Corporate Bond Default Rate

19
outstanding. However, since small businesses
generally have access to a narrower range
of financing options than corporations, the
majority of small business debt is composed of
bank loans. Therefore, developments in the
noncorporate business sector affect the health
of many banks’ balance sheets, especially for
smaller banks.
Real estate represents the majority of assets
owned by noncorporate businesses (Chart
4.2.5). The decline in real estate collateral
values since the beginning of the financial crisis
has hampered noncorporate borrowers’ ability
to borrow from banks. However, there are signs
that credit conditions are gradually improving,
supported by rising real estate values and
improving business conditions. Net borrowing
by nonfinancial noncorporate businesses,
which had dropped dramatically through 2010,
was slightly positive for most of 2013 except
immediately following the federal government
shutdown (Chart 4.2.6). Respondents to the
SLOOS noted some easing on loan standards
for small firms, while demand for loans by small
businesses generally continued to be tepid
(Chart 4.2.7). Additionally, according to the
National Federation of Independent Businesses
(NFIB), the number of small businesses
indicating difficulty in obtaining credit
continued its downward trend in 2013
(Chart 4.2.8).
4.2.3 Household Sector
Household debt increased sharply in the years
leading up to the financial crisis, reaching a
high of 135 percent of disposable personal
income in the third quarter of 2007. Since then,
households have been deleveraging. By the
end of last year, the ratio of household debt to
disposable income had declined to its 2003 level
of roughly 104 percent (Chart 4.2.9), mostly
due to decreases in outstanding mortgage debt,
which accounts for about three-fourths of all
household debt. The contraction in mortgage
debt appeared to halt in the third quarter of
2013 (Chart 4.2.10). The apparent bottoming
out of mortgage debt follows continued
housing-market activity and a pick-up in home
-400
-200
0
200
400
600
-400
-200
0
200
400
600
2000 2002 2004 2006 2008 2010 2012
Source: Federal Reserve, Haver Analytics
As Of: 2013 Q4Billions of US$
Note: Seasonally adjusted at an annual rate. Gray bars signify NBER recessions.
Billions of US$
-100
-50
0
50
100
-100
-50
0
50
100
2000 2002 2004 2006 2008 2010 2012 2014
Source: SLOOS, Haver Analytics
As Of: Jan-2014Percent
Note: Data includes firms with annual sales of less than $50 million. Gray bars signify NBER recessions.
Percent
Reporting Stronger Demand from Small Firms
Reporting Tighter Standards for Small Firms
0
4
8
12
16
0
4
8
12
16
2000 2002 2004 2006 2008 2010 2012 2014
Source: NFIB, Haver Analytics
As Of: 2014 Q1Percent
Note: Percent of firms reporting credit was harder to obtain minus those reporting easier to get over the past three months. Gray bars signify NBER recessions.
Percent
Net Percent Reporting Credit Harder to Obtain
4.2.7 Bank Business Lending Standards and Demand
4.2.8 Small Businesses’ Difficulty Obtaining Credit
4.2.6 Net Borrowing by Nonfinancial Noncorporate Businesses
Macroeconomic Env i ronment

2 0 1 4 F S O C / / Annual Report20
prices last year, aided by low mortgage rates and
improving labor markets. Borrowers with high
credit scores and equity generally have access to
conforming GSE-backed mortgages, and federal
programs have extended refinance assistance to
borrowers in agency-guaranteed loans without
equity, but access to credit by other borrowers
remains tight relative to pre-crisis levels.
Slow debt growth, historically low interest
rates, and modest increases in employment
and income have reduced the household debt
service ratio (the ratio of debt service payments
to disposable personal income) to 30-year
lows (Chart 4.2.11). Reduced debt burdens
have allowed households to slowly but steadily
become more current on their debts. Since
2009, the percentage of household debt that
is delinquent has decreased from 12 percent
to 7 percent, but still remains significantly
above pre-crisis levels. The share of seriously
delinquent debts also remains at roughly 2008
levels (Chart 4.2.12). Moreover, while aggregate
measures of the debt burden have improved, a
large number of households continue to face
difficulties meeting their financial obligations,
and many are still underwater on their
mortgages.
Aggregate household net worth (the difference
between assets and liabilities) rose about $10
trillion in 2013 to a historical high of nearly $81
trillion (Chart 4.2.13). The ratio of household
net worth to disposable personal income also
increased. Capital gains from rising asset prices,
especially corporate equities, accounted for
most of the increase in net worth, though active
saving, and the decline in outstanding debt
noted above, also contributed in smaller part.
Owners’ equity as a share of household real
estate continued to move up with rising house
prices and falling mortgage debt, although
it still remains about 8 percentage points
below its 1990 to 2005 average (Chart 4.2.14).
As discussed in Section 5.1.4, the share of
mortgages underwater declined.
0
25
50
75
100
125
150
0
25
50
75
100
125
150
1992 1996 2000 2004 2008 2012
Source: BEA, Flow of Funds,Haver Analytics
As Of: 2013 Q4Percent
Note: Other Household Debt includes debts of both households and nonprofits.
Percent
Other Household CreditConsumer CreditMortgages
0
50
100
150
200
0
50
100
150
200
1992 1996 2000 2004 2008 2012
Source: BEA, Flow of Funds,Haver Analytics
As Of: 2013 Q4Percent of Nominal GDP Percent of Nominal GDP
Consumer and Other Household Debt
Nonfinancial Noncorporate DebtNonfinancial Corporate Debt
Mortgages
Note: Other Household Debt includes debts of both households and nonprofits.
9
10
11
12
13
14
15
9
10
11
12
13
14
15
1980 1985 1990 1995 2000 2005 2010
Source: Federal Reserve, Haver Analytics
As Of: 2013 Q4Percent
Note: Ratio of debt service payments to disposable personal income. Seasonally adjusted. Gray bars signify NBER recessions.
Percent
4.2.10 Private Nonfinancial Debt
4.2.11 Household Debt Service Ratio
4.2.9 Household Debt as a Percent of Disposable Personal Income

21Macroeconomic Env i ronment
Unlike mortgage debt, non-mortgage consumer
credit, which accounts for slightly more than
20 percent of total household debt, has been
growing over the past three years. During 2013,
consumer credit outstanding increased about
6 percent to $3 trillion. Auto loans and student
loans accounted for almost all of this increase
(Chart 4.2.15). Costs of education rose, and
federal programs remained the dominant
source of education lending, continuing to
expand at a rapid pace in 2013.
The increase in auto loans reflects availability of
credit and rising consumer demand for motor
vehicles. About $75 billion of auto loan asset-
backed securities (ABS) was issued in 2013.
Subprime auto loan ABS issuance reemerged,
although reportedly with stronger credit
support than before the crisis.
Indicators of changes in the demand for
credit were mixed in 2013. Respondents to the
SLOOS reported stronger demand for credit by
consumers, especially for auto loans. However,
credit applications were little changed, on net,
over the year, and remained generally subdued
relative to the pre-crisis period (Chart 4.2.16).
Although last year’s delinquency rates on auto,
credit card and mortgage loans fell to 2008
levels, delinquencies on student loans and home
equity lines remained considerably higher than
their pre-crisis levels (Chart 4.2.17). Lower
delinquency rates for revolving credit and
auto loans in 2013 likely reflected, in part, the
composition shift toward borrowers with higher
credit scores. The delinquency rates on these
loans to consumers with prime and super-prime
credit scores are currently near their historical
averages.
While households are becoming more current
on most types of debt, the delinquency rate on
student loans outstanding rose to 12 percent
at the end of 2013. Large and growing student
debt burdens and continued weakness in labor
markets have pushed many younger borrowers
into delinquency, despite the longer grace
periods that typically accompany student loans.
0
3
6
9
12
15
0
3
6
9
12
15
2003 2005 2007 2009 2011 2013
Source: FRBNY Consumer CreditPanel/Equifax, Haver Analytics
As Of: 2013 Q4Percent Percent
Derogatory120+ Days Late90 Days Late60 Days Late30 Days Late
Note: Derogatory loans are loans for which there are reports of a repossession, charge off to bad debt, or foreclosure.
-40
-20
0
20
40
60
80
100
120
-40
-20
0
20
40
60
80
100
120
2000 2002 2004 2006 2008 2010 2012
As Of: 2013 Q4Trillions of US$ Trillions of US$
Other AssetsEquitiesCredit Market InstrumentsCash InstrumentsReal Estate
MortgagesConsumer CreditOther Debt
Net Worth
Note: Other Assets primarily include life insurance reserves, pension entitlements, and noncorporateequities. Other Debt primarily include security credit, trade payables, and unpaid life insurance premiums.
Source: Flow of Funds,Haver Analytics
30
40
50
60
70
30
40
50
60
70
2000 2002 2004 2006 2008 2010 2012
1990-2005 Average
Percent Percent
Source: Flow of Funds, Haver Analytics Note: Gray bars signify NBER recessions.
As Of: 2013 Q4
4.2.13 Household and Nonprofit Balance Sheets
4.2.14 Owners’ Equity as Share of Household Real Estate
4.2.12 Share of Household Debt by Delinquency Status

2 0 1 4 F S O C / / Annual Report22
The risk to lenders is mitigated by the fact
that both federal and private student loans
are difficult to discharge in bankruptcy, and
that the federal government has extraordinary
collection authorities. However, rising student-
loan debt burdens and delinquencies may
have implications for households. Despite
features of federal student loans that facilitate
flexible repayment and loan modifications,
high student-debt burdens may dampen
consumption and could impact household
demand for housing purchases in coming years,
as heavily indebted and delinquent borrowers
may be less able to access mortgage credit.
0
200
400
600
800
1000
1200
0
200
400
600
800
1000
1200
2003 2006 2009 2012
Source: FRBNY Consumer Credit Panel/Equifax, Haver Analytics
As Of: 2013 Q4Billions of US$
Note: Gray bar signifies NBER recession.
Billions of US$
Credit Card Debt
Auto Loans
Student Loans
Other HouseholdDebt
100
150
200
250
300
100
150
200
250
300
2000 2002 2004 2006 2008 2010 2012
Source: FRBNY Consumer Credit Panel/Equifax, Haver Analytics
As Of: 2013 Q4Millions of Inquiries
Note: Number of Equifax inquiries within 6 months. Gray bars signify NBER recessions.
Millions of Inquiries
0
3
6
9
12
15
0
3
6
9
12
15
2003 2006 2009 2012Source: FRBNY Consumer Credit Panel/Equifax, Haver Analytics
As Of: 2013 Q4Percent
Note: Student loan delinquency rates in 2012 Q3 are inflated by the reposting of a large number of delinquent loans by a single servicer. Gray bar signifies NBER recession.
Percent
Mortgage Loans
HELOC Auto Loans
Credit Card LoansStudent Loans
4.2.16 Applications for Credit
4.2.17 90+ Day Delinquency Rate by Loan Type
4.2.15 Components of Consumer Credit

23Macroeconomic Env i ronment
4.3 Government Finance
4.3.1 Federal Government
The deficit in the federal unified budget was
4.1 percent of nominal GDP in fiscal year 2013,
a 2.7 percentage point reduction from the 6.8
percent deficit posted in 2012. Outlays declined
modestly reflecting spending restraint from
the 2011 Budget Control Act and sequestration.
Revenue growth in 2013 was strong owing to
policy changes—the expiration of the payroll
tax cut, the reduction in bonus depreciation
allowances, and provisions applying to high-
income taxpayers in the American Taxpayer
Relief Act and Affordable Care Act—as well
as solid growth of taxable incomes of both
corporations and individuals.
The medium-term budget outlook is subject
to considerable uncertainty with respect to
the performance of the economy, the future
stance of fiscal policy, and other factors such
as the pace of health care cost growth. The
Congressional Budget Office estimates that the
deficit will continue to decline to 2.6 percent
of GDP in 2015, owing in large part to robust
revenue growth as the economy continues to
recover and changes in tax law provisions,
especially the bonus depreciation provision.
Starting in 2016, the deficit is expected to
gradually increase, reaching 3.7 percent of GDP
by 2024 (Chart 4.3.1). The rise in the deficit is
driven primarily by projected increases in Social
Security and health care costs due to the aging
of the population and the expectation that
per-capita health care expenditures will grow
faster than GDP, as well as increases in interest
payments (Chart 4.3.2). The ratio of debt held
by the public to GDP is expected to drift up
as the projected deficits are not low enough to
stabilize the debt-to-GDP ratio (Chart 4.3.3).
-12
-8
-4
0
4
-12
-8
-4
0
4
2000 2004 2008 2012 2016 2020 2024
Source: CBO, Haver Analytics
As Of: Apr-2014Percent of GDP
Note: Negative values denote a deficit. Data for fiscal years. Years after 2013 are projected.
Percent of GDP
CBO Baseline Projection
0
1
2
3
4
5
6
7
0
1
2
3
4
5
6
7
2013 2015 2017 2019 2021 2023
Source: CBO, Haver Analytics
As Of: Apr-2014Percent of GDP Percent of GDP
Social Security
Net Interest
Other Mandatory Spending
Defense Discretionary SpendingNondefense Discretionary Spending
Major Health Care Programs
Note: Other mandatory spending is all mandatory spending other than that for major health care programs, Social Security, and net interest.
0
30
60
90
120
150
0
30
60
90
120
150
1948 1958 1968 1978 1988 1998 2008 2018
Source: CBO, Haver Analytics
As Of: Apr-2014Percent of GDP
Note: Data for fiscal years. Years after 2013 are projected.
Percent of GDP
CBO Baseline Projection
4.3.2 Projected Spending in Major Budget Categories
4.3.3 Federal Debt Held by the Public as a Percent of GDP
4.3.1 Federal Unified Budget Surplus/Deficit

2 0 1 4 F S O C / / Annual Report24
The increase in interest payments that is likely
to follow the high level of public debt projected
over the medium term may have important
consequences for fiscal policy moving forward.
In the near term, however, net interest outlays
remain near historical lows and the average
maturity of outstanding debt continues to
lengthen (Chart 4.3.4).
All three major rating agencies maintained
their overall ratings for the United States
in 2013, with Moody’s and Fitch assigning
the United States their highest ratings and
Standard and Poor’s (S&P) assigning the
second-highest rating. Fitch placed U.S.
sovereign debt on negative ratings watch in
October, citing political brinksmanship as a
concern for the U.S.’ creditworthiness (see Box
A), but changed the outlook back to stable in
March 2014. Moody’s and S&P also maintain a
stable outlook for the United States.
40
44
48
52
56
60
64
68
72
1.0
1.4
1.8
2.2
2.6
3.0
3.4
1980 1985 1990 1995 2000 2005 2010
Source: BEA, OMB, Haver Analytics
As Of: 2013 Q4Percent of GDP
Note: Gray bars signify NBER recessions.
Months
Average Maturity of Outstanding Debt
(right axis)
Interest Outlays (left axis)
4.3.4 Interest Outlays and Average Maturity of U.S. Public Debt
0.5
0.7
0.9
1.1
1.3
0.5
0.7
0.9
1.1
1.3
1999 2001 2003 2005 2007 2009 2011 2013
Trillions of US$ Trillions of US$
Source: Census Bureau
As Of: 2013 Q4
Note: Revenues measures includes revenues from property, individual income, corporate income, and sales taxes. Gray bars signify NBER recessions. Revenue shown represents the trailing 4 quarters.
4.3.5 State and Local Government Tax Revenues

25
compounded by a 16-day government shutdown that
began on October 1, 2013.
In early October, the market began to consider a
scenario in which Congress would be unable to reach an
agreement to raise the debt ceiling before the Treasury
exhausted its extraordinary measures. This led yields to
rise on bills maturing around that date as investors grew
concerned about the potential for a delayed payment.
In the days leading up to October 17, 2013, yields on
Treasury bills with maturities from mid-October to late-
October became extremely volatile relative both to the
preceding months and historical averages. For example,
the yield on the Treasury bill maturing on October 3, 2013
rose from 3 basis points on September 30, 2013 to 53
basis points on October 15, 2013, a larger reaction than in
similarly affected bills during the 2011 debt ceiling episode
(Chart A.1).
The federal debt ceiling was extended on two separate
occasions in 2013. On both occasions, uncertainties
surrounding the debt ceiling led to temporary disruptions
in some key short-term markets. Investor concerns about
the risk of a missed payment on some Treasury securities
led to a temporary increase in term borrowing costs for
the U.S. government.
On December 26, 2012, Treasury Secretary Geithner
announced that the statutory debt ceiling would be
reached on December 31, 2012 and that Treasury
would begin taking certain extraordinary measures to
temporarily postpone the date that the United States
would otherwise default on its legal obligations. In mid-
January 2013, Treasury Secretary Geithner announced
that the Treasury would exhaust its extraordinary
measures between mid-February and mid-March of
that year. Extraordinary measures are actions, such as
suspending investments in certain federal trust funds,
that temporarily extend the Treasury’s ability to meet the
government’s obligations. The ensuing political debate
with regard to a debt ceiling increase led some investors
to avoid owning certain Treasury bills out of concern that
the principal would not be repaid on time. Accordingly,
yields on bills maturing in late-February and early March
briefly spiked higher than those of surrounding maturities
on the yield curve. However, in late-January an agreement
was reached and on February 4, 2013 a law was enacted
that suspended the debt ceiling through May 18, 2013,
and conditions in the Treasury market quickly normalized.
After May 18, with the debt limit suspension period
ended, the Treasury was able to again take extraordinary
measures to temporarily continue borrowing without
breaching the ceiling, and pressures were largely absent
from financial markets during the second and third
quarters of 2013. Yields on Treasury bills remained at
near-zero rates until the end of the third quarter. However,
in late-September concerns began to reemerge after
Treasury Secretary Lew announced Treasury’s estimate
that extraordinary measures would be exhausted no later
than October 17, 2013 and as it became apparent that
there was no clear plan for Congress to extend the debt
ceiling in a timely manner. Those concerns were later
BOX A: Macroeconomic and Financial Market Impacts of the Debt Ceiling and Government Shutdown
-0.1
0
0.1
0.2
0.3
0.4
0.5
0.6
-0.1
0
0.1
0.2
0.3
0.4
0.5
0.6
-70 -60 -50 -40 -30 -20 -10 0
08/04/2011 T-Bill
10/31/2013 T-Bill
Change in Bills Rate from Reference Date
Source: Bloomberg, L.P.
Note: Horizontal axis refers to the number of days prior to the debt ceiling agreement. 2013 debt ceiling agreement date is 10/17/13. 2011 debt ceiling agreement date is 8/1/11.
A.1 Treasury Bill Yields: 2011 vs. 2013
Macroeconomic Env i ronment

2 0 1 4 F S O C / / Annual Report26
Stress in the Treasury bill market soon spread to the repo
market as some cash lenders excluded certain Treasuries
as acceptable collateral for tri-party repo transactions
(Chart A.2). Moreover, some counterparties took
temporary informal actions by requesting that Treasury
securities maturing in 2013 not be accepted as collateral
in repo and securities lending transactions. In contrast to
the illiquidity experienced in the market for short-dated
bills, overnight repo markets remained liquid.
Additionally, some investors publicly stated that they did
not hold certain Treasury securities that could have been
affected by the debt ceiling. These factors widened bid-
ask spreads for Treasury bills, which under normal market
conditions have minimal transaction spreads. Operational
risks about a missed Treasury payment were also a
concern, since systems that handle securities clearance,
settlement, financing, collateral management, payments,
and pricing could have required manual workarounds and
advanced payments to clients to limit market disruption.
Once an agreement to suspend the debt ceiling was
reached, short-dated bills rapidly returned to near zero
rates. Market participants have emphasized significant
strains in Treasury bill and money markets would likely
occur sooner and with more severity during future debt
ceiling debates.
-10
-5
0
5
10
15
20
25
-10
-5
0
5
10
15
20
25
-60 -50 -40 -30 -20 -10 0 10
GCF Repo (2011)
GCF Repo (2013)
Change in Rate (in Basis Points) from Reference Date
Source: Bloomberg, L.P.
Note: Horizontal axis refers to the number of days prior to the debt ceiling agreement. 2013 debt ceiling agreement date is 10/17/13. 2011 debt ceiling agreement date is 8/1/11.
A.2 Treasury Collateralized Borrowing Rate

27
4.3.2 State and Local Governments
In general, the fiscal position of state and local
governments improved in 2013. State and local
tax revenues increased, continuing the trend
since 2009 (Chart 4.3.5). The improved revenue
picture for both state and local governments
was accompanied by a stabilization of
employment during 2013 (Chart 4.3.6).
Net credit flows to state and local governments
were mixed in 2013. Long-term municipal bond
mutual funds experienced outflows for 10 of the
last 12 months, and long-term bond issuance
was down 12.6 percent to $332 billion (Chart
4.3.7). However, much of this decrease reflected
a decline in refundings from the 2012 levels,
due in part to higher interest rates. In many
instances, municipal bond spreads, a proxy for
municipal yields relative to index levels, also
declined (Chart 4.3.8).
In spite of the relative stability that the sector
experienced during 2013, state and local
governments continue to face significant long-
term challenges. In some municipalities, the
slow pace of economic recovery has restrained
income and sales tax growth. Additionally,
home values remain below peak values in some
parts of the country, restraining property tax
revenue. Other challenges include increased
spending pressure from pension liabilities
and other post-employment benefits. Thirteen
states contribute less than 80 percent of their
annual required contribution to their public
pension funds. In some municipalities, pension
and other post-employment benefits costs are
beginning to crowd out other services.
-2.0
-1.0
0.0
1.0
2.0
3.0
-2.0
-1.0
0.0
1.0
2.0
3.0
2000 2002 2004 2006 2008 2010 2012 2014
Source: BLS, Haver Analytics
As Of: 2014 Q1Percent Change
Note: Gray bars signify NBER recessions.
Percent Change
0
100
200
300
400
500
600
0
100
200
300
400
500
600
2004 2005 2006 2007 2008 2009 2010 2011 2012 2013
New CapitalRefunding
Billions of US$ Billions of US$
Source: Thomson Reuters, SIFMA
As Of: 2013
Note: Excludes maturities of 13 months or less and private placements.
Source: Thomson Reuters MMD
-200
-100
0
100
200
300
400
500
600
700
800
-200
-100
0
100
200
300
400
500
600
700
800
2008 2009 2010 2011 2012 2013 2014
Basis Points Basis PointsAs Of: 31-Mar-2014
Note: Spreads to 10-year Treasury.
AAA GO
MichiganCalifornia
A GO
Illinois Puerto Rico
4.3.7 Municipal Bond Issuance
4.3.8 Municipal Bond Spreads
4.3.6 Growth of State and Local Government Employment
Macroeconomic Env i ronment

2 0 1 4 F S O C / / Annual Report28
Developments in municipal markets—Detroit’s filing for
Chapter 9 bankruptcy protection and the downgrade
of Puerto Rico’s credit rating to non-investment grade
status—have drawn significant investor and media
attention. While market participants largely view these
events as idiosyncratic, they might have the potential to
affect the municipal bond market (Chart B.1).
Although Detroit’s bankruptcy is unique in many respects,
there are two primary ways in which the unfolding story in
Michigan could impact municipalities elsewhere. Investors
may begin to demand higher interest rates from cities with
weak economic fundamentals similar to Detroit, including
population decline, chronic deficits, large unfunded
pension liabilities, and an eroding tax base.
Additionally, if the treatment of claims in Detroit’s
bankruptcy ultimately differs significantly from other
previous municipal bankruptcies, this could create
uncertainty and lead to some amount of broader
re-pricing of risk by investors.
Puerto Rico’s financial challenges have also drawn
investor and media attention. Its overall economy remains
weak, having been in a recession since 2006. Additionally,
Puerto Rico’s outstanding debt of roughly $73 billion
represents a large percentage of GDP. A significant
portion of Puerto Rico’s debt is exempt from federal,
state, and local taxes in the United States and is widely
held by investors.
Despite downgrades to non-investment grade status by
all three major ratings agencies in February 2014, Puerto
Rico was able to issue $3.5 billion in debt in early March,
which authorities have said will allow them to meet their
obligations until the end of calendar year 2015. However,
a material deterioration in the economic and financial
conditions in Puerto Rico could heighten concerns of
municipal market investors, whose current sentiment
remains fragile.
BOX B: Detroit and Puerto Rico: Municipal Market Impact
2.3
2.5
2.7
2.9
3.1
3.3
3.5
3.7
-5000
-4000
-3000
-2000
-1000
0
1000
2000
Feb:13 Apr:13 Jun:13 Aug:13 Oct:13 Nov:13 Jan:14 Mar:14
Municipal Bond Flow – ETFs & Mutual Funds
(left axis)Puerto Rico bond sale
Puerto Rico bond sale
Millions of US$ Percent
Source: EPFR, Bank of America Merrill Lynch, Haver Analytics
As Of: 26-Mar-2014
Detroit files for Chapter 9
Illinois passes pension reform law
Downgrade of Puerto Rico
Municipal Index: Effective Yield
(right axis)Illinois downgraded
B.1 Weekly Municipal Bond Fund Flows and Yields

29
4.4 External Environment
4.4.1 Advanced Foreign Economies
GDP growth in the advanced economies
remained sluggish in 2013, at slightly below the
already subdued pace of the previous two years
(Chart 4.4.1). However, the quarterly trajectory
was more favorable, with most economies
seeing a notable pickup in growth during the
second half of the year. Growth in the euro
area resumed in the second quarter after six
consecutive quarters of contraction. Although
the region’s recovery remains subdued, the exit
from recession removes what had been a major
drag on global activity.
For the major foreign advanced economies
(the euro area, Japan, the United Kingdom,
and Canada), real GDP increased 0.6 percent
in 2013 on a calendar year, GDP-weighted
basis. A slower pace of fiscal consolidation
and significant easing in financial stresses
helped recovery take hold in the euro area. In
Japan, additional discretionary fiscal stimulus,
improved sentiment, and strong corporate
profits helped support consumer and business
spending amid a reflationary monetary policy
program.
Thus far in 2014, activity in the major foreign
advanced economies appears to have held
close to the improved pace maintained during
the second half of 2013. The International
Monetary Fund (IMF) projects major foreign
advanced economies to expand 1.4 percent in
calendar year 2014. The IMF expects growth
in these economies to pick up to a pace of 1.6
percent over the medium term, as headwinds
from fiscal consolidation and deleveraging after
the Great Recession continue to fade
(Chart 4.4.2).
-6
-4
-2
0
2
4
6
8
10
-6
-4
-2
0
2
4
6
8
10
2000 2002 2004 2006 2008 2010 2012 2014 2016 2018
Source: IMF, Haver Analytics
As Of: Apr-2014Percent
Note: Year-over-year percent change.Data after April 2014 is projected.
Percent
Advanced Economies
EmergingEconomies
-6
-4
-2
0
2
4
6
-6
-4
-2
0
2
4
6
2000 2002 2004 2006 2008 2010 2012 2014 2016 2018
Source: IMF, Haver Analytics
As Of: Apr-2014Percent
Note: Year-over-year percent change. Data after April 2014 are projected.
Percent
Canada
Japan
Euro Area
UnitedKingdom United States
4.4.2 Advanced Economies Real GDP Growth
4.4.1 Real GDP Growth
Macroeconomic Env i ronment

2 0 1 4 F S O C / / Annual Report30
Euro Area
Policy actions by euro area authorities have
reduced concerns about a systemic event in
the region, and since mid-2012, have helped
to substantially ease previously severe market
pressures. However, fiscal and financial
headwinds remain. After a year and a half of
recession, the euro area economy saw a tentative
rebound in the middle of 2013, with GDP
expanding over the second and third quarters.
However, euro area GDP growth remains about
2.5 percentage points below its rate in the first
quarter of 2008, and unemployment is running
at a near-record high of 12 percent. The pace of
economic recovery in the euro area is expected
to remain gradual. The IMF forecasts regional
real GDP growth in 2014 to track at roughly
1.2 percent, with growth in most periphery
countries expected to remain measurably below
1 percent (Chart 4.4.3).
The fiscal consolidation measures implemented
to date in the periphery have resulted in
progress in stabilizing fiscal deficits and
arresting the upward trajectory of public debt
burdens. Altogether, euro area governments are
estimated to have reduced fiscal deficits from
6.4 percent of GDP in 2009 to 3 percent of GDP
at the end of 2013. Euro area periphery public
debt levels are now projected to stabilize at high
levels over the coming few years (Chart 4.4.4).
The euro area’s overall current account
balance shifted from a small deficit in 2008 to
a consistent surplus with the surplus reaching
2.4 percent of GDP in 2013. The Netherlands
and Germany have continued to run substantial
current account surpluses since 2011, while
the current account deficits of Italy and Spain
and the smaller economies in the periphery
have contracted significantly. Weak periphery
domestic demand due to deleveraging has not
been offset with stronger exports to the core
(Chart 4.4.5).
-6
-4
-2
0
2
4
6
-6
-4
-2
0
2
4
6
2002 2005 2008 2011 2014 2017
Source: IMF, Haver Analytics
As Of: Apr-2014Percent
Note: Year-over-year percent change. Data after April 2014 are projected.
Percent
SpainFranceEuro AreaItalyGermany
0
40
80
120
160
200
0
40
80
120
160
200
2006 2008 2010 2012 2014 2016 2018
Source: IMF, Haver Analytics
As Of: Apr-2014Percent of GDP
Note: Data after April 2014 are projected.
Percent of GDP
GreeceItalyPortugalIrelandSpain
250
300
350
400
450
250
300
350
400
450
2005 2007 2009 2011 2013
Billions of EUR Billions of EUR
Source: IMF, Federal Reserve, Haver Analytics
As Of: Nov-2013
Note: Seasonally adjusted, 3-month annualized rolling sum. Peripheral Europe includes Ireland, Italy, Spain, Greece, and Portugal.
Outside Euro Area
Within Euro Area
4.4.4 Peripheral Europe: Gross Public Debt
4.4.5 Peripheral Merchandise Exports
4.4.3 Euro Area Real GDP Growth

31
-1
0
1
2
3
4
-1
0
1
2
3
4
2005 2006 2007 2008 2010 2011 2012 2013
As Of: Mar-2014Percent Percent
Current Target
Core
Headline
Note: Year-over-year percent change.Source: Statistical Office of the European Communities, Haver Analytics
4.4.6 Euro Zone: Consumer Price InflationEuro area consumer price inflation has
declined to well below the European Central
Bank’s (ECB) 2 percent target rate. Inflation
readings (both headline, which includes
volatile items, and core, which excludes those
items) were tracking near or below 1 percent
during the final months of 2013 (Chart 4.4.6).
With inflation dropping to multi-year lows in
recent months, the euro area faces the risk of a
prolonged period of substantially below-target
inflation or outright deflation. This could slow
recovery, hinder the internal rebalancing that
is needed between the core and periphery, and
increase the real burden of public and private
debts. IMF and ECB forecasts are for euro area
inflation to stabilize.
Meanwhile, European authorities are pushing
forward with efforts to deepen regional
financial integration and enhance market
confidence in the capital adequacy of European
banks. A single supervisory mechanism for
euro area banks is in the process of being
established under the ECB (expected to be in
place by November 2014) and comprehensive
assessments (by the ECB in cooperation
with the national competent authorities) of
approximately 130 of the largest banking
groups also are underway.
European policymakers also have reached
agreements to pass legislation harmonizing
banking rules and regulation across the
European Union (EU), including national
deposit guarantee schemes, bank recovery and
resolution frameworks and common bail-in
rules, and their new capital requirements
legislation is now in force. In March 2014, EU
finance ministers and the European Parliament
reached a provisional agreement on the Single
Resolution Mechanism, which establishes
a common resolution authority and single
resolution fund for European banks.
Macroeconomic Env i ronment

2 0 1 4 F S O C / / Annual Report32
Japan
In 2013, Japan’s new Liberal Democratic Party
government launched an economic reform
program designed to revive the economy and
exit almost two decades of deflation. (The
program is popularly termed Abenomics,
in reference to Prime Minister Shinzo- Abe.)
The program consists of the so-called “three
arrows”: aggressive monetary stimulus; short-
term fiscal stimulus, paired with long-term
measures to reduce large, structural fiscal
deficits; and structural reforms, to boost the
economy’s long-term growth potential. The IMF
projects that GDP growth will be 1.4 percent in
2014, down slightly from 2013.
Household spending picked up significantly
in 2013 partly in response to rising equity
prices and broader expectations of economic
growth under Prime Minister Abe’s policies.
Consumption is expected to further boost
GDP in the first quarter of 2014, ahead of the
April 2014 consumption tax hike. Temporary
fiscal stimulus of 1 percent of GDP passed in
December will only partially offset the initial
impact of the consumption tax increase and
the overall fiscal impulse in 2014 will be
contractionary.
Japan’s larger banks have begun to reduce
their sizeable Japanese government bond
(JGB) holdings in response to the Bank of
Japan’s (BoJ) asset purchase program. From
March 2013 through December 2013, banks’
holdings of JGBs dropped ¥29,474 billion and
deposits at the BoJ went up ¥35,685 billion.
Domestic lending began to pick up throughout
2013, averaging 2.6 percent growth for the
year. There also are signs that Japan may be
moving from entrenched deflation to sustained
moderate inflation. The overall Consumer
Price Index was up 1.5 percent from its year-
ago level in February. Consumer price inflation
excluding food and energy reached 0.7 percent
in February 2014, the highest in roughly
15 years (Chart 4.4.7). Survey measures of
expected inflation have also risen somewhat.-3
-2
-1
0
1
2
3
4
-3
-2
-1
0
1
2
3
4
1990 1995 2000 2005 2010
Source: Ministry of Internal Affairs and Communications, Haver Analytics
As Of: Feb-2014Percent
Note: Year-over-year percent change.
Percent
Current Target
Core
Headline
4.4.7 Japan: Consumer Price Inflation

33Macroeconomic Env i ronment
4.4.2 Emerging Market Economies
Emerging Market Economies
Economic growth remained generally sluggish
in 2013 across the EMEs (Chart 4.4.8). Growth
for all EMEs was an estimated 4.4 percent
in GDP-weighted calendar year terms, down
slightly from 2012 and roughly 2.5 percentage
points below growth during the 2003-07 global
boom. Growth for EMEs excluding China was
3.1 percent in 2013, also down slightly from
2012 and almost 3 percentage points below
the 2003 to 2007 average. Recent indicators—
including industrial production, exports, and
purchasing manager surveys—show that a
slight recovery may be underway. The IMF is
expecting a modest pickup in growth to 4.6
percent this year, and 3.4 percent
excluding China.
The EMEs continue to act as the main source
of global growth. Last year, EMEs contributed
three-fourths of global GDP growth, and
according to the IMF forecast EMEs will
contribute some two-thirds of global growth
in 2014 (Chart 4.4.9). Importantly, estimates
suggest that trend growth has slowed across
the largest EMEs. The IMF now forecasts EME
real GDP trend growth at roughly 5.25 percent,
down some 1.5 percentage points from its
forecast just two years ago.
EME asset prices came under pressure
beginning in May 2013, with EMEs
experiencing reduced capital inflows in the
second and third quarter, reflecting in part
changing expectations for Federal Reserve
policy, deteriorating longer-term EME growth
prospects, political unrest, and structural
vulnerabilities in some prominent EMEs. While
the market selloff in May and June (see Box C)
broadly affected EME assets, markets displayed
discrimination, putting countries with large
external financing needs, elevated inflation,
and more unpredictable policy frameworks
under greater pressure. Policy makers in a
number of EMEs responded to market strains
by tightening monetary policy and by taking
steps to rebuild policy credibility.
-10
-5
0
5
10
15
-10
-5
0
5
10
15
2005 2007 2009 2011 2013 2015 2017 2019
Source: IMF, Haver Analytics
As Of: Apr-2014Percent
Note: Year-over-year percent change. Data after April 2014 are projected.
Percent
ChinaMexicoBrazil
IndiaRussia
-3
-2
-1
0
1
2
3
4
5
6
-3
-2
-1
0
1
2
3
4
5
6
1992 1995 1998 2001 2004 2007 2010 2013 2016 2019
Source: IMF, Haver Analytics
As Of: Apr-2014Percent
Note: Data after April 2014 are projected.
Percent
Advanced EconomiesEmerging Economies
4.4.9 EME Contributions to Global Growth
4.4.8 Emerging Economies Real GDP Growth

2 0 1 4 F S O C / / Annual Report34
Moving forward, tighter financial conditions
and weaker exchange rates across the EMEs
represent a key question mark for both the
growth and inflation outlooks. EMEs generally
have benefitted from strong capital inflows
over the past several years, something that has
helped support domestic credit growth and
financial system deepening. Nonetheless, such
rapid domestic credit growth across a number
of EMEs has increased asset quality risks and
funding vulnerabilities and could weigh on
growth prospects moving forward.
China
Developments in China remain particularly
important, as China contributed 35 percent of
global GDP growth in 2013. China’s economic
growth held steady in 2013 at 7.7 percent—the
same rate as the previous year—but showed
some signs of modest deceleration in mid-
2013 and in early 2014 (Chart 4.4.10). Growth
in China had slowed steadily from the first
quarter of 2010 through the third quarter of
2012, reflecting in part the government’s desire
to slow the pace of credit growth and rein in
investment in some sectors of the economy,
as well as sluggish external demand in the
advanced economies. Chinese authorities
announced an important new economic reform
agenda in November 2013, which entails, among
other things, a hardening of budget constraints
for some state-owned enterprises and local
governments and enhanced supervision of the
nontraditional credit intermediation system.
China’s current account surplus declined
from 10.1 percent of GDP in 2007 to about 2.1
percent of GDP for the four quarters ending
in December 2013, driven by factors such as
exchange rate appreciation, weak external
demand, and increased imports for domestic
investment purposes.
Private sector debt in China has increased
rapidly over the past five years. From December
2008 to June 2013, private sector debt grew by
167 percent, over twice as fast as GDP growth
over the same period (which was 72 percent)
(Chart 4.4.11). Nonbank financing channels
(off-balance sheet lending, trust loans, and
0
2
4
6
8
10
12
14
16
0
2
4
6
8
10
12
14
16
2000 2003 2006 2009 2012
Source: China National Bureau of Statistics, Haver Analytics
As Of: 2014 Q1Percent
Note: Quarterly data. Percent change from the same quarter of the previous year.
Percent
100
110
120
130
140
150
160
170
180
190
200
100
110
120
130
140
150
160
170
180
190
200
Dec-07 Dec-08 Dec-09 Dec-10 Dec-11 Dec-12
Percent of GDP Percent of GDPAs Of: 2013 Q3
Source: China National Bureau of Statistics, BIS, Haver Analytics Note: Rolling 4-quarter sum of GDP.
4.4.10 China Real GDP Growth
4.4.11 China: Credit to the Private Sector

35Macroeconomic Env i ronment
corporate bond issuance) account for an
increasing share of the flow of new credit.
The rapid growth of credit (Chart 4.4.12) has
raised questions about the efficiency of credit
allocation and the potential for defaults over
the medium term. Much of the funding for this
new credit has come via wealth-management
products (WMPs), which may have increased
liquidity risk in the financial sector. Sold to
investors as higher-yielding alternatives to time
deposits, WMPs are largely off-balance sheet
investment vehicles offered by banks, trusts, and
securities companies. Increased competition for
funds has led to the rapid growth of WMPs—
to 10 percent of system deposits—as well as
increased reliance on interbank borrowing,
particularly at smaller banks.
0
2
4
6
8
10
12
14
16
18
0
2
4
6
8
10
12
14
16
18
2005 2006 2007 2008 2009 2010 2011 2012 2013
Source: China National Bureau of Statistics, The People's Bank of China, Haver Analytics
As Of: 2013Trillions of Renminbi
Note: Additional sources of credit include the following components of "total social financing" as reported by the People's Bank of China: trust loans, entrusted lending, undiscounted bankers' acceptances, and net new corporate bond issuance.
Trillions of Renminbi
Incremental Increase in Nominal GDP
Additional Sources of CreditBank Loans
4.4.12 China: Annual Increases in Credit and GDP

37
5 Financial Developments
5.1 Asset Valuations
5.1.1 Fixed Income Valuations
The past year was a year of transition for
domestic fixed income as market participants
perceived a reduction in the tail risk of
contagion from a European financial crisis
and focused attention on U.S. fiscal and
monetary developments. Fixed income markets
experienced a general rise in nominal medium-
to long-term yields and some periods of
elevated volatility. The increase in volatility was
most notable during late spring and summer
amid changes in monetary policy expectations
and in October during the U.S. government
shutdown and debt ceiling debate. Although
yields rose in the majority of fixed income
sectors, they remain well below long-term
averages.
Treasury yields rose year over year across
maturities as seen by the change in 10-year
yields from 1.86 percent to 2.73 percent
(Chart 5.1.1). Yields for five-year and seven-year
maturities rose on average by 1.02 percent while
shorter maturity yields remained unchanged
over the same period. The most significant
yield increases were seen in the months of May
through August 2013, a period of considerable
volatility (see Box C). The Treasury yield curve
steepened (Chart 5.1.2), retracing to 2011 levels,
reflecting a notable increase in long-term yields.
While fixed income implied volatility remains
at historically low levels, periods of elevated
volatility did occur in 2013. Fixed income
implied volatility, as measured by prices of
options on Treasury securities and interest rate
swaps, nearly doubled during May and June
2013 (Chart 5.1.3).
Agency mortgage-backed securities (MBS)
experienced significant price declines and
higher yields resulting from interest rate
5.1.1 Treasury Yields
Percent As Of: 31-Mar-2014
Source: U.S. Department of Treasury
0
1
2
3
4
0
1
2
3
4
Jan:11 Jul:11 Jan:12 Jul:12 Jan:13 Jul:13 Jan:14
Percent
2Y
5Y
10Y
Basis Points
100
150
200
250
300
100
150
200
250
300
Jan:11 Jul:11 Jan:12 Jul:12 Jan:13 Jul:13 Jan:14
2Y/10Y Spread
Basis PointsAs Of: 31-Mar-2014
Source: U.S. Department of Treasury
5.1.2 Slope of the Treasury Yield Curve
F inanc ia l Deve lopments
0
50
100
150
200
250
0
50
100
150
200
250
2005 2006 2007 2008 2009 2010 2011 2012 2013 2014
Source: Bank of America Merrill Lynch, Haver Analytics
As Of: Mar-2014Basis Points
Note: MOVE is the yield curve weighted index of the normalized implied volatility on 1-month Treasury options. SMOVE is the yield curve weighted index of the normalized implied volatility on 1-month swaptions.
Basis Points
MOVE Index SMOVE Index
5.1.3 Implied Volatility

2 0 1 4 F S O C / / Annual Report38
volatility (Chart 5.1.4). The combination of
significant declines in MBS duration from
declining interest rates and increases in
borrower refinancing incentives since mid-2012
increased the possibility of a convexity event.
As noted in the Council’s 2013 annual report,
a convexity event is where an initial increase in
long-term interest rates is amplified by many
MBS investors actively hedging the duration of
their MBS, resulting in rapid increases in long-
term interest rates. While agency MBS suffered
sizeable losses mid-year, the market impact from
a rise in interest rates was not as severe as the
2003 convexity event, when 10-year Treasury
yields rose by 1.4 percentage points in a six-
week period. By comparison, the 10-year yield
rose by 1.0 percentage point in about the same
time frame at mid-year 2013. There are several
reasons why this convexity event was less severe.
First, unlike in 2003, the Federal Reserve held
a substantial portion of outstanding MBS in
2013, thus absorbing a significant part of the
overall MBS universe duration extension as
interest rates rose. Because the Federal Reserve
was not engaged in hedging activities that other
large-scale investors would be engaged in, this
lessened the impact of higher rates resulting
from hedges. Second, interest rate options, a
major driver of higher rates in 2003’s convexity
event, experienced lower volumes due to less
participation in this market by the GSEs.
Lastly, the predominant holders of agency MBS
outside of the Federal Reserve are composed
of banks, investment funds, life insurance
companies and pensions (Chart 5.1.5). These
investors, which tend to rebalance their
duration hedges infrequently, have increased
their holdings since 2003. While these investors
are sensitive to price fluctuations, they tend
to have longer investment horizons and very
stable sources of funding compared to agency
real estate investment trusts (REITs) or hedge
funds.
Like Treasury securities, corporate bonds
experienced a significant increase in yields in
May and June 2013. Investment grade yields
year over year increased on average from 3.26
1.5
2.0
2.5
3.0
3.5
4.0
1.5
2.0
2.5
3.0
3.5
4.0
Jan:13 Apr:13 Jul:13 Oct:13 Jan:14
Source: Bloomberg, L.P.
As Of: 31-Mar-2014Percent Percent
10-Year Treasury
Fannie Mae 30-Year MBS
Source: Fannie Mae, Freddie Mac, SIFMA, Federal Reserve, FSOC calculations
Mutual Funds (14.3%)
FederalReserve (25.2%)
DepositoryInstitutions
(23.3%)Foreign (10.3%)
State and Local Gov
(5.7%)
Pension Funds (5.3%)
Insurance (5.7%)
GSEs (3.5%)
Agency REITs(3.4%)
Other (3.3%)
Note: Other includes security brokers and dealers, households, nonfinancial corporations, and ABS issuers.
As Of: 2013 Q4
5.1.4 Agency MBS and Treasury Yields
5.1.5 Outstanding Agency MBS by Holders

39
percent to 3.65 percent. Average yields for
high-yield bonds remained relatively unchanged
year over year at 5.7 percent. Credit spreads
continued to tighten for both investment grade
and high-yield bonds (Chart 5.1.6). Issuance
of corporate bonds remained strong, with
over $1.4 trillion, nearly the same amount as
2012 (Chart 5.1.7). Some market participants
attribute this level of activity in the corporate
bond market to improved credit conditions and
low levels of default, while others cite greater
demand by a broader set of investors searching
for yield.
Leveraged loans, generally issued to speculative
grade obligors, also had a very strong year
of issuance and credit spread performance
(Chart 5.1.8, Chart 5.1.9). Strong demand from
collateralized loan obligations (CLOs) and from
private and public funds searching for yield
helped propel leveraged loan growth. CLOs
witnessed stronger demand in 2013 than 2012,
with gross issuance rising almost $83 billion
(Chart 5.1.10). As with leveraged loans, CLOs
have seen a broadening of the investor base
as more institutions seek to find higher yields.
Analysts and market participants have raised
concerns that new investors may be unprepared
for the limited liquidity and potential for large
credit losses that both markets could experience
as firms may be taking on outsized risk in
exchange for incremental yield.
5.1.6 U.S. Corporate Bond Option-Adjusted Spreads
200
300
400
500
600
700
800
75
100
125
150
175
200
225
250
Jan:12 Jul:12 Jan:13 Jul:13 Jan:14
Source: Bloomberg, L.P.
As Of: 31-Mar-2014Basis Points Basis Points
High Yield (right axis)
Investment Grade (left axis)
0
300
600
900
1200
1500
0
300
600
900
1200
1500
1996 2000 2004 2008 2012
High-Yield Investment Grade
Billions of US$ Billions of US$
Source: Thomson Reuters, SIFMA
As Of: 2013
Note: Includes all non-convertible corporate debt, medium term notes, and Yankee bonds, but excludes all issues with maturities of one year or less and CDs.
-200
0
200
400
600
800
-200
0
200
400
600
800
2004 2007 2010 2013
Billions of US$ Billions of US$
Source: S&P LCD
Outstanding
As Of: 2013
Gross IssuanceNet Issuance
5.1.7 U.S. Corporate Bond Issuance
5.1.8 Institutional Loans Issuance and Market Size
F inanc ia l Deve lopments

2 0 1 4 F S O C / / Annual Report40
The Shared National Credits (SNC) Review
for 2013 indicates that while credit quality of
syndicated loans remains broadly unchanged
from the previous year’s review, a focused
review of leveraged loans found material
widespread weaknesses in underwriting
practices, including excessive leverage, inability
to amortize debt over a reasonable period, and
lack of meaningful financial covenants. The
review included an evaluation of underwriting
standards on SNCs that were originated in
2012, and examiners noted an increased
frequency of weak underwriting. This trend
heightened the agencies’ concern, and agencies
reiterated that they expect financial institutions
to properly evaluate and monitor underwritten
risk in leveraged loans, and ensure borrowers
have sustainable capital structures, consistent
with the updated leveraged lending supervisory
guidance issued in March 2013.
5.1.9 CLO and Leveraged Loan Spreads
0
50
100
150
200
250
300
300
400
500
600
700
800
900
2010 2011 2012 2013 2014
CLO AAA(right axis)
Leveraged Loans (left axis)
Basis Points Basis PointsAs Of: 31-Mar-2014
Source: JP Morgan, S&P LCD Note: Spreads relative to 3-month LIBOR.
0
20
40
60
80
100
120
0
20
40
60
80
100
120
2005 2007 2009 2011 2013
Billions of US$ Billions of US$
Source: S&P LCD
As Of: 2013
5.1.10 Annual CLO Issuance

41
In its 2013 annual report, the Council pointed to a rapid rise
in longer-term yields as a potential vulnerability. Since last
year’s report, longer-term yields increased substantially,
with the sharpest increase occurring between May 2,
2013 and September 5, 2013 when the 10-year Treasury
yield rose from 1.69 percent to 3.13 percent. This sharp
increase in yield corresponded to a loss of 13.41 percent
on the value of 10-year Treasury holdings. The selloff was
reportedly triggered by investors’ reassessment of the
future path of asset purchases by the Federal Reserve.
Market liquidity in Treasury markets declined during the
selloff. Bid-ask spreads, which measure the cost of buying
and selling assets, widened (Chart C.1). The price impact,
which measures how much prices move in response to
selling pressure, increased (Chart C.2). Market depth,
which measures how much buying and selling can be
supported at a given moment, declined (Chart C.3). These
effects were not limited to Treasury markets, but rather they
reverberated to major fixed income markets.
At the time of the selloff, some buy-side market participants
and the press speculated whether companies’ preparation
for enhanced regulatory capital requirements may
have magnified the severity of the selloff by reducing
broker-dealers’ willingness to provide market liquidity.
Broker-dealers intermediate between buyers and sellers,
putting capital at risk. The less broker-dealers choose to
intermediate supply and demand imbalances, the lower
market liquidity is likely to be. To gauge broker-dealer
market-making broadly, Chart C.4 shows 10-week
changes in broker-dealers’ gross positions in fixed-
income securities. The biggest decline in long positions
in 2013 occurred between May and July (the diamonds
labeled 2013 to the extreme left of the lower-left quadrant),
suggesting that broker-dealers reduced their market-
making activities during the selloff. Other instances in which
there were large changes in both long and short positions
are limited to the height of the financial crisis in 2008, the
bond market selloff of 1994, and the financial market turmoil
of 1998.
BOX C: The 2013 Bond Market Selloff, Market Liquidity, and Broker-Dealer Balance Sheets
C.1 Bid-Ask Spreads on U.S. Treasury Notes
0.25
0.26
0.27
0.28
0.29
0.30
0.50
0.51
0.52
0.53
0.54
0.55
0.56
Jan:13 Mar:13 May:13 Jul:13 Sep:13 Nov:13 Jan:14
Source: Unattributed BrokerTec data, FRBNY calculations
Note: The chart plots 21-day moving average bid-ask spreads for the most recently issued 2-, 5-, and 10-year U.S. Treasury notes. The spread is calculated by subtracting the best bid price from the best ask price in the limit order book and then averaging over the trading day. They are calculated from January 2, 2013 to December 31, 2013.
32nds 32nds
10Y (left axis)5Y (right axis)2Y (right axis)
As Of: 31-Dec-2013
2013 Selloff
0.0
0.5
1.0
1.5
2.0
0
2
4
6
8
Jan:13 Mar:13 May:13 Jul:13 Sep:13 Nov:13 Jan:14
Source: Unattributed BrokerTec data, FRBNY calculations
Note: The chart plots price impact coefficients for the most recently issued 2-, 5-, and 10-year U.S. Treasury notes. The coefficients are calculated on a weekly basis from univariate regressions of 5-minute price changes on net order flow (buyer-initiated volume – seller-initiated volume) over the same interval from January 2, 2013 to December 31, 2013. Grey bar signifies 2013 selloff.
32nds of a point per Billion of US$ 32nds of a point per Billion of US$
2Y (right axis)5Y (left axis)10Y (left axis)
2013 Selloff
As Of: 31-Dec-2013
C.2 Price Impact of Trades Increases during the Selloff
F inanc ia l Deve lopments
0
60
120
180
0
250
500
750
1000
Jan:13 Mar:13 May:13 Jul:13 Sep:13 Nov:13 Jan:14
Source: Unattributed BrokerTec data, FRBNY calculations
Note: The chart plots the 21-day moving average quoted depth for most recently issued 2-, 5-, and 10-year U.S. Treasury notes. The quoted depth is calculated by taking the average of the first tier bid depth and first tier ask depth of the limit order book and then averaging over the trading day. They are calculated from January 2, 2013 to December 31, 2013.
Millions of US$ Millions of US$
2Y (left axis)5Y (right axis)10Y (right axis)
As Of: 31-Dec-2013
2013 Selloff
C.3 Quoted Treasury Market Depth

2 0 1 4 F S O C / / Annual Report42
A look at risk measures of broker-dealers helps to better
understand why broker-dealers pared positions during
the selloff.
Broker-dealer leverage declined markedly during the recent
financial crisis, suggesting that broker-dealer risk-taking has
moderated since the crisis (Chart C.5). Another indicator
of risk-taking is value-at-risk (VaR), which is a forecast of the
worst loss at the 99 percent confidence interval for a daily
horizon. The sum of firm-wide daily VaR across eight large
U.S. broker-dealers has trended down since the financial
crisis. The decline in broker-dealer VaR reflects the decline
in market volatility since the financial crisis as well as the
smaller balance sheet capacity of broker-dealers.
The data presented in Chart C.6 suggests that companies’
preparation for enhanced regulatory capital requirements
was not a major contributing factor in broker-dealers’
willingness to provide market liquidity. In fact, broker-dealer
subsidiaries of BHCs with less regulatory capital before
the selloff reduced their net positions less than other
broker-dealers during the selloff, suggesting that capital
constraints at the consolidated BHC were not a meaningful
exacerbating factor. In particular, U.S. broker-dealers with
a higher VaR gap (which measures the difference between
a broker-dealer’s VaR and its VaR limit), and U.S. broker-
dealer subsidiaries of BHCs with higher Tier 1 capital ratios,
Tier 1 leverage ratios, and Basel III common equity Tier 1
ratio buffers (which measures the difference between a
BHC’s reported ratio and its proposed ratio requirement)
before the selloff tended to reduce their net positions more
during the selloff. That is, broker-dealer subsidiaries of
BHCs with higher capital levels actually sold off more. This
relationship suggests that broker-dealer behavior during the
selloff was driven more by differences in risk appetite than
by enhanced regulatory requirements.
The evidence also suggests that broker-dealers managed
their balance sheets more conservatively at a time when
investors were repricing interest rate risk rapidly, triggered
by changes in expectations about the future path of the
Federal Reserve’s asset purchase program. Broker-
dealers’ withdrawal of liquidity may have amplified the sharp
rise in rates and volatility.
-45
-30
-15
0
15
30
45
-45
-30
-15
0
15
30
45
-40 -20 0 20 40
Sho
rt P
ositi
ons
(per
cent
)
Long Positions (percent)
1998
1994 2008
Source: Federal Reserve, FRBNY calculations
Note: 10-week changes in dealers positions in U.S. Treasury securities, agency debt securities, and agency MBS from September 12, 1990 to January 8, 2014. Highlighted points are all those from 1994, 1998, 2008, and 2013 with significant decreases.
2013
As Of: 08-Jan-2014
C.4 Change in Broker-Dealers’ Long Vs. Short Positions
C.5 Broker-Dealers’ VaR and Net Leverage
0
5
10
15
20
25
0.0
0.3
0.6
0.9
1.2
1.5
2004 2006 2008 2010 2012
Billions of US$ RatioAs Of: 2013 Q4
Total VaR (left axis)
Net Leverage (right axis)
Source: Flow of Funds, Bloomberg, L.P.
Notes: VaR includes Bank of America, Bear Stearns, Citibank, Goldman Sachs, JP Morgan, Lehman, Merrill Lynch, and Morgan Stanley. Net leverage is total financial assets over equity capital.
Correlation between Change in Net Positions and Constraint Prior to the Selloff
Measure of Broker-Dealer Constraint prior to the Selloff:
• VaR Gap (May 1, 2013) -60%
• Basel III Common Equity Tier 1 Ratio Surplus (March 31, 2013) -83%
• Q1 Tier 1 Capital Ratio (March 31, 2013) -74%
• Q1 Tier 1 Leverage Ratio (March 31, 2013) -6%
Source: Federal Reserve, FRBNY calculations
Note: The table shows pairwise correlations between broker-dealers changes in net positions in U.S. Treasury securities, agency debt securities, agency mortgage-backed securities, and corporate securities in the 10-week period spanning the May-July run-up in yields, and dealers constraints shortly before the selloff. To calculate the ratio requirement for the Basel III Common Equity Tier 1 Ratio, we include the 4.5% minimum requirement; 2.5% capital conservation buffer; and the Global Systemically Important Bank (G-SIBs) additional loss absorbency buckets proposed by the Financial Stability Board in November 2012.
C.6 Capital Constrained Broker-Dealers Are Associated withLess Selling

43Financ ia l Deve lopments
5.1.2 Sovereign/Foreign Corporate Debt and
Foreign Exchange
U.S. Sovereign Debt
The total amount of outstanding U.S.
sovereign debt held by the public (including
Federal Reserve holdings, but not other intra-
governmental debt) rose to $12.6 trillion
as of March 2014 (Chart 5.1.11). Long-term
Treasury yields rose starting in May 2013, in
part in response to changing expectations
regarding Federal Reserve policy. The Federal
Reserve announced a modest reduction in the
monthly pace of asset purchases at its meeting
in December 2013, amid an improving U.S.
economic backdrop and labor market. As of the
end of 2013, 10-year Treasury yields had risen
138 basis points since May to 3.04 percent, the
highest level since July 2011.
Foreign holdings of Treasury securities
continued to grow. Year over year ending
February 2014, they rose by $194 billion to $5.9
trillion. The largest investors—investors from
China and Japan—collectively accounted for
$2.5 trillion of Treasury securities, while other
foreign accounts held $3.4 trillion. Since the
end of 2012, the shares and holdings of euro
area and Japanese investors have risen, while
the combined share of other countries has
fallen (Chart 5.1.12).
European Sovereign Debt
German and other core euro area sovereign
debt yields rose over the course of 2013 as
concerns about periphery country credit risk
continued to abate and economic activity
improved. At the end of March 2014, the yield
on the German 10-year government bond
was 1.57 percent, compared to 1.29 percent
a year earlier. Other core country yields rose
by a similar magnitude. The compression of
periphery spreads began following a July 26,
2012, speech in which ECB President Draghi
signaled the creation of the Outright Monetary
Transactions (OMT) program, which allows the
ECB to make unlimited purchases of sovereign
bonds conditional on policy reforms, and vowed
to “do whatever it takes” to prevent the breakup
0
10
20
30
40
50
60
70
80
90
100
0
10
20
30
40
50
60
70
80
90
100
2000 2002 2004 2006 2008 2010 2012 2014
Percent Percent
Source: U.S. Department of Treasury, Haver Analytics
As Of: Feb-2014
China
Japan
Euro Area
Other
5.1.12 Foreign Holders of U.S. Federal Debt
0
3
6
9
12
15
0
3
6
9
12
15
2001 2003 2005 2007 2009 2011 2013
Source: U.S. Department of Treasury, Haver Analytics
As Of: Mar-2014Trillions of US$ Trillions of US$
5.1.11 Publically Held Federal Debt Outstanding

2 0 1 4 F S O C / / Annual Report44
of the euro area. The spreads on Spanish and
Italian 10-year government bonds to German
equivalents were respectively 639 and 536 basis
points on the eve of the speech and by the end
of March 2014, Spanish and Italian spreads to
German bonds were 166 and 173 basis points,
respectively (Chart 5.1.13). The spreads of
government bonds to German equivalents
in Ireland and Portugal also narrowed
substantially and these nations were able to
re-enter debt markets.
Ten-year sovereign yields in the United
Kingdom rose over the course of the year,
ending March 2014 at 2.74 percent, compared
to 1.77 percent a year earlier. Yields were
supported by the broader rise in advanced
economy interest rates as well as the economic
recovery in the United Kingdom.
Japanese Sovereign Debt
In April 2013, the BoJ implemented a policy
known as Quantitative and Qualitative Easing.
Under the policy, the BoJ is seeking to expand
the monetary base at an annual rate of about
60 to 70 trillion yen. The policy seeks to achieve
an inflation rate of two percent in about two
years. As part of the policy, the BoJ increased its
purchases of government bonds, and extended
the duration of its purchases.
Emerging Market Debt
Beginning in May 2013, EM sovereign debt
spreads widened versus Treasury yields, as
measured by the Emerging Market Bond Index
Plus (Chart 5.1.14). Investors began to increase
their level of concern regarding economic
activity (see Section 4.4.2), credit conditions,
external financing needs and elevated inflation
rates in several EMs. Economic and credit
conditions in China in particular were a source
of concern regarding EMs. Political risks in
several EMEs further weighed on market
performance (Chart 5.1.15).
Foreign portfolio inflows to EMEs, which were
very heavy since mid-2009 due in part to carry
trade strategies, declined sharply in the second
quarter of 2013, and had a significant impact on
0
6
12
18
24
30
36
0
3
6
9
12
15
18
2010 2011 2012 2013 2014
Source: Bloomberg, L.P.
As Of: 31-Mar-2014Percent Percent
United Kingdom (left axis)Italy (left axis)Spain (left axis)Portugal (left axis)Ireland (left axis)Greece (right axis)
Note: Ireland did not issue 10-year debt between 10/12/2011 and 3/14/2013.
0
200
400
600
800
1000
0
200
400
600
800
1000
Jul:08 Jul:09 Jul:10 Jul:11 Jul:12 Jul:13
Source: JP Morgan, Haver Analytics
As Of: 31-Mar-2014Basis Points
Note: JP Morgan EMBI+ Sovereign Spreads indices for each region.
Basis Points
Latin AmericaEuropeAsia
5.1.13 Euro Area 10-Year Yield Spreads to German Debt
5.1.14 Emerging Market Bond Spreads
-101
-97
-93
-89
-85
-81
-50
0
50
100
150
200
May:13 Aug:13 Nov:13 Feb:14
EM 5Y LC Yield
(left axis)US 10Y Yield
(left axis)
EM USD Sovereign Spreads (left axis)
EM Currencies (right axis)
Change in Basis Points IndexAs Of: 31-Mar-2014
Source: Bloomberg, L.P., IMF
Note: Index = -100 for May-1-2013. EM 5Y is GDP-weighted average of interest rate swaps for: Malaysia, Korea, Indonesia, Philippines, Thailand, Brazil, Chile, Colombia, Mexico, Peru, Czech Republic, Hungary, Poland, South Africa, Turkey. EM Currencies is a GDP-Weighted average of FX spot rates for: Indonesia, India, Brazil, Chile, Colombia, Mexico, Peru, Czech Republic, Poland, South Africa, Turkey.
5.1.15 EM Assets and U.S. Treasuries: Performance Since3May 1, 2013

45Financ ia l Deve lopments
EME yields (Chart 5.1.16). Gross capital flows to
EMEs declined in the second and third quarter
but remained positive with foreign direct
investment flows continuing to comprise the
largest component (Chart 5.1.17).
EM financial markets came under renewed
pressure in early 2014. Unlike during stress
episodes in 2013, changes in expectations of
Federal Reserve policy did not appear to play a
leading role, as EM asset prices weakened even
as long-term Treasury yields declined. Instead,
EM market weakness appeared to be driven
by a series of country-specific developments in
China, Turkey, Argentina, Ukraine, and Russia.
Declines appeared to be amplified by a more
generalized reduction in global risk sentiment
in the aftermath of extended rallies in some
risk assets (such as U.S. equities) and weaker
data from the United States and China.
In 2013, EMs issued a record amount of
corporate debt and the outstanding amount
reached its highest-ever share of GDP (Charts
5.1.18, 5.1.19). The issuance of U.S. dollar-
denominated (USD) corporate bonds, at $422
billion, was almost four times that of the $111
billion issuance of sovereign bonds. This rise in
issuance comes as EMEs represent an increasing
share in global economic activity.
Asian firms were the most active issuers of
international debt securities in recent years,
followed by Latin American firms. Asian
corporates currently account for 40 percent
of outstanding EM corporate bonds, with
Chinese firms doing much of the borrowing.
Brazilian firms account for the majority of Latin
American borrowing.
Growth of the EME corporate bond market
is generally seen as a positive development
reflecting the increasing global integration of
firms in EMs and an improvement in access
to funding. Portfolio diversification incentives
and risk-return preferences suggest an ongoing 0
100
200
300
400
500
600
0
100
200
300
400
500
600
2004 2005 2006 2007 2008 2009 2010 2011 2012 2013
Private Public
Sovereign
Billions of US$ Billions of US$
Source: Dealogic
As Of: 2013
Note: Public includes issuance by state-owned enterprises.
5.1.18 EME Gross Global Bond Issuance
-350
-300
-250
-200
-150
-100
-50
0
50
-350
-300
-250
-200
-150
-100
-50
0
50
2010 2011 2012 2013 2014
EM
US
Basis Points Basis PointsAs Of: 31-Mar-2014
Source: Bloomberg, L.P., IMF
Note: EM includes GDP-weighted average of Brazil, Chile, Czech Republic, Hungary, Indonesia, Malaysia, Mexico, Peru, Philippines, Poland, South Africa, South Korea, Thailand, and Turkey.
-500
-300
-100
100
300
500
-500
-300
-100
100
300
500
2006 2007 2008 2009 2010 2011 2012 2013
Net Inflows
Portfolio FlowsBank Flows
FDI
Billions of US$ Billions of US$
Source: Haver Analytics
As Of: 2013 Q3
5.1.16 Cumulative Changes in 5-year Government Yields
5.1.17 Gross Capital Flows to EMEs

2 0 1 4 F S O C / / Annual Report46
demand for EM assets commensurate with
their economic and financial growth. These
developments, however, come with risks:
• Currency mismatch: The stock of EME
corporate debt reveals that dollar-
denominated liabilities still constitute a
substantial share of outstanding liabilities.
The debt burden of an EME corporate
borrower that has foreign currency
liabilities but primarily local currency
denominated revenues will rise in the event
of depreciation in its local currency.
• Market illiquidity: Low trading volume
in the secondary market and a lack of risk
management products (i.e. corporate credit
default swaps (CDS)) could amplify the
market reaction in the event of a selloff,
leading to a sharp hike in corporate lending
rates.
• Negative transmission linkages to banking
sector and real economy: Heightened
corporate default rates could generate losses
for domestic banks—both in their loan
books, if they are large lenders to heavily
indebted corporates, and in their securities
holdings, if they hold corporate debt. This
could weaken bank asset quality and capital
adequacy and constrain credit availability to
the domestic economy.
Foreign Exchange
In 2013, the USD appreciated modestly on a
trade-weighted basis, appreciating the most
against the Japanese yen and EM currencies
(Chart 5.1.20). The level of option-implied
volatility across major currency pairs has
remained near historic lows (Chart 5.1.21).
Market participants cited improved U.S.
economic data and the actual announcement
of a decrease in the pace of asset purchases by
the Federal Reserve as supporting the dollar.
However, the USD depreciated against the euro,
the British pound, and the Swiss franc, due to
improving sentiment toward these economies
(Chart 5.1.22).
0.0
0.5
1.0
1.5
2.0
2.5
3.0
3.5
4.0
4.5
0.0
0.5
1.0
1.5
2.0
2.5
3.0
3.5
4.0
4.5
2000 2002 2004 2006 2008 2010 2012
Percent Percent
Source: BIS, IMF, Haver Analytics
As Of: 2013 Q4
Note: Debt expressed as percentage of EME GDP.
Asia & PacificLatin America & CaribbeanEuropeAfrica & Middle East
98
99
100
101
102
103
104
98
99
100
101
102
103
104
Jan:13 Apr:13 Jul:13 Oct:13 Jan:14
Source: Federal Reserve, Haver Analytics
As Of: Mar-2014Index
Note: U.S. Dollar Trade Weighted Index is a weighted average of the foreign exchange value of the U.S. dollar against the currencies of a broad group of major U.S. trading partners.
Index
5.1.19 EME Corporate Debt Securities Outstanding
5.1.20 U.S. Dollar Trade Weighted Index
0
5
10
15
20
0
5
10
15
20
Jan:11 Jul:11 Jan:12 Jul:12 Jan:13 Jul:13 Jan:14
Source: Bloomberg, L.P.
As Of: 31-Mar-2014Percent Percent
Currency VIX1-Month Dollar-Yen1-Month Euro-Dollar
5.1.21 Currency Implied Volatility

47Financ ia l Deve lopments
The euro has appreciated 7.4 percent versus
the dollar since reaching year-to-date lows in
July, and implied volatility continues to trade
near multi-year lows. This was partly due to
an improvement in economic data across
the region, most notably GDP, Purchasing
Managers Index, consumer confidence, and to
a relatively benign political backdrop. Rising
short-term interest rates also contributed to the
appreciation of the euro.
The Japanese yen’s recent performance has
been range-bound, as most of the currency’s
nearly 20 percent depreciation versus the dollar
from late 2012 to early 2013 had coincided with
aggressive fiscal and monetary policy changes.
Investors also remain highly focused on the
outcome of Japan’s ongoing structural reform
efforts.
Year over year, ending March 2014, the British
pound appreciated against all major currencies,
including 9.4 percent versus the USD, on
improved economic data and expectations that
the Bank of England’s (BoE) unemployment
threshold of 7 percent could be reached earlier
than initially expected, and may result in a
reduction of BoE accommodation.
EM currencies have come under pressure
on investor concerns about the longer-term
impact of less accommodative monetary policy
by advanced economy central banks and less
optimistic growth outlooks for many EMEs
(Chart 5.1.23). After the initial April 2013
selloff, some differentiation has occurred,
though depreciation pressures remain for
some EM currencies. After an initial sharp
depreciation, pressures on the Mexican peso
and Indian rupee diminished over the latter
half of the year. Despite this trend, South
Korea and China have seen their currencies
appreciate from April 2013 to March 2014.
70
80
90
100
110
120
130
140
150
70
80
90
100
110
120
130
140
150
Jul:08 Jul:09 Jul:10 Jul:11 Jul:12 Jul:13
Source: Federal Reserve, Haver Analytics
As Of: 31-Mar-2014Index Index
Euro-DollarMajor Dollar IndexOITPYen-Dollar
Note: 1-Jul-2008 = 100. Other Important Trading Partners (OITP) is a weighted average of the FX values of the dollar against a subset of currencies in the broad index that do not circulate widely outside the country of issue.
-35
-30
-25
-20
-15
-10
-5
0
5
10
-35
-30
-25
-20
-15
-10
-5
0
5
10Percent Percent
Source: JP Morgan, Haver Analytics
As Of: Mar-2014
Note: Change in exchange rate is a change in country's JP Morgan Broad Nominal Effective Exchange Rate Index.
5.1.22 U.S. Dollar Exchange Rates
5.1.23 Change in Exchange Rates (April 2013-March 2014)

2 0 1 4 F S O C / / Annual Report48
Even though the economic recovery has solidified over
the past year, activity in most advanced economies
still remains below potential, and inflationary pressures
remain subdued, with inflation well below central bank
targets in some instances. In response, central banks
in the advanced economies have continued to adjust
their policies to sustain their accommodative support
(Chart D.1). The BoJ substantially increased the size
of its asset purchase program, while the ECB further
cut its main policy rate, and both the ECB and the BoE
introduced forms of forward guidance (Chart D.2).
Although the economic recovery in the United States
led the Federal Reserve to begin to reduce the pace of
its asset purchases, it has reinforced its guidance that
monetary policy will remain accommodative for some
time.
The BoJ has continued to pursue achieving and
maintaining a 2 percent inflation rate. Targeting a range
of increase in the monetary base of ¥60 to ¥70 trillion
annually by purchasing JGBs and also some riskier assets
such as exchange-traded funds (ETFs) and Japanese
REITs, the BoJ’s assets have grown rapidly. The yen
depreciated substantially in late 2012 through early 2013,
and Japanese sovereign yields remain at very low levels
even as sovereign rates in other advanced economies
have risen. So far, the shift in policy seems to be
successful in helping to stimulate the Japanese economy
and raising both inflation and inflation expectations,
though year-over-year inflation remains below the BoJ’s 2
percent target.
At its August policy meeting, the BoE introduced new
forward guidance to provide greater clarity and to “keep
market participants from revising up excessively” their
expectations of future monetary policy. The BoE’s
Monetary Policy Committee (MPC) announced that it
intended to keep the policy rate at its current level of
0.5 percent and the stock of assets purchased at £375
billion at least until the unemployment rate has fallen to
7 percent, noting that it expected this to occur around
mid-2016. The MPC stipulated that its guidance would
cease to hold if it expected inflation to rise more than
0.5 percent above its target, or if it thought that inflation
BOX D: Global Monetary Policy Actions
50
90
130
170
210
250
0
1
2
3
4
2000 2002 2004 2006 2008 2010 2012 2014
Source: Bank of Japan, Federal Reserve, European Central Bank
Trillions of Local Currency Trillions of Local Currency
Japan (right axis)
United States(left axis)
As Of: Mar-2014
Euro Area (left axis)
0
5
10
15
20
25
30
35
40
45
50
55
0
5
10
15
20
25
30
35
40
45
50
55
2007 2008 2009 2010 2011 2012 2013 2014
Percent of GDP Percent of GDP
Source: Haver Analytics
Japan
Euro Area
United States
United Kingdom
As Of: Mar-2014
D.2 Central Bank Assets
D.1 Advanced Economy Base Money
expectations had become unanchored or its policies
posed a significant threat to financial stability. Following
a much more rapid drop in the unemployment rate than
was anticipated at the time that its forward guidance was
adopted, the BoE recently revised its guidance, tying
lift-off of its policy rate not just to the unemployment rate
but to the MPC’s overall assessment of spare capacity in
the U.K. economy. In another effort to stimulate growth,
the BoE and U.K. Treasury extended the length and
terms of their Funding for Lending Scheme, which was
designed to encourage lending to households and small-
and medium-sized enterprises; however, in November, in

49Financ ia l Deve lopments
light of a pickup in the housing market, the terms of this
extension were changed to remove support for lending to
households while continuing to support lending to small-
and medium-sized enterprises.
The ECB continued to offer three-month funds through its
longer-term refinancing operations; however, as financial
conditions improved in the euro area, many banks began
to repay funds borrowed from earlier, three-year, ECB
loan operations, and overnight interest rates began to drift
up somewhat. In light of a still-fragile economic recovery
and declining inflation, the ECB sought to provide further
monetary stimulus, using both conventional monetary
policy and forward guidance. The ECB cut its benchmark
policy rate by 25 basis points in both May and November,
lowering the rate from 75 to 25 basis points. At its July
meeting, the Governing Council of the ECB issued
forward guidance by announcing that it “expects the key
ECB interest rates to remain at present or lower levels for
an extended period of time.”
In the United States, the Federal Open Market Committee
(FOMC) maintained the pace of large-scale asset
purchases through last year, continuing to add to its
holdings of agency MBS and longer-term Treasury
securities at a pace of $40 billion and $45 billion per
month, respectively. At its December 2013 meeting, as the
outlook for labor market conditions continued to gradually
improve, the FOMC announced that, starting in January,
it would modestly reduce the pace of its purchases of
agency MBS and longer-term Treasury securities to $35
billion and $40 billion per month, respectively. At the
same time, the FOMC reinforced its forward guidance on
the path of the federal funds rate, indicating that it would
consider not only the unemployment rate but also other
indicators—including additional measures of labor market
conditions, indicators of inflation pressures and inflation
expectations, and readings on financial developments—in
determining how long to maintain a highly accommodative
stance of monetary policy. Based on these factors, the
FOMC anticipated that it would likely be appropriate to
maintain the current federal funds rate target well past
the time that the unemployment rate declined to below
6.5 percent, especially if projected inflation continued to
6
7
8
9
10
11
12
13
40
50
60
70
80
90
100
110
120
Jan:13 May:13 Sep:13 Jan:14
Source: Bloomberg, L.P.
As Of: 31-Mar-2014Index Percent
MOVE Index (left axis)
EM-VXY Index (right axis)
Note: The MOVE Index is a measure of implied volatility on 1-month Treasury options. The EM-VXY Index is a measure of aggregate volatility in currency markets.
D.3 Market Volatility
run below the FOMC’s 2 percent longer-run goal. With
incoming information broadly supporting the FOMC’s
expectation of ongoing improvement in labor market
conditions and inflation moving back toward its longer-
run objective, the FOMC announced further modest
reductions in the pace of asset purchases at its January
and March of 2014 meetings, bringing the pace of
purchases to $25 billion per month for agency MBS and
$30 billion per month for longer-term Treasury securities.
The relatively modest EM currency market reaction
to the FOMC’s December 2013 and January 2014
announcements could be attributed to the fact that
expectations for a reduction in the pace of purchases
were already priced into the market. Indeed, there
had been more market turmoil in May and June of last
year, when speculation that the FOMC would begin to
reduce the pace of its asset purchases first intensified
(Chart D.3). Long-term interest rates in the United States
and other foreign economies increased substantially at
that time. Interest rates in some EMEs increased, however
the dollar appreciated against most other currencies.
Some EME central banks also intervened to support
their currencies. However, these responses were not
uniform; central banks in some of the EMEs with stronger
fundamentals, including Mexico and South Korea, had
enough leeway to cut their policy rates as economic
growth moderated.

2 0 1 4 F S O C / / Annual Report50
5.1.3 Equities and Commodities
Equities
All major equity indices in advanced
economies exhibited significant gains in
2013 (Chart 5.1.24). The rise in developed
market equities was bolstered by an improved
global growth outlook, low interest rates, and
accommodative monetary policy (see Box D).
In the United States, the price performance of
equity indices continued to be positive, with a
gain of over 20 percent for the S&P 500 Index
since April 2013. Corporate equity valuations
increased notably, as the price-to-earnings
ratio for the S&P 500 rose over the course
of the year (Chart 5.1.25). These increased
valuations reflected corporate earnings growth
that started to shift from cost savings to a rise
in sales and revenue. In the euro area, the
Euro Stoxx Index rose by approximately 22
percent since April 2013 (Chart 5.1.26). In the
United Kingdom, the FTSE 250 index rose by 3
percent. Finally, Japanese equity markets rose
by 22 percent.
In contrast, EM equities declined significantly
over the past year. The declines were led by
Brazil and Russia, which fell by 10 percent
and 15 percent, respectively, and were
reflected more broadly in the MSCI Emerging
Markets Index, which was down 4 percent.
Underperformance in EMs reflected concerns
regarding economic activity, credit conditions,
and exchange rate risk. Chinese equity markets
also weakened due to economic growth
concerns as the Shanghai and Hang Seng
indices fell 9 and 1 percent, respectively. In
Russia, equity markets fell sharply at the start of
March 2014 in response to tensions around the
purported annexation of Crimea from Ukraine,
political instability and violence in Eastern
Ukraine, and potential repercussions from U.S.
and EU sanctions.
U.S. equity market implied volatility, as
measured by the Chicago Board Options
Exchange Volatility Index (VIX), averaged
roughly 14 percent in 2013. This marks a return
of the VIX not only to pre-crisis levels, but also
40
60
80
100
120
140
160
40
60
80
100
120
140
160
Jul:08 Jul:09 Jul:10 Jul:11 Jul:12 Jul:13
Source: Haver Analytics
As Of: 31-Mar-2014Index
Note: 01-Jul-2008 = 100.
Index
S&P 500MSCI EMEuro Stoxx 50Nikkei 225
1.0
1.5
2.0
2.5
3.0
3.5
4.0
5
10
15
20
25
30
2002 2004 2006 2008 2010 2012 2014
Percent Percent
Source: Bloomberg, L.P.
P/B Ratio (right axis)
P/E Ratio (left axis)
As Of: 31-Mar-2014
Change from1-Apr-2013 to 31-Mar-2014
Change from 5-Year Low to 31-Mar-2014
Major EconomiesU.S. (S&P) 20% 131%Euro (Euro Stoxx) 22% 67%Japan (Nikkei) 22% 82%U.K. (FTSE) 3% 68%
Selected Europe Germany (DAX) 23% 131%France (CAC) 18% 58%Italy (FTSEMIB) 41% 75%Spain (IBEX) 31% 74%
Emerging Markets Brazil (Bovespa) -10% 20%Russia (RTS) -15% 79%India (Sensex) 19% 126%China (Shanghai SE) -9% 4%Hong Kong (Hang Seng) -1% 64%
Source: Capital IQ
5.1.25 S&P 500 Key Ratios
5.1.26 Returns in Selected Equities Indices
5.1.24 Selected Equities Indices

51
toward the lowest levels of the past 20 years
(Chart 5.1.27). Implied and realized volatility
fluctuated significantly during the year, with the
VIX ranging between 12 and 21 percent. The
fluctuations were most acute in early May when
discussion of tapering by the Federal Reserve
increased, around U.S. fiscal negotiations in
October 2013, and again in January 2014 when
EM asset price volatility rose amid increasing
global growth concerns.
Commodities
Oil prices varied within a narrow band and
experienced less volatility than in prior years
as sharp U.S. domestic supply growth offset
sanctioned Iranian exports, reductions in
Libyan supply, and shocks to the geopolitical
risk premium due to the conflict in Syria.
Consequently, average retail unleaded gasoline
prices in the United States experienced more
muted seasonal price spikes in comparison with
prior years. The difference between West Texas
Intermediate, the principal U.S. oil benchmark,
and Brent, the international benchmark,
narrowed in 2013 but the spread between
the two persists with a backdrop of further
projected gains in domestic energy production.
Growth of natural gas production in the United
States has slowed as producers have shut down
projects or shifted their focus to oil and other
more high value liquids amid the low U.S.
natural gas prices of the last few years. However,
a surge in demand due to unusually cold
weather led to a spike in natural gas prices in
early 2014.
Industrial metal prices that are heavily
influenced by demand from Asia remain
depressed relative to 2011 peaks as market
participants coalesce around lower growth
expectations for Asia and the emerging world
more broadly (Chart 5.1.28).
0
10
20
30
40
50
60
70
80
90
0
10
20
30
40
50
60
70
80
90
1992 1994 1996 1998 2000 2002 2004 2006 2008 2010 2012 2014
VIX
Percent Percent
Source: Capital IQ
As Of: 31-Mar-2014
0
20
40
60
80
100
120
140
0
20
40
60
80
100
120
140
2008 2009 2010 2011 2012 2013
Source: Energy Information Administration, S&P, Haver Analytics
As Of: 31-Mar-2014Index
Note: 01-Jul-2008 = 100.
Index
Agriculture (S&P GSCI Agricultural Spot Index)Industrial Metals (S&P GSCI Industrial Metals Spot Index)Crude OilNatural Gas
5.1.28 Commodities
5.1.27 Market Volatility
F inanc ia l Deve lopments

2 0 1 4 F S O C / / Annual Report52
5.1.4 Real Estate Markets
Housing Market Overview
Housing prices in 2013 continued to recover,
though the pace of recovery slowed in the
second half of the year as mortgage rates
rose following increased uncertainty and
anticipation around the timing of Federal
Reserve tapering. Home prices in January
2014 were up 7.4 percent over one year earlier
according to the FHFA’s repeat sales home
price index (Chart 5.1.29), which reflects sales
of single-family detached homes purchased
with conforming loans. From March through
October 2013, seasonally adjusted monthly
existing home sales remained the highest
since 2007 with the exception of November
2009. New single-family home sales continued
to slowly recover, rising 4.5 percent over one
year earlier in December 2013, still well below
historical norms, as both sales and supply of
new homes remained muted. Housing starts
followed a similar pattern, rising 4.2 percent
over one year earlier in December 2013 to a
seasonally adjusted annual rate of 1.0 million
units, still well below the historical average rate
of 1.5 million units. Macroeconomic factors
such as unemployment contribute to the low
demand for new housing units, as do low rates
of household formation that have averaged
around half historical levels since 2006.
Refinancing, which made up over three-fifths of
the dollar volume of mortgage originations in
2013, fell considerably during the course of the
year (Chart 5.1.30). While mortgage purchase
originations recovered slowly, climbing to a
two-year high of $30.9 billion in July, refinance
originations fell in each month of 2013 from a
high of $67.4 billion to $12.2 billion by year end.
Overall, total originations fell in each month
except May and purchases have outpaced
refinancing originations since October of 2013.
The performance of outstanding loans
improved significantly since 2012. Delinquent
loans declined from 3.1 million in December
2012 to 2.7 million in December 2013, partly
due to reduced rates of negative equity and
100
120
140
160
180
200
220
100
120
140
160
180
200
220
2000 2002 2004 2006 2008 2010 2012 2014
Source: CoreLogic, FHFA, Haver Analytics
As Of: Feb-2014Index
Note: Gray bars signify NBER recessions.
Index
CoreLogic (including
distressed sales)CoreLogic(excluding
distressed sales)
FHFA
5.1.29 National Repeat Sales Home Price Indices
0
1
2
3
4
5
6
7
8
0
20
40
60
80
100
2006 2007 2008 2009 2010 2011 2012 2013
30Y Mortgage Rates(right axis)
Refinance(left axis)
Purchase(left axis)
Billions of US$ PercentAs Of: Dec-2013
Source: CoreLogic, FHLMC
5.1.30 Monthly Originations by Purchase and Refinance

53Financ ia l Deve lopments
improved macroeconomic conditions. As a
result of price increases, completed foreclosures
on underwater loans, loan modifications, and
the amortization of older loans, the fraction
of mortgages with negative equity declined
markedly from 21.6 percent at the end of 2012
to 13.3 percent in the fourth quarter 2013,
with the total value of negative equity falling
from $628 billion to $398 billion during the
same period (Chart 5.1.31). The backlog of
mortgages in foreclosure has also showed signs
of improvement (Chart 5.1.32). The share of
loans with payments more than 90 days past due
dropped from 3 percent to 2.6 percent between
December 2012 and December 2013 and the
share of all loans that were delinquent fell from
7.5 to 6.7 percent. Over the same period, the
share of mortgages in foreclosure dropped from
3.7 percent to 2.9 percent.
Current credit standards remain more
conservative than prior to the financial crisis.
The average FICO score of individuals receiving
purchase mortgages from Fannie Mae and
Freddie Mac reached a two-decade high of 766
in June 2013. Borrowers with credit scores of
760 and above make up an increasing volume of
all purchase mortgages. The portion of first lien
purchase mortgages that went to borrowers with
credit scores in this range rose from 47 percent
in December 2012 to 53 percent one year later
(Chart 5.1.33). However, there is evidence
of credit loosening in refinancing, with the
portion of refinance mortgage volume going to
borrowers with credit scores of 760 and above
falling from 57 percent to 45 percent over the
same period. With refinances making up the
bulk of mortgages for 2013, the percentage of
banks reporting looser standards in the SLOOS
exceeded the percentage reporting tighter
standards by 4.6 to 8.7 percent throughout the
year. While FHFA and the GSEs have made
progress in developing a new representations
and warranties framework, lenders reportedly
continue to employ tighter standards above
minimum GSE credit standards, reflecting the
perception of increased put-back risk associated
with lower-credit-quality and higher loan-to-
value ratio loans.
10
12
14
16
18
20
22
24
26
28
300
400
500
600
700
800
900
Mar:10 Sep:10 Mar:11 Sep:11 Mar:12 Sep:12 Mar:13 Sep:13
Value of Negative Equity in Residential Mortgages
(left axis)
Percent of Residential
Mortgages with Negative Equity
(right axis)
Billions of US$ Percent
Source: CoreLogic
As Of: 2013 Q4
5.1.31 Mortgages with Negative Equity
0
1
2
3
4
5
6
0
1
2
3
4
5
6
2000 2002 2004 2006 2008 2010 2012
Source: Mortgage Bankers Association, Haver Analytics
As Of: 2013 Q4Percent
Note: Percent of all mortgages.
Percent
Mortgage Foreclosure Inventory
Mortgage PaymentsPast-Due 90+ Days
5.1.32 Mortgage Delinquency and Foreclosure
0
10
20
30
40
50
60
70
80
90
100
0
10
20
30
40
50
60
70
80
90
100
2002 2004 2006 2008 2010 2012
Percent of Origination Volume Percent of Origination Volume
Source: CoreLogic
As Of: 2013
Note: Includes first lien purchases only.
<600
600-660
660-700
700-720
720-760
>760
5.1.33 Purchase Origination Volume by Credit Score

2 0 1 4 F S O C / / Annual Report54
Over the next few years, the bulk of home
equity line of credit (HELOC) originations,
which were made in increasing volumes leading
up to the crisis, are approaching the end of
their draw periods, meaning that homeowners
face the beginning of repayment of the
principal borrowed and in some cases balloon
payments of their entire principal balances.
In 2014, roughly $23 billion in outstanding
HELOC balances are expected to reach the
end of their interest-only periods. Another
estimated $41 billion will reach the end of their
draw period in 2015, followed by $49 billion in
2016 and $54 billion in 2017.
Investor activity in home purchases increased in
2013, particularly in regions that experienced
significant home price increases over this same
period. Investors purchased homes for rental.
They also participated in this market via equity
REITs. In addition, the first rental property
securitization bond was issued in late 2013 with
the potential for more issuance in the future.
U.S. commercial banks and thrifts continued to
transfer MSRs throughout 2013 (Chart 5.1.34).
By the end of the year, banks held $5.4 trillion
in unpaid balance, down $758 billion from
2012 as many banks sought to reduce holdings
subject to enhanced capital requirements that
begin to go into effect in 2014. In contrast,
nonbank holdings increased by $806 billion to
$1.7 trillion.
At their peak in 2006, prior to the financial
crisis, private portfolios and securitization
comprised nearly 70 percent of mortgage
originations. With the collapse of the MBS
market and the onset of the financial crisis,
private capital dried up in mortgage markets,
leaving government and agency guarantees to
back over 90 percent of originations in 2009
(Chart 5.1.35). With the housing recovery, a
limited amount of private capital has taken
on credit risk, primarily in jumbo loans for
very high-credit-quality borrowers. However,
private capital still has less than a third of
the market share it had at its pre-crisis peak.
Today, the share of all originations through
0
1
2
3
4
5
6
7
0
1
2
3
4
5
6
7
2012 Q4 2013 Q1 2013 Q2 2013 Q3 2013 Q4
BanksNonbanks
Trillions of US$ Trillions of US$
Source: Inside Mortgage Finance
As Of: 2013 Q4
5.1.34 Servicing Growth: Banks vs. Nonbanks
0
10
20
30
40
50
60
70
80
90
100
0
10
20
30
40
50
60
70
80
90
100
2002 2004 2006 2008 2010 2012
Percent Percent
Source: Inside Mortgage Finance
As Of: 2013 Q3
VA FHA
GSE
Private Portfolio and Securitized
5.1.35 Mortgage Originations by Program

55Financ ia l Deve lopments
the Federal Housing Administration (FHA),
the U.S. Department of Veterans Affairs, and
GSEs stands at 81 percent. There is evidence
that risk-bearing private capital is reentering
the market primarily via portfolio lending
and whole loans rather than securitization, in
part due to barriers to investor reviews of the
underwriting of securitized loans that persist.
Although private securitization volume doubled
in 2013, it still remains less than one percent of
all originations.
The GSEs completed nearly 4.1 million
refinancings in 2013 through December, with
the Home Affordable Refinance Program
representing 22 percent of this amount. In
addition, the FHA Streamline Refinance
program completed nearly 512 thousand
refinancings. With the uptick in interest rates
and depletion of refinance-eligible homes, the
GSEs’ refinance volume decreased in the fourth
quarter of 2013 by 63 percent over the fourth
quarter of 2012.
Government Sponsored Entities
Through the third quarter of 2013, the
GSEs accounted for approximately 76
percent of MBS issuances, with practically
all remaining issuances coming from Ginnie
Mae (Chart 5.1.36). As market conditions
recovered, the financial health of Fannie Mae
and Freddie Mac also improved. Fannie Mae
and Freddie Mac posted net incomes of $84.0
billion and $48.7 billion, respectively in 2013
(Chart 5.1.37). While the health of these
enterprises has improved, their recent profits
are not expected to be indicators of steady
future profits, particularly because most of the
2013 income came from one-time sources such
as the release of loan loss reserves.
In 2013, under FHFA guidance, the GSEs
completed three transactions which were
aimed at minimizing taxpayer risk by sharing
credit risk with private investors who pre-fund
collateral at the time of transactions. These
transactions accounted for the bulk of the
GSEs’ credit risk-sharing transactions associated
0.0
0.5
1.0
1.5
2.0
2.5
3.0
0.0
0.5
1.0
1.5
2.0
2.5
3.0
2000 2002 2004 2006 2008 2010 2012
NonagencyAgency
Trillions of US$ Trillions of US$
Source: Thomson Reuters, Dealogic, Fannie Mae, Freddie Mac, SIFMA
As Of: 2013
5.1.36 Issuance of RMBS
-40
-20
0
20
40
60
-40
-20
0
20
40
60
2006 2007 2008 2009 2010 2011 2012 2013
Freddie MacFannie Mae
Billions of US$ Billions of US$
Source: SNL Financial
As Of: 2013 Q4
5.1.37 GSE Net Income

2 0 1 4 F S O C / / Annual Report56
with $75 billion in mortgages that were
completed in 2013. The remaining transactions
were based on insurance structures.
Commercial Real Estate
Commercial real estate (CRE) markets
continued to improve in 2013. Price indices rose
in CRE markets (Chart 5.1.38), though price
appreciation for retail properties continued
to lag the rest of the sector. Delinquency rates
on CRE loans at banks continued to improve,
falling from 4.12 percent in the fourth quarter
of 2012 to 2.46 percent in the fourth quarter of
2013.
Commercial REITs issued almost $27 billion in
unsecured notes in 2013, higher than any year
in the preceding decade. Private commercial
mortgage-backed securities (CMBS) issuance
rose in 2013 to $81.6 billion, a level in line
with years prior to 2005 (Chart 5.1.39). Market
participants expect issuance to slow due to
the rising rate environment. Meanwhile, the
reduction in CRE delinquencies at banks is
reflected in CMBS as well: the fraction of CMBS
loan balances in Fitch-rated deals that were 60
or more days delinquent or in foreclosure fell
from 7.99 percent in December 2012 to 5.98
percent in December 2013. This improvement is
also reflected in slightly lower CMBS senior debt
spreads (Chart 5.1.40). However, refinancing
risks for these CMBS could be significant if
cash flows from the properties do not increase
enough to support higher rates in the future.
20
30
40
50
60
70
80
90
100
110
20
30
40
50
60
70
80
90
100
110
Mar:08 Mar:09 Mar:10 Mar:11 Mar:12 Mar:13
Index Index
Source: Real Capital Analytics, Moody s Investors Service
Moody s/RCA CPPI – National
Note: Mar-2008 = 100.
Moody s/RCA CPPI – Major Markets
As Of: Jan-2014
0
50
100
150
200
250
0
50
100
150
200
250
2001 2003 2005 2007 2009 2011 2013
AgencyNon-Agency
Billions of US$ Billions of US$
Source: Commercial Mortgage Alert
As Of: 2013
0
50
100
150
200
250
0
50
100
150
200
250
Apr:11 Oct:11 Apr:12 Oct:12 Apr:13 Oct:13
Non-Agency AAA CMBS Spread
Basis Points Basis Points
Source: Barclays
As Of: 27-Mar-2014
Note: Spread of Non-Agency 3.0 AAA 5-Year CMBS to Swaps.
5.1.39 CMBS New Issuance
5.1.40 CMBS Senior Debt Spreads
5.1.38 Commercial Property Price Indices

57Financ ia l Deve lopments
5.2 Wholesale Funding Markets
Short-term wholesale funding markets provide
financial intermediaries with funds, on a
secured or unsecured basis, that supplement
other funding sources such as retail deposits
and long-term debt. Major short-term wholesale
funding types include federal funds, CP, repos,
certificates of deposit (CDs) and large time
deposits. Financial institutions have varying
reliance on short-term wholesale funding.
U.S. branches of foreign banks and broker-
dealers tend to rely more on short-term
wholesale funding than domestic banks, which
have access to U.S. retail deposits. Sources of
short-term wholesale funding include cash
on balance sheets of nonfinancial companies,
MMFs, reinvestments of cash collateral obtained
from securities lending activities, and cash held
by mutual funds, pension funds, and sovereign
wealth funds. Domestic banking firms’ reliance
on short-term wholesale funding measured as
a share of retail deposits has decreased since
the financial crisis. The decreased reliance on
wholesale funding primarily reflects growth in
retail deposits (Chart 5.2.1).
5.2.1 Commercial Paper, Asset-Backed
Commercial Paper, and Large Time Deposits
CP outstanding of $952 billion in December
2013 was essentially unchanged from a year ago
(Chart 5.2.2). Asset-backed commercial paper
(ABCP) outstanding continued to decline over
2013, extending a trend since the financial
crisis. As of December 2013, ABCP accounted
for 28 percent of total CP outstanding, while
financial CP and non-financial corporate CP
accounted for 52 and 20 percent, respectively.
Overall, domestic CP outstanding (excluding
ABCP and including both financial and non-
financial CP), was generally stable over 2013
(Chart 5.2.3). Domestic financial CP issuance
declined to all-time low levels, which market
participants largely attributed to a reduction in
demand for short-term funding from domestic
banks, as noted above. In contrast, domestic
non-financial CP outstanding modestly
40
60
80
100
120
140
160
4
5
6
7
8
9
10
2003 2005 2007 2009 2011 2013
Source: FDIC, Federal Reserve, Haver Analytics
As Of: 2013 Q4Trillions of US$ Percent
Short-Term Wholesale Funding (left axis)
Wholesale as a Percent of Retail
Deposits (right axis)
Retail Deposits (left axis)
0.0
0.5
1.0
1.5
2.0
2.5
0.0
0.5
1.0
1.5
2.0
2.5
2005 2006 2007 2008 2009 2010 2011 2012 2013 2014
Source: Federal Reserve, Haver Analytics
As Of: Mar-2014Trillions of US$ Trillions of US$
Financial IssuersCorporate Issuers
ABCP
Other
0
100
200
300
400
500
600
700
800
900
0
100
200
300
400
500
600
700
800
900
Jan:12 Jun:12 Nov:12 Apr:13 Sep:13 Feb:14
ForeignDomestic
Billions of US$ Billions of US$
Source: Federal Reserve
As Of: 26-Mar-2014
Note: Does not include ABCP. Domestic includes CP issued in the U.S. by entities with foreign parents.
5.2.2 Commercial Paper Outstanding
5.2.3 Commercial Paper Outstanding
5.2.1 Composition of Bank Short-Term Funding

2 0 1 4 F S O C / / Annual Report58
increased, consistent with increased overall
corporate funding needs.
Foreign CP outstanding increased by
approximately 30 percent year-over-year in
2013, driven by increased issuance by euro area
financial institutions. This has generally been
attributed to improving investor sentiment
with regard to Europe and low U.S. money
market rates prompting some “search for
yield” behavior. Consistent with these trends,
U.S. prime MMFs increased the amount and
extended the average tenor of their unsecured
euro area exposures (Chart 5.2.4). However,
prime MMFs continue to have small direct
exposure to peripheral euro area institutions.
U.S. commercial bank large time deposits,
which include wholesale CDs, modestly
increased in 2013 to reach $1.6 trillion. Similar
to dynamics in the CP market, growth was
led by deposits at foreign institutions, which
increased 14.2 percent. Large time deposits
at domestically chartered banks declined 4.1
percent.
Consistent with relatively benign conditions in
offshore USD funding markets, the premium
for borrowing USD via FX swap markets
remained small (Chart 5.2.5). Moreover, the
premium for borrowing USD against euros
in the three-month tenor was negative in late
2013. This indicates the existence of a premium
for borrowing euros, which happened for the
first time since early 2008, reflecting eased
conditions in dollar funding markets and
tighter conditions in euro money markets.
5.2.2 Repo Markets
A repo is the sale of securities for cash with
an agreement to buy back the securities at a
specified date and price. This arrangement
resembles a secured loan with securities as
collateral. Securities broker-dealers play a
significant role in repo markets. There are
three repo market segments: the tri-party
market, in which broker-dealers primarily
obtain funding from cash investors and transact
utilizing the collateral management and
0
50
100
150
200
250
300
350
400
450
0
50
100
150
200
250
300
350
400
450
Nov:11 Apr:12 Sep:12 Feb:13 Jul:13 Dec:13
Repo with European Counterparties
ABCP issued by European Entities
Billions of US$ Billions of US$As Of: Mar-2014
Source: SEC Form N-MFP filings, OFR Calculations
Unsecured CD and CP issued by European Entities
Note: Assets valued at amortized cost.
-50
0
50
100
150
200
-50
0
50
100
150
200
2010 2011 2012 2013 2014
Source: Bloomberg, L.P.
As Of: 31-Mar-2014Basis Points
Note: Premium for borrowing U.S. dollars is the negative of the 3 month Euro-U.S. Dollar FX Swap.
Basis Points
5.2.5 Premium for Borrowing U.S. Dollars for 3 Months
5.2.4 U.S. MMF Holdings of European Entities’ CP, CD, and Repos

59Financ ia l Deve lopments
settlement services of the two tri-party repo
clearing banks (JPMorgan Chase and Bank of
New York Mellon); GCF repo, which is centrally
cleared by FICC over the tri-party platform;
and bilateral repo, in which transactions are
executed without the services of the two tri-
party clearing banks.
Repos outstanding decreased in 2013, as
measured both in the tri-party repo statistics
and in the Federal Reserve Bank of New York
(FRBNY) primary dealer survey (Chart 5.2.6).
The decrease was particularly pronounced for
agency MBS and, to a lesser extent, Treasury
securities. Many institutions reduced their
reliance on wholesale funding more generally,
both repos and other forms of wholesale
funding, in response to an influx of retail
deposits. Market observers also have cited
other factors in reference to the decline
in repo activity, such as the purchases of
Treasury securities and agency MBS by the
Federal Reserve, as part of its large-scale asset
purchases, as well as deleveraging by financial
institutions in anticipation of enhanced capital
regulations, notably the supplementary leverage
ratio. The relative size of the primary dealer
term repo market compared to the overnight
repo market remained similar in 2013 versus
the prior year (Chart 5.2.7).
The majority of tri-party repo financing
remains collateralized by assets that are
eligible for use in Federal Reserve open market
operations, such as Treasury securities, agency
debentures, and agency MBS. As of December
2013, these types of collateral accounted
for 75 percent of all tri-party repo collateral
(Chart 5.2.8). The remaining 25 percent
of collateral used in tri-party repos includes
corporate bonds, equities, agency and private
label collateralized mortgage obligations, ABS,
CP, other money market instruments, whole
loans, and municipal bonds. Haircuts in the
tri-party market have been stable in the last few
years across all collateral classes, suggesting an
unchanged stance towards collateral quality
and potential price volatility.
0
1
2
3
4
5
0
1
2
3
4
5
2002 2004 2006 2008 2010 2012 2014
Trillions of US$ Trillions of US$
Source: FRBNY
As Of: Mar-2014
Note: Limited data were provided by clearing banks prior to April 2008. These figures are estimates based on the data provided. Gray bar signifies NBER recession.
FR 2004 Primary Dealer Repo
Tri-Party Repo Market
5.2.6 Value of the Repo Market
0
1
2
3
4
5
0
1
2
3
4
5
1998 2000 2002 2004 2006 2008 2010 2012 2014
Overnight/Continuing Repo AgreementsTerm Repo Agreements
Trillions of US$ Trillions of US$As Of: 26-Mar-2014
Source: FRBNY
0.0
0.5
1.0
1.5
2.0
2.5
3.0
0.0
0.5
1.0
1.5
2.0
2.5
3.0
Jan:13 Mar:13 May:13 Jul:13 Sep:13 Nov:13 Jan:14 Mar:14
Trillions of US$ Trillions of US$
Source: FRBNY
As Of: Mar-2014
Note: Other = CDO, International, Money Market, Municipal Debt, and Whole Loans.
CMO Private LabelAgency CMOsAgency Debentures & Strips
US Treasuries StripsEquitiesCorporatesABS
Other
Agency MBSUS Treasuries excluding Strips
5.2.8 Collateral in Tri-Party Repo
5.2.7 Primary Dealer Repo Agreements

2 0 1 4 F S O C / / Annual Report60
While risks to financial stability remain in the
tri-party repo market, over the past two years,
the industry has made significant progress in
implementing the vision of the Tri-Party Repo
Infrastructure Reform Task Force
(see Section 3.1.1).
5.2.3 Securities Lending
Securities lending is a transaction involving
the temporary transfer of a security by one
party (the lender) to another (the borrower),
in exchange for collateral in the form of either
cash or non- cash instruments. Institutions
may want to borrow securities to facilitate
short selling, for derivative hedges, to deliver a
security to another party to settle a transaction,
or to obtain a particular security to post as
collateral in another transaction. The main
lenders of securities are institutional investors,
such as pension plans, mutual funds, and
insurance companies (Chart 5.2.9). The main
borrowers are hedge funds, broker-dealers,
derivatives traders, and market makers. Most
domestic securities lending is done against cash
collateral. Typically, the lender of a security
pays an interest rate to the borrower for the
cash collateral. Lenders seek to earn a higher
return by investing the cash collateral in a MMF
or other short-term investment fund which,
in turn, may invest in CP, repos, and other
short-term wholesale funding instruments as
discussed above.
The global value of securities lending
transactions remained fairly flat in 2013, at an
average value of around $1.8 trillion, effectively
unchanged from 2012, according to available
estimates (Chart 5.2.10). The composition
of assets being lent, both globally and in the
United States, remained consistent with 2012,
with government bonds and equities continuing
to comprise the vast majority of securities
lent in 2013 (Chart 5.2.11). Overall, market
commentary suggests little change in lending
terms throughout 2013, which is further
supported by results of Senior Credit Officer
Surveys on Dealer Financing Terms.
0
10
20
30
40
50
60
70
80
90
100
0
10
20
30
40
50
60
70
80
90
100
2008 2009 2010 2011 2012 2013 2014
Percent of Lending Percent of Lending
Source: Markit Group Limited
As Of: 31-Jan-2014
Mutual Funds
Retirement and Pension
Corporate
InsuranceGovernment Bodies
Endowments
Foundations
Note: Data is based on a survey of agent based lenders.
0.0
0.5
1.0
1.5
2.0
2.5
3.0
3.5
4.0
4.5
0.0
0.5
1.0
1.5
2.0
2.5
3.0
3.5
4.0
4.5
2008 2009 2010 2011 2012 2013 2014
Trillions of US$ Trillions of US$
Source: Markit Group Limited
Global Market (including U.S.)
U.S. Market
As Of: 30-Jan-2014
Note: Data is based on a survey of agent based lenders.
0
10
20
30
40
50
60
70
0
10
20
30
40
50
60
70
2008 2009 2010 2011 2012 2013 2014
Percent of Lending Percent of Lending
Source: Markit Group Limited
Government Bonds
As Of: 30-Jan-2014
Equities
Corporate BondsETFsADRs
Note: Data is based on a survey of agent based lenders.
5.2.10 Value of Securities on Loan
5.2.11 Composition of Securities Lending by Security Type
5.2.9 Share of Securities Lending by Lender Type

61Financ ia l Deve lopments
Both securities lending on a cash-collateral
basis and on a non-cash collateral basis pose
some risks. In securities lending on a non-
cash collateral basis, a party usually swaps, or
temporarily exchanges their lower quality assets,
by posting them as collateral for higher quality
assets, such as Treasury securities. This process
is typically termed “collateral transformation.”
Risks of collateral transformation are twofold:
the value of the lower quality collateral could
decline beyond the initial margin such that
additional collateral must be posted to maintain
adequate overcollateralization, which can force
deleveraging if the borrower does not have
the additional collateral needed; and financial
institutions providing collateral swaps might
introduce additional counterparty and liquidity
risk exposure.
As is the case of non-cash collateral, loans
of securities against cash collateral also
pose risks. Before the crisis, cash collateral
was often reinvested in assets with longer
weighted-average maturities, causing significant
maturity and credit mismatches between their
invested assets and their liabilities (cash) that
became problematic when collateral needed
to be returned on a same-day basis. However,
despite recent data showing an increased
share of lending on a cash collateral basis, the
weighted-average maturity of cash reinvestment
remains well below levels seen in the pre-crisis
timeframe (Chart 5.2.12), which suggests that
the investment strategy of these cash collateral
reinvestment pools remains conservative, at
least with respect to duration risk.
0
50
100
150
200
250
0.0
0.3
0.6
0.9
1.2
1.5
1.8
2000 2002 2004 2006 2008 2010 2012
Trillions of US$ Days
Source: The Risk Management Association
Mean WAM (right axis)
Median WAM (right axis)
As Of: 2013 Q4
Note: WAM = Weighted Average Maturity. Data is based on a survey of agent based lenders.
Total Cash Reinvestment (left axis)
5.2.12 Securities Lending Cash Reinvestment

2 0 1 4 F S O C / / Annual Report62
5.3 Bank Holding Companies and Depository Institutions
5.3.1 Bank Holding Companies and Dodd-
Frank Act Stress Tests
Performance
BHCs are companies with at least one
commercial bank subsidiary. Subsidiaries
of BHCs may also include nonbanks such as
broker-dealers, investment companies, or
insurance companies. As of the fourth quarter
of 2013, there were 1,054 BHCs in the United
States (excluding Puerto Rico) with greater
than $500 million in assets, whose aggregate
assets totaled $18.0 trillion.
The domestic banking sector in 2013 continued
to face a challenging interest rate environment,
enhanced regulatory requirements, and a
sluggish, but slowly recovering, macroeconomic
environment. Beginning in May 2013 and
continuing for the remainder of the year,
shifting expectations about the timing of the
Federal Reserve’s reduction in asset purchases
resulted in higher Treasury yields that weighed
on capital markets and mortgage banking
revenues. Despite headwinds, earnings grew
in the sector in 2013, mostly as a result of
expense control measures and lower loan-
loss provisions as credit quality continued to
improve. Aggregate pretax income for all BHCs
increased 25 percent in 2013 to $199.1 billion
(Chart 5.3.1). Nevertheless, the return on assets
across BHCs remained lower than the levels that
prevailed in the 10 years before the crisis (Chart
5.3.2).
BHC net interest margins (NIM) continued
to decline through most of 2013, as they have
for more than a decade, although the rate of
compression decelerated (Chart 5.3.3). NIM
compression was driven by the run off of
higher-yielding securities amid relatively low
reinvestment yields and increased competition
across some loan categories. In addition,
deposit costs remained near the zero-bound,
limiting the extent to which BHCs could benefit
-1200
-900
-600
-300
0
300
600
900
1200
-1200
-900
-600
-300
0
300
600
900
1200
2006 2007 2008 2009 2010 2011 2012 2013
Provisions Noninterest ExpenseRealized Gains/Losses on Investments
Billions of US$ Billions of US$
Source: FR Y-9C
As Of: 2013
Noninterest IncomeNet Interest Income
Total Pre-Tax Income
-1.5
-1.0
-0.5
0.0
0.5
1.0
1.5
-1.5
-1.0
-0.5
0.0
0.5
1.0
1.5
1996 1998 2000 2002 2004 2006 2008 2010 2012
1996-2005 Average
Percent PercentAs Of: 2013 Q4
Source: FR Y-9C
2.0
2.2
2.4
2.6
2.8
3.0
3.2
3.4
3.6
3.8
4.0
2.0
2.2
2.4
2.6
2.8
3.0
3.2
3.4
3.6
3.8
4.0
2000 2002 2004 2006 2008 2010 2012
Percent Percent
Source: FRBNY Quarterly Trends Report
As Of: 2013 Q4
Note: For domestic BHCs and commercial banks.
5.3.2 Return on Average Assets for BHCs > $10B
5.3.3 Annualized Net Interest Margin
5.3.1 Aggregate BHC Pre-Tax Income

63Financ ia l Deve lopments
from lower funding costs. Moreover, some large
BHCs took steps to increase holdings of lower-
yielding, high quality liquid assets to improve
their liquidity profiles, further pressuring
NIMs.
The rise in Treasury yields and steepening of
the yield curve that began in May 2013 have
not yet translated into wider NIMs. Further,
short-term rates remain low, so banks have not
benefited from yield increases on their floating-
rate assets. BHCs mitigated the effects of the
compressed rate environment through various
cost control measures, including restructurings
and compensation reductions. For example,
some banks began reducing expenses in
their mortgage banking businesses in the
latter half of 2013, as higher MBS rates and
lower origination volumes adversely affected
mortgage-related revenues
(Charts 5.3.4, 5.3.5).
Despite continued margin pressure, the largest
banks did not appear to assume outsized credit
or duration risk, although competition for
loans has increased in the more profitable small
business and middle market segments. However,
some smaller banks continue to lengthen the
maturity of their asset portfolios, as evidenced
in the estimates of the asset/liability maturity
and repricing interval gap
(Charts 5.3.6, 5.3.7).
Large BHCs reduced some legal uncertainly in
2013 as a result of settling certain outstanding
legal matters, primarily related to pre-crisis
mortgage lending (see Section 6.1.5). In
addition to reduced legal uncertainty, BHCs
benefited from greater clarity on impending
regulations (see Section 6). Nevertheless, BHCs
still face ongoing investigations into certain
matters, such as manipulation of LIBOR and
FX markets. These incidents highlight the need
for BHCs to have effective risk management
policies and practices in place to address
potential legal risk.
0
100
200
300
400
500
600
0
100
200
300
400
500
600
Mar:13 Jun:13 Sep:13 Dec:13
PurchasesRefinancings
Billions of US$ Billions of US$
Source: Mortgage Bankers Association
As Of: 2013 Q4
0.0
0.4
0.8
1.2
1.6
2.0
1.0
1.5
2.0
2.5
3.0
3.5
4.0
4.5
5.0
5.5
2010 2011 2012 2013 2014
Source: Bloomberg, L.P.
As Of: 31-Mar-2014Percent Percent
30-year Agency MBS Rate (left axis)
30-year Mortgage Rate (left axis)
Spread (right axis)
Density
Source: Federal Reserve
As Of: 2013 Q4
0.00
0.05
0.10
0.15
0.20
0.25
0.00
0.05
0.10
0.15
0.20
0.25
-5 0 5 10 15
2010: Q42012: Q4
2003: Q3
YearsNote: Banks with assets over $50 billion. Approximations based on midpoint of Call Report ranges. Liquid deposits assumed to have 1-year maturity.
Density
2013: Q4
5.3.5 U.S. Mortgage Spread
5.3.6 Maturity Gap at Large Banks
5.3.4 Total Residential Mortgage Originations

2 0 1 4 F S O C / / Annual Report64
Market Indicators
BHC share prices rose in 2013. As of the end
of March, the KBW bank index had increased
29 percent year over year and implied volatility
had declined (Chart 5.3.8). The market value
of the six largest BHCs increased 31 percent
in aggregate and the market-capitalization
weighted-average price-to-book ratio for
this group was slightly above 1.0 at year end.
Valuations are at the highest level since early
2011, though they remain well below pre-crisis
levels (Chart 5.3.9). Five-year CDS spreads
of these six BHCs tightened approximately
20 to 50 percent in 2013, and finished the
year near pre-crisis levels, due primarily to
continued strengthening of bank balance
sheets (Chart 5.3.10). Advanced systemic risk
measures, which attempt to gauge systemic risk
at the six largest BHCs in real time, continued
to decline in 2013 and remain well below crisis
levels (Chart 5.3.11).
Capital
Aggregate capital ratios, as defined per the
Federal Reserve’s Capital Assessments and
Stress Testing reporting requirements (that is,
the Y-14A report) for BHCs increased modestly
in 2013 with the Tier 1 common capital ratio
increasing 25 basis points to 11.70 percent.
The domestic implementation of Basel 2.5 in
January 2013 led to a large increase in risk-
weighted assets (RWAs) in the first quarter of
2013 (Chart 5.3.12), negatively affecting Tier
1 common capital ratios, particularly at the
largest banks with significant market risk and
trading activities. Nevertheless, this decline was
offset by increases in retained earnings, driven
by positive operating results and by modest
capital raising.
Large BHCs, in aggregate, improved their Basel
III common equity Tier 1 capital in 2013 despite
the rise in interest rates during the second
half of the year. The rise in rates led to a large
decline in net unrealized gains on available-for-
sale (AFS) securities portfolios.
Density
Source: Federal Reserve
As Of: 2013 Q4
0.00
0.05
0.10
0.15
0.20
0.25
0.00
0.05
0.10
0.15
0.20
0.25
-5 0 5 10 15 20
2010: Q42012: Q4
2003: Q3
Density
2013: Q4
Note: Banks with assets under $50 billion. Approximations based on midpoint of Call Report ranges. Liquid deposits assumed to have 1-year maturity.
Years
40
45
50
55
60
65
70
75
10
20
30
40
50
Jan:12 Jul:12 Jan:13 Jul:13 Jan:14
Index Percent
Source: Bloomberg, L.P.
KBW Bank Index (left axis)
30-Day Implied Volatility of KBW Bank Index
(right axis)
As Of: 31-Mar-2014
Source: Bloomberg, L.P.
0
10
20
30
40
50
60
70
0
1
2
3
4
5
6
2000 2002 2004 2006 2008 2010 2012 2014
P/B Ratio P/E RatioAs Of: 31-Mar-2014
P/B Ratio (left axis)
Long-Term Average P/E (right axis)
Long-Term Average P/B
(left axis)
P/E Ratio (right axis)
Note: Market-cap weighted average of BAC, C, GS, JPM, MS, WFC.
5.3.8 KBW Bank Index and Implied Volatility
5.3.9 Average P/B and P/E Ratios of 6 Large Complex BHCs
5.3.7 Maturity Gap at Small Banks

65
During 2013, most BHCs increased their
capital distributions. Dividends paid by BHCs
that participated in the 2013 Comprehensive
Capital Analysis and Review (CCAR) increased
approximately 19 percent in the aggregate while
share repurchases increased approximately
76 percent from 2012. However, capital
distributions remain subdued relative to pre-
crisis levels.
Liquidity
Liquidity profiles continued to improve in
2013. As of the fourth quarter of 2013, the
consolidated liquidity ratio (liquid assets/total
assets) of all BHCs reached 22 percent, far
above historical levels (Chart 5.3.13).
The improvement in consolidated liquidity
ratios since the crisis is driven in part by
inclusion of two large broker-dealers that
converted to BHCs in 2009, as well as the
acquisitions of broker-dealers by BHCs in
2008. Broker-dealers typically have significant
holdings of liquid assets, which are often
encumbered and funded with shorter-term
wholesale funding (see Section 5.4).
In recent years, BHC liquidity profiles also
have benefitted from large inflows of deposits,
which have grown 29 percent since the first
quarter of 2009, compared to 4 percent growth
in total loans. The strong deposit growth,
amid subdued loan growth due to economic
uncertainty and an uneven recovery, has
resulted in BHCs increasing cash balances and
holdings of liquid securities.
The potential implementation of the LCR
in the United States as part of the Basel III
liquidity framework has also been a driver
for improved liquidity profiles. The LCR as
proposed by banking agencies, which would be
fully implemented by 2017 if adopted, would
require banking institutions to hold a sufficient
amount of highly liquid assets to meet their
liquidity needs during a short period of severe
liquidity stress.
F inanc ia l Deve lopments
Basis Points
0
100
200
300
400
0
100
200
300
400
Jul:09 Jul:10 Jul:11 Jul:12 Jul:13
Basis PointsAs Of: 31-Mar-2014
Source: Markit Group LimitedNote: Equal-weighted average of BAC, C, GS, JPM, MS, WFC.
0
1
2
3
4
5
6
0
1
2
3
4
5
6
Feb:05 Feb:07 Feb:09 Feb:11 Feb:13
Source: Bloomberg L.P., OFR calculations
As Of: Mar-2014
CoVaRSESDIP
Index Index
Note: Sample consists of BAC, C, JPM, WFC, GS, and MS. Measures are standardized by their historical volatility.
11.4411.70
9
10
11
12
13
14
9
10
11
12
13
14
Tier 1Common(4Q12)
RWA ChangeImpact
Net Issuanceof Stock
RetainedEarnings
OtherAdjustments
Tier 1Common(4Q13)
(.81)1.05 .11
(.09)
Percent of RWA Percent of RWA
Source: FR Y-9C
As Of: 2013 Q4
5.3.11 Systemic Risk Measures
5.3.12 Change in Tier 1 Common Ratios for Aggregate U.S. BHCs
5.3.10 CDS Spreads of 6 Large Complex BHCs

2 0 1 4 F S O C / / Annual Report66
Asset Quality
Asset quality also continued to improve in 2013.
Nonperforming loans declined across all major
categories (Chart 5.3.14), led by declines in
CRE. Residential loan delinquencies declined
sharply during the year but remain elevated, as
extended foreclosure timelines in many states
keep longer dated delinquencies from being
resolved (Chart 5.3.15).
Net charge-offs (i.e., reductions to loan loss
reserves) also declined significantly during the
year, with declines across all loan categories,
and in aggregate reached pre-crisis levels. As
of the fourth quarter of 2013, the industry-
wide net charge-off ratio was 63 basis points,
a 37 basis point decline from the prior year
(Chart 5.3.16). Provisions (i.e., additions to
loan loss reserves) as a share of loans also
decreased to historical lows in 2013. Loan loss
reserves have fallen since 2010, but remain
slightly above pre-crisis levels. The ratio of loan
loss reserves to annualized net charge offs has
increased sharply over the past three years
as net charge offs (ratio denominator) have
declined much more significantly than loan loss
reserves (ratio numerator) (Chart 5.3.17).
DFAST and CCAR
In March, the Federal Reserve released the
results of the 2014 annual Dodd-Frank Act
stress tests (DFAST) and the CCAR. A total
of 30 BHCs with $50 billion or more in total
consolidated assets participated in the annual
stress tests and CCAR, including 18 BHCs that
participated in 2013.
DFAST is a forward looking exercise conducted
by the Federal Reserve to evaluate whether
the 30 BHCs have sufficient capital to absorb
losses resulting from stressful economic and
financial market conditions, using hypothetical
supervisory scenarios designed by the Federal
Reserve. In the nine quarters of the planning
horizon covered in the stress test, the aggregate
projected tier 1 common ratio for the 30 BHCs
fell to a minimum level of 7.6 percent under the
severely adverse scenario from 11.5 percent in
Source: FR Y-9C, SNL Financial, FSOC calculations
10
15
20
25
10
15
20
25
1995 1998 2001 2004 2007 2010 2013
Percent PercentAs Of: 2013
Average (17.1%)
Liquidity Ratio*
+2 Standard Deviation
+1 Standard Deviation
-1 Standard Deviation
Note: Liquidity Ratio is the sum of Cash & Due From, FFS, Repos, U.S. Treasuries, U.S. Gov. Agencies and U.S. Gov. Sponsored Agencies divided by Total Assets. All top-tier BHCs included.
Source: SNL Financial
0.0
0.5
1.0
1.5
2.0
2.5
3.0
3.5
4.0
0.0
0.5
1.0
1.5
2.0
2.5
3.0
3.5
4.0
Mar:09 Mar:10 Mar:11 Mar:12 Mar:13
Percent Percent
Residential
As Of: 2013 Q4
Other Consumer
C&I
Credit Card
Total NPLs
CRE
Source: SNL Financial
0
2
4
6
8
10
0
2
4
6
8
10
Mar:09 Mar:10 Mar:11 Mar:12 Mar:13
Percent Percent
Residential
As Of: 2013 Q4
Other Consumer
C&I
Credit Card
Total NPLsCRE
5.3.14 Nonperforming Loans (30-89 Days)
5.3.15 Nonperforming Loans (90+ Days and Nonaccrual)
5.3.13 Consolidated BHC Liquidity Ratio

67
the third quarter of 2013 (Chart 5.3.18). The
summary results showed that under the severely
adverse scenario, projected minimum tier 1
common ratios for individual firms ranged
from 0.7 to 8.1 percentage points lower than
actual tier 1 common ratios in the third quarter
of 2013.
Through CCAR, the Federal Reserve evaluates
the capital planning processes and capital
adequacy of the 30 BHCs, including the firms’
proposed capital actions such as dividend
payments and share buybacks and issuances.
The Federal Reserve considers both qualitative
and quantitative factors in analyzing a firm’s
capital plan. In 2014, the Federal Reserve did
not object to the capital plans of 25 of the 30
BHCs and objected to the capital plans of five
BHCs (Chart 5.3.19). Four of the objections
were based on qualitative concerns about
BHCs’ capital planning processes. One of the
objections was on quantitative grounds, as
the firm’s tier 1 common ratio fell below the 5
percent threshold under the severely adverse
scenario. Following issuance of the initial CCAR
results, Bank of America Corporation disclosed
that it had incorrectly reported data used in
the calculation of regulatory capital ratios in
the stress tests. Based on these errors, the
Federal Reserve determined that the firm must
resubmit its capital plan and suspend planned
increases in capital distributions. Bank of
America must address the quantitative errors in
its capital plan as part of the resubmission and
undertake a review of its regulatory reporting to
ensure there are no further errors.
Insured Commercial Banks and Savings
Institutions
As of the fourth quarter of 2013, the banking
industry was composed of 6,812 FDIC-insured
commercial banks, savings institutions and
BHCs with total assets of $14.7 trillion. There
were 2,056 institutions with assets under $100
million and 666 institutions had assets over $1
billion. The number of institutions fell by 271
firms during 2013 due to failures and mergers.
Failures of insured depository institutions
F inanc ia l Deve lopments
0
1
2
3
4
5
6
0
1
2
3
4
5
6
2000 2002 2004 2006 2008 2010 2012
Percent of Total Loans Percent of Total LoansAs Of: 2013 Q4
Annualized Net Charge-offs
Total Non-Performing Loans
Source: FRBNY Quarterly Trends ReportNote: For domestic BHCs and commercial banks.
0
50
100
150
200
250
300
350
0
50
100
150
200
2000 2002 2004 2006 2008 2010 2012
As a Percent of Non-Performing Loans
(left axis)As a Percent of Annualized Net
Charge-Offs (right axis)
Percent PercentAs Of: 2013 Q4
Source: FRBNY Quarterly Trends Report, FSOC Calculations
Note: For domestic BHCs and commercial banks.
0
2
4
6
8
10
12
14
0
2
4
6
8
10
12
14Pre-stressPost-stress
Percent Percent
Source: Federal Reserve
As Of: 20-Mar-2014
Note: 2013 aggregate ratios are for 18 participants. 2014 aggregate ratios are for 30 participants. Stress ratios using severely adverse supervisory scenario.
DFAST 2013 DFAST 2014
5.3.17 Loan Loss Reserves
5.3.18 Initial and Stressed Tier 1 Common Capital Ratios
5.3.16 Credit Quality

2 0 1 4 F S O C / / Annual Report68
continue to decline since the financial crisis,
as 24 institutions with $6 billion in total assets
failed in 2013 (Chart 5.3.20). This is the
smallest number of failures since 2007.
As of December 31, 2013, 467 institutions, or 6.9
percent of all institutions, were on the FDIC’s
“problem bank” list, which includes institutions
with financial, operational, or managerial
weaknesses that require corrective action in
order to operate in a safe and sound manner.
That total is more than 45 percent lower than
the most recent peak of 888 problem banks at
the end of March 2011.
Pre-tax income for all U.S. commercial banks
and savings institutions totaled $224 billion in
2013, representing a 12 percent increase from
2012. Continued improvement in credit quality,
with an associated reduction in loan loss
provisions and other expenses, has been the
principal driver of the recovery in pretax net
income since 2009 (Chart 5.3.21). The positive
trend in asset quality indicators has been
accompanied by a reduction in overall portfolio
risk as evidenced by the post-crisis decrease in
RWAs relative to total assets (Chart 5.3.22).
5.3.2 U.S. Branches and Agencies of Foreign
Banks
Foreign banks also have a large presence in the
United States. Together, assets of U.S. branches
and agencies of foreign banks total $2.4 trillion.
By comparison, FDIC-insured institutions—
which do not include U.S. branches and
agencies of foreign banks—hold $14.7 trillion
in assets.
Cash and cash equivalents, particularly
reserve balances at the Federal Reserve, have
grown sharply since the crisis and continue to
represent the largest asset category for foreign
branches and agencies (Chart 5.3.23).
U.S. branches and agencies of foreign banks
also dedicate a significant portion of their
balance sheets to loans. Direct C&I loans
outstanding by these banks typically constitute
the largest portion of their loan portfolios.
Note: Firms in blue are first-time CCAR participants. *Bank of America and Goldman Sachs resubmitted their capital plans after receiving results of DFAST. Bank of America is resubmitting its capital plan after incorrectly reporting regulatory capital.Source: Federal Reserve
Non-Objection to Capital Plan Objection to Capital PlanAlly Financial JPMorgan Chase Citigroup
American Express KeyCorp HSBC North America
Bank of America* M&T Bank RBS Citizens Financial
Bank of New York Mellon Morgan Stanley Santander Holdings USA
BB&T Northern Trust Zions
BBVA Compass PNC Financial
BMO Financial Regions Financial
Capital One State Street
Comerica SunTrust
Discover Financial U.S. Bancorp
Fifth Third Bancorp UnionBanCal
Goldman Sachs* Wells Fargo
Huntington Bancshares
0
1
2
3
4
5
0
100
200
300
400
500
600
1980 1985 1990 1995 2000 2005 2010
Source: BEA, FDIC, Haver Analytics
As Of: 2013Number of Institutions
Note: No FDIC-insured institutions failed during 2005 and 2006.
Percent
Number of Institutions (left axis)
Assets of Failed Institutions as a Percent
of Nominal GDP (right axis)
-1000
-750
-500
-250
0
250
500
750
1000
-1000
-750
-500
-250
0
250
500
750
1000
2006 2007 2008 2009 2010 2011 2012 2013
Billions of US$ Billions of US$
Source: FDICNote: Includes all FDIC-insured commercial banks and thrifts.
As Of: 2013
Noninterest IncomeNet Interest Income
Noninterest ExpenseProvisions
Realized Gains/Losses on Investments
Total Pre-Tax Income
5.3.20 FDIC-Insured Failed Institutions
5.3.21 Commercial Bank and Thrift Pre-Tax Income
5.3.19 Federal Reserve’s Actions in CCAR 2014

69Financ ia l Deve lopments
The liability structures of U.S. branches and
agencies of foreign banks also vary considerably.
These U.S. branches lack access to the stable
source of funds represented by households’
checking, savings, and other transaction
accounts, as they are not permitted to offer
deposits insured by the FDIC. Instead,
wholesale funding, particularly CDs issued
primarily to institutional investors, provides
the majority of funding for these institutions
(Chart 5.3.24).
Pre-crisis, U.S. branches and agencies of foreign
banks, in aggregate, obtained wholesale dollar
deposits in the United States and used those
deposits to provide dollar funding to their
parent organizations and related affiliates,
which in turn used the funds for lending and
investment. Beginning in 2011, this trend
reversed. For some institutions, flows from
parent and related entities into U.S. branches
and agencies served to stabilize U.S. branches
experiencing deposit withdrawals stemming
from European sovereign and banking sector
concerns. More recently, dollar inflows to U.S.
branches and agencies of foreign banks, in
conjunction with an increase in U.S. deposit-
taking (such as negotiable CDs) on the part of
these institutions, have funded an accumulation
of reserve balances at the Federal Reserve.
5.3.3 Credit Unions
Credit unions are member-owned depository
institutions. As of the fourth quarter of 2013,
there were 6,554 federally insured credit unions
with aggregate assets of nearly $1.1 trillion.
More than three quarters of credit unions
(5,099) had assets under $100 million, while
426 credit unions had assets over $500 million.
Corporate credit unions—which provide critical
services to the broader credit union system—
continue to consolidate and deleverage as they
refocus their business models on providing
operational support to consumer credit unions,
raising capital, and adjusting to the new
regulatory environment. As of December 2013,
there were 15 corporate credit unions with
$18.5 billion in assets serving consumer credit
63
66
69
72
75
78
-1.5
-1.0
-0.5
0.0
0.5
1.0
1.5
2.0
2006 2008 2010 2012
Source: FDIC, Haver Analytics
As Of: 2013 Q4Percent
Note: All FDIC-insured institutions.
Percent
Risk-Weighted Assets as a Percent of Total Assets (right axis)
Return on Assets (left axis)
0.0
0.5
1.0
1.5
2.0
2.5
3.0
3.5
4.0
0.0
0.5
1.0
1.5
2.0
2.5
3.0
3.5
4.0
2004 2005 2006 2007 2008 2009 2010 2011 2012 2013
Source: Federal Reserve, Haver Analytics
As Of: 2013 Q4Trillions of US$
Note: Other assets includes government securities, asset-backed securities, and other trading assets.
Trillions of US$
Cash and Balances Due from Depository Institutions (excluding Reserve Balances)
Non C&I LoansC&I Loans
Net Due From Related Depository Institutions Reserve Balances
Other AssetsSecurities Purchased with Repurchase Agreements & Fed Funds Sold
0.0
0.5
1.0
1.5
2.0
2.5
3.0
3.5
4.0
0.0
0.5
1.0
1.5
2.0
2.5
3.0
3.5
4.0
2004 2005 2006 2007 2008 2009 2010 2011 2012 2013
Source: Federal Reserve, Haver Analytics
As Of: 2013 Q4Trillions of US$
Note: Other liabilities includes transaction accounts, non-transaction accounts, and other borrowed money.
Trillions of US$
Deposits & Credit BalancesNet Due to Related Depository Insitutions
Other LiabilitiesSecurities Sold with Repurchase Agreements & Fed Funds Purchased
5.3.23 U.S. Branches and Agencies of Foreign Banks: Assets
5.3.24 U.S. Branches and Agencies of Foreign Banks: Liabilities
5.3.22 Risk-Weighted Assets and Return on Assets

2 0 1 4 F S O C / / Annual Report70
unions—a decline from 27 corporate credit
unions with $96 billion in assets in
December 2007.
Annual net income at credit unions was about
$8.14 billion in 2013 (Chart 5.3.25), a decline
of 3.8 percent from 2012. The amount of
outstanding loans at credit unions increased
by 8.0 percent (year-over-year) during 2013.
This was an increase from 4.6 percent in 2012.
The credit union system experienced return
on average assets (ROA) of 78 basis points in
2013, a decrease from 85 basis points in 2012.
The decline in ROA reverses a four-year period
of rising ROA. In 2011 and 2012 ROA increased
even as net-interest margin compressed. The
ROA growth during this four-year period was
primarily driven by reductions in provisions for
loan losses. As provisions for loan losses have
returned to their pre-crisis levels, the industry-
wide trend of NIMs is more clearly reflected in
earnings. NIMs declined to 2.8 percent in 2013
from 2.9 percent in 2012 and are down 45 basis
points from 2010.
A key concern for the industry is ongoing
challenges related to the low interest rate
environment and the eventual transition
process to a higher rate environment,
potentially with a flatter yield curve. Although
interest rate sensitive deposits continue to
decline as a share of total liabilities, they
remain well above pre-crisis levels and the
share of money market accounts and individual
retirement accounts continues to increase
(Chart 5.3.26). Net long-term assets continue to
increase as a share of assets despite the decline
in the share of mortgages maturing in five years
or longer (Chart 5.3.27). It appears that, having
exhausted other sources of earnings growth,
some credit unions are reaching for yield by
lengthening their term of investments to boost
near-term earnings.
-60
-45
-30
-15
0
15
30
45
60
-60
-45
-30
-15
0
15
30
45
60
2006 2007 2008 2009 2010 2011 2012 2013
Noninterest IncomeNet Interest Income
Noninterest ExpenseProvisions
Realized Gains/Losses on Investments
Net Income
Billions of US$ Billions of US$
Source: NCUA
As Of: 2013 Q4
45
50
55
60
65
20
25
30
35
2005 2007 2009 2011 2013
Percent Percent
Source: NCUA
As Of: 2013 Q4
Money Market and IRA Deposit Share (left axis)
Interest Sensitive Deposit Share (right axis)
0
5
10
15
20
25
30
35
40
0
5
10
15
20
25
30
35
40
2005 2007 2009 2011 2013
Percent Percent
Source: NCUA
As Of: 2013 Q4
Mortgage Loans Maturing in 5+ Years
Long-Term InvestmentsBusiness LoansFixed Assets
Note: Percent of net long-term assets.
5.3.26 Credit Union Deposits
5.3.27 Credit Union Long-Term Assets
5.3.25 Federally Insured Credit Union Income

71Financ ia l Deve lopments
Investments in total have increased, rising from
19 percent of assets in the fourth quarter of
2006 to over 28 percent in the second quarter
of 2013. Total investments as a share of assets
declined somewhat during the second half of
2013 to just under 27 percent. But over the year,
investments with a maturity of less than three
years fell 13 percent—a decline of almost $25
billion—while investments with a maturity of
more than three years rose by 31 percent—a
rise of $30 billion (Chart 5.3.28). The slight
increase in long-term interest rates in 2013
has already had a substantial effect on the
market value of these investments. At the end
of 2012, credit unions had an unrealized gain
of $2.8 billion from held-to-maturity and AFS
securities. By the end of 2013, this gain had
reversed to an unrealized loss of $2.4 billion
(Chart 5.3.29). In addition to federally insured
credit unions, there are 133 non-federally
insured credit unions operating in nine states.
These credit unions, which are insured privately
and not backed by NCUA share insurance, had
$13.4 billion in combined assets at the end of
2013 and served 1.2 million members.
5.4 Nonbank Financial Companies
5.4.1 Securities Broker-Dealers
As of the fourth quarter of 2013, there were
4,378 domestic and foreign-owned securities
broker-dealers registered with the SEC. The
U.S. broker-dealer sector remains relatively
concentrated, with about 60 percent of industry
assets held by the top 10 broker-dealers at
the end of 2013, the largest of which are
affiliated with domestic BHCs or foreign banks.
Aggregate annual revenues of broker-dealers
increased by approximately 3.4 percent in 2013
to $71.2 billion, with increases in all categories,
except in trading and other revenues related to
the securities business (Chart 5.4.1).
Assets held within the U.S. broker-dealer
industry declined modestly in 2013 to $4.6
trillion (Chart 5.4.2). Broker-dealer leverage
similarly declined slightly in 2013, after
decreasing markedly during the crisis to a level
last seen in the early 1990s and remaining
0
5
10
15
20
25
30
0
5
10
15
20
25
30
Dec:06 Dec:12 Dec:13
Percent Percent
Source: NCUA
As Of: Dec-2013
1-3 Years3-5 Years5-10 Years
<1 Year
>10 Years
-3
-2
-1
0
1
2
3
4
-3
-2
-1
0
1
2
3
4
2010 2011 2012 2013
Billions of US$ Billions of US$
Source: NCUA
As Of: 2013 Q4
Note: AFS=Available for Sale and HTM=Held to Maturity.
5.3.29 Credit Union Unrealized Gains on AFS and HTM Securities
5.3.28 Credit Union Investments by Maturity
0
20
40
60
80
100
120
140
0
20
40
60
80
100
120
140
2005 2006 2007 2008 2009 2010 2011 2012 2013
Billions of US$ Billions of US$
Source: FINRA
As Of: 2013
OtherCommissionsSecurities TradingUnderwritingSale of Investment Company SharesFees-Supervision, Advisory, Admin
5.4.1 Broker-Dealer Revenues

2 0 1 4 F S O C / / Annual Report72
relatively stable since the crisis. Measured as
total assets as a multiple of equity, broker-
dealers operate at 19 times leverage in
aggregate (well below the peak of 36 times in
2007); measured as total assets as a multiple of
regulatory capital, broker-dealers operate at 13
times leverage in aggregate.
Dealer assets consist primarily of securities
borrowed in securities financing transactions
and trading inventory held for market-making
and proprietary trading purposes. After the
financial crisis, there were significant changes
in the composition of net positions held by
large dealers operating in the U.S. For example,
primary dealers (dealers that have a trading
relationship with the Federal Reserve) increased
holdings of U.S. government securities and
reduced holdings of corporate securities,
including ABS, agency MBS and agency debt,
reflecting changes in risk appetite and balance
sheet capacity (Chart 5.4.3).
In 2013, further changes occurred in the
positions held by primary dealers, which
pared net positions across rate-sensitive assets,
such as Treasuries, agency MBS, and agency
debt. Dealer holdings of Treasuries declined
significantly in the second half of the year.
These declines likely reflect a reduction
in dealer risk appetite and adjustments to
regulatory changes. It also appears that dealers
were affected by events in May and June
2013 that caused uncertainty on the general
direction of monetary policy, and concomitant
volatility in bond prices and interest rates. In
response to these developments, dealers sold
off bonds to cut their risk exposures and reduce
inventory (see Box C).
5.4.2 Insurance Companies
The U.S. insurance industry is composed of
over 3,700 operating insurance companies,
which are broadly defined by the insurance
products they sell: Life insurers provide
coverage for human life contingencies such
as unexpected death and retirement savings
products like annuities, while property and
0
5
10
15
20
25
30
35
40
45
0
1
2
3
4
5
6
7
2005 2006 2007 2008 2009 2010 2011 2012 2013
Trillions of US$ Leverage Ratio
Source: FINRA
As Of: 2013
Note: Leverage is the ratio of total assets to equity.
Total Assets (left axis)
Leverage (right axis)
-200
-100
0
100
200
300
400
Jul:01 Jul:03 Jul:05 Jul:07 Jul:09 Jul:11 Jul:13-200
-100
0
100
200
300
400Billions of US$ Billions of US$
Source: FRBNY
Primary Dealer Net Outright Corporate Securities
Primary Dealer Net Outright U.S. Government SecuritiesPrimary Dealer Net Outright Federal Agency Securities and Agency MBS
As Of: 26-Mar-2014
Note: Corporate securities includes corporate bonds, commercial
paper, non-agency residential MBS, and other CMBS.
5.4.3 Primary Dealer Securities
5.4.2 Broker-Dealer Assets and Leverage

73Financ ia l Deve lopments
casualty (P/C) insurers provide coverage on
homes, cars, and businesses. All figures in this
section are from statutory insurance filings,
which only include operating insurance
companies and underestimate the total size of
the U.S. insurance industry because subsidiaries
such as asset managers and foreign subsidiaries
are excluded. According to statutory data, the
U.S. life insurance industry has approximately
$6.0 trillion in assets, which is more than
three times those of P/C insurers who hold
$1.7 trillion. Approximately 80 percent
of life insurance assets are held in the 25
largest companies, compared to a 67 percent
concentration for the P/C industry.
Life insurance revenue from insurance and
annuity products decreased to $583 billion in
2013 from the record $645 billion set in 2012.
Expanded product distribution channels and a
more favorable interest rate environment led to
higher fixed annuity sales, but a number of one-
time transactions and increased reinsurance
cession overcame the improved fixed annuity
sales and led to the decrease in total revenues.
Despite rising significantly in 2013, interest
rates remained well below historical averages
and continued to weigh on life insurance
investment yields. Life insurers’ investment
portfolios turn over at a slow rate because
they mostly hold long duration assets until
maturity. Since market interest rates are still
below the yield earned on maturing assets, life
insurers’ average portfolio yields continued to
decline in 2013, albeit at a slower rate than in
2012. Nonetheless, the life sector’s net income
rose 6.8 percent to $41 billion, a record high
(Chart 5.4.4). Rising equity markets benefited
life insurers as customers paid higher fees on
higher equity account balances.
P/C revenue from insurance products increased
3.9 percent to $544 billion in 2013, a record
high. Rates charged by insurers to policyholders
increased moderately in most commercial
lines of business led by strong sales of workers’
compensation and demand for personal auto
insurance. Net income increased to a record
level of $70 billion, or an increase of 91.5
240
270
300
330
360
-60
-40
-20
0
20
40
60
2006 2007 2008 2009 2010 2011 2012 2013
Billions of US$ Billions of US$
Source: NAIC
Capital (right axis)
Net Income (left axis)
Note: Includes accident and health.
As Of: 2013
5.4.4 Life and Other Insurance: Capital and Net Income

2 0 1 4 F S O C / / Annual Report74
percent from 2012, as expenses and losses paid
on claims declined and there were no major
storms during the hurricane season in 2013
(Chart 5.4.5). Improved profitability
increased capital held by P/C operating
insurance entities to $665 billion, or an increase
of 10.4 percent over 2012.
As noted above, low interest rates present
a challenge to insurers as net yield on
invested assets continued to decline in 2013
(Chart 5.4.6). Life insurance companies
are more sensitive to interest rates than P/C
companies because investment income accounts
for a higher percentage of revenue (21 percent
in 2013) than for the P/C sector (9 percent in
2013). In addition, many life insurance and
annuity products are spread-based, and a
protracted low interest rate environment may
stress life insurers’ profits as the spread between
investment yields and the rate promised to
policyholders compresses. Legacy products in
particular (including annuities, long-term care,
and universal life insurance with secondary
guarantees) have been less profitable in the
current interest rate environment, as they were
originally priced and sold under differing
market conditions. To adapt to current financial
conditions as well as changing demographic
trends, companies have redesigned offerings
and discontinued product lines. The current
low interest rate environment also may affect
the use of captive reinsurance: the low rates
affect the present value of insurers’ contract
obligations (increasing the present values
of future obligations), and therefore may
encourage use of reinsurance for insurance
products with liability valuations that are
interest-rate-sensitive (see Box E).
0
20
40
60
80
2006 2007 2008 2009 2010 2011 2012 2013400
450
500
550
600
650
700Billions of US$ Billions of US$
Source: NAIC
Capital (right axis)Net Income
(left axis)
As Of: 2013
4.0
4.5
5.0
5.5
6.0
6.5
2006 2007 2008 2009 2010 2011 2012 20130.5
0.7
0.9
1.1
1.3
1.5Percent Percent
Source: NAIC, SNL Financial
Investment Yield(left axis)
Required Interest Rate(left axis)
Investment Yield Minus Required Interest Rate
(right axis)
As Of: 2013
5.4.5 Property and Casualty Insurance: Capital and Net Income
5.4.6 Life Insurers: Impact of Low Rate Environment

75
BOX E: Concerns Related to Captive Reinsurance
of product risks, the full scope of which has yet to be
determined. Of particular concern is the use of captives
to reinsure insurance products with liability valuations that
are volatile, cyclically sensitive, or interest rate sensitive,
such as variable annuities with guaranteed living benefits
and long-term care insurance.
In addition, captive reinsurers may hold riskier asset
portfolios, including higher exposures to derivatives, than
is generally permitted under state law for primary insurers.
Also, instead of holding high-quality liquid collateral in
trust to cover reserves reinsured to captives, insurance
companies can sometimes collateralize a portion of the
reserves held at captives with bank letters of credit that
are guaranteed by their parent holding companies or,
as allowed in some states, use a direct guarantee from
the parent holding company in lieu of any third-party
collateral. If the parent company providing a guarantee
to a captive were to experience financial distress and
become unable to properly capitalize the captive, the
primary insurer could lose credit for the reinsurance on its
statutory balance sheet and could experience a capital
shortfall as a result. This could complicate the orderly
resolution of a large insurance organization. Furthermore,
an insurance organization could face funding rollover
risk in a period of financial distress to the extent that its
captive uses bank letters of credit to support longer-
duration liabilities.
All of these factors can add complexity and reduce
transparency around the financial condition and
potential resolvability of certain life insurance companies.
Regulators and rating agencies have noted that the broad
use of captive reinsurance by life insurers may result in
regulatory capital ratios that potentially understate risk.
During times of financial market volatility when reserve
and capital levels for some products should increase, an
insurance company that uses captive reinsurance may not
be required to hold higher reserves and capital. This could
become a financial stability concern if a large, complex
insurance organization were to experience financial
distress.
Captive insurance entities were originally formed by
corporations and non-profit organizations seeking
to self-insure their own insurable business risks
such as general liability, workers’ compensation,
employee benefits, and automobile coverage.
Over time, commercial life insurance companies
formed captive reinsurers to reinsure policyholder
risks. As with primary insurers, captive reinsurers
are regulated by their licensing state or country
of domicile. However, because captive reinsurers
originally only provided self-insurance coverage of
business insurable risks as opposed to policyholder
risks, state captive regulation originally developed
separately from primary insurance regulation, which
places more emphasis on solvency and policyholder
protection. Although captive reinsurance transactions
must be approved by both the captive and primary
insurer’s regulators, the opportunity for regulatory
arbitrage arises because of state-by-state differences
in oversight, accounting, and capital requirements
for the two types of entities. In addition, in most
instances, unlike primary insurers, reinsurance
captives are required neither to file public statutory
financial statements nor to follow the same regulatory
accounting practices as primary insurers.
Some life insurance organizations have been using
captive reinsurance companies for many years to,
at least in part, obtain relief from certain regulatory
requirements. Importantly, the use of captive
reinsurance by a life insurer impacts results reported
on a regulatory accounting basis rather than U.S.
generally accepted accounting principles (GAAP)
accounting. For example, life insurance captives
became popular for reinsuring level premium
term life insurance and universal life insurance
with secondary guarantees. Both products have
statutory liability reserve requirements that exceed
the expected economic risks and the use of captive
reinsurance transactions allow for the reduction
of required regulatory capital. In the last decade,
the use of captive reinsurance by life insurers has
grown significantly and has expanded to other types
F inanc ia l Deve lopments

2 0 1 4 F S O C / / Annual Report76
Regulatory Developments
State insurance regulators are continuing
work to address the challenges of state-by-
state differences in the oversight of captives.
Specifically, state regulators, through the National
Association of Insurance Commissioners (NAIC),
are seeking to develop and then implement
consistent regulatory controls for reinsuring term
life insurance and universal life insurance with
secondary guarantees; proposing changes to the
NAIC’s accreditation program for state regulators
which would require U.S. reinsurance captives
to be subject to the U.S. solvency framework;
and considering further refinements to collateral
requirements for captive reinsurance transactions
involving letters of credit. State regulators are also
in the process of preparing for the implementation
of a principles-based reserve valuation system,
which would allow life insurers to “right-size”
reserves based on credible insurance company
experience data. The implementation of
principles-based reserving may eliminate the need
to use captive reinsurance for the purpose of
reducing reserves that are significantly higher than
expected losses.
In addition to the work being done by state
insurance regulators, reports completed by
Council members and member agencies
including the Treasury’s FIO and OFR have
identified concerns regarding life insurers’ use
of captives. The Federal Reserve also recently
issued a Supervision and Regulation Letter
concerning the effects of risk transfer activities on
capital adequacy, which would apply to captive
reinsurance risk transfer transactions for insurance
companies it supervises when they become
subject to the Federal Reserve’s risk-based capital
framework. Further, the FIO is monitoring both the
role and impact of captives in the sector and the
potential for regulatory improvements at the state
level.

77Financ ia l Deve lopments
5.4.3 Specialty Finance Companies
Specialty finance companies provide credit
to both consumers and businesses. Examples
of consumer credit include revolving credit
and student, mortgage, and auto loans, while
examples of business credit include equipment
leasing, accounts receivable factoring and
other major capital asset financing. Specialty
finance companies may be either independent
companies, captives of vehicle or equipment
manufacturers, or subsidiaries of financial
holding companies. Credit activity in the
specialty-lending sector continued to expand
in 2013, yet still remains below pre-crisis levels.
Overall, nonbank financial companies owned
approximately $855 billion of consumer
loans, $157 billion of real estate loans, and
$402 billion of business loans at year end 2013
(Charts 5.4.7, 5.4.8).
The securitization market for these credit types
originated by both bank and nonbank financial
companies remained healthy in 2013, while
overall issuance volume declined approximately
7.5 percent from 2012 due in part to a decrease
in securitization of government guaranteed
student loans. In the auto ABS market, which
comprises the largest share of consumer ABS,
many benchmark prime issuers reduced their
securitization volumes, electing to tap alternate
funding sources, such as corporate bond
markets. Subprime auto ABS issuance increased
moderately year-over-year. Student loan ABS
issuance declined in 2013 as the amount of
government-guaranteed issuance continues to
dwindle after the elimination of the Federal
Family Education Loan Program in 2010
(Chart 5.4.9).
Senior credit spreads on credit card and
auto ABS are slightly wider than they were
at the start of 2013, as the spread widening
that occurred following the June 2013 selloff
(See Box C) did not fully retrace due to more
moderate demand in anticipation of changes
to the interest rate environment. Subordinate
tranche credit spreads tightened moderately
during the second half of 2013, due to a
combination of reach for yield by investors and
0.0
0.3
0.6
0.9
1.2
1.5
1.8
0.0
0.3
0.6
0.9
1.2
1.5
1.8
2001 2003 2005 2007 2009 2011 2013
Source: Federal Reserve, Haver Analytics
As Of: Mar-2014Trillions of US$
Note: Loans owned and securitized. Series break in December 2010 for consumer loans outstanding at finance companies due to change in data collection methodology. Gray bars signify NBER recessions.
Trillions of US$
Commercial Banks
Finance Companies
0.0
0.3
0.6
0.9
1.2
1.5
1.8
0.0
0.3
0.6
0.9
1.2
1.5
1.8
2001 2003 2005 2007 2009 2011 2013
Source: Federal Reserve, Haver Analytics
As Of: Mar-2014Trillions of US$ Trillions of US$
Commercial Banks
Finance Companies
Note: Loans owned and securitized. Series break in December 2010 for business loans outstanding at finance companies due to change in data collection methodology. Gray bars signify NBER recessions.
0
50
100
150
200
250
0
50
100
150
200
250
2008 2009 2010 2011 2012 2013
Credit CardStudent Loans
AutoHousing RelatedOther
Equipment
Billions of US$ Billions of US$
Source: Thomson Reuters, SIFMA
As Of: 2013
5.4.8 Business Loans Outstanding
5.4.9 ABS Issuance
5.4.7 Consumer Loans Outstanding

2 0 1 4 F S O C / / Annual Report78
lower subordinate tranche supply relative to
senior tranches (Chart 5.4.10).
5.4.4 Agency REITs
Agency MBS REITs use short-term debt, mainly
in the form of bilateral repos, to fund the
purchase of agency MBS. Most agency MBS
REITs also use derivatives to hedge at least a
portion of the inherent duration mismatch
between their assets and liabilities. However,
prepayment risk and basis risk limit the efficacy
of hedging with interest rate derivatives.
Consequently, agency MBS REITs’ investment
strategy exposes them to interest rate risk
resulting from changes in the yield curve and
convexity risks, or the risk of MBS prices falling
at an increasing rate when rates rise. Convexity
risk is particularly acute for agency MBS REITs
since their use of leverage can magnify the
negative effects of any material increase in
interest rate volatility. Additionally, agency MBS
REITs are exposed to rollover risk, or the risk
of an increase in financing costs or a pullback
in the willingness of lending counterparties
to extend credit when their short-term repo
matures.
On net, REITs earn the yield on the underlying
MBS less the cost of financing and hedging
the portfolio. REITs’ earnings are not taxed at
the corporate level. They are only taxed when
equity holders receive the earnings in the form
of a dividend. To maintain their REIT status,
these entities must comply with various income
and asset tests, as well as distribute at least
90 percent of their taxable income to equity
holders. Given their tax status, dividend payout
requirements and use of leverage, REITs are
able to offer relatively high dividend yields
which some institutional and retail equity
investors find attractive.
The year 2013 proved to be a particularly
challenging year for agency MBS REITs as
rising interest rates and widening MBS spreads
weighed heavily on their portfolios. The
events that transpired throughout 2013 gave
observers insight into how these entities would
react to adverse market conditions. In the face
0
20
40
60
80
100
120
0
50
100
150
200
250
300
Jan:10 Jul:10 Jan:11 Jul:11 Jan:12 Jul:12 Jan:13 Jul:13 Jan:14
Basis Points Basis Points
Source: Barclays
Auto Fixed BBB 3-Year
(left axis)Credit Card Fixed
BBB 3-Year (left axis) Auto Fixed
AAA 3-Year (right axis)
Credit Card Fixed AAA 3-Year (right axis)
As Of: 27-Mar-2014
Note: Spreads to Treasury securities.
5.4.10 Selected ABS Spreads

79Financ ia l Deve lopments
of declining asset values, many REITs sold a
portion of their agency MBS holdings, reduced
leverage and bolstered hedges (Chart 5.4.11).
The 12 largest publically traded agency MBS
REITs reduced their agency MBS exposure
by roughly $111 billion, or 28 percent of
peak holdings. While it appears this REIT
selling may have exacerbated negative price
action in agency MBS, there were no major
market disruptions. The heavy losses and
aforementioned defensive portfolio positioning
resulted in a significant reduction of net
income, which in turn inhibited their ability to
maintain dividend payouts. Correspondingly,
shares of major agency MBS REITs declined
notably, with many falling between 20 and
30 percent year-over-year (Chart 5.4.12). The
market value of equity for most REITs declined
10 to 20 percent below their corresponding
book value, a rare occurrence for agency
MBS REITs. When the market value of equity
declines below the book value, agency MBS
REITs will find it difficult to raise new equity
capital and purchase additional agency MBS.
On these occasions, REITs have an incentive
to sell agency MBS holdings and repurchase
shares in the open market, a trend that
materialized and persisted throughout the
second half of 2013. Lastly, despite heightened
MBS price volatility in last years’ selloff, agency
MBS REITs did not report any material changes
to funding conditions.
As Of: 2013 Q4
0
5
10
15
20
0
50
100
150
200
250
300
350
400
2001 2003 2005 2007 2009 2011 2013
Billions of US$ Ratio
Source: Bloomberg, L.P.
Assets to Equity Ratio (right axis)
Total Assets (left axis)
Note: Data for 12 largest publically traded agency MBS REITs. Assets to equity ratio is weighted by market capitalization.
-100
0
100
200
300
-1
0
1
2
3
2003 2005 2007 2009 2011 2013
Percent Basis Points
2Y/10Y Treasury Spread (right axis)
Average ROA* (left axis)
As Of: 2013 Q3
Source: Bloomberg, L.P. Note: *Weighted by market capitalization.
5.4.12 Agency REITs: Return on Assets
5.4.11 Total Agency REIT Assets and Leverage

2 0 1 4 F S O C / / Annual Report80
In recent years, carry trades have become an increasingly
popular investment strategy. “Carry” broadly means
the difference between the yield or return on a financial
contract or asset and the cost of funds. If the yield or
return is higher (lower) than the cost of funds, the investor
is said to have positive (negative) carry. Volatile swings
in asset prices or spikes in borrowing costs can quickly
erase expected gains from positive carry. A sharp rise
in volatility among seemingly uncorrelated assets can
cause a forced exit of carry trades leading to market
dislocations.
The carry trade is most often found in currency and
fixed income markets. For example, in 2001, an investor
could borrow Japanese yen (JPY), at funding costs close
to zero, and invest in Australian (AUD) denominated
government securities yielding over 5 percent. As long
as the AUD/JPY exchange rate remained stable or the
Australian dollar strengthened, the investor would maintain
positive carry of about 5 percent or more (Chart F.1).
This trade persisted until global asset markets
experienced significant volatility during the summer of
2008. When volatility increased, investors exited this
trade, which strengthened the yen and exacerbated
currency movements that negatively impacted this
strategy (Chart F.2).
Periods of low market volatility, such as in recent years,
make carry trades popular among investors. Persistently
low interest rates can also incentivize a search for yield
and a higher degree of risk taking in carry trades. These
incentives can lead to a buildup of leveraged risks among
market participants. Should risks become greater than
expected, investors may exit carry trades on a “first out”
basis. Such a scenario, especially in illiquid markets, could
lead to forced selling in which one trade after another is
exited. This could cause negative spillover effects with
financial stability implications to markets and institutions.
BOX F: Carry Trade Strategies and Susceptibility to Shocks
0
1
2
3
4
5
6
7
0
1
2
3
4
5
6
7
Jan:01 Jul:02 Jan:04 Jul:05 Jan:07 Jul:08
Percent Percent
Source: IMF, Federal Reserve
Australian Government Bonds
Japanese Discount Rate
Carry Earned on Trade
As Of: Dec-2008
50
60
70
80
90
100
110
120
130
140
150
50
60
70
80
90
100
110
120
130
140
150
Jan:01 Jul:02 Jan:04 Jul:05 Jan:07 Jul:08
Index Index
Source: BIS, Federal Reserve
Australian Dollar
Japanese Yen
Note: Vertical line placed at September 2008. Jan-2001 = 100.
As Of: Dec-2008
F.2 Real Effective Exchange Rate Returns
F.1 Interest Rate on Government Bonds and Discount Rate

81
5.5 Investment Funds
5.5.1 Money Market Funds
MMFs are a type of mutual fund that invests
in certain high quality short-term securities as
defined by the SEC. Subject to compliance with
the investment restrictions, MMFs are permitted
to use the amortized cost method of valuation
and/or the penny-rounding method of pricing
to facilitate a stable NAV, commonly $1 per
share, for subscriptions and redemptions. There
are three main categories of MMFs: prime
funds, which invest primarily in corporate
debt securities; government and Treasury
funds, which invest primarily in U.S. federal
government securities; and tax-exempt funds,
which invest primarily in short-term, tax-exempt
securities of local and state governments. Prime
MMF assets increased slightly in 2013 from
$1.76 trillion to $1.79 trillion, while government
and Treasury MMF assets increased from $949
billion to $981 billion (Chart 5.5.1). Tax-
exempt MMFs declined from $299 billion to
$281 billion. Taken together, MMFs held just
over $3 trillion in assets as of December 2013,
or about 18 percent of total mutual fund assets
under management (AUM), according to the
Investment Company Institute.
The last two years have been a period of
persistent consolidation in the MMF industry,
with the number of MMFs dropping from 629
at the start of 2012 to 555 at the end of 2013.
In the sustained low-interest rate environment,
competitive measures have led fund managers
to offer fee waivers to MMF investors to prevent
negative net yield, which contributed to fund
consolidation.
During 2013, MMFs decreased liquidity levels
and increased the weighted-average life of
their fund portfolios (Charts 5.5.2, 5.5.3).
In particular, the weighted-average life of
non-traditional repo held in MMF portfolios
lengthened from 17.7 days at the end of 2012 to
30.3 days at the end of 2013.
0.0
0.5
1.0
1.5
2.0
2.5
3.0
3.5
4.0
0.0
0.5
1.0
1.5
2.0
2.5
3.0
3.5
4.0
Jan:11 Jul:11 Jan:12 Jul:12 Jan:13 Jul:13 Jan:14
Trillions of US$ Trillions of US$
Source: SEC
As Of: Feb-2014
Prime Government and TreasuryTax-Exempt
20
25
30
35
40
45
50
20
25
30
35
40
45
50
Jan:11 Jul:11 Jan:12 Jul:12 Jan:13 Jul:13 Jan:14
Percent of Total Assets Percent of Total Assets
Source: SEC
As Of: Feb-2014
Daily Liquidity
Weekly Liquidity
Note: Weighted by fund size.
Note: Weighted by fund sizeSource: SEC
60
65
70
75
80
85
60
65
70
75
80
85
Jan:11 Jul:11 Jan:12 Jul:12 Jan:13 Jul:13 Jan:14
Days Days
Prime
All Funds
As Of: Feb-2014
5.5.2 Liquidity of Prime MMFs
5.5.3 Weighted Average Life of MMFs
5.5.1 MMF Assets by Fund Type
F inanc ia l Deve lopments

2 0 1 4 F S O C / / Annual Report82
While the ranking changed slightly from 2012
to 2013, prime MMFs continued to have the
heaviest geographical exposures to the United
States, Canada, Japan, France, and Australia/
New Zealand. Notably, MMF exposure to
Chinese banks has increased steadily since
exposures first appeared in portfolios in
November 2011. However, at $5.9 billion at the
end of 2013, it is still a very small percentage of
prime MMF assets (0.3 percent).
Another notable change for MMFs in 2013
was the introduction of the Overnight Fixed-
Rate Capped-Allotment Reverse Repurchase
Agreement Operational Exercise, which the
Federal Reserve has undertaken as part of
its effort to test potential tools for future
implementation of monetary policy. As a
consequence of this exercise, investors in short-
term funding markets, including MMFs, now
have an additional, albeit potentially temporary,
high-quality liquid investment option. As of
December 31, 2013, prime MMFs held 44
percent of these repos, and all MMFs together
held over 78 percent.
5.5.2 Mutual Funds
The U.S. mutual fund industry has grown from
AUM of approximately $1 trillion in 1990 to
$17 trillion in December 2013 (Chart 5.5.4).
Long-term (equity and bond/hybrid) funds,
with assets of almost $12.3 trillion, made up 72
percent of total AUM as of December 2013.
In the wake of the 2008 financial crisis there
was a significant flow of cash into bond funds,
accompanied by a lesser but still significant
flow of cash out of equity funds. From January
2009 to December 2012, approximately $1,044
billion of new cash flowed into bond funds
while approximately $306 billion flowed out
of equity funds (Chart 5.5.4). This trend
reversed in 2013 as taxable bond funds had
net redemptions of $25 billion (compared to
net inflows of $254 billion in 2012) while tax-
exempt bond funds had net redemptions of $58
billion (Chart 5.5.5). This contrasts with equity
funds, which had a net inflow of $161 billion
in 2013 (89 percent into international funds
0
2
4
6
8
10
12
14
16
18
0
2
4
6
8
10
12
14
16
18
1990 1994 1998 2002 2006 2010
Trillions of US$ Trillions of US$
Source: ICI Factbook 2013, Flow of Funds, ICI, Haver Analytics
As Of: 2013
Total Bond/HybridEquity
OtherETFs
MMF
Note: Other = Unit Investment Trusts and Closed-End Funds.
-70-60-50-40-30-20-10010203040
-70-60-50-40-30-20-10
010203040
Jan:13 Mar:13 May:13 Jul:13 Sep:13 Nov:13 Jan:14
Source: ICI, Haver Analytics
As Of: Feb-2014Billions of US$ Billions of US$
Tax-ExemptTaxable
-5
0
5
10
15
20
25
30
35
40
-5
0
5
10
15
20
25
30
35
40
Jan:13 Apr:13 Jul:13 Oct:13 Jan:14
Source: ICI, Haver Analytics
As Of: Feb-2014Billions of US$ Billions of US$
5.5.5 Monthly Bond Mutual Fund Flows
5.5.6 Monthly Equity Mutual Fund Flows
5.5.4 Growth in Assets of the Investment Company Industry

83
and 11 percent into domestic stock funds) after
recording a net outflow of $153 billion in 2012
(Chart 5.5.6). Equity funds had not had net
inflows since 2007.
The month of June 2013 marked a turning
point in bond fund flows. After taxable bond
funds had net inflows of $87 billion from
January through May 2013, they had net
redemptions of $112 billion from June through
December, as markets anticipated that the
Federal Reserve would reduce its $85 billion-
per-month bond buying program and economic
conditions improved. Taxable bond funds had
net inflows for every week from January through
May and net outflows for all but three weeks
from June through December.
By far the most popular bond fund category
in 2013 was corporate short-term bond funds.
These funds, which primarily invest in lower-
rated bank loans, had net inflows of $62 billion
in 2013, or about five times the 2012 net inflow
(Chart 5.5.7). With interest rates still near
historical lows, investors who are reluctant to
take on interest rate risk in the form of longer
duration bonds have been attracted to this fund
category.
5.5.3 Pension Funds
As of the third quarter of 2013, the combined
AUM of private and public pensions, including
federal pensions and defined contribution
plans, were almost $16 trillion (Chart 5.5.8).
Corporate defined benefit funded status–the
estimated share of fund liabilities covered by
current assets-improved in 2013 (Chart 5.5.9).
One estimate of the funded status of the 100
largest corporate pension plans reached 94
percent in November 2013, and some large
plans reached full funding in 2013. The
improvement of the aggregate corporate
funded status resulted in part from the increase
in the corporate pension liability discount rate
over the course of 2013. Corporate pension
discount rates are closely tied to corporate bond
rates, which rose during the year in tandem
with the rise in Treasury yields. Additionally,
-10
0
10
20
30
40
50
60
-10
0
10
20
30
40
50
60
2005 2006 2007 2008 2009 2010 2011 2012 2013
Billions of US$ Billions of US$
Source: Morningstar, Inc.
As Of: 2013
0
5
10
15
20
0
4
8
12
16
20
24
Dec:06 Dec:07 Dec:08 Dec:09 Dec:10 Dec:11 Dec:12
Source: Flow of Funds, Haver Analytics
As Of: 2013 Q3Trillions of US$ Trillions of US$
Private Defined Benefit Plans
Individual AccountsPrivate Defined Contribution Plans
State and LocalFederal
60
70
80
90
100
110
120
60
70
80
90
100
110
120
Dec:02 Dec:04 Dec:06 Dec:08 Dec:10 Dec:12
Source: Public Fund Survey, Milliman
Percent Percent
Public Defined Benefit Plans
Private Defined Benefit Plans
As Of: Dec 2013
5.5.8 Retirement Fund Assets by Plan Type
5.5.9 Public and Private Pension Funding Level
5.5.7 Bank Loan Mutual Funds: Annual Flows
F inanc ia l Deve lopments
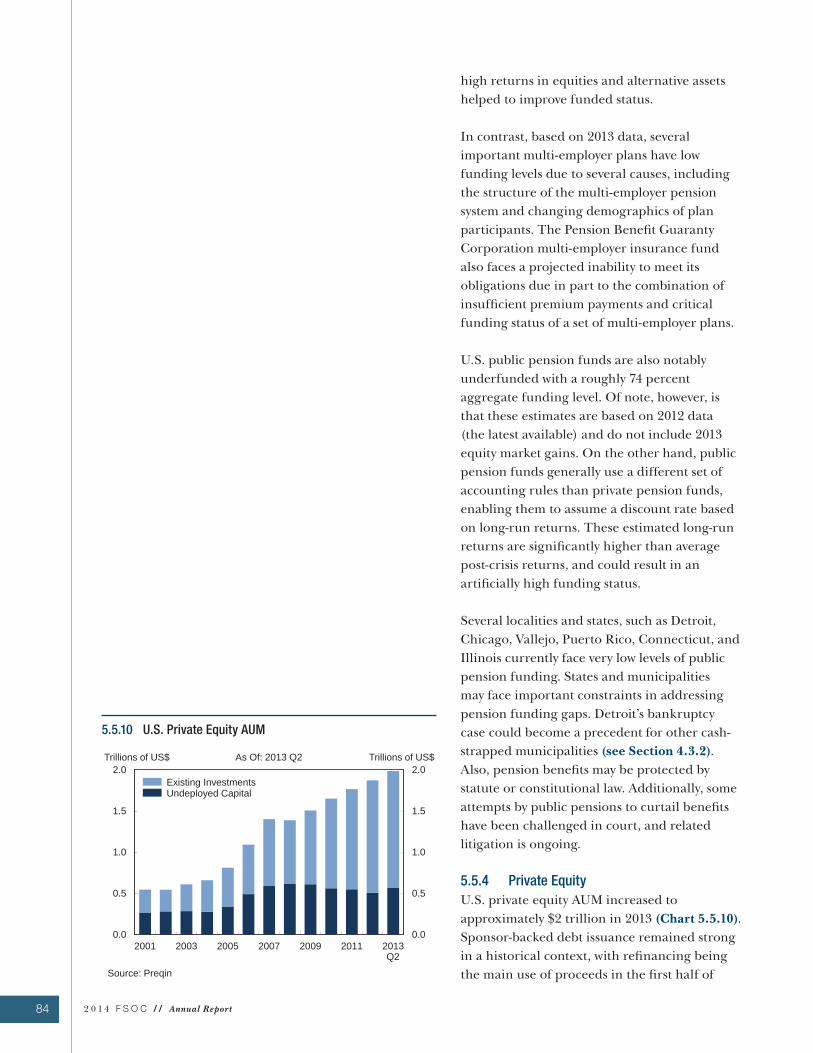
2 0 1 4 F S O C / / Annual Report84
high returns in equities and alternative assets
helped to improve funded status.
In contrast, based on 2013 data, several
important multi-employer plans have low
funding levels due to several causes, including
the structure of the multi-employer pension
system and changing demographics of plan
participants. The Pension Benefit Guaranty
Corporation multi-employer insurance fund
also faces a projected inability to meet its
obligations due in part to the combination of
insufficient premium payments and critical
funding status of a set of multi-employer plans.
U.S. public pension funds are also notably
underfunded with a roughly 74 percent
aggregate funding level. Of note, however, is
that these estimates are based on 2012 data
(the latest available) and do not include 2013
equity market gains. On the other hand, public
pension funds generally use a different set of
accounting rules than private pension funds,
enabling them to assume a discount rate based
on long-run returns. These estimated long-run
returns are significantly higher than average
post-crisis returns, and could result in an
artificially high funding status.
Several localities and states, such as Detroit,
Chicago, Vallejo, Puerto Rico, Connecticut, and
Illinois currently face very low levels of public
pension funding. States and municipalities
may face important constraints in addressing
pension funding gaps. Detroit’s bankruptcy
case could become a precedent for other cash-
strapped municipalities (see Section 4.3.2).
Also, pension benefits may be protected by
statute or constitutional law. Additionally, some
attempts by public pensions to curtail benefits
have been challenged in court, and related
litigation is ongoing.
5.5.4 Private Equity
U.S. private equity AUM increased to
approximately $2 trillion in 2013 (Chart 5.5.10).
Sponsor-backed debt issuance remained strong
in a historical context, with refinancing being
the main use of proceeds in the first half of
0.0
0.5
1.0
1.5
2.0
0.0
0.5
1.0
1.5
2.0
2001 2003 2005 2007 2009 2011 2013
Existing InvestmentsUndeployed Capital
Trillions of US$ Trillions of US$
Source: Preqin
As Of: 2013 Q2
Q2
5.5.10 U.S. Private Equity AUM

85
2013, and debt related to new leveraged buyouts
increasing notably in the latter half of 2013.
The issuance of sponsor-backed payment-in-
kind bonds, which are financing vehicles used
by private equity firms that are typically viewed
as highly risky for investors, spiked in the third
quarter 2013. Nonetheless, both the volume of
payment-in-kind bonds and their percentage of
total issuance remain substantially below pre-
crisis levels (Chart 5.5.11).
5.5.5 Hedge Funds
Hedge fund industry assets grew to an
estimated $2.6 trillion in 2013, a 17 percent
increase from 2012 (Chart 5.5.12). The growth
in 2013 was mainly driven by positive investment
performance (Chart 5.5.13). Large funds
continued to receive the majority of aggregate
net inflows in 2013 (Chart 5.5.14). Meanwhile,
funds of hedge funds continue to lose
popularity relative to standalone funds, as 2013
was the sixth consecutive year of net capital
outflows for these types of funds.
Responses to the Federal Reserve’s Senior
Credit Officer Opinion Survey on Dealer
Financing Terms conducted in June 2013
indicated that hedge fund financial leverage
was roughly halfway between the pre-crisis peak
and post-crisis trough. The findings differed
somewhat by hedge fund strategy: about one-
fifth of dealers reported that equity-oriented
and macro-oriented funds were utilizing levels
of leverage near to or at the pre-crisis peak.
According to form PF data from year-end 2012,
the mean financial leverage of the top 100
funds—measured by gross asset value divided
by NAV—ranges from 1x to 18x for funds in
the first and fourth quartile of the distribution
of financial leverage, respectively. The source
of this leverage is primarily repo transactions
and prime broker financing. For gross leverage,
defined as gross notional exposure divided by
NAV, the corresponding measures range from
1x to 57x. Gross notional exposure includes
synthetic leverage provided by derivatives,
measured as the sum of absolute notional values
of long and short positions.
0
10
20
30
40
50
60
0.0
1.5
3.0
4.5
6.0
7.5
9.0
2005 2006 2007 2008 2009 2010 2011 2012 2013 2014
Billions of US$
Source: S&P LCD
As Of: 2014 Q1
PIK Volume (left axis)
Percent of Sponsor-Backed High Yield Issuances
(right axis)
Percent
-2
0
2
4
6
8
10
12
-0.5
0.0
0.5
1.0
1.5
2.0
2.5
3.0
1992 1995 1998 2001 2004 2007 2010 2013
Number of Funds (right axis)
Estimated Assets (left axis)Net Asset Flows (left axis)
Trillions of US$ Thousands of Funds
Source: Hedge Fund Research, Inc.
As Of: 2013
5.5.11 Sponsor-Backed Payment-in-Kind Bonds
5.5.12 Hedge Fund Assets and Net Asset Flows
-500
-250
0
250
500
-500
-250
0
250
500
2003 2005 2007 2009 2011 2013
Net InflowsPerformance Return
Billions of US$ Billions of US$
Source: Hedge Fund Research, Inc.
As Of: 2013
5.5.13 Change in Hedge Fund AUM
F inanc ia l Deve lopments

2 0 1 4 F S O C / / Annual Report86
5.5.6 Exchange-Traded Products
Exchange-traded products (ETPs) include
ETFs, exchange-traded notes and other
investment vehicles. Since their creation,
ETPs have expanded from primarily offering
exposure to equity market indices to also
investing in commodities, currencies, and
other non-securities instruments, such as loans
and precious metals. ETPs are often used as a
means to achieve exposure to a market sector
or index in a manner that is potentially more
efficient and cost-effective than a traditional
mutual fund, investment product, or financial
instrument. Intra-day pricing and secondary
markets for ETPs can provide higher levels of
liquidity than other fund vehicles that price
daily, such as mutual funds.
U.S.-listed ETP assets grew by 26 percent to $1.7
trillion in 2013 and the number of U.S.-listed
ETPs grew to 1,536 (Chart 5.5.15). U.S. equity
ETP aggregate net inflows were $199 billion in
2013, up from $124 billion in 2012. U.S. bond
ETPs, however, experienced net inflows of only
$7.7 billion, down from a net inflow of over $55
billion in 2012. In contrast to equity and bond
ETPs, commodity ETPs experienced aggregate
net outflows of $30 billion in 2013.
ETFs referencing fixed income and EM assets
underwent a period of increased volatility in the
middle of 2013, reflecting in part changes in
market participants’ expectations for monetary
policy. On June 20, 2013, amid elevated volatility
in fixed income markets, some investors
experienced temporary restrictions related
to ETF redemptions. For example, one ETF
sponsor opted to only allow standard, in-kind
redemptions for certain ETFs—temporarily
taking away an optional cash redemption—
because the higher costs of liquidity would have
been borne by ETF shareholders. Furthermore,
rising interest rates in 2013 prompted fixed-
income investors to reduce the duration of
their investments. As a result, floating rate
note ETFs experienced substantial inflows, and
short-duration corporate credit ETFs saw robust
inflows as well.
-20
0
20
40
60
80
-20
0
20
40
60
80
2010 2011 2012 2013
$1-5 Billion>$5 Billion
<$1 Billion
Billions of US$ Billions of US$
Source: Hedge Fund Research, Inc.
As Of: 2013
0.0
0.2
0.4
0.6
0.8
1.0
1.2
1.4
1.6
1.8
0.0
0.2
0.4
0.6
0.8
1.0
1.2
1.4
1.6
1.8
2007 2008 2009 2010 2011 2012 2013
Trillions of US$ Thousands of Funds
Source: Morningstar, Inc.
As Of: 2013
AUM (left axis) Number of Funds (right axis)
5.5.15 U.S.-Listed ETP AUM and Count
5.5.14 Hedge Fund Net Asset Flows by AUM

87
5.6 Derivatives Infrastructure
Global Derivatives Volumes
Between December 2012 and June 2013, the
size of the global over-the-counter (OTC)
derivatives market increased by 9 percent from
$633 trillion to $693 trillion gross notional
outstanding, according to the most recent Bank
for International Settlements survey of global
market activity (Chart 5.6.1). The composition
by asset classes remained similar to previous
surveys.
Since November 2013, the CFTC has been
publishing weekly Swaps Reports that provide
aggregate data on OTC derivatives volumes and
notional amounts. The Swaps Report represents
all OTC derivatives transactions reported to the
CFTC-registered SDRs (i.e., CME, Depository
Trust and Clearing Corporation (DTCC),
Intercontinental Exchange, and Bloomberg) by
entities subject to the CFTC’s reporting rules,
which are primarily U.S. market participants.
As of January 31, 2014, the CFTC’s Swaps
Report showed $406 trillion in notional amount
outstanding for OTC derivative transactions
across all asset classes. Similar to the global
market, U.S. interest rate derivatives accounted
for around 85 percent of the activity at $343
trillion, followed by FX and credit derivatives
with $31 trillion and $8 trillion, respectively.
Data reported in the credit derivatives market
over the past few years reflect a significant
move by market participants from single name
activity to more index-based trading. Some of
this movement may result from the significant
reduction of new structured credit and tranche
product activity that necessitated the use of
many different single name CDS contracts,
including entities that had no debt outstanding.
Volume in single name CDS dropped
significantly after the financial crisis because of
the reduced demand from monoline insurance
companies and the overall decline of complex
products. In contrast, volume in index CDS has
increased significantly in the post-crisis years
(Chart 5.6.2). Market participants cite better
0
100
200
300
400
500
600
700
800
0
100
200
300
400
500
600
700
800
2000 2002 2004 2006 2008 2010 2012
Source: BIS, Haver Analytics
As Of: 2013 Q2Trillions of US$ Trillions of US$
Credit Default Swaps
FX Contracts
Equity-linked ContractsCommodity Contracts
Interest Rate Contracts
Unallocated
Note: Notional values.
0
2
4
6
8
10
12
0
2
4
6
8
10
12
2009 2010 2011 2012 2013 2014
Trillions of US$ Trillions of US$
Source: DTCC
As Of: Feb-2014
Note: Gross notional includes the notional from the perspective of both swap counterparties.
CDS IndexSingle Name CDSCDS Tranche
5.6.2 Credit Derivatives Outstanding
5.6.1 Global OTC Derivatives Market
F inanc ia l Deve lopments

2 0 1 4 F S O C / / Annual Report88
execution and liquidity in indexes as compared
to trading in individual single name CDS.
Central Clearing
G-20 commitments and Dodd-Frank Act
requirements to promote central clearing of
certain OTC derivatives transactions have led
to an increase in the number of transactions
centrally cleared. A central counterparty
(CCP) reduces risks to participants through
multilateral netting of trades, imposing risk
controls on clearing members, and maintaining
financial resources commensurate with
risks it carries. A CCP also has the benefit of
establishing ex-ante procedures for managing
a default and allocating losses that can provide
the market with more certainty in the event of
a clearing member default. Given the rise in
activity of certain derivatives through CCPs,
and their relevance to financial stability, it is
important that they have robust capital and risk
management standards in place.
In recognition of this shift to central clearing
and the associated concentration of risks, the
Dodd-Frank Act coupled the clearing mandate
with a requirement for risk management
standards, requiring the implementation of
risk management standards for systemically
important financial market utilities (FMUs),
including CCPs that are designated systemically
important by the Council, that take into
consideration relevant international standards,
such as those set forth in the Principles for
Financial Market Infrastructures (PFMIs).
Accordingly, U.S. regulators have prioritized
implementation of revised regulations in line
with these standards (see Section 6.1.1).
The Seventh Progress Report on
Implementation of OTC Derivatives Market
Reforms published by the Financial Stability
Board (FSB) indicates that of 15 FSB member
jurisdiction dealers’ gross notional outstanding
in OTC interest rate derivatives products, as of
end-February 2014, 53 percent of those products
offered for clearing by a CCP are estimated
to have been centrally cleared. For credit
derivatives this number stood at 40 percent.

89
In the United States, mandatory central
clearing began in 2013 with certain
standardized derivatives on a phased-in
schedule pursuant to CFTC rules. U.S. central
clearing of credit derivatives has grown from
zero percent in the beginning of 2009 to 81
percent in February 2014 (Chart 5.6.3). Most
market participants that are active in the swaps
market, including dealers, were generally
required to clear these products starting in
March 2013, while other less active market
participants were required to clear certain
credit derivatives indices starting in June or
September 2013. According to Depository Trust
& Clearing Corporation data, centrally cleared
credit derivatives remain heavily concentrated
within the interdealer network with a few firms
accounting for 49 percent of volumes over the
period 2010 to present. While some dealer-to-
dealer trades were being cleared on a voluntary
basis before 2013, CFTC rules did result in a
significant increase in clearing of client trades.
The process of mandating additional products
for central clearing is ongoing.
Swap Execution Facilities
In the United States, there has been progress
on the G-20 commitment for increased
transparency in the OTC derivatives market
through the introduction of swap execution
facilities (SEFs) in 2013. A transition to
organized platform trading increases pre-
trade transparency and supports more efficient
markets. The CFTC implemented its SEF
rules in October 2013, and in February 2014
mandatory trading began for benchmark USD,
euro, and sterling interest rate swap contracts
as well as certain five-year CDS indices, with
temporary relief granted for contracts involving
contingent and simultaneous execution with
another contract. The rules also require that
SEFs report all transactions to SDRs and make
market data publicly available through their
website on a daily basis.
0
10
20
30
40
50
60
70
80
90
100
0
10
20
30
40
50
60
70
80
90
100
2009 2010 2011 2012 2013 2014
Percent Percent
Source: DTCC
As Of: Feb-2014
Uncleared
Cleared
5.6.3 Growth of Credit Derivative Central Clearing
F inanc ia l Deve lopments

2 0 1 4 F S O C / / Annual Report90
Swap Futures Products
Partially in response to the new requirements
and the added costs of trading OTC derivatives
in late 2012, U.S. futures exchanges began
offering dollar-denominated futures contracts
with similar cash flows and exposure profiles
as some interest rate and credit OTC derivative
contracts in December 2012 and June 2013
respectively. Euro-denominated interest rate
swap futures launched in April 2014. Interest
rate swap futures have lower initial margin
requirements compared to those on similar
OTC swaps, which is a potential driver for
their use.
Since the third phase of the CFTC clearing
mandate came into effect in September 2013,
the market for interest rate swap futures
has grown 34 percent measured by notional
outstanding. In January 2014, average daily
trading volume for interest rate swap futures
products was $528 million and open interest
at the end of the month was $18 billion, both
measured by notional amount (Chart 5.6.4).
However, the trading volume and size of
the USD interest rate swap futures market
still remains small relative to those of the
comparable USD interest rate swap market.
The notional amount of open interest in USD
interest rate swap futures is about 0.02 percent
of the notional outstanding USD OTC interest
rate swaps cleared by LCH SwapClear. The
trading volume and open interest for CDS
index futures have declined since they were
introduced in June 2013.
0
2
4
6
8
10
12
14
16
0
20
40
60
80
100
120
140
160
180
200
Jan:13 Apr:13 Jul:13 Oct:13 Jan:14
Average Daily Volume (right axis)
Thousands Thousands
Source: CME Group, Eris Exchange
Open Interest (left axis)
As Of: 31-Mar-2014
Note: Number of contracts. Notional contract value is $100,000/contract.
5.6.4 Interest Rate Swap Futures: Volume and Open Interest

91Regu lato r y Deve lopments; Counc i l Ac t i v i t i es
Since the Council’s 2013 annual report, financial reform progress included further strengthening
of capital, leverage, and liquidity standards for financial institutions and risk-management standards
for FMUs; adoption of the Volcker Rule, which generally prohibits banking entities from engaging in
proprietary trading and limits their investment in and sponsorship of private funds; refinements of
periodic supervisory and company-run stress tests; further implementation of the OLA; regulation of
the derivatives markets to reduce risk and increase transparency; new standards to protect mortgage
borrowers and reduce risks in the mortgage market; and other measures to enhance consumer and
investor protection.
In addition, the Council has continued to fulfill its mandate. In particular, the Council made
determinations that three nonbank financial companies will be subject to Federal Reserve supervision
and enhanced prudential standards, pursuant to Section 113 of the Dodd-Frank Act. The Council also
continued to monitor potential risks to U.S. financial stability and served as a forum for discussion and
coordination among the member agencies.
The following is a discussion of the significant financial regulatory reforms implemented by the Council
and its member agencies since the Council’s 2013 annual report. This section covers: (1) the safety and
soundness of financial institutions; (2) financial infrastructure, markets, and oversight; (3) consumer
and investor protection; (4) data standards; and (5) Council activities. A special topic in this section
covers enhancements of the Council’s governance and transparency.
6.1 Safety and Soundness
6.1.1 Enhanced Capital and Prudential Standards and Supervision
Capital, Leverage, and Liquidity Standards
The banking agencies have made significant progress over the last year in implementing capital,
leverage, and liquidity standards.
In July 2013, the Federal Reserve, FDIC, and OCC issued new rules implementing the Basel III
regulatory capital standards by establishing heightened minimum risk-based and leverage capital
requirements for banking organizations, creating a mechanism for counter-cyclical capital buffers for
periods of high credit growth, limiting capital distributions, and certain discretionary bonus payments
if banking organizations fail to maintain a capital conservation buffer, and removing references to and
reliance on credit ratings in capital calculations. These rules apply to all insured depository institutions
and to BHCs and savings and loan holding companies, with certain exceptions. These rules include a
new minimum ratio of common equity tier 1 capital to RWAs of 4.5 percent and a common equity tier
1 capital conservation buffer of 2.5 percent of RWAs. The rules also raise the minimum ratio of tier
1 capital to RWAs from 4 percent to 6 percent. The rules maintain a total risk-based capital ratio of 8
percent and a minimum tier 1 ratio to total on-balance sheet assets leverage ratio of 4 percent. For large,
internationally active banking organizations, the rules establish a minimum supplementary leverage
ratio of 3 percent that is based on the international leverage ratio standard and takes into account
off-balance sheet exposures.
6 Regulatory Developments; Council Activities

2 0 1 4 F S O C / / Annual Report92
In July 2013, the SEC adopted amendments to the broker-dealer financial responsibility rules that, among
other things, clarify that a broker-dealer providing securities lending and borrowing services is acting in a
principal capacity for purposes of the net capital rule, and thus subject to increased capital charges, unless
the broker-dealer takes certain steps to disclaim principal liability. The SEC has also proposed to increase
the minimum net capital requirement of certain large broker-dealers and subject these firms to a monthly
liquidity stress test to ensure that large broker-dealers have sufficient liquidity to survive a potential loss of
funding in a liquidity stress event.
In addition, in October 2013, the banking agencies released a proposed rule that would establish a
standardized liquidity requirement through a LCR for large financial institutions. The requirement would
apply to BHCs and savings and loan holding companies without significant insurance or commercial
operations and that are internationally active—generally those with $250 billion or more in total
consolidated assets or $10 billion or more in on-balance sheet foreign exposure. The rule would also apply to
the consolidated insured depository institution subsidiaries of those companies with $10 billion or more in
total consolidated assets. The rule would additionally apply to nonbank financial companies designated by
the Council that do not have substantial insurance operations. The proposal also would apply a less stringent,
modified LCR to BHCs and savings and loan holding companies without significant insurance or commercial
operations that are not internationally active, but have more than $50 billion in total assets. The proposed
requirement would be consistent with the international LCR standard. The proposed rule would require
institutions to maintain highly liquid assets sufficient to withstand a severe short-term, standardized liquidity
stress scenario, thereby promoting the resilience of their liquidity risk profile and improving the banking
sector’s ability to absorb shocks arising from financial and economic stress, as well as improvements in the
measurement and management of liquidity risk.
In February 2014, the Federal Reserve issued a final rule implementing enhanced prudential standards for
U.S. BHCs and FBOs with total consolidated assets of $50 billion or more. For a BHC with total consolidated
assets of $50 billion or more, the rule incorporates previously issued capital planning and stress testing
requirements and imposes enhanced liquidity requirements, enhanced risk-management requirements, and a
debt-to-equity limit for companies that the Council determines pose a grave threat to U.S. financial stability.
For a FBO with total consolidated assets of $50 billion or more, the rule implements enhanced risk-based
and leverage capital requirements, liquidity requirements, risk-management requirements, stress-testing
requirements, and a debt-to-equity limit for companies that the Council determines pose a grave threat to
U.S. financial stability. In addition, the rule requires FBOs with U.S. non-branch assets of $50 billion or more
to form a U.S. intermediate holding company and imposes capital, liquidity, and other requirements on that
entity. The rule also implements stress-testing requirements for FBOs and foreign savings and loan holding
companies with total consolidated assets of more than $10 billion. In addition, the rule establishes a risk-
committee requirement for certain banking organizations.
In April 2014, the Federal Reserve, FDIC, and OCC issued a final joint rule to strengthen the supplementary
leverage ratio requirements for the largest, most interconnected U.S. BHCs, those with total consolidated
assets greater than $700 billion or assets under custody greater than $10 trillion, and insured depository
institution subsidiaries of those BHCs. Under the rule, subsidiary insured depository institutions of these
companies will be required to satisfy a 6 percent supplementary leverage ratio requirement to be considered
well capitalized under the agencies’ prompt corrective action regulations. U.S. top-tier holding companies
will be required to maintain a leverage buffer of at least 2 percent above the minimum supplementary
leverage ratio requirement of 3 percent, for a total requirement of 5 percent. The rule is intended to
constrain the buildup of financial leverage at the largest banking organizations and place additional private
capital at risk before the Deposit Insurance Fund or government resolution mechanisms would need to be
called upon.

93Regu lato r y Deve lopments; Counc i l Ac t i v i t i es
Foreign Bank Regulation
In February 2014, the Federal Reserve issued a final rule implementing enhanced prudential standards for
FBOs to help increase the resiliency of their operations.
The Federal Reserve also issued an interim final rule clarifying how uninsured U.S. branches and agencies
of foreign banks will be treated under Section 716 of the Dodd-Frank Act, also known as the “swaps push-
out rule.” The interim final rule provides that for purposes of Section 716, the term “insured depository
institution” includes any uninsured U.S. branch or agency of a foreign bank. Following the Federal Reserve’s
interim final rule, the OCC notified uninsured branches and agencies of foreign banks that they may request
a transition period under Section 716 from the OCC. The Federal Reserve finalized this rule in
December 2013.
The FDIC issued a final rule regarding the treatment of deposits in foreign branches of U.S. banks.
Currently, under the Federal Deposit Insurance Act, funds deposited in foreign branches of U.S. banks are
not considered deposits unless the funds are payable both in the foreign branch and in the United States.
A recent consultation paper issued by the U.K. Prudential Regulation Authority could result in some large
U.S. banks changing their deposit agreements to make U.K. branch deposits payable in both the United
Kingdom and United States. In response, the FDIC in September 2013 issued a rule that clarifies that deposits
in foreign branches of U.S. banks are not eligible for FDIC deposit insurance, although they may qualify as
deposits for the purpose of the national depositor preference statute enacted in 1993.
Emergency Lending Authority
In December 2013, the Federal Reserve issued proposed amendments to Regulation A implementing the
Dodd-Frank Act’s amendments to Section 13(3) of the Federal Reserve Act. The amendments are designed
to ensure that any emergency extension of credit or emergency lending program or facility established by the
Federal Reserve is solely for the purpose of providing liquidity to the financial system, and not to assist failing
financial institutions.
Risk-Management Standards for Designated FMUs
As discussed in Section 5.6, the Dodd-Frank Act required the implementation of enhanced risk-management
standards for designated FMUs, which take into consideration the relevant international standards. These
international standards, the PFMIs, were issued in April 2012 by the Committee on Payment and Settlement
Systems and IOSCO. The PFMIs harmonized, strengthened, and created new international risk management
standards for systemically important payment systems, central securities depositories, securities settlement
systems, CCPs, and trade repositories. The PFMIs include standards for governance, credit risk management,
margin and collateral, liquidity risk management, settlement, clearing member default management, and
business and operational risk, among others.
The Council has designated eight FMUs as systemically important, subjecting them to the enhanced
regulatory and supervisory regime provided by Title VIII of the Dodd-Frank Act. The supervisory agencies
for the currently designated FMUs (the Federal Reserve, CFTC, and SEC) are in various stages of rulemaking
to implement enhanced risk-management standards for designated FMUs. The CFTC issued a final rule in
November 2013 establishing enhanced risk management standards for derivatives clearing organizations
designated as systemically important FMUs by the Council. The SEC’s operational and risk-management
standards for clearing agencies, including clearing agencies that clear security-based swaps, came into effect
in January 2013. In March 2014, the SEC proposed additional standards that would be consistent with the
PFMIs for clearing agencies designated as systemically important FMUs by the Council. The Federal Reserve
proposed revisions to its risk-management standards for designated FMUs other than those for which the

2 0 1 4 F S O C / / Annual Report94
SEC or the CFTC is the supervisory agency in January 2014. Each of the supervisory agencies’ rules or rule
proposals are, while not identical, based on and generally consistent with the PFMIs.
6.1.2 Volcker Rule
In December 2013, the Federal Reserve, OCC, FDIC, SEC, and CFTC issued final rules to implement section
619 of the Dodd-Frank Act, commonly referred to as the Volcker Rule. The rulemaking was coordinated
by Treasury. The final rules, which include a single, common regulatory text, generally prohibit banking
entities from: (1) engaging in short-term proprietary trading in securities, derivatives, commodity futures,
and options on these instruments for their own account, and (2) owning, sponsoring, or having certain
relationships with hedge funds, private equity funds, and other covered funds. As required by section 619
of the Dodd-Frank Act, the final rules provide exemptions for certain activities, including market making-
related activities, underwriting, risk-mitigating hedging, and trading in certain U.S. and foreign government
obligations, among others. In accordance with the Dodd-Frank Act, the final rules prohibit any activity, even
if it would otherwise be permitted, if it would involve a material conflict of interest, a material exposure to
high-risk assets or trading strategies, or a threat to the safety and soundness of the banking entity or to U.S.
financial stability.
6.1.3 Dodd-Frank Stress Tests and Comprehensive Capital Analysis and Review
Section 165(i) of the Dodd-Frank Act requires two types of stress tests. First, the Federal Reserve must
conduct annual supervisory stress tests of BHCs with $50 billion or more in total consolidated assets and
nonbank financial companies designated by the Council. Second, financial companies with more than $10
billion in total consolidated assets must conduct annual stress tests, and BHCs with $50 billion or more in
total consolidated assets and nonbank financial companies designated by the Council must also conduct
semi-annual company-run stress tests. In addition, the Federal Reserve conducts an annual CCAR.
The results of company-run, mid-year stress tests were released by certain banking organizations in
September 2013. Also in September 2013, the Federal Reserve issued a rule providing a one-year transition
period during which banking organizations with between $10 and $50 billion in total assets would not be
required to reflect the Basel III capital rule in their stress tests.
In November 2013, the Federal Reserve, FDIC, and OCC issued the economic and financial market scenarios
used in the 2013 to 2014 stress tests and capital planning program. A total of 30 BHCs and other financial
institutions regulated by the Federal Reserve with consolidated assets of at least $50 billion participated in the
2013 to 2014 exercise, and the results of these stress tests were released in March 2014. The Federal Reserve
approved the plans of 25 financial institutions in the CCAR, and objected to the plans of five firms—four
based on qualitative concerns, and one due to its inability to meet a minimum post-stress capital requirement.
Following the initial CCAR results, the Federal Reserve required Bank of America Corporation to resubmit
its capital plan, as described in Section 5.3.1. All but two of the 30 CCAR participants are expected to build
capital from the second quarter of 2014 through the first quarter of 2015. In the aggregate, the firms are
expected to distribute 40 percent less than their projected net income during the same period.
Institutions with $50 billion or more that are subject to the Federal Reserve, FDIC, and OCC company-run
stress test rules began their second stress test cycle in 2013. Institutions with $10 to $50 billion in assets began
their first stress test cycle in 2013. These midsize institutions are not required to publicly disclose their 2013
to 2014 stress test results; public disclosures will begin in June 2015 with the results of the 2014 to 2015 stress
tests.
In March 2014, the Federal Reserve published a final rule providing that no banking organization would
be required to calculate its regulatory capital ratios using the Basel III advanced approaches until the 2015

95Regu lato r y Deve lopments; Counc i l Ac t i v i t i es
to 2016 stress testing cycle. Also in March 2014, the Federal Reserve, FDIC, and OCC issued stress testing
guidance for institutions with $10 to $50 billion in assets.
6.1.4 Resolution Plans and Orderly Liquidation Authority
Resolution Plans
Under the framework of the Dodd-Frank Act, bankruptcy is the preferred option in the event of the failure of
a financial company. Section 165(d) of the Dodd-Frank Act requires nonbank financial companies designated
by the Council for supervision by the Federal Reserve and BHCs (including FBOs that are, or are treated as,
BHCs) with total consolidated assets of $50 billion or more to report periodically to the Federal Reserve, the
FDIC, and the Council with plans—also referred to as living wills—for their rapid and orderly resolution
under the U.S. Bankruptcy Code in the event of material financial distress or failure. The Federal Reserve
and the FDIC must review each plan and may jointly determine that the plan is not credible or would not
facilitate an orderly resolution of the company under the U.S. Bankruptcy Code. If the Federal Reserve
and the FDIC make such a joint determination, then the company must resubmit its plan with revisions
demonstrating that the plan is credible and would result in an orderly resolution under the Bankruptcy Code,
including any proposed changes in business operations and corporate structure to facilitate implementation
of the plan. In November 2011, the Federal Reserve and the FDIC published a joint final rule implementing
the resolution plan requirement.
Eleven of the largest, most complex institutions submitted initial plans in 2012 and revised plans in 2013.
During 2013, an additional 120 institutions subject to the rule at that time submitted initial plans. The public
portions of each resolution plan were published on the Federal Reserve’s and the FDIC’s websites. In 2013,
the Council designated three nonbank financial companies for Federal Reserve supervision, and these firms
will submit initial resolution plans in 2014.
Following the review of the 11 plans submitted in 2012, the Federal Reserve and the FDIC issued guidance for
those firms concerning information that should be included in their 2013 resolution plan submissions. The
guidance identified significant obstacles to rapid and orderly resolution for the firms to consider and address,
including delineating the actions or steps the company has taken or proposes to take to remediate or to
otherwise mitigate each obstacle, and providing a timeline for proposed actions, as necessary.
The significant obstacles identified in the guidance were:
• Multiple competing insolvencies: The risk of discontinuity of critical operations, arising from
operations in multiple jurisdictions.
• Global cooperation: The risk that lack of cooperation could lead to ring fencing of assets.
• Operations and interconnectedness: The risk that critical services provided by an affiliate or third
party might be interrupted.
• Counterparty actions: The risk that derivative and other counterparty actions may lead to systemic
market disruption.
• Funding and liquidity: The risk of having insufficient liquidity to maintain critical operations.
Orderly Liquidation Authority
In cases where resolution of a financial company under the Bankruptcy Code may result in serious adverse
effects on financial stability in the United States, the OLA set out in Title II of the Dodd-Frank Act serves
as the last resort alternative. Under the Dodd-Frank Act, the Federal Reserve, and another financial
regulatory agency specified by the Dodd-Frank Act (either the FDIC, the SEC, or FIO) must make written
recommendations to the Secretary of the Treasury, who must then make certain determinations in order to

2 0 1 4 F S O C / / Annual Report96
invoke the OLA. These include determining that the company is in default or danger of default; that failure
of the company and its resolution under other law, including bankruptcy, would have serious adverse effects
on U.S. financial stability; and that no private sector alternative is available to prevent the default of the
company.
The FDIC is developing a strategic approach, the SPOE, to carry out the OLA when resolving a financial
company. Under SPOE, the FDIC would be appointed receiver only of the top-tier parent holding company of
a financial group upon the completion of the recommendation, determination, and expedited judicial review
process set forth in Title II. The FDIC would organize a temporary bridge financial company and transfer
to it assets from the receivership estate—including the failed holding company’s investments in and loans
to subsidiaries. The FDIC would oversee operations of the bridge financial company and retain control over
high-level key matters of its governance, impose losses on shareholders and unsecured creditors, and replace
culpable senior management.
The FDIC would appoint a board of directors and nominate a new chief executive officer and other key
managers to operate the bridge financial company under the FDIC’s oversight. The company may be
restructured by shrinking businesses, breaking the company into smaller entities, liquidating assets, or
closing operations to ensure that the resulting entities could be resolved in bankruptcy.
During the operation of the bridge financial company, the healthy subsidiaries of the company would remain
open, protecting against contagion in the financial system by maintaining continuity of services. At the same
time, SPOE would protect against moral hazard by holding the failed company’s shareholders, management,
and creditors, accountable for its failure. In December 2013, the FDIC approved a Federal Register Notice for
public comment that provides greater detail on SPOE.
International Coordination on Resolution under the OLA
Advance planning and cross-border coordination for resolution of G-SIFIs are essential to minimize
disruptions to global financial markets. The FDIC and the BoE, in conjunction with prudential regulators
in their respective jurisdictions, are developing contingency plans for the failure of a G-SIFI with operations
in the United States and the United Kingdom. In December 2013, building on their joint policy paper on
resolution strategies released in 2012, the FDIC and the BoE, in conjunction with the Prudential Regulation
Authority, the Federal Reserve, and the FRBNY, held a tabletop exercise exploring cross-border issues and
mitigating actions that regulators could take in case of a resolution.
The FDIC and the European Commission have established a joint working group to focus on resolution
and deposit insurance issues. In 2013, the working group convened twice, and staff collaboration has been
ongoing.
In 2013, the FDIC also collaborated with regulators in Switzerland, Germany, and Japan to discuss cross-
border issues and impediments affecting the resolution of G-SIFIs. They will continue this work in 2014, with
tabletop exercises.
In a demonstration of cross-border cooperation, the FDIC, the BoE, the Swiss Financial Market Supervisory
Authority, and the German Federal Financial Supervisory Authority signed a November 2013 joint letter to
the International Swaps and Derivatives Association (ISDA). This letter encouraged ISDA to revise derivatives
contracts to authorize the short-term suspension of early termination rights and other remedies in the event
of a G-SIFI resolution. Such changes are intended to permit the exercise of all applicable types of resolution
powers without resulting in a disorderly termination of derivatives contracts.

97Regu lato r y Deve lopments; Counc i l Ac t i v i t i es
6.1.5 Insurance
FIO, state regulators and, as of October 2013, the Federal Reserve, are members of the International
Association of Insurance Supervisors (IAIS). FIO’s director and two state regulators serve on the
IAIS’s Executive Committee.
Through service on the IAIS’s Financial Stability Committee, FIO, the NAIC, and state regulators
have participated extensively in the process of identifying global systemically important insurers
(G-SIIs) and the policy measures to be applied to any such designated insurer. The FSB, which
was tasked by the G-20 to identify G-SIIs, delegated the development of a methodology and policy
measures for G-SIIs to the IAIS. On July 18, 2013, the FSB, in consultation with the IAIS, identified
an initial list of nine G-SIIs that included three U.S.-based insurers; however, a decision on the G-SII
status of major reinsurers was deferred until November 2014. In July 2013, the IAIS also published,
and the FSB endorsed, a set of policy measures that will apply to G-SIIs, including enhanced
group-wide supervision, recovery and resolution planning, and higher loss absorbency (HLA)
requirements.
In the absence of an international capital standard for insurance companies, the FSB also called
upon the IAIS to develop two separate capital measures. The first, straightforward backstop capital
requirements (BCR), will serve as a foundation for HLA requirements for G-SIIs. The second is a
quantitative insurance capital standard (ICS) that will be part of the IAIS’s Common Framework
for the Supervision of Internationally Active Insurance Groups. The IAIS’s Technical Committee
directs the development of this integrated, multilateral, and multidisciplinary framework for the
group-wide supervision of internationally active insurance groups. FIO, state regulators (through
the NAIC), and the Federal Reserve have been participating actively in the IAIS task force charged
with developing and testing the BCR and ICS. The IAIS will develop and propose a BCR to the FSB
by late 2014 and will propose HLA by the end of 2015, with implementation of both to begin January
2019. The ICS will be developed by the end of 2016, and will be field tested through 2018 in advance
of implementation in 2019.
Title V of the Dodd-Frank Act established FIO and directed it to study and report on how to
modernize and improve the system of insurance regulation in the United States. After extensive
study and consultation, the report was released in December 2013 and concluded that the United
States should build on the existing hybrid model of insurance regulation, incorporating state
regulation with a federal role, where necessary. Accordingly, the report recommends how the U.S.
system of insurance regulation can be modernized and improved by a combination of steps by the
states and certain actions by the federal government. Specifically, the report highlights three areas
of note where FIO concluded that federal involvement is warranted: development of international
insurance regulatory standards; topics for which national uniformity is an appropriate standard
and topics of national interest for which federal involvement is necessary; and oversight of mortgage
insurance.
Since early 2012, FIO, state regulators (through the NAIC), the European Commission, and the
European Insurance, and Occupational Pensions Authority have participated in a project to increase
mutual understanding and enhance cooperation between the EU and the United States in order
to promote business opportunity, consumer protection, and effective supervision. After focusing
on gap analysis through 2012, the focus of the project shifted in 2013 to professional secrecy and
confidentiality, solvency and capital requirements, and reinsurance and collateral requirements.
With the IAIS developments and the finalization of the EU’s oversight regime (Solvency II), new
areas will be focused on in 2014.

2 0 1 4 F S O C / / Annual Report98
State insurance regulators, through the NAIC, continue work on updating the insurance financial solvency
framework and to refine existing accounting, reporting, valuation, and risk-based capital requirements. States
continue to adopt various NAIC models or updated models related to the Solvency Modernization Initiative,
including the revised Credit for Reinsurance Model Law and Regulation, the revised Model Insurance
Holding Company System Regulatory Act (including the enterprise risk report), the Standard Valuation Law
to implement principles-based reserving, and the Risk Management and Own Risk and Solvency Assessment
Model Law, which was adopted by the NAIC in 2012 to establish the Own Risk and Solvency Assessment
filing requirement. In addition, state insurance regulators continue to build on various aspects of these
projects through implementation efforts at the NAIC. This includes the NAIC’s approval of four international
supervisory authorities as conditional qualified jurisdictions under the Process for Developing and
Maintaining the NAIC List of Qualified Jurisdictions, and the rollout of the NAIC’s Reinsurance Financial
Analysis (E) Working Group, which among other things coordinates multi-state efforts in reviewing and
addressing issues related to certified reinsurers.
The Council also will continue to monitor relevant domestic and international financial regulatory proposals
and developments involving insurance.
6.1.6 Mortgage-related Litigation and Settlements
Federal and state agencies reached several significant settlements in 2013 with financial institutions, including
some relating to the sale of mortgage securities.
Beginning in January 2013, 15 mortgage servicing companies subject to enforcement actions for deficient
practices in mortgage loan servicing and foreclosure processing reached settlements with the OCC and
the Federal Reserve to provide approximately $3.9 billion in direct cash payments to borrowers and
approximately $6.1 billion in other foreclosure prevention assistance, such as loan modifications and the
forgiveness of deficiency judgments. For participating servicers, fulfillment of these agreements satisfies the
foreclosure file review requirements of enforcement actions issued by the OCC, Federal Reserve, and Office
of Thrift Supervision in 2011 and 2012. In addition, in December 2013, the CFPB, together with authorities in
49 states and the District of Columbia, entered into a settlement with the country’s largest nonbank mortgage
loan servicer, requiring it to provide consumer refunds and $2 billion in loan modification relief.
Since January 2013, there have been settlements totaling more than $17 billion in eight lawsuits filed by FHFA
relating to financial institutions’ sales of mortgage securities to Fannie Mae and Freddie Mac. The largest of
these settlements were $9.3 billion by Bank of America, $4.0 billion by JPMorgan, $1.9 billion by Deutsche
Bank, and $1.3 billion by Morgan Stanley.
Also, in October 2013, the Justice Department announced a $13 billion settlement with JPMorgan to resolve
federal and state civil claims arising out of the packaging, marketing, sale, and issuance of residential
mortgage-backed securities (RMBS) by JPMorgan, Bear Stearns, and Washington Mutual prior to January
1, 2009. Of the $13 billion, $9 billion will be paid to settle federal and state civil claims by federal agencies
and several states related to RMBS. This $13 billion settlement also includes JPMorgan’s settlement with the
FHFA that requires it to pay out $4 billion in the form of relief to aid consumers harmed by the conduct of
JPMorgan, Bear Stearns, and Washington Mutual.
In 2013, the SEC continued its pursuit of financial institutions that misled investors in connection with the
sale of MBS. The SEC brought actions against large financial institutions such as Bank of America and the
Royal Bank of Scotland for their roles in the issuance of RMBS. The SEC also filed charges against broker-
dealers, collateral managers, and their principals for fraud in connection with the structuring and sale of
billions of dollars of collateralized debt obligations.

99Regu lato r y Deve lopments; Counc i l Ac t i v i t i es
6.2 Financial Infrastructure, Markets, and Oversight
6.2.1 Over-the-Counter Derivatives Reform
Title VII of the Dodd-Frank Act establishes a comprehensive new regulatory framework for swaps
and security-based swaps. Among other things, the legislation: (1) provides for the registration and
comprehensive regulation of swap dealers, security-based swap dealers, major swap participants (MSPs),
and major security-based swap participants; (2) imposes clearing and trade execution requirements
on standardized derivatives products; and (3) creates robust recordkeeping and real-time reporting
requirements with respect to swaps and security-based swaps. Title VII also provides for greater pre-trade and
post-trade transparency in the swaps and security-based swaps markets. Under Title VII, the CFTC regulates
“swaps,” the SEC regulates “security-based swaps,” and the CFTC and SEC jointly regulate “mixed swaps.”
A number of elements of the CFTC’s swaps regulatory regime became effective over the past year. The CFTC
continued to phase in its implementation of the clearing mandate for certain standardized index CDS and
interest rate swaps. The clearing requirement was implemented in March 2013 for swap dealers, MSPs, and
private funds active in the swaps market; in June 2013 for entities including commodity pools and private
funds other than active funds; and in September 2013 for all other entities. The CFTC also adopted a final
rule in April 2013 exempting swaps between certain affiliated entities within a corporate group from the
mandatory clearing requirement.
An important milestone for increased transparency in the swaps market was achieved in May 2013 when the
CFTC adopted final rules implementing the core principles and other requirements for SEFs, where swap
contracts may be listed for trading. At the same time, the CFTC also issued rules establishing the process by
which a designated contract market or a SEF can submit a determination that a swap has been made available
for trading for purposes of the trade execution mandate.
Over the past year, the CFTC also took significant actions to begin implementing the international regulatory
framework for swaps. In July 2013, the CFTC and the European Commission announced a “Path Forward”
regarding their joint understandings on a package of measures for how to approach cross-border derivatives.
In the same month, the CFTC issued a final interpretive guidance and policy statement regarding the
application of the CFTC’s swap regulatory regime to cross-border activities. In December 2013, the CFTC
issued broad comparability determinations, covering a range of Dodd-Frank Act requirements, for a number
of foreign jurisdictions. These comparability determinations would permit eligible swap counterparties to
comply with local requirements rather than the corresponding Dodd-Frank Act requirements in cases where
substituted compliance is available.
Other significant CFTC actions include a final interpretive statement issued in May 2013 providing guidance
on statutory provisions prohibiting certain disruptive trading, practices, or conduct. In November 2013, the
CFTC issued final rules imposing requirements on swap dealers and MSPs with respect to the treatment
of collateral posted by their counterparties to margin, guarantee, or secure uncleared swaps. Finally, in
December 2013, the CFTC issued proposed rules to establish speculative position limits for 28 exempt and
agricultural commodity futures and option contracts, and physical commodity swaps that are ‘‘economically
equivalent’’ to such contracts.
The SEC also has begun the first major phase of security-based swap regulation. In May 2013, the SEC issued
comprehensive proposed rules and proposed interpretations on cross-border security-based swap activities.
This proposal covers registration requirements for security-based swap dealers and major security-based
swap participants; transaction-related requirements such as the reporting, dissemination, clearing, and trade
execution of security-based swaps; exceptions to registration requirements; and the re-proposal of Regulation

2 0 1 4 F S O C / / Annual Report100
SBSR (for security-based swap reporting), which provides for the reporting and dissemination of security-
based swap information. In addition, in April 2014, the SEC proposed rules for security-based swap dealers
and major security-based swap market participants, as required by the Dodd-Frank Act. The proposed rules
cover recordkeeping, reporting, and notification requirements for security-based swap dealers and major
security-based swap participants and would establish additional recordkeeping requirements for broker-
dealers to account for their security-based swap activities.
Finally, in September of 2013, the Basel Committee on Banking Supervision and IOSCO’s working group on
margin requirements released the final policy framework on minimum standards for margin requirements
for non-centrally cleared derivatives. The framework is designed to reduce risks related to OTC derivatives
markets and provide firms with appropriate incentives for central clearing while managing the liquidity
impact of the requirements. The CFTC, SEC, Federal Reserve, FDIC, OCC, FHFA, and Farm Credit
Administration are working to implement rules that are generally consistent with this policy framework and
the Dodd-Frank Act.
6.2.2 Securitization Reform
In August 2013, the Federal Reserve, OCC, FDIC, FHFA, SEC, and HUD re-proposed a rule from 2011
to implement the requirement under the Dodd-Frank Act for securitizers to retain risk in the assets they
securitize. The rulemaking is coordinated by Treasury. The risk-retention requirement is intended better to
align the interests of securitizers and investors, and provide a strong incentive for securitizers to monitor the
credit quality and underwriting of assets they securitize.
Under the Dodd-Frank Act, the rule must generally provide that securitizers must retain at least 5 percent
of the credit risk for the assets collateralizing any ABS that they issue, unless the securitized assets or
the transaction qualify for an exemption. Consistent with the statute, the reproposal would establish
underwriting standards for QRMs, which would be exempt from the risk-retention requirements. The
reproposal would provide sponsors of ABS with various options for meeting the risk retention requirements.
The new proposal would provide for the QRM definition to equal the definition of “qualified mortgage”
(QM) established by the CFPB in 2013. The reproposal also requested comment on an alternative definition
of QRM that would include certain underwriting standards in addition to the QM criteria.
6.2.3 Money Market Mutual Fund Reform
In June 2013, the SEC proposed further reforms for the regulation of MMFs. The reforms were intended to
make MMFs less susceptible to runs that could threaten financial stability and harm investors. The SEC’s
proposal includes two principal reforms that could be adopted alone or in combination. One alternative
would require a floating NAV for prime institutional MMFs. The other alternative would allow the use of
liquidity fees and redemption gates in times of stress. The proposal also includes additional diversification,
disclosure, and stress testing measures that would apply under either alternative. The public comment period
has closed, and the SEC is currently reviewing the comments and working to develop a final rule.
The SEC began evaluating the need for MMF reform after the Reserve Primary Fund “broke the buck” at
the height of the financial crisis in September 2008. In 2010, the SEC adopted reforms enhancing the risk-
limiting conditions on MMFs by reducing maturities, improving credit quality and imposing new liquidity
requirements. The SEC’s proposed rules would supplement the 2010 reforms. In November 2012, the
Council issued for public comment a proposed recommendation that the SEC implement structural reforms
to mitigate the vulnerability of MMFs to runs. The Council’s proposed recommendation was issued under
Section 120 of the Dodd-Frank Act. Under Section 120, if the Council determines that a financial activity
or practice conducted by BHCs or nonbank financial companies could create or increase the risk of certain

101
problems spreading among financial companies or markets, the Council may, after seeking public comment,
issue recommendations to the relevant regulator to apply new or heightened standards or safeguards.
6.2.4 Credit Rating Reforms
Section 939A of the Dodd-Frank Act requires each federal agency to modify its regulations to remove any
reference to, or requirement of reliance on, credit ratings and to substitute in its regulations a standard of
credit-worthiness that the agency determines is appropriate. In 2013, agencies including the FDIC, Federal
Reserve, NCUA, OCC, SEC, and the Internal Revenue Service continued to implement this requirement
by amending their rules. Previously, other agencies including the CFTC and FHFA had adopted rules
implementing Section 939A.
6.2.5 Accounting Standards
In December 2012, the Financial Accounting Standards Board (FASB) issued for public comment a proposal
to improve financial reporting by moving to an expected credit loss model for loans and other financial
assets. The proposal, Financial Instruments—Credit Losses (Subtopic 825-15), is intended to require more
timely recognition of credit losses, while also providing additional transparency about credit risk. Currently,
under U.S. GAAP, credit losses are generally not reflected in financial statements until it is probable that the
losses have been incurred. Under the proposal, a firm’s balance sheet would reflect management’s current
estimate of expected credit losses at the reporting date (as an allowance for credit losses), and the income
statement would reflect all changes in expected credit losses (as a provision for credit losses). The FASB’s final
standard is expected to be issued by the end of 2014. While the FASB’s and the International Accounting
Standards Board’s (IASB) approaches on expected credit losses will not be converged, the final standards will
represent a significant change from the current incurred loss credit impairment model.
In February 2013, the FASB issued for public comment a proposal to improve financial reporting by providing
a comprehensive framework for classifying and measuring financial instruments. Under the proposal, the
classification and measurement of a financial asset would be based on the asset’s cash flow characteristics and
the entity’s business model for managing the asset. In November 2012, the IASB had proposed amendments
to its financial instruments accounting standards that would also classify and measure financial assets
based on cash flow characteristics and business model assessments, although some parts of the two boards’
proposals differed. However, in December 2013 and January 2014, the FASB decided that it would not
continue to pursue the proposed contractual cash flow characteristics and business model assessments. In
March 2014, the FASB decided to retain the separate models in existing U.S. GAAP for determining the
classification of loans and securities, but directed staff to analyze whether changes are needed to the current
definition of a security. The FASB’s final standard is expected to be issued by the end of 2014.
In May 2013, the FASB, jointly with the IASB, issued a revised proposal for public comment to increase
transparency and comparability among organizations that lease assets (as lessor or lessee), updating a joint
proposal from August 2010. The revised proposal would create a new approach to lease accounting, the core
principle of which would be that both a lessee and a lessor organization should recognize assets and liabilities
arising from a lease on the balance sheet. Existing lease accounting standards have been criticized for failing
to meet the needs of financial statements users. In March 2014, the FASB and IASB began redeliberations on
the revised proposal and reaffirmed that all leases would be recognized on the balance sheet by lessees, while
current lessor accounting would remain substantially unchanged. However, based on the FASB’s decisions,
most existing operating leases would continue to have straight-line expense and most existing capital leases
would continue to have accelerated lease expense. The boards will continue redeliberations during 2014 to
try and reach a converged solution.
Regu lato r y Deve lopments; Counc i l Ac t i v i t i es

2 0 1 4 F S O C / / Annual Report102
The FASB and the IASB also are in the process of finalizing standards on revenue recognition. U.S. GAAP
comprises broad revenue recognition concepts and numerous requirements for particular industries or
transactions that can result in different accounting for economically similar transactions. International
Financial Reporting Standards have fewer requirements on revenue recognition. To resolve these
inconsistencies, the FASB and the IASB initiated a joint project to develop a common revenue standard
for U.S. GAAP and International Financial Reporting Standards. The initial proposal to amend revenue
recognition rules was issued in June 2010. After receiving comments, an amended exposure draft was issued
in November 2011, and proposed amendments to U.S. GAAP were released in January 2012. In November
2013, the FASB completed its discussions on revenue recognition, and a final standard is expected to be
issued in the first half of 2014.
In June 2013, the FASB issued for public comment a proposal to improve the financial reporting of
insurance contracts. The proposal would have required contracts that transfer significant insurance risk to
be accounted for in a similar manner, regardless of the type of institution issuing the contract. In contrast,
existing U.S. GAAP for insurance contracts only applies if the entity providing insurance is an insurance
company. The IASB also issued an insurance proposal in June 2013 that is similar in some respects to the
FASB proposal. The FASB began redeliberations on its proposal in February 2014 and, in light of feedback,
decided to limit the scope of the project to insurance entities as described in existing U.S. GAAP and to focus
on making targeted improvements to existing U.S. GAAP. A completion date for the project has not been
established.
6.3 Consumer and Investor Protection
6.3.1 Mortgage Transactions and Housing
In December 2013, the CFPB published a final rule and forms that combine several federal disclosures that
a consumer receives in connection with applying for and closing on a mortgage loan under Regulation Z
(which implements the Truth in Lending Act (TILA)) and Regulation X (which implements the Real Estate
Settlement Procedures Act (RESPA)).
For more than 30 years, federal law has required a lender to provide different sets of disclosures to a
consumer who applies for and closes on a mortgage loan: one under TILA and the other under RESPA. Two
different federal agencies separately had developed the required disclosures. The information on the TILA
and RESPA disclosure forms is overlapping and the language is inconsistent. Pursuant to a mandate in the
Dodd-Frank Act, the CFPB integrated the mortgage loan disclosures required under TILA and RESPA. After
engaging in extensive consumer and industry outreach and testing and considering the comments on the
proposed rule, the CFPB issued the integrated disclosures in a final rule.
The final rule also provides a detailed explanation of how the forms should be filled out and used. The first
new form, called the Loan Estimate, is designed to provide information to a consumer when the consumer
applies for a mortgage loan so that the consumer can understand the key features, costs, and risks of the
loan. The Loan Estimate form must be sent to the consumer no later than three business days after the
creditor receives the consumer’s application. The second new form, called the Closing Disclosure, is designed
to provide information to a consumer to understand all of the costs of the mortgage loan transaction, and
must be provided to the consumer no later than three business days prior to closing on the loan.
In developing the Loan Estimate and Closing Disclosure forms, the CFPB reconciled the differences between
the existing TILA and RESPA disclosures, and combined several other mandated disclosures, including
an appraisal notice under the Equal Credit Opportunity Act and a servicing application disclosure under
RESPA. The rule also makes certain changes to reduce the risk that consumers will be surprised at the

103
closing table. These changes include requiring that closing information be provided three days in advance
and placing certain further restrictions on increases in charges disclosed on the Loan Estimate. The final
rule is effective on August 1, 2015, and applies to transactions for which the creditor or mortgage broker
receives an application on or after that date, subject to certain exceptions.
In January 2013, the CFPB issued several rules implementing new consumer protections for the mortgage
market as mandated in the Dodd-Frank Act. First, the CFPB issued a final rule, known as the ability-to-
repay/QM rule, implementing a requirement of the Dodd-Frank Act that creditors make a reasonable,
good-faith determination at the time of consummation that a consumer has a reasonable ability to repay
a mortgage. The ability-to-repay/QM rule is designed, in part, to promote the stability of the financial
system by aligning the consumer’s interest in obtaining a loan that he or she can afford with the lender’s
interest in originating a loan that is a viable asset. The ability-to-repay requirements contained in the CFPB’s
Regulation Z generally prohibit a creditor from using unverified information about a consumer’s income
and debt and from underwriting a loan based only on low “teaser” rates. Certain mortgages, called QMs,
that meet specific criteria set forth in the rule are entitled to a presumption of compliance with the ability-
to-repay requirements. A QM that is a higher-priced mortgage loan is subject to a rebuttable presumption of
compliance, while a QM that is not higher priced receives a safe harbor from a claim alleging a violation of
the ability-to-repay requirements.
The CFPB rules generally require that a consumer’s backend debt-to-income (DTI) ratio may not exceed 43
percent for a QM, with some exceptions. In particular, to help ensure access to credit while the market adjusts
to the new regulations, the CFPB rules provide that for the next several years, certain loans that are eligible
for purchase, guarantee, or insurance by the government sponsored entities and certain federal agencies
shall be deemed QMs even if the DTI ratio exceeds 43 percent.
The CFPB subsequently amended the ability-to-repay rule in 2013, so as to exempt certain creditors and
lending programs from the ability-to-repay requirements, facilitate compliance by and to preserve access
to credit from small creditors, and modify the requirements regarding the inclusion of loan originator
compensation in the QM 3 percent points and fees cap. In particular, the CFPB adopted exemptions from the
ability-to-repay requirements for creditors designated by certain federal government agencies under specified
community development lending programs, as well as for creditors designated as nonprofit organizations that
extend credit secured by a dwelling no more than 200 times annually, provide credit only to low-to-moderate
income consumers, and follow their own written procedures to determine that consumers have a reasonable
ability to repay their loans.
Among other amendments designed to preserve access to credit for customers of small creditors, the CFPB
raised the threshold for determining when a QM is deemed to be a higher-priced mortgage. This amendment
expands the ability of small creditors to receive the safe harbor under the ability-to-repay requirements. The
amendments also exempt a small creditor from the 43 percent DTI requirement for QMs the creditor holds
in its portfolio, so long as the creditor considers DTI ratios or residual income according to its own internal
criteria. Finally, in October 2013 the CFPB, Federal Reserve, FDIC, NCUA, and OCC issued interagency
guidance to address issues regarding fair lending risks associated with offering only QMs.
Under the new rules, certain loans eligible for purchase by Fannie Mae and Freddie Mac will be deemed
QMs under the temporary QM category described above. These loans need not meet the 43 percent DTI
ratio cap. However, a jumbo loan generally may receive QM status only if that loan meets the 43 percent
DTI requirement, and a loan with certain product features or with points and fees in excess of the general
Regu lato r y Deve lopments; Counc i l Ac t i v i t i es

2 0 1 4 F S O C / / Annual Report104
3 percent cap is not eligible for QM status. In response to the CFPB’s rules, FHFA directed Fannie Mae and
Freddie Mac to refrain from purchasing a loan that is subject to the “ability to repay” rule if the loan is not
fully amortizing, has a term of longer than 30 years, or includes points and fees in excess of 3 percent of
the total loan amount generally. Effectively, this means that Fannie Mae and Freddie Mac may not purchase
interest-only loans, loans with 40-year terms, or those with points and fees exceeding the thresholds
established by the rule.
The CFPB’s rules also address concerns with regard to servicers’ policies and procedures regarding
recordkeeping, servicing transfers, loss mitigation, and other topics. The new rules generally require that
servicers provide consistent monthly statements, expand and improve their information request and error
resolution procedures, and provide certain disclosures to consumers before imposing force-placed insurance.
The new rules also direct servicers to improve communications with borrowers who are having difficulty
repaying their loans. Servicers must reach out to troubled borrowers within 36 days of delinquency, provide
continuity of contact with trained personnel, and process applications for loan modifications and other
foreclosure relief consistent with specified timelines and procedures.
In January 2013, the CFPB also issued mortgage servicing rules to implement several protections mandated
by the Dodd-Frank Act. Over the course of 2013, the CFPB amended certain provisions of the mortgage
servicing rules to clarify the scope and application of the rules. Small servicers are exempt from several of the
provisions. In January 2013, the CFPB also issued rules to implement requirements under the Dodd-Frank
Act concerning mortgage loan appraisals, loan originator compensation and training, high-cost mortgage
loans, the use of agreements requiring arbitration of disputes concerning mortgage loans, mandatory escrow
accounts for certain higher priced mortgage loans, and various other topics. The CFPB made some minor
clarifications and adjustments to these rules over the course of 2013.
In January 2013, the Federal Reserve, FDIC, OCC, FHFA, CFPB, and NCUA jointly issued a final rule that
established new appraisal requirements for higher-priced mortgage loans. Under the Dodd-Frank Act,
mortgage loans are higher-priced if they are secured by a consumer’s home and have annual percentage rates
above certain thresholds. In December 2013, the agencies approved a supplemental rule that exempts a subset
of higher-priced mortgage loans from certain appraisal requirements. As mandated by the Dodd-Frank Act,
in March 2014 these agencies issued a proposed rule that would implement minimum requirements for state
registration and supervision of appraisal management companies.
The FHFA and CFPB also have continued their work on the construction of a National Mortgage Database,
the core of which consists of a nationally representative rolling 5 percent sample of originated mortgages,
matched with credit bureau data and supplemented by survey data. This database is intended to provide
regulators with an unprecedented understanding of mortgage market dynamics.
6.3.2 Consumer Protection
Among its authorities, the CFPB may supervise certain nonbank entities, including mortgage companies,
private education lenders, payday lenders, “larger participants” of a market for other consumer financial
products and services, and any nonbank covered person that the CFPB has reasonable cause to determine is
engaging or has engaged in conduct that poses risks to consumers with regard to the offering or provision
of consumer financial products or services. In July 2013, the CFPB issued a rule to establish procedures by
which the CFPB would bring a nonbank covered person under the CFPB’s supervisory authority because the
person’s conduct poses risks to consumers. The CFPB’s procedural rule is designed to establish a consistent
framework applicable to all affected entities, and thereby provide transparency regarding the procedures the
CFPB would use prior to commencement of a proceeding to notify and give an affected entity an opportunity
to respond to the CFPB’s proposed order to supervise the entity.

105Regu lato r y Deve lopments; Counc i l Ac t i v i t i es
In December 2013, the CFPB issued another in its series of rules to define “larger participants” of specific
markets for purposes of establishing, in part, the scope of the CFPB’s nonbank supervision program. The
CFPB’s larger-participant rule defines a market for “student loan servicing” activities, which covers the
servicing of both federal and private student loans. The rule provides that a person who engages in student
loan servicing would be a larger participant, and thus subject to the CFPB’s supervisory authority, if the
account volume of the person and its affiliates exceeds one million.
6.3.3 Investor Protection
The SEC issued a final rule in July 2013 implementing Section 926 of the Dodd-Frank Act, prohibiting
directors, officers, and other covered persons from relying on the exemption under Rule 506 under the
Securities Act of 1933 for a securities offering if any of these individuals are subject to criminal convictions,
disciplinary orders, or other administrative proceedings for wrongful acts, false representations, or other
disqualifying events.
In addition, in July 2013, the SEC adopted rule amendments to strengthen the audit requirements for broker-
dealers and enhance oversight of the way broker-dealers maintain custody of their customers’ assets. Among
other things, the amendments require that broker-dealer audits be conducted in accordance with standards
of the Public Company Accounting Oversight Board as provided by the Dodd-Frank Act. In addition, broker-
dealers are required to file a new form that elicits information about the broker-dealer’s practices with respect
to the custody of securities and funds of customers and non-customers so that regulators can better monitor
custody practices and oversee security of customer assets.
In September 2013, the SEC adopted rules establishing a permanent registration regime for municipal
advisors, as required by the Dodd-Frank Act. The new rules require a municipal advisor to permanently
register with the SEC if it provides advice on the issuance of municipal securities or about certain investment
strategies or municipal derivatives. As a result of these rules, municipal advisors will be subject to a
comprehensive regulatory regime when they provide advice to municipalities.
6.4 Data Standards
Data standards improve the clarity and quality of data by providing an unambiguous and universally accepted
meaning, thus increasing confidence in the data, and enabling comparison, aggregation, sharing, and
exchange. Adoption of data standards also reduces the need for costly conversion when exchanging data.
Building, adopting, and using standards for financial data will promote financial stability monitoring and
both better risk management and lower-cost regulatory reporting by firms.
The financial industry, the Council, and the Council’s members are increasingly focused on the need
for data standardization. Many industries have found that sector-wide standardization can reduce costs
and improve efficiency. The OFR works on behalf of the Council to participate as appropriate in industry
standards-making bodies, such as the Mortgage Industry Standards Maintenance Organization, to ensure
that regulatory needs are satisfied in data standard design. The SEC’s new Market Information Data Analytics
System (MIDAS), introduced in 2013, is an example of regulators’ response to increasing amounts of data
generated by financial markets. On a typical trading day, MIDAS collects roughly a billion price quotes and
trades from 13 U.S. stock exchanges. Tools like MIDAS require significant data standardization.
6.4.1 Legal Entity Identifier
The progress of the global LEI is evidence of the Council and the international community recognizing the
need for data standards. The LEI is a code that uniquely identifies parties to financial transactions instantly
and precisely. It is the first non-proprietary global unique entity identifier. The LEI is expected to reduce

2 0 1 4 F S O C / / Annual Report106
regulatory reporting burden and generate considerable cost savings for the financial industry in collecting,
cleaning, and aggregating data. The LEI is a key identifier for enabling better monitoring of risks in the
financial system.
To date, 13 organizations have issued more than 250,000 codes in 178 countries. Council member agencies
have played a key role throughout the LEI development process, leading work streams, and working
with other regulators and industry to provide recommendations to the G-20 to guide the governance,
development, and implementation of the global LEI system. The OFR’s Chief Counsel currently serves as the
Chair of the LEI’s Regulatory Oversight Committee, and representatives of the Federal Reserve, SEC, CFTC,
OCC, and FDIC sit on this committee. The Global LEI Foundation is being established in Switzerland to
oversee the system. The foundation’s board of directors was nominated in December 2013 and was endorsed
by the FSB in January 2014. It will have authority over a global federation of local operating units to ensure
adherence with LEI governing principles.
Mandatory reporting uses of the LEI will facilitate the rapid deployment of the LEI. LEIs are already
required for counterparty identification in the CFTC’s and the European Securities and Markets Authority’s
swap data reporting requirements and are optional for reporting by private fund investment advisers on
the SEC’s Form PF. The European Banking Authority has decided to recommend the use of LEIs as unique
identification codes for supervisory purposes for every credit and financial institution in the EU. The
Council’s Data Committee is evaluating how to expand the use of the LEI in U.S. regulatory and reporting
requirements.
6.4.2 Mortgage Industry
Regulators are working to adopt data standards in the mortgage industry. As with LEIs, adoption of such
standards offers the benefits of improved data quality, increased efficiency and effectiveness of data sharing
among regulators, and decreased costs for regulatory reporting by the industry. The Dodd-Frank Act
amended the Home Mortgage Disclosure Act to allow the CFPB to require a UMI, if deemed appropriate.
The CFPB convened a Small Business Review panel in March 2014 to consider a number of issues in Home
Mortgage Disclosure Act reporting, including the use of both the LEI and a UMI.
Given the size, complexity, and fragmented nature of the mortgage system, regulators need a clear and
con¬sistent identifier of each mortgage. The Mortgage Industry Standards Maintenance Organization
created placeholders in its standards for the LEIs of financial institutions involved in each loan, from
origination through servicing and securitization of mortgages. A recent OFR working paper described
how a universal mortgage identi¬fier could improve aggregation, comparability, and analysis in the U.S.
mortgage industry. During the financial crisis, the lack of a mortgage identifier made it difficult for lenders
and regulators to have a consistent understanding of trends in originations, underwriting standards,
performance, and loan modifications. A unique mortgage identifier designed to protect individual privacy
has the potential to be beneficial in this regard.
The Uniform Mortgage Data Program is an ongoing initiative implemented by the FHFA and the GSEs to
improve the consistency, quality, and uniformity of data collected at the beginning of the lending process,
as well as for servicing data. Developing standard terms, definitions, and industry standard data-reporting
protocols will decrease costs for originators and appraisers, reduce repurchase risk, and also allow new
entrants to use industry standards rather than having to develop their own proprietary data systems.
6.4.3 Swap Data Repositories
Promoting standardization and transparency in the OTC derivatives or swaps market is a priority for
the Council and the international regulatory community. At the 2009 Pittsburgh summit, G-20 leaders

107Regu lato r y Deve lopments; Counc i l Ac t i v i t i es
committed to several reforms to strengthen the OTC derivatives markets and improve transparency and
regulatory oversight. One of the main elements of these reforms was the mandated reporting of OTC
derivative transactions. OTC derivatives products have historically been among the least-standardized
financial instruments. The Dodd-Frank Act established a new regulatory framework for OTC derivatives,
under which all swap transactions must be reported to new entities known as SDRs or SBSDRs.
The CFTC has issued rules identifying specific fields that must be reported for every swap and for classes
of swaps. Those rules require the use of the LEI as well as the Unique Product Identifier, which categorizes
swaps according to certain underlying information, and the Unique Swap Identifier, which identifies
individual swaps, where available.
SDRs for interest rate, credit, equity, FX, and other commodity asset classes under the CFTC’s jurisdiction
are required to publicly disseminate real-time swap transaction data for these swap transactions, such as
transaction prices and sizes, “as soon as technologically practicable” after the SDR receives such data, unless
the transaction is subject to a time delay. Additionally, all trades are subject to delays during the phase-in of
the CFTC reporting rules. The CFTC has begun reporting aggregated swap data (such as aggregate numbers
of trades and aggregate gross notional amounts) in weekly reports that combine data from the SDRs. These
reports have recently estimated gross notional amounts reported at over $390 trillion.
There are four SDRs in the United States. In an effort to reduce burden, the CFTC required the SDRs to
report transactions, but did not specify reporting standards regarding data definitions or formats. However,
data standards are essential to enable data aggregation across SDRs and across asset classes. The CFTC, with
support from other Council member agencies, is working to improve and harmonize data reporting by SDRs.
Legislation in several key jurisdictions has led to a proliferation of trade repositories (internationally, SDRs
are referred to as trade repositories). However, in many jurisdictions, the legal framework for reporting
derivatives transactions limits authorities’ ability to obtain access to the information. In the United States,
authorities (other than the CFTC or SEC, as applicable) face obstacles obtaining access to data reported
to and maintained in registered SDRs without agreeing to confidentiality requirements and to indemnify
the SDR and the CFTC or SEC for litigation expenses relating to the information provided. This and
other obstacles restricting authorities’ access to trade repository data run counter to the G-20’s goals of
practical and effective access for authorities and enhanced market transparency. With limited access to data,
authorities, including certain Council members and member agencies, are unable to carry out fully their
mandates to monitor systemic risk and identify potential emerging threats.
The FSB, Committee on Payment and Settlement Systems, and IOSCO have recognized the importance of
standards in derivatives data reporting and the challenges posed by the fragmentation of derivatives data
across global trade repositories. Disparate reporting rules, a lack of uniform data standards, and varying
rules for authorities’ access to data across jurisdictions makes analysis of the global derivatives market
difficult. To fulfill their mandates, authorities may need to combine data from trade repositories within
and across jurisdictions. In 2013, the FSB called for the creation of the Aggregation Feasibility Study Group
to study how to ensure that data reported to trade repositories can be effectively used by authorities and
options for producing and sharing global aggregated trade repository data. The Aggregation Feasibility Study
Group includes representatives of the CFTC, Federal Reserve, FRBNY, and Treasury. The FSB published a
consultative report in February 2014, and a final report is expected to be published in mid-2014.

2 0 1 4 F S O C / / Annual Report108
6.4.4 Other Interagency Data Initiatives
Interagency Data Inventory
In January 2014, the OFR published an excerpt of its interagency data inventory for describing data that the
Council member agencies collect from financial institutions. The inventory described almost 500 separate
forms currently used in regulatory oversight by Council member agencies. The inventory is intended to
help the OFR and member agencies identify potential gaps in data collection, with the goal of enabling an
evaluation of what, how, and by whom data is being reported. The inventory may also facilitate identification
of any overlaps in collections.
Private Fund Data
In July 2013, the SEC released a report on the use of data and records on private investment funds derived
from the new Form PF. The SEC has received a complete set of initial filings from registered investment
advisers on the form. As of mid-2013, private funds were reporting on more than $7 trillion in regulatory
AUM with Form PF. The Council and OFR are using certain Form PF data to evaluate potential risks
to financial stability. The OFR published preliminary results from analysis of Form PF data in its 2013
annual report, including analysis of leverage and VaR. SEC staff has begun to assess the quality of the
data collected—including evaluating the consistency of filer responses and differences in approaches or
assumptions made by filers—and has used the data to obtain information regarding certain private funds.
The SEC also has identified a number of uses of the information, including incorporating Form PF data into
SEC analytical tools, using Form PF information to monitor the risk-taking activities of investment advisers
to private funds, conducting pre-examination due diligence and in risk identification, and providing certain
aggregated Form PF data to IOSCO regarding large hedge funds to offer a more complete overview of the
global hedge fund market.
6.5 Council Activities
6.5.1 Determination of Nonbank Financial Companies to be Supervised by the Federal Reserve
One of the Council’s statutory authorities is to determine that a nonbank financial company will be subject
to supervision by the Federal Reserve and enhanced prudential standards if the company’s material financial
distress—or the nature, scope, size, scale, concentration, interconnectedness, or mix of its activities—could
pose a threat to U.S. financial stability. The Council’s authority to make these determinations is an important
tool to help mitigate potential threats posed by these companies to U.S. financial stability. The Dodd-Frank
Act sets forth the standard for the Council’s determinations regarding nonbank financial companies and
requires the Council to take into account 10 specific considerations when evaluating those companies.
To further inform the public of the Council’s framework and processes for assessing nonbank financial
companies, the Council issued a rule and interpretive guidance, beginning with the release of an advance
notice of proposed rulemaking at its first meeting in October 2010.
The Federal Reserve issued a final rule in April 2013 establishing the requirements for determining if a
company is “predominantly engaged in financial activities.” A company that falls within this definition is
eligible for a determination by the Council that the company could pose a threat to U.S. financial stability
and will be supervised by the Federal Reserve and subject to enhanced prudential standards. For the
purposes of Title I of the Dodd-Frank Act, a company is predominantly engaged in financial activities if 85
percent or more of its revenues or assets are derived from or related to activities that are “financial in nature”
under the Bank Holding Company Act.
In 2013, the Council made its first determinations regarding nonbank financial companies. The Council
voted in July to make final determinations regarding American International Group (AIG) and General

109Regu lato r y Deve lopments; Counc i l Ac t i v i t i es
Electric Capital Corporation. In September, the Council voted to make a final determination regarding
Prudential Financial. The basis for each final determination is available on the Council’s website.
The Council’s three determinations in 2013 followed the process laid out in the Council’s rule and guidance.
Each of the nonbank financial companies subject to a Council determination received a letter in June 2013
informing it that the Council had made a proposed determination and providing it with an explanation of
the basis of the Council’s proposed determination. Each company then had 30 days to request a hearing
to contest the Council’s proposed determination. Neither AIG nor General Electric Capital Corporation
requested a hearing. The Council conducted a hearing for Prudential Financial in July 2013.
6.5.2 Risk Monitoring and Regulatory Coordination
The Dodd-Frank Act charges the Council with responsibility to identify risks to U.S. financial stability,
promote market discipline, and respond to emerging threats to the stability of the U.S. financial system.
The Council also has a duty to facilitate coordination among member agencies and other federal and state
agencies regarding financial services policy and other developments. The Council regularly examines
significant market developments and structural issues within the financial system. For example, over the past
year, the Council has considered issues such as market volatility, the government shutdown and debt ceiling
impasse, interest rate risk, economic developments in Europe and emerging economies, housing finance
reform, the NASDAQ trading halt in August 2013, and risks to financial stability arising from cybersecurity
vulnerabilities. The Council will continue to monitor potential threats to financial stability, whether from
external shocks or structural weaknesses, and to facilitate coordination among federal and state agencies.
To facilitate this risk monitoring process, the Council established the Systemic Risk Committee (SRC),
composed primarily of member agency staff in supervisory, monitoring, examination, and policy roles. The
SRC serves as a forum for member agency staff to identify and analyze potential risks that may extend beyond
the jurisdiction of any one agency.
The OFR plays an important role in the activities of the Council. In 2013, the OFR reported regularly to the
SRC on developments in financial markets. In its 2013 annual report, the OFR issued a prototype Financial
Stability Monitor that assesses risks to the financial system based on five areas of risk: macroeconomic,
market, credit, funding and liquidity, and contagion.
6.5.3 Study on Asset Management and Financial Stability
In September 2013, the OFR released a report requested by the Council that provided an overview of
the asset management industry and an analysis of how asset management firms and their activities could
introduce vulnerabilities into the financial system. The Council had requested the report to inform its
analysis of potential threats asset management activities or firms might pose to financial stability.
The OFR’s report noted that asset management activities and firms differ from commercial banking and
insurance activities in that asset managers act primarily as agents, managing assets on behalf of clients as
opposed to investing on the managers’ behalf. Nonetheless, the report stated that some asset management
activities could give rise to threats to financial stability if improperly managed or accompanied by the use
of leverage, liquidity transformation, or funding mismatches. For example, the report discussed risk-taking
in separately managed accounts and the reinvestment of cash collateral in securities lending transactions.
The report also noted that significant data gaps hamper analysis of the industry. The Council is considering
potential next steps with regard to asset management.

2 0 1 4 F S O C / / Annual Report110
6.5.4 Operations of the Council
The Dodd-Frank Act requires the Council to convene no less than quarterly. In 2013, the Council met 10
times. The meetings bring Council members together to discuss and analyze market developments, threats to
financial stability, and financial regulatory issues. While the Council’s work frequently involves confidential
supervisory and sensitive information, the Council is committed to conducting its business as openly and
transparently as practicable. Consistent with the Council’s transparency policy, the Council opens its
meetings to the public whenever possible. The Council held a public session at two of its meetings in 2013.
Approximately every two weeks, the Council’s Deputies Committee, which is composed of senior
representatives of Council members, convenes to discuss the Council’s agenda and to coordinate and
oversee the work of the SRC and the five other functional committees. The other functional committees are
organized around the Council’s ongoing statutory responsibilities: (1) identification and consideration of
nonbank financial companies for designation; (2) identification and consideration of FMUs and payment,
clearing, and settlement activities for designation; (3) making recommendations to primary financial
regulatory agencies regarding heightened prudential standards for financial firms; (4) consultation with the
FDIC on OLA and review of the resolution plan requirements for designated nonbank financial firms and the
largest BHCs; and (5) the collection of data and improvement of data-reporting standards.
The ability to share data among Council members with confidence that the data will be maintained securely
is important to the Council. To help accomplish this objective, the Council’s Data Committee developed a
framework that builds on existing standards and agreements to enable the secure sharing of data among
Council member agencies. Each agency retains the discretion to determine how to apply the framework
internally, based on the unique nature of that agency’s organization or mission.
In 2013, the Council adopted its fourth budget. In addition, the Council fulfilled its obligations under the
Freedom of Information Act (FOIA) by responding to FOIA requests in accordance with the Council’s FOIA
regulation, and complied with the Council’s transparency policy by conducting its business in an open and
transparent manner whenever possible.
6.5.5 Section 119 of the Dodd-Frank Act
Section 119 of the Dodd-Frank Act provides that the Council may issue non-binding recommendations to
member agencies on disputes about the agencies’ respective jurisdiction over a particular BHC, nonbank
financial company, or financial activity or product. (Certain consumer protection matters, for which another
dispute mechanism is provided under Title X of the Act, are excluded.) To date, no member agency has
approached the Council to resolve a dispute under Section 119.

111
The Council seeks to maximize transparency and
accountability while also protecting the market-
sensitive and confidential information that it regularly
considers. Achieving this balance has been a priority
for the Council since its first meeting in October
2010, when it adopted its publicly available bylaws and
transparency policy. The Council opens its meetings to
the public whenever possible and will continue to seek
opportunities for public engagement. For example, in
December 2013, for the first time, a representative from
the private sector presented at a public meeting of the
Council.
The Council undertook a review of its governance and
transparency policies in 2013 and early 2014 to help
ensure that these policies remain appropriate. The
review included consideration of the practices of other
organizations with similar structures, memberships, or
responsibilities as the Council. As a result of this work,
the Council is considering several enhancements to
its transparency policy and the adoption of bylaws for
its Deputies Committee. These efforts are intended
to help the Council achieve its goal of maximizing
transparency and accountability, while continuing to
protect the confidentiality of sensitive information. Some
of the changes would formalize or expand on existing
practices of the Council, such as providing public notice
at least seven days before all regularly scheduled Council
meetings and releasing a brief summary of the topics
discussed immediately after each meeting, in order
to provide the public with information about Council
proceedings well in advance of the release of the official
minutes for each meeting.
The Deputies Committee bylaws would further clarify
the purpose, duties, and composition of the committee.
Information about the Council’s governance is available
at www.fsoc.gov.
BOX G: Governance and Transparency
Regu lato r y Deve lopments; Counc i l Ac t i v i t i es

113Potent ia l Emerg ing Threats
7.1 Risk of Reliance Upon Short-Term Wholesale Funding
The risk of fire sales continues to be a major
source of financial instability in the tri-party
repo market. This instability is particularly
acute because of the large size of the tri-party
repo market and the potential vulnerability
emanating from liquidity pressures that
could force many investors to sell assets
simultaneously.
Repos and securities borrowing transactions
provide a means for participants to enter
into short sales and broker-dealers to meet
their settlement obligations. The tri-party
repo market is used by broker-dealers to
finance their securities inventories and client
securities. Funding in this market is primarily
provided by MMFs, securities lenders, and
other institutional cash investors such as
mutual funds, insurance companies, corporate
treasurers, and state and local government
treasurers.
There are two types of fire-sale risk: Pre-
default fire sales occur when a dealer begins
to lose access to market sources of funding
and must sell its securities quickly. Post-default
fire-sales occur when a dealer defaults and its
investors receive its repo collateral in lieu of
cash repayment, and sell that collateral in an
uncoordinated and rapid manner.
Large broker-dealers’ tri-party repo books
range between $100 and $150 billion. The
collateral is mainly government securities, but
the size of these positions can dwarf the amount
a single investor could expect to sell without
pushing prices lower on a given day. The
liquidation risk is even greater for less-liquid,
lower quality collateral.
7 Potential Emerging Threats
MMFs and securities lenders constitute more than
half of the investor base in tri-party repo. These
firms are vulnerable to same-day calls for liquidity,
creating strong pressure to sell assets quickly
if needed to generate that liquidity. MMFs can
experience runs when perceived by shareholders to
have worrisome risk exposures. This vulnerability
was evident following the bankruptcy of Lehman
Brothers, when investors withdrew approximately
$300 billion (10 percent of assets) from prime
MMFs in a couple of days. Lenders of securities
typically include mutual funds, pensions, insurers,
and other asset managers that own securities
and can enhance returns by lending securities.
Because most securities lending is done against
cash collateral, securities lenders, or their agent
often hold large pools of cash collateral, which they
reinvest to enhance their return. Most securities
lending is done on an open maturity basis, which
means that the lender of a security has to return the
cash collateral as soon as the borrower returns the
security, and can face the need to generate liquidity
quickly to make that return.
Pre- and post-default fire sales require different
risk mitigants. Regulators of broker-dealers can
examine firms to assess their management of
rollover risk, the maturity of their repo books,
their single-day concentrations, and their capital
and liquidity resources. But no single regulator has
an ability to impose a coordination mechanism to
support orderly liquidations across all investors in
the market. Market participants will be critically
important in defining a solution to this collective
action problem.
7.2 Developments in Financial Products, Services, and Business Practices
The financial system is constantly evolving. New
products, services, and business practices are being
developed, and existing products are undergoing
changes or being used in new ways or with greater
frequency. These changes can occur for a variety

2 0 1 4 F S O C / / Annual Report114
of reasons, including improvements in technology
that make new practices possible, new or changing
regulations, and competition between financial
institutions for customers.
Financial evolution provides a number of benefits to
the financial system. Investors and consumers gain
access to new products. New products and services
also may serve the needs of financial institutions.
Along with these benefits come new challenges
to supervisors and regulators. For example, as
regulators institute new regulations, products or
services are often developed that attempt to weaken
the effectiveness of these regulations. In other
cases, activities may move outside of the regulatory
perimeter or move from a heavily regulated entity
to an entity that is less regulated. Still, other
innovations may result in products or services where
the interests of the provider are not aligned with the
interests of the consumer.
While at times it is possible to evaluate the benefits
of an innovation early on, more often than not it is
difficult to determine whether an innovation will
be beneficial to the financial system. As a result,
authorities are confronted with the need to make a
judgment about the potential net benefits of a new
practice. Because it is impossible to foresee how even
seemingly beneficial innovations will ultimately be
utilized, that judgment can be very difficult.
An example may shed some light on this difficult
determination. CDS were introduced in the early
1990s. CDS allow the buyers of the contracts to
transfer the credit risk associated with fixed income
products to the sellers of the contracts. The ability
to set a market price for the credit risk of a fixed
income product was an important, positive change
for financial markets, and when the market was
relatively small, few questioned the product. The
market grew and evolved until the notional value of
CDS contracts outstanding was over $60 trillion in
2007, and CDS were being written on increasingly
complex structured products. Concerns arose
about lack of transparency, flaws in record keeping,
and the misjudgment of risk that some market
participants appeared to have with respect to their
CDS positions. Ultimately, some of these issues
contributed to the problems that led to the federal
bailout of AIG during the financial crisis.
The changing landscape of the post-financial crisis
world has fostered many innovations. What follows
are examples of developments in products, services,
and business practices that Council member
agencies are currently aware of and are monitoring
so as to understand the potential benefits and risks.
We list these in order to illustrate the many ways
in which innovation is manifested in the current
financial landscape and the need for Council
member agencies to remain vigilant.
• MSRs are increasingly being transferred
to nonbank mortgage servicing companies.
While the CFPB and state regulators have some
authority over these companies, many of them
are not currently subject to prudential standards
such as capital, liquidity, or risk management
oversight. Further, in many cases, mortgage
investors’ ability to collect on mortgages is
dependent on a single mortgage servicing
company, where failure could have significant
negative consequences for market participants.
• Banks are building in optionality to the money
market instruments they issue to raise funding.
Some instruments give investors the option
to put paper back to the bank ahead of the
maturity date. Others allow the bank to call the
paper prior to its scheduled maturity. These
options satisfy investors’ needs for liquidity, but
they serve other purposes as well. For example,
some institutions have been issuing debt with
an embedded call option, despite the additional
cost. The willingness to bear this cost appears to
be driven by these institutions’ belief that they
do not need to hold liquid assets against these
liabilities provided they call them 30 or more
days prior to maturity. However, to the extent
that this practice creates expectations of future
callbacks, a deviation from this practice can
be interpreted as a negative signal by market
participants.
• High demand for single-family rental properties
and low price-to-rent ratios appear to have

115
7.3 Risk-Taking Incentives of Large, Complex, Interconnected Financial Institutions
Historically, when large, complex, interconnected
financial institutions became distressed, the official
sector often intervened to maintain financial
stability. In the financial crisis of 2008, the official
sector, including the Federal Reserve, Treasury,
and FDIC, provided liquidity and solvency support
to some of the largest U.S. financial institutions.
Past support can engender expectations of future
support, and such expectations provide incentives
for further increases in size, interconnectedness,
and complexity. When market participants,
including bond investors, uninsured depositors, and
other counterparties, expect institutions to receive
support, they will not correctly price risk when
lending to and transacting with these institutions.
This will incentivize large institutions to take on
excessive risk, and put pressure on competing firms
to do likewise.
The Dodd-Frank Act explicitly addresses and
attempts to mitigate the incentives and abilities of
large, complex, interconnected financial institutions
to engage in excessive risk-taking through a
combination of policies.
1. The Act limits the ability of the Federal Reserve
to provide extraordinary support to individual
institutions.
2. The Act requires the Federal Reserve to adopt
enhanced prudential standards for the largest
BHCs and designated nonbank financial
companies (see Section 6.1.1). The stringency
of these requirements must increase with the
size and complexity of the firm. In addition, the
Dodd-Frank Act requires the Federal Reserve
to impose a debt-to-equity limit on companies
the Council has determined pose a grave threat
to financial stability. On February 18, 2014, the
Federal Reserve adopted final rules establishing
enhanced prudential standards for large BHCs
and FBOs. The final rule also requires a FBO
with a significant U.S. presence to establish an
intermediate holding company over its U.S.
subsidiaries. The Federal Reserve is continuing
attracted new investors to the single-family
rental property market. Late last year, the first
securitization of income from single-family
rental properties was issued. However, since
developments in this area are new, there is
uncertainty about how they will impact the
housing finance market, renters, and investors.
• In the insurance industry, life insurance
companies have increasingly used affiliated
captive reinsurers to address perceived
redundancies in statutory reserves, and for
other reasons. However, some state insurance
regulators have expressed concern about this
practice and how it affects the overall reserve and
capital levels of the company.
• Pension plans are transferring their exposure to
longevity risk to the insurance industry. In some
instances, both the asset risk and the longevity
risk are transferred to an insurance company.
In other instances, pension plans are keeping
the asset risk but transferring the longevity risk
outright to the insurance industry. This business
migration moves risk between spaces with
different regulations. While this migration has
the potential to provide significant benefits to
pension plan participants as well as the insurance
industry, it also has the potential of transferring
significant amounts of risk to the insurance
industry.
• Some asset managers are now providing
indemnification to securities lenders as part of
their securities lending business. There are likely
benefits for asset managers from combining
indemnification provision with securities lending,
but there also is the potential for enhanced
risks. Unlike banks, asset managers are not
required to set aside capital when they provide
indemnification. Also, although asset managers
have access to management fees, they do not
have access to banks’ stable deposit funding
base. Consequently, the indemnification that
asset managers provide may be a source of stress
on their own balance sheets, while at the same
time resulting in lower protection for the lenders
relative to indemnities provided by banks.
Potent ia l Emerg ing Threats

2 0 1 4 F S O C / / Annual Report116
to develop single counterparty credit limits
and early remediation requirements for both
large BHCs and FBOs.
3. Title I of the Act requires certain companies
to develop and submit to the Federal Reserve
and the FDIC their own plan for rapid and
orderly resolution under the Bankruptcy
Code in the event they experience material
financial distress or failure. Title II of the
Act authorizes the FDIC to resolve financial
companies whose failure and resolution
under otherwise applicable law would have
serious adverse effects on U.S. financial
stability. The FDIC is developing a strategic
approach, referred to as SPOE, to carry out
its OLA for resolving a financial company.
On December 10, 2013, the FDIC Board
approved a Federal Register notice for public
comment that provides greater detail on
the SPOE strategy and discusses key issues
that will be faced in a financial company’s
resolution (see Section 6.1.4). Additionally,
the Federal Reserve is considering adopting
a proposal that would require the largest,
most complex U.S. banking firms to
maintain a minimum amount of long-term
unsecured debt outstanding at the holding
company level.
During 2013, the largest U.S. financial
institutions continued to reduce their
complexity. For example, they now hold fewer
assets where fair value measurement is based on
unobservable inputs (level 3 assets), one of the
measures used to identify global systemically
important banks (Chart 7.3.1). Similarly, they
continued to reduce their interconnectedness,
as measured by the estimated size of the fire-
sale externalities they would impose on the
rest of the system if they were subject to an
adverse shock to their assets or equity capital
(Chart 7.3.2). Some of them increased their
size further, but at a slower pace than during
the pre-crisis period. Additionally, since the
passage of the Dodd-Frank Act, certain rating
agencies have lowered their assessments of the
likelihood of government support. Moody’s
assessment of the probability that a bank will Source: FRBNY
4
6
8
10
12
14
16
18
4
6
8
10
12
14
16
18
2001 2003 2005 2007 2009 2011 2013
US BancorpMorgan Stanley
Goldman Sachs
Index Index
Wells Fargo
As Of: 2013 Q4
Citigroup JPMorgan
Bank of America
Note: Connectedness measures illiquidity concentration; it depends on whether an institution’s illiquid assets are also widely held in the system. Lower connectedness implies smaller fire-sale externalities when banks suffer shocks. The Bank of New York merged with Mellon Financial in 2007, hence the break.
Bank of New York Mellon
7.3.2 Connectedness
Source: FRBNY
0
2
4
6
8
10
12
0
2
4
6
8
10
12
2007 2008 2009 2010 2011 2012 2013
US Bancorp
Morgan StanleyGoldman Sachs
Percent Percent
Wells Fargo
As Of: 2013 Q4
Citigroup
Bank of New York Mellon
JPMorgan
Bank of America
Note: Level 3 assets as a percent of total assets. Level 3 assets are assets whose fair value cannot be determined by using observable inputs.
7.3.1 Level 3 Assets

117
receive support from the official sector or
the parent corporation in times of stress has
declined for most of the largest banks after the
passage of Dodd-Frank Act (Chart 7.3.3). Fitch’s
assessment of the likelihood that a bank will
receive support from the official sector in times
of stress depicts a similar picture (Chart 7.3.4).
However, both rating agencies are still of the
opinion that there is some chance that the
official sector will provide support to the largest
banks if they become financially distressed
(Charts 7.3.3, 7.3.4).
It is possible that these remaining expectations
of official sector support reflect the incomplete
state of Dodd-Frank Act implementation.
To the extent that this is the case, the full
implementation of the orderly resolution facility
and the phasing in of enhanced prudential
standards in coming years should help reduce
remaining perceptions of government support
to large, complex, interconnected financial
institutions.
7.4 Reliance upon Reference Rates as a Vulnerability
As discussed in the Council’s 2013 annual
report, the problems with USD LIBOR reflect
several interrelated structural factors including
the decline in unsecured interbank markets,
the incentives to manipulate rates submitted
to reference rate panels owing to the vast scale
of derivatives tied to the reference rate, and
the dominance of instruments tied to LIBOR
in terms of market liquidity. Reliance on USD
LIBOR creates vulnerabilities that could pose
a threat to market integrity, the safety and
soundness of individual financial institutions,
and to U.S. financial stability. First, a reference
rate that is not anchored in observable
transactions or that relies overly on transactions
in a relatively low-volume market increases
the incentives and potential for manipulative
activity. Second, the current and prospective
levels of activity in unsecured interbank markets
raise the risk that continued production of
LIBOR might not be sustainable. The cessation
0
2
4
6
8
0
2
4
6
8
2007 2008 2009 2010 2011 2012 2013 2014
Notches Notches
Citibank
Bank of America
JPMorgan Chase BankBank of
New York Mellon
Wells Fargo Bank
U.S. Bank
As Of: Mar-2014
Source: Moody’s Analytics, FRBNY calculations
Note: Uplift is defined as the difference between Moody’s long-term issuer rating and Moody’s bank financial strength rating, which provides an estimate of the effect of implicit guarantees and external support.
2007 2008 2009 2010 2011 2012 2013 2014
SupportHigh
Med.
Low
Source: Fitch Ratings
Support
Citibank
Bank of America JPMorgan
Chase Bank
Bank of New York
MellonWells Fargo Bank
U.S. Bank
As Of: Mar-2014
Note: Support Rating Floors (SRFs) reflect Fitch’s view about the likelihood an entity will receive extraordinary government support in case of need.
High
Med.
Low
7.3.3 Moody’s Systemic Support Uplift
7.3.4 Fitch Support Rating Floors
Potent ia l Emerg ing Threats

2 0 1 4 F S O C / / Annual Report118
of such a heavily used-reference rate would pose
substantial legal risks and could cause substantial
disruptions to and uncertainties around the large
gross flows of LIBOR-related payments and receipts
between financial institutions.
Manipulative Activity in Interest Rate Benchmarks
Since the Council’s 2013 annual report, the CFTC
issued orders bringing and settling charges of
manipulation, attempted manipulation, and
false reporting against Rabobank and ICAP, an
interdealer broker. In total, five financial institutions
have now settled with the CFTC over charges of
benchmark interest rate manipulation, paying
fines and penalties of nearly $3 billion. Globally,
penalties paid related to benchmark interest rate
manipulation exceed $6 billion.
Reform Efforts in Interest Rate Benchmarks
Since the Council’s 2013 annual report, official
sector efforts to strengthen financial market
benchmarks have made substantial progress.
The IOSCO Task Force on financial market
benchmarks published its final report in July 2013
establishing principles of governance, quality, and
accountability for all financial benchmarks. IOSCO
intends to review the extent to which benchmark
administrators, within an 18-month timeframe, have
implemented the principles.
In June 2013, the FSB established an Official Sector
Steering Group (OSSG) comprised of relevant
central banks and regulatory agencies including the
Federal Reserve and CFTC. The OSSG was tasked
with coordinating reviews of existing interest rate
benchmarks, encouraging the identification of
robust alternative benchmarks by the private sector,
and proposing strategies for transitioning to a new
benchmark. The OSSG is scheduled to provide its
analysis and recommendations to the FSB in June
2014.
The OSSG’s work has focused on LIBOR, the
EURIBOR and the Tokyo Interbank Offered Rate
(TIBOR). While some alternative to these rates
could include bank credit risk, other alternative
rates would be largely risk-free and potentially more
appropriate for use in derivatives transactions or
other products where credit risk plays a smaller role.
Using largely risk-free rates for these transactions
would lower the risks to financial institutions and
to financial stability from a further decline in
the unsecured interbank market, consistent with
the Council’s recommendations. Separating the
reference rate used for most derivatives from the
interbank market would also remove one of the
significant incentives to manipulate LIBOR and
would allow some users to select a reference rate
that is more appropriate for their purpose than the
current system in which the vast majority of contracts
reference LIBOR.
Concerns about Other Reference Rates
Since the Council’s 2013 annual report, concerns
about other financial benchmarks, including
swap rates and FX rates, have increased. These
benchmarks are used for valuing numerous
contracts and portfolios of assets. In various
countries, agencies, including the Department of
Justice in cooperation with U.S. financial regulators,
have begun to investigate charges of manipulation
of exchange rate benchmarks. Authorities are also
investigating charges of manipulation of ISDAfix,
a leading set of benchmarks for interest-rate-swap
rates produced by the ISDA.
These investigations serve as a reminder of the
prevalence of benchmark rates across financial
markets and of their integral importance to the
financial system. IOSCO intends to review the extent
to which its principles have been implemented
across a wide set of financial markets. In addition,
the FSB created a subgroup to undertake a
review of exchange rate benchmarks and market
practices in relation to their use. Conclusions
and recommendations from this review will be
transmitted by the FSB to the G-20 in November
2014.
7.5 Financial System Vulnerability to Interest Rate Volatility
The prolonged period of low interest rates and low
volatility has led financial institutions and investors
to search for yield. Low interest rates weigh on
earnings of banks, credit unions, broker-dealers and
insurance companies, thereby incenting companies

119
to September 2013 period, there was a significant
repricing of long-duration fixed-income assets.
The sharp rise in rates and volatility triggered
losses across fixed income investment strategies
and vehicles. Bond mutual funds experienced
large outflows; the agency mortgage REIT share
price index lost 25 percent; risk parity funds
posted record losses; and EMs’ financial assets sold
off broadly. While the rise in rates last year was
large by historical standards, it did not create any
disruptions to the intermediation function of the
financial system, or more broadly to the banking
and insurance sectors. However, investors did suffer
sizeable losses. In addition, as explained in section
5.1.4, the weakening in housing starts in the latter
part of 2013 has largely been attributed to the rise in
mortgage rates last year.
Despite the relatively benign impact on financial
stability of last year’s increase in long-term interest
rates, a sharp increase in interest rate volatility still
poses some potentially important threats to financial
stability. The first threat is that a bigger interest-
rate shock might still occur. While a larger shock is
less likely, given the normalization of rates that we
have seen so far, it can certainly not be ruled out.
Moreover, the leveraged strategies highlighted above
leave investors potentially exposed to sizable losses
should a sharp jump in yields materialize, and such
losses could force institutions to liquidate positions,
pushing yields yet higher.
A second concern with interest rate volatility risk
relates to the recent growth in floating rate loans
and the loosening of underwriting standards. Since
most leveraged lending is done with floating rate
instruments and borrowers have high levels of debt,
a sharp rise in short term interest rates could also
have significant adverse effects to these borrowers’
credit risk and possibly their credit holders. In
addition, since the crisis, some banks have combined
floating rate lending with market-based pricing,
whereby they tie loans’ credit spreads to borrowers’
CDS spreads. This practice has the potential to
create an amplifying mechanism for interest-rate
shocks that may ultimately have significant effects
on borrowers’ credit risk and by extension on their
creditors.
Potent ia l Emerg ing Threats
to seek higher-yielding investments. The ability of
pension and retirement funds to meet their long-
term liabilities is also under pressure, incenting
them to seek more yield.
Investors have responded to the low interest
rate environment in different ways. Some have
extended maturities or invested in lower-quality
credit, or sought ways to further enhance returns
with leverage. While some leveraged strategies and
investment vehicles have nearly disappeared since
the end of the financial crisis, others have witnessed
a large growth or resurgence. Among fixed income
mutual funds, high yield and leveraged loan
funds have experienced record inflows. In equity
markets, agency mortgage REITs experienced
substantial inflows of funds in the years after the
crisis. Furthermore, hedge fund products such as
risk parity funds—which hold a leveraged position
in fixed income and an unlevered position in
equities so as to achieve the same total volatility in
each of those two asset classes—have continued
to be popular. Issuance of CLOs is at record
highs. Additionally, higher yields and stronger
economic growth have fueled investments in EM
bonds, pushing flows between 2009 and early
2013 to record high levels. While each of these
developments is likely due to a range of factors,
including the economic recovery and an increase in
risk appetite, low interest rates have probably played
a role.
Financial institutions also have responded to the
low interest rate environment. Some banks have
extended their portfolios’ durations, and eased
their loan underwriting standards, discounting
risk when setting interest rates, and reducing the
incidence of covenants. Banks also have increased
the volume of leveraged loans (see Section 5.1.1).
Insurance companies have adjusted their investment
portfolios by moderately increasing the duration of
their portfolio and investing in lower quality credit.
MMFs also have modestly increased the duration of
their fund portfolios (see Section 5.5.1) in order to
obtain higher yields.
Since the 2013 annual report, yields in fixed-income
markets increased significantly and volatility surged
during the summer (see Box C). During the May

2 0 1 4 F S O C / / Annual Report120
A continued low rate environment has additional
risks. It will continue to drain earnings of financial
institutions. Pension and retirement funds
historically relied on rate of return assumptions
based on earlier periods when interest rates were
between 5 and 10 percent. Therefore, pension and
retirement liabilities that were based on assumptions
of such higher returns will reduce the earnings
of these companies, as their assets will yield
substantially less in a low-interest rate environment.
For insurance companies, low rates affect
policyholder behavior in a way that reduces earnings.
In addition, low rates may make it difficult to sell
new policies for some products at a profit. In Japan,
a country that has experienced a prolonged period
of low rates for nearly 25 years, a number of insurers
went bankrupt, although low interest rates were only
one contributing factor in a complex process.
7.6 Operational Risks
Cybersecurity: Vulnerabilities to Attacks on
Financial Services
Cyber incidents can impact the confidentiality,
integrity, and availability of the information and
technologies essential to the provision of services,
resulting in financial, compliance, and reputation
risk. Moreover, cyber incidents that disrupt, degrade,
or impact the integrity and availability of critical
financial infrastructure could have consequences
on operations and efficiency. Such incidents can
undermine the confidence of consumers and
investors, and ultimately, threaten the stability of the
financial system.
In the past two years, several financial institutions
sustained distributed denial-of-service attacks to
their public-facing websites. The frequency of such
incidents declined over much of 2013. Other types
of cyber incidents have engendered public concern,
in part because of their increasing magnitude. For
instance, the recent theft of customer information at
Target and other retailers showed how skilled cyber
thieves could gain access to significant amounts of
credit and debit cardholder data. It also highlighted
the potential risks posed by the financial sector’s
interconnectedness with other major sectors of
the economy. Indeed, cyber criminals exploited
vulnerabilities at certain third-party and retailer
IT networks in order to gain access to customer
information that could be used illegally throughout
the broader retail payment system. Similar attacks
against other non-financial sector networks may
continue to pose threats to customers of financial
institutions.
Mitigating the evolving cyber threats, effectively
managing incidents, and promoting recovery efforts
are critical to maintaining public confidence and
reducing financial risk. These actions require a
close partnership between the public and private
sectors. In 2013, the Federal Financial Institutions
Examination Council established a cyber-related
working group to review cyber-related activities.
Financial institutions have been investing in ways
to protect their systems and infrastructure and
to design their core information and transaction
systems to make it harder for intruders to gain
access to valuable data. Financial services industry
associations have similarly been focused on
bolstering resilience. The Financial Services Sector
Coordinating Council, and the Financial Services
Information Sharing and Analysis Center are
the private sector’s principal representatives on
cybersecurity matters. Over the last year, these
two groups have collaborated with the Treasury
and members of regulatory, law enforcement, and
intelligence communities to identify measures
and best practices for disseminating timely and
actionable information.
The President’s Executive Order 13636 on
Improving Critical Infrastructure Cybersecurity
should help strengthen these activities. Among
its core provisions is the establishment of a new
cybersecurity framework to encourage private
institutions to strengthen cybersecurity practices as
well as an expedited process for obtaining security
clearances so that qualified employees at these
firms can gain access to sensitive information and
technical assistance from the government.
In addition, the Department of Justice and the
Federal Trade Commission in April 2014 released
an antitrust policy statement on the sharing of
cybersecurity information among industry, which is
designed to reduce uncertainty for those who want
to share ways to prevent and combat cyber attacks.

121
markets held a normal end-of-day close for NASDAQ-
listed securities.
The importance of system integrity in highly
interconnected markets is critical. When systems do
not operate as intended, there are consequences for all
market participants. Significant and frequent system
failures that impact financial markets can potentially
erode investor confidence and may threaten market
stability. During 2013 regulators took steps to address
such infrastructure concerns as well as continue to
address automated-trading system issues. In March
2013, the SEC proposed Regulation Systems Compliance
and Integrity to strengthen the automated systems
of important participants in the securities markets.
Additionally, in September 2013 the CFTC published
“Concept Release on Risk Controls and Systems
Safeguards for Automated Trading Environments” which
requested information about market practices relating
to the use of automated trading systems and possible
regulations that would have a direct impact on a wide
variety of market participants.
7.7 Foreign Economic and Financial Developments
Foreign risks can threaten U.S. financial stability and
economic activity. The nature of these risks has shifted
over the past year with many EMEs experiencing
considerable market stress, stemming from a number
of domestic challenges and changes in expectations
for U.S. monetary policy. EMEs have generally stronger
macroeconomic fundamentals and structural buffers
compared to previous crisis periods. China’s ability to
reform its economy while avoiding an abrupt slowdown
in growth remains critical for the global economy and
EMEs in particular. In the past year, potential risks in the
euro area and Japan have declined. Still, the potential for
negative shocks to the U.S. economy from strains abroad
remain significant.
There are a number of channels through which
international developments could spill over to the U.S.
economy and financial system. For example, weakness in
foreign growth and asset prices may translate into lower
demand for U.S. exports, weighing on U.S. growth. In
aggregate, EMEs import the largest share of U.S. goods
The financial sector is increasingly
dependent on many other industry sectors,
including energy, transportation, and
telecommunications. As a result, a cyber
event that disrupts or destroys any critical
infrastructure organizations in these areas
could have significant spillover effects on the
financial sector.
Market Infrastructure and Market Continuity
A number of different operational issues
affected the U.S. securities markets in 2013,
including network connectivity and hardware
failures, software changes and configuration
management errors, and human operational
errors. These issues led to the suspension of
trading on the affected exchanges for up to
several hours, the disruption of trade and quote
publication for stocks, the display of erroneous
trading data, broken trades, the execution
of expired orders, and the publication of
inaccurate quotes. Although none of these
incidents rose to the level of posing a threat to
financial stability, they do serve as important
reminders of the need to address operational
risks. Some notable events include:
• On August 20, 2013, an internal error in
Goldman Sachs’s trading systems caused the
firm’s non-actionable indications of interest
in certain options symbols to be treated as
actual orders to buy and sell options with
unintended limit prices. These orders were
sent to the options exchanges just prior
to the opening of trading. Some of the
resulting trades were cancelled according
to the obvious error rules of the options
exchanges, but Goldman Sachs took net
losses on the trades that were not cancelled.
• On August 22, 2013, NASDAQ halted
trading in all NASDAQ-listed securities for
more than three hours after the Unlisted
Trading Privileges Securities Information
Processor, the single source of consolidated
market data for Nasdaq-listed securities, was
unable to process quotes from the exchanges
for dissemination to the public. Once the
halt was lifted, trading resumed and the
Potent ia l Emerg ing Threats

2 0 1 4 F S O C / / Annual Report122
and service exports, with the largest importers
being Mexico and China. In addition to its
direct trade ties to the United States, China
also stands out for its significant contribution to
global growth—roughly one-quarter since 2010.
Trade links with Japan and the euro area are
sizeable as well (Chart 7.7.1).
Another channel for spillover is through
U.S. banks’ country exposures (Chart 7.7.2).
Exposures to EMEs totaled $786 billion,
including sovereign and private sector
exposures, as of the third quarter 2013
weighted toward private sector borrowers in
investment-grade rated countries, with the
largest exposures to Brazil, Mexico, Korea,
India, and China. U.S. banks’ total exposure
to Europe is even greater at $1.7 trillion, while
Japanese exposure totals $377 billion. Indirect
exposures are also important; some European
banking systems, including ones in the euro
area periphery, have larger exposures to EMEs
than do the U.S. banking system banks.
Emerging Markets
U.S. economic and financial linkages with
the emerging world in aggregate are sizeable,
but links with any one country appear
limited. While EME growth has decelerated
in recent years, and external vulnerabilities
have increased, risks of a broad EME crisis
appear contained. Past EME crises have often
come in clusters, reflecting changes in the
global environment, shared vulnerabilities,
and common external funding sources. The
downside risk is that conditions deteriorate,
reducing growth, which spurs further
reductions in capital flows to EMs and increases
global financial strains.
In some countries, market confidence in the
trajectory of domestic policy or politics has
declined, contributing to financial pressures.
Additionally, there are signs of increasing
vulnerability in the corporate sector in
some EMEs stemming from significant
borrowing and deteriorating profitability
in the context of weaker growth. However,
the level of vulnerability across the EMEs
0
2
4
6
8
10
12
14
16
18
0
2
4
6
8
10
12
14
16
18Percent Percent
Source: BEA, Haver Analytics
As Of: 2013 Q4
Note: Sum of exports from 2013 Q1 to 2013Q4 as a percent of total U.S. exports.
TotalExposure(Billions of
US$)
Cross-Border Claims(Billions of
US$)
ForeignOffice Claims
(Billions of US$)
Total Exposure Relative to
Tier 1 Capital (Percent)
Memo:Unused
Commitments(Billions of US$)
Europe 1686 955 513 150% 246
- Euro area 906 701 76 80% 134
Japan 377 134 225 33% 31
Total EME 786 387 378 70% 87
- China 88 53 33 8% 5
Source: FFIEC Country Exposure Report
As Of: Sep-2013
Note: EME exposures exclude financial centers. Euro area does not include data for Cyprus, Estonia, Latvia, Malta, or Slovenia, which are not publicly available.
7.7.2 Country Exposures of All U.S. Banks
7.7.1 Destination of U.S. Exports of Goods and Services

123
appears materially lower than in the run-up to
past crisis episodes. This reflects improved policy
frameworks, including flexible exchange rate
regimes, independent central banks, and generally
lower levels of government indebtedness. Moreover,
existing foreign reserves can cover years of maturing
debt in most EMEs, providing scope to ride out
periods of increasing market volatility and reduced
funding. Additionally, while foreign portfolio
inflows have surged since the global financial crisis,
the relative importance of stable foreign direct
investment flows in EMEs’ external funding has
also increased. Finally, EME banks generally have
stronger capital and liquidity positions and are
better managed and supervised than has historically
been the case.
China
Recent Chinese economic data suggest that activity
is decelerating, in line with the government’s
desire to slow credit expansion (see Section 4.4.2).
Given the difficulty in achieving a well-timed and
calibrated rebalancing, authorities will encounter
significant challenges in their attempts to shift
growth away from inefficient investment and
exports towards consumption. Authorities also face
a challenge in addressing liquidity risks and rapid
growth in off-balance sheet liabilities in the financial
sector, which contributed to elevated volatility in the
interbank money market in the second half of 2013.
China is set to gradually undertake a host of difficult
structural reforms, such as interest rate and capital
account liberalization. China’s strong external
position, however, provides an important buffer
against shocks.
Euro Area
Public sector debt burdens, at the periphery, are
projected to stabilize at high levels, leaving that part
of the euro area vulnerable to policy setbacks, shifts
in market sentiment, and eventually, rising interest
rates. The announcement of the ECB’s outright
monetary transactions (OMT) program effectively
served as a backstop to peripheral sovereign debt
markets and contributed to the sharp reduction
in peripheral spreads since June 2012. However,
the OMT itself is now subject to some uncertainty
following the decision by Germany’s constitutional
court to refer its case on the program’s legality to
the European Court of Justice, indicating that it
views the current program as non-compliant with
the EU Treaty.
Financial fragmentation within the euro area also
persists. The ECB’s comprehensive assessment of
the largest euro area banks will be an important test
for the new regulatory and supervisory framework
with implications for the credibility of the ECB
and confidence in euro area’s banks. Ensuring
adequate credibility and transparency regarding
methodology, risk exposures and results, given
limited clarity regarding available national and
regional backstops to address identified capital
shortfalls, will be important for the success of the
exercise.
7.8 Data Gaps and Data Quality
More than five years after the financial crisis,
regulators have made significant progress in
addressing financial data gaps. Regulators collect
real-time data from derivatives markets, detailed
loan- and position-level financial data from banks,
and data from MMFs and private funds.
However, gaps remain in the data that are available,
both to regulators and market participants. The
Council remains concerned about the risks of
funding runs and fire sales in wholesale funding
markets. Council members have highlighted
weaknesses in the scope and availability of data
that are available to regulators concerned with
monitoring these risks, particularly around repo
and securities lending activities. U.S. banking
regulators now have access to fairly detailed data
on tri-party repo and GCF repo transactions
through the two clearing banks that conduct all of
the domestic matching and settlement activity and
have this information for all of their customers.
However, regulators and policymakers currently
have no reliable, ongoing information on bilateral
repo market activity, which is more difficult to
collect because activity in this segment does not flow
through a settlement agent like tri-party and GCF
repo transactions do.
Potent ia l Emerg ing Threats

2 0 1 4 F S O C / / Annual Report124
There are similar data gaps regarding the securities
lending activities of financial institutions. Regulators
are still unable to fully monitor securities lending
transactions and the reinvestment of cash collateral.
It is difficult to know the depth of securities lending
in a particular issue, the counterparty exposures, or
the number of times that an issue has been re-lent.
The Dodd-Frank Act requires the SEC to adopt rules
increasing the transparency of information about
securities lending available to broker-dealers and
investors.
The lack of data standards governing legal entities,
instruments, and transactions continues to create
challenges for financial analysis, risk management,
supervision, and financial stability monitoring.
There has been important progress in rolling out
the LEI to precisely identify parties to financial
transactions. However, more work remains. Working
closely with Council member agencies, the OFR
is tasked with promoting financial data standards
and has taken a lead role in the rollout of the LEI.
Although the mandating of the LEI in the CFTC’s
SDR rules initially spurred the implementation of
the LEI, other regulators have only recently begun
to establish the LEI in regulatory reporting and
rulemakings.
An important development in 2014 is the continued
creation of SDRs and SBSDRs, which collect
and maintain confidential information about
transactions and make those data available to
regulators. However, under current rules the
repositories have significant discretion in how
they report the data. Without strong and common
standards, the data collected by repositories are
unlikely to bring the desired benefits to counterparty
analysis and financial stability monitoring. The
CFTC is working to improve data quality and data
standards in swaps data reporting with input from
the OFR. However, some U.S. authorities’ access
to these data remains a challenge due to legal and
other obstacles.

125Abbrev ia t ions
ABCP Asset-Backed Commercial Paper
ABS Asset-Backed Securities
AFS Available-for-Sale
AIG American International Group
AUM Assets Under Management
BCR Backstop Capital Requirements
BHC Bank Holding Company
BoE Bank of England
BoJ Bank of Japan
C&I Commercial and Industrial
CCAR Comprehensive Capital Analysis and Review
CCP Central Counterparty
CDS Credit Default Swap
CDs Certificates of Deposit
CFPB Bureau of Consumer Financial Protection
CFTC Commodity Futures Trading Commission
CLO Collateralized Loan Obligation
CMBS Commercial Mortgage-Backed Security
CoVaR Conditional Value-at-Risk
CP Commercial Paper
CRE Commercial Real Estate
Abbreviations

2 0 1 4 F S O C / / Annual Report126
CSP Common Securitization Platform
DFAST Dodd-Frank Act Stress Tests
DTCC Depository Trust and Clearing Corporation
DTI Debt-to-Income
ECB European Central Bank
EM Emerging Market
EME Emerging Market Economy
ETF Exchange-Traded Funds
ETP Exchange-Traded Product
EU European Union
EURIBOR Euro Interbank Offered Rate
FASB Financial Accounting Standards Board
FBO Foreign Banking Organization
FDIC Federal Deposit Insurance Corporation
FHA Federal Housing Administration
FHFA Federal Housing Finance Agency
FICO Fair Isaac Corporation
FIO Federal Insurance Office
FMU Financial Market Utilities
FOIA Freedom of Information Act
FOMC Federal Open Market Committee
FRBNY Federal Reserve Bank of New York
FSB Financial Stability Board
FSOC Financial Stability Oversight Council

127
FX Foreign Exchange
G-20 The Group of Twenty
GCF General Collateral Finance
GDP Gross Domestic Product
GSE Government-Sponsored Enterprise
G-SIFI Global Systemically Important Financial Institution
G-SII Global Systemically Important Insurer
HLA Higher Loss Absorbency
HUD U.S. Department of Housing and Urban Development
IAIS International Association of Insurance Supervisors
IASB International Accounting Standards Board
ICS Insurance Capital Standard
IMF International Monetary Fund
IOSCO International Organization of Securities Commissions
ISDA International Swaps and Derivatives Association
JGB Japanese Government Bond
LCR Liquidity Coverage Ratio
LEI Legal Entity Identifier
LIBOR London Interbank Offered Rate
MBS Mortgage-Backed Securities
MIDAS Market Information Data Analytics System
MMF Money Market Fund
MPC Monetary Policy Committee
MSPs Major Swap Participants
Abbrev ia t ions

2 0 1 4 F S O C / / Annual Report128
MSR Mortgage Servicing Rights
NAIC National Association of Insurance Commissioners
NAV Net Asset Value
NFIB National Federation of Independent Businesses
NIM Net Interest Margin
OCC Office of the Comptroller of the Currency
OFR Office of Financial Research
OLA Orderly Liquidation Authority
OMT Outright Monetary Transactions
OSSG Official Sector Steering Group
OTC Over-the-Counter
P/C Property and Casualty Insurance
PFMI Principles for Financial Market Infrastructures
QM Qualified Mortgage
QRM Qualified Residential Mortgage
REIT Real Estate Investment Trusts
Repo Repurchase Agreements
RESPA Real Estate Settlement Procedures Act
RMBS Residential Mortgage-Backed Securities
ROA Return on Average Assets
RWA Risk-Weighted Assets
S&P Standard and Poor’s
SBSDRs Security-Based Swap Data Repositories
SBSR Security-Based Swap Reporting

129
SDRs Swap Data Repositories
SEC Securities and Exchange Commission
SEF Swap Execution Facilities
SES Systemic Expected Shortfall
SLOOS Senior Loan Officer Opinion Survey
SPOE Single Point of Entry
SRC Systemic Risk Committee
TIBOR Tokyo Interbank Offered Rate
TILA Truth in Lending Act
U.S. GAAP Generally Accepted Accounting Principles
UMI Unique Mortgage Identifier
UPB Unpaid Balance
USD U.S. Dollar
VaR Value-at-Risk
VIX Chicago Board Options Exchange Volatility Index
WMP Wealth-Management Products
Abbrev ia t ions

131
Asset-Backed Commercial Paper
(ABCP)
Short-term debt that has a fixed maturity of up to 270 days and
is backed by some financial asset, such as trade receivables,
consumer debt receivables, securities, or auto and equipment loans
or leases.
Asset-Backed Security (ABS) A fixed income or other security that is collateralized by any type of
self-liquidating financial asset that allows the holder of the security
to receive payments that depend primarily on cash flows from the
assets.
Available-for-Sale (AFS) An accounting term for debt and equity securities that are
accounted for at fair value on firms’ balance sheets and are not
classified as trading securities or as held-to-maturity securities.
Changes in fair value for AFS securities are recognized in
stockholders’ equity as part of accumulated other comprehensive
income.
Base Money The sum of currency in circulation and reserve balances.
Basel III Common Equity Tier 1
ratio
A ratio which divides common equity Tier 1 by Basel III risk-
weighted assets.
Bilateral Repo Bilateral repos are repos between two institutions where
settlement typically occurs on a “delivery versus payment” basis.
More specifically, the transfer of the collateral to the cash lender
occurs simultaneously with the transfer of the cash to the collateral
provider.
Carry Trade An investment strategy involving borrowing at low interest rates to
purchase assets that yield higher returns.
Central Counterparty (CCP) An entity that interposes itself between counterparties to contracts
traded in one or more financial markets, becoming the buyer to
every seller and the seller to every buyer and thereby ensuring the
performance of open contracts.
Clearing Bank A BHC subsidiary that facilitates payment and settlement of
financial transactions, such as check clearing, or facilitates trades
between the sellers and buyers of securities or other financial
instruments or contracts.
Collateral Any asset pledged by a borrower to guarantee payment of a debt.
Glossary
Glossa r y

2 0 1 4 F S O C / / Annual Report132
Collateralized Loan Obligation
(CLO)
Securitization vehicles backed predominantly by commercial loans.
Collateralized Mortgage Obligation
(CMO)
An obligation of a bankruptcy remote special purpose vehicle with
claims to specific cash flows from a pool of MBS. The streams of
principal and interest payments on the MBS underlying loans are
distributed to the different classes of CMO interests, known as
tranches, according to a deal structure. Each tranche may have
different principal balances, coupon rates, prepayment risks, and
maturity dates.
Collateral Transformation In securities lending on a non-cash collateral basis, a party usually
swaps, or temporarily exchanges their lower quality assets, by
posting them as collateral for higher quality assets, such as
Treasury securities.
Commercial Mortgage-Backed
Security (CMBS)
A security that is collateralized by a pool of commercial mortgage
loans and makes payments derived from the interest and principal
payments on the underlying mortgage loans.
Commercial Paper (CP) Short-term (maturity of up to 270 days), unsecured corporate debt.
Common Securitization Platform
(CSP)
A common securitization infrastructure between Freddie Mac and
Fannie Mae for RMBS.
Comprehensive Capital Analysis
and Review (CCAR)
An annual exercise by the Federal Reserve to ensure that
institutions have robust, forward-looking capital planning
processes that account for their unique risks and sufficient capital
to continue operations throughout times of economic and financial
stress.
Conditional Value-at-Risk (CoVaR) The value-at-risk (VaR) of the financial system conditional on
institutions being in distress.
Consumer Price Index (CPI) A monthly index containing monthly data on changes in the prices
paid by urban consumers for a representative basket of goods and
services.
Convexity Event Risk Risk that an initial increase in long-term interest rates can be
significantly amplified by many MBS investors actively hedging
the duration of their MBS. Convexity events can result in rapid
changes in long-term interest rates, sharp increases in interest
rate volatility, and reduced liquidity in fixed income markets. See
Duration Hedging.

133
Credit Default Swap (CDS) A financial contract in which one party agrees to make a payment
to the other party in the event of a specified credit event, in
exchange for one or more fixed payments.
Credit Rating Agency A private company that evaluates the credit quality of debt
issuers as well as their issued securities and provides ratings
on the issuers and those securities. Many credit rating agencies
are Nationally Recognized Statistical Rating Organizations, the
largest of which are Fitch Ratings, Moody’s Investors Service, and
Standard & Poor’s.
Debt-to-Income (DTI) Ratio The ratio of debt payments to income for a borrower.
Defined Benefit (DB) Plan A retirement plan in which the cost to the employer is based on a
predetermined formula to calculate the amount of a participant’s
future benefit. In DB plans, the investment risk is borne by the plan
sponsor.
Defined Contribution (DC) Plan A retirement plan in which the cost to the employer is limited to the
specified annual contribution. In DC plans, the investment risk is
borne by the plan participant.
Distress Insurance Premium (DIP) A measure of systemic risk that integrates the characteristics of
bank size, default probability, and interconnectedness.
Dodd-Frank Act Stress Tests
(DFAST)
Annual stress tests required by Dodd-Frank for national banks and
federal savings associations with total consolidated assets of more
than $10 billion.
Duration The sensitivity of the prices of bonds and other fixed-income
securities to changes in the level of interest rates.
Duration Hedging A process of dynamically changing portfolio allocation to fixed
income instruments—such as Treasury securities or futures, or
interest rate swaps or swaptions—so as to limit fluctuation of the
portfolio interest rate duration.
Euro Interbank Offered Rate
(EURIBOR)
The rate at which Euro interbank term deposits are offered by one
prime bank to another prime bank within the euro area.
Exchange Traded Product (ETP) An investment fund whose shares are traded on an exchange.
ETPs offer continuous pricing, unlike mutual funds which offer only
end-of-day pricing. ETPs are often designed to track an index or a
portfolio of assets.
Glossa r y

2 0 1 4 F S O C / / Annual Report134
Federal Funds Rate The interest rate at which depository institutions lend balances
to each other overnight. The FOMC sets a target level for the
overnight federal funds rate, and the FRBNY then uses open market
operations to influence the overnight federal funds rate to trade
around the policy target rate or within the target rate range.
FICO Score A measure of a borrower’s creditworthiness based on the
borrower’s credit data; developed by the Fair Isaac Corporation.
Financial Market Infrastructure
(FMI)
A multilateral system among participating financial institutions,
including the operator of the system, used for the purposes of
recording, clearing, or settling payments, securities, derivatives,
or other financial transactions. Under the Dodd-Frank Act, certain
FMIs are recognized as FMUs.
Financial Market Utility (FMU) A Dodd-Frank defined entity, which, subject to certain exclusions,
is “any person that manages or operates a multilateral system
for the purpose of transferring, clearing, or settling payments,
securities, or other financial transactions among financial
institutions or between financial institutions and the person.”
Fire Sale The disorderly liquidation of assets to meet margin requirements
or other urgent cash needs. Such a sudden selloff drives down
prices, potentially below their intrinsic value, when the quantities to
be sold are large relative to the typical volume of transactions. Fire
sales can be self-reinforcing and lead to additional forced selling by
some market participants that, subsequent to an initial fire sale and
consequent decline in asset prices, may also need to meet margin
or other urgent cash needs.
Fiscal Consolidation Changes in government policy pertaining to taxes and spending
intended to reduce deficits and slow the pace of debt accumulation.
Fiscal Year Any 12-month accounting period. The fiscal year for the federal
government begins on October 1 and ends on September 30 of the
following year; it is named after the calendar year in which it ends.
Future A standardized contract traded over exchanges to buy or sell an
asset in the future.
General Collateral Finance (GCF) An interdealer repo market in which the Fixed Income Clearing
Corporation plays the role of intraday CCP. Trades are netted at the
end of each day and settled at the tri-party clearing banks.
See Tri-party Repo.

135
Government-Sponsored Enterprise
(GSE)
A corporate entity that has a federal charter authorized by law, but
that is a privately owned financial institution. Examples include
the Federal National Mortgage Association (Fannie Mae) and the
Federal Home Loan Mortgage Corporation (Freddie Mac).
Gross Domestic Product (GDP) The broadest measure of aggregate economic activity, measuring
the total value of all final goods and services produced within a
country’s borders during a specific period.
Haircut The discount, represented as a percentage of par or market value,
at which an asset can be pledged as collateral. For example, a
$1,000,000 bond with a 5 percent haircut would collateralize a
$950,000 loan. The purpose of a haircut is to provide a collateral
margin for a secured lender.
Held-to-Maturity An accounting term for debt securities held in portfolio and
accounted for at cost less any impairment, under the proviso that
the company has no intent to sell and it is more likely than not that
it will hold those securities to maturity.
Home Equity Line of Credit
(HELOC)
A line of credit extended to a homeowner that uses the home as
collateral.
High-Quality Liquid Asset Assets such as government bonds that are considered eligible as
liquidity buffers in Basel III’s LCR. High-quality liquid assets should
be liquid in markets during times of stress and, ideally, be central
bank eligible.
Household Debt Service Ratio An estimate of the ratio of debt payments to disposable personal
income. Debt payments consist of the estimated required payments
on outstanding mortgage and consumer debt.
Interest Rate Risk Management The management of the exposure of an individual’s or an
institution’s financial condition to movements in interest rates.
Interest Rate Swap A derivative contract in which two parties swap interest rate cash
flows on a periodic basis, referencing a specified notional amount
for a fixed term. Typically one party will pay a predetermined fixed
rate while the other party will pay a short-term variable reference
rate that resets at specified intervals.
Large-Scale Asset Purchases Purchases by the Federal Reserve of securities issued by the U.S.
government or securities issued or guaranteed by government-
sponsored agencies (including Fannie Mae, Freddie Mac, Ginnie
Mae, and the Federal Home Loan Banks) in the implementation of
monetary policy.
Glossa r y

2 0 1 4 F S O C / / Annual Report136
Legal Entity Identifier (LEI) A 20-digit alpha-numeric code that connects to key reference
information that enables clear and unique identification of
companies participating in global financial markets. The LEI
system is designed to facilitate many financial stability objectives,
including: improved risk management in firms; better assessment
of microprudential and macroprudential risks; expedition of orderly
resolution; containment of market abuse and financial fraud; and
provision of higher-quality and more accurate financial data.
Level 3 Assets Assets where fair value measurement is based on unobservable
inputs.
Leveraged Buyout An acquisition of a company financed by a private equity
contribution combined with borrowed funds, with debt comprising a
significant portion of the purchase price.
Leveraged Loan Loans extended to a borrower who already has significant amounts
of debt or whose debt is not rated investment-grade by credit rating
agencies.
London Interbank Offered Rate
(LIBOR)
The interest rate at which banks can borrow unsecured funds from
other banks in London wholesale money markets, as measured by
daily surveys. The published rate is a trimmed average of the rates
obtained in the survey.
Liquidity Coverage Ratio (LCR) A Basel III standard to ensure that a bank maintains adequate
unencumbered, high-quality liquid assets to meet its anticipated
liquidity needs for a 30-day horizon under a liquidity stress
scenario specified by supervisors.
Loan-to-Value Ratio The ratio of the amount of a loan to the value of the asset that
the loan funds, typically expressed as a percentage. This is a key
metric when considering the level of collateralization of a mortgage.
Major Security-Based Swap
Participant
A person that is not a security-based swap dealer and maintains a
substantial position in security-based swaps, creates substantial
counterparty exposure, or is a financial entity that is highly
leveraged and not subject to federal banking capital rules.
Major Swap Participant (MSP) A person that is not a swap dealer and maintains a substantial
position in swaps, holds outstanding swaps that create substantial
counterparty exposure, or is a highly leveraged financial entity
which is not otherwise subject to capital requirements.
Maturity Gap The weighted-average time to maturity of financial assets less the
weighted-average time to maturity of liabilities.

137
Money Market Mutual Fund
(MMF)
A type of mutual fund that invests in short-term, liquid securities
such as government bills, CDs, CP, or repos.
Mortgage Servicing Company A company that acts as an agent for mortgage holders by collecting
and distributing mortgage cash flows. Mortgage servicers
also manage defaults, modifications, settlements, foreclosure
proceedings, and various notifications of borrowers and investors.
Mortgage Servicing Rights (MSRs) The right to service and collect fees on a mortgage.
Mortgage-Backed Security (MBS) ABS backed by a pool of mortgages. Investors in the security
receive payments derived from the interest and principal payments
on the underlying mortgages. This term typically applies to MBS
issued or guaranteed by the GSEs; these securities can also be
called “agency MBS.”
Municipal Bond A bond issued by states, cities, counties, local governmental
agencies, or certain nongovernment issuers to finance certain
general or project-related activities.
Net Asset Value (NAV) An investment company’s total assets minus its total liabilities.
Net Interest Margin (NIM) Net interest income as percent of interest-earning assets.
Open Market Operations The purchase and sale of securities in the open market by a central
bank to implement monetary policy.
Option A financial contract granting the holder the right but not the
obligation to engage in a future transaction on an underlying
security or real asset. The most basic examples are an equity call
option, which provides the right but not the obligation to buy a
block of shares at a fixed price for a fixed period, and an equity put
option, which similarly grants the right to sell a block of shares.
Outright Monetary Transactions
(OMT)
An ECB program under which secondary market purchases of
sovereign bonds can be made, with the aim of safeguarding
appropriate monetary policy transmission and the singleness of
the monetary policy. A necessary condition for OMT is a support
agreement under which the European Financial Stability Facility or
European Stability Mechanism program can make primary market
purchases of sovereign debt. Such an agreement would include a
range of policy conditions.
Over-the-Counter (OTC) A method of trading that does not involve an organized exchange.
In OTM markets, participants trade directly on a bilateral basis,
typically through voice or computer communication and often with
certain standardized documentation with counterparty-dependent
terms.
Glossa r y

2 0 1 4 F S O C / / Annual Report138
Prudential Regulation Regulation aimed at ensuring the safe and sound operation of
financial institutions, set by both state and federal authorities.
Public Debt All debt issued by Treasury and the Federal Financing Bank,
including both debt held by the public and debt held in
intergovernmental accounts such as the Social Security Trust
Funds. Not included is debt issued by government agencies other
than the Department of the Treasury.
Purchasing Managers Index An index based off a survey of manufacturing companies, which
asks questions about new orders, inventory levels, production,
supplier deliveries and the employment environment.
Qualified Mortgage (QM) A mortgage loan that meets certain underwriting criteria
announced by the CFPB. An originator of a QM is provided with
certain protections from borrower lawsuits alleging that the
originator failed to fulfill its duty under the Dodd-Frank Act to make
a good faith and reasonable determination of the borrower’s ability
to repay the loan.
Qualified Residential Mortgage
(QRM)
A mortgage loan that is exempt from the Dodd-Frank Act’s
securitization risk retention rule requiring securitization issuers to
retain a portion of securitized risk exposure in transactions that
they issue.
Qualitative and Quantitative
Easing
A program introduced by the BoJ in April 2013 to achieve the price
stability target of 2 percent in terms of the year-on-year rate of
change in the CPI at the earliest possible time, with a time horizon
of about two years. The program will double the monetary base
and the amounts outstanding of JGBs as well as ETFs in two years,
and more than double the average remaining maturity of JGB
purchases.
Real Estate Investment Trust
(REIT)
An operating company that manages income-producing real estate
or real estate-related assets. Certain REITs also operate real estate
properties in which they invest. To qualify as a REIT, a company
must have three-fourths of its assets and gross income connected
to real estate investment and must distribute at least 90 percent
of its taxable income to shareholders annually in the form of
dividends.
Receiver A custodian appointed to maximize the value of the assets of a
failed institution or company and to settle its liabilities.
Repurchase Agreement (Repo) The sale of a security combined with an agreement to repurchase
the security, or a similar security, on a specified future date at a
prearranged price. A repo is a secured lending arrangement.

139
Residential Mortgage-Backed
Security (RMBS)
A security that is collateralized by a pool of residential mortgage
loans and makes payments derived from the interest and principal
payments on the underlying mortgage loans.
Revolving Credit A lending arrangement whereby a lender commits to provide a
certain amount of funding to a borrower on demand. The borrower
may generally draw funds and repay the committed funding at any
time over the term of the agreement.
Risk-Based Capital An amount of capital, based on the risk-weighting of various asset
categories, that a financial institution holds to help protect against
losses.
Risk-Weighted Assets (RWA) A risk-based concept used as the denominator of risk-based capital
ratios (common equity tier 1, tier 1 risk-based, and total risk-based)
with respect to Basel capital guidelines for banking organizations.
The RWA is a weighted total asset value calculated from assigned
risk categories or modeled analysis. Broadly, total RWA are
determined by calculating RWA for market risk and operational risk,
as applicable, and adding the sum of RWA for on-balance sheet,
off-balance sheet, counterparty, and other credit risks. Details vary,
in part, depending upon the version(s) of Basel capital guidelines
that may apply to the banking organization.
Rollover Risk The risk that as an institution’s debt nears maturity, the institution
may not be able to refinance the existing debt or may have to
refinance at less favorable terms.
Run Risk The risk that investors lose confidence in an institution—due to
concerns about counterparties, collateral, solvency, or related
issues—and respond by pulling back their funding.
Securities Information Processor A system that consolidates and disseminates equity prices.
Securities Lending/Borrowing The temporary transfer of securities from one party to another for
a specified fee and term, in exchange for collateral in the form of
cash or securities.
Securitization A financial transaction in which assets such as mortgage loans are
pooled, securities representing interests in the pool are issued, and
proceeds from the underlying pooled assets are used to service
and repay securities issued via the securitization.
Glossa r y

2 0 1 4 F S O C / / Annual Report140
Security-Based Swap Dealer A person that holds itself out as a dealer in security-based swaps,
makes a market in security-based swaps, regularly enters into
security-based swaps with counterparties, or engages in any
activity causing it to be known as a dealer or market maker in
security-based swaps; does not include a person entering into
security-based swaps for such person’s own account.
Short-Term Wholesale Funding Short-term funding instruments not covered by deposit insurance
that are typically issued to institutional investors. Examples include
large checkable and time deposits, brokered CDs, CP, Federal
Home Loan Bank borrowings, and repos.
Sponsor-backed payment-in-kind
(PIK) bond
A bond that compensates the holder with other bonds rather than
cash.
Swap An exchange of cash flows with defined terms and over a fixed
period, agreed upon by two parties. A swap contract may reference
underlying financial products across various asset classes including
interest rates, credit, equity, commodity, and FX.
Swap Data Repository (SDR) A person that collects and maintains information or records
with respect to transactions or positions in, or the terms and
conditions of, swaps entered into by third parties for the purpose
of providing a centralized recordkeeping facility for swaps. In
certain jurisdictions, SDRs are referred to as trade repositories.
The Committee on Payment and Settlement Systems and IOSCO
describes a trade repository as “an entity that maintains a
centralized electronic record (database) of transaction data.”
Swap Execution Facility (SEF) A term defined in the Dodd-Frank Act as a trading platform which
market participants use to execute and trade swaps by accepting
bids and offers made by other participants.
Swap Dealer A person that holds itself out as a dealer in swaps, makes a
market in swaps, regularly enters into swaps with counterparties,
or engages in any activity causing it to be known as a dealer or
market maker in swaps; does not include a person entering into
swaps for such person’s own account.
Swap Future A futures contract that mimics the economic substance of a swap.
Systemic Expected Shortfall (SES) A systemic risk indicator that estimates the extent to which the
market value equity of a financial firm would be depleted by a
decline in equity prices.
Swaption An option granting the right to enter into a swap. See Option and
Swap.

141
Tri-Party Repo Infrastructure
Reform Task Force
A task force formed in September 2009 under the auspices of the
Payments Risk Committee, a private sector body sponsored by the
FRBNY. The Task Force membership included representatives from
multiple types of market participants in the tri-party repo market,
as well as relevant industry associations.
Tier 1 Capital A measure that includes common stock, preferred stock, and
retained earnings
Tier 1 Common Tier 1 capital less non-common elements, including perpetual
preferred stock and related surplus, minority interest in
subsidiaries, trust preferred securities and mandatory convertible
preferred securities.
Time Deposits Deposits which the depositor, generally, does not have the right to
withdraw before a designated maturity date without paying an early
withdrawal penalty. A CD is a time deposit.
Tri-Party Repo A repo in which a clearing bank acts as third-party agent to provide
collateral management services and to facilitate the exchange of
cash against collateral between the two counterparties.
Underwriting Standards Terms, conditions, and criteria used to determine the extension of
credit in the form of a loan or bond.
Value-at-Risk (VaR) A tool measuring the risk of portfolio losses. The VaR projects the
probability and maximum expected loss for a specific time period.
For example, the VaR over 10 days and with 99 percent certainty
measures the most one would expect to lose over a 10-day period,
99 percent of the time.
Wealth-Management Products
(WMPs)
Products sold to investors as higher-yielding alternatives to time
deposits, WMPs are largely off-balance sheet investment vehicles
offered by banks, trusts, and securities companies.
Weighted-Average Life A weighted average of the time to each principal payment in a
security.
Weighted-Average Maturity A weighted average of the time to maturity on all mortgages in a
mortgage-backed security.
Yield Curve A graphical representation of the relationship between bond yields
and their respective maturities.
Glossa r y

F inanc ia l S tab i l i t y Ove rs ight Counc i l 143
List of Charts
Chart 4.1.1 Change in Real Gross Domestic Product ...................................................................15
Chart 4.1.2 Change in Real Personal Consumption Expenditures ..................................................15
Chart 4.1.3 Private Housing Starts ............................................................................................15
Chart 4.1.4 Net Change in Nonfarm Payroll Employment ..............................................................16
Chart 4.1.5 Civilian Unemployment Rate ....................................................................................16
Chart 4.1.6 Labor Force Participation Rate ................................................................................16
Chart 4.1.7 Long-Term Unemployment ......................................................................................17
Chart 4.2.1 Debt to Assets for Nonfinancial Corporations .............................................................17
Chart 4.2.2 Bank Business Lending Standards and Demand ........................................................17
Chart 4.2.3 Nonfinancial Corporate Bond Default Rate .................................................................18
Chart 4.2.4 Noncurrent Commercial and Industrial Loans .............................................................18
Chart 4.2.5 Noncorporate Assets..............................................................................................18
Chart 4.2.6 Net Borrowing by Nonfinancial Noncorporate Businesses ............................................19
Chart 4.2.7 Bank Business Lending Standards and Demand ........................................................19
Chart 4.2.8 Small Businesses' Difficulty Obtaining Credit..............................................................19
Chart 4.2.9 Household Debt as a Percent of Disposable Personal Income ......................................20
Chart 4.2.10 Private Nonfinancial Debt ........................................................................................20
Chart 4.2.11 Household Debt Service Ratio .................................................................................20
Chart 4.2.12 Share of Household Debt by Delinquency Status ........................................................21
Chart 4.2.13 Household and Nonprofit Balance Sheets .................................................................21
Chart 4.2.14 Owners' Equity as Share of Household Real Estate .....................................................21
Chart 4.2.15 Components of Consumer Credit .............................................................................22
Chart 4.2.16 Applications for Credit ............................................................................................22
Chart 4.2.17 90+ Day Delinquency Rate by Loan Type .................................................................22
Chart 4.3.1 Federal Unified Budget Surplus/Deficit ......................................................................23
Chart 4.3.2 Projected Spending in Major Budget Categories ........................................................23
Chart 4.3.3 Federal Debt Held by the Public as a Percent of GDP .................................................23
Chart 4.3.4 Interest Outlays and Average Maturity of U.S. Public Debt ...........................................24
Chart 4.3.5 State and Local Government Tax Revenues...............................................................24
Chart A.1 Treasury Bill Yields: 2011 vs 2013 ...........................................................................25
Chart A.2 Treasury Collateralized Borrowing Rate .....................................................................26
Chart 4.3.6 Growth of State and Local Government Employment ..................................................27
Chart 4.3.7 Municipal Bond Issuance .......................................................................................27
Chart 4.3.8 Municipal Bond Spreads .........................................................................................27
Chart B.1 Weekly Municipal Bond Fund Flows and Yields ..........................................................28
Chart 4.4.1 Real GDP Growth ..................................................................................................29

2 0 1 4 F S O C / / Annual Report144
Chart 4.4.2 Advanced Economies Real GDP Growth ...................................................................29
Chart 4.4.3 Euro Area Real GDP Growth ....................................................................................30
Chart 4.4.4 Peripheral Europe: Gross Public Debt .......................................................................30
Chart 4.4.5 Peripheral Merchandise Exports ..............................................................................30
Chart 4.4.6 Euro Zone: Consumer Price Inflation .........................................................................31
Chart 4.4.7 Japan: Consumer Price Inflation ..............................................................................32
Chart 4.4.8 Emerging Economies Real GDP Growth ....................................................................33
Chart 4.4.9 EME Contributions to Global Growth .........................................................................33
Chart 4.4.10 China Real GDP Growth ..........................................................................................34
Chart 4.4.11 China: Credit to the Private Sector ...........................................................................34
Chart 4.4.12 China: Annual Increases in Credit and GDP ...............................................................35
Chart 5.1.1 Treasury Yields ......................................................................................................37
Chart 5.1.2 Slope of the Treasury Yield Curve ............................................................................37
Chart 5.1.3 Implied Volatility .....................................................................................................37
Chart 5.1.4 Agency MBS and Treasury Yields ............................................................................38
Chart 5.1.5 Outstanding Agency MBS by Holders .......................................................................38
Chart 5.1.6 U.S. Corporate Bond Option-Adjusted Spreads ..........................................................39
Chart 5.1.7 U.S. Corporate Bond Issuance ................................................................................39
Chart 5.1.8 Institutional Loans Issuance and Market Size .............................................................39
Chart 5.1.9 CLO and Leveraged Loan Spreads ...........................................................................40
Chart 5.1.10 Annual CLO Issuance .............................................................................................40
Chart C.1 Bid-Ask Spreads on U.S. Treasury Notes ..................................................................41
Chart C.2 Price Impact of Trades Increases during the Selloff .....................................................41
Chart C.3 Quoted Treasury Market Depth ................................................................................41
Chart C.4 Change in Broker-Dealers' Long Vs. Short Positions ...................................................42
Chart C.5 Broker-Dealer's VaR and Net Leverage .....................................................................42
Chart C.6 Capital Constrained Broker-Dealers Are Associated with Less Selling ...........................42
Chart 5.1.11 Publically Held Federal Debt Outstanding ..................................................................43
Chart 5.1.12 Foreign Holders of U.S. Federal Debt .......................................................................43
Chart 5.1.13 Euro Area 10-Year Yield Spreads to German Debt ..................................................... 44
Chart 5.1.14 Emerging Market Bond Spreads ............................................................................. 44
Chart 5.1.15 EM Assets and U.S. Treasuries: Performance Since May 1, 2013 ............................... 44
Chart 5.1.16 Cumulative Changes in 5-year Government Yields ......................................................45
Chart 5.1.17 Gross Capital Flows to EMEs ...................................................................................45
Chart 5.1.18 EME Gross Global Bond Issuance ............................................................................45
Chart 5.1.19 EME Corporate Debt Securities Outstanding ..............................................................46
Chart 5.1.20 U.S. Dollar Trade Weighted Index .............................................................................46
Chart 5.1.21 Currency Implied Volatility .......................................................................................46
Chart 5.1.22 U.S. Dollar Exchange Rates .....................................................................................47
Chart 5.1.23 Change in Exchange Rates (April 2013-March 2014) .................................................47

F inanc ia l S tab i l i t y Ove rs ight Counc i l 145
Chart D.1 Advanced Economy Base Money.............................................................................48
Chart D.2 Central Bank Assets ...............................................................................................48
Chart D.3 Market Volatility .....................................................................................................49
Chart 5.1.24 Selected Equities Indices ........................................................................................50
Chart 5.1.25 S&P 500 Key Ratios ..............................................................................................50
Chart 5.1.26 Returns in Selected Equities Indices .........................................................................50
Chart 5.1.27 Market Volatility .....................................................................................................51
Chart 5.1.28 Commodities .........................................................................................................51
Chart 5.1.29 National Repeat Sales Home Price Indices ................................................................52
Chart 5.1.30 Monthly Originations by Purchase and Refinance .......................................................52
Chart 5.1.31 Mortgages with Negative Equity ...............................................................................53
Chart 5.1.32 Mortgage Delinquency and Foreclosure ....................................................................53
Chart 5.1.33 Purchase Origination Volume by Credit Score ............................................................53
Chart 5.1.34 Servicing Growth: Banks vs. Nonbanks ....................................................................54
Chart 5.1.35 Mortgage Originations by Program ...........................................................................54
Chart 5.1.36 Issuance of RMBS .................................................................................................55
Chart 5.1.37 GSE Net Income ...................................................................................................55
Chart 5.1.38 Commercial Property Price Indices ..........................................................................56
Chart 5.1.39 CMBS New Issuance ..............................................................................................56
Chart 5.1.40 CMBS Senior Debt Spreads ....................................................................................56
Chart 5.2.1 Composition of Bank Short-Term Funding .................................................................57
Chart 5.2.2 Commercial Paper Outstanding ...............................................................................57
Chart 5.2.3 Commercial Paper Outstanding ...............................................................................57
Chart 5.2.4 U.S. MMF Holdings of European Entities' CP, CD, and Repos .......................................58
Chart 5.2.5 Premium for Borrowing U.S. Dollars for 3 Months ......................................................58
Chart 5.2.6 Value of the Repo Market .......................................................................................59
Chart 5.2.7 Primary Dealer Repo Agreements ............................................................................59
Chart 5.2.8 Collateral in Tri-Party Repo ......................................................................................59
Chart 5.2.9 Share of Securities Lending by Lender Type ..............................................................60
Chart 5.2.10 Value of Securities on Loan .....................................................................................60
Chart 5.2.11 Composition of Securities Lending by Security Type ...................................................60
Chart 5.2.12 Securities Lending Cash Reinvestment .....................................................................61
Chart 5.3.1 Aggregate BHC Pre-Tax Income ..............................................................................62
Chart 5.3.2 Return on Average Assets for BHCs > $10B .............................................................62
Chart 5.3.3 Annualized Net Interest Margin ................................................................................62
Chart 5.3.4 Total Residential Mortgage Originations ....................................................................63
Chart 5.3.5 U.S. Mortgage Spread ............................................................................................63
Chart 5.3.6 Maturity Gap at Large Banks ...................................................................................63
Chart 5.3.7 Maturity Gap at Small Banks ...................................................................................64
Chart 5.3.8 KBW Bank Index and Implied Volatility ......................................................................64

2 0 1 4 F S O C / / Annual Report146
Chart 5.3.9 Average P/B and P/E Ratios of 6 Large Complex BHCs ..............................................64
Chart 5.3.10 CDS Spreads of 6 Large Complex BHCs ..................................................................65
Chart 5.3.11 Systemic Risk Measures .........................................................................................65
Chart 5.3.12 Change in Tier 1 Common Ratios for Aggregate U.S. BHCs ........................................65
Chart 5.3.13 Consolidated BHC Liquidity Ratio .............................................................................66
Chart 5.3.14 Nonperforming Loans (30-89 Days) .........................................................................66
Chart 5.3.15 Nonperforming Loans (90+ Days and Nonaccrual) ....................................................66
Chart 5.3.16 Credit Quality ........................................................................................................67
Chart 5.3.17 Loan Loss Reserves...............................................................................................67
Chart 5.3.18 Initial and Stressed Tier 1 Common Capital Ratios .....................................................67
Chart 5.3.19 Federal Reserve's Actions in CCAR 2014 .................................................................68
Chart 5.3.20 FDIC-Insured Failed Institutions ................................................................................68
Chart 5.3.21 Commercial Bank and Thrift Pre-Tax Income .............................................................68
Chart 5.3.22 Risk-Weighted Assets and Return on Assets .............................................................69
Chart 5.3.23 U.S. Branches and Agencies of Foreign Banks: Assets ...............................................69
Chart 5.3.24 U.S. Branches and Agencies of Foreign Banks: Liabilities ............................................69
Chart 5.3.25 Federally Insured Credit Union Income ......................................................................70
Chart 5.3.26 Credit Union Deposits .............................................................................................70
Chart 5.3.27 Credit Union Long-Term Assets ...............................................................................70
Chart 5.3.28 Credit Union Investments by Maturity ........................................................................71
Chart 5.3.29 Credit Union Unrealized Gains on AFS & HTM Securities .............................................71
Chart 5.4.1 Broker-Dealer Revenues .........................................................................................71
Chart 5.4.2 Broker-Dealer Assets and Leverage .........................................................................72
Chart 5.4.3 Primary Dealer Securities........................................................................................72
Chart 5.4.4 Life and Other Insurance: Capital and Net Income ......................................................73
Chart 5.4.5 Property and Casualty Insurance: Capital and Net Income ...........................................74
Chart 5.4.6 Life Insurers: Impact of Low Rate Environment ...........................................................74
Chart 5.4.7 Consumer Loans Outstanding .................................................................................77
Chart 5.4.8 Business Loans Outstanding ...................................................................................77
Chart 5.4.9 ABS Issuance........................................................................................................77
Chart 5.4.10 Selected ABS Spreads ...........................................................................................78
Chart 5.4.11 Total Agency REIT Assets and Leverage ...................................................................79
Chart 5.4.12 Agency REITs: Return on Assets ..............................................................................79
Chart F.1 Interest Rate on Government Bonds and Discount Rate ..............................................80
Chart F.2 Real Effective Exchange Rate Returns ......................................................................80
Chart 5.5.1 MMF Assets by Fund Type ......................................................................................81
Chart 5.5.2 Liquidity of Prime MMFs .........................................................................................81
Chart 5.5.3 Weighted Average Life of MMFs ..............................................................................81
Chart 5.5.4 Growth in Assets of the Investment Company Industry ................................................82
Chart 5.5.5 Monthly Bond Mutual Fund Flows ............................................................................82

F inanc ia l S tab i l i t y Ove rs ight Counc i l 147
Chart 5.5.6 Monthly Equity Mutual Fund Flows ...........................................................................82
Chart 5.5.7 Bank Loan Mutual Funds: Annual Flows ...................................................................83
Chart 5.5.8 Retirement Fund Assets by Plan Type .......................................................................83
Chart 5.5.9 Public and Private Pension Funding Level ..................................................................83
Chart 5.5.10 U.S. Private Equity AUM .........................................................................................84
Chart 5.5.11 Sponsor-Backed Payment-in-Kind Bonds ..................................................................85
Chart 5.5.12 Hedge Fund Assets and Net Asset Flows ..................................................................85
Chart 5.5.13 Change in Hedge Fund AUM ...................................................................................85
Chart 5.5.14 Hedge Fund Net Asset Flows by AUM ......................................................................86
Chart 5.5.15 U.S.-Listed ETP AUM and Count ..............................................................................86
Chart 5.6.1 Global OTC Derivatives Market ................................................................................87
Chart 5.6.2 Credit Derivatives Outstanding .................................................................................87
Chart 5.6.3 Growth of Credit Derivative Central Clearing ..............................................................89
Chart 5.6.4 Interest Rate Swap Futures: Volume and Open Interest ...............................................90
Chart 7.3.1 Level 3 Assets .................................................................................................... 116
Chart 7.3.2 Connectedness ................................................................................................... 116
Chart 7.3.3 Moody's Systemic Support Uplift ........................................................................... 117
Chart 7.3.4 Fitch Support Rating Floors ................................................................................... 117
Chart 7.7.1 Destination of U.S. Exports of Goods and Services ..................................................122
Chart 7.7.2 Country Exposures of All U.S. Banks ......................................................................122
Notes on the Data
Any data sourced from ICAP Electronic Broking LLC ("ICAP") is unattributed
and ICAP takes no responsibility for its accuracy or completeness.

F I N A N C I A L S TA B I L I T Y O V E R S I G H T C O U N C I L
1500 PENNSYLVANIA AVENUE, NW | WASHINGTON, D.C. 20220
W W W.FSOC.GOV