DRAFT PRE-DECISIONAL April 19, 2012 Afghanistan Resource Oversight Council.

F inanc ia l S tab i l i t y Overs ight Counc i l ii
Financial Stability Oversight Council
The Financial Stability Oversight Council (Council) was established by the Dodd-Frank Wall
Street Reform and Consumer Protection Act (Dodd-Frank Act) and is charged with three
primary purposes:
1. To identify risks to the financial stability of the United States that could arise from the
material financial distress or failure, or ongoing activities, of large, interconnected bank
holding companies or nonbank financial companies, or that could arise outside the
financial services marketplace.
2. To promote market discipline, by eliminating expectations on the part of shareholders,
creditors, and counterparties of such companies that the U.S. government will shield
them from losses in the event of failure.
3. To respond to emerging threats to the stability of the U.S. financial system.
Pursuant to the Dodd-Frank Act, the Council consists of ten voting members and five
nonvoting members and brings together the expertise of federal financial regulators, state
regulators, and an insurance expert appointed by the President.
The voting members are:
• the Secretary of the Treasury, who serves as the Chairperson of the Council;
• the Chairman of the Board of Governors of the Federal Reserve System;
• the Comptroller of the Currency;
• the Director of the Bureau of Consumer Financial Protection;
• the Chairman of the Securities and Exchange Commission;
• the Chairperson of the Federal Deposit Insurance Corporation;
• the Chairperson of the Commodity Futures Trading Commission;
• the Director of the Federal Housing Finance Agency;
• the Chairman of the National Credit Union Administration; and
• an independent member with insurance expertise who is appointed by the President
and confirmed by the Senate for a six-year term.
The nonvoting members, who serve in an advisory capacity, are:
• the Director of the Office of Financial Research;
• the Director of the Federal Insurance Office;
• a state insurance commissioner designated by the state insurance commissioners;
• a state banking supervisor designated by the state banking supervisors; and
• a state securities commissioner (or officer performing like functions) designated by the
state securities commissioners.
The state insurance commissioner, state banking supervisor, and state securities commissioner
serve two-year terms.
2 0 1 6 F S O C / / Annual Reportii
Statutory Requirements for the Annual Report
Section 112(a)(2)(N) of the Dodd-Frank Act requires that the annual report
address the following:
i. the activities of the Council;
ii. significant financial market and regulatory developments, including
insurance and accounting regulations and standards, along with an
assessment of those developments on the stability of the
financial system;
iii. potential emerging threats to the financial stability of the
United States;
iv. all determinations made under Section 113 or Title VIII, and the
basis for such determinations;
v. all recommendations made under Section 119 and the result of such
recommendations; and
vi. recommendations—
I. to enhance the integrity, efficiency, competitiveness, and
stability of United States financial markets;
II. to promote market discipline; and
III. to maintain investor confidence.
Approval of the Annual Report
This annual report was approved unanimously by the voting members of the
Council on June 21, 2016. Except as otherwise indicated, data cited in this report
is as of March 31, 2016.
Abbreviations for Council Member Agencies and Member Agency Offices
• Department of the Treasury (Treasury)
• Board of Governors of the Federal Reserve System (Federal Reserve)
• Office of the Comptroller of the Currency (OCC)
• Bureau of Consumer Financial Protection (CFPB)
• Securities and Exchange Commission (SEC)
• Federal Deposit Insurance Corporation (FDIC)
• Commodity Futures Trading Commission (CFTC)
• Federal Housing Finance Agency (FHFA)
• National Credit Union Administration (NCUA)
• Office of Financial Research (OFR)
• Federal Insurance Office (FIO)
iiiContents
Contents
1 Member Statement ...................................................... 1
2 Executive Summary ..................................................... 3
3 Annual Report Recommendations .............................. 73.1 Cybersecurity ....................................................................................... 7
3.2 Risks Associated with Asset Management Products and Activities ......... 9
3.3 Capital, Liquidity, and Resolution ........................................................ 12
3.4 Central Counterparties ........................................................................ 13
3.5 Reforms of Wholesale Funding Markets .............................................. 14
3.6 Reforms Relating to Reference Rates .................................................. 14
3.7 Data Quality, Collection, and Sharing ................................................... 15
3.8 Housing Finance Reform ..................................................................... 16
3.9 Risk Management in an Environment of Low Interest Rates and
Rising Asset Price Volatility ................................................................. 17
3.10 . Changes in Financial Market Structure and Implications for
. Financial Stability ............................................................................ 17
3.11 Financial Innovation and Migration of Activities ................................ 18
4 Financial Developments ............................................ 194.1 U.S. Treasuries ................................................................................... 19
BOX A: The Increasing Prevalence of Negative Swap Spreads ................. 21
4.2 Sovereign Debt Markets ...................................................................... 23
BOX B: Developments in the European Banking Union ............................. 26
BOX C: Municipal Debt Markets: Challenges in Puerto Rico ..................... 33
4.3 Corporate Credit ................................................................................ 34
4.4 Household Credit ................................................................................ 37
4.5 Real Estate Markets ........................................................................... 39
4.6 Foreign Exchange .............................................................................. 46
4.7 Equities .............................................................................................. 47
4.8 Commodities ..................................................................................... 48
2 0 1 6 F S O C / / Annual Reportiv
4.9 Wholesale Funding Markets ............................................................... 48
4.10 Derivatives Markets .......................................................................... 56
BOX D: Trade Compression in Derivatives Markets ................................. 62
4.11 Bank Holding Companies and Depository Institutions ........................ 66
4.12 Nonbank Financial Companies .......................................................... 76
4.13 Investment Funds ............................................................................. 82
BOX E: Third Avenue Focused Credit Fund .............................................. 86
5 Regulatory Developments and Council Activities ..... 915.1 Safety and Soundness ........................................................................ 91
5.2 Financial Infrastructure, Markets, and Oversight ................................. 99
5.3 Mortgage Transactions, Housing, and Consumer Protection .............. 102
5.4 Data Scope, Quality, and Accessibility ............................................... 103
5.5 Council Activities .............................................................................. 106
6 Potential Emerging Threats and Vulnerabilities ..... 1096.1 Ongoing Structural Vulnerabilities ..................................................... 109
6.2 Cybersecurity: Vulnerabilities to Attacks on Financial Services ........... 113
6.3 Asset Price Declines and Increasing Volatility .................................... 114
BOX F: Implications of Lower Commodity Prices ................................... 117
BOX G Equity Market Volatility on August 24, 2015 ............................... 119
6.4 Risk-Taking in a Low-Yield Environment ............................................ 120
6.5 Changes in Financial Market Structure and Implications for
Financial Stability ............................................................................. 121
BOX H: Perspectives on Fixed Income Market Liquidity ......................... 123
6.6 Financial Innovation and Migration of Activities ................................. 126
6.7 Global Economic and Financial Developments ................................... 128
Abbreviations ............................................................... 129
Glossary ........................................................................ 139
List of Charts ................................................................ 149
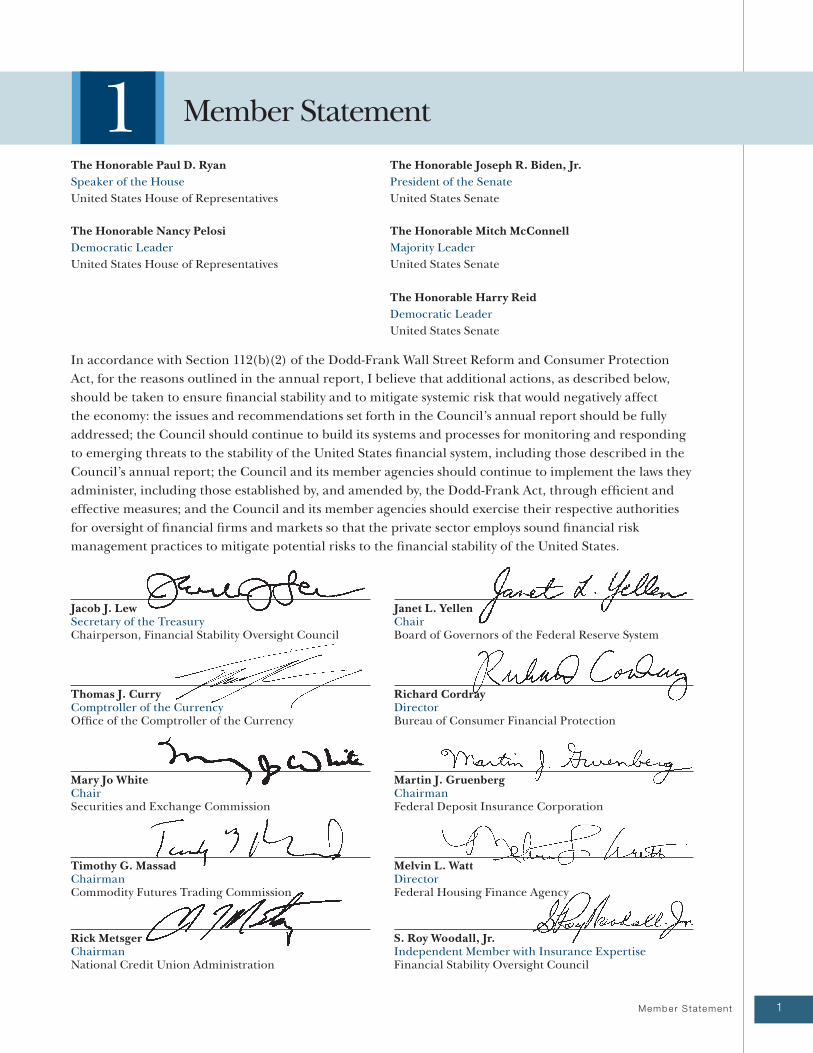
1Member S tatement
In accordance with Section 112(b)(2) of the Dodd-Frank Wall Street Reform and Consumer Protection
Act, for the reasons outlined in the annual report, I believe that additional actions, as described below,
should be taken to ensure financial stability and to mitigate systemic risk that would negatively affect
the economy: the issues and recommendations set forth in the Council’s annual report should be fully
addressed; the Council should continue to build its systems and processes for monitoring and responding
to emerging threats to the stability of the United States financial system, including those described in the
Council’s annual report; the Council and its member agencies should continue to implement the laws they
administer, including those established by, and amended by, the Dodd-Frank Act, through efficient and
effective measures; and the Council and its member agencies should exercise their respective authorities
for oversight of financial firms and markets so that the private sector employs sound financial risk
management practices to mitigate potential risks to the financial stability of the United States.
The Honorable Paul D. Ryan
Speaker of the House
United States House of Representatives
The Honorable Nancy Pelosi
Democratic Leader
United States House of Representatives
The Honorable Joseph R. Biden, Jr.
President of the Senate
United States Senate
The Honorable Mitch McConnell
Majority Leader
United States Senate
The Honorable Harry Reid
Democratic Leader
United States Senate
1 Member Statement
Jacob J. Lew Secretary of the Treasury Chairperson, Financial Stability Oversight Council
Thomas J. Curry Comptroller of the Currency Office of the Comptroller of the Currency
Mary Jo White Chair Securities and Exchange Commission
Timothy G. Massad Chairman Commodity Futures Trading Commission
Rick Metsger Chairman National Credit Union Administration
Janet L. Yellen Chair Board of Governors of the Federal Reserve System
Richard Cordray Director Bureau of Consumer Financial Protection
Martin J. Gruenberg Chairman Federal Deposit Insurance Corporation
Melvin L. Watt Director Federal Housing Finance Agency
S. Roy Woodall, Jr. Independent Member with Insurance Expertise Financial Stability Oversight Council

3E xecut i ve Summar y
In the past year, concerns about slowing global growth, supply gluts in commodities markets, and shifts
in exchange rate and monetary policies abroad led to significant price swings across a range of financial
assets as U.S. interest rates remained low. Although these developments have created challenges for
particular firms and sectors, financial regulatory reforms and a strengthening of market discipline since
the global financial crisis have made the U.S. financial system more resilient, as vulnerabilities remained
moderate.
U.S. financial regulators and market participants made progress in addressing a number of structural
vulnerabilities highlighted in the Council’s previous annual reports. The Federal Reserve finalized a
rule requiring that global systemically important banks (G-SIBs) increase their holdings of common
equity relative to risk-weighted assets (RWAs) and proposed standards for mandatory long-term debt
and total loss-absorbing capacity for G-SIBs. The Federal Reserve and the FDIC completed their review
of the 2015 resolution plans of eight of the largest, most complex U.S. bank holding companies (BHCs).
The agencies jointly determined that five of the firms had submitted plans that were not credible
or would not facilitate an orderly resolution under bankruptcy and have notified these firms of the
deficiencies in their plans. The Federal Reserve and the FDIC informed all eight firms of the steps they
must take in response to the agencies’ findings. The International Swaps and Derivatives Association
(ISDA) expanded the scope of its Universal Resolution Stay Protocol to cover securities financing
transactions. In February 2016, the CFTC and the European Commission announced a common
approach to the supervision of central counterparties (CCPs) operating in the United States and the
European Union (EU). U.S. prudential regulators and the CFTC issued rules establishing minimum
margin requirements for swaps that are not cleared through CCPs. The SEC finalized rules setting
forth reporting requirements for securities-based swaps and establishing a process for the registration
of securities-based swap dealers and major securities-based swap participants. The OFR, Federal
Reserve System, and SEC collaborated on pilot projects to improve the collection and analysis of data on
securities financing transactions. These and other actions undertaken over the last year can be expected
to make the largest, most interconnected financial institutions more resilient, improve regulators’
and firm managers’ ability to manage potential distress at such institutions, and reduce the impact of
contagion that may arise from interconnections among firms and markets. Despite these important,
positive steps, this report identifies a number of structural vulnerabilities and emerging threats in the
U.S. financial system that require action from market participants, regulators, and policymakers.
In addition, the Council continued its analysis of potential financial stability risks that may arise from
certain asset management products and activities. Based on this work, the Council identified areas
of potential financial stability risks and, in April 2016, publicly issued a written update regarding its
evaluation. Since May 2015, the SEC has issued several proposed rules affecting the asset management
industry. The SEC has proposed rules to enhance data reporting for registered investment companies
and registered investment advisers of separately managed accounts, strengthen liquidity risk
management programs and disclosure for registered funds, and limit the amount of leverage that
registered investment companies may obtain through derivatives transactions.
2 Executive Summary
2 0 1 6 F S O C / / Annual Report4
Lastly, the Council remains focused on taking steps to appropriately address threats to financial stability.
Recently, a federal court rescinded the Council’s designation of a nonbank financial company for Federal
Reserve supervision and enhanced prudential standards. The government is appealing the court’s decision.
The Council’s authority to designate nonbank financial companies remains a critical tool to address potential
threats to financial stability, and the Council will continue to defend vigorously the nonbank designations
process.
Cybersecurity
Cyber threats and vulnerabilities continue to be a pressing concern for companies and governments in the
United States and around the world. Significant investment in cybersecurity by the financial services sector
over the past several years has been critical to reducing cybersecurity vulnerabilities within companies and
across the sector as a whole, and such investments should continue. Government agencies and the private
sector should continue to work to improve and enhance information sharing, baseline protections such as
security controls and network monitoring, and response and recovery planning.
Asset Management Products and Activities
The asset management industry’s increasing significance to financial markets and to the broader economy
underscores the need for the Council’s consideration of potential risks to U.S. financial stability from
products and activities in this sector. Building on work begun in 2014, including a public request for
comment, the Council and staffs of its members and member agencies have carried out analyses and engaged
in dialogue regarding these issues. Based on this work, the Council has identified certain areas of potential
financial stability risk and provided its views on key areas of focus and next steps to respond to these potential
risks.
Specifically, to help mitigate financial stability concerns that may arise from liquidity and redemption risks
in pooled investment vehicles, the Council believes that robust liquidity risk management practices for
mutual funds, establishment of clear regulatory guidelines addressing limits on the ability of mutual funds
to hold assets with very limited liquidity, enhanced reporting and disclosures by mutual funds of their
liquidity profiles and liquidity risk management practices, steps to allow and facilitate mutual funds’ use of
tools to allocate redemption costs more directly to investors who redeem shares, additional public disclosure
and analysis of external sources of financing, and measures to mitigate liquidity and redemption risks that
are applicable to collective investment funds (CIFs) and similar pooled investment vehicles offering daily
redemptions should be considered. Regarding potential financial stability risks associated with leverage,
the Council’s review of the use of leverage in the hedge fund industry suggests a need for further analysis
of the activities of hedge funds. Accordingly, the Council has created an interagency working group that
will share and analyze relevant regulatory information in order to better understand whether certain hedge
fund activities might pose potential risks to financial stability. With respect to its review of operational risks,
securities lending, and resolvability and transition planning, work going forward will involve additional data
collection, further engagement and analysis, and monitoring.
Large, Complex, Interconnected Financial Institutions
The size, scope, and interconnectedness of the nation’s largest financial institutions warrant continued
close attention from financial regulators. While the capital and liquidity positions of the largest BHCs have
improved considerably since the financial crisis, the low and relatively flat yield curve, rising credit risk in
some market segments, litigation expenses, and other factors have put pressure on BHC equity valuations
and profitability. Regulators should continue working to ensure that there is enough capital and liquidity at
financial institutions to reduce systemic risk, including finalizing rules setting standards for the minimum
levels of total loss-absorbing capacity and long-term debt maintained by G-SIBs and large foreign banking
organizations (FBOs) operating in the United States.

5
Central Counterparties
CCPs can enhance financial stability and increase market resilience by improving transparency, imposing
robust risk management and margin standards on clearing members, expanding multilateral netting,
and facilitating the orderly management of counterparty credit losses. Because of the critical role these
infrastructures play in financial markets, it is essential that they be resilient and resolvable. Member
agencies should continue to evaluate whether existing rules and standards for CCPs and their clearing
members are sufficiently robust to mitigate potential threats to financial stability. Moreover, with clearing
mandates for selected interest rate and credit default index swaps in effect in the United States, and similar
mandates either in effect or planned in a number of foreign jurisdictions, member agencies should continue
working with international standard setting bodies to implement more granular guidance with respect
to international risk management standards in order to enhance the safety and soundness of CCPs. Such
guidance should also minimize the potential for material differences between jurisdictions’ standards, which
could potentially result in regulatory arbitrage by market participants.
Short-Term Wholesale Funding
Intraday counterparty risk exposure in the tri-party repurchase (repo) market contracted significantly
in recent years, but more work is needed to bring the settlement of General Collateral Finance (GCF)
repo transactions in line with post-crisis reforms. The potential for fire sales of collateral by creditors of a
defaulted broker-dealer also remains a significant risk. Additionally, data gaps continue to limit regulators’
ability to monitor the aggregate repo market and identify interdependencies among firms and market
participants. Regulators will need to monitor market responses to new SEC money market mutual fund
(MMF) rules, which become effective this year, and assess where there may be unforeseen risks, as well as
potential regulatory and data gaps associated with other types of cash management vehicles.
Reliance on Reference Rates
Post-crisis reforms by the official sector and market participants have improved the resilience of the London
Interbank Offered Rate (LIBOR) by subjecting the rate and its administrator to more direct oversight,
eliminating many little-used currency/tenor pairings, and embargoing the submissions of individual banks
for a three-month period. However, because the volume of unsecured wholesale lending has declined
markedly, it is difficult to firmly root LIBOR submissions in a sufficient number of observable transactions.
This development makes LIBOR more reliant on the judgment of submitting banks and poses the risk that it
may not be possible to publish the benchmark on an ongoing basis if transactions decline further. Regulators
and market participants should continue their efforts to develop alternative rates and implementation plans
to achieve a smooth transition to these new rates.
Data Gaps and Challenges to Data Quality, Collection, and Sharing
While Council members have made progress in filling gaps in the scope, quality, and accessibility of data
available to regulators, much work remains. Regulators face challenges comprehensively monitoring and
understanding developments across financial markets, as each agency’s data, information, and analysis are
focused primarily on the entity types or market segments for which they have regulatory purview. More
broadly, markets continually evolve and financial transactions cross regulatory jurisdictions, making data
sharing and integration among regulators both at home and abroad, as well as cooperative data analysis,
imperatives. Regulators and market participants should continue to work together to improve the scope,
quality, and accessibility of financial data.
E xecut i ve Summar y
2 0 1 6 F S O C / / Annual Report6
Housing Finance Reform
The government-sponsored enterprises (GSEs) are now into their eighth year of conservatorship. While
regulators and supervisors have taken great strides to work within the constraints of conservatorship to
promote greater investment of private capital and improve operational efficiencies with lower costs, federal
and state regulators are approaching the limits of their ability to enact wholesale reforms that are likely to
foster a vibrant, resilient housing finance system. Housing finance reform legislation is needed to create a
more sustainable system that enhances financial stability.
Risk Management in an Environment of Low Interest Rates and Rising Asset Price Volatility
The Council has long been attentive to the possibility that low interest rates may lead some market
participants to take on risk to gain higher yields by reducing the duration of their liabilities, by increasing
leverage, or by shifting toward assets that are less liquid or embed greater market or credit risk. Such behavior
can contribute to excessive asset valuations, which can leave investors susceptible to rapid, unexpected price
declines. Elevated asset price volatility associated with downward movement in asset valuations can pose
challenges for those market participants that are highly leveraged or hold concentrated and inadequately
hedged exposures to affected market segments. The persistent fall in energy and metals commodities prices,
large swings in equity valuations, and upward movement in high-yield debt spreads underscore the need for
supervisors, regulators, and managers to remain vigilant in ensuring that firms and funds maintain robust
risk management standards.
Changes in Financial Market Structure
With the growing importance in certain markets of proprietary trading firms and other market participants
that rely heavily on automated trading systems, access to those markets has increased and costs for investors
and issuers have generally fallen. However, this shift in market structure may introduce new vulnerabilities,
including operational risks associated with the very high speed and volume of trading activity and
potential destabilizing price feedback dynamics arising from interactions among high-speed algorithmic
trading decisions. Increased coordination among regulators is needed to evaluate and address these risks,
particularly in circumstances where economically similar products, such as cash Treasuries and Treasury
futures, are traded in different markets and fall under the purview of different regulators.
Financial Innovation and Migration of Activities
New financial products, delivery mechanisms, and business practices, such as marketplace lending and
distributed ledger systems, offer opportunities to lower transaction costs and improve the efficiency of
financial intermediation. However, innovations may also embed risks, such as credit risk associated with
the use of new and untested underwriting models. In other instances, risks embedded in new products and
practices may be difficult to foresee. Financial regulators will need to continue to be vigilant in monitoring
new and rapidly growing financial products and business practices, even if those products and practices are
relatively nascent and may not constitute a current risk to financial stability.
7Annua l Repor t Recommendat ions
3.1 Cybersecurity
Cybersecurity threats and vulnerabilities continue to be pressing concerns for companies and
governments in the United States and around the world. In the U.S. financial system, cybersecurity
remains an area of significant focus for both firms and the government sector. This attention is
appropriate, as cybersecurity-related incidents create significant operational risk, impacting critical
services in the financial system, and ultimately affecting financial stability and economic health.
Financial services sector companies and industry groups, executive branch agencies, financial
regulators, and others have made notable progress in improving cybersecurity and resilience throughout
the system. This progress includes developing and testing of system-wide plans for responding to major
incidents, the expansion of information sharing programs through organizations like the Financial
Services Information Sharing and Analysis Center (FS-ISAC), and the continued development of
regulatory and non-regulatory structures for assessing and addressing firms’ cybersecurity risk levels.
Continuing to advance these and other efforts should remain a top priority for business and government
leaders, and the Council makes several recommendations for doing so which build on recommendations
made in last year’s annual report.
Information Sharing
The timely sharing of actionable cybersecurity information between industry and government is
critical to preventing and limiting the impact of cybersecurity incidents. The signing into law of
the Cybersecurity Act of 2015 provides a foundation for further advances in cybersecurity-related
information sharing. The Act establishes a more robust legal framework for sharing cyber-related
information between companies and between the public and private sectors. Such information sharing
will improve the government’s ability to analyze and respond to cyber-related attacks and vulnerabilities
that may impact the private sector.
The Council recommends that Treasury, the U.S. Departments of Homeland Security, Justice, and
Defense, and financial regulators strongly support efforts to implement this legislation, including
coordinating their associated processes with the financial services sector, consistent with processes
established by the law.
Work to continue to improve information sharing should recognize the full scope of information that
is useful to cybersecurity professionals. This information includes the technical details of malicious
activity, as well as supporting information, such as how the incident unfolded, its significance, and what
tools and tactics the adversary used. Agencies may possess such information, and should continue to
seek appropriate ways to share additional information, leveraging existing information mechanisms
where possible, to provide a more complete picture of malicious activity.
The Council recommends that the Financial and Banking Information Infrastructure Committee
(FBIIC) and its member agencies continue to foster information sharing by law enforcement,
homeland security, and the intelligence community agencies with the FBIIC member agencies.
3 Annual Report Recommendations
2 0 1 6 F S O C / / Annual Report8
Baseline Protections
The financial sector’s continued efforts to improve cybersecurity as threats and vulnerabilities evolve are
critically important. These efforts include taking steps to reduce the risk of incidents by making networks
more secure, reducing vulnerabilities, and increasing costs to malicious actors. In addition, the SEC's
Regulation SCI, which became effective in November 2015, requires certain key market participants to
have comprehensive policies and procedures in place surrounding their technological systems and
improves Commission oversight of securities market technology infrastructure.
The financial services sector’s continued collaboration with the National Institute of Standards and
Technology (NIST) to use the NIST Framework for Improving Critical Infrastructure Cybersecurity and
incorporate it into existing industry practices is an important part of such efforts.
It is important to note, however, that the Framework is an evolving guide that establishes a common lexicon
for businesses to discuss their cybersecurity posture and is not designed to serve as a regulatory standard.
As financial regulators adopt approaches to cybersecurity supervision, the Council recommends that they
endeavor to establish a common risk-based approach to assess cybersecurity and resilience at the firms they
regulate. Informed by their regulatory and supervisory process, individual regulators could leverage that
common risk-based approach to address any unique statutory and regulatory requirements, as well as any
distinct cybersecurity risks presented by segments of the financial sector they oversee. The Council also
recommends that financial regulators integrate the Framework’s lexicon into any common approach to risk
assessment and related regulatory and supervisory process to the extent possible to further reinforce the
ability of diverse stakeholders to communicate about, and assess more consistently, cybersecurity risk across
the financial sector.
In addition, it is important to highlight that the cybersecurity of financial services sector companies depends
on both the internal security of companies and also the security of the vendors and service providers on
which they rely. To continue to improve the cybersecurity of the financial services sector as a whole, the
Council recommends increased engagement between the sector and service providers of all types, including
those in the energy, telecommunications, and technology sectors.
Finally, the approaches and authorities to supervise third-party service providers continue to vary across
financial regulators. The Council continues to support efforts to synchronize these authorities, by passing
new legislation that helps to enhance the security of third-party service providers and the critical services
they provide. The Council supports the granting of examination and enforcement powers to NCUA and
FHFA to oversee third-party service providers, including information technology, and more broadly,
other critical service providers engaged respectively with credit unions and the GSEs.
Response and Recovery
A significant cybersecurity incident affecting the financial services sector has the potential to affect financial
stability. Government agencies and the private sector must be prepared to respond to such incidents to limit
their impact and expedite recovery processes. These preparations should include developing robust sector-
wide plans for responding to a significant cybersecurity incident, and this work is well underway.
9
Building on this work, as well as the series of cybersecurity exercises conducted by government and industry
over the past two years, the Council recommends that agencies and financial sector companies further
explore how best to concurrently manage the financial stability and technical impacts of a significant
cybersecurity incident. Ultimately, effective response to a significant cybersecurity incident affecting the
financial services sector will depend on technical, financial stability, and business response efforts. The
Council recommends continuing efforts by the FBIIC members and the private sector to understand how
these issues intersect and explore various means for these perspectives to be considered during a crisis.
3.2 Risks Associated with Asset Management Products and Activities
In April 2016, the Council issued a statement providing a public update on its review of potential risks to U.S.
financial stability that may arise from asset management products and activities. The statement details the
Council’s current views regarding potential financial stability risks and next steps to be considered to respond
to these potential risks. The Council’s evaluation of risks focused on the following areas: (1) liquidity and
redemption; (2) leverage; (3) operational functions; (4) securities lending; and (5) resolvability and transition
planning.
The Council’s public statement builds on an extensive review of potential financial stability risks in the asset
management industry, including the Council’s May 2014 public conference and its directive to staff at its July
2014 meeting to undertake a more focused analysis of industry-wide products and activities. In December
2014, the Council published a notice seeking public comment regarding whether and how certain asset
management products and activities could pose potential risks to U.S. financial stability.
Below are summaries of the Council’s views from the public statement across each of the areas covered in its
review.
Liquidity and Redemption Risk
The Council believes there are financial stability concerns that may arise from liquidity and redemption risks
in pooled investment vehicles, particularly where investor redemption rights and underlying asset liquidity
may not match. To help mitigate these financial stability risks, the Council believes that the following steps
should be considered: (1) robust liquidity risk management practices for mutual funds, particularly with
regard to preparations for stressed conditions by funds that invest in less liquid assets; (2) establishment of
clear regulatory guidelines addressing limits on the ability of mutual funds to hold assets with very limited
liquidity, such that holdings of potentially illiquid assets do not interfere with a fund’s ability to make orderly
redemptions; (3) enhanced reporting and disclosures by mutual funds of their liquidity profiles and liquidity
risk management practices; (4) steps to allow and facilitate mutual funds’ use of tools to allocate redemption
costs more directly to investors who redeem shares; (5) additional public disclosure and analysis of external
sources of financing, such as lines of credit and interfund lending, as well as events that trigger the use of
external financing; and (6) measures to mitigate liquidity and redemption risks that are applicable to CIFs
and similar pooled investment vehicles offering daily redemptions.
While exchange-traded funds (ETFs) are not subject to the same types of liquidity and redemption risks as
other open-end funds, the Council will continue to monitor other risks that could arise, such as the potential
for ETFs to disconnect from the price of their underlying securities for an extended period, and whether such
risks could raise financial stability concerns. The Council notes that the SEC is currently reviewing exchange-
traded products (ETPs) with respect to a broad variety of issues.
Annua l Repor t Recommendat ions
2 0 1 6 F S O C / / Annual Report10
In May 2015, the SEC proposed rules, forms, and amendments to modernize and enhance the reporting
and disclosure of information by registered investment companies and registered investment advisers. In
September 2015, the SEC issued proposed rules for mutual funds and ETFs designed to enhance liquidity
risk management by funds, provide new disclosures regarding fund liquidity, and allow funds to adopt swing
pricing to pass on transaction costs to entering and exiting investors. The Council welcomes the SEC’s policy
initiatives in this area and understands the SEC is currently reviewing public comments on its proposed rules.
To the extent that these or any other measures are implemented by the SEC or other regulators, the
Council intends to review and consider whether risks to financial stability remain. This review will take into
account how the industry may evolve in light of any regulatory changes, whether additional data is needed
to comprehensively assess liquidity and redemption risk, and the differences and similarities in risk profiles
among mutual funds and other pooled investment vehicles.
Leverage Risk
The Council’s analysis of data from the SEC’s Form PF showed that many hedge funds use relatively small
amounts of leverage, but leverage appears to be concentrated in a small number of large hedge funds,
based on certain measures. The Council acknowledges that the relationship between a hedge fund’s level
of leverage and risk, and whether that risk may have financial stability implications, is highly complex.
While reporting on Form PF has increased transparency, it does not provide complete information on the
economics and corresponding risk exposures of hedge fund leverage or potential mitigants associated with
reported leverage levels. In addition, since hedge funds’ major counterparties are regulated by various
regulators with different jurisdictions, no single regulator has all the information necessary to evaluate
the complete risk profiles of hedge funds. Accordingly, the Council believes further analysis is needed,
and therefore is creating an interagency working group that will share and analyze relevant regulatory
information in order to better understand hedge fund activities and further assess whether there are
potential risks to financial stability. In particular, the working group will: (1) use regulatory and supervisory
data to evaluate the use of leverage in combination with other factors—such as counterparty exposures,
margining requirements, underlying assets, and trading strategies—for purposes of assessing potential risks
to financial stability; (2) assess the sufficiency and accuracy of existing data and information, including data
reported on Form PF, for evaluating risks to financial stability, and consider how the existing data might be
augmented to improve the ability to make such evaluations; and (3) consider potential enhancements to
and the establishment of standards governing the current measurements of leverage, including risk-based
measures of leverage.
In December 2015, the SEC issued a proposed rule on the use of derivatives by registered investment
companies, including mutual funds, ETFs, and business development companies. The Council welcomes
the SEC’s efforts to limit the amount of leverage that registered investment companies such as mutual funds
and ETFs may obtain through derivatives transactions, strengthen their asset segregation requirements, and
require derivatives risk management programs for certain funds. The Council intends to monitor the effects
of any regulatory changes and their implications for financial stability.
Regulators should consider whether aspects of any SEC rules regarding derivatives and data reporting
modernization, or other measures, may be appropriate for CIFs subject to their respective jurisdictions.
Regulators should consider how the industry may evolve as a result of any final SEC rules, whether additional
data is needed to comprehensively assess leverage risk at CIFs, and differences in regulatory regimes.
11
In May 2015, the SEC issued a proposed rule requiring registered investment advisers to provide annual
data on the separately managed accounts they manage. The SEC has proposed important enhancements
that would increase data available to monitor the use of leverage in separately managed accounts. The
Council welcomes these efforts and understands that the SEC is currently reviewing public comments on the
proposed rule. The Council intends to monitor the effects of any regulatory changes and their implications
for financial stability.
Operational Risk
The Council has considered whether a disruption or failure of a service provider, or the provision of a flawed
service, could result in a transmission of risk to the broader financial system. The use of service providers and
reliance on technology within the asset management industry calls for greater understanding of potential
risks. While the asset management industry, as with the financial industry as a whole, has placed increasing
emphasis on business continuity planning, and individual market participants have information on their own
service provider relationships, there is limited information available to enable regulators to assess operational
risks across the industry, including service provider risks. Although the incidents to date have not raised
financial stability concerns, this does not preclude the potential for future incidents to pose more serious
threats.
As a result, the Council will continue its analysis of potential service provider risks, including by engaging
with relevant industry participants and other stakeholders, which may also be useful in better understanding
potential service provider risks within the financial industry as a whole. The Council’s analysis is expected
to cover key functions performed by service providers to asset managers, including, among other things,
a review of the concentration of service providers, the level of outsourcing of particular services, and the
complexity of the infrastructure and activities supported by such providers. The Council will consider
whether there is the potential for operational disruptions or problems to cause significant losses and disrupt
market functioning. The Council also intends to further evaluate industry practices for managing these
risks, such as business continuity and disaster recovery planning for disruptions. As part of this analysis, the
Council will consider tools already available to mitigate risks from service providers, as well as potential ways
to enhance information sharing among regulators to help evaluate the extent of these risks.
Additionally, the Council will continue to work with the asset management industry and other components
of the financial services industry to promote information sharing, best practices, and efforts to improve
planning, response, and recovery from cyber incidents.
Securities Lending Risk
Without comprehensive information on securities lending activities across the financial system, regulators
cannot fully assess the severity of potential risks to financial stability in this area. Current estimates of the
total size of the securities lending market differ widely, and greater transparency is needed. Therefore, the
Council encourages enhanced and regular data collection and reporting, as well as interagency data sharing,
regarding securities lending activities.
The Council welcomes the efforts of the OFR, Federal Reserve System, and SEC on their recently completed
joint securities lending data collection pilot, which surveyed major securities lending agents to collect data
covering a wide array of lenders and borrowers. This data collection is critical to better understand securities
lending activities across different types of institutions. The Council encourages efforts to propose and adopt
a rule for a permanent collection. Data collection efforts should be expanded to include a greater number of
market participants. In addition, regulators should continue to monitor cash collateral reinvestment vehicles
Annua l Repor t Recommendat ions
2 0 1 6 F S O C / / Annual Report12
and explore ways to gather information on reinvestment practices occurring outside of the regulatory
perimeter. The Council encourages relevant agencies to report back to the Council on their assessment of
potential risks arising from securities lending activities based on these enhanced data gathering initiatives.
With regard to other data enhancements, the SEC issued a proposed rule in May 2015 to require funds
to report monthly on their securities lending activities, including certain counterparty information and
position-level information on Form N-PORT. The Council welcomes proposals by the SEC to collect
more detailed information on the characteristics of securities lending activities undertaken by registered
funds, including data on principal, collateral, counterparties, reinvestment practices, and indemnification
agreements.
Finally, the extent to which particular market participants operate across national boundaries is not clear
from available data, so it is difficult for regulators to determine how stresses in a foreign jurisdiction may
affect securities lending activities in the United States. As current estimates suggest that half of global
securities lending activities take place outside of the United States, the Council encourages member agencies
to work with key foreign counterparts on enhanced data collection across jurisdictions.
Resolvability and Transition Planning
Resolvability and transition challenges could exacerbate the risks arising from the stress or failure of an asset
manager or investment vehicle. In the case of a disorderly liquidation or abrupt failure of an investment
vehicle, resolution challenges could amplify the transmission of risks related to liquidity and redemption
or leverage. The Council’s analysis considered how advance planning by asset managers for certain
stress scenarios could mitigate such challenges. SEC staff is working to develop a proposed rule for SEC
consideration to require registered investment advisers to create and maintain transition plans that address,
among other things, a major disruption in their business. The Council welcomes the SEC’s efforts in this area
and will monitor the effects of any regulatory changes and their implications for financial stability.
3.3 Capital, Liquidity, and Resolution
Depository institutions across the system have taken meaningful steps to strengthen financial stability by
increasing capital levels and liquidity buffers. Meanwhile, regulatory agencies continue to develop and
implement rulemakings to further enhance the resilience of these institutions. For instance, in October 2015,
the Federal Reserve issued a proposed rule requiring U.S. G-SIBs and large FBOs operating in the United
States to maintain a minimum level of total loss-absorbing capacity and long-term debt that could be used to
recapitalize these firms' critical operations as part of the resolution process for the firm. The proposal would
also require these entities to maintain holding company structures that improve their resolvability. These
developments would further operationalize the orderly resolution of a large, complex financial institution,
and the Council recommends that the Federal Reserve continue to work toward finalizing these important
rules. The Council recommends continued vigilance by regulators to ensure there is enough capital and
liquidity at the largest financial institutions to reduce the vulnerability of these firms to economic and
financial shocks.
The FDIC and the Federal Reserve completed their review of the 2015 resolution plans of eight of the
largest, most complex U.S. BHCs. The agencies jointly determined that five of the firms had submitted plans
that were not credible or would not facilitate an orderly resolution under bankruptcy and have notified
these firms of the deficiencies in their plans. The agencies continue to review and provide feedback to all
resolution plan filers, including large BHCs and designated nonbank financial companies, regarding their
resolution plans. The agencies have also taken steps to streamline the information requirements of the plans
of smaller, less complex firms so as to reduce the burden of resolution planning for these firms. The Council
13
recommends that the agencies closely review the plans and take appropriate action, as set forth in the Dodd-
Frank Act, to promote resolvability under the U.S. Bankruptcy Code.
In November 2015, ISDA launched its 2015 Universal Resolution Stay Protocol, which expanded the ISDA
2014 Resolution Stay Protocol to cover securities financing transactions. Interested parties (most G-SIBs)
can submit a request to become an adhering party of the Protocol, and all eight U.S. G-SIBs have adhered.
The 2015 Protocol requires the adhering parties to follow special resolution regimes, which aim to ensure
that cross-border derivatives and securities financing transactions are subject to stays on cross-default and
early termination rights in the event a counterparty enters into resolution. Subjecting the contracts to these
stays enhances the ability of firms or regulators to facilitate an orderly resolution in the event of a firm’s
failure. The Council recommends that the appropriate member agencies take steps to provide for resolution
stay requirements consistent with the Protocol and to encourage a more widespread adoption of contractual
amendments for other financial contracts consistent with resolution stay requirements. The Council also
recommends that regulators and market participants continue to work together to facilitate industry-
developed mechanisms to address similar risks among other financial market participants and in other
financial contracts governed by standardized market documentation.
3.4 Central Counterparties
As noted in last year’s annual report, CCPs serve important risk-mitigating functions and are key to the
effective functioning of a number of markets. The financial stability benefits provided by central clearing are
only achievable if CCPs are highly resilient to potential stress. Regulators have made progress in promoting
robust risk management and greater transparency, including at systemically important CCPs.
The Council recommends that the Federal Reserve, CFTC, and SEC continue to coordinate in the
supervision of all CCPs that are designated as systemically important financial market utilities (FMUs).
Member agencies should continue to evaluate whether existing rules and standards for CCPs and their
clearing members are sufficiently robust to mitigate potential threats to financial stability, in consultation
with each other and the Council’s FMU Committee as well as other relevant forums. Member agencies should
also continue working with international standard setting bodies to identify and address areas of common
concern as additional derivatives clearing requirements are implemented in other jurisdictions. Further,
agencies should finalize any outstanding rules regarding CCP risk management standards under their
jurisdiction.
In addition, the Council encourages agencies to continue to study the interconnections between CCPs
and their clearing members to develop a greater understanding of the potential risks posed by these
interconnections. This work should include enhancing the resilience of the clearing system and examining
whether current disclosure standards provide market participants with sufficient information to assess their
exposures to CCPs. The Council also encourages private sector stakeholders to sponsor and organize a series
of CCP tabletop exercises across public and private sector stakeholders that would simulate a stress scenario
in an informal setting. Such exercises could improve CCPs’ coordination and identify potential operational
improvements in the case of a default by one or more clearing members across multiple systemically
important CCPs.
While regulators have made progress on CCP resolution planning, the Council encourages regulators to
continue working collaboratively to further develop resolution plans for systemically important CCPs that are
designed to ensure the continuity of critical services.
Annua l Repor t Recommendat ions
2 0 1 6 F S O C / / Annual Report14
3.5 Reforms of Wholesale Funding Markets
Repo Markets
Counterparty risk exposure has been significantly reduced in the tri-party repo market; however, more work
is needed to bring the settlement of GCF repo transactions in line with post-crisis reforms. The Council
recommends continued monitoring as the CCP responsible for settling interbank GCF repo transactions
suspends such transactions in July 2016, as well as sustained efforts by regulators and market participants to
reduce intraday credit usage in the interbank GCF repo settlement process.
Further, the potential for fire sales of collateral by creditors of a defaulted broker-dealer remains an
important risk. The Council recommends continued monitoring of market developments and recent reforms
to determine whether this risk is reasonably mitigated.
Lastly, data is needed to assist policymakers’ understanding of how the aggregate repo market operates, the
interdependencies of institutions and participants, and changes in risk characteristics, such as collateral and
haircuts. Though policymakers have improved visibility into the tri-party repo market, much less is known
about the bilateral repo market’s size, composition, concentration, pricing, or risk profile. The Council
recommends expanding and making permanent the voluntary pilot programs initiated by the OFR, Federal
Reserve System, and SEC to improve transparency and risk monitoring in this market.
Money Market Mutual Funds and Other Cash Management Vehicles
In recent years, the SEC adopted structural reforms of MMFs that are intended to make these vehicles less
susceptible to potentially destabilizing runs. These measures will be fully implemented later this year, and
the Council will continue to monitor and evaluate their effectiveness and broader implications for financial
stability, including any unintended consequences. In late 2015 and early 2016, the Council noted measurable
shifts between different MMF types in anticipation of the implementation deadline.
In addition, the Council recommends that regulators continue to assess the risks that may be posed by
other types of cash management vehicles—such as short-term investment funds (STIFs), local government
investment pools, pools for reinvestment of cash collateral from securities lending, and private liquidity
funds—and whether regulatory gaps exist for these vehicles. In 2012, the OCC adopted rules that enhanced
the reporting of data on STIFs operated by banks under its jurisdiction. The Council recommends that
regulators consider what additional data on other types of cash management vehicles is needed and take steps
to address any identified data gaps.
3.6 Reforms Relating to Reference Rates
In prior annual reports, the Council has recognized the importance of well-governed financial benchmarks
that are anchored in observable transactions and resilient against attempted manipulation. Recent progress
towards this goal has been made, but because of the scarcity of transactions in wholesale unsecured funding
markets, structural weaknesses in the widely used interbank offered rates remain. These weaknesses,
combined with the sustained reliance upon LIBOR in particular, necessitate further action by regulators and
market participants.
15Annua l Repor t Recommendat ions
To address these structural weaknesses, the Council recommends that the Alternative Reference Rates
Committee (ARRC) and other market participants continue to work to identify alternative, near risk-free
rates. The Council further recommends that the ARRC develop a credible implementation plan to achieve
a smooth transition to these new reference rates. Such a plan should include well-defined targets and,
when possible, detailed timelines in order to provide greater certainty to market participants. These steps
will in turn minimize the market confidence issues that may arise during the transition, encourage market
participants to abide by the proposed terms of the transition, and discourage market participants from
divesting contracts tied to old benchmarks in a disorderly manner.
3.7 Data Quality, Collection, and Sharing
Addressing data needs for the analysis of potential threats to financial stability remains an important
priority of the Council, as mentioned in prior reports. The Council recommends that regulators and market
participants continue to work together to improve the coverage, quality, and accessibility of financial data, as
well as data sharing between relevant agencies. Data sharing improvements may include developing stronger
data sharing agreements, collecting common data using standard methodologies, developing and linking
together data inventories, and promoting standard criteria, protocols, and appropriately strong security
controls to streamline secure sharing of datasets.
Securities Financing Data
Following on the recent pilot data collections of securities financing transactions, the Council recommends
that the appropriate member agencies continue to develop a permanent data collection program and to
design the collection and its implementation in a manner that facilitates secure sharing and integration of
the data with that of other member agencies, in particular with similar data such as that gathered by the tri-
party repo collection discussed in Section 5.4.1. This task includes making appropriately aggregated statistics
available to the public and contributing to data aggregation and data sharing efforts under the auspices of
the Financial Stability Board (FSB) and the Committee on Payments and Market Infrastructures and the
International Organization of Securities Commissions (CPMI-IOSCO) to gain better understanding of cross-
border flows of securities financing transactions by multi-national financial institutions.
Legal Entity Identifier
Broader adoption of the legal entity identifier (LEI) by financial market participants continues to be a
Council priority. When the global LEI system begins collecting and publishing information on entity
hierarchy data, it will be critical that all legal entities within a complex financial institution have an LEI
so that a complete picture of these ownership structures can be viewed by authorities and the public. To
facilitate this broad coverage of the LEI, the Council recommends that member agencies continue moving to
adopt the use of the LEI in regulatory reporting and other data collections, where appropriate.
Mortgage Data Standards
The Council recommends that member agencies update their regulatory mortgage data collections to
include universal loan identifier (ULI) and LEI fields, so these fields are paired with loan records throughout
a loan’s lifecycle. The Council also recommends that member agencies support the adoption and use of
standards in mortgage data, including consistent terms, definitions, and data quality controls, so transfers of
loans or their servicing rights create no disruptions to borrowers or investors.
2 0 1 6 F S O C / / Annual Report16
Derivatives Data
Following the ongoing work by the CFTC, with collaboration from the OFR, to harmonize derivatives
data reporting, the Council recommends that members and member agencies continue to work on global
derivatives data reporting harmonization. Further, given the Congressional repeal of the Dodd-Frank Title
VII swap data repository (SDR) indemnification requirement in December 2015, the Council recommends
member agencies and the OFR collaborate to identify areas that would benefit from direct access to such
granular data collected by the CFTC- and SEC-registered SDRs. These include cross-market monitoring
of threats to financial stability, expediting harmonization of derivatives data, promoting best practices for
global data aggregation and sharing, and assisting prudential regulation of swap-related activities, as well as
monitoring of capital requirements.
Insurance Data
The Council recommends that state regulators and the National Association of Insurance Commissioners
(NAIC) continue their ongoing work that improves the transparency of captive reinsurance transactions,
including by making publicly available additional financial statement information of captive reinsurers.
FIO should continue to monitor and report on issues involved with the regulatory treatment of captive
reinsurance.
Pension Data
The Council supports efforts to improve the quality and timeliness of pension data and reporting. The
Council recommends that pension regulators continue to work to improve the timeliness and the quality and
depth of disclosure of pension financial statements, and will continue to monitor financial developments in
pensions.
3.8 Housing Finance Reform
The domestic housing market continued to improve over the past year as sales of new and existing homes
increased, prices rose, and the share of properties with negative equity fell. Meanwhile, post-crisis regulatory
reforms to the housing finance system within the framework of existing legislation have largely been
implemented. Fannie Mae and Freddie Mac (the GSEs) have reduced their retained portfolios more than
50 percent below their levels at year-end 2008 and are now engaging in credit risk transfers on 90 percent
of their typical 30-year fixed-rate mortgage acquisitions. Federal regulators have completed rules that
more clearly define risk retention requirements for mortgage securitizations, and the representations and
warranties framework that governs lender repurchases of defective loans has been refined. The Council
recommends that regulators and market participants continue to take steps to encourage private capital to
play a larger role in the housing finance system.
FHFA and the GSEs have also made progress on the development of a new housing finance infrastructure,
including the Common Securitization Platform (CSP) and a single agency mortgage-backed security. The
Council recommends that efforts to advance both the CSP and single security continue.
Notwithstanding the above progress, the GSEs are now into their eighth year of conservatorship. The
Council acknowledges that, under existing regulatory authorities, federal and state regulators are
approaching the limits of their ability to enact reforms that foster a vibrant, resilient housing finance system.
The Council therefore reaffirms its view that housing finance reform legislation is needed to create a more
sustainable system.
17Annua l Repor t Recommendat ions
3.9 Risk Management in an Environment of Low Interest Rates and Rising Asset Price Volatility
Domestic and foreign interest rates remained quite low by historical standards over the last year. The
Council has long been attentive to the risk that the ongoing low-interest-rate environment may lead some
market participants to take on risk to gain higher net yields by relying more heavily on short-term financing,
increasing leverage, or shifting toward assets that are less liquid or contain greater market or credit risk.
Such behavior can contribute to excessive asset valuations, which can leave investors susceptible to rapid,
unexpected price declines. The Council recommends that supervisors, regulators, and firm management
continue to closely monitor and assess the heightened risks resulting from continued reach-for-yield behavior.
Loan growth and underwriting standards in commercial real estate (CRE) have been a point of focus for
prudential regulators. In December 2015, the Federal Reserve, the FDIC, and the OCC jointly issued a
statement reminding financial institutions of existing regulatory guidance on prudent risk management
practices for CRE lending. The agencies have observed substantial growth in many CRE asset and lending
markets, increased competitive pressures, rising CRE concentrations in banks, and an easing of CRE
underwriting standards. The statement affirms that financial institutions should maintain underwriting
discipline and exercise prudent risk-management practices to identify, measure, monitor, and manage the
risks arising from CRE lending.
Continuing a trend that began in late 2014, energy prices fell and volatility moved sharply upward in
2015. 2015 also saw falling valuations in high-yield corporate debt markets and significant swings in
equity valuations. Rising price volatility and stressed asset valuations can pose challenges for those market
participants that are highly leveraged or hold concentrated or inadequately hedged exposures to affected
market segments. In this environment, it is important that firms maintain robust risk management standards.
The Council recommends that supervisors, regulators, and firm management continue to closely monitor
and assess financial institutions’ exposures to asset classes experiencing increased volatility, particularly
where there are indications that prior reach-for-yield behavior may have contributed to valuation pressure.
Regulators should be attentive to the potential for a substantial increase in asset market volatility to
contribute to destabilizing feedback effects such as asset fire sales or adverse liquidity or leverage spirals.
To lessen the risk of such phenomena, financial regulators should continue working to ensure that financial
institutions maintain robust risk management standards at all points in the credit, business, and interest
rate cycles.
3.10 Changes in Financial Market Structure and Implications for Financial Stability
Markets have continued to function well over the past year, despite a notable rise in volatility. Traditional
intermediaries are better capitalized and better positioned to withstand periods of stress than they were prior
to the crisis. With the growing importance in certain markets of proprietary trading firms and other market
participants that make use of automated trading systems, access to those markets has increased and costs
for investors and issuers have generally fallen. However, there may be some new risks that are materializing,
particularly within fixed income markets, with possible impacts to market functioning and financial stability.
2 0 1 6 F S O C / / Annual Report18
This past year, the Treasury, Federal Reserve, FRBNY, CFTC, and SEC issued a joint staff report to assess
the period of intraday volatility in the Treasury market on October 15, 2014. This study examined trading
patterns on that day and highlighted the importance of firms that use automated trading systems to transact
in Treasury securities and related instruments. It also raised important questions about differing forms
of regulatory oversight, market transparency, and the possible need for increased trade reporting and
monitoring by the official sector. On January 22, 2016, the Treasury released a Request for Information
(RFI) asking market participants for their views about the evolving structure of the Treasury market and
the implications for market functioning, liquidity provisioning, and risk management practices. In addition,
the RFI calls for more data reporting for the official sector to facilitate enhanced current analysis and
event monitoring. The Council supports these efforts and encourages expanding this examination beyond
Treasury securities to the entire interest rate products complex. The Council should take up such an
examination across interest rate products and venues to examine regulatory treatment of products that
have highly correlated underlying risk drivers, and, where appropriate, consider steps to harmonize
regulatory treatment.
The Council supports primary regulators in efforts to create greater transparency and resilience of all
market participants. The Council supports increased member agency coordination of oversight and
regulatory developments pertinent to financial stability risks as markets evolve. In particular, the Council
supports exploring the use of coordinated tools such as trading halts, with careful consideration of
tradeoffs that such tools may present, across heavily interdependent markets during periods of market
stress, operational failure, or other incidents that may pose a threat to financial stability. The Council also
recommends enhanced data and information sharing among member agencies to create timely, accurate,
and responsive monitoring tools.
3.11 Financial Innovation and Migration of Activities
Continued innovation is critical to the long-term health of the U.S. financial system. It is the means by which
market participants respond to changing marketplace demands, make use of new technology, and adapt to
evolving regulatory constraints. New financial products, delivery mechanisms, and business practices offer
opportunities to lower transaction costs and improve efficiency, but they may also embed risks, such as credit
risk associated with the use of new and untested underwriting models. In other instances, risks embedded
in new products and practices may be difficult to foresee. Accordingly, the Council encourages financial
regulators to continue to monitor and evaluate the implications of how new products and practices affect
regulated entities and financial markets, and to assess whether they could pose risks to financial stability.
In addition, the Council recommends that policies to protect consumers should be reviewed on an ongoing
basis to assess the appropriate treatment of new products.
19Financ ia l Deve lopments
4.1.1 Federal Debt Held by the Public
4.1.2 10-Year Treasury Yields
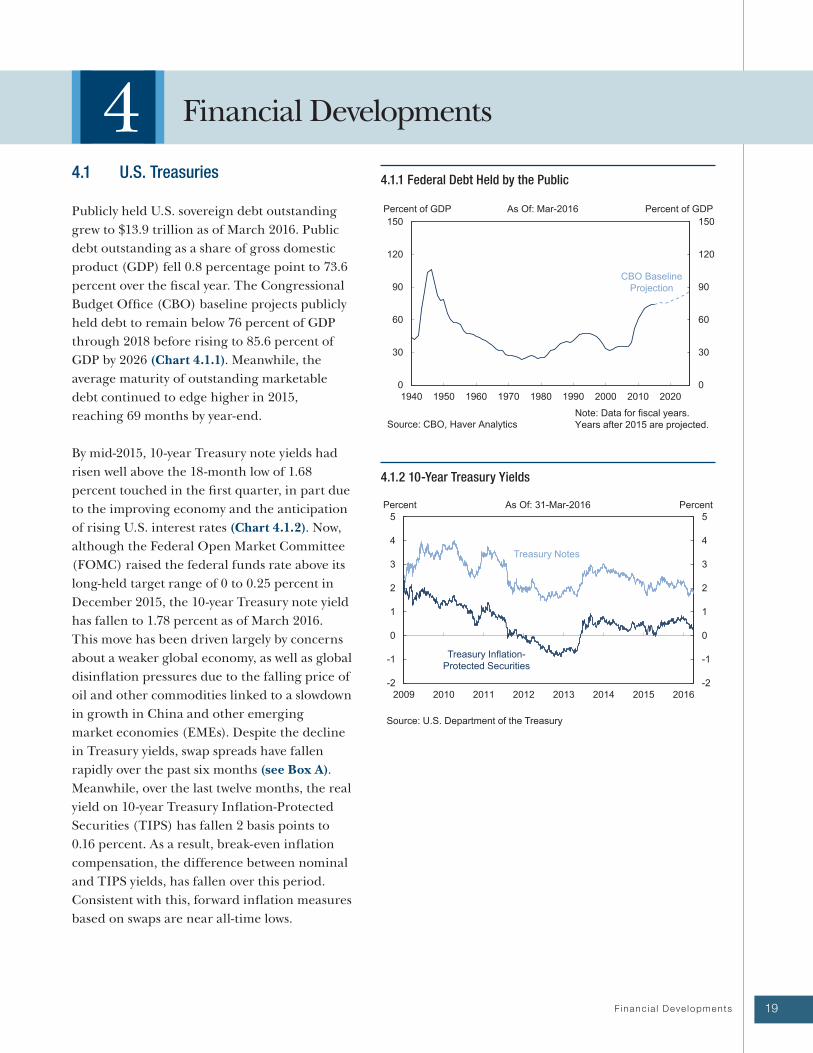
4.1 U.S. Treasuries
Publicly held U.S. sovereign debt outstanding
grew to $13.9 trillion as of March 2016. Public
debt outstanding as a share of gross domestic
product (GDP) fell 0.8 percentage point to 73.6
percent over the fiscal year. The Congressional
Budget Office (CBO) baseline projects publicly
held debt to remain below 76 percent of GDP
through 2018 before rising to 85.6 percent of
GDP by 2026 (Chart 4.1.1). Meanwhile, the
average maturity of outstanding marketable
debt continued to edge higher in 2015,
reaching 69 months by year-end.
By mid-2015, 10-year Treasury note yields had
risen well above the 18-month low of 1.68
percent touched in the first quarter, in part due
to the improving economy and the anticipation
of rising U.S. interest rates (Chart 4.1.2). Now,
although the Federal Open Market Committee
(FOMC) raised the federal funds rate above its
long-held target range of 0 to 0.25 percent in
December 2015, the 10-year Treasury note yield
has fallen to 1.78 percent as of March 2016.
This move has been driven largely by concerns
about a weaker global economy, as well as global
disinflation pressures due to the falling price of
oil and other commodities linked to a slowdown
in growth in China and other emerging
market economies (EMEs). Despite the decline
in Treasury yields, swap spreads have fallen
rapidly over the past six months (see Box A).
Meanwhile, over the last twelve months, the real
yield on 10-year Treasury Inflation-Protected
Securities (TIPS) has fallen 2 basis points to
0.16 percent. As a result, break-even inflation
compensation, the difference between nominal
and TIPS yields, has fallen over this period.
Consistent with this, forward inflation measures
based on swaps are near all-time lows.
4 Financial Developments
20 2 0 1 6 F S O C / / Annual Report
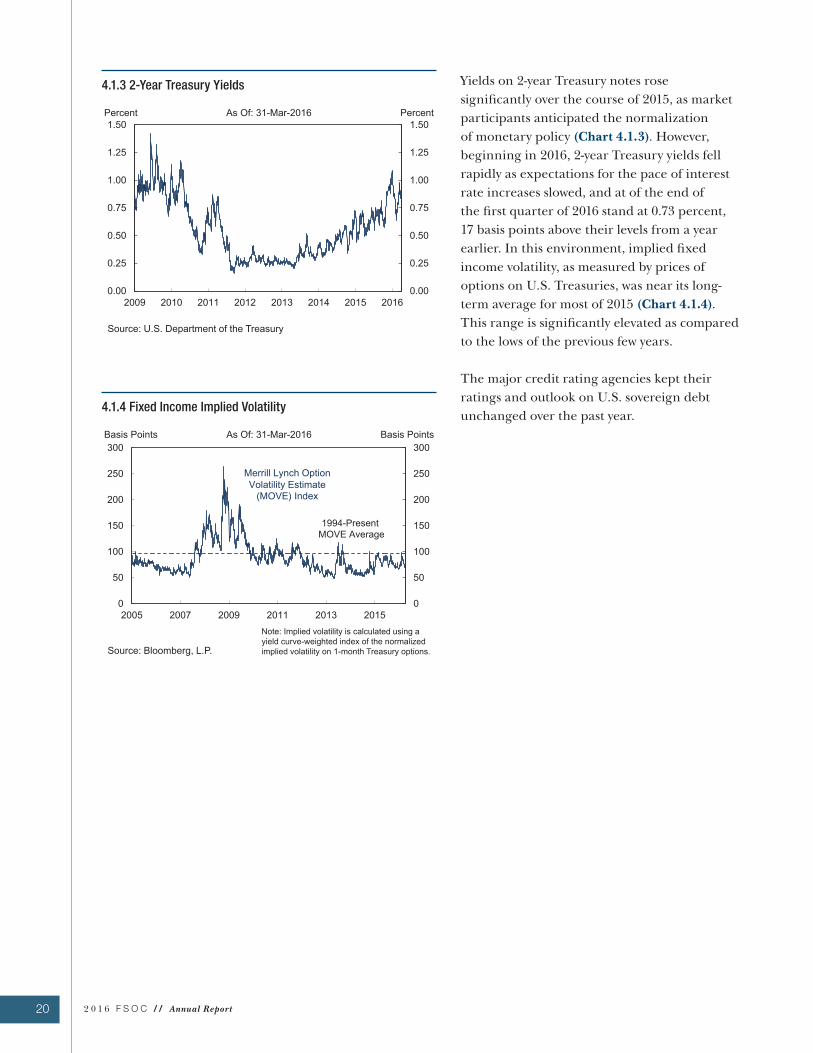
4.1.4 Fixed Income Implied Volatility
4.1.3 2-Year Treasury Yields Yields on 2-year Treasury notes rose
significantly over the course of 2015, as market
participants anticipated the normalization
of monetary policy (Chart 4.1.3). However,
beginning in 2016, 2-year Treasury yields fell
rapidly as expectations for the pace of interest
rate increases slowed, and at of the end of
the first quarter of 2016 stand at 0.73 percent,
17 basis points above their levels from a year
earlier. In this environment, implied fixed
income volatility, as measured by prices of
options on U.S. Treasuries, was near its long-
term average for most of 2015 (Chart 4.1.4).
This range is significantly elevated as compared
to the lows of the previous few years.
The major credit rating agencies kept their
ratings and outlook on U.S. sovereign debt
unchanged over the past year.
21Financ ia l Deve lopments
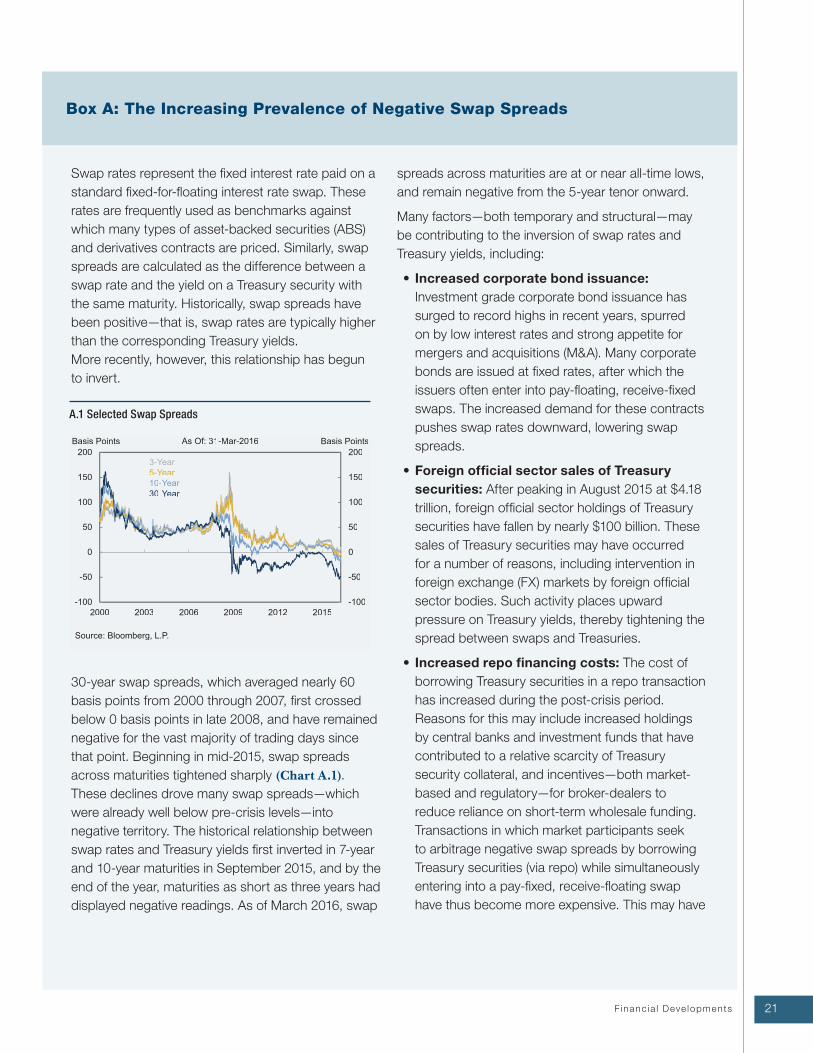
Swap rates represent the fixed interest rate paid on a
standard fixed-for-floating interest rate swap. These
rates are frequently used as benchmarks against
which many types of asset-backed securities (ABS)
and derivatives contracts are priced. Similarly, swap
spreads are calculated as the difference between a
swap rate and the yield on a Treasury security with
the same maturity. Historically, swap spreads have
been positive—that is, swap rates are typically higher
than the corresponding Treasury yields.
More recently, however, this relationship has begun
to invert.
30-year swap spreads, which averaged nearly 60
basis points from 2000 through 2007, first crossed
below 0 basis points in late 2008, and have remained
negative for the vast majority of trading days since
that point. Beginning in mid-2015, swap spreads
across maturities tightened sharply (Chart A.1).
These declines drove many swap spreads—which
were already well below pre-crisis levels—into
negative territory. The historical relationship between
swap rates and Treasury yields first inverted in 7-year
and 10-year maturities in September 2015, and by the
end of the year, maturities as short as three years had
displayed negative readings. As of March 2016, swap
spreads across maturities are at or near all-time lows,
and remain negative from the 5-year tenor onward.
Many factors—both temporary and structural—may
be contributing to the inversion of swap rates and
Treasury yields, including:
• Increased corporate bond issuance:
Investment grade corporate bond issuance has
surged to record highs in recent years, spurred
on by low interest rates and strong appetite for
mergers and acquisitions (M&A). Many corporate
bonds are issued at fixed rates, after which the
issuers often enter into pay-floating, receive-fixed
swaps. The increased demand for these contracts
pushes swap rates downward, lowering swap
spreads.
• Foreign official sector sales of Treasury
securities: After peaking in August 2015 at $4.18
trillion, foreign official sector holdings of Treasury
securities have fallen by nearly $100 billion. These
sales of Treasury securities may have occurred
for a number of reasons, including intervention in
foreign exchange (FX) markets by foreign official
sector bodies. Such activity places upward
pressure on Treasury yields, thereby tightening the
spread between swaps and Treasuries.
• Increased repo financing costs: The cost of
borrowing Treasury securities in a repo transaction
has increased during the post-crisis period.
Reasons for this may include increased holdings
by central banks and investment funds that have
contributed to a relative scarcity of Treasury
security collateral, and incentives—both market-
based and regulatory—for broker-dealers to
reduce reliance on short-term wholesale funding.
Transactions in which market participants seek
to arbitrage negative swap spreads by borrowing
Treasury securities (via repo) while simultaneously
entering into a pay-fixed, receive-floating swap
have thus become more expensive. This may have
Box A: The Increasing Prevalence of Negative Swap Spreads
A.1 Selected Swap Spreads
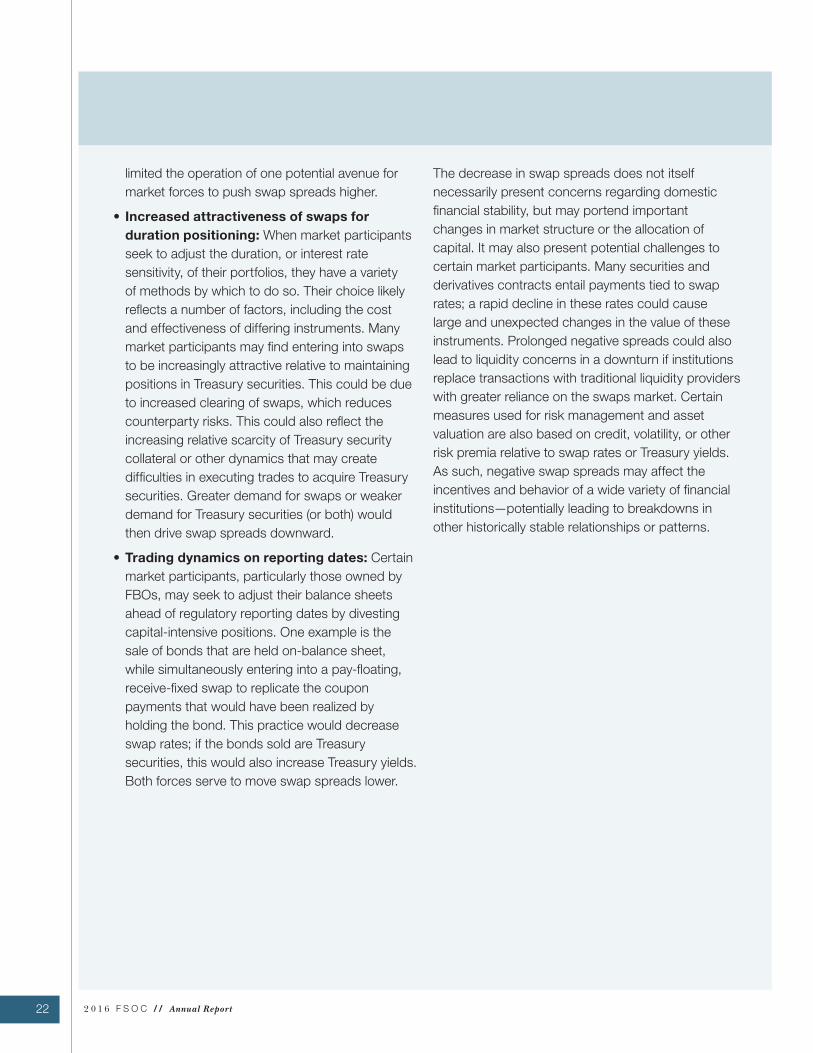
2 0 1 6 F S O C / / Annual Report22
limited the operation of one potential avenue for
market forces to push swap spreads higher.
• Increased attractiveness of swaps for
duration positioning: When market participants
seek to adjust the duration, or interest rate
sensitivity, of their portfolios, they have a variety
of methods by which to do so. Their choice likely
reflects a number of factors, including the cost
and effectiveness of differing instruments. Many
market participants may find entering into swaps
to be increasingly attractive relative to maintaining
positions in Treasury securities. This could be due
to increased clearing of swaps, which reduces
counterparty risks. This could also reflect the
increasing relative scarcity of Treasury security
collateral or other dynamics that may create
difficulties in executing trades to acquire Treasury
securities. Greater demand for swaps or weaker
demand for Treasury securities (or both) would
then drive swap spreads downward.
• Trading dynamics on reporting dates: Certain
market participants, particularly those owned by
FBOs, may seek to adjust their balance sheets
ahead of regulatory reporting dates by divesting
capital-intensive positions. One example is the
sale of bonds that are held on-balance sheet,
while simultaneously entering into a pay-floating,
receive-fixed swap to replicate the coupon
payments that would have been realized by
holding the bond. This practice would decrease
swap rates; if the bonds sold are Treasury
securities, this would also increase Treasury yields.
Both forces serve to move swap spreads lower.
The decrease in swap spreads does not itself
necessarily present concerns regarding domestic
financial stability, but may portend important
changes in market structure or the allocation of
capital. It may also present potential challenges to
certain market participants. Many securities and
derivatives contracts entail payments tied to swap
rates; a rapid decline in these rates could cause
large and unexpected changes in the value of these
instruments. Prolonged negative spreads could also
lead to liquidity concerns in a downturn if institutions
replace transactions with traditional liquidity providers
with greater reliance on the swaps market. Certain
measures used for risk management and asset
valuation are also based on credit, volatility, or other
risk premia relative to swap rates or Treasury yields.
As such, negative swap spreads may affect the
incentives and behavior of a wide variety of financial
institutions—potentially leading to breakdowns in
other historically stable relationships or patterns.
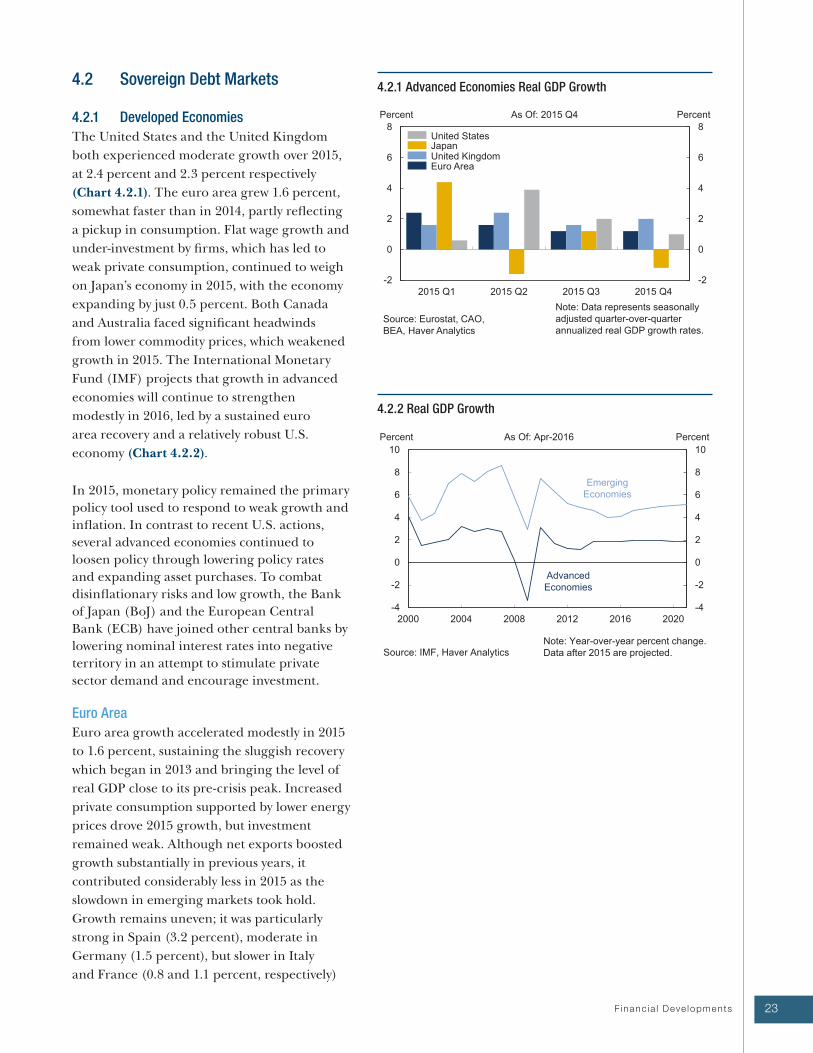
23Financ ia l Deve lopments
4.2.2 Real GDP Growth
4.2.1 Advanced Economies Real GDP Growth4.2 Sovereign Debt Markets
4.2.1 Developed Economies
The United States and the United Kingdom
both experienced moderate growth over 2015,
at 2.4 percent and 2.3 percent respectively
(Chart 4.2.1). The euro area grew 1.6 percent,
somewhat faster than in 2014, partly reflecting
a pickup in consumption. Flat wage growth and
under-investment by firms, which has led to
weak private consumption, continued to weigh
on Japan’s economy in 2015, with the economy
expanding by just 0.5 percent. Both Canada
and Australia faced significant headwinds
from lower commodity prices, which weakened
growth in 2015. The International Monetary
Fund (IMF) projects that growth in advanced
economies will continue to strengthen
modestly in 2016, led by a sustained euro
area recovery and a relatively robust U.S.
economy (Chart 4.2.2).
In 2015, monetary policy remained the primary
policy tool used to respond to weak growth and
inflation. In contrast to recent U.S. actions,
several advanced economies continued to
loosen policy through lowering policy rates
and expanding asset purchases. To combat
disinflationary risks and low growth, the Bank
of Japan (BoJ) and the European Central
Bank (ECB) have joined other central banks by
lowering nominal interest rates into negative
territory in an attempt to stimulate private
sector demand and encourage investment.
Euro Area
Euro area growth accelerated modestly in 2015
to 1.6 percent, sustaining the sluggish recovery
which began in 2013 and bringing the level of
real GDP close to its pre-crisis peak. Increased
private consumption supported by lower energy
prices drove 2015 growth, but investment
remained weak. Although net exports boosted
growth substantially in previous years, it
contributed considerably less in 2015 as the
slowdown in emerging markets took hold.
Growth remains uneven; it was particularly
strong in Spain (3.2 percent), moderate in
Germany (1.5 percent), but slower in Italy
and France (0.8 and 1.1 percent, respectively)
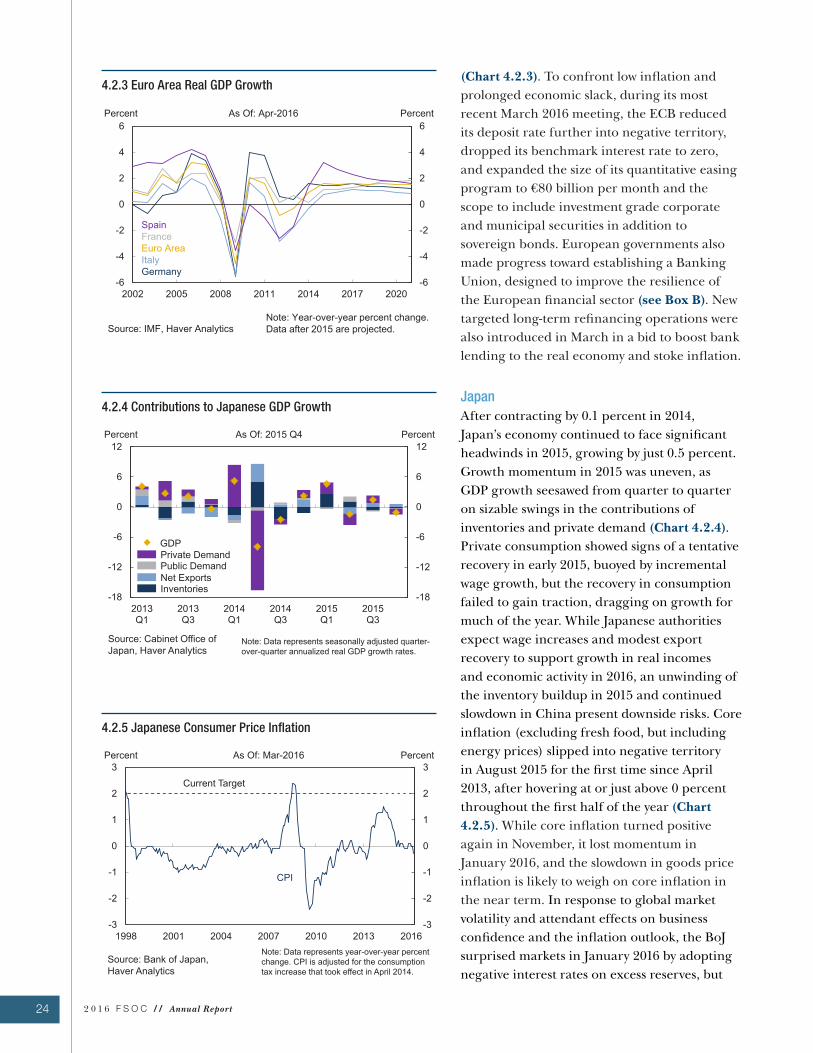
24 2 0 1 6 F S O C / / Annual Report
4.2.5 Japanese Consumer Price Inflation
4.2.4 Contributions to Japanese GDP Growth
4.2.3 Euro Area Real GDP Growth(Chart 4.2.3). To confront low inflation and
prolonged economic slack, during its most
recent March 2016 meeting, the ECB reduced
its deposit rate further into negative territory,
dropped its benchmark interest rate to zero,
and expanded the size of its quantitative easing
program to €80 billion per month and the
scope to include investment grade corporate
and municipal securities in addition to
sovereign bonds. European governments also
made progress toward establishing a Banking
Union, designed to improve the resilience of
the European financial sector (see Box B). New
targeted long-term refinancing operations were
also introduced in March in a bid to boost bank
lending to the real economy and stoke inflation.
Japan
After contracting by 0.1 percent in 2014,
Japan’s economy continued to face significant
headwinds in 2015, growing by just 0.5 percent.
Growth momentum in 2015 was uneven, as
GDP growth seesawed from quarter to quarter
on sizable swings in the contributions of
inventories and private demand (Chart 4.2.4).
Private consumption showed signs of a tentative
recovery in early 2015, buoyed by incremental
wage growth, but the recovery in consumption
failed to gain traction, dragging on growth for
much of the year. While Japanese authorities
expect wage increases and modest export
recovery to support growth in real incomes
and economic activity in 2016, an unwinding of
the inventory buildup in 2015 and continued
slowdown in China present downside risks. Core
inflation (excluding fresh food, but including
energy prices) slipped into negative territory
in August 2015 for the first time since April
2013, after hovering at or just above 0 percent
throughout the first half of the year (Chart
4.2.5). While core inflation turned positive
again in November, it lost momentum in
January 2016, and the slowdown in goods price
inflation is likely to weigh on core inflation in
the near term. In response to global market
volatility and attendant effects on business
confidence and the inflation outlook, the BoJ
surprised markets in January 2016 by adopting
negative interest rates on excess reserves, but
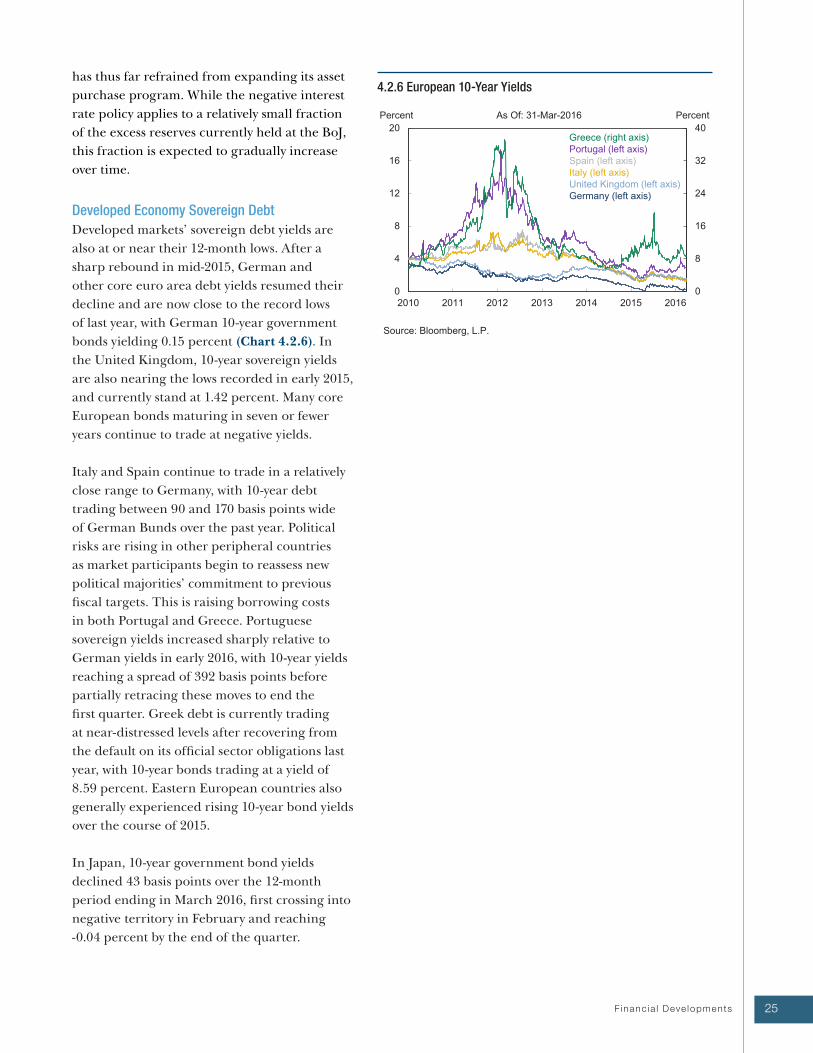
25Financ ia l Deve lopments
4.2.6 European 10-Year Yieldshas thus far refrained from expanding its asset
purchase program. While the negative interest
rate policy applies to a relatively small fraction
of the excess reserves currently held at the BoJ,
this fraction is expected to gradually increase
over time.
Developed Economy Sovereign Debt
Developed markets’ sovereign debt yields are
also at or near their 12-month lows. After a
sharp rebound in mid-2015, German and
other core euro area debt yields resumed their
decline and are now close to the record lows
of last year, with German 10-year government
bonds yielding 0.15 percent (Chart 4.2.6). In
the United Kingdom, 10-year sovereign yields
are also nearing the lows recorded in early 2015,
and currently stand at 1.42 percent. Many core
European bonds maturing in seven or fewer
years continue to trade at negative yields.
Italy and Spain continue to trade in a relatively
close range to Germany, with 10-year debt
trading between 90 and 170 basis points wide
of German Bunds over the past year. Political
risks are rising in other peripheral countries
as market participants begin to reassess new
political majorities’ commitment to previous
fiscal targets. This is raising borrowing costs
in both Portugal and Greece. Portuguese
sovereign yields increased sharply relative to
German yields in early 2016, with 10-year yields
reaching a spread of 392 basis points before
partially retracing these moves to end the
first quarter. Greek debt is currently trading
at near-distressed levels after recovering from
the default on its official sector obligations last
year, with 10-year bonds trading at a yield of
8.59 percent. Eastern European countries also
generally experienced rising 10-year bond yields
over the course of 2015.
In Japan, 10-year government bond yields
declined 43 basis points over the 12-month
period ending in March 2016, first crossing into
negative territory in February and reaching
-0.04 percent by the end of the quarter.
2 0 1 6 F S O C / / Annual Report26
Box B: Developments in the European Banking Union
In response to the banking and sovereign debt
crises in the euro area, the Heads of State
and Government of the EU and the European
Commission proposed the creation of a Banking
Union in 2012. The proposal aimed to help
restore financial stability by weakening the link
between banks and their sovereigns and facilitate
the application of EU rules to banks within
the Banking Union. With a common financial
regulatory framework as its basis, the proposal
included such initiatives as a single supervisory
mechanism, a single resolution mechanism, and
a single deposit guarantee scheme. Several of
these initiatives have since been implemented;
today, the union consists of euro area Member
States and is open to non-euro Member States
that choose to join.
Single Supervisory Mechanism and Single
Resolution Mechanism
The Single Supervisory Mechanism (SSM)
constituted one of the pillars of the Banking
Union and took full effect in November 2014.
Under the SSM, the ECB took on increased
responsibility for supervising banks in the Banking
Union. The ECB now supervises “significant”
institutions directly and coordinates with national
supervisors to help supervise institutions
considered “less significant.” In addition, at any
time, the ECB can decide to directly supervise
any one of these latter institutions to ensure the
consistent application of heightened supervisory
standards. As mandated by the SSM, several key
supervisory responsibilities of the ECB include
ensuring the safety and soundness of banks
under its authority, ensuring compliance with
EU prudential rules, and setting higher capital
requirements as necessary.
Related to the SSM is the Single Resolution
Mechanism (SRM), an initiative designed to
provide failing banks with a path toward orderly
resolution while minimizing costs to the taxpayer.
The SRM took full effect in January 2016 and
established the Single Resolution Board (SRB), a
central resolution authority. While working closely
with national resolution authorities within the
Banking Union, the SRB is expected to manage
the resolution of significant and cross-border
banking groups established within participating
Member States. In coordination with the
applicable supervisors, the SRB has the ability to
influence capital levels by assigning a minimum
requirement for own funds and eligible liabilities
(MREL) on a case-by-case basis for firms under
the SRB’s direct authority. In addition, national
resolution authorities within the Banking Union will
set MREL for firms under their purview following
general instructions from the SRB.
The SRM also established the bank-funded
Single Resolution Fund (SRF), which can be
used to finance the resolution and potential
recapitalization of banks in the Banking Union.
The size of the SRF is targeted at 1 percent of
covered bank deposits in Banking Union Member
States, approximately €55 billion, to be built up
and mutualized among banks over the next eight
years.
European Deposit Insurance Scheme
In November 2015, the European Commission
published a legislative proposal for another major
Banking Union initiative: a common deposit
insurance system, referred to as the European
Deposit Insurance Scheme (EDIS). Although a
system of national deposit guarantee schemes
and minimum standards exists in the EU
currently, that system remains vulnerable to local
27Financ ia l Deve lopments
shocks, sovereign credit problems, and concerns
related to the absence of an explicit lender of
last resort. The EDIS proposal seeks to address
these vulnerabilities and reduce the risk of
contagion. Legislative approval by the European
Council and European Parliament is subject to
continued debate regarding the extent to which
the proposal’s implementation should be linked to
certain risk-reducing measures, such as limiting
bank exposures to individual sovereigns.
If passed, participation in EDIS will be mandatory
for each deposit guarantee scheme of the
Banking Union Member States. The European
Commission proposes funding the related
European Deposit Insurance Fund (EDIF)
through contributions by banks, to reach a
target of 0.8 percent of covered deposits in the
Banking Union (currently close to €43 billion) by
2024, and mutualizing the deposit insurance in
stages. The SRB would be modified to create a
governance structure that would administer EDIF
in coordination with SRF.
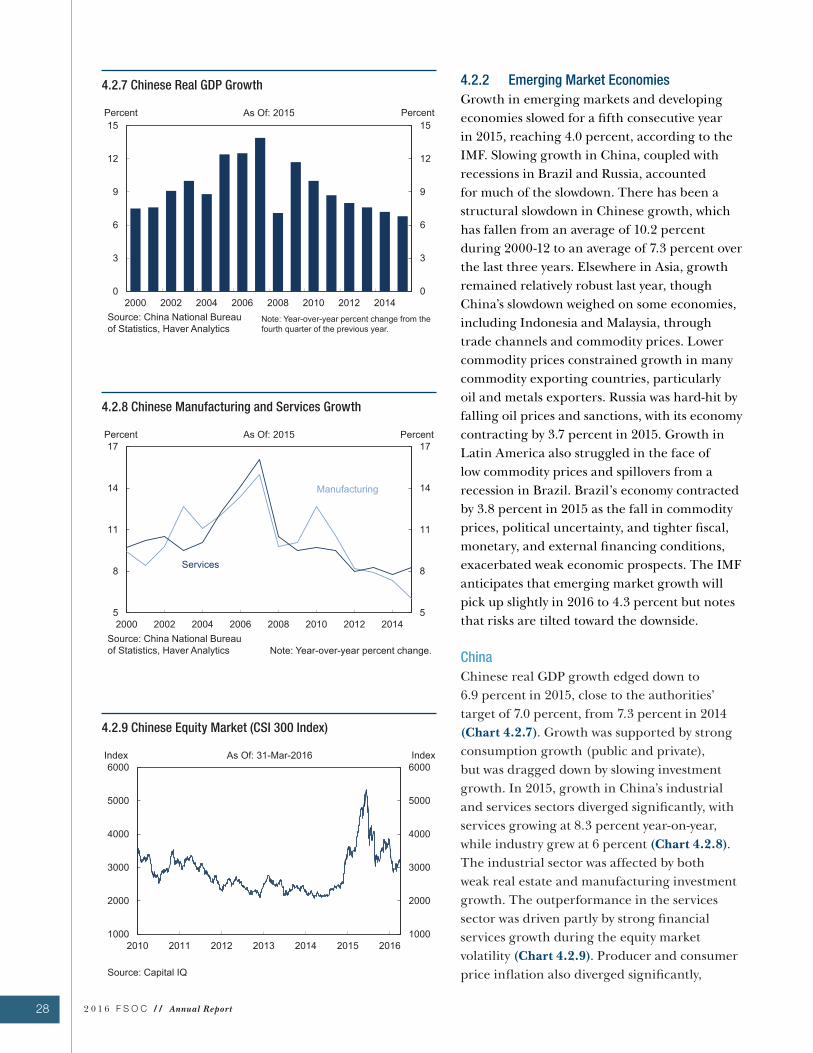
28 2 0 1 6 F S O C / / Annual Report
4.2.9 Chinese Equity Market (CSI 300 Index)
4.2.8 Chinese Manufacturing and Services Growth
4.2.7 Chinese Real GDP Growth 4.2.2 Emerging Market Economies
Growth in emerging markets and developing
economies slowed for a fifth consecutive year
in 2015, reaching 4.0 percent, according to the
IMF. Slowing growth in China, coupled with
recessions in Brazil and Russia, accounted
for much of the slowdown. There has been a
structural slowdown in Chinese growth, which
has fallen from an average of 10.2 percent
during 2000-12 to an average of 7.3 percent over
the last three years. Elsewhere in Asia, growth
remained relatively robust last year, though
China’s slowdown weighed on some economies,
including Indonesia and Malaysia, through
trade channels and commodity prices. Lower
commodity prices constrained growth in many
commodity exporting countries, particularly
oil and metals exporters. Russia was hard-hit by
falling oil prices and sanctions, with its economy
contracting by 3.7 percent in 2015. Growth in
Latin America also struggled in the face of
low commodity prices and spillovers from a
recession in Brazil. Brazil’s economy contracted
by 3.8 percent in 2015 as the fall in commodity
prices, political uncertainty, and tighter fiscal,
monetary, and external financing conditions,
exacerbated weak economic prospects. The IMF
anticipates that emerging market growth will
pick up slightly in 2016 to 4.3 percent but notes
that risks are tilted toward the downside.
China
Chinese real GDP growth edged down to
6.9 percent in 2015, close to the authorities’
target of 7.0 percent, from 7.3 percent in 2014
(Chart 4.2.7). Growth was supported by strong
consumption growth (public and private),
but was dragged down by slowing investment
growth. In 2015, growth in China’s industrial
and services sectors diverged significantly, with
services growing at 8.3 percent year-on-year,
while industry grew at 6 percent (Chart 4.2.8).
The industrial sector was affected by both
weak real estate and manufacturing investment
growth. The outperformance in the services
sector was driven partly by strong financial
services growth during the equity market
volatility (Chart 4.2.9). Producer and consumer
price inflation also diverged significantly,
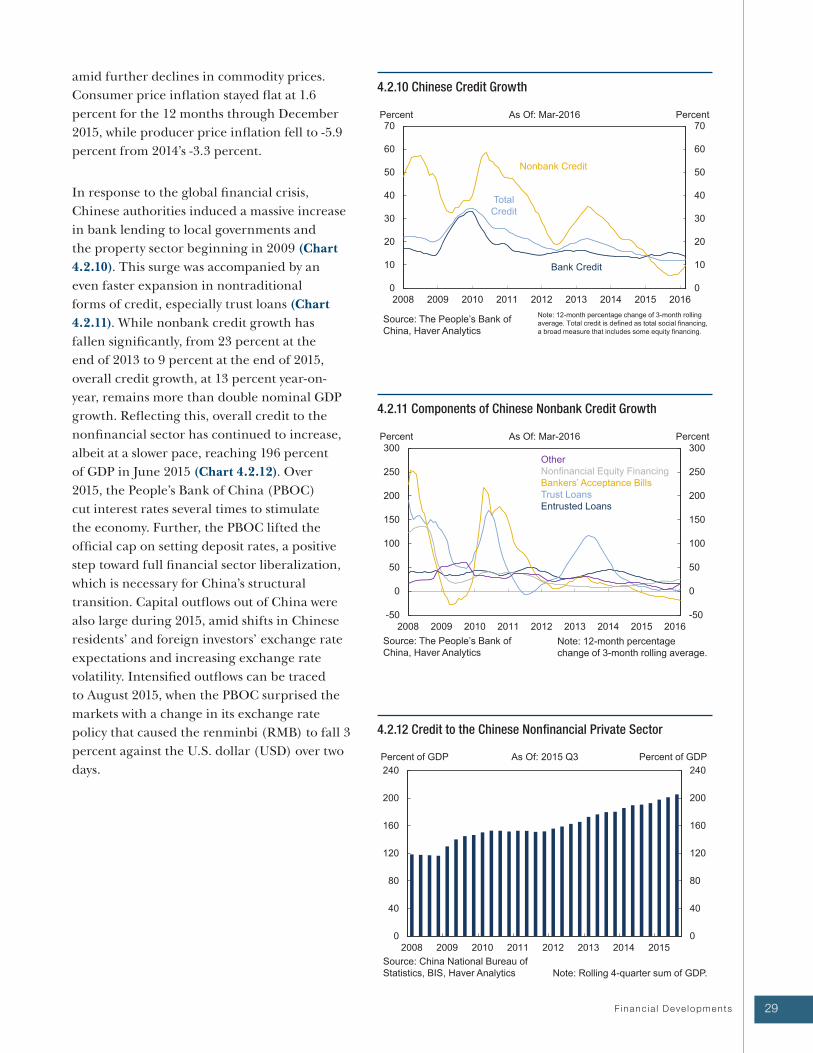
29Financ ia l Deve lopments
4.2.12 Credit to the Chinese Nonfinancial Private Sector
4.2.11 Components of Chinese Nonbank Credit Growth
4.2.10 Chinese Credit Growthamid further declines in commodity prices.
Consumer price inflation stayed flat at 1.6
percent for the 12 months through December
2015, while producer price inflation fell to -5.9
percent from 2014’s -3.3 percent.
In response to the global financial crisis,
Chinese authorities induced a massive increase
in bank lending to local governments and
the property sector beginning in 2009 (Chart
4.2.10). This surge was accompanied by an
even faster expansion in nontraditional
forms of credit, especially trust loans (Chart
4.2.11). While nonbank credit growth has
fallen significantly, from 23 percent at the
end of 2013 to 9 percent at the end of 2015,
overall credit growth, at 13 percent year-on-
year, remains more than double nominal GDP
growth. Reflecting this, overall credit to the
nonfinancial sector has continued to increase,
albeit at a slower pace, reaching 196 percent
of GDP in June 2015 (Chart 4.2.12). Over
2015, the People’s Bank of China (PBOC)
cut interest rates several times to stimulate
the economy. Further, the PBOC lifted the
official cap on setting deposit rates, a positive
step toward full financial sector liberalization,
which is necessary for China’s structural
transition. Capital outflows out of China were
also large during 2015, amid shifts in Chinese
residents’ and foreign investors’ exchange rate
expectations and increasing exchange rate
volatility. Intensified outflows can be traced
to August 2015, when the PBOC surprised the
markets with a change in its exchange rate
policy that caused the renminbi (RMB) to fall 3
percent against the U.S. dollar (USD) over two
days.
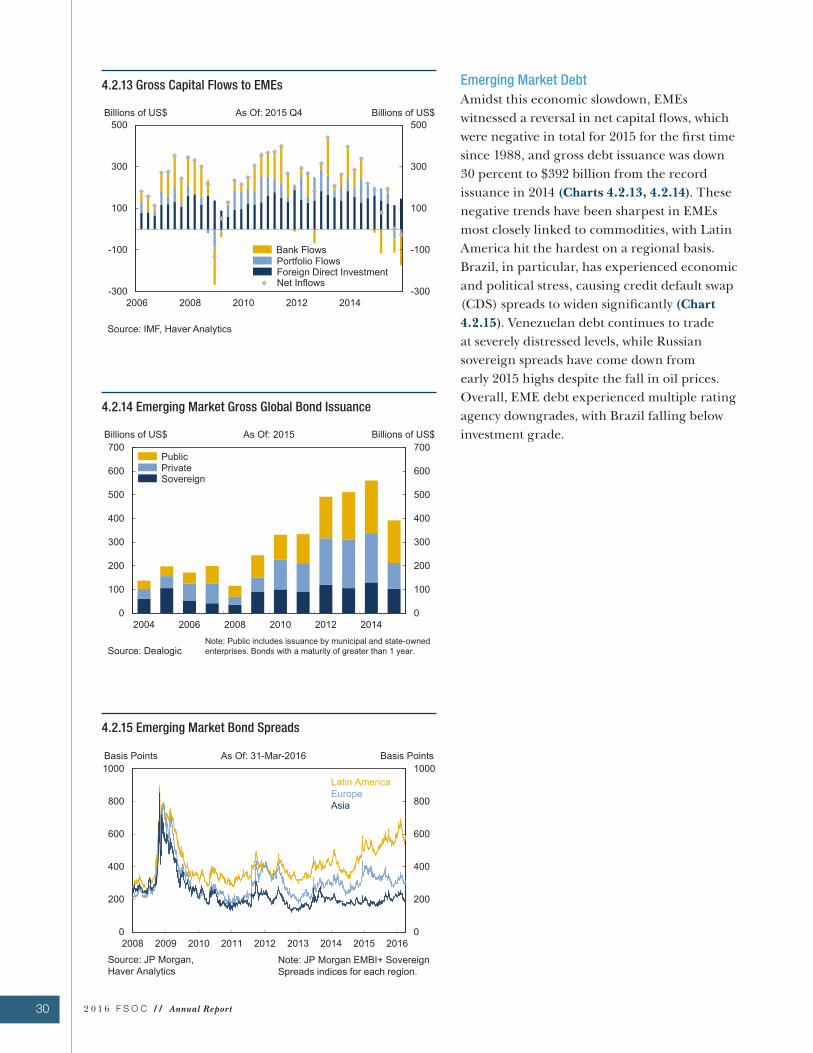
30 2 0 1 6 F S O C / / Annual Report
4.2.15 Emerging Market Bond Spreads
4.2.14 Emerging Market Gross Global Bond Issuance
4.2.13 Gross Capital Flows to EMEs Emerging Market Debt
Amidst this economic slowdown, EMEs
witnessed a reversal in net capital flows, which
were negative in total for 2015 for the first time
since 1988, and gross debt issuance was down
30 percent to $392 billion from the record
issuance in 2014 (Charts 4.2.13, 4.2.14). These
negative trends have been sharpest in EMEs
most closely linked to commodities, with Latin
America hit the hardest on a regional basis.
Brazil, in particular, has experienced economic
and political stress, causing credit default swap
(CDS) spreads to widen significantly (Chart
4.2.15). Venezuelan debt continues to trade
at severely distressed levels, while Russian
sovereign spreads have come down from
early 2015 highs despite the fall in oil prices.
Overall, EME debt experienced multiple rating
agency downgrades, with Brazil falling below
investment grade.
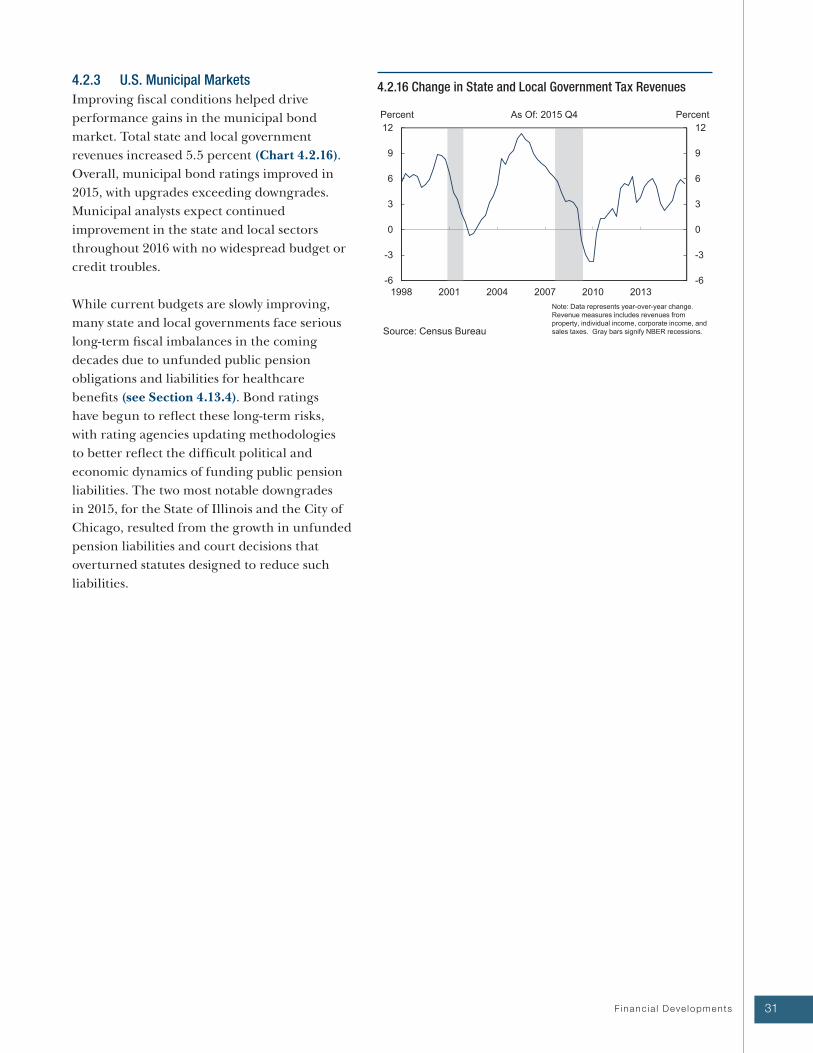
31Financ ia l Deve lopments
4.2.16 Change in State and Local Government Tax Revenues4.2.3 U.S. Municipal Markets
Improving fiscal conditions helped drive
performance gains in the municipal bond
market. Total state and local government
revenues increased 5.5 percent (Chart 4.2.16).
Overall, municipal bond ratings improved in
2015, with upgrades exceeding downgrades.
Municipal analysts expect continued
improvement in the state and local sectors
throughout 2016 with no widespread budget or
credit troubles.
While current budgets are slowly improving,
many state and local governments face serious
long-term fiscal imbalances in the coming
decades due to unfunded public pension
obligations and liabilities for healthcare
benefits (see Section 4.13.4). Bond ratings
have begun to reflect these long-term risks,
with rating agencies updating methodologies
to better reflect the difficult political and
economic dynamics of funding public pension
liabilities. The two most notable downgrades
in 2015, for the State of Illinois and the City of
Chicago, resulted from the growth in unfunded
pension liabilities and court decisions that
overturned statutes designed to reduce such
liabilities.
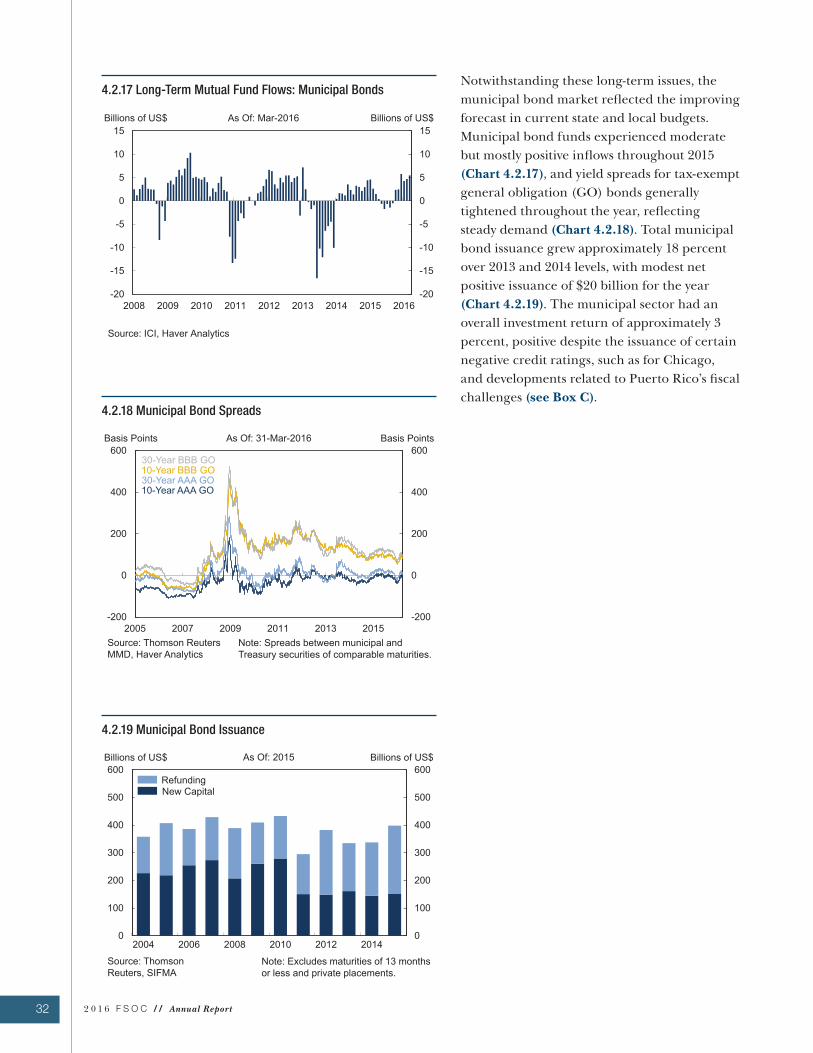
32 2 0 1 6 F S O C / / Annual Report
4.2.19 Municipal Bond Issuance
Notwithstanding these long-term issues, the
municipal bond market reflected the improving
forecast in current state and local budgets.
Municipal bond funds experienced moderate
but mostly positive inflows throughout 2015
(Chart 4.2.17), and yield spreads for tax-exempt
general obligation (GO) bonds generally
tightened throughout the year, reflecting
steady demand (Chart 4.2.18). Total municipal
bond issuance grew approximately 18 percent
over 2013 and 2014 levels, with modest net
positive issuance of $20 billion for the year
(Chart 4.2.19). The municipal sector had an
overall investment return of approximately 3
percent, positive despite the issuance of certain
negative credit ratings, such as for Chicago,
and developments related to Puerto Rico’s fiscal
challenges (see Box C). 4.2.18 Municipal Bond Spreads
4.2.17 Long-Term Mutual Fund Flows: Municipal Bonds
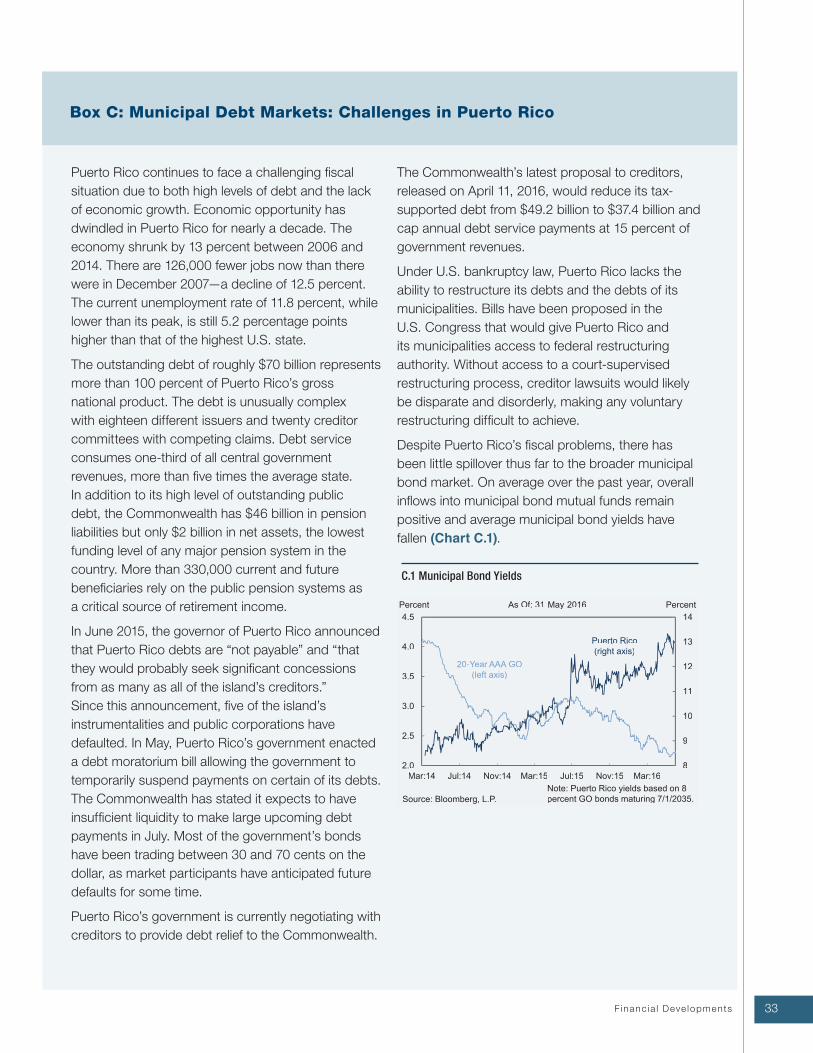
33Financ ia l Deve lopments
Puerto Rico continues to face a challenging fiscal
situation due to both high levels of debt and the lack
of economic growth. Economic opportunity has
dwindled in Puerto Rico for nearly a decade. The
economy shrunk by 13 percent between 2006 and
2014. There are 126,000 fewer jobs now than there
were in December 2007—a decline of 12.5 percent.
The current unemployment rate of 11.8 percent, while
lower than its peak, is still 5.2 percentage points
higher than that of the highest U.S. state.
The outstanding debt of roughly $70 billion represents
more than 100 percent of Puerto Rico’s gross
national product. The debt is unusually complex
with eighteen different issuers and twenty creditor
committees with competing claims. Debt service
consumes one-third of all central government
revenues, more than five times the average state.
In addition to its high level of outstanding public
debt, the Commonwealth has $46 billion in pension
liabilities but only $2 billion in net assets, the lowest
funding level of any major pension system in the
country. More than 330,000 current and future
beneficiaries rely on the public pension systems as
a critical source of retirement income.
In June 2015, the governor of Puerto Rico announced
that Puerto Rico debts are “not payable” and “that
they would probably seek significant concessions
from as many as all of the island’s creditors.”
Since this announcement, five of the island’s
instrumentalities and public corporations have
defaulted. In May, Puerto Rico’s government enacted
a debt moratorium bill allowing the government to
temporarily suspend payments on certain of its debts.
The Commonwealth has stated it expects to have
insufficient liquidity to make large upcoming debt
payments in July. Most of the government’s bonds
have been trading between 30 and 70 cents on the
dollar, as market participants have anticipated future
defaults for some time.
Puerto Rico’s government is currently negotiating with
creditors to provide debt relief to the Commonwealth.
The Commonwealth’s latest proposal to creditors,
released on April 11, 2016, would reduce its tax-
supported debt from $49.2 billion to $37.4 billion and
cap annual debt service payments at 15 percent of
government revenues.
Under U.S. bankruptcy law, Puerto Rico lacks the
ability to restructure its debts and the debts of its
municipalities. Bills have been proposed in the
U.S. Congress that would give Puerto Rico and
its municipalities access to federal restructuring
authority. Without access to a court-supervised
restructuring process, creditor lawsuits would likely
be disparate and disorderly, making any voluntary
restructuring difficult to achieve.
Despite Puerto Rico’s fiscal problems, there has
been little spillover thus far to the broader municipal
bond market. On average over the past year, overall
inflows into municipal bond mutual funds remain
positive and average municipal bond yields have
fallen (Chart C.1).
Box C: Municipal Debt Markets: Challenges in Puerto Rico
C.1 Municipal Bond Yields
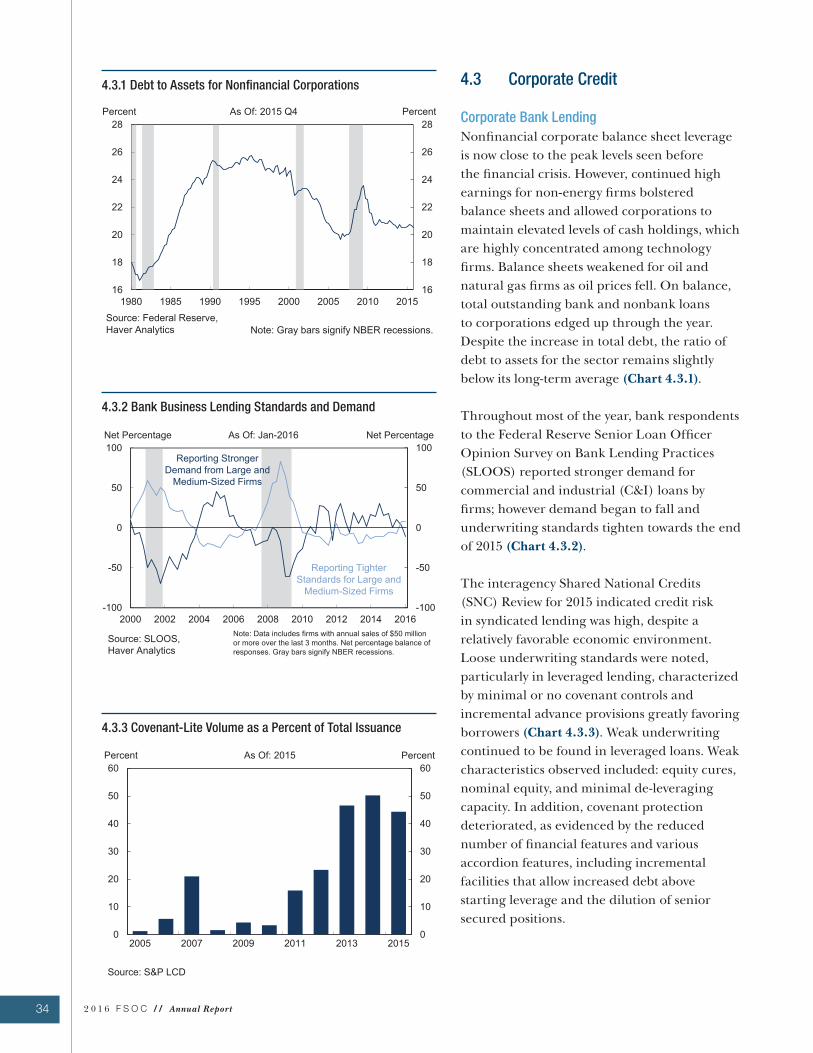
34 2 0 1 6 F S O C / / Annual Report
4.3.3 Covenant-Lite Volume as a Percent of Total Issuance
4.3.2 Bank Business Lending Standards and Demand
4.3.1 Debt to Assets for Nonfinancial Corporations 4.3 Corporate Credit
Corporate Bank Lending
Nonfinancial corporate balance sheet leverage
is now close to the peak levels seen before
the financial crisis. However, continued high
earnings for non-energy firms bolstered
balance sheets and allowed corporations to
maintain elevated levels of cash holdings, which
are highly concentrated among technology
firms. Balance sheets weakened for oil and
natural gas firms as oil prices fell. On balance,
total outstanding bank and nonbank loans
to corporations edged up through the year.
Despite the increase in total debt, the ratio of
debt to assets for the sector remains slightly
below its long-term average (Chart 4.3.1).
Throughout most of the year, bank respondents
to the Federal Reserve Senior Loan Officer
Opinion Survey on Bank Lending Practices
(SLOOS) reported stronger demand for
commercial and industrial (C&I) loans by
firms; however demand began to fall and
underwriting standards tighten towards the end
of 2015 (Chart 4.3.2).
The interagency Shared National Credits
(SNC) Review for 2015 indicated credit risk
in syndicated lending was high, despite a
relatively favorable economic environment.
Loose underwriting standards were noted,
particularly in leveraged lending, characterized
by minimal or no covenant controls and
incremental advance provisions greatly favoring
borrowers (Chart 4.3.3). Weak underwriting
continued to be found in leveraged loans. Weak
characteristics observed included: equity cures,
nominal equity, and minimal de-leveraging
capacity. In addition, covenant protection
deteriorated, as evidenced by the reduced
number of financial features and various
accordion features, including incremental
facilities that allow increased debt above
starting leverage and the dilution of senior
secured positions.
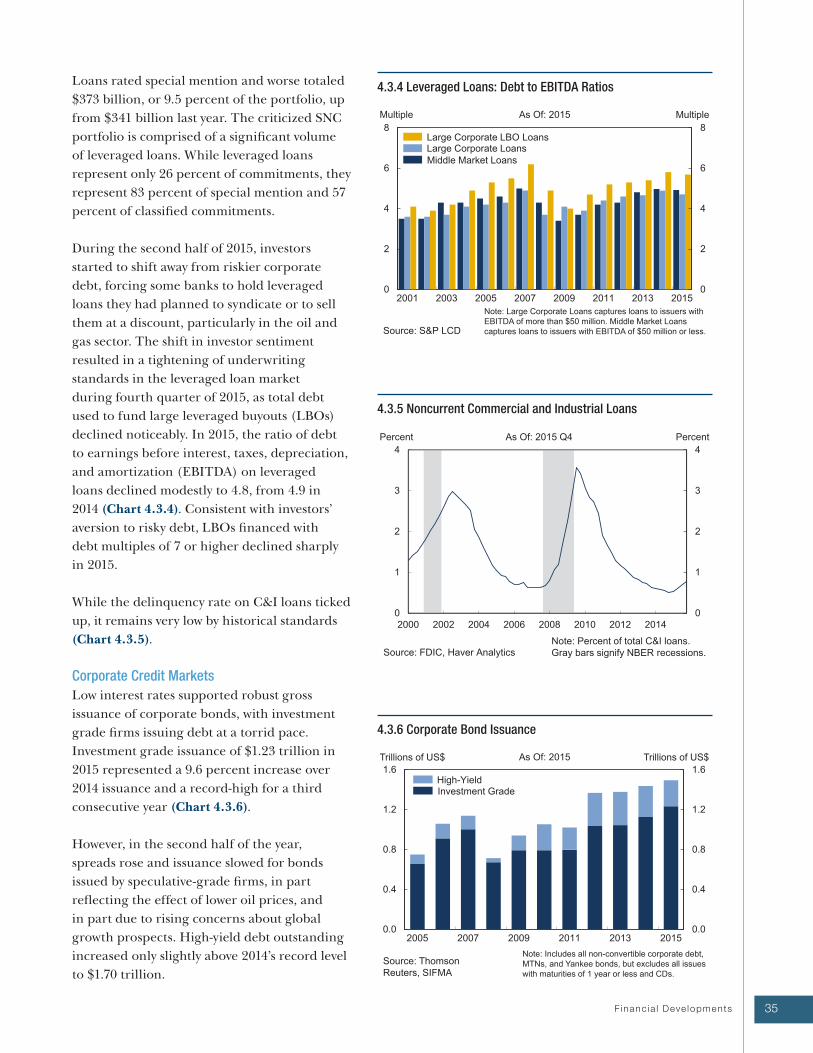
35Financ ia l Deve lopments
4.3.6 Corporate Bond Issuance
4.3.5 Noncurrent Commercial and Industrial Loans
4.3.4 Leveraged Loans: Debt to EBITDA RatiosLoans rated special mention and worse totaled
$373 billion, or 9.5 percent of the portfolio, up
from $341 billion last year. The criticized SNC
portfolio is comprised of a significant volume
of leveraged loans. While leveraged loans
represent only 26 percent of commitments, they
represent 83 percent of special mention and 57
percent of classified commitments.
During the second half of 2015, investors
started to shift away from riskier corporate
debt, forcing some banks to hold leveraged
loans they had planned to syndicate or to sell
them at a discount, particularly in the oil and
gas sector. The shift in investor sentiment
resulted in a tightening of underwriting
standards in the leveraged loan market
during fourth quarter of 2015, as total debt
used to fund large leveraged buyouts (LBOs)
declined noticeably. In 2015, the ratio of debt
to earnings before interest, taxes, depreciation,
and amortization (EBITDA) on leveraged
loans declined modestly to 4.8, from 4.9 in
2014 (Chart 4.3.4). Consistent with investors’
aversion to risky debt, LBOs financed with
debt multiples of 7 or higher declined sharply
in 2015.
While the delinquency rate on C&I loans ticked
up, it remains very low by historical standards
(Chart 4.3.5).
Corporate Credit Markets
Low interest rates supported robust gross
issuance of corporate bonds, with investment
grade firms issuing debt at a torrid pace.
Investment grade issuance of $1.23 trillion in
2015 represented a 9.6 percent increase over
2014 issuance and a record-high for a third
consecutive year (Chart 4.3.6).
However, in the second half of the year,
spreads rose and issuance slowed for bonds
issued by speculative-grade firms, in part
reflecting the effect of lower oil prices, and
in part due to rising concerns about global
growth prospects. High-yield debt outstanding
increased only slightly above 2014’s record level
to $1.70 trillion.
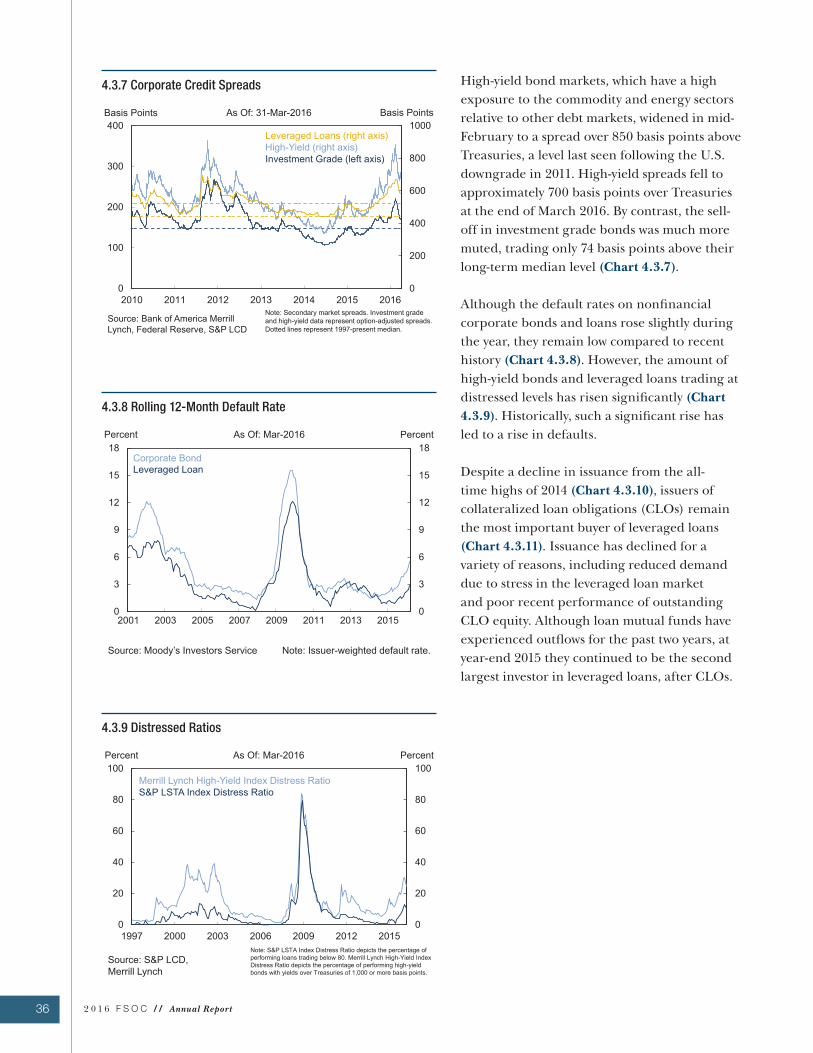
36 2 0 1 6 F S O C / / Annual Report
4.3.9 Distressed Ratios
4.3.8 Rolling 12-Month Default Rate
4.3.7 Corporate Credit Spreads
High-yield bond markets, which have a high
exposure to the commodity and energy sectors
relative to other debt markets, widened in mid-
February to a spread over 850 basis points above
Treasuries, a level last seen following the U.S.
downgrade in 2011. High-yield spreads fell to
approximately 700 basis points over Treasuries
at the end of March 2016. By contrast, the sell-
off in investment grade bonds was much more
muted, trading only 74 basis points above their
long-term median level (Chart 4.3.7).
Although the default rates on nonfinancial
corporate bonds and loans rose slightly during
the year, they remain low compared to recent
history (Chart 4.3.8). However, the amount of
high-yield bonds and leveraged loans trading at
distressed levels has risen significantly (Chart
4.3.9). Historically, such a significant rise has
led to a rise in defaults.
Despite a decline in issuance from the all-
time highs of 2014 (Chart 4.3.10), issuers of
collateralized loan obligations (CLOs) remain
the most important buyer of leveraged loans
(Chart 4.3.11). Issuance has declined for a
variety of reasons, including reduced demand
due to stress in the leveraged loan market
and poor recent performance of outstanding
CLO equity. Although loan mutual funds have
experienced outflows for the past two years, at
year-end 2015 they continued to be the second
largest investor in leveraged loans, after CLOs.
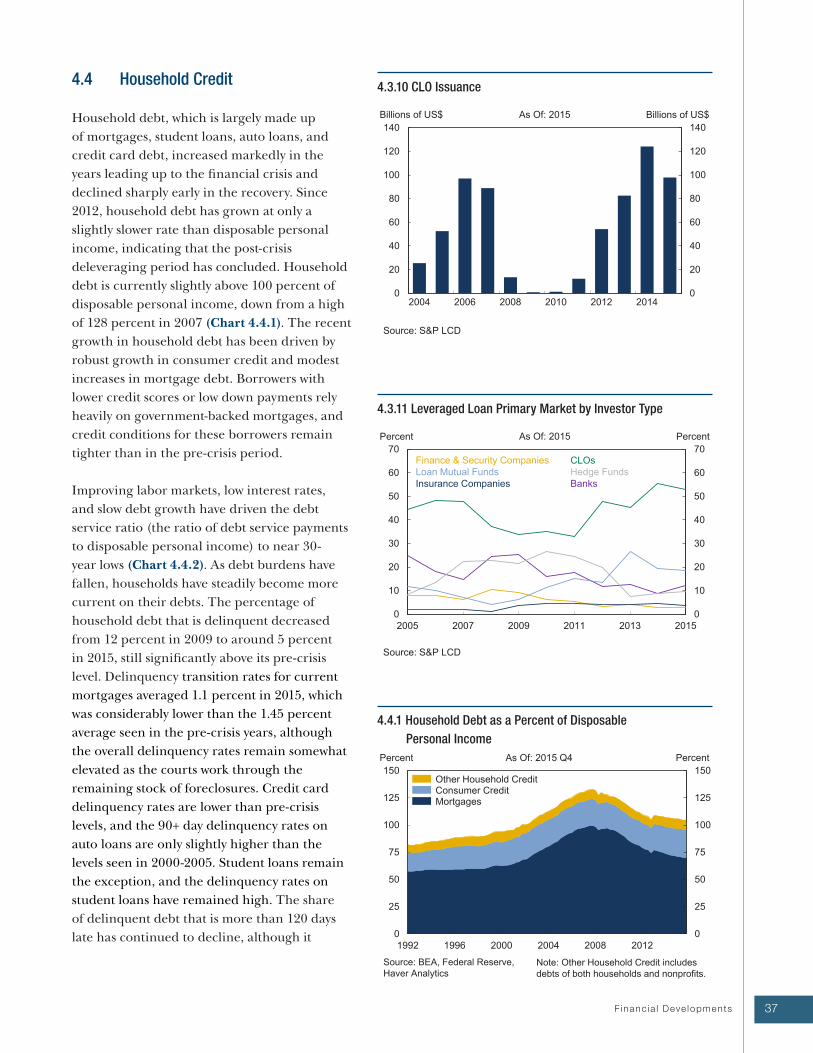
37Financ ia l Deve lopments
4.3.11 Leveraged Loan Primary Market by Investor Type
4.4.1 Household Debt as a Percent of Disposable
Personal Income
4.3.10 CLO Issuance4.4 Household Credit
Household debt, which is largely made up
of mortgages, student loans, auto loans, and
credit card debt, increased markedly in the
years leading up to the financial crisis and
declined sharply early in the recovery. Since
2012, household debt has grown at only a
slightly slower rate than disposable personal
income, indicating that the post-crisis
deleveraging period has concluded. Household
debt is currently slightly above 100 percent of
disposable personal income, down from a high
of 128 percent in 2007 (Chart 4.4.1). The recent
growth in household debt has been driven by
robust growth in consumer credit and modest
increases in mortgage debt. Borrowers with
lower credit scores or low down payments rely
heavily on government-backed mortgages, and
credit conditions for these borrowers remain
tighter than in the pre-crisis period.
Improving labor markets, low interest rates,
and slow debt growth have driven the debt
service ratio (the ratio of debt service payments
to disposable personal income) to near 30-
year lows (Chart 4.4.2). As debt burdens have
fallen, households have steadily become more
current on their debts. The percentage of
household debt that is delinquent decreased
from 12 percent in 2009 to around 5 percent
in 2015, still significantly above its pre-crisis
level. Delinquency transition rates for current
mortgages averaged 1.1 percent in 2015, which
was considerably lower than the 1.45 percent
average seen in the pre-crisis years, although
the overall delinquency rates remain somewhat
elevated as the courts work through the
remaining stock of foreclosures. Credit card
delinquency rates are lower than pre-crisis
levels, and the 90+ day delinquency rates on
auto loans are only slightly higher than the
levels seen in 2000-2005. Student loans remain
the exception, and the delinquency rates on
student loans have remained high. The share
of delinquent debt that is more than 120 days
late has continued to decline, although it
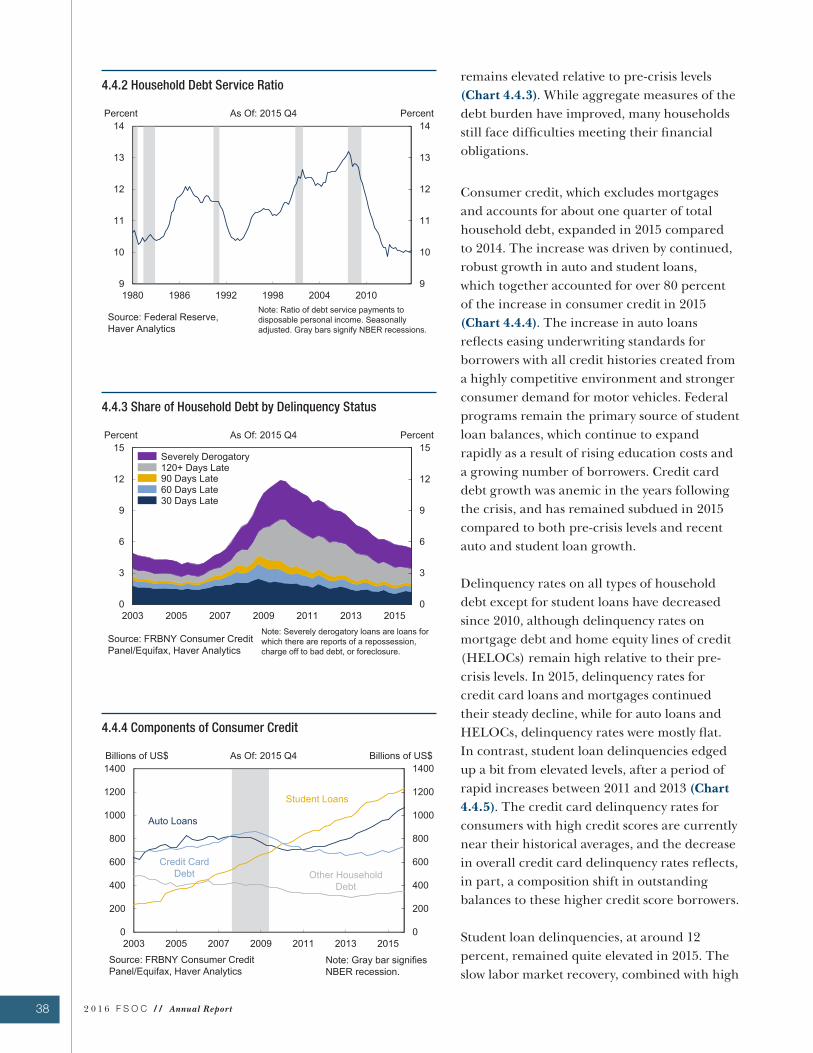
38 2 0 1 6 F S O C / / Annual Report
4.4.4 Components of Consumer Credit
4.4.3 Share of Household Debt by Delinquency Status
4.4.2 Household Debt Service Ratioremains elevated relative to pre-crisis levels
(Chart 4.4.3). While aggregate measures of the
debt burden have improved, many households
still face difficulties meeting their financial
obligations.
Consumer credit, which excludes mortgages
and accounts for about one quarter of total
household debt, expanded in 2015 compared
to 2014. The increase was driven by continued,
robust growth in auto and student loans,
which together accounted for over 80 percent
of the increase in consumer credit in 2015
(Chart 4.4.4). The increase in auto loans
reflects easing underwriting standards for
borrowers with all credit histories created from
a highly competitive environment and stronger
consumer demand for motor vehicles. Federal
programs remain the primary source of student
loan balances, which continue to expand
rapidly as a result of rising education costs and
a growing number of borrowers. Credit card
debt growth was anemic in the years following
the crisis, and has remained subdued in 2015
compared to both pre-crisis levels and recent
auto and student loan growth.
Delinquency rates on all types of household
debt except for student loans have decreased
since 2010, although delinquency rates on
mortgage debt and home equity lines of credit
(HELOCs) remain high relative to their pre-
crisis levels. In 2015, delinquency rates for
credit card loans and mortgages continued
their steady decline, while for auto loans and
HELOCs, delinquency rates were mostly flat.
In contrast, student loan delinquencies edged
up a bit from elevated levels, after a period of
rapid increases between 2011 and 2013 (Chart
4.4.5). The credit card delinquency rates for
consumers with high credit scores are currently
near their historical averages, and the decrease
in overall credit card delinquency rates reflects,
in part, a composition shift in outstanding
balances to these higher credit score borrowers.
Student loan delinquencies, at around 12
percent, remained quite elevated in 2015. The
slow labor market recovery, combined with high
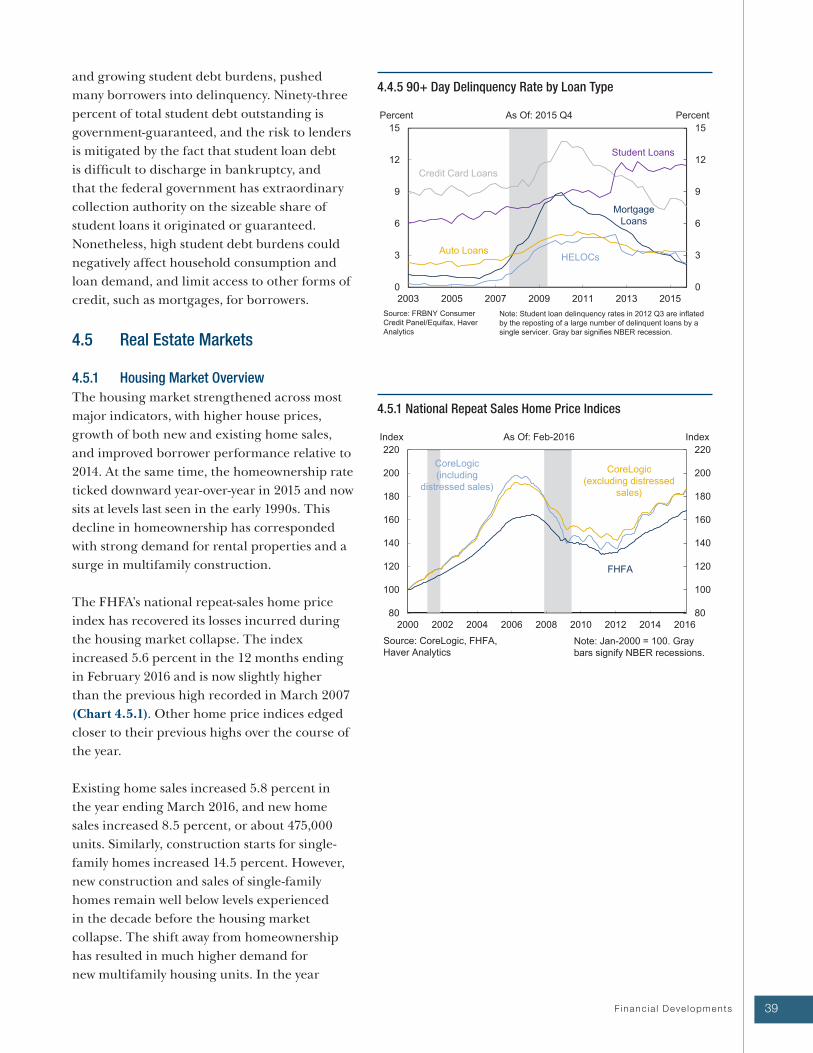
39Financ ia l Deve lopments
and growing student debt burdens, pushed
many borrowers into delinquency. Ninety-three
percent of total student debt outstanding is
government-guaranteed, and the risk to lenders
is mitigated by the fact that student loan debt
is difficult to discharge in bankruptcy, and
that the federal government has extraordinary
collection authority on the sizeable share of
student loans it originated or guaranteed.
Nonetheless, high student debt burdens could
negatively affect household consumption and
loan demand, and limit access to other forms of
credit, such as mortgages, for borrowers.
4.5 Real Estate Markets
4.5.1 Housing Market Overview
The housing market strengthened across most
major indicators, with higher house prices,
growth of both new and existing home sales,
and improved borrower performance relative to
2014. At the same time, the homeownership rate
ticked downward year-over-year in 2015 and now
sits at levels last seen in the early 1990s. This
decline in homeownership has corresponded
with strong demand for rental properties and a
surge in multifamily construction.
The FHFA’s national repeat-sales home price
index has recovered its losses incurred during
the housing market collapse. The index
increased 5.6 percent in the 12 months ending
in February 2016 and is now slightly higher
than the previous high recorded in March 2007
(Chart 4.5.1). Other home price indices edged
closer to their previous highs over the course of
the year.
Existing home sales increased 5.8 percent in
the year ending March 2016, and new home
sales increased 8.5 percent, or about 475,000
units. Similarly, construction starts for single-
family homes increased 14.5 percent. However,
new construction and sales of single-family
homes remain well below levels experienced
in the decade before the housing market
collapse. The shift away from homeownership
has resulted in much higher demand for
new multifamily housing units. In the year
4.5.1 National Repeat Sales Home Price Indices
4.4.5 90+ Day Delinquency Rate by Loan Type
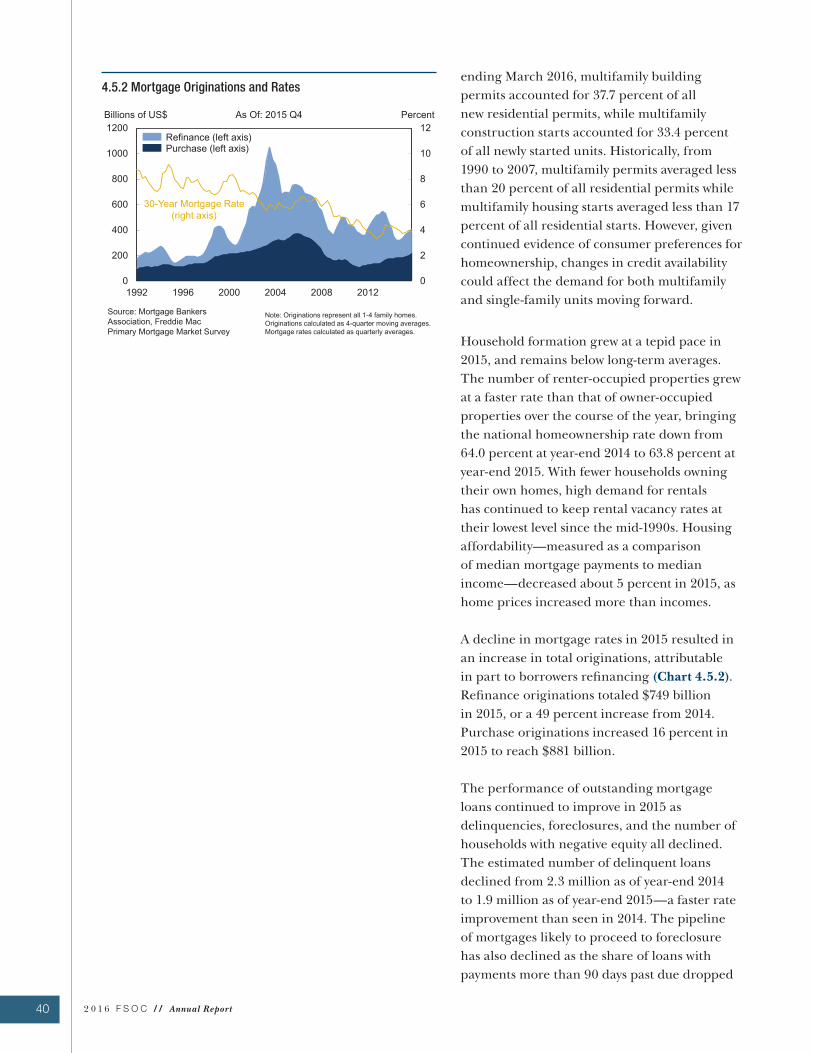
40 2 0 1 6 F S O C / / Annual Report
ending March 2016, multifamily building
permits accounted for 37.7 percent of all
new residential permits, while multifamily
construction starts accounted for 33.4 percent
of all newly started units. Historically, from
1990 to 2007, multifamily permits averaged less
than 20 percent of all residential permits while
multifamily housing starts averaged less than 17
percent of all residential starts. However, given
continued evidence of consumer preferences for
homeownership, changes in credit availability
could affect the demand for both multifamily
and single-family units moving forward.
Household formation grew at a tepid pace in
2015, and remains below long-term averages.
The number of renter-occupied properties grew
at a faster rate than that of owner-occupied
properties over the course of the year, bringing
the national homeownership rate down from
64.0 percent at year-end 2014 to 63.8 percent at
year-end 2015. With fewer households owning
their own homes, high demand for rentals
has continued to keep rental vacancy rates at
their lowest level since the mid-1990s. Housing
affordability—measured as a comparison
of median mortgage payments to median
income—decreased about 5 percent in 2015, as
home prices increased more than incomes.
A decline in mortgage rates in 2015 resulted in
an increase in total originations, attributable
in part to borrowers refinancing (Chart 4.5.2).
Refinance originations totaled $749 billion
in 2015, or a 49 percent increase from 2014.
Purchase originations increased 16 percent in
2015 to reach $881 billion.
The performance of outstanding mortgage
loans continued to improve in 2015 as
delinquencies, foreclosures, and the number of
households with negative equity all declined.
The estimated number of delinquent loans
declined from 2.3 million as of year-end 2014
to 1.9 million as of year-end 2015—a faster rate
improvement than seen in 2014. The pipeline
of mortgages likely to proceed to foreclosure
has also declined as the share of loans with
payments more than 90 days past due dropped
4.5.2 Mortgage Originations and Rates
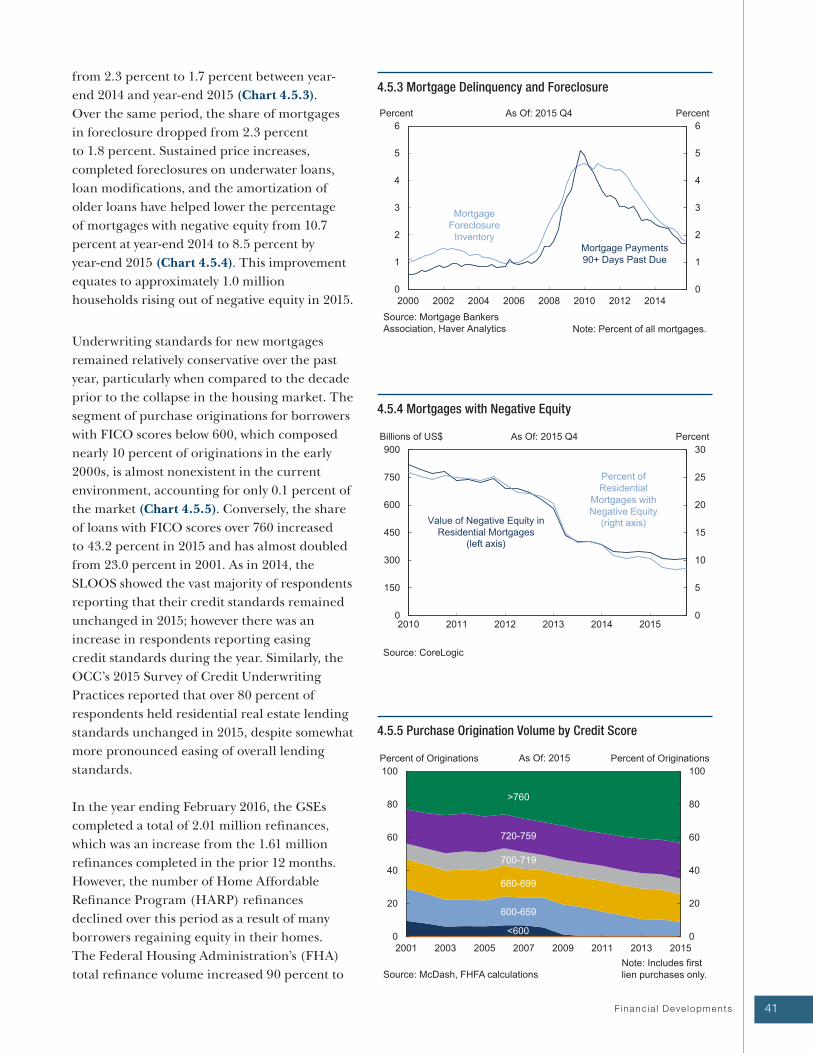
41 F inanc ia l Deve lopments
from 2.3 percent to 1.7 percent between year-
end 2014 and year-end 2015 (Chart 4.5.3).
Over the same period, the share of mortgages
in foreclosure dropped from 2.3 percent
to 1.8 percent. Sustained price increases,
completed foreclosures on underwater loans,
loan modifications, and the amortization of
older loans have helped lower the percentage
of mortgages with negative equity from 10.7
percent at year-end 2014 to 8.5 percent by
year-end 2015 (Chart 4.5.4). This improvement
equates to approximately 1.0 million
households rising out of negative equity in 2015.
Underwriting standards for new mortgages
remained relatively conservative over the past
year, particularly when compared to the decade
prior to the collapse in the housing market. The
segment of purchase originations for borrowers
with FICO scores below 600, which composed
nearly 10 percent of originations in the early
2000s, is almost nonexistent in the current
environment, accounting for only 0.1 percent of
the market (Chart 4.5.5). Conversely, the share
of loans with FICO scores over 760 increased
to 43.2 percent in 2015 and has almost doubled
from 23.0 percent in 2001. As in 2014, the
SLOOS showed the vast majority of respondents
reporting that their credit standards remained
unchanged in 2015; however there was an
increase in respondents reporting easing
credit standards during the year. Similarly, the
OCC’s 2015 Survey of Credit Underwriting
Practices reported that over 80 percent of
respondents held residential real estate lending
standards unchanged in 2015, despite somewhat
more pronounced easing of overall lending
standards.
In the year ending February 2016, the GSEs
completed a total of 2.01 million refinances,
which was an increase from the 1.61 million
refinances completed in the prior 12 months.
However, the number of Home Affordable
Refinance Program (HARP) refinances
declined over this period as a result of many
borrowers regaining equity in their homes.
The Federal Housing Administration’s (FHA)
total refinance volume increased 90 percent to
4.5.5 Purchase Origination Volume by Credit Score
4.5.4 Mortgages with Negative Equity
4.5.3 Mortgage Delinquency and Foreclosure
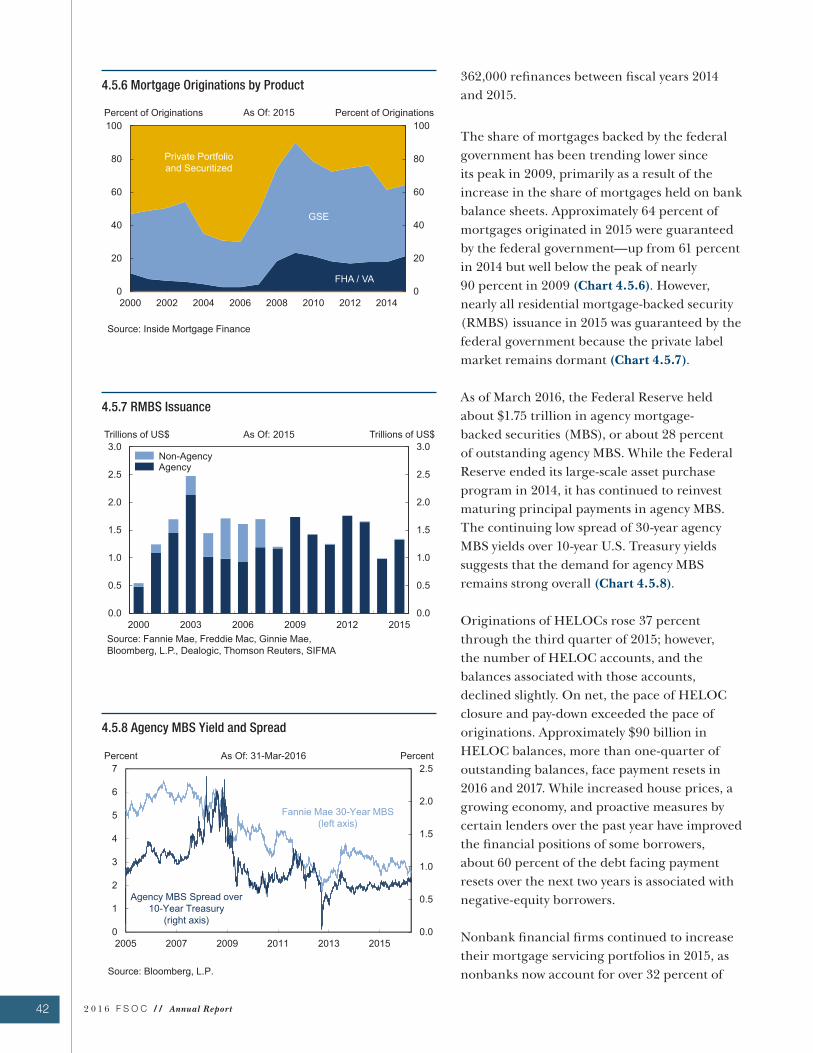
42 2 0 1 6 F S O C / / Annual Report
362,000 refinances between fiscal years 2014
and 2015.
The share of mortgages backed by the federal
government has been trending lower since
its peak in 2009, primarily as a result of the
increase in the share of mortgages held on bank
balance sheets. Approximately 64 percent of
mortgages originated in 2015 were guaranteed
by the federal government—up from 61 percent
in 2014 but well below the peak of nearly
90 percent in 2009 (Chart 4.5.6). However,
nearly all residential mortgage-backed security
(RMBS) issuance in 2015 was guaranteed by the
federal government because the private label
market remains dormant (Chart 4.5.7).
As of March 2016, the Federal Reserve held
about $1.75 trillion in agency mortgage-
backed securities (MBS), or about 28 percent
of outstanding agency MBS. While the Federal
Reserve ended its large-scale asset purchase
program in 2014, it has continued to reinvest
maturing principal payments in agency MBS.
The continuing low spread of 30-year agency
MBS yields over 10-year U.S. Treasury yields
suggests that the demand for agency MBS
remains strong overall (Chart 4.5.8).
Originations of HELOCs rose 37 percent
through the third quarter of 2015; however,
the number of HELOC accounts, and the
balances associated with those accounts,
declined slightly. On net, the pace of HELOC
closure and pay-down exceeded the pace of
originations. Approximately $90 billion in
HELOC balances, more than one-quarter of
outstanding balances, face payment resets in
2016 and 2017. While increased house prices, a
growing economy, and proactive measures by
certain lenders over the past year have improved
the financial positions of some borrowers,
about 60 percent of the debt facing payment
resets over the next two years is associated with
negative-equity borrowers.
Nonbank financial firms continued to increase
their mortgage servicing portfolios in 2015, as
nonbanks now account for over 32 percent of
4.5.8 Agency MBS Yield and Spread
4.5.7 RMBS Issuance
4.5.6 Mortgage Originations by Product
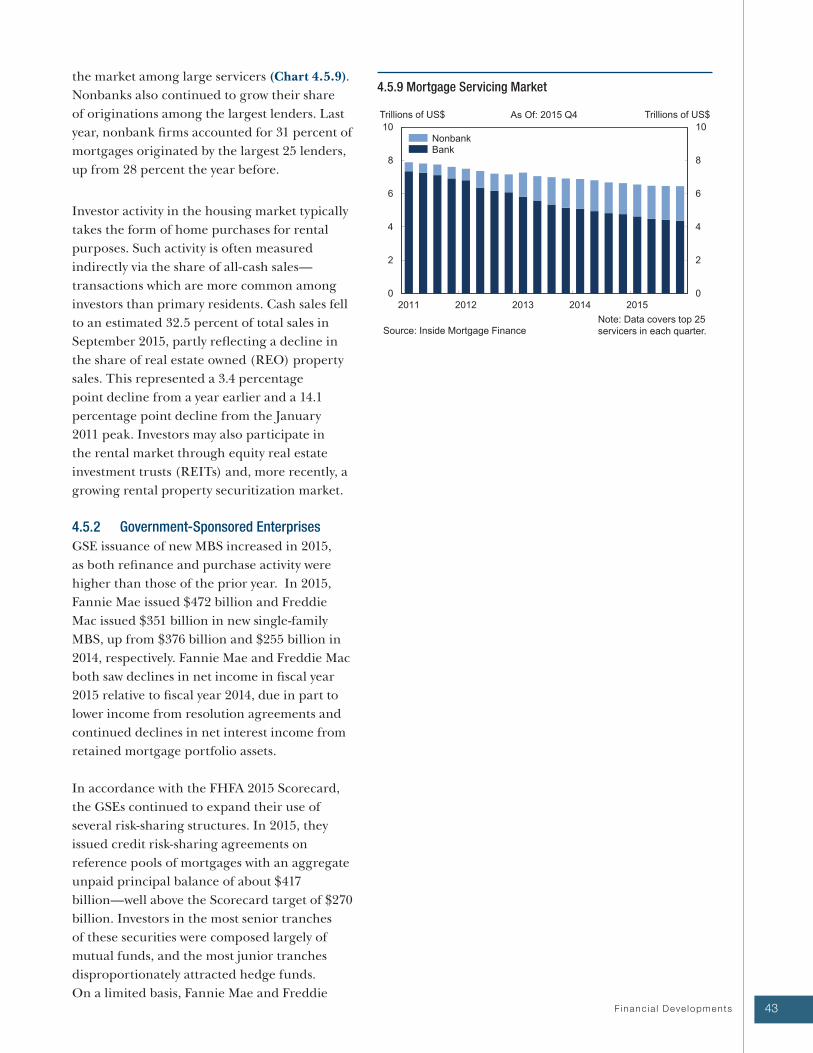
43 F inanc ia l Deve lopments
the market among large servicers (Chart 4.5.9).
Nonbanks also continued to grow their share
of originations among the largest lenders. Last
year, nonbank firms accounted for 31 percent of
mortgages originated by the largest 25 lenders,
up from 28 percent the year before.
Investor activity in the housing market typically
takes the form of home purchases for rental
purposes. Such activity is often measured
indirectly via the share of all-cash sales—
transactions which are more common among
investors than primary residents. Cash sales fell
to an estimated 32.5 percent of total sales in
September 2015, partly reflecting a decline in
the share of real estate owned (REO) property
sales. This represented a 3.4 percentage
point decline from a year earlier and a 14.1
percentage point decline from the January
2011 peak. Investors may also participate in
the rental market through equity real estate
investment trusts (REITs) and, more recently, a
growing rental property securitization market.
4.5.2 Government-Sponsored Enterprises
GSE issuance of new MBS increased in 2015,
as both refinance and purchase activity were
higher than those of the prior year. In 2015,
Fannie Mae issued $472 billion and Freddie
Mac issued $351 billion in new single-family
MBS, up from $376 billion and $255 billion in
2014, respectively. Fannie Mae and Freddie Mac
both saw declines in net income in fiscal year
2015 relative to fiscal year 2014, due in part to
lower income from resolution agreements and
continued declines in net interest income from
retained mortgage portfolio assets.
In accordance with the FHFA 2015 Scorecard,
the GSEs continued to expand their use of
several risk-sharing structures. In 2015, they
issued credit risk-sharing agreements on
reference pools of mortgages with an aggregate
unpaid principal balance of about $417
billion—well above the Scorecard target of $270
billion. Investors in the most senior tranches
of these securities were composed largely of
mutual funds, and the most junior tranches
disproportionately attracted hedge funds.
On a limited basis, Fannie Mae and Freddie
4.5.9 Mortgage Servicing Market
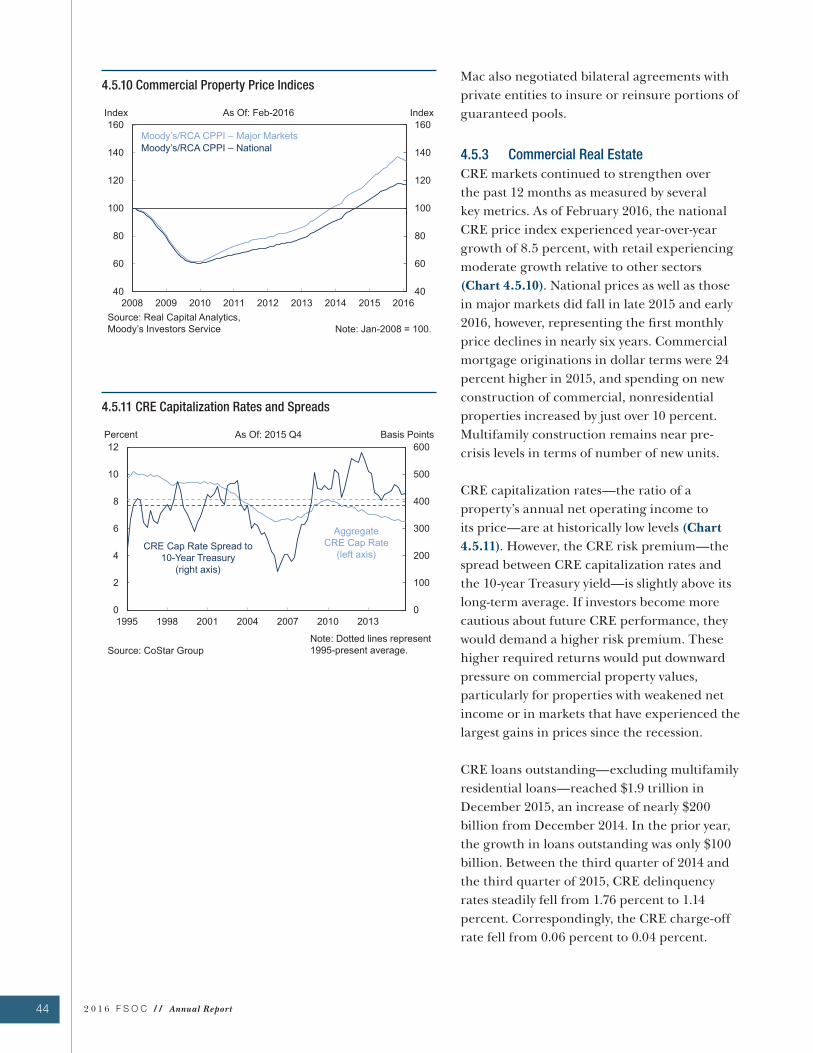
44 2 0 1 6 F S O C / / Annual Report
Mac also negotiated bilateral agreements with
private entities to insure or reinsure portions of
guaranteed pools.
4.5.3 Commercial Real Estate
CRE markets continued to strengthen over
the past 12 months as measured by several
key metrics. As of February 2016, the national
CRE price index experienced year-over-year
growth of 8.5 percent, with retail experiencing
moderate growth relative to other sectors
(Chart 4.5.10). National prices as well as those
in major markets did fall in late 2015 and early
2016, however, representing the first monthly
price declines in nearly six years. Commercial
mortgage originations in dollar terms were 24
percent higher in 2015, and spending on new
construction of commercial, nonresidential
properties increased by just over 10 percent.
Multifamily construction remains near pre-
crisis levels in terms of number of new units.
CRE capitalization rates—the ratio of a
property’s annual net operating income to
its price—are at historically low levels (Chart
4.5.11). However, the CRE risk premium—the
spread between CRE capitalization rates and
the 10-year Treasury yield—is slightly above its
long-term average. If investors become more
cautious about future CRE performance, they
would demand a higher risk premium. These
higher required returns would put downward
pressure on commercial property values,
particularly for properties with weakened net
income or in markets that have experienced the
largest gains in prices since the recession.
CRE loans outstanding—excluding multifamily
residential loans—reached $1.9 trillion in
December 2015, an increase of nearly $200
billion from December 2014. In the prior year,
the growth in loans outstanding was only $100
billion. Between the third quarter of 2014 and
the third quarter of 2015, CRE delinquency
rates steadily fell from 1.76 percent to 1.14
percent. Correspondingly, the CRE charge-off
rate fell from 0.06 percent to 0.04 percent.
4.5.11 CRE Capitalization Rates and Spreads
4.5.10 Commercial Property Price Indices
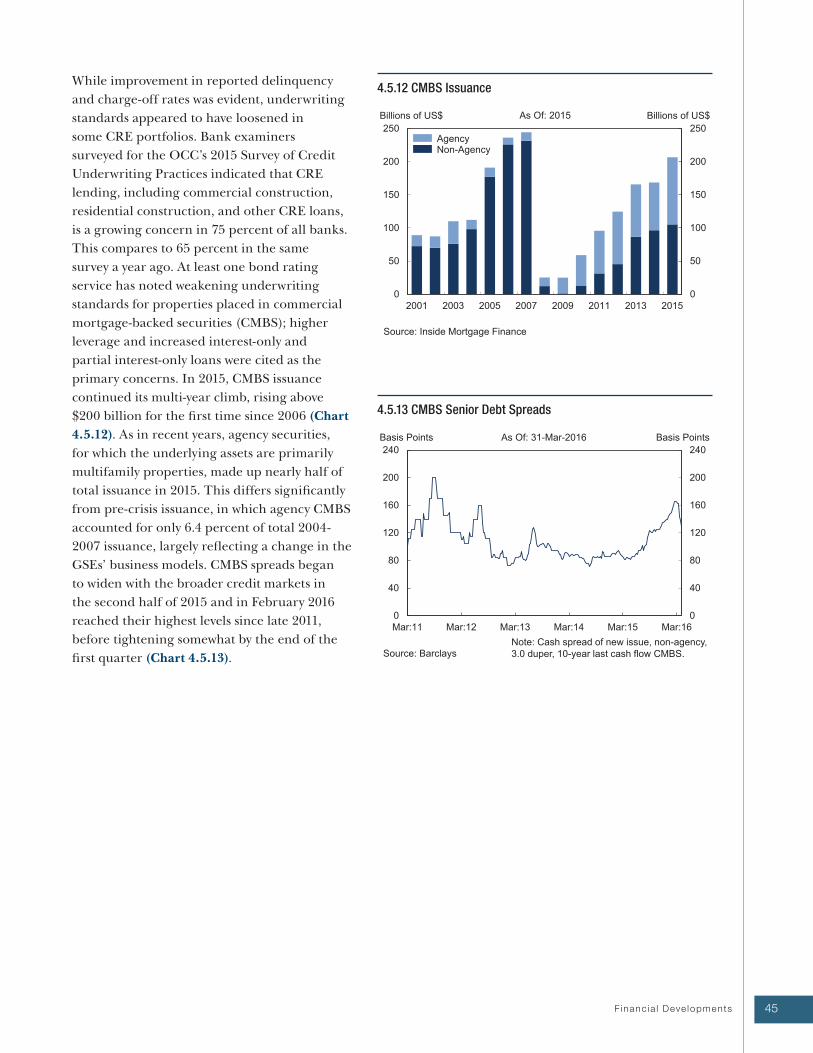
45 F inanc ia l Deve lopments
While improvement in reported delinquency
and charge-off rates was evident, underwriting
standards appeared to have loosened in
some CRE portfolios. Bank examiners
surveyed for the OCC’s 2015 Survey of Credit
Underwriting Practices indicated that CRE
lending, including commercial construction,
residential construction, and other CRE loans,
is a growing concern in 75 percent of all banks.
This compares to 65 percent in the same
survey a year ago. At least one bond rating
service has noted weakening underwriting
standards for properties placed in commercial
mortgage-backed securities (CMBS); higher
leverage and increased interest-only and
partial interest-only loans were cited as the
primary concerns. In 2015, CMBS issuance
continued its multi-year climb, rising above
$200 billion for the first time since 2006 (Chart
4.5.12). As in recent years, agency securities,
for which the underlying assets are primarily
multifamily properties, made up nearly half of
total issuance in 2015. This differs significantly
from pre-crisis issuance, in which agency CMBS
accounted for only 6.4 percent of total 2004-
2007 issuance, largely reflecting a change in the
GSEs’ business models. CMBS spreads began
to widen with the broader credit markets in
the second half of 2015 and in February 2016
reached their highest levels since late 2011,
before tightening somewhat by the end of the
first quarter (Chart 4.5.13).
4.5.13 CMBS Senior Debt Spreads
4.5.12 CMBS Issuance
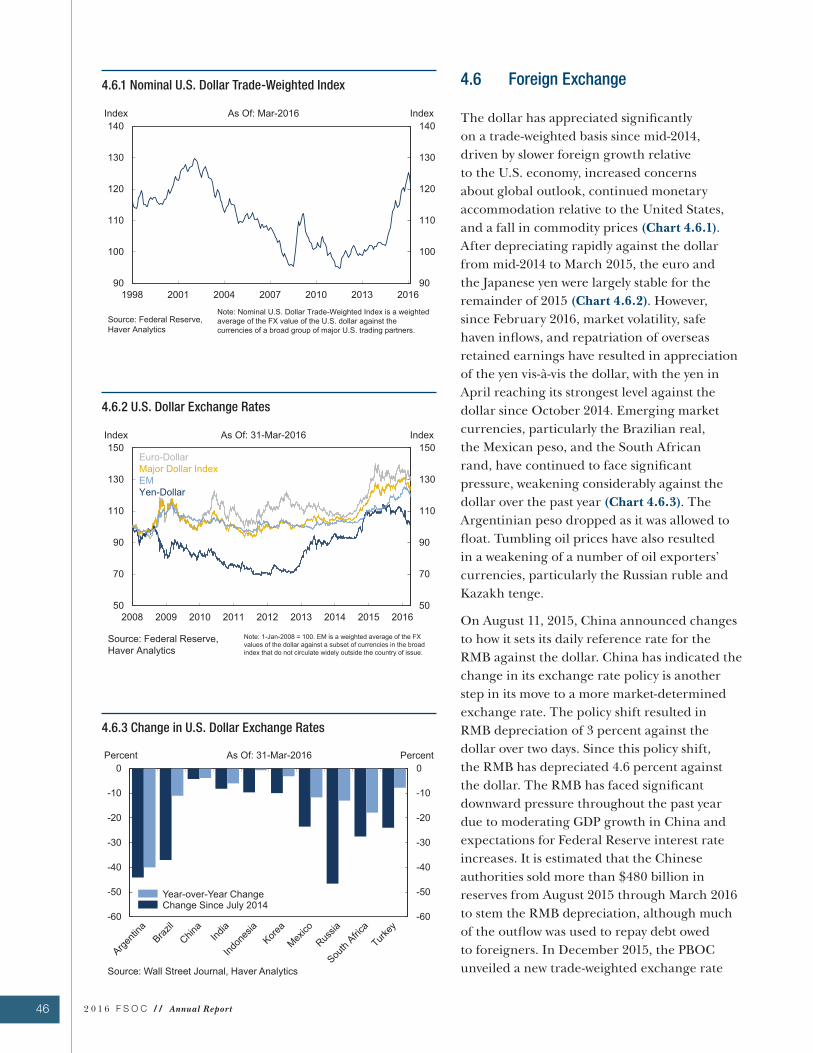
46 2 0 1 6 F S O C / / Annual Report
4.6 Foreign Exchange
The dollar has appreciated significantly
on a trade-weighted basis since mid-2014,
driven by slower foreign growth relative
to the U.S. economy, increased concerns
about global outlook, continued monetary
accommodation relative to the United States,
and a fall in commodity prices (Chart 4.6.1).
After depreciating rapidly against the dollar
from mid-2014 to March 2015, the euro and
the Japanese yen were largely stable for the
remainder of 2015 (Chart 4.6.2). However,
since February 2016, market volatility, safe
haven inflows, and repatriation of overseas
retained earnings have resulted in appreciation
of the yen vis-à-vis the dollar, with the yen in
April reaching its strongest level against the
dollar since October 2014. Emerging market
currencies, particularly the Brazilian real,
the Mexican peso, and the South African
rand, have continued to face significant
pressure, weakening considerably against the
dollar over the past year (Chart 4.6.3). The
Argentinian peso dropped as it was allowed to
float. Tumbling oil prices have also resulted
in a weakening of a number of oil exporters’
currencies, particularly the Russian ruble and
Kazakh tenge.
On August 11, 2015, China announced changes
to how it sets its daily reference rate for the
RMB against the dollar. China has indicated the
change in its exchange rate policy is another
step in its move to a more market-determined
exchange rate. The policy shift resulted in
RMB depreciation of 3 percent against the
dollar over two days. Since this policy shift,
the RMB has depreciated 4.6 percent against
the dollar. The RMB has faced significant
downward pressure throughout the past year
due to moderating GDP growth in China and
expectations for Federal Reserve interest rate
increases. It is estimated that the Chinese
authorities sold more than $480 billion in
reserves from August 2015 through March 2016
to stem the RMB depreciation, although much
of the outflow was used to repay debt owed
to foreigners. In December 2015, the PBOC
unveiled a new trade-weighted exchange rate
4.6.3 Change in U.S. Dollar Exchange Rates
4.6.2 U.S. Dollar Exchange Rates
4.6.1 Nominal U.S. Dollar Trade-Weighted Index
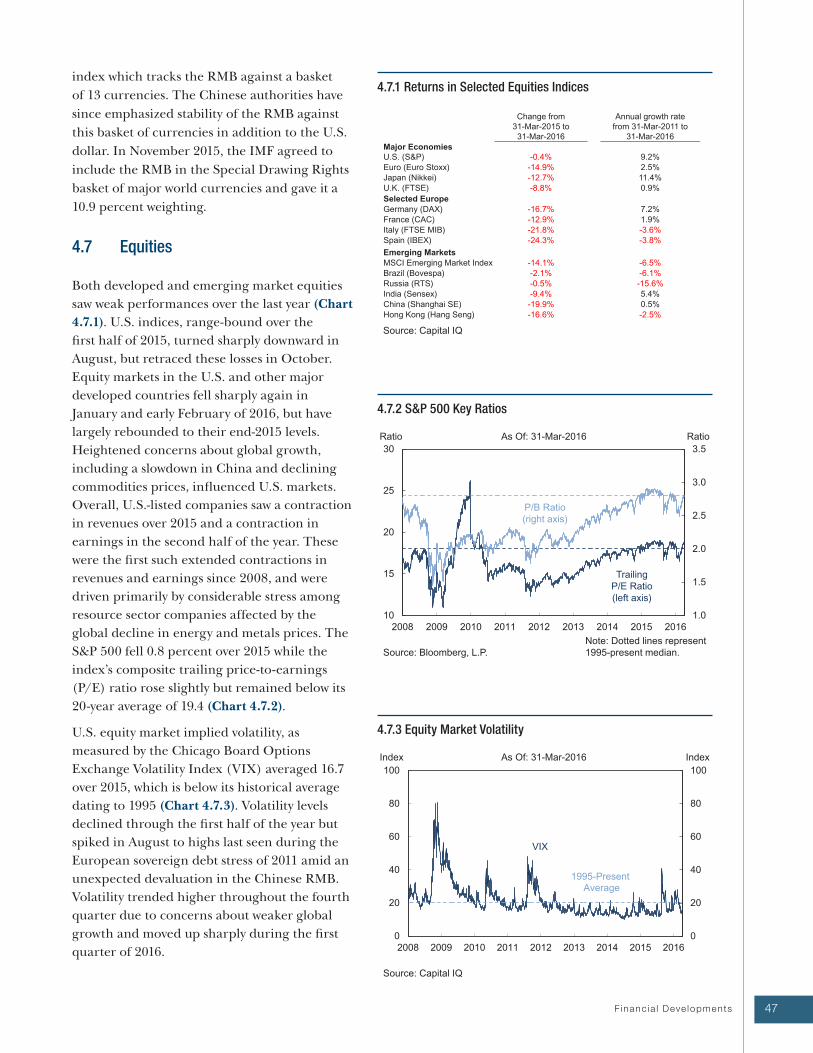
47 F inanc ia l Deve lopments
index which tracks the RMB against a basket
of 13 currencies. The Chinese authorities have
since emphasized stability of the RMB against
this basket of currencies in addition to the U.S.
dollar. In November 2015, the IMF agreed to
include the RMB in the Special Drawing Rights
basket of major world currencies and gave it a
10.9 percent weighting.
4.7 Equities
Both developed and emerging market equities
saw weak performances over the last year (Chart
4.7.1). U.S. indices, range-bound over the
first half of 2015, turned sharply downward in
August, but retraced these losses in October.
Equity markets in the U.S. and other major
developed countries fell sharply again in
January and early February of 2016, but have
largely rebounded to their end-2015 levels.
Heightened concerns about global growth,
including a slowdown in China and declining
commodities prices, influenced U.S. markets.
Overall, U.S.-listed companies saw a contraction
in revenues over 2015 and a contraction in
earnings in the second half of the year. These
were the first such extended contractions in
revenues and earnings since 2008, and were
driven primarily by considerable stress among
resource sector companies affected by the
global decline in energy and metals prices. The
S&P 500 fell 0.8 percent over 2015 while the
index’s composite trailing price-to-earnings
(P/E) ratio rose slightly but remained below its
20-year average of 19.4 (Chart 4.7.2).
U.S. equity market implied volatility, as
measured by the Chicago Board Options
Exchange Volatility Index (VIX) averaged 16.7
over 2015, which is below its historical average
dating to 1995 (Chart 4.7.3). Volatility levels
declined through the first half of the year but
spiked in August to highs last seen during the
European sovereign debt stress of 2011 amid an
unexpected devaluation in the Chinese RMB.
Volatility trended higher throughout the fourth
quarter due to concerns about weaker global
growth and moved up sharply during the first
quarter of 2016.
4.7.3 Equity Market Volatility
4.7.2 S&P 500 Key Ratios
4.7.1 Returns in Selected Equities Indices
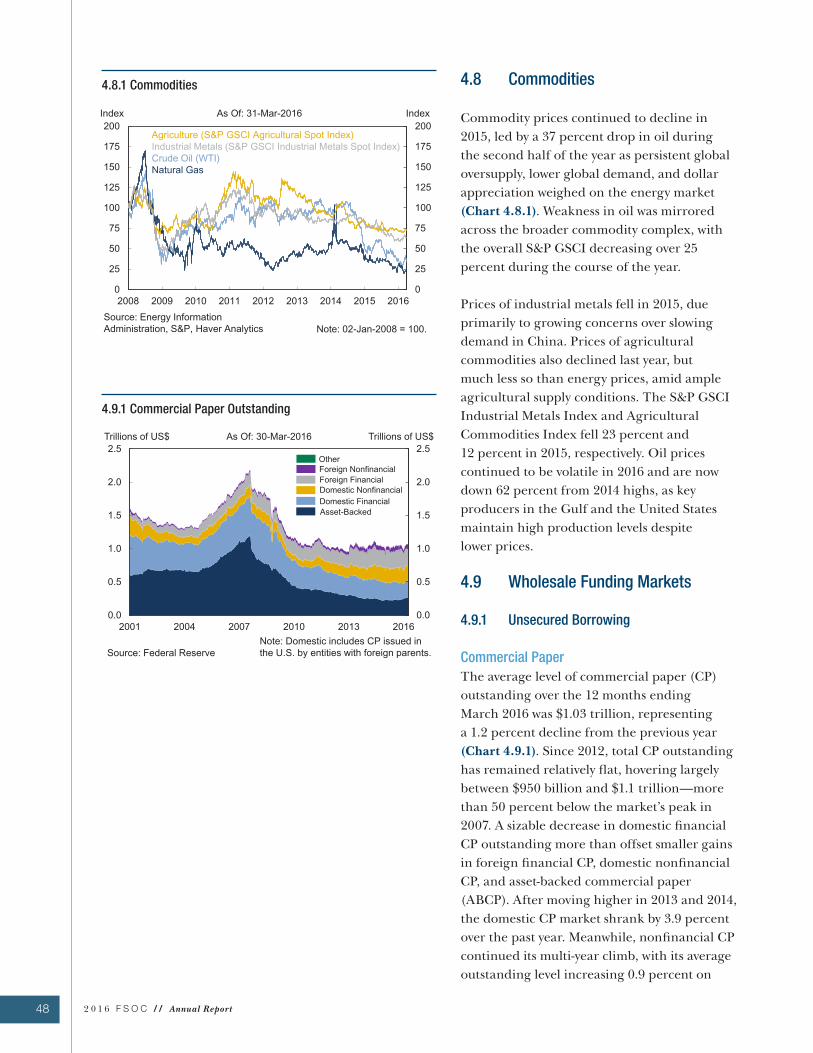
48 2 0 1 6 F S O C / / Annual Report
4.8 Commodities
Commodity prices continued to decline in
2015, led by a 37 percent drop in oil during
the second half of the year as persistent global
oversupply, lower global demand, and dollar
appreciation weighed on the energy market
(Chart 4.8.1). Weakness in oil was mirrored
across the broader commodity complex, with
the overall S&P GSCI decreasing over 25
percent during the course of the year.
Prices of industrial metals fell in 2015, due
primarily to growing concerns over slowing
demand in China. Prices of agricultural
commodities also declined last year, but
much less so than energy prices, amid ample
agricultural supply conditions. The S&P GSCI
Industrial Metals Index and Agricultural
Commodities Index fell 23 percent and
12 percent in 2015, respectively. Oil prices
continued to be volatile in 2016 and are now
down 62 percent from 2014 highs, as key
producers in the Gulf and the United States
maintain high production levels despite
lower prices.
4.9 Wholesale Funding Markets
4.9.1 Unsecured Borrowing
Commercial Paper
The average level of commercial paper (CP)
outstanding over the 12 months ending
March 2016 was $1.03 trillion, representing
a 1.2 percent decline from the previous year
(Chart 4.9.1). Since 2012, total CP outstanding
has remained relatively flat, hovering largely
between $950 billion and $1.1 trillion—more
than 50 percent below the market’s peak in
2007. A sizable decrease in domestic financial
CP outstanding more than offset smaller gains
in foreign financial CP, domestic nonfinancial
CP, and asset-backed commercial paper
(ABCP). After moving higher in 2013 and 2014,
the domestic CP market shrank by 3.9 percent
over the past year. Meanwhile, nonfinancial CP
continued its multi-year climb, with its average
outstanding level increasing 0.9 percent on
4.9.1 Commercial Paper Outstanding
4.8.1 Commodities
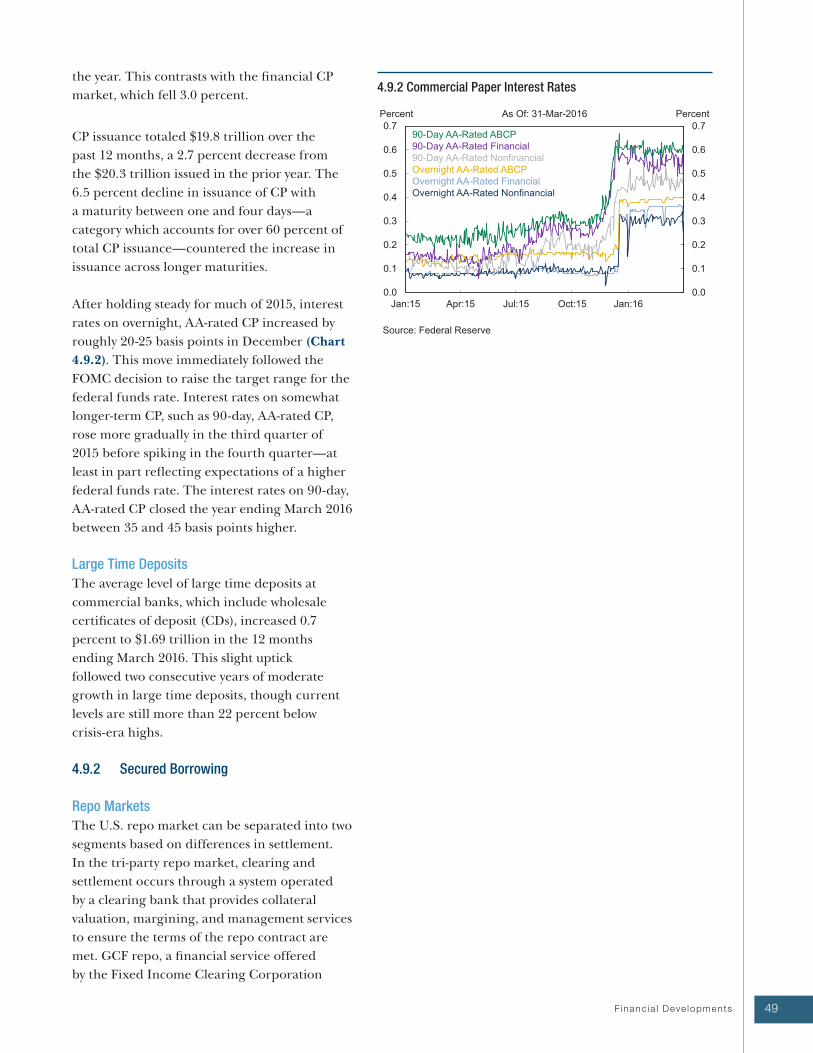
49 F inanc ia l Deve lopments
the year. This contrasts with the financial CP
market, which fell 3.0 percent.
CP issuance totaled $19.8 trillion over the
past 12 months, a 2.7 percent decrease from
the $20.3 trillion issued in the prior year. The
6.5 percent decline in issuance of CP with
a maturity between one and four days—a
category which accounts for over 60 percent of
total CP issuance—countered the increase in
issuance across longer maturities.
After holding steady for much of 2015, interest
rates on overnight, AA-rated CP increased by
roughly 20-25 basis points in December (Chart
4.9.2). This move immediately followed the
FOMC decision to raise the target range for the
federal funds rate. Interest rates on somewhat
longer-term CP, such as 90-day, AA-rated CP,
rose more gradually in the third quarter of
2015 before spiking in the fourth quarter—at
least in part reflecting expectations of a higher
federal funds rate. The interest rates on 90-day,
AA-rated CP closed the year ending March 2016
between 35 and 45 basis points higher.
Large Time Deposits
The average level of large time deposits at
commercial banks, which include wholesale
certificates of deposit (CDs), increased 0.7
percent to $1.69 trillion in the 12 months
ending March 2016. This slight uptick
followed two consecutive years of moderate
growth in large time deposits, though current
levels are still more than 22 percent below
crisis-era highs.
4.9.2 Secured Borrowing
Repo Markets
The U.S. repo market can be separated into two
segments based on differences in settlement.
In the tri-party repo market, clearing and
settlement occurs through a system operated
by a clearing bank that provides collateral
valuation, margining, and management services
to ensure the terms of the repo contract are
met. GCF repo, a financial service offered
by the Fixed Income Clearing Corporation
4.9.2 Commercial Paper Interest Rates
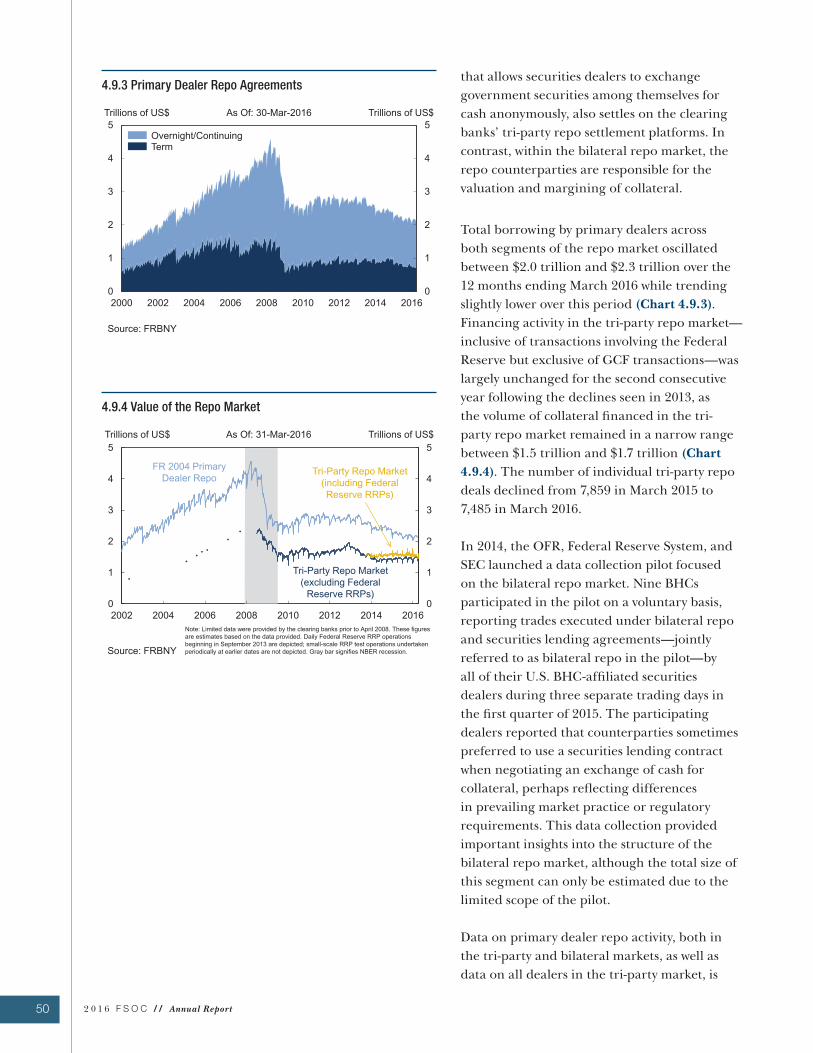
50 2 0 1 6 F S O C / / Annual Report
that allows securities dealers to exchange
government securities among themselves for
cash anonymously, also settles on the clearing
banks’ tri-party repo settlement platforms. In
contrast, within the bilateral repo market, the
repo counterparties are responsible for the
valuation and margining of collateral.
Total borrowing by primary dealers across
both segments of the repo market oscillated
between $2.0 trillion and $2.3 trillion over the
12 months ending March 2016 while trending
slightly lower over this period (Chart 4.9.3).
Financing activity in the tri-party repo market—
inclusive of transactions involving the Federal
Reserve but exclusive of GCF transactions—was
largely unchanged for the second consecutive
year following the declines seen in 2013, as
the volume of collateral financed in the tri-
party repo market remained in a narrow range
between $1.5 trillion and $1.7 trillion (Chart
4.9.4). The number of individual tri-party repo
deals declined from 7,859 in March 2015 to
7,485 in March 2016.
In 2014, the OFR, Federal Reserve System, and
SEC launched a data collection pilot focused
on the bilateral repo market. Nine BHCs
participated in the pilot on a voluntary basis,
reporting trades executed under bilateral repo
and securities lending agreements—jointly
referred to as bilateral repo in the pilot—by
all of their U.S. BHC-affiliated securities
dealers during three separate trading days in
the first quarter of 2015. The participating
dealers reported that counterparties sometimes
preferred to use a securities lending contract
when negotiating an exchange of cash for
collateral, perhaps reflecting differences
in prevailing market practice or regulatory
requirements. This data collection provided
important insights into the structure of the
bilateral repo market, although the total size of
this segment can only be estimated due to the
limited scope of the pilot.
Data on primary dealer repo activity, both in
the tri-party and bilateral markets, as well as
data on all dealers in the tri-party market, is
4.9.4 Value of the Repo Market
4.9.3 Primary Dealer Repo Agreements
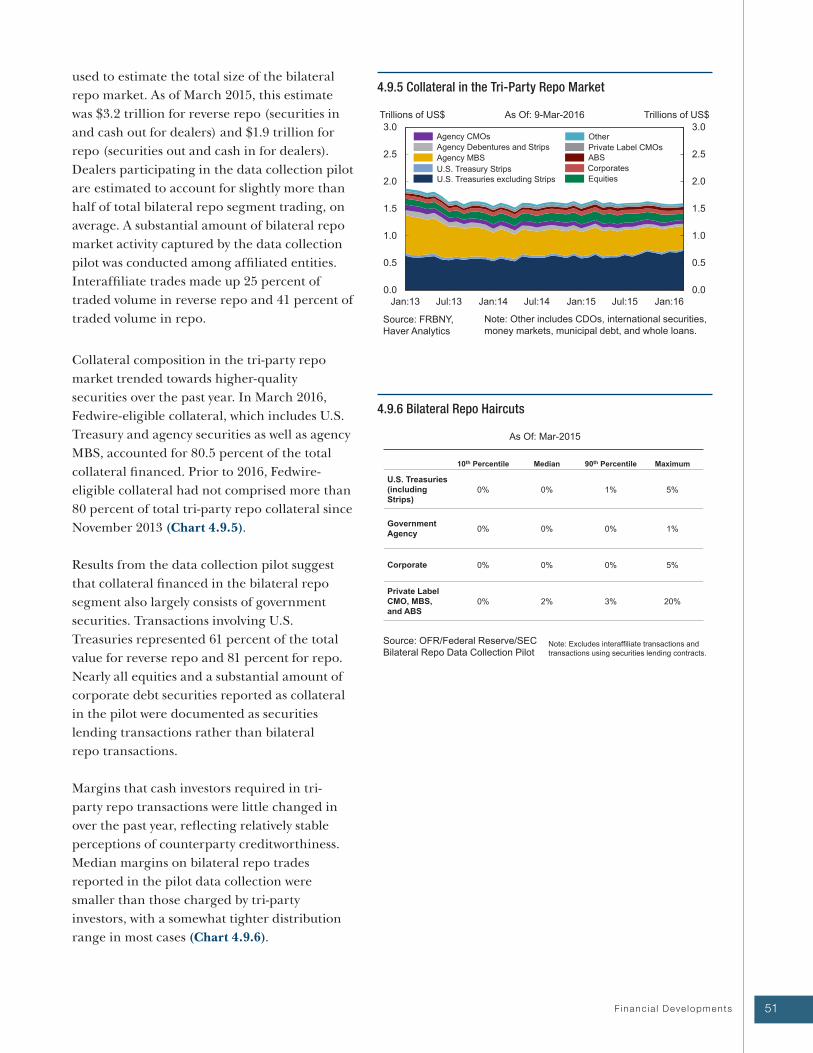
51 F inanc ia l Deve lopments
used to estimate the total size of the bilateral
repo market. As of March 2015, this estimate
was $3.2 trillion for reverse repo (securities in
and cash out for dealers) and $1.9 trillion for
repo (securities out and cash in for dealers).
Dealers participating in the data collection pilot
are estimated to account for slightly more than
half of total bilateral repo segment trading, on
average. A substantial amount of bilateral repo
market activity captured by the data collection
pilot was conducted among affiliated entities.
Interaffiliate trades made up 25 percent of
traded volume in reverse repo and 41 percent of
traded volume in repo.
Collateral composition in the tri-party repo
market trended towards higher-quality
securities over the past year. In March 2016,
Fedwire-eligible collateral, which includes U.S.
Treasury and agency securities as well as agency
MBS, accounted for 80.5 percent of the total
collateral financed. Prior to 2016, Fedwire-
eligible collateral had not comprised more than
80 percent of total tri-party repo collateral since
November 2013 (Chart 4.9.5).
Results from the data collection pilot suggest
that collateral financed in the bilateral repo
segment also largely consists of government
securities. Transactions involving U.S.
Treasuries represented 61 percent of the total
value for reverse repo and 81 percent for repo.
Nearly all equities and a substantial amount of
corporate debt securities reported as collateral
in the pilot were documented as securities
lending transactions rather than bilateral
repo transactions.
Margins that cash investors required in tri-
party repo transactions were little changed in
over the past year, reflecting relatively stable
perceptions of counterparty creditworthiness.
Median margins on bilateral repo trades
reported in the pilot data collection were
smaller than those charged by tri-party
investors, with a somewhat tighter distribution
range in most cases (Chart 4.9.6).
4.9.6 Bilateral Repo Haircuts
4.9.5 Collateral in the Tri-Party Repo Market
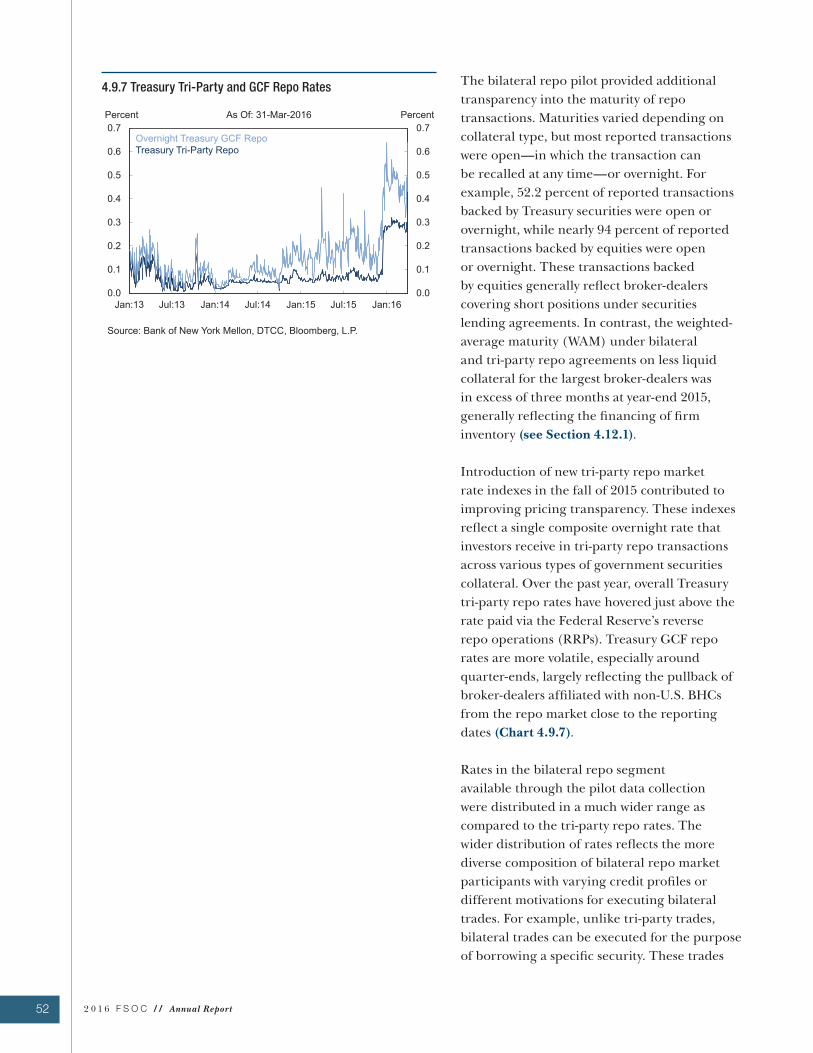
52 2 0 1 6 F S O C / / Annual Report
The bilateral repo pilot provided additional
transparency into the maturity of repo
transactions. Maturities varied depending on
collateral type, but most reported transactions
were open—in which the transaction can
be recalled at any time—or overnight. For
example, 52.2 percent of reported transactions
backed by Treasury securities were open or
overnight, while nearly 94 percent of reported
transactions backed by equities were open
or overnight. These transactions backed
by equities generally reflect broker-dealers
covering short positions under securities
lending agreements. In contrast, the weighted-
average maturity (WAM) under bilateral
and tri-party repo agreements on less liquid
collateral for the largest broker-dealers was
in excess of three months at year-end 2015,
generally reflecting the financing of firm
inventory (see Section 4.12.1).
Introduction of new tri-party repo market
rate indexes in the fall of 2015 contributed to
improving pricing transparency. These indexes
reflect a single composite overnight rate that
investors receive in tri-party repo transactions
across various types of government securities
collateral. Over the past year, overall Treasury
tri-party repo rates have hovered just above the
rate paid via the Federal Reserve’s reverse
repo operations (RRPs). Treasury GCF repo
rates are more volatile, especially around
quarter-ends, largely reflecting the pullback of
broker-dealers affiliated with non-U.S. BHCs
from the repo market close to the reporting
dates (Chart 4.9.7).
Rates in the bilateral repo segment
available through the pilot data collection
were distributed in a much wider range as
compared to the tri-party repo rates. The
wider distribution of rates reflects the more
diverse composition of bilateral repo market
participants with varying credit profiles or
different motivations for executing bilateral
trades. For example, unlike tri-party trades,
bilateral trades can be executed for the purpose
of borrowing a specific security. These trades
4.9.7 Treasury Tri-Party and GCF Repo Rates
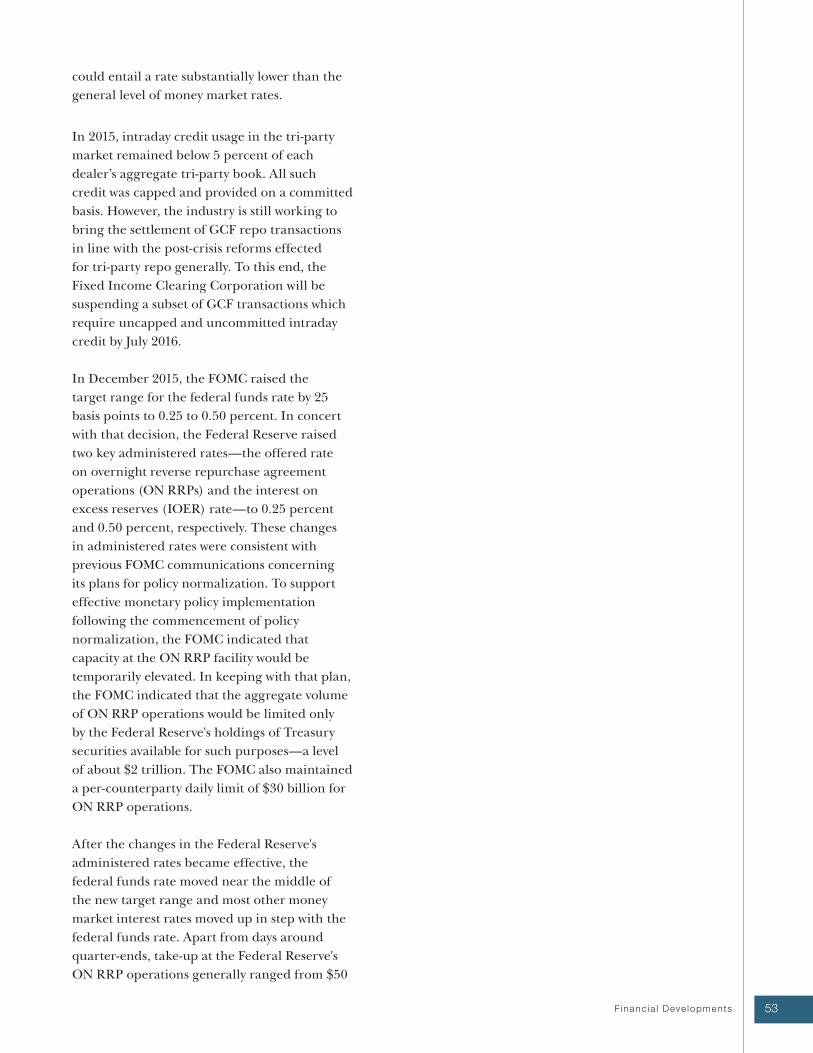
53 F inanc ia l Deve lopments
could entail a rate substantially lower than the
general level of money market rates.
In 2015, intraday credit usage in the tri-party
market remained below 5 percent of each
dealer’s aggregate tri-party book. All such
credit was capped and provided on a committed
basis. However, the industry is still working to
bring the settlement of GCF repo transactions
in line with the post-crisis reforms effected
for tri-party repo generally. To this end, the
Fixed Income Clearing Corporation will be
suspending a subset of GCF transactions which
require uncapped and uncommitted intraday
credit by July 2016.
In December 2015, the FOMC raised the
target range for the federal funds rate by 25
basis points to 0.25 to 0.50 percent. In concert
with that decision, the Federal Reserve raised
two key administered rates—the offered rate
on overnight reverse repurchase agreement
operations (ON RRPs) and the interest on
excess reserves (IOER) rate—to 0.25 percent
and 0.50 percent, respectively. These changes
in administered rates were consistent with
previous FOMC communications concerning
its plans for policy normalization. To support
effective monetary policy implementation
following the commencement of policy
normalization, the FOMC indicated that
capacity at the ON RRP facility would be
temporarily elevated. In keeping with that plan,
the FOMC indicated that the aggregate volume
of ON RRP operations would be limited only
by the Federal Reserve's holdings of Treasury
securities available for such purposes—a level
of about $2 trillion. The FOMC also maintained
a per-counterparty daily limit of $30 billion for
ON RRP operations.
After the changes in the Federal Reserve's
administered rates became effective, the
federal funds rate moved near the middle of
the new target range and most other money
market interest rates moved up in step with the
federal funds rate. Apart from days around
quarter-ends, take-up at the Federal Reserve's
ON RRP operations generally ranged from $50
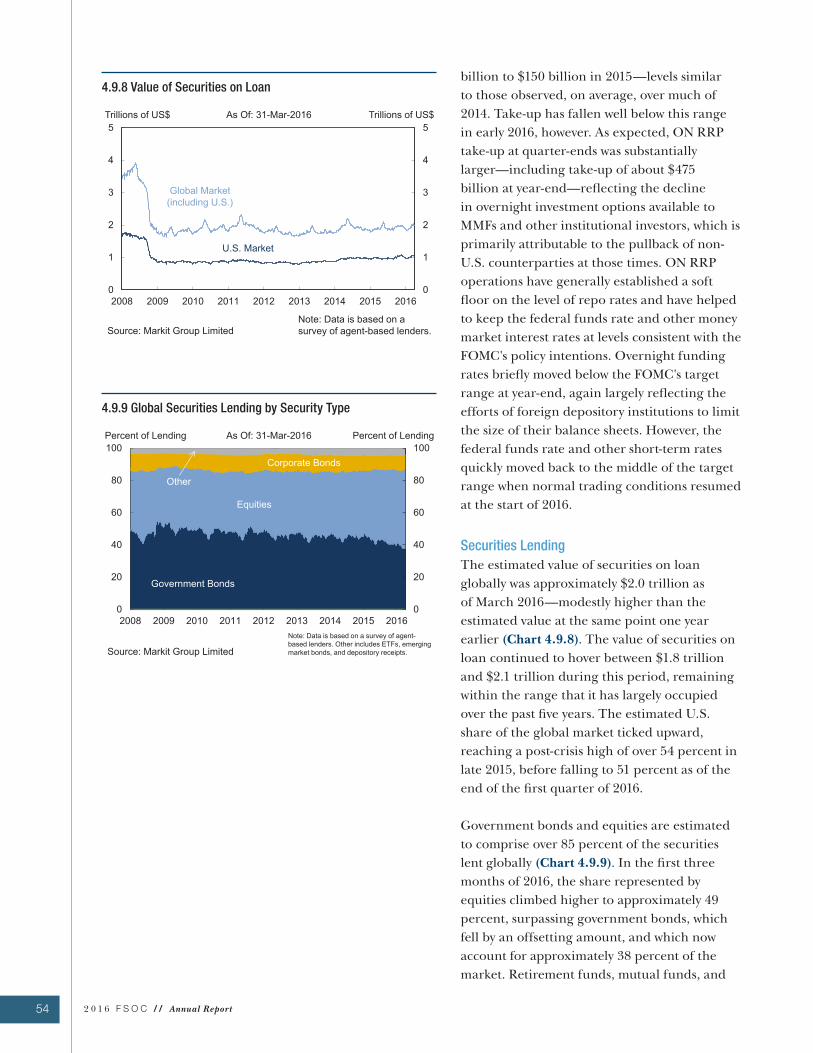
54 2 0 1 6 F S O C / / Annual Report
billion to $150 billion in 2015—levels similar
to those observed, on average, over much of
2014. Take-up has fallen well below this range
in early 2016, however. As expected, ON RRP
take-up at quarter-ends was substantially
larger—including take-up of about $475
billion at year-end—reflecting the decline
in overnight investment options available to
MMFs and other institutional investors, which is
primarily attributable to the pullback of non-
U.S. counterparties at those times. ON RRP
operations have generally established a soft
floor on the level of repo rates and have helped
to keep the federal funds rate and other money
market interest rates at levels consistent with the
FOMC's policy intentions. Overnight funding
rates briefly moved below the FOMC's target
range at year-end, again largely reflecting the
efforts of foreign depository institutions to limit
the size of their balance sheets. However, the
federal funds rate and other short-term rates
quickly moved back to the middle of the target
range when normal trading conditions resumed
at the start of 2016.
Securities Lending
The estimated value of securities on loan
globally was approximately $2.0 trillion as
of March 2016—modestly higher than the
estimated value at the same point one year
earlier (Chart 4.9.8). The value of securities on
loan continued to hover between $1.8 trillion
and $2.1 trillion during this period, remaining
within the range that it has largely occupied
over the past five years. The estimated U.S.
share of the global market ticked upward,
reaching a post-crisis high of over 54 percent in
late 2015, before falling to 51 percent as of the
end of the first quarter of 2016.
Government bonds and equities are estimated
to comprise over 85 percent of the securities
lent globally (Chart 4.9.9). In the first three
months of 2016, the share represented by
equities climbed higher to approximately 49
percent, surpassing government bonds, which
fell by an offsetting amount, and which now
account for approximately 38 percent of the
market. Retirement funds, mutual funds, and
4.9.9 Global Securities Lending by Security Type
4.9.8 Value of Securities on Loan
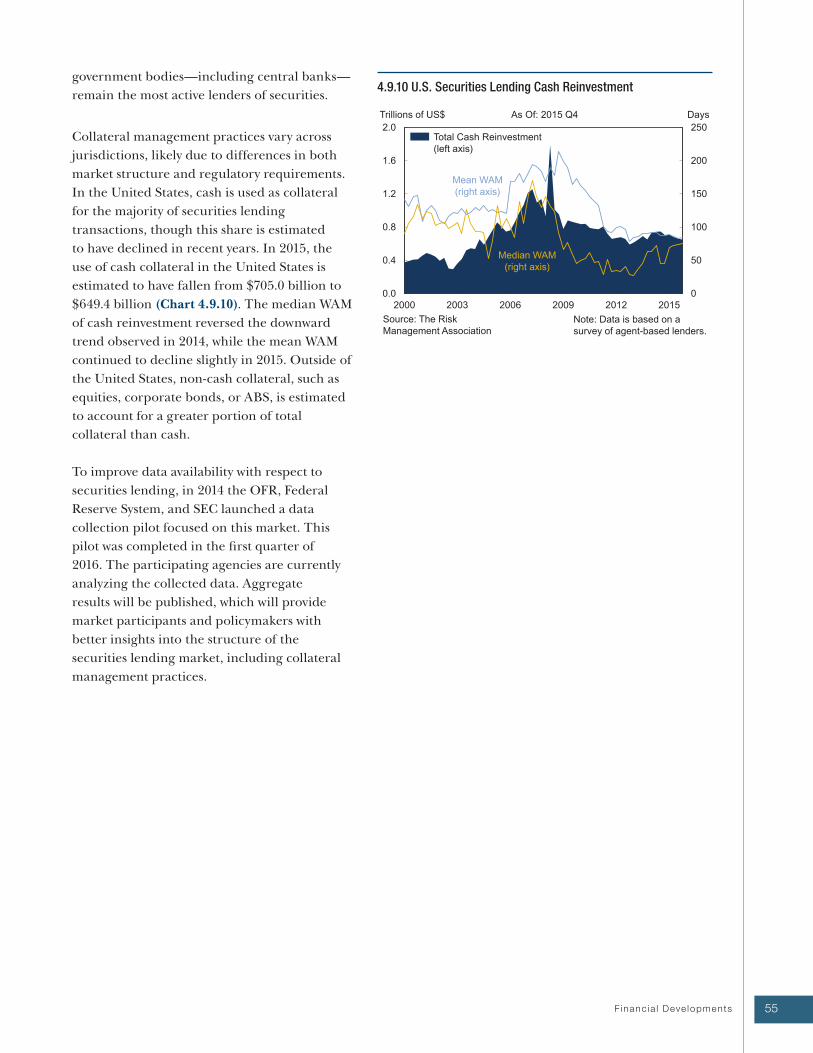
55 F inanc ia l Deve lopments
government bodies—including central banks—
remain the most active lenders of securities.
Collateral management practices vary across
jurisdictions, likely due to differences in both
market structure and regulatory requirements.
In the United States, cash is used as collateral
for the majority of securities lending
transactions, though this share is estimated
to have declined in recent years. In 2015, the
use of cash collateral in the United States is
estimated to have fallen from $705.0 billion to
$649.4 billion (Chart 4.9.10). The median WAM
of cash reinvestment reversed the downward
trend observed in 2014, while the mean WAM
continued to decline slightly in 2015. Outside of
the United States, non-cash collateral, such as
equities, corporate bonds, or ABS, is estimated
to account for a greater portion of total
collateral than cash.
To improve data availability with respect to
securities lending, in 2014 the OFR, Federal
Reserve System, and SEC launched a data
collection pilot focused on this market. This
pilot was completed in the first quarter of
2016. The participating agencies are currently
analyzing the collected data. Aggregate
results will be published, which will provide
market participants and policymakers with
better insights into the structure of the
securities lending market, including collateral
management practices.
4.9.10 U.S. Securities Lending Cash Reinvestment
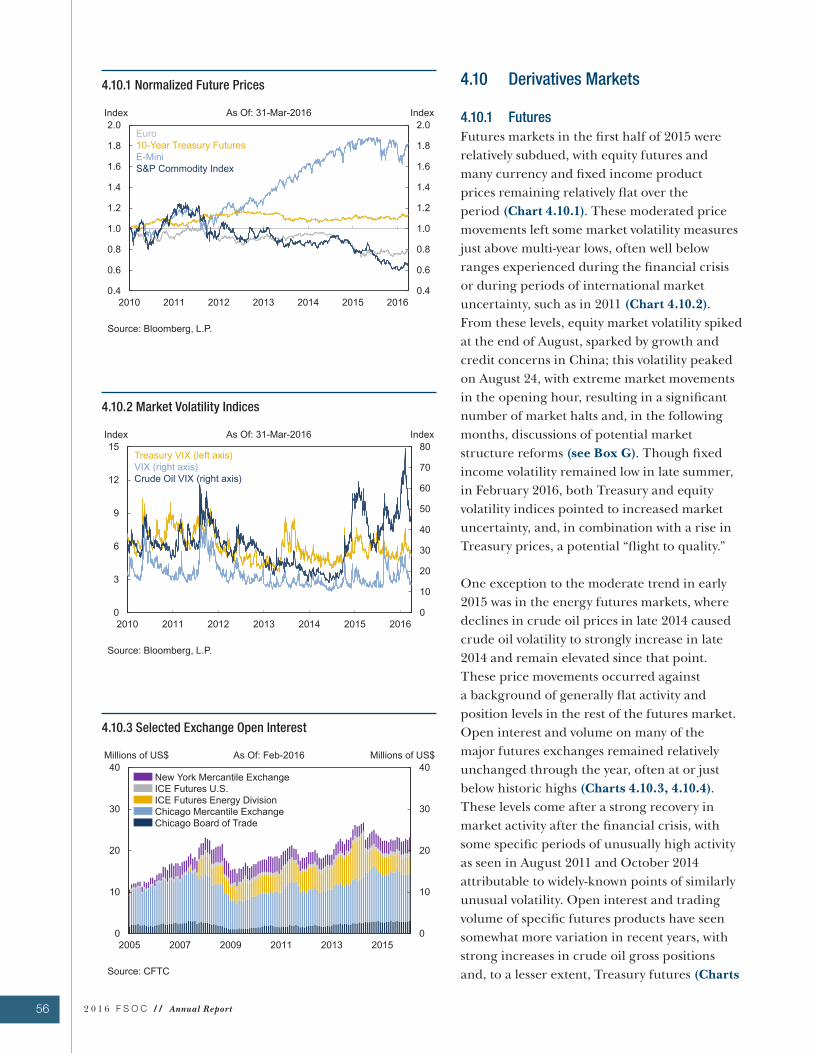
56 2 0 1 6 F S O C / / Annual Report
4.10 Derivatives Markets
4.10.1 Futures
Futures markets in the first half of 2015 were
relatively subdued, with equity futures and
many currency and fixed income product
prices remaining relatively flat over the
period (Chart 4.10.1). These moderated price
movements left some market volatility measures
just above multi-year lows, often well below
ranges experienced during the financial crisis
or during periods of international market
uncertainty, such as in 2011 (Chart 4.10.2).
From these levels, equity market volatility spiked
at the end of August, sparked by growth and
credit concerns in China; this volatility peaked
on August 24, with extreme market movements
in the opening hour, resulting in a significant
number of market halts and, in the following
months, discussions of potential market
structure reforms (see Box G). Though fixed
income volatility remained low in late summer,
in February 2016, both Treasury and equity
volatility indices pointed to increased market
uncertainty, and, in combination with a rise in
Treasury prices, a potential “flight to quality.”
One exception to the moderate trend in early
2015 was in the energy futures markets, where
declines in crude oil prices in late 2014 caused
crude oil volatility to strongly increase in late
2014 and remain elevated since that point.
These price movements occurred against
a background of generally flat activity and
position levels in the rest of the futures market.
Open interest and volume on many of the
major futures exchanges remained relatively
unchanged through the year, often at or just
below historic highs (Charts 4.10.3, 4.10.4).
These levels come after a strong recovery in
market activity after the financial crisis, with
some specific periods of unusually high activity
as seen in August 2011 and October 2014
attributable to widely-known points of similarly
unusual volatility. Open interest and trading
volume of specific futures products have seen
somewhat more variation in recent years, with
strong increases in crude oil gross positions
and, to a lesser extent, Treasury futures (Charts
4.10.3 Selected Exchange Open Interest
4.10.2 Market Volatility Indices
4.10.1 Normalized Future Prices
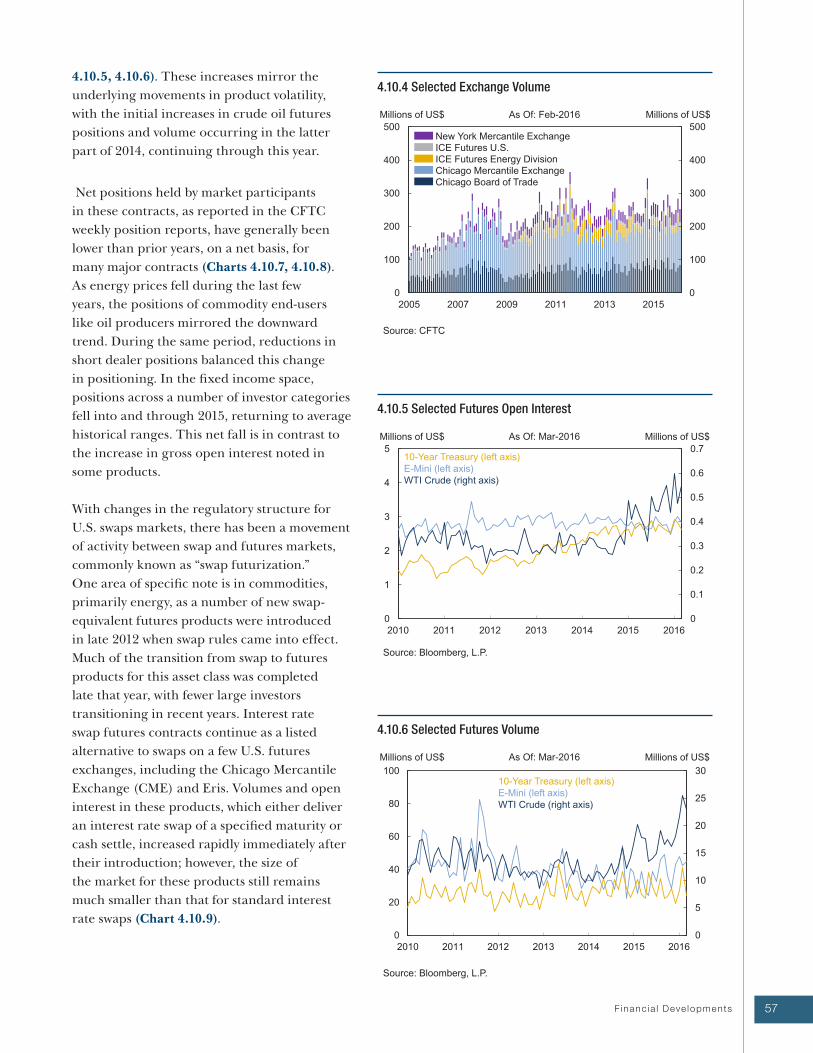
57 F inanc ia l Deve lopments
4.10.5, 4.10.6). These increases mirror the
underlying movements in product volatility,
with the initial increases in crude oil futures
positions and volume occurring in the latter
part of 2014, continuing through this year.
Net positions held by market participants
in these contracts, as reported in the CFTC
weekly position reports, have generally been
lower than prior years, on a net basis, for
many major contracts (Charts 4.10.7, 4.10.8).
As energy prices fell during the last few
years, the positions of commodity end-users
like oil producers mirrored the downward
trend. During the same period, reductions in
short dealer positions balanced this change
in positioning. In the fixed income space,
positions across a number of investor categories
fell into and through 2015, returning to average
historical ranges. This net fall is in contrast to
the increase in gross open interest noted in
some products.
With changes in the regulatory structure for
U.S. swaps markets, there has been a movement
of activity between swap and futures markets,
commonly known as “swap futurization.”
One area of specific note is in commodities,
primarily energy, as a number of new swap-
equivalent futures products were introduced
in late 2012 when swap rules came into effect.
Much of the transition from swap to futures
products for this asset class was completed
late that year, with fewer large investors
transitioning in recent years. Interest rate
swap futures contracts continue as a listed
alternative to swaps on a few U.S. futures
exchanges, including the Chicago Mercantile
Exchange (CME) and Eris. Volumes and open
interest in these products, which either deliver
an interest rate swap of a specified maturity or
cash settle, increased rapidly immediately after
their introduction; however, the size of
the market for these products still remains
much smaller than that for standard interest
rate swaps (Chart 4.10.9).
4.10.6 Selected Futures Volume
4.10.5 Selected Futures Open Interest
4.10.4 Selected Exchange Volume
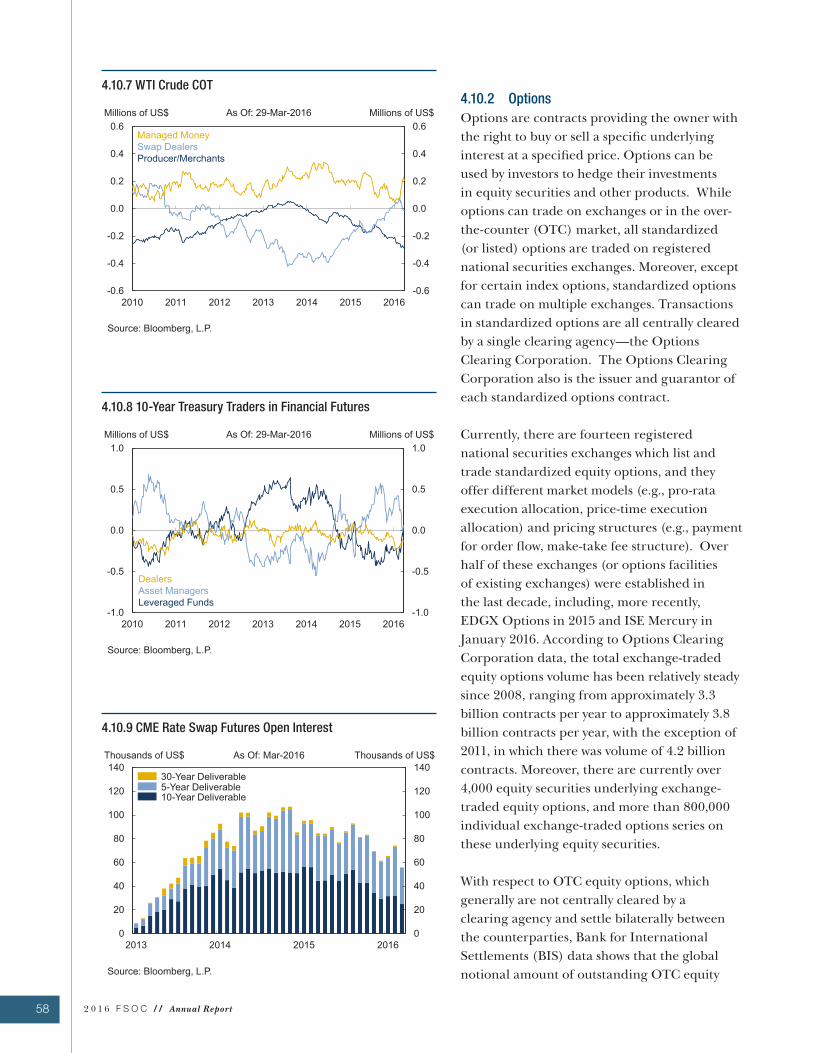
58 2 0 1 6 F S O C / / Annual Report
4.10.9 CME Rate Swap Futures Open Interest
4.10.8 10-Year Treasury Traders in Financial Futures
4.10.7 WTI Crude COT4.10.2 Options
Options are contracts providing the owner with
the right to buy or sell a specific underlying
interest at a specified price. Options can be
used by investors to hedge their investments
in equity securities and other products. While
options can trade on exchanges or in the over-
the-counter (OTC) market, all standardized
(or listed) options are traded on registered
national securities exchanges. Moreover, except
for certain index options, standardized options
can trade on multiple exchanges. Transactions
in standardized options are all centrally cleared
by a single clearing agency—the Options
Clearing Corporation. The Options Clearing
Corporation also is the issuer and guarantor of
each standardized options contract.
Currently, there are fourteen registered
national securities exchanges which list and
trade standardized equity options, and they
offer different market models (e.g., pro-rata
execution allocation, price-time execution
allocation) and pricing structures (e.g., payment
for order flow, make-take fee structure). Over
half of these exchanges (or options facilities
of existing exchanges) were established in
the last decade, including, more recently,
EDGX Options in 2015 and ISE Mercury in
January 2016. According to Options Clearing
Corporation data, the total exchange-traded
equity options volume has been relatively steady
since 2008, ranging from approximately 3.3
billion contracts per year to approximately 3.8
billion contracts per year, with the exception of
2011, in which there was volume of 4.2 billion
contracts. Moreover, there are currently over
4,000 equity securities underlying exchange-
traded equity options, and more than 800,000
individual exchange-traded options series on
these underlying equity securities.
With respect to OTC equity options, which
generally are not centrally cleared by a
clearing agency and settle bilaterally between
the counterparties, Bank for International
Settlements (BIS) data shows that the global
notional amount of outstanding OTC equity
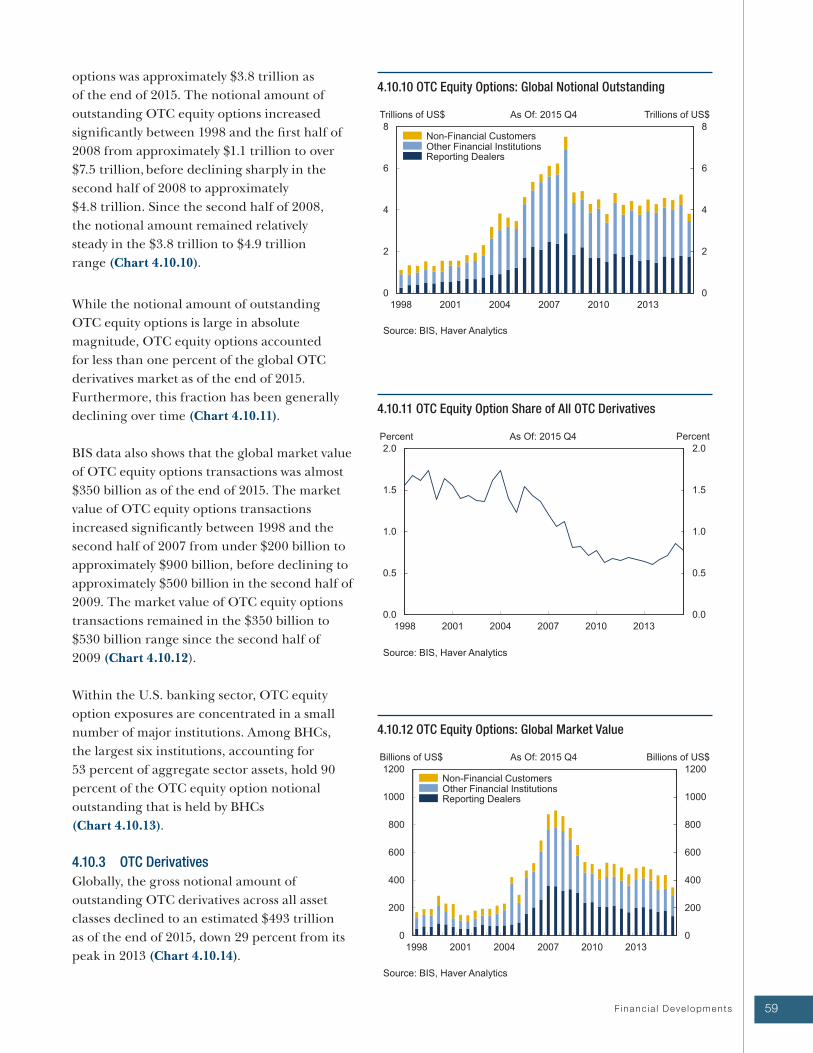
59 F inanc ia l Deve lopments
options was approximately $3.8 trillion as
of the end of 2015. The notional amount of
outstanding OTC equity options increased
significantly between 1998 and the first half of
2008 from approximately $1.1 trillion to over
$7.5 trillion, before declining sharply in the
second half of 2008 to approximately
$4.8 trillion. Since the second half of 2008,
the notional amount remained relatively
steady in the $3.8 trillion to $4.9 trillion
range (Chart 4.10.10).
While the notional amount of outstanding
OTC equity options is large in absolute
magnitude, OTC equity options accounted
for less than one percent of the global OTC
derivatives market as of the end of 2015.
Furthermore, this fraction has been generally
declining over time (Chart 4.10.11).
BIS data also shows that the global market value
of OTC equity options transactions was almost
$350 billion as of the end of 2015. The market
value of OTC equity options transactions
increased significantly between 1998 and the
second half of 2007 from under $200 billion to
approximately $900 billion, before declining to
approximately $500 billion in the second half of
2009. The market value of OTC equity options
transactions remained in the $350 billion to
$530 billion range since the second half of
2009 (Chart 4.10.12).
Within the U.S. banking sector, OTC equity
option exposures are concentrated in a small
number of major institutions. Among BHCs,
the largest six institutions, accounting for
53 percent of aggregate sector assets, hold 90
percent of the OTC equity option notional
outstanding that is held by BHCs (Chart 4.10.13).
4.10.3 OTC Derivatives
Globally, the gross notional amount of
outstanding OTC derivatives across all asset
classes declined to an estimated $493 trillion
as of the end of 2015, down 29 percent from its
peak in 2013 (Chart 4.10.14).
4.10.12 OTC Equity Options: Global Market Value
4.10.11 OTC Equity Option Share of All OTC Derivatives
4.10.10 OTC Equity Options: Global Notional Outstanding
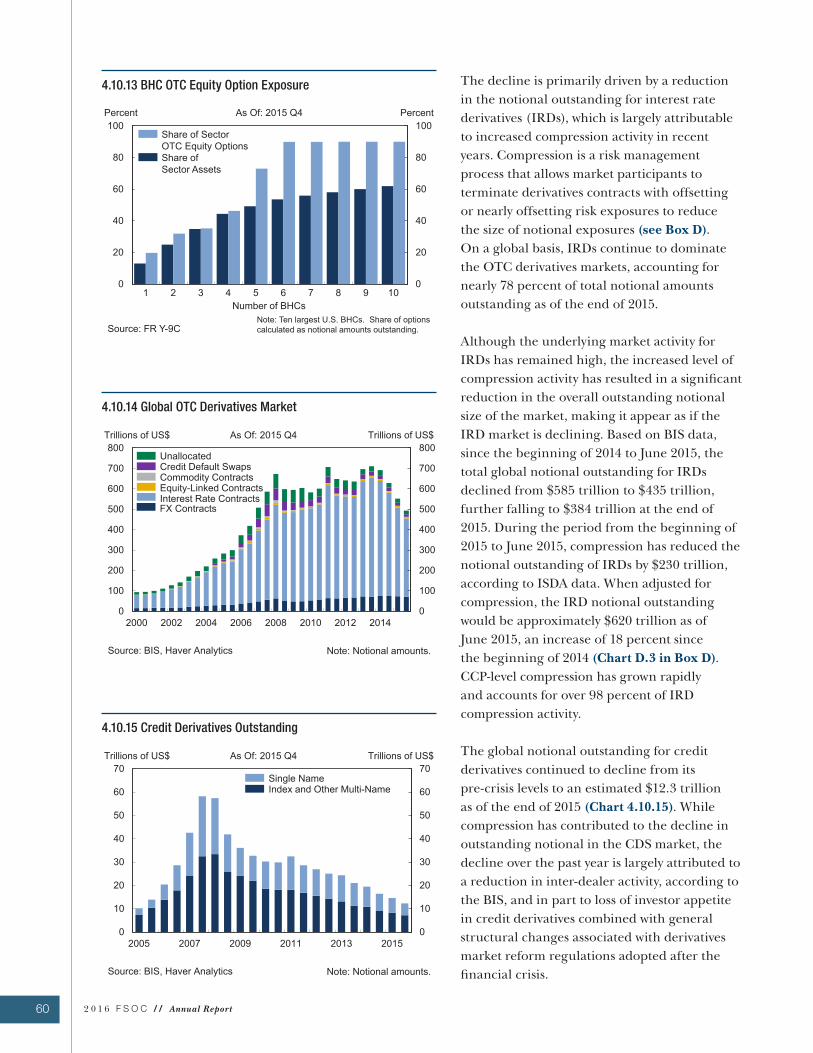
60 2 0 1 6 F S O C / / Annual Report
The decline is primarily driven by a reduction
in the notional outstanding for interest rate
derivatives (IRDs), which is largely attributable
to increased compression activity in recent
years. Compression is a risk management
process that allows market participants to
terminate derivatives contracts with offsetting
or nearly offsetting risk exposures to reduce
the size of notional exposures (see Box D).
On a global basis, IRDs continue to dominate
the OTC derivatives markets, accounting for
nearly 78 percent of total notional amounts
outstanding as of the end of 2015.
Although the underlying market activity for
IRDs has remained high, the increased level of
compression activity has resulted in a significant
reduction in the overall outstanding notional
size of the market, making it appear as if the
IRD market is declining. Based on BIS data,
since the beginning of 2014 to June 2015, the
total global notional outstanding for IRDs
declined from $585 trillion to $435 trillion,
further falling to $384 trillion at the end of
2015. During the period from the beginning of
2015 to June 2015, compression has reduced the
notional outstanding of IRDs by $230 trillion,
according to ISDA data. When adjusted for
compression, the IRD notional outstanding
would be approximately $620 trillion as of
June 2015, an increase of 18 percent since
the beginning of 2014 (Chart D.3 in Box D).
CCP-level compression has grown rapidly
and accounts for over 98 percent of IRD
compression activity.
The global notional outstanding for credit
derivatives continued to decline from its
pre-crisis levels to an estimated $12.3 trillion
as of the end of 2015 (Chart 4.10.15). While
compression has contributed to the decline in
outstanding notional in the CDS market, the
decline over the past year is largely attributed to
a reduction in inter-dealer activity, according to
the BIS, and in part to loss of investor appetite
in credit derivatives combined with general
structural changes associated with derivatives
market reform regulations adopted after the
financial crisis.
4.10.15 Credit Derivatives Outstanding
4.10.14 Global OTC Derivatives Market
4.10.13 BHC OTC Equity Option Exposure
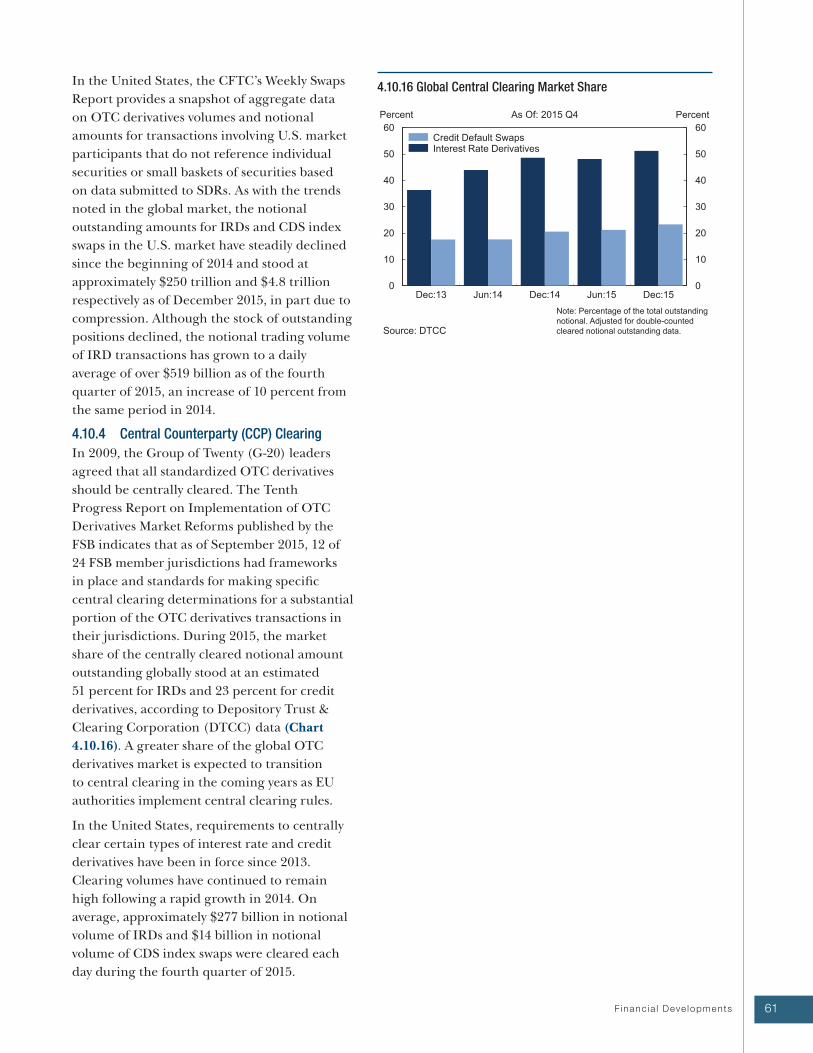
61 F inanc ia l Deve lopments
In the United States, the CFTC’s Weekly Swaps
Report provides a snapshot of aggregate data
on OTC derivatives volumes and notional
amounts for transactions involving U.S. market
participants that do not reference individual
securities or small baskets of securities based
on data submitted to SDRs. As with the trends
noted in the global market, the notional
outstanding amounts for IRDs and CDS index
swaps in the U.S. market have steadily declined
since the beginning of 2014 and stood at
approximately $250 trillion and $4.8 trillion
respectively as of December 2015, in part due to
compression. Although the stock of outstanding
positions declined, the notional trading volume
of IRD transactions has grown to a daily
average of over $519 billion as of the fourth
quarter of 2015, an increase of 10 percent from
the same period in 2014.
4.10.4 Central Counterparty (CCP) Clearing
In 2009, the Group of Twenty (G-20) leaders
agreed that all standardized OTC derivatives
should be centrally cleared. The Tenth
Progress Report on Implementation of OTC
Derivatives Market Reforms published by the
FSB indicates that as of September 2015, 12 of
24 FSB member jurisdictions had frameworks
in place and standards for making specific
central clearing determinations for a substantial
portion of the OTC derivatives transactions in
their jurisdictions. During 2015, the market
share of the centrally cleared notional amount
outstanding globally stood at an estimated
51 percent for IRDs and 23 percent for credit
derivatives, according to Depository Trust &
Clearing Corporation (DTCC) data (Chart
4.10.16). A greater share of the global OTC
derivatives market is expected to transition
to central clearing in the coming years as EU
authorities implement central clearing rules.
In the United States, requirements to centrally
clear certain types of interest rate and credit
derivatives have been in force since 2013.
Clearing volumes have continued to remain
high following a rapid growth in 2014. On
average, approximately $277 billion in notional
volume of IRDs and $14 billion in notional
volume of CDS index swaps were cleared each
day during the fourth quarter of 2015.
4.10.16 Global Central Clearing Market Share
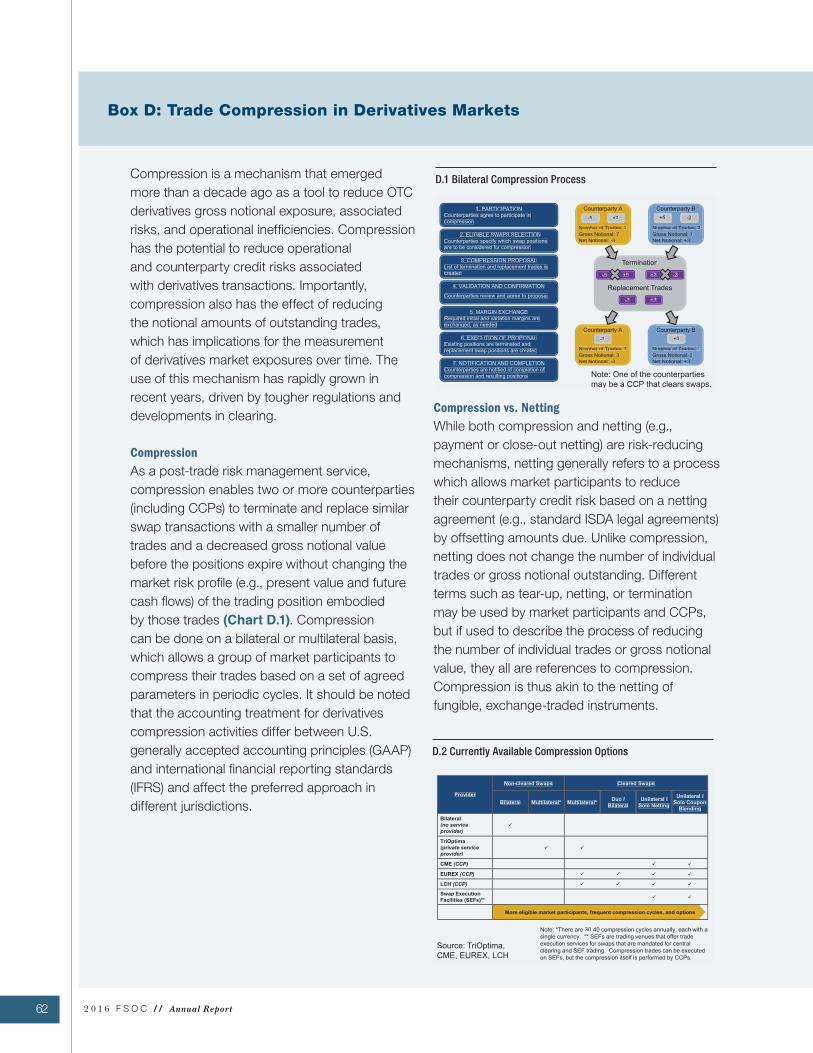
2 0 1 6 F S O C / / Annual Report62
Box D: Trade Compression in Derivatives Markets
Compression is a mechanism that emerged
more than a decade ago as a tool to reduce OTC
derivatives gross notional exposure, associated
risks, and operational inefficiencies. Compression
has the potential to reduce operational
and counterparty credit risks associated
with derivatives transactions. Importantly,
compression also has the effect of reducing
the notional amounts of outstanding trades,
which has implications for the measurement
of derivatives market exposures over time. The
use of this mechanism has rapidly grown in
recent years, driven by tougher regulations and
developments in clearing.
Compression
As a post-trade risk management service,
compression enables two or more counterparties
(including CCPs) to terminate and replace similar
swap transactions with a smaller number of
trades and a decreased gross notional value
before the positions expire without changing the
market risk profile (e.g., present value and future
cash flows) of the trading position embodied
by those trades (Chart D.1). Compression
can be done on a bilateral or multilateral basis,
which allows a group of market participants to
compress their trades based on a set of agreed
parameters in periodic cycles. It should be noted
that the accounting treatment for derivatives
compression activities differ between U.S.
generally accepted accounting principles (GAAP)
and international financial reporting standards
(IFRS) and affect the preferred approach in
different jurisdictions.
Compression vs. Netting
While both compression and netting (e.g.,
payment or close-out netting) are risk-reducing
mechanisms, netting generally refers to a process
which allows market participants to reduce
their counterparty credit risk based on a netting
agreement (e.g., standard ISDA legal agreements)
by offsetting amounts due. Unlike compression,
netting does not change the number of individual
trades or gross notional outstanding. Different
terms such as tear-up, netting, or termination
may be used by market participants and CCPs,
but if used to describe the process of reducing
the number of individual trades or gross notional
value, they all are references to compression.
Compression is thus akin to the netting of
fungible, exchange-traded instruments.
D.1 Bilateral Compression Process
D.2 Currently Available Compression Options
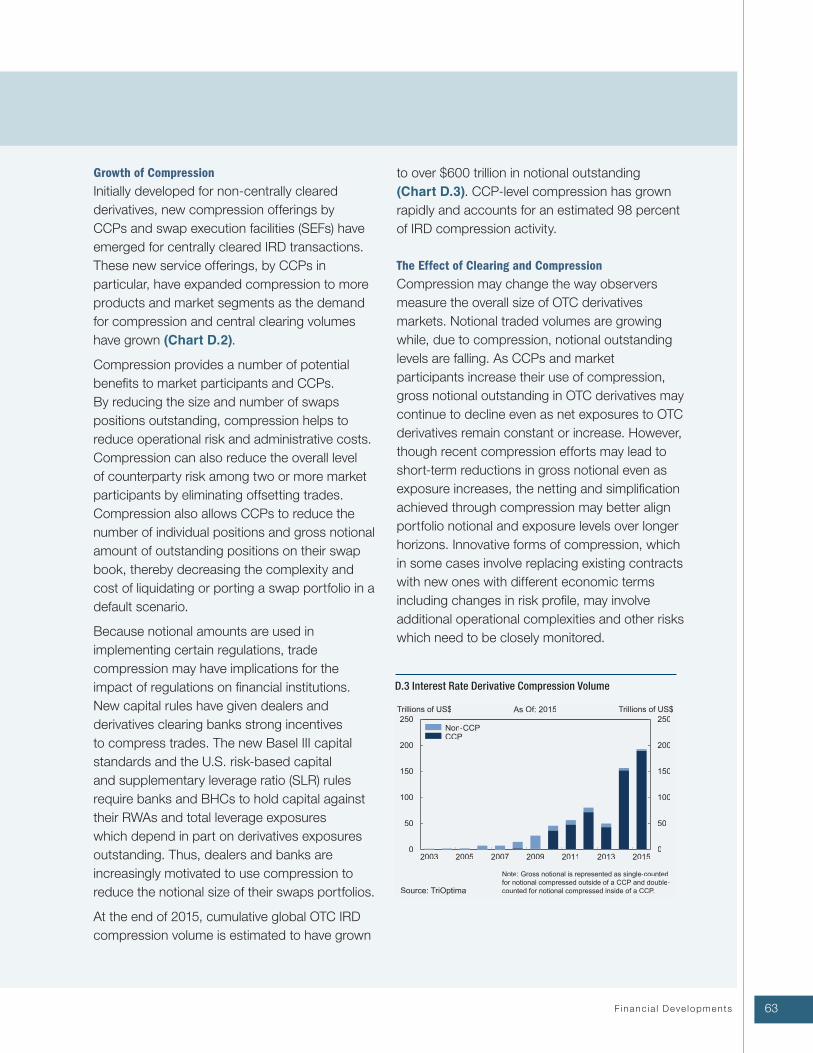
63Financ ia l Deve lopments
Growth of Compression
Initially developed for non-centrally cleared
derivatives, new compression offerings by
CCPs and swap execution facilities (SEFs) have
emerged for centrally cleared IRD transactions.
These new service offerings, by CCPs in
particular, have expanded compression to more
products and market segments as the demand
for compression and central clearing volumes
have grown (Chart D.2).Compression provides a number of potential
benefits to market participants and CCPs.
By reducing the size and number of swaps
positions outstanding, compression helps to
reduce operational risk and administrative costs.
Compression can also reduce the overall level
of counterparty risk among two or more market
participants by eliminating offsetting trades.
Compression also allows CCPs to reduce the
number of individual positions and gross notional
amount of outstanding positions on their swap
book, thereby decreasing the complexity and
cost of liquidating or porting a swap portfolio in a
default scenario.
Because notional amounts are used in
implementing certain regulations, trade
compression may have implications for the
impact of regulations on financial institutions.
New capital rules have given dealers and
derivatives clearing banks strong incentives
to compress trades. The new Basel III capital
standards and the U.S. risk-based capital
and supplementary leverage ratio (SLR) rules
require banks and BHCs to hold capital against
their RWAs and total leverage exposures
which depend in part on derivatives exposures
outstanding. Thus, dealers and banks are
increasingly motivated to use compression to
reduce the notional size of their swaps portfolios.
At the end of 2015, cumulative global OTC IRD
compression volume is estimated to have grown
to over $600 trillion in notional outstanding
(Chart D.3). CCP-level compression has grown
rapidly and accounts for an estimated 98 percent
of IRD compression activity.
The Effect of Clearing and Compression
Compression may change the way observers
measure the overall size of OTC derivatives
markets. Notional traded volumes are growing
while, due to compression, notional outstanding
levels are falling. As CCPs and market
participants increase their use of compression,
gross notional outstanding in OTC derivatives may
continue to decline even as net exposures to OTC
derivatives remain constant or increase. However,
though recent compression efforts may lead to
short-term reductions in gross notional even as
exposure increases, the netting and simplification
achieved through compression may better align
portfolio notional and exposure levels over longer
horizons. Innovative forms of compression, which
in some cases involve replacing existing contracts
with new ones with different economic terms
including changes in risk profile, may involve
additional operational complexities and other risks
which need to be closely monitored.
D.3 Interest Rate Derivative Compression Volume
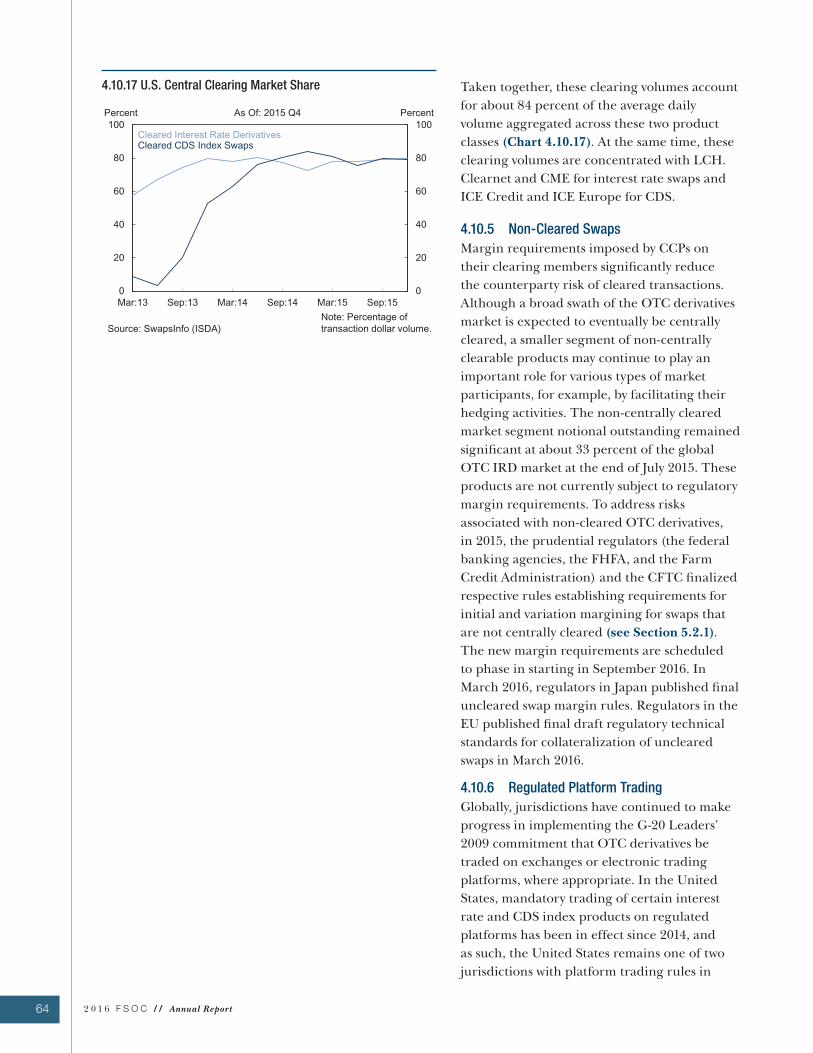
64 2 0 1 6 F S O C / / Annual Report
4.10.17 U.S. Central Clearing Market Share Taken together, these clearing volumes account
for about 84 percent of the average daily
volume aggregated across these two product
classes (Chart 4.10.17). At the same time, these
clearing volumes are concentrated with LCH.
Clearnet and CME for interest rate swaps and
ICE Credit and ICE Europe for CDS.
4.10.5 Non-Cleared Swaps
Margin requirements imposed by CCPs on
their clearing members significantly reduce
the counterparty risk of cleared transactions.
Although a broad swath of the OTC derivatives
market is expected to eventually be centrally
cleared, a smaller segment of non-centrally
clearable products may continue to play an
important role for various types of market
participants, for example, by facilitating their
hedging activities. The non-centrally cleared
market segment notional outstanding remained
significant at about 33 percent of the global
OTC IRD market at the end of July 2015. These
products are not currently subject to regulatory
margin requirements. To address risks
associated with non-cleared OTC derivatives,
in 2015, the prudential regulators (the federal
banking agencies, the FHFA, and the Farm
Credit Administration) and the CFTC finalized
respective rules establishing requirements for
initial and variation margining for swaps that
are not centrally cleared (see Section 5.2.1).
The new margin requirements are scheduled
to phase in starting in September 2016. In
March 2016, regulators in Japan published final
uncleared swap margin rules. Regulators in the
EU published final draft regulatory technical
standards for collateralization of uncleared
swaps in March 2016.
4.10.6 Regulated Platform Trading
Globally, jurisdictions have continued to make
progress in implementing the G-20 Leaders’
2009 commitment that OTC derivatives be
traded on exchanges or electronic trading
platforms, where appropriate. In the United
States, mandatory trading of certain interest
rate and CDS index products on regulated
platforms has been in effect since 2014, and
as such, the United States remains one of two
jurisdictions with platform trading rules in
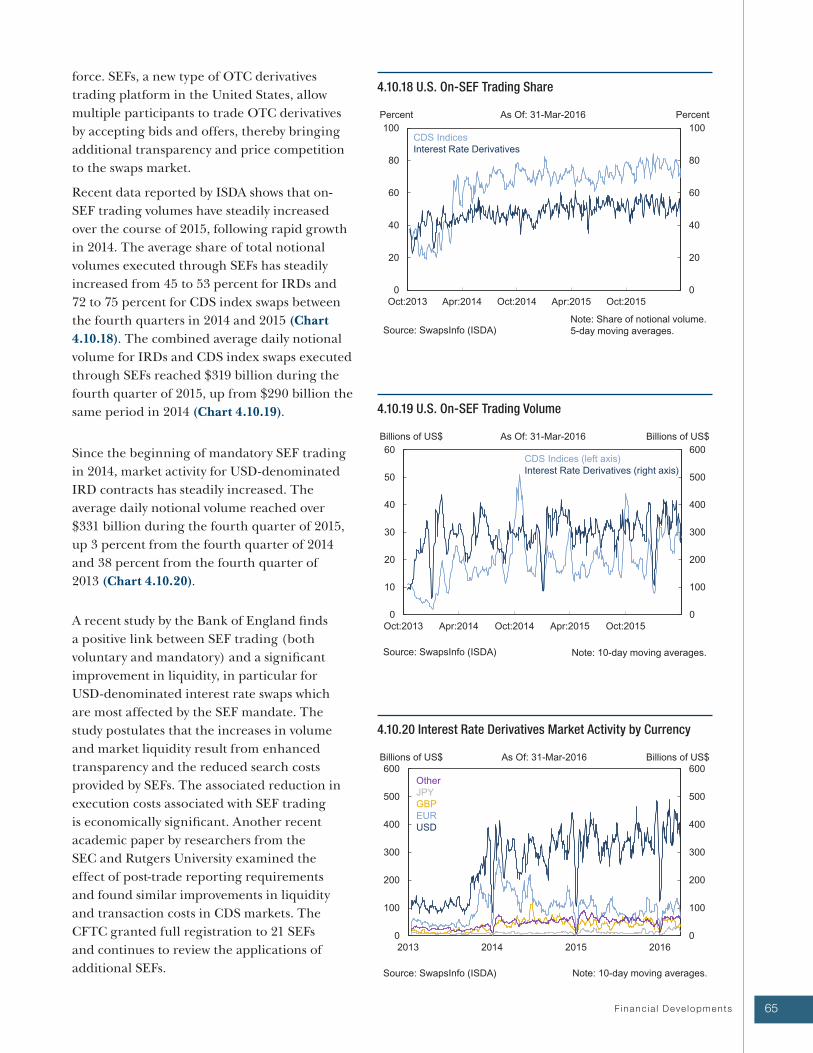
65 F inanc ia l Deve lopments
force. SEFs, a new type of OTC derivatives
trading platform in the United States, allow
multiple participants to trade OTC derivatives
by accepting bids and offers, thereby bringing
additional transparency and price competition
to the swaps market.
Recent data reported by ISDA shows that on-
SEF trading volumes have steadily increased
over the course of 2015, following rapid growth
in 2014. The average share of total notional
volumes executed through SEFs has steadily
increased from 45 to 53 percent for IRDs and
72 to 75 percent for CDS index swaps between
the fourth quarters in 2014 and 2015 (Chart
4.10.18). The combined average daily notional
volume for IRDs and CDS index swaps executed
through SEFs reached $319 billion during the
fourth quarter of 2015, up from $290 billion the
same period in 2014 (Chart 4.10.19).
Since the beginning of mandatory SEF trading
in 2014, market activity for USD-denominated
IRD contracts has steadily increased. The
average daily notional volume reached over
$331 billion during the fourth quarter of 2015,
up 3 percent from the fourth quarter of 2014
and 38 percent from the fourth quarter of
2013 (Chart 4.10.20).
A recent study by the Bank of England finds
a positive link between SEF trading (both
voluntary and mandatory) and a significant
improvement in liquidity, in particular for
USD-denominated interest rate swaps which
are most affected by the SEF mandate. The
study postulates that the increases in volume
and market liquidity result from enhanced
transparency and the reduced search costs
provided by SEFs. The associated reduction in
execution costs associated with SEF trading
is economically significant. Another recent
academic paper by researchers from the
SEC and Rutgers University examined the
effect of post-trade reporting requirements
and found similar improvements in liquidity
and transaction costs in CDS markets. The
CFTC granted full registration to 21 SEFs
and continues to review the applications of
additional SEFs.
4.10.20 Interest Rate Derivatives Market Activity by Currency
4.10.19 U.S. On-SEF Trading Volume
4.10.18 U.S. On-SEF Trading Share
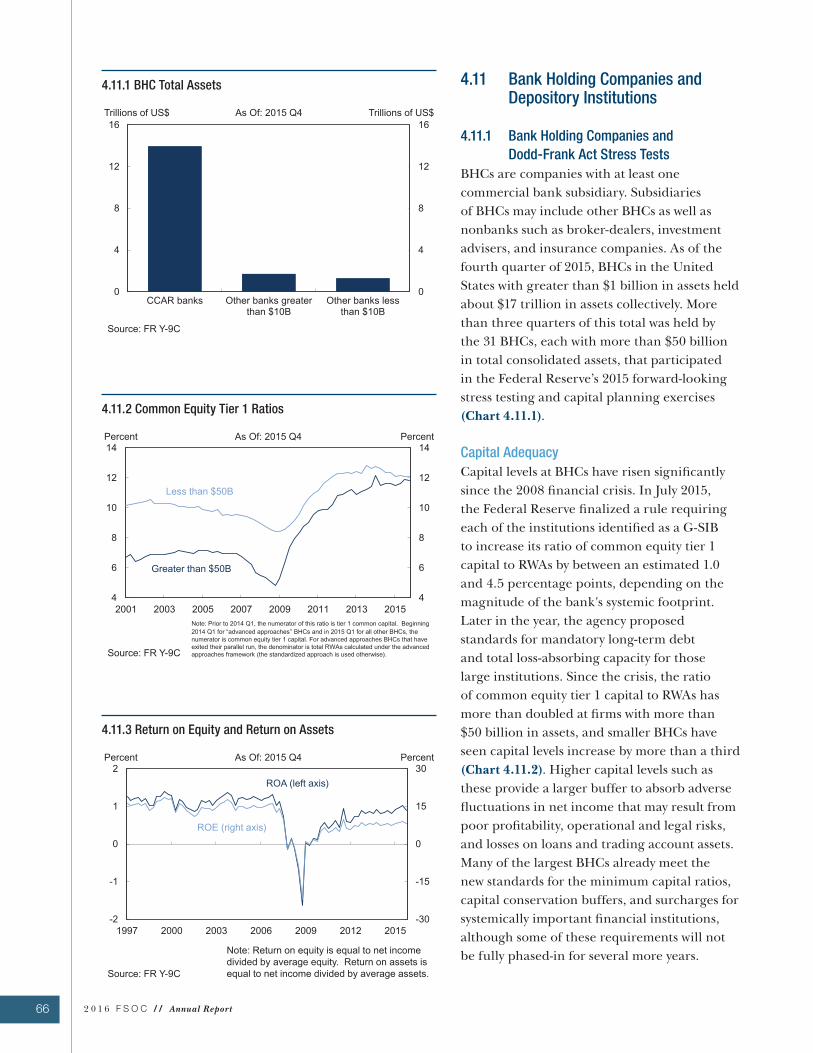
66 2 0 1 6 F S O C / / Annual Report
4.11 Bank Holding Companies and Depository Institutions
4.11.1 Bank Holding Companies and
Dodd-Frank Act Stress Tests
BHCs are companies with at least one
commercial bank subsidiary. Subsidiaries
of BHCs may include other BHCs as well as
nonbanks such as broker-dealers, investment
advisers, and insurance companies. As of the
fourth quarter of 2015, BHCs in the United
States with greater than $1 billion in assets held
about $17 trillion in assets collectively. More
than three quarters of this total was held by
the 31 BHCs, each with more than $50 billion
in total consolidated assets, that participated
in the Federal Reserve’s 2015 forward-looking
stress testing and capital planning exercises
(Chart 4.11.1).
Capital Adequacy
Capital levels at BHCs have risen significantly
since the 2008 financial crisis. In July 2015,
the Federal Reserve finalized a rule requiring
each of the institutions identified as a G-SIB
to increase its ratio of common equity tier 1
capital to RWAs by between an estimated 1.0
and 4.5 percentage points, depending on the
magnitude of the bank's systemic footprint.
Later in the year, the agency proposed
standards for mandatory long-term debt
and total loss-absorbing capacity for those
large institutions. Since the crisis, the ratio
of common equity tier 1 capital to RWAs has
more than doubled at firms with more than
$50 billion in assets, and smaller BHCs have
seen capital levels increase by more than a third
(Chart 4.11.2). Higher capital levels such as
these provide a larger buffer to absorb adverse
fluctuations in net income that may result from
poor profitability, operational and legal risks,
and losses on loans and trading account assets.
Many of the largest BHCs already meet the
new standards for the minimum capital ratios,
capital conservation buffers, and surcharges for
systemically important financial institutions,
although some of these requirements will not
be fully phased-in for several more years.
4.11.3 Return on Equity and Return on Assets
4.11.2 Common Equity Tier 1 Ratios
4.11.1 BHC Total Assets
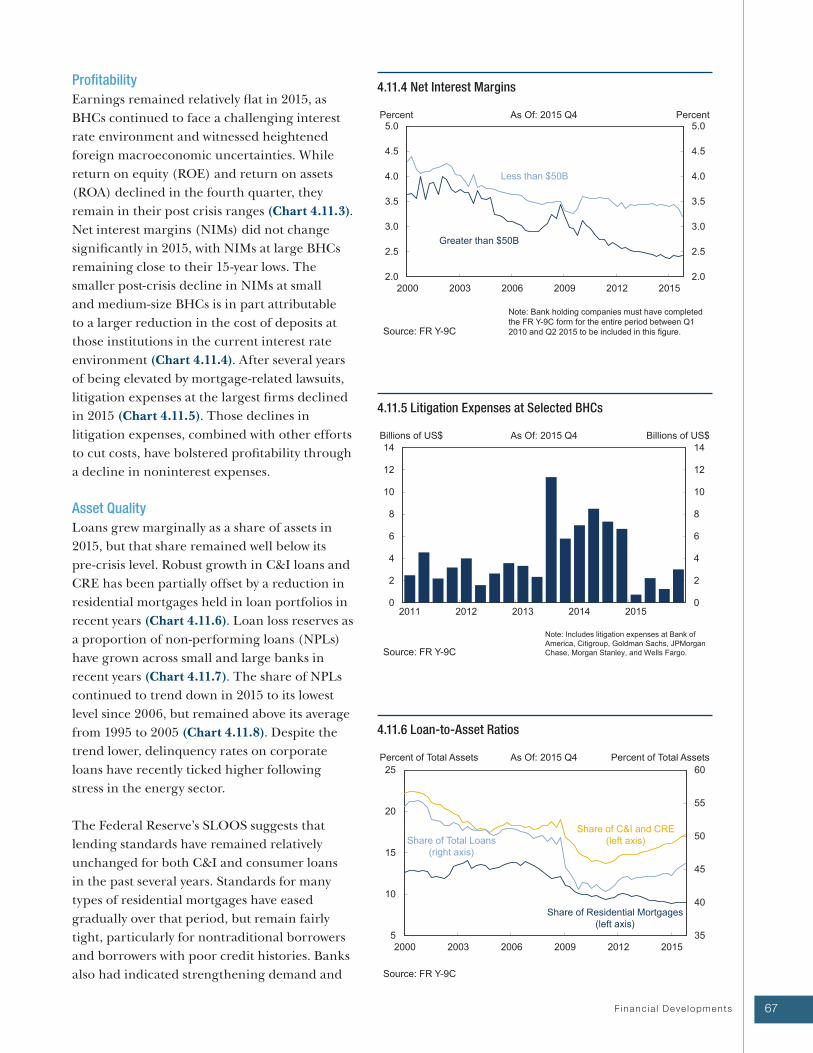
67 F inanc ia l Deve lopments
Profitability
Earnings remained relatively flat in 2015, as
BHCs continued to face a challenging interest
rate environment and witnessed heightened
foreign macroeconomic uncertainties. While
return on equity (ROE) and return on assets
(ROA) declined in the fourth quarter, they
remain in their post crisis ranges (Chart 4.11.3).
Net interest margins (NIMs) did not change
significantly in 2015, with NIMs at large BHCs
remaining close to their 15-year lows. The
smaller post-crisis decline in NIMs at small
and medium-size BHCs is in part attributable
to a larger reduction in the cost of deposits at
those institutions in the current interest rate
environment (Chart 4.11.4). After several years
of being elevated by mortgage-related lawsuits,
litigation expenses at the largest firms declined
in 2015 (Chart 4.11.5). Those declines in
litigation expenses, combined with other efforts
to cut costs, have bolstered profitability through
a decline in noninterest expenses.
Asset Quality
Loans grew marginally as a share of assets in
2015, but that share remained well below its
pre-crisis level. Robust growth in C&I loans and
CRE has been partially offset by a reduction in
residential mortgages held in loan portfolios in
recent years (Chart 4.11.6). Loan loss reserves as
a proportion of non-performing loans (NPLs)
have grown across small and large banks in
recent years (Chart 4.11.7). The share of NPLs
continued to trend down in 2015 to its lowest
level since 2006, but remained above its average
from 1995 to 2005 (Chart 4.11.8). Despite the
trend lower, delinquency rates on corporate
loans have recently ticked higher following
stress in the energy sector.
The Federal Reserve’s SLOOS suggests that
lending standards have remained relatively
unchanged for both C&I and consumer loans
in the past several years. Standards for many
types of residential mortgages have eased
gradually over that period, but remain fairly
tight, particularly for nontraditional borrowers
and borrowers with poor credit histories. Banks
also had indicated strengthening demand and
4.11.5 Litigation Expenses at Selected BHCs
4.11.4 Net Interest Margins
4.11.6 Loan-to-Asset Ratios
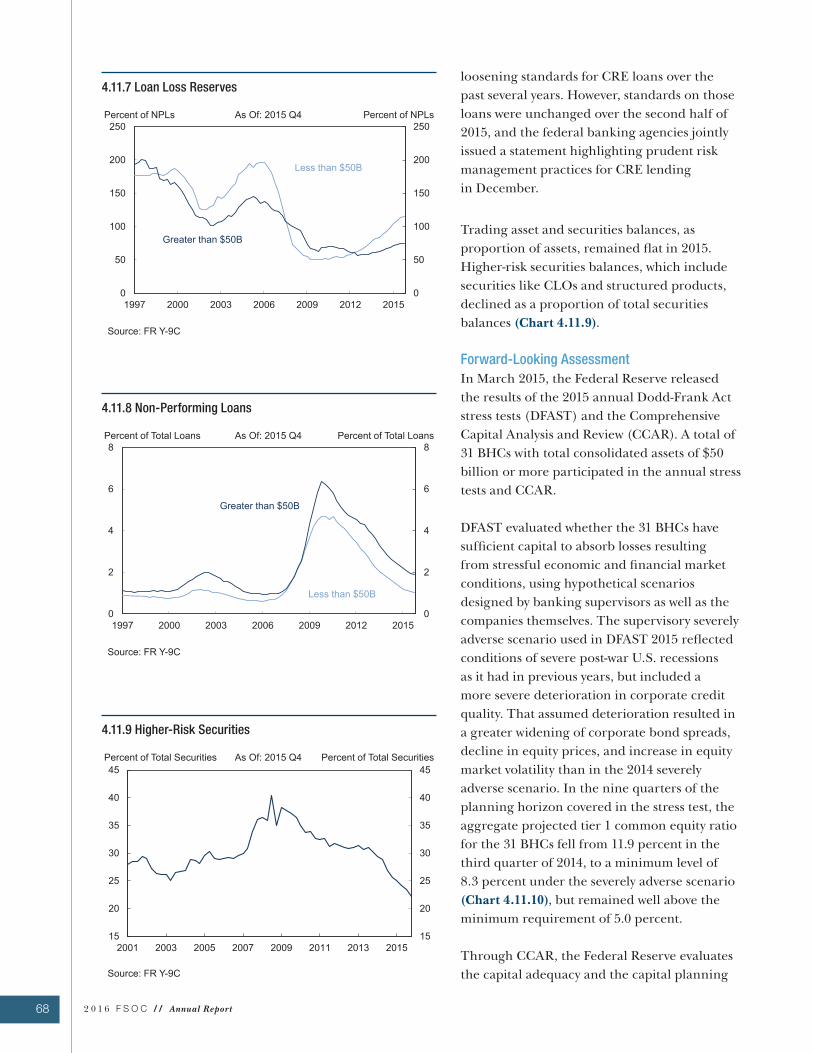
68 2 0 1 6 F S O C / / Annual Report
loosening standards for CRE loans over the
past several years. However, standards on those
loans were unchanged over the second half of
2015, and the federal banking agencies jointly
issued a statement highlighting prudent risk
management practices for CRE lending
in December.
Trading asset and securities balances, as
proportion of assets, remained flat in 2015.
Higher-risk securities balances, which include
securities like CLOs and structured products,
declined as a proportion of total securities
balances (Chart 4.11.9).
Forward-Looking Assessment
In March 2015, the Federal Reserve released
the results of the 2015 annual Dodd-Frank Act
stress tests (DFAST) and the Comprehensive
Capital Analysis and Review (CCAR). A total of
31 BHCs with total consolidated assets of $50
billion or more participated in the annual stress
tests and CCAR.
DFAST evaluated whether the 31 BHCs have
sufficient capital to absorb losses resulting
from stressful economic and financial market
conditions, using hypothetical scenarios
designed by banking supervisors as well as the
companies themselves. The supervisory severely
adverse scenario used in DFAST 2015 reflected
conditions of severe post-war U.S. recessions
as it had in previous years, but included a
more severe deterioration in corporate credit
quality. That assumed deterioration resulted in
a greater widening of corporate bond spreads,
decline in equity prices, and increase in equity
market volatility than in the 2014 severely
adverse scenario. In the nine quarters of the
planning horizon covered in the stress test, the
aggregate projected tier 1 common equity ratio
for the 31 BHCs fell from 11.9 percent in the
third quarter of 2014, to a minimum level of
8.3 percent under the severely adverse scenario
(Chart 4.11.10), but remained well above the
minimum requirement of 5.0 percent.
Through CCAR, the Federal Reserve evaluates
the capital adequacy and the capital planning
4.11.9 Higher-Risk Securities
4.11.8 Non-Performing Loans
4.11.7 Loan Loss Reserves
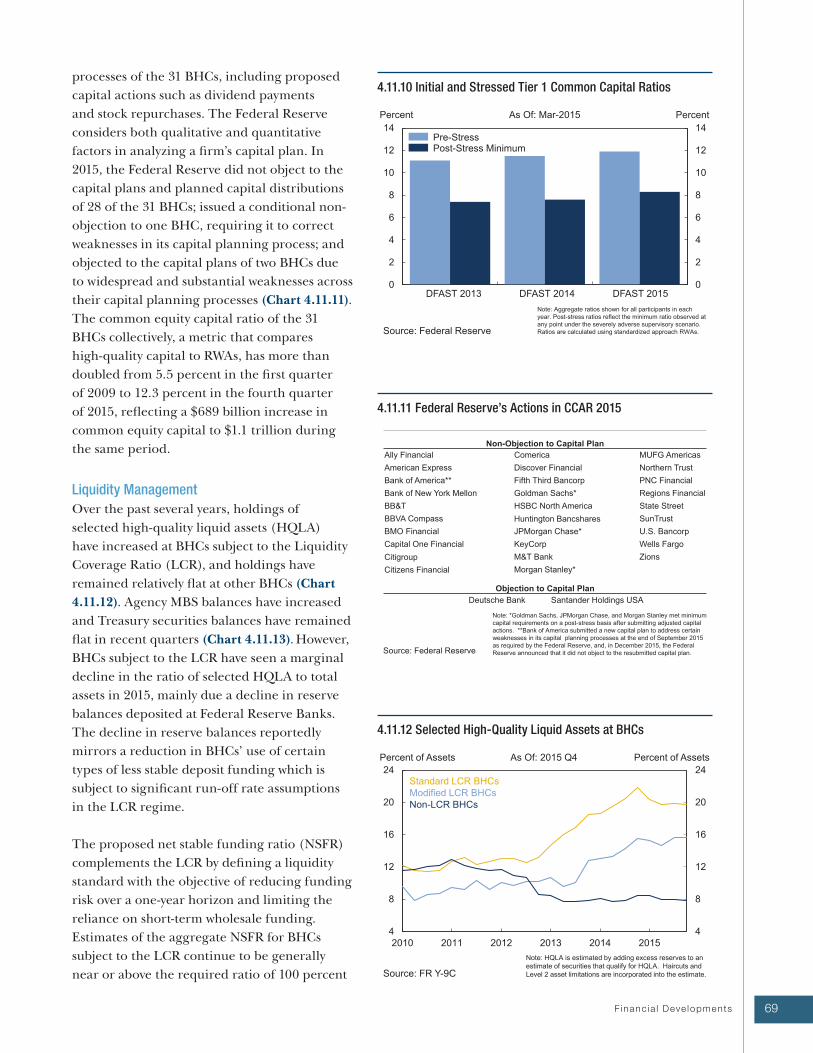
69 F inanc ia l Deve lopments
processes of the 31 BHCs, including proposed
capital actions such as dividend payments
and stock repurchases. The Federal Reserve
considers both qualitative and quantitative
factors in analyzing a firm’s capital plan. In
2015, the Federal Reserve did not object to the
capital plans and planned capital distributions
of 28 of the 31 BHCs; issued a conditional non-
objection to one BHC, requiring it to correct
weaknesses in its capital planning process; and
objected to the capital plans of two BHCs due
to widespread and substantial weaknesses across
their capital planning processes (Chart 4.11.11).
The common equity capital ratio of the 31
BHCs collectively, a metric that compares
high-quality capital to RWAs, has more than
doubled from 5.5 percent in the first quarter
of 2009 to 12.3 percent in the fourth quarter
of 2015, reflecting a $689 billion increase in
common equity capital to $1.1 trillion during
the same period.
Liquidity Management
Over the past several years, holdings of
selected high-quality liquid assets (HQLA)
have increased at BHCs subject to the Liquidity
Coverage Ratio (LCR), and holdings have
remained relatively flat at other BHCs (Chart
4.11.12). Agency MBS balances have increased
and Treasury securities balances have remained
flat in recent quarters (Chart 4.11.13). However,
BHCs subject to the LCR have seen a marginal
decline in the ratio of selected HQLA to total
assets in 2015, mainly due a decline in reserve
balances deposited at Federal Reserve Banks.
The decline in reserve balances reportedly
mirrors a reduction in BHCs’ use of certain
types of less stable deposit funding which is
subject to significant run-off rate assumptions
in the LCR regime.
The proposed net stable funding ratio (NSFR)
complements the LCR by defining a liquidity
standard with the objective of reducing funding
risk over a one-year horizon and limiting the
reliance on short-term wholesale funding.
Estimates of the aggregate NSFR for BHCs
subject to the LCR continue to be generally
near or above the required ratio of 100 percent
4.11.11 Federal Reserve’s Actions in CCAR 2015
4.11.10 Initial and Stressed Tier 1 Common Capital Ratios
4.11.12 Selected High-Quality Liquid Assets at BHCs
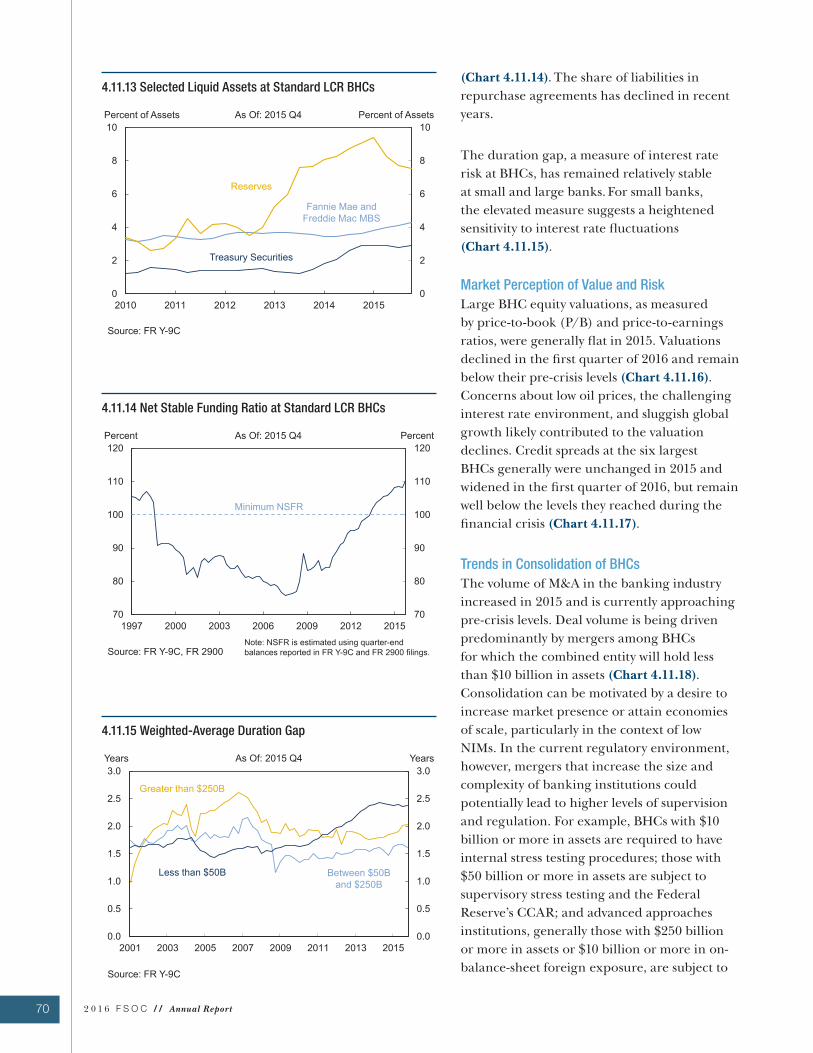
70 2 0 1 6 F S O C / / Annual Report
(Chart 4.11.14). The share of liabilities in
repurchase agreements has declined in recent
years.
The duration gap, a measure of interest rate
risk at BHCs, has remained relatively stable
at small and large banks. For small banks,
the elevated measure suggests a heightened
sensitivity to interest rate fluctuations
(Chart 4.11.15).
Market Perception of Value and Risk
Large BHC equity valuations, as measured
by price-to-book (P/B) and price-to-earnings
ratios, were generally flat in 2015. Valuations
declined in the first quarter of 2016 and remain
below their pre-crisis levels (Chart 4.11.16).
Concerns about low oil prices, the challenging
interest rate environment, and sluggish global
growth likely contributed to the valuation
declines. Credit spreads at the six largest
BHCs generally were unchanged in 2015 and
widened in the first quarter of 2016, but remain
well below the levels they reached during the
financial crisis (Chart 4.11.17).
Trends in Consolidation of BHCs
The volume of M&A in the banking industry
increased in 2015 and is currently approaching
pre-crisis levels. Deal volume is being driven
predominantly by mergers among BHCs
for which the combined entity will hold less
than $10 billion in assets (Chart 4.11.18).
Consolidation can be motivated by a desire to
increase market presence or attain economies
of scale, particularly in the context of low
NIMs. In the current regulatory environment,
however, mergers that increase the size and
complexity of banking institutions could
potentially lead to higher levels of supervision
and regulation. For example, BHCs with $10
billion or more in assets are required to have
internal stress testing procedures; those with
$50 billion or more in assets are subject to
supervisory stress testing and the Federal
Reserve’s CCAR; and advanced approaches
institutions, generally those with $250 billion
or more in assets or $10 billion or more in on-
balance-sheet foreign exposure, are subject to
4.11.15 Weighted-Average Duration Gap
4.11.14 Net Stable Funding Ratio at Standard LCR BHCs
4.11.13 Selected Liquid Assets at Standard LCR BHCs
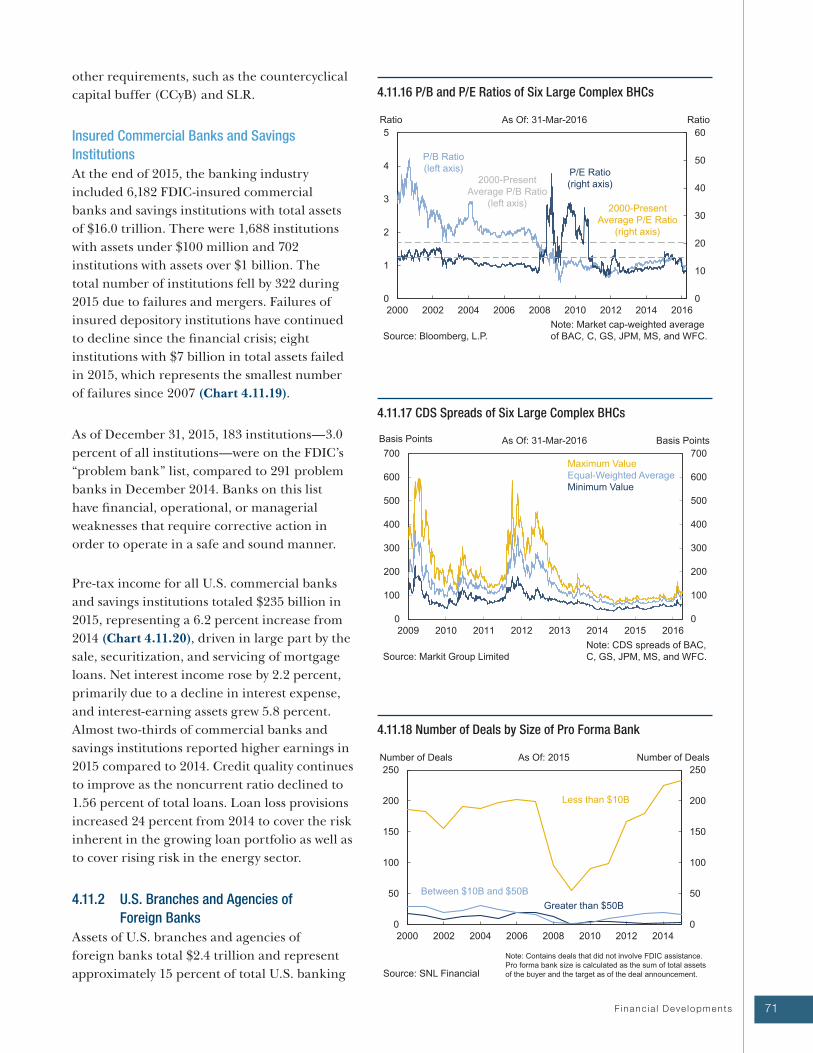
71 F inanc ia l Deve lopments
other requirements, such as the countercyclical
capital buffer (CCyB) and SLR.
Insured Commercial Banks and Savings
Institutions
At the end of 2015, the banking industry
included 6,182 FDIC-insured commercial
banks and savings institutions with total assets
of $16.0 trillion. There were 1,688 institutions
with assets under $100 million and 702
institutions with assets over $1 billion. The
total number of institutions fell by 322 during
2015 due to failures and mergers. Failures of
insured depository institutions have continued
to decline since the financial crisis; eight
institutions with $7 billion in total assets failed
in 2015, which represents the smallest number
of failures since 2007 (Chart 4.11.19).
As of December 31, 2015, 183 institutions—3.0
percent of all institutions—were on the FDIC’s
“problem bank” list, compared to 291 problem
banks in December 2014. Banks on this list
have financial, operational, or managerial
weaknesses that require corrective action in
order to operate in a safe and sound manner.
Pre-tax income for all U.S. commercial banks
and savings institutions totaled $235 billion in
2015, representing a 6.2 percent increase from
2014 (Chart 4.11.20), driven in large part by the
sale, securitization, and servicing of mortgage
loans. Net interest income rose by 2.2 percent,
primarily due to a decline in interest expense,
and interest-earning assets grew 5.8 percent.
Almost two-thirds of commercial banks and
savings institutions reported higher earnings in
2015 compared to 2014. Credit quality continues
to improve as the noncurrent ratio declined to
1.56 percent of total loans. Loan loss provisions
increased 24 percent from 2014 to cover the risk
inherent in the growing loan portfolio as well as
to cover rising risk in the energy sector.
4.11.2 U.S. Branches and Agencies of
Foreign Banks
Assets of U.S. branches and agencies of
foreign banks total $2.4 trillion and represent
approximately 15 percent of total U.S. banking
4.11.17 CDS Spreads of Six Large Complex BHCs
4.11.16 P/B and P/E Ratios of Six Large Complex BHCs
4.11.18 Number of Deals by Size of Pro Forma Bank
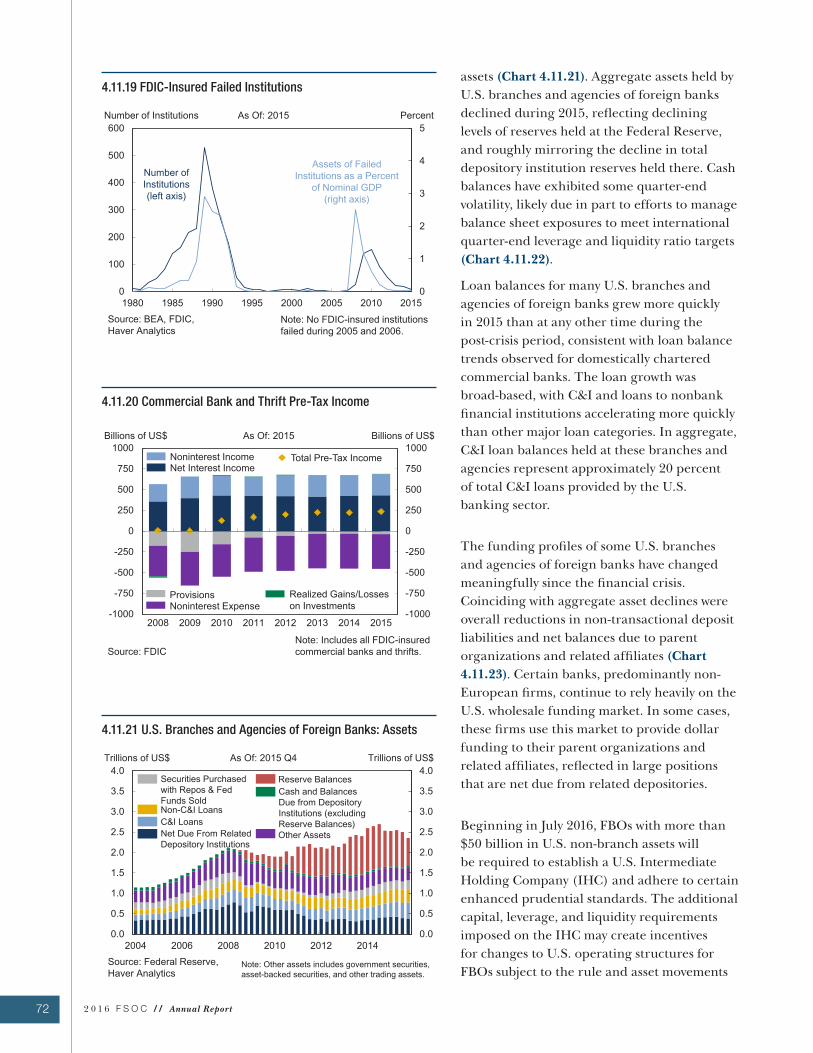
72 2 0 1 6 F S O C / / Annual Report
assets (Chart 4.11.21). Aggregate assets held by
U.S. branches and agencies of foreign banks
declined during 2015, reflecting declining
levels of reserves held at the Federal Reserve,
and roughly mirroring the decline in total
depository institution reserves held there. Cash
balances have exhibited some quarter-end
volatility, likely due in part to efforts to manage
balance sheet exposures to meet international
quarter-end leverage and liquidity ratio targets
(Chart 4.11.22).
Loan balances for many U.S. branches and
agencies of foreign banks grew more quickly
in 2015 than at any other time during the
post-crisis period, consistent with loan balance
trends observed for domestically chartered
commercial banks. The loan growth was
broad-based, with C&I and loans to nonbank
financial institutions accelerating more quickly
than other major loan categories. In aggregate,
C&I loan balances held at these branches and
agencies represent approximately 20 percent
of total C&I loans provided by the U.S.
banking sector.
The funding profiles of some U.S. branches
and agencies of foreign banks have changed
meaningfully since the financial crisis.
Coinciding with aggregate asset declines were
overall reductions in non-transactional deposit
liabilities and net balances due to parent
organizations and related affiliates (Chart
4.11.23). Certain banks, predominantly non-
European firms, continue to rely heavily on the
U.S. wholesale funding market. In some cases,
these firms use this market to provide dollar
funding to their parent organizations and
related affiliates, reflected in large positions
that are net due from related depositories.
Beginning in July 2016, FBOs with more than
$50 billion in U.S. non-branch assets will
be required to establish a U.S. Intermediate
Holding Company (IHC) and adhere to certain
enhanced prudential standards. The additional
capital, leverage, and liquidity requirements
imposed on the IHC may create incentives
for changes to U.S. operating structures for
FBOs subject to the rule and asset movements
4.11.21 U.S. Branches and Agencies of Foreign Banks: Assets
4.11.20 Commercial Bank and Thrift Pre-Tax Income
4.11.19 FDIC-Insured Failed Institutions
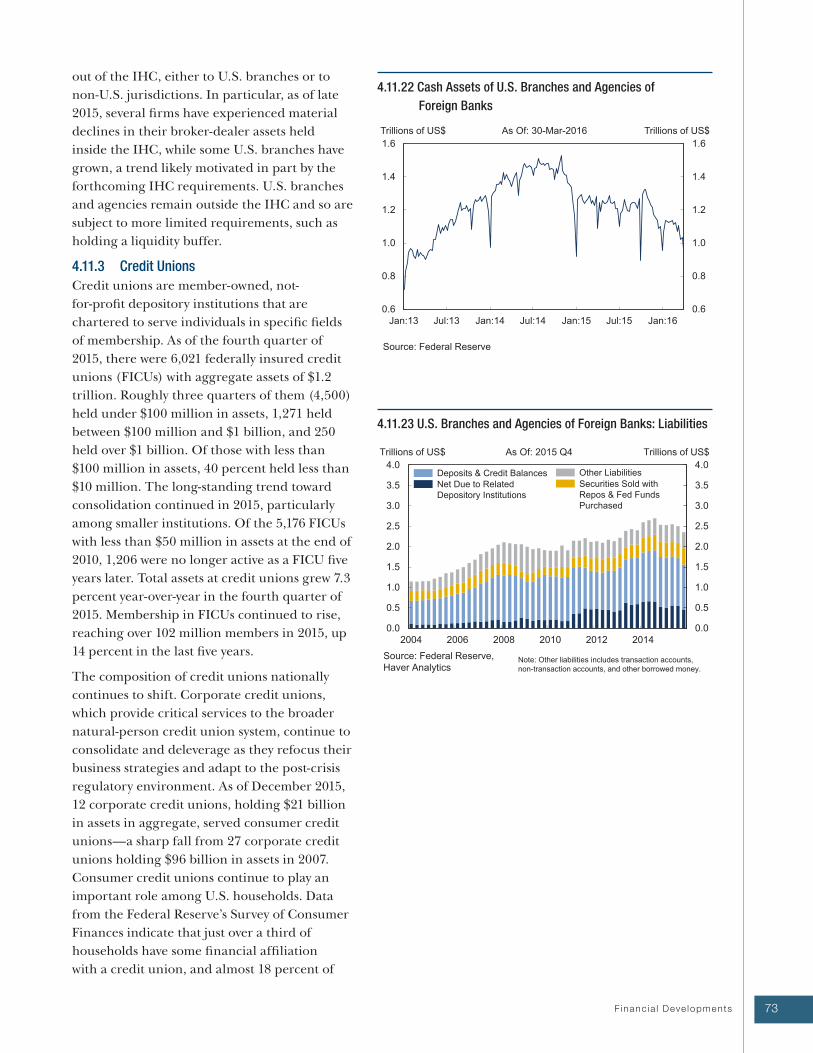
73 F inanc ia l Deve lopments
out of the IHC, either to U.S. branches or to
non-U.S. jurisdictions. In particular, as of late
2015, several firms have experienced material
declines in their broker-dealer assets held
inside the IHC, while some U.S. branches have
grown, a trend likely motivated in part by the
forthcoming IHC requirements. U.S. branches
and agencies remain outside the IHC and so are
subject to more limited requirements, such as
holding a liquidity buffer.
4.11.3 Credit Unions
Credit unions are member-owned, not-
for-profit depository institutions that are
chartered to serve individuals in specific fields
of membership. As of the fourth quarter of
2015, there were 6,021 federally insured credit
unions (FICUs) with aggregate assets of $1.2
trillion. Roughly three quarters of them (4,500)
held under $100 million in assets, 1,271 held
between $100 million and $1 billion, and 250
held over $1 billion. Of those with less than
$100 million in assets, 40 percent held less than
$10 million. The long-standing trend toward
consolidation continued in 2015, particularly
among smaller institutions. Of the 5,176 FICUs
with less than $50 million in assets at the end of
2010, 1,206 were no longer active as a FICU five
years later. Total assets at credit unions grew 7.3
percent year-over-year in the fourth quarter of
2015. Membership in FICUs continued to rise,
reaching over 102 million members in 2015, up
14 percent in the last five years.
The composition of credit unions nationally
continues to shift. Corporate credit unions,
which provide critical services to the broader
natural-person credit union system, continue to
consolidate and deleverage as they refocus their
business strategies and adapt to the post-crisis
regulatory environment. As of December 2015,
12 corporate credit unions, holding $21 billion
in assets in aggregate, served consumer credit
unions—a sharp fall from 27 corporate credit
unions holding $96 billion in assets in 2007.
Consumer credit unions continue to play an
important role among U.S. households. Data
from the Federal Reserve’s Survey of Consumer
Finances indicate that just over a third of
households have some financial affiliation
with a credit union, and almost 18 percent of
4.11.23 U.S. Branches and Agencies of Foreign Banks: Liabilities
4.11.22 Cash Assets of U.S. Branches and Agencies of
Foreign Banks
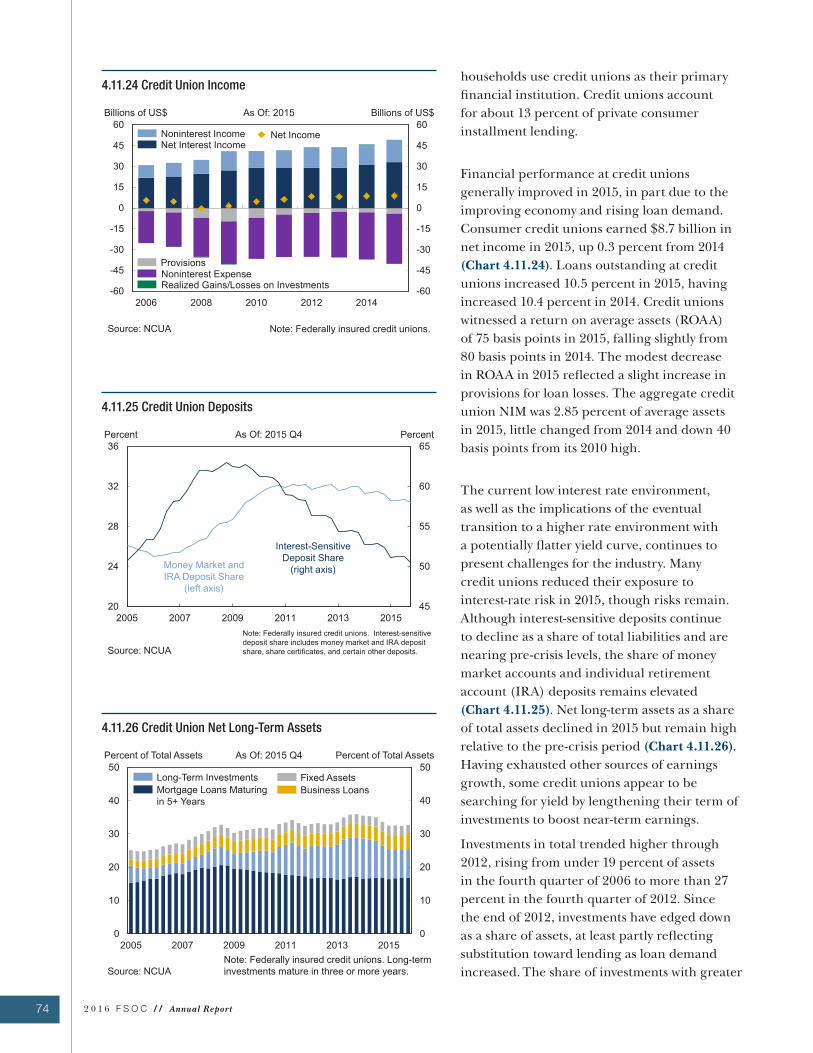
74 2 0 1 6 F S O C / / Annual Report
households use credit unions as their primary
financial institution. Credit unions account
for about 13 percent of private consumer
installment lending.
Financial performance at credit unions
generally improved in 2015, in part due to the
improving economy and rising loan demand.
Consumer credit unions earned $8.7 billion in
net income in 2015, up 0.3 percent from 2014
(Chart 4.11.24). Loans outstanding at credit
unions increased 10.5 percent in 2015, having
increased 10.4 percent in 2014. Credit unions
witnessed a return on average assets (ROAA)
of 75 basis points in 2015, falling slightly from
80 basis points in 2014. The modest decrease
in ROAA in 2015 reflected a slight increase in
provisions for loan losses. The aggregate credit
union NIM was 2.85 percent of average assets
in 2015, little changed from 2014 and down 40
basis points from its 2010 high.
The current low interest rate environment,
as well as the implications of the eventual
transition to a higher rate environment with
a potentially flatter yield curve, continues to
present challenges for the industry. Many
credit unions reduced their exposure to
interest-rate risk in 2015, though risks remain.
Although interest-sensitive deposits continue
to decline as a share of total liabilities and are
nearing pre-crisis levels, the share of money
market accounts and individual retirement
account (IRA) deposits remains elevated
(Chart 4.11.25). Net long-term assets as a share
of total assets declined in 2015 but remain high
relative to the pre-crisis period (Chart 4.11.26).
Having exhausted other sources of earnings
growth, some credit unions appear to be
searching for yield by lengthening their term of
investments to boost near-term earnings.
Investments in total trended higher through
2012, rising from under 19 percent of assets
in the fourth quarter of 2006 to more than 27
percent in the fourth quarter of 2012. Since
the end of 2012, investments have edged down
as a share of assets, at least partly reflecting
substitution toward lending as loan demand
increased. The share of investments with greater
4.11.26 Credit Union Net Long-Term Assets
4.11.25 Credit Union Deposits
4.11.24 Credit Union Income
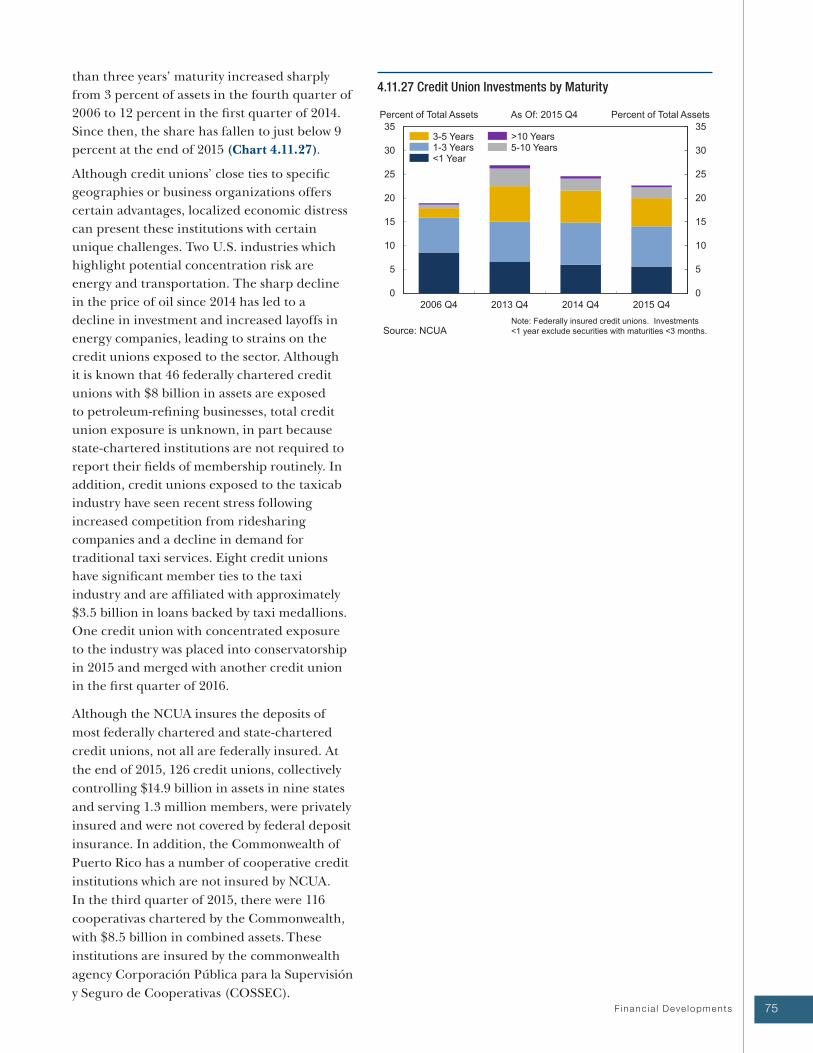
75 F inanc ia l Deve lopments
than three years’ maturity increased sharply
from 3 percent of assets in the fourth quarter of
2006 to 12 percent in the first quarter of 2014.
Since then, the share has fallen to just below 9
percent at the end of 2015 (Chart 4.11.27).
Although credit unions’ close ties to specific
geographies or business organizations offers
certain advantages, localized economic distress
can present these institutions with certain
unique challenges. Two U.S. industries which
highlight potential concentration risk are
energy and transportation. The sharp decline
in the price of oil since 2014 has led to a
decline in investment and increased layoffs in
energy companies, leading to strains on the
credit unions exposed to the sector. Although
it is known that 46 federally chartered credit
unions with $8 billion in assets are exposed
to petroleum-refining businesses, total credit
union exposure is unknown, in part because
state-chartered institutions are not required to
report their fields of membership routinely. In
addition, credit unions exposed to the taxicab
industry have seen recent stress following
increased competition from ridesharing
companies and a decline in demand for
traditional taxi services. Eight credit unions
have significant member ties to the taxi
industry and are affiliated with approximately
$3.5 billion in loans backed by taxi medallions.
One credit union with concentrated exposure
to the industry was placed into conservatorship
in 2015 and merged with another credit union
in the first quarter of 2016.
Although the NCUA insures the deposits of
most federally chartered and state-chartered
credit unions, not all are federally insured. At
the end of 2015, 126 credit unions, collectively
controlling $14.9 billion in assets in nine states
and serving 1.3 million members, were privately
insured and were not covered by federal deposit
insurance. In addition, the Commonwealth of
Puerto Rico has a number of cooperative credit
institutions which are not insured by NCUA.
In the third quarter of 2015, there were 116
cooperativas chartered by the Commonwealth,
with $8.5 billion in combined assets. These
institutions are insured by the commonwealth
agency Corporación Pública para la Supervisión
y Seguro de Cooperativas (COSSEC).
4.11.27 Credit Union Investments by Maturity
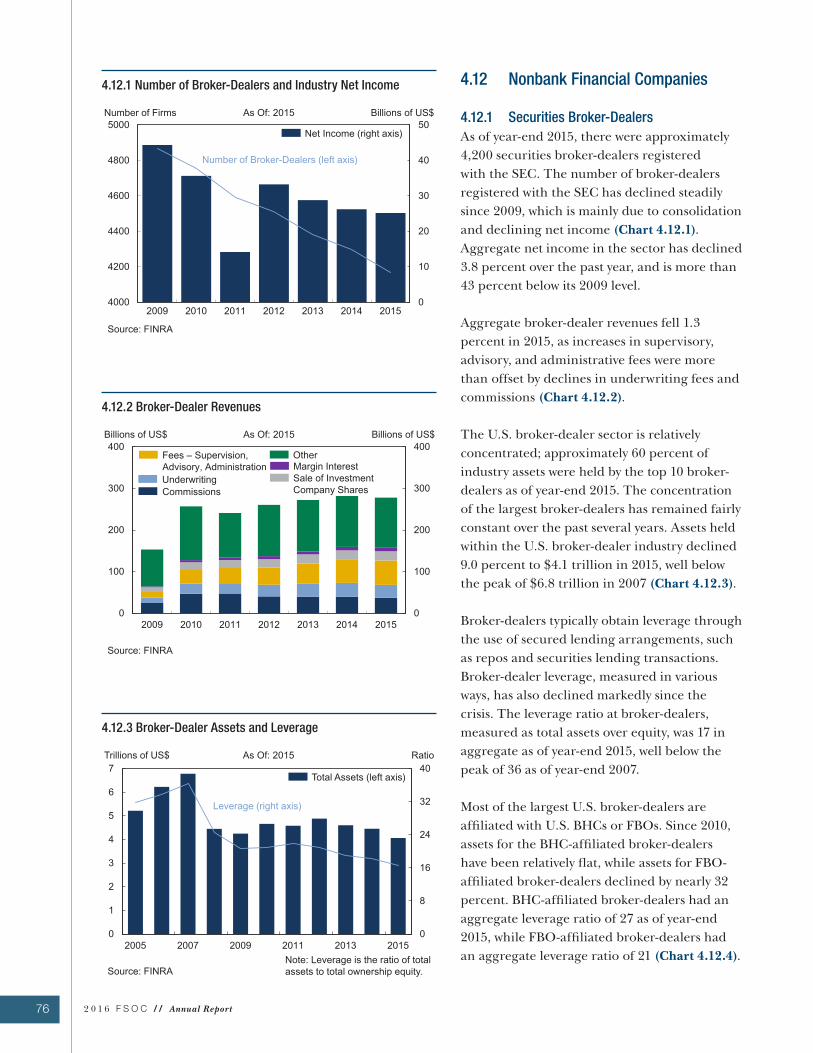
76 2 0 1 6 F S O C / / Annual Report
4.12.3 Broker-Dealer Assets and Leverage
4.12 Nonbank Financial Companies
4.12.1 Securities Broker-Dealers
As of year-end 2015, there were approximately
4,200 securities broker-dealers registered
with the SEC. The number of broker-dealers
registered with the SEC has declined steadily
since 2009, which is mainly due to consolidation
and declining net income (Chart 4.12.1).
Aggregate net income in the sector has declined
3.8 percent over the past year, and is more than
43 percent below its 2009 level.
Aggregate broker-dealer revenues fell 1.3
percent in 2015, as increases in supervisory,
advisory, and administrative fees were more
than offset by declines in underwriting fees and
commissions (Chart 4.12.2).
The U.S. broker-dealer sector is relatively
concentrated; approximately 60 percent of
industry assets were held by the top 10 broker-
dealers as of year-end 2015. The concentration
of the largest broker-dealers has remained fairly
constant over the past several years. Assets held
within the U.S. broker-dealer industry declined
9.0 percent to $4.1 trillion in 2015, well below
the peak of $6.8 trillion in 2007 (Chart 4.12.3).
Broker-dealers typically obtain leverage through
the use of secured lending arrangements, such
as repos and securities lending transactions.
Broker-dealer leverage, measured in various
ways, has also declined markedly since the
crisis. The leverage ratio at broker-dealers,
measured as total assets over equity, was 17 in
aggregate as of year-end 2015, well below the
peak of 36 as of year-end 2007.
Most of the largest U.S. broker-dealers are
affiliated with U.S. BHCs or FBOs. Since 2010,
assets for the BHC-affiliated broker-dealers
have been relatively flat, while assets for FBO-
affiliated broker-dealers declined by nearly 32
percent. BHC-affiliated broker-dealers had an
aggregate leverage ratio of 27 as of year-end
2015, while FBO-affiliated broker-dealers had
an aggregate leverage ratio of 21 (Chart 4.12.4).
4.12.2 Broker-Dealer Revenues
4.12.1 Number of Broker-Dealers and Industry Net Income
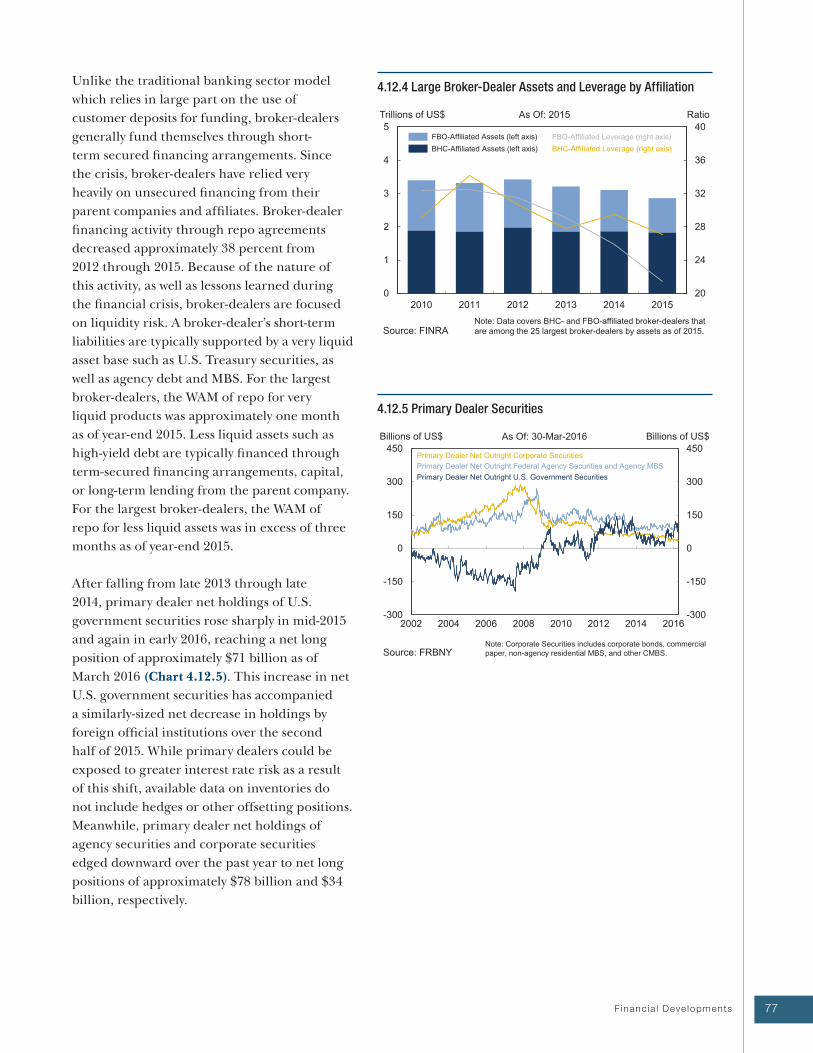
77 F inanc ia l Deve lopments
4.12.5 Primary Dealer Securities
4.12.4 Large Broker-Dealer Assets and Leverage by AffiliationUnlike the traditional banking sector model
which relies in large part on the use of
customer deposits for funding, broker-dealers
generally fund themselves through short-
term secured financing arrangements. Since
the crisis, broker-dealers have relied very
heavily on unsecured financing from their
parent companies and affiliates. Broker-dealer
financing activity through repo agreements
decreased approximately 38 percent from
2012 through 2015. Because of the nature of
this activity, as well as lessons learned during
the financial crisis, broker-dealers are focused
on liquidity risk. A broker-dealer’s short-term
liabilities are typically supported by a very liquid
asset base such as U.S. Treasury securities, as
well as agency debt and MBS. For the largest
broker-dealers, the WAM of repo for very
liquid products was approximately one month
as of year-end 2015. Less liquid assets such as
high-yield debt are typically financed through
term-secured financing arrangements, capital,
or long-term lending from the parent company.
For the largest broker-dealers, the WAM of
repo for less liquid assets was in excess of three
months as of year-end 2015.
After falling from late 2013 through late
2014, primary dealer net holdings of U.S.
government securities rose sharply in mid-2015
and again in early 2016, reaching a net long
position of approximately $71 billion as of
March 2016 (Chart 4.12.5). This increase in net
U.S. government securities has accompanied
a similarly-sized net decrease in holdings by
foreign official institutions over the second
half of 2015. While primary dealers could be
exposed to greater interest rate risk as a result
of this shift, available data on inventories do
not include hedges or other offsetting positions.
Meanwhile, primary dealer net holdings of
agency securities and corporate securities
edged downward over the past year to net long
positions of approximately $78 billion and $34
billion, respectively.
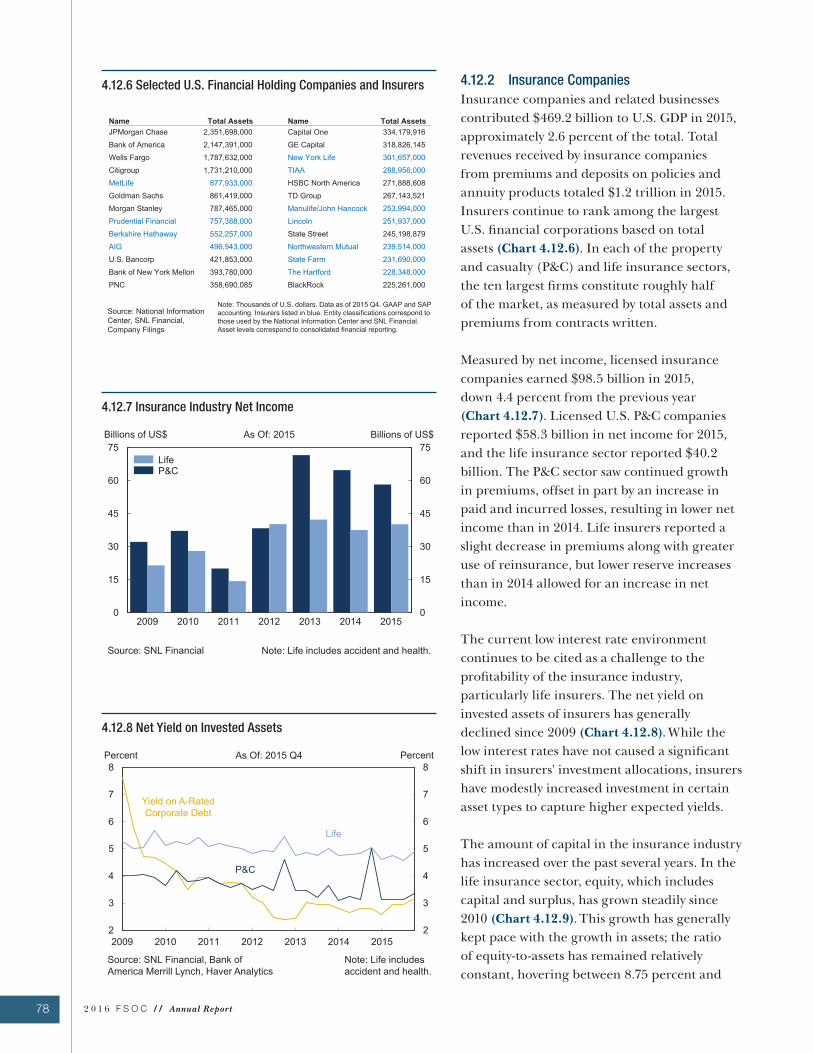
78 2 0 1 6 F S O C / / Annual Report
4.12.8 Net Yield on Invested Assets
4.12.7 Insurance Industry Net Income
4.12.6 Selected U.S. Financial Holding Companies and Insurers 4.12.2 Insurance Companies
Insurance companies and related businesses
contributed $469.2 billion to U.S. GDP in 2015,
approximately 2.6 percent of the total. Total
revenues received by insurance companies
from premiums and deposits on policies and
annuity products totaled $1.2 trillion in 2015.
Insurers continue to rank among the largest
U.S. financial corporations based on total
assets (Chart 4.12.6). In each of the property
and casualty (P&C) and life insurance sectors,
the ten largest firms constitute roughly half
of the market, as measured by total assets and
premiums from contracts written.
Measured by net income, licensed insurance
companies earned $98.5 billion in 2015,
down 4.4 percent from the previous year
(Chart 4.12.7). Licensed U.S. P&C companies
reported $58.3 billion in net income for 2015,
and the life insurance sector reported $40.2
billion. The P&C sector saw continued growth
in premiums, offset in part by an increase in
paid and incurred losses, resulting in lower net
income than in 2014. Life insurers reported a
slight decrease in premiums along with greater
use of reinsurance, but lower reserve increases
than in 2014 allowed for an increase in net
income.
The current low interest rate environment
continues to be cited as a challenge to the
profitability of the insurance industry,
particularly life insurers. The net yield on
invested assets of insurers has generally
declined since 2009 (Chart 4.12.8). While the
low interest rates have not caused a significant
shift in insurers' investment allocations, insurers
have modestly increased investment in certain
asset types to capture higher expected yields.
The amount of capital in the insurance industry
has increased over the past several years. In the
life insurance sector, equity, which includes
capital and surplus, has grown steadily since
2010 (Chart 4.12.9). This growth has generally
kept pace with the growth in assets; the ratio
of equity-to-assets has remained relatively
constant, hovering between 8.75 percent and
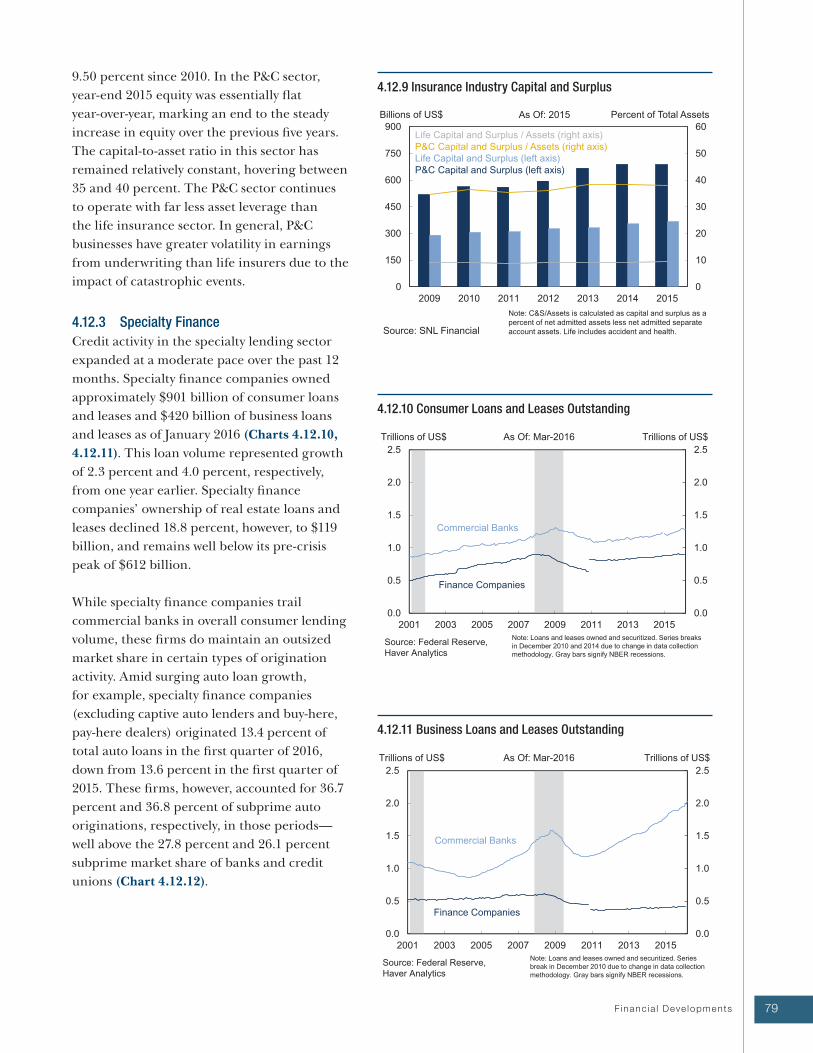
79 F inanc ia l Deve lopments
4.12.11 Business Loans and Leases Outstanding
4.12.10 Consumer Loans and Leases Outstanding
4.12.9 Insurance Industry Capital and Surplus9.50 percent since 2010. In the P&C sector,
year-end 2015 equity was essentially flat
year-over-year, marking an end to the steady
increase in equity over the previous five years.
The capital-to-asset ratio in this sector has
remained relatively constant, hovering between
35 and 40 percent. The P&C sector continues
to operate with far less asset leverage than
the life insurance sector. In general, P&C
businesses have greater volatility in earnings
from underwriting than life insurers due to the
impact of catastrophic events.
4.12.3 Specialty Finance
Credit activity in the specialty lending sector
expanded at a moderate pace over the past 12
months. Specialty finance companies owned
approximately $901 billion of consumer loans
and leases and $420 billion of business loans
and leases as of January 2016 (Charts 4.12.10,
4.12.11). This loan volume represented growth
of 2.3 percent and 4.0 percent, respectively,
from one year earlier. Specialty finance
companies’ ownership of real estate loans and
leases declined 18.8 percent, however, to $119
billion, and remains well below its pre-crisis
peak of $612 billion.
While specialty finance companies trail
commercial banks in overall consumer lending
volume, these firms do maintain an outsized
market share in certain types of origination
activity. Amid surging auto loan growth,
for example, specialty finance companies
(excluding captive auto lenders and buy-here,
pay-here dealers) originated 13.4 percent of
total auto loans in the first quarter of 2016,
down from 13.6 percent in the first quarter of
2015. These firms, however, accounted for 36.7
percent and 36.8 percent of subprime auto
originations, respectively, in those periods—
well above the 27.8 percent and 26.1 percent
subprime market share of banks and credit
unions (Chart 4.12.12).
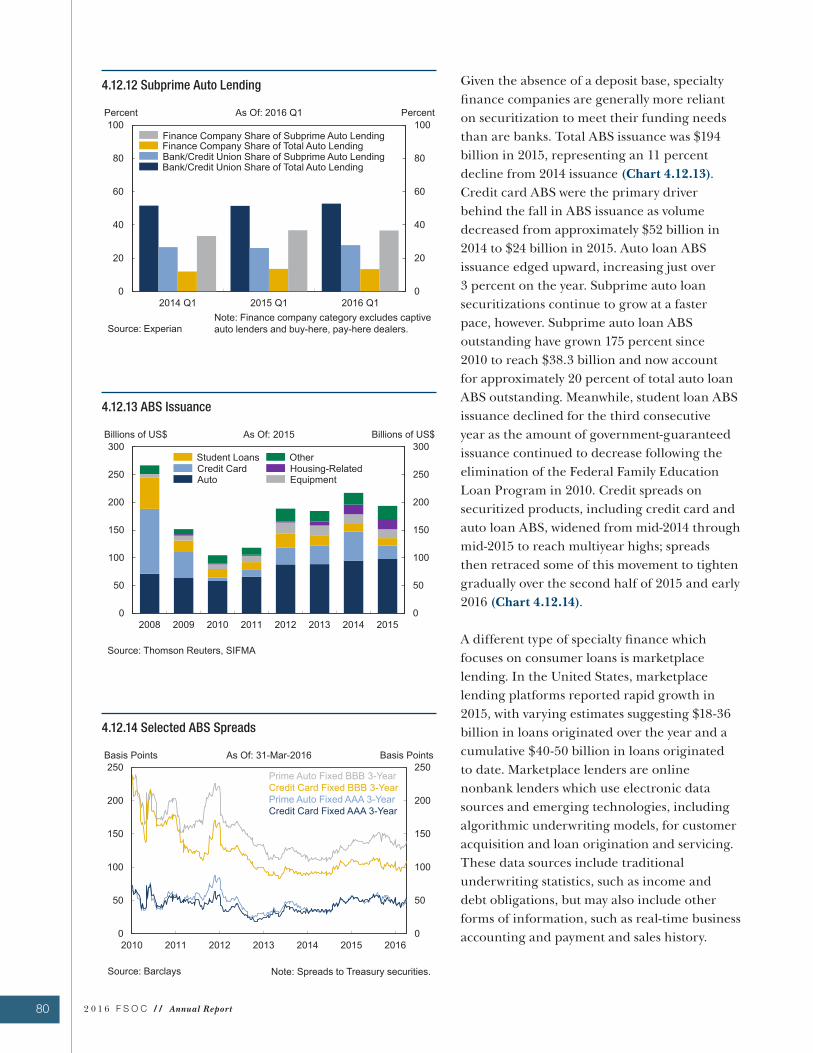
80 2 0 1 6 F S O C / / Annual Report
4.12.14 Selected ABS Spreads
4.12.13 ABS Issuance
4.12.12 Subprime Auto Lending Given the absence of a deposit base, specialty
finance companies are generally more reliant
on securitization to meet their funding needs
than are banks. Total ABS issuance was $194
billion in 2015, representing an 11 percent
decline from 2014 issuance (Chart 4.12.13).
Credit card ABS were the primary driver
behind the fall in ABS issuance as volume
decreased from approximately $52 billion in
2014 to $24 billion in 2015. Auto loan ABS
issuance edged upward, increasing just over
3 percent on the year. Subprime auto loan
securitizations continue to grow at a faster
pace, however. Subprime auto loan ABS
outstanding have grown 175 percent since
2010 to reach $38.3 billion and now account
for approximately 20 percent of total auto loan
ABS outstanding. Meanwhile, student loan ABS
issuance declined for the third consecutive
year as the amount of government-guaranteed
issuance continued to decrease following the
elimination of the Federal Family Education
Loan Program in 2010. Credit spreads on
securitized products, including credit card and
auto loan ABS, widened from mid-2014 through
mid-2015 to reach multiyear highs; spreads
then retraced some of this movement to tighten
gradually over the second half of 2015 and early
2016 (Chart 4.12.14).
A different type of specialty finance which
focuses on consumer loans is marketplace
lending. In the United States, marketplace
lending platforms reported rapid growth in
2015, with varying estimates suggesting $18-36
billion in loans originated over the year and a
cumulative $40-50 billion in loans originated
to date. Marketplace lenders are online
nonbank lenders which use electronic data
sources and emerging technologies, including
algorithmic underwriting models, for customer
acquisition and loan origination and servicing.
These data sources include traditional
underwriting statistics, such as income and
debt obligations, but may also include other
forms of information, such as real-time business
accounting and payment and sales history.
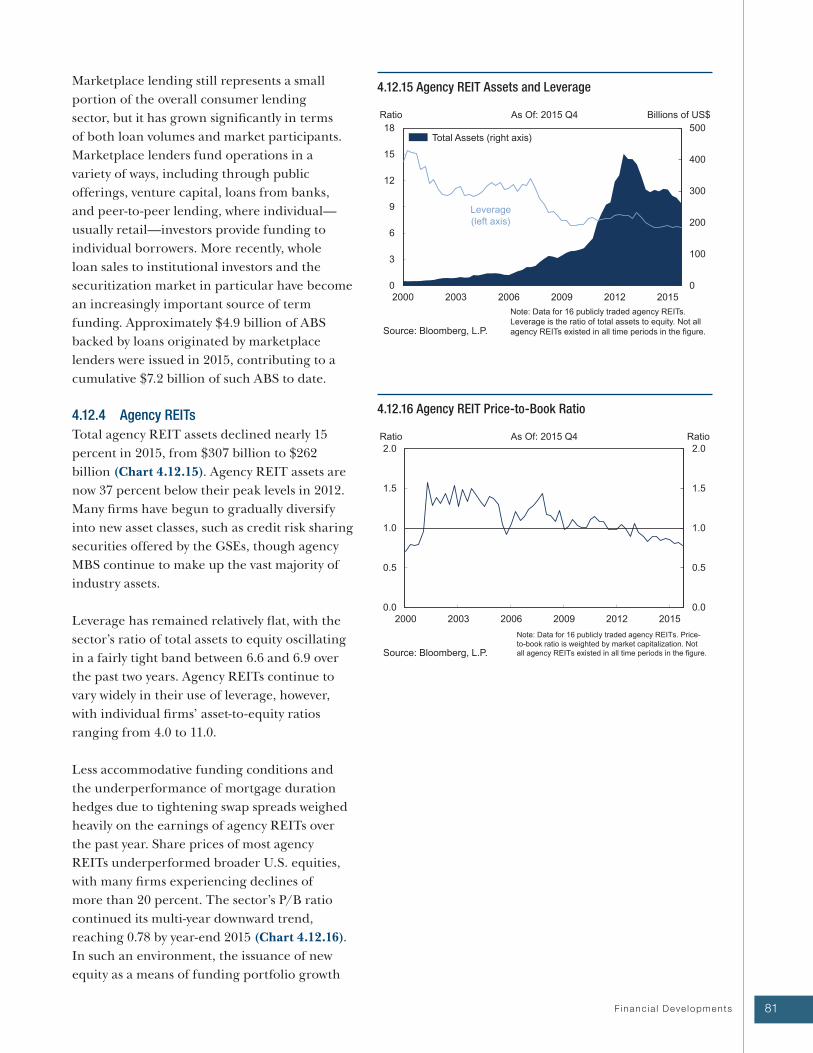
81 F inanc ia l Deve lopments
4.12.16 Agency REIT Price-to-Book Ratio
4.12.15 Agency REIT Assets and LeverageMarketplace lending still represents a small
portion of the overall consumer lending
sector, but it has grown significantly in terms
of both loan volumes and market participants.
Marketplace lenders fund operations in a
variety of ways, including through public
offerings, venture capital, loans from banks,
and peer-to-peer lending, where individual—
usually retail—investors provide funding to
individual borrowers. More recently, whole
loan sales to institutional investors and the
securitization market in particular have become
an increasingly important source of term
funding. Approximately $4.9 billion of ABS
backed by loans originated by marketplace
lenders were issued in 2015, contributing to a
cumulative $7.2 billion of such ABS to date.
4.12.4 Agency REITs
Total agency REIT assets declined nearly 15
percent in 2015, from $307 billion to $262
billion (Chart 4.12.15). Agency REIT assets are
now 37 percent below their peak levels in 2012.
Many firms have begun to gradually diversify
into new asset classes, such as credit risk sharing
securities offered by the GSEs, though agency
MBS continue to make up the vast majority of
industry assets.
Leverage has remained relatively flat, with the
sector’s ratio of total assets to equity oscillating
in a fairly tight band between 6.6 and 6.9 over
the past two years. Agency REITs continue to
vary widely in their use of leverage, however,
with individual firms’ asset-to-equity ratios
ranging from 4.0 to 11.0.
Less accommodative funding conditions and
the underperformance of mortgage duration
hedges due to tightening swap spreads weighed
heavily on the earnings of agency REITs over
the past year. Share prices of most agency
REITs underperformed broader U.S. equities,
with many firms experiencing declines of
more than 20 percent. The sector’s P/B ratio
continued its multi-year downward trend,
reaching 0.78 by year-end 2015 (Chart 4.12.16).
In such an environment, the issuance of new
equity as a means of funding portfolio growth
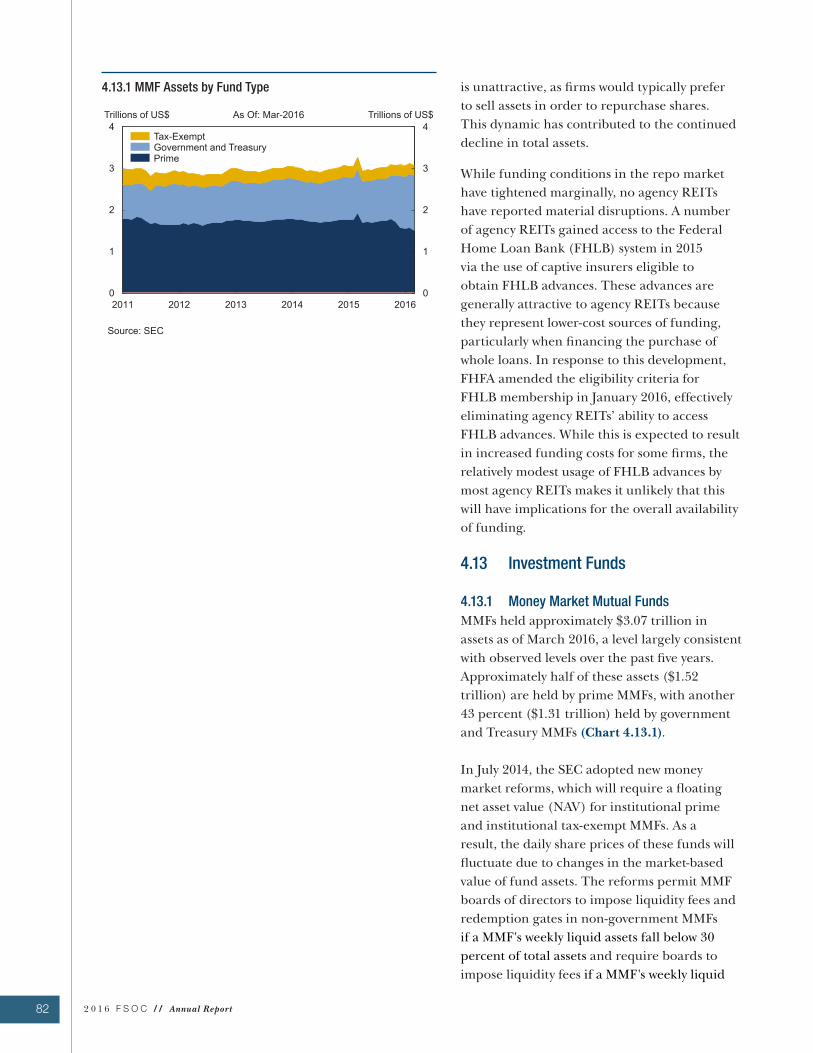
82 2 0 1 6 F S O C / / Annual Report
4.13.1 MMF Assets by Fund Type is unattractive, as firms would typically prefer
to sell assets in order to repurchase shares.
This dynamic has contributed to the continued
decline in total assets.
While funding conditions in the repo market
have tightened marginally, no agency REITs
have reported material disruptions. A number
of agency REITs gained access to the Federal
Home Loan Bank (FHLB) system in 2015
via the use of captive insurers eligible to
obtain FHLB advances. These advances are
generally attractive to agency REITs because
they represent lower-cost sources of funding,
particularly when financing the purchase of
whole loans. In response to this development,
FHFA amended the eligibility criteria for
FHLB membership in January 2016, effectively
eliminating agency REITs’ ability to access
FHLB advances. While this is expected to result
in increased funding costs for some firms, the
relatively modest usage of FHLB advances by
most agency REITs makes it unlikely that this
will have implications for the overall availability
of funding.
4.13 Investment Funds
4.13.1 Money Market Mutual Funds
MMFs held approximately $3.07 trillion in
assets as of March 2016, a level largely consistent
with observed levels over the past five years.
Approximately half of these assets ($1.52
trillion) are held by prime MMFs, with another
43 percent ($1.31 trillion) held by government
and Treasury MMFs (Chart 4.13.1).
In July 2014, the SEC adopted new money
market reforms, which will require a floating
net asset value (NAV) for institutional prime
and institutional tax-exempt MMFs. As a
result, the daily share prices of these funds will
fluctuate due to changes in the market-based
value of fund assets. The reforms permit MMF
boards of directors to impose liquidity fees and
redemption gates in non-government MMFs
if a MMF's weekly liquid assets fall below 30
percent of total assets and require boards to
impose liquidity fees if a MMF's weekly liquid
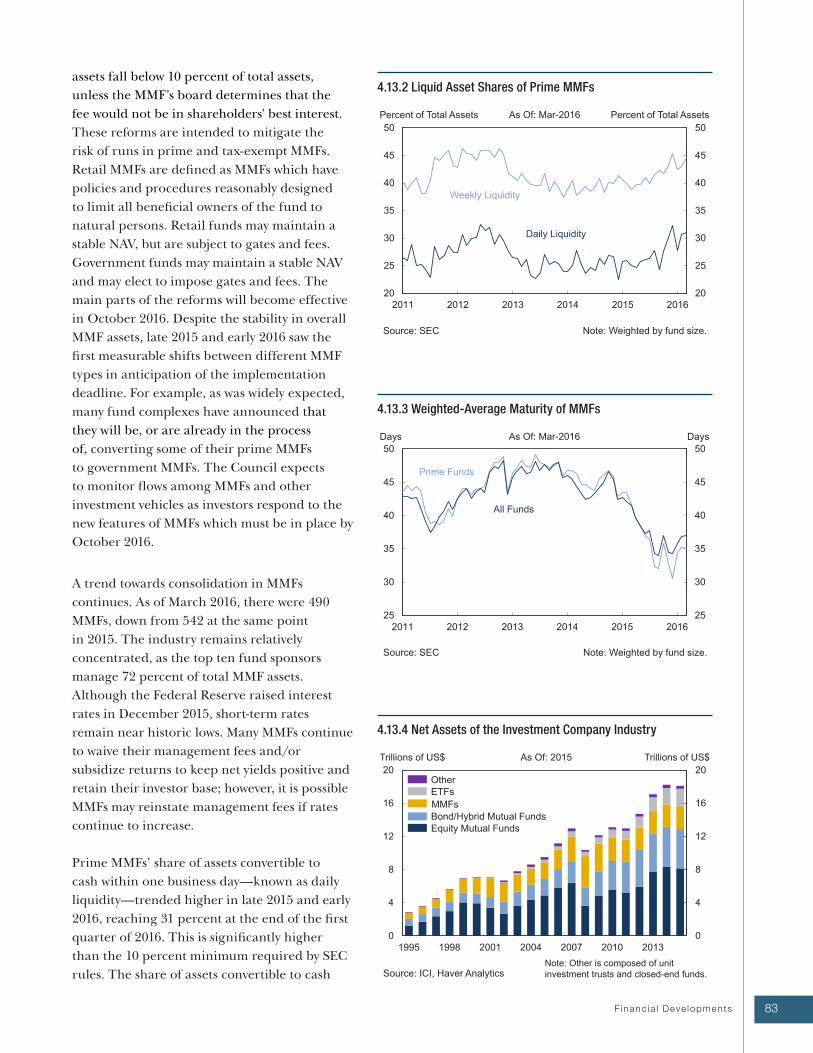
83 F inanc ia l Deve lopments
assets fall below 10 percent of total assets,
unless the MMF's board determines that the
fee would not be in shareholders' best interest.
These reforms are intended to mitigate the
risk of runs in prime and tax-exempt MMFs.
Retail MMFs are defined as MMFs which have
policies and procedures reasonably designed
to limit all beneficial owners of the fund to
natural persons. Retail funds may maintain a
stable NAV, but are subject to gates and fees.
Government funds may maintain a stable NAV
and may elect to impose gates and fees. The
main parts of the reforms will become effective
in October 2016. Despite the stability in overall
MMF assets, late 2015 and early 2016 saw the
first measurable shifts between different MMF
types in anticipation of the implementation
deadline. For example, as was widely expected,
many fund complexes have announced that
they will be, or are already in the process
of, converting some of their prime MMFs
to government MMFs. The Council expects
to monitor flows among MMFs and other
investment vehicles as investors respond to the
new features of MMFs which must be in place by
October 2016.
A trend towards consolidation in MMFs
continues. As of March 2016, there were 490
MMFs, down from 542 at the same point
in 2015. The industry remains relatively
concentrated, as the top ten fund sponsors
manage 72 percent of total MMF assets.
Although the Federal Reserve raised interest
rates in December 2015, short-term rates
remain near historic lows. Many MMFs continue
to waive their management fees and/or
subsidize returns to keep net yields positive and
retain their investor base; however, it is possible
MMFs may reinstate management fees if rates
continue to increase.
Prime MMFs’ share of assets convertible to
cash within one business day—known as daily
liquidity—trended higher in late 2015 and early
2016, reaching 31 percent at the end of the first
quarter of 2016. This is significantly higher
than the 10 percent minimum required by SEC
rules. The share of assets convertible to cash
4.13.4 Net Assets of the Investment Company Industry
4.13.3 Weighted-Average Maturity of MMFs
4.13.2 Liquid Asset Shares of Prime MMFs
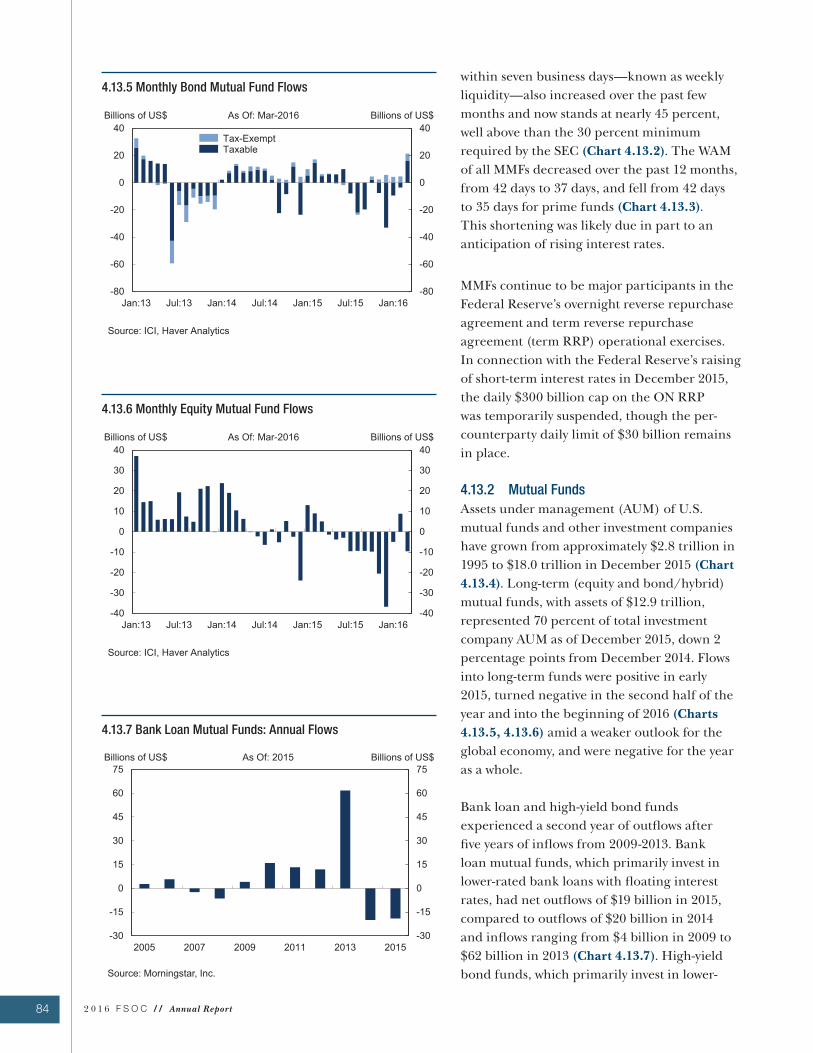
84 2 0 1 6 F S O C / / Annual Report
4.13.7 Bank Loan Mutual Funds: Annual Flows
4.13.6 Monthly Equity Mutual Fund Flows
4.13.5 Monthly Bond Mutual Fund Flowswithin seven business days—known as weekly
liquidity—also increased over the past few
months and now stands at nearly 45 percent,
well above than the 30 percent minimum
required by the SEC (Chart 4.13.2). The WAM
of all MMFs decreased over the past 12 months,
from 42 days to 37 days, and fell from 42 days
to 35 days for prime funds (Chart 4.13.3).
This shortening was likely due in part to an
anticipation of rising interest rates.
MMFs continue to be major participants in the
Federal Reserve’s overnight reverse repurchase
agreement and term reverse repurchase
agreement (term RRP) operational exercises.
In connection with the Federal Reserve’s raising
of short-term interest rates in December 2015,
the daily $300 billion cap on the ON RRP
was temporarily suspended, though the per-
counterparty daily limit of $30 billion remains
in place.
4.13.2 Mutual Funds
Assets under management (AUM) of U.S.
mutual funds and other investment companies
have grown from approximately $2.8 trillion in
1995 to $18.0 trillion in December 2015 (Chart
4.13.4). Long-term (equity and bond/hybrid)
mutual funds, with assets of $12.9 trillion,
represented 70 percent of total investment
company AUM as of December 2015, down 2
percentage points from December 2014. Flows
into long-term funds were positive in early
2015, turned negative in the second half of the
year and into the beginning of 2016 (Charts
4.13.5, 4.13.6) amid a weaker outlook for the
global economy, and were negative for the year
as a whole.
Bank loan and high-yield bond funds
experienced a second year of outflows after
five years of inflows from 2009-2013. Bank
loan mutual funds, which primarily invest in
lower-rated bank loans with floating interest
rates, had net outflows of $19 billion in 2015,
compared to outflows of $20 billion in 2014
and inflows ranging from $4 billion in 2009 to
$62 billion in 2013 (Chart 4.13.7). High-yield
bond funds, which primarily invest in lower-
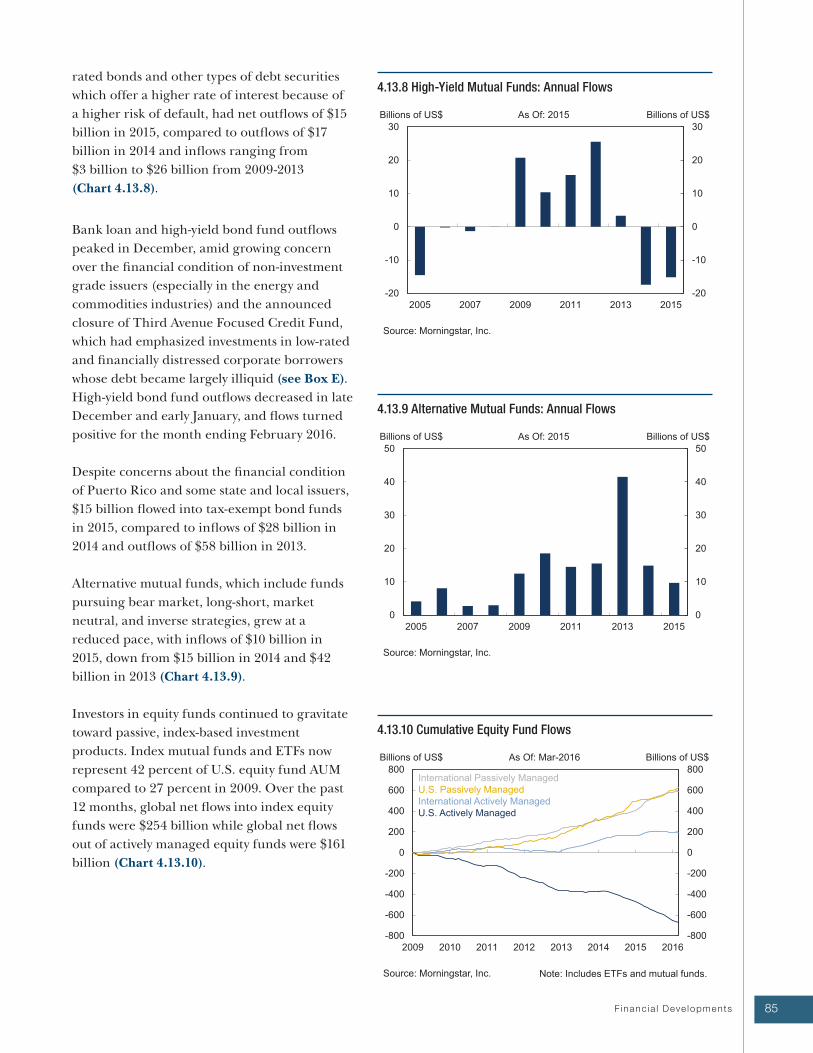
85 F inanc ia l Deve lopments
rated bonds and other types of debt securities
which offer a higher rate of interest because of
a higher risk of default, had net outflows of $15
billion in 2015, compared to outflows of $17
billion in 2014 and inflows ranging from
$3 billion to $26 billion from 2009-2013
(Chart 4.13.8).
Bank loan and high-yield bond fund outflows
peaked in December, amid growing concern
over the financial condition of non-investment
grade issuers (especially in the energy and
commodities industries) and the announced
closure of Third Avenue Focused Credit Fund,
which had emphasized investments in low-rated
and financially distressed corporate borrowers
whose debt became largely illiquid (see Box E).
High-yield bond fund outflows decreased in late
December and early January, and flows turned
positive for the month ending February 2016.
Despite concerns about the financial condition
of Puerto Rico and some state and local issuers,
$15 billion flowed into tax-exempt bond funds
in 2015, compared to inflows of $28 billion in
2014 and outflows of $58 billion in 2013.
Alternative mutual funds, which include funds
pursuing bear market, long-short, market
neutral, and inverse strategies, grew at a
reduced pace, with inflows of $10 billion in
2015, down from $15 billion in 2014 and $42
billion in 2013 (Chart 4.13.9).
Investors in equity funds continued to gravitate
toward passive, index-based investment
products. Index mutual funds and ETFs now
represent 42 percent of U.S. equity fund AUM
compared to 27 percent in 2009. Over the past
12 months, global net flows into index equity
funds were $254 billion while global net flows
out of actively managed equity funds were $161
billion (Chart 4.13.10).
4.13.10 Cumulative Equity Fund Flows
4.13.9 Alternative Mutual Funds: Annual Flows
4.13.8 High-Yield Mutual Funds: Annual Flows
2 0 1 6 F S O C / / Annual Report86
On December 16, 2015, the SEC issued a
temporary order granting Third Avenue’s
Focused Credit Fund (FCF)’s request to suspend
redemption rights until the fund has liquidated.
This followed FCF’s earlier announcement that
“investor requests for redemption … in addition
to the general reduction of liquidity in the fixed
income markets, have made it impracticable for
FCF going forward to create sufficient cash to pay
anticipated redemptions without resorting
to sales at prices that would unfairly disadvantage
the remaining shareholders.” Since 2000, such
suspensions have been rare, and in 2008,
only two municipal bond funds suspended
cash redemptions.
Starting in the third quarter of 2014, FCF faced
heavy redemptions against the backdrop of
underperformance. FCF’s AUM fell from $3.5
billion in July 2014 to $788 million at the time it
suspended redemptions, due to a combination
of market action and redemptions. Since
its inception in 2009, FCF had emphasized
investments in low-rated and financially distressed
corporate borrowers, an increasing portion of
which had become illiquid over the course of
2015. Current SEC rules require FCF to disclose
its position-level holdings on a quarterly basis,
and such disclosures made the fund’s low credit
quality transparent to its investors. As of July 31,
2015, nearly 90 percent of FCF’s assets were
CCC or below and unrated assets. The fund
represented in its filing seeking SEC approval
to suspend redemptions, “it had become
apparent during the week of December 7, 2015
that the fund was unable to find buyers even for
otherwise liquid securities at rational prices and
that redemptions would likely continue.” FCF
disclosed in its July 31 Form N-Q filing that
only 9 percent of its assets met the illiquid
asset definition.
The actions by FCF came at a time of heightened
volatility in the high-yield credit market, and other
high-yield mutual funds also saw significant
outflows. However, no other high-yield funds
were forced to suspend redemptions.
Box E: Third Avenue Focused Credit Fund
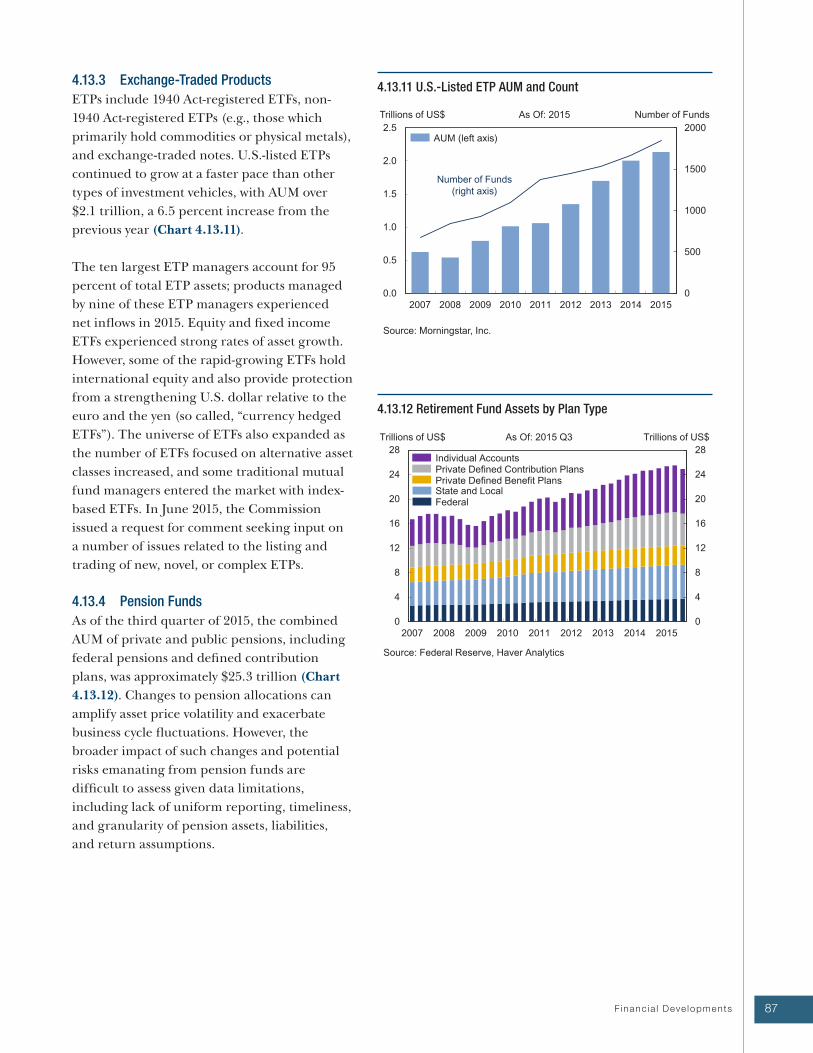
87 F inanc ia l Deve lopments
4.13.11 U.S.-Listed ETP AUM and Count4.13.3 Exchange-Traded Products
ETPs include 1940 Act-registered ETFs, non-
1940 Act-registered ETPs (e.g., those which
primarily hold commodities or physical metals),
and exchange-traded notes. U.S.-listed ETPs
continued to grow at a faster pace than other
types of investment vehicles, with AUM over
$2.1 trillion, a 6.5 percent increase from the
previous year (Chart 4.13.11).
The ten largest ETP managers account for 95
percent of total ETP assets; products managed
by nine of these ETP managers experienced
net inflows in 2015. Equity and fixed income
ETFs experienced strong rates of asset growth.
However, some of the rapid-growing ETFs hold
international equity and also provide protection
from a strengthening U.S. dollar relative to the
euro and the yen (so called, “currency hedged
ETFs”). The universe of ETFs also expanded as
the number of ETFs focused on alternative asset
classes increased, and some traditional mutual
fund managers entered the market with index-
based ETFs. In June 2015, the Commission
issued a request for comment seeking input on
a number of issues related to the listing and
trading of new, novel, or complex ETPs.
4.13.4 Pension Funds
As of the third quarter of 2015, the combined
AUM of private and public pensions, including
federal pensions and defined contribution
plans, was approximately $25.3 trillion (Chart
4.13.12). Changes to pension allocations can
amplify asset price volatility and exacerbate
business cycle fluctuations. However, the
broader impact of such changes and potential
risks emanating from pension funds are
difficult to assess given data limitations,
including lack of uniform reporting, timeliness,
and granularity of pension assets, liabilities,
and return assumptions.
4.13.12 Retirement Fund Assets by Plan Type

88 2 0 1 6 F S O C / / Annual Report
Corporate Plans
Corporate defined benefit funded status—the
estimated share of fund liabilities covered by
current assets—was little changed in 2015
(Chart 4.13.13). One estimate of the funded
status of the 100 largest corporate defined
benefit pension plans in the United States rose
to 81.8 percent in December 2015, an increase
of 0.1 percentage point from the previous year.
The slightly higher aggregate corporate funded
status resulted in part from a 25 basis point
increase in discount rates and an update to life
expectancy assumptions. Corporate pension
discount rates, which are used to value pension
liabilities, rose in tandem with Treasury yields.
Large investment losses, however, partially
offset the benefits of lower pension liabilities.
As of the end of 2014, many corporate plan
sponsors began to incorporate new mortality
assumptions which generally reflect increases
in life expectancy. In 2016, however, per
Internal Revenue Service (IRS) Notice 2015-
53, corporate pension plans are authorized to
use static mortality tables dating back several
years for use in actuarial valuations. Industry
analysis indicates an increase of up to 3.4
percent in liabilities based on full adoption of
mortality tables from the Society of Actuaries
as of December 2014. While this change is
expected to result in higher pension liabilities,
the magnitude of those changes will depend
on the demographics of plan participants and
the degree to which longevity risk is hedged.
Pension funds can obtain relief via risk transfer
mechanisms such as longevity swaps, pension
close-out deals arranged with insurers, and buy-
out or buy-in options.
Multiemployer Plans
Plans in the multiemployer sector are on
average 79 percent funded, though 214 plans
(17 percent of all multiemployer plans) are
funded at less than 65 percent of total liabilities.
The total shortfall for multiemployer plans
which are less than 65 percent funded is
estimated at $65 billion.
4.13.13 Public and Private Pension Funding Levels
89 F inanc ia l Deve lopments
The Pension Benefit Guaranty Corporation
(PBGC) insurance program for private sector
multiemployer defined benefit pension plans
is projected to have insufficient funds to cover
the projected future demands from plans
requiring financial assistance. It is more likely
than not the program will run out of money
in 2025. In December 2014, the Multiemployer
Pension Reform Act of 2014 was passed. The
law increased the premiums multiemployer
plans pay to the PBGC and changed the PBGC’s
ability to provide financial assistance through
a partition of plan liabilities. It also allowed
multiemployer plans projected to become
insolvent in the next 20 years (15 in some
cases) to apply to the Treasury Department for
permission to reduce pension benefits if doing
so would allow the plan to remain solvent over
the long-term and continue to provide benefits
at least 10 percent higher than the level of the
PBGC guarantee, with further protections for
the aged and disabled. In September 2015,
one large multiemployer pension fund filed an
application to reduce benefits with the Treasury
Department, with two others following in
December 2015, and another in March 2016.
Public Plans
In 2015, the aggregate funded status of U.S.
public pension plans is 68.9 percent, slightly
lower than last year. However, this estimate is
based on 2014 data (the latest available) and
thus does not account for mark-to-market
changes in public pensions’ investment
holdings in 2015. Indeed, an independent
estimate of funded ratios based on market
valuations of plan assets shows a 3.5 percentage
point increase in funded ratios from 2014.
Also of note, public pension funds generally
use a different set of accounting rules than
private pension funds. This enables them to
assume investment returns based on long-run
expectations, which are significantly higher
than average post-crisis returns, and thus could
overstate funded status.
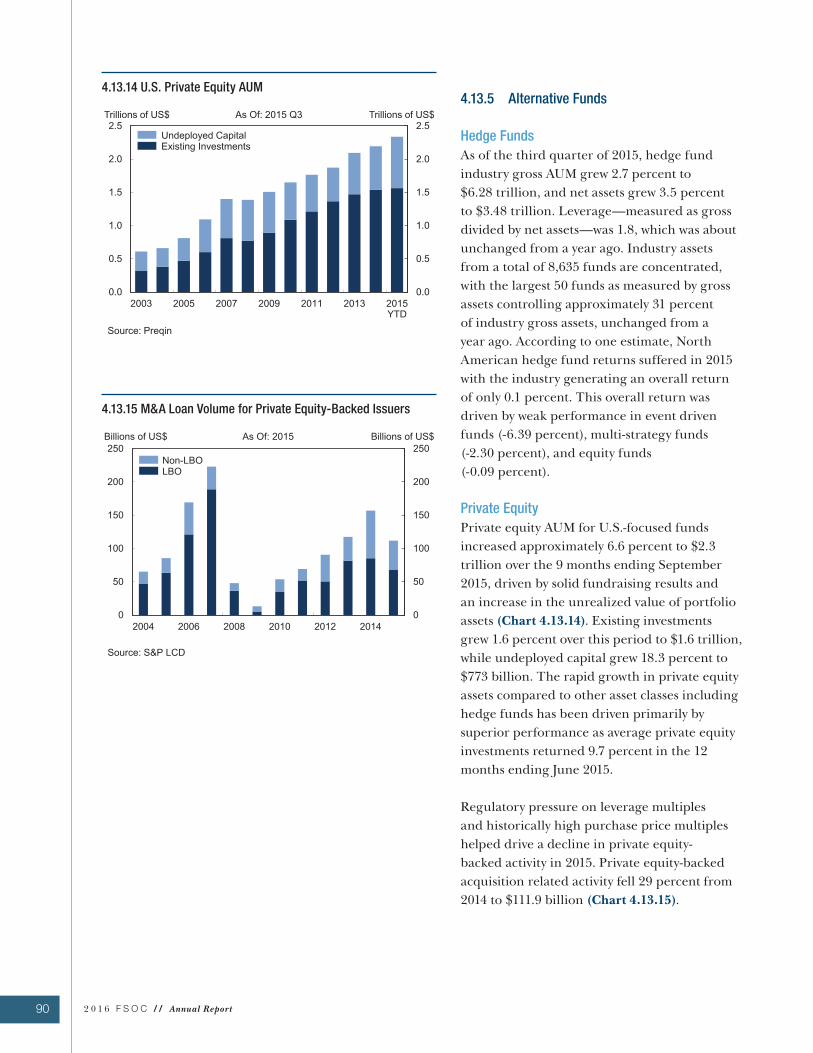
90 2 0 1 6 F S O C / / Annual Report
4.13.5 Alternative Funds
Hedge Funds
As of the third quarter of 2015, hedge fund
industry gross AUM grew 2.7 percent to
$6.28 trillion, and net assets grew 3.5 percent
to $3.48 trillion. Leverage—measured as gross
divided by net assets—was 1.8, which was about
unchanged from a year ago. Industry assets
from a total of 8,635 funds are concentrated,
with the largest 50 funds as measured by gross
assets controlling approximately 31 percent
of industry gross assets, unchanged from a
year ago. According to one estimate, North
American hedge fund returns suffered in 2015
with the industry generating an overall return
of only 0.1 percent. This overall return was
driven by weak performance in event driven
funds (-6.39 percent), multi-strategy funds
(-2.30 percent), and equity funds
(-0.09 percent).
Private Equity
Private equity AUM for U.S.-focused funds
increased approximately 6.6 percent to $2.3
trillion over the 9 months ending September
2015, driven by solid fundraising results and
an increase in the unrealized value of portfolio
assets (Chart 4.13.14). Existing investments
grew 1.6 percent over this period to $1.6 trillion,
while undeployed capital grew 18.3 percent to
$773 billion. The rapid growth in private equity
assets compared to other asset classes including
hedge funds has been driven primarily by
superior performance as average private equity
investments returned 9.7 percent in the 12
months ending June 2015.
Regulatory pressure on leverage multiples
and historically high purchase price multiples
helped drive a decline in private equity-
backed activity in 2015. Private equity-backed
acquisition related activity fell 29 percent from
2014 to $111.9 billion (Chart 4.13.15).
4.13.15 M&A Loan Volume for Private Equity-Backed Issuers
4.13.14 U.S. Private Equity AUM
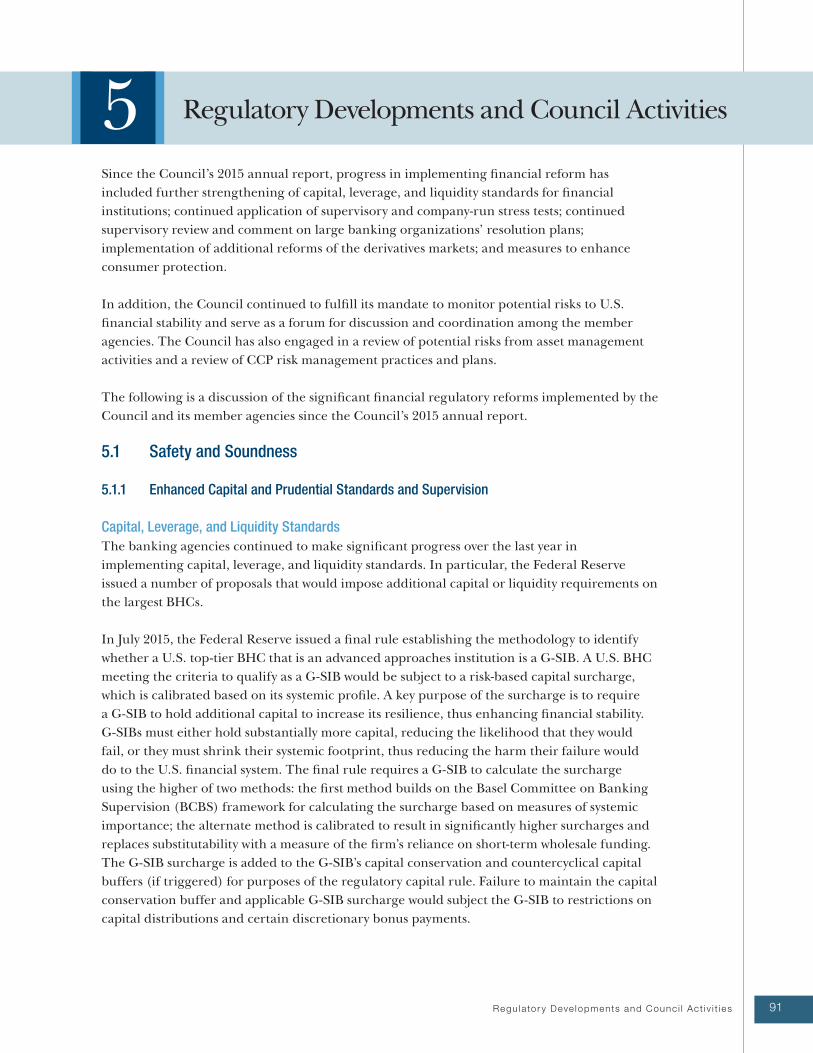
91Regu lato r y Deve lopments and Counc i l Ac t i v i t i es
5 Regulatory Developments and Council Activities
Since the Council’s 2015 annual report, progress in implementing financial reform has
included further strengthening of capital, leverage, and liquidity standards for financial
institutions; continued application of supervisory and company-run stress tests; continued
supervisory review and comment on large banking organizations’ resolution plans;
implementation of additional reforms of the derivatives markets; and measures to enhance
consumer protection.
In addition, the Council continued to fulfill its mandate to monitor potential risks to U.S.
financial stability and serve as a forum for discussion and coordination among the member
agencies. The Council has also engaged in a review of potential risks from asset management
activities and a review of CCP risk management practices and plans.
The following is a discussion of the significant financial regulatory reforms implemented by the
Council and its member agencies since the Council’s 2015 annual report.
5.1 Safety and Soundness
5.1.1 Enhanced Capital and Prudential Standards and Supervision
Capital, Leverage, and Liquidity Standards
The banking agencies continued to make significant progress over the last year in
implementing capital, leverage, and liquidity standards. In particular, the Federal Reserve
issued a number of proposals that would impose additional capital or liquidity requirements on
the largest BHCs.
In July 2015, the Federal Reserve issued a final rule establishing the methodology to identify
whether a U.S. top-tier BHC that is an advanced approaches institution is a G-SIB. A U.S. BHC
meeting the criteria to qualify as a G-SIB would be subject to a risk-based capital surcharge,
which is calibrated based on its systemic profile. A key purpose of the surcharge is to require
a G-SIB to hold additional capital to increase its resilience, thus enhancing financial stability.
G-SIBs must either hold substantially more capital, reducing the likelihood that they would
fail, or they must shrink their systemic footprint, thus reducing the harm their failure would
do to the U.S. financial system. The final rule requires a G-SIB to calculate the surcharge
using the higher of two methods: the first method builds on the Basel Committee on Banking
Supervision (BCBS) framework for calculating the surcharge based on measures of systemic
importance; the alternate method is calibrated to result in significantly higher surcharges and
replaces substitutability with a measure of the firm’s reliance on short-term wholesale funding.
The G-SIB surcharge is added to the G-SIB’s capital conservation and countercyclical capital
buffers (if triggered) for purposes of the regulatory capital rule. Failure to maintain the capital
conservation buffer and applicable G-SIB surcharge would subject the G-SIB to restrictions on
capital distributions and certain discretionary bonus payments.
2 0 1 6 F S O C / / Annual Report92
In October 2015, the Federal Reserve issued a proposed rule to require U.S. G-SIBs to meet a new long-
term debt requirement and a new total loss-absorbing capacity requirement. The proposed long-term debt
requirement would set a minimum level of eligible external long-term debt that could be used to recapitalize
these firms' critical operations upon failure of the parent holding company. The complementary total loss-
absorbing capacity requirement would set a new minimum level of eligible external total loss-absorbing
capacity, which can be met with both regulatory capital and long-term debt. To satisfy these requirements,
G-SIBs would have to issue instruments that can be used to ensure losses from the banking organization
are borne by its investors in the case of failure. The top-tier U.S. IHCs of foreign G-SIBs would be required
to meet new long-term debt and total loss-absorbing capacity requirements by issuing these instruments to
a foreign parent company. The proposal would also subject the operations of both U.S. and foreign G-SIBs
to “clean holding company” limitations that would prohibit certain activities and cap the value of liabilities
of top-tier U.S. BHCs of U.S. G-SIBs and top-tier intermediate U.S. holding companies of foreign G-SIBs to
further improve their resolvability and the resilience of their operating subsidiaries.
In November 2015, the Federal Reserve proposed a rule requiring all depository institution holding
companies and covered nonbank companies that are required to calculate the LCR to publicly disclose
several measures of their liquidity profile. A covered company would be required to publicly disclose on a
quarterly basis quantitative information about its LCR calculation, as well as a discussion of certain features
of its LCR results, including its average eligible HQLA.
On December 21, 2015, the Federal Reserve voted to affirm the CCyB amount at the current level of 0
percent, based on its assessment that financial vulnerabilities remained moderate. That assessment reflected
in part the relatively low levels of leverage and maturity transformation in the financial sector, as well as
continued modest growth in household debt. The Federal Reserve also proposed a policy statement detailing
the framework that it would follow in setting the CCyB, a macroprudential tool that can be used to increase
the resilience of the financial system when there is a somewhat higher risk of elevated losses in the future,
so that it is then available to help absorb losses and moderate the reduction in credit supply associated with
worsening credit conditions. The framework consists of a set of principles for translating assessments of
financial-system vulnerabilities that are regularly undertaken by the Federal Reserve into the appropriate
level of the CCyB.
In June 2015, the federal banking agencies finalized revisions to the regulatory capital rules, which were
originally adopted in 2013, applicable to advanced approaches banking organizations. The revisions clarify
certain requirements of the advanced approaches risk-based capital rule based on observations made by
the agencies during the parallel run review process of advanced approaches banking organizations. The
revisions also enhance consistency of the agencies' advanced approaches risk-based capital rule with relevant
international standards.
In April 2016, the Federal Reserve finalized a rule to amend its LCR requirement. The final rule allows
investment grade, U.S. general obligation state and municipal securities to be counted as HQLA up to certain
levels if they meet the same liquidity criteria which currently apply to corporate debt securities. The limits on
the amount of a state or municipality's securities which could qualify are based on the liquidity characteristics
of the securities. The final rule applies only to institutions supervised by the Federal Reserve and subject to
the LCR requirement.
93Regu lato r y Deve lopments and Counc i l Ac t i v i t i es
Enhanced Prudential Standards
In July 2015, the Federal Reserve issued a final order which established enhanced prudential standards for
General Electric Capital Corporation (GECC), a nonbank financial company designated by the Council in
July 2013 for Federal Reserve supervision and enhanced prudential standards. In light of the substantial
similarity of GECC's activities and risk profile to that of a similarly sized BHC, the enhanced prudential
standards adopted by the Federal Reserve are similar to those that apply to large BHCs, including capital
requirements, capital-planning and stress-testing requirements, liquidity requirements, risk-management and
risk-committee requirements, and reporting requirements. In light of the plan announced and in the process
of execution by General Electric, parent company of GECC, to substantially shrink GECC’s systemic footprint
and retain only those business lines that support General Electric’s core industrial businesses, the final
order provides for application of enhanced prudential standards in two phases. Effective January 1, 2016,
GECC must comply with risk-based capital and leverage requirements, the LCR rule, and related reporting
requirements. Additional requirements come into effect on January 1, 2018.
Emergency Lending Authority
On November 30, 2015, the Federal Reserve approved a final rule updating its procedures for emergency
lending under Section 13(3) of the Federal Reserve Act. The Dodd-Frank Act limits the Federal Reserve’s
authority to engage in emergency lending to programs and facilities with “broad-based eligibility” which
have been established with the approval of the Secretary of the Treasury. The Dodd-Frank Act also prohibits
lending to entities which are insolvent and imposes certain other limitations. The rule provides greater clarity
regarding the Federal Reserve’s implementation of these and other statutory requirements.
5.1.2 Dodd-Frank Act Stress Tests and Comprehensive Capital Analysis and Review
Section 165(i) of the Dodd-Frank Act requires two types of stress tests. First, the Federal Reserve must
conduct annual supervisory stress tests of BHCs with $50 billion or more in total consolidated assets,
U.S. IHCs of FBOs with $50 billion or more in U.S. non-branch assets, and nonbank financial companies
designated by the Council. Second, financial companies with more than $10 billion in total consolidated
assets regulated by a primary federal financial regulatory agency must conduct annual company-run stress
tests, and BHCs with $50 billion or more in total consolidated assets and nonbank financial companies
designated by the Council must also conduct semiannual company-run stress tests. In March 2015, the
Federal Reserve released the results of 2015 annual DFAST and the CCAR (see Section 4.11.1).
For the first time in 2015, certain financial institutions with total consolidated assets between $10 and $50
billion were required to disclose the results of their Dodd-Frank Act company-run stress tests. Results were
disclosed between June 15 and June 30. These tests are not conducted by the federal banking agencies, and
the agencies do not make public statements about the results.
In November 2015, the Federal Reserve issued a final rule to modify its capital plan and stress testing rules
effective January 1, 2016. For BHCs with more than $10 billion but less than $50 billion in total consolidated
assets and savings and loan holding companies with total consolidated assets of more than $10 billion, the
final rule modifies certain mandatory capital action assumptions in the stress test rules. It also delays the
application of the company-run stress test requirements to savings and loan holding companies until January
1, 2017. For BHCs with total consolidated assets of $50 billion or more and state member banks subject to the
Federal Reserve’s advanced approaches capital requirements, the final rule delays the use of the SLR for one
year and indefinitely defers the use of the advanced approaches risk-based capital framework in the capital
plan and stress test rules. For BHCs that have total consolidated assets of $50 billion or more, the final rule
also removes the tier 1 common capital ratio requirement and modifies certain mandatory capital action
assumptions. The FDIC and OCC similarly revised their respective rules in 2014 to modify the timing of the
stress tests.
2 0 1 6 F S O C / / Annual Report94
In January 2016, the OCC and Federal Reserve released supervisory scenarios for the 2016 DFAST. The
FDIC released its stress test scenarios in February 2016. The Federal Reserve also issued instructions to
firms participating in 2016 CCAR. Financial institutions are required to use the supervisory scenarios to
in both the stress test conducted as part of CCAR and those required by the Dodd-Frank Act. Financial
institutions are also required to use at least one BHC defined stress scenario and a BHC baseline scenario
as part of CCAR. The severely adverse supervisory scenario for DFAST and the CCAR exercise features
a countercyclical element: as described in the 2013 policy statement on scenario design, when prevailing
economic conditions are sufficiently strong, as measured by the unemployment rate, the scenario’s severity, as
measured by the increase in unemployment rate, is increased. In this year’s stress test, the unemployment rate
increased 5 percentage points to a level of 10 percent unemployment; the scenarios used in the annual stress
tests since 2012 had featured increases of 4 percentage points.
5.1.3 Resolution Plans and Orderly Liquidation Authority
Under the framework of the Dodd-Frank Act, resolution under the U.S. Bankruptcy Code is the statutory
first option in the event of the failure of a financial company. Section 165(d) of the Dodd-Frank Act requires
nonbank financial companies designated by the Council for supervision by the Federal Reserve and BHCs—
including FBOs that are, or are treated as, BHCs—with total consolidated assets of $50 billion or more
to report periodically to the Federal Reserve, the FDIC, and the Council with plans—also referred to as
living wills—for their rapid and orderly resolution under the U.S. Bankruptcy Code in the event of material
financial distress or failure. The Federal Reserve and the FDIC review each plan and may jointly determine
that a plan is not credible or would not facilitate an orderly resolution of the company under the U.S.
Bankruptcy Code. If the Federal Reserve Board of Governors and the FDIC Board of Directors make such a
joint determination, the agencies must notify the company of the deficiencies in its plan, and the company
must resubmit its plan with revisions that address the deficiencies jointly identified by the Federal Reserve
and FDIC, including any proposed changes in business operations and corporate structure. The company
must also explain why it believes that the revised plan is credible and would result in an orderly resolution
under the U.S. Bankruptcy Code.
If a firm fails to adequately remediate its identified deficiencies, the Federal Reserve and the FDIC, acting
jointly, may impose more stringent capital, leverage, or liquidity requirements, or restrictions on growth,
activities, or operations of the firm, or its subsidiaries. If, following a two-year period beginning on the date
of the imposition of such requirements, a firm still has failed to adequately remediate any deficiencies, the
Federal Reserve and the FDIC, in consultation with the Council, may jointly require the firm to divest certain
assets or operations to facilitate an orderly resolution of the firm in bankruptcy.
In April 2016, the Federal Reserve and FDIC jointly determined that each of the 2015 resolution plans
of Bank of America, Bank of New York Mellon, JP Morgan Chase, State Street, and Wells Fargo was not
credible or would not facilitate an orderly resolution under the U.S. Bankruptcy Code, the statutory
standard established in the Dodd-Frank Act, and notified these firms of their deficiencies. In assessing the
2015 resolution plans, the agencies evaluated a number of areas, and key among them were seven elements:
capital, liquidity, governance mechanisms, operational capabilities, legal entity rationalization, derivatives
and trading activities, and responsiveness. The agencies issued joint notices of deficiencies to the five firms
detailing the deficiencies in their plans and the actions the firms must take to address them. Each firm must
remediate its deficiencies by October 1, 2016. If a firm has not done so, it may be subject to more stringent
prudential requirements, as described above.
95Regu lato r y Deve lopments and Counc i l Ac t i v i t i es
The Federal Reserve and FDIC also jointly identified weaknesses in the 2015 resolution plans of Goldman
Sachs and Morgan Stanley that the firms must address, but did not make joint determinations regarding
the plans. The FDIC determined that the plan submitted by Goldman Sachs was not credible or would not
facilitate an orderly resolution under the U.S. Bankruptcy Code, and identified deficiencies. The Federal
Reserve identified a deficiency in Morgan Stanley's plan and found that the plan was not credible or would
not facilitate an orderly resolution under the U.S. Bankruptcy Code.
Neither agency found that Citigroup's 2015 resolution plan was not credible or would not facilitate an orderly
resolution under the U.S. Bankruptcy Code, although the agencies did identify weaknesses that the firm must
address.
In addition, the agencies issued guidance to the eight firms for the development of their July 1, 2017 plan
submissions. The 2017 plan of each firm is expected to satisfactorily address the vulnerabilities discussed in
the guidance, and the agencies will evaluate the plans under the statutory standard.
In March 2015, the Federal Reserve and the FDIC delivered feedback letters to three large FBOs (BNP
Paribas, HSBC Holdings plc, and The Royal Bank of Scotland plc) regarding their 2014 resolution plan
submissions. In July 2015, the Federal Reserve and the FDIC provided feedback to three nonbank financial
companies (American International Group, Inc. (AIG), Prudential Financial, Inc., and GECC) regarding
their initial resolution plans. These six organizations submitted their 2015 plans before the December 31,
2015 deadline set by the agencies.
Also in July 2015, the Federal Reserve and the FDIC provided guidance to 119 firms that file their resolution
plans in December of each year. Twenty-nine of the more complex firms were required to file either full
or tailored resolution plans that take into account guidance identified by the agencies. Ninety firms with
limited U.S. operations were permitted to file plans that focus on material change to their 2014 resolution
plans, actions taken to strengthen the effectiveness of those plans, and, where applicable, actions to ensure
any subsidiary insured depository institution is adequately protected from the risk arising from the activities
of nonbank affiliates of the firm. The agencies also released an updated tailored resolution plan template
intended to facilitate the preparation of tailored resolution plans.
In November 2015, ISDA relaunched the ISDA Universal Resolution Stay Protocol. The 2015 Protocol ensures
cross-border derivatives and securities financing transactions are captured by stays on cross-default and early
termination rights in the event a counterparty enters into resolution. These stays would facilitate a resolution
under either the Orderly Liquidation Authority or the U.S. Bankruptcy Code by helping to address some of
the cross-border uncertainty and contagion risks in both regimes.
In February 2016, the FDIC and the SEC proposed a joint rule to establish procedures for the FDIC to
appoint the Securities Investor Protection Corporation (SIPC) as trustee of a broker-dealer placed into a
Title II receivership and providing for satisfaction of customer claims against the covered broker-dealer.
The proposed rule clarifies how the customer protections of the Securities Investor Protection Act will be
integrated with the other provisions of Title II, the role of the FDIC as receiver and SIPC as trustee for the
covered broker-dealer, and the administration of claims in the receivership of a covered broker-dealer.
2 0 1 6 F S O C / / Annual Report96
5.1.4 Insurance
FIO, the Federal Reserve, and state insurance regulators are the U.S.-based members of the International
Association of Insurance Supervisors (IAIS). FIO’s director, three state insurance regulators, one member
of the Federal Reserve’s senior staff, in addition to supervisors from other jurisdictions, serve on the IAIS’s
Executive Committee.
Through service on the IAIS’s Financial Stability and Technical Committee, FIO, the Federal Reserve, state
insurance regulators, and the NAIC have participated extensively in the process of evaluating insurers for
potential identification by the IAIS and the FSB as global systemically important insurers (G-SIIs) and in
developing the policy measures to be applied to G-SIIs. The FSB, which was tasked by the G-20 to identify
G-SIIs, delegated to the IAIS the development of a methodology to identify G-SIIs and the development of
policy measures applicable to G-SIIs. On November 3, 2015, the FSB, after consultation with the IAIS and
national authorities, identified an updated list of nine G-SIIs. The 2015 G-SII list included the three U.S.-
based insurers that were on the G-SII lists in both 2013 and 2014.
In November 2015, the IAIS issued two public consultations related to the IAIS’s G-SII work. The first
consultation proposed revisions to the methodology to identify G-SIIs to ensure, among other things,
an appropriate treatment of all types of primary insurance, reinsurance and other financial activities of
global insurers. The second consultation is part of an effort by the IAIS to update and improve upon the
IAIS’s concept of non-traditional non-insurance activities and products, which are an important part of the
methodology, as well as the determination of the basic capital requirement (BCR) and higher loss absorbency
(HLA) requirement to G-SIIs.
The FSB also called upon the IAIS to develop several separate capital standards. The IAIS finalized the
first such standard in 2014—a straightforward BCR that applies to all G-SII group activities, including non-
insurance activities. In October 2015, the IAIS also developed an initial version of the HLA requirements
for G-SIIs. The BCR and HLA standards were both subsequently endorsed by the FSB. The IAIS is also
developing a more risk-sensitive group-wide global insurance capital standard (ICS) that, if adopted by the
IAIS and implemented, would replace the BCR as the foundation for HLA for a G-SII, and would apply to
a broader cohort of internationally active insurance groups (IAIGs). The FIO, the Federal Reserve, state
insurance regulators, and the NAIC have participated significantly in IAIS committees and working groups
involved with the development of the BCR, HLA, and ICS. This includes annual iterations of field test
exercises that involve the collection and analysis of data from volunteer IAIGs, including some of the largest
U.S.-based insurance groups.
FIO, the Federal Reserve, state insurance regulators, and the NAIC are members of the IAIS Financial Crime
Task Force, which is developing an issues paper that would lead to the development of global standards for
cybersecurity.
Since 2012, FIO, state insurance regulators, the NAIC, the European Commission, and the European
Insurance and Occupational Pensions Authority have participated in an EU-U.S. Insurance Project to
increase mutual understanding and enhance cooperation among insurance authorities in the EU and the
United States. In November 2015, the Steering Committee held its third public forum dedicated to the topics
of group supervision and transatlantic cooperation. The forum reported on the progress of the EU-U.S.
Insurance Project on group supervision, focusing on supervisory colleges and the Own Risk and Solvency
Assessment (ORSA). The EU-U.S. Insurance Project in November 2015 also released reports regarding group
supervision and ORSA.
97Regu lato r y Deve lopments and Counc i l Ac t i v i t i es
Under Title V of the Dodd-Frank Act, FIO has the authority to assist the Secretary of the Treasury in
negotiating “covered agreements” in conjunction with the U.S. Trade Representative (USTR). A covered
agreement is a written bilateral or multilateral agreement between the United States and one or more foreign
governments, authorities, or regulatory entities regarding prudential measures with respect to the business of
insurance or reinsurance.
In November 2015, Treasury and USTR jointly consulted with Congress regarding the intention to initiate
negotiations to enter into a covered agreement with the EU. Treasury and USTR advised Congress that a
covered agreement with the EU would level the regulatory playing field for U.S.-based insurers and reinsurers
operating there, and further confirm that the existing U.S. insurance regulatory system serves the goals of
insurance sector oversight, policyholder protection, and national and global financial stability. U.S. and EU
representatives met in February 2016 to begin negotiating a covered agreement. During this initial meeting,
both sides agreed to move forward efficiently and expeditiously and affirmed their good faith pursuit of a
covered agreement relating to group supervision, exchange of confidential information between supervisory
authorities, and reinsurance supervision including collateral. Additionally, both sides agreed to meaningful
stakeholder consultation and engagement throughout the negotiations. Talks continued in May 2016 at the
conclusion of which U.S. and EU representatives expressed commitment to pursuit of an agreement that will
improve regulatory and supervisory treatment for insurers and reinsurers operating on both sides of
the Atlantic.
By statute, FIO also assists the Secretary of the Treasury with administration of the Terrorism Risk Insurance
Program (TRIP). Title I of the Terrorism Risk Insurance Program Reauthorization Act of 2015 requires
that Treasury collect data concerning terrorism risk insurance coverage and issue several reports and new
rules as part of the implementation process. In October 2015, Treasury released a required report regarding
the process for certifying an “act of terrorism” under TRIP. In March 2016, Treasury announced the
commencement of data collection for 2016 from participating insurers concerning their experience under
TRIP. Also, in April 2016, Treasury sought public comment on a proposed revision to the TRIP regulations
that would add rules concerning, among other things, data collection and the certification process.
State insurance regulators, through the NAIC, continue work on updating the NAIC’s insurance financial
solvency framework and refining existing NAIC accounting, actuarial, reporting, valuation, and risk-based
capital standards. All 50 states, the District of Columbia, and Puerto Rico have adopted key amendments to
the Insurance Holding Company System Regulatory Act, including provisions requiring the submission of a
new enterprise risk report. In addition, revisions to the model act are being adopted by states to clarify their
legal authorities to act as group-wide supervisor for certain IAIGs. States continue to enact new and updated
NAIC model laws related to the Solvency Modernization Initiative, including the Risk Management and Own
Risk and Solvency Assessment Model Act (requiring the ORSA filing), and the revised Standard Valuation
Law to implement principle-based reserving, both of which have been adopted in a majority of states.
The states, through the NAIC, are moving toward establishing a more consistent regulatory framework for
life insurance affiliated captive reinsurance transactions entered into after 2014 relating to certain term
and universal life insurance products. This framework provides for the public disclosure of the reserves
and assets related to those transactions. This year, state insurance regulators, through the NAIC, continued
the implementation of the framework and further enhanced the supplemental disclosure. In addition, the
NAIC is currently studying the regulatory-related incentives that encourage insurers to engage in variable
annuity reinsurance transactions with captives and formulating potential adjustments to the NAIC solvency
framework required by the accreditation program. A quantitative impact study is currently underway to
determine the adjustments that are necessary to be made to the solvency framework.
2 0 1 6 F S O C / / Annual Report98
Under the 2011 revisions to the NAIC Credit for Reinsurance Model Law and Regulation, reinsurers from
a qualified jurisdiction are eligible to be certified for reduced reinsurance collateral requirements. The
majority of states have adopted the model law revisions, which now covers approximately 66 percent of
direct insurance premiums written across all lines of business in the U.S. The NAIC’s Financial Regulation
Standards and Accreditation Committee is currently considering making the certified reinsurer provisions a
uniform accreditation standard required for all NAIC accredited jurisdictions.
In addition to continuing to enact changes to the insurance solvency framework, state insurance regulators
have also focused on cybersecurity at insurance companies, and, in 2014, the NAIC established a
cybersecurity task force to coordinate such efforts. Through this task force, the NAIC developed and adopted
“Principles for Effective Cybersecurity Insurance Regulatory Guidance,” which promote uniform standards,
accountability, and access to necessary information while protecting consumers. The NAIC developed and
adopted a “Roadmap for Cybersecurity Consumer Protections” that will be used to guide drafting efforts for
the Insurance Data Security Model Law. A draft of that model law was exposed for comment in March 2016.
The NAIC also reviewed and updated cybersecurity examination standards in the NAIC Financial Examiner’s
Handbook to incorporate concepts from the NIST Cybersecurity Framework and similar enhancements are
expected to be made to the NAIC Market Conduct Examiner’s Handbook this year. The NAIC also adopted a
new Cybersecurity and Identity Theft Insurance Coverage Supplement to the Property and Casualty Annual
Statement to gather information about the insurers selling cybersecurity insurance products and the market
for such products. The first filings of this supplement were due on April 1, 2016.
5.1.5 Federal Mortgage-related Settlements
Since the Council’s last annual report, federal agencies reached additional significant settlements with
financial institutions relating to mortgage practices and the sale of mortgage securities.
In April 2016, the Department of Justice (DOJ), along with the NCUA and other federal and state
partners, announced a $5.6 billion settlement with Goldman Sachs related to its conduct in the packaging,
securitization, marketing, sale, and issuance of RMBS. The settlement required payment of a $2.4 billion
civil penalty and $1.8 billion in other relief for underwater homeowners, distressed borrowers and affected
communities, including the largest commitment in any RMBS agreement to provide financing for affordable
housing. Goldman Sachs also paid $875 million to settle claims with other federal and state entities, including
$575 million to settle claims with the NCUA.
In February 2016, the DOJ announced that Morgan Stanley agreed to pay a $2.6 billion penalty to resolve
claims related to the marketing, sale, and issuance of RMBS it issued in 2006 and 2007. This settlement
constitutes the largest component of a set of resolutions with Morgan Stanley entered by members of the
RMBS Working Group, which have totaled approximately $5 billion. As part of the agreement, Morgan
Stanley acknowledged in writing that it failed to disclose critical information to prospective investors about
the quality of the mortgage loans underlying its RMBS and about its due diligence practices. In conjunction
with this agreement, Morgan Stanley also agreed to pay $550 million and $22.5 million, respectively, to the
states of New York and Illinois.
In February 2016, Wells Fargo announced in a filing with the SEC that it had reached a $1.2 billion agreement
in principle with the DOJ and the Department of Housing and Urban Development (HUD) to resolve claims
that its FHA loan certifications violated the False Claims Act. Because the settlement is not finalized, DOJ and
HUD have not yet announced the settlement.
99Regu lato r y Deve lopments and Counc i l Ac t i v i t i es
In February 2015, DOJ and 19 states and the District of Columbia announced a $1.4 billion settlement with
S&P to resolve claims related to inflated ratings that it issued for RMBS and collateralized debt obligations
(CDOs) from 2004 to 2007 that misrepresented the securities’ true credit risks. Half of the settlement amount
constitutes a penalty to be paid to the federal government and is the largest penalty of its type ever paid by a
ratings agency, while the remaining half will be divided among the states and the District
of Columbia.
5.2 Financial Infrastructure, Markets, and Oversight
5.2.1 Over-the-Counter Derivatives Reform
The SEC, the CFTC, and the federal banking agencies continue to implement Title VII of the Dodd-Frank
Act, which establishes a comprehensive new regulatory framework for swaps and security-based swaps.
Security-Based Swaps
In February 2015, the SEC adopted Regulation SBSR. Regulation SBSR provides for the reporting of
security-based swap information to registered security-based swap data repositories (SBSDRs) and the public
dissemination of security-based swap transaction, volume, and pricing information by registered SBSDRs.
Regulation SBSR contains provisions that address the application of the regulatory reporting and public
dissemination requirements to cross-border security-based swap activity, as well as provisions for permitting
market participants to satisfy these requirements through substituted compliance. Concurrently, the SEC
also adopted new rules governing the SBSDR registration process, duties, and core principles and amending
several of its existing rules and regulations in order to accommodate SBSDRs. To further implement Title
VII, in August 2015, the SEC issued rules to establish a process for the registration (or withdrawal from
registration) of security-based swap dealers and major security-based swap participants with the SEC. In
February 2016, the SEC adopted rules governing how security-based swaps that involve dealing activity in
the United States should be counted in a foreign entity’s security-based swap dealer de minimis threshold
calculations. With these rules, the SEC has completed its rulemaking relating to the de minimis thresholds
and their application to U.S. and foreign dealers. In April 2016, the SEC adopted rules implementing a
comprehensive set of business conduct standards and chief compliance officer requirements for security-
based swap dealers and major security-based swap participants.
Margin Rules for Non-Cleared OTC Derivatives
In October 2015, the federal banking agencies, the FHFA, and the Farm Credit Administration (the
prudential regulators) released their final rule establishing capital and margin requirements for swap and
security-based swap dealers and major swap and security-based swap participants regulated by one of the
agencies. The final rule establishes minimum margin requirements for swaps and security-based swaps that
are not cleared through a clearinghouse. The margin requirements mandate the exchange of initial and
variation margin for non-cleared swaps and non-cleared security-based swaps between covered swap entities,
their affiliates, and certain counterparties. The amount of margin will vary based on the relative risk of the
non-cleared swap or non-cleared security-based swap as determined by initial margin models, if approved by
the prudential regulators, or standardized initial margin amounts. The agencies also issued an interim final
rule exempting from margin requirements certain non-cleared swaps and non-cleared security-based swaps
used for hedging purposes by commercial end-users and certain other counterparties.
2 0 1 6 F S O C / / Annual Report100
In December 2015, the CFTC adopted its final rule establishing initial and variation margin requirements
on non-cleared swaps for swap dealers and major swap participants for which there is no prudential
regulator. The CFTC rule is similar to the rules adopted by the prudential regulators and the framework
being developed in the EU. In May 2016, the CFTC separately adopted a rule for application of its margin
requirements to cross-border transactions.
The prudential regulators and the CFTC also adopted and sought comment on respective interim final
rules implementing the Business Risk Mitigation and Price Stabilization Act of 2015, which exempts from
the margin rules for non-cleared swaps certain swaps for which a counterparty qualifies for an exemption or
exception from clearing under Dodd-Frank.
5.2.2 CCPs: Ongoing Domestic and International Regulatory Initiatives
Regulators are actively working on domestic and international work streams related to CCPs, a number of
which are highlighted here.
In February 2015, CPMI-IOSCO published quantitative disclosure standards, which are intended to enable
stakeholders to compare CCP risk controls and to better understand and assess the risks of participating in
CCPs. By January 2016, all U.S. systemically important CCPs published their first set of quarterly quantitative
disclosures, which include data on their clearing transactions and financial resources. CCPs have been
publishing public qualitative disclosures regarding implementation of the Principles for Financial Market
Infrastructures (PFMI) at least biennially since 2013.
In February 2016, the CFTC and the European Commission announced a common approach to the
supervision of CCPs operating in the EU and the United States, representing an important step forward
in harmonizing CCP regulatory standards internationally. Under this common approach, the European
Commission and CFTC agreed on a substituted compliance regime for certain regulatory requirements
adopted by the CFTC in March 2016. The SEC continues to work with the European Commission on a
common approach with respect to CCPs under its jurisdiction.
In addition, the CFTC continues to review recovery and wind down plans submitted in the past year by the
systemically important CCPs under its jurisdiction. The SEC staff is working on a recommendation for the
Commission to adopt a rule on the standards for the systemically important clearing agencies under its
jurisdiction, including requirements for the development of recovery and wind down plans.
Staff working groups of the Council’s FMU Committee have held several targeted sessions on default risk
management, liquidity risk management, risk management governance, and resolution planning to promote
interagency engagement on potential risks associated with CCPs and potential policy responses. Committee
staff continues to review CCP risk management and the interconnections between CCPs and their clearing
members and the broader financial system. This includes assessing the level and breadth of transparency
that should be provided into CCP risk management, including the risk models used to calculate margin
requirements for each type of transaction and into stress testing methodologies and assumptions, so that
stakeholders can assess the adequacy of a CCPs risk management practices and of its financial and liquidity
resources. In addition, domestic regulators continue to engage internationally in stocktaking and assessment
efforts regarding stress testing, margin, adequacy of financial resources, CCP contributions of own capital,
loss allocation and other recovery tools, and resolution planning. Regulators will continue to review and
evaluate the effectiveness of current risk management standards and practices across these areas.
101Regu lato r y Deve lopments and Counc i l Ac t i v i t i es
5.2.3 Money Market Mutual Fund Reform
In July 2014, the SEC adopted significant structural reforms for the regulation of MMFs, building upon the
reforms adopted by the SEC in March 2010. The reforms are intended to make MMFs less susceptible to runs
that could threaten financial stability and harm investors. Several of these reforms went into effect in April
2016, and the remaining reforms will go into effect in October 2016.
5.2.4 Operational Risks for Technological Systems and Cybersecurity
In December 2015, the CFTC proposed Regulation AT, a series of risk controls, transparency measures and
other safeguards to enhance the safeguards for automated trading on U.S. designated contract markets
(DCMs). The proposed regulations focus on automation of order origination, transmission and execution,
and the risks that may arise from such activity. Principal elements of Regulation AT for market participants
and clearing futures commission merchants include: registration of certain entities not otherwise registered
with the Commission; new algorithmic trading procedures for trading firms and clearing firms, including
pre-trade and other risk controls; testing, monitoring, and supervision requirements for automated trading
systems; and requirements that certain persons submit compliance reports to DCMs regarding their ATSs.
Principal elements for DCMs include: new risk controls for Direct Electronic Access provided by DCMs;
transparency in DCM electronic trade matching platforms; and new risk control procedures, including pre-
trade risk controls, compliance report review standards, self-trade prevention tool requirements, and market-
maker and trading incentive program disclosure and related requirements.
In December 2015, the CFTC also proposed amendments to its system safeguards testing rules for DCMs,
SEFs, SDRs, and in a separate proposal, for derivatives clearing organizations. The amendments would
specify and define the types of cybersecurity testing essential to fulfilling system safeguards testing
obligations, including vulnerability testing, penetration testing, controls testing, security incident response
plan testing, and enterprise technology risk assessment and would clarify a number of other rule provisions.
The proposal would also add new provisions applicable to covered DCMs and all SDRs instituting minimum
frequency requirements for conducting the essential types of cybersecurity testing and requirements for
performance of certain tests by independent contractors.
Regulators continue work to develop mechanisms to evaluate and report on the ability of supervised financial
institutions to effectively manage the various safety and soundness risks posed by the use of information
technology at the entities and their significant vendors. In June 2015, the Federal Financial Institutions
Examination Council (FFIEC), on behalf of its members, published the Cybersecurity Assessment Tool
(CAT) to help institutions identify their risks and determine their cybersecurity preparedness across five
domains: Cyber Risk Management and Oversight; Threat Intelligence and Collaboration; Cybersecurity
Controls; External Dependency Management; and Cybersecurity Incident Management and Resilience. The
CAT provides a repeatable process for institutions to measure their cybersecurity preparedness over time.
It incorporates cybersecurity-related principles from within the FFIEC IT Examination Handbook and key
concepts from the NIST Cybersecurity Framework. Institutions of all sizes may use the CAT to perform a
self-assessment and inform their risk management strategies. A number of the member agencies are in the
process of using the CAT to support their bank examination process to benchmark and assess financial
institutions’ cybersecurity efforts.
The FFIEC on behalf of its members also published new and updated booklets within the FFIEC IT Examination Handbook. These updates included substantial revisions to the Management Booklet to reflect
the importance of incorporating technology operations management into an institution’s enterprise risk
management system. The Business Continuity Planning Booklet was updated to include a new appendix that
communicates expectations regarding components of an effective third-party risk management program
and highlights the importance of incorporating technology service providers’ business continuity plans into
2 0 1 6 F S O C / / Annual Report102
the institution’s overall resilience planning. Additionally, the FFIEC, on behalf of its members also published
several statements to inform institutions of threat trends and risk mitigation steps to address destructive
malware, compromised credentials, and cyber attacks involving extortion.
5.2.5 Accounting Standards
In January 2016, the Financial Accounting Standards Board (FASB) issued an Accounting Standards Update
(ASU) on recognition and measurement of financial instruments and financial liabilities. The amended
standard requires certain equity investments to be measured at fair value, with changes in fair value
recognized in net income. It also simplifies the impairment assessment of equity investments without readily
determinable fair values by requiring a qualitative assessment to identify the impairment. The ASU further
provides that, for a liability measured at fair value under the fair value option for financial instruments,
the portion of the total change in the fair value of the liability resulting from a change in the instrument-
specific credit risk ("own credit risk") will no longer be reflected in net income but, instead, will be presented
separately in other comprehensive income. The amended standard modifies a number of reporting
requirements with regard to the disclosure of fair value of assets and of the methods used to estimate that
fair value, as well as with regard to their presentation on the balance sheet. Finally, the amended standard
requires the separate presentation of financial assets and financial liabilities by measurement category
and form of financial asset in the statement of financial position or the accompanying notes to the
financial statements.
In February 2016, the FASB issued an ASU that improves the financial reporting of leasing activities and
increases transparency and comparability among organizations that engage in such activities. The principal
change the ASU makes to existing U.S. GAAP is the recognition by lessees of lease assets and lease liabilities
on the balance sheet for most of those leases previously classified as operating leases, which have not been
reflected on the balance sheet. The ASU retains a distinction between finance leases and operating leases
for lessees, which is substantially similar to the distinction between capital leases and operating leases in
existing GAAP. As a result, the effect of leases in a lessee's income statement and statement of cash flows is
largely unchanged from current accounting. The accounting applied by a lessor under the ASU generally is
comparable to the treatment under existing GAAP. The FASB’s leases project began as a joint project with
the International Accounting Standards Board (IASB) and many of the ASU’s requirements are the same as
those in the IASB’s January 2016 leasing standard.
5.3 Mortgage Transactions, Housing, and Consumer Protection
5.3.1 Mortgage Transactions and Housing
State banking supervisors, through the Conference of State Bank Supervisors (CSBS), are evaluating
industry feedback on the Proposed Regulatory Prudential Standards for Nonbank Mortgage Servicers that
CSBS published in March 2015. The proposed prudential standards contemplate a set of baseline standards
for all nonbank mortgage servicers and enhanced prudential standards for large, complex firms. Agencies
that are active in supervising or setting standards for nonbank mortgage servicers, including state banking
supervisors, the FHFA, and the CFPB, are engaged in regular efforts to coordinate these supervisory matters.
In October 2015, the CFPB issued a final rule to amend its Regulation C, which implements the Home
Mortgage Disclosure Act (HMDA). Among other measures, the rule revises the tests for determining
which financial institutions and housing-related credit transactions are covered under HMDA, requires
the reporting of new data points identified in the Dodd-Frank Act, and better aligns the requirements of
Regulation C to existing industry data standards, to the extent practicable.
103Regu lato r y Deve lopments and Counc i l Ac t i v i t i es
In January 2016, the FHFA adopted a final rule revising its regulations governing FHLB membership. The
revisions prevent circumvention of the statute’s membership restrictions by ineligible entities using captive
insurers as conduits for FHLB membership by defining “insurance company” to exclude captive insurers.
The final rule did not adopt provisions in the proposed rule which would have required an institution to
hold at least one percent of its assets in home mortgage loans (and ten percent on an ongoing basis where
applicable) as a condition of remaining a member. FHFA concluded in its final rule that, as 98 percent of
current members would likely be in compliance with the proposed requirements, compliance burdens of
these eligibility requirements would outweigh the benefits.
5.3.2 Consumer Protection
Among its authorities, the CFPB may supervise certain nonbank entities, including mortgage companies,
private education lenders, payday lenders, “larger participants” of a market for other consumer financial
products and services, and any nonbank covered person that the CFPB has reasonable cause to determine is
engaging or has engaged in conduct that poses risks to consumers with regard to the offering or provision of
consumer financial products or services. The CFPB has issued a series of larger-participant rulemakings for
specific markets, which establish the scope of the CFPB’s nonbank supervision authority in those markets.
In June 2015, the CFPB published a final rule to define a market for automobile financing and define certain
nonbank covered persons as larger participants in this market. Under the rule, a nonbank covered person is
a larger participant in the market for automobile financing if the entity has at least 10,000 aggregate annual
originations. Automobile financing is defined to include grants of credit for purchasing an automobile,
refinancing of these credit obligations, and the purchasing or acquiring of these obligations. The rule also
defines automobile leases and the purchasing or acquiring of automobile leases as automobile financing but
does not include automobile title lending or the securitization of automobile loans or leases.
In June 2015, the OCC, Federal Reserve, FDIC, CFPB, FHFA, and the NCUA jointly issued a final rule that
(1) established the minimum requirements laid out in Dodd-Frank to be applied by participating states in the
registration and supervision of appraisal management companies (AMCs); (2) required federally regulated
AMCs to meet the same applicable minimum Dodd-Frank requirements (other than registering with the
state); and (3) required the reporting by participating states of certain AMC information to the Appraisal
Subcommittee of the FFIEC.
Starting in April 2015, the FFIEC agencies began incorporating the Interagency Examination Procedures for
the Truth in Lending Act (TILA) and the Real Estate Settlement Procedures Act (RESPA), developed by the
FFIEC, into their respective examination guidance. These procedures reflected certain CFPB amendments
to Regulation X and Z, mostly related to the integrated mortgage disclosure requirements under TILA and
RESPA, which came into effect on October 3, 2015.
5.4 Data Scope, Quality, and Accessibility
5.4.1 Data Scope
Data scope refers to the breadth and depth of information available to supervisors and market participants.
Supervisors need data about diverse markets, institutions, and products to conduct financial stability analysis.
Those data must cover financial activities that cut across regulatory boundaries. Those data also must be
detailed, to enable supervisors to monitor and assess risks. Regulators took several steps in 2015 to expand
the scope of data collections and identify areas that need to be improved.
2 0 1 6 F S O C / / Annual Report104
Treasury Market Data
In July 2015, officials, including the CFTC, Board of Governors of the Federal Reserve System, Federal
Reserve Bank of New York (FRBNY), the SEC, and Treasury, released a joint staff report reporting on
the events surrounding the exceptionally volatile trading that occurred in the U.S. Treasury market on
October 15, 2014. The report noted significant gaps in timely official access to market data for Treasury cash
securities. On January 19, 2016, the Treasury issued an RFI seeking public comment on the evolving structure
of the U.S. Treasury market. The RFI stated that there is a need for more comprehensive official sector access
to data regarding the Treasury market. It sought comment on whether additional reporting of Treasury cash
security market transaction data to the public would also be beneficial and included questions regarding the
appropriate level, timing, and granularity of any such reporting. Given that Treasury market activity crosses
multiple regulatory agencies and market sub-segments, with substantial cross market activity noted between
secondary trading of Treasury benchmarks in the cash market and Treasury futures contracts, the RFI sought
comment on how transmission protocols, data standards, and identifiers might be structured to facilitate
data integration, information sharing, and cooperative data analysis while limiting the associated reporting
burden.
Securities Financing Data Collections
In 2014, the OFR, Federal Reserve System, and SEC launched voluntary data collection pilots in the repo
and securities lending markets. The first data collection pilot covering dealers’ bilateral repo activity took
place in the first quarter of 2015. Participating firms provided snapshots of their bilateral repo books during
three nonconsecutive business days. The second data collection pilot covering securities lending activity was
completed in the first quarter of 2016. Potential permanent bilateral repo data and securities lending data
collections may be considered, and these permanent collections may require firms to use the LEI, as well
as other data standards as they become available. Further, any permanent collections would be designed
in a way that facilitates appropriate and secure sharing of data with other officials, given the role of repo
and securities lending in connecting sub-segments of financial markets. It is anticipated that appropriately
aggregated statistics would be made available to the public.
SEC Asset Management Proposals
On May 20, 2015, the SEC proposed significant new reporting requirements for mutual funds and other
registered investment companies. The proposal would require most registered investment companies to
report monthly portfolio information in a machine-readable format, similar to existing requirements for
MMFs. Under the proposal, the SEC’s current reporting Forms N-Q and N-SAR, which are required to be
filed semi-annually, would be replaced by new monthly reporting on Form N-PORT and annual reporting on
Form N-CEN. Form N-PORT would collect information on fund portfolios, including assets and liabilities,
certain risk measures, and investments, including repo agreements, securities on loan and reinvestment of
cash collateral from securities on loan, and the terms of derivatives contracts. Form N-CEN would collect
census-type information for registered investment companies, such as arrangements with third-party service
providers and information regarding securities lending activities and ETFs. The SEC also proposed to
amend Form ADV to enhance reporting for separately managed accounts by registered investment advisers.
(Separately managed accounts are portfolios of assets or securities directly owned by investors and managed
by professional investment firms.) Additional proposed rules to enhance liquidity disclosure requirements
and derivatives risk management were also proposed by the SEC in 2015, with added reporting requirements
for investment companies on Forms N-PORT and N-CEN.
105Regu lato r y Deve lopments and Counc i l Ac t i v i t i es
5.4.2 Data Quality
LEI
The LEI is a globally sanctioned system that assigns a unique alphanumeric code to individual entities
that engage in financial transactions. Once LEIs are linked to robust organizational hierarchies, this will
allow more robust analyses of data—by entity and across multiple entities—which is critical for regulators
who monitor and analyze risks in the financial system, and for private sector risk managers who seek to
understand and address risks impacting their individual firms.
As of December 31, 2015, more than 410,000 LEIs have been issued in 195 countries by 27 operational issuers
that have been approved to issue LEIs. Approximately half of these have been issued by the sole operational
issuer in the United States, and approximately a quarter have been issued to U.S.-based entities. The total
number of LEIs issued represents a 24 percent increase from 2014 year-end and has been largely driven by the
use of the LEI in derivatives reporting, which is mandated by key regulatory authorities in the United States,
Europe, and other jurisdictions worldwide. LEIs are required to be renewed annually in order to ensure
the integrity of the LEI reference data; the governing bodies of the global LEI system have been working to
increase the rate of compliance with this requirement. The SEC’s proposed new asset management reporting
requirements and the CFPB’s final rule on mortgage lending both include LEI reporting.
Reporting of Derivatives Data
Promoting transparency in derivatives markets continues to be a major priority for global regulators,
including members of the Council. The CFTC and OFR continued to harmonize derivatives data reported to
U.S. SDRs. In December 2015, CFTC staff issued a request for comment on a draft technical specification for
120 swap data elements.
As discussed above, in 2015, the SEC adopted Regulation SBSR—Reporting and Dissemination of Security-
Based Swap Information (see Section 5.2.1).
Further, global regulators, including the CFTC, OFR, and SEC, worked to harmonize derivatives data
reporting across jurisdictions to facilitate global aggregation of these data. Through the Working Group for
Harmonization of Key OTC Derivatives Data Elements of the CPMI-IOSCO, regulators issued consultation
documents on the Unique Product Identifier (UPI), Unique Transaction Identifier (UTI), and the first set
of prioritized data elements (other than UPI and UTI) for global harmonization. The UPI and UTI are
being designed to identify each OTC derivatives product and each transaction involving an OTC derivatives
product which is reported to a trade repository. These codes will help facilitate the communication of data
about OTC derivatives products and transactions in standardized formats and facilitate aggregation and
sharing of OTC derivatives data within and across jurisdictions.
Mortgage Data Standards
In October 2015, the CFPB revised reporting requirements under HMDA. Under the revisions, HMDA data
collection will include a ULI for each mortgage loan application, origination, or purchase reported. The
revisions require an LEI for the reporting entity and the ID of the loan originator assigned by the Nationwide
Multistate Licensing System & Registry. Broader use and adoption of a ULI may allow regulators to follow a
single loan through its lifecycle. The ability to better understand the market players associated with individual
mortgage transactions may help regulators monitor mortgage financing.
2 0 1 6 F S O C / / Annual Report106
5.4.3 Data Accessibility
In 2015, Council member agencies explored best practices in data sharing and reporting efficiency. Several
basic elements of data management were discussed which, if addressed through interagency collaboration,
could better facilitate data sharing and reporting efficiency. These included streamlining the process for
creating data sharing agreements; harmonizing naming conventions and definition of data elements; linking
and sharing metadata (data about the data); and greater upfront coordination on data collection.
The recently released Treasury RFI on Treasury markets sought comment on use of data standards,
transmission, and identifiers to facilitate data sharing and analysis, given the range of regulatory and official
engagement in Treasury markets (see Section 5.4.1). Further, plans for the OFR, Federal Reserve System, and
SEC to undertake consideration of a permanent collection on securities financing would include the use of
data standards and development of a metadata catalog to facilitate the appropriate sharing of those data with
other officials and the public, securely and appropriately.
In December 2015 Congress amended sections of the Commodity Exchange Act and Securities Exchange
Act to remove the indemnification requirements for data sharing by swap and security-based swap data
repositories, which should foster the ability to share these data.
5.5 Council Activities
5.5.1 Determinations Regarding Nonbank Financial Companies
One of the Council’s statutory authorities is to subject a nonbank financial company to supervision by the
Federal Reserve and enhanced prudential standards if the company’s material financial distress—or the
nature, scope, size, scale, concentration, interconnectedness, or mix of its activities—could pose a threat to
U.S. financial stability. As noted above, the Council’s authority to make these determinations is an important
tool to help mitigate potential threats posed by these companies to U.S. financial stability. The Dodd-Frank
Act sets forth the standard for the Council’s determinations regarding nonbank financial companies and
requires the Council to take into account 10 specific considerations when evaluating those companies.
To further inform the public of the Council’s framework and processes for assessing nonbank financial
companies, in 2012 the Council issued a final rule and interpretive guidance following three separate
requests for public comment. In February 2015, the Council adopted supplemental procedures regarding its
nonbank financial company designation procedures that, among other things, increase public transparency
regarding the Council’s actions and create additional opportunities for engagement with companies under
active consideration and with designated companies during the Council’s annual reevaluations of
previous designations.
Under Section 113 of the Dodd-Frank Act, the Council is required at least annually to reevaluate each
previous determination and rescind any determination if the company no longer meets the statutory
standards. In 2015, the Council completed its second annual reevaluations of the determinations regarding
each of AIG, GECC, and Prudential Financial and, in March 2016, completed its first annual reevaluation of
the determination regarding MetLife. The Council did not rescind any of its determinations; however, on
March 30, 2016, the U.S. District Court for the District of Columbia rescinded the Council’s determination
regarding MetLife. The government has filed a notice of appeal. The Council’s supplemental procedures
with respect to nonbank financial company determinations provide the public with additional information
regarding the process for the Council’s annual reevaluations of determinations. As of the date of this report,
three nonbank financial companies are subject to final determinations by the Council, and the Council
has voted not to advance five nonbank financial companies to Stage 3 of the Council’s three-stage process
107Regu lato r y Deve lopments and Counc i l Ac t i v i t i es
for evaluating nonbank financial companies. Since the Council’s last annual report, the Council has not
advanced any nonbank financial companies to Stage 3 or made a proposed or final determination regarding
any nonbank financial company.
5.5.2 Risk Monitoring and Regulatory Coordination
The Dodd-Frank Act charges the Council with responsibility to identify risks to U.S. financial stability,
promote market discipline, and respond to emerging threats to the stability of the U.S. financial system.
The Council also has a duty to facilitate coordination among member agencies and other federal and state
agencies regarding financial services policy and other developments.
The Council regularly examines significant market developments and structural issues within the financial
system. This risk monitoring process is facilitated by the Council’s Systemic Risk Committee (SRC), which
is composed primarily of member agency staff in supervisory, monitoring, examination, and policy roles.
The SRC serves as a forum for member agency staff to identify and analyze potential risks which may extend
beyond the jurisdiction of any one agency.
The OFR plays an important role in the Council’s monitoring activities. In 2015, the OFR reported regularly
to the Council on developments in financial markets and on the development of monitoring tools. In its 2015
Financial Stability Report, the OFR assessed financial system vulnerabilities and resilience. The OFR also
routinely assists and advises the Council on data activities, notably on best practices for data collection and
secure data sharing.
5.5.3 Asset Management Analysis
Building on work begun in 2014, the Council analyzed potential financial stability risks that may arise
from certain asset management products and activities. Based on this work, the Council identified areas of
potential financial stability risk and, in April 2016, publicly issued a written update regarding its views.
5.5.4 Operations of the Council
The Dodd-Frank Act requires the Council to convene no less than quarterly. In 2015, the Council held a
total of nine meetings, including at least one each quarter. The meetings bring Council members together
to discuss and analyze market developments, threats to financial stability, and financial regulatory issues.
Although the Council’s work frequently involves confidential supervisory and sensitive information, the
Council is committed to conducting its business as openly and transparently as practicable. Consistent with
the Council’s transparency policy, the Council opens its meetings to the public whenever possible. The
Council held a public session at three of its meetings in 2015.
Approximately every two weeks, the Council’s Deputies Committee, which is composed of senior
representatives of Council members, convenes to discuss the Council’s agenda and to coordinate and
oversee the work of the SRC and the four other functional committees. The other functional committees
are organized around the Council’s ongoing statutory responsibilities: (1) to consider, make, and review
determinations that nonbank financial companies shall be supervised by the Federal Reserve and be subject
to enhanced prudential standards, pursuant to Section 113 of the Dodd-Frank Act; (2) to conduct analyses,
review, and provide recommendations to the Council related to the designation of FMUs or payment,
clearing, and settlement activities as systemically important, pursuant to Section 804 of the Dodd-Frank Act;
(3) to identify potential gaps in regulation that could pose risks to U.S. financial stability and to support
the Council in consulting and providing recommendations on the development by the Federal Reserve of
heightened prudential standards for nonbank financial companies and large, interconnected BHCs;
2 0 1 6 F S O C / / Annual Report108
(4) to identify risks to, and respond to emerging threats to, the stability of the U.S. financial system; and
(5) to provide support on data-related matters, including identifying data and information gaps, facilitating
information sharing and coordination among members, and providing direction to the OFR. In 2015, the
Council adopted charters for the Nonbank Financial Companies Designations Committee; the Financial
Market Utilities and Payment, Clearing and Settlement Activities Committee; the Regulation and Resolution
Committee; the Systemic Risk Committee; and the Data Committee.
In 2015, the Council adopted its sixth budget.
5.5.5 Section 119 of the Dodd-Frank Act
Section 119 of the Dodd-Frank Act provides that the Council may issue non-binding recommendations to
member agencies on disputes about the agencies’ respective jurisdiction over a particular BHC, nonbank
financial company, or financial activity or product. (Certain consumer protection matters, for which another
dispute mechanism is provided under Title X of the Act, are excluded.) To date, no member agency has
approached the Council to resolve a dispute under Section 119.
109Potent ia l Emerg ing Threats and Vu lne rab i l i t i es
6.1 Ongoing Structural Vulnerabilities
Previous versions of the Council’s annual report have identified a number of structural vulnerabilities
in the U.S. financial system. These include risk-taking incentives of large, complex, interconnected
financial institutions; concentration of activities and exposures in CCPs; reliance on less stable,
short-term funding markets; continued use of reference rates which are not sufficiently derived from
observable transactions and which may be susceptible to manipulation; and challenges to data quality,
collection, and sharing. While regulators and market participants have made progress in mitigating
the risks posed by these vulnerabilities, the vulnerabilities themselves remain. Going forward, these
vulnerabilities will need to be closely monitored, and additional action by regulators and market
participants is needed.
Risk-Taking Incentives of Large, Complex, Interconnected Financial Institutions
Since the financial crisis, the largest BHCs have reduced leverage and become better prepared to
manage draws on liquidity, significantly improving their resilience. Much of this improvement can
be attributed to implementation of the Dodd-Frank Act and other financial regulatory reforms. In
addition, the largest BHCs that operate in the United States continue to be subject to both company-
run and supervisory stress testing as well. Over the last year, financial regulators have continued to work
to address risks posed by large, complex, interconnected financial institutions. The Federal Reserve
finalized a rule requiring that G-SIBs increase their holdings of common equity tier 1 capital relative to
RWAs and proposed standards for mandatory long-term debt and total loss-absorbing capacity for these
firms (see Section 5.1.1).
Meaningful steps have been made in recovery and resolution planning as well. The Dodd-Frank Act
requires certain companies to periodically submit resolution plans to the Federal Reserve and FDIC.
Each plan must describe the company's strategy for rapid and orderly resolution under the U.S.
Bankruptcy Code in the event of material financial distress or failure of the company. The Federal
Reserve and FDIC continue to implement this authority and provide guidance to these firms. Another
area of progress is the November 2015 relaunch of the ISDA Resolution Stay Protocol, which now covers
securities financing transactions. These stays are intended to give regulators time to facilitate an orderly
resolution of a troubled bank (see Section 5.1.3).
In addition to structural vulnerabilities, cyclical factors can further exacerbate risks for such firms.
Though the largest BHCs are much safer than they were at the outset of the financial crisis, these
institutions have faced some challenges in the current economic environment. The relatively flat yield
curve has continued to put pressure on large BHCs’ NIMs (Chart 4.11.4) and credit risk associated
with both syndicated lending to energy sector firms (see Box F) and CRE lending (see Section 4.5.3)
has grown.
6 Potential Emerging Threats and Vulnerabilities
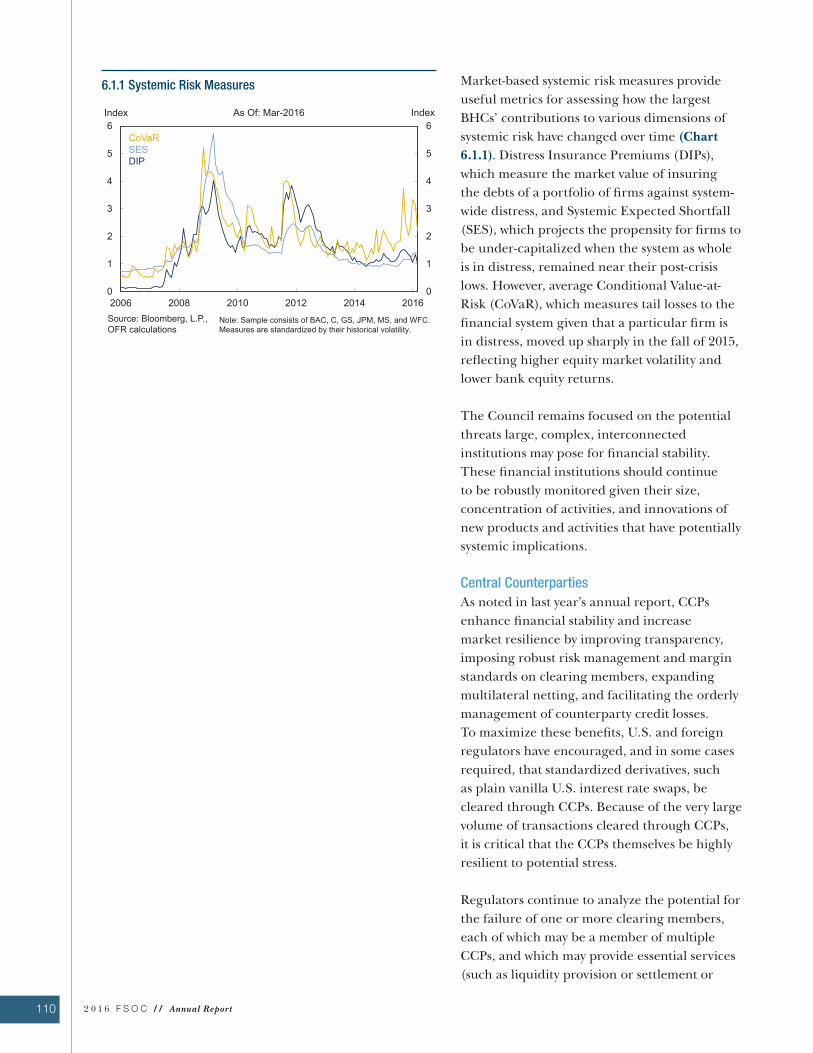
110 2 0 1 6 F S O C / / Annual Report
6.1.1 Systemic Risk Measures Market-based systemic risk measures provide
useful metrics for assessing how the largest
BHCs’ contributions to various dimensions of
systemic risk have changed over time (Chart
6.1.1). Distress Insurance Premiums (DIPs),
which measure the market value of insuring
the debts of a portfolio of firms against system-
wide distress, and Systemic Expected Shortfall
(SES), which projects the propensity for firms to
be under-capitalized when the system as whole
is in distress, remained near their post-crisis
lows. However, average Conditional Value-at-
Risk (CoVaR), which measures tail losses to the
financial system given that a particular firm is
in distress, moved up sharply in the fall of 2015,
reflecting higher equity market volatility and
lower bank equity returns.
The Council remains focused on the potential
threats large, complex, interconnected
institutions may pose for financial stability.
These financial institutions should continue
to be robustly monitored given their size,
concentration of activities, and innovations of
new products and activities that have potentially
systemic implications.
Central Counterparties
As noted in last year’s annual report, CCPs
enhance financial stability and increase
market resilience by improving transparency,
imposing robust risk management and margin
standards on clearing members, expanding
multilateral netting, and facilitating the orderly
management of counterparty credit losses.
To maximize these benefits, U.S. and foreign
regulators have encouraged, and in some cases
required, that standardized derivatives, such
as plain vanilla U.S. interest rate swaps, be
cleared through CCPs. Because of the very large
volume of transactions cleared through CCPs,
it is critical that the CCPs themselves be highly
resilient to potential stress.
Regulators continue to analyze the potential for
the failure of one or more clearing members,
each of which may be a member of multiple
CCPs, and which may provide essential services
(such as liquidity provision or settlement or
111Potent ia l Emerg ing Threats and Vu lne rab i l i t i es
custody services) to multiple CCPs, to exacerbate the transmission of stress among financial institutions
or markets. Such analysis will help regulators better understand the extent and implications of such
interconnections.
Given CCPs’ importance to the global financial system, CCPs must maintain credible plans for recovery and
wind-down. U.S. regulators have begun to review recovery plans of designated CCPs. It will be important for
authorities to further analyze the potential procyclical effects of certain recovery tools, as well as examine the
ability of each CCP to operate its own default management processes in an environment in which other CCPs
or market participants may also be under stress.
Regulators continue to analyze a range of possible risks arising from or related to the potential failure of
one or more clearing members, each of which may be a member of multiple CCPs, and may provide essential
services (such as liquidity provision or settlement or custody services) to multiple CCPs. These include
the extent to which such failures may transmit stress among financial institutions or markets and whether
there are transferees that will accept transfer of the positions of non-defaulting customers of the defaulting
member(s), reducing the likelihood of a liquidation of customer positions that could potentially exacerbate
stressful conditions. Such analysis will help regulators to better understand the extent and implications of
interconnections among members, CCP resilience, and access to clearing services and help ensure the success
of reforms to mandate greater use of central clearing.
Internationally, greater implementation of the risk management standards in the CPMI-IOSCO PFMI across
regulatory regimes is critical to enhancing the safety and efficiency of CCPs and financial stability more
broadly. Material differences between jurisdictions’ standards could potentially result in regulatory arbitrage
by market participants or lead to an unlevel playing field between CCPs. U.S. regulators have substantially
implemented the G-20’s central clearing mandate and have implemented standards related to CCP risk
management and resilience. Domestic and foreign regulators should continue to monitor implementation of
the PFMI by systemically important CCPs globally. Further, all regulators should continue work to promote
robust standards for CCP resilience both domestically and internationally.
Recent rules establishing minimum margin requirements for non-cleared swaps were a positive step in
improving the resilience of the financial system. These rules reduce counterparty risk for non-cleared swaps
and provide an incentive to move non-cleared swaps to CCPs. As these new rules are implemented, regulators
will need to continue to closely supervise CCPs’ processes for approving new products for clearing.
Short-Term Wholesale Funding
Repo MarketsAs noted by the Council in prior years, the tri-party repo market has seen a significant reduction in
counterparty risk exposure. More work is needed, however, to extend post-crisis reforms to the settlement of
GCF repo transactions. In addition, the risk of fire sales of collateral by creditors of a defaulted broker-dealer
remains a significant risk to financial stability. Lastly, there are important data gaps that need to be filled to
assist policymakers’ understanding of the aggregate repo market, including the interdependencies of various
firms and market participants. In particular, greater visibility into many key characteristics of the bilateral
repo market’s size, composition, concentration, pricing, and risk profile would greatly assist regulators and
supervisors in assessing potential areas of concern.
2 0 1 6 F S O C / / Annual Report112
MMFs and STIFsMMFs and other cash management vehicles—particularly those that offer a stable NAV—have the potential to
suffer from runs, which could undermine investor confidence, trigger redemptions across funds, and impair
access to credit in short-term lending markets. In recent years, the SEC and OCC have adopted important
reforms of MMFs and STIFs that seek to address these risks. Regulators are monitoring MMF reforms as they
are implemented, and it is critical that they continue to do so in order to understand the extent to which any
material risks may remain. Regulators should also continue to examine whether regulatory gaps exist for
other cash management vehicles, as well as whether additional data is needed to better understand such gaps
and the risks that they pose.
Reliance on Reference Rates
Regulators, benchmark administrators, and market participants made continued progress over the past year
in strengthening the governance of interest rate benchmarks and developing alternative reference rates.
Post-crisis reforms have improved the resilience of LIBOR by subjecting the rate and its administrator to
more direct oversight, eliminating many little-used currency/tenor pairings, and embargoing the submissions
of individual banks for a three-month period. These and other ongoing reforms have reduced some of the
incentives for market participants to attempt to manipulate the benchmark. However, because the volume
of unsecured wholesale lending has declined markedly, it is difficult to firmly root LIBOR submissions
in a sufficient number of observable transactions. This development makes LIBOR more susceptible to
manipulation, and poses the risk that it may not be possible to publish the benchmark on an ongoing basis if
transactions decline further. Therefore, continued vigilance by regulators is necessary to ensure that newly
created governance structures, oversight mechanisms, and methodology changes are effective.
Because of these concerns, the ARRC has focused on identifying alternative near risk-free reference rates that
will more accurately meet the needs of some market participants, particularly for contracts that are unrelated
to measures of bank credit. The transition to new benchmarks must be carefully managed to minimize
market confidence risks that could arise.
Data Gaps and Challenges to Data Quality, Collection, and Sharing
The financial crisis exposed gaps in the coverage, quality, and accessibility of data available to regulators.
While Council members have made progress in filling some of these gaps, much work remains. These gaps,
if left unaddressed, can obscure an emerging threat to financial stability and impair both regulators and
market participants’ ability to respond effectively. In particular, important gaps remain in wholesale
funding markets, asset management activities, and banking and market making taking place outside the
regulatory perimeter.
Regulators face challenges monitoring and understanding developments across financial markets, as each
agency’s data, information, and analysis is focused primarily on the entity types or market segments for
which it has regulatory purview. As markets continually evolve and financial transactions cross regulatory
boundaries, data sharing and analysis among regulators, both at home and abroad, remains imperative.
113Potent ia l Emerg ing Threats and Vu lne rab i l i t i es
Regulators need better mechanisms to quickly share, link, and integrate data which cut across different types
of institutions and markets. International cooperation on data standards and data sharing is also essential to
reduce variations in data collections across national boundaries, and authorities have still not yet achieved
the goal of cross-border aggregation of derivatives data. Wider adoption of LEI will also facilitate data
accessibility, sharing, and analysis, and enhanced entity hierarchy data under LEI (i.e., data on the parents
and subsidiaries of legal entities) would facilitate its role in enabling authorities and the public to develop a
more complete picture of complex financial institution's structures.
6.2 Cybersecurity: Vulnerabilities to Attacks on Financial Services
Malicious actors continue to attempt to exploit cyber-related vulnerabilities for a variety of purposes, whether
at a financial firm or the government, such as the 2014 intrusion into the Office of Personnel Management.
Financial firms have made significant investments in cybersecurity over the past several years, with many
maintaining cutting-edge cybersecurity capabilities. These investments have been critical to reducing both
firm-specific and system-wide cybersecurity vulnerabilities within companies and across the industry. Along
with preparing for more routine incidents, companies should prepare for worst-case scenarios, including
those that may be highly unlikely but extremely costly.
Worst-case scenario incidents include the threat posed by destructive malware. For example, the widely-
reported 2014 cyber-attack against Sony Pictures Entertainment has highlighted the potential impact of a
significant malware attack and serves as a reminder of the potential implications of a significant cybersecurity
incident for companies. This attack destroyed systems and wiped out data, along with the public posting of
unreleased movies and confidential emails in order to damage and shame a U.S. company and its personnel.
Unfortunately, Sony is not the only organization to experience cyber-attacks which attempt to destroy or
degrade systems. At the same time the Sony attack was gripping the United States, Germany’s Federal Office
for Information Security released a report describing a cyberattack against a German steel mill which
resulted in catastrophic physical damage to equipment. Media reports indicate that in 2013, banks and
television stations in South Korea experienced a significant cyber-attack which froze computer terminals, and
in 2012, Saudi Aramco experienced a destructive malware attack that destroyed computers. Media reporting
also cited a February 2014 destructive malware incident against Las Vegas Sands Corporation which disrupted
business operations.
Destructive malware attacks represent a unique threat in that they are both infrequent and yet potentially
catastrophic. Financial institutions, working with government agencies, should understand this risk and
take steps to improve cybersecurity, engage in information sharing efforts, and prepare to respond to, and
recover from, a major incident. These preparations should include consideration of the technical impacts,
appropriate response mechanisms, business implications, and possible effect on the financial system.
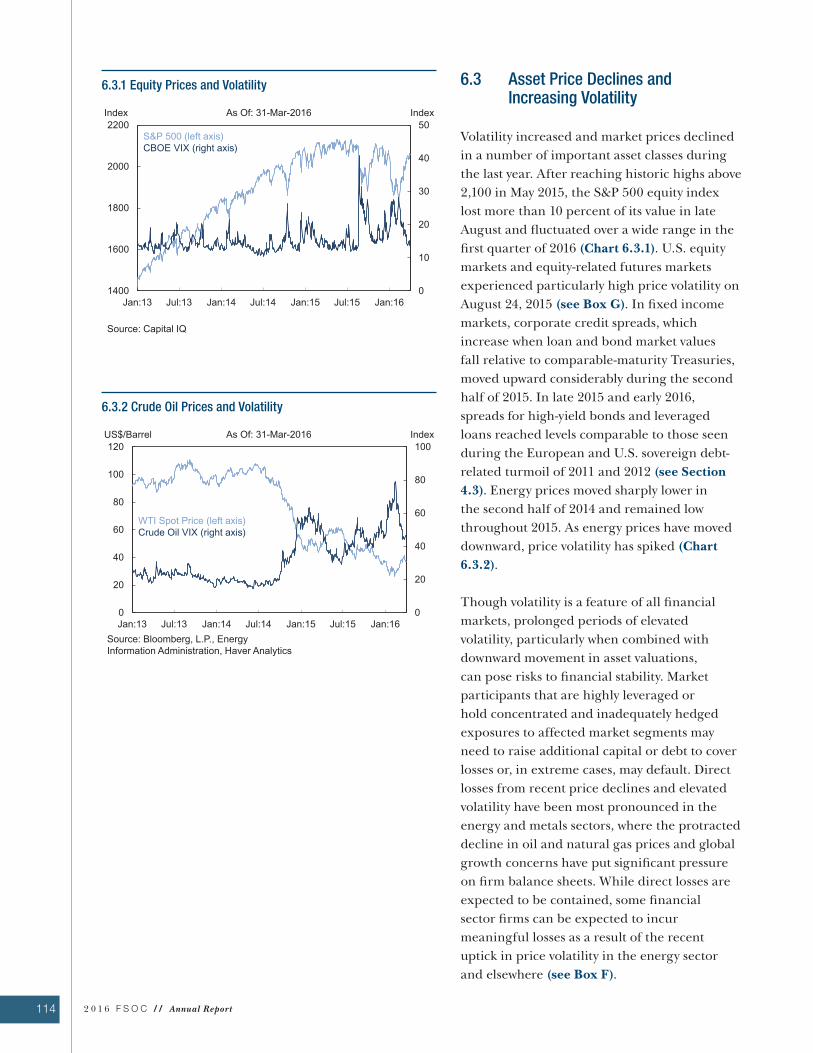
114 2 0 1 6 F S O C / / Annual Report
6.3.2 Crude Oil Prices and Volatility
6.3.1 Equity Prices and Volatility 6.3 Asset Price Declines and Increasing Volatility
Volatility increased and market prices declined
in a number of important asset classes during
the last year. After reaching historic highs above
2,100 in May 2015, the S&P 500 equity index
lost more than 10 percent of its value in late
August and fluctuated over a wide range in the
first quarter of 2016 (Chart 6.3.1). U.S. equity
markets and equity-related futures markets
experienced particularly high price volatility on
August 24, 2015 (see Box G). In fixed income
markets, corporate credit spreads, which
increase when loan and bond market values
fall relative to comparable-maturity Treasuries,
moved upward considerably during the second
half of 2015. In late 2015 and early 2016,
spreads for high-yield bonds and leveraged
loans reached levels comparable to those seen
during the European and U.S. sovereign debt-
related turmoil of 2011 and 2012 (see Section
4.3). Energy prices moved sharply lower in
the second half of 2014 and remained low
throughout 2015. As energy prices have moved
downward, price volatility has spiked (Chart
6.3.2).
Though volatility is a feature of all financial
markets, prolonged periods of elevated
volatility, particularly when combined with
downward movement in asset valuations,
can pose risks to financial stability. Market
participants that are highly leveraged or
hold concentrated and inadequately hedged
exposures to affected market segments may
need to raise additional capital or debt to cover
losses or, in extreme cases, may default. Direct
losses from recent price declines and elevated
volatility have been most pronounced in the
energy and metals sectors, where the protracted
decline in oil and natural gas prices and global
growth concerns have put significant pressure
on firm balance sheets. While direct losses are
expected to be contained, some financial
sector firms can be expected to incur
meaningful losses as a result of the recent
uptick in price volatility in the energy sector
and elsewhere (see Box F).

115Potent ia l Emerg ing Threats and Vu lne rab i l i t i es
Potentially more concerning is the risk that
reasonable and prudent actions taken by
individual firms or market infrastructures
to protect themselves from the effects of
anticipated future asset price changes could,
in aggregate, contribute to volatility and
further declines in prices. There are several
mechanisms through which such adverse
feedback loops can arise. In collateralized
lending arrangements, haircuts are often
higher when there is greater uncertainty
about the future value of the collateral. Larger
haircuts effectively increase the cost of holding
collateral, potentially putting downward
pressure on collateral valuations. Similarly,
initial margin requirements for derivatives
trades are typically tied to estimates of the
current volatility of the transactions in question.
As volatility increases and margin requirements
grow, market participants must either fund
additional collateral or limit their derivative
trading. More broadly, concerns about the
elevated credit risk of firms adversely affected
by asset market price volatility can induce
lenders to curtail their exposures to such firms,
resulting in higher funding costs. Higher
funding costs, in turn, make it more difficult for
borrowers to weather the effects of unfavorable
asset price movements, as some marginal firms
are unable to refinance existing debt as interest
expenses exceed the levels required
for solvency.
The likelihood that appropriate risk-
management tools might contribute to
adverse feedback loops depends, to a great
extent, on whether sufficiently prudent
standards are applied prior to the onset of
heightened volatility. Employing conservative
risk-management practices during times of
low volatility helps to ensure that market
participants have sufficient resources in place
to manage volatility when it arrives, obviating
the need to dramatically curtail activity during
times of stress. The Federal Reserve’s CCAR
BHC stress tests use more severe scenarios
about shocks to the unemployment rate
and other macroeconomic conditions when
currently prevailing values of those variables
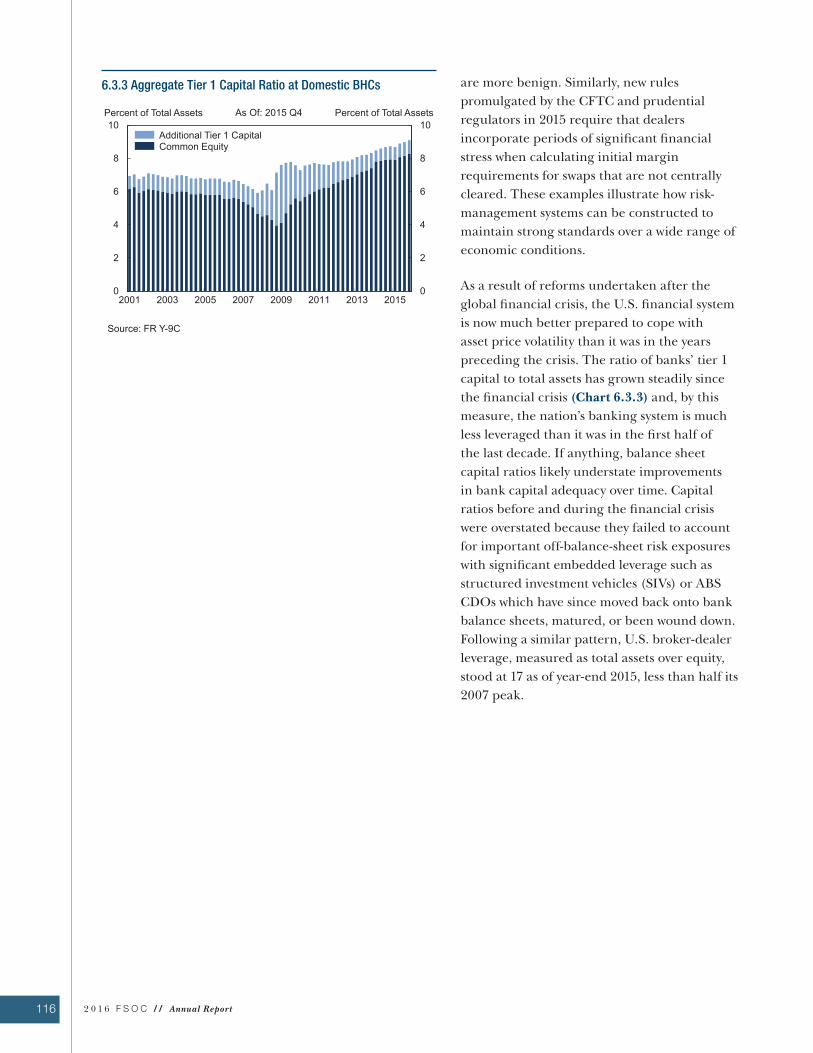
116 2 0 1 6 F S O C / / Annual Report
6.3.3 Aggregate Tier 1 Capital Ratio at Domestic BHCs are more benign. Similarly, new rules
promulgated by the CFTC and prudential
regulators in 2015 require that dealers
incorporate periods of significant financial
stress when calculating initial margin
requirements for swaps that are not centrally
cleared. These examples illustrate how risk-
management systems can be constructed to
maintain strong standards over a wide range of
economic conditions.
As a result of reforms undertaken after the
global financial crisis, the U.S. financial system
is now much better prepared to cope with
asset price volatility than it was in the years
preceding the crisis. The ratio of banks’ tier 1
capital to total assets has grown steadily since
the financial crisis (Chart 6.3.3) and, by this
measure, the nation’s banking system is much
less leveraged than it was in the first half of
the last decade. If anything, balance sheet
capital ratios likely understate improvements
in bank capital adequacy over time. Capital
ratios before and during the financial crisis
were overstated because they failed to account
for important off-balance-sheet risk exposures
with significant embedded leverage such as
structured investment vehicles (SIVs) or ABS
CDOs which have since moved back onto bank
balance sheets, matured, or been wound down.
Following a similar pattern, U.S. broker-dealer
leverage, measured as total assets over equity,
stood at 17 as of year-end 2015, less than half its
2007 peak.
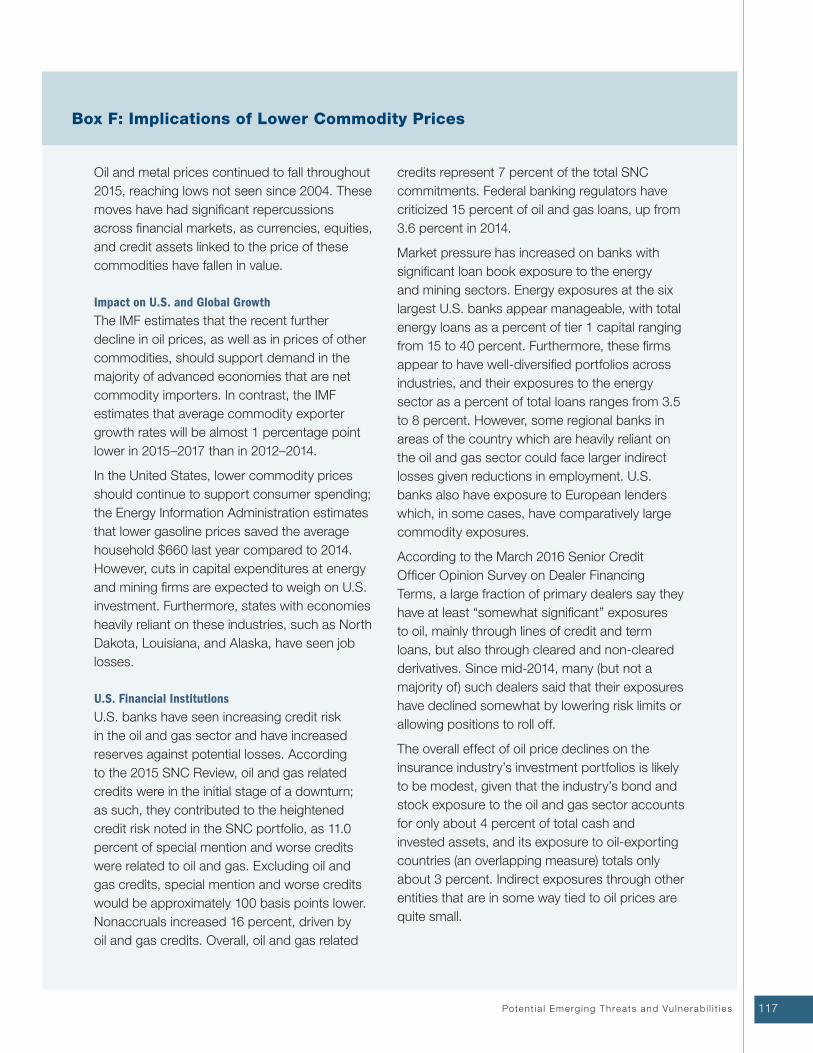
117Potent ia l Emerg ing Threats and Vu lne rab i l i t i es
Oil and metal prices continued to fall throughout
2015, reaching lows not seen since 2004. These
moves have had significant repercussions
across financial markets, as currencies, equities,
and credit assets linked to the price of these
commodities have fallen in value.
Impact on U.S. and Global Growth
The IMF estimates that the recent further
decline in oil prices, as well as in prices of other
commodities, should support demand in the
majority of advanced economies that are net
commodity importers. In contrast, the IMF
estimates that average commodity exporter
growth rates will be almost 1 percentage point
lower in 2015–2017 than in 2012–2014.
In the United States, lower commodity prices
should continue to support consumer spending;
the Energy Information Administration estimates
that lower gasoline prices saved the average
household $660 last year compared to 2014.
However, cuts in capital expenditures at energy
and mining firms are expected to weigh on U.S.
investment. Furthermore, states with economies
heavily reliant on these industries, such as North
Dakota, Louisiana, and Alaska, have seen job
losses.
U.S. Financial Institutions
U.S. banks have seen increasing credit risk
in the oil and gas sector and have increased
reserves against potential losses. According
to the 2015 SNC Review, oil and gas related
credits were in the initial stage of a downturn;
as such, they contributed to the heightened
credit risk noted in the SNC portfolio, as 11.0
percent of special mention and worse credits
were related to oil and gas. Excluding oil and
gas credits, special mention and worse credits
would be approximately 100 basis points lower.
Nonaccruals increased 16 percent, driven by
oil and gas credits. Overall, oil and gas related
credits represent 7 percent of the total SNC
commitments. Federal banking regulators have
criticized 15 percent of oil and gas loans, up from
3.6 percent in 2014.
Market pressure has increased on banks with
significant loan book exposure to the energy
and mining sectors. Energy exposures at the six
largest U.S. banks appear manageable, with total
energy loans as a percent of tier 1 capital ranging
from 15 to 40 percent. Furthermore, these firms
appear to have well-diversified portfolios across
industries, and their exposures to the energy
sector as a percent of total loans ranges from 3.5
to 8 percent. However, some regional banks in
areas of the country which are heavily reliant on
the oil and gas sector could face larger indirect
losses given reductions in employment. U.S.
banks also have exposure to European lenders
which, in some cases, have comparatively large
commodity exposures.
According to the March 2016 Senior Credit
Officer Opinion Survey on Dealer Financing
Terms, a large fraction of primary dealers say they
have at least “somewhat significant” exposures
to oil, mainly through lines of credit and term
loans, but also through cleared and non-cleared
derivatives. Since mid-2014, many (but not a
majority of) such dealers said that their exposures
have declined somewhat by lowering risk limits or
allowing positions to roll off.
The overall effect of oil price declines on the
insurance industry’s investment portfolios is likely
to be modest, given that the industry’s bond and
stock exposure to the oil and gas sector accounts
for only about 4 percent of total cash and
invested assets, and its exposure to oil-exporting
countries (an overlapping measure) totals only
about 3 percent. Indirect exposures through other
entities that are in some way tied to oil prices are
quite small.
Box F: Implications of Lower Commodity Prices
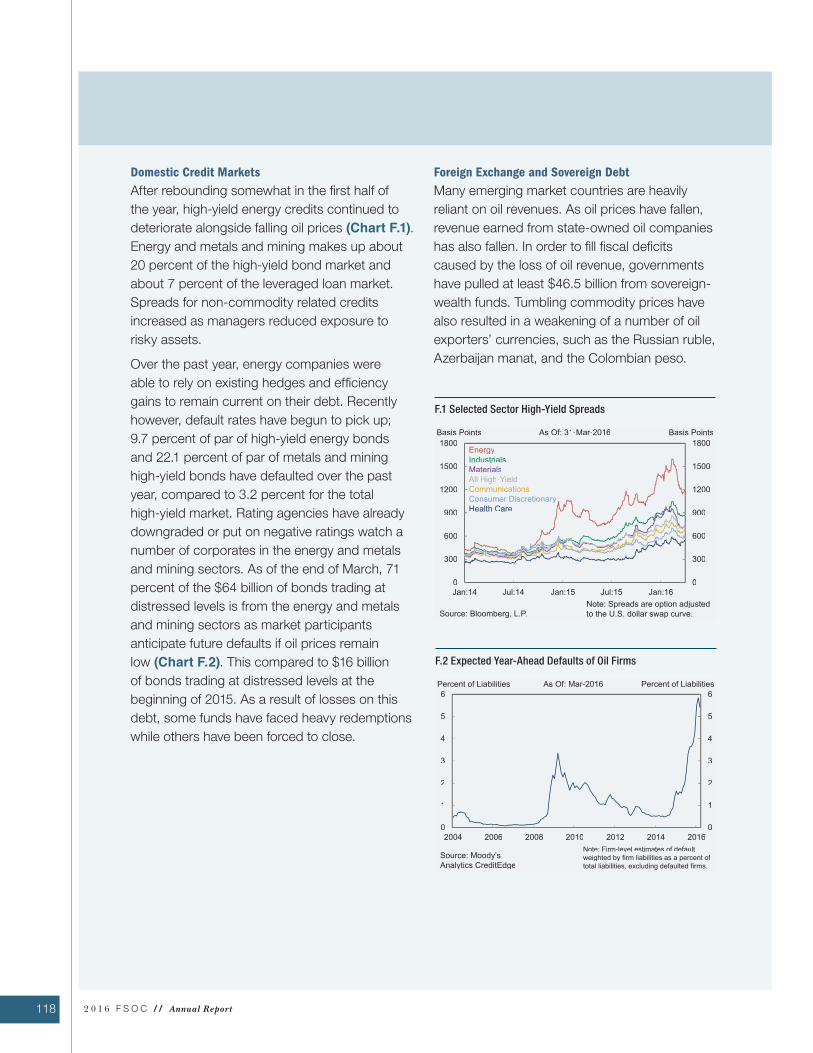
2 0 1 6 F S O C / / Annual Report118
Domestic Credit Markets
After rebounding somewhat in the first half of
the year, high-yield energy credits continued to
deteriorate alongside falling oil prices (Chart F.1). Energy and metals and mining makes up about
20 percent of the high-yield bond market and
about 7 percent of the leveraged loan market.
Spreads for non-commodity related credits
increased as managers reduced exposure to
risky assets.
Over the past year, energy companies were
able to rely on existing hedges and efficiency
gains to remain current on their debt. Recently
however, default rates have begun to pick up;
9.7 percent of par of high-yield energy bonds
and 22.1 percent of par of metals and mining
high-yield bonds have defaulted over the past
year, compared to 3.2 percent for the total
high-yield market. Rating agencies have already
downgraded or put on negative ratings watch a
number of corporates in the energy and metals
and mining sectors. As of the end of March, 71
percent of the $64 billion of bonds trading at
distressed levels is from the energy and metals
and mining sectors as market participants
anticipate future defaults if oil prices remain
low (Chart F.2). This compared to $16 billion
of bonds trading at distressed levels at the
beginning of 2015. As a result of losses on this
debt, some funds have faced heavy redemptions
while others have been forced to close.
Foreign Exchange and Sovereign Debt
Many emerging market countries are heavily
reliant on oil revenues. As oil prices have fallen,
revenue earned from state-owned oil companies
has also fallen. In order to fill fiscal deficits
caused by the loss of oil revenue, governments
have pulled at least $46.5 billion from sovereign-
wealth funds. Tumbling commodity prices have
also resulted in a weakening of a number of oil
exporters’ currencies, such as the Russian ruble,
Azerbaijan manat, and the Colombian peso.
F.1 Selected Sector High-Yield Spreads
F.2 Expected Year-Ahead Defaults of Oil Firms
119Potent ia l Emerg ing Threats and Vu lne rab i l i t i es
On Monday, August 24, 2015, the U.S. equity markets
and equity-related futures markets experienced
unusual price volatility, particularly during the period
surrounding the 9:30 a.m. opening of regular trading
hours. As indicated in a SEC staff research note, in
contrast to the Flash Crash on May 6, 2010, broad
market prices did not “flash crash”—defined as a
sudden and extreme price decline that is unexplained
by the arrival of new information and soon reversed.
Prior to 9:30 on August 24, broad market prices
already had declined by 5 percent, and the most
active equity-related futures products had reached
their limit down levels. At 9:30, the equity markets
opened for regular trading hours at broad market
price levels that were consistent with the pre-9:30
trading. The broad market then absorbed an intense
surge in market-order selling (with volume as much as
4 to 8 times higher in many ETPs and other securities)
with a relatively small price decline of 2 percent and
soon recovered.
SEC staff identified some significant issues that
occurred on August 24. First, in the opening minutes
of trading, a significant minority of ETPs experienced
what could be described as a breakdown in
arbitrage—they traded at substantial discounts to
the underlying indexes they were designed to track.
Second, many of these ETPs which experienced
extreme volatility also triggered a large number of
trading halts under the Limit Up/Limit Down (LULD)
Plan. Often, these discounts occurred because
trading in the ETP halted while trading continued
in the underlying index; pre-halt ETP prices then
diverged significantly from the more recently updated
index price. These trading halts helped prevent the
irrational prices that occurred during the 2010 Flash
Crash (such as executions at prices of one penny).
After the halts, the ETPs did not resume trading in
an orderly fashion, but traded in ways that often
triggered additional LULD halts. More than 80 percent
of the LULD halts on August 24 occurred in ETPs,
and most of these were repeat halts in the same
symbols and occurred when prices were recovering
upward.
Notably, although a significant minority of ETPs
experienced severe volatility and multiple LULD halts
on August 24, the majority of ETPs experienced levels
of volatility consistent with broad market prices, and
80 percent of ETPs did not experience a single
LULD halt.
Box G: Equity Market Volatility on August 24, 2015
2 0 1 6 F S O C / / Annual Report120
6.4 Risk-Taking in a Low-Yield Environment
Last year, the Council detailed potential vulnerabilities associated with increased risk-taking stemming from
a low-yield environment. Over the past 12 months, global long-term interest rates have continued to fall
further.
The slope of the U.S. Treasury yield curve, as measured by the spread between 10-year and 2-year Treasury
yields, is now at its flattest point since the financial crisis, stressing NIMs at banks, credit unions, and broker-
dealers. In addition, the low-rate environment may incentivize insurance companies to boost returns by
taking on additional risk. Prolonged periods of low interest rates also reduce the benefits of certain insurance
and annuity products, adversely affecting the consumer demand for these products and dampening new
sales.
In this low-yield environment, concerns about slowing global growth and falling commodities prices have also
brought significant stresses to certain credit markets, which have had a strong impact both on the pricing
of risk and the demand for risky assets. Risk-taking in asset classes which have experienced fundamental
headwinds, notably U.S. high-yield corporate credit and emerging markets bonds, appears to have moderated
over the last year, and these asset classes have experienced mutual fund outflows. In contrast, asset classes
which have not seen such stresses, such as CRE and investment grade corporate bonds, have continued to see
high levels of debt issuance and relatively strong pricing.
As detailed in Section 4.3, banking regulators continue to note high and increasing credit risk in syndicated
lending. However, underwriting standards tightened in 4Q15, and leverage ratios in 2015 on large corporate
LBO loans ticked down to 5.7x debt/EBITDA from 5.8x in 2014. Market participants cite regulatory guidance
targeting loans with 6.0x or greater leverage as a key driver. Investors are backing away from lower-rated
credits. Spreads between BB and B rated leverage loans widened from 150 basis points in June to 335 basis
points in mid-February. Emerging markets debt has seen a similar dynamic, as issuance has fallen off and
spreads have moved wider as fiscal and current account balances have deteriorated in major emerging market
countries.
By contrast, U.S. investment grade debt saw record issuance and moderate spreads, suggesting that
corporations were taking advantage of the cheap financing offered by the low-interest rate environment.
Leverage in investment grade markets is now back at 2007 levels. CRE has continued to see prices climb and
capitalization rates fall. However, the spread of capitalization rates over Treasuries has remained relatively
constant over the past two years (Chart 4.5.11), suggesting that this price increase may be driven, at least in
part, by the fall in long-term interest rates.
In December 2015, the Federal Reserve, FDIC, and OCC jointly issued a statement reinforcing existing
regulatory guidance on prudent risk management practices for CRE lending. The statement affirms that
financial institutions should maintain underwriting discipline and exercise prudent risk-management
practices to identify, measure, monitor, and manage the risks arising from CRE lending. Survey respondents
to the SLOOS of January 2016 indicated that lending standards for CRE loans of all types tightened during
the fourth quarter of 2015.
121Potent ia l Emerg ing Threats and Vu lne rab i l i t i es
6.5 Changes in Financial Market Structure and Implications for Financial Stability
Historically, market making activities have been characterized by strong economies of scale owing to the
high cost and limited availability of capital and the specialized personnel needed to expedite timely and
efficient price discovery, clearing, and settlement in various markets. These types of activities were typically
performed by broker-dealers affiliated with large banks. While such dealers continue to be intermediaries
in many markets, they are by no means the only market participants able to supply liquidity. Asset managers,
proprietary trading firms, hedge funds, and other market participants operating on exchanges or other
trade-matching platforms add liquidity by trading into or out of assets when prices move away from
fundamentals or arbitrage opportunities arise. Over the years, increasingly automated trading infrastructures
have enabled market participants to implement largely autonomous trading strategies determined by
computer algorithms. High-frequency traders deploy algorithms which depend on very high-speed
communication between their own systems and trade-matching platforms. High-frequency traders, whose
trading systems are often physically collocated with automated trade-matching engines, have the capacity to
execute trades far more quickly than any process which depends on human input.
Algorithmic, high-frequency, and other forms of automated trading strategies are estimated to account for
over two-thirds of trading volume in U.S. cash equities and futures markets, between 60 and 80 percent of
trading volume in dollar-euro and dollar-yen FX interdealer markets, and over half of trading volume in
the on-the-run U.S. Treasury interdealer market. Participation by alternative liquidity providers deploying
automated trading strategies has been abetted by a proliferation of new electronic trading platforms—some
sponsored by dealers—which provide efficient and flexible mechanisms for requesting quotes and matching
trades. As increasing volumes of swaps trading have moved to SEFs, large asset managers have significantly
expanded the scale and frequency of their swaps trading. Automated trading firms, which account for a
substantial share of trading in cash equities and futures markets, are also becoming important providers of
liquidity in certain fixed income markets, namely interest rate products.
While there is a great degree of substitution for similar risks in the interest rate complex, the same cannot be
said for corporate bonds. The corporate bond market has always been fairly fragmented among various types
of dealers, both large and small. In recent years, with the proliferation of various sizes and types of corporate
debt issuances, this fragmentation has only grown. Because corporate bonds are more heterogeneous in their
risk characteristics, they are less amenable to the kind of highly automated, high-frequency trading that has
become important in other more homogenous markets like equities. In recent years, new e-trading platforms
have facilitated greater non-dealer access to the most actively traded segments of the corporate bond market,
though trade sizes on these platforms are relatively small. It is not apparent, especially given the sharp rise in
volatility in credit markets over the past few months, that liquidity or market functioning for corporate bonds
has been significantly impaired. The Council will continue to monitor these markets for indications of any
potential shift in these conditions.
Interest Rate Complex: Different Venues and Products, Similar Risks
The interest rate complex is large, exceeding an estimated $150 trillion in notional value, and involves many
different products that are often used interchangeably by market participants to express a view on future
interest rates or as a hedge against interest rate risk. Traded products include: Treasury securities, futures on
Treasury securities, Eurodollar futures, options on these futures, interest rate swaps, swaptions (options on
interest rate swaps), and MBS. Treasury securities are often used as a substitute for Treasury futures and vice
versa. The same can be said for Eurodollar futures and interest rate swaps, as well as related options on each.
Because of the homogenous and highly correlated risks associated with each of these products, there is a high
degree of interdependency in the pricing and trading of interest rate products. Differences in the extent of
automation, regulatory standards and associated barriers to access, and transaction costs have historically

2 0 1 6 F S O C / / Annual Report122
led to fragmented markets in which some market segments primarily involved dealers using manual methods
and other segments involved a high proportion of non-dealer intermediaries using automated systems. Over
time, the lines between many of these market segments have become blurred, however, leading to mixed
markets in which dealers and non-dealers deploying both manual and automated techniques interact directly.
The transformation of these markets over time, resulting from technology, regulation, and competitive and
cyclical factors, has enabled a greater degree of price discovery, broader participation, and reduction of
trading and financing costs for investors and issuers. However, there may be risks and vulnerabilities posed by
some of these developments.
Potential Risks and Vulnerabilities
The evolving structure of U.S. financial markets demonstrates the ability of markets to adapt to changing
technology and an evolving regulatory landscape. Changes in liquidity dynamics pose a number of important
considerations (see Box H). Financial markets have generally functioned well as significant changes in market
structure have taken place, but the shift in liquidity provision away from traditional market-makers may pose
risks.
First, financial regulation is well adapted to an environment in which liquidity primarily flows through large
dealers who are typically subject to prudential standards, ongoing supervision, and a range of conduct and
risk regulations, including stress testing. Similar prudential standards and ongoing supervision does not exist
for proprietary trading firms, hedge funds, and other non-traditional liquidity providers.
Second, the speed and volume of trading in highly automated markets significantly increases operational
risks associated with system failures, such as those seen during the Flash Crash in 2010. These operational
risks are very hard to predict and manage and may present a significant risk to market functioning.
Finally, mixed markets may give rise to significant signaling errors among firms providing liquidity to
investors. One example is “phantom liquidity,” which may give investors a false sense of security about the
durability and consistency of liquidity offered in the market. In such a scenario, during normal market
periods, liquidity providers who deploy automated trading systems may be willing to provide ample liquidity
but may reduce the capacity for market making if a significant rise in volatility were to occur. This may cause
price signaling problems for participants with larger liquidity needs facing intermediaries that historically
provided large block markets through traditional “voice” markets. Another potential signaling problem can
arise when interactions among automated trading systems occasionally lead to excessive, spurious asset price
volatility. Market participants often hedge unwanted risk exposures by using derivative instruments that
reference an underlying asset, such as a bond. The amount of hedging needed to neutralize the unwanted
risk depends, in large part, on the short-term volatility of the underlying asset. A false signal of increasing
price volatility could lead to hedging activity that may otherwise not occur. Such hedging activity could
lead to an adverse feedback loop that drives volatility higher, leading to even more false price signals. As
the character of liquidity provision in key U.S. financial markets continues to evolve, regulators and market
participants should work to ensure that financial regulations and risk-management practices continue to
evolve as well.
123Potent ia l Emerg ing Threats and Vu lne rab i l i t i es
Resilient, well-functioning secondary markets are
an important component of financial stability and
are critical to the health of primary bond markets,
serving as sources of credit and funding for
governments and corporations. Liquid markets,
where a diversity of buyers meet a diversity of
sellers, enable participants to quickly find trading
counterparties at prices near current market
valuations. Among other benefits, liquid markets
help keep transaction costs and other frictions
low, and can facilitate efficient price discovery.
Although liquidity conditions can vary over time
and across markets for a variety of reasons that
may have little direct impact on financial stability,
market breakdowns, such as that observed in
ABS markets during the financial crisis, can pose
severe solvency and liquidity challenges. During
these times, market participants may be unable
to hedge and manage exposures in the market
or raise needed financing. A significant amount
of recent public discussion among market
participants, the official sector, and academia
has considered the state of fixed income market
liquidity. This section surveys some of the key
themes raised in this dialogue from a financial
stability perspective.
Healthy Markets Require Healthy Market Participants
The robustness of market liquidity provided by
intermediaries depends greatly on their resilience,
diversity, and ability to take and manage risk.
In recent years, more traditional intermediaries,
such as broker-dealers and banks, as well as
important elements of market infrastructure
such as CCPs and exchanges, have undertaken
various efforts to enhance resilience, especially
during times of stress. However, challenges
and vulnerabilities may still exist, particularly for
intermediaries that exist outside of the regulatory
perimeter. Many of these efforts, like increases
in bank capital, improved risk management
standards, and standardized execution and
clearing practices, were the result of heightened
regulatory standards developed in coordination
with the international community. These and
similar efforts have left the financial marketplace
significantly more robust than it was during the
period prior to the financial crisis. On a macro-
level, these reforms have bolstered financial
stability. They have helped to mitigate the risk of
market breakdowns during periods of heightened
price volatility when intermediaries may be
less confident in trading at rapidly changing
price levels, and have reduced the potential for
transmission of risk between markets, particularly
when concerns about the viability of key
intermediaries act to exacerbate such uncertainty.
During the financial crisis, many intermediaries
were unable, or unwilling, to provide liquidity in
certain markets. Most notably, in the ABS market,
a combination of inadequate models and opacity
often made the provision of liquidity prohibitively
expensive. Problems in this market were
exacerbated by large amounts of forced selling
by highly levered market participants, which
amplified sharp price declines. The resulting
liquidity breakdown was especially problematic
for many pass-through vehicles which relied
upon an uninterrupted ability to trade mortgage
securities, the norm in the years preceding the
crisis; entities which were designed to transfer
products from buyers to sellers found themselves
accumulating inventory of rapidly diminishing
value. In the most extreme cases, intermediaries
faced bankruptcy and ceased their market
making activities or, through inventory liquidation,
demanded rather than provided liquidity.
Following the crisis, a number of important
reforms were implemented by both the public
and private sectors to avoid the risk propagations
Box H: Perspectives on Fixed Income Market Liquidity
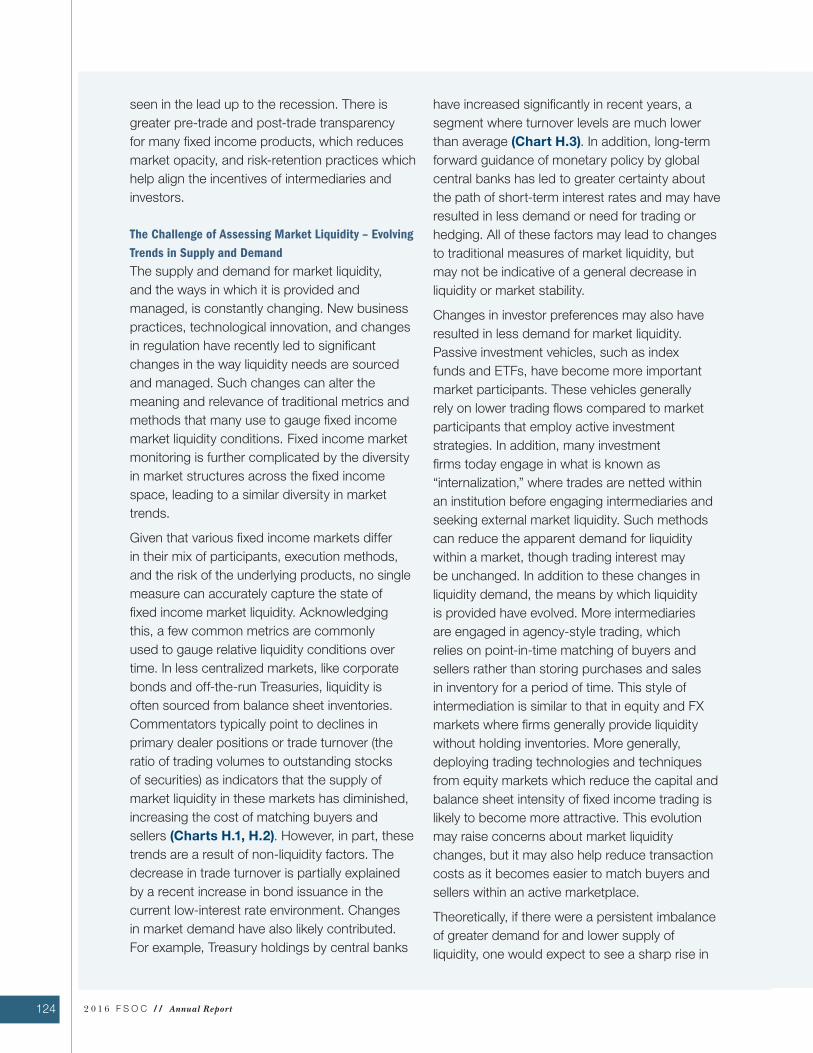
2 0 1 6 F S O C / / Annual Report124
seen in the lead up to the recession. There is
greater pre-trade and post-trade transparency
for many fixed income products, which reduces
market opacity, and risk-retention practices which
help align the incentives of intermediaries and
investors.
The Challenge of Assessing Market Liquidity – Evolving
Trends in Supply and Demand
The supply and demand for market liquidity,
and the ways in which it is provided and
managed, is constantly changing. New business
practices, technological innovation, and changes
in regulation have recently led to significant
changes in the way liquidity needs are sourced
and managed. Such changes can alter the
meaning and relevance of traditional metrics and
methods that many use to gauge fixed income
market liquidity conditions. Fixed income market
monitoring is further complicated by the diversity
in market structures across the fixed income
space, leading to a similar diversity in market
trends.
Given that various fixed income markets differ
in their mix of participants, execution methods,
and the risk of the underlying products, no single
measure can accurately capture the state of
fixed income market liquidity. Acknowledging
this, a few common metrics are commonly
used to gauge relative liquidity conditions over
time. In less centralized markets, like corporate
bonds and off-the-run Treasuries, liquidity is
often sourced from balance sheet inventories.
Commentators typically point to declines in
primary dealer positions or trade turnover (the
ratio of trading volumes to outstanding stocks
of securities) as indicators that the supply of
market liquidity in these markets has diminished,
increasing the cost of matching buyers and
sellers (Charts H.1, H.2). However, in part, these
trends are a result of non-liquidity factors. The
decrease in trade turnover is partially explained
by a recent increase in bond issuance in the
current low-interest rate environment. Changes
in market demand have also likely contributed.
For example, Treasury holdings by central banks
have increased significantly in recent years, a
segment where turnover levels are much lower
than average (Chart H.3). In addition, long-term
forward guidance of monetary policy by global
central banks has led to greater certainty about
the path of short-term interest rates and may have
resulted in less demand or need for trading or
hedging. All of these factors may lead to changes
to traditional measures of market liquidity, but
may not be indicative of a general decrease in
liquidity or market stability.
Changes in investor preferences may also have
resulted in less demand for market liquidity.
Passive investment vehicles, such as index
funds and ETFs, have become more important
market participants. These vehicles generally
rely on lower trading flows compared to market
participants that employ active investment
strategies. In addition, many investment
firms today engage in what is known as
“internalization,” where trades are netted within
an institution before engaging intermediaries and
seeking external market liquidity. Such methods
can reduce the apparent demand for liquidity
within a market, though trading interest may
be unchanged. In addition to these changes in
liquidity demand, the means by which liquidity
is provided have evolved. More intermediaries
are engaged in agency-style trading, which
relies on point-in-time matching of buyers and
sellers rather than storing purchases and sales
in inventory for a period of time. This style of
intermediation is similar to that in equity and FX
markets where firms generally provide liquidity
without holding inventories. More generally,
deploying trading technologies and techniques
from equity markets which reduce the capital and
balance sheet intensity of fixed income trading is
likely to become more attractive. This evolution
may raise concerns about market liquidity
changes, but it may also help reduce transaction
costs as it becomes easier to match buyers and
sellers within an active marketplace.
Theoretically, if there were a persistent imbalance
of greater demand for and lower supply of
liquidity, one would expect to see a sharp rise in
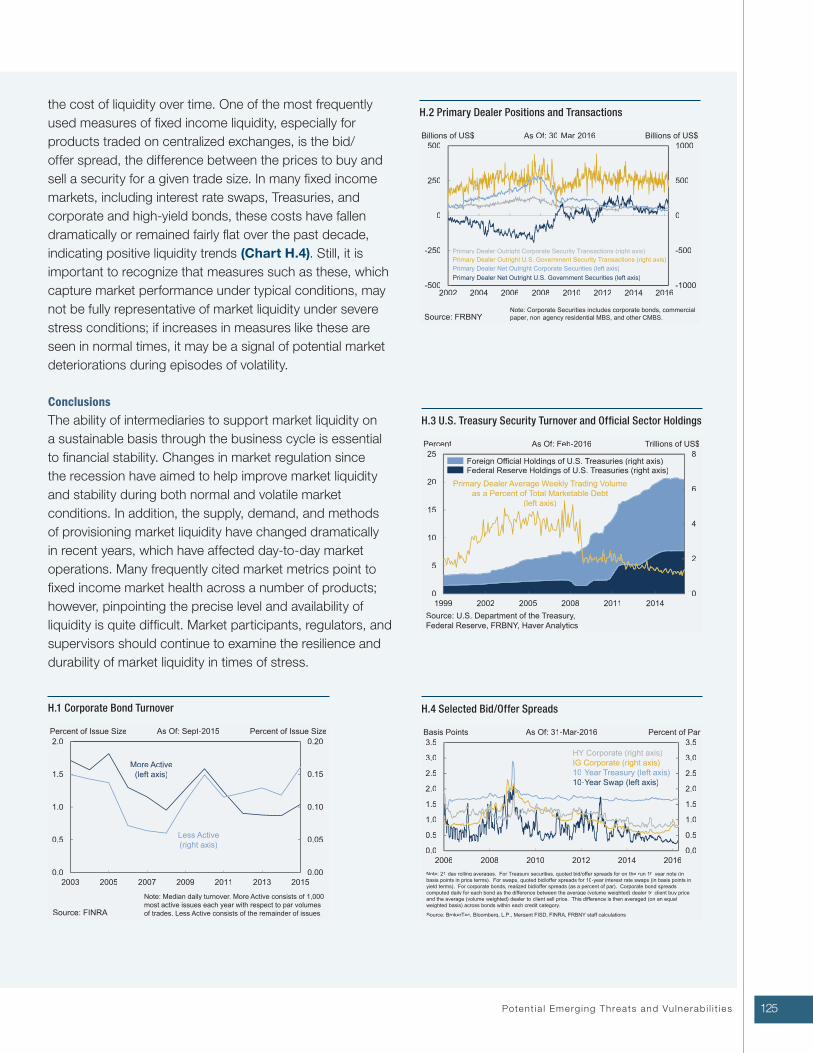
125Potent ia l Emerg ing Threats and Vu lne rab i l i t i es
the cost of liquidity over time. One of the most frequently
used measures of fixed income liquidity, especially for
products traded on centralized exchanges, is the bid/
offer spread, the difference between the prices to buy and
sell a security for a given trade size. In many fixed income
markets, including interest rate swaps, Treasuries, and
corporate and high-yield bonds, these costs have fallen
dramatically or remained fairly flat over the past decade,
indicating positive liquidity trends (Chart H.4). Still, it is
important to recognize that measures such as these, which
capture market performance under typical conditions, may
not be fully representative of market liquidity under severe
stress conditions; if increases in measures like these are
seen in normal times, it may be a signal of potential market
deteriorations during episodes of volatility.
Conclusions
The ability of intermediaries to support market liquidity on
a sustainable basis through the business cycle is essential
to financial stability. Changes in market regulation since
the recession have aimed to help improve market liquidity
and stability during both normal and volatile market
conditions. In addition, the supply, demand, and methods
of provisioning market liquidity have changed dramatically
in recent years, which have affected day-to-day market
operations. Many frequently cited market metrics point to
fixed income market health across a number of products;
however, pinpointing the precise level and availability of
liquidity is quite difficult. Market participants, regulators, and
supervisors should continue to examine the resilience and
durability of market liquidity in times of stress.
H.1 Corporate Bond Turnover
H.2 Primary Dealer Positions and Transactions
H.3 U.S. Treasury Security Turnover and Official Sector Holdings
H.4 Selected Bid/Offer Spreads
2 0 1 6 F S O C / / Annual Report126
6.6 Financial Innovation and Migration of Activities
The financial system is characterized by frequent, often disruptive, innovations in products and business
practices. Such innovation allows market participants to adapt to changing marketplace demands, fully
exploit the benefits of new technology, and respond efficiently and creatively to new regulatory constraints.
Precisely because innovations are new and potentially disruptive, they merit special attention from financial
regulators who must be vigilant to ensure that new products and practices do not blunt the effectiveness
of existing regulations or pose unanticipated risks to markets or institutions. Advances in information
technology have long been an important catalyst for change in financial services. Marketplace lending,
facilitated by online platforms which automate underwriting processes, and distributed ledger systems,
facilitated by advances in cryptology and data processing algorithms, currently play a relatively small role in
financial markets, but appear poised for substantial near-term growth. Financial regulators should continue
to monitor and evaluate the implications of how new products and practices affect regulated entities and
financial markets and assess whether they could pose risks to financial stability.
Marketplace Lending
Online marketplace lending refers to the segment of the financial services industry that uses investment
capital and data-driven online platforms featuring algorithmic underwriting models to lend either directly
or indirectly to consumers and small businesses. This segment initially emerged with companies giving
individual, usually retail, investors the ability to provide financing to fund individual borrowers through what
was known as a “peer-to-peer” model. However, marketplace lending has since evolved to include funding by
institutional investors, such as hedge funds, banks, and insurance companies seeking to provide financing
that ultimately is used to fund consumer and small business loans of various types in order to gain access
to additional lending channels and favorable rates of return. Marketplace lenders also use public offerings,
venture capital, securitizations, and loans from banks as funding sources. While loan origination volumes
and the number of marketplace lenders have grown rapidly in recent years, marketplace lending remains a
relatively small part of the $3.3 trillion U.S. consumer lending market.
When individual or institutional investors provide funding, marketplace lending does not involve maturity
transformation. Investors cannot withdraw funds before their notes mature, though in some cases limited
secondary market trading is available. Therefore, outstanding marketplace loans that are funded by investors
should not be susceptible to the sorts of run risks which can arise when there is a mismatch between the
duration of funding and loan principal. On the other hand, marketplace lending is an emerging way to
extend credit using algorithmic underwriting which has not been tested during a business cycle, so there is
a risk that marketplace loan investors may prove to be less willing than other types of creditors to fund new
lending during times of stress.
As marketplace lending continues to grow, financial regulators will need to be attentive to signs of erosion
in lending standards. In other markets, business models in which intermediaries receive fees for arranging
new loans but do not retain an interest in the loans they originate have, at times, led to incentives for
intermediaries to evaluate and monitor loans less rigorously. Furthermore, given the rapid rise in the number
of marketplace lenders who often compete with traditional lenders for the same borrowers, there is a risk
that underwriting standards and loan administration standards of these lenders could deteriorate to spur
volumes, which could spill over into other market segments.
127Potent ia l Emerg ing Threats and Vu lne rab i l i t i es
Distributed Ledger Systems
A distributed ledger is a transactions database which can be accessed and potentially updated by a number
of parties. Under traditional, centralized ledger systems, a single trusted party is responsible for maintaining
an accurate database of transactions; this “golden copy” ledger serves as a reference for all other parties.
In contrast, under a distributed ledger system, each member of a group is able to maintain its own golden
copy ledger, which, after allowing for some delay in the transmission and encoding of new transaction
information, is guaranteed to be identical to the ledger instances maintained by all other members of the
group. Distributed ledgers are made possible through the application of encryption and algorithms that allow
new transactions to be aggregated, encoded, and appended to an existing chain of transactions.
These features enable network participants to validate the accuracy of new transactions and prevent the
history of transactions from being modified.
Distributed ledger systems may enable market participants to manage many types of bilateral or multilateral
transactions without the direct participation of trusted third parties. Proponents of distributed ledger
technology believe it could help to significantly improve efficiency by replacing manually intensive
reconciliation processes and reduce risks associated with trading, clearing, settlement, and custody services.
Distributed ledger systems may mitigate risk and improve resilience in financial networks in a number of
ways. Because distributed ledgers can be designed to be broadly accessible and verifiable, they could provide
a valuable mechanism for enhancing market transparency. By eliminating the need for some transactions
to flow through trusted third parties, distributed ledgers could reduce concentrated risk exposures to
those firms and infrastructures. In addition, by improving the speed and accuracy of settlement systems,
distributed ledger systems could reduce the counterparty and operational risks which arise when financial
assets are exchanged. For example, distributed ledger systems may facilitate the automation of complex,
multi-party transactions such as the payment of bonds and insurance coupons through the development of
smart contracts.
Like most new technologies, distributed ledger systems also pose certain risks and uncertainties which market
participants and financial regulators will need to monitor. Market participants have limited experience
working with distributed ledger systems, and it is possible that operational vulnerabilities associated with such
systems may not become apparent until they are deployed at scale. For example, in recent months, Bitcoin
trade confirmation delays have increased dramatically and some trade failures have occurred as the speed
with which new Bitcoin transactions are submitted has exceeded the speed with which they can be added
to the blockchain. Similarly, although distributed ledger systems are designed to prevent reporting errors
or fraud by a single party, some systems may be vulnerable to fraud executed through collusion among a
significant fraction of participants in the system.
Distributed ledger systems have the potential to change the way some asset classes are traded and settled.
Financial regulators have often worked with those market infrastructures and firms which facilitate trading
and settlement, such as exchanges, dealers, and clearinghouses, to monitor markets and, in some cases,
regulate market activity. To the extent that distributed ledger systems ultimately reduce the importance
of these types of more centralized intermediaries, regulators will need to adapt to the changing market
structure. Furthermore, since the set of market participants which makes use of a distributed ledger system
may well span regulatory jurisdictions or national boundaries, a considerable degree of coordination among
regulators may be required to effectively identify and address risks associated with distributed ledger systems.
2 0 1 6 F S O C / / Annual Report128
6.7 Global Economic and Financial Developments
Developments in EMEs and Europe pose risks to U.S. firms and markets linked to those regions. A slowing of
growth in a number of important economies has put downward pressure on commodities prices and adversely
affected some countries’ balance sheets. Concerns over the pace of global growth and changes in monetary
and currency policies abroad appear to have contributed to considerable volatility in U.S. equity, bond, and
currency markets, both last summer and early this year.
China is in the midst of long-term transitions in its economy away from investment toward household
consumption, and away from manufacturing toward services. China’s households have unusually low
consumption rates and China’s service sector is underdeveloped relative to other economies. China is the
world’s second largest economy when measured at market exchange rates and the world’s largest importer of
commodities. It is also a critical link in global supply chains and is increasingly a source of final demand for
other countries’ goods and services exports. Consequently, the evolution of China’s economy has important
economic implications globally. Last summer, a sharp correction in China’s stock market and a shift in the
manner in which Chinese authorities set the reference rate of its currency value drew increased attention to
China’s policies and underlying fundamentals.
Persistently low commodity prices, due in large part to oversupply in the oil market and slowing Chinese
demand, also poses significant risks for resource rich emerging markets that have relied on high commodity
prices to boost growth over much of the last decade. Low commodity prices have weighed heavily on these
economies’ growth rates, resulting in significant strains in their fiscal positions. In 2015, the economic
growth rates of commodity exporters slowed, most notably in Russia and Brazil, and their fiscal balances
deteriorated. Commodity exporters with fiscal buffers can use these buffers to enact countercyclical fiscal
policies to ease the shock in the short-term, but prolonged commodity price weakness can deplete these
buffers, making it critical for governments to enact policies and adjust expenditures to smooth the transition
process to a non-commodity driven growth model. For commodity exporters with limited buffers, such as
Venezuela, the situation is more acute and has brought on sharp and prolonged recessions and political
tensions.
The situation in the euro area has significantly improved since 2012, but domestic demand growth remains
modest despite a weaker euro last year and low oil prices. Concerns related to the upcoming United Kingdom
referendum on exit from the EU, uncertainty in securing an agreement on Greece, and ongoing geopolitical
tension between Russia and Ukraine will likely weigh on sentiment in the coming months. In addition, the
substantial increase in immigration from conflict-torn countries has also threatened European cohesion, and
the rise of anti-austerity parties in Spain and Portugal has raised concerns over the sustainability of economic
policies in euro area periphery economies.
129Abbrev ia t ions
ABCP Asset-Backed Commercial Paper
ABS Asset-Backed Security
AIG American International Group, Inc
AMC Appraisal Management Company
ARRC Alternative Reference Rates Committee
ASU Accounting Standards Update
AUM Assets Under Management
BCBS Basel Committee on Banking Supervision
BCR Basic Capital Requirement
BEA Bureau of Economic Analysis
BHC Bank Holding Company
BIS Bank for International Settlements
BoJ Bank of Japan
C&I Commercial and Industrial
CAT Cybersecurity Assessment Tool
CBO Congressional Budget Office
CCAR Comprehensive Capital Analysis and Review
CCP Central Counterparty
Abbreviations
2 0 1 6 F S O C / / Annual Report130
CCyB Countercyclical Capital Buffer
CD Certificate of Deposit
CDO Collateralized Debt Obligation
CDS Credit Default Swap
CFPB Bureau of Consumer Financial Protection
CFTC Commodity Futures Trading Commission
CIF Collective Investment Fund
CLO Collateralized Loan Obligation
CMBS Commercial Mortgage-Backed Security
CME Chicago Mercantile Exchange
CMO Collateralized Mortgage Obligation
COSSEC Corporación Pública para la Supervisión y Seguro de Cooperativas
COT Commitment of Traders
Council Financial Stability Oversight Council
CoVaR Conditional Value-at-Risk
CP Commercial Paper
CPMI Committee on Payments and Market Infrastructures
CRE Commercial Real Estate
CSBS Conference of State Bank Supervisors
CSP Common Securitization Platform
131Abbrev ia t ions
DCM Designated Contract Market
DFAST Dodd-Frank Act Stress Tests
DIP Distress Insurance Premium
Dodd-Frank Act Dodd-Frank Wall Street Reform and Consumer Protection Act
DoJ U.S. Department of Justice
DTCC Depository Trust & Clearing Corporation
EBITDA Earnings Before Interest, Taxes, Depreciation, and Amortization
ECB European Central Bank
EDIF European Deposit Insurance Fund
EDIS European Deposit Insurance Scheme
EME Emerging Market Economy
ETF Exchange-Traded Fund
ETP Exchange-Traded Product
EU European Union
FASB Financial Accounting Standards Board
FBIIC Financial and Banking Information Infrastructure Committee
FBO Foreign Banking Organization
FCF Third Avenue Focused Credit Fund
FDIC Federal Deposit Insurance Corporation
Federal Reserve Board of Governors of the Federal Reserve System

2 0 1 6 F S O C / / Annual Report132
FFIEC Federal Financial Institutions Examination Council
FHA Federal Housing Administration
FHFA Federal Housing Finance Agency
FHLB Federal Home Loan Bank
FICO Fair Isaac Corporation
FICU Federally Insured Credit Union
FINRA Financial Industry Regulatory Authority
FIO Federal Insurance Office
FMI Financial Market Infrastructure
FMU Financial Market Utility
FOMC Federal Open Market Committee
FRBNY Federal Reserve Bank of New York
FS-ISAC Financial Sector Information Sharing and Analysis Center
FSB Financial Stability Board
FSOC Financial Stability Oversight Council
FX Foreign Exchange
G-20 Group of Twenty
G-SIB Global Systemically Important Bank
G-SII Global Systemically Important Insurer
GAAP Generally Accepted Accounting Principles

133Abbrev ia t ions
GCF General Collateral Finance
GDP Gross Domestic Product
GECC General Electric Capital Corporation, Inc
GO General Obligation
GSE Government-Sponsored Enterprise
HARP Home Affordable Refinance Program
HELOC Home Equity Line of Credit
HLA Higher Loss Absorbency
HMDA Home Mortgage Disclosure Act
HQLA High-Quality Liquid Asset
HUD U.S. Department of Housing and Urban Development
HY High-Yield
IAIG Internationally Active Insurance Group
IAIS International Association of Insurance Supervisors
IASB International Accounting Standards Board
ICE Intercontinental Exchange
ICI Investment Company Institute
ICS Insurance Capital Standard
IFRS International Financial Reporting Standards
IG Investment Grade

2 0 1 6 F S O C / / Annual Report134
IHC Intermediate Holding Company
IMF International Monetary Fund
IOER Interest on Excess Reserves
IOSCO International Organization of Securities Commissions
IRA Individual Retirement Account
IRD Interest Rate Derivative
IRS Internal Revenue Service
ISDA International Swaps and Derivatives Association
LBO Leveraged Buyout
LCR Liquidity Coverage Ratio
LEI Legal Entity Identifier
LIBOR London Interbank Offered Rate
LSTA Loan Syndications & Trading Association
LULD Limit Up/Limit Down
M&A Mergers and Acquisitions
MBS Mortgage-Backed Security
MMF Money Market Mutual Fund
MOVE Merrill Lynch Option Volatility Estimate
MREL Minimum Requirement for Own Funds and Eligible Liabilities
MTN Medium Term Note
135Abbrev ia t ions
NAIC National Association of Insurance Commissioners
NASAA North American Securities Administrators Association
NAV Net Asset Value
NBER National Bureau of Economic Research
NCUA National Credit Union Administration
NIM Net Interest Margin
NIST National Institute of Standards and Technology
NPL Non-Performing Loan
NSFR Net Stable Funding Ratio
OCC Office of the Comptroller of the Currency
OFR Office of Financial Research
ON RRP Overnight Reverse Repurchase Agreement
ORSA Own Risk and Solvency Assessment
OTC Over-the-Counter
P/B Price-to-Book
P&C Property and Casualty
P/E Price-to-Earnings
PBGC Pension Benefit Guaranty Corporation
PBOC People’s Bank of China
PFMI Principles for Financial Market Infrastructures

2 0 1 6 F S O C / / Annual Report136
REIT Real Estate Investment Trust
REO Real Estate Owned
Repo Repurchase Agreement
RESPA Real Estate Settlement Procedures Act
RFI Request for Information
RMB Renminbi
RMBS Residential Mortgage-Backed Security
ROA Return on Assets
ROAA Return on Average Assets
ROE Return on Equity
RRP Reverse Repurchase Operation
RWA Risk-Weighted Asset
S&P Standard & Poor's
SAP Statutory Accounting Principles
SBSDR Security-Based Swap Data Repository
SDR Swap Data Repository
SEC Securities and Exchange Commission
SEF Swap Execution Facility
SES Systemic Expected Shortfall
SIFMA Securities Industry and Financial Markets Association
137Abbrev ia t ions
SIPC Securities Investor Protection Corporation
SIV Structured Investment Vehicle
SLOOS Senior Loan Officer Opinion Survey on Bank Lending Practices
SLR Supplementary Leverage Ratio
SNC Shared National Credits
SRB Single Resolution Board
SRC Systemic Risk Committee
SRF Single Resolution Fund
SRM Single Resolution Mechanism
SSM Single Supervisory Mechanism
STIF Short-Term Investment Fund
STRIPS Separate Trading of Registered Interest and Principal of Securities
Term RRP Term Reverse Repurchase Agreement
TILA Truth in Lending Act
TIPS Treasury Inflation-Protected Securities
Treasury U.S. Department of the Treasury
TRIP Terrorism Risk Insurance Program
ULI Universal Loan Identifier
UPI Unique Product Identifier
USD U.S. Dollar
2 0 1 6 F S O C / / Annual Report138
USTR U.S. Trade Representative
UTI Unique Transaction Identifier
VA U.S. Department of Veterans Affairs
VaR Value-at-Risk
VIX Chicago Board Options Exchange Volatility Index
WAM Weighted-Average Maturity
WTI West Texas Intermediate

139Glossar y
Glossary
The Investment Company Act of 1940 is an act of
Congress primarily concerning the regulation of mutual
funds, closed-end funds, exchange-traded funds, and
business development companies.
1940 Act
A regulatory capital measure which may include items such
as noncumulative perpetual preferred stock and mandatory
convertible preferred securities which satisfy the eligibility
criteria in the Revised Capital Rule, as well as related surplus
and minority interests.
Additional Tier 1 Capital
The Advanced Approaches capital framework requires certain
banking organizations to use an internal ratings-based
approach and other methodologies to calculate risk-based
capital requirements for credit risk and advanced measurement
approaches to calculate risk-based capital requirements for
operational risk. The framework applies to large, internationally
active banking organizations—generally those with at least $250
billion in total consolidated assets or at least $10 billion in total
on-balance sheet foreign exposure—and includes the depository
institution subsidiaries of those firms.
Advanced Approaches Capital
Framework
In general, a company is an affiliate of another company if 1)
either company consolidates the other on financial statements
prepared in accordance with U.S. Generally Accepted Accounting
Principles, the International Finance Reporting Standards, or
other similar standards; 2) both companies are consolidated
with a third company on financial statements prepared in
accordance with such principles or standards; 3) for a company
that is not subject to such principles or standards, consolidation
as described above would have occurred if such principles or
standards had applied; or 4) a primary regulator determines that
either company provides significant support to, or is materially
subject to the risks or losses of, the other company.
Affiliate
Short-term debt which has a fixed maturity of up to 270 days
and is backed by some financial asset, such as trade receivables,
consumer debt receivables, securities, or auto and equipment
loans or leases.
Asset-Backed Commercial
Paper (ABCP)
A fixed income or other type of security which is collateralized
by self-liquidating financial assets that allows the holder of the
security to receive payments that depend primarily on cash flows
from the assets.
Asset-Backed Security (ABS)

2 0 1 6 F S O C / / Annual Report140
A repo between two institutions where settlement typically
occurs on a “delivery versus payment” basis. More
specifically, the transfer of the collateral to the cash lender
occurs simultaneously with the transfer of the cash to the
collateral provider.
Bilateral Repo
An entity which interposes itself between counterparties to
contracts traded in one or more financial markets, becoming
the buyer to every seller and the seller to every buyer, thereby
ensuring the performance of open contracts.
Central Counterparty (CCP)
A BHC subsidiary that facilitates payment and settlement of
financial transactions, such as check clearing, or facilitates
trades between the sellers and buyers of securities or other
financial instruments or contracts.
Clearing Bank
Any asset pledged by a borrower to guarantee payment of a debt.Collateral
A securitization vehicle backed predominantly by
commercial loans.
Collateralized Loan Obligation (CLO)
A security which is collateralized by a pool of commercial
mortgage loans and makes payments derived from the interest
and principal payments on the underlying mortgage loans.
Commercial Mortgage-Backed
Security (CMBS)
Short-term (maturity of up to 270 days), unsecured
corporate debt.
Commercial Paper (CP)
A regulatory capital measure which includes capital with the
highest loss-absorbing capacity, such as common stock and
retained earnings.
Common Equity Tier 1 Capital
A ratio which divides common equity tier 1 capital by total risk-
weighted assets. The ratio applies to all banking organizations
subject to the Revised Capital Rule.
Common Equity Tier 1 Capital Ratio
A common RMBS securitization infrastructure between Fannie
Mae and Freddie Mac.
Common Securitization
Platform (CSP)
An annual exercise by the Federal Reserve to ensure that
institutions have robust, forward-looking capital planning
processes which account for their unique risks and sufficient
capital to continue operations throughout times of economic and
financial stress.
Comprehensive Capital Analysis
and Review (CCAR)
The value-at-risk (VaR) of the financial system conditional on
institutions being in distress.
Conditional Value-at-Risk (CoVaR)

141Glossar y
A monthly index containing data on changes in the prices
paid by urban consumers for a representative basket of goods
and services.
Consumer Price Index (CPI)
Any swap dealer or major swap participant registered with
the CFTC and any major security-based swap participant
registered with the SEC that is a national bank, Federal
savings association, Federal branch or agency of a foreign
bank, state member bank, bank holding company, savings and
loan holding company, foreign banking organization, foreign bank
that does not operate an insured branch, state branch or agency
of a foreign bank, Edge or agreement corporation, any other
FDIC-insured state-chartered bank or savings association,
and any affiliate of any of the foregoing
Covered Swap Entity
A financial contract in which one party agrees to make a payment
to the other party in the event of a specified credit event, in
exchange for one or more fixed payments.
Credit Default Swap (CDS)
A private company which evaluates the credit quality of debt
issuers as well as their issued securities, and provides ratings
on the issuers and securities. Many credit rating agencies are
Nationally Recognized Statistical Rating Organizations, the
largest of which are Fitch Ratings, Moody’s Investors Service,
and Standard & Poor’s.
Credit Rating Agency
A retirement plan in which the cost to the employer is based on a
predetermined formula to calculate the amount of a participant’s
future benefit. In defined benefit plans, the investment risk is
borne by the plan sponsor.
Defined Benefit Plan
A retirement plan in which the cost to the employer is limited to
the specified annual contribution. In defined contribution plans,
the investment risk is borne by the plan participant.
Defined Contribution Plan
A measure of systemic risk which integrates the characteristics
of bank size, default probability, and interconnectedness.
Distress Insurance Premium (DIP)
Annual stress tests required by the Dodd-Frank Act for national
banks and federal savings associations with total consolidated
assets of more than $10 billion.
Dodd-Frank Act Stress Tests
(DFAST)
The sensitivity of the prices of bonds and other fixed income
securities to changes in the level of interest rates.
Duration
An investment fund or note whose shares are traded on an
exchange. ETPs offer continuous pricing—unlike mutual funds,
which offer only end-of-day pricing. ETPs are often designed to
track an index or a portfolio of assets.
Exchange-Traded Product (ETP)

2 0 1 6 F S O C / / Annual Report142
The interest rate at which depository institutions lend balances
to each other overnight. The FOMC sets a target level for the
overnight federal funds rate, and the Federal Reserve Bank of
New York then uses open market operations to influence the
overnight federal funds rate to trade around the policy target
rate or within the target rate range.
Federal Funds Rate
A measure of a borrower’s creditworthiness based on the
borrower’s credit data; developed by the Fair Isaac Corporation.
FICO Score
A multilateral system among participating financial institutions,
including the operator of the system, used for the purposes of
recording, clearing, or settling payments, securities, derivatives,
or other financial transactions. Under the Dodd-Frank Act, certain
FMIs are recognized as FMUs.
Financial Market Infrastructure
(FMI)
A Dodd-Frank defined entity, which, subject to certain exclusions,
is “any person that manages or operates a multilateral system
for the purpose of transferring, clearing, or settling payments,
securities, or other financial transactions among financial
institutions or between financial institutions and the person.”
Financial Market Utility (FMU)
The disorderly liquidation of assets to meet margin requirements
or other urgent cash needs. Such a sudden sell-off drives down
prices, potentially below their intrinsic value, when the quantities
to be sold are large relative to the typical volume of transactions.
Fire sales can be self-reinforcing and lead to additional forced
selling by some market participants which, subsequent to an
initial fire sale and consequent decline in asset prices, may also
need to meet margin or other urgent cash needs.
Fire Sale
Any 12-month accounting period. The fiscal year for the
federal government begins on October 1 and ends on September
30 of the following year; it is named after the calendar year in
which it ends.
Fiscal Year
A standardized contract traded over exchanges to buy or sell an
asset in the future.
Future
An interdealer repo market in which the Fixed Income Clearing
Corporation plays the role of intraday CCP. Trades are netted at
the end of each day and settled at the tri-party clearing banks.
See Tri-party Repo.
General Collateral Finance
(GCF)
A corporate entity with a federal charter authorized by law, but
which is a privately owned financial institution. Examples include
the Federal National Mortgage Association (Fannie Mae) and the
Federal Home Loan Mortgage Corporation (Freddie Mac).
Government-Sponsored
Enterprise (GSE)

143Glossar y
The broadest measure of aggregate economic activity, measuring
the total value of all final goods and services produced within a
country’s borders during a specific period.
Gross Domestic Product
(GDP)
The discount, represented as a percentage of par or market
value, at which an asset can be pledged as collateral. For
example, a $1,000,000 bond with a 5 percent haircut would
collateralize a $950,000 loan. The purpose of a haircut is to
provide a collateral margin for a secured lender.
Haircut
An accounting term for debt securities accounted for at amortized
cost, under the proviso that the company can assert that it has
the positive intent and ability to hold the securities to maturity.
Held-to-Maturity
An asset—such as a government bond—which is considered
eligible as a liquidity buffer in the U.S. banking agencies’
liquidity coverage ratio. High-quality liquid assets should be
liquid in markets during times of stress and, ideally, be central
bank-eligible.
High-Quality Liquid Asset (HQLA)
A line of credit extended to a homeowner which uses the home
as collateral.
Home Equity Line of Credit (HELOC)
An estimate of the ratio of debt payments to disposable personal
income. Debt payments consist of the estimated required
payments on outstanding mortgage and consumer debt.
Household Debt Service Ratio
A measure of housing demand, calculated as the month-to-month
change in the number of occupied housing units.
Household Formation
The management of the exposure of an individual’s or an
institution’s financial condition to movements in interest rates.
Interest Rate Risk Management
A derivative contract in which two parties swap interest rate cash
flows on a periodic basis, referencing a specified notional amount
for a fixed term. Typically one party will pay a predetermined fixed
rate while the other party will pay a short-term variable reference
rate which resets at specified intervals.
Interest Rate Swap
Purchases by the Federal Reserve of securities issued by the U.S.
government or securities issued or guaranteed by government-
sponsored agencies (including Fannie Mae, Freddie Mac, Ginnie
Mae, and the Federal Home Loan Banks) in the implementation of
monetary policy.
Large-Scale Asset Purchases

2 0 1 6 F S O C / / Annual Report144
A 20-digit alpha-numeric code that connects to key reference
information which enables clear and unique identification of
companies participating in global financial markets. The LEI
system is designed to facilitate many financial stability
objectives, including: improved risk management in firms;
better assessment of microprudential and macroprudential risks;
expedition of orderly resolution; containment of market abuse and
financial fraud; and provision of higher-quality and more accurate
financial data.
Legal Entity Identifier (LEI)
An acquisition of a company financed by a private equity
contribution combined with borrowed funds, with debt
comprising a significant portion of the purchase price.
Leveraged Buyout (LBO)
A loan for which the obligor's post-financing leverage as
measured by debt-to-assets, debt-to-equity, cash flow-to-total
debt, or other such standards unique to particular industries
significantly exceeds industry norms. Leveraged borrowers
typically have a diminished ability to adjust to unexpected events
and changes in business conditions because of their higher ratio
of total liabilities to capital.
Leveraged Loan
A standard to ensure that covered companies maintain adequate
unencumbered, high-quality liquid assets to meet anticipated
liquidity needs for a 30-day horizon under a standardized liquidity
stress scenario.
Liquidity Coverage Ratio (LCR)
The ratio of the amount of a loan to the value of the asset that
the loan funds, typically expressed as a percentage. This is a
key metric when considering the level of collateralization of a
mortgage.
Loan-to-Value Ratio
The interest rate at which banks can borrow unsecured funds
from other banks in London wholesale money markets, as
measured by daily surveys. The published rate is a trimmed
average of the rates obtained in the survey.
London Interbank Offered Rate
(LIBOR)
A person that is not a security-based swap dealer and maintains
a substantial position in security-based swaps, creates
substantial counterparty exposure, or is a financial entity that is
highly leveraged and not subject to federal banking capital rules.
Major Security-Based Swap
Participant
The weighted-average time to maturity of financial assets less
the weighted-average time to maturity of liabilities.
Maturity Gap
A type of mutual fund which invests in short-term, liquid
securities such as government bills, CDs, CP, or repos.
Money Market Mutual Fund (MMF)

145Glossar y
ABS backed by a pool of mortgages. Investors in the security
receive payments derived from the interest and principal
payments on the underlying mortgages.
Mortgage-Backed Security (MBS)
A company which acts as an agent for mortgage holders by
collecting and distributing mortgage cash flows. Mortgage
servicers also manage defaults, modifications, settlements,
foreclosure proceedings, and various notifications to borrowers
and investors.
Mortgage Servicing Company
A bond issued by states, cities, counties, local governmental
agencies, or certain nongovernment issuers to finance certain
general or project-related activities.
Municipal Bond
An investment company's total assets minus its total liabilities.Net Asset Value (NAV)
Net interest income as a percent of interest-earning assets.Net Interest Margin (NIM)
A liquidity standard to promote the funding stability of
internationally active banks, through the maintenance of stable
funding resources relative to assets and off-balance sheet
exposures.
Net Stable Funding Ratio (NSFR)
The purchase and sale of securities in the open market by a
central bank to implement monetary policy.
Open Market Operations
A financial contract granting the holder the right but not the
obligation to engage in a future transaction on an underlying
security or real asset. The most basic examples are an equity
call option, which provides the right but not the obligation to
buy a block of shares at a fixed price for a fixed period, and an
equity put option, which similarly grants the right to sell a block
of shares.
Option
A method of trading which does not involve an organized
exchange. In OTC markets, participants trade directly
on a bilateral basis, typically through voice or computer
communication and often with certain standardized
documentation with counterparty-dependent terms.
Over-the-Counter (OTC)
Regulation aimed at ensuring the safe and sound operation of
financial institutions, set by both state and federal authorities.
Prudential Regulation
All debt issued by Treasury and the Federal Financing Bank,
including both debt held by the public and debt held in
intergovernmental accounts, such as the Social Security Trust
Funds. Not included is debt issued by government agencies other
than the Department of the Treasury.
Public Debt

2 0 1 6 F S O C / / Annual Report146
An operating company which manages income-producing real
estate or real estate-related assets. Certain REITs also operate
real estate properties in which they invest. To qualify as a REIT, a
company must have three-fourths of its assets and gross income
connected to real estate investment and must distribute at least
90 percent of its taxable income to shareholders annually in the
form of dividends.
Real Estate Investment Trust (REIT)
The sale of a security combined with an agreement to repurchase
the security, or a similar security, on a specified future date at a
prearranged price. A repo is a secured lending arrangement.
Repurchase Agreement (Repo)
A security which is collateralized by a pool of residential
mortgage loans and makes payments derived from the interest
and principal payments on the underlying mortgage loans.
Residential Mortgage-Backed
Security (RMBS)
The capital rule which revised the risk-based and leverage capital
requirements for U.S. banking organizations, as finalized by the
Federal Reserve Board and the OCC in October 2013 (78 FR
62018), and for which the FDIC issued a substantially identical
interim rule in September 2013 (78 FR 55340). In April 2014,
the FDIC adopted the interim final rule as a final rule with no
substantive changes (79 FR 20754).
Revised Capital Rule
An amount of capital, based on the risk-weighting of various
asset categories, which a financial institution holds to help
protect against losses.
Risk-Based Capital
A risk-based concept used as the denominator of risk-based
capital ratios (common equity tier 1, tier 1, and total). The
total RWAs for an institution are a weighted total asset value
calculated from assigned risk categories or modeled analysis.
Broadly, total RWAs are determined by calculating RWAs for
market risk and operational risk, as applicable, and adding
the sum of RWAs for on-balance sheet, off-balance sheet,
counterparty, and other credit risks.
Risk-Weighted Assets (RWAs)
The risk that as an institution’s debt nears maturity, the institution
may not be able to refinance the existing debt or may have to
refinance at less favorable terms.
Rollover Risk
The risk that investors lose confidence in an institution—due to
concerns about counterparties, collateral, solvency, or related
issues—and respond by pulling back their funding.
Run Risk
A system which consolidates and disseminates equity prices.Securities Information Processor
The temporary transfer of securities from one party to another for
a specified fee and term, in exchange for collateral in the form of
cash or securities.
Securities Lending/Borrowing

147Glossar y
A financial transaction in which assets such as mortgage loans
are pooled, securities representing interests in the pool are
issued, and proceeds from the underlying pooled assets are used
to service and repay the securities.
Securitization
A person that holds itself out as a dealer in security-based
swaps, makes a market in security-based swaps, regularly enters
into security-based swaps with counterparties, or engages in
any activity causing it to be known as a dealer or market maker
in security-based swaps; does not include a person entering into
security-based swaps for such person’s own account.
Security-Based Swap Dealer
Short-term funding instruments not covered by deposit insurance
which are typically issued to institutional investors. Examples
include large checkable and time deposits, brokered CDs, CP,
Federal Home Loan Bank borrowings, and repos.
Short-Term Wholesale Funding
Tier 1 capital of an advanced approaches banking organization
divided by total leverage exposure. All advanced approaches
banking organizations must maintain an SLR of at least 3
percent. The SLR is effective January 1, 2018, and organizations
must calculate and publicly disclose their SLRs beginning March
31, 2015.
Supplementary Leverage Ratio
(SLR)
An exchange of cash flows with defined terms and over a fixed
period, agreed upon by two parties. A swap contract may
reference underlying financial products across various asset
classes including interest rates, credit, equities, commodities,
and FX.
Swap
A person that collects and maintains information or records
with respect to transactions or positions in, or the terms and
conditions of, swaps entered into by third parties for the purpose
of providing a centralized recordkeeping facility for swaps. In
certain jurisdictions, SDRs are referred to as trade repositories.
The Committee on Payments and Settlement Systems and
IOSCO describe a trade repository as “an entity that maintains a
centralized electronic record (database) of transaction data.”
Swap Data Repository (SDR)
A person that holds itself out as a dealer in swaps, makes a
market in swaps, regularly enters into swaps with counterparties,
or engages in any activity causing it to be known as a dealer or
market maker in swaps; does not include a person entering into
swaps for such person’s own account.
Swap Dealer
A term defined in the Dodd-Frank Act as a trading platform which
market participants use to execute and trade swaps by accepting
bids and offers made by other participants.
Swap Execution Facility (SEF)
A futures contract which mimics the economic substance of a
swap.
Swap Future

2 0 1 6 F S O C / / Annual Report148
An option granting the right to enter into a swap. See Option
and Swap.
Swaption
A systemic risk indicator which estimates the extent to which the
market value equity of a financial firm would be depleted by a
decline in equity prices.
Systemic Expected Shortfall (SES)
A regulatory capital measure comprised of common equity tier
1 capital and additional tier 1 capital. See Common Equity Tier 1
Capital and Additional Tier 1 Capital.
Tier 1 Capital
A regulatory capital measure which includes subordinated debt
with a minimum maturity of five years and satisfies the eligibility
criteria in the Revised Capital Rule.
Tier 2 Capital
Deposits which the depositor generally does not have the right
to withdraw before a designated maturity date without paying an
early withdrawal penalty. A CD is a time deposit.
Time Deposits
A regulatory capital measure comprised of tier 1 capital and tier 2
capital. See Tier 1 Capital and Tier 2 Capital.
Total Capital
A repo in which a clearing bank acts as third-party agent
to provide collateral management services and to facilitate
the exchange of cash against collateral between the two
counterparties.
Tri-Party Repo
Terms, conditions, and criteria used to determine the extension of
credit in the form of a loan or bond.
Underwriting Standards
A tool to measure the risk of portfolio losses. The VaR projects
the probability and maximum expected loss for a specific time
period. For example, the VaR over 10 days and with 99 percent
certainty measures the most one would expect to lose over a
10-day period, 99 percent of the time.
Value-at-Risk (VaR)
A standard measure of market expectations of short-term
volatility based on S&P equity index option prices.
VIX (Chicago Board Options
Exchange Market Volatility Index)
A weighted average of the time to each principal payment in a
security.
Weighted-Average Life
A weighted average of the time to maturity on all loans in an
asset-backed security.
Weighted-Average Maturity (WAM)
A graphical representation of the relationship between bond
yields and their respective maturities.
Yield Curve
149L is t o f Char ts
List of Charts
4.1.1 Federal Debt Held by the Public ........................................................ 19
4.1.2 10-Year Treasury Yields ..................................................................... 19
4.1.3 2-Year Treasury Yields ....................................................................... 20
4.1.4 Fixed Income Implied Volatility........................................................... 20
A.1 Selected Swap Spreads ................................................................... 21
4.2.1 Advanced Economies Real GDP Growth .......................................... 23
4.2.2 Real GDP Growth ............................................................................. 23
4.2.3 Euro Area Real GDP Growth ............................................................. 24
4.2.4 Contributions to Japanese GDP Growth ........................................... 24
4.2.5 Japanese Consumer Price Inflation ................................................... 24
4.2.6 European 10-Year Yields ................................................................... 25
4.2.7 Chinese Real GDP Growth................................................................ 28
4.2.8 Chinese Manufacturing and Services Growth ................................... 28
4.2.9 Chinese Equity Market (CSI 300 Index) ............................................. 28
4.2.10 Chinese Credit Growth ..................................................................... 29
4.2.11 Components of Chinese Nonbank Credit Growth ............................. 29
4.2.12 Credit to the Chinese Nonfinancial Private Sector ............................. 29
4.2.13 Gross Capital Flows to EMEs ............................................................ 30
4.2.14 Emerging Market Gross Global Bond Issuance ................................. 30
4.2.15 Emerging Market Bond Spreads ....................................................... 30
4.2.16 Change in State and Local Government Tax Revenues ..................... 31
4.2.17 Long-Term Mutual Fund Flows: Municipal Bonds .............................. 32
4.2.18 Municipal Bond Spreads ................................................................... 32
4.2.19 Municipal Bond Issuance .................................................................. 32
C.1 Municipal Bond Yields ...................................................................... 33
4.3.1 Debt to Assets for Nonfinancial Corporations .................................... 34
4.3.2 Bank Business Lending Standards and Demand .............................. 34
4.3.3 Covenant-Lite Volume as a Percent of Total Issuance ....................... 34
4.3.4 Leveraged Loans: Debt to EBITDA Ratios ......................................... 35
4.3.5 Noncurrent Commercial and Industrial Loans ................................... 35
4.3.6 Corporate Bond Issuance ................................................................. 35
4.3.7 Corporate Credit Spreads ................................................................. 36
4.3.8 Rolling 12-Month Default Rate ........................................................... 36
4.3.9 Distressed Ratios .............................................................................. 36
4.3.10 CLO Issuance ................................................................................... 37
4.3.11 Leveraged Loan Primary Market by Investor Type ............................. 37
2 0 1 6 F S O C / / Annual Report150
4.4.1 Household Debt as a Percent of Disposable Personal Income .......... 37
4.4.2 Household Debt Service Ratio .......................................................... 38
4.4.3 Share of Household Debt by Delinquency Status .............................. 38
4.4.4 Components of Consumer Credit ..................................................... 38
4.4.5 90+ Day Delinquency Rate by Loan Type .......................................... 39
4.5.1 National Repeat Sales Home Price Indices ....................................... 39
4.5.2 Mortgage Originations and Rates ...................................................... 40
4.5.3 Mortgage Delinquency and Foreclosure ............................................ 41
4.5.4 Mortgages with Negative Equity ........................................................ 41
4.5.5 Purchase Origination Volume by Credit Score ................................... 41
4.5.6 Mortgage Originations by Product .................................................... 42
4.5.7 RMBS Issuance ................................................................................ 42
4.5.8 Agency MBS Yield and Spread ......................................................... 42
4.5.9 Mortgage Servicing Market ............................................................... 43
4.5.10 Commercial Property Price Indices ................................................... 44
4.5.11 CRE Capitalization Rates and Spreads ............................................. 44
4.5.12 CMBS Issuance ................................................................................ 45
4.5.13 CMBS Senior Debt Spreads ............................................................. 45
4.6.1 Nominal U.S. Dollar Trade-Weighted Index ........................................ 46
4.6.2 U.S. Dollar Exchange Rates .............................................................. 46
4.6.3 Change in U.S. Dollar Exchange Rates ............................................. 46
4.7.1 Returns in Selected Equities Indices ................................................. 47
4.7.2 S&P 500 Key Ratios .......................................................................... 47
4.7.3 Equity Market Volatility ...................................................................... 47
4.8.1 Commodities .................................................................................... 48
4.9.1 Commercial Paper Outstanding ........................................................ 48
4.9.2 Commercial Paper Interest Rates ...................................................... 49
4.9.3 Primary Dealer Repo Agreements ..................................................... 50
4.9.4 Value of the Repo Market .................................................................. 50
4.9.5 Collateral in the Tri-Party Repo Market .............................................. 51
4.9.6 Bilateral Repo Haircuts ...................................................................... 51
4.9.7 Treasury Tri-Party and GCF Repo Rates ........................................... 52
4.9.8 Value of Securities on Loan ............................................................... 54
4.9.9 Global Securities Lending by Security Type ...................................... 54
4.9.10 U.S. Securities Lending Cash Reinvestment ..................................... 55
4.10.1 Normalized Future Prices .................................................................. 56
4.10.2 Market Volatility Indices ..................................................................... 56
4.10.3 Selected Exchange Open Interest ..................................................... 56
4.10.4 Selected Exchange Volume .............................................................. 57
4.10.5 Selected Futures Open Interest ......................................................... 57
151L is t o f Char ts
4.10.6 Selected Futures Volume .................................................................. 57
4.10.7 WTI Crude COT ................................................................................ 58
4.10.8 10-Year Treasury Traders in Financial Futures .................................... 58
4.10.9 CME Rate Swap Futures Open Interest ............................................. 58
4.10.10 OTC Equity Options: Global Notional Outstanding ............................ 59
4.10.11 OTC Equity Option Share of All OTC Derivatives................................ 59
4.10.12 OTC Equity Options: Global Market Value ......................................... 59
4.10.13 BHC OTC Equity Option Exposure .................................................... 60
4.10.14 Global OTC Derivatives Market ......................................................... 60
4.10.15 Credit Derivatives Outstanding .......................................................... 60
4.10.16 Global Central Clearing Market Share ............................................... 61
D.1 Bilateral Compression Process ......................................................... 62
D.2 Currently Available Compression Options ......................................... 62
D.3 Interest Rate Derivative Compression Volume ................................... 63
4.10.17 U.S. Central Clearing Market Share ................................................... 64
4.10.18 U.S. On-SEF Trading Share ............................................................... 65
4.10.19 U.S. On-SEF Trading Volume ............................................................ 65
4.10.20 Interest Rate Derivatives Market Activity by Currency ........................ 65
4.11.1 BHC Total Assets .............................................................................. 66
4.11.2 Common Equity Tier 1 Ratios ........................................................... 66
4.11.3 Return on Equity and Return on Assets ............................................ 66
4.11.4 Net Interest Margins .......................................................................... 67
4.11.5 Litigation Expenses at Selected BHCs .............................................. 67
4.11.6 Loan-to-Asset Ratios ........................................................................ 67
4.11.7 Loan Loss Reserves ......................................................................... 68
4.11.8 Non-Performing Loans ...................................................................... 68
4.11.9 Higher-Risk Securities ....................................................................... 68
4.11.10 Initial and Stressed Tier 1 Common Capital Ratios ............................ 69
4.11.11 Federal Reserve’s Actions in CCAR 2015 .......................................... 69
4.11.12 Selected High-Quality Liquid Assets at BHCs ................................... 69
4.11.13 Selected Liquid Assets at Standard LCR BHCs ................................ 70
4.11.14 Net Stable Funding Ratio at Standard LCR BHCs ............................. 70
4.11.15 Weighted-Average Duration Gap ....................................................... 70
4.11.16 P/B and P/E Ratios of Six Large Complex BHCs ............................... 71
4.11.17 CDS Spreads of Six Large Complex BHCs ....................................... 71
4.11.18 Number of Deals by Size of Pro Forma Bank .................................... 71
4.11.19 FDIC-Insured Failed Institutions ......................................................... 72
4.11.20 Commercial Bank and Thrift Pre-Tax Income .................................... 72
4.11.21 U.S. Branches and Agencies of Foreign Banks: Assets ..................... 72
4.11.22 Cash Assets of U.S. Branches and Agencies of Foreign Banks......... 73
2 0 1 6 F S O C / / Annual Report152
4.11.23 U.S. Branches and Agencies of Foreign Banks: Liabilities ................. 73
4.11.24 Credit Union Income ......................................................................... 74
4.11.25 Credit Union Deposits ....................................................................... 74
4.11.26 Credit Union Net Long-Term Assets .................................................. 74
4.11.27 Credit Union Investments by Maturity ................................................ 75
4.12.1 Number of Broker-Dealers and Industry Net Income ......................... 76
4.12.2 Broker-Dealer Revenues ................................................................... 76
4.12.3 Broker-Dealer Assets and Leverage .................................................. 76
4.12.4 Large Broker-Dealer Assets and Leverage by Affiliation .................... 77
4.12.5 Primary Dealer Securities .................................................................. 77
4.12.6 Selected U.S. Financial Holding Companies and Insurers ................. 78
4.12.7 Insurance Industry Net Income ......................................................... 78
4.12.8 Net Yield on Invested Assets ............................................................. 78
4.12.9 Insurance Industry Capital and Surplus ............................................. 79
4.12.10 Consumer Loans and Leases Outstanding ....................................... 79
4.12.11 Business Loans and Leases Outstanding ......................................... 79
4.12.12 Subprime Auto Lending .................................................................... 80
4.12.13 ABS Issuance ................................................................................... 80
4.12.14 Selected ABS Spreads ..................................................................... 80
4.12.15 Agency REIT Assets and Leverage ................................................... 81
4.12.16 Agency REIT Price-to-Book Ratio ..................................................... 81
4.13.1 MMF Assets by Fund Type ................................................................ 82
4.13.2 Liquid Asset Shares of Prime MMFs ................................................. 83
4.13.3 Weighted-Average Maturity of MMFs ................................................ 83
4.13.4 Net Assets of the Investment Company Industry ............................... 83
4.13.5 Monthly Bond Mutual Fund Flows ..................................................... 84
4.13.6 Monthly Equity Mutual Fund Flows .................................................... 84
4.13.7 Bank Loan Mutual Funds: Annual Flows ........................................... 84
4.13.8 High-Yield Mutual Funds: Annual Flows ............................................ 85
4.13.9 Alternative Mutual Funds: Annual Flows ............................................ 85
4.13.10 Cumulative Equity Fund Flows .......................................................... 85
4.13.11 U.S.-Listed ETP AUM and Count ...................................................... 87
4.13.12 Retirement Fund Assets by Plan Type ............................................... 87
4.13.13 Public and Private Pension Funding Levels ....................................... 88
4.13.14 U.S. Private Equity AUM ....................................................................90
4.13.15 M&A Loan Volume for Private Equity-Backed Issuers ........................90
6.1.1 Systemic Risk Measures ..................................................................110
6.3.1 Equity Prices and Volatility ...............................................................114
6.3.2 Crude Oil Prices and Volatility ..........................................................114
6.3.3 Aggregate Tier 1 Capital Ratio at Domestic BHCs ...........................116
153L is t o f Char ts
F.1 Selected Sector High-Yield Spreads ................................................118
F.2 Expected Year-Ahead Defaults of Oil Firms ......................................118
H.1 Corporate Bond Turnover ............................................................... 125
H.2 Primary Dealer Positions and Transactions ..................................... 125
H.3 U.S. Treasury Security Turnover and Official Sector Holdings .......... 125
H.4 Selected Bid/Offer Spreads ............................................................ 125