
Financial results Q1 2017 - SHW · 2017-12-04 · Q1 2016 Q1 2017. 3 > Sales development as...
17
Outlook for fiscal year 2017 confirmed Financial results Q1 2017 Analyst and Investor Conference Call, 3 May 2017
Transcript of Financial results Q1 2017 - SHW · 2017-12-04 · Q1 2016 Q1 2017. 3 > Sales development as...
Outlook for fiscal year 2017 confirmed
Financial results Q1 2017
Analyst and Investor Conference Call, 3 May 2017

1
Agenda
> Financial results January to March 2017
> Outlook for fiscal year 2017
Drive international growth and leverage
innovation leadership

2
Stable market environment in Q1 2017
SHW well positioned to benefit from structural market changes and strong demand
for mobility solutions
> Light vehicle production: +
4.2 per cent to 24.0 million
units with marked growth
rate differences
> Gasoline engines gain
further market share; diesel
engines stable
> Above-average growth rates
for automatic transmissions
– global production
increased by 8.0 per cent to
14.0 million units
Light Vehicle Production(< 6 t) (m units)
Source: IHS, April 2017
Global Engine Production(m units)
Global Transmission Production(m units)
104.3106.6
SHW Group Sales (€m)
4.94.8
Gasoline
18.918.1
Diesel
13,0
10,0
14,0
9,8
AutomaticManual
5.95.5
China
6.76.5
South
America
0.70.6
North
America
4.54.5
Europe
Q1 2016
Q1 2017
3
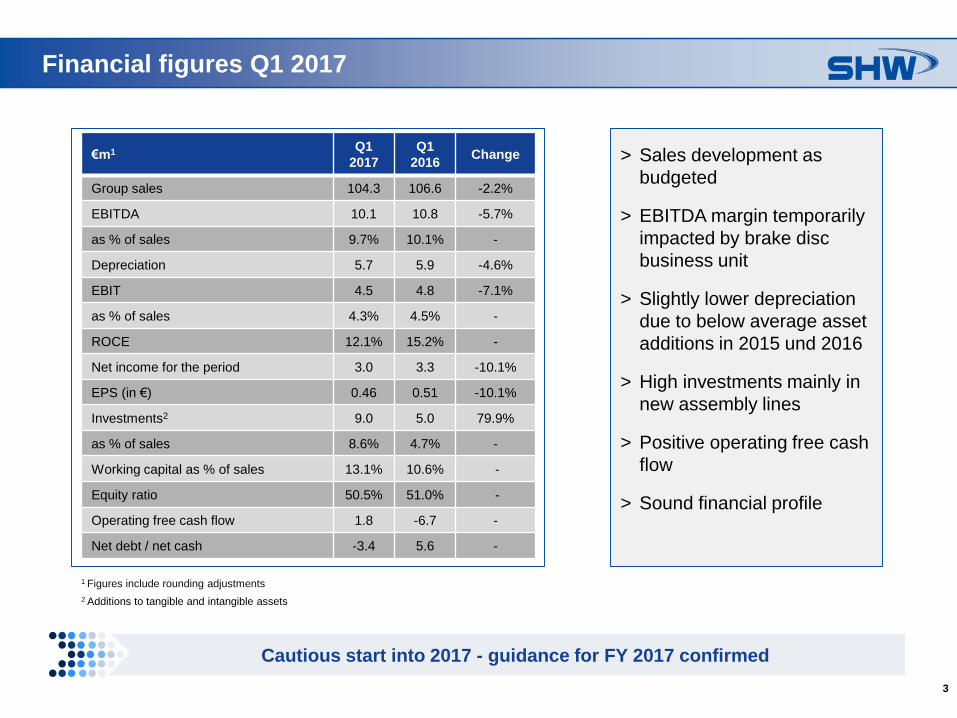
> Sales development as
budgeted
> EBITDA margin temporarily
impacted by brake disc
business unit
> Slightly lower depreciation
due to below average asset
additions in 2015 und 2016
> High investments mainly in
new assembly lines
> Positive operating free cash
flow
> Sound financial profile
Financial figures Q1 2017
Cautious start into 2017 - guidance for FY 2017 confirmed
€m1 Q1
2017
Q1
2016Change
Group sales 104.3 106.6 -2.2%
EBITDA 10.1 10.8 -5.7%
as % of sales 9.7% 10.1% -
Depreciation 5.7 5.9 -4.6%
EBIT 4.5 4.8 -7.1%
as % of sales 4.3% 4.5% -
ROCE 12.1% 15.2% -
Net income for the period 3.0 3.3 -10.1%
EPS (in €) 0.46 0.51 -10.1%
Investments2 9.0 5.0 79.9%
as % of sales 8.6% 4.7% -
Working capital as % of sales 13.1% 10.6% -
Equity ratio 50.5% 51.0% -
Operating free cash flow 1.8 -6.7 -
Net debt / net cash -3.4 5.6 -
2 Additions to tangible and intangible assets
1 Figures include rounding adjustments
4
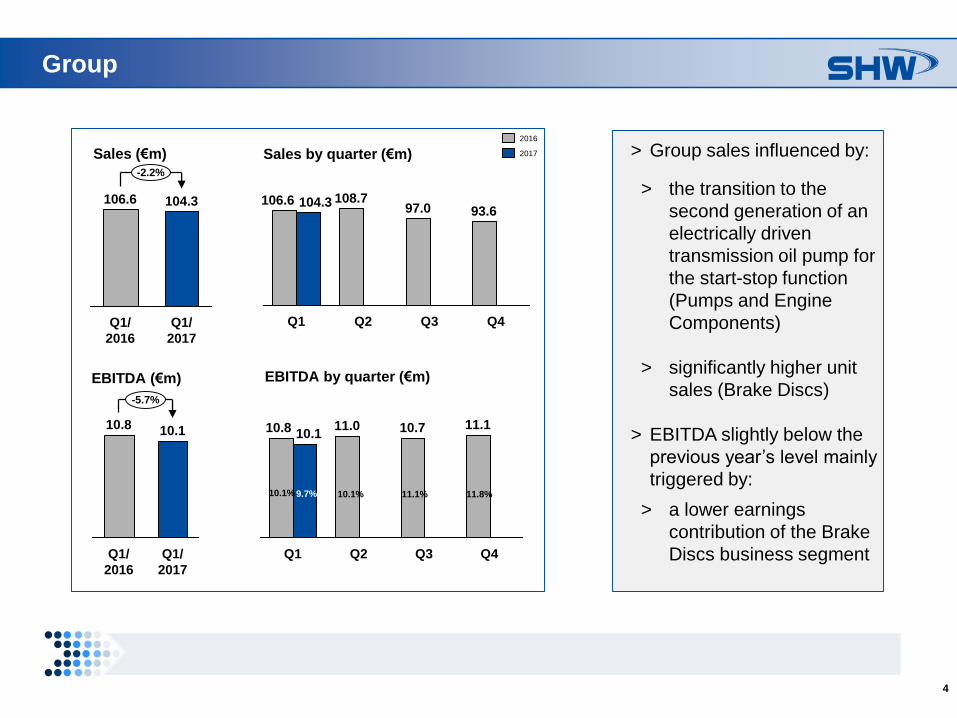
Group
Sales by quarter (€m)
EBITDA (€m)
Sales (€m)
Q1/
2017
104.3
Q1/
2016
106.6
-2.2%
Q4
93.6
Q3
97.0
Q2
108.7
Q1
104.3106.6
10.8
-5.7%
Q1/
2017
10.1
Q1/
2016
> Group sales influenced by:
> the transition to the
second generation of an
electrically driven
transmission oil pump for
the start-stop function
(Pumps and Engine
Components)
> significantly higher unit
sales (Brake Discs)
> EBITDA slightly below the
previous year’s level mainly
triggered by:
> a lower earnings
contribution of the Brake
Discs business segment
EBITDA by quarter (€m)
Q4
11.1
Q3
10.7
Q2
11.0
Q1
10.110.8
10.1%
2016
2017
9.7% 10.1% 11.1% 11.8%
5
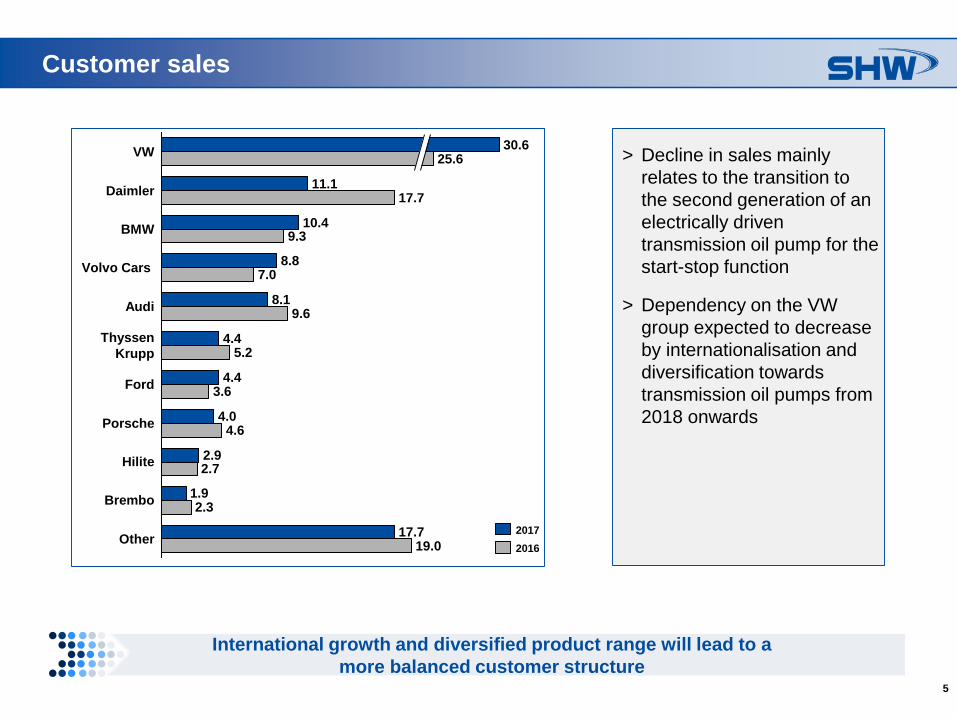
Customer sales
International growth and diversified product range will lead to a
more balanced customer structure
> Decline in sales mainly
relates to the transition to
the second generation of an
electrically driven
transmission oil pump for the
start-stop function
> Dependency on the VW
group expected to decrease
by internationalisation and
diversification towards
transmission oil pumps from
2018 onwards
VW
Other
3.6
4.6
Ford
4.0
2.7
Porsche
2.9
2.3
Hilite
1.9
19.0
Brembo
17.7
4.4
9.6
Volvo Cars
8.1
5.2
Audi
4.4
7.08.8
Daimler11.1
17.7
BMW10.4
9.3
30.625.6
Thyssen
Krupp
2016
2017
6
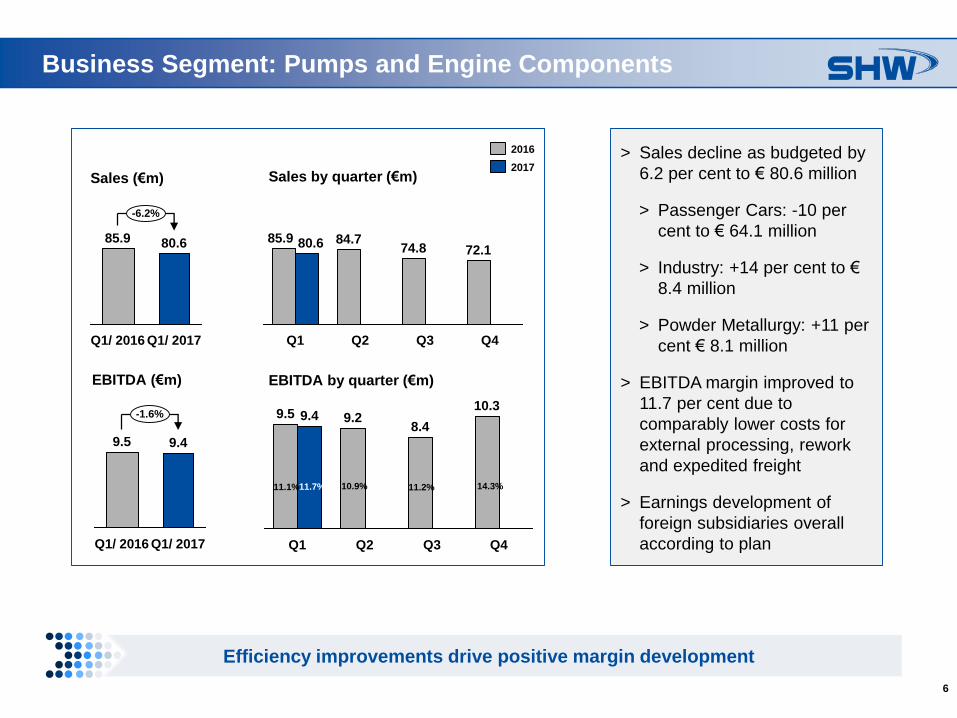
Business Segment: Pumps and Engine Components
Efficiency improvements drive positive margin development
> Sales decline as budgeted by
6.2 per cent to € 80.6 million
> Passenger Cars: -10 per
cent to € 64.1 million
> Industry: +14 per cent to €
8.4 million
> Powder Metallurgy: +11 per
cent € 8.1 million
> EBITDA margin improved to
11.7 per cent due to
comparably lower costs for
external processing, rework
and expedited freight
> Earnings development of
foreign subsidiaries overall
according to plan
Sales by quarter (€m)
EBITDA (€m)
Sales (€m)
Q4
74.8 72.185.9 80.6 84.7
Q2Q1 Q3Q1/ 2016
80.685.9
Q1/ 2017
-6.2%
EBITDA by quarter (€m)
10.3
8.4
Q3
9.2
Q2 Q4Q1
9.49.5
11.1%11.7% 10.9% 11.2% 14.3%
2017
2016
Q1/ 2016
9.49.5
Q1/ 2017
-1.6%
7
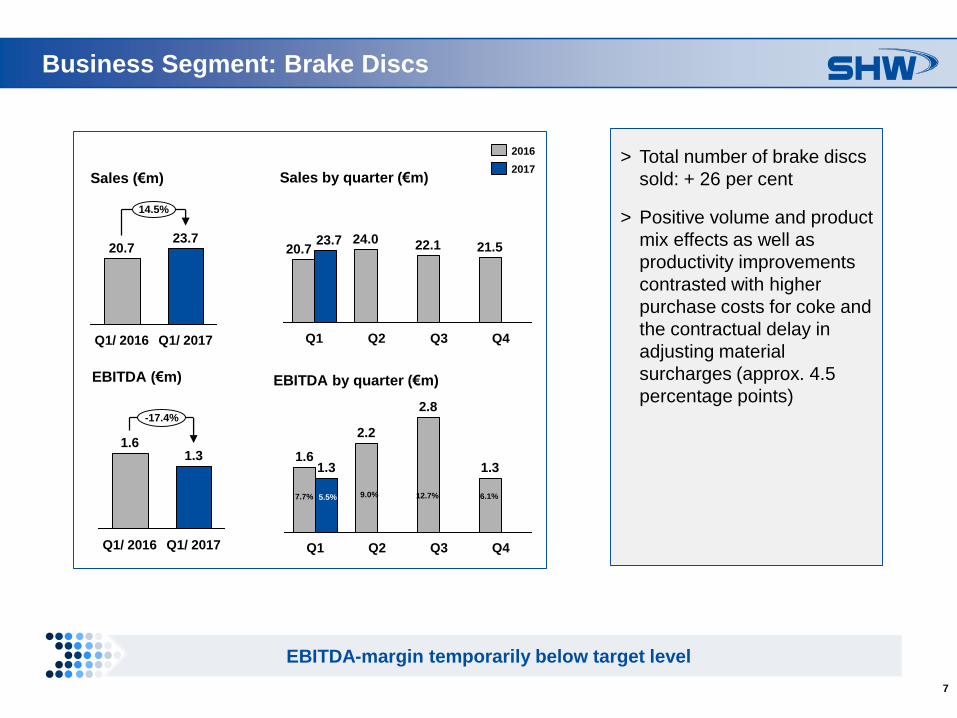
Business Segment: Brake Discs
EBITDA-margin temporarily below target level
> Total number of brake discs
sold: + 26 per cent
> Positive volume and product
mix effects as well as
productivity improvements
contrasted with higher
purchase costs for coke and
the contractual delay in
adjusting material
surcharges (approx. 4.5
percentage points)
Q4
21.5
Q3
22.1
Q2
24.0
Q1
23.720.7
Q1/ 2016
20.7
14.5%
Q1/ 2017
23.7
Q4
1.3
Q3
2.8
Q2
2.2
Q1
1.31.6
7.7% 5.5% 9.0% 12.7%
2017
2016
Sales by quarter (€m)Sales (€m)
EBITDA (€m) EBITDA by quarter (€m)
6.1%
-17.4%
Q1/ 2017
1.3
Q1/ 2016
1.6
8
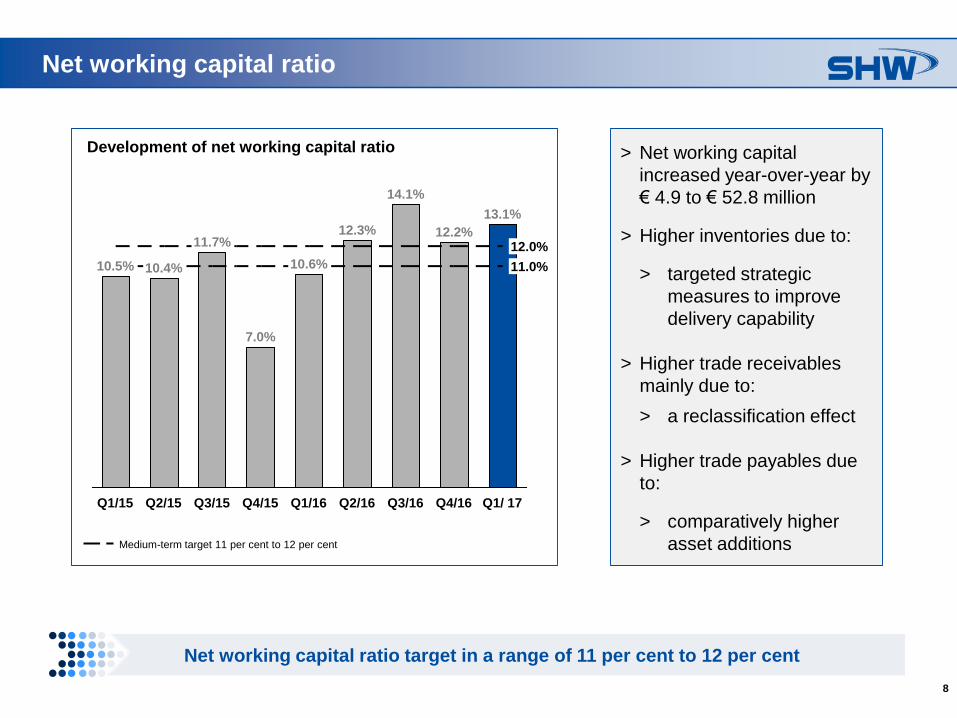
Net working capital ratio
Net working capital ratio target in a range of 11 per cent to 12 per cent
> Net working capital
increased year-over-year by
€ 4.9 to € 52.8 million
> Higher inventories due to:
> targeted strategic
measures to improve
delivery capability
> Higher trade receivables
mainly due to:
> a reclassification effect
> Higher trade payables due
to:
> comparatively higher
asset additions
13.1%
Q1/15
10.5%
12.3%
Q1/16
10.6%
Q4/15
7.0%
Q3/15
11.7%
Q2/15
10.4%
Q1/ 17
12.0%
11.0%
Q4/16
12.2%
Q3/16
14.1%
Q2/16
Development of net working capital ratio
Medium-term target 11 per cent to 12 per cent

9
Investments and depreciation
> Investments in property,
plant and equipment and
intangible assets at a total of
€ 9.0 million
> Pumps & Engine
Components: mainly for new
assembly lines in Germany
and China (total: € 7.5m)
> Brake Discs: mainly for
second automated
aluminium casting line (total:
€ 1.4m)
> Slightly lower depreciation
due to below average asset
additions in 2015 und 2016
Investments by quarter (€m)
Depreciation (€m) Depreciation by quarter (€m)
Investments (€m)
9.0
5.0
Q4
8.0
Q3
6.8
Q2
4.9
Q1
5.9
Q1
2017
5.7
Q1
2016
5.75.9
Q4
6.3
Q3
6.1
Q2
6.2
Q1
Q1
2017
9.0
Q1
2016
5.0
5.6%
4.7%
2017
2016
5.4% 5.8% 6.3%
4.5% 7.0%8.4% 8.6%
6.3%

10
> Operating cash flow
improved mainly due to a
significant increase in trade
payables
> Total free cash flow
influenced by payment of
second purchase price
instalment for joint venture
SHW Longji Brake Discs
Cash Flow
Strong focus on operating free cash flow
(€m)1 Q1 2017 Q1/2016
Cash flow from operating activities 10.6 -1.7
Cash flow from investing activities
- tangible and intangible assets
-8.8 -5.0
Operating free cash flow 1.8 -6.7
Cash flow from investing activities
- financial assets-6.8 -0.0
Total free cash flow -5.0 -6.7
Other (esp. capital increase / dividend
payment) 0.0 -0.1
Change in net cash -5.0 -6.8
1 Figures include rounding adjustments
11
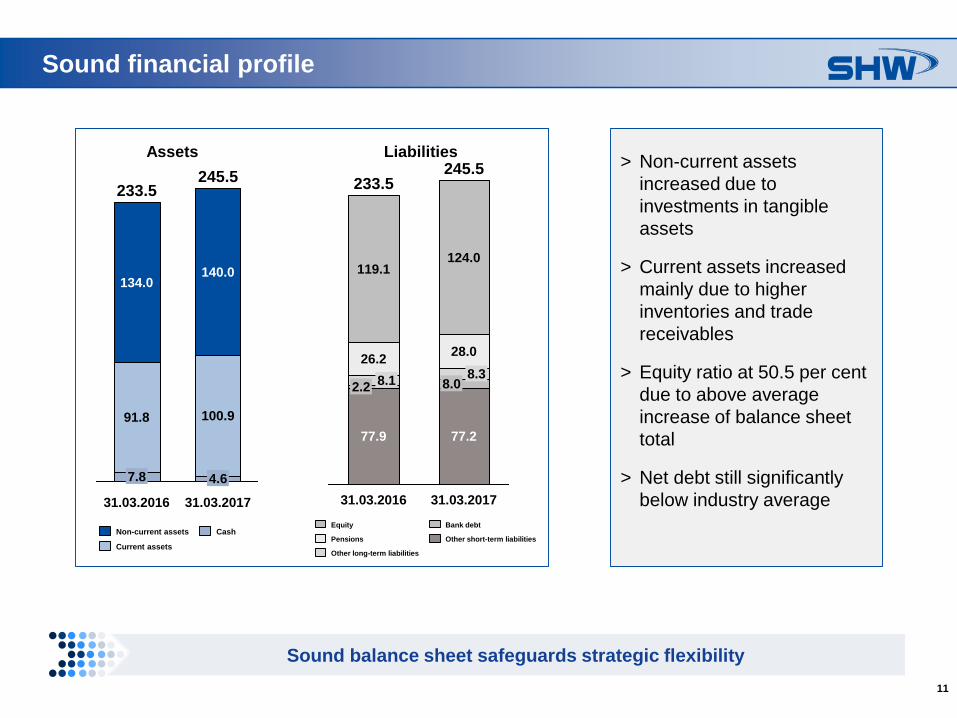
> Non-current assets
increased due to
investments in tangible
assets
> Current assets increased
mainly due to higher
inventories and trade
receivables
> Equity ratio at 50.5 per cent
due to above average
increase of balance sheet
total
> Net debt still significantly
below industry average
Sound financial profile
Sound balance sheet safeguards strategic flexibility
31.03.2017
8.08.3
28.0
245.5
77.2
233.5
31.03.2016
124.0
77.9
2.2
119.1
8.1
26.2
LiabilitiesAssets
31.03.2017
91.8
134.0
233.5
7.8
100.9
140.0
31.03.2016
245.5
4.6
Current assets
CashNon-current assetsOther short-term liabilities
Other long-term liabilities
Bank debtEquity
Pensions
12
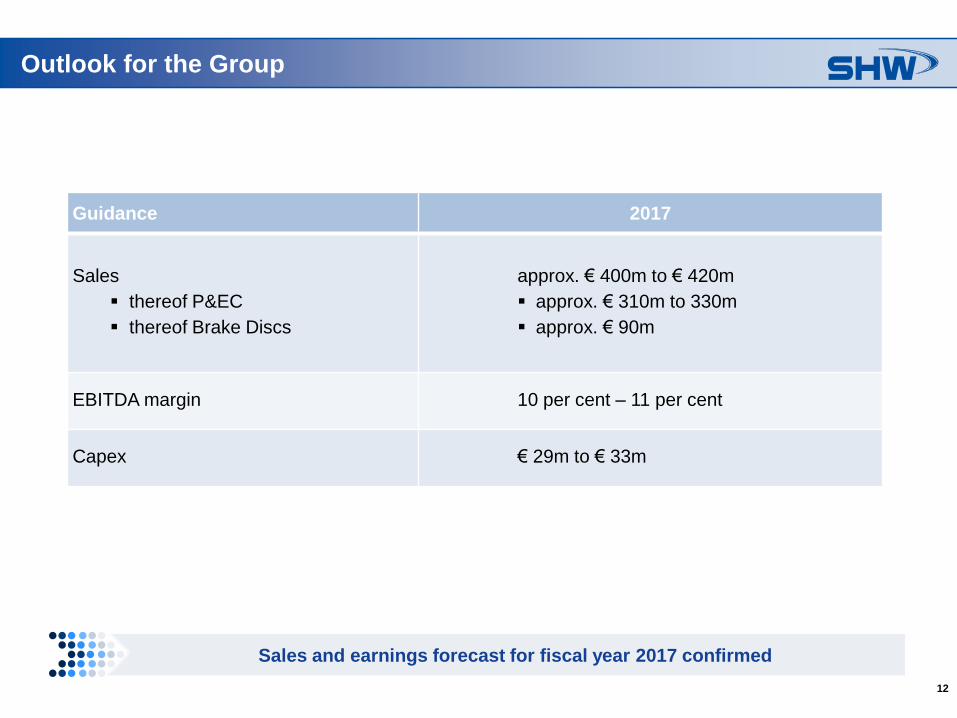
Outlook for the Group
Guidance 2017
Sales
thereof P&EC
thereof Brake Discs
approx. € 400m to € 420m
approx. € 310m to 330m
approx. € 90m
EBITDA margin 10 per cent – 11 per cent
Capex € 29m to € 33m
Sales and earnings forecast for fiscal year 2017 confirmed
13
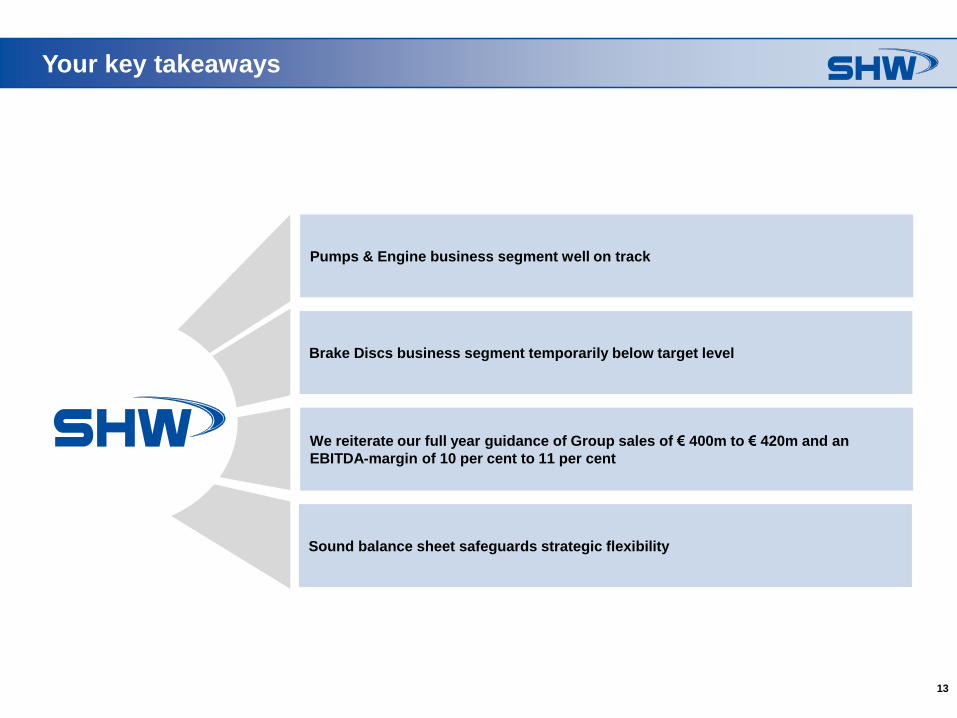
Your key takeaways
Pumps & Engine business segment well on track
Brake Discs business segment temporarily below target level
We reiterate our full year guidance of Group sales of € 400m to € 420m and an
EBITDA-margin of 10 per cent to 11 per cent
Sound balance sheet safeguards strategic flexibility
14
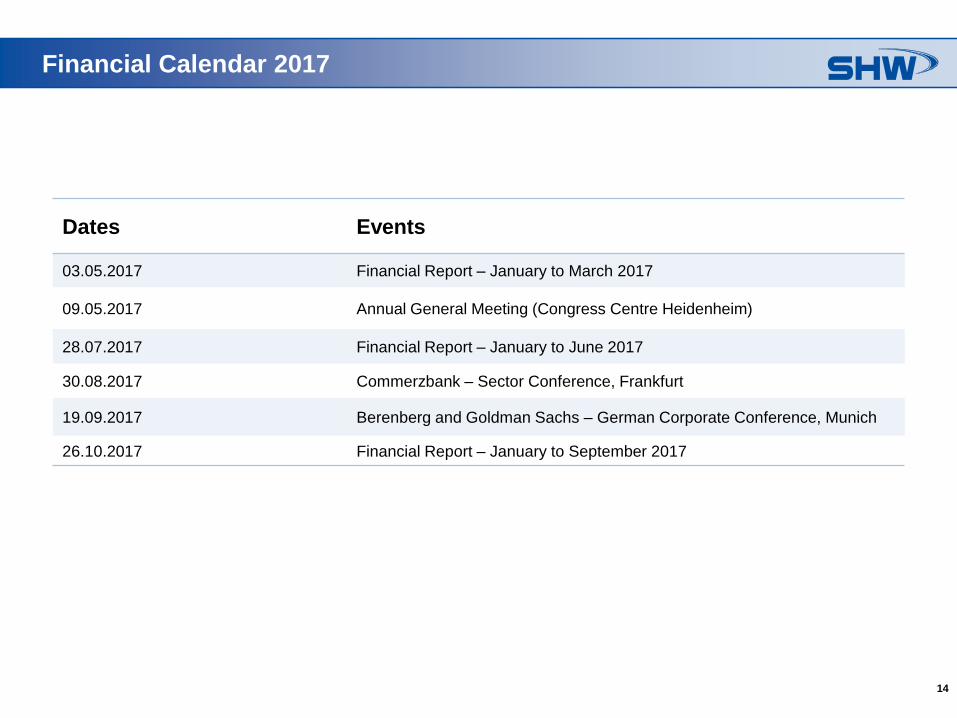
Financial Calendar 2017
Dates Events
03.05.2017 Financial Report – January to March 2017
09.05.2017 Annual General Meeting (Congress Centre Heidenheim)
28.07.2017 Financial Report – January to June 2017
30.08.2017 Commerzbank – Sector Conference, Frankfurt
19.09.2017 Berenberg and Goldman Sachs – German Corporate Conference, Munich
26.10.2017 Financial Report – January to September 2017
15
Michael SchicklingHead of Investor Relations & Corporate Communications
Telephone: +49 (0) 7361 502-462
E-Mail: [email protected]
Sandra SchererJunior Manager Investor Relations & Corporate Communications
Telephone: +49 (0) 7361 502-469
E-Mail: [email protected]
Contact Investor Relations
16
Disclaimer
No offer or investment recommendation
This document, which has been issued by SHW AG (the “Company” or “SHW”), does not constitute an offer to sell, or the solicitation of an offer to subscribe for or
buy, any shares in the Company, nor shall it or any part of it nor the fact of its distribution form the basis of, or be relied on in connection with, any contract or
investment decision in relation thereto.
The contents of this presentation are may not be reproduced, redistributed or passed on, directly or indirectly, to any other person or published, in whole or in part,
for any purpose. Neither the Company nor any other party is under any duty to update or inform you of any changes to such information. In particular, it should be
noted that financial information relating to the Company contained in this document has not been audited and in some cases is based on management information
and estimates.
This material is given in conjunction with an oral presentation and should not be taken out of context.
Certain market data and financial and other figures (including percentages) in this document were rounded in accordance with commercial principles. Figures
rounded may not in all cases add up to the stated totals or the statements made in the underlying sources. For the calculation of percentages used in the text, the
actual figures, rather than the commercially rounded figures, were used. Accordingly, in some cases, the percentages provided in the text may deviate from
percentages based on rounded figures.
Future Oriented Statements
Certain statements in this presentation are forward-looking statements. By their nature, forward-looking statements involve a number of risks, uncertainties and
assumptions that could cause actual results or events to differ materially from those expressed or implied by the forward‐looking statements. These risks,
uncertainties and assumptions could adversely affect the outcome and financial consequences of the plans and events described herein.
No obligation to update the information
The Company does not undertake any obligation to update or revise any forward-looking statements, whether as a result of new information, future events or
otherwise, except as otherwise required by applicable laws and regulations. You should not place undue reliance on forward-looking statements, which speak as
only of the date of this presentation. Statements contained in this presentation regarding past trends or events should not be taken as a representation that such
trends or events will continue in the future.


![Welcome [] · 15/12/2017 · 2012 q1 2013 q1 2014 q1 2015 q1 2016 q1 2017 q1 unemployment rate, lhs (% labour force, seasonally adjusted) Job vacancies rate, rhs (%labour force,](https://static.fdocuments.in/doc/165x107/5f9663c45f9e000e8c444eed/welcome-15122017-2012-q1-2013-q1-2014-q1-2015-q1-2016-q1-2017-q1-unemployment.jpg)


