Financial Results for 3Q FY2020
15
Financial Results for 3Q FY2020 (December 1, 2019 – February 29, 2020) April 2, 2020
Transcript of Financial Results for 3Q FY2020
Financial Results for 3Q FY2020(December 1, 2019 – February 29, 2020)
April 2, 2020

Copyright 2020 SankyoTateyama, Inc. All Rights Reserved 1
Summary of Financial Results for 3Q FY2020

Copyright 2020 SankyoTateyama, Inc. All Rights Reserved
Financial Overview for 3Q FY2020
2
✔ Operating income increased by approx. 1.3 billion yen (+262.6%)
・Construction materials business; increased significantly due to improve profitability in
the sales and production divisions and aluminum ingot prices remaining at a low level
compared to last fiscal year.
・Materials business and Global business; decreased mainly due to a decline in sales.
✔ Sales decreased by approx. 15.6 billion yen (-6.2%)
・Construction materials business; decreased due to reactionary drop after consumption
tax hike and convergence of disaster recovery demand.
・Materials businesses; decreased due to the impacts of US-China trade friction and the
spread of new coronavirus infection
・Commercial facilities business; decreased due to withholding of the launching of new
retail stores.
・Global businesses; decreased due to slowdown in European economy.
✔ Sales down, Operating income up YoY
Sales decreased in all businesses.

Copyright 2020 SankyoTateyama, Inc. All Rights Reserved
Summary of Financial Results for 3Q FY2020
3
(Billion JPY)
* Amounts are rounded down to the nearest 100 million JPY
FY2020 3Q FY2019 3Q
Results Results %
Net sales 236.3 251.9 -15.6 ー6.2%
Operating income 1.8 0.5 1.3 +262.6%
Operating margin 0.8% 0.2% +0.6p
Ordinary income 1.9 0.7 1.1 +148.3%
-0.6 -0.4 -0.2 -
Year-on-year Change
Quarterly net income
attributable to owners of parent

Copyright 2020 SankyoTateyama, Inc. All Rights Reserved
-0.00.10.7
3.52.1
1.0
-2.1 -2.7
Constructionmaterials
Materials
Commercialfacilities
Results
3Q FY2019 3Q FY2020
0.5
Globalbusiness
1.8
-0.5
+2.7
-1.0
+0.2
1.8 billion JPY
+1.3 billion JPY
(+262.6%)
YoY
236.3 billion JPY
-15.6 billion JPY
(-6.2%)
YoY
Review of Consolidated Financial Results for Q3 FY2020:
Year-on-Year Comparison
Net sales Operating income
4
* Amounts are rounded down to the nearest 100 million JPY.
152.2 146.7
34.3 30.0
29.8 28.4
35.431.0
Constructionmaterials
Materials
Commercialfacilities
Results
3Q FY2019
251.9 236.3Global
business
3Q FY2020
-5.4
-4.3
-1.3
-4.4
Copyright 2020 SankyoTateyama, Inc. All Rights Reserved
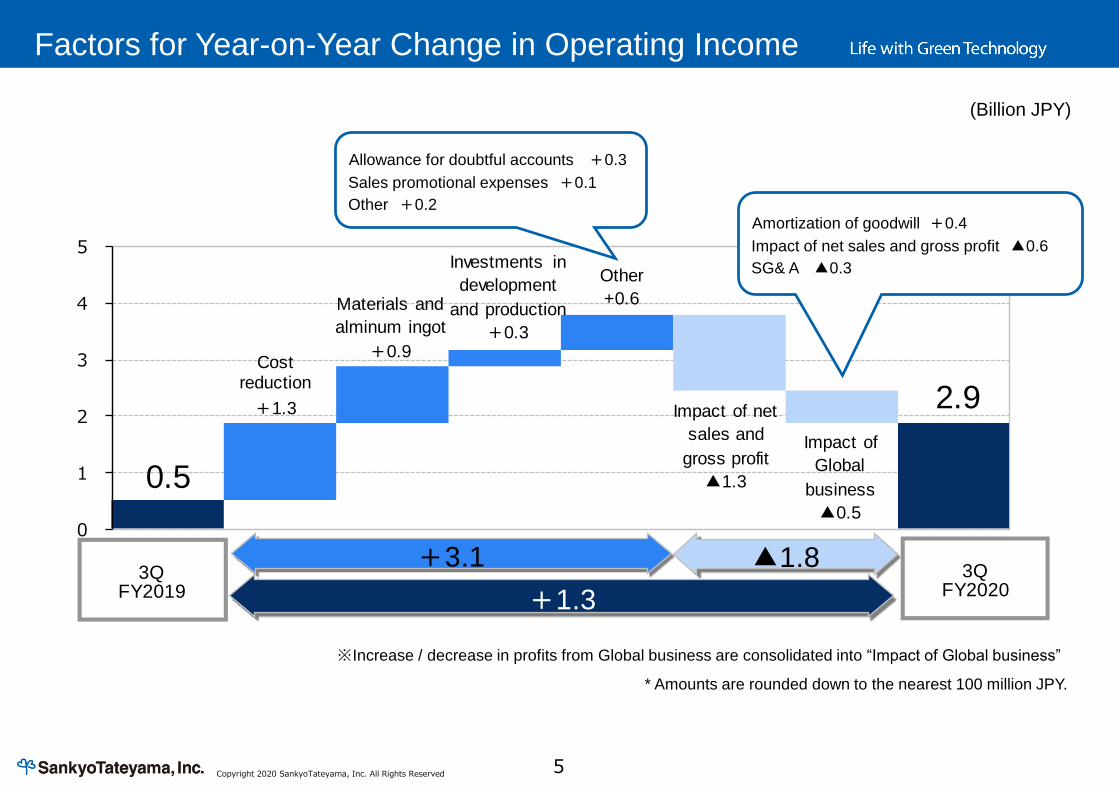
0
1
2
3
4
5
▲1.8+3.1
+1.33Q
FY20193Q
FY2020
2.9
0.5
Cost reduction
+1.3 Impact of net
sales and
gross profit
▲1.3
Impact of
Global
business
▲0.5
Investments in
development
and production
+0.3
Other
+0.6Materials and
alminum ingot
+0.9
5
Factors for Year-on-Year Change in Operating Income
Amortization of goodwill +0.4
Impact of net sales and gross profit ▲0.6
SG& A ▲0.3
Allowance for doubtful accounts +0.3
Sales promotional expenses +0.1
Other +0.2
(Billion JPY)
* Amounts are rounded down to the nearest 100 million JPY.
※Increase / decrease in profits from Global business are consolidated into “Impact of Global business”

Copyright 2020 SankyoTateyama, Inc. All Rights Reserved
FY2020 FY2020
Revised forecast Previous forecast Change %
Net sales 318.0 338.0 -20.0 -5.9%
Operating income 2.5 4.0 -1.5 -37.5%
Operating margin 0.8% 1.2% -0.4p
Ordinary income 1.8 3.7 -1.9 -51.4%
Undecided 1.4 - -Profit attributable to owners of
the parent
6
【Reasons to revise of full-year performance forecast】
The business environment is changing daily, with the European and Chinese economies
are slowing down and the spread of the new coronavirus worldwide is affecting the
economy. Based on these circumstances and the results of the last three quarters, sales,
operating income and ordinary income are expected to be lower than previously announced
forecasts.
Profit attributable to owners of the parent has not been determined since it is difficult to
estimate reasonably. The large fluctuations in the stock market, in addition to signs of
impairment of subsidiaries are recognized due to changes in the economic environment.
Revision to Full-Year Performance Forecast for FY2020
(Billion JPY)
* Amounts are rounded down to the nearest 100 million JPY

Copyright 2020 SankyoTateyama, Inc. All Rights Reserved
FY2019 FY2018 FY2017
[Construction materials business (housing) index] 690 thousand units 737 thousand units 741 thousand units
The number of new housing starts (April-December) (-6.5% yoy) (-0.5% yoy) (-1.3% yoy)
The number of new housing starts 223 thousand units 222 thousand units 310 thousand units
[owner-occupied houses](April-December) (+0.5% yoy) (-28.4% yoy) (-2.6% yoy)
The number of new housing starts 261 thousand units 309 thousand units 323 thousand units
[house for rent](April-December) (-15.5% yoy) (-4.3% yoy) (-2.4% yoy)
54,762 thousand ㎡ 58,069 thousand ㎡ 59,678 thousand ㎡
(-5.7% yoy) (-2.7% yoy) (+1.8% yoy)
266.6 thousand tons 270.4 thousand tons 274.2 thousand tons
(-1.4% yoy) (-1.4% yoy) (+5.0% yoy)
5,076 buildings 5,847 buildings 6,100 buildings
(-13.2% yoy) (-4.1% yoy) (-7.0% yoy)
247.1 JPY/kg 292.7 JPY/kg 279.6 JPY/kg
(-15.6% yoy) (+4.7% yoy) (+23.9% yoy)
[Materials business index]
Aluminum extrusion weight [excluding sashes and
doors](April-December)
[Aluminum ingot (The Nikkei)]
Average prices for the period from April to December
[Construction materials business (building) index]
Floor area of non-wooden structure starts
(April-December)
[Commercial facilities business index]
The number of new building starts [stores]
(April-December)
7
Business Environment
Figures in parentheses are year-on-year.

Copyright 2020 SankyoTateyama, Inc. All Rights Reserved
-15.6%-8.8%-5.7%-6.5%
+0.5%
3.5 billion JPY
+2.7 billion JPY
(357.9%)
YoY
8
Business Environment
Net sales Operating income
Business Environment and Financial Results
- Construction material business -
146.7 billion JPY
-5.4 billion JPY
(-3.6%)
YoY YoY
Number of new housing
starts
Floor area of non-wooden
structure starts
Sales weight of aluminum
sash for buildingsAluminum ingot price(Source: Nikkei)
* Percentage figures represent the year-on-year
change in cumulative total during April-December.
Source: Current Survey of Production by
the Ministry of Economy, Trade and
Industry
Source: Report of Statistical Survey of
Construction Starts by the Ministry of Land,
Infrastructure, Transport and TourismSource: Report of Statistical Survey of
Construction Starts by the Ministry of Land,
Infrastructure, Transport and Tourism
Whole
Owner-
occupied
houses
* Amounts are rounded down to the nearest 100 million JPY.
・Reactionary drop after consumption tax hike
・Convergence of disaster recovery demand in the
exterior construction segment
・Promote profitability improvement in sales and
production divisions
・Aluminum ingot prices remain at low level

Copyright 2020 SankyoTateyama, Inc. All Rights Reserved
-15.4%-1.4%
* Amounts are rounded down to the nearest 100 million JPY.
1.0 billion JPY
-1.0 billion JPY
(-50.5%)
YoY
30.0 billion JPY
-4.3 billion JPY
(-12.6%)
YoY YoY
9
Business Environment
Net sales Operating income
Business Environment and Financial Results
- Materials business -
Domestic aluminum extrusion weight(excluding sashes and doors)
Source: Statistics by Japan Aluminum Association
Domestic aluminum extrusion weight(general machinery)
Source: Statistics by Japan Aluminum Association
* Percentage figures represent the year-on-year
change in cumulative total during April-December.
・Decrease in demand for general machinery due
to impact from U.S.-China trade friction and the
spread of new coronavirus infections
・Severe competitive environment and reduced
sales linked to the aluminum ingot market
・Downturn in rate of operation alongside
reduced order volume, etc.

Copyright 2020 SankyoTateyama, Inc. All Rights Reserved
-0.2%-13.2%
0.1 billion JPY
+0.2 billion JPY
( - %)
YoY
28.4 billion JPY
-1.3 billion JPY
(-4.7%)
YoY YoY
10
Business Environment
Net sales Operating income
Business Environment and Financial Results
- Commercial facilities business -* Amounts are rounded down to the nearest 100 million JPY.
* Percentage figures represent the year-on-year
change in cumulative total during April-December.
Number of new building starts (stores)
Source: Report of Statistical Survey of Construction
Starts by the Ministry of Land, Infrastructure, Transport
and Tourism
Retail sales amount (whole)
Source: Report of Current Survey of Commerce by the
Ministry of Economy, Trade and Industry
・Acquisition of demand for store renovation for
manpower-saving and work efficiency
・Decreased demand for launching of new retail
stores
・Improve profitability by improving work efficiency

Copyright 2020 SankyoTateyama, Inc. All Rights Reserved
-2.7 billion JPY
-0.5 billion JPY
( - %)
YoY
0.1% -0.2% 2.3%
0.3% 0.2% 2.6%
0.1% 0.0% 1.6%
-13.3% -2.4%
-0.6% -7.5%
-8.3% -21.7%
Gross Domestic Product(GDP)
YoY
( Apr.-Jun. 2019)
( Jul.-Sep. 2019)
( Oct.-Dec. 2019)
31.0 billion JPY
-4.4 billion JPY
(-12.5%)
YoY
11
Business Environment
Net sales Operating income
Germany
Car production
YoY
Source: VDA Source: EUROSTAT
( Apr.-Jun. 2019)
( Jul.-Sep. 2019)
(Oct.-Dec. 2019)
Thailand
Source: NESDC
Business Environment and Financial Results
- Global business -* Amounts are rounded down to the nearest 100 million JPY.
Euro area Germany Thailand
・Firm performance in Thailand
・Declining car production and demand for
machinery due to slowing European economy
・Downturn in rate of operation due to decreased
sales at European subsidiary
Copyright 2020 SankyoTateyama, Inc. All Rights Reserved
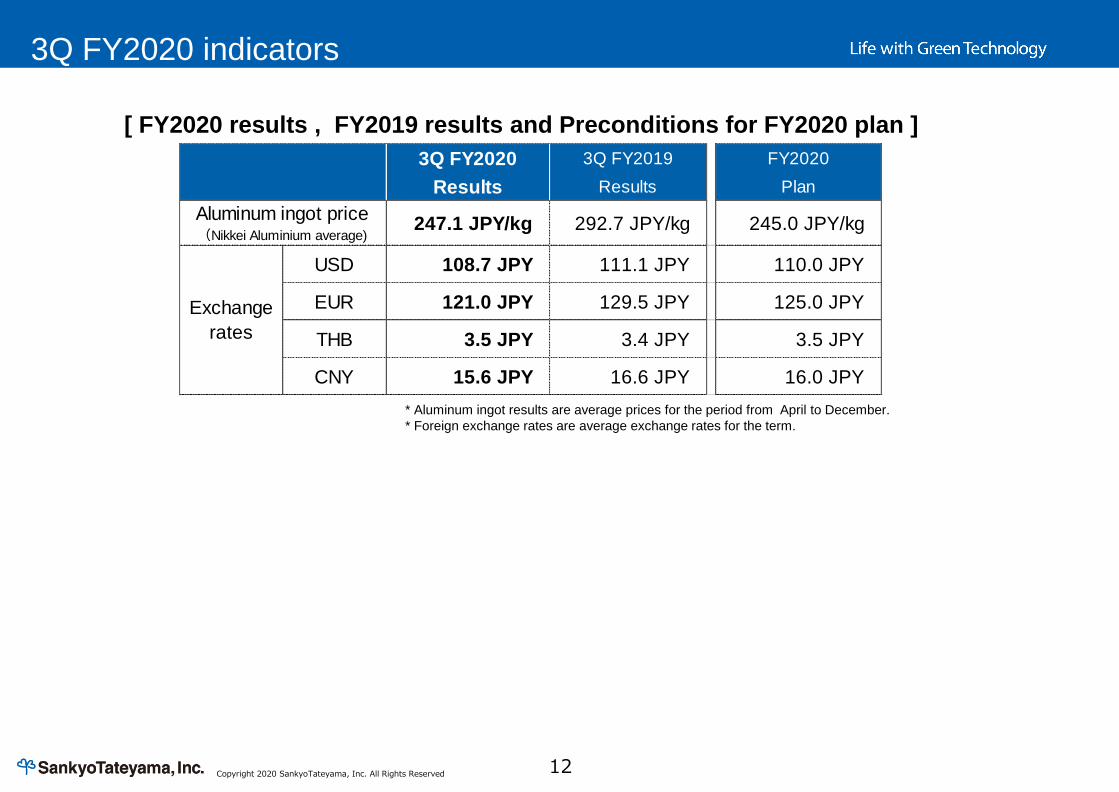
3Q FY2020 3Q FY2019 FY2020
Results Results Plan
247.1 JPY/kg 292.7 JPY/kg 245.0 JPY/kg
USD 108.7 JPY 111.1 JPY 110.0 JPY
EUR 121.0 JPY 129.5 JPY 125.0 JPY
THB 3.5 JPY 3.4 JPY 3.5 JPY
CNY 15.6 JPY 16.6 JPY 16.0 JPY
Aluminum ingot price(Nikkei Aluminium average)
Exchange
rates
[ FY2020 results , FY2019 results and Preconditions for FY2020 plan ]
12
3Q FY2020 indicators
* Aluminum ingot results are average prices for the period from April to December.
* Foreign exchange rates are average exchange rates for the term.

Copyright 2020 SankyoTateyama, Inc. All Rights Reserved
SDGs (Sustainable Development Goals) contain the ideal of a world where all people can enjoy rich and healthy lives, many of which overlap
with our management philosophy and the purposes of our CSR activities. We will continue to contribute to achieving SDGs through our daily
business activities.
CSR Activities
Sankyo Tateyama Group’s Initiatives for SDGs
ESG CSR SDGs
EEnvironment
SSociety
GGovernance
Harmony with
environment
Harmony with society
Healthy corporate activities
Promoting customer satisfaction improvement activitiesDeveloping and providing products that satisfy customer demandsEnhancing corporate governance
Enhancing risk managementPromoting complianceEnhancing information security
Promoting environmental conservation activities
Promoting development of eco-friendly products
Increasing communication with stakeholdersPromoting community-based social contribution activities
Respect for humanity
Promoting diversityImproving mental and physical health
13
Sankyo Tateyama Management Philosophy Based on cooperation encompassing clients, local communities and employees, we create new value
and contribute to realizing a world of well-being by giving custmers delight and satisfaction

Copyright 2020 SankyoTateyama, Inc. All Rights Reserved 14
[Notes regarding these documents]
These documents contain forward-looking statements, including plans, strategies, and business results of Sankyo Tateyama, Inc. and its
consolidated subsidiaries (hereinafter collectively referred to as the “Sankyo Tateyama Group”). These statements are based upon
assumptions and decisions of the Sankyo Tateyama Group that have been derived from information available as of the time of writing, and
include foreseeable and unforeseeable risks, uncertainties, and other factors. Due to these effects, the actual business results, business
activities, and financial conditions of the Sankyo Tateyama Group may vary significantly from these forward-looking statements. Additionally,
the Sankyo Tateyama Group may not necessarily revise its forward-looking statements in response to new information, future events, or other
reasons. Risks, uncertainties, and other factors that may have a material effect on the actual business results and other aspects of the
Sankyo Tateyama Group may include, but are not limited to, economic conditions in the business areas in which it operates, changes in
demand trends, and intensified price competition for the products and services of the Sankyo Tateyama Group, as well as price fluctuations of
items such as aluminum ingots.
Reproduction or retransmission of these documents is prohibited