Financial Planning: A Guide for Water and Wastewater … the lowest life cycle cost. Water and...
56
Financial Planning: A Guide for Water and Wastewater Systems
Transcript of Financial Planning: A Guide for Water and Wastewater … the lowest life cycle cost. Water and...

Financial Planning:A Guide for Water and Wastewater Systems

Rural Community Assistance Corporation
Funded by the State of New Mexico Department of Finance and Administration and the New Mexico Office of the State Engineer.
Rural Community Assistance Corporationwww.rcac.org

IntroductIon...................................................................................................................................................................... 4chapter.1..the.annual.BudgetIng.process.............................................................................................................8 STEP 1: DETERMINING YOUR ANNUAL OPERATING EXPENSES............................................................................. 10
STEP 2: SETTING ASIDE RESERVES ......................................................................................................................... 14
STEP 3: DETERMINING YOUR CURRENT REVENUE................................................................................................. 20
STEP 4: BALANCING THE BUDGET ........................................................................................................................... 22
chapter.2:..the.rate.settIng.process......................................................................................................................24 Rate Structures ......................................................................................................................................................... 26
Customer Water Usage ............................................................................................................................................. 29
Fixed and Variable Expenses.................................................................................................................................... 30
Setting the Rates ...................................................................................................................................................... 33
Customer Education to Gain Support ...................................................................................................................... 38
chapter.3:.the.6.–.Year.FInancIal.plan...................................................................................................................40 Developing a 6-year budget projection .................................................................................................................... 40
Determining revenues required from your customers to meet budget projections .............................................. 47
Conclusion ................................................................................................................................................................. 48
Key Terms ................................................................................................................................................................................. 50
References ............................................................................................................................................................................... 52
Appendix A – Define the Line Items Worksheet ..................................................................................................................... 53
Appendix B – Rate Calculating Resources ............................................................................................................................. 54
Acknowledgements .................................................................................................................................................................. 55
Contents

� 2006 EditionRural Community Assistance Corporation
IntroductionNew Mexico’s drinking water and wastewater systems will need to implement new administrative systems and management tools to allow them to adapt to the increased regulatory requirements and environmental complexities they face. These new tools will allow the systems to operate on a “business model” for long term sustainability to help address the issues of: new and stricter regulatory requirements, growing populations, increased service demands, limited water supplies, a highly variable climate, aging infrastructure, and limited state and federal funding.
Cost estimates for water and wastewater system needs in New Mexico are several billion dollars, while the existing state and federal funding sources can only meet a fraction of this need. These sources of funding are not expected to increase, and in many cases, are declining. Therefore, approaches to reducing the gap between what is needed and what funds are available will need to be adopted. In addition, funders want assurance that the investments they make in water and wastewater infrastructure will be adequately managed and maintained to ensure long term sustainability and security. This assurance will require water and wastewater systems to present convincing evidence that they possess adequate financial, technical, and managerial capacity to provide the service that their customers expect, to maintain the infrastructure necessary to provide that service, and to manage the organization technically and financially throughout the life expectancy of the improvements being financed.
To address these significant challenges, the 2005 New Mexico Legislature passed HJM86, which called for the State Engineer, in collaboration with the New Mexico Environment Department and other agencies, to “develop criteria for water system planning, performance and conservation as a condition of funding.” The results of the HJM86 efforts indicated that requiring specific standards related to water and wastewater system operation, management, and planning is the best way to ensure that the millions of dollars in annual state and federal funding is invested in the most appropriate and cost-effective projects and is provided to systems that have adequate capacity to protect that investment. The report developed in response to HJM86 recommended that systems adopt a “business model” for managing the delivery of services that includes:
• a five-year financial plan with a fully allocated rate structure;
• an asset management plan;
• a water accounting system with full metering;
• full compliance with the Safe Drinking Water Act (SDWA), the Clean Water Act (CWA), and all of the regulations of the Office of the State Engineer and the New Mexico Environment Department;
• a governance structure adequate for proper management and oversight; and
• participation in regional efforts to collaborate on long term solutions.

�2006 Edition Rural Community Assistance Corporation
In 2006, three Technical Assistance Providers and the State of New Mexico teamed-up to develop guidebooks to help water and wastewater systems better manage their water resources and plan for their future. The guidebooks are titled:
. Water.use.auditing:.a.guide.to.accurately.Measure.Water.use.and.Water.loss;
. Financial.planning:.a.guide.for.Water.and.Wastewater.systems;.and
. asset.Management:.a.guide.for.Water.and.Wastewater.systems.
These guidebooks address core issues regarding water system sustainability: auditing water use to reduce water losses and increase system efficiency, financial planning and management to ensure sufficient revenues to sustain operations, and asset management to allow the system to provide a sustained level of service at the lowest life cycle cost. Water and wastewater system owners, operators, managers, and board members will find that these guidebooks are useful tools for assessing the current status of their operations and for developing strategic plans for sustainable water and wastewater service.
These guidebooks are intended to be used together as integrated tools for efficient management to enable the system to meet future service demands and regulatory requirements and to provide for long-term sustainability. For example, asset management is a fundamental step in determining financial resources needed to operate the system and pay for system improvements, expansions, or replacements. The water auditing program can tie to asset management by providing information about the condition of some of the buried assets. The water auditing process also ties to water conservation and rate setting. Because of these ties, water and wastewater system personnel are encouraged to examine all three manuals before beginning their system evaluation. However, the guides can be used independently, allowing a water or wastewater system to implement the “business model” incrementally, starting with the system’s most pressing needs or starting with the easiest success. No matter how the system implements the practices, the ultimate goal should be incorporating all three of these tools into the system’s standard management practices.
Once initial assessments are complete, findings can and should be used by key decision makers to guide the future of the water or wastewater system. These are not “one time” activities; it will be important to reevaluate and update this information annually or whenever the system’s needs change. Over time, the use of the tools can be increased and enhanced to support more complex and sophisticated operations.
Providing safe and dependable supplies of drinking water and protecting water quality through adequate wastewater treatment is critical to maintaining New Mexico’s economic vitality and quality of life. These guidebooks should provide the tools needed by water and wastewater systems to actively and consistently analyze current operations and future needs in order to develop robust management systems and well-designed infrastructure to meet these growing challenges.

� 2006 EditionRural Community Assistance Corporation
Is.thIs.guIde.For.You?Are you responsible for the operations and management of a water or wastewater system? If so, this guide is for you.
Having adequate financial resources is a must if you are going to meet the ultimate goal of maintaining an adequate and sustainable supply of safe drinking water and a reliable wastewater system for your community members. You may already have excellent operators, a plentiful supply of high-quality water and good infrastructure to store and deliver the water or a properly functioning wastewater system. However, healthy fiscal stability and planning are necessary to sustain quality operations.
This guide is meant for decision makers, operators, clerks/recorders, engineering firms and others responsible for managing the financial resources of a utility system. This guide intends to assist rural utilities through the budget development and the rate setting processes and planning for the future. It is designed to take you step by step through processes that will ensure the financial health of your utility. This guide models how your utility can help itself become financially sustainable.
usIng.thIs.guIdeWritten as a workbook, this guide provides a process for developing and monitoring a utility budget, evaluating rate structures and developing a 5-year financial plan. Strategic tips, information and resources are included throughout this guide. In addition, the guide includes references to worksheets with examples, as well as blank worksheets in which to insert your specific system information. In order to fully take advantage of this guide, you will need a computer and some spreadsheet knowledge.
this.guide.is.meant.for..decision.makers,.operators,.
clerks/recorders,.engineering.firms and others responsible for
managing the financial resources of.a.utility.system..this.guide.intends.to.assist.rural.utilities.
through the budget development and.the.rate.setting.processes.
and.planning.for.the.future..

�2006 Edition Rural Community Assistance Corporation
InForMatIon.You.WIll.needInformation specific to your utility will help you maximize the usefulness of this guide. The following is a checklist of information needed.
Current fiscal year’s adopted budget
Last 3 fiscal year’s actual revenue and expense financials
Water audit information from the Water Use Audit: A guide to accurately measure water use and water loss
Balances on any existing reserve/savings accounts: $__________
Projected system growth: ___% and ____ connections/year
Planned improvements or project information for the next five years
Current Year Connection Fee $_______ Proposed Connection Fee $_______
Loan payment schedules (if applicable)
Details of any debt service reserve requirements related to existing or planned loans (if applicable)
Copy of existing rate policy/ordinance & current rate structure
Connection classifications (residential, commercial, active and non-active, etc.)
Monthly water use data for each customers for a 12 month period

� 2006 EditionRural Community Assistance Corporation
evaluatIng.Your.current..Budget:.hoW.does.It.look?Establishing a budget in which revenues cover expenses is the first step toward ensuring your system’s financial stability. The following budget review questions will help gauge your system’s current financial condition:
Table 1.1 Budget Review & EvaluationYES/NO QUESTIONS
1. Do you have an annual budget review process in place?
2. Is your system budget maintained separately from other utility or service budgets?
3. Have operational revenues been sufficient to cover expenses over the last 3 years?
Last year 2 years ago 3 years ago
Total operating revenues*
Total operating expenses**
NET OPERATING REVENUES
Arerevenuessufficienttocoverexpenses?
* Operational revenues — Refers to all dependable revenue sources expected year after year. Examples of these are water and wastewater sales.
** Total operating expenses — Refers to all annual expenses needed to operate a water system including, but not limited to, staff, physical equipment, operating supplies, office supplies, administrative costs (insurance, rent, audits), annual debt service or loan payments.
4. Were you able to meet all payments on the outstanding debt during the last 3 years?
5. Is your system in compliance with all applicable regulations?
6. Were you able to cover costs of emergency and preventive maintenance as needed?
7. Were you able to cover all major costs using only revenues?
8. Do you have existing reserves/savings? If yes, how much? $
9. Do you have 15% or less unaccounted water identified in your water audit? %
Chapter 1The Annual Budgeting Process

�2006 Edition Rural Community Assistance Corporation
Water Audit* Gallons or ft3
Total water sold last year
Water used for system flushing, fire training, etc.
Total water produced last year (based on master water meter)
. total.unaccounted.water*.
. percent.of.total.unaccounted..
* Estimating unaccounted water can be accomplished through the use of the Water Use Audit: A guide to accurately measure water use and water loss. This guide is designed to help you identify source of water loss.
You may be a victim of water theft, or have significant leaks in your system. If you have more than 15% unaccounted for water, lost water is lost revenue! r
10. Do your decision-makers regularly monitor the budget and take corrective action when required?
11. Have you had a rate increase in the last three years?
If you answered NO to more than two of these questions, it is in the best interest of the utility to review the financial management practices.
You may be a victim of water .theft, or have significant .
leaks.in.your.system...Lost water is lost revenue!
%

10 2006 EditionRural Community Assistance Corporation
Estimating next year’s budgetWhat exactly is a budget? A budget is a best-guess projection of a system’s financial needs and resources. It is a powerful financial management instrument that both authorizes and restricts spending. Developing a budget will help identify the full cost of operating your system and provide a tool to assure your system is taking in enough revenue to cover the costs associated with the regular operations. It may also help decision-makers to take corrective action. Simply put, a budget will help determine if “your ship is going to sink or sail.”
What is a sound budget and what is involved in budget development? A sound budget is one that captures the goals and objectives of the system in dollars and cents. There are four basic steps involved in good budget preparation:
(1) Estimating annual operating expenses
(2) Estimating needed reserves (A step often overlooked!)
(3) Identifying and assuring revenues needed to cover expenditures and reserves
(4) Balancing the budget
step.1:..estIMatIng.annual.operatIng.eXpensesReview cost categories or “expense line items”There are numerous ways to categorize expenses related to your system. It is critical to develop a list of cost categories that make sense to you, the utility decision makers, i.e. board of directors, council, etc., and your customers. Table 1.2 is a list of common operations and expense line items with descriptions.
Table 1.2 Common Water System Expense CategoriesLine Item #
Typical Expense Categories Line Item Description
1 Salaries and Wages Include wages for all utility employees or contractors (operators, billing clerks, recorders, etc.)
2 Personnel benefits Medical, vision, dental and other benefits provided to utility staff, as well as payroll taxes.
3 Power and other utilities Costs of electric power, water, telephone, gas and other utility system related expenses incurred in producing and delivering the utility’s service.
4 Chemicals and treatment Costs of all chemicals used for water or wastewater treatment (e.g., chlorine).5 Sampling Cost related with monitoring including laboratory costs.6 Materials, parts and repairs Include all materials and supplies used for producing and delivering service to the
utility’s customers including grease and oil, equipment rental, and minor repairs to equipment. This should not include materials used for administrative purposes.
7 Transportation Expenses related to trucks, automobiles, construction equipment and other vehicles used for producing, delivering, or maintaining the system.
8 Office supplies and postage All office supplies and equipment including paper, copies, postage, post office box, etc.
9 Insurance All insurance costs associated with vehicles, general liability, fidelity bond coverage, worker’s compensation insurance, directors’ and officers’ insurance, and other insurance costs related to system operation.
10 Permits and fees Expenses related to regulatory permits such as water rights applications, Non-Profit annual report, and other permits and fees as applicable.

112006 Edition Rural Community Assistance Corporation
11 Licenses, dues and subscriptions
Membership dues for organizations such as American Water Works Association, Rural Water, any publication subscription dues.
12 Trainings, meetings, and mileage
Include costs for travel and registration to meetings and trainings necessary for operation of the system.
13 Professional services All engineering, legal, or accounting assistance — both in-house and outside assistance.
14 Other deductions, fees and expenses
Other fees, including bank fees or penalties.
15 Repair & Replacement Large equipment repair and/or replacement16 Taxes Taxes, including state and federal income tax, gross receipt tax,
property tax, etc.
Note: Some of the taxes are pass-through where they reflect as revenues and expenses.
17 DEBT SERVICE: Annual loan payment(s)
Annual loan payment(s) including the principal and interest total.
18 Rent Office, storage, multi-use buildings. 19 Other:20 Other:
The next step is to check your budget expense line items for the following:
Yes No
Do cost categories make sense?
Can they be explained to the board and the customers?
Are ALL system-related costs included?
Does anything need to be added? If yes, what? _______________
Are only system-related costs included in the budget?
If not, estimate costs only related to the system operations $____________
A budget will help determine .if “your ship is going to .
sink or sail.”

12 2006 EditionRural Community Assistance Corporation
determining.expendituresOnce you have reviewed existing expense line items, you are ready to fill out the Operating & Maintenance Expense Worksheet (Table 1.3). To use the Expense worksheet, first, fill in the cost categories in the “expense line items” column, then, under “line item description”, add short explanations for each cost. Next, insert last year actual information in its respective column, and last, in the current year projected column add this year’s projected costs for each expense line item.
Table 1.3 Fiscal Year Operating & Maintenance Expense WorksheetO&M Expense Line Item Last Year
ActualCurrent Year Projected
MOE* Expansion Next Year Projected
Line Item Description
1 Salaries and wages $ $ % $2 Personnel benefits $ $ % $3 Power and other utilities $ $ % $4 Chemicals and treatment $ $ % $5 Sampling $ $ % $6 Materials, parts and repairs $ $ % $7 Transportation $ $ % $8 Office supplies and postage $ $ % $9 Insurance $ $ % $11 Permits and fees $ $ % $12 Licenses, dues and
subscriptions$ $ % $
13 Trainings, meetings and mileage
$ $ % $
14 Professional services $ $ % $15 Other deductions, fees and
expenses$ $ % $
16 Repair & Replacement $ $ % $17 Taxes $ $ % $

132006 Edition Rural Community Assistance Corporation
O&M Expense Line Item Last Year Actual
Current Year Projected
MOE* Expansion Next Year Projected
Line Item Description
18 Rent $ $ % $19 Other: $ $ % $
20 TOTAL O&M EXPENSES (total.lines.1-19)
$ $ % $
deBt.servIce21 Total annual loan payment(s) $ $ % $ Total annual loan payment(s) including the
principal and interest total.
*Howtousethe“MOE”,“Expansion”and“LineItemDescription”columns
Use the “MOE (Maintenance of Effort)” column to estimate any increase in cost for the upcoming year(s) in order to maintain basic operations. For example, the cost of power and other utilities may be expected to increase by 5 percent; or it is assumed all employees will receive a 3 percent annual raise. Enter percentage increases in the “MOE” column.
The “Expansion” column is used to capture any anticipated cost increases due to expansion. To complete this column, you will need to collect information that anticipates cost changes. Many costs are constantly in flux because of system expansion, upgrades and more. For example, next year you may plan to purchase an Association of Special Districts membership that will cost $100 per year, or you may know you’ll need to make the first loan payment of $10,000 on a current improvement project, or you may want to begin mailing bills which will cause you to budget for postage.
The “Line Item Description” column explains changes in the budget. Alternatively, if you are using your own budget format, you can use the “Define the line items” worksheet included in Appendix A to describe each line item.
Note: If this is your system’s first year of operation, you may need to get estimates from vendors or suppliers, call laboratories for sampling cost estimates, figure hourly wages, and review your monthly bills to date, etc.

1� 2006 EditionRural Community Assistance Corporation
step.2:.settIng.asIde.reservesSetting aside reserves can mean the difference between a system that is self-sustaining and one that may fall apart or become financially unstable during a small emergency. If your utility does not have reserve accounts, consider establishing one as soon as possible. Having a reserve account is critical to developing and maintaining financial stability. Having a savings account is a good start.
How much should be set aside for reserves? There are several different categories of reserves and ways to estimate the reserve accounts your system might need. Ultimately, the question of how much funds a system will want to reserve is up to the utility’s decision making body. The following are descriptions of suggested reserves to consider establishing and the ‘rule of thumb’ for estimating adequate amounts to set aside.
Debt Service ReserveIf money was borrowed to build your system, chances are the system agreed to place money into a Debt Service Reserve account until an agreed upon dollar amount is reached. A Debt Service Reserve is in addition to a loan repayment. The Debt Service Reserve helps ensure timely payments can be made even if there is a financial emergency. If required in the loan agreement, a Debt Service Reserve is a legal and binding obligation on the system. Review loan documents, terms and conditions, to determine if your system is obligated to establish this reserve account. If so, determine how much is needed to budget for next year in order to meet this obligation.
Emergency ReserveAn emergency reserve is cash set aside for unplanned major maintenance or equipment failure. How much should be set aside? Some specialists suggest setting aside enough cash to cover the cost of replacing the most “vulnerable component” of your system, the component that would cause the greatest disruption of service and is the most costly to replace. Replacement of a production well, a source of supply, the largest piece of pumping equipment or a key transmission line are examples of the most vulnerable component for many water or wastewater systems. You should also review what emergencies took place in the last 12 to 24 months and how much each cost to resolve. Think about the age of your system and the condition it’s in. Involve your operator in this process, as it calls for an informed assessment. If possible, research the experience of other systems similar to yours in age and size and operating conditions.
Operating ReserveAn operating reserve compensates for cash flow variations. There can be a significant length of time between when a system provides a service and when a customer may pay for the service rendered. In addition to timing, the volume of cash flow can be affected by weather and seasonal demand patterns. A 45 day (approximately 6 weeks) operating reserve is a frequently used industry norm. The operating reserve can also cover costs of unplanned expenses, other than emergencies, such as increase in electrical or operational costs; costs caused by leaks; extra callouts, late payments, etc. Many systems set aside a minimum of 1/8 of their operating budget, minus any debt payments, which should cover the cost of operations for 45 days.
Caution, if you bill less frequently than once a month you will need to increase the amount of this reserve to reflect the cost expended and when payment can reasonably be expected to be received.

1�2006 Edition Rural Community Assistance Corporation
Capital Improvement Reserve A capital improvement reserve is for system rehabilitation, long-term equipment replacement, system expansion, and equipment/components, as well as ‘on-hand cash’ for expansion and new projects. How far into the future will you need to plan and save? Your system’s decision making body should determine the appropriate planning horizon for your system. In general, the further you can look into the future, the better off you will be. Utility systems that save for equipment replacement and new projects 10 to12 years in the future are doing an excellent job of managing their assets by reducing the costs associated with borrowing and equipment repairs or replacements.
To establish and properly fund a capital improvement reserve account, you must develop a plan that outlines new projects and system expansion, as well as equipment replacement needs. To develop the plan, review existing planning documents such as your infrastructure capital improvement plan (ICIP), utility master plan, engineering studies, etc. These planning documents evaluate existing system conditions, establish asset rehabilitation, maintenance priorities, and system expansion needs and often include cost estimates for these improvements. One of the most comprehensive plans is an asset management plan. If you have not completed one, the New Mexico Environmental Finance Center has developed an asset management guide to help utilities identify their needs. Its title is Asset Management: A guide for water and wastewater systems and is available to any utility system. The development of this guide includes five steps which are designed to help you manage and accordingly plan for your system’s future:
1. Asset Inventory
2. Level of Service
3. Determining Critical Assets
4. Life Cycle Cost Analysis
5. Long-Term Funding Strategy
Setting aside reserves can mean the difference between
a.system.that.is.self-sustaining.and.one.that.may.fall.apart.or.become financially unstable .during.a.small.emergency.

1� 2006 EditionRural Community Assistance Corporation
calculating.capital..Improvement ReserveIn the included CD you will find the RCAC Reserve Fund Calculator© which you can use to help determine your annual capital improvement reserve set aside required to meet your utility system’s infrastructure needs. Once you have determined a prioritized list of equipment replacement costs, you can begin using the RCAC Reserve Fund Calculator©. The intent of the calculator is to help you identify the minimal amount of annual reserve needed to meet the capital improvement goals. This is done by projecting the future item cost, taking into account inflation and interest earned on reserves over the collection period. To utilize the calculator, this is the information you will need to enter:
Enter description of items to replace or new projects to incur, in descending order (i.e. longest replacement time first – reference Table 1.4 for an example).
Enter today’s estimated replacement cost and estimated inflation in the appropriate columns. If you know the future cost of an item, enter this value and do not enter inflation.
Add a conservative account interest rate (the rate expected to be earned on the system’s funds) in the appropriate column.
In the top portion of the worksheet enter the number of connections.
Table 1.4 is a screen print out of a sample capital improvement plan reserve fund calculation.
When completed, the RCAC Reserve Fund Calculator© will estimate how much money is needed to be included in the annual budget to generate the cash necessary to implement the capital improvement plan. It will also determine the amount each customer will pay in their rates to adequately fund this reserve.

1�2006 Edition Rural Community Assistance Corporation
eXaMple.rcac.reserve.Fund.calculator© v3.3 .
Table 1.4 RCAC Reserve Fund Calculator©
Calculation start date : xx/xx/xxConnections / ERUs: 210 Total cash expense over 9 years: $169,106Monthly payment per connection: $7.20 If this background appears in the ‘Years to Replace’ column below, a rate
decrease or reassignment of reserve funds is possible and information will be shown here.
Total annual payment to reserve funds: $18,144.InstructIons:.list.items.in descending order of “Years to Replace” (Longest replacement time first). Enter replacement costs (usually what it would cost “today”), annual inflation percentage, and interest rate of reserve savings account. Note: Do not “drag” or “cut” entries in cells! Item replacement.cost. Years.to.replace Inflation Future.cost account.Interest.rate.1 New reservoir $65,000 9.0 2.00% $77,681 1.50%2 Upgrade booster pump station $14,000 7.0 3.00% $17,218 1.50%3 Replace 500’ pipe on Willow St. $16,800 6.0 4.00% $21,257 1.50%4 Planning $$ for upgrades $19,000 6.0 2.00% $21,397 1.50%5 Replace wellpump #1 $5,000 5.0 2.00% $5,520 1.50%6 Office computer $1,500 4.0 2.00% $1,624 1.50%7 Wellhouse #1 re-build $4,500 4.0 2.00% $4,871 1.50%8 Replace 60 meters $3,900 3.0 2.00% $4,139 1.50%9 Replace 50 meters $3,250 3.0 2.00% $3,449 1.50%10 Replace 2 fire hydrants $5,000 2.5 2.00% $5,254 1.50%11 Replace 50 meters $3,250 2.0 2.00% $3,381 1.50%12 Replace 50 meters $3,250 1.0 2.00% $3,315 1.50%13 14 15 1617181920
NOTE! You don’t have any entry errors; re-check your entries for accuracy
1� 2006 EditionRural Community Assistance Corporation
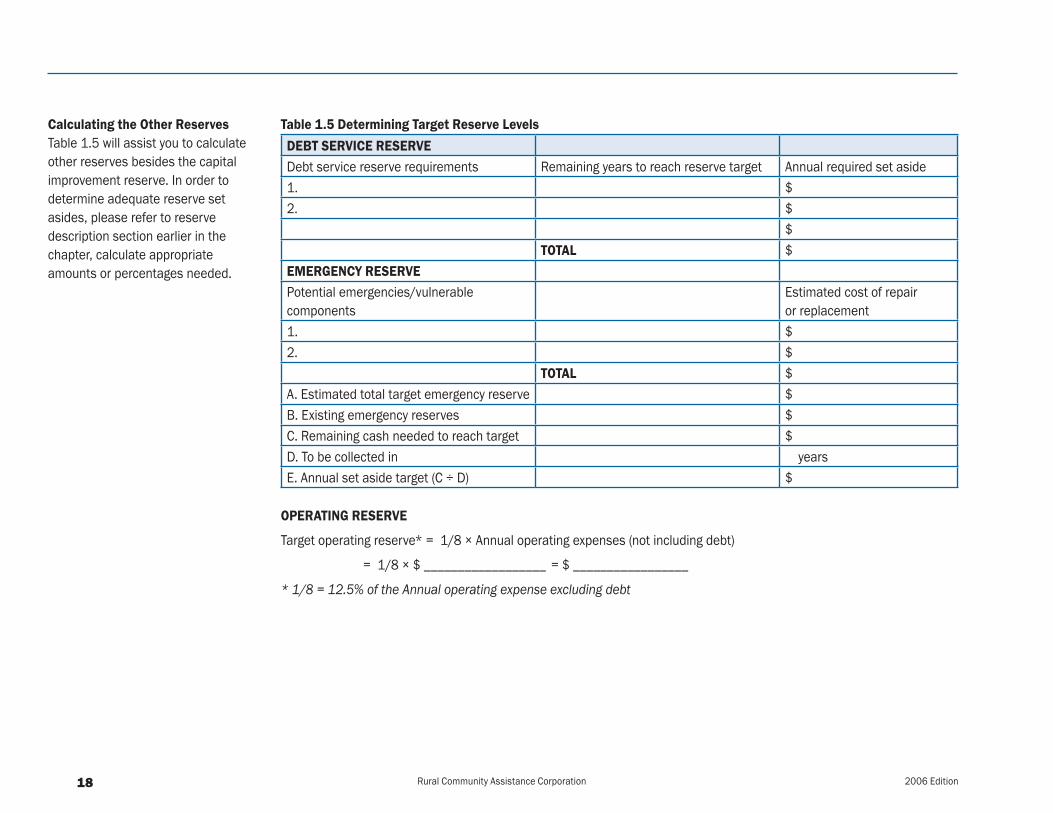
Calculating the Other ReservesTable 1.5 will assist you to calculate other reserves besides the capital improvement reserve. In order to determine adequate reserve set asides, please refer to reserve description section earlier in the chapter, calculate appropriate amounts or percentages needed.
Table 1.5 Determining Target Reserve LevelsdeBt.servIce.reserveDebt service reserve requirements Remaining years to reach reserve target Annual required set aside1. $2. $
$total $
eMergencY.reservePotential emergencies/vulnerable components
Estimated cost of repair or replacement
1. $2. $
total $A. Estimated total target emergency reserve $B. Existing emergency reserves $C. Remaining cash needed to reach target $D. To be collected in yearsE. Annual set aside target (C ÷ D) $
.operatIng.reserve
Target operating reserve* = 1/8 × Annual operating expenses (not including debt)
= 1/8 × $ __________________ = $ _________________
* 1/8 = 12.5% of the Annual operating expense excluding debt

1�2006 Edition Rural Community Assistance Corporation
Reserve Tracking The following worksheet will help you track your reserve accounts once you have established the reserve set asides for all your reserve accounts.
Table 1.6 Summary Reserve Worksheet . prior.Year current.Year next.Year
Actual Budget Annual Adopted Budget
Projected Budget
1 Debt Service Reserve 2 Annual installment (Reference Table 1.5) 3 Withdrawals 4 Running balance 5 Target balance 6 Operating Reserve 7 Annual installment (Reference Table 1.5) 8 Withdrawals 9 Running balance 10 Target balance 11 Emergency Reserve 12 Annual installment (Reference Table 1.5) 13 Withdrawals 14 Running balance 15 Target balance 16 Capital Improvement Reserve 17 Annual installment
(See RCAC Reserve Fund Calculator©)
18 Withdrawals 19 Running balance 20 Target balance
(See RCAC Reserve Fund Calculator©)
21 TOTAL ANNUAL RESERVE INSTALLMENTS (add lines 2+ 7+12+17)
$ $ $
22 TOTAL WITHDRAWALS (add lines 3+ 8+13+18)
$ $ $
23 TOTAL RUNNING BALANCE (subtract lines 21-22)
$ $ $

20 2006 EditionRural Community Assistance Corporation
step.3:.deterMInIng.the.utIlItY’s.current.revenueAfter determining the system’s expenses, the next step is to review how much money you’ve collected each year (your annual revenue), and if the revenue generated has been sufficient to cover the utility’s annual expenses. Does it cover all the major expense categories and the reserves as identified in the previous steps?
The first thing is to determine what revenues are generated by the utility. There are two primary revenue categories, operating and non-operating.
Operating revenue includes:l Income from monthly service fee
l Income from water and/or wastewater sales (commodity rate)
For most systems, income from the monthly service fees and/or sale of service are the most stable and reliable source of revenue because they’re based on historical information.
Non-operating revenue includes: l Interest on checking and reserve accounts
l Meter deposits
l Connection fees*
l Late payments, penalties and reconnection fees*
*Connection fees and income from late payments, penalties and reconnection fees may only be considered operating revenue sources if they are stable and dependable revenue sources.
When estimating revenues, it is best to ignore non-operating .
revenues and only rely on .operating revenue to cover .
your.system’s.expenses...This provides better assurance
that operating costs will be met.

212006 Edition Rural Community Assistance Corporation
Determining the Annual RevenuesUse the worksheet below to help account for the annual revenue. The worksheet separates operating from non-operating revenue.
Table 1.7 Revenue Worksheet .line.Item last.Year current.Year .+/- projected.amount.for.
next.Yearnotes
revenues 1 Available opening cash balance $ $ $ $ revenues.receIved Operating revenue 2 Water/wastewater rates $ 3 Other $ 4 Other $ 5 total.operatIng.revenue $ $ $ Non-operating revenue 6 Connection charges* $ 7 Late payment fees, penalties,
reconnection fees, etc.* $
8 Interest $ 9 Other $ 10 Other $ 11 total.non-operatIng.revenue. $ $ $ 12 total.revenue. $ $ $
* Sometimes considered to be operating revenue, depending on the reliability of the income source. Move to operating revenue category if appropriate. Most small systems rely on water sales as the only operating revenue source.

22 2006 EditionRural Community Assistance Corporation
step.4:.BalancIng.the.BudgetDetermining Actual Revenue to Cover Expenses and ReservesNow that you have a better sense of costs of operating your utility and the reserves needed to be self sustaining, it is now time to determine where the utility stands financially. The budget balancing process will help you compare the estimated revenues against the estimated expenses. Will your estimated revenues cover next year’s estimated expenses and reserves? (Look at the net surplus/deficit on the Budget Balance Worksheet for the ‘bottom line’). The amount of operating revenue should equal the total annual costs including the annual reserve contribution. To determine if your system meets this goal, complete the Budget Balance Worksheet below.
Table 1.8 Budget Balance Worksheet. last.Year current.Year next.Year1 total.operatIng.revenues $ $ $
eXpenses2 Total Operating Expenses $ $ $3 Total Debt Service $ $ $4 Total Annual Reserve Set aside $ $ $5 total.cost.oF.BusIness.
(line.2.through.line.4) $ $ $
6 net.operatIng.revenues..(Line 1 minus Line 5)*
$ $ $
7 Additional Revenues from Non-operating Revenue Sources
8 NET SURPLUS/DEFICIT (Line 49 plus Line 50)* $ $ $
*Anetdeficitindicatesneedforarateincrease.Anynetsurplusisrecommendedtobeappliedtowardreserves.
Systems that underestimate expenses or overestimate revenues just to make the budget balance consistently wind up in financial trouble. Don’t do it! It is best to ignore non-operating revenues and use only operating revenues to meet system expenses.
232006 Edition Rural Community Assistance Corporation
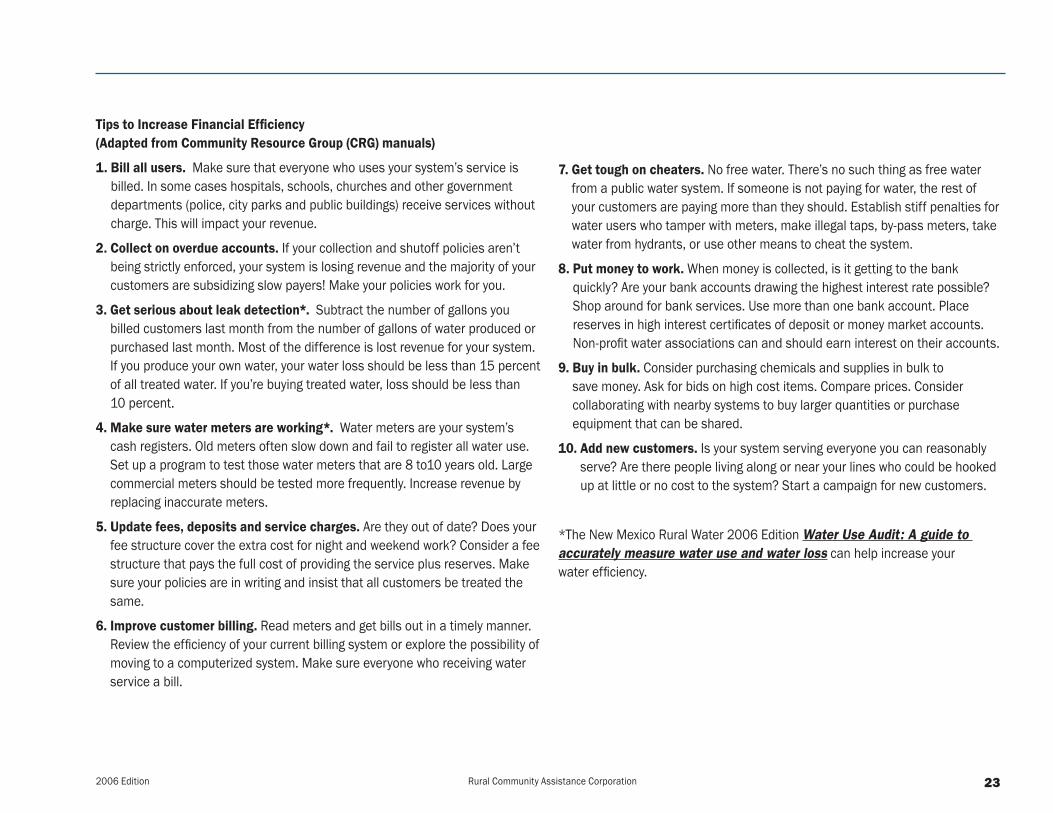
Tips to Increase Financial Efficiency(adapted.from.community.resource.group.(crg).manuals)
1.. Bill.all.users. Make sure that everyone who uses your system’s service is billed. In some cases hospitals, schools, churches and other government departments (police, city parks and public buildings) receive services without charge. This will impact your revenue.
2. Collect on overdue accounts. If your collection and shutoff policies aren’t being strictly enforced, your system is losing revenue and the majority of your customers are subsidizing slow payers! Make your policies work for you.
3.. Get serious about leak detection*. Subtract the number of gallons you billed customers last month from the number of gallons of water produced or purchased last month. Most of the difference is lost revenue for your system. If you produce your own water, your water loss should be less than 15 percent of all treated water. If you’re buying treated water, loss should be less than 10 percent.
4. Make.sure.water.meters.are.working*. Water meters are your system’s cash registers. Old meters often slow down and fail to register all water use. Set up a program to test those water meters that are 8 to10 years old. Large commercial meters should be tested more frequently. Increase revenue by replacing inaccurate meters.
5. Update fees, deposits and service charges. Are they out of date? Does your fee structure cover the extra cost for night and weekend work? Consider a fee structure that pays the full cost of providing the service plus reserves. Make sure your policies are in writing and insist that all customers be treated the same.
6. Improve customer billing. Read meters and get bills out in a timely manner. Review the efficiency of your current billing system or explore the possibility of moving to a computerized system. Make sure everyone who receiving water service a bill.
7. get.tough.on.cheaters. No free water. There’s no such thing as free water from a public water system. If someone is not paying for water, the rest of your customers are paying more than they should. Establish stiff penalties for water users who tamper with meters, make illegal taps, by-pass meters, take water from hydrants, or use other means to cheat the system.
8...put.money.to.work. When money is collected, is it getting to the bank quickly? Are your bank accounts drawing the highest interest rate possible? Shop around for bank services. Use more than one bank account. Place reserves in high interest certificates of deposit or money market accounts. Non-profit water associations can and should earn interest on their accounts.
9.. Buy in bulk. Consider purchasing chemicals and supplies in bulk to save money. Ask for bids on high cost items. Compare prices. Consider collaborating with nearby systems to buy larger quantities or purchase equipment that can be shared.
10. add.new.customers. Is your system serving everyone you can reasonably serve? Are there people living along or near your lines who could be hooked up at little or no cost to the system? Start a campaign for new customers.
*The New Mexico Rural Water 2006 Edition Water Use Audit: A guide to accurately measure water use and water loss can help increase your water efficiency.

2� 2006 EditionRural Community Assistance Corporation
Chapter 2The Rate Setting Process
a.system.checkupSo far, this guidebook has concentrated on assessing the financial health of your utility. Now that you have a good understanding of the demands of your system, you need to figure out how to adequately address those demands. This chapter will focus on how to achieve and maintain a stable financial footing through a good rate structure. A well-conceived rate structure is the foundation of a well-run utility system. The ideal rate structure for a particular system is equitable and generates sufficient revenues. A utility’s good reputation depends on, among other things, its customers’ confidence that their use fees are reasonable and equitable.
In many cases, customers may not know if they are being under-charged for water or wastewater. On the other hand, if customers are, or believe they are, being over-charged, they will question every expenditure, making it difficult to manage and operate the system. Poorly conceived rates may render a system unable to address short term emergencies and long term plans. It is therefore in the best interest of the system to establish reasonable rates and communicate the rationale of the established rate to its customers.
determining.an.appropriate.Water.rate.structure.for.Your.utilityCharging customers for the actual cost of the service will ensure that you earn enough revenue to cover the costs of operation, treatment, storage, distribution, and collection, plus maintain sufficient reserve accounts. An appropriate rate structure for your particular system will ensure you have the necessary financial resources to meet established goals and implement future plans.
this.chapter.will.focus.on..how to achieve and maintain .
a stable financial footing through.a.good.rate.structure...
A well-conceived rate .structure.is.the.foundation.of..
a.well-run.utility.system.

2�2006 Edition Rural Community Assistance Corporation
Basic.rate.structure.principles:1. Charging the full cost to deliver the service ensures your system’s financial health by protecting the system’s ability to
provide its service now and into the future.
2. Rates should be adequate and equitable. Adequate means the rates generate sufficient income to cover the full cost to operate the system and equitable means that each class of customer is paying its proportional share of the costs directly influenced by their consumption and/or benefit they are receiving.
3. The rate structure should be explained to the utility customers. Customers will be more receptive to rate changes if they understand how rates are related to covering the full cost of the service received. Rates should be posted and customers should be sent a rate schedule annually and each time the rates are adjusted.
4. Rate changes should be fully transparent and easy to understand. In the case of a water utility, the rates should promote water conservation.
5. Rates can become outdated once they’re not generating the revenues necessary to cover all major expense categories and reserve set asides. For that reason, they should be examined annually during the budget development process to determine if it is time to “adjust” them.
6. Good rate structures are based on good budgets.
7. Annual review ensures that a system will continue to earn sufficient revenue to cover costs. Keep good records of previous years expenses and revenues and be sure to adequately fund the system’s reserve accounts.
Factors.that.will.impact..your.rates.include:
•.complexity.of.treatment
• Service area size
•.customer.categories..(residential,.commercial,..
industrial)
•.Water.and/or..wastewater.demand
•.others
Your.system’s.particular..circumstances.will.determine.
what.type.of.rate.structure..best meets your needs

2� 2006 EditionRural Community Assistance Corporation
the.Most.common.Water.rate.structuresThere are five common types of water rate structures:
• Flat rate or fixed fee;
• Uniform rate;
• Decreasing block rate;
• Increasing block rate; and
• Seasonal rate.
Under each of these rate structures, systems have the flexibility to set different rates for different categories of customers (for example, a different rate for residential users versus agricultural users). Table 2.1 describes and summarizes some of the advantages and disadvantages of the five rate structures most frequently used. Remember, there are other rate structures in addition to those listed in the table, such as priority pricing (i.e., customers choose a higher rate to guarantee service), which may be more appropriate for your system.
under.each.of.these..rate.structures,.systems.have the flexibility to set
different.rates.for.different.categories.of.customers

2�2006 Edition Rural Community Assistance Corporation
Table 2.1 Rate Structure Description and Considerationsrate.structure description Advantages DisadvantagesFlat Rate or Fixed Fee All customers pay the same amount
each month regardless of quantity of water used.
• Easy to implement • Everyone pays too much or too little for what they consume
• Does not promote water conservationUniform Rate or Single Block Rate
Customers are charged a uniform rate per unit of water (per 1,000 gallons, per cubic feet) regardless of the amount of water used. Often coupled with a minimum monthly charge. Used in metered systems.
• Easy to administer
• May encourage water conservation
• Cost to the customer is in direct proportion to the water consumption
• Has the ability to discourage high volume users
Decreasing Block Rate The price of water declines as the amount used increases. Each succeeding consumption block is cheaper. Used in metered systems.
• Attractive to high volume users • High water consumption increases the need for wastewater treatment facilities
• Does not offer an incentive to conserve water
• It is complex to determine and administerIncreasing Block Rate The price of water increases as the
consumption increases. Used in metered systems.
• Promotes water conservation
• Provides a reasonable amount of water at reasonable price
• May discourage high volume use
• Requires a computerized billing system
Seasonal Rate Rates vary according to the time of year. This rate is normally used in conjunction with block rates or uniform rates.
• Promotes water conservation
• Equitable for transient communities (campgrounds, seasonal communities, etc.)
• May affect high-consumption users during the time of the year when rates are highest
• Revenues will most likely fluctuate
appendix.B lists additional resources on rate setting.

2� 2006 EditionRural Community Assistance Corporation
setting.the.right.rate.structureSetting rates requires you to be equitable to all your customers. You may not be able to control the cost of providing safe drinking water service to your customers, but you must recover the full cost of the service without ignoring that each customer has to pay their fair share. Before you can set rates or determine an appropriate rate structure, you need to have certain historical knowledge about your utility. Use Table 2.2 to complete the information you need.
Table 2. 2 Identifying the adequate rate structure checklist
1st.year 2nd.year 3rd.year considerationsWater Billed (Total) How much water do your customers use?
Is the water consumption predictable based on the last 3 years?
Do you charge the same rate to the average residential customer as you do to the commercial customers?
Number of Customers How many customers does your system serve? Types of Customers Do you have a high number of seasonal users?
Does your system have a large number of commercial users, like farms, apartments, governments, schools, etc.? Is the number increasing?

2�2006 Edition Rural Community Assistance Corporation
Estimating Customer Water Usage to develop an adequate rate structureTo ensure your system meets revenue requirements, rates must be set in a fair and equitable way, based on the amount of water delivered to the customer. Therefore, unless you use a flat rate or fixed fee, water-use information is needed to set rates. System officials will need to gather this information. Billing data is the best source to determine the amount of water used by your customers. If your system does not have meters installed, you will need to estimate each customer’s water use. It is very important that you record actual usage for at least a 12 month period in order to calculate annual average. Use the table below to help you determine customers water usage.
Table 2.3 Customer Water Usage Chart
(c).Monthly.Water.usage.(In.gallons)
(d)..#.of.customers.using.this.amount.of.Water
(e)..total.#.of.customers.in this Usage Level
(F)..total.estimated..Water.use.(gal)
(g).total.%.of.water (h).%.total.customers
Under 1,0001,001-2,0002,001-3,0003,001-4,0004,001-5,0005,001-6,0006,001-7,0007,001-8,0008,001-9,0009,001-10,00110,001-15,00015,001-20,00020,001-30,00030,001-40,00040,001-50,000All Over 50,001
total.annual.Water.Billed.(a) gallonstotal.#.of.customers.(B)
Calculating Customer Water Usage:
(E) = Sum of (D)_________________ customers (G) = (F) /(A)_________________ gallons
(F) = (E) x (C)_________________gallons (H) = (E)/(B)_________________ customers

30 2006 EditionRural Community Assistance Corporation
Determining Fixed and Variable ExpensesWhether the service is used or not, it is the system’s obligation to have the service available to its customers 365 days per year, 24 hours a day. Obviously, there are costs associated with making the service available at all times.
Fixed.costs are costs that must be recovered even if the service is not used. Fixed costs are usually recovered from each customer on an equal basis through the use of a minimum monthly bill. Fixed costs may cover 100 percent of some expenses in your budget, but only a portion of other types of expenses. Fixed costs are expenses incurred regardless of the quantity of service supplied to your customers. Examples include insurance, debt repayment, rent, sampling and it may include a percentage of salaries.
The method for identifying all or part of some expenses as fixed costs includes determining to what extent each of the line item expenses in your budget benefits every customer of the system regardless of their level of service. This is a determination that each system has to make for itself.
Fixed costs are costs that you should recover in your Minimum Bill also called the minimum monthly fee charged equally to each customer within each customer classification (residential, multi-residential, commercial, etc.)
Variable costs, in this case referring to water costs, are system expenses that are directly related to how much water you pump, treat, store and sell. Variable expenses change with the amount of water that is produced or pumped. In the case of a wastewater rate study, variable costs can only be estimated if using the Estimated Winter Months Method. Examples of variable expenses include electrical power, chemicals and a percentage of salaries. To recover variable costs, your water rate structure will need a “usage charge” also called a “consumption” or “commodity charge”, which is the cost of water per 1,000 gallons.
The following worksheets will help you determine your annual fixed and variable expenses. The amount of money you spend on fixed costs (e.g., salaries, benefits, insurance, rent, and debt payments) and variable costs (e.g., maintenance; chemicals; equipment, training, and billing costs) will likely affect the rate structure you choose. Use the expense line items from the budget developed in Chapter 1 of this guidebook.
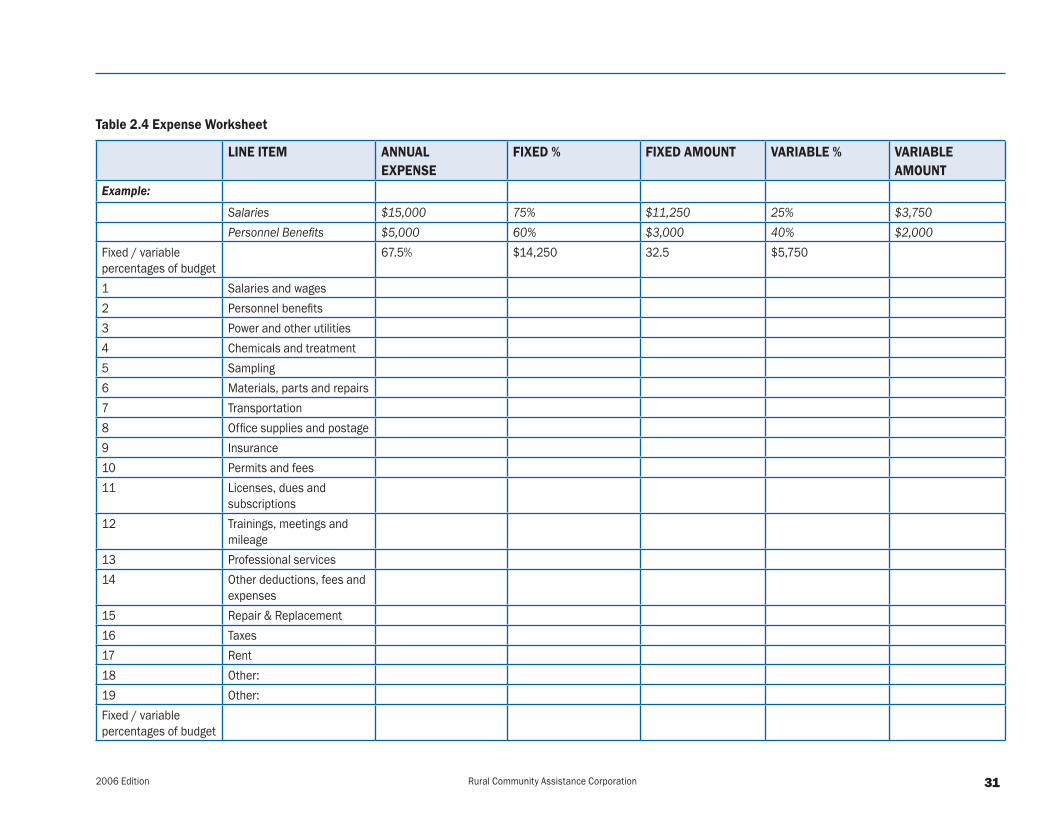
To complete the following worksheet, you will need to determine both your fixed and variable expenses. The percentage you determine to be fixed costs and variable costs will likely affect the rate structure. Remember to include only those costs related to providing the specific service for the utility you are setting the rate for, not other utilities.
The example in the two first lines in Table 2.4 calculates the fixed percentage at 75%.
312006 Edition Rural Community Assistance Corporation
Table 2.4 Expense Worksheet
lIne.IteM annual..eXpense
FIXed.% FIXed.aMount varIaBle.% varIaBle.aMount
Example:
Salaries $15,000 75% $11,250 25% $3,750 Personnel Benefits $5,000 60% $3,000 40% $2,000
Fixed / variable percentages of budget
67.5% $14,250 32.5 $5,750
1 Salaries and wages2 Personnel benefits3 Power and other utilities4 Chemicals and treatment5 Sampling6 Materials, parts and repairs7 Transportation8 Office supplies and postage9 Insurance10 Permits and fees11 Licenses, dues and
subscriptions12 Trainings, meetings and
mileage13 Professional services 14 Other deductions, fees and
expenses15 Repair & Replacement16 Taxes17 Rent18 Other:19 Other:Fixed / variable percentages of budget
32 2006 EditionRural Community Assistance Corporation
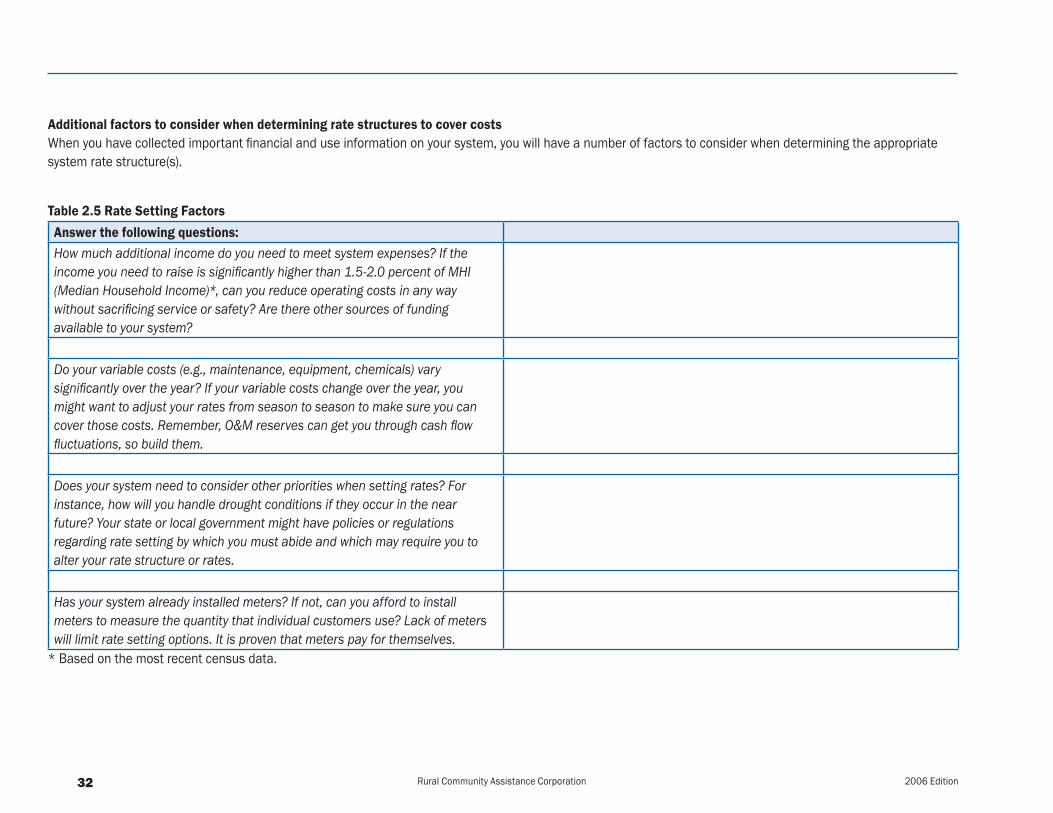
Additional factors to consider when determining rate structures to cover costsWhen you have collected important financial and use information on your system, you will have a number of factors to consider when determining the appropriate system rate structure(s).
Table 2.5 Rate Setting FactorsAnswer the following questions:How much additional income do you need to meet system expenses? If the income you need to raise is significantly higher than 1.5-2.0 percent of MHI (Median Household Income)*, can you reduce operating costs in any way without sacrificing service or safety? Are there other sources of funding available to your system?
Do your variable costs (e.g., maintenance, equipment, chemicals) vary significantly over the year? If your variable costs change over the year, you might want to adjust your rates from season to season to make sure you can cover those costs. Remember, O&M reserves can get you through cash flow fluctuations, so build them.
Does your system need to consider other priorities when setting rates? For instance, how will you handle drought conditions if they occur in the near future? Your state or local government might have policies or regulations regarding rate setting by which you must abide and which may require you to alter your rate structure or rates.
Has your system already installed meters? If not, can you afford to install meters to measure the quantity that individual customers use? Lack of meters will limit rate setting options. It is proven that meters pay for themselves.
* Based on the most recent census data.

332006 Edition Rural Community Assistance Corporation
setting.Water.rate.structuresAfter organizing usage data, you are ready to set your utility water rates. The water rate structure you choose should reflect the considerations previously discussed. The basic steps are the same as when calculating the monthly minimum, regardless of what rate structure will be used. In the case of the monthly minimum, the fixed percentage will prescribe how much each customer will contribute. In other words, set your service charge to pay your fixed expenses.
step.#1 A. Develop the customer monthly minimum to cover Fixed Costs.
$____________________ ÷ ________________________ = $________________________
Fixed cost (Table 2.4) Total # of customers (Table 2.3) Fixed cost / customer per year
$________________________ ÷ 12 = ________________________ monthly minimum per customer
Fixed cost /customer per year
step.#2 B. Develop the commodity price (per 1,000 gal. cost) to cover Variable Costs
C. Divide total Variable Expenses by Total Gallons sold the previous year (Table 2.3). This will provide you the per each gallon charge.
$______________ ÷ ____________ = $_____________ variable cost total water usage variable cost per gallon
D. If you want to charge per 1,000 gallons, then multiply the number in C by 1,000 to get the cost per 1,000 gallons.
$ ___________× 1,000 = $____________ per each 1,000 gallons.

3� 2006 EditionRural Community Assistance Corporation
settIng.WasteWater.rate.structuresthe.Winter.Months.MethodSince there are no meters to calculate wastewater use, the Winter Months Method is one of the most frequently used methods to set wastewater rate structures. Wastewater rates are calculated by measuring and averaging consumption during the winter months when there is less irrigation of lawns.
For example, Customer A has the following consumption during the winter months:
December 6,000 gallons 31 days
January 5,500 gallons 31 days
February 5,000 gallons 28 days
Total 16, 500 gallons 90 days
16,500 gallons / 90 days = 183.33 gallons/day
Or,
183.33 gallons per day × 365 days per year = 66,916 gallons per year ÷12 months = 5,576 gallons/month
The charge for wastewater collection and treatment is equivalent to the usage of 5,576 gallons of drinking water, thus the rate is:
5,576 gallons x current water rate = $ monthly wastewater fee
The Estimated Winter Months Method determines average residential customer wastewater usage. For commercial and/or industrial customers calculate additional fee based on higher water consumption.
3�2006 Edition Rural Community Assistance Corporation
For systems that only sell wastewater services without water:
the.Flat.rate.MethodAnnual O & M costs + reserves ÷ number of customers/12 months = $ customer monthly fee
For.on-site.systems:.The budget must reflect expenses related to the management of an on-site/septic system. Calculate wastewater rate structure utilizing any of the methods described above.
As part of this guidebook, an electronic rate calculator is included in the CD. Table 2.6 is a print out sample of a water rate calculation (see next page). Additional rate structure resources are available in Appendix B of this guidebook.

3� Rural Community Assistance Corporation
Table 2.6 RCAC Rate Setting Calculator© example:.sMall.Water.sYsteM.rate.Worksheet.....RESIDENTIAL CONNECTIONS 150 Residential gallons sold 10,800,000 Total gallons sold 10,800,000
ADJUSTED CONNECTIONS 150 Residential cubic feet sold Total cubic feet soldERU gallons 6000 Free gallons 0 Adjusted gallons 10,800,000ERU cubic feet 0 Free cubic feet Adjusted Ft³ LINE ITEM ANNUAL FIXED % FIXED VARIABLE % VARIABLESalaries $15,000 75 $11,250 25 $3,750 Personnel Benfits $5,000 75 $3,750 25 $1,250 Power and Utilities $12,000 15 $1,800 85 $10,200 Chemicals $800 15 $120 85 $680 Sampling $1,500 100 $1,500 0 Materials, parts & repairs $2,500 50 $1,250 50 $1,250 Purchased water $9,000 10 $900 90 $8,100 Transportation $1,000 50 $500 50 $500 Office Supplies $500 90 $450 10 $50 Insurance $3,500 100 $3,500 0 Permits & Fees $750 100 $750 0 Licenses, dues & fees $375 50 $188 50 $188 Trainings, meetings $500 75 $375 25 $125 Professional services $5,000 75 $3,750 25 $1,250 Taxes $900 100 $900 0 Reserves $5,000 100 $5,000 0 $0 100 $0 $0 100 $0 Annual Operating Budget $63,325 $35,983 $27,343Fixed / variable percentages of budget 57% 43%Service Charge $20.00 **Charges may NOT be valid!
Re-check data entered
Avg. Monthly Bill $35.19 Commodity Rate /1000 galsCost for 2 ERUs $50.38 43% worksheets below! $2.53REVENUE CHECK Per ERU: $15.19Service Charge Revenues $36,000 Rate Revenues $27,343 Commodity Rate /100 cubic ft #VALUE!Operating Revenues $63,343 Per ERU: #VALUE!

3�2006 Edition Rural Community Assistance Corporation
Instructions.for.the.rcac.rate.setting.calculator©.use1. Enter information into Blue.or.green cells only
2. Yellow cells are protected and calculate a formula
3. Most of the cells are protected and you can’t hurt the spreadsheet by accidentally entering the wrong data. Selecting a protected cell for data entry will trigger a “popup” which may be removed by pressing the “ESC” key on your keyboard.
4. Required information to be inserted:
a. Number of residential connections
b. Residential gallons or cubic feet sold
c. Budget numbers with fixed percentages assigned
5. The calculator will then determine:
a. The monthly service charge needed to recover total fixed costs based on fixed percentage as assigned above.
b. The commodity rate or revenue needed to charge for water usage to cover variable expenses.
6. Most rate structures are obvious, but there are a few options that may need instruction.
7. Finally, when the rate structure is completed, it must be approved by the governing body and/or by a regulatory agency determined by the water systems’ organizational structure (e.g. municipality, cooperative, mutual domestic). Approval of the rate structure must be obtained prior to implementation.
*TheRCACRateSettingCalculator©isincludedelectronicallyontheCDaspartofthisguidebook.

3� 2006 EditionRural Community Assistance Corporation
customer.education.to.gain.supportWhen a rate increase is implemented, customers want and need to know why. It is critical for customers to understand and appreciate what it takes to operate and maintain a utility system. Customer education should be an ongoing part of a system’s operation. Your utility system belongs to your customers. One of the best times to educate your customers is during the annual budget development process. Notify the public when you are working on the budgets. Post notices inviting them to attend budget meetings. Transparency is very important to gaining customer support. The more your customers know about what it takes to provide services they take for granted, the more likely they will be to support a rate increase, if necessitated. Customers are much more likely to be supportive if they know specifically how their fees will be used. Given the amount of work put into determining equitable rate structures to cover all operational costs, they should feel confident their rate structure is based on accurate figures, facts and fairness.
a.customer-education.program.should.include.the.following.points:
1...the.proposed.increase.will.ensure.the.system.can.comply.with.new.regulations.to.protect.the.health.and.welfare.of.the.community.
2. The rate structure is as equitable as possible; each class of customer pays its.fair.share.of.costs.
3. The rate increase is needed to cover the full cost of producing, treating, storing and distributing safe water to the community.
4. The process should include a structure for customers’ input or feed back.
Two final overall rate increase strategies to consider:
l Small increases are always better than large increases.
l Scheduled small increases are even better. Don’t wait until your system is in deep financial trouble or the pump goes out to start thinking about a rate increase.

3�2006 Edition Rural Community Assistance Corporation
Reviewing the ProcessYour utility system is on its way to a financially sound future. As the information detailed in this chapter has shown, setting sustainable rates is an important part of ensuring a system’s financial health. Communicating effectively the full cost of doing business will have a positive impact on your relationship with customers and will help alleviate rate shock when a rate adjustment is necessary.
What you have accomplished up to this point:
l Determined the full cost of doing business (Developed the budget first!).
l Determined current revenues.
l Considered reserves required to ensure enough funds to cover costs during the next 5 years.
l Calculated how much money is needed to cover all O&M expenses and reserves.
l Evaluated options and designed an appropriate rate.
l Learned how to implement the rate.
Next, projecting into the future, the following chapter will walk you through the process of using the developed rate structures to determine financial health and the need for rate increases using what you know thus far.
Communicating effectively the full cost of doing business will have a positive impact on your.relationship.with.custom-
ers.and.will.help..alleviate rate shock when a
rate.adjustment.is.necessary.

�0 2006 EditionRural Community Assistance Corporation
The last chapter of this guidebook is the last step to achieving long-term financial stability for your utility. This chapter ties in what you have developed in the previous two chapters and uses it to forecast the financial stability of your utility five years down the road.
Why develop budget projections? Long-term budget projections help you to more accurately gauge your budget needs and to plan accordingly. Budget projections require you to think beyond this year and next year. During normal operations of a utility, there are a number of factors that can affect the revenue required from year to year. You may be surprised how quickly the gap between revenues and costs can widen when considering the cost increases related to inflation, increased asset rehabilitation and repair needs for aging infrastructure, and other unforeseen changes. Estimating costs for the next several years based on your fixed costs, operating expenses, predicted equipment replacement, repair needs, and existing grants or loans can help avoid a significant gap between revenue and costs. Once you have a better idea of estimated costs for future years, you can revise your current and next year’s budgets accordingly.
Developing a 6-year budget projectionThe following worksheet will help you understand how long-term planning is achieved. The information and data used in the following example (Table 3.1) is strictly for the purpose of illustrating how quickly, if you don’t plan ahead, financial trouble can hit a utility.
Chapter 3The �-Year Financial Plan
estimating.costs.for.the..next several years based on .your fixed costs, operating
expenses, predicted equipment replacement,.repair.needs,.and.
existing.grants.or.loans.can..help avoid a significant gap .between revenue and costs.

�12006 Edition Rural Community Assistance Corporation
Table 3.1 Budget Projections Worksheet
revenues.and.eXpendItures.Worksheet
Public Utility system.
. . .
Revenues and Expenses (without Capital Expenses)
Line No DESCRIPTION Current Year
Inflation Factor (%)
Year 2 Year 3 Year 4 Year 5 Year 6
PROJECTED CUSTOMERS 140 ----- 150 150 170 180 190 Annual increase in customers (%) ----- ----- 7.1% 6.7% 6.3% 5.9% 5.6% EXPENSES Operations,Maintenance&
AdministrativeExpenses
1 Salaries $ 24,000 3.0% $ 24,720 $ 25,462 $ 26,225 $ 27,012 $ 27,823 2 Personnel Benefits $ 3,000 12.0% $ 3,360 $ 3,763 $ 4,215 $ 4,721 $ 5,287 3 Power & other utilities* $ 5,000 6.0% $ 5,679 $ 6,421 $ 7,231 $ 8,116 $ 9,081 4 Chemicals and Treatment* $ 800 5.0% $ 900 $ 1,008 $ 1,125 $ 1,250 $ 1,386 5 Sampling $ 1,000 3.0% $ 1,030 $ 1,061 $ 1,093 $ 1,126 $ 1,159 6 Materials, parts & repairs* $ 1,500 3.0% $ 1,655 $ 1,819 $ 1,990 $ 2,171 $ 2,360 7 Purchased water-Wholesale* $ 400 3.0% $ 441 $ 485 $ 531 $ 579 $ 629 8 Transportation $ 500 3.0% $ 515 $ 530 $ 546 $ 563 $ 580 9 Office Supplies & Postage* $ 1,500 3.0% $ 1,655 $ 1,819 $ 1,990 $ 2,171 $ 2,360 10 Insurance $ 3,000 3.0% $ 3,090 $ 3,183 $ 3,278 $ 3,377 $ 3,478 11 Permits and fees $ 500 0.0% $ 500 $ 500 $ 500 $ 500 $ 500 12 Licenses, dues & subscriptions $ 500 3.0% $ 515 $ 530 $ 546 $ 563 $ 580 13 Trainings, meetings & mileage $ 500 3.0% $ 515 $ 530 $ 546 $ 563 $ 580 14 Professional Services $ 5,000 3.0% $ 5,150 $ 5,305 $ 5,464 $ 5,628 $ 5,796 15 Taxes $ 300 3.0% $ 309 $ 318 $ 328 $ 338 $ 348
16 Water Conservation Fee $ 300 0.0% $ 300 $ 300 $ 300 $ 300 $ 300
17 Public Regulation Commission $ 250 0.0% $ 250 $ 250 $ 250 $ 250 $ 250
18 Other: $ -- $ -- $ -- $ -- $ --
19 total.operating.expenses . $ 48,050 3.3% $ 50,585 $ 53,283 $ 56,159 $ 59,225 $ 62,495

�2 2006 EditionRural Community Assistance Corporation
Debt
20 Total Annual Loan Payments $ 5,000 0.0% $ 5,000 $ 5,000 $ 5,000 $ 5,000 $ 5,000 21 Other: $ -- 0.0% $ -- $ -- $ -- $ -- $ -- 22 Total Debt Expense $5,000 $5,000 $5,000 $5,000 $5,000 $5,000
ReserveAnnualSetAside23 Debt Service Reserve $ 1,500 $ 1,500 $ 1,500 $ 1,500 $ 1,500 $ 1,500 24 Operating Reserve $ -- $ -- $ -- $ -- $ -- 25 Emergency Reserve $ 150 $ 150 $ 150 $ 150 $ 150 $ 150 26 Capital Improvement Reserve $ -- $ -- $ -- $ -- $ --- 27 Equipment Replacement Reserve $ 200 $ 200 $ 200 $ 200 $ 200 $ 200 28 Other: 29 Total Annual Reserve Fund
Contribution $ 1,850 . $ 1,850 $ 1,850 $ 1,850 $ 1,850 $ 1,850
30 total.annual..
cost.oF.BusIness..(add.lines.19+22+29).)
. $ 54,900 $ 57,435 .$...60,133. .$.63,009. $ 66,075 $ 69,345
revenues31 AVAILABLE OPENING
CASH BALANCE $ 2,400 $ 2,060 $ -- $ - $ - $ --
revenues.receIved. OperatingRevenue . . . . . . .32 Utility Rates [assumes increase
based on new customers] $ 45,360 $ 48,600 $ 51,840 $ 55,080 $ 58,320 $ 61,560
33 Other 34 Other 35 total.operatIng.revenue . $ 45,360 . .$...48,600. $ 51,840 $ 55,080 $ 58,320 $ 61,560
�32006 Edition Rural Community Assistance Corporation
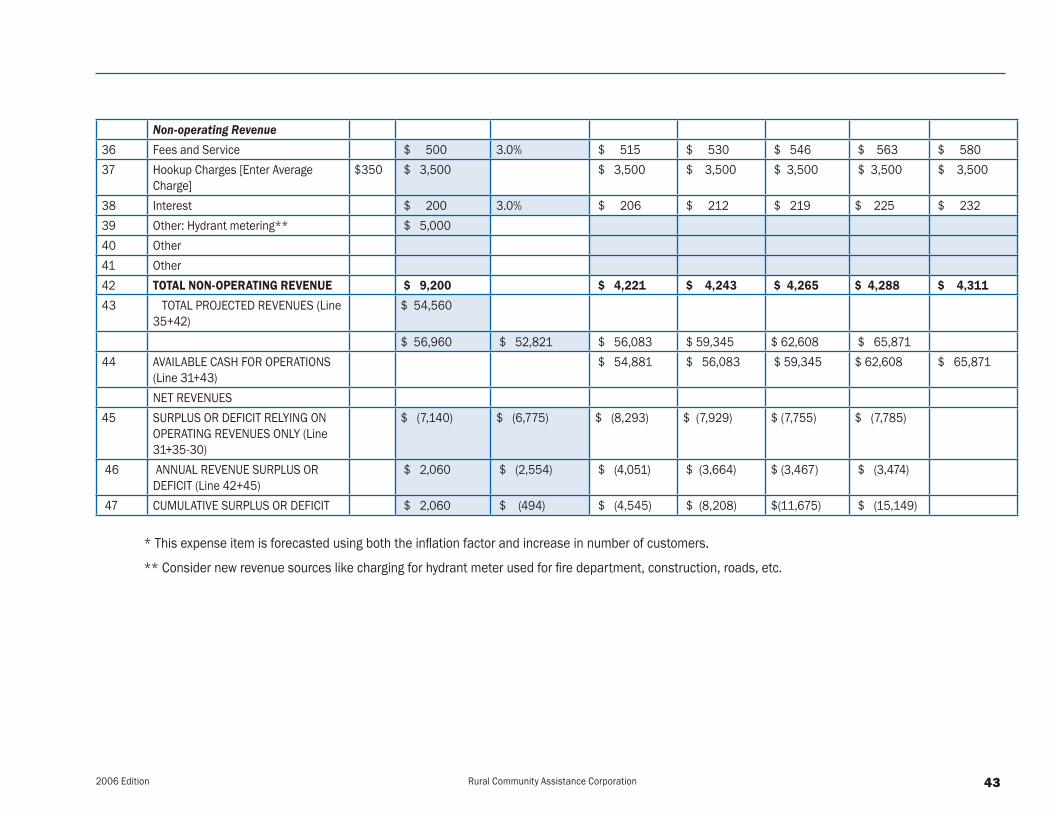
Non-operatingRevenue . . . . . . .36 Fees and Service $ 500 3.0% $ 515 $ 530 $ 546 $ 563 $ 580 37 Hookup Charges [Enter Average
Charge]$350 $ 3,500 $ 3,500 $ 3,500 $ 3,500 $ 3,500 $ 3,500
38 Interest $ 200 3.0% $ 206 $ 212 $ 219 $ 225 $ 232 39 Other: Hydrant metering** $ 5,000 40 Other 41 Other 42 total.non-operatIng.revenue .$...9,200. . .$...4,221. .$....4,243. $ 4,265 $..4,288. .$....4,311.43 TOTAL PROJECTED REVENUES (Line
35+42)$ 54,560
$ 56,960 $ 52,821 $ 56,083 $ 59,345 $ 62,608 $ 65,871 44 AVAILABLE CASH FOR OPERATIONS
(Line 31+43) $ 54,881 $ 56,083 $ 59,345 $ 62,608 $ 65,871
NET REVENUES45 SURPLUS OR DEFICIT RELYING ON
OPERATING REVENUES ONLY (Line 31+35-30)
$ (7,140) $ (6,775) $ (8,293) $ (7,929) $ (7,755) $ (7,785)
46 ANNUAL REVENUE SURPLUS OR DEFICIT (Line 42+45)
$ 2,060 $ (2,554) $ (4,051) $ (3,664) $ (3,467) $ (3,474)
47 CUMULATIVE SURPLUS OR DEFICIT $ 2,060 $ (494) $ (4,545) $ (8,208) $(11,675) $ (15,149) * This expense item is forecasted using both the inflation factor and increase in number of customers.
** Consider new revenue sources like charging for hydrant meter used for fire department, construction, roads, etc.

�� 2006 EditionRural Community Assistance Corporation
Now that you know the importance of budget projections, you are ready to complete your own budget projection worksheet. This is what you need to know:
1. Open the budget projection worksheet in your CD.
2 . Fill in all the green spaces.
3. Add information on Projected Customers for the next 6 years. For information on anticipated growth look at your most recent water master plan, review your local comprehensive plan and/or contact your local planning agency.
4. Next, enter the expense and budget line items you have identified for your system in Chapter 1.
5. Enter information on projections for the next year in the appropriate column from the EXPENSE Worksheet, RESERVE SUMMARY Worksheet, and REVENUE Worksheets in Chapter 1.
6. Add information on inflation as appropriate. If there is no projected inflationary impact, leave the space blank or enter 0%.
7. Be sure to enter your current connection fee in line 37.

��2006 Edition Rural Community Assistance Corporation
hoW.to.read.the.Worksheet.The information that will be of most value is under Net Revenue (Line 45) and indicates whether the operating revenues are sufficient to cover expenses plus planned reserve set asides. Line 46 shows Net Deficit or Surplus, and it considers both operating and non-operating revenues. A surplus indicates that there are adequate revenues to cover costs. A deficit indicates that rates will most likely need to be adjusted, if that is the case, you need to follow the process in Chapter 2. Line 47 shows Cumulative Net Revenues.
Below is information using the example worksheet to help you graphically understand what the budget projection determined.
graph.1:.total.cost.of.operations.projected.for.next.Year
Debt Service Requirement, $5,000, 9%
Reserve Contribution, $1,850, 3%
Operating Expenses, $48,050, 88%

�� 2006 EditionRural Community Assistance Corporation
these.types.of.graphs.can..assist in explaining to board members and customers why rates.increases.are.necessary.and.when.they.may.need..to be raised, or why they .are adequate.
$-
$20,000
$40,000
$60,000
$80,000
Year
Expenditures
Revenues
Expenditures $54,900 $57,435 $60,133 $63,009 $66,075 $69,345Revenues $56,960 $54,881 $56,083 $59,345 $62,608 $65,871
1 2 3 4 5 6
$2,060
$(494)
$(4,545)
$(8,208)
$(11,675)
$(15,149)
($20,000)
($15,000)
($10,000)
($5,000)
$0
$5,000
$10,000
1 2 3 4 5 6
Year
Cum
ulat
ive
Defic
it/Su
rplu
s
Graph 4: Cumulative Surplus/Deficit
Graph 2: Total Cost of operations vs. Revenues

��2006 Edition Rural Community Assistance Corporation
Determining revenues required from your customers to meet budget projections
Chapter 2 repeatedly stresses the importance of generating sufficient revenues to meet all operating expenses, including reserve set asides. As a utility system, the only source of reliable revenue is that generated from the sale of your services. By consequence the rates must be assessed annually to guarantee adequate funding of all expenses and reserves. Budget projections can be used as a road map identifying major issues and challenges. It can also help you recognize turns off the path of financial stability and safely. As a forecasting tool, it is a good one to have in your toolbox.
Budget.projections.can..be used as a road map identi-fying.major.issues.and.chal-lenges..It.can.also.help.you.
recognize turns off the path of financial stability and safely. as.a.forecasting.tool,.it.is.a.
good one to have. in your toolbox.

�� 2006 EditionRural Community Assistance Corporation
conclusIon.This guide book has walked you through several steps to help you achieve sound financial footing. Use it as a reference guide every year during budget development time to help you assess whether your revenues are adequately covering all the costs of operating your system, including maintaining a good reserve system to address any emergencies or future capital improvement replacement plans.
The steps of this guidebook have been designed to help you meet the financial requirements from the different state funding agencies when you request funding assistance for any of your infrastructure projects. The following checklist will help you prepare your funding request financial information.
Funding Requirement Checklist:
A budget that includes the following information:
• Last Years Actual Expenses;
• Current Years Expenses;
• Changes in Next Year’s Budget; and
• Next Year’s Estimated Expenses.
A rate structure to meet all expenses and reserve requirements
A 6-year budget projection

��2006 Edition Rural Community Assistance Corporation
If you need assistance with this guide, please contact:
rural.community.assistance.corporation www.rcac.org
1-505-983-5074
1-505-382-6992
1-505-298-4511
If you need assistance with other issues on your utility, there are other technical assistance providers in the state you can call for assistance.
new.Mexico.rural.Water.association www.nmrwa.org 1-800-819-9893
Environmental Finance Center www.efc.nmt.edu 1-505-272-7280

�0 2006 EditionRural Community Assistance Corporation
keY.terMs
Affordability — The ability to pay a water bill without compromising the ability to pay for other essential goods and services. Affordability criteria are determined by each state and may vary from state to state.
asset.Management — A planning process for managing your system’s assets (i.e, equipment, facilities, and infrastructure). Asset management helps to ensure that a system has adequate resources to rehabilitate or replace assets and can reduce system costs while increasing the efficiency and reliability of the assets.
Block — A quantity of water for which a price per unit of water is set, it normally includes 1000 gallons.
Capacity Development — A process through which a water system can acquire adequate technical, managerial, and financial capabilities to consistently provide safe and adequate drinking water.
Capital Improvement Plan — A budgeting and financial tool that a system can use to establish asset rehabilitation and maintenance priorities and to establish funding for repairs and improvements. Developing a capital improvement plan involves: inventorying and evaluating existing conditions of system infrastructure; prioritizing infrastructure needs; identifying how these needs will be financed; establishing a schedule for meeting these needs taking into account priorities and finances; and developing a brief written plan summarizing these steps.
Community Water System (CWS)— .A system that serves at least 15 service connections used by year-round residents or regularly serves at least 25 year-round residents.
Decreasing Block Rate — A rate structure under which the price of water per block decreases as the amount used increases. Blocks are set according to consumption (e.g., up to 2,000 gallons used, 2,000 to 6,000 gallons used, etc.).
Disadvantaged Community— .A community that does not meet affordability criteria defined by the state and where residents will have difficulties paying for water. If your system serves a disadvantaged community, you may be eligible for federal or state grants.
Equitable Rate Structures — A rate structure that covers all costs and which the community agrees is equitable – e.g. the community may agree that schools get free water and that all citizens will share.
Fixed Expenses — Costs that remain the same regardless of how much your system’s services are being used (e.g., debt service on loans).
Flat Rate/Fixed Fee — Rate structure under which all customers pay a set monthly fee for water service.
Income — The cash flow into the system.
Increasing Rate — Rate structure under which the price of water per block increases as the amount used increases. Blocks are set according to consumption (e.g., up to 2,000 gallons used, 2,000 to 6,000 gallons used, etc.).
Median.household.Income.(MhI) — An estimate of local annual household income. It is calculated by listing all household incomes in the community in ascending order. The MHI will be the household income in the middle of the list (i.e., with the same number of households above and below it). To be affordable, water rates should not exceed 2 to 2.5 percent of the MHI.
Net Income — The funds available in excess of the funds expended to run the system.
non-transient,.non-community.Water System (NTNCWS) — A public water system that is not a community water system and that regularly serves at least 25 of the same persons over 6 months per year. Examples include schools, hospitals, and churches with their own water supplies.
Public Water System (PWS) — A system that provides water for human consumption to the public through pipes or other constructed conveyances. These systems have at least 15 service connections or regularly serve an average of at least 25 individuals daily at least 60 days out of the year.
Rate — The charge your system assesses its customers for use of

�12006 Edition Rural Community Assistance Corporation
your system’s services, usually billed monthly.
Rate Structure — A framework used to assess charges (rates) to water system customers, enabling the system to generate sufficient revenue. The structure can take into account the system’s characteristics (e.g., location in a highly industrial area) and goals (e.g., to generate enough revenue to cover the full cost of water provision and encourage conservation). The structure can also account for customers of different classes (e.g., agricultural or residential), income levels, and water use habits. Rate structures are usually made up of a fixed service charge that does not change from month to month, and a consumption charge assessed per unit of water consumed.
Reserve Account — Used to set aside funds that will be needed in the future to finance future system expenses such as infrastructure rehabilitation or replacement, or to address system emergencies.
Revenue — Funds generated from operation of the water system.
Seasonal Rate — Rates that vary depending on the time of the year. Seasonal rates can be used in conjunction with any rate structure, including flat rates and uniform, decreasing, or increasing block rates.
Strategic Planning — A process through which an organization defines what it does and why. A strategic plan defines an entity’s long-term goals and objectives and provides a framework through which to meet these goals. Strategic plans should be flexible and easily adapted in response to unexpected changes.
technical,.Managerial,..and.Financial.capacity.
Technical Capacity — refers to the physical infrastructure of a water system, including but not limited to the and Financial Capacity adequacy of the source water, infrastructure (source, treatment, storage, and distribution), and the ability of system personnel to implement the requisite technical knowledge.
Managerial Capacity — refers to a water system’s management structure, including but not limited to ownership accountability, staffing and organization, and effective linkages to customers and regulatory agencies.
Financial Capacity — refers a water system’s financial resources, including but not limited to revenue sufficiency, credit worthiness, and fiscal controls.
transient.non-community.Water.System (TNCWS) — A non-community water system that does not regularly serve at least 25 of the same persons over 6 months Non-community per year. Examples include campgrounds, rest areas, or truck stops.
Uniform Rate — A rate structure under which customers usually pay a minimum monthly fee plus additional costs assessed per gallon of water used.
Variable Expenses — The costs of operating your system that change as the amount of water that you pump, treat, and sell increases or decreases. Examples include chemicals, maintenance, and training costs.

�2 2006 EditionRural Community Assistance Corporation
reFerences
1. A Guidebook of Financial Tools. USEPA, Environmental Finance Program.
2. Financial Accounting Guide for Small Water Utilities, Michael D. Peroo (Kansas Rural Water Association).
3. Small System Guide to Developing and Setting Water Rates, Rural Community Assistance Program, Inc.
4. Rate Setting and Capacity Development, the Environmental Finance Center at the University of Maryland.
5. North Dakota’s Small Community Water System’s Handbook on Developing and Setting Water Rates, the Midwest Assistance Program, the Midwestern RCAP, under a contract with the North Dakota Department of Health.
6. A Guide for Financing and Rate-setting Options for Small Water Systems, Andrea L. Williams and Virginia Water Resources Research Center, Virginia Polytechnic Institute and State University.
7. EPA Setting Small Drinking Water System Rates for a Sustainable Future. STEP Guide Series. EPA 816-R-05-006.

�32006 Edition Rural Community Assistance Corporation
appendIX.a.–.deFIne.the.lIne.IteMs.Worksheet
operating.expensesline.Item: Definition:EXAMPLE:Wages This line item includes regular salaries, on-call, overtime and a performance bonus
incentive that is proposed for employee performance objectives. A 5 percent cost-of-living allowance (COLA) is included in the budget.

�� 2006 EditionRural Community Assistance Corporation
appendIX.B.rate.calculating.resources
1. Environmental Finance Center at Boise State
• capFinance.helps systems develop an inventory of their assets and analyze funding options for rehabilitation and replacement of assets.
• ratio8 is a financial assessment tool that can help systems identify potential problems and monitor their financial situation. It analyzes data from eight areas: operations, revenue, liability, sales, expenses, assets, debts, and accounts receivable.
• ratecheckup is a rate-setting program that generates rate schedules and provides budgets and financial forecasts.
For more information on these products, visit the Environmental Finance Center online at, http://sspa.boisestate.edu/efc/services.htm or call (208) 426-1567.
2. show-me.Water.ratemaker. The Missouri Department of Natural Resources has developed analysis software to help water systems set rates. To obtain a free copy visit: http://www.dnr.state.mo.us/oac/Ratemakerbrochure.pdf, or call (800) 361-4827.
3. safety/setting.Water.rates.-.small.Water.systems.operation.and.Maintenance. The Office of Water Programs at California State University Sacramento developed a series of CD-ROMs. CD: 702E contains information on setting water rates from the Small Water System Operation and Maintenance manual. The CD is the companion material for a 15-contact hour course on safety and setting water rates, but can be purchased separately online at, http://www.owp.csus.edu/ordering.htm

��2006 Edition Rural Community Assistance Corporation
This Guidebook is dedicated to the sustainability and increasing viability of rural utilities in New Mexico.
It is with great pride that RCAC has produced this financial planning guidebook. We would gratefully like to acknowledge the contributions of those who have brought their experience forward to make this guidebook meaningful, especially Swati Thomas, Brian Phillips, Blanca Surgeon, George Schlender, Skip Rand, Nicole Trousdale, John Offersen, Cynthia Rex, and Tom McHugh. While not mentioned by name, there are many others, to whom accolades must also be given. Thank you so much.
The most credit for conceiving and delivering this important guidebook goes to Olga Morales-Sanchez for her vision and tireless attention to detail.
We would particularly like to express our sincere thanks to New Mexico utility water and wastewater systems for sharing their financial management challenges and for helping us to develop a resource tool that helps them overcome their challenges while becoming financially sustainable. Special thank yous go to Arenas Valley Water Development Association, Ilfleld Mutual Domestic Water Consumers Association and Bosque Farms Water System for volunteering their financial information during the development of this guidebook.
Last, but certainly not least, we thank Anne Watkins, Special Assistant to the State Engineer, Office of the New Mexico State Engineer/Interstate Stream Commission for her leadership and dedication to this effort and to the State of New Mexico for funding this much needed financial planning guidebook
Acknowledgements
NTNicole TrousdaleGraphic Design
2546 Valley Park Blvd.Larkspur, CO 80118
NTNicole TrousdaleGraphic Design
2546 Valley Park Blvd.Larkspur, CO 80118
NTNicole TrousdaleGraphic Design
2546 Valley Park Blvd.Larkspur, CO 80118
NTNicole TrousdaleGraphic Design
2546 Valley Park Blvd.Larkspur, CO 80118
NTNicole TrousdaleGraphic Design
2546 Valley Park Blvd.Larkspur, CO 80118
NTNicole TrousdaleGraphic Design
2546 Valley Park Blvd.Larkspur, CO 80118
Design by Nicole Trousdale graphic design

200� Edition
Rural Community Assistance Corporationwww.rcac.org