
Financial Integrity Rating System of Texas (FIRST)
31
NEWLY ADOPTED INDICATORS FOR THE 2015‐2016 RATING YEAR AND SUBSEQUENT RATING YEARS Financial Integrity Rating System of Texas (FIRST)
Transcript of Financial Integrity Rating System of Texas (FIRST)

NEWLY ADOPTED INDICATORS FOR THE 2015‐2016 RATING YEAR AND SUBSEQUENT RATING YEARS
Financial Integrity Rating System of Texas (FIRST)

What is FIRST?
FIRST is an accountability rating system that holds school districts accountable for the quality of their financial management practices and actual improved performance.
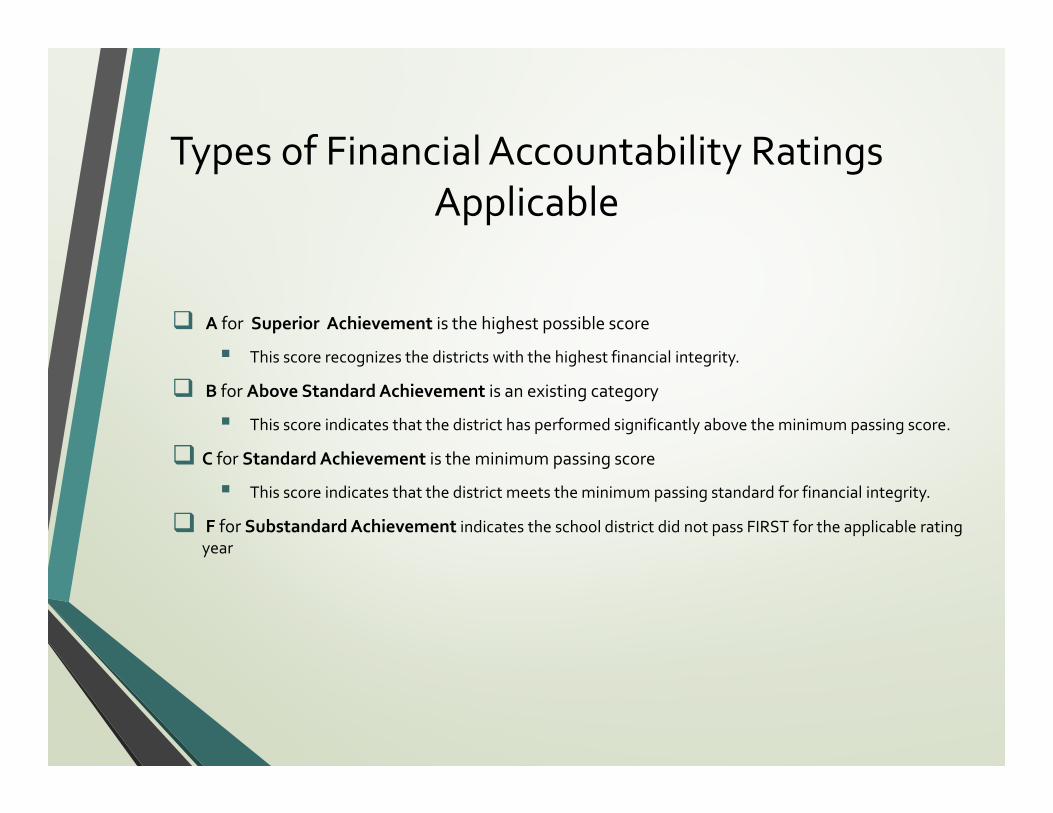
Types of Financial Accountability Ratings Applicable
A for Superior Achievement is the highest possible score
This score recognizes the districts with the highest financial integrity.
B for Above Standard Achievement is an existing category
This score indicates that the district has performed significantly above the minimum passing score.
C for Standard Achievement is the minimum passing score
This score indicates that the district meets the minimum passing standard for financial integrity.
F for Substandard Achievement indicates the school district did not pass FIRST for the applicable rating year

Indicator 1: Filing the Annual Financial Report (AFR) and Electronic Data feed
Was the complete annual financial report (AFR) and data submitted to the TEA within 30 days of the November 27 or January 28 deadline depending on the school district’s fiscal year end date of June 30 or August 31, respectively?
Yes, the AFR was submitted 10/29/15

Indicator 2.A: Unmodified Opinion for AFR
Was there an unmodified opinion in the AFR on the financial statements as a whole?
Yes

Indicator 2.B: Material Weakness Noted On AFR
Did the external independent auditor report that the AFR was free of any instance(s) of material weaknesses in internal controls over financial reporting and compliance for local, state, or federal funds?
Yes

Indicator 3: Default on Debt
Was the school district in compliance with the payment terms of all debt agreements at fiscal year end?
Yes

Indicator 4: Timely Payment
Did the school district make timely payments to the Teachers Retirement System (TRS), Texas Workforce Commission (TWC), Internal Revenue Service (IRS), and other government agencies?
Yes

Indicator 5: Unrestricted Net Asset Balance
Was the total unrestricted net asset balance (Net of the accretion of interest for capital appreciation bonds) in the governmental activities column in the Statement of Net Assets greater than zero?
Yes. The District had an unrestricted net asset balance of $12,330,141

Indicator 6: Days Cash on Hand
Was the number of days of cash on hand and current investments in the general fund for the school district sufficient to cover operating expenditures (excluding facilities acquisition and construction)?
Yes. Score: 10 Points
Cash and Equivalents 25,018,877* 365 = 103.65 days
Expenditures 88,101,442

Indicator 6: Days Cash On Hand
Indicator 6: Determination of Points for School Districts
0 points = < 30 days
2 points = 30 to 44 days
4 points = 45 to 59 days
6 points = 60 to 74 days
8 points = 75 to 89 days
10 points = 90+ days

Indicator 7: Current Assets to Current Liabilities
Was the measure of current assets to current liabilities ratio for the school district sufficient to cover short‐term debt?
Yes. Score: 6 Points
Current Assets 52,060,765= 2.191Current Liabilities 23,761,133

Indicator 7: Current Assets to Current Liabilities
Indicator 7: Determination of Points for School Districts
0 points = < 1
2 points = 1 to 1.49
4 points = 1.5 to 1.99
6 points = 2 to 2.49
8 points = 2.5 to 2.99
10 points = 3+

Indicator 8: Long‐Term Liability to Total Assets Ratio
Was the ratio of long‐term liabilities to total assets for the school district sufficient to support long‐term solvency?
Yes. Score: 8 Points
Long Term Liabilities (minus Net Pension Liability) 207,005,500= 0.688339
Total Assets 300,731,779

Indicator 8: Long‐Term Liability to Total Assets Ratio ‐Continued
Indicator 8: Determination of Points for School Districts
0 points = > 1
2 points = 1 to 0.91
4 points = 0.9 to 0.81
6 points = 0.8 to 0.71
8 points = 0.7 to 0.61
10 points = 0.6 or less

Indicator 9: General Fund Expenditure Analysis
Did the school district’s general fund revenues equal or exceed expenditures (excluding facilities acquisition and construction)?
Yes. Score 10 Points
Total Revenue 92,575,894= 1.050788 ‐ 1.00 = 0.050788
Total Expenditures 88,101,442

Indicator 10: Debt Service Coverage Ratio
Was the debt service coverage ratio sufficient to meet the required debt service?
Yes. Score: 10 Points
Total Revenues 113,475,404‐Total Expenditures 105,153,154+ Debt Service (function codes 71, 72, and 73) 17,051,712+ Fund Code 599 (Debt Service fund balance) 15,570,030
Subtotal 40,943,992= 2.4012Debt Service (function codes 71, 72, and 73) 17,051,712

Indicator 10: Debt Service Coverage Ratio
Indicator 10: Determination of Points for School Districts
0 points = < 1.00
2 points = 1.00 to 1.05
4 points = 1.05 to 1.10
6 points = 1.10 to 1.15
8 points = 1.15 to 1.20
10 points = > 1.20

Indicator 11: Administrative Cost Ratio
Was the school district’s administrative cost ratio equal to or less than the threshold ratio?
Yes. Score 8 Points
District Administrative Cost Ratio 0.0863
ADA 10,049.75

Indicator 11: Administrative Cost Ratio
Indicator 11: Determination of Points for School Districts with ADA size 10,000 and Above
0 points = > 0.1855
2 points = 0.1855 to 0.1605
4 points = 0.1605 to 0.1355
6 points = 0.1355 to 0.1105
8 points = 0.1105 to 0.0855
10 points = < 0.0855

Indicator 12: Student to Staff Ratio
Did the school district not have a 15 percent decline in the students to staff ratio over 3 years (total enrollment to total staff)?
Yes. Score: 10 Points
2014‐2015 Total Enrollment 10,651
2012‐2013 Total Enrollment 10,370

Indicator 13: PEIMS Data Quality
Did the comparison of PEIMS data to like information in the school district’s AFR data feed result in an aggregate variance of less than 3%?
Yes. Score: 10 Points
Difference of Comparison of PEIMS data to District's Annual Financial Report 215 = 0.0000
Expenditures 88,101,421

Indicator 14: Material Noncompliance Noted On Annual Financial Report (AFR)
Did the external independent auditor indicate the AFR was free of any instance(s) of material noncompliance for grants, contracts, and laws related to local, state, or federal funds?
Yes. Score: 10 Points

Indicator 15: FSP Hardship
Did the school district not receive an adjusted repayment schedule for more than one fiscal year for an over allocation of Foundation School Program (FSP) funds as a result of a financial hardship?
Yes. Score: 10 Points

Georgetown ISD 2015‐16 Rating
Georgetown ISD received the highest possible rating of
A = Superior Achievement
With a score of 92 out of 100

Disclosures Reporting requirements for the financial management report for Schools FIRST public hearing are found in Title 19 Texas Administrative Code Chapter 109, Budgeting, Accounting, and Auditing, Subchapter AA, Commissioner's Rules Concerning Financial Accountability Rating System. This rule describes requirements for the five (5) disclosures explained below that are to be presented as appendices in the Schools FIRST financial management report. 1. Superintendent’s Employment Contract The school district is to provide a copy of the superintendent's employment contract that is effective on the date of the Schools FIRST hearing in calendar year 2016. In lieu of publication in the Schools FIRST financial management report, the school district may choose to publish the superintendent's employment contract on the school district's Internet site. If published on the Internet, the contract is to remain accessible for twelve months. The Superintendent’s Employment Contract is available on the District’s webpage found at the following link:
http://www.georgetownisd.org/Domain/79

Disclosures 2. Reimbursements Received by the Superintendent and Board Members for Fiscal Year 2015 For the Twelve-month Period Ended June 30, 2015 Description of Reimbursements Fred
Brent Scott
Stribling Scott
Alarcon Andy Webb
Fred Barhydt
Melanie Dunham
Greg Eady
Ronna Johnson
Meals -
-
-
- - 43.82 - 149.36
Lodging 174.80
-
-
- - 456.49 -
2,634.13
Transportation 550.76 232.17
-
- - 385.52 -
1,558.25
Motor Fuel -
-
-
- - - -
-
Other -
-
-
- - - -
159.21
Total 725.56 232.17
-
- - 885.83 - 4,500.95 Note – The spirit of the rule is to capture all “reimbursements” for fiscal year 2015, regardless of the manner of payment, including direct pay, credit card, cash, and purchase order. Reimbursements to be reported per category include: Meals – Meals consumed off of the school district’s premises, and in-district meals at area restaurants (excludes catered meals for board meetings). Lodging - Hotel charges. Transportation - Airfare, car rental (can include fuel on rental), taxis, mileage reimbursements, leased cars, parking and tolls. Motor fuel – Gasoline. Other - Registration fees, telephone/cell phone, internet service, fax machine, and other reimbursements (or on-behalf of) to the superintendent and board member not defined above.

Disclosures 3. Outside Compensation and/or Fees Received by the Superintendent for Professional Consulting and/or Other Personal
Services in Fiscal Year 2015 For the Twelve-Month Period Ended June 30, 2015 Name(s) of Entity(ies) $ Total $ 0.00
Note – Compensation does not include business revenues from the superintendent’s livestock or agricultural-based activities on a ranch or farm. Report gross amount received (do not deduct business expenses from gross revenues). Revenues generated from a family business that have no relationship to school district business are not to be disclosed.

Disclosures 4. Gifts Received by the Executive Officer(s) and Board Members (and First Degree Relatives, if any) in Fiscal Year 2015 For the Twelve-Month Period Ended June 30, 2015
Fred Brent
Scott Stribling
Scott Alarcon
Andy Webb
Fred Barhydt
Melanie Dunham
Greg Eady
Ronna Johnson
Summary Amounts - - - - - - - - Note – An executive officer is defined as the superintendent, unless the board of trustees or the district administration names additional staff under this classification. (Any gifts received by their immediate family as described in Government Code, Chapter 573, Subchapter B, Relationships by Consanguinity or by Affinity will be reported under the applicable school official.)

Disclosures 5. Business Transactions Between School District and Board Members for Fiscal Year 2015 For the Twelve-Month Period Ended June 30, 2015
Scott
Stribling Scott
Alarcon Andy Webb
Fred Barhydt
Melanie Dunham
Greg Eady
Ronna Johnson
Summary Amounts - - - - - - - Note - The summary amounts reported under this disclosure are not to duplicate the items reported in the summary schedule of reimbursements received by board members.

Disclosures Item 6 Other Information. 6. Any other information the board of trustees of the school district or open-enrollment charter school determines to be useful.


