Financial Information 2015 - Iwatani · Notes to the Consolidated Financial Statements P. 9 ......
32
Financial Information 2015
Transcript of Financial Information 2015 - Iwatani · Notes to the Consolidated Financial Statements P. 9 ......

Financial Information 2015

CONTENTS
Management’s Discussion and Analysis P. 1Consolidated Balance Sheets P. 4Consolidated Statements of Income P. 6Consolidated Statements of Comprehensive Income P. 6Consolidated Statements of Changes in Net Assets P. 7Consolidated Statements of Cash Flows P. 8Notes to the Consolidated Financial Statements P. 9Independent Auditors’ Report P. 29

1
Management’s Discussion and Analysis
1. Financial PositionTotal assets as of March 31, 2015 stood at ¥408,824 million, down by ¥7,395 million compared with the previous fiscal year-end. This decrease was mainly attributable to decreases in certain accounts including ¥14,282 million in notes and accounts receivable-trade, and ¥9,726 million in merchandise and finished goods ; exceeding increasing factors such as ¥1,241 million in cash and deposits, ¥1,633 million in land, ¥1,553 million in construction in progress, and ¥9,514 million in investments in securities (including those in nonconsolidated subsidiaries and affiliates). Total liabilities amounted to ¥290,882 million, a year-on-year decrease of ¥20,279 million. This decrease was mainly due to considerable decreases such as ¥5,414 million in notes and accounts payable-trade, ¥8,248 million in short-term borrowings, and ¥11,378 million in long-term borrowings. Among liabilities, the aggregate amount of interest-bearing debt including lease obligations amounted to ¥141,793 million, down by ¥19,306 million from the previous fiscal year-end. Total net assets as of March 31, 2015 resulted in ¥117,942 million, a ¥12,884 million increase compared with the previous fiscal year-end. This increase was mainly attributable to increases such as ¥3,194 million in retained earnings, ¥6,372 million in unrealized gains on securities, and ¥2,552 million in foreign currency translation adjustments. Total equity rose by ¥12,281 million from the previous fiscal year-end to ¥109,007 million. Accordingly, the equity ratio improved by 3.5 percentage points to 26.7%. Adding ¥8,935 million minority interests to equity, total net assets amounted to ¥117,942 million. As a result of the above, ROA (the ratio of ordinary income to total assets) for the fiscal year ended March 31, 2015 was 3.1%. The ratio of interest-bearing debt to total assets was 34.7%, reflecting a ¥7,395 million decrease in total assets to ¥408,824 million and a ¥19,306 million decrease in total interest-bearing debt to ¥141,793 million.
2. Enhancement of Corporate GovernanceThe Company has established an organizational structure for management control that provides for ample functioning of corporate governance with respect to the system for auditing, management decision-making, business execution, and internal control. The Board of Directors, the Company’s business decision-making and supervisory body, consists of 15 directors (including 1 outside director). The Company has enhanced the functioning of the Board of Directors to ensure that the Board engages in appropriate, prompt decision-making and supervision on the basis
of full and active discussion. In particular, it ensures that the outside director collects information from a perspective independent of executive management in cooperation with the Audit & Supervisory Board members and strengthens and enhances transparency in decision-making and oversight effectiveness through a wealth of experience and extensive knowledge concerning corporate governance. The Company holds twice monthly Management Conferences, attended by senior management at the executive director level and above, to deliberate on matters to be submitted for resolution by the Board of Directors and important matters related to business execution and to promote information sharing and communication. In addition, the Company has introduced an executive officer system and is undertaking to invigorate the Board of Directors to increase the speed of decision-making and promote delegation of authority. The representative directors delegate authority to the executive officers in accordance with management policies determined by the Board of Directors, and the executive officers focus on executing business in accordance with instructions and orders. By introducing this system, the Company has promoted management efficiency through strengthening of the corporate strategy decision-making function and supervisory function of the Board of Directors. The Company has adopted the audit and supervisory board system. The Audit & Supervisory Board consists of four Audit & Supervisory Board members (including two outside Audit & Supervisory Board members). The full-time Audit & Supervisory Board members attend all meetings of the Board of Directors and Management Conferences, and the outside Audit & Supervisory Board members also attend meetings of the Board of Directors. The result is a system that enables sufficient monitoring of execution of duties by directors. In the appointment of Audit & Supervisory Board members, the Company places importance on specialized expertise in finance and accounting or the law and on knowledge and experience of the Company’s business. The outside Audit & Supervisory Board members satisfy the requirements concerning independent corporate officers stipulated by financial instruments exchanges. In this way, the Company has established an audit structure based on more diversified points of view. The Audit Department has been established by the Company as an organization that reports directly to the president. The Audit Department periodically conducts internal audits, maintaining a close relationship and collaboration with the Audit & Supervisory Board, and conducts audits to determine whether the business activities of the Group as a whole are being conducted appropriately and efficiently. The Company has selected KPMG AZSA LLC as the
SG&A Expenses ROE (Net Income to Net Assets) ROA (Ordinary Income to Total Assets)
(¥ million)
’11 ’12 ’13 ’14 ’15
(%)
SG&A expensesSG&A expenses to net sales
20.0
123,740
18.9 18.8
125,261 123,053
18.2
128,274
18.8
129,859
(%)
’11 ’12 ’13 ’14 ’15
15.7
10.0 10.4
11.6
6.1
(%)
’11 ’12 ’13 ’14 ’15
5.1
4.54.8
3.1
4.2

2
independent auditor, submits necessary data to the independent auditor in a timely manner, and has in place a system that enables the conduct of appropriate audits.
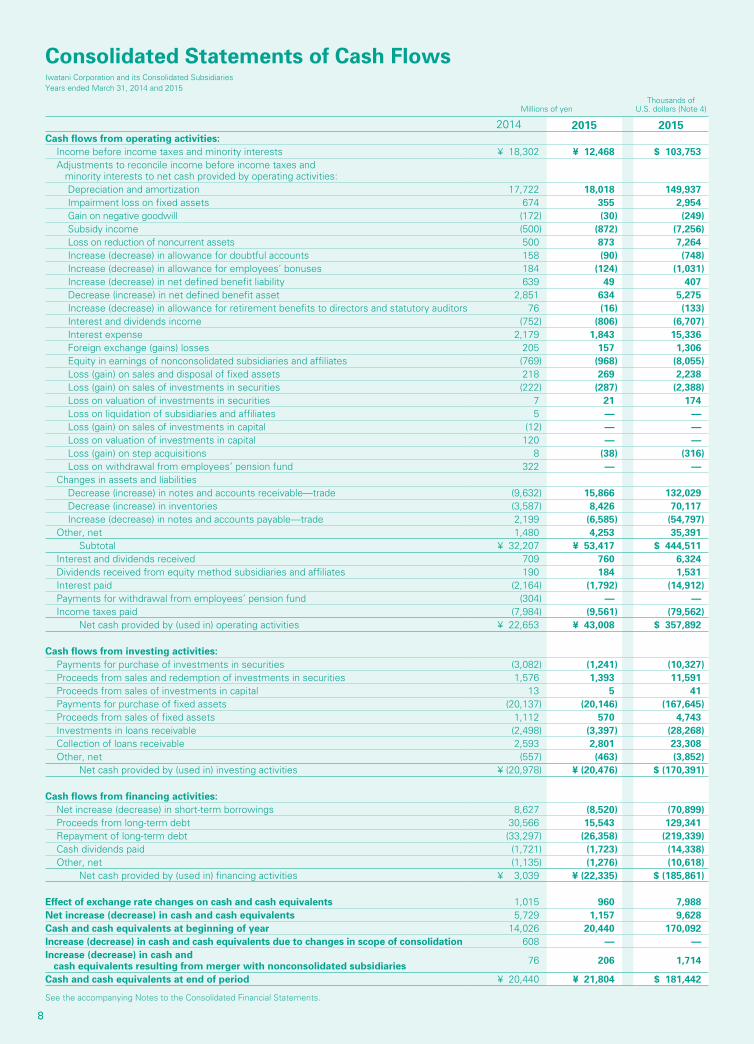
3. Cash FlowsCash and cash equivalents as of March 31, 2015 amounted to ¥21,804 million, a ¥1,363 million increase from the previous fiscal year-end.
(1) Cash flows from operating activitiesNet cash provided by operating activities for the fiscal year ended March 31, 2015 increased by ¥20,354 million from the previous fiscal year to ¥43,008 million. The major cash in-flow factors were ¥12,468 million income before income taxes and minority interests, ¥15,060 million depreciation, ¥15,866 million decrease in notes and accounts receivable-trade, and ¥8,426 million decrease in inventories.
(2) Cash flows from investing activitiesNet cash used in investing activities decreased by ¥502 million from the previous fiscal year to ¥20,476 million. Major factors behind this slight decrease were cash out-flow factors including ¥17,225 million payments for purchase of property, plant and equipment, ¥2,920 million payments for purchase of intangible assets, and ¥1,241 million payments for purchases of investments in securities, partially offset by ¥1,393 million proceeds from sales and redemption of investments in securities.
(3) Cash flows from financing activitiesNet cash used in financing activities for the fiscal year ended March 31, 2015 was ¥22,335 million, reversing ¥3,039 million net cash provided in the previous fiscal year. This cash-flow increase was mainly due to ¥19,335 million net decrease in short-term and long-term borrowings, ¥1,029 million repayment of lease obligations, and ¥1,920 million total cash dividends paid.
4. Risk ManagementThe following are some risks to the Iwatani Group’s business that may have a significant influence on investor decisions. Any forward-looking statements contained herein reflect the judgment of the Iwatani Group as of March 31, 2015.
(1) Seasonal factors and weather fluctuationsSince consumption of LPG, the Group’s mainstay product, is affected by air and water temperatures, LPG sales volumes tend to
decrease in warm seasons and increase in cool seasons. For this reason, the Group’s earnings structure is weighted toward income in the second half of the fiscal year. Additionally, unseasonable weather patterns may affect the Group’s LPG sales volumes.
(2) The impact of LPG import pricesWith regard to LPG import prices, the contract price (CP) announced monthly by Saudi Arabian Oil Company (Saudi Aramco) has a significant influence on pricing decisions in the international market. Accordingly, sudden fluctuations in the CP are a factor that affects the Iwatani Group’s LPG purchase prices. The Iwatani Group also procures LPG produced in the U.S. and is affected by fluctuations in the Mont Belvieu (MB) price, the LPG benchmark price in the U.S.
(3) Impact of currency rate fluctuationsThe Group uses forward exchange contracts in order to avoid risks from exchange rate fluctuations in currency markets, which the Group is exposed to in its trade transactions. However, if exchange rates fluctuate rapidly, it is difficult to completely eliminate the risks, meaning that such conditions could impact on the Group’s financial performance.
(4) Impact of interest rate fluctuationsThe Group has financing needs for its strategic investments, including capital expenditures for increasing the number of LPG customer households through M&A, as well as for expanding the industrial gas business. This means that interest rate fluctuations could impact on the Group’s financial performance. However, since most of the Group’s interest-bearing debt has been procured at a fixed rate, such fluctuations have limited impact.
(5) Impact of credit riskThe Group has made it a practice to grant credit to business partners in various ways, meaning that the Group is exposed to credit risk in the event of non-performance by the partners. In order to avoid such credit risk, the Group takes appropriate safeguard measures depending on the partners’ credit standing, such as setting credit limits and obtaining the necessary collateral and guarantees. However, in the event that we are unable to recover credit because of deterioration in credit standing, bankruptcies or other conditions affecting our business partners, the financial performance of the Group could possibly be affected.
(6) Intensified competition resulting from deregulationCurrently, legal reforms and deregulation are under way to extensively liberalize the electric power and gas retail businesses.
Capital Expenditure Depreciation and Amortization Interest-bearing Debt
(¥ million)
’11 ’12 ’13 ’14 ’15
23,312
20,64118,843
22,171
15,238
(¥ million)
’11 ’12 ’13 ’14 ’15
17,575 17,130 17,722 18,01816,885
(¥ million)
’11 ’12 ’13 ’14 ’15
(%)
Interest-bearing debt Ratio of interest-bearing debt to total assets
41.339.2
159,398 151,378
38.7
161,099
34.7
141,793
44.4
166,108

32
Such movements could result in significant transformation of the business environment toward severer competition within the same industry and/or among the various energy businesses, and the financial performance of the Group could be negatively affected.
(7) Impact of country riskThe Group not only has vast foreign trade transactions, but also has established business operations overseas, especially in Asia. The Group’s financial performance may be affected if changes should occur in the countries and regions where the Group operates, such as deterioration in political and/or economic climate, unexpected revision of laws, regulations and tax schemes and deterioration of public security.
(8) Risk from price fluctuations in marketable securitiesIn addition to holding shares in the Group companies, the Group holds marketable securities, primarily in business partners and financial institutions, for the purpose of creating closer business relationships. Accordingly, future fluctuations in the stock markets may impact on the Group’s financial performance.
(9) Defects in products and servicesThe products and services of the Group are produced and provided under an appropriate quality control system. However, if compensation was claimed for product liability, or if the Group must recall certain products, the social credibility and public image of the Group could be tarnished, in addition to a considerable amount of monetary expenses being directly required. Such a situation may impact the financial performance of the Group.
(10) DisastersThe Group handles LPG, industrial gases and other products in compliance with the High-Pressure Gas Safety Law. The Group
therefore conducts regular inspections as mandated by the Law, as well as voluntary inspections and checks. However, the stable supply of these products may conceivably be interrupted if the Group’s supply sites or the customers’ facilities were to be damaged due to a large earthquake or other natural disasters.
(11) Handling of personal informationIn running the LPG business and other business operations, the Group handles a considerable amount of personal information. As business operators handling personal information covered by the Law on the Protection of Personal Information, we do our utmost to comply with the Law by always working to ensure that such information is managed properly. However, if any of the personal information the Group handles were to be leaked outside of the Group despite our efforts to prevent such events, the Group’s reputation in society could be tarnished and/or customers could claim for damages. Such events could negatively affect the financial performance of the Group.
(12) Risk relating to legal complianceThe Group, which develops its businesses at home and abroad under various laws, regulations and social norms, has established the Compliance Committee and been striving to reinforce the corporate structure for legal compliance. In addition, the Group has also established the Outline of Iwatani Corporate Ethics, and widely publicized it to all members of the Group as the norm they should comply with. However, if infringement of laws and regulations occurred despite our efforts for thorough legal compliance as described above, the financial performance of the Group could be adversely affected through such consequences as administrative dispositions made by the authorities, lawsuits raised by stakeholders and tarnished social credibility of the Group.
Corporate Governance Structure
General Meeting of Shareholders
Board of Directors (15 directors and
1 outside director)
Executive Officers
(As of June 29, 2015)
Management Committee
•Security and Export Management Committee•Personal Information Control Committee•Compliance Committee•Factory Security Control Committee• Disaster Response and Environment Control Committee
•Overseas Security Control Committee•CS (Customer Satisfaction) Committee•Product Safety & Brand Management Committee
Business divisions and related companies
RepresentativeDirectors
Board of Corporate Auditors (2 full-time corporate auditors and
2 outside corporate auditors)
Appointment and dismissal
Appointment and dismissal
Report
Report
Report Report
Direction
Direction
Direction Direction
Direction
Report
Report Report
Report
Direction
Direction
Report
Internal audit
Internal audit
Appointment, dismissal and supervision
Report
Liaison
Audit
Audit
Appointment and dismissal
Risk Management Committee
Audit Department
Independent Auditors

4
Consolidated Balance SheetsIwatani Corporation and its Consolidated SubsidiariesYears ended March 31, 2014 and 2015
Millions of yenThousands of
U.S. dollars (Note 4)
ASSETS 2014 2015 2015
Current assets:
Cash and cash equivalents (Note 7) ¥ 20,440 ¥ 21,804 $ 181,442
Time deposits (Note 7) 555 432 3,594
Notes and accounts receivable (Note 7)
Trade 121,074 106,792 888,674
Other 3,962 4,953 41,216
Allowance for doubtful accounts (778) (732) (6,091)
Inventories (Note 9) 45,339 37,592 312,823
Deferred tax assets (Note 11) 3,251 3,462 28,809
Other 7,649 7,504 62,444
Total current assets 201,495 181,809 1,512,931
Property, plant and equipment:
Land (Notes 10 and 15) 55,735 57,368 477,390
Buildings and structures (Notes 10 and 15) 103,403 106,510 886,327
Machinery, vehicles, equipment and tools (Notes 10 and 15) 143,661 149,591 1,244,828
Lease assets 5,670 6,136 51,060
Construction in progress 2,211 3,764 31,322
310,682 323,371 2,690,946
Accumulated depreciation (178,246) (186,392) (1,551,069)
Net property, plant and equipment 132,436 136,979 1,139,876
Intangible assets:
Goodwill 14,027 14,157 117,808
Other 2,890 2,854 23,749
Total intangible assets 16,917 17,012 141,566
Investments and other assets:
Investments in securities (Notes 7, 8 and 10) 32,248 40,078 333,510
Investments in nonconsolidated subsidiaries and affiliates (Note 7) 17,723 19,407 161,496
Net defined benefit asset (Note 12) 4,436 2,346 19,522
Deferred tax assets (Note 11) 2,731 3,023 25,156
Other 9,053 8,999 74,885
Allowance for doubtful accounts (824) (831) (6,915)
Total investments and other assets 65,369 73,023 607,664
Total assets ¥ 416,219 ¥ 408,824 $ 3,402,047
See the accompanying Notes to the Consolidated Financial Statements.

54
Millions of yenThousands of
U.S. dollars (Note 4)
LIABILITIES AND NET ASSETS 2014 2015 2015
Current liabilities:
Short-term borrowings (Notes 7 and 10) ¥ 45,902 ¥ 37,654 $ 313,339
Current portion of long-term debt (Notes 7 and 10) 24,151 24,704 205,575
Notes and accounts payable—trade (Note 7) 103,401 97,987 815,403
Income taxes payable 7,038 3,347 27,852
Accrued bonuses 4,484 4,364 36,315
Other 20,229 24,620 204,876
Total current liabilities 205,206 192,678 1,603,378
Long-term liabilities:
Long-term debt (Notes 7 and 10) 87,278 75,899 631,596
Deferred tax liabilities (Notes 2(11) and 11) 3,093 5,483 45,627
Net defined benefit liability (Note 12) 5,243 5,732 47,699
Allowance for retirement benefits for directors and statutory auditors 1,190 1,174 9,769
Other 9,148 9,913 82,491
Total long-term liabilities 105,954 98,203 817,200
Total liabilities 311,161 290,882 2,420,587
Contingent liabilities (Note 13)
Net assets (Note 18)
Shareholders’ equity:
Common stock Authorized — 600,000,000 shares in 2015 and 2014 Issued — 251,365,028 shares in 2015 and 2014
20,096 20,096 167,229
Capital surplus 18,042 18,118 150,769
Retained earnings 52,339 55,534 462,128
Treasury stock, at cost 5,279,790 shares in 2015 5,342,931 shares in 2014
(1,452) (1,454) (12,099)
Total shareholders’ equity 89,025 92,294 768,028
Accumulated other comprehensive income:
Unrealized gains (losses) on securities 6,492 12,865 107,056
Deferred gains (losses) on hedges 55 127 1,056
Foreign currency translation adjustments 1,207 3,759 31,280
Remeasurements of defined benefit plans (55) (40) (332)
Total accumulated other comprehensive income 7,700 16,712 139,069
Minority interests 8,332 8,935 74,352
Total net assets 105,058 117,942 981,459
Total liabilities and net assets ¥ 416,219 ¥ 408,824 $ 3,402,047
See the accompanying Notes to the Consolidated Financial Statements.

6
Consolidated Statements of IncomeIwatani Corporation and its Consolidated SubsidiariesYears ended March 31, 2014 and 2015
Millions of yenThousands of
U.S. dollars (Note 4)
2014 2015 2015Net sales ¥ 703,923 ¥ 691,902 $ 5,757,693 Cost of sales 557,130 550,868 4,584,072
Gross profit 146,792 141,034 1,173,620 Selling, general and administrative expenses (Note 19) 128,274 129,859 1,080,627
Operating income 18,518 11,174 92,984
Other income (expenses):Interest and dividends income 752 806 6,707 Interest expense (2,179) (1,843) (15,336)Equity in earnings of nonconsolidated subsidiaries and affiliates 769 968 8,055 Impairment loss on fixed assets (Note 15) (674) (355) (2,954)Other, net (Note 20) 1,115 1,718 14,296
(216) 1,293 10,759
Income before income taxes and minority interests 18,302 12,468 103,753 Income taxes (Note 11) :
Current 9,900 5,433 45,210 Deferred (2,723) 114 948
7,177 5,548 46,167
Income before minority interests 11,125 6,919 57,576 Minority interests in income 658 719 5,983
Net income ¥ 10,466 ¥ 6,199 $ 51,585
Yen U.S. dollars (Note 4)
2014 2015 2015Per share (Note 17) :
Basic: net income ¥ 42.53 ¥ 25.19 $ 0.20 Cash dividends applicable to the period 7.00 7.00 0.05
See the accompanying Notes to the Consolidated Financial Statements.
See the accompanying Notes to the Consolidated Financial Statements.
Consolidated Statements of Comprehensive IncomeIwatani Corporation and its Consolidated SubsidiariesYears ended March 31, 2014 and 2015
Millions of yenThousands of
U.S. dollars (Note 4)
2014 2015 2015Income before minority interests ¥ 11,125 ¥ 6,919 $ 57,576
Other comprehensive income:Unrealized gains (losses) on securities 2,243 6,320 52,592 Deferred gains (losses) on hedges (92) 64 532 Foreign currency translation adjustments 2,784 2,470 20,554 Remeasurements of defined benefit plans, net of tax — (3) (24)Share of other comprehensive income of associates accounted for using equity method 323 328 2,729
Total other comprehensive income 5,259 9,181 76,400 Comprehensive income ¥ 16,384 ¥ 16,100 $ 133,976
Comprehensive income attributable to:Owners of the parent 15,467 15,212 126,587 Minority interests ¥ 916 ¥ 888 $ 7,389

76
Consolidated Statements of Changes in Net AssetsIwatani Corporation and its Consolidated SubsidiariesYears ended March 31, 2014 and 2015
Number of shares of common
stock (thousands)
Millions of yen
Shareholders’ equity Accumulated other comprehensive income
TotalCommon stock
Capital surplus
Retained earnings
Treasury stock
Unrealized gains (losses) on securities
Deferred gains (losses) on
hedges
Foreign currency
translation adjustments
Remeasurements of defined
benefit plans
Minority interests
Balance as of April 1, 2013 251,365 ¥ 20,096 ¥ 18,042 ¥ 43,637 ¥ (1,409) ¥ 4,251 ¥ 148 ¥ (1,646) — ¥ 7,781 ¥ 90,903
Net income for the year — — — 10,466 — — — — — — 10,466
Cash dividends — — — (1,725) — — — — — — (1,725)
Changes in scope of consolidation
— — — (40) — — — — — — (40)
Purchase of treasury stock — — — — (42) — — — — — (42)
Net changes in items other than shareholders’ equity
— — — — — 2,240 (93) 2,853 (55) 551 5,496
Balance as of April 1, 2014 251,365 ¥ 20,096 ¥ 18,042 ¥ 52,339 ¥ (1,452) ¥ 6,492 ¥ 55 ¥ 1,207 ¥ (55) ¥ 8,332 ¥ 105,058
Cumulative effects of changes in accounting policies
— — — (1,280) — — — — — — (1,280)
Restated balance as of April 1, 2014
251,365 20,096 18,042 51,058 (1,452) 6,492 55 1,207 (55) 8,332 103,778
Net income for the year — — — 6,199 — — — — — — 6,199
Cash dividends — — — (1,724) — — — — — — (1,724)
Purchase of treasury stock — — — — (29) — — — — — (29)
Disposal of treasury stock — — 76 — 27 — — — — — 103
Net changes in items other than shareholders’ equity
— — — — — 6,372 72 2,552 15 603 9,615
Balance as of March 31, 2015 251,365 ¥ 20,096 ¥ 18,118 ¥ 55,534 ¥ (1,454) ¥ 12,865 ¥ 127 ¥ 3,759 ¥ (40) ¥ 8,935 ¥ 117,942
Number of shares of common
stock (thousands)
Thousands of U.S. dollars (Note 4)
Shareholders’ equity Accumulated other comprehensive income
TotalCommon stock
Capital surplus
Retained earnings
Treasury stock
Unrealized gains (losses) on securities
Deferred gains (losses) on
hedges
Foreign currency
translation adjustments
Remeasurements of defined
benefit plans
Minority interests
Balance as of April 1, 2014 251,365 $ 167,229 $ 150,137 $ 435,541 $ (12,082) $ 54,023 $ 457 $ 10,044 $ (457) $ 69,335 $ 874,244
Cumulative effects of changes in accounting policies
— — — (10,651) — — — — — — (10,651)
Restated balance as of April 1, 2014
251,365 167,229 150,137 424,881 (12,082) 54,023 457 10,044 (457) 69,335 863,593
Net income for the year — — — 51,585 — — — — — — 51,585
Cash dividends — — — (14,346) — — — — — — (14,346)
Purchase of treasury stock — — — — (241) — — — — — (241)
Disposal of treasury stock — — 632 — 224 — — — — — 857
Net changes in items other than shareholders’ equity
— — — — — 53,024 599 21,236 124 5,017 80,011
Balance as of March 31, 2015 251,365 $ 167,229 $ 150,769 $ 462,128 $ (12,099) $ 107,056 $ 1,056 $ 31,280 $ (332) $ 74,352 $ 981,459
See the accompanying Notes to the Consolidated Financial Statements.
88
Consolidated Statements of Cash FlowsIwatani Corporation and its Consolidated SubsidiariesYears ended March 31, 2014 and 2015
See the accompanying Notes to the Consolidated Financial Statements.
Millions of yenThousands of
U.S. dollars (Note 4)
2014 2015 2015Cash flows from operating activities:
Income before income taxes and minority interests ¥ 18,302 ¥ 12,468 $ 103,753 Adjustments to reconcile income before income taxes and minority interests to net cash provided by operating activities:
Depreciation and amortization 17,722 18,018 149,937 Impairment loss on fixed assets 674 355 2,954 Gain on negative goodwill (172) (30) (249)Subsidy income (500) (872) (7,256)Loss on reduction of noncurrent assets 500 873 7,264 Increase (decrease) in allowance for doubtful accounts 158 (90) (748)Increase (decrease) in allowance for employees’ bonuses 184 (124) (1,031)Increase (decrease) in net defined benefit liability 639 49 407 Decrease (increase) in net defined benefit asset 2,851 634 5,275 Increase (decrease) in allowance for retirement benefits to directors and statutory auditors 76 (16) (133)Interest and dividends income (752) (806) (6,707)Interest expense 2,179 1,843 15,336 Foreign exchange (gains) losses 205 157 1,306 Equity in earnings of nonconsolidated subsidiaries and affiliates (769) (968) (8,055)Loss (gain) on sales and disposal of fixed assets 218 269 2,238 Loss (gain) on sales of investments in securities (222) (287) (2,388)Loss on valuation of investments in securities 7 21 174 Loss on liquidation of subsidiaries and affiliates 5 — —Loss (gain) on sales of investments in capital (12) — —Loss on valuation of investments in capital 120 — —Loss (gain) on step acquisitions 8 (38) (316)Loss on withdrawal from employees’ pension fund 322 — —
Changes in assets and liabilitiesDecrease (increase) in notes and accounts receivable—trade (9,632) 15,866 132,029 Decrease (increase) in inventories (3,587) 8,426 70,117 Increase (decrease) in notes and accounts payable—trade 2,199 (6,585) (54,797)
Other, net 1,480 4,253 35,391 Subtotal ¥ 32,207 ¥ 53,417 $ 444,511
Interest and dividends received 709 760 6,324 Dividends received from equity method subsidiaries and affiliates 190 184 1,531 Interest paid (2,164) (1,792) (14,912)Payments for withdrawal from employees’ pension fund (304) — —Income taxes paid (7,984) (9,561) (79,562)
Net cash provided by (used in) operating activities ¥ 22,653 ¥ 43,008 $ 357,892
Cash flows from investing activities:Payments for purchase of investments in securities (3,082) (1,241) (10,327)Proceeds from sales and redemption of investments in securities 1,576 1,393 11,591 Proceeds from sales of investments in capital 13 5 41 Payments for purchase of fixed assets (20,137) (20,146) (167,645)Proceeds from sales of fixed assets 1,112 570 4,743 Investments in loans receivable (2,498) (3,397) (28,268)Collection of loans receivable 2,593 2,801 23,308 Other, net (557) (463) (3,852)
Net cash provided by (used in) investing activities ¥ (20,978) ¥ (20,476) $ (170,391)
Cash flows from financing activities:Net increase (decrease) in short-term borrowings 8,627 (8,520) (70,899)Proceeds from long-term debt 30,566 15,543 129,341 Repayment of long-term debt (33,297) (26,358) (219,339)Cash dividends paid (1,721) (1,723) (14,338)Other, net (1,135) (1,276) (10,618)
Net cash provided by (used in) financing activities ¥ 3,039 ¥ (22,335) $ (185,861)
Effect of exchange rate changes on cash and cash equivalents 1,015 960 7,988 Net increase (decrease) in cash and cash equivalents 5,729 1,157 9,628 Cash and cash equivalents at beginning of year 14,026 20,440 170,092 Increase (decrease) in cash and cash equivalents due to changes in scope of consolidation 608 — —Increase (decrease) in cash and cash equivalents resulting from merger with nonconsolidated subsidiaries 76 206 1,714
Cash and cash equivalents at end of period ¥ 20,440 ¥ 21,804 $ 181,442

988
Notes to the Consolidated Financial StatementsIwatani Corporation and its Consolidated Subsidiaries
1. Basis of Presenting Consolidated Financial Statements
The accompanying consolidated financial statements of Iwatani Corporation (“the Company”) and its consolidated subsidiaries (together, “the Companies”) have been prepared in accordance with the provisions set forth in the Japanese Financial Instruments and Exchange Act and its related accounting regulations and in conformity with accounting principles generally accepted in Japan (“Japanese GAAP”), which are different in certain respects as to application and disclosure requirements from International Financial Reporting Standards. The accompanying consolidated financial statements have been restructured and translated into English, with some expanded descriptions, from the consolidated financial statements of the Company prepared in accordance with Japanese GAAP and filed with the appropriate Local Finance Bureau of the Ministry of Finance as required by the Financial Instruments and Exchange Act. Some supplementary information included in the statutory Japanese language consolidated financial statements, but not required for fair presentation, is not presented in the accompanying consolidated financial statements. As permitted, amounts of less than one million yen are omitted in the presentation for 2014 and 2015. As a result, the totals shown in the accompanying consolidated financial statements, both in yen and in U.S. dollars, do not necessarily agree with the sum of the individual amounts.
2. Summary of Major Accounting Policies(1) Scope of consolidationThe accompanying consolidated financial statements include the accounts of the Company and 108 of its subsidiaries for the year ended March 31, 2015. Certain subsidiaries have fiscal years ending on December 31. As a result, adjustments have been made for any significant intercompany transactions which took place during the period between the fiscal year-end of those subsidiaries and the fiscal year-end of the Company.
(2) Elimination and combinationFor the purposes of preparing the consolidated financial statements of the Companies, all significant intercompany transactions, account balances and unrealized profits among the Companies have been entirely eliminated. In the elimination, the differences between the cost of investments in subsidiaries and the amount of underlying equity in net assets of the subsidiaries is amortized using the straight-line method within 10 years.
(3) Equity method of accounting for investments in nonconsolidated subsidiaries and affiliates
As of March 31, 2015, the Company had 67 nonconsolidated subsidiaries and 90 affiliates (Companies over which the Company exercises significant influence over operating and financial policies). The equity method has been applied to the investments in 67 of the subsidiaries and 44 of the affiliates.
Since the investments in the remaining affiliates do not have a material effect on consolidated net income and retained earnings, the investments in these affiliates are carried at cost and are not accounted for by the equity method.
(4) Translation of foreign currenciesForeign currency transactions are translated at the applicable rate of exchange prevailing at the transaction date. Assets and liabilities denominated in foreign currencies at the balance sheet date are translated into Japanese yen at the applicable rate of exchange prevailing at that date. Exchange differences are charged or credited to income. Assets and liabilities of foreign consolidated subsidiaries and affiliates accounted for by the equity method are translated into Japanese yen at applicable year-end rates of exchange, and all income and expense accounts are translated at the average rate of exchange prevailing during the year. The resulting translation adjustments are accumulated and included in ”Foreign currency translation adjustments” classified as part of net assets.
(5) Cash and cash equivalentsCash and cash equivalents include all highly liquid investments, generally, with original maturities of three months or less that are readily convertible to known amounts of cash and are so near maturity that they present insignificant risk of change in value because of a change in interest rates.
(6) SecuritiesSecurities are classified into four categories: trading securities, held-to-maturity debt securities, equity securities of nonconsolidated subsidiaries and affiliates and other securities. As of March 31, 2014 and 2015, the Companies did not hold any trading securities. Held-to-maturity debt securities are stated at amortized cost. Equity securities of nonconsolidated subsidiaries and affiliates are accounted for, with minor exceptions due to materiality, using the equity method of accounting. Other securities whose fair market values are readily determinable are carried at fair value with unrealized gains and losses included as a component of net assets, net of related taxes. Other securities for which it is not practicable to estimate fair value are stated at cost. In cases in which a significant decline in the value of net assets is assessed to be other than temporary, the cost of other securities is written-down by the impaired amount and charged to income. Realized gains and losses are determined by the moving average cost method and are reflected in the consolidated statement of income.
(7) Allowance for doubtful accountsAn allowance for doubtful accounts is provided in an amount based on past experience with bad debts generally and an evaluation of the collectibility of specific receivables with the possibility of default.
(8) InventoriesInventories are stated mainly at the lower of first-in, first-out

10
cost or net realizable value.
(9) Property, plant and equipment and depreciationFixed assets, including significant renewals and additions, are carried at cost. When these assets are retired or otherwise disposed of, the cost and related depreciation are cleared from the respective accounts, and the net difference less any amount realized on disposal is reflected in earnings. Principal estimated useful lives are as follows: Buildings and structures ...............................3 to 50 years Machinery, vehicles, equipment and tools ...2 to 20 years Depreciation is calculated by the declining balance method over the useful life of the asset, except that the straight-line method is applied to the Sakai LPG Plant, hydrogen stations, certain fixed assets for lease, certain gas generators and buildings purchased since April 1, 1998. Lease assets are depreciated using the straight-line method over the lease term as the useful life, with zero residual value. However, finance lease transactions that do not transfer ownership of the lease assets and commenced prior to April 1, 2008 or have total lease payments of not more than ¥3 million ($24 thousand) under a single lease contract are accounted for as operating leases. Maintenance and repairs, including minor renewals and improvements are charged to income as incurred.
(10) Intangible assetsComputer software for internal use is amortized by the straight-line method over the estimated useful life of 5 years. Other intangible assets are amortized by the straight-line method over the estimated useful life of the respective asset.
(11) Income taxesThe asset-liability approach is used to recognize deferred tax assets and liabilities for the expected future tax consequences of temporary differences between the carrying amounts of assets and liabilities for financial reporting purposes and the amounts used for income tax purposes. Deferred income taxes are measured by applying currently enacted tax laws. The effect on deferred tax assets and liabilities of a change in tax rates is recognized in income in the period that the change is enacted. Valuation allowances are recorded to reduce deferred tax assets when it is more likely than not that a tax benefit will not be realized.
(12) Accrued bonusesAccrued bonuses are calculated and provided for based on the estimated amounts of future payments attributable to the services that have been rendered by employees as of the date of the balance sheet.
(13) Retirement benefits( i ) Employees’ severance and retirement benefitsTo provide for retirement benefit payments to employees, net defined benefit asset and liability are recorded at the amounts deemed to be incurred at the fiscal year-end, based on the amount of projected benefit obligations and the fair value of
plan assets at the fiscal year-end. The retirement benefit obligations are attributed to periods on a benefit formula basis. Prior service cost is amortized by the straight-line method over a period of 12 to 14 years, which is within the average remaining years of service of employees. Actuarial differences are amortized by the straight-line method over a period of 12 to 14 years, which is within the average remaining years of service of employees, commencing with the following period. Unrecognized actuarial differences and unrecognized prior service cost are accrued as remeasurements of defined benefit plans, net of tax, in accumulated other comprehensive income in net assets.
( ii ) Retirement benefits for directors and statutory auditorsTo provide for the payment of lump-sum retirement benefits to directors and statutory auditors, certain consolidated subsidiaries provide an allowance for retirement benefits to directors and statutory auditors at an amount that would be required by their internal regulations if all directors and statutory auditors retired on the balance sheet date.
(14) Goodwill and negative goodwillGoodwill and negative goodwill generated on or before March 31, 2010 are amortized on a straight-line basis over a period not to exceed ten years.
(15) Derivative financial instrumentsDerivative financial instruments are used by the Companies principally to reduce interest rate and foreign exchange rate risks. The Companies have established a control environment which includes policies and procedures for risk assessment and for the approval, reporting and monitoring of transactions involving derivative financial instruments. The Companies do not hold or issue derivative financial instruments for trading purposes. The Companies are exposed to certain market risks arising from fluctuations in exchange rates and interest rates and manage this risk by entering into forward exchange contracts and swap agreements. The Companies are also exposed to the risk of credit loss in the event of non-performance by the counterparties. However, the Companies do not anticipate non-performance by any of these counterparties, all of whom are financial institutions with high credit ratings. Derivative financial instruments are measured at fair value. Hedging transactions which meet the criteria for hedge accounting are accounted for using deferral hedge accounting, which requires the unrealized gain or loss to be deferred as a liability or asset until the loss or gain on the related hedged item is recognized. In addition, certain forward exchange contracts and certain interest rate swap transactions are accounted for using the allocation method and the special method. The allocation method requires that recognized foreign currency receivables and payables covered by forward exchange contracts be translated at contract rates. Under the special method, interest rate swap transactions are accounted for as if the interest rates under those transactions were originally applied to the underlying borrowings and bonds.

1110
(16) Expenses for Research and DevelopmentExpenses for research and development are charged to income when incurred.
(17) ReclassificationsCertain reclassifications of the financial statements for the year ended March 31, 2014 have been made to conform to the presentation for the year ended March 31, 2015.
3. Changes in Accounting PoliciesAdoption of accounting standard for retirement benefitsThe Company and its consolidated domestic subsidiaries adopted Article 35 of the “Accounting Standard for Retirement Benefits” (ASBJ Statement No. 26, May 17, 2012 (hereinafter, “Statement No. 26”)) and Article 67 of the “Guidance on Accounting Standard for Retirement Benefits” (ASBJ Guidance No. 25, March 26, 2012 (hereinafter, “Guidance No. 25”)) from the year ended March 31, 2015 and have changed the determination of retirement benefit obligations and current service cost. In addition, the Company and its consolidated domestic subsidiaries have changed the method of attributing expected benefit to periods from a straight-line basis to a benefit formula basis along with changing the method of determining discount rate to a method that uses a single weighted average discount rate reflecting the estimated timing and amount of benefit payment, rather than a discount rate based on the term of the relevant bonds approximate to the expected average remaining service years of employees. In accordance with Article 37 of Statement No. 26, the effect of changing the determination of retirement benefit obligations and current service costs has been recognized in retained earnings at the beginning of the year ended March 31, 2015. As a result of the application, net defined benefit asset decreased by ¥1,553 million, net defined benefit liability increased by ¥434 million and retained earnings decreased by ¥1,280 million at the beginning of the year ended March 31, 2015. There was immaterial impact on operating income, ordinary income and income before income taxes and minority interests for the year ended March 31, 2015, respectively.
Unapplied accounting standards– “Revised Accounting Standard for Business Combination”
(ASBJ Statement No. 21, September 13, 2013)– “Revised Accounting Standard for Consolidated Financial
Statements” (ASBJ Statement No. 22, September 13, 2013)
– “Revised Accounting Standard for Business Divestitures” (ASBJ Statement No. 7, September 13, 2013)
– “Revised Accounting Standard for Earnings Per Share” (ASBJ Statement No. 2, September 13, 2013)
– “Revised Guidance on Accounting Standard for Business Combinations and Accounting Standard for Business Divestitures” (ASBJ Guidance No. 10, September 13, 2013)
– “Revised Guidance on Accounting Standard for Earnings Per Share” (ASBJ Guidance No. 4, September 13, 2013)
(1) SummaryThe above standards and guidance have been revised primarily to account for:q How changes in the holding of shares in subsidiaries over
which the Company continues to control should be treated by the Company when additional stock of a subsidiary is acquired.
w Treatment of acquisition related costse Presentation of current net income and the change in
shareholder’s equity from minority interests to non-controlling interests
r Provisional application of accounting treatments
(2) Effective datesEffective from the beginning of the year ended March 31, 2016. Provisional application of the accounting standards is scheduled to begin for business combinations effective after the beginning of the year ended March 31, 2016.
(3) Effects of application of the standardsThe Company is currently in the process of determining the effects of these new standards on the consolidated financial statements.
4. U.S. Dollar AmountsThe translation of the Japanese yen amounts into U.S. dollar amounts is included solely for the convenience of readers outside Japan, using the prevailing exchange rate as of March 31, 2015, which was ¥120.17 to U.S. $1.00. The translations should not be construed as representations that the Japanese yen amounts have been, could have been or could in the future be converted into U.S. dollars at this or any other rate of exchange.

12
Tables show ¥ in millions and US$ in thousands.
5. Accounting Standards for Presentation of Comprehensive IncomeAmounts reclassified to net income (loss) in the current period that were recognized in other comprehensive income in the current or previous periods and the tax effects for each component of other comprehensive income were as follows:
2014 2015 2015Unrealized gains (losses) on securitiesIncrease (decrease) during the year ¥ 4,201 ¥ 8,929 $ 74,303 Reclassification adjustments (95) (88) (732)Subtotal, before tax 4,105 8,841 73,570 Tax (expense) or benefit (1,862) (2,520) (20,970)Subtotal, net of tax 2,243 6,320 52,592
Deferred gains (losses) on hedgesIncrease (decrease) during the year (138) 79 657 Subtotal, before tax (138) 79 657 Tax (expense) or benefit 46 (14) (116)Subtotal, net of tax (92) 64 532
Foreign currency translation adjustmentsIncrease (decrease) during the year 2,776 2,470 20,554 Reclassification adjustments 8 — —Subtotal, before tax 2,784 2,470 20,554 Subtotal, net of tax 2,784 2,470 20,554
Remeasurements of defined benefit plans, net of taxIncrease (decrease) during the year — (106) (882)Reclassification adjustments — 108 898 Subtotal, before tax — 2 16 Tax (expense) or benefit — (5) (41)Subtotal, net of tax — (3) (24)
Share of other comprehensive income of associates accounted for using equity methodIncrease (decrease) during the year 323 328 2,729 Subtotal, net of tax 323 328 2,729
Total other comprehensive income ¥ 5,259 ¥ 9,181 $ 76,400
6. Supplemental Information on the Consolidated Statements of Cash FlowsSignificant non-cash transactions for the years ended March 31, 2014, and 2015 were as follows:
2014 2015 2015
Increase in investment securities due to the dissolution of the employees’ retirement benefit trust ¥ 1,720 ¥ — $ —
7. Financial InstrumentsInformation on Financial instruments as of March 31, 2014 and 2015 was as follows:
1. Status of financial instruments(1) Policies for financial instrumentsThe Group primarily obtains funds through borrowing from banks and the issuance of corporate bonds for funding of its capital expenditures plan. After adequate liquidity has been ensured, the Companies invest temporary excess funds in deposits with low risk. Additionally, the Companies obtain
short-term funds through bank borrowing, etc. The Companies utilize derivative transactions only for hedging purposes and not for speculative or dealing purposes.
(2) Description and risks of financial instrumentsNotes and accounts receivable are exposed to customer credit risk. Additionally, some notes and accounts receivable are denominated in foreign currencies and are exposed to exchange rate fluctuation risk. If necessary, the Companies utilize foreign exchange forward contracts to reduce foreign currency risk.

1312
Investments in securities are composed primarily of held-to-maturity debt securities and stocks in companies with which the Companies have business alliances and are exposed to credit risk in relation to issuers and market price fluctuation risk. Notes and accounts payable such as accounts payable—trade are generally payable within six months. Some notes and accounts payable are denominated in foreign currencies. If necessary, the Companies utilize foreign exchange forward contracts to reduce foreign currency risk. Borrowings and bonds are mainly for capital expenditures. The longest redemption period is fourteen years after the fiscal year closing date. Because some of these instruments have a variable interest rate, they are exposed to interest rate fluctuation risk. Therefore, the Companies utilize derivative transactions and interest rate swap contracts to hedge this risk. Derivative transactions consist of the use of foreign exchange forward contracts for the purpose of hedging exchange rate fluctuation risk related to notes and accounts receivable and notes and accounts payable and interest rate swap contracts for the purpose of hedging interest rate fluctuation risk related to borrowings. Hedging instruments and hedged items, hedging policy, assessment of hedge effectiveness and hedge accounting are discussed in Note 2(15), “Summary of Major Accounting Policies–Derivative financial instruments.”
(3) Risk management of financial instruments(i) Management of credit risk(Risk of default by customers and counterparties)In accordance with the internal policies of the Companies for managing credit risk arising from receivables and long-term loan receivables, each related sales management section monitors the credit worthiness of their main customers and counterparties on a regular basis and monitors due dates and outstanding balances by individual customer. In addition, the Companies are making efforts to quickly identify and mitigate risks of bad debts of customers who are having financial difficulties. In investments in securities, the Companies monitor the financial condition, etc., of the issuing companies on a regular basis. The Companies believe that the credit risk of the derivatives themselves is insignificant as they enter into derivatives only with financial institutions which have a high credit rating.
(ii) Management of market risk (risk arising from fluctuations in foreign exchange rates, interest rates and others)
The Companies utilize foreign exchange forward contracts within the requirements of their business activities in respect to
part of their trade receivables and trade liabilities denominated in foreign currencies to mitigate exchange rate fluctuation risk and use interest rate swap contracts in respect to part of their borrowings to mitigate interest rate fluctuation risk. In investments in securities, the Companies review the fair value of these securities and the financial condition of the issuing companies on a quarterly basis. For investments in securities, except held-to-maturity debt securities, the Companies monitor the market price and financial condition of the issuers and regularly evaluate the investment in each company, taking into account the relationship with the counterparty. The accounting department enters into and manages derivative transactions within the requirements of the Companies’ business activities and regulations established by the internal policies of the Companies. Based on policies approved by the Board of Directors, the issuance of bonds and the borrowing of large amounts, etc., are decided only by the Board of Directors. Therefore, foreign exchange forward contracts and interest rate swap contracts in respect to the aforementioned transactions are decided by the Board of Directors at the same time.
(iii) Management of liquidity risk (risk that the Companies may not be able to meet their obligations on scheduled due dates)
The Companies prepare cash flow projections and monitor funding requirements in the accounting department based on reports from each section and maintain fund liquidity.
(4) Supplementary explanation of fair value of financial instruments
The fair value of financial instruments is based on market price, but in cases in which the market price is not available, the fair value is reasonably estimated. As variable factors are incorporated in the estimation of values, values may vary depending on the assumptions used. The contract amount related to derivative transactions under “Note 16, Derivative Transactions,” does not express the market risk related to the derivative transactions themselves.
2. Fair values of financial instrumentsFor financial instruments, amounts recorded on the consolidated balance sheet, the fair values as of March 31, 2014 and 2015 and the difference between the two are set forth in the table below. It should be noted that financial instruments for which it was considered extremely difficult to assess the fair value were not included in the table.

14
Tables show ¥ in millions and US$ in thousands.
2014Amounts on consolidated balance sheet
Fair value Difference
(1) Cash and deposits ¥ 20,995 ¥ 20,995 ¥ —(2) Notes and accounts receivable—trade 121,074 121,074 —(3) Investments in securities
Held-to-maturity debt securities 1,000 1,000 0 Other securities 29,631 29,631 —Subsidiaries and affiliates 4,271 3,798 (473)
Total assets 176,974 176,501 (472)(1) Notes and accounts payable—trade 103,401 103,401 —(2) Short-term borrowings 45,902 45,902 —(3) Bonds 8,000 8,000 0 (4) Long-term borrowings 103,429 103,774 344
Total liabilities 260,733 261,078 344 Derivative transactions*
Transactions to which hedge accounting is not applied (11) (11) —Transactions to which hedge accounting is applied 100 69 (31)
Total derivative transactions ¥ 89 ¥ 58 ¥ (31)
2015Amounts on consolidated balance sheet
Fair value Difference
(1) Cash and deposits ¥ 22,237 ¥ 22,237 ¥ —(2) Notes and accounts receivable—trade 106,792 106,792 —(3) Investments in securities
Other securities 38,463 38,463 —Subsidiaries and affiliates 4,501 3,813 (687)
Total assets 171,994 171,306 (687)(1) Notes and accounts payable—trade 97,987 97,987 —(2) Short-term borrowings 37,654 37,654 —(3) Bonds 8,000 8,075 75 (4) Long-term borrowings 92,603 92,926 323
Total liabilities 236,245 236,644 398 Derivative transactions*
Transactions to which hedge accounting is not applied (20) (20) —Transactions to which hedge accounting is applied 180 169 (10)
Total derivative transactions ¥ 160 ¥ 149 ¥ (10)
2015Amounts on consolidated balance sheet
Fair value Difference
(1) Cash and deposits $ 185,046 $ 185,046 $ —(2) Notes and accounts receivable—trade 888,674 888,674 —(3) Investments in securities
Other securities 320,071 320,071 —Subsidiaries and affiliates 37,455 31,730 (5,716)
Total assets 1,431,255 1,425,530 (5,716)(1) Notes and accounts payable—trade 815,403 815,403 —(2) Short-term borrowings 313,339 313,339 —(3) Bonds 66,572 67,196 624 (4) Long-term borrowings 770,599 773,287 2,687
Total liabilities 1,965,923 1,969,243 3,311 Derivative transactions*
Transactions to which hedge accounting is not applied (166) (166) —Transactions to which hedge accounting is applied 1,497 1,406 (83)
Total derivative transactions $ 1,331 $ 1,239 $ (83)*The amounts for derivative transactions shown above are net of assets and liabilities. When the net amount results in a liability, it is shown in parentheses.

1514
Tables show ¥ in millions and US$ in thousands.
Liabilities(1) Notes and accounts payable—trade
(2) Short-term borrowingsThe book value is used as the fair value for these items as the fair value approximates book value due to the short maturity of these instruments.
(3) Bonds
(4) Long-term borrowingsThe fair value of bonds and long-term borrowings is based on present value calculated by discounting the sum of future principal and interest payments at rates that would be applied to similar borrowings at the present time.
(Note 1) The calculation method used to determine fair value of financial instruments and matters related to securities and derivative transactions
Assets(1) Cash and deposits
(2) Notes and accounts receivable—tradeThe book value is used as the fair value for these items as fair value approximates book value due to the short maturity of these instruments.
(3) Investments in securitiesThe fair value of equity securities is based on market price on securities exchanges. The fair value of bonds is based on present discounted value.Refer to Note 8, “Investments in Securities,” for notes on securities categorized by holding purposes.
(Note 2) Financial instruments with no fair value as of March 31, 2014 and 2015 were as follows:
2014 2015 2015Unlisted securities ¥ 1,616 ¥ 1,615 $ 13,439Investments in subsidiaries and affiliates 11,648 12,986 108,063Investments in capital of subsidiaries and affiliates 1,802 1,918 15,960
(Note 3) The maturity profile of the anticipated future contractual cash flows in relation to the Companies’ financial assets as of March 31, 2014 and 2015 was as follows:
2014
Due within 1 year
Due over 1 yearbut within
5 years
Due over 5 yearsbut within10 years
Due over 10 years
Cash and deposits ¥ 20,995 ¥ — ¥ — ¥ —Notes and accounts receivable—trade 121,074 — — —Investments in securities
Held-to-maturity debt securities (corporate bonds) — — 1,000 —Total ¥ 142,070 ¥ — ¥ 1,000 ¥ —
2015
Due within 1 year
Due over 1 yearbut within
5 years
Due over 5 yearsbut within10 years
Due over 10 years
Cash and deposits ¥ 22,237 ¥ — ¥ — ¥ —Notes and accounts receivable—trade 106,792 — — —
Total ¥ 129,029 ¥ — ¥ — ¥ —
2015
Due within 1 year
Due over 1 yearbut within
5 years
Due over 5 yearsbut within10 years
Due over 10 years
Cash and deposits $ 185,046 $ — $ — $ —Notes and accounts receivable—trade 888,674 — — —
Total $ 1,073,720 $ — $ — $ —

16
Tables show ¥ in millions and US$ in thousands.
(Note 4) The aggregate annual maturities of bonds and long-term borrowings as of March 31, 2014 and 2015 were as follows:
2014
Due within 1 year
Due over 1 yearbut within
2 years
Due over 2 yearsbut within
3 years
Due over 3 yearsbut within
4 years
Due over 4 yearsbut within
5 years
Due over 5 years
Short-term borrowings ¥ 45,902 ¥ — ¥ — ¥ — ¥ — ¥ —Bonds — — — — 3,000 5,000Long-term borrowings 24,151 24,421 21,165 20,192 10,272 3,225
Total ¥ 70,053 ¥ 24,421 ¥ 21,165 ¥ 20,192 ¥ 13,272 ¥ 8,225
2015
Due within 1 year
Due over 1 yearbut within
2 years
Due over 2 yearsbut within
3 years
Due over 3 yearsbut within
4 years
Due over 4 yearsbut within
5 years
Due over 5 years
Short-term borrowings ¥ 37,654 ¥ — ¥ — ¥ — ¥ — ¥ —Bonds — — — 3,000 — 5,000Long-term borrowings 24,704 22,572 21,575 12,114 9,541 2,096
Total ¥ 62,358 ¥ 22,572 ¥ 21,575 ¥ 15,114 ¥ 9,541 ¥ 7,096
2015
Due within 1 year
Due over 1 yearbut within
2 years
Due over 2 yearsbut within
3 years
Due over 3 yearsbut within
4 years
Due over 4 yearsbut within
5 years
Due over 5 years
Short-term borrowings $ 313,339 $ — $ — $ — $ — $ —Bonds — — — 24,964 — 41,607Long-term borrowings 205,575 187,833 179,537 100,807 79,395 17,441
Total $ 518,914 $ 187,833 $ 179,537 $ 125,771 $ 79,395 $ 59,049
8. Investments in SecuritiesInvestments in held-to-maturity debt securities with fair value as of March 31, 2014 consisted of the following:
2014
Book value Fair value Unrealizedgains (losses)
Securities with fair value exceeding book valueCorporate bonds ¥ 1,000 ¥ 1,000 ¥ 0
Total ¥ 1,000 ¥ 1,000 ¥ 0
Investments in other securities with fair value as of March 31, 2014 and 2015 consisted of the following:
2014
Book value Acquisitioncost
Unrealizedgains (losses)
Securities with book value exceeding acquisition costSecurities ¥ 28,606 ¥ 18,050 ¥ 10,555
Securities with book value not exceeding acquisition costSecurities 1,025 1,181 (156)
Total ¥ 29,631 ¥ 19,232 ¥ 10,399
2015
Book value Acquisitioncost
Unrealizedgains (losses) Book value Acquisition
costUnrealized
gains (losses)
Securities with book value exceeding acquisition costSecurities ¥ 37,894 ¥ 18,567 ¥ 19,326 $ 315,336 $ 154,506 $ 160,822
Securities with book value not exceeding acquisition costSecurities 569 657 (87) 4,734 5,467 (723)
Total ¥ 38,463 ¥ 19,225 ¥ 19,238 $ 320,071 $ 159,981 $ 160,089

1716
Tables show ¥ in millions and US$ in thousands.
Total sale of held-to-maturity debt securities as of March 31, 2014 and 2015 consisted of the following:2014 2015 2015
Book value sold — ¥ 1,000 $ 8,321Amount sold — 1,000 8,321Total gain or loss on sale — — —
Total sale of other securities as of March 31, 2014 and 2015 consisted of the following:2014 2015 2015
Amount sold ¥ 1,564 ¥ 393 $ 3,270Total gain on sales 261 288 2,396Total loss on sales ¥ 34 ¥ 1 $ 8
The impairment loss on investments in securities was ¥7 million and ¥21 million ($174 thousand) for the years ended March 31, 2014 and 2015, respectively.
9. InventoriesInventories as of March 31, 2014 and 2015 were as follows:
2014 2015 2015Merchandise and finished goods ¥ 39,204 ¥ 29,478 $ 245,302Work-in-process 2,614 3,424 28,492Raw materials and supplies 3,520 4,689 39,019
Total ¥ 45,339 ¥ 37,592 $ 312,823
10. Short-term Borrowings and Long-term DebtThe weighted average interest rate of short-term bank borrowings outstanding as of March 31, 2014 and 2015 was 0.9% and 0.9%, respectively.
Short-term borrowings as of March 31, 2014 and 2015 consisted of the following:2014 2015 2015
Secured ¥ 2,740 ¥ 1,246 $ 10,368Unsecured 43,161 36,408 302,970
Total ¥ 45,902 ¥ 37,654 $ 313,339
Long-term debt as of March 31, 2014 and 2015 consisted of the following:2014 2015 2015
Loans, principally from banks and maturing serially through 2028 with interest ranging from 0.2% to 7.3%
Secured ¥ 5,576 ¥ 5,327 $ 44,328Unsecured 97,853 87,276 726,271Unsecured bonds0.590% bonds, due September 2018 3,000 3,000 24,9640.690% bonds, due September 2021 5,000 5,000 41,607Subtotal 111,429 100,603 837,172Current portion of long-term debt (24,151) (24,704) (205,575)
Total ¥ 87,278 ¥ 75,899 $ 631,596

18
As of March 31, 2014 and 2015, the following assets were pledged as security for short-term borrowings and long-term debt:
Net book value 2014 2015 2015Land ¥ 6,355 ¥ 6,091 $ 50,686Buildings and structures 3,648 3,381 28,135Machinery, vehicles, equipment and tools 1,533 1,281 10,659Investments in securities 589 679 5,650
Total ¥ 12,127 ¥ 11,434 $ 95,148
The aggregate annual maturities of long-term debt as of March 31, 2015 were as follows:Year ended March 31,
2017 ¥ 22,572 $ 187,8332018 21,575 179,5372019 12,114 100,8072020 9,541 79,3952021 and thereafter 2,096 17,441
Total ¥ 67,899 $ 565,024
The Company entered into commitment line contracts with three banks for the efficient management of financial liabilities. The maximum aggregate credit facility available to the Company as of March 31, 2014 and 2015 was ¥10,000 million and ¥10,000 million ($83,215 thousand), respectively. The credit facility has not been used as of March 31, 2014 and 2015.
11. Deferred TaxesThe Company and its domestic subsidiaries are subject to a number of taxes based on earnings which, in the aggregate, resulted in a statutory rate of approximately 38.0% and 35.6% for the years ended March 31, 2014 and 2015, respectively. Overseas subsidiaries are subject to income taxes of the countries in which they operate.
Deferred taxes consisted of the following:2014 2015 2015
Deferred tax assetsTax loss carryforwards ¥ 985 ¥ 1,748 $ 14,546Allowance for doubtful accounts 305 268 2,230Accrued bonuses 1,592 1,434 11,933Net defined benefit liability 1,415 1,359 11,308Accrued enterprise taxes 510 251 2,088
Intercompany profits and write-downs (inventories, investments in securities and fixed assets) 1,294 1,477 12,290
Loss on valuation of securities 343 327 2,721Loss on cancellation of real estate trust 383 347 2,887Impairment loss 860 779 6,482Other 4,849 3,993 33,227Valuation allowance (2,656) (2,340) (19,472)
Total deferred tax assets ¥ 9,885 ¥ 9,645 $ 80,261
Deferred tax liabilitiesReserve for advanced depreciation of noncurrent assets (301) (262) (2,180)Unrealized gains on securities (3,558) (6,076) (50,561)Valuation of assets and liabilities of consolidated subsidiaries on acquisition (1,076) (973) (8,096)Deferred gains on hedges (44) (67) (557)Other (2,016) (1,263) (10,510)
Total deferred tax liabilities (6,996) (8,643) (71,923)Net deferred tax assets ¥ 2,888 ¥ 1,001 $ 8,329
Tables show ¥ in millions and US$ in thousands.

1918
Tables show ¥ in millions and US$ in thousands.
Reconciliation of the differences between the statutory tax rate and the effective tax rate was as follows:2014 2015
Statutory tax rate — 35.6%Permanently nondeductible expenses — 5.2Permanently nontaxable gain — (0.7)Change in valuation allowance — (0.6)Taxation on per capital basis — 1.6Equity in earnings of nonconsolidated subsidiaries and affiliates — (2.8)Retained earnings of foreign consolidated subsidiaries — 1.3Adjustment of deferred tax assets due to changes in tax rate — 2.7Other — 2.3Effective tax rate — 44.5%Note: Information for the year ended March 31, 2014 is not provided because the difference between the statutory tax rate and the effective tax rate was less than 5%.
Adjustment of deferred tax assets and liabilities for enacted changes in tax laws and ratesOn March 31, 2015, amendments to the Japanese tax regulations were enacted into law. Based on the amendments, the statutory income tax rates utilized for the measurement of deferred tax assets and liabilities expected to be settled or realized from April 1, 2015 to March 31, 2016 and on or after April 1, 2016 are changed from 35.6% for the year ended March 31, 2015 to 33.0% and 32.2%, respectively, as of March
31, 2015. Due to these changes in statutory income tax rates, net deferred tax liabilities (after deducting the deferred tax assets) decreased by ¥270 million as of March 31, 2015, deferred income tax expense recognized for the year ended March 31, 2015 increased by ¥333 million, unrealized gains on securities increased by ¥604 million, deferred gains on hedges increased by ¥4 million and remeasurements of defined benefit plans decreased by ¥4 million.
12. Employees’ Severance and Retirement BenefitsThe Company and some domestic consolidated subsidiaries have contributory funded defined benefit pension plans and lump-sum benefit plans, and some domestic consolidated subsidiaries have defined contribution plans.
1. Defined benefit plans(1) Movement in retirement benefit obligations
2014 2015 2015Balance as of April 1, ¥ 17,927 ¥ 18,308 $ 152,350
Cumulative effects of changes in accounting policies — 1,987 16,534Restated balance as of April 1, 17,927 20,296 168,894
Service cost 1,240 1,674 13,930Interest cost 279 190 1,581Actuarial loss (gain) (247) 175 1,456Benefits paid (1,012) (1,331) (11,075)Other 120 (76) (632)
Balance as of March 31, ¥ 18,308 ¥ 20,929 $ 174,161
(2) Movements in plan assets2014 2015 2015
Balance as of April 1, ¥ 20,294 ¥ 17,501 $ 145,635Expected return on plan assets 177 214 1,780Actuarial loss (gain) 1,282 94 782Contributions paid by the employer 1,921 377 3,137Benefits paid (579) (741) (6,166)Return of portion of plan assets (5,720) — —Other 124 98 815
Balance as of March 31, ¥ 17,501 ¥ 17,543 $ 145,984

20
(3) Reconciliation from retirement benefit obligations and plan assets to liability (asset) for retirement benefits2014 2015 2015
Funded retirement benefit obligations ¥ 14,242 ¥ 16,561 $ 137,813Plan assets (17,501) (17,543) (145,984)
(3,259) (982) (8,171)Unfunded retirement benefit obligations 4,066 4,367 36,340Total net defined benefit liability (asset) as of March 31, ¥ 807 ¥ 3,385 $ 28,168
Net defined benefit liability ¥ 5,243 ¥ 5,732 $ 47,699Net defined benefit asset (4,436) (2,346) (19,522)Total net defined benefit liability (asset) as of March 31, ¥ 807 ¥ 3,385 $ 28,168
(4) Retirement benefit costs2014 2015 2015
Service cost ¥ 1,240 ¥ 1,674 $ 13,930Interest cost 279 190 1,581Expected return on plan assets (177) (214) (1,780)Amortization of transition obligation 929 — —Amortization of actuarial differences (492) (15) (124)Amortization of prior service cost 124 124 1,031Other (43) (68) (565)Total retirement benefit costs for the year ended March 31, ¥ 1,860 ¥ 1,691 $ 14,071
(5) Remeasurements of defined benefit plans2014 2015 2015
Prior service cost ¥ — ¥ 98 $ 815Actuarial differences — (96) (798)Total balance as of March 31, ¥ — ¥ 2 $ 16
(6) Accumulated remeasurements of defined benefit plans2014 2015 2015
Unrecognized prior service cost ¥ 773 ¥ 674 $ 5,608Unrecognized actuarial differences (627) (530) (4,410)Total balance as of March 31, ¥ 145 ¥ 143 $ 1,189
(7) Plan assets( i ) Plan assets comprise
2014 2015Bonds 28.3% 41.1%Equity securities 22.1% 20.5%Cash and cash equivalents 30.5% 18.1%General account 19.0% 20.1%Other 0.1% 0.2%Total 100.0% 100.0%
( ii ) Long-term expected rate of returnCurrent and target asset allocations, historical and expected returns on various categories of plan assets have been considered in determining the long-term expected rate of return.
(8) Actuarial assumptionsThe principal actuarial assumptions are set forth below:
2014 2015Discount rate 2.0% 1.0%Expected return on plan assets 0.0–2.2% 0.0–2.2%Expected rate of salary increase 4.7–7.9% 4.7–7.9%
Tables show ¥ in millions and US$ in thousands.

2120
expended ¥155 million ($1,289 thousand) and ¥189 million ($1,572 thousand) on contributions for the multi-employer pension plans for the year ended March 31, 2014 and 2015, respectively. In addition, the amount of contribution for withdrawal from the employees’ pension fund was ¥322 million ($2,679 thousand) and was recorded in other expenses for the year ended March 31, 2014.
13. Contingent LiabilitiesContingent liabilities as of March 31, 2014 and 2015 were as follows:
2014 2015 2015Notes receivable endorsed ¥ 41 ¥ 14 $ 116
Recourse obligation for notes receivable sold 886 764 6,357
2014 2015 2015Guarantees of loans made by:
Nonconsolidated subsidiaries and affiliates ¥ 585 ¥ 670 $ 5,575
Other 5 5 41Total ¥ 591 ¥ 675 $ 5,617
2. Defined contribution plansSome domestic consolidated subsidiaries expended ¥248 million ($2,063 thousand) and ¥269 million ($2,238 thousand) on contributions for defined contribution plans for the year ended March 31, 2014 and 2015, respectively.
3. Multi-employer pension plansThe funded status of the multi-employer pension plans as of March 31, 2013 and 2014 (based on information available as of March 31, 2014 and 2015) to which contributions were recorded as net periodic retirement benefit costs was as follows:
2014 2015 2015Fair value of plan assets ¥ 706,711 ¥ 800,473 $ 6,661,171
Total of actuarial liabilities and minimum reserves in the calculation of pension financing
756,040 830,612 6,911,974
Difference ¥ (49,329) ¥ (30,138) $ (250,794)
The contribution ratio of the Companies to the multi-employer pension plans from April 1, 2012 to March 31, 2013 and from April 1, 2013 to March 31, 2014 was 4.0% and 4.1% respectively. Some domestic consolidated subsidiaries
Tables show ¥ in millions and US$ in thousands.
14. LeasesAs LesseeAs of March 31, 2014 and 2015, lease payments for finance lease transactions that did not transfer ownership of the lease assets and commenced prior to April 1, 2008 were as follows:
2014 2015 2015Lease payments ¥ 459 ¥ 279 $ 2,321
The amounts of outstanding future minimum lease payments due as of March 31, 2014 and 2015, including the portion of interest thereon, were as follows:
2014 2015 2015Future minimum lease payments
Due within one year ¥ 279 ¥ 255 $ 2,121Due over one year 593 338 2,812
Total ¥ 873 ¥ 593 $ 4,934
Assumed acquisition cost, accumulated depreciation, net book value and depreciation of lease assets as of March 31, 2014 and 2015, including the portion of interest thereon, were as follows:
2014 2015 2015Acquisition cost ¥ 5,738 ¥ 3,027 $ 25,189
Buildings and structures 68 60 499Machinery, vehicles, equipment and tools 5,669 2,966 24,681
Accumulated depreciation 4,865 2,433 20,246Buildings and structures 47 41 341Machinery, vehicles, equipment and tools 4,817 2,391 19,896
Net book value 873 593 4,934Buildings and structures 21 19 158Machinery, vehicles, equipment and tools 851 574 4,776
Depreciation 459 279 2,321

22
Tables show ¥ in millions and US$ in thousands.
Depreciation is computed by the straight-line method over the lease term as the useful life with the assumption of no residual value.
Future minimum lease payments under non-cancelable operating leases as of March 31, 2014 and 2015 were as follows:
2014 2015 2015Future minimum lease payments
Due within one year ¥ 1,953 ¥ 1,791 $ 14,903Due over one year 7,646 6,344 52,791
Total ¥ 9,600 ¥ 8,136 $ 67,704
As LessorLease investment assets as of March 31, 2014 and 2015 were as follows:
2014 2015 2015Amount of lease payments receivable ¥ 999 ¥ 1,029 $ 8,562Estimated residual value — 6 49Amount equivalent to interest receivable (63) (94) (782)
Lease investment assets ¥ 935 ¥ 941 $ 7,830
The collection schedule for lease payments from lease investment assets after March 31, 2015 was as follows:Year ended March 31,
2016 ¥ 328 $ 2,7292017 243 2,0222018 188 1,5642019 134 1,1152020 78 6492021 and thereafter 55 457
Total ¥ 1,029 $ 8,562
Future minimum lease receipts from non-cancelable operating lease transactions as of March 31, 2014 and 2015 were as follows:
2014 2015 2015Due within one year ¥ 95 ¥ 103 $ 857Due over one year 186 177 1,472
Total ¥ 281 ¥ 281 $ 2,338
15. Impairment Loss on Fixed AssetsThe Companies reduced the book value of a portion of idle assets and fixed assets for business use for which profitability had declined to net realizable value and recognized the reduced amount as impairment loss.
(Method of grouping)The Companies grouped assets based on operating segments for which the Companies reviewed performance and profitability regularly. Idle assets not in operation were treated individually.
Impairment loss recognized for the years ended March 31, 2014 and 2015 was as follows:
Year ended March 31, 2014 2014Land ¥ 222 Buildings and structures 407 Machinery, vehicles, equipment and tools 44 Total ¥ 674
Year ended March 31, 2015 2015 2015Land ¥ 192 $ 1,597Buildings and structures 64 532Machinery, vehicles, equipment and tools 98 815Total ¥ 355 $ 2,954

2322
Tables show ¥ in millions and US$ in thousands.
16. Derivative TransactionsDerivative transactions to which hedge accounting is not appliedCurrency related transactions
2014Contract amount
Contract amount over 1 year Fair value* Valuation
gain (loss)
Foreign exchange forward contractsTo sell ¥ 835 ¥ — ¥ (5) ¥ (5)To buy 647 — (5) (5)
¥ 1,482 ¥ — ¥ (11) ¥ (11)
2015Contract amount
Contract amount over 1 year Fair value* Valuation
gain (loss)Contract amount
Contract amount over 1 year Fair value* Valuation
gain (loss)
Foreign exchange forward contractsTo sell ¥ 890 ¥ — ¥ 7 ¥ 7 $ 7,406 $ — $ 58 $ 58To buy 563 — (27) (27) 4,685 — (224) (224)
¥ 1,454 ¥ — ¥ (20) ¥ (20) $ 12,099 $ — $ (166) $ (166)*Fair values are based on quotes obtained from financial institutions.
Derivative transactions to which hedge accounting is applied(1) Currency related transactions
2014Principal
items hedgedContract amount
Contract amount over 1 year Fair value*1
Principle method
Foreignexchangeforward
transactionsForeign exchange forward contracts
To sellU.S. dollars ¥ 1,143 ¥ — ¥ (30)Other currencies 11 — 0
To buyU.S. dollars 9,678 — 54Other currencies 902 — 77
Allocation method Foreign exchange forward contracts
To sell
U.S. dollars*2 Accounts receivable 1,802 — —
Other currencies*2 Accounts receivable 151 — —
To buy
U.S. dollars*2 Accounts payable 5,141 — —
Other currencies*2 Accounts payable 47 — —
¥ 18,879 ¥ — ¥ 100

24
Tables show ¥ in millions and US$ in thousands.
2015Principal
items hedgedContract amount
Contract amount over 1 year Fair value*1 Principal
items hedgedContract amount
Contract amount over 1 year Fair value*1
Principle method
Foreignexchangeforward
transactions
Foreignexchangeforward
transactionsForeign exchange forward contracts
To sellU.S. dollars ¥ 1,622 ¥ — ¥ (20) $ 13,497 $ — $ (166)Other currencies 6 — 0 49 — 0
To buyU.S. dollars 4,976 29 221 41,408 241 1,839Other currencies 396 — (20) 3,295 — (166)
Allocation method Foreign exchange forward contracts
To sell
U.S. dollars*2 Accounts receivable 2,741 — — Accounts
receivable 22,809 — —
Other currencies*2 Accounts receivable 675 — — Accounts
receivable 5,617 — —
To buy
U.S. dollars*2 Accounts payable 3,667 — — Accounts
payable 30,515 — —
Other currencies*2 Accounts payable 23 — — Accounts
payable 191 — —
¥ 14,110 ¥ 29 ¥ 180 $ 117,416 $ 241 $ 1,497*1 Fair values are based on quotes obtained from financial institutions.*2 The hedged foreign currency receivables and payables were recorded using the Japanese yen amounts at the contracted forward rate, and no gains or losses on the
foreign exchange forward contracts were recorded. The fair values of foreign exchange forward contracts were included in accounts receivable and accounts payable.
(2) Interest related transactions2014
Principal items hedged
Contract amount
Contract amount over 1 year Fair value*1
Interest rate swap contracts
Pay fixed, receive variable*2 Long-termborrowings ¥ 5,521 ¥ 5,072 ¥ (31)
2015Principal
items hedgedContract amount
Contract amount over 1 year Fair value*1 Principal
items hedgedContract amount
Contract amount over 1 year Fair value*1
Interest rate swap contracts
Pay fixed, receive variable*2 Long-termborrowings ¥ 5,072 ¥ — ¥ (10) Long-term
borrowings $ 42,206 $ — $ (83)
*1 Fair values are based on quotes obtained from financial institutions.*2 The net amount to be paid or received under interest rate swap contracts was added to or deducted from the interest on the assets or liabilities for which the swap
contract was executed.

2524
Tables show ¥ in millions and US$ in thousands.
17. Earnings Per ShareThe basis of calculating net income per share for the years ended March 31, 2014 and 2015 was as follows:Year ended March 31 2014 2015 2015Net income ¥ 10,466 ¥ 6,199 $ 51,585
Net income attributable to common stockholders 10,466 6,199 51,585
Net income not attributable to common stockholders — — —
(Thousands)
Weighted average number of shares outstanding 246,065 246,052
* Diluted net income per share has not been presented for the years ended March 31, 2014 and 2015 because the Company had no potentially dilutive shares outstanding as of these balance sheet dates.
18. Net AssetsUnder the Japanese laws and regulations, the entire amount paid for new shares is required to be designated as common stock. However, a company may, by a resolution of the Board of Directors, designate an amount not exceeding one half of the price of the new shares as additional paid-in capital, which is included in capital surplus. Under the Japanese Corporate Law (“The Law”), in cases in which a dividend distribution of surplus is made, the smaller of an amount equal to 10% of the dividend or the excess, if any, of 25% of common stock over
20. Other Income (Expenses)Other, net consisted of the following:
2014 2015 2015Gain (loss) on sales of investments in securities ¥ 222 ¥ 287 $ 2,388Loss on valuation of investments in securities (7) (21) (174)Gain (loss) on sales and disposal of fixed assets (218) (269) (2,238)Gain (loss) on sales of investments in capital 12 — - —Loss on valuation of investments in capital (120) — —Gain (loss) on liquidation of subsidiaries and affiliates (5) 8 66Foreign exchange gains (losses) 711 568 4,726Sales discounts (492) (501) (4,169)Gain on negative goodwill 172 30 249Retirement benefits for directors and statutory auditors (5) (9) (74)Gain (loss) on step acquisitions (8) 38 316Subsidy income 500 872 7,256Loss on reduction of noncurrent assets (500) (873) (7,264)Loss on withdrawal from the employees’ pension fund (322) — —Other, net 1,177 1,588 13,214
Total ¥ 1,115 ¥ 1,718 $ 14,296
the total of additional paid-in capital and legal earnings reserve must be set aside as additional paid-in capital or legal earnings reserve. Legal earnings reserve and additional paid-in capital may not be distributed as dividends. By the resolution of shareholders’ meeting, legal earnings reserve and additional paid-in capital may be transferred to other retained earnings and capital surplus, respectively, which are potentially available for dividends. The maximum amount that the Company can distribute as dividends is calculated based on the nonconsolidated financial statements of the Company in accordance with the Law. Cash dividends charged to retained earnings during the two years ended March 31, 2015 represent dividends paid out during those periods. The accompanying consolidated financial statements do not include any provision for the year-end dividend of ¥7 ($0.058) per share, aggregating ¥1,724 million ($14,346 thousand), which was approved at the Company’s shareholders’ meeting on June 26, 2015, in respect of the year ended March 31, 2015.
19. Expenses for Research and DevelopmentResearch and development expenses charged to selling, general and administrative expenses for the years ended March 31, 2014 and 2015 were ¥1,368 million and ¥1,250 million ($10,401 thousand), respectively.

26
Tables show ¥ in millions and US$ in thousands.
21. Segment Information1. General information about reportable segmentsThe Company’s reportable segments are regularly reviewed by the Board of Directors using the financial information available within each segment to determine the allocation of management resources and evaluate business results. The Company maintains commercial divisions classified by merchandise and products. Each commercial division develops comprehensive business strategies for Japan and the world. Therefore, the Company is organized by operating segments which are classified by merchandise, products and sales channels based on commercial divisions. From the year ended March 31, 2015, the reportable segment of a consolidated subsidiary has been changed from the Others to the Industrial Gases & Machinery Business segment. The segment information of the year ended March 31, 2014 is disclosed in line with the new segmentation.
The main products of the four reportable segments were as follows:(1) Energy: LPG for household, commercial and industrial use,
LPG supply equipment and facilities, LNG, petroleum products, household kitchen appliances, home energy components, daily necessities, portable cooking stoves, gas canisters, mineral water, etc.
(2) Industrial Gases & Machinery: air-separation gases, hydrogen, helium, other specialty gases, gas supply facilities, welding materials, welding and cutting equipment, industrial machinery and facilities, industrial robots, pumps
and compressors, facilities for hydrogen stations, disaster prevention equipment, high-pressure gas containers, semiconductor manufacturing equipment, electronic component manufacturing equipment, factory automation systems, medicine and food packing machinery, environmental equipment, etc.
(3) Materials: stainless steel, non-ferrous metals, functional plastic products, electronic display materials, mineral sand, rare earth metals, etc.
(4) Agri-bio & Foods: frozen vegetables and fruits, health foods, livestock related products, agri-bio related goods, food plant sanitation management, etc.
2. Basis of measurement for reported segment profit and loss, segment assets and other material items by report-able segment
Accounting methods for reportable segments are basically the same as the accounting methods described in “Basis of Presenting Consolidated Financial Statements.” Income by reportable segment is equivalent to operating income. Intersegment sales and transfers are based on market values. As described in “Changes in Accounting Policies,” in accordance with the change in the calculation method for retirement benefit obligations and service cost from the beginning of the year ended March 31, 2015, the Company also revised the calculation method for retirement benefit obligations and service cost for each reportable segment in the same way. There was immaterial impact on segment income.
3. Information related to sales, operating income (loss), assets and other items by reportable segment
2014Reportable Segment
Others*1 Total Adjustments*2Consolidated statements of operations*3Energy Industrial Gases
& Machinery Materials Agri-bio &Foods Subtotal
Net salesOutside customers ¥ 386,718 ¥ 153,387 ¥ 126,885 ¥ 26,378 ¥ 693,370 ¥ 10,553 ¥ 703,923 ¥ — ¥ 703,923Intersegment 7,272 6,171 5,708 242 19,395 20,821 40,217 (40,217) —
Total 393,990 159,559 132,593 26,621 712,765 31,375 744,140 (40,217) 703,923Segment income ¥ 12,075 ¥ 4,849 ¥ 2,683 ¥ 573 ¥ 20,182 ¥ 931 ¥ 21,114 ¥ (2,595) ¥ 18,518
Segment assets ¥ 165,093 ¥ 109,351 ¥ 59,738 ¥ 9,633 ¥ 343,816 ¥ 44,182 ¥ 387,999 ¥ 28,220 ¥ 416,219Other items:
Depreciation and amortization ¥ 5,286 ¥ 4,316 ¥ 938 ¥ 173 ¥ 10,713 ¥ 3,010 ¥ 13,724 ¥ 1,338 ¥ 15,062Impairment loss on fixed assets 31 57 — 406 496 — 496 178 674Amortization of goodwill 2,008 602 22 26 2,660 — 2,660 — 2,660
Increase in fixed assets and intangible assets 6,844 4,294 1,057 431 12,627 2,666 15,293 3,550 18,843

2726
Tables show ¥ in millions and US$ in thousands.
2015Reportable Segment
Others*1 Total Adjustments*2Consolidated statements of operations*3Energy Industrial Gases
& Machinery Materials Agri-bio &Foods Subtotal
Net salesOutside customers ¥ 365,592 ¥ 162,275 ¥ 128,034 ¥ 27,286 ¥ 683,189 ¥ 8,712 ¥ 691,902 ¥ — ¥ 691,902Intersegment 6,994 7,625 5,066 187 19,874 22,551 42,426 (42,426) —
Total 372,586 169,901 133,101 27,474 703,063 31,264 734,328 (42,426) 691,902Segment income ¥ 2,347 ¥ 6,324 ¥ 2,647 ¥ 727 ¥ 12,047 ¥ 826 ¥ 12,873 ¥ (1,698) ¥ 11,174
Segment assets ¥ 144,981 ¥ 114,563 ¥ 58,919 ¥ 9,972 ¥ 328,436 ¥ 40,472 ¥ 368,909 ¥ 39,915 ¥ 408,824Other items:
Depreciation and amortization ¥ 5,187 ¥ 4,597 ¥ 887 ¥ 160 ¥ 10,832 ¥ 3,041 ¥ 13,874 ¥ 1,186 ¥ 15,060Impairment loss on fixed assets 163 17 80 — 261 22 283 72 355Amortization of goodwill 2,298 609 22 26 2,957 — 2,957 — 2,957
Increase in fixed assets and intangible assets 8,361 7,648 578 175 16,763 3,404 20,167 4,219 24,386
2015Reportable Segment
Others*1 Total Adjustments*2Consolidated statements of operations*3Energy Industrial Gases
& Machinery Materials Agri-bio &Foods Subtotal
Net salesOutside customers $ 3,042,290 $ 1,350,378 $ 1,065,440 $ 227,061 $ 5,685,187 $ 72,497 $ 5,757,693 $ — $ 5,757,693Intersegment 58,200 63,451 42,156 1,556 165,382 187,659 353,049 (353,049) —
Total 3,100,490 1,413,838 1,107,605 228,626 5,850,570 260,164 6,110,743 (353,049) 5,757,693Segment income $ 19,530 $ 52,625 $ 22,027 $ 6,049 $ 100,249 $ 6,873 $ 107,123 $ (14,129) $ 92,984
Segment assets $ 1,206,465 $ 953,341 $ 490,297 $ 82,982 $ 2,733,094 $ 336,789 $ 3,069,892 $ 332,154 $ 3,402,047Other items:
Depreciation and amortization $ 43,163 $ 38,254 $ 7,381 $ 1,331 $ 90,138 $ 25,305 $ 115,453 $ 9,869 $ 125,322Impairment loss on fixed assets 1,356 141 665 — 2,171 183 2,354 599 2,954Amortization of goodwill 19,122 5,067 183 216 24,606 — 24,606 — 24,606
Increase in fixed assets and intangible assets 69,576 63,643 4,809 1,456 139,494 28,326 167,820 35,108 202,929
*1 “Others” is an operating segment not included in reportable segments. “Others” represents financial, insurance, transportation, warehouse, information processing, etc.*2 Adjustments are as follows: (1) Adjustments for segment income include companywide expenses not allocated to each segment and the elimination of intersegment transactions. (2) Adjustments for segment assets is mainly assets in cash, deposits and investments in securities of the Company along with general and administrative departments
of the Company. (3) Adjustments for depreciation and amortization is mainly depreciation and amortization for general and administrative departments of the Company. (4) Adjustments for impairment loss on fixed assets is mainly impairment loss within the general and administrative departments of the Company. (5) Adjustments for increase in fixed assets and intangible assets is increase in fixed assets and intangible assets for general and administrative departments of the
Company. (6) “Depreciation and amortization” and “Increase in fixed assets and intangible assets” include long-term prepaid expenses and its amortization.*3 Segment income is adjusted with operating income of the consolidated statements of income.
(Related Information)1. Information about products and servicesSince the segments’ products and services are the same as those for the reportable segments, information for products and services is omitted.
2. Information about geographic areas(1) Net sales
2014Japan East Asia Southeast Asia Others Total
¥ 637,180 ¥ 42,179 ¥ 13,457 ¥ 11,106 ¥ 703,923 Notes: 1. Net sales are classified by country or region based on customer locations. 2. Main countries and regions outside Japan are grouped as follows: (1) East Asia..................... China, Taiwan, South Korea (2) Southeast Asia............ Singapore, Thailand, Malaysia, Indonesia (3) Others......................... United States, Australia, Germany

28
Tables show ¥ in millions and US$ in thousands.
2015Japan East Asia Southeast Asia Others Total Japan East Asia Southeast Asia Others Total
¥ 617,910 ¥ 47,779 ¥ 14,361 ¥ 11,851 ¥ 691,902 $ 5,141,965 $ 397,595 $ 119,505 $ 98,618 $ 5,757,693Notes: 1. Net sales are classified by country or region based on customer locations. 2. Main countries and regions outside Japan are grouped as follows: (1) East Asia..................... China, Taiwan, South Korea (2) Southeast Asia............ Singapore, Thailand, Malaysia, Indonesia (3) Others......................... United States, Australia, Germany
(2) Tangible fixed assetsSince tangible fixed assets in Japan accounted for over 90% of tangible fixed assets on the consolidated balance sheets, information regarding tangible fixed assets is omitted.
3. Information about major customersSince sales to no customer accounted for 10% or more of the net sales on the consolidated statements of income, information by major customer is omitted.
(Information on amortization of goodwill and unamortized balance by reportable segment)
2014Reportable Segment
Others*Corporate assets and elimination
TotalEnergy Industrial Gases
& Machinery Materials Agri-bio &Foods Subtotal
GoodwillAmortization ¥ 2,008 ¥ 602 ¥ 22 ¥ 26 ¥ 2,660 ¥ — ¥ — ¥ 2,660 Balance as of end of year 9,669 4,180 92 85 14,027 — — 14,027
Negative goodwillAmortization ¥ 50 ¥ 0 ¥ 63 ¥ — ¥ 114 ¥ — ¥ — ¥ 114 Balance as of end of year 31 0 134 — 166 — — 166
2015Reportable Segment
Others*Corporate assets and elimination
TotalEnergy Industrial Gases
& Machinery Materials Agri-bio &Foods Subtotal
GoodwillAmortization ¥ 2,298 ¥ 609 ¥ 22 ¥ 26 ¥ 2,957 ¥ — ¥ — ¥ 2,957Balance as of end of year 10,363 3,666 69 58 14,157 — — 14,157
Negative goodwillAmortization ¥ 9 ¥ 0 ¥ 53 ¥ — ¥ 62 ¥ — ¥ — ¥ 62Balance as of end of year 22 — 81 — 103 — — 103
2015Reportable Segment
Others*Corporate assets and elimination
TotalEnergy Industrial Gases
& Machinery Materials Agri-bio &Foods Subtotal
GoodwillAmortization $ 19,122 $ 5,067 $ 183 $ 216 $ 24,606 $ — $ — $ 24,606Balance as of end of year 86,236 30,506 574 482 117,808 — — 117,808
Negative goodwillAmortization $ 74 $ 0 $ 441 $ — $ 515 $ — $ — $ 515Balance as of end of year 183 — 674 — 857 — — 857
*“Others” is an operating segment which is not included in the reportable segments. “Others” represents insurance, transportation and warehouse.
(Information on gain on negative goodwill by reportable segment)There was no significant gain on negative goodwill to report.

2928
Independent Auditors’ Report

Printed in Japan
Osaka Head Office6-4, Hommachi 3-chome, Chuo-ku, Osaka 541-0053, JapanTel: 81-6-7637-3310 Fax: 81-6-7637-3535
Tokyo Head Office21-8, Nishi-Shimbashi 3-chome, Minato-ku, Tokyo 105-8458, JapanTel: 81-3-5405-5711 Fax: 81-3-5405-5640
Corporate Website http://www.iwatani.co.jp/eng/