PZU Group’s Q1-Q3 2012 Financial Results
30
PZU Group’s Q1-Q3 2012 Financial Results Warsaw, 14 November 2012
Transcript of PZU Group’s Q1-Q3 2012 Financial Results

PZU Group’s Q1-Q3 2012 Financial Results
Warsaw, 14 November 2012

2
Agenda
1. Insurance market in Poland after H1 2012
2. Operating Performance in Q1 - Q3 2012
3. Financial Results Overview in Q1 - Q3 2012
4. Questions and Answers
1

5 655 5 719 6 377 7 046
5 220 5 498 6 380
6 550
10 876 11 218
12 757 13 596
09 10 11 12
3
Insurance market in Poland
Gross Written Premium Non-life Insurance
3.1% 13.7% 6.6%
x% - change Y/Y
7.7%
YTD, m PLN
• Major price hikes in motor products and other corporate products.
Polish FSA data; only for Polish insurance market
• PZU is still the leader in profitability (418.6 m PLN in H1 2012 – 76.6% market share).
Technical Result Non-life Insurance
210
(785)
261 547
H1 '09 H1 '10 H1 '11 H1 '12
109.5%
37.5%
x% - CAGR
Q1
Q2
Decelerating pace
of market growth
in Q2
2.7%
10.5%

4
Insurance market in Poland
x% - change Y/Y
YTD, m PLN
Polish FSA data; only for Polish insurance market
6 987 7 251 7 825 7 956
H1 '09 H1 '10 H1 '11 H1 '12
Regular Gross Written Premium Life Insurance*
3.8% 7.9% 1.7%
4.4%
• PZU Life GWP growth outperforms market (H1 2012 - 3.3% vs. 1.7%).
2 488 1 810
1 757 1 715
H1 '09 H1 '10 H1 '11 H1 '12
Technical Result Life Insurance
(11.7)%
(27.3)% (2.9)% (2.4)%
• PZU Life’s share of the market’s technical results exceeds 57.4%.
• Lower profitability driven by extent of portfolio conversion.
* Figures concerning regular premium business may be distorted by certain insurers classyfying products entailing attributes of single premium products as regular premium business
x% - CAGR
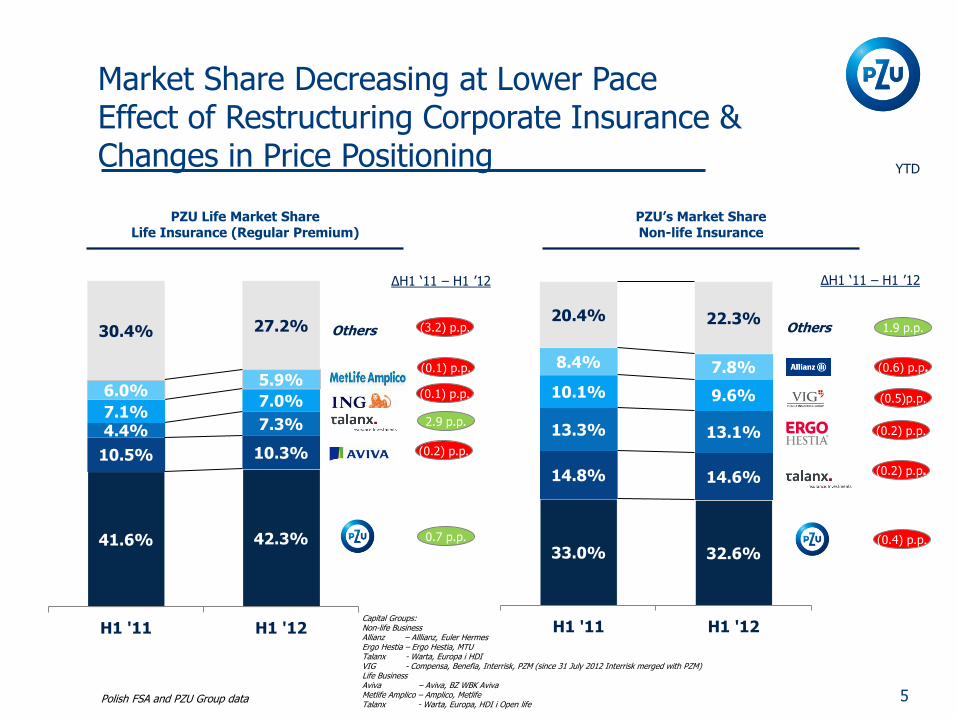
41.6% 42.3%
10.5% 10.3%
4.4% 7.3% 7.1%
7.0% 6.0%
5.9%
30.4% 27.2%
H1 '11 H1 '12
33.0% 32.6%
14.8% 14.6%
13.3% 13.1%
10.1% 9.6%
8.4% 7.8%
20.4% 22.3%
H1 '11 H1 '12
5
Market Share Decreasing at Lower Pace Effect of Restructuring Corporate Insurance & Changes in Price Positioning
PZU Life Market Share Life Insurance (Regular Premium)
PZU’s Market Share Non-life Insurance
Others (3.2) p.p.
0.7 p.p.
(0.1) p.p.
(0.2) p.p.
1.9 p.p.
(0.2) p.p.
(0.4) p.p.
(0.2) p.p.
∆H1 ‘11 – H1 ’12 ∆H1 ‘11 – H1 ’12
Others
(0.5)p.p.
(0.1) p.p. (0.6) p.p.
2.9 p.p.
Capital Groups: Non-life Business Allianz – Alllianz, Euler Hermes Ergo Hestia – Ergo Hestia, MTU Talanx - Warta, Europa i HDI VIG - Compensa, Benefia, Interrisk, PZM (since 31 July 2012 Interrisk merged with PZM) Life Business Aviva – Aviva, BZ WBK Aviva Metlife Amplico – Amplico, Metlife Talanx - Warta, Europa, HDI i Open life
YTD
Polish FSA and PZU Group data

0,0%
10,0%
20,0%
30,0%
40,0%
50,0%
60,0%
70,0%
Q1 '09 Q2 '09 Q3 '09 Q4 '09 Q1 '10 Q2 '10 Q3 '10 Q4 '10 Q1 '11 Q2 '11 Q3 '11 Q4 '11 Q1 '12 Q2 '12
21.5%
43.6%
49.2%
Non-life Insurance Market PZU’s Market Share by Business Segment
0,0%
10,0%
20,0%
30,0%
40,0%
50,0%
60,0%
70,0%
Q1 '09 Q2 '09 Q3 '09 Q4 '09 Q1 '10 Q2 '10 Q3 '10 Q4 '10 Q1 '11 Q2 '11 Q3 '11 Q4 '11 Q1 '12 Q2 '12
H1 `12 Corporate Clients
Other products
Motor Own Damage
Motor TPL
48.9%
33.5%
27.8%
Other products
Motor Own Damage
Motor TPL
H1 ‘12/H1 ’11
(2.9) p.p.
(4.3) p.p.
3.5 p.p.
H1 ’12/H1 ’11
(0.7) p.p.
(0.4) p.p.
(2.4) p.p.
6
H1 `12 Mass Clients
YTD
Polish FSA and PZU Group data Only direct business

7
Agenda
1. Insurance market in Poland after H1 2012
2. Operating Performance in Q1 - Q3 2012
3. Financial Results Overview in Q1 - Q3 2012
4. Questions and Answers
2

8
Key Issues Describing PZU’s Performance in Q1 - Q3 2012
• One of the best quarterly results in PZU Group’s history
• High profitability in group and continued life segment
• Non-life COR under long-term target
• Stable GWP growth in group and continued life segment
• GWP growth in corporate non-life (new products)
• Changes to investment strategy to enhance profitability and flatten volatility
• Larger share of corporate debt, investments in real estate and partial conversion into investment fund to gain tax-shield
• Better than expected financial market conditions:
• WIG Index up in Q1 - Q3 2012 (+16.3% vs -19.4% year before)
• T-bond yield down (leading to higher portfolio valuation)
• GWP growth despite worsening market conditions
• Profitability as main focus
• Better investment result

11 426 12 159
Q3 '11 Q3 '12
12.4 13.8
Q3 '11 Q3 '12
1 857
2 840
Q3 '11 Q3 '12
19.6%
28.4%
Q3 '11 Q3 '12
9
Overview of the PZU Group’s Q1 - Q3 2012 Financial Results
Gross Written Premium (m PLN)
Equity (bn PLN)
Net Profit (m PLN)
ROE (%)*
* Annualized ratio computed using equity at beginning and end of reporting period
YTD
6.4%
11.1%
52.9%
8.8 p.p.
x% - change Y/Y

740 856
231
239 971
1 095
Q3 '11 Q3 '12
4 608 4 771
Q3 '11 Q3 '12
10
Group Life Insurance and Continued Business grow steadily and profitably
Gross Written Premium Group and Continued Segment
Operating Profit Group and Continued Segment*
Drivers of higher gross written premium:
• Larger Group insurance portfolio and higher average premiums;
• High sales of riders to continued insurance products;
• Growth of bancassurance group investment products classified as insurance contracts (including ING Bank Śląski and Bank Millennium);
• Growth of group health care products, including new medicine insurance.
Higher operating profit driven by business growth. Lower loss ratio in protection products (as a result of GWP from riders with a low loss ratio and decrease in average permanent disability claims).
Investment margin (investment yield above technical rate up to a maximum equal to the risk free rate)
Insurance margin (investment yield using technical rate)
* Net of conversion effect
Total margin
YTD, m PLN
3.5%
12.8%
16.1% 18.0%
5.0% 5.0%
21.1% 23.0%
x% - change Y/Y
11
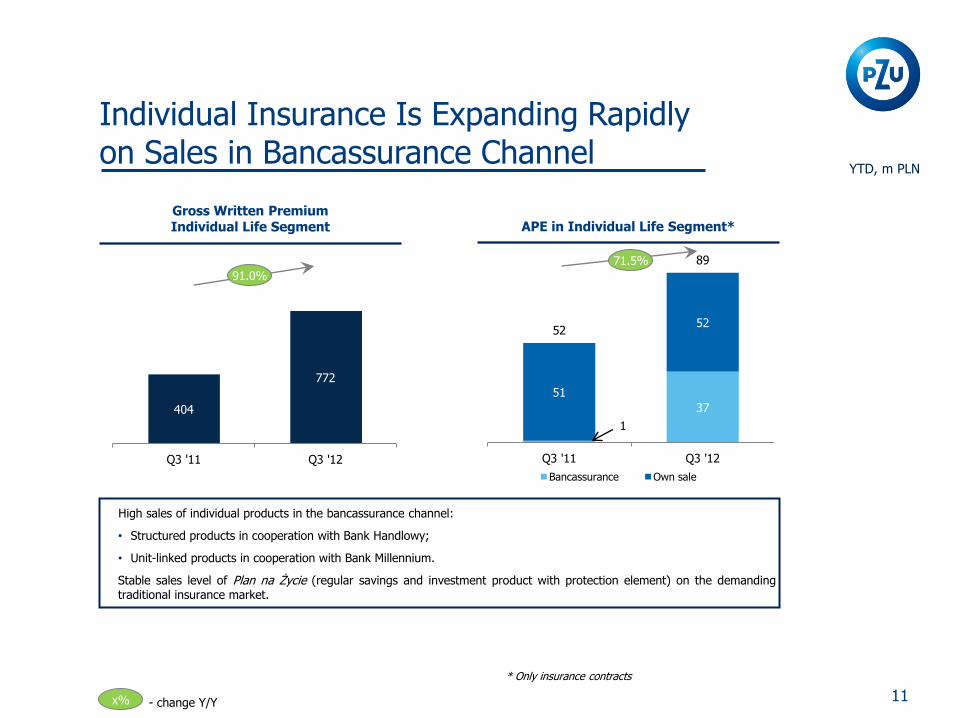
Individual Insurance Is Expanding Rapidly on Sales in Bancassurance Channel
APE in Individual Life Segment*
High sales of individual products in the bancassurance channel:
• Structured products in cooperation with Bank Handlowy;
• Unit-linked products in cooperation with Bank Millennium.
Stable sales level of Plan na Życie (regular savings and investment product with protection element) on the demanding traditional insurance market.
* Only insurance contracts
Gross Written Premium Individual Life Segment
YTD, m PLN
1
37
51
52 52
89
Q3 '11 Q3 '12
Bancassurance Own sale
404
772
Q3 '11 Q3 '12
91.0%
71.5%
x% - change Y/Y

12
Mass Client Segment Profitability Up in Motor Insurance
Gross Written Premium in Mass Client Segment
• Price hikes in 2011 in motor TPL business contributed to sales growth in 2012 (higher average premium).
• GWP growth in other TPL products following the launch of modified TPL products for health care units and small businesses.
• GWP growth in other non-life business mainly due to higher sales of property insurance (PZU DOM PLUS).
Operating profit in Mass Client Segment
• Better results in motor business due to favorable weather conditions (lower loss frequency). Loss ratio down by 6.1 p.p. to 69.9%.
• In other insurance – limited number of single high value and mass claims.
Motor Insurance Business (Technical result)
Non Motor Insurance Business (Technical result)
Impact of Investment Segment Allocation
YTD, m PLN
159 181
114
383 228
200 501
764
Q3 '11 Q3 '12
1 792 1 839
3 067 3 131
4 859 4 970
Q3 '11 Q3 '12
2.3% 52.4%
x% - change Y/Y

13
Corporate Client Segment Profitability Down on Contractual Guarantees in Construction Contracts
Operating Profit in Corporate Client Segment
• Success in sales of TPL corporate products and modified TPL products for health care units.
• High sales of accident insurance to hospitals (compulsory insurance in H1 2012).
• Lower sales of motor insurance due to price hike and restrictive underwriting policy.
• Better results in motor business related to lower loss ratio (down by 13.3 p.p. to 68.0%) due to:
oChanges in underwriting policy;
oFavorable weather conditions (decrease in loss frequency).
• Lower results in contractual guarantees in construction contracts (non-motor insurance business) mainly due to higher claim provisions as the construction sector’s financial condition deteriorated (gross result -117.1 m PLN)
Gross Written Premium in Corporate Client Segment
Motor Insurance Business (Technical result)
Non Motor Insurance Business (Technical result)
Impact of Investment Segment Allocation
YTD, m PLN
52
(20)
5 86
107 73
164 139
Q3 '11 Q3 '12
583 697
775 708
1 358 1 405
Q3 '11 Q3 '12
3.4%
(15.1)%
x% - change Y/Y

14
Higher Administrative Expenses on Project Activities
Administrative Expenses
YTD, m PLN
899 899
41
100 940
999
Q3 '11 Q3 '12
7.7% 7.7%
6.3%
7.3% 6.8%
* Administrative expense ratio: administrative expenses / net earned premium – sum of Poland ‘s insurance business segments
** Additional costs for Emplyee Benefit Fund due to different classification under IFRS and Polish GAAP
Recurring administrative expenses Other (including project expenses)
- Recurring administrative expense ratio (%)*
x% - Change Y/Y
x%
- Administrative expense ratio (%)* x%
Recurring administrative expenses
Other (including project expenses)
• Decelerating pace of administrative expenses growth y/y (costs of restructuring project launched in 2011).
• Recurring expenses stable despite business growth.
• Higher administrative expenses on projects to optimize service processes and improve the PZU Group’s image (rebranding campaign and other related expenses +30.9 mln PLN).
• Additional costs of 20 m PLN for Employee Benefit Fund.**

15
Good results and volatile financial situation - proper time for investments
One of the PZU Group’s best quarterly results in its history and..
… prime time to make investments to enhance:
1. Operational Efficiency
2. Competitiveness
…through:
1. Investments in new operating model
2. Change of IT system
3. Investments in new client service approach
Which will affect the level of spendings
in upcoming quarters while keeping the tough financial control
PZU Group ENVIRONMENT
ECONOMY
INSURANCE
FINANCIAL MARKET
● High volatility in capital markets
● Lower interest rates in the longer term
● Robust results in Q1-Q2
● Low claims frequency in Motor Business
● No catastrophic events
Leading to…
● Potencial insurance rates decrease
● Lower pace of investments in the economy and slower insurance market growth

16
Business transformation (Implementing the of Target Operating
Model) ...
Enhancing flexibility and shortening ’time-to-market’
Customer centric philosophy and active customer management
Multi-channel process of sales, renewals and service management
Automating processes, paper-less philosophy, cost-light operations
I
II
III
IV
Implementing Everest to Achieve PZU 2.0 Strategy
• ability to adjust products and rates more quickly and with greater facility – high range of configurability
• 360 client analysis on-line giving access
to users and agents
• advanced functionality of business processes, including renewals
• tested ’ready to use’ solutions facilitating customer and agent support and back-office processes
New insurance IT system…
... entailing the implementation and integration of a insurance system

17
Agenda
1. Insurance market in Poland after H1 2012
2. Operating Performance in Q1 - Q3 2012
3. Financial Results Overview in Q1 - Q3 2012
4. Questions and Answers
3

18
Overview of PZU Group’s Financial Highlights
* Annualized ratio computed using equity at beginning and end of reporting period ** Only for Non-Life insurance business
m PLN, IFRS Q1-Q3 2011 Q1-Q3 2012 Change YoY Q3 2011 Q3 2012 Change YoY Q2 2012Change Q3
over Q2
Profit and Loss
Statement
Gross Written Premium 11 426 12 159 6.4% 3 753 3 913 4.3% 3 924 (0.3)%
Premium Earned 11 054 11 949 8.1% 3 785 4 083 7.9% 3 998 2.1%
Investment Result 1 040 2 569 147.0% (39) 1 045 x 651 60.6%
Operating Profit 2 331 3 541 51.9% 429 1 405 227.5% 1 101 27.6%
Net Profit 1 857 2 840 52.9% 305 1 124 268.9% 894 25.7%
Balance Sheet
Equity 12 419 13 801 11.1% 12 419 13 801 11.1% 12 741 8.3%
Total Assets 54 235 56 801 4.7% 54 235 56 801 4.7% 54 268 4.7%
Principal Financial
Ratios
ROE* 19.6% 28.4% 8.8 p.p. 9.7% 33.7% 24.0 p.p. 27.0% 6.7 p.p.
Combined Ratio** 94.8% 90.7% (4.1) p.p. 98.9% 91.0% (7.9) p.p. 89.9% 1.1 p.p.

19
Higher PZU Group Operating Profit due to Better Investment Result and Higher Profitability in Mass Client Segment
GWP (Local GAAP)
Operational profit
Q3 `12 Q3 `11
POLAND – NON-LIFE POLAND - OTHER
Corporate Clients
Mass Clients
POLAND – LIFE
Group and cont.
Individual Investments* Pension
ABROAD – NON-LIFE
Ukraine Lithuania Investment contracts
Other** SEGMENTS
* Investment revenues in Investment Segment – external operations
YTD, m PLN
1 358
4 859 4 608
404
2 906
85 115
1 405
4 970 4 771
772
1 661
100 144
164
501
1 346
148
(13) (2)
1 19 82 85 139
764
1 276
124 8 11 2
1 065
92 60
** Sale of shares from AFS portfolio – impact in 2012; Armatura Group consolidation – impact in 2011

20
Profitability by Insurance Business Segment
* Combined Ratio (calculated in relation to net premium) presented for Non-Life insurance business / operating profit ratio (calculated in relation to GWP) presented for Life insurance business
** Operating profit ratio net of conversion effect (under Polish GAAP)
Insurance Business
Segments
m PLN, local GAAP Q1-Q3 2011 Q1-Q3 2012 Change YoY Q1-Q3
2011
Q1-Q3
2012Change YoY Q1-Q3 2011 Q1-Q3 2012
Total Non-Life 6 418 6 618 3.1% 664 915 37.9% 94.8% 90.7%
Mass Insurance - Poland 4 859 4 970 2.3% 501 764 52.4% 94.0% 88.9%
Motor TPL Insurance 1 841 1 935 5.1% (15) 221 x 103.3% 92.6%
Motor Own Damage 1 226 1 196 (2.5)% 129 162 25.2% 88.5% 84.8%
Other products 1 792 1 839 2.6% 159 181 14.1% 88.7% 87.6%
Impact of investment
segment allocationx x x 228 200 (12.4)% x x
Corporate Insurance -
Poland 1 358 1 405 3.4% 164 139 (15.1)% 95.7% 95.1%
Motor TPL Insurance 300 296 (1.2)% (33) (4) x 110.8% 101.3%
Motor Own Damage 475 412 (13.2)% 38 90 139.0% 91.9% 80.3%
Other products 583 697 19.6% 52 (20) x 90.1% 104.3%
Impact of investment
segment allocationx x x 107 73 (32.0)% x x
Ukraine 85 100 17.2% (2) 11 x 118.1% 105.0%
Lithuania 115 144 24.8% 1 2 96.2% 101.9% 104.3%
Total Life Poland 5 012 5 543 10.6% 1 494 1 400 (6.3)% 29.8% 25.3%
Group and Continued ** 4 608 4 771 3.5% 971 1 095 12.8% 21.1% 23.0%
Individual 404 772 91.0% 148 124 (16.6)% 36.7% 16.0%
Conversion effect x x x 375 182 (51.6)% x x
Combined Ratio /
Operating profit ratio*Gross Written Premium Operating Profit

m PLN, IFRS Q1-Q3 2011 Q1-Q3 2012
Operating Profit (according to financial
statements) 2 331.5 3 540.8
including:
Movement in insurance provisions –
release of type P provisions 354.1 170.4
Effects of consolidating the Armatura
Group – change in the method of valuation 118.9
Result on contractual guarantees in
construction contracts(117.1)
Result on selling shares from AFS portfolio 101.0
21
Extraordinary Items Affecting the Results
1
2
Impact of converting long-term contracts into yearly-
renewable term contracts comparable Y/Y.
The difference between the value of the Armatura Group carried in the balance sheet as at 31 December 2010 and PZU Group’s share in the Armatura Group’s net assets was reported in the 2011 profit and loss statement. The non-recurring impact is related to commencing consolidation by the full method. Lower result on contractual guarantees in construction contracts due to this sector’s deteriorating financial condition (higher claim reserves and reduced assessment of share in reinsurers’ profits). Sale of shares from AFS portfolio whose changing valuation in previous years was allocated to the revaluation reserve.
1
2
3
3
4
4
YTD, m PLN

22
Group and Continued Life Insurance Segment
Primary Operating Profit Components in Group and Continued Life Insurance
(m PLN) Remarks
• GWP growth +3.5% Y/Y mainly due to higher group insurance portfolio (including riders to continued insurance) and higher average premiums.
• Higher investment result in unit-linked products driven by robust capital markets in Q1 - Q3 2012 comparing Y/Y.
• Slight increase in net claims in type P group protection insurance due to portfolio expansion and lower loss ratio.
• Growth of mathematical provisions in unit-linked products due to high investment income. Lower conversion ratio in type P group insurance.
• Acquisition expenses up Y/Y driven by higher sales volume.
• Higher administrative expenses driven by PZU Group rebranding campaign.
• Lower operating profit stemming primarily from the decrease in conversion effect in type P group insurance; net of conversion effect, this segment’s margin improved.
Growth Rate
Y/Y
(5.2)%
1 276
1 346
210
163
21
10
43
359
10
Gross Operating ProfitQ1 - Q3 2012
Other
Administrative expenses
Acquisition expenses
Net change in technicalprovisions**
Net Claims*
Investment Result
Gross Written Premium
Gross Operating ProfitQ1 - Q3 2011
43.8%
0.3%
x%
21.7%
82.3%
2.4%
3.5%
* Claims paid and RBNP reserves
** Mathematical and other provisions, including conversion effect

23
Individual Life Insurance Segment
Primary Operating Profit Components in Individual Life Insurance (m PLN) Remarks
• GWP up by 91.0% Y/Y primarily driven by high sales of investment products via the bancassurance channel.
• Higher investment result mainly in investment products driven by robust capital markets in Q1 - Q3 2012 comparing Y/Y.
• Net claims down on a lower level of maturities in traditional protection insurance.
• Growth of mathematical provisions due to higher sales of investment products and better investment result in unit-linked portfolio.
• Acquisition expenses up Y/Y due to higher sales volume (including investment insurance with a high first-year non-deferrable commission).
• Higher administrative expenses driven by PZU Group rebranding campaign and robust sale of individual products via the bancassurance channel.
• Lower operating profit stemming primarily from high sales of investment products with a high first-year non-deferrable commission. Growth Rate (16.6)%
124
148
148
81
98
368
0
3
24
544
Gross Operating ProfitQ1 - Q3 2012
Other
Administrative expenses
Acquisition expenses
Net change in technicalprovisions**
Net Claims*
Investment Result
Gross Written Premium
Gross Operating ProfitQ1 - Q3 2011
Y/Y
70.6%
(16.6)%
x%
57.5%
x%
8.1%
91.0%
* Claims paid and RBNP reserves
** Mathematical and other provisions

24
Profitability of Corporate Non-life Insurance Segment
• Lower loss ratio (down 13.3 p.p. to 68.0%) in motor business
stemming from the decrease in loss frequency.
• Lower loss ratio in motor business partly compensated
for by providing for contractual guarantees in construction
contracts – effect of this sector’s deteriorating financial
condition (impact on gross result-117.1 m PLN).
• Higher administrative expense ratio resulted from:
o PZU Group’s rebranding campaign;
o Initiatives to optimize service processes.
• Acquisition ratio up as a result of lower cost base in 2011
(affecting comparable data) - deferrable commissions in motor
business expensed in 2010.
• COR excluding contractual guarantees in construction contracts
was 86.2%, down by 8.9 p.p.
Profitability of Corporate Non-life Insurance (COR %) Remarks
95.1%
95.7%
2.4 p.p.
0.2 p.p.
3.2 p.p.
Q1 - Q3 2012
Acquisition expense ratio
Administrative expenseratio
Loss ratio
Q1 - Q3 2011

25
Profitability in Mass Non-life Insurance Segment
• Decrease in loss ratio in:
o motor business (down 6.1 p.p. to 69.9%) as a result
of lower loss frequency;
o other non-life business due to low number of single high
value claims and mass claims.
• More claims in agriculture insurance stemming from the adverse
consequences of frost and hail (up 9.4% Y/Y).
• Higher administrative expense ratio resulted from:
o PZU Group’s rebranding campaign;
o initiatives to optimize service processes.
• Lower acquisition expense ratio as indirect acquisition costs fell.
Profitability of Mass Non-life Insurance (COR %) Remarks
88.9%
94.0%
0.5 p.p.
1.2 p.p.
4.4 p.p.
Q1 - Q3 2012
Acquisition expense ratio
Administrative expenseratio
Loss ratio
Q1 - Q3 2011

73.5%
15.1%
0.1%
10.4%
0.9%
26
High Profitability of Debt and Equity Instruments
Q3 `11 Investment Composition* Q3 `12 Investment Composition*
Investment Revenues
Debt securities
Loans
* Investments include financial assets, investment properties and negative valuation of derivatives
Interest-bearing instruments** Equity instruments and
derivatives TOTAL
Other investments
Reverse repo and deposits
Investment property
Equity instruments and derivatives
** Investment revenues for interest-bearing instruments include results on debt securities, loans, reverse repo and deposits
YTD, m PLN
76.4%
8.8%
2.1% 11.6%
1.1%
(587) 690
Q3 '11 Q3 '12
1 773 2 035
Q3 '11 Q3 '12
1 040
2 569
Q3 '11 Q3 '12
14.8% 147.0%

27
High Profitability of Main Portfolio in Q3 2012
Investment Revenues (Total m PLN) Investment Revenues on main portfolio
of PZU Group (m PLN)
Financial assets on policyholders’
risk* – 6.1 bn PLN
Financial assets in the main
portfolio – 43.6 bn PLN
2012
Total: 49.7 bn PLN
* Products at policyholders’ risk: unit-linked, structured and tax exempt products
Net quarterly data, m PLN
873
651
1 045
Q1 '12 Q2 '12 Q3 '12
699 603
895
Q1 '12 Q2 '12 Q3 '12
174
48 150
Q1 '12 Q2 '12 Q3 '12
Investment Revenues on Policyholders’ Risk* (m PLN)
No impact on PZU Group’s net result
87.8%
12.2%
48.4%

Robust Capitalization, Strong Solvency Ratios and Stable Dividends
PZU Own Funds and Solvency Margin Coverage Ratio (m PLN, Polish GAAP)
PZU Group’s Equity (m PLN, IFRS)
PZU Życie Own Funds and Solvency Margin Coverage Ratio (m PLN, Polish GAAP)
PZU Group’s Own Funds for Q3 2012 (bn PLN, IFRS)
Solvency Margin Coverage Ratio Solvency Margin Coverage Ratio
Consolidated solvency
ratio: 384.4%
28
12.00
3.12
Own funds Solvency margin
12 870 13 801
2 840 28 1 937
Equity YE'11
Net profit 2011dividend
Other Equity Q3'12
5 323 6 258
Q3 '11 Q3 '12
8 909 10 216
Q3 '11 Q3 '12
666.1% 763.8%
313.4% 361.8%

29
Agenda
1. Insurance market in Poland after H1 2012
2. Operating Performance in Q1 - Q3 2012
3. Financial Results Overview in Q1 - Q3 2012
4. Questions and Answers 4

Questions and Answers
Contact data: PZU Al. Jana Pawła II. 24 00-133 Warsaw, Poland Management Board Office Marcin Góral – Director Piotr Wisniewski – IRO Tel.: (+48 22) 582 26 23 [email protected] www.pzu.pl/ir Spokesman Michał Witkowski, tel.(+48 22) 582 59 44 [email protected]
30