Financial Analysis of Panasonic carbon india ltd
28
PANASONIC CARBON INDIA LTD. GROUP – 2 • ARNAB KR. CHATTERJEE • KOUSTAV NAHA • MUDIT KANSAL • RAJVEERSINH CHAUHAN • RIDDHIMA KARTIK • JYOTI SINGH
-
Upload
riddhima-kartik -
Category
Economy & Finance
-
view
104 -
download
0
Transcript of Financial Analysis of Panasonic carbon india ltd

PANASONIC CARBON INDIA LTD. GROUP – 2
• ARNAB KR. CHATTERJEE
• KOUSTAV NAHA • MUDIT KANSAL • RAJVEERSINH
CHAUHAN • RIDDHIMA KARTIK • JYOTI SINGH

TABLE OF CONTENTS
• COMPANY INTRODUCTION• MANAGEMENT STRUCTURE• PERFORMANCE OVERVIEW• FINANCIAL ANALYSIS BASED ON RATIO ANALYSIS

COMPANY INTRODUCTION
• ESTABLISHED IN THE YEAR 1982• PANASONIC CARBON OPERATES IN THE ELECTRODES AND GRAPHITE
SECTOR.• MANUFACTURES ELECTRODES AND WELDING EQUIPMENTS• CURRENT MARKET CAPITALIZATION OF PANASONIC CARBON STANDS FOR
RS.224.54 CRORES.• COMPANY IS BOTH LISTED IN BOMBAY STOCK EXCHANGE(BSE) & NEW
YORK STOCK EXCHANGE(NSE)

MANAGEMENT STRUCTURE
• R SENTHIL KUMAR - MANAGING DIRECTOR,• V R GUPTE – DIRECTOR• A RAGHAVENDRA RAO – DIRECTOR• K SUBRAMANIAN – DIRECTOR• C JAYASHREE – DIRECTOR• CHIAKI KIDANI - ADDNL. NON EXECUTIVE DIRECTOR.

MISSION AND VISIONMISSION• RECOGNIZING OUR RESPONSIBILITIES AS INDUSTRIALISTS, WE WILL
DEVOTE OURSELVES TO THE PROGRESS AND DEVELOPMENT OF SOCIETY AND THE WELL-BEING OF PEOPLE THROUGH OUR BUSINESS ACTIVITIES, THEREBY ENHANCING THE QUALITY OF LIFE THROUGHOUT THE WORLD.
VISION• THROUGH OUR BUSINESS ACTIVITIES, WE AT PANASONIC HAVE LONG
NURTURED OUR “CONSUMER ELECTRONICS DNA.” MAKING THIS DNA CENTRAL TO ALL OF OUR ACTIVITIES AND CARRYING IT FORTH, WE AIM TO CONTINUE TO PROVIDE “BETTER LIVING” FOR OUR CUSTOMERS IN THE VARIOUS SPACES AND AREAS WHERE OUR CUSTOMERS GO ABOUT THEIR LIVES, SUCH AS THEIR HOMES, COMMUNITIES, BUSINESSES, JOURNEYS, AND AUTOMOBILES.

COMPANY OPERATIONS
Appliances Company is
committed to developing
environmentally leading products that meet new
customer needs in the areas of
homemaking, cooking, air
conditioning, water heating,
beauty and health.
Eco Solutions Company will make untiring efforts to offer solutions for
creating a comfortable
environment.The services under this
category are :
Lighting Business Division
Energy Systems Business DivisionHousing Systems Business Division
AVC Networks Company was newly
formed by combining BtoC and BtoB businesses of the
former AVC Networks Company, which has
strong expertise in Audio Visual technology and of
the former Systems & Communications
Company, which has strong expertise in
wireless-communications technology.Some of the
Services under this category are :
Storage Business DivisionVisual Systems Business
Division
Automotive & Industrial Systems
Company will help realize ecological and smart lifestyles that
are also safe and secure through using
our unique core technology as a
base.Some of the services are : Automotive
Electronics Systems Business Division
Rechargeable Battery Business Division

MAJOR COMPETITORS AND THEIR MARKET CAP VALUE
• AIA ENGG. – INR 8,497 CR • SKF INDIA – INR 6,101 CR • GRAPHITE INDIA – INR 1,356 CR• ESAB INDIA – INR 857 CR
• PANASONIC CARBON – INR 224.54 CR

PERFORMANCE OVERVIEW
• PROS:
- COMPANY IS VIRTUALLY DEBT FREE.- COMPANY HAS BEEN MAINTAINING A HEALTHY DIVIDEND PAYOUT OF 46.87%
• CONS:
- STOCK IS TRADING AT 2.94 TIMES ITS BOOK VALUE- COMPANY HAS A LOW RETURN ON EQUITY OF 12.35% FOR LAST 3 YEARS.- EARNINGS INCLUDE AN OTHER INCOME OF RS.5.87 CR.

TREND OF BOOK VALUE CHANGEMar 2011 Mar 2012 Mar 2013 Mar 2015 Mar 2015
Value in Rs 117.21 117.27 122.69 128.77 137.93Percentage change
0.05% 4.62% 4.96% 7.11%

OTHER OBSERVATIONS
SHARE CAPITAL SHARE CAPITAL IS CONSTANT.(4.80 CRORE) NO MERGER/ DEMERGER / ACQUISITION HAS NOT HAPPENED. NO CHANGE IN FINANCIAL STRUCTURE IN COMPANY.
RESERVES THERE IS A INCREASE IN THE RESERVES ALONG WITH THE DECREASE IN FIXED
COST. NO INVESTMENT EVEN IF THERE ARE INCREASE IN THE CASH RESERVES.
LIABILITY LIABILITY IS INCREASED.

RESERVES OVER THE YEARMar 2011 Mar 2012 Mar 2013 Mar 2014 Mar 2015
Reserves (in crore)
51.46 51.49 54.09 57.01 61.40
Reserves46485052545658606264
Mar-11Mar-12Mar-13Mar-14Mar-15

FIXED COSTMar 2011 Mar 2012 Mar 2013 Mar 2014 Mar 2015
Fixed Asset (in Crore)
3.94 3.69 3.42 3.38 2.76
Fixed Cost0
0.51
1.52
2.53
3.54
4.5
Mar-11Mar-12Mar-13Mar-14Mar-15

LIABILITIESMar 2011 Mar 2012 Mar 2013 Mar 2014 Mar 2015
Liabilities(in crore)
64.39 63.98 67.81 70.99 76.81
Total Liab-ilities
0102030405060708090
Mar-11Mar-12Mar-13Mar-14Mar-15

TREND OF COMPANY SHARE PRICE
• THE COMPANY HAS SEEN A STIFF INCREASE IN SHARE MARKET VALUE.• INCREASE IN PREMIUM.(WHICH WAS BEEN CONTRIBUTED TO THE SHARE
PREMIUM ACCOUNT)
GRAPH
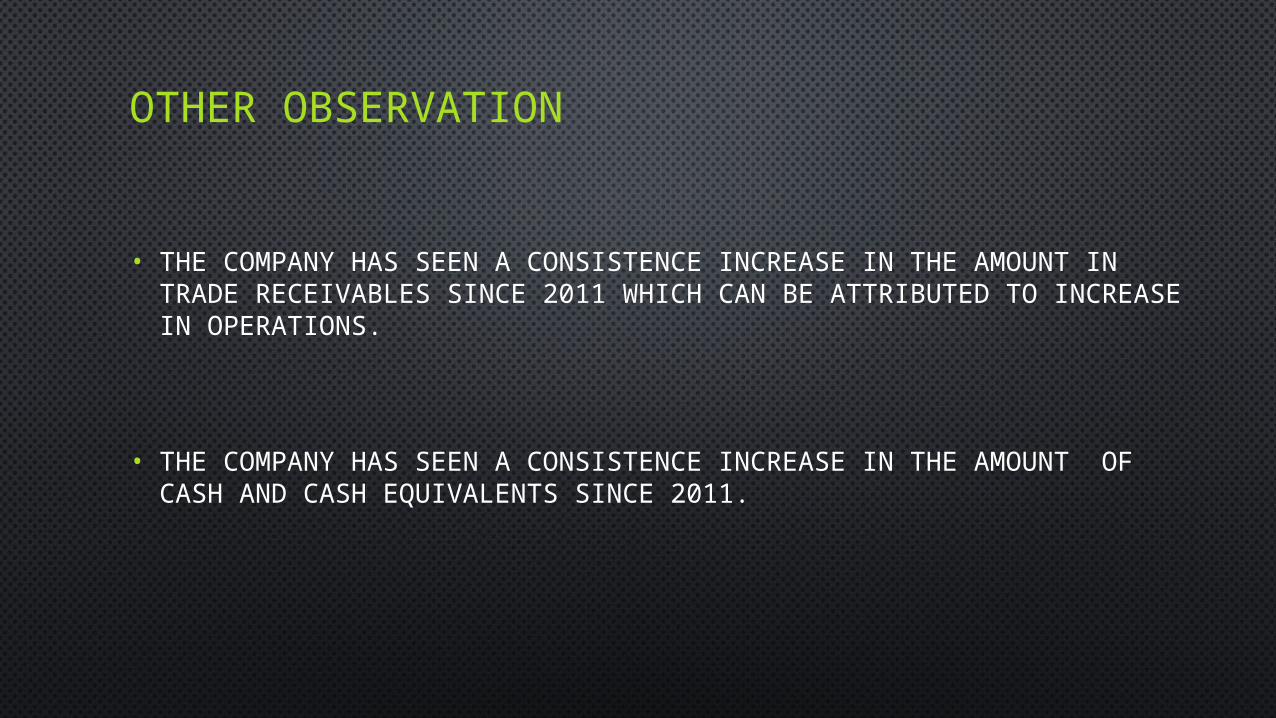
OTHER OBSERVATION
• THE COMPANY HAS SEEN A CONSISTENCE INCREASE IN THE AMOUNT IN TRADE RECEIVABLES SINCE 2011 WHICH CAN BE ATTRIBUTED TO INCREASE IN OPERATIONS.
• THE COMPANY HAS SEEN A CONSISTENCE INCREASE IN THE AMOUNT OF CASH AND CASH EQUIVALENTS SINCE 2011.

TRADE RECEIVABLES
Mar 2011 Mar 2012 Mar 2013 Mar 2014 Mar 2015Value(INR) 15,378,613 22,625,482 30,338,055 33,165,209 39,803,967
Trade Receiv-ables
05,000,000
10,000,00015,000,00020,000,00025,000,00030,000,00035,000,00040,000,00045,000,000
Mar-11Mar-12Mar-13Mar-14Mar-15

CASH AND CASH EQUIVALENTSMar 2011 Mar 2012 Mar 2013 Mar 2014 Mar 2015
Value (INR) 548,595,788 528,189,170 568,524,459 594,588,000 644,764,523
Cash and cash
equival-ent
0100,000,000200,000,000300,000,000400,000,000500,000,000600,000,000700,000,000
Mar-11Mar-12Mar-13Mar-14Mar-15

FINANCIAL ANALYSISBASED ON
RATIOS

BALANCE SHEET ANALYSIS
2015 2014 2013 2012 20110100,000,000200,000,000300,000,000400,000,000500,000,000600,000,000700,000,000800,000,000
Asset – Liabilities Comparison
Axis Title
The high value of Current asset implies that company has enough reserves to pay it’s liabilities.

CURRENT RATIO
2015 2014 2013 2012 20116.40
6.60
6.80
7.00
7.20
7.40
7.60
7.80
8.00
Current Ratio
Axis Title
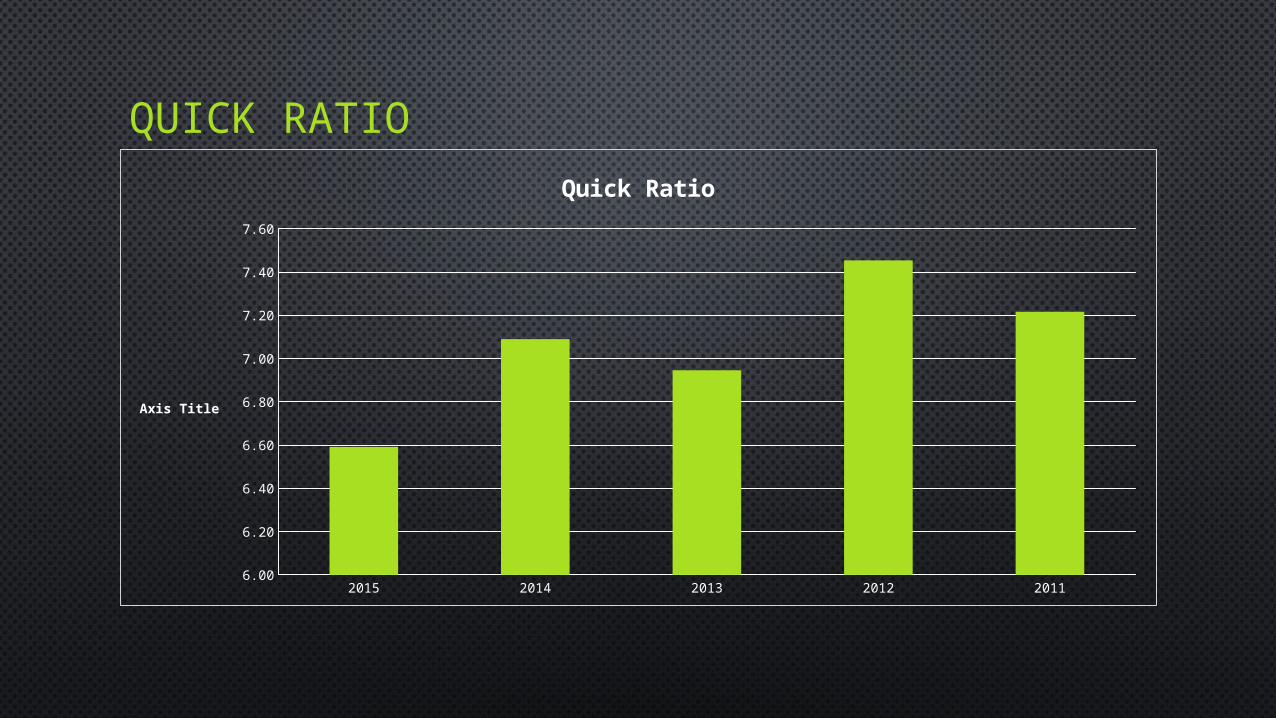
QUICK RATIO
2015 2014 2013 2012 20116.00
6.20
6.40
6.60
6.80
7.00
7.20
7.40
7.60
Quick Ratio
Axis Title

TOTAL DEBT EQUITY RATIO
2015 2014 2013 2012 20110.00
0.05
0.10
0.15
0.20
0.25
0.30
0.35
0.40
Total Debt Equity Ratio
Axis Title
Company’s debt has increased with time which can be termed as risky

INTEREST COVERAGE RATIO
2015 2014 2013 2012 2011 -
50.00
100.00
150.00
200.00
250.00
Interest Coverage Ratio
Axis Title

INVENTORY TURNOVER RATIO
2015 2014 2013 2012 2011 -
2.00
4.00
6.00
8.00
10.00
12.00
14.00
16.00
18.00
20.00
Inventory Turnover Ratio
Axis Title
After a dip in sales in the year 2012 the company has constantly increased it’s sales which has reduced their holding inventory

RETURN ON EQUITY
2015 2014 2013 2012 20110
2
4
6
8
10
12
14
16
ROE
Axis Title
Company’s high return on equity indicates that the company is on the growth stage during last one year

P/E RATIO
2015 2014 2013 2012 20110.00
2.00
4.00
6.00
8.00
10.00
12.00
14.00
16.00
18.00
P/E Ratio
Axis Title
Company’s fluctuating P/e ratio shows the investors willingness to invest which has increased in the past 1 year.


THANK YOU