Ultrasonic Consolidation (Ultrasonic Additive Manufacturing)

FINANCIAL ANALYSIS OF A PARTIAL MANUFACTURING
PLANT CONSOLIDATION
by
Rodney B. Swan
A Research Paper
Submitted in Partial Fulfillment of the Requirements for the
Master of Science Degree in Management Technology
Approved for Completion of 3 Semester Credits INMGT-735 Field Problem
___________________________ William J. Kryshak Research Advisor
The Graduate School University of Wisconsin-Stout
May, 2002
2
The Graduate School University of Wisconsin-Stout
Menomonie, WI 54751
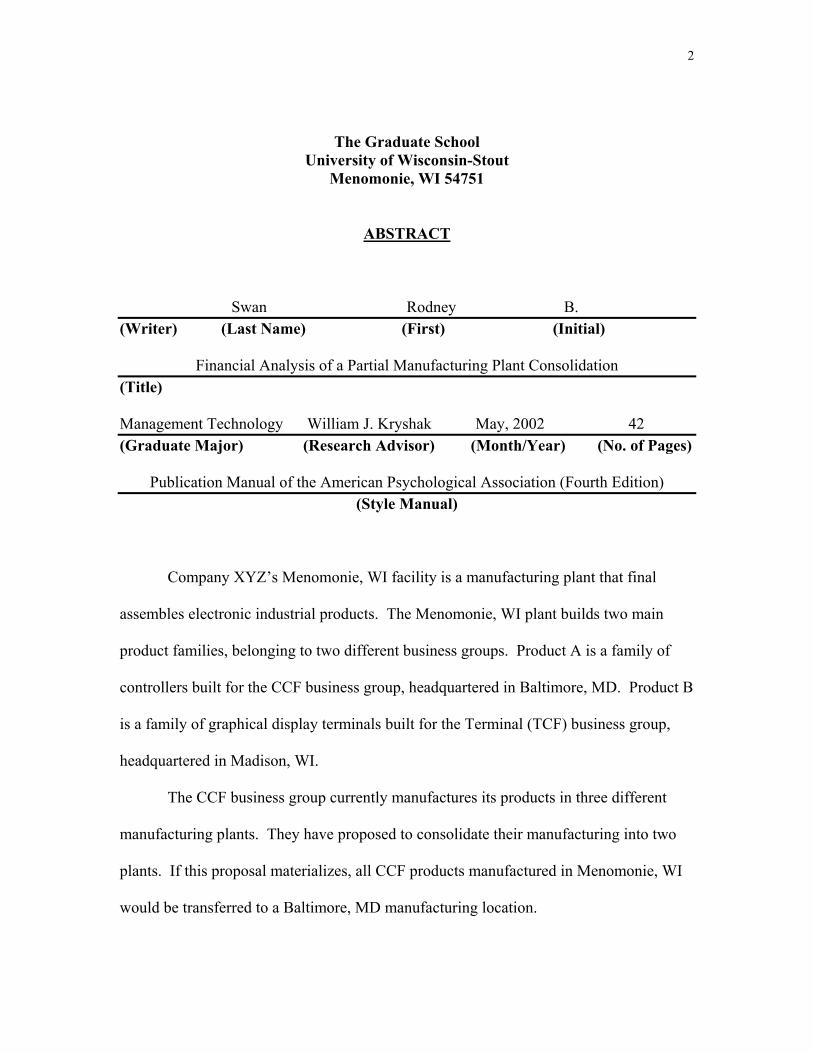
ABSTRACT
Swan Rodney B. (Writer) (Last Name) (First) (Initial)
Financial Analysis of a Partial Manufacturing Plant Consolidation (Title)
Management Technology William J. Kryshak May, 2002 42 (Graduate Major) (Research Advisor) (Month/Year) (No. of Pages)
Publication Manual of the American Psychological Association (Fourth Edition) (Style Manual)
Company XYZ’s Menomonie, WI facility is a manufacturing plant that final
assembles electronic industrial products. The Menomonie, WI plant builds two main
product families, belonging to two different business groups. Product A is a family of
controllers built for the CCF business group, headquartered in Baltimore, MD. Product B
is a family of graphical display terminals built for the Terminal (TCF) business group,
headquartered in Madison, WI.
The CCF business group currently manufactures its products in three different
manufacturing plants. They have proposed to consolidate their manufacturing into two
plants. If this proposal materializes, all CCF products manufactured in Menomonie, WI
would be transferred to a Baltimore, MD manufacturing location.

3
This research paper will analyze the financial impact to the remaining TCF
product families if the CCF business transfers their products out of the Menomonie
facility. This research was conducted by reviewing relevant literature regarding
manufacturing costing systems, followed by a thorough analysis of Company XYZ
financial data to determine the resulting financial impact of the proposed consolidation,
to the Menomonie, WI facility.

4
Acknowledgements
I respectfully acknowledge and am very grateful to my research advisor William
J. Kryshak and H. Steven Cole, both from the Department of Business, for their guidance
and support throughout this research paper.
I am also very grateful to Company XYZ, and in particular my manager for once
again, providing me the opportunity to further my education.
Above all others, I am most thankful for the support I’ve received from my wife
Cheryl and two children, Ryan and Megan. None of this would be possible without the
encouragement, understanding and sacrifices they have made for me over the past two
years.
5
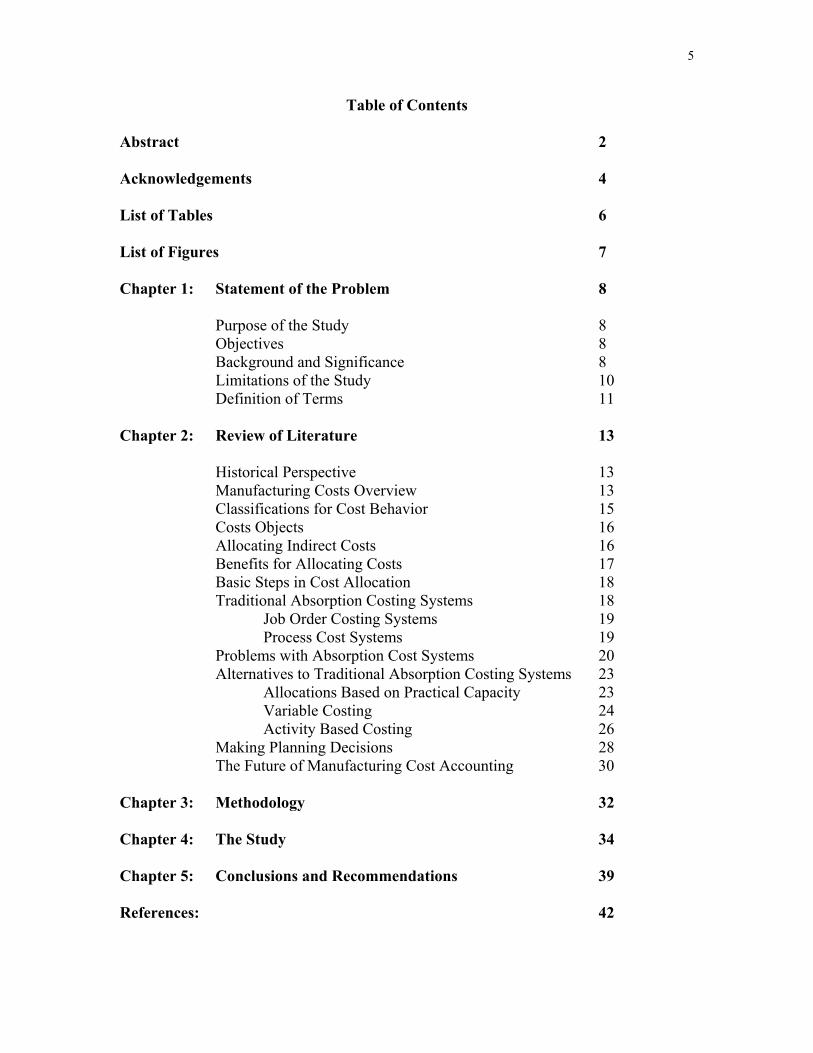
Table of Contents
Abstract 2
Acknowledgements 4
List of Tables 6
List of Figures 7
Chapter 1: Statement of the Problem 8
Purpose of the Study 8 Objectives 8 Background and Significance 8
Limitations of the Study 10 Definition of Terms 11
Chapter 2: Review of Literature 13
Historical Perspective 13 Manufacturing Costs Overview 13 Classifications for Cost Behavior 15 Costs Objects 16 Allocating Indirect Costs 16 Benefits for Allocating Costs 17 Basic Steps in Cost Allocation 18 Traditional Absorption Costing Systems 18 Job Order Costing Systems 19 Process Cost Systems 19 Problems with Absorption Cost Systems 20 Alternatives to Traditional Absorption Costing Systems 23 Allocations Based on Practical Capacity 23 Variable Costing 24 Activity Based Costing 26 Making Planning Decisions 28 The Future of Manufacturing Cost Accounting 30
Chapter 3: Methodology 32
Chapter 4: The Study 34
Chapter 5: Conclusions and Recommendations 39
References: 42
6
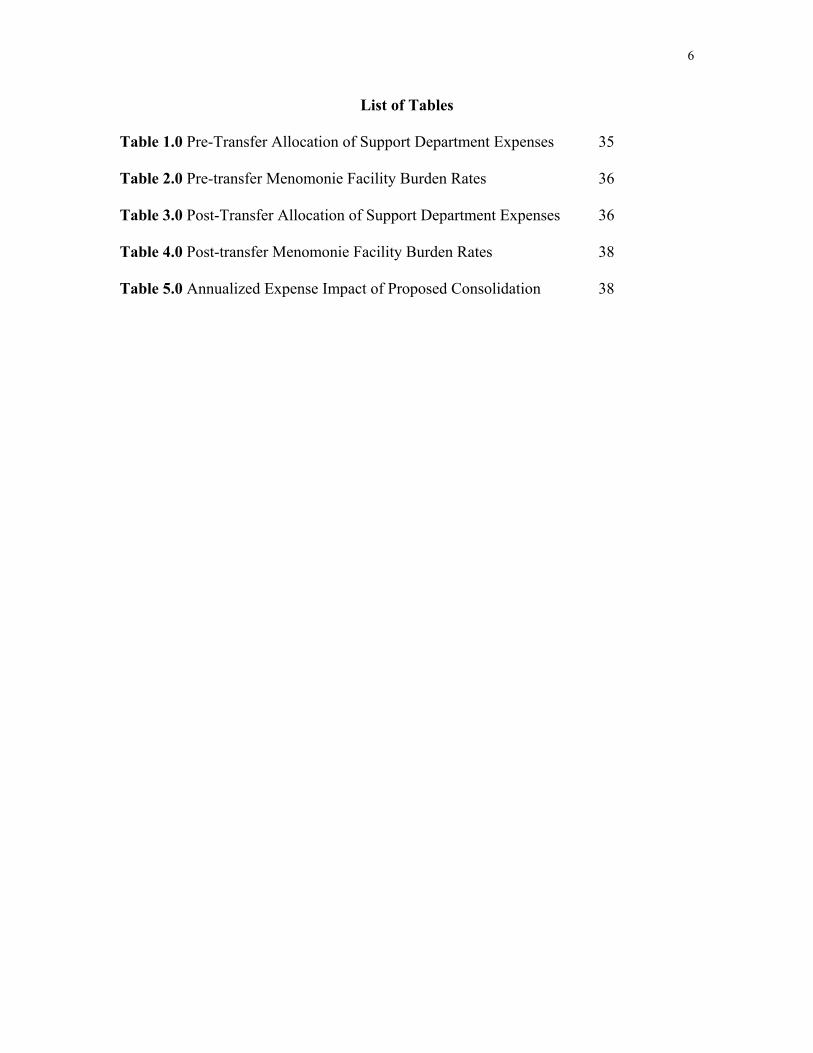
List of Tables
Table 1.0 Pre-Transfer Allocation of Support Department Expenses 35
Table 2.0 Pre-transfer Menomonie Facility Burden Rates 36
Table 3.0 Post-Transfer Allocation of Support Department Expenses 36
Table 4.0 Post-transfer Menomonie Facility Burden Rates 38
Table 5.0 Annualized Expense Impact of Proposed Consolidation 38
7
List of Figures
Figure 1.0 Menomonie Facility Expense Department Structure 34

8
Chapter 1
Statement of the Problem
Purpose of the Study
The purpose of this study is to determine the financial impact of a partial plant
consolidation involving Company XYZ’s Menomonie, WI facility. Although there are
many aspects to be considered when intra-company transfers of manufacturing lines are
proposed, this study will focus on the post-transfer financial impact to the remaining
products manufactured in the Menomonie, WI facility.
Objectives
The goals of the study are as follows:
1.0 Analyze the current financial structure of the Menomonie, WI
facility to determine the post-transfer burden rates of the remaining
products.
2.0 Provide recommendations to minimize any financial adverse
effects on the remaining products manufactured in the Menomonie,
WI facility.
Background and Significance
Company XYZ’s Menomonie, WI facility is part of a large company consisting of
450 global manufacturing, customer support, and sales locations. There are multiple
business groups within the company that support several industrial product families. The
Menomonie, WI facility manufactures product for two different business groups, the
Terminal (TCF) business and the Controller (CCF) business.

9
The TCF business group is headquartered in Madison, WI. All TCF Engineering,
Marketing, Purchasing and Finance support is located in Madison. The Menomonie, WI
plant is the only manufacturing location for TCF products.
The CCF business group is headquartered in Baltimore, MD. All CCF
Engineering, Marketing, Purchasing and Finance support is located in Baltimore. The
Menomonie, WI plant is one of three manufacturing locations for CCF products.
The Menomonie, WI facility opened in 1994 to house the manufacturing of a
family of small controllers belonging to the CCF business. In 1996, the TCF business
was in need of a manufacturing facility to produce its new family of terminals, as well as
several of its legacy terminal products. At that time, the plant reported to the TCF
business. In 1997 the TCF business expanded the Menomonie facility from 40,000
square feet to its current size of 80,000 square feet, to accommodate the new TCF
products.
In 1999, a company-wide reorganization transferred responsibility of the
Menomonie, WI facility from the TCF business to the CCF business. With this
reorganization, the only change the Menomonie, WI facility saw was their reporting
relationship to a different business.
The CCF business has two other manufacturing locations, one located in
Maryland and one in Alabama. Since the reorganization that aligned the Menomonie, WI
facility under the CCF business, the utilization of the original two CCF business
manufacturing plants has decreased, resulting in extra capacity in both plants. Because
the Alabama plant currently builds circuit boards for the CCF family of products

10
assembled in the Menomonie, WI facility, the CCF business has proposed consolidating
the entire production of small controllers into the Alabama facility.
The proposed consolidation would have profound effects on the Menomonie, WI
facility. Although the CCF business products only consume about 20% of the floorspace
in the Menomonie, WI facility, the CCF business products employ about 50% of the
workforce and generate about 40% of the Menomonie, WI facility’s revenue.
Limitations of the Study
The proposed partial consolidation of the Menomonie, WI facility’s CCF products
into the Alabama facility involves a significant number of issues that will not be
addressed in this study. These issues include a wide variety of human resource concerns
and costs, including a reduction in the work force and severance costs. In addition to
human resources, this study will not address the costs of the transfer, including both
physical move expenses as well as labor expenses related to training, engineering, and
administrative support for the transfer.
This study will not draw any conclusions about the overall cost justification of the
transfer. It will however provide a detailed analysis and picture of the resulting financial
impact to the remaining TCF products, if the CCF business transfers its products out of
the Menomonie, WI facility.

11
Definition of Terms
Absorption Costing: A costing approach in which all manufacturing costs are charged to
the product.
Activity Based Costing: (i.e. ABC) an overhead cost allocation system that allocates
overhead to multiple activity cost pools and assigns the activity cost pools to products or
services by means of cost drivers that represent the activities used.
Allocation Base: A characteristic of the cost object used to distribute indirect costs.
Cost Allocations: The distribution of indirect costs among cost objects.
Cost Behavior: The study of how specific costs respond to changes in the level of
activity within a company.
Cost Benefit Analysis: The process of making decisions by comparing the costs and
benefits of alternative choices.
Cost Driver: Any factor or activity that has a direct cause-effect relationship with the
resources consumed.
Cost Object: An item to be costed for decision-making purposes.
Direct Cost: Costs that can be directly traced to a single cost object.
Direct Labor: The work of factory employees that can be physically and conveniently
associated with converting raw materials into finished goods.
Direct Materials: Raw materials that can be physically and conveniently associated with
manufacturing the finished product.
Fixed Cost: Costs that remain the same in total regardless of changes in the activity
level.
Indirect Cost: Costs that are associated with more than one cost object.
12
Indirect Labor: Work of factory employees that has no physical association with the
finished product, or it is impractical to trace the costs to the goods produced.
Indirect Materials: Raw materials that do not physically become part of the finished
product or cannot be traced because their physical association with the finished product is
too small.
Job Order Cost System: A cost accounting system in which costs are assigned to each
job or batch.
Manufacturing Overhead: Manufacturing costs that are indirectly associated with the
manufacture of the finished product.
Opportunity Cost: The potential benefit that may be obtained from following an
alternative course of action.
Partial Absorption Costing System: A costing approach in which all variable overhead
is allocated to products, but only the fixed cost of overhead resources used are allocated
to products.
Practical Capacity: The highest rate at which an organization can operate without a rise
in congestion.
Process Cost System: A system of accounting used by companies that manufacture
relatively homogeneous products through a series of continuous processes or operations.
Variable Cost: Costs that vary in total directly and proportionately with changes in the
activity level.
Variable Costing System: A costing approach in which only variable manufacturing
costs are product costs and fixed manufacturing costs are period costs (expenses).
13
Chapter 2
Review of Literature
Historical Perspective
Procedures and rules for manufacturing cost accounting have grown in
significance since the Industrial Revolution, when manufacturing became a key economic
activity. This growth has resulted in managers becoming more and more distant from
shop-floor activities. According to Riggs (1994), it was during this time that managers
began to “question things like what does a product cost, how efficient is a section of the
manufacturing department, should a product be redesigned, or phased out, or promoted
more aggressively than a related product.”
Most of today’s standard cost accounting procedures were developed prior to
1925. According to Riggs (1994), “these procedures are built around three product
expenses: direct material, direct labor, and overhead.” During that time period, overhead
was low when compared to direct labor and material, resulting in product costs that were
dominantly variable. Because of that, cost accounting procedures that were developed
then provided relatively useful information to managers.
Riggs (1994) states that since that time period, manufacturing has changed a great
deal, but unfortunately not much has changed regarding cost accounting procedures.
Although it has become progressively less satisfactory, industry standard still defines
product expenses by using direct material, direct labor, and overhead.
Manufacturing Costs Overview

14
Manufacturing is a process that converts raw materials into finished goods.
According to Weygandt, Kieso, and Kimmel (1999) “manufacturing costs are typically
classified as either direct materials, direct labor, or manufacturing overhead.”
Manufacturing processes use basic materials and parts that are referred to as raw
materials. If these raw materials become physically associated with the finished product
during the manufacturing process, they are called direct materials. If these raw materials
do not become physically associated with the finished product, they are considered
indirect materials. “Indirect materials (1) do not physically become part of the finished
product, such as lubricants, rosin, and polishing compounds used in the manufacturing
process, or (2) cannot be traced because their physical association with the finished
product is too small in terms of cost, such as cotter pins, lock washers, and the like”
(Weygandt et al., 1999). Indirect materials are accounted for as manufacturing overhead.
Direct labor refers to those labor costs that directly result from the conversion of
raw materials into finished goods. According to Garrison & Noreen (2000) “direct labor
is sometimes called touch labor, since direct labor workers typically touch the product
while it is being made.” Labor costs that do not result from the creation of products, or
can only be traced at great cost and inconvenience, are called indirect labor, and are
handled as manufacturing overhead, just like indirect materials.
Manufacturing overhead consists of manufacturing costs that are not direct
materials or direct labor, but are costs indirectly associated with the manufacture of
finished product. Weygandt et al. (1999) state “manufacturing overhead includes indirect
materials, indirect labor, maintenance on production equipment, utilities, taxes,
depreciation, and insurance on manufacturing facilities.” Costs associated with its selling
15
and administrative functions are not included as part of manufacturing overhead.
According to Garrison & Noreen (2000) “only those costs associated with operating the
factory are included in manufacturing overhead.” Terms that are synonymous with
manufacturing overhead include indirect manufacturing cost, factory overhead, and
factory burden.
Classifications for Cost Behavior
Cost behavior refers to how a cost will change when the level of business activity
also changes. Garrison & Noreen (2000) state “as the activity level rises and falls, a
particular cost may rise and fall as well, or it may remain constant.” Understanding cost
behaviors help management anticipate cost changes and make more informed decisions.
Costs are usually categorized as either variable or fixed.
According to Garrison & Noreen (2000) “a variable cost is a cost that varies, in
total, in direct proportion to changes in the level of activity. For example, if the level of
activity increases 10%, total variable costs will increase 10%. In a manufacturing
company, the best examples of variable costs include direct materials and direct labor.
Weygandt et al. (1999) state “variable cost may also be defined as a cost that remains the
same per unit at every level of activity.” Labor intensive companies are likely to have
many variable costs. Machinery or equipment intensive companies are likely to have
relatively few variable costs.
According to Weygandt et al. (1999), “fixed costs are costs that remain the same
in total regardless of changes in the activity level.” In a manufacturing company, the best
examples of fixed costs include property taxes, insurance, rent, supervisory salaries, and
depreciation on buildings and equipment. Because fixed costs remain constant, unit costs
16
will increase as unit volumes decrease, due to the fixed costs being spread over fewer
units. Weygandt et al. (1999) states “the trend in many manufacturing companies is to
have more fixed costs and fewer variable costs.” This seems to be a result of the
increased use of automation and less use of employees. Less employees usually result in
increased fixed costs (depreciation and lease charges) and lower variable costs (direct
labor costs).
Cost Objects
According to Garrison & Noreen (2000), “a cost object is anything for which cost
data are desired, including products, product lines, customers, jobs, and organizational
sub units.” To assign costs to cost objects, costs are classified as either direct or indirect
costs. Direct costs and be easily associated with a particular cost object, and is not limited
to direct materials or direct labor. Indirect costs cannot be easily associated with a
particular cost object. Garrison & Noreen (2000) state “to be traced to a cost object such
as a particular product, the cost must be caused by the cost object.”
Allocating Indirect Costs
Cost allocation is a method of assigning indirect costs to cost objects (Morse and
Zimmerman, 1997). Indirect costs are related back to cost objects through cost drivers,
which are chosen to reflect the cause of the indirect costs.
Choosing cost drivers to trace indirect costs is usually only appropriate if the cost
driver is chosen to help make planning decisions related to the cost driver. According to
Morse & Zimmerman (1997), “allocating indirect costs through cost drivers is not
necessarily best for the organization when control and external reporting issues are
considered.” Choosing a cost allocation method is subjective, and involves ethical

17
considerations. One attribute of cost allocations used for control purposes is that they can
adversely affect certain managers and benefit others. Additionally, cost allocation
methods may be advantageous when used for external reporting, as they may result in the
advantage of more profit for the organization, or they may result in a disadvantage of
external parties such as customers or the taxing authority.
Benefits for Allocating Costs
According to Morse & Zimmerman (1997) there are three categories of benefits
for allocating costs. These benefits include the satisfaction of external requirements,
planning purposes, and control purposes.
Many times, management accounting decisions related to allocations are based on
external demand for information. This external demand often comes from outside parties
such as shareholders or governmental bodies. Allocated indirect costs play a critical role
in each of these situations.
Managers are able to make better decisions through the analysis of indirect cost
allocations. This information is key for planning purposes. According to Morse &
Zimmerman (1997), “the allocation of indirect costs provides a better measure of the
opportunity cost of providing a product or service, and also serves as a communication
mechanism to let managers know how their actions are affecting costs in the rest of the
organization.”
Morse & Zimmerman state that “motivation and control are also likely
explanations for the prevalence of cost allocations within organizations.” Sometimes,
cost allocations have the ability to control managers through the effect of cost allocations
on performance measures. Cost allocations also allow managers to monitor each other.

18
This will typically affect the managers’ behavior, which is how the choice of allocation
method becomes a tool for controlling managers.
Basic Steps in Cost Allocation
According to Morse & Zimmerman (1997), all indirect cost allocation methods
are composed of the same series of five steps:
The first step involves defining the cost objects. The organization must
decide what departments, products, customers, suppliers, or processes
should receive the indirect costs. Step two involves accumulating indirect
costs in cost pools. Cost pools accumulate indirect costs that are caused
by the common use of a resource such as a machine, building,
administrative service, or a department. The third step involves choosing
an allocation base. An allocation base is a measurement of a characteristic
used to distribute indirect costs of a cost pool to cost objects. The fourth
step involves estimating an application rate. The application rate is
typically the ratio of estimated dollars in the cost pool to estimated total
usage of the allocation base. The final step involves allocating indirect
costs based on use of the allocation base. Once the application rate for the
allocation base is estimated, indirect costs are allocated to the cost objects
as the cost objects use the allocation base (Morse and Zimmerman, 1997).
Traditional Absorption Costing Systems
Absorption costing is a widely used allocation system involving the allocation of
variable and fixed overhead costs to cost objects, which are the products. In most
manufacturing facilities, all manufacturing fixed and variable overhead is usually

19
allocated to the products built in that particular facility. Financial reporting and the
determination of inventory valuation are typical uses for absorption cost systems. The
two basic types of absorption systems are job order systems and process cost systems
(Morse & Zimmerman, 1997).
Job Order Costing Systems
Job order costing systems are most effective when many different products are
produced each period. Jobs are completed to fill a specific customer order or to replenish
inventory, and each job order typically has its own distinguishing characteristics.
According to Weygandt et al., the main objective of a job order costing system is to
compute the cost per job. The job and its associated costs are identified at each point in
the manufacturing process, and the job order costing system measures costs for each
completed job, as opposed to set time periods.
Process Cost Systems
According to Weygandt et al., “process cost systems are used when a series of
connected manufacturing processes or departments produce a large volume of uniform or
relatively homogeneous products.” With process costing, costs are assigned to products
are identical because the flow through a series of similar manufacturing steps or
processes. In order to maintain control, these processes are usually organized into
separate cost centers.
Costs are associated with the same product for costing purposes. Weygandt et al.
(1999) state “the cost allocation is not among different products but among units still in
work-in-process inventory and units transferred out of the plant to finished goods
inventory or cost of goods sold.”
20
When comparing process costing to job order costing, process order costing is
inherently simpler and less costly to maintain because job order costing has to account for
separate batches. Conversely, the information provided is much less useful for decision
making because it is in an aggregate form (Morse & Zimmerman, 1997).
Process costing becomes more difficult when accounting for work-in-process
(Morse & Zimmerman, 1997). The department’s output must be determined in
equivalent units, to compute the costs in a department. According to Garrison & Noreen
(2000) when using “the weighted average method, the equivalent units for a period are
the sum of the units transferred out of the department during the period and the
equivalent units in ending work in process inventory at the end of the period.”
A production report is the typical method to summarize activity in a process
costing department. According to Garrison & Noreen (2000), there are three separate
(though highly interrelated) parts to a production report.
The first part is a quantity schedule, which includes a computation of
equivalent units and shows the flow of units thorough a department during
a period. The second part consists of a computation of costs per
equivalent unit, with unit costs being provided individually for materials,
labor, and overhead as well as in total for the period. The third part
consists of a cost reconciliation, which summarizes all cost flows through
a department for a period (Garrison, and Noreen, 2000).
Problems with Absorption Cost Systems
According to Morse & Zimmerman (1997), absorption cost systems have always
been criticized for producing misleading information and creating incentives that are
21
inconsistent with the objectives of the company. Despite these criticisms, Morse &
Zimmerman report that absorption cost systems are still the predominant systems in use
in manufacturing firms today.
Incentive to Overproduce
The average product cost in an absorption based costing system is determined by
dividing the variable and fixed costs of making a product by the number of units
produced. Morse & Zimmerman (1997) state that the “average cost exhibits some
strange qualities that are not necessarily consistent with the opportunity costs of making
the product.” The reason for this is because as long as the variable cost is constant, the
average cost per unit decreased, because the fixed costs are spread over more units.
According to Morse & Zimmerman (1997) managers who are evaluated based on
the average cost per unit produced, have an easy way of reducing the average cost per
unit using this type of costing system. The answer is to increase the number of units
produced, provided there are no capacity constraints. As long as the extra product can be
sold, this is not necessarily a bad thing. Unfortunately, that is not always the case, and
excess inventory can lead to increased storage and handling costs.
According to Morse & Zimmerman (1997), there are several ways to mitigate this
incentive to overproduce. This can be accomplished by charging managers large
amounts for holding inventory. This “tax” is usually enough incentive to reduce or
eliminate the desire to overproduce. A second method to avoid overproduction is by
defining a policy that prohibits such actions. Still another approach is to redefine the
performance measures that evaluate managers, or to adopt just-in-time production
systems (JIT) to help reduce inventory levels.

22
Underuse of Allocation Base Used to Allocate Fixed Costs
In absorption costing systems, fixed and variable overhead costs are allocated to
products through an allocation base. The allocation of overhead costs acts like a tax on
the allocation base. According to Morse & Zimmerman (1997), “managers who are
evaluated based on product costs will use less of the allocation base because allocated
costs increase product costs and act as a tax on the manager.”
Morse & Zimmerman (1997) state “cost allocations lead to good planning
decisions if the allocated cost approximate the opportunity costs of using the allocation
base.” This is based on the idea that fixed cost allocations to products through the usage
of allocation bases are unlikely to approximate the opportunity costs of using indirect
resources.
Misleading Product Costs
According to Morse & Zimmerman (1997):
If the allocation of fixed costs does not represent the opportunity costs of
using the allocation base, product costs calculated by the absorption
costing system will not approximate the opportunity cost of making the
products. If product costs from the accounting system do not represent
opportunity costs, managers using those reported product costs are likely
to misprice products and choose inappropriate product mixes.
Morse & Zimmerman (1997) define the death spiral as a common example of
misusing product costs from full absorption cost systems. The death spiral occurs when a
company drops products because its cost is greater than its price. When this happens,
fixed overhead that was previously allocated to the dropped product is redistributed to the

23
remaining products. This leads to other products appearing to be unprofitable because of
the increased overhead is spread over fewer units. Inevitably, more products are dropped,
resulting in more overhead being allocated to the remaining products. This cycle could
theoretically continue until the organization has no profitable products left.
Alternatives to Traditional Absorption Costing Systems
Due to the many criticisms of absorption costing systems, alternative costing
methods have been suggested and are becoming increasingly popular. These systems
have been developed to overcome specific problems in making planning and control
decisions. Three of these alternatives to the traditional costing systems are allocating
overhead based on practical capacity, variable costing, and activity-based costing.
Allocating Overhead Based on Practical Capacity
One alternative to a full absorption costing system is a partial absorption costing
system. According to Morse & Zimmerman (1997), “under this system, all variable
overhead is allocated to products, but only the fixed cost of overhead resources used are
allocated to products.” In this type of costing system, fixed costs related to unused
overhead resources (excess capacity) are expensed during that period instead of
becoming part of the product cost through allocations. The formula used to calculate the
application rate for allocations of overhead based on capacity used to divide the expected
fixed overhead costs by the practical capacity of the allocation base. Morse &
Zimmerman state “the practical capacity is the maximum level of operations that can be
achieved without increasing costs due to congestion.”
There are several advantages in using the practical capacity of the allocation base
to determine the application rate. The product costs generated from this practical

24
capacity system are much closer to the opportunity cost than the traditional system, since
the cost of excess capacity is not spread over the existing projects which are usually not
part of the product. Fixed costs will not change with changes in production volumes,
therefore decisions about keeping or dropping products would not change the existing
product costs. According to Morse & Zimmerman (1997) yet another advantage is this
system provides a measure of the cost of unused capacity as opposed to the traditional
absorption costing system, in which the cost of unused capacity is included in the product
cost and not easily identified.
There are some disadvantages to allocating costs using the practical capacity
model. According to Morse & Zimmerman (1997), the practical capacity system does
not alleviate the incentive to overproduce. When only some fixed costs are allocated,
managers will also tend to underuse the allocation base. Once operations have started,
the usage of the allocation base is usually taxed at a higher rate that the opportunity cost
of using the overhead resource. If these allocation rates that are higher than the
opportunity cost of using the indirect resource, managers will tend to use the indirect
resource less than they would if the opportunity cost of using the indirect resource were
allocated.
Variable Costing
Variable costing assigns only variable manufacturing costs such as direct
materials, direct labor, and variable overhead to the cost of the product. Fixed overhead
is excluded from the product cost because it is treated as a period cost, not a product cost.
According to Hansen (1990) “all the fixed overhead of a period is seen as expiring that
period and is charged in total against the revenues of the period.”
25
Hansen (1990) states “because of the different ways of treating fixed overhead,
variable costing methods generate differences in reported incomes.” When production is
greater than sales, income appears to be greater with absorption costing because the
amount of fixed overhead attached to the units flowing into inventory. When sales
exceed production, variable costing income appears to be greater than absorption costing
income by the amount of fixed overhead flowing out of inventory. When sales and
production are equal, both methods generate the same reported income.
Even though variable costing cannot be used for external reporting, it has a
number of benefits for internal managerial applications. According to Hansen (1990),
“performance evaluation, segment reporting, and planning and control are all enhanced
by the cost information produced by a variable costing system.” This implies that both
variable and absorption costing methods should be used at the same time within a
company. More than one type of cost system is typically necessary because cost
management may have different requirements than financial reporting.
The rationale for variable costing centers on the conceptual idea that these costs
are incurred whether a company operates at zero or 100% of capacity. Because of this,
proponents of variable costing argue that these costs should be expensed in the period in
which they are incurred (Weygandt et al., 1999).
Weygandt et al. (1999) state “supporters of absorption costing defend the
assignment of fixed manufacturing overhead costs to inventory on the basis that these
costs are as much a cost of getting a product ready for sale as direct materials or direct
labor.” Because of this, these costs should be matched with revenues when a product is
sold.
26
As mentioned above, variable costing is acceptable only for internal use by
management. According to Weygandt et al. (1999) “it cannot be used in determining
product costs in financial statements prepared in accordance with generally accepted
accounting principles because it understates inventory costs.” To get around this issue, a
company will typically use absorption costing for its work in process and finished goods
inventories, as well as for income tax purposes.
Activity Based Costing
According to Weygandt et al. (1999) “activity based costing (ABC) allocates
overhead to multiple activity cost pools and assigns the activity cost pools to products by
means of cost drivers.” An activity is any event, action, transaction, or work sequence
that causes a cost during the production of a product. A cost driver refers to any activity
that has a direct cause-effect relationship with the resources consumed.
ABC begins by allocating costs to activities, and then to the products that use
those activities. The theory behind ABC cost allocation is very straightforward, products
consume activities and activities in turn consume resources.
According to Weygandt et al. (1999), ABC allocates overhead in a two-stage
process:
In the first stage, overhead is allocated to activity cost pools, each of
which is a distinct type of activity, rather than to departments. In the
second stage, the overhead allocated to the activity cost pools is assigned
to products using cost drivers which represent and measure the number of
individual activities undertaken or performed to produce products or
render services.
27
Although there are several benefits to using ABC, the primary one is more
accurate product costing. ABC typically assigns overhead product costs to more cost
pools. Instead of one plant-wide pool and a single cost driver, ABC utilizes numerous
activity cost pools with more relevant cost drivers. According to Weygandt et al. (1999),
“costs are assigned more directly on a basis of the portion of multiple cost-driven
activities that can be traced to each product.” This allows ABC enhanced control over
overhead costs. Many overhead costs can be traced directly to activities, which result in
some indirect costs becoming direct costs. This forces managers to become more aware
of their responsibility to control the activities that generate those costs. ABC should also
leads to better decisions, through more accurate product costing. More accurate product
costing should in turn result in managers setting selling prices that achieve or surpass
desired product profitability levels. Finally, more accurate cost data should aid in
deciding whether to make or buy a product part or component.
Weygandt et al. (1999) state “activity based costing does not, in and of itself,
change the amount of overhead costs, but it does in certain circumstances allocate those
costs in a more accurate manner.” This ability for costing to become more realistic, more
accurate, and better understood, allows managers to better understand cost behavior and
resulting in increased profitability.
Even though ABC systems often provide better product cost data than traditional
systems, they have certain limitations. ABC can be an expensive costing system to
adopt. According to Weygandt et al. (1999), “many companies are discouraged from
using ABC by the higher cost of identifying multiple activities and applying numerous
cost drivers.” Another limitation involves the complexity of activity based costing
28
systems. Most ABC systems are more complex than traditional costing systems, and
some are significantly more complex. Not all companies can justify the ABC. For some
companies, the costs of ABC outweigh the benefits, and they find their existing system is
sufficient. Another major limitation of ABC is that some arbitrary allocations still
continue. According to Weygandt et al. (1999) “even though more overhead costs can be
assigned directly to products through multiple activity cost pools, certain overhead costs
remain to be allocated by means of some arbitrary volume-based cost driver such as labor
or machine hours.”
Making Planning Decisions
According to Morse & Zimmerman (1997), “one of the major roles of
management accounting is to provide information for making planning decisions.” The
goals of a company determine the criteria for making these decisions. The aspects of a
decision that will help the organization achieve its goals are called benefits. Benefits are
seldom achieved without a cost. The cost of a decision is determined by the amount of
organizational resources utilized to achieve a benefit.
Cost/Benefit Analysis
According to Morse & Zimmerman (1997) “cost/benefit analysis is the process of
analyzing alternative decisions to determine which decision has the greatest expected
benefit relative to its costs.” In order to make a decision, a company must evaluate all
choices and choose the alternative with the greatest net benefits. Even though sometimes
the benefits and costs are not always easily identified and measured, managers should use
cost/benefit analysis to make organizational decisions.

29
One method to simplify the analysis is to compare only those costs and benefits
that are different among the alternative decisions. The difference in benefits is referred to
as the differential benefit and the difference in costs is referred to as the differential cost.
Comparing only the differential benefits and costs will lead to the same decision because
the remaining costs and benefits are not affected by the decision.
Problems in Identifying Benefits and Costs
The benefits related to a particular decision depend on the goals of the
organization. It is often hard to identify and measure the progress toward some goals.
Benefits are often measured in terms of cash inflows. Very often, the cash inflow from a
decision must be estimated, and cash flows from different time periods must be adjusted
for the time value of money before they are accumulated. Benefits such as learning and
training, improved working environment, and greater worker satisfaction are difficult to
identify and measure in terms of dollars, because they do not always have obvious
monetary implications. Most often, these benefits have monetary consequences in later
years. Morse & Zimmerman (1997) state “costs are the use of organizational resources.”
Costs are easy to identify and measure when cash is the resource being used, but
measuring the cost of using noncash resources is a problem. The best way to understand
these problems involve the concept of opportunity cost.
Opportunity Cost
According to Morse & Zimmerman (1997) “using the resources of an
organization, whether the resource is cash, inventory, buildings, or employee time, leads
to forgone opportunities.” A resource used for one purpose cannot be used for another
purpose. Because cost is defined as the use of resources, the measurement of costs is

30
based on the forgone opportunities of using those resources for other purposes. The
value of the forgone opportunity is the opportunity cost of using resources elsewhere.
The next best use of the resource should be identified and used to measure
opportunity cost. These forgone opportunities of using a resource include selling the
resource or using the resource for another project. According to Morse & Zimmerman
(1997):
If the next best use of the resource is to sell the resource, the sales price of
the resource is the opportunity cost of using the resource. If the use of the
resource means that further resources must be purchased for other
projects, the cost of replacing the resources is the opportunity cost. If the
next best use of the resource is for another project and replacement is not
feasible, then the loss in value to the organization of not being able to do
the other project is the opportunity cost.
The Future of Manufacturing Cost Accounting
According to Riggs (1994) “today’s typical cost accounting framework has
changed little from the framework developed during and following the Industrial
Revolution, even as large-scale manufacturing displaced owner-managed craft activities.”
In the past, direct labor and material dominated the costs of products. Typically, indirect
costs were substantially less significance. Today’s modern manufacturing incorporates
much greater automation. This has changed employee relations practices, and created
few deterministic expenses. This fact has substantially altered the mix of direct and
indirect expenses. Riggs (1994) states “as a result some of the preoccupation with
manufacturing costs to the exclusion of other categories of expenses is increasingly

31
inappropriate, as are certain of the traditional cost accounting procedures, particularly
those used to absorb overhead into individual products and services.”
32
Chapter 3
Research Methodology
The research methodology used for this field problem involved a literature
review, a financial analysis, and recommendations regarding the proposed partial plant
consolidation.
The goals of the study are to:
1.0 Analyze the current financial structure of the Menomonie, WI
facility to determine the post-transfer burden rates of the remaining
products.
2.0 Provide recommendations to minimize any financial adverse
effects on the remaining products manufactured in the Menomonie,
WI facility.
The methodology began with a literature review of manufacturing costing systems
and characteristics. The review focused on traditional absorption costing systems, and in
particular, process cost systems. The literature review also explored problems with
traditional absorption costing systems, followed by a review of alternatives to traditional
absorption costing systems. The last part of the literature review discussed the
relationship of cost accounting systems to making planning decisions.
Following the literature review, the study continued with a financial analysis of
Company XYZ’s Menomonie, WI facility. This analysis was based on the past six
months of actual expenses related to the Menomonie, WI facility. The analysis process
focused on determining what expenses were fixed, and would remain with the facility
after the CCF business was transferred out of the Menomonie, WI facility. This analysis
33
will provide a re-calculation of the burden rate of the remaining products manufactured in
the Menomonie, WI facility.
Finally, using the information obtained through the literature review and financial
analysis, recommendations will be provided to Company XYZ relative to minimizing the
financial impact of the consolidation, to the remaining products manufactured in the
Menomonie, WI facility.
34
Chapter 4
The Study
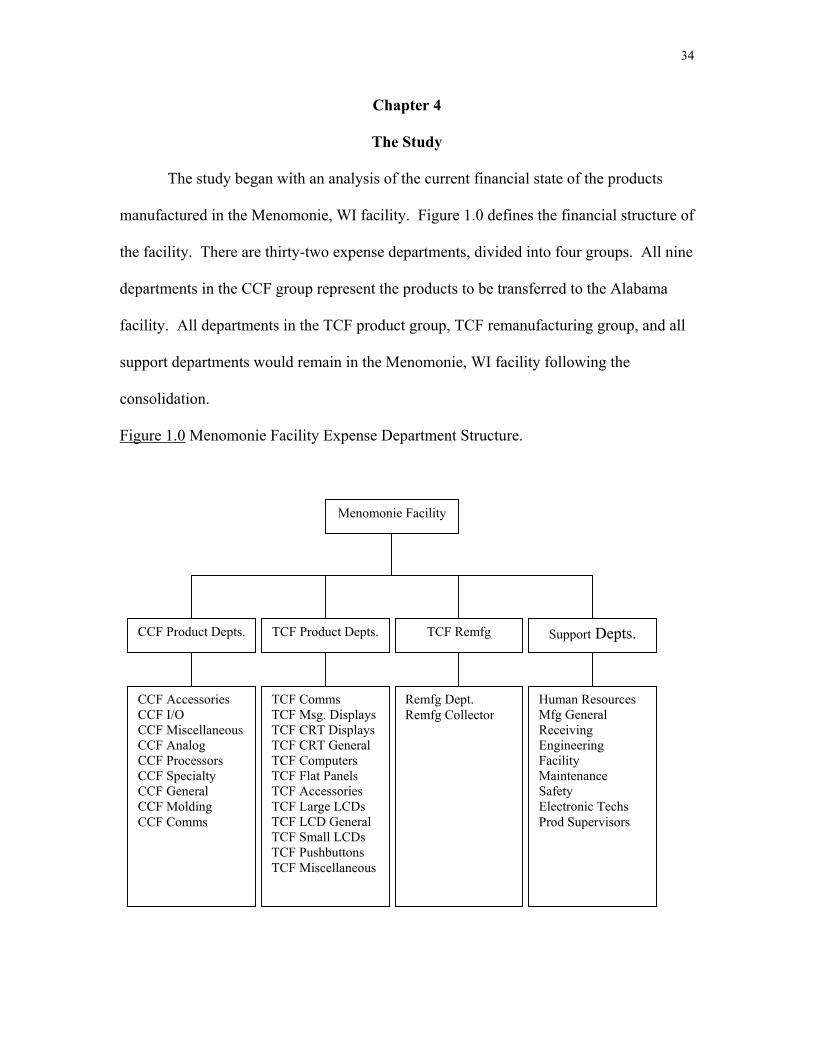
The study began with an analysis of the current financial state of the products
manufactured in the Menomonie, WI facility. Figure 1.0 defines the financial structure of
the facility. There are thirty-two expense departments, divided into four groups. All nine
departments in the CCF group represent the products to be transferred to the Alabama
facility. All departments in the TCF product group, TCF remanufacturing group, and all
support departments would remain in the Menomonie, WI facility following the
consolidation.
Figure 1.0 Menomonie Facility Expense Department Structure.
Menomonie Facility
CCF Product Depts. TCF Product Depts. TCF Remfg Support Depts.
CCF Accessories CCF I/O CCF Miscellaneous CCF Analog CCF Processors CCF Specialty CCF General CCF Molding CCF Comms
Human Resources Mfg General Receiving Engineering Facility Maintenance Safety Electronic Techs Prod Supervisors
Remfg Dept. Remfg Collector
TCF Comms TCF Msg. DisplaysTCF CRT DisplaysTCF CRT General TCF Computers TCF Flat Panels TCF Accessories TCF Large LCDs TCF LCD General TCF Small LCDs TCF Pushbuttons TCF Miscellaneous
35
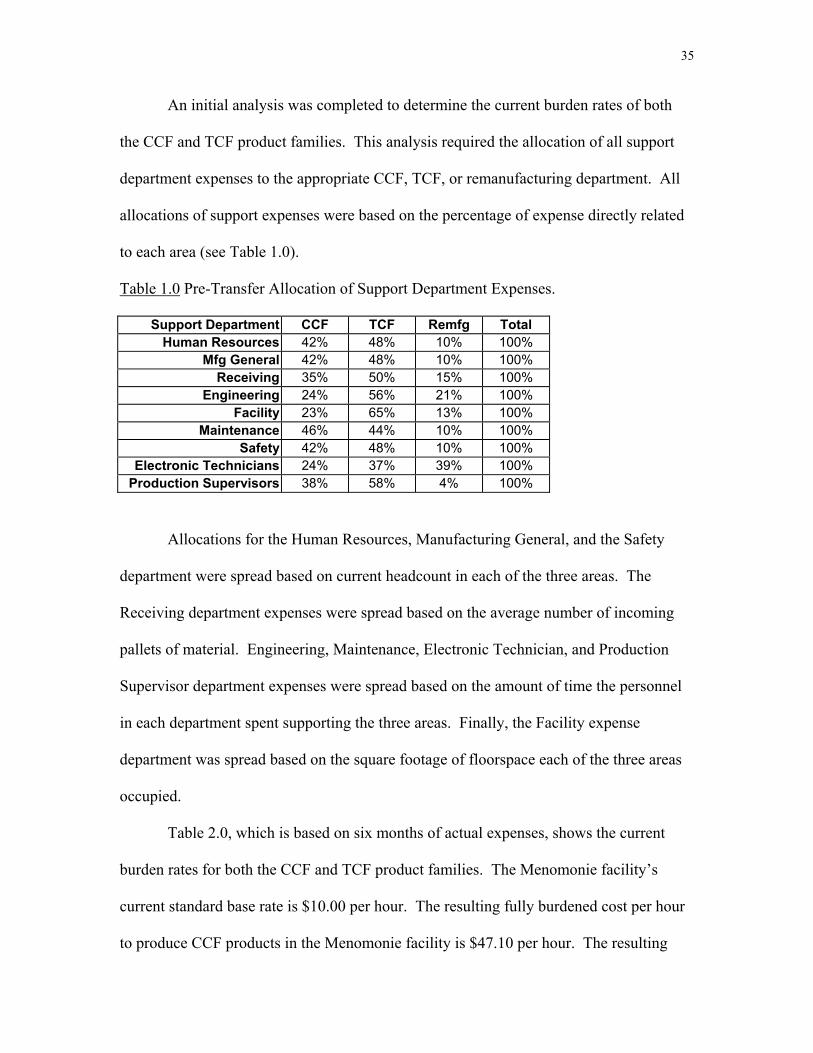
An initial analysis was completed to determine the current burden rates of both
the CCF and TCF product families. This analysis required the allocation of all support
department expenses to the appropriate CCF, TCF, or remanufacturing department. All
allocations of support expenses were based on the percentage of expense directly related
to each area (see Table 1.0).
Table 1.0 Pre-Transfer Allocation of Support Department Expenses.
Support Department CCF TCF Remfg Total Human Resources 42% 48% 10% 100%
Mfg General 42% 48% 10% 100% Receiving 35% 50% 15% 100%
Engineering 24% 56% 21% 100% Facility 23% 65% 13% 100%
Maintenance 46% 44% 10% 100% Safety 42% 48% 10% 100%
Electronic Technicians 24% 37% 39% 100% Production Supervisors 38% 58% 4% 100%
Allocations for the Human Resources, Manufacturing General, and the Safety
department were spread based on current headcount in each of the three areas. The
Receiving department expenses were spread based on the average number of incoming
pallets of material. Engineering, Maintenance, Electronic Technician, and Production
Supervisor department expenses were spread based on the amount of time the personnel
in each department spent supporting the three areas. Finally, the Facility expense
department was spread based on the square footage of floorspace each of the three areas
occupied.
Table 2.0, which is based on six months of actual expenses, shows the current
burden rates for both the CCF and TCF product families. The Menomonie facility’s
current standard base rate is $10.00 per hour. The resulting fully burdened cost per hour
to produce CCF products in the Menomonie facility is $47.10 per hour. The resulting

36
fully burdened cost per hour to produce TCF products in the Menomonie facility is
$61.30 per hour.
Table 2.0 Pre-transfer Menomonie Facility Burden Rates.
Description CCF TCF Remfg Total Standard Labor Credit -$1,142,216 -$1,263,347 $0 -$2,405,563 Variable Expenses $2,676,972 $3,639,222 $6,200,488 $12,516,682 Fixed Expenses $2,161,536 $3,681,796 $941,518 $6,784,850 External Allocations -$597,448 -$835,711 -$8,229,375 -$9,662,534 Total Department Expenses $4,241,060 $6,485,307 -$1,087,369 $9,638,998 Total Burden Rate 371% 513% 401%
The second half of the study involved determining the post-transfer TCF burden
rate. This was accomplished by eliminating all the CCF production departments, and
examining each support department to determine what expenses previously assigned to
CCF production would remain following the transfer. Table 3.0 shows the post-transfer
support department allocation splits.
Table 3.0 Post-Transfer Allocation of Support Department Expenses.
Support Department CCF TCF Remfg Total Human Resources 0% 82% 18% 100%
Mfg General 0% 48% 10% 58% Receiving 0% 50% 15% 65%
Engineering 0% 65% 16% 81% Facility 0% 84% 16% 100%
Maintenance 0% 88% 13% 100% Safety 0% 82% 18% 100%
Electronic Technicians 0% 37% 38% 75% Production Supervisors 0% 76% 4% 80%
Allocations from the Human Resources, Maintenance, and Safety departments
were not reduced following the transfer. Due to the limited number of employees in
those departments, those departments would not reduce headcount or eliminate expenses
37
following the transfer. This will result in 100% of their current expenses being spread to
the TCF production and remanufacturing areas.
The General Manufacturing and Receiving expense departments consist of
variable expenses directly related to the production departments. This will allow the
elimination of all previous CCF allocations from those departments. The TCF production
and remanufacturing allocations from those departments will remain identical to their
pre-transfer allocations.
Following the transfer, the Engineering department will release 20% of its
personnel, and spread the CCF support of two other engineers completely to TCF
production and remanufacturing. This will increase the total Engineering allocation to the
TCF production and remanufacturing by 4%.
Following the transfer, the Electronic Technician department will release 25% of
its personnel. Because these technicians support a very small portion of remanufacturing,
the overall remaining Electronic Technician allocation to the remaining TCF departments
will decrease by 1%.
The Production Supervisor department will release 20% of its personnel, and
spread the CCF support of one other supervisor completely to TCF production and
remanufacturing. This will increase the total Production Supervision allocation to the
TCF production and remanufacturing by 18%.
For the purposes of this study, the Facility expense department will not eliminate
any expenses following the transfer of CCF products to the Alabama facility. Although
there will be some reduction in utility expenses, they do not significantly affect the
overall expenses in the Facility department because that department’s expenses are
38
dominated by building depreciation and maintenance. Spreading the entire Facility
expense department to the remaining TCF production and remanufacturing areas will
increase their allocation from the facility by 23%.
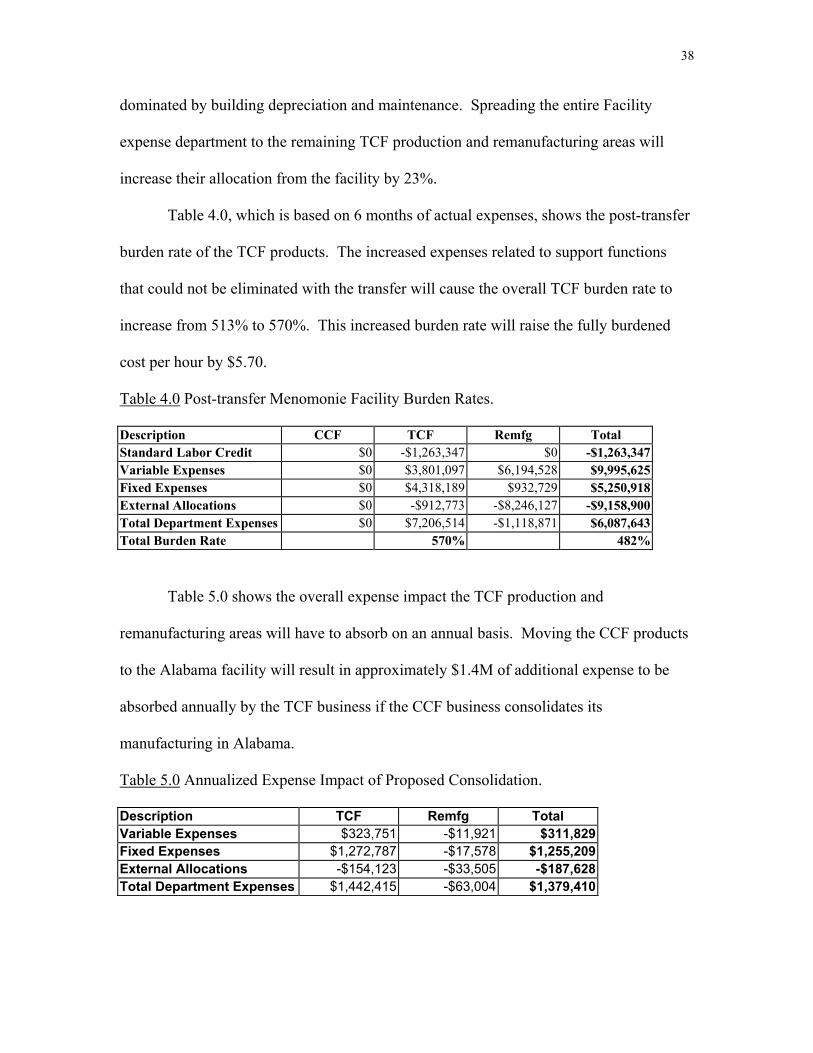
Table 4.0, which is based on 6 months of actual expenses, shows the post-transfer
burden rate of the TCF products. The increased expenses related to support functions
that could not be eliminated with the transfer will cause the overall TCF burden rate to
increase from 513% to 570%. This increased burden rate will raise the fully burdened
cost per hour by $5.70.
Table 4.0 Post-transfer Menomonie Facility Burden Rates.
Description CCF TCF Remfg Total Standard Labor Credit $0 -$1,263,347 $0 -$1,263,347 Variable Expenses $0 $3,801,097 $6,194,528 $9,995,625 Fixed Expenses $0 $4,318,189 $932,729 $5,250,918 External Allocations $0 -$912,773 -$8,246,127 -$9,158,900 Total Department Expenses $0 $7,206,514 -$1,118,871 $6,087,643 Total Burden Rate 570% 482%
Table 5.0 shows the overall expense impact the TCF production and
remanufacturing areas will have to absorb on an annual basis. Moving the CCF products
to the Alabama facility will result in approximately $1.4M of additional expense to be
absorbed annually by the TCF business if the CCF business consolidates its
manufacturing in Alabama.
Table 5.0 Annualized Expense Impact of Proposed Consolidation.
Description TCF Remfg Total Variable Expenses $323,751 -$11,921 $311,829 Fixed Expenses $1,272,787 -$17,578 $1,255,209 External Allocations -$154,123 -$33,505 -$187,628 Total Department Expenses $1,442,415 -$63,004 $1,379,410

39
Chapter 5
Conclusions and Recommendations
The purpose of this study is to determine the financial impact of a partial plant
consolidation involving Company XYZ’s Menomonie, WI facility. Although there are
many aspects to be considered when intra-company transfers of manufacturing lines are
proposed, this study focused on the post-transfer financial impact to the remaining
products manufactured in the Menomonie, WI facility.
The goals of the study were:
1.0 Analyze the current financial structure of the Menomonie, WI
facility to determine the post-transfer burden rates of the remaining
products.
2.0 Provide recommendations to minimize any financial adverse
effects on the remaining products manufactured in the Menomonie,
WI facility.
Conclusions
The overall impact of consolidating the CCF product manufacturing from the
Menomonie, WI facility into the Alabama facility will have a significant impact on the
Menomonie, WI facility.
In terms of this study’s objectives, the consolidation will increase the fully
burdened rate of the remaining TCF products by $5.70 per hour. This increase correlates
to an annual increase in expenses to the TCF business of approximately $1.4M.
Although this study was limited to the determining the financial impacts to the
remaining products following the proposed consolidation, there are numerous other
40
aspects to be considered when consolidating manufacturing locations. These
considerations include the ability to build enough stock to maintain customer service
during the move, the actual cost of training the Alabama employees, moving the
equipment, and the cost of severance for Menomonie, WI employees. It is imperative
that all relevant aspects of a manufacturing consolidation be evaluated before a final
decision is made.
Recommendations
Although Company XYZ has considered this consolidation, they have not yet
made a final decision to move the CCF production from the Menomonie, WI facility.
The question of consolidation stems from Company XYZ having too many underutilized
manufacturing facilities.
Prior to making the final decision to consolidate manufacturing into the Alabama
facility, the current CCF production expenses should be evaluated in the context of how
they would affect the Alabama facility’s burden rates. There must be enough savings
realized in the transfer to not only save the $1.4M annually, but also to provide a timely
return on investment for the one-time transfer and severance costs.
It will be very difficult to reduce the amount of expenses left for the TCF products
to absorb following the transfer, because the largest percentage of those expenses are
related to the facility itself. These expenses include building and equipment depreciation
and facility maintenance costs.
The other expenses that would remain for the TCF products to absorb are related
to salaried support staff. Given time, there is opportunity to minimize the impact of these
costs that would not transfer with the CCF products to Alabama. One method of

41
reducing those costs would involve the transition of support functions, such as Human
Resources, to a shared service model. This model would reduce the redundancies in
these types of support functions by centralizing company wide support, and reducing or
eliminating local support. Company XYZ has already begun implementing some of these
types of shared services. Partially extending that into the Safety and Engineering
functions may help to reduce left over expenses if a consolidation did occur.
In summary, the overall recommendations for Company XYZ include a similar
financial analysis to determine the resulting costs of the CCF manufacturing in Alabama.
The CCF family should only be consolidated into the Alabama facility if their costs show
favorable savings that offset the additional expenses to the remaining TCF products in the
Menomonie, WI facility, as well as a favorable return on investment for the moving and
severance costs.

42
References
Garrison, R. H., & Noreen E. W. (2000). Managerial Accounting (9th ed.).
Boston: Irwin McGraw Hill.
Hansen, D. R. (1990). Management Accounting. Boston: PWS-KENT Publishing
Company.
Morse, D.C., & Zimmerman, J. L. (1997). Managerial Accounting. Chicago:
Irwin McGraw Hill.
Riggs, H. E. (1994). Financial and Cost Analysis for Engineering and Technology
Management. New York: John Wiley & Sons, Inc.
Weygandt, J. J., Kieso, D. E. & Kimmel, P. D. (1999). Managerial Accounting:
Tools for Business Decision Making. New York: John Wiley & Sons, Inc.