Financial Analysis ITC
13
Financial Analysis of ITC Ltd. Asim Bhawsinghka – A06 1 | Page Executive Summary This report evaluates the financials of ITC Ltd. with respect to its past performance and financial health. A recommendation to investors has been provided based on the financial analysis and companies strategies. The report covers common size as well as comparative analysis of income statements and balance sheets. ITC is the market leader in the Indian cigarette space. It has diversified its operations since 1975 and forayed into hotels. Subsequently, it has also diversified into other FMCG markets. The sales turnover for the company stands at about ₹53,160 crores in FY2015. The company has demonstrated considerable skill in managing its working capital as well as reining in their operating expenses. Company’s net profits have increased over the years and it has a very comfortable net profit margin. The debt levels are extremely low, and almost entire profits are available to the equity investors. The return on capital employed is about 50%. ITC Ltd. is thus a good opportunity for investors to pursue.
-
Upload
asim-bhawsinghka -
Category
Documents
-
view
56 -
download
0
description
Financial Analysis of ITC Ltd.
Transcript of Financial Analysis ITC

Financial Analysis of ITC Ltd.
Asim Bhawsinghka – A06 1 | P a g e
Executive Summary This report evaluates the financials of ITC Ltd. with respect to its past performance and
financial health. A recommendation to investors has been provided based on the financial
analysis and companies strategies. The report covers common size as well as comparative
analysis of income statements and balance sheets.
ITC is the market leader in the Indian cigarette space. It has diversified its operations since
1975 and forayed into hotels. Subsequently, it has also diversified into other FMCG markets.
The sales turnover for the company stands at about ₹53,160 crores in FY2015. The company
has demonstrated considerable skill in managing its working capital as well as reining in their
operating expenses. Company’s net profits have increased over the years and it has a very
comfortable net profit margin. The debt levels are extremely low, and almost entire profits
are available to the equity investors. The return on capital employed is about 50%. ITC Ltd. is
thus a good opportunity for investors to pursue.
Financial Analysis of ITC Ltd.
Asim Bhawsinghka – A06 2 | P a g e
Contents Executive Summary .................................................................................................................... 1
Introduction ............................................................................................................................... 3
Financial Analysis ....................................................................................................................... 3
Common-Size Income Statement Analysis ............................................................................. 3
Common-Size Balance Sheet Analysis .................................................................................... 3
Comparative Income Statement Analysis .............................................................................. 4
Comparative Balance Sheet Analysis ..................................................................................... 4
Ratio Analysis.......................................................................................................................... 5
Current Ratio ....................................................................................................................... 5
Debt to Equity Ratio ............................................................................................................ 5
Inventory Turnover Ratio .................................................................................................... 5
Fixed Assets Turnover Ratio ................................................................................................ 5
Return on Assets ................................................................................................................. 5
Return on Net Worth .......................................................................................................... 5
Return on Capital Employed ............................................................................................... 5
Price to Earnings Ratio ........................................................................................................ 5
Summary of Financial Performance and Recommendations .................................................... 6
Appendix A: Common Size Income Statement – ITC Ltd. .......................................................... 7
Appendix B: Common Size Balance Sheet – ITC Ltd. ................................................................. 8
Appendix C: Comparative Income Statement – ITC Ltd. ......................................................... 10
Appendix D: Comparative Balance Sheet – ITC Ltd. ................................................................ 11
Appendix E: Ratio Analysis – ITC Ltd. ....................................................................................... 13
Financial Analysis of ITC Ltd.
Asim Bhawsinghka – A06 3 | P a g e
Introduction ITC Ltd. is a leading firm in the Indian FMCG space. It boasts of a wide product portfolio from
branded packaged foods, personal care products, cigarettes, lifestyle retailing, education and
stationary products, and safety matches and incense sticks. It also operates in the hotel
industry and agri business. ITC is one of the largest agri business players in India. ITC is also
present in paperboard and packaging industry and information technology space. Cigarettes,
however, forms about 60% of gross turnover of the company. The closest competitor to ITC
in the cigarette sector is Godfrey Phillips India Ltd.
ITC’s corporate strategy is to create multiple growth drivers and leverage its brand building
capability, deep distribution networks, rural linkages, expertise in agri commodity sourcing,
and packaging knowhow. Consequently, the company has invested heavily in diversifying its
products and creating multiple brands. The company aims at achieving a revenue of ₹1,
00,000 crore from the FMCG business by 2030 and become India’s number one FMCG player.
Financial Analysis
Common-Size Income Statement Analysis The common-size analysis of ITC Ltd.’s income statement reveals an increase in the COGS to
net sales of the company. An increase from 36.15% of the net sales in FY2011 to 38.04% of
net sales in FY2015 with a five year average of 37.27% of net sales does not bode well for the
company, indicating a drop in its gross margin. The company, however, has been successful
in reducing its operating expenses to net sales from 32.88% in FY2011 to 27.98% in FY2015.
Consequently, operating profit as a percentage of net sales have increased for the company
over the five year period in review. Five year average operating profit for the company was
32.78% of the net sales. Selling and Administrative expenses per unit of net sales have
reduced considerably from 12.78% in FY2011 to 9.98% in FY2015. Use of technology and
predictive analytics has been helping the company to capture quick and accurate data which
is being leveraged towards geography-specific trade promotion schemes. This has clearly
benefitted the company since the advertising and marketing expenses as a percentage of net
sales has declined from 3.03% to 2.10% during the five years from FY2011, even though these
expenses have increased from ₹567.8 crores to ₹813.75 crores in actual terms.
The net profit to sales for ITC increased throughout FY2011 to FY2015; the five year average
being 24.24%. Contrasting this to the net profit margin for Godfrey Phillips India Ltd. which
stands at 7.04% in FY2014, it is a spectacular feat by the company.
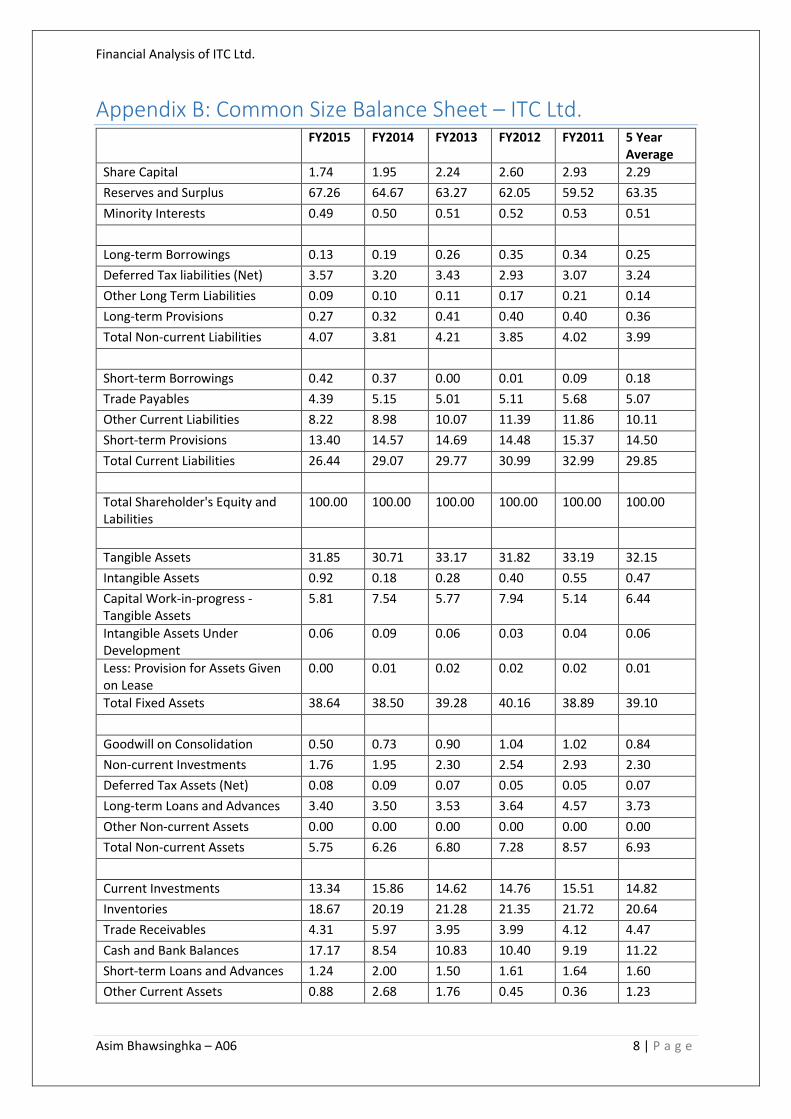
Common-Size Balance Sheet Analysis ITC Ltd. is largely an unlevered firm with owner’s equity forming 65.64% of total owner’s
equity and liabilities on an average in the five year period from FY2011 to FY2015. The owner’s
equity has been rising throughout the review period on account of some profits being
ploughed back to the company as retained earnings.

Financial Analysis of ITC Ltd.
Asim Bhawsinghka – A06 4 | P a g e
The long term borrowings as a percentage of total shareholder’s equity and liabilities has
declined from 0.34% in FY2011 to 0.13% in FY2015. The company has been clearing off its
long term debts without resorting to additional debts. This has reduced the interest burden
on the company and at the same time increased its tax liabilities over the five year period.
The current liabilities of the company have been decreasing on account of decreasing trade
payables from 5.68% of total owner’s equity and liabilities in FY2011 to 4.39% in FY2015.
There however, is a jump in short term borrowings to total owner’s equity and liabilities from
0.09% in FY2011 to 0.42% in FY2015. Part of the cash raised through short term borrowing is
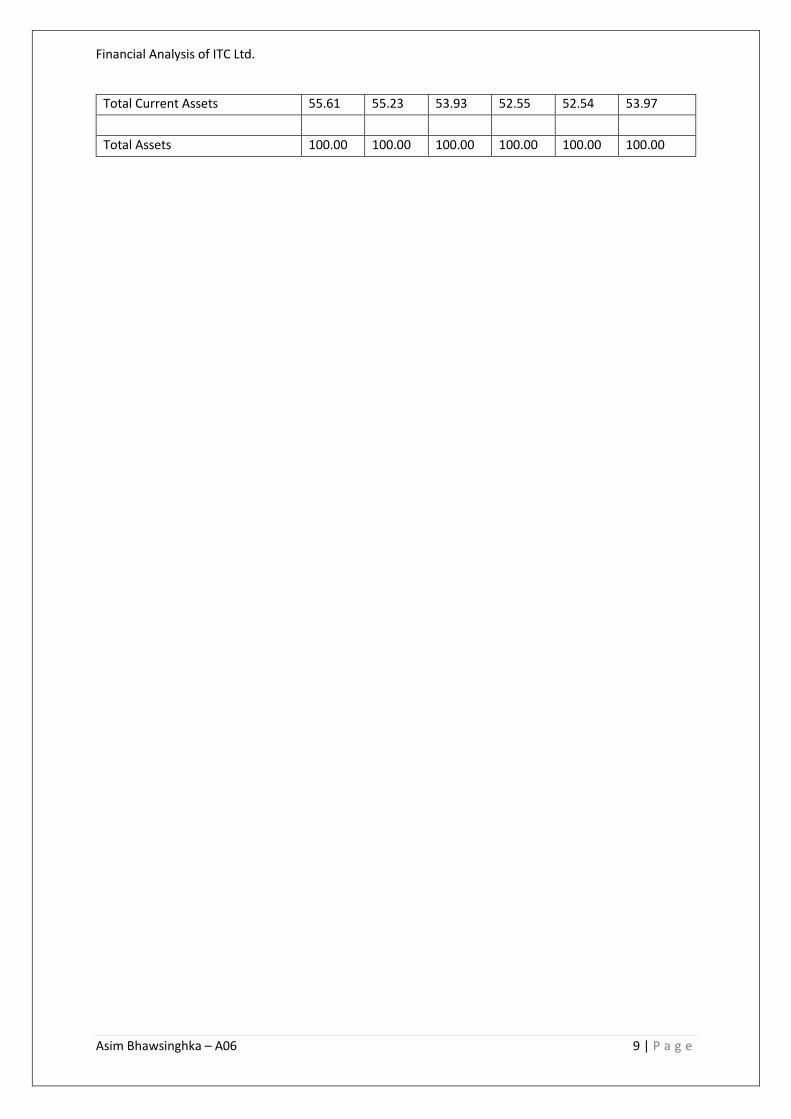
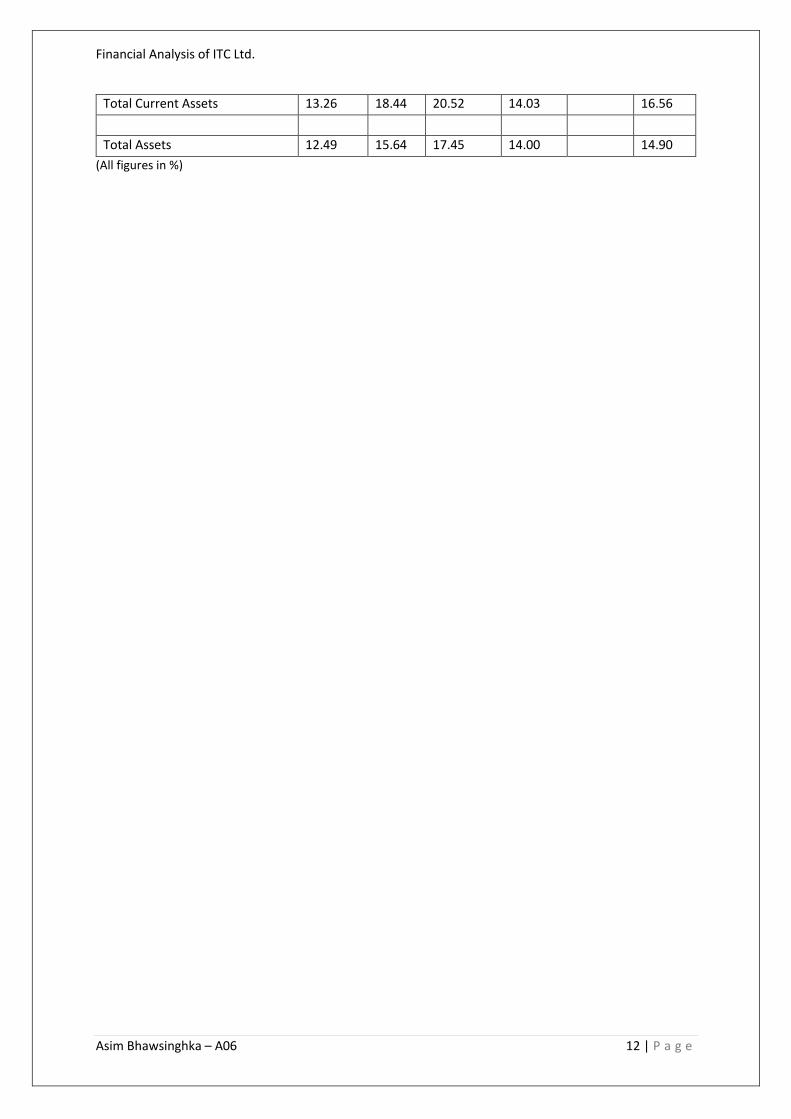
used to pay the companies’ creditors. At the same time, the total current assets to total assets
have increased from 52.54% in FY2011 to 55.61% in FY2015. Cash and Bank balances is the
major contributor to this increase. Inventories to total assets have decreased from 20.19% in
FY2014 to 18.67% to FY2015.
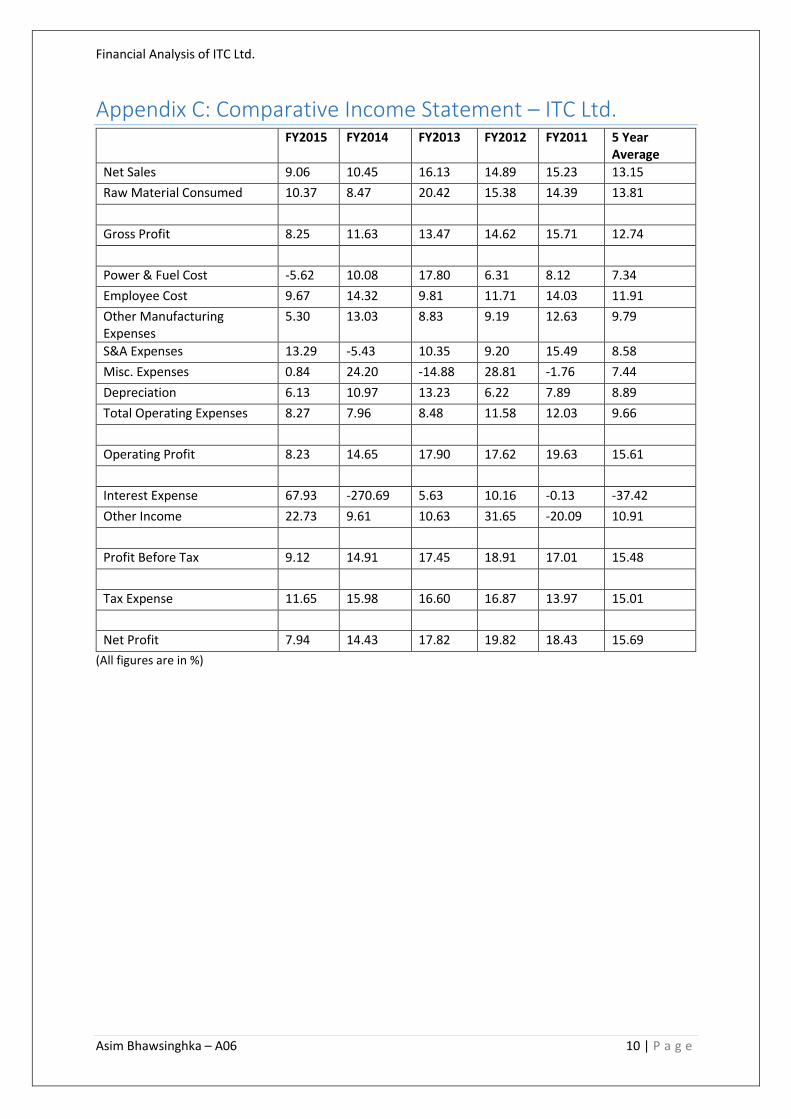
Comparative Income Statement Analysis The growth in net sales for the company is declining from FY2011 to FY2015, going from
15.23% to 9.06%. The company attributes this drop in sales to steep increase in excise duty
on filter cigarettes, cigarettes contributing to about 61% of the gross turnover of the
company. Gross profit has declined by 8.25% in FY2015 due to increase in COGS by 10.37%
over FY2014 COGS.
The total operating expenses have reduced from 12.03% in FY2011 to 8.27% in FY2015.
Despite this, net profit has also decreased through the five year period from 18.43% to 7.94%.
This is not a healthy sign for the company and the company should diversify further and
reduce its reliance on cigarettes further since the increased tax rates on cigarettes is hurting
the company severely.
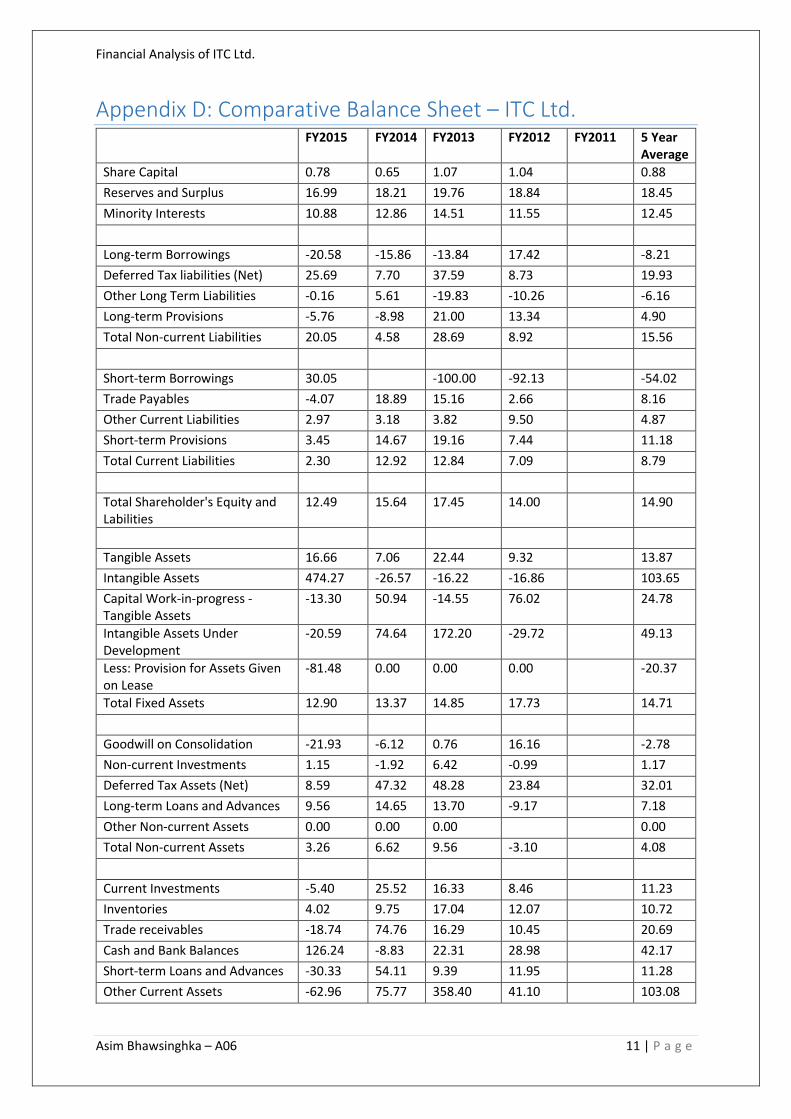
Comparative Balance Sheet Analysis The owner’s equity growth rate for the company has come down from 19.88% I n FY2012 to
17.77% in FY2015. In the year FY2015, the share capital increased by 0.78% on account of
exercising of stock options. The reserves and surplus grew at an average rate of 18.45%.
Long term borrowings of the company have been reducing since FY2013 due to repayment of
term loans. The company had relied little on short term borrowings in the years FY2011
through FY2013. This explains the near 100% decrease in short term borrowings in FY2012
and FY2013. In FY2015, the short term borrowings have increased by 30.05% over FY2014.
Tangible assets have increased substantially from FY2012 to FY2015, at an average rate of
13.87%. Intangible assets on the other hand have been decreasing from FY2012 through
FY2014. It increased only in FY2015 on account of trademarks and know-how, business and
commercial rights. The company introduced new products such as Electronic Vaping Devices
and new notebook brand in value segment, explaining the increase in trademarks.
The total assets of the company grew by 14.90% on an average through FY2012 to FY2015.

Financial Analysis of ITC Ltd.
Asim Bhawsinghka – A06 5 | P a g e
Ratio Analysis
Current Ratio The current ratio of the company in FY2015 stands at 1.24. This has steadily increased from
0.95 in FY2011 to the current levels. The average 5 year current ratio is 1.07. The company is
prudently handling is current assets and liabilities.
Debt to Equity Ratio The debt equity ratio for the company has been very low; the company is virtually debt free.
While this gives a lot of room to company to raise debts for rapid expansion in future, the
company is currently not leveraging the tax advantages that debt brings. Having such low
debts in the balance sheet also means that the cost of capital for the company is on the higher
side.
Inventory Turnover Ratio On an average, the inventory turnover ratio for the company has been 6.60, implying ITC sells
its inventory in about 55 days. Comparing this to the industry average of 6.67, the company
is doing well.
Fixed Assets Turnover Ratio The company sells ₹2.60 on an average for every rupee invested in fixed assets. Contrasting
this to Godfrey Phillips India Ltd.’s fixed asset turnover ratio of 3.91 in FY2014, ITC can still
improve upon the efficiency of its fixed assets and create a better shareholder value.
Return on Assets ITC Ltd.’s return on asset is 22.23% on average from FY2011 to FY2015. Thus the company
makes a profit of ₹0.22 for every rupee invested in its assets. Godfrey Phillips India Ltd. on
the other hand earns about ₹0.12 for every rupee invested in its assets. The performance of
ITC in this regard is far superior to Godfrey Phillips in this regards.
Return on Net Worth The return earned on stockholders’ capital is 35.04% on average. The return on net worth for
Godfrey Phillips India Ltd. is only about 20.09% in FY2014. A higher return on net worth is
favourable for investors.
Return on Capital Employed Return on capital employed (ROCE) is a better measure of a company’s performance as it
indicates how well a company is using its debt and equity to generate profits. The ROCE for
ITC ltd is 50.65% which is impressive. Since the debt levels for the company are extremely
low, almost all the profits are available to the shareholders.
Price to Earnings Ratio The average price to earnings ratio of ITC Ltd. is 33.08 from FY2011 to FY2015. Compare this
to the average price to earnings ratio of Godfrey Phillips India Ltd. which stands at 17.27. A
net profit margin of about 25% provides sufficient cushion to ITC in case sales do not pick up,
giving investors enough confidence to pay ₹33 per rupee of profit made by the company.

Financial Analysis of ITC Ltd.
Asim Bhawsinghka – A06 6 | P a g e
Summary of Financial Performance and Recommendations ITC Ltd. is an unlevered firm with good fundamentals. The increased COGS is a worry but the
increased net profit margin on decreasing operating expenses offsets the reduction in gross
profit margin. The company has used the cash from operations to reduce its current liabilities
demonstrating a good working capital management. The company, however needs to
diversify further from its core cigarette business which is susceptible to excise duty changes
by the government. A step in the correct direction is being taken by the company with the
introduction of new brands in the market. Fixed Asset Turnover ratio for the company can be
further improved by increasing sales. The inventory management of ITC is quite robust and
combined with its distribution strength has kept the company in good stead despite
weakened macroeconomic conditions.

Financial Analysis of ITC Ltd.
Asim Bhawsinghka – A06 7 | P a g e
Appendix A: Common Size Income Statement – ITC Ltd. FY2015 FY2014 FY2013 FY2012 FY2011 5 Year
Average
Net Sales 100.00 100.00 100.00 100.00 100.00 100.00
Raw Material Consumed 38.04 37.49 38.32 36.36 36.15 37.27
Gross Profit 61.96 62.51 61.68 63.64 63.85 62.73
Power & Fuel Cost 1.57 1.83 1.83 1.80 1.98 1.80
Employee Cost 7.14 7.09 6.78 7.30 7.57 7.18
Other Manufacturing Expenses 3.79 3.95 3.84 4.17 4.45 4.04
S&A Expenses 9.98 9.52 11.20 11.98 12.78 11.09
Misc. Expenses 2.85 3.10 2.63 3.60 3.01 3.04
Depreciation 2.65 2.73 2.72 2.81 3.10 2.80
Total Operating Expenses 27.98 28.22 29.00 31.65 32.88 29.95
Operating Profit 33.98 34.29 32.68 31.99 30.97 32.78
Interest Expense 0.23 0.08 0.34 0.38 0.41 0.29
Other Income 3.24 2.75 2.77 2.96 2.37 2.82
Profit Before Tax 36.98 36.96 35.11 34.56 32.93 35.31
Tax Expense 11.84 11.50 10.79 10.73 10.48 11.07
Net Profit 25.15 25.46 24.33 23.84 22.46 24.24
Financial Analysis of ITC Ltd.
Asim Bhawsinghka – A06 8 | P a g e
Appendix B: Common Size Balance Sheet – ITC Ltd. FY2015 FY2014 FY2013 FY2012 FY2011 5 Year
Average
Share Capital 1.74 1.95 2.24 2.60 2.93 2.29
Reserves and Surplus 67.26 64.67 63.27 62.05 59.52 63.35
Minority Interests 0.49 0.50 0.51 0.52 0.53 0.51
Long-term Borrowings 0.13 0.19 0.26 0.35 0.34 0.25
Deferred Tax liabilities (Net) 3.57 3.20 3.43 2.93 3.07 3.24
Other Long Term Liabilities 0.09 0.10 0.11 0.17 0.21 0.14
Long-term Provisions 0.27 0.32 0.41 0.40 0.40 0.36
Total Non-current Liabilities 4.07 3.81 4.21 3.85 4.02 3.99
Short-term Borrowings 0.42 0.37 0.00 0.01 0.09 0.18
Trade Payables 4.39 5.15 5.01 5.11 5.68 5.07
Other Current Liabilities 8.22 8.98 10.07 11.39 11.86 10.11
Short-term Provisions 13.40 14.57 14.69 14.48 15.37 14.50
Total Current Liabilities 26.44 29.07 29.77 30.99 32.99 29.85
Total Shareholder's Equity and Labilities
100.00 100.00 100.00 100.00 100.00 100.00
Tangible Assets 31.85 30.71 33.17 31.82 33.19 32.15
Intangible Assets 0.92 0.18 0.28 0.40 0.55 0.47
Capital Work-in-progress - Tangible Assets
5.81 7.54 5.77 7.94 5.14 6.44
Intangible Assets Under Development
0.06 0.09 0.06 0.03 0.04 0.06
Less: Provision for Assets Given on Lease
0.00 0.01 0.02 0.02 0.02 0.01
Total Fixed Assets 38.64 38.50 39.28 40.16 38.89 39.10
Goodwill on Consolidation 0.50 0.73 0.90 1.04 1.02 0.84
Non-current Investments 1.76 1.95 2.30 2.54 2.93 2.30
Deferred Tax Assets (Net) 0.08 0.09 0.07 0.05 0.05 0.07
Long-term Loans and Advances 3.40 3.50 3.53 3.64 4.57 3.73
Other Non-current Assets 0.00 0.00 0.00 0.00 0.00 0.00
Total Non-current Assets 5.75 6.26 6.80 7.28 8.57 6.93
Current Investments 13.34 15.86 14.62 14.76 15.51 14.82
Inventories 18.67 20.19 21.28 21.35 21.72 20.64
Trade Receivables 4.31 5.97 3.95 3.99 4.12 4.47
Cash and Bank Balances 17.17 8.54 10.83 10.40 9.19 11.22
Short-term Loans and Advances 1.24 2.00 1.50 1.61 1.64 1.60
Other Current Assets 0.88 2.68 1.76 0.45 0.36 1.23
Financial Analysis of ITC Ltd.
Asim Bhawsinghka – A06 9 | P a g e
Total Current Assets 55.61 55.23 53.93 52.55 52.54 53.97
Total Assets 100.00 100.00 100.00 100.00 100.00 100.00
Financial Analysis of ITC Ltd.
Asim Bhawsinghka – A06 10 | P a g e
Appendix C: Comparative Income Statement – ITC Ltd. FY2015 FY2014 FY2013 FY2012 FY2011 5 Year
Average
Net Sales 9.06 10.45 16.13 14.89 15.23 13.15
Raw Material Consumed 10.37 8.47 20.42 15.38 14.39 13.81
Gross Profit 8.25 11.63 13.47 14.62 15.71 12.74
Power & Fuel Cost -5.62 10.08 17.80 6.31 8.12 7.34
Employee Cost 9.67 14.32 9.81 11.71 14.03 11.91
Other Manufacturing Expenses
5.30 13.03 8.83 9.19 12.63 9.79
S&A Expenses 13.29 -5.43 10.35 9.20 15.49 8.58
Misc. Expenses 0.84 24.20 -14.88 28.81 -1.76 7.44
Depreciation 6.13 10.97 13.23 6.22 7.89 8.89
Total Operating Expenses 8.27 7.96 8.48 11.58 12.03 9.66
Operating Profit 8.23 14.65 17.90 17.62 19.63 15.61
Interest Expense 67.93 -270.69 5.63 10.16 -0.13 -37.42
Other Income 22.73 9.61 10.63 31.65 -20.09 10.91
Profit Before Tax 9.12 14.91 17.45 18.91 17.01 15.48
Tax Expense 11.65 15.98 16.60 16.87 13.97 15.01
Net Profit 7.94 14.43 17.82 19.82 18.43 15.69
(All figures are in %)
Financial Analysis of ITC Ltd.
Asim Bhawsinghka – A06 11 | P a g e
Appendix D: Comparative Balance Sheet – ITC Ltd. FY2015 FY2014 FY2013 FY2012 FY2011 5 Year
Average
Share Capital 0.78 0.65 1.07 1.04 0.88
Reserves and Surplus 16.99 18.21 19.76 18.84 18.45
Minority Interests 10.88 12.86 14.51 11.55 12.45
Long-term Borrowings -20.58 -15.86 -13.84 17.42 -8.21
Deferred Tax liabilities (Net) 25.69 7.70 37.59 8.73 19.93
Other Long Term Liabilities -0.16 5.61 -19.83 -10.26 -6.16
Long-term Provisions -5.76 -8.98 21.00 13.34 4.90
Total Non-current Liabilities 20.05 4.58 28.69 8.92 15.56
Short-term Borrowings 30.05 -100.00 -92.13 -54.02
Trade Payables -4.07 18.89 15.16 2.66 8.16
Other Current Liabilities 2.97 3.18 3.82 9.50 4.87
Short-term Provisions 3.45 14.67 19.16 7.44 11.18
Total Current Liabilities 2.30 12.92 12.84 7.09 8.79
Total Shareholder's Equity and Labilities
12.49 15.64 17.45 14.00 14.90
Tangible Assets 16.66 7.06 22.44 9.32 13.87
Intangible Assets 474.27 -26.57 -16.22 -16.86 103.65
Capital Work-in-progress - Tangible Assets
-13.30 50.94 -14.55 76.02 24.78
Intangible Assets Under Development
-20.59 74.64 172.20 -29.72 49.13
Less: Provision for Assets Given on Lease
-81.48 0.00 0.00 0.00 -20.37
Total Fixed Assets 12.90 13.37 14.85 17.73 14.71
Goodwill on Consolidation -21.93 -6.12 0.76 16.16 -2.78
Non-current Investments 1.15 -1.92 6.42 -0.99 1.17
Deferred Tax Assets (Net) 8.59 47.32 48.28 23.84 32.01
Long-term Loans and Advances 9.56 14.65 13.70 -9.17 7.18
Other Non-current Assets 0.00 0.00 0.00 0.00
Total Non-current Assets 3.26 6.62 9.56 -3.10 4.08
Current Investments -5.40 25.52 16.33 8.46 11.23
Inventories 4.02 9.75 17.04 12.07 10.72
Trade receivables -18.74 74.76 16.29 10.45 20.69
Cash and Bank Balances 126.24 -8.83 22.31 28.98 42.17
Short-term Loans and Advances -30.33 54.11 9.39 11.95 11.28
Other Current Assets -62.96 75.77 358.40 41.10 103.08
Financial Analysis of ITC Ltd.
Asim Bhawsinghka – A06 12 | P a g e
Total Current Assets 13.26 18.44 20.52 14.03 16.56
Total Assets 12.49 15.64 17.45 14.00 14.90
(All figures in %)

Financial Analysis of ITC Ltd.
Asim Bhawsinghka – A06 13 | P a g e
Appendix E: Ratio Analysis – ITC Ltd. FY2015 FY2014 FY2013 FY2012 FY2011
Debt-Equity Ratio 0 0 0 0.01 0.01
Long Term Debt-Equity Ratio 0 0 0 0 0.01
Current Ratio 1.24 1.11 1.05 0.99 0.95
Turnover Ratios
Fixed Assets 2.51 2.66 2.72 2.63 2.5
Inventory 6.63 6.74 6.88 6.46 6.28
Debtors 25.92 28.28 39.25 37.72 35.05
Interest Cover Ratio 179.43 536.72 101.88 91.83 83.61
PBIDTM (%) 29.84 28.86 27.52 27.52 26
PBITM (%) 27.93 26.95 25.63 25.54 23.87
PBDTM (%) 29.69 28.81 27.26 27.25 25.71
CPM (%) 20.98 20.58 19.51 19.48 18.31
APATM (%) 19.07 18.66 17.62 17.5 16.18
ROCE (%) 49.19 51.94 52.14 51.31 48.67
RONW (%) 33.77 36.27 36.21 35.58 33.35