Financial Analysis Group
37
FINANCIAL ANALYSIS
-
Upload
danishsamdani -
Category
Documents
-
view
7 -
download
1
description
Financial Analysis
Transcript of Financial Analysis Group

FINANCIAL ANALYSIS

What is Financial Analysis
The process of evaluating businesses, projects, budgets and other finance-related entities to determine their suitability for investment. Typically, financial analysis is used to analyze whether an entity is stable, solvent, liquid, or profitable enough to be invested in.
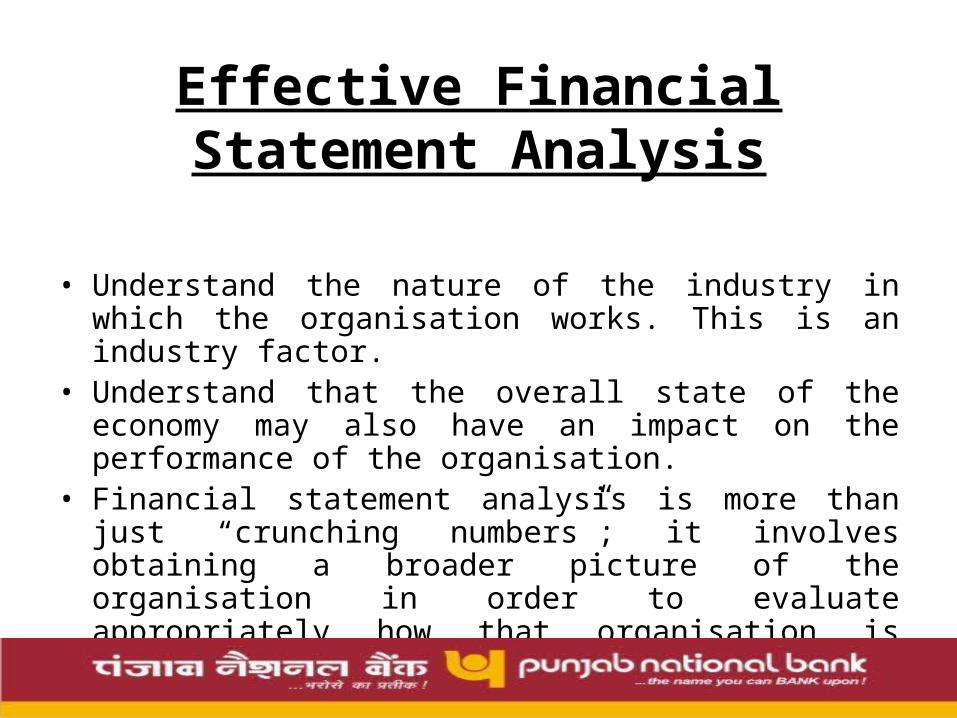
Effective Financial Statement Analysis
• Understand the nature of the industry in which the organisation works. This is an industry factor.
• Understand that the overall state of the economy may also have an impact on the performance of the organisation.
• Financial statement analysis is more than just “crunching numbers”; it involves obtaining a broader picture of the organisation in order to evaluate appropriately how that organisation is performing

Statement Required for financial Analysis
• Balance Sheet • Trading and Profit & Loss Account• Cash Flow Statement• Fund Flow Statement
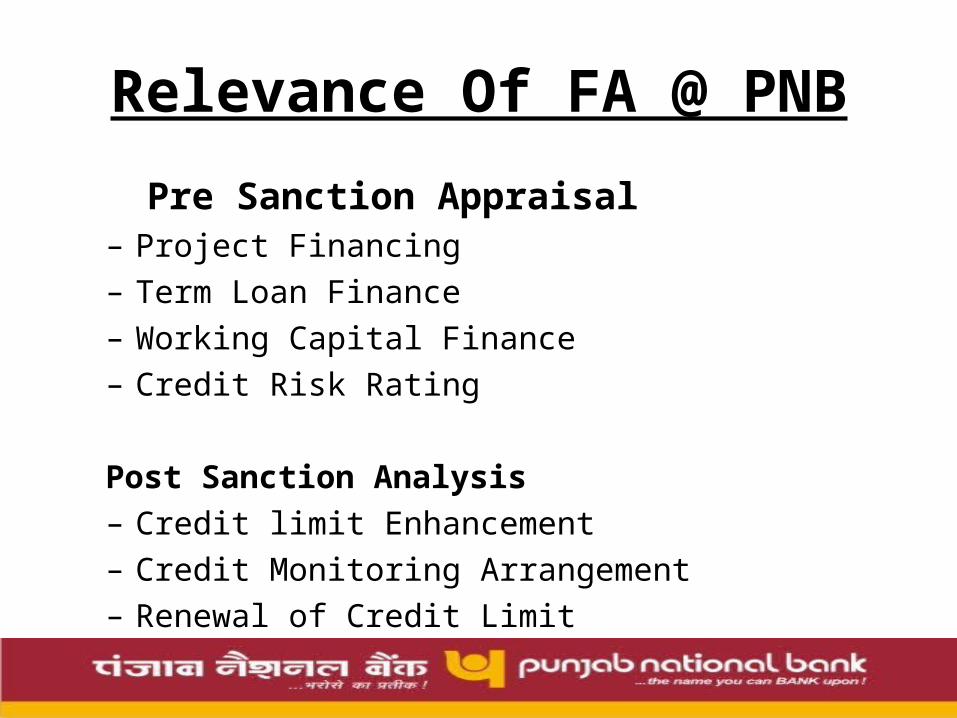
Relevance Of FA @ PNB
Pre Sanction Appraisal– Project Financing– Term Loan Finance– Working Capital Finance – Credit Risk Rating
Post Sanction Analysis– Credit limit Enhancement– Credit Monitoring Arrangement– Renewal of Credit Limit
The Use Of Financial Ratios
– Financial Ratio are used as a relative measure that facilitates the evaluation of efficiency or condition of a particular aspect of a firm's operations and status
– Ratio Analysis involves methods of calculating and interpreting financial ratios in order to assess a firm's performance and status
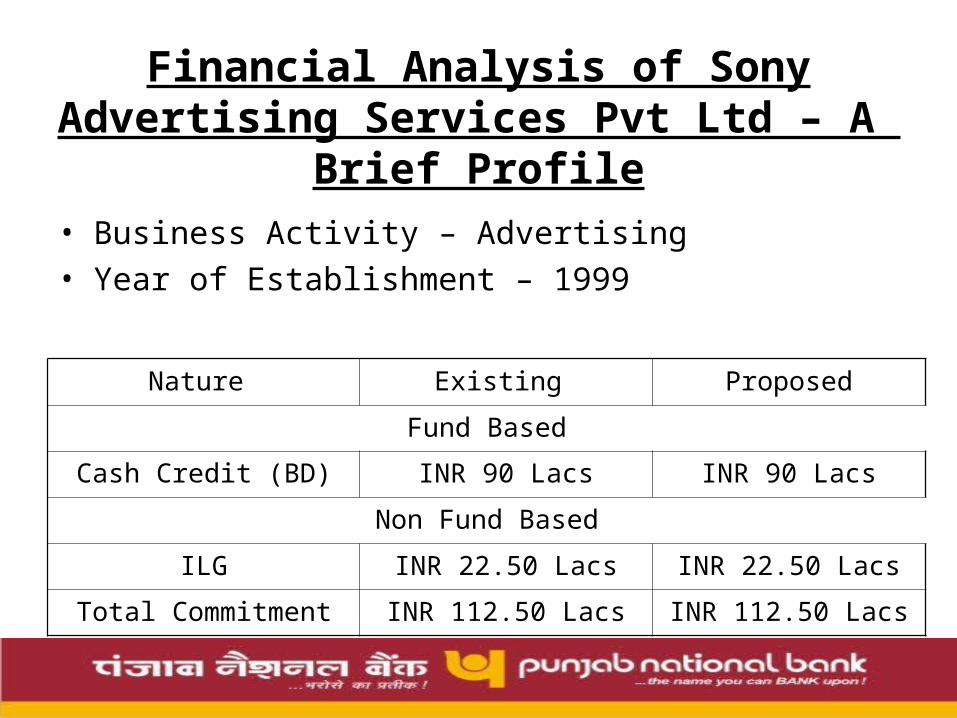
Financial Analysis of Sony Advertising Services Pvt Ltd – A Brief Profile
• Business Activity – Advertising• Year of Establishment – 1999
Nature Existing Proposed
Fund Based
Cash Credit (BD) INR 90 Lacs INR 90 Lacs
Non Fund Based
ILG INR 22.50 Lacs INR 22.50 Lacs
Total Commitment INR 112.50 Lacs INR 112.50 Lacs
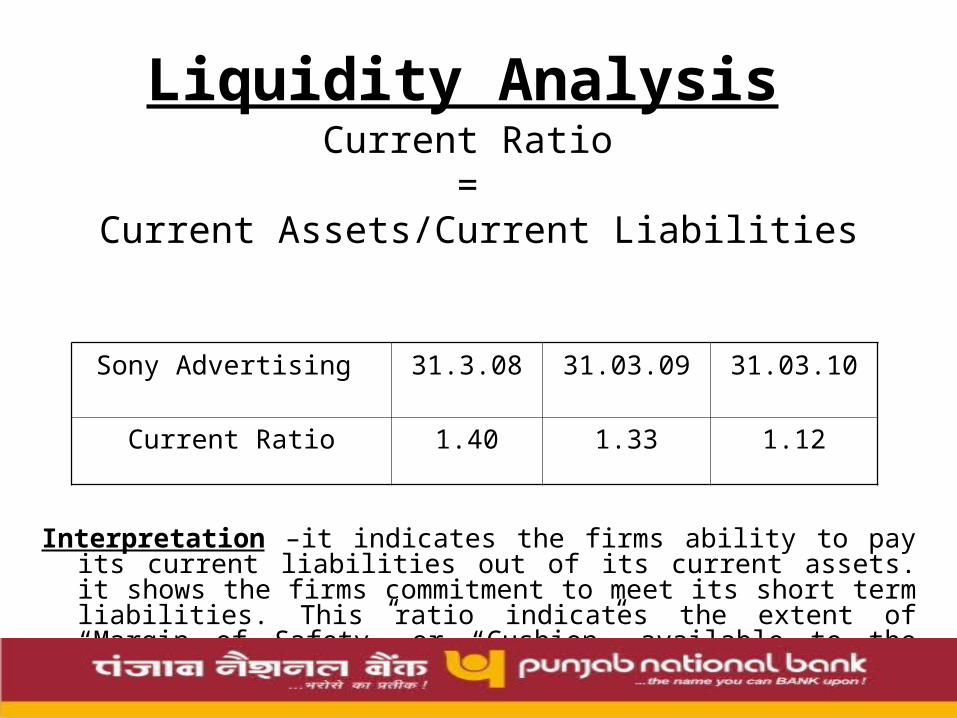
Liquidity AnalysisCurrent Ratio
= Current Assets/Current Liabilities
Interpretation –it indicates the firms ability to pay its current liabilities out of its current assets. it shows the firms commitment to meet its short term liabilities. This ratio indicates the extent of “Margin of Safety” or “Cushion” available to the current creditors.
Sony Advertising 31.3.08 31.03.09 31.03.10
Current Ratio 1.40 1.33 1.12

Profitability AnalysisOperating Profit Ratio
=OPBDIT/Net Sales
Interpretation – This ratio reflects the efficiency by which a firm
manufactures its products. It is calculated by deducting cost of goods sold from net sales. Higher the gross profit better is the result. Gross profit should be adequate to cover the operating expenses and to provide for fixed charges, dividends and accumulation of reserves. A low gross profit ratio normally indicates high cost of goods.
Sony Advertising 31.3.08 31.03.09 31.03.10
Operating profit Ratio 1.42% 2.09% 1.56%
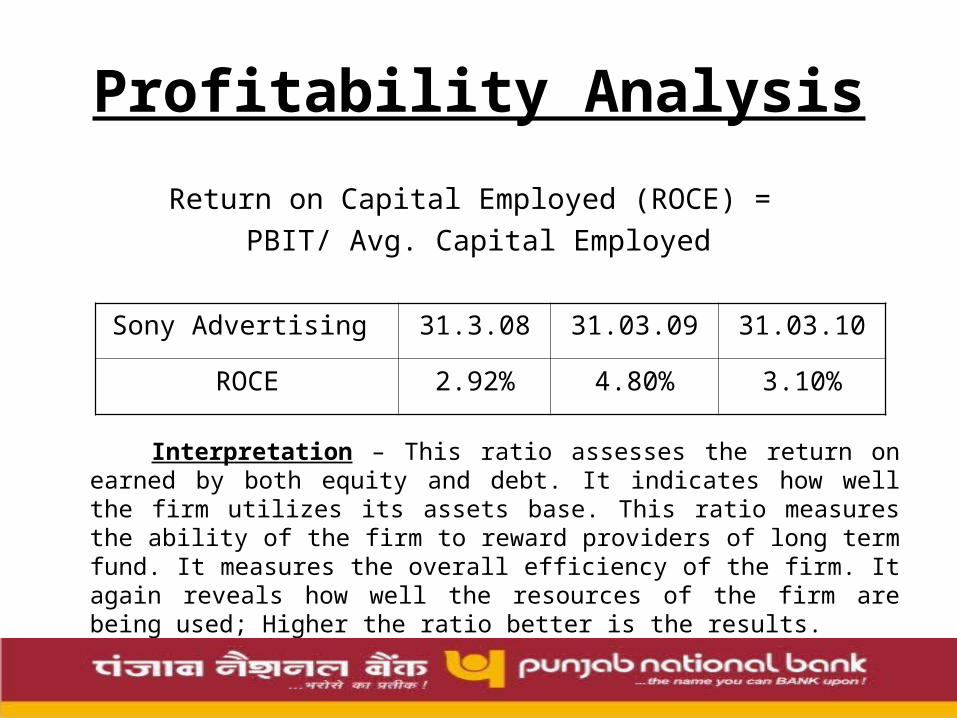
Profitability Analysis
Return on Capital Employed (ROCE) = PBIT/ Avg. Capital Employed
Interpretation – This ratio assesses the return on earned by both equity and debt. It indicates how well the firm utilizes its assets base. This ratio measures the ability of the firm to reward providers of long term fund. It measures the overall efficiency of the firm. It again reveals how well the resources of the firm are being used; Higher the ratio better is the results.
Sony Advertising 31.3.08 31.03.09 31.03.10
ROCE 2.92% 4.80% 3.10%
Profitability Analysis
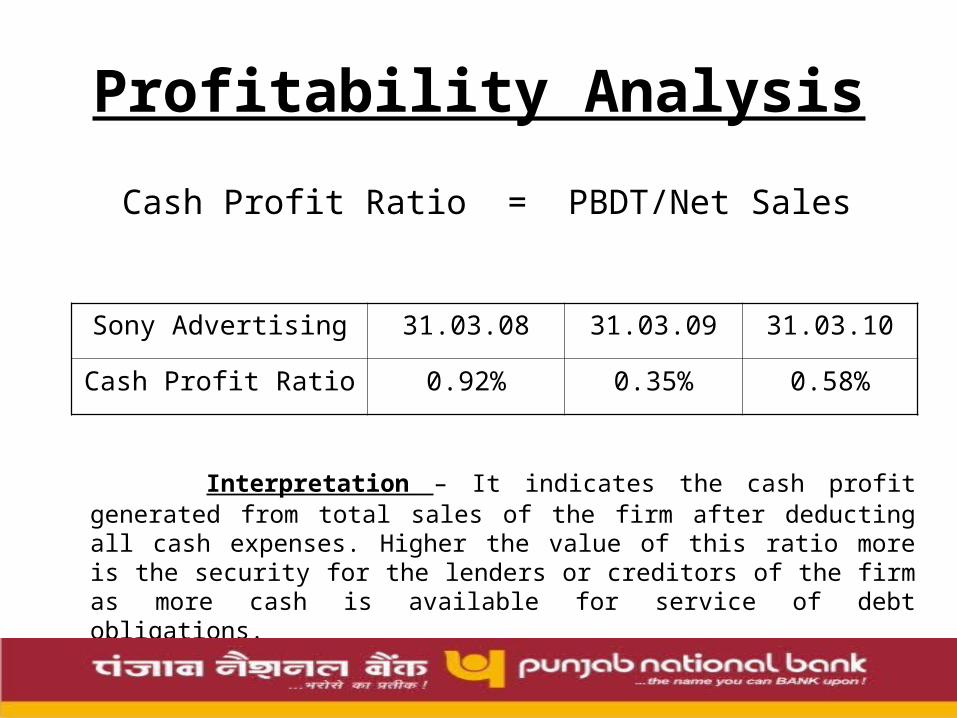
Cash Profit Ratio = PBDT/Net Sales
Interpretation – It indicates the cash profit generated from total sales of the firm after deducting all cash expenses. Higher the value of this ratio more is the security for the lenders or creditors of the firm as more cash is available for service of debt obligations.
Sony Advertising 31.03.08 31.03.09 31.03.10
Cash Profit Ratio 0.92% 0.35% 0.58%
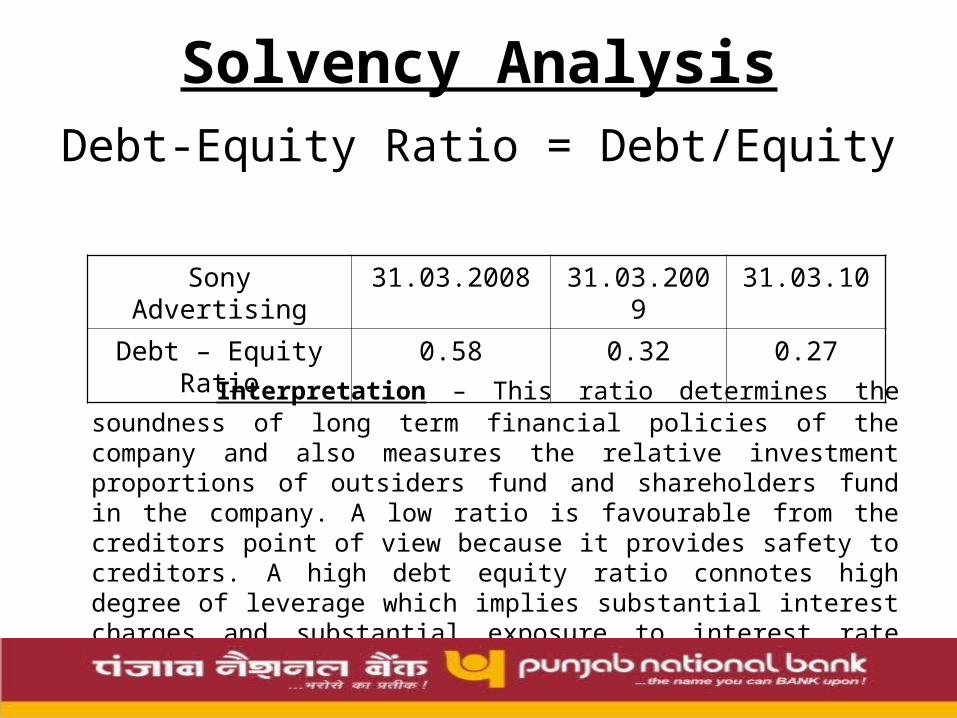
Solvency AnalysisDebt-Equity Ratio = Debt/Equity
Interpretation – This ratio determines the soundness of long term financial policies of the company and also measures the relative investment proportions of outsiders fund and shareholders fund in the company. A low ratio is favourable from the creditors point of view because it provides safety to creditors. A high debt equity ratio connotes high degree of leverage which implies substantial interest charges and substantial exposure to interest rate movement.
Sony Advertising 31.03.2008 31.03.2009 31.03.10
Debt – Equity Ratio 0.58 0.32 0.27
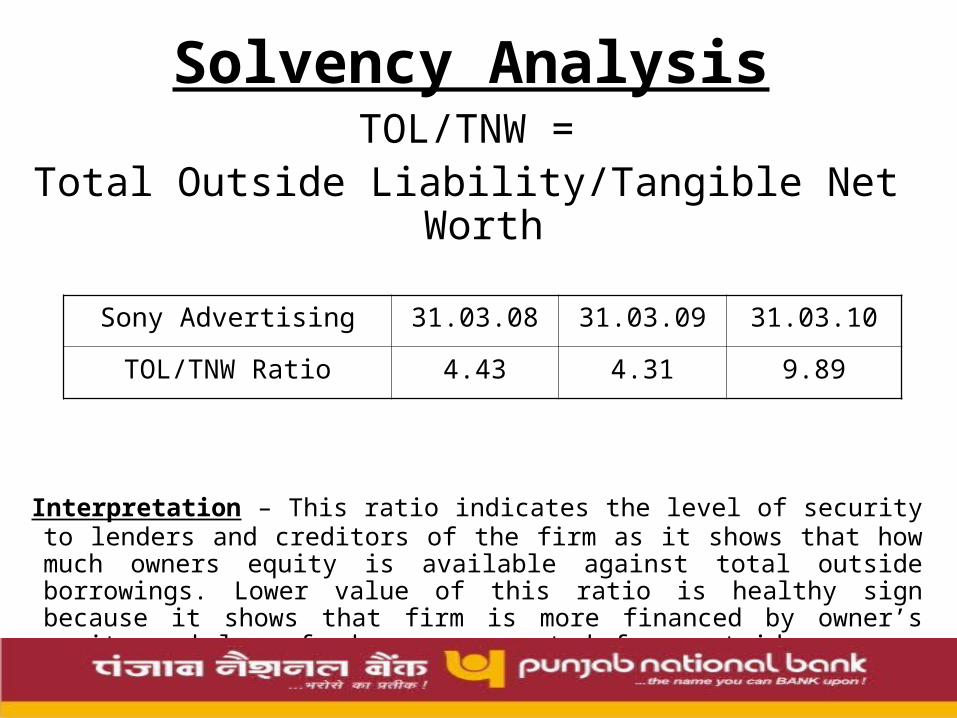
Solvency AnalysisTOL/TNW =
Total Outside Liability/Tangible Net Worth
Interpretation – This ratio indicates the level of security to lenders and creditors of the firm as it shows that how much owners equity is available against total outside borrowings. Lower value of this ratio is healthy sign because it shows that firm is more financed by owner’s equity and less funds are generated from outside sources to finance the activities of the firm.
Sony Advertising 31.03.08 31.03.09 31.03.10
TOL/TNW Ratio 4.43 4.31 9.89

Debt Coverage AnalysisInterest Coverage Ratio = EBITDA/Total Interest
Interpretation – This ratio reveals the debt servicing capacity of the firm. It measures the adequacy of profits to cover the interest, i.e. whether the business earns sufficient profits so as to pay the interest charges periodically. Higher the ratio, better for lenders and more secure their periodical interest income.
Sony Advertising 31.03.08 31.03.09 31.03.10
Interest Coverage Ratio 2.50 1.82 3.15

Debt Coverage Analysis
Debt Service Coverage Ratio (DSCR) =
EBDIA / Interest + TL Installments
Interpretation – It indicates the ability of the firm to repay the interest and installments on time. Higher the ratio, better it is. A high debt service coverage ratio implies better security to the lenders. DSCR is used to decide about the quantum of debt to be issued.

Debt Coverage AnalysisCurrent Assets to Short Term Borrowings = Total Current Assets/Short term bank loan
Interpretation – This ratio indicates that out of total current assets how much is financed by short term bank borrowings. Higher value of this ratio provides more security to repayment of interest and installment of loan amount as short term liabilities can be paid by encashing current asset.
Sony Advertising 31.03.08 31.03.09 31.03.10
Total CA/ ST bank loan 18.61 9.23 8.85
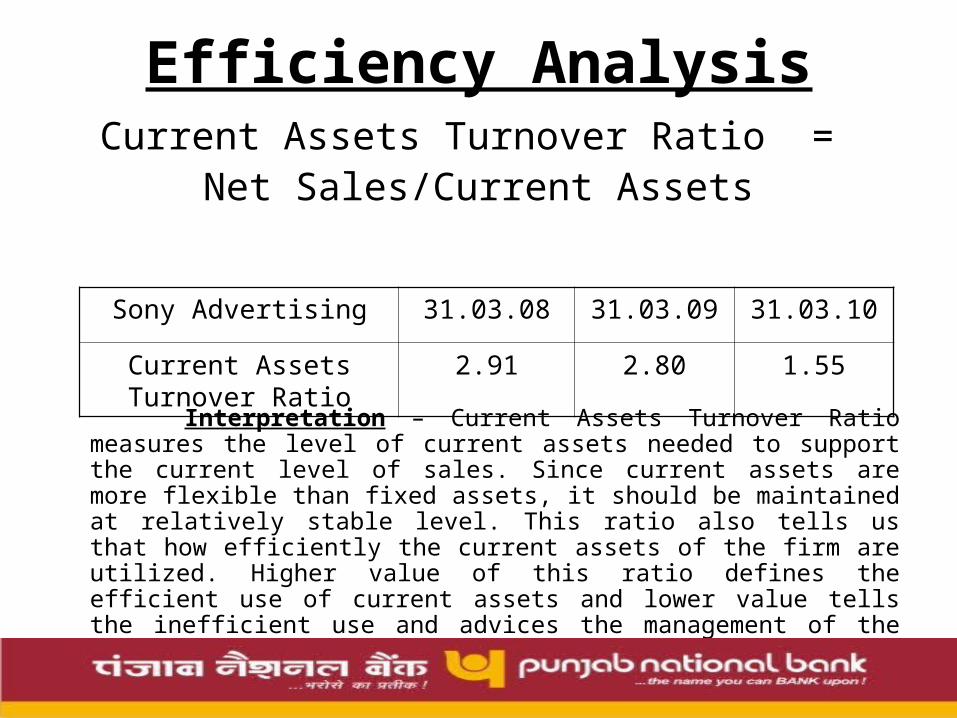
Efficiency AnalysisCurrent Assets Turnover Ratio =
Net Sales/Current Assets
Interpretation – Current Assets Turnover Ratio measures the level of current assets needed to support the current level of sales. Since current assets are more flexible than fixed assets, it should be maintained at relatively stable level. This ratio also tells us that how efficiently the current assets of the firm are utilized. Higher value of this ratio defines the efficient use of current assets and lower value tells the inefficient use and advices the management of the company to take appropriate action.
Sony Advertising 31.03.08 31.03.09 31.03.10
Current Assets Turnover Ratio
2.91 2.80 1.55
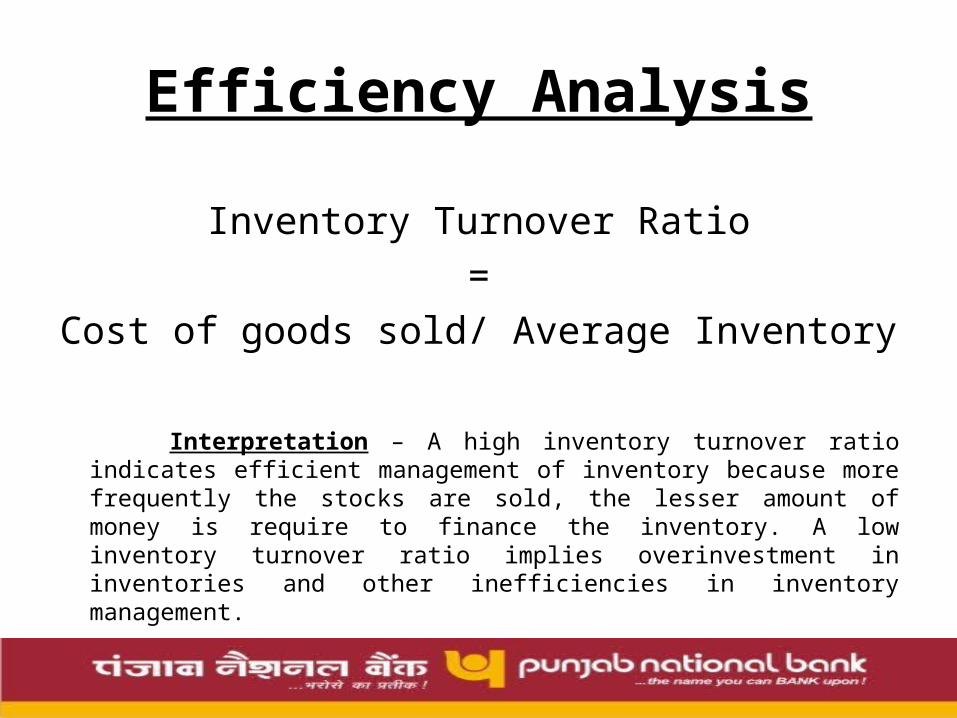
Efficiency Analysis
Inventory Turnover Ratio =
Cost of goods sold/ Average Inventory
Interpretation – A high inventory turnover ratio indicates efficient
management of inventory because more frequently the stocks are sold, the lesser amount of money is require to finance the inventory. A low inventory turnover ratio implies overinvestment in inventories and other inefficiencies in inventory management.
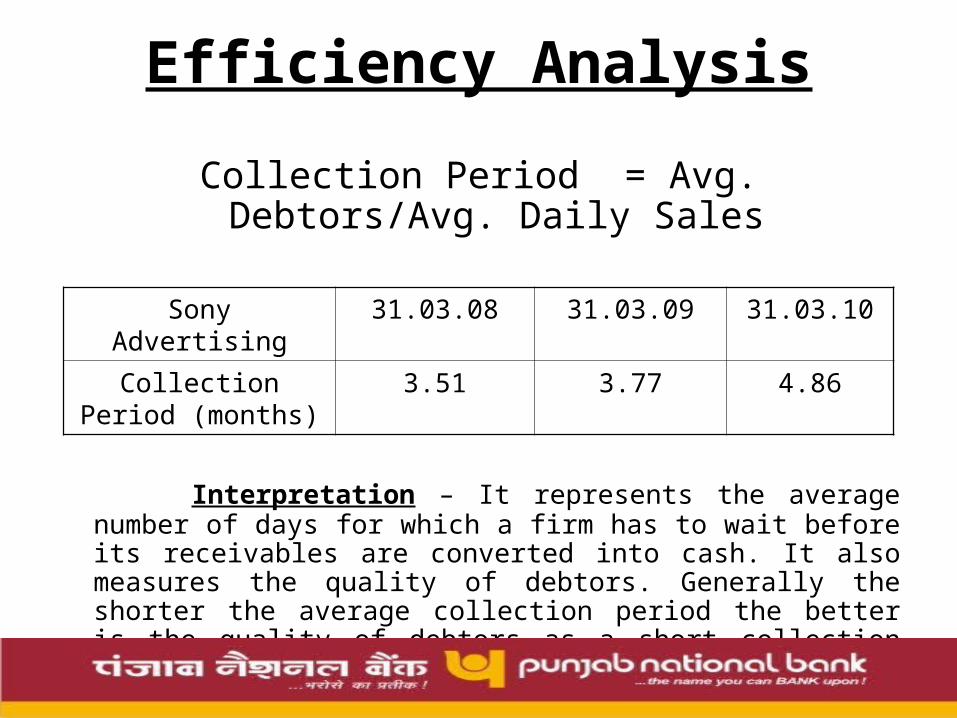
Efficiency Analysis
Collection Period = Avg. Debtors/Avg. Daily Sales
Interpretation – It represents the average number of days for which a firm has to wait before its receivables are converted into cash. It also measures the quality of debtors. Generally the shorter the average collection period the better is the quality of debtors as a short collection period implies quick payment by debtors. Longer the average collection period larger are the chances of bad debts.
Sony Advertising 31.03.08 31.03.09 31.03.10
Collection Period (months)
3.51 3.77 4.86
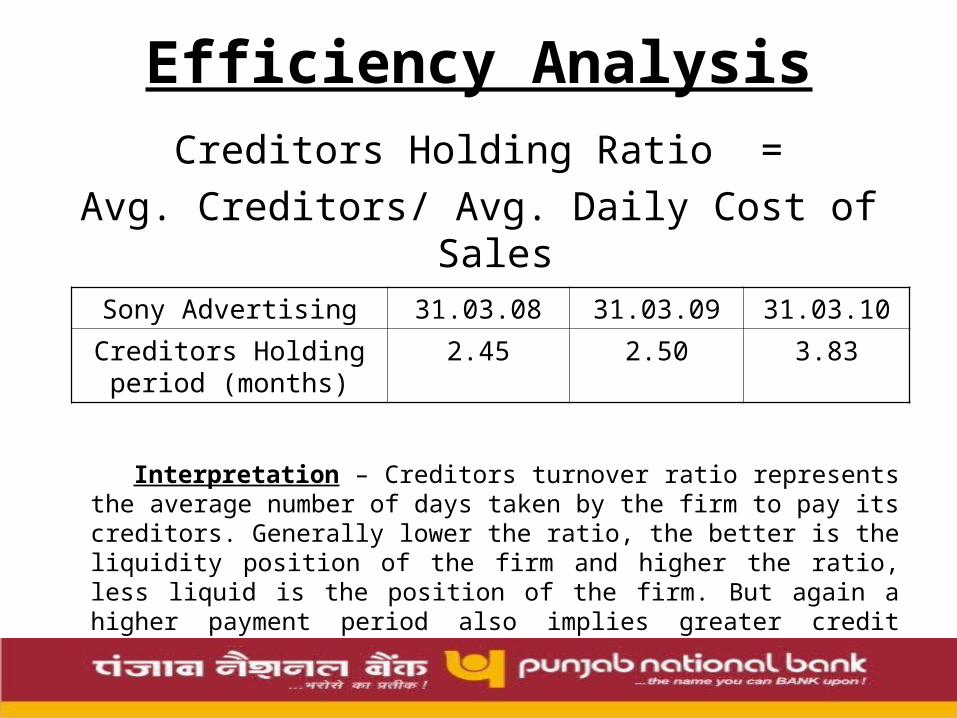
Efficiency AnalysisCreditors Holding Ratio =
Avg. Creditors/ Avg. Daily Cost of Sales
Interpretation – Creditors turnover ratio represents the average number of days taken by the firm to pay its creditors. Generally lower the ratio, the better is the liquidity position of the firm and higher the ratio, less liquid is the position of the firm. But again a higher payment period also implies greater credit period enjoyed by the firm which results in lower cost of funds and low working capital requirement.
Sony Advertising 31.03.08 31.03.09 31.03.10
Creditors Holding period (months)
2.45 2.50 3.83
Operations Analysis
Raw Material to Cost of Production =
Raw Material Expenses/ Cost of Production
Interpretation – This ratio indicates the proportion of raw material out of total cost of production. Lower the value, better the situation for the firm. This ratio can be used for comparative analysis, through which the firm can assess about the optimum quantity of raw material required for producing particular quantity of finished goods. This ratio is useful for calculation of working capital requirement of the organization.

Operations Analysis
Wages to Cost of Production =
Wages/ Cost of Production
Interpretation – This ratio indicates the proportion of wages out of total cost of production. Lower value of this ratio indicates the better efficiency of workers in producing the final goods or services. Further this ratio also provides about the appropriate number of workers required to produce goods or services.
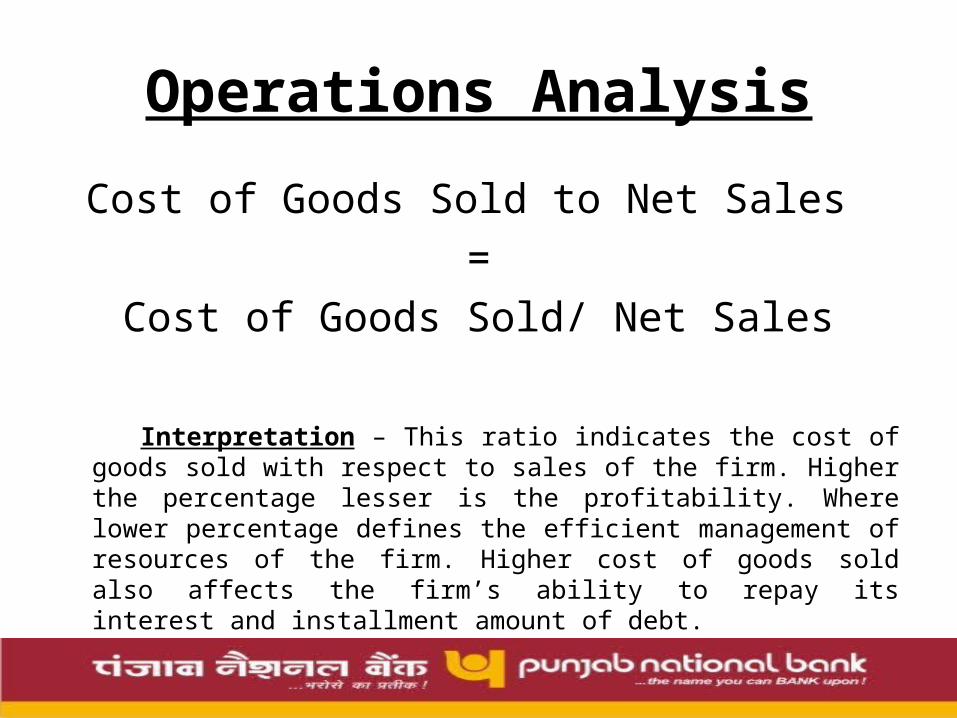
Operations Analysis
Cost of Goods Sold to Net Sales =
Cost of Goods Sold/ Net Sales
Interpretation – This ratio indicates the cost of goods sold with respect to sales of the firm. Higher the percentage lesser is the profitability. Where lower percentage defines the efficient management of resources of the firm. Higher cost of goods sold also affects the firm’s ability to repay its interest and installment amount of debt.

Limitations of Financial Analysis
• Financial Analysis is retrospective, not prospective examination• It is based on accounting data not on economic data• Financial Analysis does not capture significant off balance sheet
items• Ratios can be manipulated through acceptable alteration in
accounting policies• Quality of Data• Financial Statements reflect historical cost not necessarily current
economic cost• Do not incorporate opportunity cost or risk• Ignore cost of capital investments required to generate earnings• Difficult to compare with other opportunities when used in
isolation• May be affected by financing decisions

Cash Flow StatementsCash flow is the movement of cash into or out of a business, project, or financial product. It is usually measured during a specified, finite period of time. Measurement of cash flow can be used for calculating other parameters that give information on a company's value and situation.
-Calculation of DSCR;-IRR/ NPV Calculation;-Segmentation of Cost & Income.

As a first step in learning to prepare the statement of cash flows, you need to understand that Cash is generated by reductions in assets or increases in liabilities.
»Collection of accounts receivable increase cash and reduce receivables, an asset, and
»Increases in a bank loan increases cash and liabilities Cash is used to increase assets or to pay liabilities
»Cash is reduced to purchase fixed assets
»Cash is also reduced for Debt repayment
Preparation of the Statement of Cash Flows

The statement of cash flows is divided into three sections:
» Net cash from Operations - cash inflows and outflows relating to the firm’s normal business activities (i.e., cash operating profit and new cash flows from current assets and current liabilities) » Net cash from Investing activities - purchases and sales of long-term assets and marketable securities» Net cash from Financing activities - changes in long-term debt and equity, and the payment of dividends
Notice that the statement of cash flows combines both the income statement and the balance sheet. The sum of the three sections, therefore, yields the net change in cash for the period.There is always a built in check on the accuracy of the statement. Net cash flow plus the beginning balance in cash (last year’s ending balance) will always equal the ending balance in cash this year.
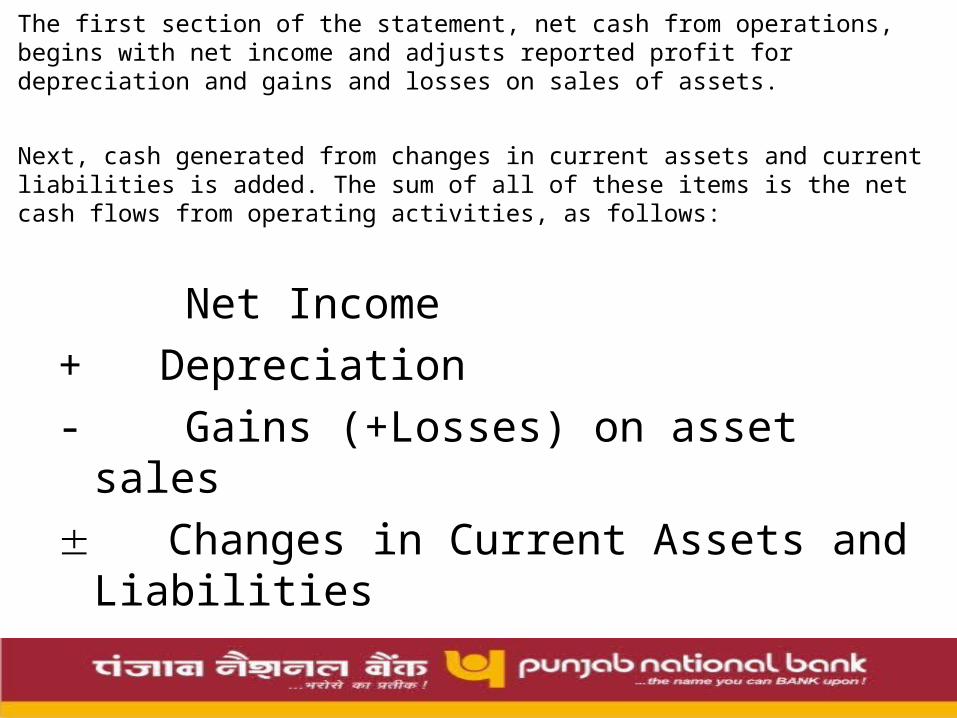
The first section of the statement, net cash from operations, begins with net income and adjusts reported profit for depreciation and gains and losses on sales of assets.
Next, cash generated from changes in current assets and current liabilities is added. The sum of all of these items is the net cash flows from operating activities, as follows:
Net Income
+ Depreciation
- Gains (+Losses) on asset sales
Changes in Current Assets and Liabilities
————————————————————
= Net Cash Flows from Operating Activities

The next section is the net cash flow from investing activities.
In this section, we are concerned with changes in the long-term portion of the asset section of the balance sheet: property, plant and equipment, and other long-term investments.
As with previous changes in balance sheet accounts, increases in these assets are recorded as cash outflows and decreases are recorded as cash inflows.

The last section deals with net cash flows from financing activities.
These include changes in long-term debt, sales and repurchases of stock, and dividends.
Increases in liabilities and equity are recorded as cash inflows and decreases as cash outflows. Dividends are also reflected as a cash outflow.
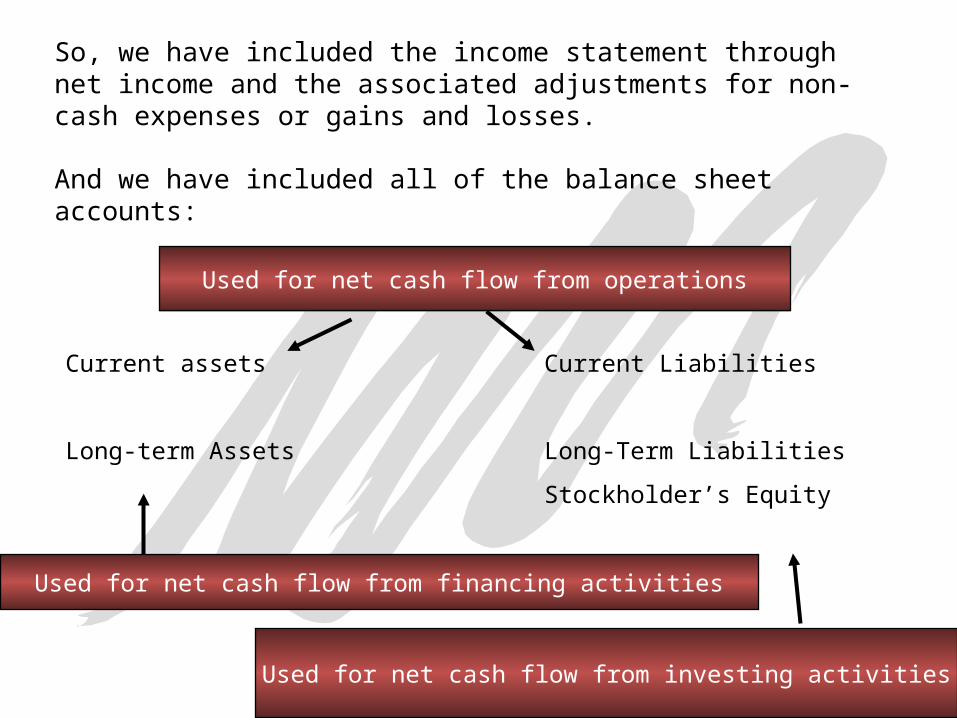
So, we have included the income statement through net income and the associated adjustments for non-cash expenses or gains and losses.
And we have included all of the balance sheet accounts:
Current assets Current Liabilities
Long-term Assets Long-Term Liabilities
Stockholder’s Equity
Used for net cash flow from financing activities
Used for net cash flow from operations
Used for net cash flow from investing activities

1998 1999 Change
Assets
Cash 25,500 4,400 21,100
Accounts Receivable 59,000 35,000 24,000
Inventories 30,000 50,000 20,000
Fixed Assets 165,000 180,000 15,000
Accumulated Depreciation (61,900) (80,400) 18,500
Fixed Assets (net) 103,100 99,600 3,500
Total Assets 217,600 189,000 28,600
Liabilities
Accounts Payable 62,600 40,500 22,100
Bonds Payable (long-term) 50,000 40,000 10,000
Equity
Common Stock 100,000 100,000 0
Retained Earnings 5,000 8,500 3,500
Total Liabilities and Equity 217,600 189,000 28,600
Sales 185,500Expenses:Cost of Goods sold 87,500Salaries expense 56,000Depreciation Expense 23,500Loss on sale of fixed assets 5,000Net income 13,500
Note:
Fixed assets originally costing Rs35,000 with Accumulated Depreciation of Rs.5,000 were sold for Rs.25,000
Dividends declared and paid during the year were Rs.10,000
Try to compute the statement of cash flows yourself before looking at the solution…

Net income 13500Depreciation 23500Loss on sale 5000Accounts Receivable 24000Inventory (20000)Accounts Payable (22100)Net cash from operations 23900 Sale of fixed assets 25000Purchase of fixed assets (50000)Net cash flow – investing (25,000) Bonds (10000)Dividends (10000)Net cash flow – financing (20000) Net change in cash (21100)Beginning cash 25500Ending cash 4400
Cash from Operating Activities
Adjustments related to investing activities
Adjustments related to Financing Activites
We start with net income
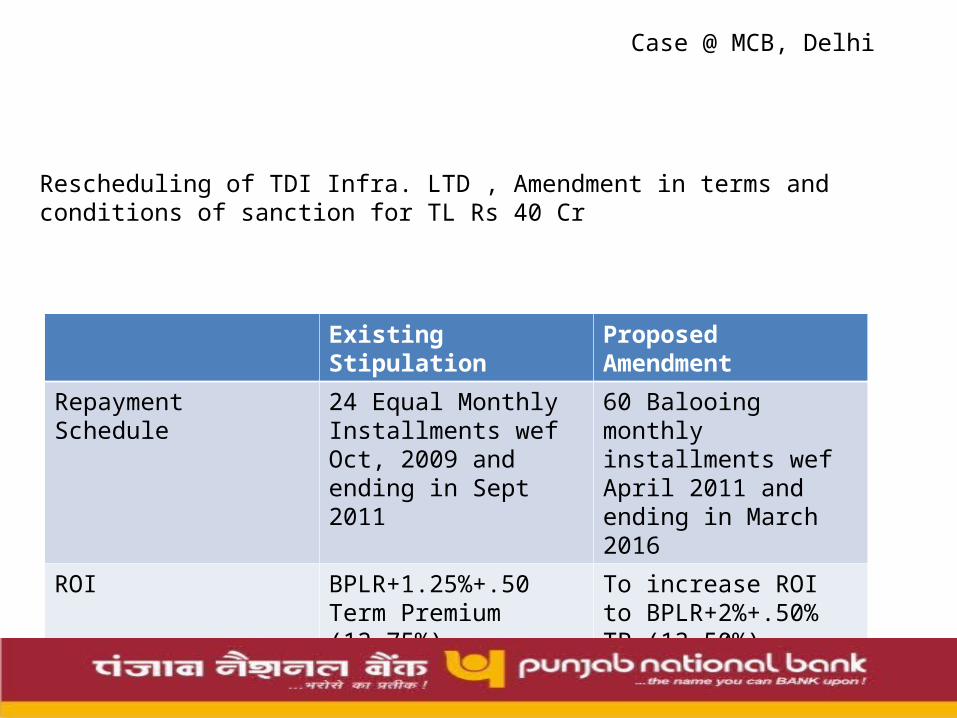
Case @ MCB, Delhi
Rescheduling of TDI Infra. LTD , Amendment in terms and conditions of sanction for TL Rs 40 Cr
Existing Stipulation Proposed Amendment
Repayment Schedule 24 Equal Monthly Installments wef Oct, 2009 and ending in Sept 2011
60 Balooing monthly installments wef April 2011 and ending in March 2016
ROI BPLR+1.25%+.50 Term Premium (12.75%)
To increase ROI to BPLR+2%+.50% TP (13.50%)

Based on the assumptions and the anticipated sales of the project, the company has projected cash flow during the project period.
The relevance lies in calculating DSCR over period of repayment
Note:- In case of any shortfall, the co. will be in a position to bring the funds from the own sources.
Limitations of Financial Analysis
• Financial Analysis is retrospective, not prospective examination• It is based on accounting data not on economic data• Financial Analysis does not capture significant off balance sheet
items• Ratios can be manipulated through acceptable alteration in
accounting policies• Quality of Data• Financial Statements reflect historical cost not necessarily current
economic cost• Do not incorporate opportunity cost or risk• Ignore cost of capital investments required to generate earnings• Difficult to compare with other opportunities when used in
isolation

Thank You• Presented By –• Ajay Kumar Yadav• Gaurav Gahlot• Saurav Bamania• Varun Singhal• Vishal Prasad