4. FINANCIAL ANALYSIS - Port of Los Angeles. FINANCIAL ANALYSIS The Financial Working Group (FWG)...
79
4. FINANCIAL ANALYSIS The Financial Working Group (FWG) has developed detailed financial analyses of the Task Force recommended control measures. The analyses include estimates of capital costs, operating costs, and cost effectiveness (expressed as cost per ton of emissions reduced). The FWG also assessed potential sources of funding to pay for or supplement the implementation of the measures. In addition, the Benefit Analysis Subgroup developed estimates of the benefits to public health from the projected emissions reductions in terms of avoidance of adverse health outcomes and assigned monetary values to those benefits. “Order of Magnitude” cost estimates for each of the control measures considered in the NNI analysis were developed and reviewed by the FWG. It is important for the reader to understand that the cost estimates presented in this report rely on a long string of assumptions (identified in previous sections) that were made during the technical analysis. These assumptions include, but are not limited to: very aggressive growth projections with no consideration of off-terminal constraints associated with the inland transportation system, numerous assumptions that are included in the 2001 baseline emissions inventory relating to emissions and activity, operational assumptions made by the various working groups, and decisions on control measures made by the Task Force itself. Also, the cost estimates have not been reviewed by the sources that will be asked to implement the proposed control measures. Therefore, these cost estimates should only be considered as preliminary “Order of Magnitude” estimates and should be further evaluated and updated as additional information becomes available. Further, the cost estimates should be part of the update to the NNI analysis that has been suggested previously to take place on three-year intervals. The costs identified for analysis by the FWG included those associated with existing and proposed regulatory measures, existing and proposed industry-funded efforts, existing port funded programs, and those unfunded measures directly related to achieving NNI. There were several costing issues that were not settled in the FWG and still need further analysis as the process moves forward and for some measures there were opposing cost estimates that were developed by different stake-holders. For example, rail measures R7 and R9 were estimated independently by the SCAQMD and the rail group, resulting in two different scenarios. After considerable debate, consensus could not be reached on accepting one scenario over the other and therefore, both scenarios were included in the cost measure estimates. In addition, there was considerable debate on the projected health benefits on to the NNI control measures and the monetary values assigned to those benefits. The following tables summarize the estimated emissions reductions from the proposed control measures, the “Order of Magnitude” cost estimates associated with those control measures, and the ARB mid-range estimates for the undiscounted health benefits valuation associated with the reduced emissions. The summaries are provided in five- year increments, with each successive five-year group becoming more speculative as assumptions and uncertainty grow. Financial Analysis 4-1 Section 4
Transcript of 4. FINANCIAL ANALYSIS - Port of Los Angeles. FINANCIAL ANALYSIS The Financial Working Group (FWG)...

4. FINANCIAL ANALYSIS The Financial Working Group (FWG) has developed detailed financial analyses of the Task Force recommended control measures. The analyses include estimates of capital costs, operating costs, and cost effectiveness (expressed as cost per ton of emissions reduced). The FWG also assessed potential sources of funding to pay for or supplement the implementation of the measures. In addition, the Benefit Analysis Subgroup developed estimates of the benefits to public health from the projected emissions reductions in terms of avoidance of adverse health outcomes and assigned monetary values to those benefits. “Order of Magnitude” cost estimates for each of the control measures considered in the NNI analysis were developed and reviewed by the FWG. It is important for the reader to understand that the cost estimates presented in this report rely on a long string of assumptions (identified in previous sections) that were made during the technical analysis. These assumptions include, but are not limited to: very aggressive growth projections with no consideration of off-terminal constraints associated with the inland transportation system, numerous assumptions that are included in the 2001 baseline emissions inventory relating to emissions and activity, operational assumptions made by the various working groups, and decisions on control measures made by the Task Force itself. Also, the cost estimates have not been reviewed by the sources that will be asked to implement the proposed control measures. Therefore, these cost estimates should only be considered as preliminary “Order of Magnitude” estimates and should be further evaluated and updated as additional information becomes available. Further, the cost estimates should be part of the update to the NNI analysis that has been suggested previously to take place on three-year intervals. The costs identified for analysis by the FWG included those associated with existing and proposed regulatory measures, existing and proposed industry-funded efforts, existing port funded programs, and those unfunded measures directly related to achieving NNI. There were several costing issues that were not settled in the FWG and still need further analysis as the process moves forward and for some measures there were opposing cost estimates that were developed by different stake-holders. For example, rail measures R7 and R9 were estimated independently by the SCAQMD and the rail group, resulting in two different scenarios. After considerable debate, consensus could not be reached on accepting one scenario over the other and therefore, both scenarios were included in the cost measure estimates. In addition, there was considerable debate on the projected health benefits on to the NNI control measures and the monetary values assigned to those benefits. The following tables summarize the estimated emissions reductions from the proposed control measures, the “Order of Magnitude” cost estimates associated with those control measures, and the ARB mid-range estimates for the undiscounted health benefits valuation associated with the reduced emissions. The summaries are provided in five-year increments, with each successive five-year group becoming more speculative as assumptions and uncertainty grow.
Financial Analysis 4-1 Section 4

Table 4-1. Summary Emissions Reduction Estimates for Proposed NNI Control
Measures
able 4-2. Cost Summary Estimates for Proposed Non-Regulatory Unfunded
2005 2006 2007 2008 2009 2005 - 2009(tons reduced) (tons reduced) (tons reduced) (tons reduced) (tons reduced) (tons reduced)
Oxides of Nitrogen 2,430 2,730 3,130 8,200 8,550 25,040Diesel Particulate Matter 110 80 80 800 800 1,870
2010 2011 2012 2013 2014 2010 - 2014(tons reduced) (tons reduced) (tons reduced) (tons reduced) (tons reduced) (tons reduced)
Oxides of Nitrogen 12,890 12,920 14,200 13,580 13,670 67,260Diesel Particulate Matter 1,110 1,130 1,180 1,200 1,230 5,850
2015 2016 2017 2018 2019 2015 - 2019(tons reduced) (tons reduced) (tons reduced) (tons reduced) (tons reduced) (tons reduced)
Oxides of Nitrogen 13,760 13,850 13,940 14,040 14,130 69,720Diesel Particulate Matter 1,260 1,290 1,320 1,360 1,390 6,620
2020 2021 2022 2023 2024 2020 - 2024(tons reduced) (tons reduced) (tons reduced) (tons reduced) (tons reduced) (tons reduced)
Oxides of Nitrogen 20,260 21,610 22,960 24,310 25,660 114,800Diesel Particulate Matter 1,420 1,450 1,490 1,520 1,550 7,430
2025(tons reduced) (tons reduced)
Oxides of Nitrogen 27,110 304,000Diesel Particulate Matter 1,590 23,000
Total NNI Control Measures
TControl Measures*
(2005 $) (2005 $) (2005 $) (2005 $) (2005 $) (2005 $)Cost Scenario 1 (w/SCAQMD R7 & R9) $10,000,000 $110,000,000 $70,000,000 $230,000,000 $200,000,000 $620,000,000Cost Scenario 2 (w/Rail R7 & R9) $11,000,000 $115,000,000 $125,000,000 $257,000,000 $228,000,000 $736,000,000
2010 2011 2012 2013 2014 2010 - 2014(2005 $) (2005 $) (2005 $) (2005 $) (2005 $) (2005 $)
Cost Scenario 1 (w/SCAQMD R7 & R9) $910,000,000 $180,000,000 $490,000,000 $200,000,000 $210,000,000 $1,990,000,000Cost Scenario 2 (w/Rail R7 & R9) $790,000,000 $195,000,000 $358,000,000 $245,000,000 $521,000,000 $2,109,000,000
2015 2016 2017 2018 2019 2015 - 2019(2005 $) (2005 $) (2005 $) (2005 $) (2005 $) (2005 $)
Cost Scenario 1 (w/SCAQMD R7 & R9) $920,000,000 $200,000,000 $480,000,000 $220,000,000 $490,000,000 $2,310,000,000Cost Scenario 2 (w/Rail R7 & R9) $1,841,000,000 $1,122,000,000 $1,395,000,000 $1,135,000,000 $935,000,000 $6,428,000,000
2020 2021 2022 2023 2024 2020 - 2024(2005 $) (2005 $) (2005 $) (2005 $) (2005 $) (2005 $)
Cost Scenario 1 (w/SCAQMD R7 & R9) $620,000,000 $240,000,000 $250,000,000 $1,130,000,000 $1,140,000,000 $3,380,000,000Cost Scenario 2 (w/Rail R7 & R9) $491,000,000 $228,000,000 $234,000,000 $1,114,000,000 $1,121,000,000 $3,188,000,000
2025(2005 $) (2005 $)
Cost Scenario 1 (w/SCAQMD R7 & R9) $1,150,000,000 * - The total cost estimates for implementing all measures considered $9,500,000,000Cost Scenario 2 (w/Rail R7 & R9) $1,130,000,000 under this plan range from $11.6 to $15.7 billion (funded + unfunded) $13,600,000,000
Total Unfunded Program Cost
2005 2006 2007 2008 2009 2005 - 2009
Financial Analysis 4-2 Section 4

Table 4-3 Summary Health Benefits Valuation (Undiscounted) Associated with NNI Control Measures*
The Health Benefits estimates in the table do not represent a consensus view of the Task Force. The rail representatives and the PMSA believe the Health Benefits analysis
users and surrounding communities.
The total “Order of Magnitude” costs associated with the NNI analysis, including the
hese FWG work products are described in greater detail in the following sections.
2005 2006 2007 2008 2009 2005 - 2009(2005 $) (2005 $) (2005 $) (2005 $) (2005 $) (2005 $)
Health Benefits Valuation (Mean) $91,000,000 $78,000,000 $80,000,000 $572,000,000 $585,000,000 $1,400,000,000
2010 2011 2012 2013 2014 2010 - 2014(2005 $) (2005 $) (2005 $) (2005 $) (2005 $) (2005 $)
Health Benefits Valuation (Mean) $858,000,000 $893,000,000 $956,000,000 $968,000,000 $999,000,000 $4,700,000,000
2015 2016 2017 2018 2019 2015 - 2019(2005 $) (2005 $) (2005 $) (2005 $) (2005 $) (2005 $)
Health Benefits Valuation (Mean) $1,032,000,000 $1,063,000,000 $1,095,000,000 $1,128,000,000 $1,162,000,000 $5,500,000,000
2020 2021 2022 2023 2024 2020 - 2024(2005 $) (2005 $) (2005 $) (2005 $) (2005 $) (2005 $)
Health Benefits Valuation (Mean) $1,280,000,000 $1,334,000,000 $1,390,000,000 $1,447,000,000 $1,505,000,000 $7,000,000,000
2025 Total Health Benefits Valuation (2005 $) (2005 $)
Health Benefits Valuation (Mean) $1,567,000,000 $20,200,000,000 * -is deeply flawed, is likely to mislead stakeholders and increase the risk that solutions will be ineffective as well as costly in terms of the resources available to the Port, lessees,
costs associated with complying with existing and proposed regulations, as well as existing industry efforts, is estimated between $11.6 billion (using SCAQMD rail estimates) and $15.7 billion (using the rail group estimates) over the 21-year study period. That cost is estimated to reduce over 300,000 tons NOx and 23,000 tons diesel particulate matter emissions between 2005 and 2025. Again, it is important to note that these results reflect inherent assumptions, such as growth rate that cannot be achieved without substantial improvements in the port and South Coast basin transportation infrastructure (which have not been defined nor included). T
Stakeholder Comments Received:
ail Industry R
alysis - Most of the assumptions employed by the FWG regarding technology availability,
f particular importance is the fact that the analysis does not offer implementation assumptions and costs
he TWG has assumed that rail activity levels will increase by over 350 percent and this will lead to a corresponding increase in emissions. However, in estimating the number of units required for each
4. Financial Anemissions, performance, and costs are speculative, represent over simplifications of rail operations, and are not well documented. The analysis either understates the costs or fails to include many costs that would arise with measure implementation. Othat reflect the unique nature of rail operations. This is apparent in the review of the measures that force the establishment of a dedicated locomotive fleet. Attendant to such a requirement are numerous operational complexities which go to the heart of the feasibility and cost of the control measures. T
Financial Analysis 4-3 Section 4

measure, it does not appear that there has been an increase in the amount of equipment required. For instance, the SCAQMD analysis for measures R7 (ultra low units), R9 (fuel), and R10 (idling controlassume 250 line-haul/heavy horsepower units and120 local switch units will be sufficient for compliancHowever, if rail activity grows by more than 350 percent, then the number of locomotives must be increased accordingly. Because this was not done, the SCAQMD dramatically underestimated the costs for all “additional” rail measures, R7—R11. Dave Howekamp
s) e.
The first paragraph, second sentence “… may realize through avoiding the adverse health outcomes that
ontinued increases in emissions” should be changed to “… will realize through
enefits
may occur due to cavoiding the adverse health outcomes that will occur due to continued increases in emissions”. The whole purpose of NNI is to protect public health so the report should not be shy about the fact that health bwill occur. Any uncertainty regarding the exact estimates of cost savings are dealt with in the CARB analysis.
4.1. Cost Estimates
ent schedule, the cost estimates were developed e. While diligent efforts have been made to accurately
, their costs are or will be borne by different ntities, primarily the Port and the owners or operators of the affected vessels, vehicles,
s or ther enforceable programs (such as the railroad MOU) which will be paid for by the
proposed regulations hich will be paid for by the affected companies or industries if/when promulgated and
To meet the NNI program developmwithin a very short time framconsider and reflect the relevant factors that will affect the cost of these measures, the estimates discussed and presented in this section should be viewed as order-of-magnitude cost estimates for comparison purposes, but should not be deemed reliable cost estimates for budgetary purposes. In addition to schedule constraints, the specificity of the cost estimates is influenced by the fact that the emission reduction measures that make up the NNI proposals are in various stages of planning and implementation, from the discussion/evaluation stage through fully implemented programs. Therefore, full details are not available for all of the measures. When these measures are implementedeor equipment. To reflect the different financial contributors and the various stages of implementation, the NNI measures have been categorized into the following groups: Existing Regulatory Costs (to industry) – These measures are promulgated regulationoaffected companies or industries. For example, OGV8 is an ARB requirement for ships operating in California waters to use lower-sulfur fuels. The cost of implementing this requirement (i.e., the differential cost of the fuel plus infrastructure costs to load, store, and burn the fuel) will be borne by the vessel owners or operators. Proposed Regulatory Costs (to industry) – These measures are weffective. For example, EPA plans to promulgate new emission standards for Category 1 and 2 marine engines that will affect harbor craft (HC6). The cost of implementing this requirement will be borne by engine manufacturers and purchasers.
Financial Analysis 4-4 Section 4
Existing and Proposed Non-Regulatory Industry-Funded Costs – These two categories cover measures that are non-regulatory programs that are or will be funded by industry.
or example, OGV2 is the Port’s voluntary speed reduction (VSR) program, the cost of
funded by the Port either directly or through incentive programs, such as R5 nd R6, the replacement of switching locomotives operating within the Port.
ces have not et been identified. Once funding sources are identified, some of these measures may be
rs, fuel suppliers, and industry representatives. To the extent possible iven the schedule constraints, they have been reviewed by appropriate industry
for the years in which the costs will be rst incurred. Operating costs are presented on an annual basis.
the categories discussed bove are displayed at top along with a brief description of the category. Below that on
Fwhich (in terms of the cost of delay caused by reducing speed) is borne by the vessel operators. Non-Regulatory Port-Funded Costs – These measures are non-regulatory programs that are currentlya Proposed Non-Regulatory Unfunded Costs – This category currently covers the majority of NNI measures that are not regulatory measures and for which funding souryreclassified into the Non-Regulatory Industry-Funded Costs (either existing or proposed, as appropriate). The cost estimates were developed using information from a variety of sources, including equipment vendogrepresentatives, whose comments and suggestions have been incorporated, again as feasible under the schedule. Further consideration and refinement should be undertaken to consider and/or address remaining concerns. The cost estimates have been prepared in terms of capital and operating costs. Capital costs have not been annualized but are presentedfi The cost estimates are summarized by year for each of the categories discussed above in Table 4-4. In this table, the color codes used to differentiate athe table is a summary by year of the totals of all measures in each financial category, and the overall 21-year totals are shown in the far right column of the table. Below the summary rows is a detailed list of all the NNI measures and their estimated costs by year. Where capital and operating costs have been identified these are shown on separate lines. Again, 21-year totals are displayed in the far right column. For each emission source category (ocean-going vessels, harbor craft, etc.), subtotal rows have been included that show the sums of the measures in each financial category. Two overall cost estimates have been prepared because of a considerable difference between estimates prepared by SCAQMD staff and railroad representatives for locomotive measures R7 and R9. Both estimates are presented for these measures, for the locomotive measures subtotal, and for the overall summary.
Financial Analysis 4-5 Section 4

Stakeholder Comments Received: Ed Avol Section 4.1 – This section on cost estimates needs some summary statements to guide the reader, rather than just leaving the tables to trudge through. A summary paragraph of the tables would be helpful as well, but at a minimum, it would be helpful to say something like the following: “Costs for reduction measures being contemplated for <each category: trucks/rail/OGV/…> are currently estimated to be $XYZ. Total reduction measure costs (all categories) are currently estimated to be $...”
Financial Analysis 4-6 Section 4

Table 4-4. Summary of Estimated Capital and Operating Costs KEY TO COLOR CODES:Existing Regulatory Costs (to industry) Existing regulatory requirements (may have future effective dates) with costs that will be incurred by industryProposed Regulatory Costs (to industry) Proposed regulatory requirements with costs that will be incurred by industry if enactedNon-Regulatory Industry-Funded Costs Existing non-regulatory programs that are currently funded by industryProposed Non-Regulatory Industry-Funded Costs Proposed non-regulatory programs that will be funded by industry if implementedNon-Regulatory Port-Funded Costs Existing non-regulatory programs that are currently funded by the port (or other entities)Proposed Non-Regulatory Unfunded Costs Proposed non-regulatory programs for which port/industry/other funding will be required if implemented
Summary Costs 2005 2006 2007 2008 2009 2010 2011 2012 2013 2014 2015 2016 2017 2018 2019 2020 2021 2022 2023 2024 2025 Total Program Cost(2005 $) (2005 $) (2005 $) (2005 $) (2005 $) (2005 $) (2005 $) (2005 $) (2005 $) (2005 $) (2005 $) (2005 $) (2005 $) (2005 $) (2005 $) (2005 $) (2005 $) (2005 $) (2005 $) (2005 $) (2005 $) (2005 $)
Existing Regulatory Costs (to industry) $1,000,000 $3,000,000 $4,000,000 $10,000,000 $10,000,000 $10,000,000 $10,000,000 $10,000,000 $10,000,000 $10,000,000 $10,000,000 $10,000,000 $20,000,000 $20,000,000 $20,000,000 $20,000,000 $20,000,000 $20,000,000 $20,000,000 $20,000,000 $30,000,000 $288,000,000Proposed Regulatory Costs (to industry) $0 $0 $0 $10,000,000 $10,000,000 $90,000,000 $50,000,000 $60,000,000 $70,000,000 $70,000,000 $80,000,000 $90,000,000 $90,000,000 $100,000,000 $100,000,000 $110,000,000 $110,000,000 $120,000,000 $120,000,000 $130,000,000 $140,000,000 $1,550,000,000Non-Regulatory Industry-Funded Costs $10,000,000 $1,000,000 $1,000,000 $10,000,000 $10,000,000 $10,000,000 $10,000,000 $10,000,000 $10,000,000 $10,000,000 $10,000,000 $10,000,000 $10,000,000 $10,000,000 $20,000,000 $20,000,000 $20,000,000 $20,000,000 $20,000,000 $20,000,000 $20,000,000 $262,000,000Proposed Non-Regulatory Industry-Funded Costs $0 $0 $0 $0 $0 $0 $0 $0 $0 $0 $0 $0 $0 $0 $0 $0 $0 $0 $0 $0 $0 $0Non-Regulatory Port-Funded Costs $15,600,000 $17,400,000 $2,700,000 $3,200,000 $1,400,000 $1,400,000 $600,000 $600,000 $600,000 $600,000 $600,000 $600,000 $600,000 $600,000 $600,000 $600,000 $600,000 $600,000 $600,000 $600,000 $600,000 $50,000,000Proposed Non-Regulatory Unfunded Costs (SCAQMD Rail Costing Scenario) $10,000,000 $110,000,000 $70,000,000 $230,000,000 $200,000,000 $910,000,000 $180,000,000 $490,000,000 $200,000,000 $210,000,000 $920,000,000 $200,000,000 $480,000,000 $220,000,000 $490,000,000 $620,000,000 $240,000,000 $250,000,000 $1,130,000,000 $1,140,000,000 $1,150,000,000 $9,450,000,000Prop. Non-Reg. Unfunded (Rail Group's Costing Scenario) $11,000,000 $115,000,000 $125,000,000 $257,000,000 $228,000,000 $790,000,000 $195,000,000 $358,000,000 $245,000,000 $521,000,000 $1,841,000,000 $1,122,000,000 $1,395,000,000 $1,135,000,000 $935,000,000 $491,000,000 $228,000,000 $234,000,000 $1,114,000,000 $1,121,000,000 $1,130,000,000 $13,591,000,000
Total Costs (SCAQMD Rail Costing Scenario) $36,600,000 $131,400,000 $77,700,000 $263,200,000 $231,400,000 $1,021,400,000 $250,600,000 $570,600,000 $290,600,000 $300,600,000 $1,020,600,000 $310,600,000 $600,600,000 $350,600,000 $630,600,000 $770,600,000 $390,600,000 $410,600,000 $1,290,600,000 $1,310,600,000 $1,340,600,000 $11,600,000,000Total Costs (Rail Group's Rail Costing Scenario) $37,600,000 $136,400,000 $132,700,000 $290,200,000 $259,400,000 $901,400,000 $265,600,000 $438,600,000 $335,600,000 $611,600,000 $1,941,600,000 $1,232,600,000 $1,515,600,000 $1,265,600,000 $1,075,600,000 $641,600,000 $378,600,000 $394,600,000 $1,274,600,000 $1,291,600,000 $1,320,600,000 $15,700,000,000Note: Certain costs currently presented in the yellow band (Proposed Non-Regulatory Unfunded Costs) may be reassigned to the blue band (Proposed Non-Regulatory Industry-Funded Costs) after evaluation by the port and/or the NNI Task Force)
Source Category DetailsProjection 2005 2006 2007 2008 2009 2010 2011 2012 2013 2014 2015 2016 2017 2018 2019 2020 2021 2022 2023 2024 2025 Total Program Cost
Ocean-Going Vessel Control Measures Line Cost Type (2005 $) (2005 $) (2005 $) (2005 $) (2005 $) (2005 $) (2005 $) (2005 $) (2005 $) (2005 $) (2005 $) (2005 $) (2005 $) (2005 $) (2005 $) (2005 $) (2005 $) (2005 $) (2005 $) (2005 $) (2005 $) (2005 $)OGV1 - New Engine Standards for Ships Green $/ton $0 $0 $0 $1,200,000 $2,500,000 $3,800,000 $4,100,000 $4,400,000 $5,300,000 $6,100,000 $7,000,000 $7,800,000 $8,700,000 $9,500,000 $10,300,000 $11,200,000 $12,000,000 $12,900,000 $13,700,000 $14,600,000 $15,400,000 $150,500,000OGV2 - VSR MOU Blue Operational $8,600,000 $500,000 $1,100,000 $10,200,000 $10,800,000 $11,300,000 $11,700,000 $12,000,000 $12,500,000 $12,900,000 $13,400,000 $13,800,000 $14,300,000 $14,700,000 $15,200,000 $15,600,000 $16,100,000 $16,500,000 $17,000,000 $17,400,000 $17,900,000 $263,500,000OGV3 - AMP Blue Capital $500,000 $0 $0 $0 $0 $0 $0 $0 $0 $0 $0 $0 $0 $0 $0 $0 $0 $0 $0 $0 $0 $500,000
Capital $3,900,000 $0 $0 $0 $0 $0 $0 $0 $0 $0 $0 $0 $0 $0 $0 $0 $0 $0 $0 $0 $0 $3,900,000Operational $700,000 $700,000 $700,000 $700,000 $700,000 $700,000 $700,000 $700,000 $700,000 $700,000 $700,000 $700,000 $700,000 $700,000 $700,000 $700,000 $700,000 $700,000 $700,000 $700,000 $700,000 $14,700,000
OGV4 - Auxiliary Engine Fuel Improvement Prog Blue Operational $100,000 $500,000 $1,000,000 $1,500,000 $0 $0 $0 $0 $0 $0 $0 $0 $0 $0 $0 $0 $0 $0 $0 $0 $0 $3,100,000OGV5 - New Cat3 Eng Standards (Low) Green $/ton $0 $0 $0 $0 $0 $0 $5,000,000 $10,000,000 $13,100,000 $16,300,000 $19,500,000 $22,700,000 $25,900,000 $29,100,000 $32,300,000 $35,400,000 $38,600,000 $41,800,000 $45,000,000 $48,200,000 $51,400,000 $434,300,000OGV6 - Reroute Cleanest Ships Blue $/ton $0 $0 $0 $4,300,000 $6,900,000 $9,500,000 $7,200,000 $5,000,000 $0 $0 $0 $0 $0 $0 $0 $0 $0 $0 $0 $0 $0 $32,900,000OGV7 - Low Emissions Main Engines Blue Capital $0 $0 $0 $0 $0 $0 $0 $0 $0 $0 $0 $0 $258,600,000 $0 $258,600,000 $258,600,000 $0 $0 $847,400,000 $847,400,000 $847,400,000 $3,318,000,000
Operational $0 $0 $0 $0 $0 $0 $0 $0 $0 $0 $0 $0 $400,000 $0 $900,000 $1,300,000 $1,300,000 $1,300,000 $2,100,000 $2,900,000 $4,900,000 $15,100,000OGV8 - Cleaner Fuels for Ship Aux Engines Blue Operational $0 $0 $0 $6,600,000 $7,000,000 $7,300,000 $7,600,000 $7,800,000 $8,100,000 $8,400,000 $8,700,000 $8,900,000 $9,200,000 $9,500,000 $9,800,000 $10,100,000 $10,400,000 $10,700,000 $11,000,000 $11,300,000 $11,600,000 $164,000,000OGV9 - Main Eng Fuel Improvement Prog Blue Operational $0 $0 $0 $3,400,000 $5,500,000 $0 $0 $0 $0 $0 $0 $0 $0 $0 $0 $0 $0 $0 $0 $0 $0 $8,900,000OGV10 - SECA Blue Operational $0 $0 $0 $0 $0 $7,500,000 $7,700,000 $8,000,000 $8,300,000 $8,600,000 $8,900,000 $9,200,000 $9,500,000 $9,800,000 $10,100,000 $10,400,000 $10,700,000 $11,000,000 $11,300,000 $11,600,000 $11,900,000 $154,500,000OGV11 - Expanded Auxiliary Fuel Imprv Prog Blue Operational $0 $0 $0 $0 $0 $0 $0 $0 $0 $0 $0 $0 $0 $0 $0 $0 $0 $0 $0 $0 $0 $0OGV12 - Expanded Main Eng Fuel Imprv Prog Blue Operational $0 $0 $0 $9,000,000 $13,700,000 $18,500,000 $19,100,000 $19,600,000 $20,400,000 $21,100,000 $21,800,000 $22,600,000 $23,300,000 $24,100,000 $24,800,000 $25,500,000 $26,300,000 $27,000,000 $27,800,000 $28,500,000 $29,200,000 $402,300,000OGV13 - Additional Auxiliary Eng Red Freq Callers Blue $/ton $0 $0 $0 $0 $0 $46,200,000 $0 $0 $0 $0 $0 $0 $0 $0 $0 $0 $0 $0 $0 $0 $0 $46,200,000OGV14 - Retro/Repower Req Infreq Callers Blue Capital $0 $0 $0 $0 $0 $520,000,000 $0 $0 $0 $0 $704,000,000 $0 $0 $0 $0 $0 $0 $0 $0 $0 $0 $1,224,000,000OGV15 - Expanded VSR Blue Capital $0 $40,000,000 $0 $0 $0 $0 $0 $0 $0 $0 $0 $0 $0 $0 $0 $0 $0 $0 $0 $0 $0 $40,000,000Add in Fuel Savings Operational $0 $9,400,000 $9,400,000 $28,300,000 $1,600,000 $31,400,000 $1,000,000 $33,300,000 $34,600,000 $35,800,000 $37,100,000 $38,400,000 $39,600,000 $40,900,000 $42,100,000 $43,400,000 $44,700,000 $45,900,000 $47,200,000 $48,400,000 $49,700,000 $662,200,000OGV16 - Expanded AMP Blue Capital $0 $10,500,000 $10,500,000 $61,200,000 $10,500,000 $65,403,750 $0 $56,246,250 $0 $0 $0 $0 $0 $0 $0 $0 $0 $0 $0 $0 $0 $214,350,000
Operational $0 $0 $0 $24,700,000 $39,700,000 $54,800,000 $80,200,000 $105,500,000 $109,500,000 $113,500,000 $117,500,000 $121,500,000 $125,500,000 $129,400,000 $133,400,000 $137,400,000 $141,400,000 $145,400,000 $149,400,000 $153,400,000 $157,400,000 $2,039,600,000OGV17 - Add In-Use Measures for Ships Blue $/ton $0 $0 $0 $0 $0 $19,400,000 $23,100,000 $26,800,000 $27,800,000 $28,800,000 $29,800,000 $30,800,000 $31,800,000 $32,900,000 $33,900,000 $34,900,000 $35,900,000 $36,900,000 $37,900,000 $38,900,000 $39,900,000 $510,000,000Existing Regulatory Costs (to industry) $0 $0 $0 $1,200,000 $2,500,000 $3,800,000 $4,100,000 $4,400,000 $5,300,000 $6,100,000 $7,000,000 $7,800,000 $8,700,000 $9,500,000 $10,300,000 $11,200,000 $12,000,000 $12,900,000 $13,700,000 $14,600,000 $15,400,000 $150,000,000Proposed Regulatory Costs (to industry) $0 $0 $0 $6,600,000 $7,000,000 $80,400,000 $43,400,000 $52,600,000 $57,300,000 $62,100,000 $66,900,000 $71,600,000 $76,400,000 $81,300,000 $86,100,000 $90,800,000 $95,600,000 $100,400,000 $105,200,000 $110,000,000 $114,800,000 $1,310,000,000Non-Regulatory Industry-Funded Costs $12,500,000 $500,000 $1,100,000 $10,200,000 $10,800,000 $11,300,000 $11,700,000 $12,000,000 $12,500,000 $12,900,000 $13,400,000 $13,800,000 $14,300,000 $14,700,000 $15,200,000 $15,600,000 $16,100,000 $16,500,000 $17,000,000 $17,400,000 $17,900,000 $270,000,000Proposed Non-Regulatory Industry-Funded Costs $0 $0 $0 $0 $0 $0 $0 $0 $0 $0 $0 $0 $0 $0 $0 $0 $0 $0 $0 $0 $0 $0Non-Regulatory Port-Funded Costs $1,300,000 $1,200,000 $1,700,000 $2,200,000 $700,000 $700,000 $700,000 $700,000 $700,000 $700,000 $700,000 $700,000 $700,000 $700,000 $700,000 $700,000 $700,000 $700,000 $700,000 $700,000 $700,000 $20,000,000Proposed Non-Regulatory Unfunded Costs $0 $59,900,000 $19,900,000 $130,900,000 $77,900,000 $699,603,750 $107,500,000 $219,646,250 $164,500,000 $170,400,000 $880,400,000 $182,500,000 $447,400,000 $194,400,000 $459,800,000 $466,200,000 $213,700,000 $219,600,000 $1,073,900,000 $1,080,600,000 $1,088,600,000 $7,960,000,000Total Costs $12,500,000 $500,000 $1,100,000 $18,000,000 $20,300,000 $95,500,000 $59,200,000 $69,000,000 $75,100,000 $81,100,000 $87,300,000 $93,200,000 $99,400,000 $105,500,000 $111,600,000 $117,600,000 $123,700,000 $129,800,000 $135,900,000 $142,000,000 $148,100,000 $9,710,000,000
Projection 2005 2006 2007 2008 2009 2010 2011 2012 2013 2014 2015 2016 2017 2018 2019 2020 2021 2022 2023 2024 2025 Total Program CostHarbor Craft Control Measures Line Cost Type (2005 $) (2005 $) (2005 $) (2005 $) (2005 $) (2005 $) (2005 $) (2005 $) (2005 $) (2005 $) (2005 $) (2005 $) (2005 $) (2005 $) (2005 $) (2005 $) (2005 $) (2005 $) (2005 $) (2005 $) (2005 $) (2005 $)HC1 - New Engine Standards for Harbor Craft Green $/ton $700,000 $800,000 $1,000,000 $1,100,000 $2,100,000 $3,000,000 $2,300,000 $1,600,000 $1,700,000 $1,800,000 $1,800,000 $1,900,000 $2,000,000 $2,100,000 $2,200,000 $2,200,000 $2,300,000 $2,400,000 $2,500,000 $2,500,000 $2,600,000 $40,600,000HC2 - Clean Fuels for Harbor Craft Green Operational $0 $0 $400,000 $400,000 $400,000 $400,000 $400,000 $400,000 $400,000 $400,000 $400,000 $400,000 $400,000 $400,000 $400,000 $400,000 $400,000 $400,000 $400,000 $500,000 $500,000 $7,800,000HC3 - Early Implementation ULSD Blue Operational $200,000 $100,000 $0 $0 $0 $0 $0 $0 $0 $0 $0 $0 $0 $0 $0 $0 $0 $0 $0 $0 $0 $300,000HC4 - Dredging Activities Blue No reduction takenHC5 - TAC HC Measures (Included in China Shipping Settlemen Blue $2,700,000HC6 - New Engine Stds - Cat 1/Cat 2 Green $/ton $0 $0 $0 $0 $0 $0 $0 $0 $400,000 $900,000 $1,300,000 $1,700,000 $2,100,000 $2,600,000 $3,000,000 $3,400,000 $3,800,000 $4,300,000 $4,700,000 $5,100,000 $5,500,000 $38,800,000HC7 - Emulsified Fuel for Harbor Craft Mrn Eng Blue Operational $0 $600,000 $600,000 $2,200,000 $2,200,000 $2,200,000 $2,200,000 $2,200,000 $2,200,000 $2,200,000 $2,200,000 $2,200,000 $2,200,000 $2,200,000 $2,200,000 $2,200,000 $2,200,000 $2,200,000 $2,200,000 $2,200,000 $2,200,000 $40,800,000HC8 - In-Use HC Emission Reduction Measure (ATCM) Blue $/ton $0 $0 $0 $0 $0 $5,100,000 $5,400,000 $5,700,000 $6,200,000 $6,800,000 $7,300,000 $7,800,000 $8,400,000 $8,900,000 $9,400,000 $9,900,000 $10,500,000 $11,000,000 $11,500,000 $12,100,000 $12,600,000 $138,600,000HC9 - Repower Existing Craft Blue Capital $8,000,000 $8,000,000 $8,000,000 $8,000,000 $8,000,000 $0 $0 $0 $0 $0 $0 $0 $0 $0 $0 $0 $0 $0 $0 $0 $0 $40,000,000HC10 - Retrofit Existing Craft Blue Capital $0 $0 $0 $1,800,000 $1,800,000 $1,800,000 $1,800,000 $1,800,000 $0 $0 $0 $0 $0 $0 $0 $0 $0 $0 $0 $0 $0 $9,000,000HC11 - AMP Ready Staging Areas Blue Capital $0 $0 $0 $200,000 $0 $0 $0 $0 $0 $0 $0 $0 $0 $0 $0 $0 $0 $0 $0 $0 $0 $200,000Existing Regulatory Costs (to industry) $700,000 $800,000 $1,400,000 $1,500,000 $2,500,000 $3,400,000 $2,700,000 $2,000,000 $2,100,000 $2,200,000 $2,200,000 $2,300,000 $2,400,000 $2,500,000 $2,600,000 $2,600,000 $2,700,000 $2,800,000 $2,900,000 $3,000,000 $3,100,000 $50,000,000Proposed Regulatory Costs (to industry) $0 $0 $0 $0 $0 $5,100,000 $5,400,000 $5,700,000 $6,600,000 $7,700,000 $8,600,000 $9,500,000 $10,500,000 $11,500,000 $12,400,000 $13,300,000 $14,300,000 $15,300,000 $16,200,000 $17,200,000 $18,100,000 $180,000,000Non-Regulatory Industry-Funded Costs $0 $0 $0 $0 $0 $0 $0 $0 $0 $0 $0 $0 $0 $0 $0 $0 $0 $0 $0 $0 $0 $0Proposed Non-Regulatory Industry-Funded Costs $0 $0 $0 $0 $0 $0 $0 $0 $0 $0 $0 $0 $0 $0 $0 $0 $0 $0 $0 $0 $0 $0Non-Regulatory Port-Funded Costs $200,000 $100,000 $0 $0 $0 $0 $0 $0 $0 $0 $0 $0 $0 $0 $0 $0 $0 $0 $0 $0 $0 $300,000Proposed Non-Regulatory Unfunded Costs $8,000,000 $8,600,000 $8,600,000 $12,200,000 $12,000,000 $4,000,000 $4,000,000 $4,000,000 $2,200,000 $2,200,000 $2,200,000 $2,200,000 $2,200,000 $2,200,000 $2,200,000 $2,200,000 $2,200,000 $2,200,000 $2,200,000 $2,200,000 $2,200,000 $90,000,000
$8,900,000 $9,500,000 $10,000,000 $13,700,000 $14,500,000 $12,500,000 $12,100,000 $11,700,000 $10,900,000 $12,100,000 $13,000,000 $14,000,000 $15,100,000 $16,200,000 $17,200,000 $18,100,000 $19,200,000 $20,300,000 $21,300,000 $22,400,000 $23,400,000Total Costs $320,000,000
Financial Analysis 4-7 Section 4

Table 4-4. Summary of Estimated Capital and Operating Costs (continued) Projection 2005 2006 2007 2008 2009 2010 2011 2012 2013 2014 2015 2016 2017 2018 2019 2020 2021 2022 2023 2024 2025 Total Program Cost
Cargo Handling Equipment Control Measures Line Cost Type (2005 $) (2005 $) (2005 $) (2005 $) (2005 $) (2005 $) (2005 $) (2005 $) (2005 $) (2005 $) (2005 $) (2005 $) (2005 $) (2005 $) (2005 $) (2005 $) (2005 $) (2005 $) (2005 $) (2005 $) (2005 $) (2005 $)CHE1 - Emission Stands. for HD Nonroad Diesel Engines Green $0 $0 $0 $0 $0 $0 $0 $0 $0 $0 $0 $0 $0 $0 $0 $0 $0 $0 $0 $0 $0 $0CHE2 - YT Modernization & ULSD Blue Captial $2,100,000 $4,500,000 $0 $0 $0 $0 $0 $0 $0 $0 $0 $0 $0 $0 $0 $0 $0 $0 $0 $0 $0 $6,600,000
Operational $1,000,000 $500,000 $0 $0 $0 $0 $0 $0 $0 $0 $0 $0 $0 $0 $0 $0 $0 $0 $0 $0 $0 $1,500,000CHE3 - Early Impl. ULSD for non-YT Blue Operational $200,000 $300,000 $0 $0 $0 $0 $0 $0 $0 $0 $0 $0 $0 $0 $0 $0 $0 $0 $0 $0 $0 $500,000CHE4 - Alternative Yard Tractor Resolution Blue No reduction takenCHE5 - Emulsified Fuels Blue Operational $300,000 $300,000 $0 $0 $0 $0 $0 $0 $0 $0 $0 $0 $0 $0 $0 $0 $0 $0 $0 $0 $0 $600,000CHE6 - TAC CHE Measures (Included in China Shipping Settl Blue $800,000CHE7 - Expanded YT Modernization Blue Captial $0 $0 $4,500,000 $6,600,000 $3,000,000 $4,500,000 $5,900,000 $6,600,000 $0 $0 $0 $0 $0 $0 $0 $0 $0 $0 $0 $0 $0 $31,100,000CHE8 - Enhanced CHE Modernization Blue Captial $0 $17,900,000 $17,900,000 $0 $0 $0 $18,700,000 $18,700,000 $18,700,000 $18,700,000 $0 $0 $0 $0 $0 $0 $0 $0 $0 $0 $0 $110,600,000CHE9 - CHE at Ports & IM Rail Yards Blue $/ton $0 $0 $0 $0 $0 $4,300,000 $4,500,000 $4,800,000 $4,600,000 $4,400,000 $4,200,000 $4,000,000 $3,800,000 $3,600,000 $3,400,000 $3,200,000 $3,100,000 $2,900,000 $2,700,000 $2,500,000 $2,300,000 $58,300,000Existing Regulatory Costs (to industry) $0 $0 $0 $0 $0 $0 $0 $0 $0 $0 $0 $0 $0 $0 $0 $0 $0 $0 $0 $0 $0 $0Proposed Regulatory Costs (to industry) $0 $0 $0 $0 $0 $4,300,000 $4,500,000 $4,800,000 $4,600,000 $4,400,000 $4,200,000 $4,000,000 $3,800,000 $3,600,000 $3,400,000 $3,200,000 $3,100,000 $2,900,000 $2,700,000 $2,500,000 $2,300,000 $60,000,000Non-Regulatory Industry-Funded Costs $0 $0 $0 $0 $0 $0 $0 $0 $0 $0 $0 $0 $0 $0 $0 $0 $0 $0 $0 $0 $0 $0Proposed Non-Regulatory Industry-Funded Costs $0 $0 $0 $0 $0 $0 $0 $0 $0 $0 $0 $0 $0 $0 $0 $0 $0 $0 $0 $0 $0 $0Non-Regulatory Port-Funded Costs $3,600,000 $5,600,000 $0 $0 $0 $0 $0 $0 $0 $0 $0 $0 $0 $0 $0 $0 $0 $0 $0 $0 $0 $9,200,000Proposed Non-Regulatory Unfunded Costs $0 $17,900,000 $22,400,000 $6,600,000 $3,000,000 $4,500,000 $24,600,000 $25,300,000 $18,700,000 $18,700,000 $0 $0 $0 $0 $0 $0 $0 $0 $0 $0 $0 $140,000,000Total Costs $3,600,000 $23,500,000 $22,400,000 $6,600,000 $3,000,000 $8,800,000 $29,100,000 $30,100,000 $23,300,000 $23,100,000 $4,200,000 $4,000,000 $3,800,000 $3,600,000 $3,400,000 $3,200,000 $3,100,000 $2,900,000 $2,700,000 $2,500,000 $2,300,000 $210,000,000
Projection 2005 2006 2007 2008 2009 2010 2011 2012 2013 2014 2015 2016 2017 2018 2019 2020 2021 2022 2023 2024 2025 Total Program CostRail Locomotive Control Measures Line Cost Type (2005 $) (2005 $) (2005 $) (2005 $) (2005 $) (2005 $) (2005 $) (2005 $) (2005 $) (2005 $) (2005 $) (2005 $) (2005 $) (2005 $) (2005 $) (2005 $) (2005 $) (2005 $) (2005 $) (2005 $) (2005 $) (2005 $)R1 - Tier 0, 1, 2 Locomotive Standards GreenR2 - ARB Diesel Fuel Used by Intrastate Locomotives Blue $/ton $0 $100,000 $100,000 $100,000 $100,000 $100,000 $100,000 $100,000 $100,000 $100,000 $100,000 $100,000 $100,000 $100,000 $100,000 $100,000 $200,000 $200,000 $200,000 $200,000 $200,000 $2,500,000R3 - Federal Standards for Nonroad Diesel Fuel Blue $/ton $0 $0 $0 $40,000 $50,000 $90,000 $250,000 $410,000 $430,000 $450,000 $470,000 $500,000 $520,000 $540,000 $560,000 $580,000 $600,000 $620,000 $640,000 $660,000 $680,000 $8,090,000R4 - Railroad MOU GreenR5 - PHL Modernization & ULSD Program Blue Capital $4,800,000 $4,800,000 $0 $0 $0 $0 $0 $0 $0 $0 $0 $0 $0 $0 $0 $0 $0 $0 $0 $0 $0 $9,600,000
Operational $100,000 $100,000 $0 $0 $0 $0 $0 $0 $0 $0 $0 $0 $0 $0 $0 $0 $0 $0 $0 $0 $0 $200,000R6 - Ultra-Low Emission Switcher Locomotives: PHL Blue Capital $0 $0 $1,100,000 $1,100,000 $800,000 $800,000 $0 $0 $0 $0 $0 $0 $0 $0 $0 $0 $0 $0 $0 $0 $0 $3,800,000
Operational $0 $0 -$100,000 -$100,000 -$100,000 -$100,000 -$100,000 -$100,000 -$100,000 -$100,000 -$100,000 -$100,000 -$100,000 -$100,000 -$100,000 -$100,000 -$100,000 -$100,000 -$100,000 -$100,000 -$100,000 -$1,900,000R7 - Ultra-Low Emission Switcher & Line Haul: Class 1 Blue Capital $0 $0 $0 $26,300,000 $26,300,000 $167,700,000 $26,300,000 $178,300,000 $0 $0 $0 $700,000 $700,000 $2,500,000 $700,000 $117,800,000 $0 $0 $0 $700,000 $700,000 $548,700,000(SCAQMD Cost Est) Operational $0 $0 $0 -$1,400,000 -$1,400,000 $6,300,000 $6,300,000 $7,900,000 $7,900,000 $7,900,000 $7,900,000 $7,900,000 $7,900,000 $7,900,000 $7,900,000 $15,100,000 $15,100,000 $15,100,000 $15,100,000 $15,100,000 $20,000,000 $168,500,000R7 - ULE Switcher & Line Haul: Class 1 (Rail Group Cost Est) Blue Capital/Op $0 $0 $0 $0 $0 $0 $0 $0 $0 $270,000,000 $877,500,000 $877,500,000 $877,500,000 $877,500,000 $455,000,000 $0 $0 $0 $0 $0 $0 $4,235,000,000R8 - Tier 3 Engine Standards Not included No reduction takenR9 - ARB Diesel for Class 1 (SCAQMD Cost Est) Blue Operational $0 $0 $1,900,000 $2,100,000 $2,300,000 $2,600,000 $2,700,000 $2,800,000 $2,900,000 $3,000,000 $3,100,000 $3,200,000 $3,400,000 $3,500,000 $3,500,000 $3,700,000 $3,900,000 $4,000,000 $4,100,000 $4,200,000 $4,400,000 $61,300,000R9 - ARB Diesel for Class 1 (Rail Group Cost Est) Blue Operational $0 $0 $51,900,000 $52,100,000 $52,300,000 $52,600,000 $52,700,000 $52,800,000 $52,900,000 $53,000,000 $53,100,000 $53,200,000 $53,400,000 $53,500,000 $3,500,000 $3,700,000 $3,900,000 $4,000,000 $4,100,000 $4,200,000 $4,400,000 $661,300,000R10 - Idling Controls for Switchers & Line Haul Blue Capital $0 $2,800,000 $0 $0 $0 $0 $0 $0 $0 $0 $0 $0 $0 $0 $0 $0 $0 $0 $0 $0 $0 $2,800,000
Operational $0 -$40,000 -$40,000 -$40,000 -$40,000 -$40,000 -$40,000 -$40,000 -$40,000 -$40,000 -$40,000 -$40,000 -$40,000 -$40,000 -$40,000 -$40,000 -$40,000 -$40,000 -$40,000 -$40,000 -$40,000 -$800,000R11 - Efficiency Improvement on In-Use Rail Equipment Blue $/ton $600,000 $800,000 $900,000 $1,100,000 $1,100,000 $1,200,000 $0 $0 $0 $0 $0 $0 $0 $0 $0 $0 $0 $0 $0 $0 $0 $5,700,000R12 - Electrification of Alameda Corridor Not included No reduction takenExisting Regulatory Costs (to industry) $0 $100,000 $100,000 $140,000 $150,000 $190,000 $350,000 $510,000 $530,000 $550,000 $570,000 $600,000 $620,000 $640,000 $660,000 $680,000 $800,000 $820,000 $840,000 $860,000 $880,000 $10,000,000Proposed Regulatory Costs (to industry) $0 $0 $0 $0 $0 $0 $0 $0 $0 $0 $0 $0 $0 $0 $0 $0 $0 $0 $0 $0 $0 $0Non-Regulatory Industry-Funded Costs $0 $0 $0 $0 $0 $0 $0 $0 $0 $0 $0 $0 $0 $0 $0 $0 $0 $0 $0 $0 $0 $0Proposed Non-Regulatory Industry-Funded Costs $0 $0 $0 $0 $0 $0 $0 $0 $0 $0 $0 $0 $0 $0 $0 $0 $0 $0 $0 $0 $0 $0Non-Regulatory Port-Funded Costs $4,900,000 $4,900,000 $1,000,000 $1,000,000 $700,000 $700,000 -$100,000 -$100,000 -$100,000 -$100,000 -$100,000 -$100,000 -$100,000 -$100,000 -$100,000 -$100,000 -$100,000 -$100,000 -$100,000 -$100,000 -$100,000 $10,000,000Proposed Non-Regulatory Unfunded Costs $600,000 $3,560,000 $2,760,000 $28,060,000 $28,260,000 $177,760,000 $35,260,000 $188,960,000 $10,760,000 $10,860,000 $10,960,000 $11,760,000 $11,960,000 $13,860,000 $12,060,000 $136,560,000 $18,960,000 $19,060,000 $19,160,000 $19,960,000 $25,060,000 $790,000,000Prop. Non-Reg. Unfunded (high end) $600,000 $3,560,000 $52,760,000 $53,160,000 $53,360,000 $53,760,000 $52,660,000 $52,760,000 $52,860,000 $322,960,000 $930,560,000 $930,660,000 $930,860,000 $930,960,000 $458,460,000 $3,660,000 $3,860,000 $3,960,000 $4,060,000 $4,160,000 $4,360,000 $4,900,000,000Total Costs (SCAQMD Rail Costing Scenario) $5,500,000 $8,560,000 $3,860,000 $29,200,000 $29,110,000 $178,650,000 $35,510,000 $189,370,000 $11,190,000 $11,310,000 $11,430,000 $12,260,000 $12,480,000 $14,400,000 $12,620,000 $137,140,000 $19,660,000 $19,780,000 $19,900,000 $20,720,000 $25,840,000 $810,000,000Total Costs (Rail Group's Rail Costing Scenario) $5,500,000 $8,560,000 $53,860,000 $54,300,000 $54,210,000 $54,650,000 $52,910,000 $53,170,000 $53,290,000 $323,410,000 $931,030,000 $931,160,000 $931,380,000 $931,500,000 $459,020,000 $4,240,000 $4,560,000 $4,680,000 $4,800,000 $4,920,000 $5,140,000 $4,920,000,000
Projection 2005 2006 2007 2008 2009 2010 2011 2012 2013 2014 2015 2016 2017 2018 2019 2020 2021 2022 2023 2024 2025 Total Program CostHeavy-Duty Vehicle Control Measures Line Cost Type (2005 $) (2005 $) (2005 $) (2005 $) (2005 $) (2005 $) (2005 $) (2005 $) (2005 $) (2005 $) (2005 $) (2005 $) (2005 $) (2005 $) (2005 $) (2005 $) (2005 $) (2005 $) (2005 $) (2005 $) (2005 $) (2005 $)HDV1 - 2004 Emission Stds GreenHDV2 - 2007 Emission Stds GreenHDV3 - Gateway Cities (Portion maybe funded under Near Ter Blue Capital $5,600,000 $5,600,000 $0 $0 $0 $0 $0 $0 $0 $0 $0 $0 $0 $0 $0 $0 $0 $0 $0 $0 $0 $11,200,000HDV4 - Engine Software Upgrade GreenHDV5 - ULSD Green Operational $0 $2,100,000 $2,200,000 $2,300,000 $2,400,000 $2,600,000 $2,700,000 $2,900,000 $3,100,000 $3,300,000 $3,600,000 $3,800,000 $4,000,000 $4,200,000 $4,500,000 $4,700,000 $4,900,000 $5,200,000 $5,400,000 $5,600,000 $5,900,000 $75,400,000HDV6 - HD I&M GreenHDV7 - Periodic Smoke Inspection GreenHDV8 - Community-Based Inspections GreenHDV 9 - Reduced Truck Idling GreenHDV10 - Exp Gateway Cities Not included Capital $0 $13,800,000 $15,300,000 $39,200,000 $75,000,000 $0 $0 $41,200,000 $0 $0 $0 $0 $0 $0 $0 $0 $0 $0 $0 $0 $0 $184,500,000HDV11 - CA HDV Stds & Fleet Mod for Mexican Trucks Not includedHDV12 - Early ULSD Implementation Blue Operational $200,000 $100,000 $0 $0 $0 $0 $0 $0 $0 $0 $0 $0 $0 $0 $0 $0 $0 $0 $0 $0 $0 $300,000HDV13 - Retrofit HDVs with DOCs Blue Capital $700,000 $700,000 $0 $0 $0 $0 $0 $0 $0 $0 $0 $0 $0 $0 $0 $0 $0 $0 $0 $0 $0 $1,400,000HDV14 - Retrofit HDVs w/ DPFs Blue Capital $0 $6,300,000 $2,600,000 $7,400,000 $0 $0 $0 $0 $0 $0 $0 $0 $0 $0 $0 $0 $0 $0 $0 $0 $0 $16,300,000HDV15 - PM In-Use Emission Control Blue $/ton $0 $0 $0 $1,089 $1,568 $2,047 $1,834 $1,620 $1,514 $1,409 $1,303 $1,197 $1,091 $985 $879 $774 $668 $562 $456 $350 $244 $20,000HDV16 - On-Board Diagnostics Not included No reduction takenHDV17 - Transportation Refrigeration Units Not included No reduction takenHDV18 - Electrified Truck Spaces Not included No reduction takenExisting Regulatory Costs (to industry) $0 $2,100,000 $2,200,000 $2,300,000 $2,400,000 $2,600,000 $2,700,000 $2,900,000 $3,100,000 $3,300,000 $3,600,000 $3,800,000 $4,000,000 $4,200,000 $4,500,000 $4,700,000 $4,900,000 $5,200,000 $5,400,000 $5,600,000 $5,900,000 $80,000,000Proposed Regulatory Costs (to industry) $0 $0 $0 $1,089 $1,568 $2,047 $1,834 $1,620 $1,514 $1,409 $1,303 $1,197 $1,091 $985 $879 $774 $668 $562 $456 $350 $244 $20,000Non-Regulatory Industry-Funded Costs $0 $0 $0 $0 $0 $0 $0 $0 $0 $0 $0 $0 $0 $0 $0 $0 $0 $0 $0 $0 $0 $0Proposed Non-Regulatory Industry-Funded Costs $0 $0 $0 $0 $0 $0 $0 $0 $0 $0 $0 $0 $0 $0 $0 $0 $0 $0 $0 $0 $0 $0Non-Regulatory Port-Funded Costs $5,600,000 $5,600,000 $0 $0 $0 $0 $0 $0 $0 $0 $0 $0 $0 $0 $0 $0 $0 $0 $0 $0 $0 $11,000,000Proposed Non-Regulatory Unfunded Costs $900,000 $20,900,000 $17,900,000 $46,600,000 $75,000,000 $0 $0 $41,200,000 $0 $0 $0 $0 $0 $0 $0 $0 $0 $0 $0 $0 $0 $200,000,000Total Costs $6,500,000 $28,600,000 $20,100,000 $48,901,089 $77,401,568 $2,602,047 $2,701,834 $44,101,620 $3,101,514 $3,301,409 $3,601,303 $3,801,197 $4,001,091 $4,200,985 $4,500,879 $4,700,774 $4,900,668 $5,200,562 $5,400,456 $5,600,350 $5,900,244 $290,000,000
Administration/Research & Development CostsNNI Program Administration (3% of non-reg cost) $300,000 $3,000,000 $2,000,000 $7,000,000 $6,000,000 $27,000,000 $5,000,000 $15,000,000 $6,000,000 $6,000,000 $28,000,000 $6,000,000 $14,000,000 $7,000,000 $15,000,000 $19,000,000 $7,000,000 $8,000,000 $34,000,000 $34,000,000 $35,000,000 $280,000,000NNI Measure Research & Development $1,000,000 $1,000,000 $1,000,000 $1,000,000 $1,000,000 $1,000,000 $1,000,000 $1,000,000 $1,000,000 $1,000,000 $1,000,000 $1,000,000 $1,000,000 $1,000,000 $1,000,000 $1,000,000 $1,000,000 $1,000,000 $1,000,000 $1,000,000 $1,000,000 $21,000,000Total Costs $1,300,000 $4,000,000 $3,000,000 $8,000,000 $7,000,000 $28,000,000 $6,000,000 $15,000,000 $7,000,000 $7,000,000 $28,000,000 $7,000,000 $15,000,000 $7,000,000 $15,000,000 $19,000,000 $8,000,000 $8,000,000 $34,000,000 $34,000,000 $35,000,000 $301,000,000
Financial Analysis 4-8 Section 4

Stakeholder Comments Received:
Ed Avol
Table 4.1 – In addition to the discussions/recommendations made at the Financial Working group meeting on 8Jun05, please consider these improvements to the table:
• Clarify the difference between “$0”, which means no cost/it’s free, and “no est”, which means we cannot offer an estimate at this time;
• If a row has “no est” in it, it cannot have “$0” in the far right column for total costs; • Add a color code key to the table; • If you are only estimating to the nearest $100,000, then you might consider listing values in units
of $100,000 (for example, $154,000 would be listed as “1.54”, which would admittedly be harder to read but would make the table smaller;
• Put a vertical line or solid column to separate the “total program cost” column from everything else
4.2. Cost Ranking and Prioritization While the cost estimates presented above detail the total estimated costs associated with each measure, the cost ranking value is the cost of a measure per unit of emission reduction achieved (i.e., cost divided by tons of reduction). The cost ranking value of a measure gives an indication of how the measures compare with each other in terms of cost if they differ in the amount of reduction they are expected to achieve. The cost ranking value can also help with decision-making if resources are limited and the highest level of reductions is needed for the lowest feasible cost. For the NNI program, the cost ranking value has been calculated and expressed as dollars per ton of emissions reduced ($/ton) for PM and NOx separately. However, it should be stressed that these values should not be compared with “cost effectiveness” figures developed or reported in other works, because significant methodological differences exist between the cost ranking values presented in this report and traditional cost effectiveness calculations. Because the costs have not been annualized, the cost ranking values are overall rather than yearly, and have been calculated by dividing total cost by total reductions. For example, a measure that costs $1,000,000 and results in a PM emission reduction of 20 tons for each of five years (for a total reduction of 100 tons of PM) would have a cost ranking value of $1,000,000/100 tons = $10,000/ton of PM. This is a simplification that does not consider the “cost of money” or financing costs that will be a part of the actual implementation of the measures. However, since all of the measures have been evaluated in the same way, the NNI measure results can be compared with other NNI measures. The NNI measure cost ranking values are presented in Table 4-5. This table presents cost ranking values for PM and NOx individually, plus a combination of PM and NOx costs calculated by adding the NOx reductions to ten times the PM values. This combination value was calculated as a way of combining the cost values for PM and NOx in such a way that the PM reduction were given more emphasis to compensate for the fact that NOx reductions are generally much larger in terms of tonnage compared with PM
Financial Analysis 4-9 Section 4
reductions. Measures for which no emissions reductions were identified or taken do not have cost ranking figures associated with them and are designated in the table by “na.” Another summary of the cost estimate data presented in Table 4-1 is presented in Table 4-6, which shows the estimated costs of measures according to whether the measure are included in the projected out-year emissions (the “green line” in the NNI summary charts) or are included in the reduced emissions line (the “blue line”). Stakeholder Comments Received: PMSA 4.2 Cost Effectiveness - This section is still undergoing significant revision. Accordingly, we reserve our comments for the next draft. We have concerns on how the costs were calculated and the metric that is being proposed as a surrogate for traditional cost-effectiveness. It will be difficult to compare the cost effectiveness in this report with any other cost effectiveness used in other applications such as the Carl Moyer program. We recommend not basing public policy decision or expenditures of public funds on this metric. Dave Howekamp Section 4.2 - Cost Effectiveness - This chapter should be relabeled and the term cost effectiveness replaced throughout with the cost comparison term that Bruce Anderson is developing. The FWG agreed that the numbers are not really cost effectiveness numbers because the costs are not annualized.
Financial Analysis 4-10 Section 4

Table 4-5. Cost Ranking and Priority Values
Measure Designation / Name NOx PM Combined*Ocean-Going Vessel Control MeasuresOGV1 - New Engine Standards for Ships $41,876 $2,872,598 $36,548OGV2 - VSR MOU $6,782 na $6,782OGV3 - AMP $27,565 $696,600 $19,750OGV4 - Auxiliary Engine Fuel Improvement Prog na $1,551,644 $155,164OGV5 - New Cat3 Eng Standards (Low) $41,275 na $41,275OGV5 - New Cat3 Eng Standards (High) na na naOGV6 - Reroute Cleanest Ships $41,275 na $41,275OGV7 - Low Emissions Main Engines $35,900 na $35,900OGV8 - Cleaner Fuels for Ship Aux Engines $10,562 $48,356 $3,317OGV9 - Main Eng Fuel Improvement Prog na $59,527 $5,953OGV10 - SECA na $34,543 $3,454OGV11 - Expanded Auxiliary Fuel Imprv Prog na na naOGV12 - Expanded Main Eng Fuel Imprv Prog $18,132 $37,127 $3,082OGV13 - Additional Auxiliary Eng Red Freq Callers $42,916 $1,079,216 $30,706OGV14 - Retro/Repower Req Infreq Callers $97,314 $2,453,803 $69,680OGV15 - Expanded VSR $12,652 na $12,652OGV16 - Expanded AMP $32,757 $824,841 $23,446OGV17 - Add In-Use Measures for Ships $16,967 $5,703,546 $16,477OGV17 - Add In-Use Measures for Ships (High) na na na* Combined values calculated by adding NOx to 10 x PM na - Value not estimated because emissions have been included in adjusted out-year emissions so ton-per-year reduction is not available.
NOx PM Combined*Harbor Craft Control MeasuresHC1 - New Engine Standards for Harbor Craft $6,433 $267,931 $5,188HC2 - Clean Fuels for Harbor Craft $3,978 $29,795 $1,704HC3 - Early Implementation ULSD $6,019 $48,272 $2,679HC4 - Dredging Activities na na naHC5 - TAC HC Measures $3,525 $38,800 $1,847HC6 - New Engine Stds - Cat 1/Cat 2 $6,606 $128,130 $4,359HC7 - Emulsified Fuel for Harbor Craft Mrn Eng $5,624 $32,897 $2,076HC8 - In-Use HC Emission Reduction Measure (ATCM) $6,721 $96,175 $3,956HC9 - Repower Existing Craft $20,845 na $20,845HC10 - Retrofit Existing Craft $3,782 $25,706 $1,530HC11 - AMP Ready Staging Areas $128 $3,378 $93* Combined values calculated by adding NOx to 10 x PM na - Value not estimated because emissions have been included in adjusted out-year emissions so ton-per-year reduction is not available.
Cost Ranking and Priority Values
Financial Analysis 4-11 Section 4

Table 4-5. Cost Ranking and Priority Values (continued)
Measure Designation / Name NOx PM Combined*Cargo Handling Equipment Control MeasuresCHE1 - Emission Stands. for HD Nonroad Diesel Engines na na naCHE2 - YT Modernization & ULSD $3,565 $42,238 $1,933CHE3 - Early Impl. ULSD for non-YT na $514,213 $51,421CHE4 - Alternative Yard Tractor Resolution na na naCHE5 - Emulsified Fuels $2,567 $10,380 $739CHE6 - TAC CHE Measures $1,264 $28,237 $873CHE7 - Expanded YT Modernization $2,627 $65,910 $1,878CHE8 - Enhanced CHE Modernization $98,058 $1,703,281 $62,231CHE9 - CHE at Ports & IM Rail Yards $6,954 $152,694 $4,778* Combined values calculated by adding NOx to 10 x PM na - Value not estimated because emissions have been included in adjusted out-year emissions so ton-per-year reduction is not available.
NOx PM Combined*Rail Locomotive Control MeasuresR1 - Tier 0, 1, 2 Locomotive Standards na na naR2 - ARB Diesel Fuel Used by Intrastate Locomotives $3,256 $115,480 $2,540R3 - Federal Standards for Nonroad Diesel Fuel $16,081 $63,406 $4,548R4 - Railroad MOU na na naR5 - PHL Modernization & ULSD Program $3,522 $213,774 $3,024R6 - Ultra-Low Emission Switcher Locomotives: PHL $1,714 $98,513 $1,460R7 - Ultra-Low Emission Switcher & Line Haul: Class 1 (low end) $84,600 $721,343 $38,936R7 - ULE Switcher & Line Haul: Class 1 (high end) $499,557 $4,259,466 $229,912R8 - Tier 3 Engine Standards $0 $0 $0R9 - ARB Diesel Fuel for Class 1 Locomotives (low) $31,544 $299,604 $15,366R9 - ARB Diesel Fuel for Class 1 Locomotives (high) $340,252 $3,231,705 $165,746R10 - Idling Controls for Switchers & Line Haul $3,696 $44,668 $2,832R11 - Efficiency Improvement on In-Use Rail Equipment $52,314 $1,349,728 $37,701R12 - Electrification of Alameda Corridor na na na* Combined values calculated by adding NOx to 10 x PM na - Value not estimated because emissions have been included in adjusted out-year emissions so ton-per-year reduction is not available.
NOx PM Combined*Heavy-Duty Vehicle Control MeasuresHDV1 - 2004 Emission Stds na na naHDV2 - 2007 Emission Stds na na naHDV3 - Gateway Cities na na naHDV4 - Engine Software Upgrade na na nHDV5 - ULSD na na naHDV6 - HD I&M na na nHDV7 - Periodic Smoke Inspection na na naHDV8 - Community-Based Inspections na na naHDV 9 - Reduced Truck Idling na na naHDV10 - Exp Gateway Cities $24,810 $722,609 $18,469HDV11 - CA HDV Stds & Fleet Mod for Mexican Trucks na na naHDV12 - Early ULSD Implementation na $1,087,193 $108,719HDV13 - Retrofit HDVs with DOCs na $500,000 $50,000HDV14 - Retrofit HDVs w/ DPFs na $316,956 $31,696HDV15 - PM In-Use Emission Control $8,529 $161 $16HDV16 - On-Board Diagnostics na na naHDV17 - Transportation Refrigeration Units na na naHDV18 - Electrified Truck Spaces na na na* Combined values calculated by adding NOx to 10 x PM na - Value not estimated because emissions have been included in adjusted out-year emissions so ton-per-year reduction is not available.
Cost Ranking and Priority Values
a
a
Financial Analysis 4-12 Section 4

Table 4-6. NNI Control Measure Cost Summary By Projection Type Total Program Cost
SUMMARY and KEY TO COLOR CODES: (2005 $)Measures included in green (non-NNI projection) emissions line $800,000,000Measures included in blue (NNI) emissions line (low cost estimate) $10,600,000,000Measures included in blue (NNI) emissions line (high cost estimate) $14,700,000,000
Source Category DetailsProjection Total Program Cost
Ocean-Going Vessel Control Measures Line Cost Type (2005 $)OGV1 - New Engine Standards for Ships Green $150,500,000OGV2 - VSR MOU Blue Operational $263,500,000OGV3 - AMP Blue Capital $500,000
Blue Capital $3,900,000Blue Operational $14,700,000
OGV4 - Auxiliary Engine Fuel Improvement Prog Blue Operational $3,100,000OGV5 - New Cat3 Eng Standards (Low) Green $434,300,000OGV5 - New Cat3 Eng Standards (High) Green $0OGV6 - Reroute Cleanest Ships Blue $32,900,000OGV7 - Low Emissions Main Engines Blue Capital $3,318,000,000
Blue Operational $15,100,000OGV8 - Cleaner Fuels for Ship Aux Engines Blue Operational $164,000,000OGV9 - Main Eng Fuel Improvement Prog Blue Operational $8,900,000OGV10 - SECA Blue Operational $154,500,000OGV11 - Expanded Auxiliary Fuel Imprv Prog Blue Operational $0OGV12 - Expanded Main Eng Fuel Imprv Prog Blue Operational $402,300,000OGV13 - Additional Auxiliary Eng Red Freq Callers Blue Cap/Op $46,200,000OGV14 - Retro/Repower Req Infreq Callers Blue Capital $1,224,000,000OGV15 - Expanded VSR Blue Capital $40,000,000Add in Fuel Savings Blue Operational $662,200,000OGV16 - Expanded AMP Blue Capital $214,350,000
Blue Operational $2,039,600,000OGV17 - Add In-Use Measures for Ships Blue $510,000,000OGV17 - Add In-Use Measures for Ships (High) Blue $0Total OGV Green Projection Line $600,000,000Total OGV Blue Projection Line $9,100,000,000
Projection Total Program CostHarbor Craft Control Measures Line Cost Type (2005 $)HC1 - New Engine Standards for Harbor Craft Green $40,600,000HC2 - Clean Fuels for Harbor Craft Green Operational $7,800,000HC3 - Early Implementation ULSD Blue Operational $300,000HC4 - Dredging Activities $0HC5 - TAC HC Measures (Included in China Shipping SettlemBlue $2,700,000HC6 - New Engine Stds - Cat 1/Cat 2 Green $38,800,000HC7 - Emulsified Fuel for Harbor Craft Mrn Eng Blue Operational $40,800,000HC8 - In-Use HC Emission Reduction Measure Blue $138,600,000HC9 - Repower Existing Craft Blue Capital $40,000,000HC10 - Retrofit Existing Craft Blue Capital $9,000,000HC11 - AMP Ready Staging Areas Blue Capital $200,000Total Green Projection Line $90,000,000Total Blue Projection Line $230,000,000
Financial Analysis 4-13 Section 4

Table 4-6. NNI Control Measure Cost Summary By Projection Type (continued) Projection Total Program Cost
Cargo Handling Equipment Control Measures Line Cost Type (2005 $)CHE1 - Emission Stands. for HD Nonroad Diesel Engines Green $0CHE2 - YT Modernization & ULSD Blue Captial $6,600,000
Blue Operational $1,500,000CHE3 - Early Impl. ULSD for non-YT Blue Operational $500,000CHE4 - Alternative Yard Tractor Resolution $0CHE5 - Emulsified Fuels Blue Operational $600,000CHE6 - TAC CHE Measures (Included in China Shipping SeBlue $800,000CHE7 - Expanded YT Modernization Blue Captial $31,100,000CHE8 - Enhanced CHE Modernization Blue Captial $110,600,000CHE9 - CHE at Ports & IM Rail Yards Blue $58,300,000Total Green Projection Line $0Total Blue Projection Line $210,000,000
Projection Total Program CostRail Locomotive Control Measures Line Cost Type (2005 $)R1 - Tier 0, 1, 2 Locomotive Standards Green $0R2 - ARB Diesel Fuel Used by Intrastate Locomotives Blue Operational $2,500,000R3 - Federal Standards for Nonroad Diesel Fuel Blue Operational $8,090,000R4 - Railroad MOU Green $0R5 - PHL Modernization & ULSD Program Blue Capital $9,600,000
Blue Operational $200,000R6 - Ultra-Low Emission Switcher Locomotives: PHL Blue Capital $3,800,000
Blue Operational -$1,900,000R7 - Ultra-Low Emission Switcher & Line Haul: Class 1 Blue Capital $548,700,000(low end) Blue Operational $168,500,000R7 - ULE Switcher & Line Haul: Class 1 (high end) Blue Capital/Op $4,235,000,000R8 - Tier 3 Engine Standards $0R9 - ARB Diesel Fuel for Class 1 Locomotives (low) Blue Operational $61,300,000R9 - ARB Diesel Fuel for Class 1 Locomotives (high) Blue Capital/Op $661,300,000R10 - Idling Controls for Switchers & Line Haul Blue Capital $2,800,000
Blue Operational -$800,000R11 - Efficiency Improvement on In-Use Rail Equipment Blue $5,700,000Total Green Projection Line $0Total Blue Projection Line (low end) $810,000,000Total Blue Projection Line (high end) $4,900,000,000
Financial Analysis 4-14 Section 4

Table 4-6. NNI Control Measure Cost Summary By Projection Type (continued)
Projection Total Program CostHeavy-Duty Vehicle Control Measures Line Cost Type (2005 $)HDV1 - 2004 Emission Stds Green $0HDV2 - 2007 Emission Stds Green $0HDV3 - Gateway Cities Blue Capital $11,200,000HDV4 - Engine Software Upgrade Green $0HDV5 - ULSD Green Operational $75,400,000HDV6 - HD I&M Green $0HDV7 - Periodic Smoke Inspection Green $0HDV8 - Community-Based Inspections Green $0HDV 9 - Reduced Truck Idling Green $0HDV10 - Exp Gateway Cities Capital $184,500,000HDV11 - CA HDV Stds & Fleet Mod for Mexican Trucks $0HDV12 - Early ULSD Implementation Blue Operational $300,000HDV13 - Retrofit HDVs with DOCs Blue Capital $1,400,000HDV14 - Retrofit HDVs w/ DPFs Blue $16,300,000HDV15 - PM In-Use Emission Control Blue $20,000HDV16 - On-Board Diagnostics $0HDV17 - Transportation Refrigeration Units $0HDV18 - Electrified Truck Spaces $0Total Green Projection Line $80,000,000Total Blue Projection Line $210,000,000
Projection Total Program CostAdministration/Research & Development Costs Line Cost Type (2005 $)NNI Program Administration (3% of non-reg cost) Blue Admin $280,000,000NNI Measure Research & Development Blue R&D $21,000,000
Stakeholder Comments Received: Rail Industry (6/13/05) Introduction - The railroads believe that the quality of the data and analysis being developed by the Technical Working Group (TWG) and the FWG is an inadequate basis for arguments and conclusions about rail measures in the NNI Task Force report. Most of the assumptions regarding technology availability, emissions, performance, and costs are speculative, represent over simplifications of rail operations, and are not well documented. The analysis either understates the costs or fails to include many costs that would arise with measure implementation. Of particular importance is the fact that the analysis does not offer implementation assumptions and costs that reflect the unique nature of rail operations. This is apparent in the review of the measures that force the establishment of a dedicated locomotive fleet. Attendant to such a requirement are numerous operational complexities that are not mentioned in the work up, and which go to the heart of the feasibility and cost of the control measure. The NNI Analysis Appears to Fail to Adjust for Activity Levels
Financial Analysis 4-15 Section 4
A core assumption of the TWG is that rail activity levels will increase by over 350 percent and this will lead to a corresponding increase in emissions.1 However, in estimating the number of units required for each measure, it does not appear that there has been a sufficient increase in the amount of equipment required. For instance, the SCAQMD analysis for measures R7 (ultra low units), R9 (fuel), and R10 (idling controls) all rely on the assumptions that 250 line-haul/heavy horsepower units and 120 local switch units are required for compliance. However, if activity levels (and correspondingly, emissions) increase by more than 350 percent, then the number of locomotives required for compliance must also increase by roughly the same percentage. However, the SCAQMD analysis only increased the line haul locomotives and their attendant costs by 66 percent. This dramatically underestimates the costs for all rail measures R7—R11 and dramatically overstated the cost-effectiveness of the measures. Rail Measure R7 – Ultra-Low Emissions Locomotives - R7 Assumptions Rail Measure R7 assumes the exclusive use of “ultra-low” emissions locomotives (e.g., 3.0 gram NOx and 0.0225 gram PM) for Port-related activity within the South Coast Air Basin (SCAB). The measure would be fully phased in by 2012 and require, according to the SCAQMD, 250 line haul units and 120 switchers for full implementation based on projected activity levels for 2010; the SCAQMD failed to sufficiently increase these numbers to handle the TWG’s assumed increase in activity level of over 350 percent. The SCAQMD estimates this measure may cost approximately $717 million to implement through 2025 and will reduce PM by around 128 tpy by 2025. The TWG and FWG assume that some combination of LNG and SCR applied to locomotive engines will meet these standards. At best, these assumptions and estimates are nothing more than unsupported, speculative conclusions about 1) LNG engine technology performance, cost, and availability, and 2) the practicality of requiring exclusive use of these engines in SCAB operations. No credible program could assume there would be LNG units available in the future. The rail industry has consistently held a position that line haul LNG locomotives are not viable, and we are providing cost estimates to – as accurately as possible – demonstrate the inherent difficulty and extreme cost of pursuing this measure. The more realistic approach to build a compliance strategy for R7 (one which is also not proven nor available for implementation) would be to assume there were some special “enhanced” version of the future Tier 3 locomotives that could be modified to achieve comparable emissions performance levels for NOx and PM to the TWG’s levels for this measure. Such units, if available, would provide a far more cost-effective method of compliance and would require no greater number of dedicated units. Additionally, basing the analysis on such units would provide more reliable insight into the potential impacts of meeting the “ultra low” emission levels. By doing this, the Task Force could set aside the debate about LNG technology and improve the cost accuracy of the FWG findings. Below, for discussion purposes, Option A costs out R7 using LNG technology; Option B estimates compliance costs using theoretically modified Tier 3 units. Option A is comparable to the analysis performed by the NNI FWG, namely an evaluation of the measure in isolation from other measures. Option B looks at the measure in the context of other measures, in this case the MOU. While the NNI report mentions the interrelationship between measures would have to be addressed, there is no discussion regarding the importance of this interrelationship. By looking at these two options the railroads hope to offer insights that are strictly aligned with the FWG analysis (i.e., the “in isolation” approach), as well as ones that speaks to the important relationship any rail measures may have on the already adopted MOU program. No matter what technology is used, the Railroads will require significantly more locomotives than estimated by the FWG, and will require development, optimization, and commercialization of that technology before it is viable for ‘day-to-day’ use. 1 The railroads continue to believe the TWG has failed to accurately project future growth and emission rates for rail. However, it is a serious methodological flaw not to grow the fleet size to accurately project the costs of these measures.
Financial Analysis 4-16 Section 4

The FWG has provided an analysis of the stand alone cost (without consideration of either adopted or future NNI measures) of R7. To provide a similar and comparable estimate, the railroads have evaluated the size of a dedicated fleet necessary to ensure that Port-related traffic was handled by R7-compliant locomotives. Furthermore, to illustrate the tremendous cost of rail measure R7 (especially when considered in light of the potential reduction of around 128 typ PM as estimated by the TWG and FWG) the railroads have further assumed the SCAQMD-provided cost of the hypothetical LNG ultra-low locomotive at $1.7 million per unit. In the case of switchers and local helpers the railroads have used a lower value of $1.0 million, again consistent with the SCAQMD and FWG assumptions. This is just for illustration purposes, as the railroads do not believe that any such locomotive will be 1) available in a commercial form by 2010, 2) able to perform at the levels stated, and 3) available at a cost of $1.7 million per unit. Not included in the SCAQMD assumption set is the fact that the LNG units would require a fuel tender car, which the railroads estimate to cost approximately $1.0 million a piece. Also note that for this illustration, the railroads ignore all other costs such as those associated with fueling infrastructure, the derating of locomotives (thus requiring incrementally more units because of the lower motive power delivered by LNG units), and the fuel cost penalty given the relatively higher cost of natural gas, the feedstock fuel. To meet the requirements of rail measure R7 the BNSF and the UPRR will have to ensure that every locomotive servicing Port cargo meets the ultra-low standards. This will require a dedicated fleet of line-haul and switch locomotives. Each railroad has unique operations into and out of the Port in terms of traffic levels, traffic patterns, and the location of maintenance and fueling facilities. These operations have a significant effect on the number of units that each railroad requires. For example, the BNSF has “nearby” maintenance and fueling facilities at Barstow, Belen (New Mexico), and Clovis (New Mexico) and the UPRR has “nearby” facilities at Roseville, Tucson, El Paso, Salt Lake City, Portland, and Yermo. The change-out (removal of the non-dedicated locomotive(s) from the train and addition of the dedicated, conforming locomotive(s)) of units must be accomplished so that ongoing train and yard operations are not compromised and trains with high-value cargo are not inordinately delayed. Tracks and facilities to serve train make-up are severely limited. As such, when possible, make-up/change-out must occur at as close a facility as possible to the SCAB without “plugging” or impeding ongoing operations. In some cases, change-out is not possible and some maintenance and fueling facilities further from the SCAB (i.e., Chicago, North Platte (Nebraska), Ft Worth, etc.) would need to be considered in order to avoid additional operational complications. It would appear that these limitations were not understood or considered by the TWG members. The BNSF and UPRR estimate that to create a combined, dedicated fleet of locomotives which is capable of covering all of their port-related cargo in the 2005-2010 timeframe, will require approximately 1,650 units to meet the ultra-low engine emissions standard.
Of this number, 120 of the units are switchers, and 100 are local helpers (mid-sized locomotive units). The remaining 1,430 units are high-horsepower line haul units that operate into and out of the SCAB.
Table 1 – BNSF and UPRR Locomotive Requirements at 2005-2010 Port Traffic Levels
Trying to Reduce the size of the dedicated fleet would only create other problems
Financial Analysis 4-17 Section 4

While it may be theoretically possible to decrease the size of the required “dedicated” fleet, this option would require additional capital costs for extensive new facilities and operating and maintenance costs to rework maintenance, crew change, and train and locomotive dispatch practices. Instead, the railroads have proposed the most cost-effective and straightforward way of complying with the engine performance standard, namely through the use of a dedicated fleet performing at an ultra-low standard that does not include the construction of new facilities, except fueling facilities when assuming the use of LNG engines. To make changes to the current set up of facilities and operating practices would also cause secondary effects associated with altering the cost structure and operating efficiencies of the rail goods movement system into and out of Los Angeles and Long Beach. These effects include: loss of rail competitiveness and the reduction of value in the rail industry; shift of cargo traffic to other transportation modes; shift of cargo traffic to other ports; increases in commodity and finished good prices; and further declining competitiveness of US exports in foreign markets. OPTION A -- LNG To be clear, the railroads believe that LNG technology in line haul applications is not viable, will not be the way that the EPA develops its Tier 3 standards, and will not be available to meet the needs of the modern, high-horsepower road units used in intermodal service.2 As noted previously herein, consistent with the railroads long standing position, the railroads believe that the TWG’s and FWG’s statements about the efficacy of LNG as a commercially viable locomotive engine fuel at the costs stated and in the timeframe described only hinders meaningful discussion about the most practical and cost-effective ways to achieve locomotive emission reductions. To be responsive to the Task Force’s methodology, however, some initial costs of such a hypothetical “system” are presented below. Table 2 – Estimated ULEL Costs to Serve the 2005-2010 POLA Traffic Levels3
By comparison, the FWG as estimated the costs for this measure would be around $335 million. Also, LNG locomotives cannot store fuel on-board. Cryogenic tenders (specially fabricated cars to store the LNG) are added behind the locomotives in the train in order to operate across longer distances. For rough estimation purposes, at least one tender is needed per LNG locomotive; legal, safe tenders cost over 2 There are four low-horsepower spark-ignited LNG locomotives operating in and around the Port, but that technology is not suitable for high-horsepower units. 3 Unlike promising Truck Engine Switcher technology for “switcher” units, Helper/Haulers have greater horsepower requirements and it is unknown what technology might be available to meet the Tier 3 standards. 4 The initial TWG analysis failed to consider the need for tenders if LNG were to be placed in high horsepower service. 5 The railroads used the TWG’s full per-unit capital cost estimate. The railroads have no way of knowing if this is an accurate estimate. For reference, new Tier 2 locomotives cost roughly $2 million each.
Financial Analysis 4-18 Section 4

$1 million each. This additional cost of about $1.4 billion brings the total LNG outlay (minus fueling stations, fuel cost differential, operational delays, etc.) to around $4 billion. These costs are for the purchase of new units and do not reflect operational costs associated with: 1) the change out of units at various crew change points for units arriving at or departing the basin, or 2) fueling infrastructure. Each change-out of units would cost approximately $300. At traffic levels in the 2005- 2010 timeframe, there would be about 240 changes per day to meet the railroads’ combined operations serving the port. The annual costs to carry out these power swaps would be approximately $26 million per year.6 The initial TWG/FWG materials assumed four fueling stations would be required to service 150 units; these costs should be increased significantly to service the expanded fleet, in a way that would not incur the costs of additional dwell time train delay. The TWG analysis also ignores the cost and complexity associated with estimating the fuel penalty associated both with the fuel differential cost and the drop in effective motive power that accompany the LNG technology. The cost of an additional 10 LNG fueling facilities would be about $40 million, using the TWG assumption that each facility would cost $4 million, an assumption the railroads believe is significantly understated. OPTION B – Modified Tier 3 Locomotive Units An alternative to the “stand alone” analysis for rail measure R7 is to assume that the true costs of adopting the ultra-low standards for the railroads is in fact the incremental cost of adopting rail measure R7 when compared to the compliance costs of the SCAB MOU. Additionally, to assume that locomotive builders could modify existing Tier 2 locomotives into ‘Tier 3-type’ units to meet rail measure R7’s combined NOx and particulate emissions standards is also highly speculative and not supported in the literature. It would appear, however, to be a more reasonable and cost-effective means of compliance were such units available. The railroads have no idea if such units will ever be offered for sale and have had to estimate preliminary costs based on their own judgments. For the purposes of this analysis, the railroads estimate that if modified Tier 3 units were available, the incremental costs (over and above the costs of a Tier 2 unit that would be needed to satisfy the present MOU) would be at least $1 million per locomotive. This assumes diesel particulate filter (DPF for PM) and various engine modifications to meet the NOx standards. There are no detailed engineering based cost projections from any manufacturer for this equipment. The railroads would need to purchase new switchers to comply with rail measure R7. Table 3 – ‘Tier 3’ Locomotive Costs to Serve the 2005-2010 POLA Traffic Levels
By comparison, as stated earlier, the FWG as estimated that the costs for this measure would be around $335 million. As with the LNG costing analysis, these costs are for the purchase of new units and do not reflect operational costs associated with the change out of units at various crew change points for units arriving at
6 As argued elsewhere, as a legal matter no state or local political jurisdiction can require a railroad to alter its current operations; however, we have done so in this analysis solely to portray compliance costs in the most plausible manner.
Financial Analysis 4-19 Section 4

or departing the basin. Each change-out of units would cost approximately $300. At traffic levels in the 2005-2010 timeframe, there would be about 240 changes per day to meet the railroads’ combined operations serving the port. The annual costs to carry out these power swaps would be approximately $26 million per year. Also these costs do not reflect any of the O & M aspects that would certainly be required to ensure operability of the after-treatment equipment. Both Option A and Option B reflect 2005-2010 fleet requirements, not requirements associated with 450% increase in container traffic The Option A and B analyses presented above use the number of units required to service Port traffic in the 2005-2010 timeframe. These analyses do not grow the dedicated fleet required in the future due the uncertain nature of the growth rate. However, if traffic levels increase dramatically -- as estimated by the TWG and which forms the basis of the TWG’s assumed emissions inventory -- the number of locomotives required to service the additional traffic will also rise substantially, even allowing for efficiency improvements. If the TWG were right about its growth assumptions, the analyses above could be underestimated by several fold. Rail Measure R7 would Gut the Railroad MOU with ARB and Render it Moot The railroad MOU with ARB (which is an already adopted program) is a flexible compliance program and allows the railroads to pursue meaningful air quality reductions while maintaining reasonable rail operations. The MOU fleet average standard is 5.5 grams NOx. It appropriately creates incentives for the railroads to seek out a variety of emission reduction opportunities, while avoiding the onerous imposition of a strict engine-based performance standard. As explained above, any strict engine-based standard focused on one particular geographic area will significantly increase costs as the only effective way to meet the requirement is to establish a dedicated fleet operation. Nonetheless, the railroads will have substantial compliance costs to meet the MOU requirements, which will be fully phased in by 2010. To implement rail measure R7 on top of the MOU will have negative consequences:
• The MOU will be moot. The railroads will have to in effect abandon the MOU because R7 will require a dedicated fleet of ultra-low performance locomotives. Complying with the MOU will not make sense in such an environment.
• Depending on the timing of the MOU and R7 implementation, it is possible that the investment in compliance measures under the MOU will have to be written off, further increasing the cost of R7.
• Incentives to improve rail emissions performance across the organization will be lost. Creativeness will go by the wayside in favor of a “command-and-control” type program.
Under this measure, the range of costs for new locomotives for a dedicated fleet would range between $1,680,000,000 and $4,111,000,000. Rail Measure R9 – Fuel Requirements - R9 Assumptions Rail measure R9 would require the Class 1 freight railroads to burn only ARB low sulfur fuel while operating in the SCAB on Port-related moves. The measure correctly points out that: “This will result in potentially significant operational, logistical and equipment changes, including but not limited to, draining of tanks, or the installation of separate tanks, baffling of tanks, or adding a dedicated fuel car containing ULSD to the train all with ability to switch over fueling”. Possible compliance strategy: fuel tank baffling7 It must be emphasized that all the proposed approaches to implement this option entail significant operational challenges. One option is priced out below; however, the FWG should recognize that all options were problematic in one way or another.
7 The railroads do not believe fuel tank baffing is a viable option; however, it is costed out here to illustrate the potential impacts of this measure.
Financial Analysis 4-20 Section 4

Theoretically, one rail measure R9 compliance strategy could involve engineering modifications to the fuel tanks in order to segregate EPA and CARB fuels. This could possibly involve the installation of a baffle, effectively splitting the existing tank into 2 smaller ones. New locomotives have fuel tanks that are welded to the frame, and are an integral part of the crash worthiness of the unit. The entire fuel tank would have to be cut out from the frame and replaced with a baffled tank. The FWG assumes that only a handful of units would require modification (150 line haul and 25 switchers). That assumption is not correct: all locomotives that could possibly handle Port-related cargo would require modification since we would not be changing out non conforming locomotives (as would be the case in R7). For both railroads it would mean about 6,000 units. Changing the fuel tank baffling in these units (the newer, high-horsepower units that serve the port) will also be quite expensive as simple baffling of the tanks is insufficient. In many cases, tanks are welded to the units, not bolted on. Also, given operating limitations, baffles must be installed in such a way to create an upper and lower chamber in the tank. These chambers must then have dual piping, filters, and control systems. Additionally, electronic fuel gauges and other instruments (e.g., automated valves, electronic fuel gages, limit switches, and controls to avoid locomotives from running totally dry in a single tank) need to be added to ensure the right tank is being drained at the right place along the route. All of these items should be included in the cost of the baffled tank line item. The railroad’s best guess for the costs to accomplish this new tank baffling would be approximately $100,000 per unit. Given the universe of 6,000 units that could be in POLA related (intermodal, bulk, and auto) service, the costs to implement this measure would be approximately $600,000,000. South Coast Air Quality Management District At the June 21 Task Force meeting, representatives of the railroads argued that SCAQMD cost estimates for measures such as R7 were based on costs to control one-half the number of trains serving the ports of Long Beach and Los Angeles. Trains arriving in Southern California carry cargo destined for both ports, and rail argued it would have to reduce emissions from all such locomotives, thereby increasing compliance costs beyond SCAQMD estimates. SCAQMD does not believe that this argument necessarily justifies higher compliance cost estimates. In addition to potential changes in operating practices that rail may be able to implement to avoid the need to control a greater number of locomotives, as the NNI control measures are crafted into specific compliance requirements, issues such as this can likely be addressed by, for example, developing appropriate emissions compliance calculation procedures. Finally, we note that it is our hope that control measures similar to the NNI measures will be implemented at both POLA and POLB thereby eliminating this issue.
4.3. Funding Sources The FWG considered the cost estimates to meet the NNI program and assess the availability of funding sources. Specifically, the FWG was asked to consider two issues as it relates to funding sources, which are:
• Identify any and all available funding sources for the NNI program, and • Determine, if other sources are unavailable, if the Port has sufficient financial
resource to fund the non-regulatory unfunded costs of NNI. The FWG was unable to complete the first undertaking of actively searching for and identifying specific, viable, long-term funding sources for the NNI program. This was due to a limit in available time and resources to complete the task. We recommend the commissioning of a thorough examination of the cost measures and implementation of a direct campaign to meet with interested organizations and agencies so that willing groups may become active. Moreover, we believe it is critical that national, state, and local
Financial Analysis 4-21 Section 4

agencies commit financial resources to this project in whatever form is best suited to create a realistic, long-term strategy to implement NNI. As for the second undertaking, it should be noted that this option should only be considered if all other funding mechanisms are insufficient to implement and make NNI achievable. This option was requested assuming that all NNI measures were required to meet the emission standards and that the funding was only available from the Port and Port tenants. This also assumes the Port has legal authority to charge tariff charges to fund NNI programs (see Section 5 – Legal Analysis for details). To complete the assessment of the Port’s financial capacity to fund the NNI measures, certain scenarios and assumptions were made. The major assumptions made include the growth rate in volume and revenue; increase in operating expenses; allocation of funds towards the Port’s existing capital improvement program; outstanding obligations of the Port (existing, long-term debt); and availability of new long-term debt to fund NNI measures. These assumptions are detailed in the following graphic, Exhibit 4-1. Exhibit 4-1. Harbor Department Funding Analysis Assumptions
Overall, the Port has approximately $1.8 billion in existing capital projects scheduled to be funded from 2005 through 2009. These capital projects will be funded with net revenues of the Port (net revenues are equal to total operating revenues less operating expenses) as well as revenue bonds and commercial paper issued by the Port. The Port would then allocate net revenues to fund NNI measures (assuming NNI measures are not
Financial Analysis 4-22 Section 4

adjusted for inflation). From 2005 to 2025, the Port’s net revenues would not be sufficient to fund the NNI measures (non-regulatory unfunded costs). The estimated shortfall in funding these measures is estimated at over $4 billion. To fund this shortfall, various actions would be required, including, but not limited to, increasing the tariff rate, adjusting compensation with Port leases, or reducing capital improvement program funding over the first five years. Consequently, any of these actions would have a potential negative impact the Port’s finances as volumes decline correspondingly. We recommend that the funding alternatives be further studied and revised as more definitive cost information becomes available, other funding partners become apparent, and volume assumptions are validated.
4.4. Benefit Analysis
The ARB assessed the potential health benefits valuation associated with the emissions reductions estimated for NNI. The methods used to develop the potential benefits are linked to the assumptions used to estimate projected emissions. The methods used for the analysis are similar to those used in developing health benefits for State Implementation Plans. During Task Force and FWG meetings there was vigorous discussion and debate about the health benefits analysis; the estimates developed do not represent a consensus view of the FWG or Task Force. Multiple industry representatives believe the health benefits analysis is deeply flawed and is likely to mislead stakeholders. Despite this criticism, the ARB stands behind their assessment and recommended it to the Task Force for inclusion in this final report. The ARB analysis is presented below, followed by stakeholder comments.
ESTIMATION OF THE HEALTH BENEFITS ASSOCIATED WITH THE REDUCTIONS OF DIESEL PM EMISSIONS
It is estimated that a decrease in both primary and secondary diesel PM from the implementation of No Net Increase (NNI) will result in approximately 2,200 fewer premature deaths. As shown in Table 4-7, the proposed NNI measures are expected to reduce primary diesel PM emissions by a cumulative amount of more than 24,000 tons by the end of year 2025, and therefore prevent an estimated 1,700 premature deaths (850 to 2,600, 95 percent confidence interval (95% CI)) by year 2025. In addition, staff estimates that the implementation of the proposed NNI measures is expected to accrue a cumulative reduction of more than 320,000 tons of NOx by the end of 2025, therefore reducing secondary PM formation and avoiding an estimated 490 premature deaths (240 to 730, 95% CI). Methodologies used to determine these mortality benefits and the reductions in non-mortality effects are discussed below.
Financial Analysis 4-23 Section 4

Table 4-7. Annual Emission Reductions Associated with Implementation of the Proposed NNI Measures
Year NOx Reductions, TPY
PM Reductions, TPY
2005 2438 105 2006 2745 75 2007 3162 68 2008 8358 782 2009 8599 792 2010 13393 1133 2011 13687 1172 2012 15124 1233 2013 14630 1250 2014 14744 1285 2015 14858 1322 2016 14972 1356 2017 15085 1391 2018 15199 1426 2019 15312 1461 2020 21473 1497 2021 23024 1531 2022 24572 1566 2023 26124 1602 2024 27673 1637 2025 29327 1676
Total 324,499 24,360
4.4.1. Primary Diesel PM Lloyd and Cackette (2001) estimated that, based on the Krewski et al. study4, a statewide population-weighted average diesel PM2.5 exposure of 1.8 µg/m3 resulted in a mean estimate of 1,985 premature deaths per year in California (Lloyd/Cackette, 2001). The statewide diesel PM2.5 emission inventory corresponding to the PM2.5 concentration of 1.8 µg/m3 is 28,000 tpy (ARB, 2000). From this information, we estimate that reducing 14.11 tpy of diesel PM2.5 emissions would result in one fewer premature death (28,000 tpy/1,985 deaths). Comparing the PM emissions before and after implementation, the proposed regulation is expected to reduce PM emissions by a cumulative amount of
4 Although there are two mortality estimates in the report by Lloyd and Cackette – one based on work by Pope et al. and the other based on Krewski et al., we selected the estimate based on the Krewski’s work. For Krewski et al., an independent team of scientific experts commissioned by the Health Effects Institute conducted an extensive reexamination and reanalysis of the health effect data and studies, including Pope et al. The reanalysis resulted in the relative risk being based on changes in mean levels of PM2.5, as opposed to the median levels from the original Pope et al. study. The Krewski et al. reanalysis includes broader geographic areas than the original study (63 cities vs. 50 cities). Further, the U.S. EPA has been using Krewski’s study for its regulatory impact analyses since 2000. (Krewski, 2000) (Pope, 1995)
Financial Analysis 4-24 Section 4

25,000 tons by the end of year 2025, and therefore prevent an estimated 1,700 premature deaths (850 to 2,600, 95% CI) by year 2025. Using this same methodology, conversion factors (tpy per unit change in incidence) were derived for other adverse health endpoints. For asthma attacks, work loss days, and minor restricted activity days (MRADs), concentration-response functions from the PM Standard Staff Report (ARB, 2002) were applied to a diesel PM2.5 exposure of 1.8 µg/m3 statewide, which corresponds to 47,000 asthma attacks, 410,000 work loss days, and 2.2 million MRADs, on an annual basis. Associating the diesel PM emission inventory of 28,000 tpy to these values leads to the following factors: 0.59 tpy per one asthma attack, 0.068 tpy per work day lost, and 0.0129 tpy per minor restricted activity day. Therefore, implementation of the proposed regulation is expected to prevent an estimated 41,000 asthma attacks (10,000 to 72,000, 95% CI), 360,000 work loss days (300,000 to 410,000, 95% CI), and 1.9 million MRADs (1.5 million to 2.2 million, 95% CI).
4.4.2. Secondary Diesel PM Lloyd and Cackette also estimated that indirect (secondary) diesel PM2.5 exposures at a level of 0.81 µg/m3 resulted in a mean estimate of 895 additional premature deaths per year in California, above those caused by directly emitted formed diesel PM. The statewide NOx emission inventory corresponding to that PM2.5 concentration of 0.81 µg/m3 is 598,965 tpy. Following the same approach as above, we estimate that reducing 669 tons of NOx emissions would result in one fewer premature death (598,965 tons/895 deaths). Therefore, with a cumulative NOx reduction of 330,000 tons by the end of 2025, an estimated 490 premature deaths (240 to 730, 95% CI) would be avoided. Using the same methodology described for primary PM2.5 for the other health enpoints, conversion factors (tpy of indirect diesel PM2.5 emissions per unit change in incidence) were derived. These factors were calculated to be 28.2 tpy per asthma attack, 3.24 tpy per work day lost, and 0.62 tpy per minor restricted activity day. Comparing the PM emissions before and after implementation of this regulation, the proposed regulation is expected prevent an estimated 12,000 asthma attacks (2,800 to 20,000, 95% CI), 100,000 work loss days (84,000 to 120,000, 95% CI), and 520,000 MRADs (430,000 to 610,000, 95% CI) by year 2025. Table 4-8 shows the year-by-year tally of premature deaths avoided by implementation of NNI. The numbers grow over time because in the absence of NNI, emissions from the Port of Los Angeles are projected to grow. That is, each row of Table 4-8 (except for the row labeled “Total”) shows the number of premature deaths avoided in the year indicated.
Financial Analysis 4-25 Section 4
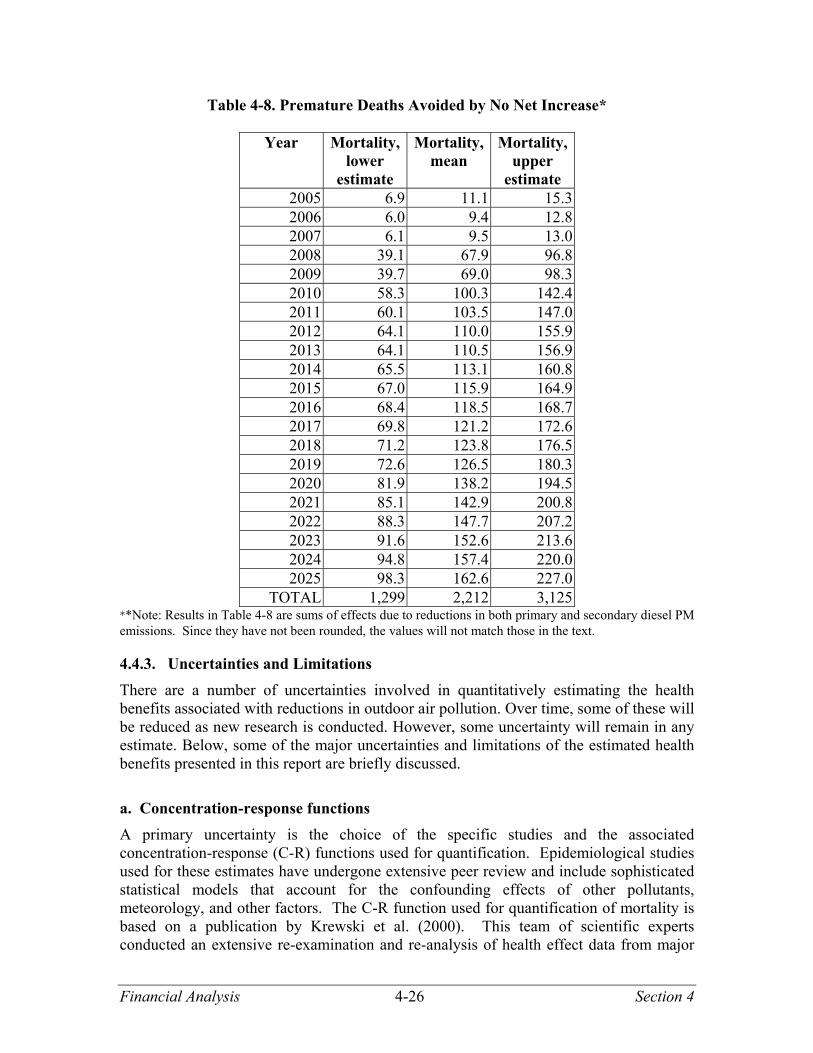
Table 4-8. Premature Deaths Avoided by No Net Increase*
Year Mortality, lower
estimate
Mortality, mean
Mortality, upper
estimate 2005 6.9 11.1 15.3 2006 6.0 9.4 12.8 2007 6.1 9.5 13.0 2008 39.1 67.9 96.8 2009 39.7 69.0 98.3 2010 58.3 100.3 142.4 2011 60.1 103.5 147.0 2012 64.1 110.0 155.9 2013 64.1 110.5 156.9 2014 65.5 113.1 160.8 2015 67.0 115.9 164.9 2016 68.4 118.5 168.7 2017 69.8 121.2 172.6 2018 71.2 123.8 176.5 2019 72.6 126.5 180.3 2020 81.9 138.2 194.5 2021 85.1 142.9 200.8 2022 88.3 147.7 207.2 2023 91.6 152.6 213.6 2024 94.8 157.4 220.0 2025 98.3 162.6 227.0 TOTAL 1,299 2,212 3,125
**Note: Results in Table 4-8 are sums of effects due to reductions in both primary and secondary diesel PM emissions. Since they have not been rounded, the values will not match those in the text.
4.4.3. Uncertainties and Limitations
There are a number of uncertainties involved in quantitatively estimating the health benefits associated with reductions in outdoor air pollution. Over time, some of these will be reduced as new research is conducted. However, some uncertainty will remain in any estimate. Below, some of the major uncertainties and limitations of the estimated health benefits presented in this report are briefly discussed.
a. Concentration-response functions
A primary uncertainty is the choice of the specific studies and the associated concentration-response (C-R) functions used for quantification. Epidemiological studies used for these estimates have undergone extensive peer review and include sophisticated statistical models that account for the confounding effects of other pollutants, meteorology, and other factors. The C-R function used for quantification of mortality is based on a publication by Krewski et al. (2000). This team of scientific experts conducted an extensive re-examination and re-analysis of health effect data from major
Financial Analysis 4-26 Section 4

studies including that of Pope et al. (1995). The re-analysis included broader geographic areas (63 cities vs 50 cities) than the original study by Pope, and the U.S. EPA has been using this re-analysis for its regulatory impact analyses since 2000. While there may be questions on whether C-R functions from the epidemiological studies are applicable to California, it should be noted that some of the cities considered by Krewski et al. are in California. Also, numerous studies have shown that the mortality effects of PM in California are comparable to those found in other locations in the United States. In addition, many of the studies were conducted in areas having fairly low concentrations of ambient PM, with ranges in PM levels that covers California values. Thus, the extrapolation is within the range of the studies. Finally, the uncertainty in the C-R functions selected is reflected in the lower and upper estimates given in Tables 4-5 and 4-6, which represent the 5th and 95th percentiles, respectively. For premature death, this estimated error amounts to about a 50 percent difference from the mean value.
b. Exposure estimates Use of the C-R function requires an input of the population-weighted diesel PM concentration. For the calculations presented in this report we used a statewide population-weighted average concentration of 1.8 µg/m3, which was estimated by ARB staff for the identification of diesel exhaust as an air toxic contaminant. Although staff also had estimated the population-weighted average concentration for the South Coast basin, use of a basin specific factor would represent a departure from our methodology that would need additional peer review.
A related issue is whether a change in diesel PM concentration of 1.8 µg/m3 can have a measurable effect on health. It is important to emphasize that while the change is small, it is an incremental change from a statewide population-weighted PM2.5 average concentration of 18.5 µg/m3.
c. Baseline rates of mortality and morbidity Mortality and morbidity baseline rates are entered into the C-R functions in order to calculate the estimates presented in this report, and there is uncertainty in these baseline rates. Often, one must assume a baseline incidence level to be consistent throughout the city or country of interest. In addition, incidence can change over time as health habits, income and other factors change. For this analysis, we used baseline rates that are used by U.S. EPA.
d. Unquantified adverse effects An additional limitation in this analysis is that we did not quantify all possible health benefits that could be associated with reducing diesel PM exposure. Although the analysis illustrates that reduction in diesel PM exposure would confer health benefits to people living in the South Coast basin, we did not provide estimates for all endpoints for which there are C-R functions available. For example, we did not estimate incidences of hospitalizations for exacerbation of heart disease, chronic lung diseases (i.e., asthma and chronic obstructive pulmonary disease), or acute lung diseases (i.e., pneumonia and acute bronchitis).
Financial Analysis 4-27 Section 4

In addition, estimates of the effects of PM on infant mortality, premature births, and low birth weight are not presented. While these endpoints are significant in an assessment of the public health impacts of diesel exhaust emissions, there are currently few published investigations on these topics. Also, the results of the studies that are available are not entirely consistent. Nevertheless, there are some data supporting a relationship between PM exposure and these effects, and there is ongoing research in these areas that should help to clarify the role of diesel exhaust PM on these endpoints.
There is also evidence for other non-cancer health effects that are attributable to diesel exhaust PM exposure. For example, diesel PM apparently can act as an adjuvant in allergic responses and possibly asthma. However, additional research is needed at diesel exhaust concentrations that more closely approximate current ambient levels before the effect of diesel PM exposure on allergy and asthma rates is established. Also, because these endpoints have been investigated only in controlled exposure studies, population level C-R functions are not available for making estimates of the population-wide impacts of exposure.
Taken as a whole, the results of our limited analysis support the conclusion that reduction in diesel PM emissions from the Ports of Los Angeles and Long Beach will confer health benefits to the exposed population. However, since we did not make estimates for all possible endpoints, it is likely that we have underestimated the health benefits in this analysis.
Value of Premature Deaths Avoided
The U. S. EPA has established $4.8 million in 1990 dollars (or $6.3 million in 2000 dollars) for a 1990 income level as the mean value of avoiding one premature death (U.S. EPA, 1999, pages 70-72). This value is the mean estimate from 5 contingent valuation studies and 21 wage-risk studies, which span the range from $0.6 million to $13.5 million in 1990 dollars (or $0.8 million to $17.8 million in 2000 dollars). Both kinds of studies examine the willingness to pay (or accept) for a minor decrease (or increase) in mortality risk. For example, if 10,000 people are willing to pay $800 apiece for risk reduction of 1/10,000 then collectively the willingness-to-pay for avoiding a premature death, in this example, would be $8 million. Contingent valuation studies provide stated preference data about willingness-to-pay for decreased levels of risk. Such studies pose a market situation to survey respondents, who are asked how much they would be willing to pay. The approach is useful for getting estimates on willingness-to-pay for policies that have not yet been tried. The earliest techniques involved asking people directly about how much they place on risk avoidance. Today the referendum format is most popular, in which the survey suggests a specific dollar amount and the respondent says yes or no (Freeman, 2003).
Financial Analysis 4-28 Section 4
Wage-risk studies provide revealed preference data about willingness to accept increased levels of risk.5 Such studies look at comparisons between different jobs in terms of wages and risks of death on the job. The comparisons focus on risk only, by controlling for other differences in job attributes. The compensating wage approach may underestimate the value of preventing premature mortality, because people who are willing to be paid to accept increased risk may value risk reduction less than the average person (Freeman, 2003). Table 4-9 provides some information about the 26 studies that U.S. EPA used to calculate its estimate of $4.8 million (in 1990 dollars) for the value of avoiding a premature death. A recent review (Viscusi and Aldy, 2003) discusses some of the studies and provides the level of risk reduction used in the study. From that we can infer the compensating wage.
5 For small changes in risk, the amount that a person is willing to accept an increase in an incremental increase in the probability of death is about the same as the amount that the person is willing to pay for the same decrease in the probability of death. For large changes in risk, the willingness to accept higher risk increases substantially, whereas the willingness to pay for lower risk tends to level off.
Financial Analysis 4-29 Section 4

Table 4-9. Annual Valuations of Premature Deaths Prevented Authors Year Type of
Estimate Valuation (millions 1990$)
Annual risk
reduction
Implied compensating
wage (1990$/year)
Kneisner and Leeth 1991 Wage-risk 0.6 0.0004 240
Smith and Gilbert 1984 Wage-risk 0.7 Dillingham 1985 Wage-risk 0.9
Butler 1983 Wage-risk 1.1 0.00005 60
Miller and Guria 1991 Cont. Valu. 1.2
Moore and Viscusi 1988 Wage-risk 2.5
Viscusi, Magat, and Huber 1991 Cont. Valu. 2.7 Gegax et al. 1985 Cont. Valu. 3.3 Marin and Psacharopoulos 1982 Wage-risk 2.8 Kneisner and Leeth 1991 Wage-risk 3.3 Gerking, de Haan, and Schulze 1988 Cont. Valu. 3.4 Cousineau, Lacroix, and Girard 1988 Wage-risk 3.6 Jones-Lee 1989 Cont. Valu. 3.8 Dillingham 1985 Wage-risk 3.9 Viscusi 1979 Wage-risk 4.1 0.0001 410 Smith 1976 Wage-risk 4.6 0.0001 460 Smith 1976 Wage-risk 4.7 0.0001 470 Olson 1981 Wage-risk 5.2 0.0001 520 Viscusi 1981 Wage-risk 6.5 0.0001 650 Smith 1974 Wage-risk 7.2 0.000125 900 Moore and Viscusi 1988 Wage-risk 7.3 0.00006 440 Kneisner and Leeth 1991 Wage-risk 7.6 Herzog and Schlottman 1987 Wage-risk 9.1 0.000097 880 Leigh and Folson 1984 Wage-risk 9.7 0.0001 970 Leigh 1987 Wage-risk 10.4 Garen 1988 Wage-risk 13.5 0.000108 1,460 Sources: U.S. EPA, 1999; Viscusi and Aldy, 2003. Note that typical studies (those getting a result close to the mean of $4.8 million in 1990 dollars) involve a mortality risk of 1/10,000 or something close to that level. The risk premium is several hundred dollars per year. As real income increases, people may be willing to pay more to prevent premature death (U.S. EPA, 2003, pages 9-17 and 9-18). U.S. EPA further adjusted the 1990 value by a factor of 1.26 for a 2020 income level. Assuming that real income grew at a constant rate from 1990 and will continue at the same rate until 2020, we adjusted the value of avoiding a premature death (increasing it at a rate of 0.8 percent per year) for each year.
Financial Analysis 4-30 Section 4

We then updated the value to 2005 dollars6. After these adjustments, the value is $8.2 million in 2005 and $9.6 million in 2025, both expressed in 2005 dollars. The U.S. EPA’s guidance of social discounting recommends using three and seven percent discount rates (U.S. EPA, 2000). Table 4 shows year-by-year valuations of the avoided premature deaths due to implementation of NNI. Based on these valuations, and the annual avoided premature deaths as weights, the weighted average value of reducing a future premature death, discounted back to the year 2005, is around $4 million at seven percent discount rate, and $6 million at three percent. Undiscounted valuations are also presented in Table 4-10. While the undiscounted sum of annual valuations is not particularly meaningful because it does not take into account the mismatch in time – we value a dollar in 2005 far more than we value a dollar in 2025 – it does provide a way to compare the health valuations to the costs of controls which were only reported as an undiscounted sum. Table 4-10. Annual Valuations of Premature Deaths Prevented by No Net Increase
Valuation ($million) Valuation ($million) Valuation ($million) Undiscounted Using 7% discount rate Using 3% discount rate
Year Lower Mean Upper Lower Mean Upper Lower Mean Upper 2005 56 91 126 56 91 126 56 91 1262006 50 78 106 46 73 99 48 76 1032007 51 80 108 45 70 95 48 75 1022008 329 572 815 268 467 665 301 523 7462009 337 585 834 257 447 636 299 520 7412010 498 858 1,218 355 612 868 430 740 1,0502011 518 893 1,267 345 595 844 434 747 1,0612012 557 956 1,354 347 595 843 453 777 1,1012013 561 968 1,374 327 563 800 443 764 1,0842014 578 999 1,419 315 543 772 443 765 1,0882015 596 1,032 1,467 303 524 746 444 768 1,0922016 613 1,063 1,513 291 505 719 443 768 1,0932017 631 1,095 1,560 280 486 693 442 768 1,0942018 649 1,128 1,608 269 468 667 442 768 1,0952019 667 1,162 1,657 259 451 643 441 768 1,0952020 758 1,280 1,802 275 464 653 487 822 1,1562021 794 1,334 1,874 269 452 635 495 831 1,1682022 831 1,390 1,949 263 440 617 503 841 1,1792023 869 1,447 2,026 257 428 599 510 850 1,1902024 906 1,505 2,103 251 416 582 517 858 1,1992025 947 1,567 2,187 245 405 565 524 868 1,211
TOTAL 11,797 20,082 28,368 5,323 9,095 12,867 8,203 13,990 19,776AVERAGE $9.08 $9.08 $9.08 $4.10 $4.11 $4.12 $6.32 $6.32 $6.33
6 The conversion uses the February 2005 and February 2000 values of the California Consumer Price Index, obtained from the California Department of Industrial Relations.
Financial Analysis 4-31 Section 4
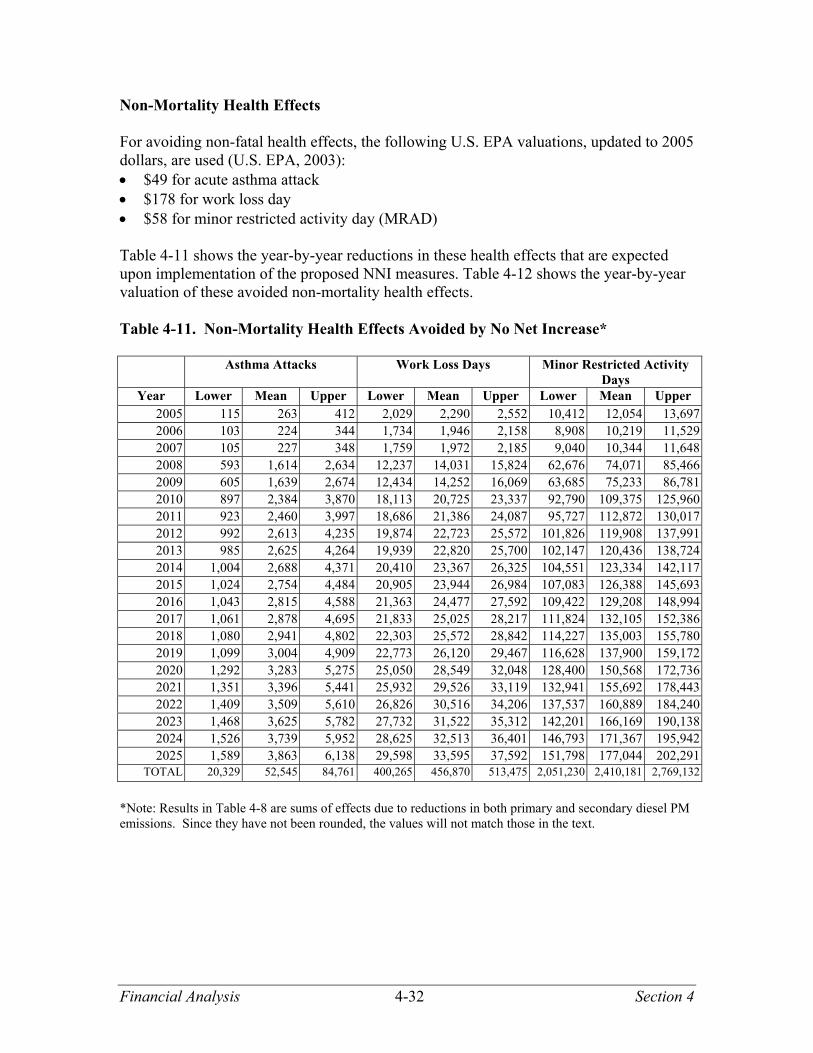
Non-Mortality Health Effects For avoiding non-fatal health effects, the following U.S. EPA valuations, updated to 2005 dollars, are used (U.S. EPA, 2003): • $49 for acute asthma attack • $178 for work loss day • $58 for minor restricted activity day (MRAD) Table 4-11 shows the year-by-year reductions in these health effects that are expected upon implementation of the proposed NNI measures. Table 4-12 shows the year-by-year valuation of these avoided non-mortality health effects. Table 4-11. Non-Mortality Health Effects Avoided by No Net Increase*
Asthma Attacks Work Loss Days Minor Restricted Activity Days
Year Lower Mean Upper Lower Mean Upper Lower Mean Upper 2005 115 263 412 2,029 2,290 2,552 10,412 12,054 13,6972006 103 224 344 1,734 1,946 2,158 8,908 10,219 11,5292007 105 227 348 1,759 1,972 2,185 9,040 10,344 11,6482008 593 1,614 2,634 12,237 14,031 15,824 62,676 74,071 85,4662009 605 1,639 2,674 12,434 14,252 16,069 63,685 75,233 86,7812010 897 2,384 3,870 18,113 20,725 23,337 92,790 109,375 125,9602011 923 2,460 3,997 18,686 21,386 24,087 95,727 112,872 130,0172012 992 2,613 4,235 19,874 22,723 25,572 101,826 119,908 137,9912013 985 2,625 4,264 19,939 22,820 25,700 102,147 120,436 138,7242014 1,004 2,688 4,371 20,410 23,367 26,325 104,551 123,334 142,1172015 1,024 2,754 4,484 20,905 23,944 26,984 107,083 126,388 145,6932016 1,043 2,815 4,588 21,363 24,477 27,592 109,422 129,208 148,9942017 1,061 2,878 4,695 21,833 25,025 28,217 111,824 132,105 152,3862018 1,080 2,941 4,802 22,303 25,572 28,842 114,227 135,003 155,7802019 1,099 3,004 4,909 22,773 26,120 29,467 116,628 137,900 159,1722020 1,292 3,283 5,275 25,050 28,549 32,048 128,400 150,568 172,7362021 1,351 3,396 5,441 25,932 29,526 33,119 132,941 155,692 178,4432022 1,409 3,509 5,610 26,826 30,516 34,206 137,537 160,889 184,2402023 1,468 3,625 5,782 27,732 31,522 35,312 142,201 166,169 190,1382024 1,526 3,739 5,952 28,625 32,513 36,401 146,793 171,367 195,9422025 1,589 3,863 6,138 29,598 33,595 37,592 151,798 177,044 202,291
TOTAL 20,329 52,545 84,761 400,265 456,870 513,475 2,051,230 2,410,181 2,769,132
*Note: Results in Table 4-8 are sums of effects due to reductions in both primary and secondary diesel PM emissions. Since they have not been rounded, the values will not match those in the text.
Financial Analysis 4-32 Section 4

Table 4-12. Valuations of Non-Mortality Health Effects Avoided by No Net Increase
Valuation of Asthma Attacks ($ million, undiscounted)
Valuation of Work Loss Days ($ million, undiscounted)
Valuation of Minor Restricted Activity Days ($ million, undiscounted)
Year Lower Mean Upper Lower Mean Upper Lower Mean Upper 2005 0.006 0.013 0.020 0.36 0.41 0.45 0.6 0.7 0.82006 0.005 0.011 0.017 0.31 0.35 0.38 0.5 0.6 0.72007 0.005 0.011 0.017 0.31 0.35 0.39 0.5 0.6 0.72008 0.029 0.079 0.129 2.17 2.49 2.81 3.6 4.3 5.02009 0.030 0.080 0.130 2.21 2.53 2.86 3.7 4.4 5.02010 0.044 0.116 0.189 3.22 3.68 4.15 5.4 6.3 7.32011 0.045 0.120 0.195 3.32 3.80 4.28 5.5 6.5 7.52012 0.048 0.128 0.207 3.53 4.04 4.54 5.9 6.9 8.02013 0.048 0.128 0.208 3.54 4.05 4.57 5.9 7.0 8.02014 0.049 0.131 0.213 3.63 4.15 4.68 6.1 7.1 8.22015 0.050 0.134 0.219 3.71 4.25 4.79 6.2 7.3 8.42016 0.051 0.137 0.224 3.80 4.35 4.90 6.3 7.5 8.62017 0.052 0.140 0.229 3.88 4.45 5.01 6.5 7.7 8.82018 0.053 0.144 0.234 3.96 4.54 5.12 6.6 7.8 9.02019 0.054 0.147 0.240 4.05 4.64 5.24 6.8 8.0 9.22020 0.063 0.160 0.257 4.45 5.07 5.69 7.4 8.7 10.02021 0.066 0.166 0.266 4.61 5.25 5.88 7.7 9.0 10.32022 0.069 0.171 0.274 4.77 5.42 6.08 8.0 9.3 10.72023 0.072 0.177 0.282 4.93 5.60 6.27 8.2 9.6 11.02024 0.074 0.182 0.290 5.09 5.78 6.47 8.5 9.9 11.42025 0.078 0.189 0.300 5.26 5.97 6.68 8.8 10.3 11.7
TOTAL 0.992 2.564 4.137 71.12 81.18 91.23 118.9 139.7 160.5 Section 4.4 – Benefit Analysis References ARB 2000. Air Resources Board. October 2000. Risk Reduction Plan to Reduce Particulate Matter Emissions from Diesel-Fueled Engines and Vehicles. http://www.arb.ca.gov/diesel/documents/rrpapp.htm ARB 2000. Air Resources Board. May 2002. Public Hearing to Consider Amendments to the Ambient Air Quality Standards for Particulate Matter and Sulfates, Staff Report. http://www.arb.ca.gov/research/aaqs/std-rs/pm-final/pm-final.htm Freeman. 2003. Freeman III, A. M.; The Measurement of Environmental and Resource Values: Theory and Methods, Second Edition. Resources for the Future. Krewski et al. 2000. Krewski D.; Burnett R.; Goldberg M.; Hoover K.; Stemiatychi J.; Jerrett M.; Abrahamovicz M.; White W. Reanalysis of the Harvard Six Cities Study and the American Cancer Society Study of Particulate Air Pollution and Mortality, Health Effects Institute, Cambridge, Massachusetts; 2000. http://es.epa.gov/ncer/science/pm/hei/Rean-ExecSumm.pdf Lloyd and Cackette. 2001. Lloyd, A.C.; Cackette, T.A.; Diesel Engines: Environmental Impact and Control; J Air Waste Manage. Assoc. 2001, 51: 809- 847. http://www.arb.ca.gov/research/seminars/lloyd/AWMA2001/JAWMADieselCritical Review.pdf
Financial Analysis 4-33 Section 4

Pope et al, 1995. Pope, C.A.; Thun, M.J.; Namboodiri, M.M.; Dockery, D.W.; Evans, J.S.; Speizer, F.E.; Heath, C.W. Particulate Air Pollution as a Predictor of Mortality in Prospective Study of U.S. Adults, Am. J. Respir. Crit. Care Med.; 1995. U.S. EPA 1999. United States Environmental Protection Agency. November 1999, The Benefits and Costs of the Clean Air Act 1990 to 2010. EPA-410-R-99-001 http://www.epa.gov/air/sect812/copy99.html U.S. EPA 2000. United States Environmental Protection Agency. September 2000, Guidelines for Preparing Economic Analyses. EPA240-R-00-003 http://www.epa.gov/opei/pubsinfo.htm U.S. EPA 2003. United States Environmental Protection Agency. April 2003. United States Environmental Protection Agency, Assessment and Standards Division, Office of Transportation and Air Quality, Draft Regulatory Impact Analysis: Control of Emissions of Air Pollution from Nonroad Diesel Engines and Fuel. EPA420-R-03-008. CD-ROM. Research Triangle Park, North Carolina. http://www.epa.gov/otaq/cleaner-nonroad/r03008.pdf Viscusi and Aldy. 2003. Viscusi, W. K.; Aldy, J. E.; The Value of a Statistical Life: A Critical Review of Market Estimates throughout the World. Related Publication 03-2. AEI-Brookings Joint Center for Regulatory Studies. Stakeholder Comments Received: Rail Industry Only portions of the draft ARB document on potentially avoided undiscounted health care costs and alleged costs attributable to premature deaths were received and those portions were only available 10 days before comments were required. Additional portions were received only two working days before comments were required. Preliminary expert review demonstrates significant inconsistencies with accepted methodologies and fundamental flaws. Until appropriate peer review and an adequate review timeframe is allowed, it would be inappropriate for the Mayor to rely on health benefits estimated for the NNI Plan. The Task Force should not include the health benefits estimation in the draft report. Separate comments were sent to the NNI Task Force on Monday, June 20, 2005 highlighting critical concerns with the health benefits estimation. Finally, there is no consensus on the information presented in the health benefits estimation. We wish to draw your attention to our significant concerns relating to the draft Health Benefits analysis we received only last week, as members of the Financial Working Group. The draft Health Benefits analysis is deeply flawed. It is likely to mislead stakeholders. It increases the risk that solutions will be ineffective as well as costly in terms of the resources available to the Port, lessees, users, and surrounding communities. The flaws in the draft Health Benefits Analysis can be corrected. We have commissioned, and attached for inclusion in the final NNI Report, initial, independent reports regarding the draft Health Benefits analysis prepared by Dr. Michael Lakin (California EnSIGHT) and Dr. Philip Goad (Center for Toxicology and Environmental Health). We request that their reports and these additional comments be included in the final NNI Report. Why The Railroads Care About Health Benefits Estimates Flawed health benefits estimates can divert scarce resources from effective solutions and lead to wasteful solutions. The Port, lessees, users, and the surrounding communities do not have unlimited resources. Even effective solutions are likely to be expensive. Reliance on flawed analyses can mislead all stakeholders and lead to the wrong solutions, to a failure to improve the environment, and to additional wasteful solutions.
Financial Analysis 4-34 Section 4
These outcomes would defeat the stated purposes of the NNI Plan, contrary to sound public policy and the public good. Both of our railroads operate in and around the Port every day. We know the vital role that the Port plays in the economic health of the City and the State of California. Its facilities and operations are now among the largest and most complex in the world. The Port is a vital gateway between the entire country and the Pacific Rim. The consequences of flawed Port policies based on flawed premises, like the draft Health Benefits analysis, are huge. We are also aware that surrounding communities are concerned about the growth and impacts of the Port, including rail operations. We have worked with the Port and State of California, as well as the federal government, to improve the efficiency and reduce the environmental impacts of rail operations. Both our railroads have demonstrated that they want to work with agencies and other stakeholders to devise solutions that work. In this letter and the attached reports, the railroads describe how the health benefits estimate can be improved. The Health Benefits Analysis Process Was Flawed Late in the NNI Plan process, some of the stakeholders in the Financial Working Group asked the ARB and SCAQMD for help determining the health benefits of adoption of the NNI Plan. ARB and SCAQMD staff quickly estimated health benefits associated with reductions in diesel particulate matter (DPM) emissions, including estimating the “Annual Valuations of Premature Deaths Prevented by No Net Increase” and providing an initial evaluation of the uncertainties and limitations in ARB’s and SCAQMD’s own estimations. The railroads and other stakeholders have not had a meaningful opportunity for review of ARB/SCAQMD staff’s estimations. This process thus lacks fundamental fairness and the Port cannot now take any action approving or implementing the NNI Plan without providing an adequate opportunity for review of the ARB/SCAQMD staff’s estimations and also an opportunity for thorough, complete and transparent expert peer review. The Port Should Comply With CEQA To expedite the process of determining the health benefits of the NNI Plan, the Port can and should combine its further review with the environmental impact report (EIR) that the California Environmental Quality Act (CEQA) requires before the Port takes any further action. Unfortunately, it is now too late for the Port NNI Plan EIR to be “prepared as early as feasible in the planning process to enable environmental considerations to influence project program and design” as required by State CEQA Guidelines §15004(b). However, it is not too late for the Port “to provide meaningful information for environmental assessment” as also required by State CEQA Guidelines §15004(b) and for the Port to fully comply with all of the other requirements of CEQA. The EIR on the NNI Plan must “identify and focus on the significant environmental effects of the proposed project” including “relevant specifics of the area, population concentration, the human use of the land (including commercial and residential development), health and safety problems . . ., and other aspects of the resource base such as water, historical resources, scenic quality, and public services.” State CEQA Guidelines §15126.2(a). Of course, in the limited time available, the ARB/SCAQMD staff health benefits estimation did not and could not address even these mandatory and important topics. Specific Flaws That Must Be Addressed in the EIR As explained in more detail in the attached preliminary reports from Dr. Lakin and Dr. Goad, the ARB/SCAQMD staff estimation is deeply flawed on its face, it does not substitute for the required CEQA analysis, and it cannot serve as the basis for Port adoption or implementation of the NNI Plan. For example, Dr. Lakin and Dr. Goad found in their initial reviews that:
1. The MATES II monitoring data indicates less diesel particulate matter (DPM) in the air near Port area than in essentially all other locations monitored.
2. The MATES II monitoring data also indicates that substantially less DPM is measured in the Port area than is predicted by modeling. Monitoring data is more accurate than predictions
Financial Analysis 4-35 Section 4
based on modeling and should be considered in assessing the accuracy of predictions contained in the ARB/SCAQMD staff estimation and in developing a sound NNI Plan.
3. The State Implementation Plan methodology is not suited to modeling the emissions from a single facility in order to predict the concentration of those emissions in the air in and around the facility.
4. The studies that the ARB/SCAQMD staff estimation rests upon have not identified DPM as the cause of the premature deaths calculated in the ARB/SCAQMD staff estimation.
5. Health effects and linear dose-response relationships from exposure to low levels of DPM have not been established, contrary to the ARB/SCAQMD staff estimation.
6. The assumption in the ARB/SCAQMD staff estimation that a given reduction in DPM emissions results in identical reductions in population exposure – regardless of where the emissions occur -- is unfounded.
7. Methods of mortality rate calculations in the ARB/SCAQMD staff estimation are not appropriate or defensible. The methodology based on the estimate of premature mortality derived by Lloyd and Cackette (2001) should not be used until its accuracy, reliability, and appropriateness for its use as the basis for the NNI Plan until it can be independently validated by stakeholders.
8. The ARB/SCAQMD staff estimation ignores available regulatory guidance for human health effects analysis.
9. The methodology and assumptions used in the ARB/SCAQMD staff estimation are highly uncertain. Consequently, the results of the ARB/SCAQMD staff estimation are equally uncertain.
10. The results in the ARB/SCAQMD staff estimation are not readily reproducible to verify their accuracy due to the limited documentation provided.
11. The “Uncertainties and Limitations” section does not address all significant sources of uncertainties and does not address the uncertainty in the concentration– response relationship in adequate detail. Description, inclusion and summation of all sources of uncertainty should be provided in the NNI Plan.
12. The ARB/SCAQMD staff estimation may well mislead stakeholders and the public. How the Port Can Improve Health Benefits Estimates The railroads suggest that the Port should analyze the health benefits of the NNI Plan in a transparent, scientifically valid, and well-founded manner, using recognized and peer reviewed methodologies, such as:
• Valid and current monitoring data to define current conditions, to validate any modeling and to validate progress as defined by the NNI Plan.
• A toxicity assessment based on scientifically valid studies identifying health affects attributable specifically to DPM, as opposed to other air contaminants originating from other sources.
• A dose-response assessment based on valid scientific studies that determines the relationship between the level of DPM exposure and the health impacts resulting from that exposure, including identification of threshold levels below which adverse effects are not anticipated.
• Emissions and air dispersion modeling that estimates actual air concentrations of DPM based on anticipated uses of diesel engines and site-specific weather data in and around the Port. More refined air dispersion methodologies designed for this purpose are available and should be used.
• An exposure assessment that accounts for population characteristics such as number, location, and activity of potentially exposed people, and likely durations of exposure. This assessment should utilize both air dispersion modeling, and available fine particulate monitoring for geographically relevant areas neighboring the Port.
• Risk characterization that presents defensible scientifically supportable estimates of risk based on the toxicity assessment and exposure assessment performed for the NNI Plan.
• Uncertainties in the methods, assumptions, data, and conclusions should be clearly identified and addressed in the EIR.
Of course, the full health benefits analysis must be “readily available for public examination” under State CEQA Guidelines §15147. In preparing an adequate health benefits assessment, the Port may also find in this complex area that “early consultation solves many potential problems that would arise in more serious
Financial Analysis 4-36 Section 4

forms later in the review process.” State CEQA Guidelines §15083. Unlike the ARB/SCAQMD staff estimation, “Conclusory statements unsupported by factual information will not suffice.” State CEQA Guidelines §15088(c). The railroads look forward to participating in the preparation of a full and adequate EIR on the NNI plan. An NNI Plan that rests on a fully adequate EIR should provide assurance that public and private resources will be spent on truly improving air quality.
Financial Analysis 4-37 Section 4

Financial Analysis 4-38 Section 4

Financial Analysis 4-39 Section 4

Financial Analysis 4-40 Section 4

Financial Analysis 4-41 Section 4

Financial Analysis 4-42 Section 4

Financial Analysis 4-43 Section 4

Financial Analysis 4-44 Section 4
Financial Analysis 4-45 Section 4

Financial Analysis 4-46 Section 4
Financial Analysis 4-47 Section 4

Financial Analysis 4-48 Section 4

Financial Analysis 4-49 Section 4

Financial Analysis 4-50 Section 4
Financial Analysis 4-51 Section 4
Financial Analysis 4-52 Section 4

Financial Analysis 4-53 Section 4

Financial Analysis 4-54 Section 4
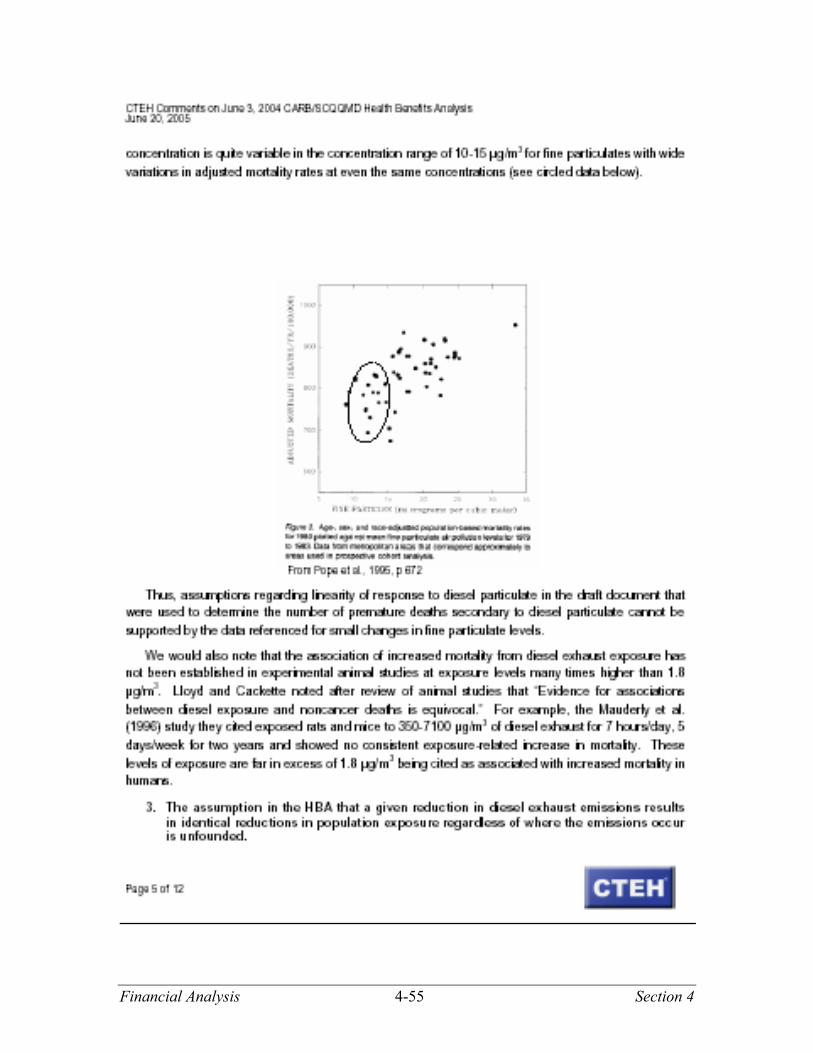
Financial Analysis 4-55 Section 4
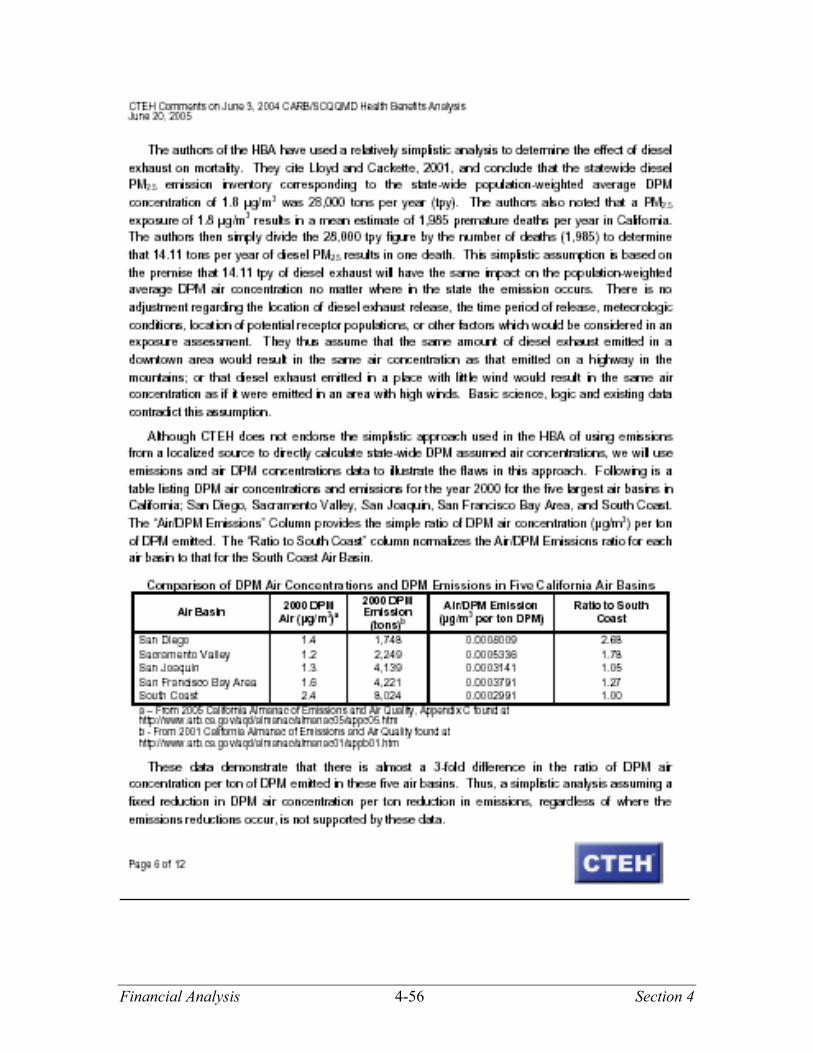
Financial Analysis 4-56 Section 4

Financial Analysis 4-57 Section 4

Financial Analysis 4-58 Section 4

Financial Analysis 4-59 Section 4

Financial Analysis 4-60 Section 4
Financial Analysis 4-61 Section 4
Financial Analysis 4-62 Section 4

Pacific Energy Partners
Financial Analysis 4-63 Section 4
Financial Analysis 4-64 Section 4

Natural Resources Defense Council The Natural Resources Defense Council (NRDC) and the Coalition for Clean Air (CCA) commend the California Air Resources Board (ARB) for its efforts to calculate the public health benefits associated with achieving the goal of No Net Increase (NNI). We strongly believe that it is absolutely imperative that these estimates be included in the final NNI submittal to the Mayor. As has been discussed during multiple Financial Working Group meetings, these estimates are based on a vetted methodology and years of research by state and national regulatory agency experts. Furthermore, these figures are the first representation of what community members and members of the NNI Task Force have been asking for since the outset of this effort. As we all know, the entire purpose of the NNI Task Force is to address the significant particulate matter (PM) and smog-forming emissions resulting from port operations which directly affect the health of workers and residents of nearby communities. The adverse health effects from exposure to air pollution generate high costs resulting from hospital visits, asthma attacks, lost work days and even premature deaths, just to name a few. Diesel pollution in particular from the ports' trains, ships, cargo handling equipment and trucks poses significant risks to local residents, including cancer and heart disease. Cancer clusters reported by USC to be statistically significant in the Los Angeles area should alarm us all. Other studies have shown that the health impacts from diesel pollution exposure alone cost Southern California over $10 billion last year. The health benefits resulting from implementation of the NNI plan, which, over time, exceeds one billion dollars annually, further help justify the costs associated with trying to reduce air pollution from port operations in our region. If the NNI plan is not implemented, communities adjacent to the Port of Los
Financial Analysis 4-65 Section 4

Angeles’ operations, including associated railyards and transportation corridors, will continue to bear the brunt of the health impacts and associated costs. In effect, residents throughout our region will continue to subsidize the movement of goods. Additionally, we understand the inherent uncertainties that surround such a valuation and believe ARB has done a good job of documenting these in its most recent updated drafts. As ARB staff has stated, these uncertainties are accounted for and captured in the significantly large confidence interval that bounds the mortality and non-morality estimates. We recommend including a summary table that includes both mortality and non-mortality estimates combined. Additionally, we do have the concern that asthma cases may be underestimated. It is unclear whether asthma prevalence captures not only visits to the hospital or a school nurse but also diagnosis by a pediatrician. This could result in a significant underestimation of asthma attacks. Finally, as NRDC, CCA, ARB and others have repeatedly emphasized, although the calculated public health benefits appear high, the proposed figures are underestimated. As ARB has noted in its updated draft, several health and non-health benefits that would result from achieving NNI were not included in the study. For example, health consequences from ozone exposure and other adverse health effects from PM exposure, such as respiratory illnesses, chronic respiratory diseases, low birth weight, and allergic responses, were not included in the valuation. Furthermore, NNI would avoid some non-health related costs, including reduced visibility from smog, climate change and its effect on the economy, noise and traffic congestion, and adverse effects on other organisms and ecosystems. These non-quantified impacts should be explicitly stated and addressed in a future iteration of this analysis. Additionally, the current ARB analysis should explicitly state that these benefits only capture those from achieving NNI. These health impact figures do not account for the public health impacts which will be incurred until the 2001 baseline is achieved. Similarly, ARB’s analysis does not capture the public health impacts that communities will continue to suffer even when 2001 baseline levels are achieved. ARB should clearly articulate these points in their analysis. Thank you again for the opportunity to provide comments on this critical element of the NNI plan.
Financial Analysis 4-66 Section 4
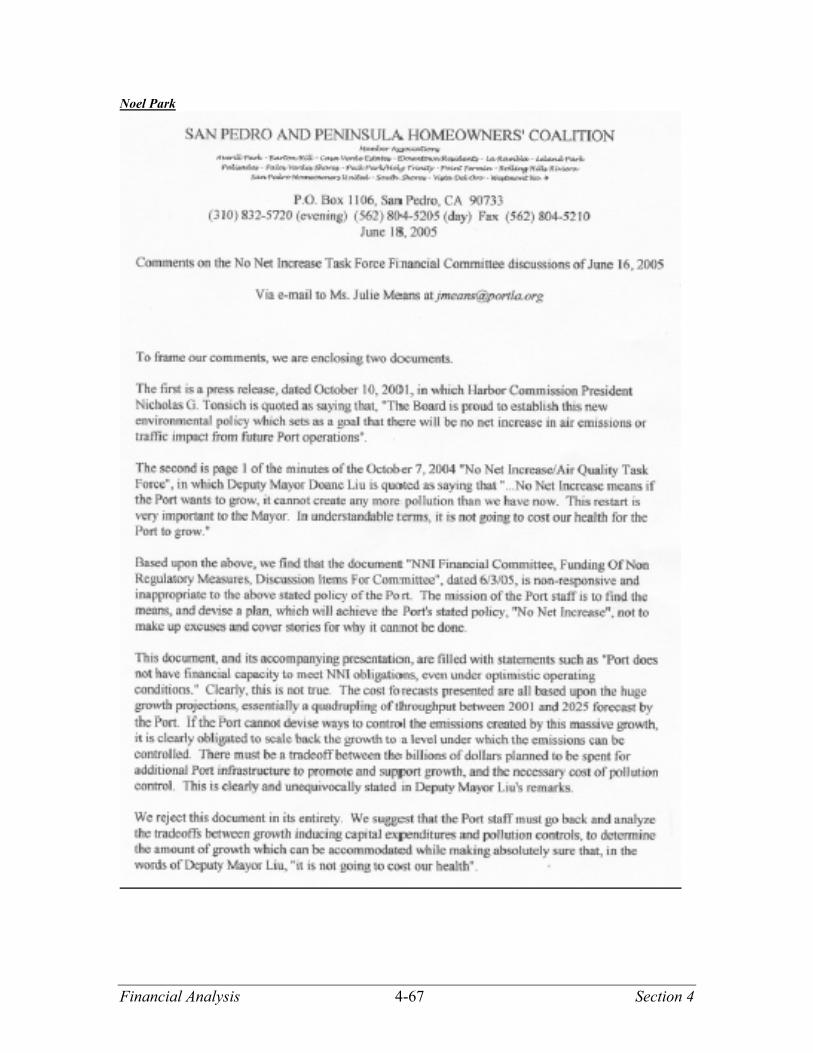
Noel Park
Financial Analysis 4-67 Section 4

Financial Analysis 4-68 Section 4

Financial Analysis 4-69 Section 4

Financial Analysis 4-70 Section 4

Financial Analysis 4-71 Section 4

NRDC We again commend the tremendous effort that has gone into development of these control measures; however, we wanted to raise some general and specific concerns given the additional information that has been incorporated into the cost documentation since our last comment letter to the Financial Working Group (FWG) on May 12th. Based upon our review, we have the following general comments followed by specific concerns on each measure:
GENERAL COMMENTS
We have a number of overarching concerns that impact the substantive discussion of the document:
1) The cost documentation should explicitly address and separate measures that are already mandatory due to regulation, MOU or other agreements. These costs should not be included in the costs to achieve ‘No Net Increase’ (NNI) since they are slated to be incurred independent of this plan. It is misleading to include costs of compliance or regulations, which could be interpreted as necessary to achieve NNI.
2) Currently, significant capital outlays are not amortized over time. For example, OGV14 has one time
capital outlays in 2010 and 2015 of over $500 million. These outlays do not reflect the fact that the costs will likely be spread out over time into the future.
3) In any cost summary tables, it should be noted that currently three measures account for over two-
thirds of the cost. Additionally, these measures have very tentative costs associated with them which should be prominently noted.
4) In cost summary tables, it should be noted that a third of the costs are currently incurred in 2023 and
beyond. Given significant outlays will occur after 2022, decision makers should have the opportunity to plan investments in advance, identify funding opportunities and prepare budgets.
5) As was presented on the first page of the 'Cost Summary' document, we agree costs should be broken
out in five year increments. We would also recommend that for each five year increment percentage reductions in PM and NOx be included. Note that by 2010, the NNI achieves approximately 50% annual reductions in PM and NOx based on $450 million in non-regulatory/compliance costs over the first five years.
6) It is our understanding that several regulatory rules currently under development will require portions
of certain measures to occur as compliance. Therefore, those measures should have discounted costs to account for compliance.
7) Given the inherent uncertainties in projecting costs far into the future, a range of costs should be
provided for each measure. Costs are dependent on a vast number of variables and presenting a single point estimate for annual costs is misleading.
8) The current cost documentation contains a number of measures without cost estimates. We strongly
recommend that any additional cost measures be distributed no later than Wednesday of this week to allow for sufficient time for review.
9) Many of the measures cover similar programs with overlapping costs. These overlapping costs must
be quantified and subtracted from the total NNI costs. We have highlighted individual measures where double counting may be occurring.
Financial Analysis 4-72 Section 4

10) As described in our previous comment letter to the FWG, we wanted to reiterate three general concerns (please reference our May 12th letter for a more detailed explanation):
a. The calculations currently proposed separate PM and NOx emission reductions in terms of cost effectiveness for each proposed mitigation measure. This practice is problematic because it does not truly capture the full benefit of implementing a measure simultaneously reducing PM and NOx. Furthermore, as suggested under the current Carl Moyer guideline update, we strongly believe that a cost-benefit equation that evaluates both PM and NOx reductions should at least account for the weighting factor of 10 attributable to PM health impacts as compared with NOx.
b. We would like the cost-basis document to clearly emphasize that the past Carl Moyer threshold for cost-effectiveness should not be relied upon going forward, particularly given the magnitude of the public health impacts from port operations and the Mayor’s directive to achieve a No Net Increase in air pollution from the Port of Los Angeles. Ultimately, all these measures are necessary to achieve the NNI goal to begin the process of protecting regional public health.
c. By relying solely on the Port of Los Angeles’ Emissions Inventory’s assumptions and emission figures, we have significant concerns that the emissions associated with OGV hotelling operations has been significantly understated. We recommend that these concerns be explicitly noted for each of these measures.
SPECIFIC COMMENTS ON CONTROL MEASURES
Our concerns over specific assumptions and estimates made in individual measures are detailed below.
Ocean- Going Vessel (OGV) Measures
OGV2 – Vessel Speed Reduction (VSR) Memorandum of Understanding (MOU) There is no detail or source listed for the estimate of $3,000 per vessel per hour. Additionally, this figure is inadequately representative given that it is only from one shipping line.
•
•
•
• •
•
•
•
•
This measure appears to be calculating costs for ‘delayed hours’. These costs are speculative given a ship’s ability to adjust speed outside of the 20 mile boundary and a shipping lines’ ability to adjust for shipping arrival times.
OGV3 – Alternative Marine Power (AMP) It is our understanding that the port is willing to pay up to $810,000 per ship retrofitted. Given China Shipping’s cost of $320,000 per vessel and other vessels such as cruise ships that have incurred retrofit costs of less than $500,000, it should not be assumed that AMP retrofits will cost the full $810,000. At the very least, a range in costs should be provided to capture this difference. Additional documentation is needed to support the $1.5 million estimate of cost to the port. It is unclear what the operational costs are based on. ARB, as part of their cold-ironing feasibility study, currently estimates 3 laborers per shift. As we have previously commented on a number of occasions, the hotelling emissions from auxiliary engines may be significantly underestimated. We recommend that this note be included in both the measure description document as well as in the cost document. We would also like this note to be incorporated in the other measures as appropriate.
OGV4 – Auxiliary Engine Fuel Improvement Program
Given the unpredictability in fuel costs, relying on costs from the 1st quarter of 2005 is limiting. We do not believe it is appropriate to use only this data point and extrapolate costs based on this figure 20 years into the future. This measure should at the very least capture a range in costs. We recommend using the 3-year average as a more representative cost premium. Also, as previously stated in our comment letter to the FWG (5/12/05), in anticipation of EU adoption and current CARB rulemaking, supply of lower sulfur marine fuels should increase, potentially resulting in a decrease in costs. This point should be noted in the cost basis documentation. We recommend noting fuel usage in the cost basis documentation to support the operating cost figures.
Financial Analysis 4-73 Section 4

OGV7 – Low Emissions Main Propulsion Engines
•
•
•
•
•
•
•
•
•
•
•
•
•
•
Our estimates for SCR range from $260,000 to $1.2 million, as documented in our August 2004 report, Harboring Pollution: Strategies to Clean Up U.S. Ports (Harboring Pollution)7, and are far lower than the $1.97 million included in this measure. Capital estimates for SCR and Man B&W should take into account the volume discounts that would apply given the large number of orders. Additionally, given that equipment is slated for purchase for at least 15 years, are these costs anticipated to remain constant for this technology into the future? The equipment life appears to be too low.
OGV8 – Cleaner Fuels for Auxiliary Engines & OGV 11 – Expanded Auxiliary Fuel Improvement Program
As recommended under OGV4, given the unpredictability in fuel costs, relying on costs from the 1st quarter of 2005 is limiting. We do not believe it is appropriate to use only this data point and extrapolate costs based on this figure 20 years into the future. This measure should at the very least capture a range in costs. We recommend using the 3-year average as a more representative cost premium. It should be noted in the cost analysis for this measure, what proportion of vessels would be switching from IFO 2.7% to MGO versus MDO to MGO. Also, as previously stated in our comment letter to the FWG (5/12/05), in anticipation of EU adoption and current CARB rulemaking, supply of lower sulfur marine fuels should increase, potentially resulting in a decrease in costs. This point should be noted in the cost basis documentation. We recommend noting fuel usage in the cost basis documentation to support the operating cost figures.
OGV9 – Main Engine Fuel Improvement Program, OGV10 – Sulfur Oxide Emission Control Area (SECA) & OGV12 – Expanded Main Engine Fuel Improvement Program
As recommended under OGV4, given the unpredictability in fuel costs, relying on costs from the 1st quarter of 2005 is limiting. We do not believe it is appropriate to use only this data point and extrapolate costs based on this figure 20 years into the future. This measure should at the very least capture a range in costs. We recommend using the 3-year average as a more representative cost premium. Also, as previously stated in our comment letter to the FWG (5/12/05), in anticipation of EU adoption and current CARB rulemaking, supply of lower sulfur marine fuels should increase, potentially resulting in a decrease in costs. This point should be noted in the cost basis documentation. We recommend noting fuel usage in the cost basis documentation to support the operating cost figures.
OGV14 – Retrofit/Repower Requirements for Infrequent Callers
We want to be sure the capital estimates for the new engines take into account any potential volume discounts that would apply given the large number of orders. Additionally, given that the equipment is slated for purchase in at least 5 to 10 years, are these costs anticipated to remain constant for this technology into the future?
OGV15 – Expanded VSR Program
There is no detail or source supporting the estimate of $3,000 per vessel per hour. Additionally, this figure is inadequately representative given that it is only from one shipping line.
7 This report is available online at: http://www.coalitionforcleanair.org/reports-harboring-pollution-strategies-to-clean-up-US-ports.html, or http://www.nrdc.org/air/pollution/ports/contents.asp
Financial Analysis 4-74 Section 4

This measure appears to be calculating costs for ‘delayed hours’. These costs are speculative given a ship’s ability to adjust speed outside of the 40 mile boundary and a shipping line’s ability to adjust for shipping arrival times.
•
•
• •
•
•
•
•
Annual reporting costs should not be double counted in conjunction with OGV2. OGV16 – Expanded Alternative Maritime Power (AMP)
Additional documentation is needed to support the $1.5 million port cost. Costs should account for economies of scale when multiple ‘outlets’ will be installed at a given terminal. Given the $320,000 actual cost to retrofit the China Shipping vessel, $500,000 per ship for all years into the future is high. At the very least a range should be noted. ARB, as part of their cold-ironing feasibility study, currently estimates only 3 laborers per shift needed for such a program.
Harbor Craft (HC) Measures
HC2 – Clean Fuels for Harbor Craft
This item will be required by regulation and should not be categorized as costs necessary to achieved NNI.
HC3 – Early Implementation of ULSD
As previously stated in our comment letter to the FWG (5/12/05), there is no support for the $0.07 subsidy cost per gallon. ARB’s June 2003 Proposed Amendments to California’s Diesel Fuel Regulations Document (http://www.arb.ca.gov/regact/ulsd2003/isor.pdf) on page 11 estimates that the costs of reducing the sulfur content of diesel fuel and requiring the fuel to meet minimum lubricity specifications will be about 2 to 4 cents per gallon of diesel.
•
•
•
•
•
•
It is not clear whether fuel consumption estimates account for more efficient engines installed through repowers.
HC5 – Technical Advisory Committee (TAC) Harbor Craft Measures
It is not clear whether or how these costs will be included.
HC7 – Emulsified Fuels
It is not clear whether fuel consumption estimates account for more efficient engines installed through repowers.
HC9 – Repower Existing Harbor Craft
The assumptions behind the estimated $160,000 cost per repower must be clearly stated. For example, incentive programs commonly cover the cost of a new engine. The resale value of the old engine commonly covers most drydock and installation expenses, leaving an overall incremental cost of roughly $50,000, as documented in our August 2004 report, Harboring Pollution.8
HC10 – Harbor Craft Retrofits
It is not clear whether some of these technologies are appropriate for use on harbor craft, most notably Lean NOx catalysts. The costs of some of the retrofit controls have not all been scaled for use on large horsepower engines.
8 This report is available online at: http://www.coalitionforcleanair.org/reports-harboring-pollution-strategies-to-clean-up-US-ports.html, or http://www.nrdc.org/air/pollution/ports/contents.asp
Financial Analysis 4-75 Section 4

o The $2,000 cost estimate of a DOC is more appropriate for a bus or truck. In Harboring Pollution, we estimated $50,000 for a DOC scaled for a tugboat, including installation costs.
o The $10,000 cost estimate for a DPF is also more appropriate for a bus or truck. We have no estimate for a DPF scaled to a harbor craft and are not sure a DPF would work well on a harbor craft. However, the estimated cost for a DPF should be over $50,000 if it was found to be compatible on harbor craft.
HC11 – AMP-Ready Staging Areas
•
• •
•
•
•
•
• •
•
As of December 2003, according to the Port of Los Angeles, 6 of 12 tugs based at the port had the capability to plug into electrical power while not in use.9 This should be accounted for in the costs for this measure.
Cargo Handling Equipment (CHE) Measures
CHE2 - YT Modernization & ULSD
The LSD cost of $0.07 per gallon is too high, per comments above. At least part of the modernization program could be paid for by other incentive fund programs such as Carl Moyer. Further, this measure may be part of compliance with the upcoming CARB CHE ATCM. Therefore costs are overestimated.
CHE3 - Early implementation of ULSD for non-YT
The LSD cost of $0.07 per gallon is too high, per comments above. CHE4 - Alternative Yard Tractor Resolution, no cost estimate
This measure should include a cost estimate. For example, LNG yard tractors being purchased for use at the YTI terminal at the Port of Los Angeles and at the LBCT at the Port of Long Beach cost roughly $106,000. This is an approximately $40,000 incremental cost to the base off-road diesel without after-treatment. However that cost is likely to be covered by incentive funding programs, such as Carl Moyer.
CHE5 - Emulsified Fuels This program should not be included as an extra cost specific to NNI since it is an ongoing program already in existence.
CHE6 - TAC CHE Measures
This measure is missing an explanation of the cost. It simply has a $1.75 million cost listed from the port.
CHE7 - Expanded YT Modernization
It is not clear why the level of subsidy varies from 30% to 40% for different phases of this measure. At least part of this measure would be attributable to compliance of the upcoming CARB CHE ATCM; therefore the overall cost to NNI is over estimated.
CHE8 - Enhanced CHE Modernization
At least part of this measure would be attributable to compliance of the upcoming CARB CHE ATCM; therefore the overall cost to NNI is over estimated.
9 Garrett, T.L. Air Resources Group, Port of Los Angeles, personal conversation on December 8, 2003. As reported in NRDC’s and CCA’s report “Harboring Pollution: The Dirty Truth about U.S. Ports”, March 2004.
Financial Analysis 4-76 Section 4
Locomotive Measures
R2 - ARB low sulfur Diesel No cost should be included since this measure is only compliance with existing regulations. •
•
•
•
•
•
•
•
•
•
The LSD cost of $0.07 per gallon is too high, per comments above. R3 - Federal low sulfur diesel for locomotives
Again this measure is an existing rule and therefore costs nothing more than compliance.
R5 - Switcher Modernization (16) and low sulfur diesel until 2007 mandatory deadline The $1.2 million cost for each new Switcher is too high. In Harboring Pollution, we report that a new electric hybrid switcher costs $750,000. The cost may have increased in the past year, but $1.2 million is not a reasonable estimate. The LSD cost of $0.07 per gallon is too high, per comments above.
R6 - Ultra-low Emission Locomotives (4)
The costs for new locomotives are reasonable: $1.07 million for National Railway Equipment and $783,000 for Railpower, but why invest in new National Railway Equipment locomotives that are one quarter of a million dollars more expensive than the Railpower switchers if both meet the same emission standards? Costs for the Cleaire Longview retrofit are reasonable at $25,000, but useful lifetime of 8 years appears to be too short.
R7 - Ultra Low Emission Line Haul and Switch Locomotives
The replacement program for 150 new LNG line haul locomotives assumes an inflated cost estimate of $1.7 million per LNG train.
o If 150 new LNG line haul locomotives are deployed, the per unit cost will be much lower. o The $1.7 million is likely based upon the incremental cost of the 4 LNG locomotives that
Hunter & Hunter wants to deploy between the Port and Lancaster, CA. However, this short-line route is probably not typical of the 150 locomotives being discussed in this measure.
o The $1.7 million cost of the Hunter & Hunter project was fully funded through the Carl Moyer program. Similar funding would apply to this measure, covering or at least lowering the cost.
o Energy Conversions Inc. (ECI) reports a cost of roughly $2 million for new OEM LNG locomotives. However, existing diesel locomotives converted to LNG, which is likely to be the case here, cost as little as $1 million per locomotive.
o In comparison, Motive Power, the company that built the four LNG switch locomotives now being used in Vernon, estimates a cost of $1.25 million for a new 2000 HP line-haul LNG locomotive. This is cheaper than a new diesel locomotive, which costs approximately $1.5 million.
The refueling station costs of $4 million per station are too high. o For example, the largest LNG station in the world (City of Los Angeles East Valley) cost
less than $4 million. o Noting that the cost of the fueling station depends on the size, how many locomotives
need to be fueled and daily fueling demands; and assuming that each locomotive will burn about 1,000 gallons of LNG per day; if 10 locomotives share a station, it will require 30,000 to 50,000-gallons of LNG storage on-site, costing roughly $2.0 million.
o Similarly, a station serving 25 LNG locomotives would cost approximately $3.0 million. o Finally, fueling infrastructure may cost nothing at all, considering that LNG locomotives
can actually be fueled directly from a 10,000-gallon LNG transport truck. The four LNG locomotives in Vernon are currently being fueled in this manner, at no infrastructure cost. The cost of the fuel is the same as if it were delivered into a fueling station.
The $116,000 estimate in extra fuel costs of LNG is questionable. o Currently LNG is selling for roughly the same price as diesel, actually a few cents less
per diesel equivalent gallon.
Financial Analysis 4-77 Section 4
o In the future, especially if the SES LNG terminal is successful, we expect that the cost of LNG will be significantly less than diesel.
o For the purposes of this report, we recommend that the cost of the LNG be conservatively considered equal to that of diesel.
Oxidation catalysts should not need to be replaced every 8 years and the initial cost of $200,000 for original OCs seems too high.
•
•
•
•
•
•
•
•
• •
•
•
•
• •
•
•
The replacement program for 25 Switchers seems duplicative of R5 & R6; therefore costs should not be added but taken in place of R5 and R6.
R9 - CARB Diesel for Class 1 Railroads
This measure should not include the cost of fuel for 25 switchers because they already have to comply with the CARB fuel rule for intra-state locomotives, whether they are owned by Class 1 railroads or not. The LSD cost of $0.05 per gallon is too high, per comments above.
R10 - Idling controls for line hauls & switcher locomotives
The idling control cost of $16,000 is reasonable although some are much cheaper. A range of costs would have been useful. New switchers come with automatic idling controls, so the cost for 25 switchers should not be included since other measures cover their replacement. Heavy-duty Diesel Vehicle (HDDV) Measures
HDV3 - Gateway Cities
This program already has funding and therefore should not be counted as part of the NNI additional expenses.
HDV5 - ULSD
This is a mandatory federal rule; compliance should not be counted within NNI costs The LSD cost of $0.06 per gallon is too high, per comments above.
HDV10 - Expanded Gateway Cities
This measure may be covered in some part by existing Gateway Cities funds and therefore over estimates the cost. Useful life estimates (Truck - 10 years, DPF - 5 years) are too low although it’s unclear whether they are incorporated or not. The number of trucks does not add up:
o 1987 – 1993 are replaced in two years from 2008-2009. o The same model year group is replaced again from 2009 – 2012. o 1991 and newer model trucks should be replaced with 2004 and newer models instead of
1999 or newer models suggested here; maybe that was accounted for in some of the capital cost estimates, since the cost jumps from $25,000 per new truck to $46,250 without explanation.
HDV12 - Early ULSD Implementation
The LSD cost of $0.07 per gallon is too high, per comments above. It is not clear whether this measure would work. For example, how would it be enforced?
HDV13 - Retrofit HDVs with DOCs
It is not clear that this measure achieves any emission reductions, 1999 and newer trucks are likely to utilize a catalyst. Therefore adding a DOC would be redundant. The cost of adding a DPF to the same trucks is accounted for in the next measure; this is double counting costs.
Financial Analysis 4-78 Section 4

Financial Analysis 4-79 Section 4
HDV14 - Retrofit HDVs with DPFs •
•
The cost of $8,500 for DPFs is reasonable, however Moyer and other incentive programs may cover some of these costs. The 5-year useful lifetime is too low.