Financial Accounting Project
11
9/4/2016 FINANCIAL ACCOUNTING RESEARCH PROJECT Performance Evaluation and Ratio Analysis of Pharmaceutical Companies PRESENTED BY: TEAM NO. 3 ARPIT TANDON (MYDM-2018-10) ASHISH DONGRE (MYDM-2018-11) ASHISH JAIN (MYDM-2018-12) ATUL KUMAR DWIVEDI (MYDM-2018-13) BALAKUMAR G.R (MYDM-2018-14) FACULTY: Dr. R. Radhakrishna SUBJECT CODE:
-
Upload
arpit-tandon -
Category
Economy & Finance
-
view
96 -
download
0
Transcript of Financial Accounting Project
9/4/2016
FINANCIAL ACCOUNTING RESEARCH
PROJECT Performance Evaluation and Ratio Analysis of
Pharmaceutical Companies
PRESENTED BY:
TEAM NO. 3
ARPIT TANDON (MYDM-2018-10)
ASHISH DONGRE (MYDM-2018-11)
ASHISH JAIN (MYDM-2018-12)
ATUL KUMAR DWIVEDI (MYDM-2018-13)
BALAKUMAR G.R (MYDM-2018-14)
FACULTY: Dr. R. Radhakrishna
SUBJECT CODE:
1 | P a g e
CONTENTS
TOPICS PAGE NO.
1 ABSTRACT 2
2 COMPANY OVERVIEW
3
3 RATIO ANALYSIS
Current Ratio
Quick Ratio
Solvency Ratio
Debt to Equity Ratio
Inventory Turnover Ratio
Collection Period (DAYS)
Assets Turnover Ratio
Operating Margin Ratio
Net Margin Ratio
Return on Total Assets
Ratio
Return on Equity Ratio
4-9
4 REFERENCES 10

2 | P a g e
ABSTRACT
The thesis applies Performance Evaluation and Ratio Analysis of pharmaceutical companies
listed in S&P 500. It means evaluating how well the company performs. The main aim is
achieved through ratio analysis of two pharmaceutical (Pfizer and AbbVie) companies in the
US. Different financial ratios have been evaluated like liquidity ratios, asset management ratios,
profitability ratios, market value ratios, debt management ratios and finally to measure the best
performance between two companies. The mathematical calculation has been established for
ratio analysis between two companies from 2013-2015. It is the most important factor for
performance evaluation. The graphical analysis and comparisons are applied between two
companies for measurement of all types of financial ratio analysis. Liquidity ratio is conveying
the ability to repay short-term creditors. It determines performance of short term creditor of both
pharmaceutical companies under the three categories such as current ratio, quick ratio and
cash ratio. Asset management ratio is measurement how effectively a company uses and controls
its assets. It’s also quantified into seven categories for both pharmaceutical companies such as
account receivable turnover, average collection period, inventory turnover, account payable
turnover, account payable turnover in days, fixed asset turnover, total asset turnover.
Profitability ratio evaluates how well a company is performing by analyzing and how profit
was earned relative to sales, total assets and net worth for both pharmaceutical companies.
Debt coverage ratio is used for performing the property insufficient to collect their
mortgage for both companies and market value is performed to analyze their future
market value of the stock market. Overall analyses are measured between both Pfizer and
AbbVie.
NOTE: Inspite of collecting data for the 3 financial years i.e. 2013-2015, we have added
2012 data in the table in order to calculate the net receivables.
Keyword: Financial analysis, ratio analysis, Pfizer company financial analysis, AbbVie
financial analysis.

3 | P a g e
Company Overview
Pfizer Inc. is an American global pharmaceutical corporation headquartered in New York
City, with its research headquarters in Groton, Connecticut. It is among the world's largest
pharmaceutical companies. Pfizer is listed on the New York Stock Exchange, and its shares have
been a component of the Dow Jones Industrial Average since 2004.
Pfizer develops and produces medicines and vaccines for a wide range of medical disciplines,
including immunology, oncology, cardiology, diabetology/endocrinology, and neurology.
Pfizer's products include the blockbuster drug Lipitor (atorvastatin), used to lower LDL blood
cholesterol.
AbbVie Inc. is a pharmaceutical company that discovers, develops, and markets
both biopharmaceuticals and small molecule drugs. It originated in 2013 as a spin-off of Abbott
Laboratories.
AbbVie developed adalimumab, which is marketed under the trade name Humira,
a biopharmaceutical treatment for autoimmune diseases that has exceeded $10 billion in global
sales. AbbVie’s portfolio of medicines also includes AndroGel, Creon, Duodopa and
Duopa, Kaletra, Lupron, Niaspan, Norvir, Sevoflurane, Synagis,Synthroid, TriCor and
Trilipix, Viekira, and Zemplar.

4 | P a g e
1. CURRENT RATIO:
The Current Ratio is a liquidity and an efficiency ratio that measures a firm's ability to pay off its short-term liabilities with
its current assets. A current ratio of 2:1 is considered satisfactory.
Pfizer Inc. (PFE)
Particulars Y 2015 Y 2014 Y 2013 Y 2012
Total current assets $43,804,000,000 $55,595,000,000 $56,244,000,000 $64,831,000,000
Total current liabilities $29,399,000,000 $21,587,000,000 $23,366,000,000 $29,186,000,000
Current Ratio 1.489982652 2.575392597 2.407087221 2.221304735
AbbVie Inc. (ABBV)
Particulars Y 2015 Y 2014 Y 2013 Y 2012
Total current assets $16,314,000,000 $16,081,000,000 $17,848,000,000 $15,354,000,000
Total current liabilities $10,894,000,000 $11,393,000,000 $6,879,000,000 $6,776,000,000
Current Ratio 1.497521572 1.411480743 2.594563163 2.265938606
Analysis: In 2015, the current ratio of AbbVie is higher as compared to Pfizer. It implies that a higher current ratio is
always more favorable than a lower current ratio because it shows the company can more easily make current debt
payments. In 2014, Pfizer has a higher ratio as compared to AbbVie. In this case, Pfizer can more easily make current debt
payments. In 2013, AbbVie has a higher value compared to Pfizer. Thus for this year, AbbVie can easily make more current
debt payments.
2. QUICK RATIO:
The Quick Ratio or Acid Test Ratio is a liquidity ratio that measures the ability of a company to pay its current liabilities
when they come due with only quick assets. Quick assets are current assets that can be converted to cash within 90 days
or in the short-term. A quick ratio of 1:1 is an ideal ratio.
Pfizer Inc. (PFE)
Particulars Y 2015 Y 2014 Y 2013 Y 2012
Total current assets $16,314,000,000 $16,081,000,000 $17,848,000,000 $15,354,000,000
Prepaid exp. and other $1,458,000,000 $1,952,000,000 $1,234,000,000 $1,320,000,000
Inventories, net $1,719,000,000 $1,124,000,000 $1,150,000,000 $1,091,000,000
Quick Assets $13,137,000,000 $13,005,000,000 $15,464,000,000 $12,943,000,000
Total current liabilities $29,399,000,000 $21,587,000,000 $23,366,000,000 $29,186,000,000
Quick Assets 0.446851934 0.602445917 0.661816314 0.443466045
AbbVie Inc. (ABBV)
Particulars Y 2015 Y 2014 Y 2013 Y 2012
Total current assets $16,314,000,000 $16,081,000,000 $17,848,000,000 $15,354,000,000
Prepaid exp. and other $1,458,000,000 $1,952,000,000 $1,234,000,000 $1,320,000,000
Inventories, net $1,719,000,000 $1,124,000,000 $1,150,000,000 $1,091,000,000
Quick Assets $13,137,000,000 $13,005,000,000 $15,464,000,000 $12,943,000,000
Total current liabilities $10,894,000,000 $11,393,000,000 $6,879,000,000 $6,776,000,000
Quick Assets 1.205893152 1.141490389 2.248001163 1.910123967
Analysis: In 2015, the Quick ratio of Pfizer is slightly higher as compared to AbbVie. It implies that there are more quick
assets as compared to current liabilities. In 2014, Pfizer has a comparatively higher value as compared to Abbvie. In this
case, Pfizer has more quick assets than current liabilities. As the ratio increases so does the liquidity of the company. In
2013, AbbVie has a higher value when compared to Pfizer. Hence, AbbVie would be able to have more quick assets
compared to current liabilities.

5 | P a g e
3. SOLVENCY RATIO:
Solvency ratios, also called leverage ratios, measure a company's ability to sustain operations indefinitely by comparing
debt levels with equity, assets, and earnings.
Pfizer Inc (PFE)
Particulars Y 2015 Y 2014 Y 2013 Y 2012
Total current liabilities $29,399,000,000 $21,587,000,000 $23,366,000,000 $29,186,000,000
Long-term debt $28,740,000,000 $31,541,000,000 $30,462,000,000 $31,036,000,000
Total Debt $58,139,000,000 $53,128,000,000 $53,828,000,000 $60,222,000,000
Total assets $167,381,000,000 $167,566,000,000 $172,101,000,000 $185,798,000,000
Solvency Ratio 34.73452781 31.70571596 31.2769827 32.41262016
AbbVie Inc. (ABBV)
Particulars Y 2015 Y 2014 Y 2013 Y 2012
Total current liabilities $10,894,000,000 $11,393,000,000 $6,879,000,000 $6,776,000,000
Long-term debt $29,240,000,000 $10,538,000,000 $14,292,000,000 $14,630,000,000
Total Debt $40,134,000,000 $21,931,000,000 $21,171,000,000 $21,406,000,000
Total assets $16,314,000,000 $16,081,000,000 $17,848,000,000 $15,354,000,000
Solvency Ratio 246.0095623 136.3783347 118.6183326 139.4164387
Analysis: As per the table, in all the 3 years from 2013 to 2015, the solvency ratio of AbbVie is much higher when
compared to Pfizer. Solvency ratios show a company's ability to make payments and pay off its long-term obligations to
creditors, bondholders, and banks. Better solvency ratios indicate a more creditworthy and financially sound company in
the long-term. Hence, AbbVie will be a more financially sound company in the long term.
4. DEBT to EQUITY RATIO:
The Debt to Equity Ratio is a financial, liquidity ratio that compares a company's total debt to total equity. Normally debt-
equity ratio of 1:1 is reasonable.
Pfizer Inc. (PFE)
Particulars Y 2015 Y 2014 Y 2013 Y 2012
Total current liabilities $29,399,000,000 $21,587,000,000 $23,366,000,000 $29,186,000,000
Long-term debt $28,740,000,000 $31,541,000,000 $30,462,000,000 $31,036,000,000
Total Debt $58,139,000,000 $53,128,000,000 $53,828,000,000 $60,222,000,000
Total Equity $64,998,000,000 $71,622,000,000 $76,620,000,000 $81,678,000,000
Debt Equity Ratio 89.447367611 74.178325096 70.253197599 73.730992434
AbbVie Inc. (ABBV)
Particulars Y 2015 Y 2014 Y 2013 Y 2012
Total current liabilities $10,894,000,000 $11,393,000,000 $6,879,000,000 $6,776,000,000
Long-term debt $29,240,000,000 $10,538,000,000 $14,292,000,000 $14,630,000,000
Total Debt $40,134,000,000 $21,931,000,000 $21,171,000,000 $21,406,000,000
Total Equity $3,945,000,000 $1,742,000,000 $4,492,000,000 ($350,000,000)
Debt Equity Ratio 1017.338403 1258.955224 471.3045414 (6116)
Analysis: A lower debt to equity ratio usually implies a more financially stable business. Companies with a higher debt to
equity ratio are considered more risky to creditors and investors than companies with a lower ratio. In 2015, Pfizer has a
higher ratio compared to AbbVie, which means Pfizer is more risky to investors and AbbVie is financially stable. In 2014,
ratio of Pfizer is less compared to Abbvie which implies that in this year, Pfizer has a more stable business compared to
AbbVie. In 2013, AbbVie has a higher ratio compared to Pfizer which implies that it was more risky to investors in that
period.

6 | P a g e
5. INVENTORY TURNOVER RATIO:
The inventory turnover ratio is an efficiency ratio that shows how effectively inventory is managed by comparing cost of
goods sold with average inventory for a period.
Pfizer Inc. (PFE)
Particulars Y 2015 Y 2014 Y 2013 Y 2012
Cost of good sales $9,648,000,000 $9,577,000,000 $9,586,000,000 $9,821,000,000
Inventories $7,513,000,000 $5,663,000,000 $6,166,000,000 $6,076,000,000
Average Inventories $6,588,000,000 $5,914,500,000 $6,121,000,000
Inventories Turnover Ratio 1.464480874 1.619240849 1.566083973
AbbVie Inc. (ABBV)
Particulars Y 2015 Y 2014 Y 2013 Y 2012
Cost of goods sold $4,500,000,000 $4,426,000,000 $4,581,000,000 $4,508,000,000
Inventories $1,719,000,000 $1,124,000,000 $1,150,000,000 $1,091,000,000
Average Inventories $1,421,500,000 $1,137,000,000 $1,120,500,000
Inventory Turnover Ratio 3.165670067 3.892700088 4.088353414
Analysis: Inventory turnover is a measure of how efficiently a company can control its merchandise, so it is important to
have a high turn. It shows that the company can effectively sell the inventory it buys. In 2015, 2014 as well as in 2013,
AbbVie has a higher ratio compared to Pfizer which means AbbVie can efficiently control its merchandise. On the contrary,
Pfizer’s ratio reflects dull business, over investment in inventory, wrong valuation of stock and stock of unsaleable &
obsolete goods.
6. COLLECTION PEROID (DAYS):
The Average Collection Period or Days' Sales in Receivables, measures the number of days it takes a company to collect
cash from its credit sales. This calculation shows the liquidity and efficiency of a company's collections department.
Pfizer Inc. (PFE)
Particulars Y 2015 Y 2014 Y 2013 Y 2012
Revenues $48,851,000,000 $49,605,000,000 $51,584,000,000 $54,657,000,000
Receivables $8,176,000,000 $8,401,000,000 $9,357,000,000 $10,675,000,000
Average Receivables $8,288,500,000 $8,879,000,000 $10,016,000,000
Collection Period (Days) 61.92918262 65.33282935 70.87158809
AbbVie Inc. (ABBV)
Particulars Y 2015 Y 2014 Y 2013 Y 2012
Revenues $22,859,000,000 $19,960,000,000 $18,790,000,000 $18,380,000,000
Receivables $4,730,000,000 $3,735,000,000 $3,854,000,000 $4,298,000,000
Average Receivables $4,232,500,000 $3,794,500,000 $4,076,000,000
Collection Periods (Days) 67.58224332 69.3884018 79.17722193
Analysis: A lower ratio is more favorable because it means companies collect cash earlier from customers and can use
this cash for other operations. A higher ratio indicates a company with poor collection procedures and customers who are
unable or unwilling to pay for their purchases. In 2015, 2014 as well as in 2013, AbbVie has a higher value when compared
to Pfizer which means AbbVie is unable to convert sales into cash as quickly as firms with lower ratios. On the contrary,
Pfizer’s account receivables are good and won’t be written off as bad debts.
7 | P a g e
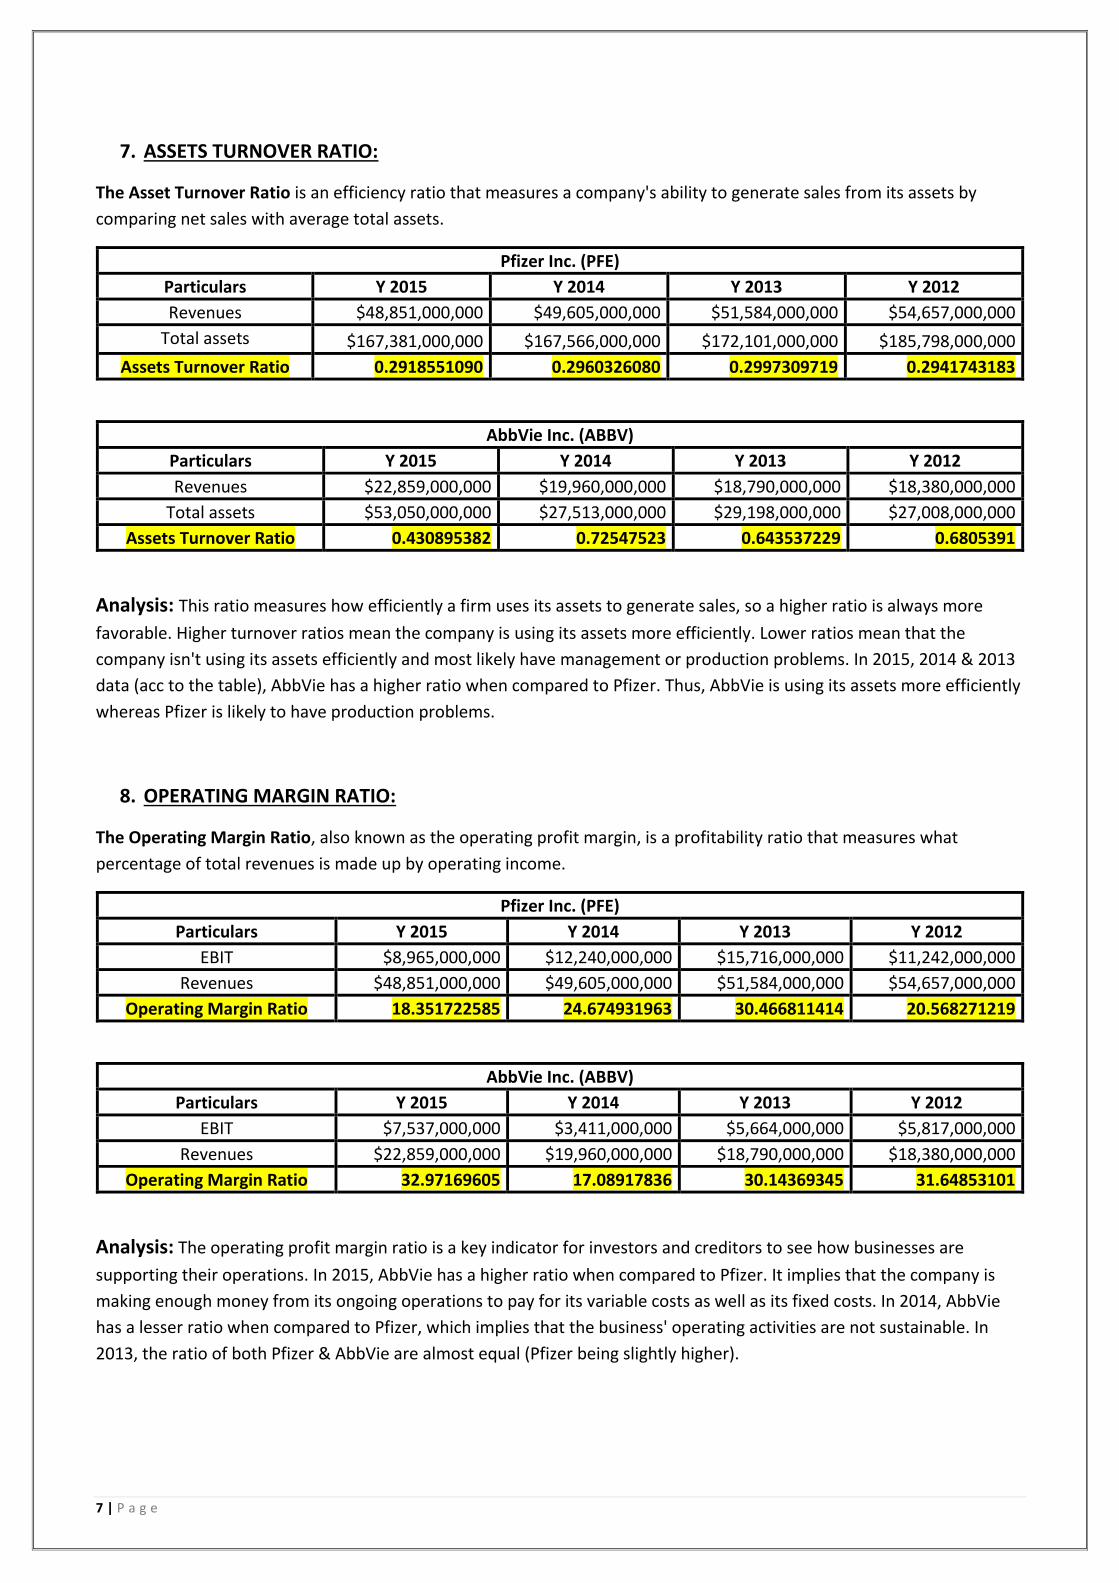
7. ASSETS TURNOVER RATIO:
The Asset Turnover Ratio is an efficiency ratio that measures a company's ability to generate sales from its assets by
comparing net sales with average total assets.
Pfizer Inc. (PFE)
Particulars Y 2015 Y 2014 Y 2013 Y 2012
Revenues $48,851,000,000 $49,605,000,000 $51,584,000,000 $54,657,000,000
Total assets $167,381,000,000 $167,566,000,000 $172,101,000,000 $185,798,000,000
Assets Turnover Ratio 0.2918551090 0.2960326080 0.2997309719 0.2941743183
AbbVie Inc. (ABBV)
Particulars Y 2015 Y 2014 Y 2013 Y 2012
Revenues $22,859,000,000 $19,960,000,000 $18,790,000,000 $18,380,000,000
Total assets $53,050,000,000 $27,513,000,000 $29,198,000,000 $27,008,000,000
Assets Turnover Ratio 0.430895382 0.72547523 0.643537229 0.6805391
Analysis: This ratio measures how efficiently a firm uses its assets to generate sales, so a higher ratio is always more
favorable. Higher turnover ratios mean the company is using its assets more efficiently. Lower ratios mean that the
company isn't using its assets efficiently and most likely have management or production problems. In 2015, 2014 & 2013
data (acc to the table), AbbVie has a higher ratio when compared to Pfizer. Thus, AbbVie is using its assets more efficiently
whereas Pfizer is likely to have production problems.
8. OPERATING MARGIN RATIO:
The Operating Margin Ratio, also known as the operating profit margin, is a profitability ratio that measures what
percentage of total revenues is made up by operating income.
Pfizer Inc. (PFE)
Particulars Y 2015 Y 2014 Y 2013 Y 2012
EBIT $8,965,000,000 $12,240,000,000 $15,716,000,000 $11,242,000,000
Revenues $48,851,000,000 $49,605,000,000 $51,584,000,000 $54,657,000,000
Operating Margin Ratio 18.351722585 24.674931963 30.466811414 20.568271219
AbbVie Inc. (ABBV)
Particulars Y 2015 Y 2014 Y 2013 Y 2012
EBIT $7,537,000,000 $3,411,000,000 $5,664,000,000 $5,817,000,000
Revenues $22,859,000,000 $19,960,000,000 $18,790,000,000 $18,380,000,000
Operating Margin Ratio 32.97169605 17.08917836 30.14369345 31.64853101
Analysis: The operating profit margin ratio is a key indicator for investors and creditors to see how businesses are
supporting their operations. In 2015, AbbVie has a higher ratio when compared to Pfizer. It implies that the company is
making enough money from its ongoing operations to pay for its variable costs as well as its fixed costs. In 2014, AbbVie
has a lesser ratio when compared to Pfizer, which implies that the business' operating activities are not sustainable. In
2013, the ratio of both Pfizer & AbbVie are almost equal (Pfizer being slightly higher).

8 | P a g e
9. NET MARGIN RATIO:
Net Margins Ratio is a profitability ratio that measures the amount of net income earned with each dollar of sales
generated by comparing the net income and net sales of a company.
Pfizer Inc. (PFE)
Particulars Y 2015 Y 2014 Y 2013 Y 2012
EAT $6,986,000,000 $9,168,000,000 $22,072,000,000 $14,598,000,000
Revenues $48,851,000,000 $49,605,000,000 $51,584,000,000 $54,657,000,000
Net Margins Ratio 14.300628442 18.482007862 42.788461538 26.708381360
AbbVie Inc. (ABBV)
Particulars Y 2015 Y 2014 Y 2013 Y 2012
EAT $5,144,000,000 $1,774,000,000 $4,128,000,000 $5,275,000,000
Revenues $22,859,000,000 $19,960,000,000 $18,790,000,000 $18,380,000,000
Net Margins Ratio 22.50317162 8.887775551 21.96913252 28.69967356
Analysis: This ratio also indirectly measures how well a company manages its expenses relative to its net sales. In 2015,
Pfizer’s ratio is less when compared to AbbVie. It implies that Pfizer has generated less revenues. In 2014 & 2013, Pfizer
has generated more revenues which means it has either maintained its revenues or lowered its expenses.
10. RETURN ON TOTAL ASSETS RATIO :
The Return on Total Assets Ratio, often called the return on total assets, is a profitability ratio that measures the net
income produced by total assets during a period by comparing net income to the average total assets. . Since company
assets' sole purpose is to generate revenues and produce profits, this ratio helps both management and investors see how
well the company can convert its investments in assets into profits.
Pfizer Inc. (PFE)
Particulars Y 2015 Y 2014 Y 2013 Y 2012
EBIT $8,965,000,000 $12,240,000,000 $15,716,000,000 $11,242,000,000
Total assets $167,381,000,000 $167,566,000,000 $172,101,000,000 $185,798,000,000
Return on Total Assets 5.3560439954 7.3045844622 9.1318469968 6.0506571653
AbbVie Inc. (ABBV)
Particulars Y 2015 Y 2014 Y 2013 Y 2012
EBIT $7,537,000,000 $3,411,000,000 $5,664,000,000 $5,817,000,000
Total assets $53,050,000,000 $27,513,000,000 $29,198,000,000 $27,008,000,000
Return on Total Assets 14.20735156 12.3977756 19.39858894 21.5380628
Analysis: In all the 3 years, 2015, 2014 & 2013, AbbVie has got the highest ratio when compared to Pfizer. It implies that
a higher ratio is more favorable to investors because it shows that the company is more effectively managing its assets to
produce greater amounts of net income.
9 | P a g e
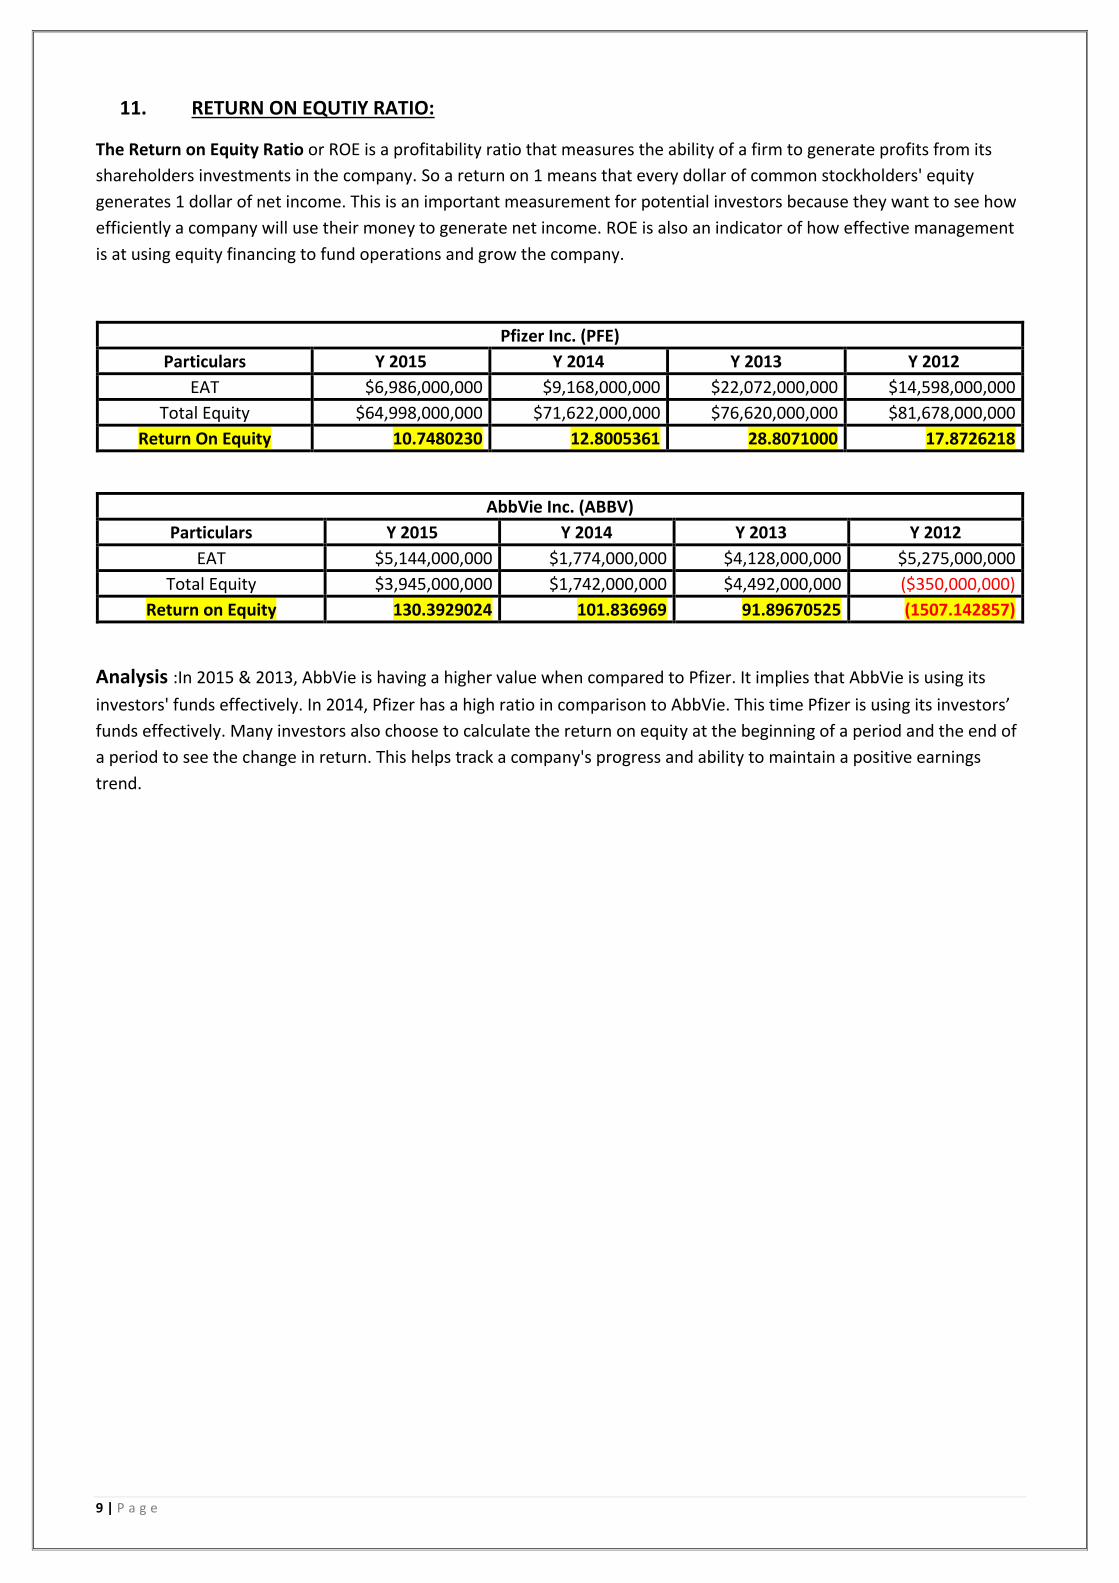
11. RETURN ON EQUTIY RATIO:
The Return on Equity Ratio or ROE is a profitability ratio that measures the ability of a firm to generate profits from its
shareholders investments in the company. So a return on 1 means that every dollar of common stockholders' equity
generates 1 dollar of net income. This is an important measurement for potential investors because they want to see how
efficiently a company will use their money to generate net income. ROE is also an indicator of how effective management
is at using equity financing to fund operations and grow the company.
Pfizer Inc. (PFE)
Particulars Y 2015 Y 2014 Y 2013 Y 2012
EAT $6,986,000,000 $9,168,000,000 $22,072,000,000 $14,598,000,000
Total Equity $64,998,000,000 $71,622,000,000 $76,620,000,000 $81,678,000,000
Return On Equity 10.7480230 12.8005361 28.8071000 17.8726218
AbbVie Inc. (ABBV)
Particulars Y 2015 Y 2014 Y 2013 Y 2012
EAT $5,144,000,000 $1,774,000,000 $4,128,000,000 $5,275,000,000
Total Equity $3,945,000,000 $1,742,000,000 $4,492,000,000 ($350,000,000)
Return on Equity 130.3929024 101.836969 91.89670525 (1507.142857)
Analysis :In 2015 & 2013, AbbVie is having a higher value when compared to Pfizer. It implies that AbbVie is using its
investors' funds effectively. In 2014, Pfizer has a high ratio in comparison to AbbVie. This time Pfizer is using its investors’
funds effectively. Many investors also choose to calculate the return on equity at the beginning of a period and the end of
a period to see the change in return. This helps track a company's progress and ability to maintain a positive earnings
trend.

10 | P a g e
REFERENCES
1. CALCBENCH - http://www.calcbench.com/
2. FINANCIAL ACCOUNTING BY M.R AGGARWAL
3. INVESTOPEDIA - http://www.investopedia.com/