Finance Writing Sample
25
Pace University Finance 351 Portfolio Matt Tyburski
-
Upload
matt-tyburski -
Category
Documents
-
view
226 -
download
1
Transcript of Finance Writing Sample

8/6/2019 Finance Writing Sample
http://slidepdf.com/reader/full/finance-writing-sample 1/25
Pace University Finance 351 Portfolio
Matt Tyburski
8/6/2019 Finance Writing Sample
http://slidepdf.com/reader/full/finance-writing-sample 2/25
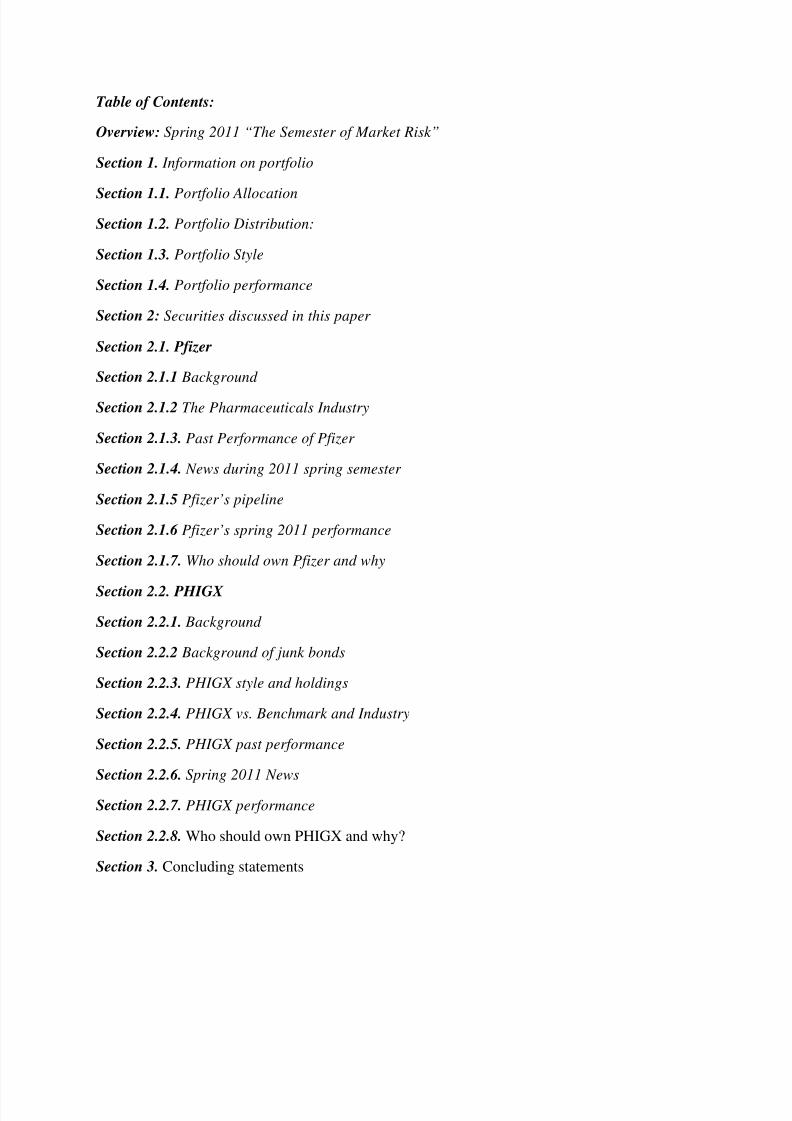
Table of Contents:
Overview: Spring 2011 “The Semester of Market Risk”
Section 1. Information on portfolio
Section 1.1. Portfolio Allocation
Section 1.2. Portfolio Distribution:
Section 1.3. Portfolio Style
Section 1.4. Portfolio performance
Section 2: Securities discussed in this paper
Section 2.1. Pfizer
Section 2.1.1 Background
Section 2.1.2 The Pharmaceuticals Industry
Section 2.1.3. Past Performance of Pfizer
Section 2.1.4. News during 2011 spring semester
Section 2.1.5 Pfizer’s pipeline
Section 2.1.6 Pfizer’s spring 2011 performance
Section 2.1.7. Who should own Pfizer and why
Section 2.2. PHIGX
Section 2.2.1. Background
Section 2.2.2 Background of junk bonds
Section 2.2.3. PHIGX style and holdings
Section 2.2.4. PHIGX vs. Benchmark and Industry
Section 2.2.5. PHIGX past performance
Section 2.2.6. Spring 2011 News
Section 2.2.7. PHIGX performance
Section 2.2.8. Who should own PHIGX and why?
Section 3. Concluding statements

8/6/2019 Finance Writing Sample
http://slidepdf.com/reader/full/finance-writing-sample 3/25
Overview: Spring 2011 “The Semester of Market Risk”
Throughout the spring 2011 semester, there have been numerous events that have affected EPS
despite bullish earnings. These events have significantly affected the securities in the Finance
351 portfolio, making it quite difficult to predict future performance. The specific events that
have affected the portfolio are the Middle East and North African revolutions, the tsunami andearthquake in Japan, European fiscal deterioration, and commodity inflation.
Middle East and North African revolutions greatly increase market risk because there is an
abundance of oil in those areas. If these areas were to “blow up”, there would be a shortage of
supply in the market, which would drive up the price of oil. This lowers EPS for most
companies, as many companies use oil for production and transportation. Investors are also very
wary about this situation, which offsets companies’ bullish earnings. Specifically, the airline
industry has been affected by this crisis, as fuel is one of their main costs. For example,
American Airlines lost $436 million in the first quarter of 2011, despite revenue rising 9.2%.
This caused EPS to go down 1.31, which is directly caused by the oil crisis. Even if employmentnumbers have improved over the past few months, the market risk causes investors to be
extremely cautious.
The tsunami and earthquake in Japan increases market risk because Japan plays such a major
role in the economy, and companies such as Sony and Hitachi operate in the affected area. Just to
show the impact of these disasters, Sony’s stock was $35.00 on March 9, and dropped down to
$29.88 on March 16. Additionally, it recovered after the tsunami and went up to $32.28, but then
another earthquake caused the stock to slide back down to $29.71. This fluctuation was caused
because these disasters impaired the infrastructure of Japan and caused factories to be inoperable.
Additionally, Japanese power plants may explode at any moment, which adds additional risk tothe situation. Lastly, Japanese companies are not the only corporations affected by these
disasters, as many American firms have been affected because of the new idea of a “global
economy”. For example, the S&P 500 dropped from 1305 to 1245 because of the earthquake.
Since then, the market has recovered and is currently up to its previous level of 1300.In
summation, an earthquake and tsunami and Japan will not only affect the EPS of Japanese
companies, but companies all over the world.
European fiscal deterioration has caused many problems in the EU countries, as Ireland and
Greece needed to be bailed out. Additionally, many people suspect that Portugal will join that list
very soon. This affects the international bond market, as the chance of default greatly increaseswith this fiscal deterioration. Since Greek and Portuguese bonds are riskier than other EU
countries, there is a large gap between rates. For example, 10 year German bonds are currently
yielding 3.28% and 10 year Greek bonds are yielding 14.48%. This is the largest spread in the
history of the EU, and the way things are going, this gap is going to widen even more.
Additionally, these bonds are being downgraded often, which means very large losses for
investors. Lastly, this means that companies in these countries and the countries themselves are
paying much more interest on their loans, which means costs are higher than previous years. This
affects EPS of companies in these areas, which affects the “global economy”.

8/6/2019 Finance Writing Sample
http://slidepdf.com/reader/full/finance-writing-sample 4/25
Commodity inflation also plays a big factor in increasing market risk. Commodity inflation
increases the price of consumer goods, or the amount of profit and EPS a company makes. For
example, if the price of corn goes up, then food prices will increase. This price increase occurs
because corn is in over 90% of all food products. An increase in price may lead to a price war
amongst competitors to see who can keep their margins the lowest in order to keep the price low.
Additionally, commodity inflation will increase the demand for futures, as many companies want
to lock in their costs. Furthermore, if a commodity such as oil goes up, then companies’ costs go
up, causing them to take losses or raise prices. In either situation, the economy is affected, as
EPS goes down if they decide to take a loss, and demand goes down if they raise prices. Lastly,
if the price of gold goes up, this means that the value of the dollar will depreciate, which will
affect the market as a whole. In this case, gold may be a better investment than equity, which
will decrease the demand for equity and lower EPS and stock price.
In summation, an increase in market risk has significantly affected EPS, even if earnings are
fairly bullish. The events that have occurred have either impaired production, driven costs up, or
increased the risk of the investment. With that being said, earnings of the securities in the Spring
2011 portfolio have been greatly affected by the events that have occurred, and would have done
much better without these disasters.
Section 1. Information on portfolio
Section 1.1. Portfolio Allocation
In the spring 2011 semester, the Finance 351 class was assigned a portfolio to track throughout
the duration of the semester. The following is an overview of the portfolio:
Common Stock Ticker Symbol Position Size Purchase Price Investment
Pfizer PFE Long 1000 $18.47 $18,470.00 Apple APPL Long 100 $341.60 $34,160.00Verizon VZ Short 600 $35.79 $21,474.00Mutual Fund Ticker Symbol Position Size Purchase Price Investment Putnam New
Opportunities
PNOPX Long 600 $51.70 $31,020.00
Putnam High
Yield Trust
PHIGX Long 3000 $7.84 $23,520.00
Bonds Ticker Symbol Position Size Purchase Price InvestmentUS Treasury
5/15/39
912810QB7 Long 20,000 96.109% $19,221.80
General
Electric 2/15/20
36962G4J0 Long 20,000 106.64% $21,328.00
Options Ticker Symbol Position Size Purchase Price Investment Joy Global
July 90
JOYG110716C00090000 Long 15 $6.00 $9,000.00
June 550
GOOG110421P00550000 Short 5 $14.20 $7,100.00
Futures Ticker Symbol Position Size Purchase Price InvestmentS&P 500 June June_2011_S_P_500 Long $320,650 $1,282.60 $28,125.00

8/6/2019 Finance Writing Sample
http://slidepdf.com/reader/full/finance-writing-sample 5/25
T-Bond June June_2011_T_Bond Short $100,000 120.25% $3,240.00Total $216,658.80
Section 1.2. Portfolio Distribution:
Section 1.3. Portfolio style:
Based on the securities we have selected, we have classified ourselves as very risk tolerant. This
means that this portfolio is suitable for someone who does not mind taking the risk of losing their
money. With that being said, this portfolio has the potential to have very high returns given the
associated risk level.
34%
25%
19%
7%
15%
Portfolio Distribution
Stocks Mutual Funds Bonds Options Futures

8/6/2019 Finance Writing Sample
http://slidepdf.com/reader/full/finance-writing-sample 6/25
The chart above shows what the risk reward trade off line would be like for our portfolio. There
are few securities with low risk and return (Ex: Treasury bond), but an abundance of high risk
and return securities (Options and Futures).
Section 1.4: Portfolio performance
The following chart shows the overall performance of the portfolio from 1/25/2011-5/6/2011
CommonStock
Ticker Symbol Size Purchase Price SellingPrice
Profit
Pfizer PFE 1000 $18.47 $20.55 $2,080.00 Apple APPL 100 $341.60 $346.66 $506.00Verizon VZ 600 $35.79 $37.28 $(894.00)Mutual Fund Ticker Symbol Size Purchase Price Selling
PriceProfit
Putnam New
Opportunities
PNOPX 600 $51.70 $54.17 $1,482.00
Putnam High
Yield Trust
PHIGX 3000 $7.84 $7.98 $420.00
Bonds Ticker Symbol Size Purchase Price SellingPrice
Profit
US Treasury
5/15/39
912810QB7 20,000 96.109% 99.5% $684.40
General
Electric
2/15/20
36962G4J0 20,000 106.64% 108.34% $339.20
Options Ticker Symbol Size Purchase Price Selling
Price
Profit
Joy Global
July 90
JOYG110716C00090000 15 $6.00 $5.80 $(300.00)
June 550
GOOG110421P00550000 5 $14.20 $22.45 $4,125.00
Futures Ticker Symbol Size Purchase Price SellingPrice
Profit
S&P 500 June June_2011_S_P_500 $320,650 $1,282.60 $1,334 $13,000.00
T-Bond June June_2011_T_Bond $100,000 120.25% 124.37% $(4,125.00)Dividends $470.00Profit $17,787.60
With these results, the portfolio had a ROI of 8.2%. On January 25, 2011, The S&P was valuedat $1,291 and on May 6, 2011, it was valued at $1,340. This is only a 3.8% increase, which
means the portfolio has outperformed the market by 4.4%.
Section 2: Securities discussed in this paper
In this paper, two securities in the portfolio will be discussed: Pfizer and PHIGX. These
securities are particularly interesting, and are considered to be great values.
Section 2.1. Pfizer

8/6/2019 Finance Writing Sample
http://slidepdf.com/reader/full/finance-writing-sample 7/25
Section 2.1.1 Background
Pfizer is a global pharmaceuticals company founded in 1849 that offers prescription medicine for
humans and animals. They are number one in sales in the pharmaceuticals industry, with revenue
of 67.8 billion in 2010. They are part of the drug manufacturers’ industry and the Dow Industrial.
Additionally, they are a large cap stock, with a current market capitalization of 164.14bn.Furthermore, Pfizer’s governance risk factor is low in all areas (Board, Audit, Compensation
Shareholder Rights). On January 26, 2009, Pfizer acquired Wyeth for $68 billion, which made
them the largest pharmaceutical company in the world. Additionally, in October 2010, Pfizer
bought King Pharmaceuticals for $3.6 billion.
Section 2.1.2. The Pharmaceuticals Industry
The pharmaceuticals industry has been extremely popular with investors over the past few
decades, largely because of consistent growth. This growth started in the 1940s, with the
introduction of Penicillin and the new concept of “R&D”. In the 1970s, generic brands werestarting to be produced, as the government no longer allowed permanent patents on drugs. Since
generic brands were now allowed, there was a large increase in competition. Additionally, there
were many advancements in technology and regulatory laws which strengthened this
competition. Furthermore, acquisitions such as Pfizer’s buyout of Wyeth and King have tried to
offset this competition. Pfizer’s main competitors are Bayer, Merck, and Novartis. The following
chart shows a comparison of all of these companies to Pfizer:
As shown in the chart, Pfizer has the largest market cap, revenue, and gross margin.
Additionally, they have the 2nd
highest net income, which would be the highest if it wasn’t for a
large lawsuit from Nigeria over deaths of their citizens and a $2.3 billion fraud lawsuit. These
lawsuits have greatly affected net income, but as time goes on, net income will go back to
previous levels. Therefore, now may be the right time to buy Pfizer, as net income is expected to
rise. Lastly, Pfizer has a much lower P/E ratio than Merck and Bayer, which means that Pfizer
could be potentially undervalued given its past and present performance.

8/6/2019 Finance Writing Sample
http://slidepdf.com/reader/full/finance-writing-sample 8/25
The pharmaceuticals industry has been very popular over the last few decades due to various
political, economic, social, and technological factors. Many people believe that in order to
maintain economic stability, there must be a proper health care system in place. For example,
Obama insists that in order to fix our countries economic crisis, there must be a universal health
care system. This universal health care system would increase demand for prescription drugs,
which would positively affect the industry as a whole. Additionally, the pharmaceutical industry
is expected to grow 4-7% through 2013, reaching a market value of over $975 billion by 2013. In
addition to these growth expectations, people are generally becoming more health conscious and
are living longer, which will increase the demand for prescription medication. For example, the
AIDS breakout in the 1980s has caused a huge growth in the industry, and many companies are
continuing to advance treatment of AIDS with new developments. Furthermore, the average life
expectancy has been increasing over the years, which also increases the demand for prescription
drugs. Lastly, technological advancement has put more pressure on the industry to come out with
better products faster. With that being said, pharmaceutical companies are now putting more
money into innovation, which has caused people to have an increased interest in the industry.
Despite constant growth in the pharmaceutical industry over the past few decades, there are still
many areas that are untapped. For example, there are many parts of Africa that are currently
developing and will be able to afford more medication for their AIDS epidemic. Additionally,
India’s biotech industry grew 17% from 2009-2010, with 60% of that growth coming from the
pharmaceuticals industry. Lastly, many countries in Asia such as China, India, South Korea,
Malaysia, and Indonesia have increased disposable incomes. This means people can now afford
more medication, and are also becoming more educated. With this increase in income and
education, the demand for pharmaceuticals is likely to grow rapidly.
Section 2.1.3. Past Performance of Pfizer
Over the past three years, Pfizer has consistently outperformed the pharmaceutical industry and
the S&P 500 in total return. The following chart demonstrates this by giving the trailing returns:
As shown by the chart, Pfizer has outperformed the market by 11.21% in returns over the last 3
months, and the drug manufacturers industry by 14.63%. Additionally, it has outperformed the
8/6/2019 Finance Writing Sample
http://slidepdf.com/reader/full/finance-writing-sample 9/25
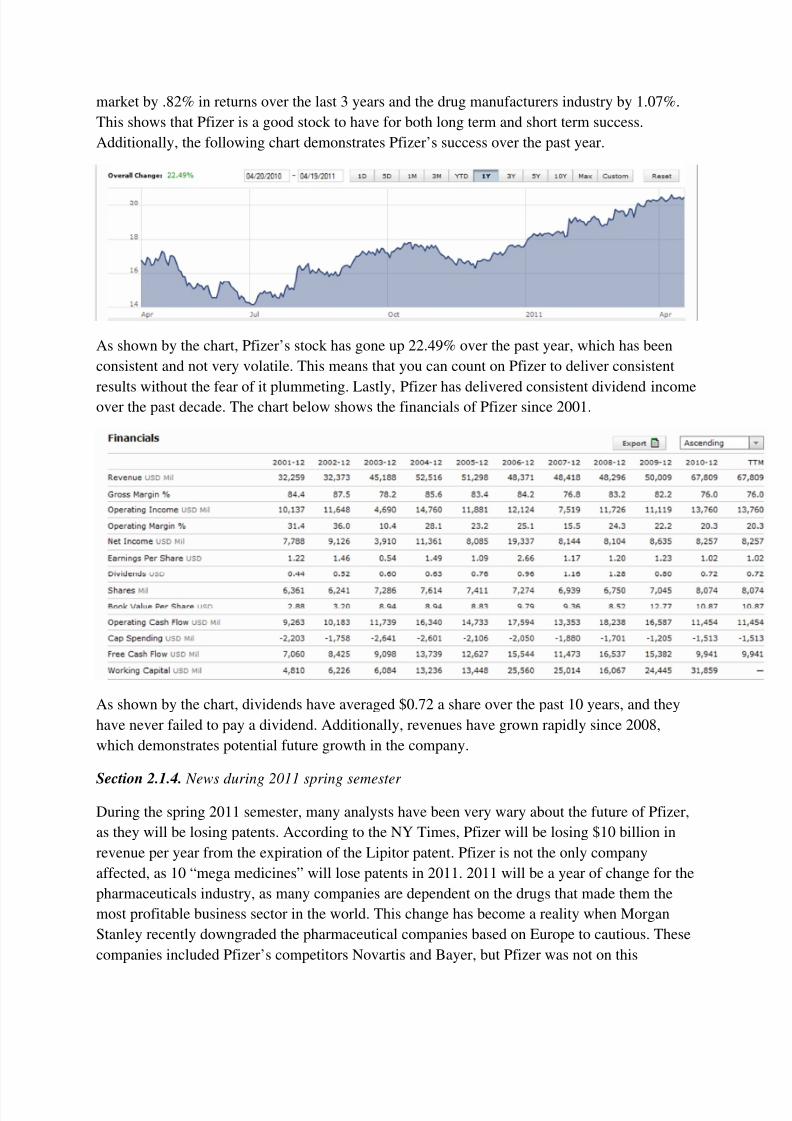
market by .82% in returns over the last 3 years and the drug manufacturers industry by 1.07%.
This shows that Pfizer is a good stock to have for both long term and short term success.
Additionally, the following chart demonstrates Pfizer’s success over the past year.
As shown by the chart, Pfizer’s stock has gone up 22.49% over the past year, which has been
consistent and not very volatile. This means that you can count on Pfizer to deliver consistent
results without the fear of it plummeting. Lastly, Pfizer has delivered consistent dividend incomeover the past decade. The chart below shows the financials of Pfizer since 2001.
As shown by the chart, dividends have averaged $0.72 a share over the past 10 years, and they
have never failed to pay a dividend. Additionally, revenues have grown rapidly since 2008,
which demonstrates potential future growth in the company.
Section 2.1.4. News during 2011 spring semester
During the spring 2011 semester, many analysts have been very wary about the future of Pfizer,
as they will be losing patents. According to the NY Times, Pfizer will be losing $10 billion in
revenue per year from the expiration of the Lipitor patent. Pfizer is not the only company
affected, as 10 “mega medicines” will lose patents in 2011. 2011 will be a year of change for the
pharmaceuticals industry, as many companies are dependent on the drugs that made them the
most profitable business sector in the world. This change has become a reality when Morgan
Stanley recently downgraded the pharmaceutical companies based on Europe to cautious. These
companies included Pfizer’s competitors Novartis and Bayer, but Pfizer was not on this
8/6/2019 Finance Writing Sample
http://slidepdf.com/reader/full/finance-writing-sample 10/25
downgrade list. In order to deal with these downgrades and loss of profit, pharmaceutical firms
cut 53,000 jobs last year, which has caused panic in the industry. Additionally, even though
research spending is up to $45 billion industry wide over the past decade, there are tighter
regulations which have hampered the approval of the drugs that come out of this research. In
order to counteract this, Pfizer has specifically said that they will cut R&D by 30% and only put
the research funds towards the products that have the most potential. Additionally, even when
Pfizer’s patents expire, they have $20 billion in cash and continue to pay attractive dividends.
Furthermore, large drug companies have been buying out other smaller drug firms in order to
counteract the loss of patents. Since they have $20 billion in cash, they may use some of this
money to buy out yet another company that has potential “mega medicines” in development.
In addition to patents expiring, many countries are looking for ways to slash the price of
medicine and healthcare. For example, China plans to cut hundreds of drug prices by 40%, which
would be a large hit for the industry because China is the 3rd largest drug market. Additionally,
the US is also taking actions to cut drug prices, which would significantly harm the industry’s
profits because the US pharmaceuticals market is the largest in the world. Lastly, doctors seem to
be prescribing less name brand medicine, as only three name brand drugs made the “top drugs
prescribed by doctors.” Of these three, Pfizer’s Lipitor had the top position at number 8. Even
with this news, many analysts say that these pharmaceutical companies are a good buy because
they have fairly low P/E ratios and high dividend yields. With that being said, it may be wise to
invest in Pfizer, since many analysts believe it is undervalued, and it produces good dividend
income.
On May 3, 2011, Pfizer announced that its net income rose 10% in 1Q 2011 and that its sales
were slightly down. This increase in net income was because they managed to cut costs, which
are expected to be 30% less than last year. Additionally, there has been news that Pfizer may
breakup their assets. Pfizer says that they will not announce a decision until the 2nd
half of the
year, but analysts are becoming very impatient with the company. If Pfizer splits their company,
analysts say that the parts can be worth $180 billion, which is 11% more than what it’s worth
now. Many analysts believe that it will be a great move for the company, as it will make up for
the loss of Lipitor and it will cut costs. This has led the stock to be up around 20% since the
beginning of the year, which is the highest since 2008.
Section 2.1.5 Pfizer’s pipeline
Despite losing some of its “mega patents”, Pfizer still has an extensive pipeline filled withpotential “mega drugs”. The following chart is the most recent pipeline snapshot from February
2011:

8/6/2019 Finance Writing Sample
http://slidepdf.com/reader/full/finance-writing-sample 11/25
Of the projects in the pipeline, 28% of the drugs are either in phase 3 or registration, which
means they will most likely be completed. As shown by the drugs in registration below, it seems
as though Pfizer is focusing on cardiovascular and neuroscience drugs.
Pfizer is probably targeting cardiovascular and metabolic disease because of the huge market.
According to the AHA 81,000,000 people in the United States have some form of cardiovascular
disease. Additionally, among adults who take prescription drugs, 38% say that they are taking a
cardiovascular drug. Furthermore, Americans spent $32 billion on cardiovascular drugs in 2007,
and this number is greatly increasing as people want to live longer. Additionally, Lipitor also
prevents cardiovascular disease, so they are trying to put out a drug that will potentially replace
their product before the patent runs out. Lipitor made $11.5 billion in sales for Pfizer last year, so
these three drugs may potentially make up for the loss of revenue for Pfizer.
Along with three cardiovascular drugs, Pfizer also has two neuroscience pain drugs in
registration. This is also a large market to get into, as the market for neuropathic pain drugs was

8/6/2019 Finance Writing Sample
http://slidepdf.com/reader/full/finance-writing-sample 12/25
$6 billion in 2008 and is expected to grow to $9.7 billion by 2018. One of the pain drugs they list
in their pipeline, Celebrex, is currently on the market and has a patent expiring in 2013. They
may be looking to re-register the drug under an updated formula in order to get an extension on
the patent. Celebrex made $810 million in revenue for Pfizer in 2010, so they are certainly
looking to get the patent extended in any way.
In addition to the drugs registered, Pfizer also has 25 drugs which are in the 3rd stage of research.
Of the 25 drugs, 9 of them are in the pain and inflammation category, and 8 treat cancerous
diseases. This means that 68% of the 3rd
stage research is focused on pain, inflammation and
cancer. They probably wanted to focus less on cardiovascular disease in this stage as they had an
abundance of cardiovascular drugs in the registration process. Additionally, cancer drugs are an
extremely large market, expected to grow to $75-$80 billion worldwide in 2012. Additionally,
cancer and heart disease drugs are the most prescribed classes of drugs worldwide, so Pfizer
most likely wants a large breakthrough in this area.
In the United States alone, the market for cancer, heart disease, and pain drugs in around $87billion. This doesn’t take into factor growing markets such as China in India, in which Pfizer
sees a lot of potential in. Therefore, since they are making major developments in the cancer,
heart disease, and pain drugs, Pfizer may be able to cover the loss of the Lipitor patent.
Section 2.1.6 Pfizer’s spring 2011 performance
Overall, Pfizer has proven to be a great buy for the 2011 semester. They are continuing to cut
costs in order to fight off the loss of their patents, which has proven to be successful thus far.
Common
Stock
Ticker Symbol Size Purchase Price Selling
Price
Profit
Pfizer PFE 1000 $18.47 $20.55 $2,080.00
As shown by the chart, Pfizer has made the portfolio $2,080.00 for the semester, which is a
significant ROI of 11.2%. Much of Pfizer’s success is because analysts continue to believe that it
is undervalued, and that Pfizer may breakup the company and relist it on the exchange. This
decision would increase Pfizer’s value, and shareholders would see significant profits. In
addition, Pfizer also continues to be a dividend stock, as the portfolio made an additional$200.00 in dividends from Pfizer. This brings Pfizer’s total profit for the portfolio to $2,280.00,
which is a total ROI of 12.3%. Lastly, the following chart graphs Pfizer’s performance over the
semester.

8/6/2019 Finance Writing Sample
http://slidepdf.com/reader/full/finance-writing-sample 13/25
Section 2.1.7. Who should own Pfizer and why
If you are a retired individual looking for consistent income and stability in a stock, Pfizer is the
stock for you. Not only has it shown a trailing return of 22.74% over the past year, but it pays out
dividends of $0.72 per share, which is expected to grow as the patents expire. As previously
mentioned, Pfizer has $20 billion in cash, which can be used to consistently pay out dividends to
its shareholders. Additionally, Pfizer has 34 drugs that are either in the process of being
registered or are in the 3rd stage of development. This means that the next “mega drug” could be
in the making, especially since the drugs they are focusing on have a market of $87 billion.
Lastly, in the semester of market risk, Pfizer has done very well, having a ROI of 12.3%. Many
analysts are also confident that Pfizer will breakup the company, which will make shareholders
profit even further. With this information, it can be said that Pfizer has not only shown consistent
growth, but also provides dividend income for its shareholders.
Section 2.2. PHIGX
Section 2.2.1. Background

8/6/2019 Finance Writing Sample
http://slidepdf.com/reader/full/finance-writing-sample 14/25
PHIGX is a high yield junk bond fund managed by Putnam Investments since 1978. Accordingto their website, the fund's objective is to seek high current income with capital growth as asecondary objective. Additionally, PHIGX has the following qualities:
• Income focused: The portfolio managers strive for a higher level of income than mostbonds offer by investing in higher-yielding, lower rated corporate bonds.
• Active risk management: The managers can adjust the fund's holdings to capitalize onmarket opportunities, such as emphasizing bonds with higher credit quality when creditrisk increases.
• Leading research: The managers, supported by Putnam's fixed-income researchdivision, analyze a range of bonds to build a diversified portfolio.
The current managers of the fund are Robert L. Salvin., Paul Scanlon, and Norman P. Boucher.
Section 2.2.2 Background of junk bonds
A junk bond is defined as a bond that is sold below investment grade when it is bought. Bonds
with a credit rating of under BB+ and under are considered to be in this category. These bondsare different from investment grade bonds because they are far more risky and have a much
higher yield. The risks that these bonds carry are default risk and interest rate risk. Default risk
means that the bond issuer may not be able to pay the interest and par value of the bond. The
higher the amount of default risk, the more of a chance there is of this occurring. Risk is
measured by credit rating, ranging from AAA(the best) to D(the worst). Interest rate risk is
fluctuation in interest rates causing changes in the bonds’ value. For example, if a bond
currently has a yield of 4% and a new bond of the same risk level enters the market at 5%, the
older bond's value goes down. This is because you can get a higher yield for your risk with the
new bond, thus making it valued higher than the old bond. Additionally, if a bond is rated BB+
and has a yield of 5%, then gets upgraded to AA, the value of the bond will go up, as your risk is
being decreased. This is the hope for every manager of a junk bond fund; for the bonds to be
upgraded. On the contrary, every manager of a junk bond fund hopes that the bonds do not
default, as they will then be worth 0.
As previously stated, you are getting a higher yield on junk bonds because you are taking on
additional risk. History has shown that junk bonds typically have yields 6% higher than treasury
bonds. In Europe, there is currently a crisis over the "spreads" between German bonds and Greek
and Portuguese bonds. This is a problem, as a country like Greece has to pay around 14% on
their debt, and a country like Germany only has to pay around 3%. This may lead to the collapse
of the European Union, as stable countries like Germany and the UK have to bail out these
countries.
According to the library of economics, 95% of U.S. corporations with revenues over $35 million
are non-investment grade. This is a big change from the mid-20th century, as almost all bonds
that were publically issued prior to the 1970s were investment grade. After the 1970s, there was
very high inflation and interest rates, which led to very high borrowing costs for companies.
Since only the companies with the highest reputations could receive loans, the "junk bond
market" emerged, and is worth over a half trillion dollars today. This market exploded because
8/6/2019 Finance Writing Sample
http://slidepdf.com/reader/full/finance-writing-sample 15/25
borrowers could get lower borrowing rates through these bond auctions and buyers (lenders)
could get a greater risk-adjusted return for their investment. The junk bond market grew rapidly
until the years 2000-2002 when many internet companies defaulted on their bonds. During this
time, the average return for investors in the junk bond market was 0%. Since then, the junk bond
market grew once again, but then declined with the recent economic downturn. Investors are now
extremely risk averse, which means that they would rather would their money in a fund that has
very little risk.
Section 2.2.3. PHIGX style and holdings
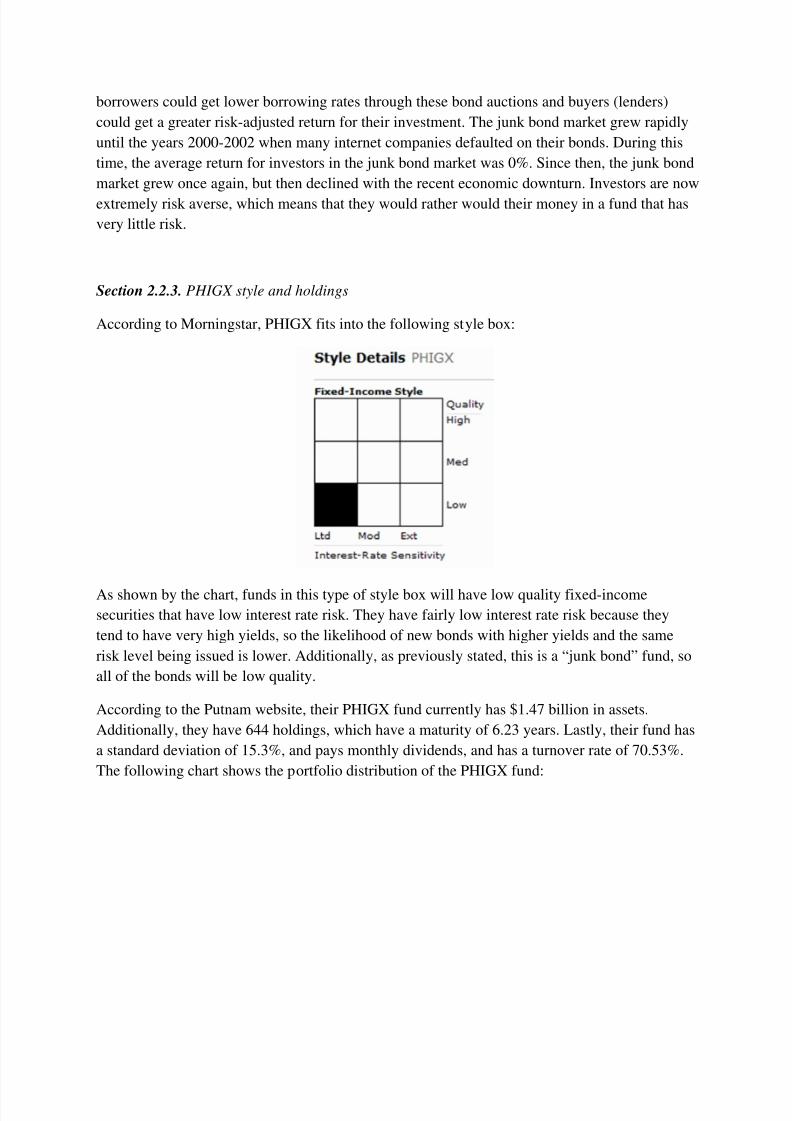
According to Morningstar, PHIGX fits into the following style box:
As shown by the chart, funds in this type of style box will have low quality fixed-income
securities that have low interest rate risk. They have fairly low interest rate risk because they
tend to have very high yields, so the likelihood of new bonds with higher yields and the same
risk level being issued is lower. Additionally, as previously stated, this is a “junk bond” fund, so
all of the bonds will be low quality.
According to the Putnam website, their PHIGX fund currently has $1.47 billion in assets.
Additionally, they have 644 holdings, which have a maturity of 6.23 years. Lastly, their fund has
a standard deviation of 15.3%, and pays monthly dividends, and has a turnover rate of 70.53%.
The following chart shows the portfolio distribution of the PHIGX fund:

8/6/2019 Finance Writing Sample
http://slidepdf.com/reader/full/finance-writing-sample 16/25
As you can see by their portfolio distribution, 85.86% of their holdings are high yield corporate
bonds. In order to make their fund more attractive to investors, Putnam also added in investment
grade corporate bonds to their portfolio. This will offset some of the risk of having so many risky
bonds, which will attract more investors.
PHIGX’s holdings are spread out amongst numerous sectors. The following chart demonstrates
these sectors:
Many consumer cyclical stocks tend to be risky, as they are very affected by economic
conditions. Examples of consumer cyclical stocks are cars and entertainment. These items are
not necessities, but are considered to be things that people buy when they have disposable
85.86%
6.81%5.41% 1.57% 0.35%
PHIGX Holdings
High Yield Corporate Bonds Investment Grade Corporate Bonds
Bank Loans Cash
Emerging Market Bonds

8/6/2019 Finance Writing Sample
http://slidepdf.com/reader/full/finance-writing-sample 17/25
income. Additionally, financial stocks are also fairly risky as of late, with the bailouts of
Citigroup and downfall of Lehman Brothers.
Although PHIGX contains mostly junk bonds, it has bonds with a variety of ratings:
The managers of PHIGX take a very large amount of risk having most of its bonds BB and
under, which may turn away many investors. But, it also attracts many adventurous investors
who are willing to take the risk of investing in the fund.
Of the bonds in the fund, a majority are in the 1-10 year length:
As bond maturity date goes up, so does the risk associated with that bond. This is because there
is a longer period of time where the price of the bond can be affected. With that being said, the
managers do not want to have too many bonds that have a very long maturity, as the bonds are
already below investment grade to begin with. This causes the managers to have many bonds that
are in the 1-10 year length, as they do not want to have even more risk than they already have.
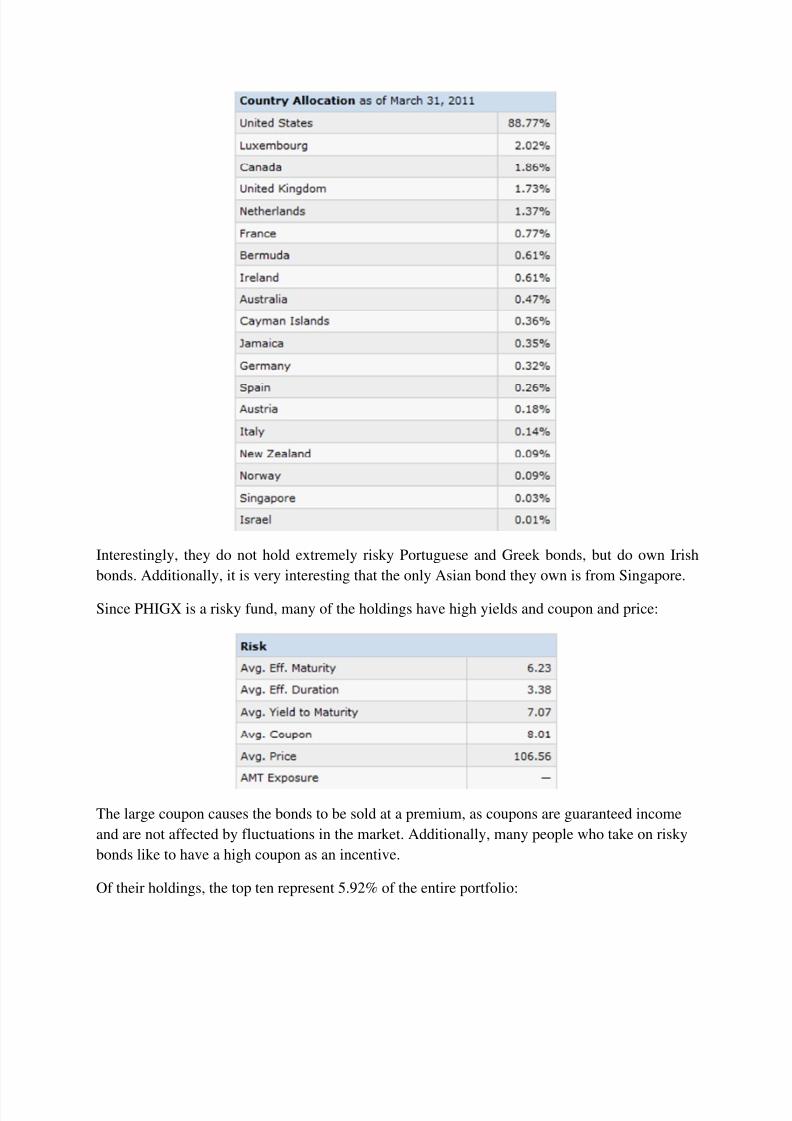
Although most of the bonds are American bonds, there are also bonds from other countries:
8/6/2019 Finance Writing Sample
http://slidepdf.com/reader/full/finance-writing-sample 18/25
Interestingly, they do not hold extremely risky Portuguese and Greek bonds, but do own Irish
bonds. Additionally, it is very interesting that the only Asian bond they own is from Singapore.
Since PHIGX is a risky fund, many of the holdings have high yields and coupon and price:
The large coupon causes the bonds to be sold at a premium, as coupons are guaranteed income
and are not affected by fluctuations in the market. Additionally, many people who take on risky
bonds like to have a high coupon as an incentive.
Of their holdings, the top ten represent 5.92% of the entire portfolio:

8/6/2019 Finance Writing Sample
http://slidepdf.com/reader/full/finance-writing-sample 19/25
In addition, none of their individual securities make up for more than 1% of the entire portfolio.
This means that the fund is extremely spread out amongst a variety of assets.
Section 2.2.4. PHIGX vs. Benchmark and Industry
The following charts provide a variety of benchmarking information about the fund with regards
to allocation and classification. The benchmark that is being used is the Barclays Capital
aggregate bond. The industry that the fund is being compared to is the high yield bond category.
Please note that these charts are from 12/31/2010, so the previous charts are more updated. As
shown by the chart(see next page), the fund is far more risky than the Barclays Capital aggregate
bond fund and fairly even with the industry average when it comes to credit quality of the
holdings. Additionally, when it comes to sector weightings, PHIGX does not have mortgage and
US Government bonds, which both the benchmark and industry average have in their holdings.With regards to foreign bonds, PHIGX does not invest in foreign government bonds, but does
invest in foreign corporate bonds. This is different from both the benchmark and average, as they
hold both foreign corporate and foreign government bonds. Furthermore, PHIGX is fairly similar
to the industry average when it comes to coupon payments, but is very different from the lower
coupon average that the benchmark’s holdings have. Lastly, most of PHIGX’s holdings have a
maturity between 3 and 10 years (87.94%), which is fairly similar to the industry average
(91.44%). But, the benchmark’s holdings have a far longer maturity date, as 37.27% expire in
20-30 years. The benchmark’s holdings probably have a longer maturity date because they
contain mostly AAA rated bonds that carry very little risk. Since they carry mostly AAA rated
bonds, they can add a longer maturity date in order to increase return.
(Refer to chart on next page for previous paragraph)

8/6/2019 Finance Writing Sample
http://slidepdf.com/reader/full/finance-writing-sample 20/25

8/6/2019 Finance Writing Sample
http://slidepdf.com/reader/full/finance-writing-sample 21/25
Section 2.2.5. PHIGX past performance
Since PHIGX contains many financial bonds and consumer cyclical bonds, it was greatly
affected by the recent economic crisis:
However, if you look at the funds NAV in 2006, it has fully recovered and may continue to
increase since they took on a lot of risk during the crisis. Additionally, the fund has consistently
had higher trailing returns than both the benchmark and the industry.
8/6/2019 Finance Writing Sample
http://slidepdf.com/reader/full/finance-writing-sample 22/25
As shown by the chart, PHIGX has done very well compared to competition, as has been getting
higher returns for the past 15 years. This shows that the fund is very well managed, as funds with
a similar risk level are not getting returns as good as PHIGX.
Section 2.2.6. Spring 2011 News
The major news about PHIGX during the 2011 Spring semester was that Putnam was named the
retirement leader of the year. According to Putnam Investments “Putnam was recognized for its
leadership initiatives and innovative solutions in the workplace savings arena, including its
efforts to sharpen the focus on retirement income and encourage the industry and policy makers
to further strengthen the workplace savings system.” This is an extremely prestigious award for
Putnam, especially when retirees are always trying to maximize income without increasing risk.
This proves that Putnam is extremely well managed, and truly cares about their clients’ needs.
Even though Putnam won this award, PHIGX is not a fund that retired people should invest in, as
it is one of the riskier funds that Putnam manages. Nonetheless, the news still shows that PHIGX
is managed by some of the best fund managers.
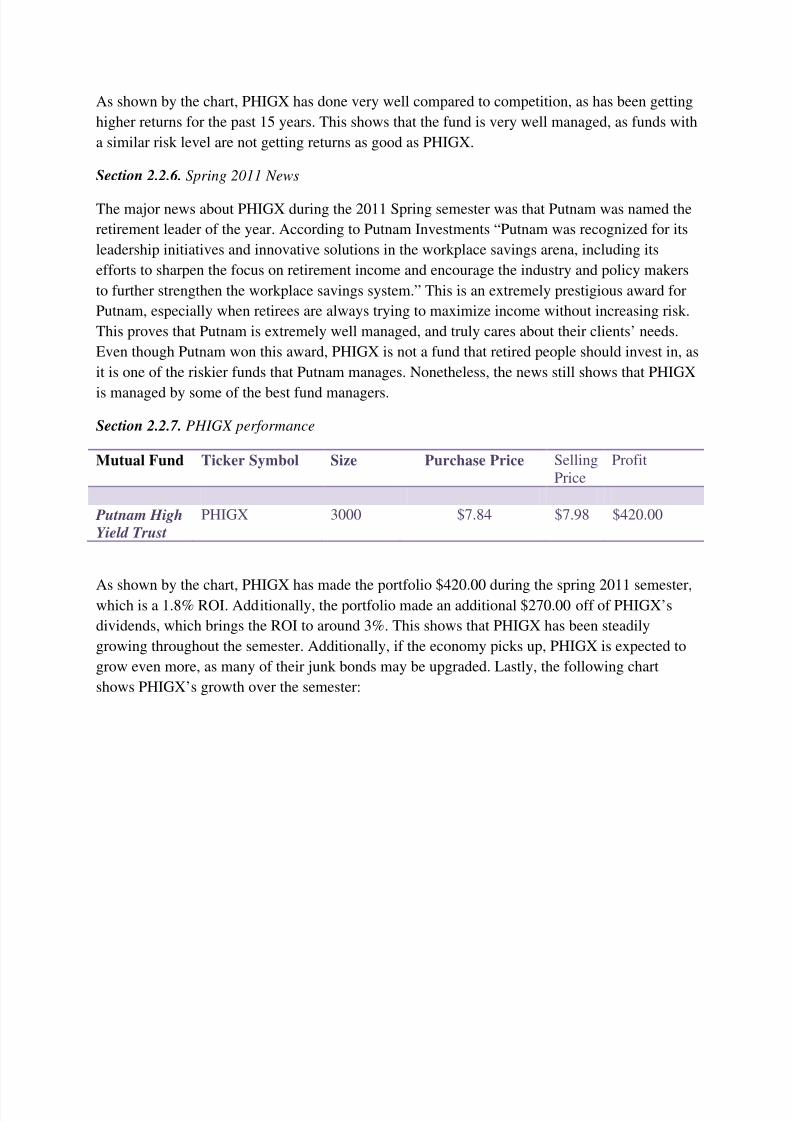
Section 2.2.7. PHIGX performance
Mutual Fund Ticker Symbol Size Purchase Price SellingPrice
Profit
Putnam High
Yield Trust
PHIGX 3000 $7.84 $7.98 $420.00
As shown by the chart, PHIGX has made the portfolio $420.00 during the spring 2011 semester,which is a 1.8% ROI. Additionally, the portfolio made an additional $270.00 off of PHIGX’s
dividends, which brings the ROI to around 3%. This shows that PHIGX has been steadily
growing throughout the semester. Additionally, if the economy picks up, PHIGX is expected to
grow even more, as many of their junk bonds may be upgraded. Lastly, the following chart
shows PHIGX’s growth over the semester:

8/6/2019 Finance Writing Sample
http://slidepdf.com/reader/full/finance-writing-sample 23/25
The chart above demonstrates that PHIGX has shown significant growth since the beginning of
the semester, and has bounced back from a brief setback in March when the tsunami occurred.
Section 2.2.8. Who should own PHIGX and why?
If you are someone who is young, ambitious, and willing to take risk, PHIGX is an excellent
security to own. As previously stated, it has outperformed both the benchmark and the industry,
and is managed by an award winning firm. Additionally, this semester it had an ROI of around
3%, which would have been much higher if it wasn’t for the significant market risk of the
semester. In the future, as market risk decreases, you can expect to see significant growth from
PHIGX, as many of their junk bonds may be upgraded. If you are willing to take this risk,
PHIGX is a great buy, and also provides dividend income to offset some of the risk.
Section 3. Concluding statements
Despite significant amounts of market risk, PHIGX and Pfizer have done fairly well compared to
their benchmarks and industry. Additionally, many analysts believe these two securities will
continue to grow, as Pfizer may breakup their assets and junk bonds may be upgraded as the
market grows. Furthermore, both securities pay a consistent dividend, which offsets some of the
risk involved in owning these securities. Overall, these two securities generated $2500.00 in
capital gains and $470.00 in dividend income, which is a total of $2970.00 in total. This is a

8/6/2019 Finance Writing Sample
http://slidepdf.com/reader/full/finance-writing-sample 24/25
5.1% ROI, which shows that these securities were a major reason why the portfolio did very
well. In conclusion, PHIGX and Pfizer have proven to be great buys for the semester, and will
continue to grow as the year goes on.
8/6/2019 Finance Writing Sample
http://slidepdf.com/reader/full/finance-writing-sample 25/25
Works cited
http://www.pharmaceutical-drug-manufacturers.com/articles/pharmaceutical-market-trends-
2010.html
http://www.verbigena.com/case_studies/history_analysis.pdf
http://en.wikipedia.org/wiki/Pharmaceuticals_in_India
http://performance.morningstar.com/stock/performance-
return.action?region=USA&t=pfe&culture=en-US
http://blogs.wsj.com/health/2011/04/19/what-drug-did-doctors-prescribe-most-last-
year/?mod=yahoo_hs