Finance Kpi Collection
38
KPI Collection Finance Key Performance Indicators Benchmarking Approach A Firm-wide KPIs B Function and Process KPIs C Click the letters below to jump to section:
-
Upload
barakkat72 -
Category
Documents
-
view
64 -
download
2
description
Finance KPI
Transcript of Finance Kpi Collection

KPI Collection
FinanceKey Performance Indicators
Benchmarking ApproachA
Firm-wide KPIsB
Function and Process KPIsC
Click the letters below to jump to section:

1mc.sgo1.Finance.ODFebruary 2013 © Lab Consulting Partnership, Inc. All Rights Reserved
This Collection Describes OpsDog’s Benchmarking Approach and Over 375 Comparative KPIs for Finance
A. OpsDog’sApproachtoBenchmarking . . . . . . . . . . . . . . . . . . . . . . . . . . . . . . . 3 • Describes OpsDog’s library of benchmarking KPIs and outlines our typical
benchmarking approach
B. Firm-wideBenchmarkingKPIs . . . . . . . . . . . . . . . . . . . . . . . . . . . . . . . . . . . . . 8 • Reviews OpsDog’s most popular comparative KPIs for analyzing overall organization size,
structure and operating effectiveness. These KPIs are useful for identifying relevant peers.
C. FinanceBenchmarkingKPIs . . . . . . . . . . . . . . . . . . . . . . . . . . . . . . . . . . . . . . 11 • Defines comparative KPIs used by OpsDog to analyze the procedures and operating
effectiveness of functional departments in Finance.
A. Financial Planning, Analysis and Reporting D. Accounts Receivable and Payable
B. Treasury E. Other Finance Functions
C. General / Management Accounting

2mc.sgo1.Finance.ODFebruary 2013 © Lab Consulting Partnership, Inc. All Rights Reserved
OpsDogApproachtoBenchmarking• Describes OpsDog’s library of benchmarking KPIs and outlines our typical
benchmarking approach
ASectio
n

3mc.sgo1.Finance.ODFebruary 2013 © Lab Consulting Partnership, Inc. All Rights Reserved
What is Process Benchmarking?
Overview
Process benchmarking, sometimes referred to as performance benchmarking or management benchmarking, is quantitatively comparing groups of sequential work activities, known variously as “workflows,” “value streams,” or “business processes.” These “processes” are not the traditional assembly lines that follow documented procedures to produce standardized, tangible products. More often, the term “business process” refers to virtual, less obvious, assembly lines spanning multiple knowledge worker organizations and producing loosely defined, even ad hoc, outputs or work products. Examples include: Order to Cash [for fulfillment processes] and Record to Report [for accounting processes]. Ideally, process benchmarking enables comparison against a widely acknowledged industry standard or industry leader. In practice, this is never straightforward because these processes are highly obscure and few, if any, such standards exist.
Use
Internally [i.e., inside out], process benchmarking is used by managers to assess operations as objectively as possible. These quantified measures are then used to target areas for improvement and set tangible performance goals. Externally, [i.e., outside in] process benchmarking is used to compare the firm’s activities with other firms, sometimes with firms considered to be industry leaders. Process Benchmarking is also used by investors to help identify ‘hidden value’ that might be exploited through deployment of capital. Examples include: management buyouts, activist investments, takeovers, and private placements. Private equity investors have been known to send observers to count a business’ customers, cars in the parking lot, and similar process performance benchmarks to predict earnings or evaluate operational efficiency.
Types
Process Benchmarking can be divided into three broad categories, based on peer groups:
a. Direct competitors – Firms that offer similar products and services to the same customers and markets.
b. Similar industry – Companies active in the same industry that do not compete “head to head.”
c. Out of Industry – Businesses from any industry that may perform similar processes with comparable activities and outputs.
TheFiveTypesofKPIs
1. General Characteristics: Basic info used to provide apples-to-apples comparison
2. Activity Checklist: Compare tasks and activities performed to further apples-to-apples comparison.
3. Organizational: Compare headcounts, structure, reporting levels and centralization.
4. Process: Compare volumes, cycle times, customer service levels, work quality and accuracy.
5. Expense:Compare expense as it relates to employees, operations, technology, etc.

4mc.sgo1.Finance.ODFebruary 2013 © Lab Consulting Partnership, Inc. All Rights Reserved
What is Process Benchmarking?[cont.]
History
Benchmarking of goods and services has existed in business since time immemorial. It is known simply as “comparison shopping.” Process benchmarking, however, represents a relatively new approach to business performance measurement. The term “benchmark” has been attributed to various guilds and trades, the earliest being cobblers. According to legend, early shoemakers marked their customers’ foot sizes on their workbenches. The more recent and likely source, however, is land surveyors, who continue to use the term and the practice to this day. A “benchmark” for surveyors was a chiseled horizontal line in a stone that held a leveling rod. This was the measure against which altitudes at other locations were determined. The benchmark was compared to a known altitude, typically mean sea level.
Even today, careful observers can find benchmark icons painted on streets near construction areas: a circle divided into black and white, checkerboard quadrants. Historians and biographers have recorded numerous, perhaps apocryphal, examples of process benchmarking observations requested or conducted by the early titans of business: Vanderbilt, Rockefeller, Ford and others. However, the Xerox Corporation is generally credited with the first formal, institutionalized application of process benchmarking. Facing imminent collapse in the early 1980s, the company looked outside and discovered that it spent twice as long as its Japanese competitors to bring a product to market, employed five times the number of engineers, generated four times the number of design changes, and ultimately incurred three times the total design cost.
Today
Multiple surveys indicate that an increasing number of companies are using tools that involve process benchmarking; however, these efforts are generally not producing meaningful, measurable improvement results. One survey indicated the companies are most likely to use benchmarking for writing their mission statements and designing their customer surveys. But few companies harness the quantitative power of process benchmarking for performance measurement and best practice identification. Another survey indicated that only 15% of the surveyed companies’ benchmarking projects resulted in implementing new practices. One reason: Little, if any, comprehensive, standardized documentation exists for the business processes that companies seek to benchmark.

5mc.sgo1.Finance.ODFebruary 2013 © Lab Consulting Partnership, Inc. All Rights Reserved
AboutthisBenchmarkingKPICollection...
Our KPI collections comprise a standardized repository of the most operationally relevant performance measures for a wide range of organizations and industries.
This FinanceKPICollection is drawn from the Support Group section of our Organization-based collections.
KPIs included in the collection have been selected and grouped on the basis of practicality. Over the years, these measures have proven to be the most feasible to collect externally and the easiest to administer for internal operations management.
OpsDog “reuses” these standard KPIs on each of our consulting engagements. This approach enables OpsDog to refresh the data comparisons on a continual basis and avoid redefining costly, one-off comparisons. Similarly, our clients find it helpful to standardize their own internal performance measures and align these with OpsDog’s KPIs to enable cost-efficient external comparisons.
OpsDog’sBenchmarkingKPILibrary
Organization-based collections
SupportGroup
• Finance
• Human Resources
• Marketing
• Information Technology
• Corporate Services
• Compliance/ Audit
• Legal
• Internal Improvement Teams
GeneralLine
• Field Sales & Support
• Customer Service
• Contact Centers
• New Product Development
Supply Chain Operations
• Order Management
• Procurement
• Materials Management
• Production
• Distribution
Services
• Financial Services
– Insurance
– Banking
– Broker/Dealer
– Investment Management
• Media Services
• Information Services
• Health Plans
• Telecommunications
• Utilities
SupplyChain
• Pharmaceuticals
• Chemicals
• Food Production/Processing
• Paper/ Packaging
• Industrial Products/Appliances
• Technology
• Print and Mail
• Consumer Packaged Goods
• Retail and Distribution
• Oil and Gas
Industry-based collections
6mc.sgo1.Finance.ODFebruary 2013 © Lab Consulting Partnership, Inc. All Rights Reserved
HelpfulTipsforPerformanceMeasurement
OpsDog’s Approach to KPI Selection
Avoidenterprisecomparisons—OpsDog focuses on specific “nuts and bolts” level, quantified comparisons of well-documented operating tasks, routines and ratios. We avoid wholesale comparisons of companies or business lines. Such efforts can rapidly evolve into broad, subjective discussions of qualitative, overarching business philosophies and strategies.
Focusprimarilyonoperational[notcost]comparisons—OpsDog limits cost benchmarks to 20% or less of the total KPIs used in any comparative analysis. Both internal and external cost data frequently include allocations and chargebacks that cannot be unbundled for normalized comparison within a reasonable time frame.
Targetworkactivitiesandcommonroutinesforcomparison—Business processes and organization structure vary significantly both across and within comparable peer companies. However, the tasks and sub-routines that comprise these processes and organizations are remarkably similar. OpsDog targets these common elements for comparison.
KeepKPIstoamanageablequantity—Most external peers considering participation in a benchmarking effort will tolerate only a small number of readily available KPIs, typically less than twenty. Prioritize KPIs into several groups to ensure that a small number of essential KPIs are gathered first during each interview. A longer list of “extra credit” questions can be posed to peers willing to spend additional time on the interview. Similarly, internal operating measures for day to day use should be restricted to a concise number for each area—roughly 6–10 essential KPIs.

7mc.sgo1.Finance.ODFebruary 2013 © Lab Consulting Partnership, Inc. All Rights Reserved
Firm-wideBenchmarkingKPIs• Reviews OpsDog’s most popular comparative KPIs for analyzing overall
organization size, structure and operating effectiveness. These KPIs are useful for identifying relevant peers.
BSection

8mc.sgo1.Finance.ODFebruary 2013 © Lab Consulting Partnership, Inc. All Rights Reserved
8.FinanceOrganizationIndicates whether the finance function is centralized or decentralized along various lines a. Centralized at corporate [single Finance group within
a central, corporate Finance department] b. Located within business groups [separate Finance
departments/ functions oversee and are responsible for the Finance function within each business group, i.e., not corporate Finance]
c. Centralized at a shared service center [a “non-corporate” shared service center comprised of several support functions that oversee the Finance function for all business groups
d. Mixed Finance function [Finance functional responsibilities and activities are distributed between a single corporate Finance department and business group Finance departments
e. Other [please specify]
9.TotalCorporateHumanResourcesExpenseTotal amount budgeted for corporate human resources department divided by total corporate operating budget for 20xx.
10.TotalHumanResourcesEmployeesTotal number of employees in all human resources departments, as reported in interviews.
11.ManagementLevelswithinHumanResourcesNumber of management levels in corporate human resources department from department head to lowest management level [e.g., from Vice President to Supervisor, inclusive].
12.ManagementLevelsinFinanceFunctionIndicates the number of management levels in the Finance organization [from Vice President to Supervisor] a. Corporate/executive officer level b. Line/staff level
13.DirectReportsIndicates the average number of direct reports per manager.
Firm-wide KPIs
1.TotalRevenue Total enterprise-wide revenue year-end 20xx as reported
on an earnings statement.
2.TotalOperatingExpense Total operating expense for Finance year-end 20xx.
a. Total firm-wide operating expense b. Total Finance expense
3.TotalEmployeeHeadcount Total number of employees at year-end 20xx.
a. Total FTEs firm-wide b. Total Finance FTEs firm-wide
4.NewHiresIndicate number or new Finance hires in 20xx.
5.BusinessSegmentsIndicates the total number of firm-wide business segments.
6.LinesofBusinessYes/No KPI indicating major lines of business. a. Investments [e.g., investment management] b. Broker/Dealer [e.g., securities broker or trader,
investment bank] c. Commercial Bank [e.g., savings account, loans]
d. Insurance [e.g., institutional insurance, individual insurance]
7.LargestRevenueSourceIndicate business line that yields the largest amount of company revenue. a. Investments [e.g., investment management] b. Broker/Dealer [e.g., securities broker or trader, investment bank] c. Commercial Bank [e.g., savings account, loans] d. Insurance [e.g., institutional insurance, individual insurance]

9mc.sgo1.Finance.ODFebruary 2013 © Lab Consulting Partnership, Inc. All Rights Reserved
14.OutsourcingofFinanceFunctionsIndicates which, if any, of the functions in the company Finance organization are outsourced
a. Financial Reporting b. Treasury c. Audit d. Systems e. General Accounting and Controls f. Accounts Receivable g. Management Accounting h. Tax i. Accounts Payable j. Fixed Assets Processing/Management k. Financial Systems and IT l. Financial Planning, Budgeting and Analysis j. Other [please specify]
15.RecentRelocationInitiativesYes/no KPI indicating whether any groups or activities within the Finance organization have recently relocated or are currently under consideration for relocation
16.SiteSelectionIndicates the relocation site was selected
B = Pre-existing business facility C = Cheap acquisition of new facility P = Proximity to customers L = Access to talented labor O = Other [please specify]
17.RelocationCandidatesIndicates activity types that have been relocated or are currently under consideration for relocation.
G = Entire group A = Bulk of activities B = Back Office [e.g., accounts payable] P = Processing [e.g., transaction clearing] C = Call Center O = Other [please specify]
18.LargestRevenueSourceIndicate business line that yields the largest amount of company revenue. a. Investments [e.g., investment management]
b. Broker/Dealer [e.g., securities broker or trader, investment bank]
c. Commercial Bank [e.g., savings account, loans] d. Insurance [e.g., institutional insurance, individual
insurance]
Firm-wide KPIs

10mc.sgo1.Finance.ODFebruary 2013 © Lab Consulting Partnership, Inc. All Rights Reserved
BankingFunctionalandBusinessProcessKPIs• Defines comparative KPIs used by OpsDog to analyze the procedures and
operating effectiveness of functional departments in Finance.
A. Financial Planning, Analysis and Reporting B. Treasury C. General / Management Accounting D. Accounts Receivable and Payable E. Other Finance Functions
CSection

11mc.sgo1.Finance.ODFebruary 2013 © Lab Consulting Partnership, Inc. All Rights Reserved
FinancialPlanning
1.TotalOperatingExpenseTotal operating expense for Finance year-end 20xx. a. Total Financial Reporting expense b. Total Planning expense c. Total Budgeting expense d. Total Analysis expense
2.TotalEmployeeHeadcountTotal employee headcount for Finance year-end 20xx. a. Total Financial Reporting headcount b. Total Planning headcount expense c. Total Budgeting headcount expense d. Total Analysis headcount expense
3.FinancialReportingOrganizationIndicates whether the financial reporting function is centralized or decentralized. a. Centralized [single reporting group within a central,
corporate Finance department] b. Located within business groups [separate reporting
departments/ functions oversee and are responsible for the reporting function within each business group, i.e., not corporate reporting]
c. Centralized at a shared service center [a “non-corporate” shared service center comprised of several support functions that oversee the reporting function for all business groups
d. Mixed reporting function [Finance functional responsibilities and activities are distributed between a single corporate reporting department and business group reporting departments
4.FinancialPlanningFunctionIndicates the activities conducted by individuals in the financial planning group.
5.FinancialBudgetingFunctionIndicates the activities conducted by individuals in the financial budgeting group.
6.FinancialAnalysisFunctionIndicates the activities conducted by individuals in the financial analysis group.
7.FinancialReportingFunctionIndicates the activities conducted by individuals in the financial reporting group.
8.SuccessMeasuresIndicates means used by peer to measure success/failure of Financial Reporting. a. Achievement of strategic objectives b. No disruption of reporting schedule c. Cost savings d. Employee satisfaction e. Timeliness of initiative completion f. Increased customer efficiency g. Heightened service efficiency h. Other [please specify]
FinancialAnalysis
9.BudgetAdjustmentsIndicates the number of budget adjustments for Finance year-end 20xx.
10.FinancialAdviceIndicates the estimated amount of time that Financial Analysts spend per day providing financial advice to clients [percentage of work activities].
11.UseofInternalBenchmarksYes/no KPI indicating whether company internally benchmarks financial analysis performance and report results on a regular basis.
Forecasting
12. IntegratedStrategicandFinancialForecastingYes/no KPI indicating whether the strategic plan is created as part of the same process as budget.
13.CombinedForecastingandPlanningProcessYes/no KPI indicating whether forecasts are linked to and cross-checked against the budget [ex., forecasts are created quarterly out of same program used to create budget schedules; present forecasts with same frequency at same levels as budget].
14.GoalSettingYes/no KPI indicates whether each level’s leadership draws up and presents business goals prior to target setting.
Financial Planning, Budgeting, Analysis & Reporting

12mc.sgo1.Finance.ODFebruary 2013 © Lab Consulting Partnership, Inc. All Rights Reserved
15.CashForecastingCycleTimeIndicates the average amount of time [in days] devoted to cash forecast: a. 1-3 days b. 4-6 days c. 7-9 days d. 10-12 days e. 13 or more Note: Do not use if Treasury responsibility
16.CashForecastingFrequencyIndicate the frequency of cash forecasting: a. Daily b. Weekly c. Monthly d. Quarterly e. Semi-annually f. Not applicable [Treasury function]
17.AnnualFinancialPlan[AFP]CompletionsIndicates the timing of preparation of annual financing plan: a. Year-end b. After budget c. Ad-hoc d. Other Note: Do not use if Treasury responsibility
ExpenseBudgeting
18.BudgetSchedulesIndicates that expense budget schedules include which of the following: a. Income statements b. Cash flow c. Balance sheet d. Strategic goals e. Spending plan f. Other
19.ScheduleQuantityIndicates the number of expense budget schedules [supporting documents/spreadsheets included with budget] submitted yearly: a. 1 b. 2-5 c. 5-10 d. 10 or more
20.LineItemsIndicates the average number of line items in expense budget schedules: a. 1-5 b. 6-10 c. 11-15 d. 15-25 e. 25 or more
21.BudgetDetailIndicates the level of detail in expense budget [check all answers that apply]: a. Divisional [e.g., labor spending by division] b. Group [e.g., labor spending by department/group] c. Individual [e.g., individual salary costs]
d. Other [e.g., projects below a cutoff level of expenditure require no explanation; require one or two lines for larger projects]
22.BudgetCompletionsCycleTimeIndicates the average time [in calendar days] to complete expense budget: a. Less than 30 b. 30-60 c. 60-90 d. 90-120 e. 120 or more
23.BudgetSchedulesIndicates that expense budget schedules include which of the following: a. Income statements b. Cash flow c. Balance sheet d. Strategic goals e. Spending plan f. Other
24.NumberofBudgetIterationsIndicates the average number of expense budget iterations [refers to any revisions in the budget after one draft is completed]: a. 1-2 b. 3-4 c. 4-5 d. 5-6 e. 7 or more
25.CostperBudgetTotal cost related to developing budgets divided by total number of budget year-end 20xx.
Financial Planning, Budgeting, Analysis & Reporting

13mc.sgo1.Finance.ODFebruary 2013 © Lab Consulting Partnership, Inc. All Rights Reserved
26.BudgetSettingAuthorizationYes/no KPI indicating expense budget set with lower-level input [business goals are defined prior to target setting].
27.AnnualOperatingBudgetYes/no KPI indicating whether the company completes an annual operating budget for all levels firm-wide.
CapitalBudgeting
28.CostCalculationsIndicates how company calculates the cost of capital.
29.CapitalReturnVolumeIndicates the volume of capital returns.
30.CapitalTargetsYes/no KPI indicating whether company establishes firm capital targets early [i.e., does a true deadline for creation and establishment of “hard” capital targets exist]?
31.CapitalBudgetHorizonIndicates the firm’s capital horizon [in months]: a. 1-6 b. 6-12 c. 12-18 d. 18-24 e. More than 2 years
32.SchedulesIndicates which of the following capital budget schedules include: a. Income statements b. Cash flow c. Balance sheet d. Strategic goals e. Capital spending plan f. Other [please specify]
33.NumberofCapitalBudgetSchedulesIndicates the number of supporting documents/spreadsheets included with budget submitted annually: a. 1 b. 2-5 c. 5-10 d. 10 or more
34.LineExpenseItemsIndicates average number of line items in expense budget schedules: a. 1-5 b. 6-10 c. 11-15 d. 15-25 e. 25 or more
35.LevelofDetailinCapitalBudgetCheck all answers that apply: a. Divisional [e.g., labor spending by division] b. Group [e.g., labor spending by department/group] c. Individual [e.g., individual salary costs] d. Other [e.g., projects below a cutoff level of
expenditure require no explanation; require one or two lines for larger projects]
36.CycleTimeIndicates the average time [in calendar days] to complete capital budget: a. Less than 30 b. 30-60 c. 60-90 d. 90-120 e. 120 or more
37.NumberofIterationsIndicates the average number of capital budget iterations [refers to any revisions in the budget after one draft is completed]: a. 1-2 b. 3-4 c. 4-5 d. 5-6 e. 7 or more
38.CapitalAuthorizationYes/no KPI indicates the capital budget set with lower-level input [business goals are defined prior to target setting].
39.PricingAnalysisIndicates the number of reports that receive formal pricing analysis.
40.ReportingSystemYes/no KPI indicating whether company has an integrated finance reporting system
Financial Planning, Budgeting, Analysis & Reporting
14mc.sgo1.Finance.ODFebruary 2013 © Lab Consulting Partnership, Inc. All Rights Reserved
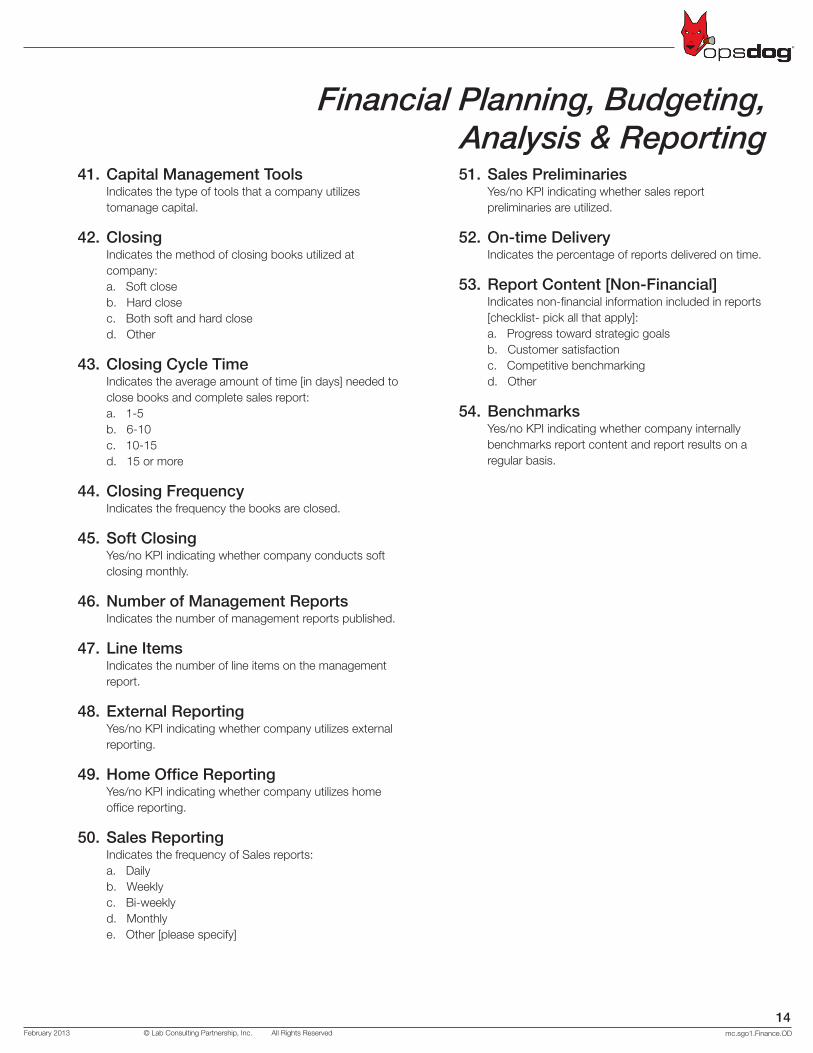
41.CapitalManagementToolsIndicates the type of tools that a company utilizes tomanage capital.
42.ClosingIndicates the method of closing books utilized at company: a. Soft close b. Hard close c. Both soft and hard close d. Other
43.ClosingCycleTimeIndicates the average amount of time [in days] needed to close books and complete sales report: a. 1-5 b. 6-10 c. 10-15 d. 15 or more
44.ClosingFrequencyIndicates the frequency the books are closed.
45.SoftClosingYes/no KPI indicating whether company conducts soft closing monthly.
46.NumberofManagementReportsIndicates the number of management reports published.
47.LineItemsIndicates the number of line items on the management report.
48.ExternalReportingYes/no KPI indicating whether company utilizes external reporting.
49.HomeOfficeReportingYes/no KPI indicating whether company utilizes home office reporting.
50.SalesReportingIndicates the frequency of Sales reports: a. Daily b. Weekly c. Bi-weekly d. Monthly e. Other [please specify]
51.SalesPreliminariesYes/no KPI indicating whether sales report preliminaries are utilized.
52.On-timeDeliveryIndicates the percentage of reports delivered on time.
53.ReportContent[Non-Financial]Indicates non-financial information included in reports [checklist- pick all that apply]: a. Progress toward strategic goals b. Customer satisfaction c. Competitive benchmarking d. Other
54.BenchmarksYes/no KPI indicating whether company internally benchmarks report content and report results on a regular basis.
Financial Planning, Budgeting, Analysis & Reporting

15mc.sgo1.Finance.ODFebruary 2013 © Lab Consulting Partnership, Inc. All Rights Reserved
Treasury
1.TotalOperatingExpenseTotal operating expense for Treasury year-end 20xx. a. Total Cash Management expense b. Total Liquidity Management expense c. Total Investment Management expense d. Total Foreign Exchange expense e. Total Bank Reconciliation expense
2.TotalEmployeeHeadcountTotal employee headcount for Treasury year-end 20xx. a. Total Cash Management headcount b. Total Liquidity Management headcount c. Total Investment Management headcount d. Total Foreign Exchange headcount e. Total Bank Reconciliation headcount f. Other [please specify]
3.TreasuryOrganizationIndicates whether the Treasury function is centralized or decentralized. a. Centralized [single Treasury group within a central,
corporate Treasury department] b. Located within business groups [separate Treasury
departments/functions oversee and are responsible for the Treasury function within each business group, i.e., not corporate Treasury]
c. Centralized at a shared service center [a “non-corporate” shared service center comprised of several support functions that oversee the Treasury function for all business groups]
d. Mixed Treasury function [Treasury functional responsibilities and activities are distributed between a single corporate Treasury department and business group Treasury departments]
e. Other [please specify]
4.TreasuryFunctionIndicates the structure of sub-groups within treasury functions.
a. Forecasting b. Wire Processing c. Bank Account Administration d. Bank Reconciliation e. Cash Accounting f. Check Reconciliation g. Check Copying h. Inter-entity/Legal Reconciliation i. Cash Reconciliation j. Cash Management k. Check Issue/Check Paid File Transmissions l. Forgery Processing m. Escheat Processing n. Compliance Reporting o. Other [please specify]
5.CashBooking/ClearingResponsibilityIndicates the party primarily responsible for booking/clearing cash. A = Business Unit B = Treasury Department C = Specialized group O = Other [please specify]
6.TreasurySupportApplicationsIndicate which of the following types of systems are maintained by Finance Treasury functions:
a. Decision Support/Analytic b. Portfolio Management c. Trading d. Record keeping e. Performance f. General Support g. Other [please specify]

16mc.sgo1.Finance.ODFebruary 2013 © Lab Consulting Partnership, Inc. All Rights Reserved
CashManagement
7.BusinessMixIndicate which businesses are supported by asset management
8.CashManagementActivitiesIndicates activities included in Cash Management operations:T = Trade Support Z = Settlement A = Account Maintenance C = Check Issuance I = Performance Reports F = Accounting and Reporting S = Sales Support I = Securities Lending E = Extensions D = Delivery of Securities V = Vaulting B = Bank Loan T = Transfer
9.AssetsUnderManagementIndicates total dollar amount of assets under management year-end 20xx. a. Public equity b. Public fixed income
10.PortfoliosIndicates the total number of portfolios in Asset Management year-end 20xx a. Public equity b. Public fixed income
11.CorporateAccountsIndicates the total number of corporate accounts [based on quarterly run] year-end 20xx.
12.BranchesIndicates the total number of domestic branches which house money managers and other Treasury employees.
13.BankingFunctionsIndicates what functions, if any, banks perform for Asset Management operations [ex., provide cash available].
14.CheckCopyImagingYes/no KPI indicating whether peer utilizes imaging for check copies.
15.CycleTimeIndicates the average amount of time [in days] devoted to cash forecast [checklist]: a. 1-3 b. 4-6 c. 7-9 d. 10-12 e. 13 or more
16.GeneralLedger/AccountingSystemIndicate the level of detail maintained in the general ledger and the accounting system: a. Investment year b. Segment c. Asset Manager d. Asset Type e. Strategy f. Other
17.LedgerClosingIndicates when general ledger books are closed at the end of each month [e.g., first business day, second business day, etc.].
18.CashBooking/ClearingIndicates how company books and clears cash. A = Through Suspense Accounts
1. Book 2. Clear
B = Directly to Ledger Accounts
1. Book 2. Clear
19.CashForecastingFrequencyIndicates how often peer conducts cash forecasts [check all that apply]: a. Daily b. Weekly c. Monthly d. Quarterly e. Semi-annually
Treasury

17mc.sgo1.Finance.ODFebruary 2013 © Lab Consulting Partnership, Inc. All Rights Reserved
20.DataCollectionIndicates how data is collected to complete cash forecasting [check all that apply]: a. Standardized submission sheets b. Proprietary forecasting software c. Over-the-counter forecasting software
21.AnnualFinancialPlan[AFP]Yes/no KPI indicating whether an annual financing plan is utilized.
22.TimingofAnnualFinancialPlan[AFP]Indicates when the Annual Financing Plan is created. a. Year-end b. After budget c. Ad-hoc e. Other [please specify]
23.AnnualFinancingPlanCycleTimeIndicates average number of business days to develop and annual financing plan. a. Standard development time b. Percent of plans developed within standard
24.VendorandPayrollAccountsIndicates the number of vendor and payroll accounts under management. a. Less than 30 b. 30-50 c. 51-80 d. 81-100 e. more than 100
25.ChecksandEFTVolumeIndicates the number of checks and electronic fund transfers that are estimated to be covered weekly: a. Less than 100 b. 100 to 500 c. 501 to 1000 d. more than 1000
26.GeneralLedgerEntriesIndicates the frequency of providing Accounting with entries for input into general ledger.
27.AverageTradesIndicates the total Average Daily Domestic Trades year-end 20xx.
28.TradeCostIndicates the average cost per trade year-end 20xx.
29.TradesIndicates the percentage of trades in the following areas
a. Equity b. Corporate Bonds c. Municipal Bonds d. Government Bonds e. Bond Funds/CD f. Mutual Funds g. Futures/Commodities h. Repos i. MBS j. All Other
30.TradeCycleTimeIndicates the average time to complete an individual trade, from trade order to trade confirmation.
31.BudgetVarianceIndicate the percent variance of actual operating expense from budgeted operating expense for Cash Management [Monthly] a. 0% - 1% b. 1% - 2% c. 2% - 5% d. More than 5%
32.CostperEmployeeThe total cash management year-end 20xx operating expense per cash management staff.
33.ResearchInquiriesIndicate the number of cash-related research inquiries conducted per month: a. Less than 50 b. 51-100 c. 100-200 d. More than 200
34.TimetoResearchRequestsIndicate the number of days required to conduct and finish a cash-related research inquiry: a. Less than 1 hour b. 1 Hour to 1 day c. More than 1 day but less than 1 week d. 1 Week or more
35.ResearchInquiriesBacklogIndicate the number of unresolved cash-related inquiries per month a. Less than 50 b. 51-100 c. 100-200 d. More than 200
Treasury

18mc.sgo1.Finance.ODFebruary 2013 © Lab Consulting Partnership, Inc. All Rights Reserved
36.ElectronicBankStatementYes/no KPI indicating whether company receives monthly statements from bank in electronic format [BAI] that feed directly into cash management systems.
37.CashForecastCycleTimeIndicate the average amount of time [in days] devoted to cash forecast [checklist]: a. 1-3 b. 4-6 c. 7-9 d. 10-12 e. 13 or more
38.SupportStaffIndicate the number of administrative support staff per cash management staff.
39.PerformanceMeasuresYes/no KPI indicates whether the company evaluates cash management staff based on formal performance measures related to operations, such as accuracy of forecasting vs. daily balances
40.EmployeeEducationalBackgroundIndicate the percentage of cash management employees have the following degree: a. Four-year Bachelor or higher b. Two year junior/associate degree [accounting, etc] c. No college degree but with a high school diploma d. None of the above
41.ContinuingEducationYes/no indicating company adopts the following practice to increase employee satisfaction and reduce turnover rate a. Employees are encouraged to obtain certification
through taking part time classes outside of work b. Supervisors give employees structured advice/
guidance on continuing education issues
LiquidityManagement
42.LiquidityManagementActivitiesIndicates activities included in Liquidity Management operations: T = Trade Support Z = Settlement A = Account Maintenance C = Check Issuance I = Performance Reports F = Accounting and Reporting S = Sales Support I = Securities Lending E = Extensions D = Delivery of Securities V = Vaulting B = Bank Loan T = Transfer
43. InternetTransactionsIndicates the percentage of transactions completed on the internet
44.ZeroBalanceConcentrationAccountYes/no KPI indicates whether a concentrated account is in place to link all operating accounts [e.g., a zero balance account ensures that all daily debits and credits are posted to the sub-accounts, sub-accounts will be automatically off-set by sweeping surplus funds from sub-accounts to concentration account or vice versa]
45.CashBetweenAccountsIndicates average number of business days to move cash between accounts. a. Standard cash movement cycle time b. Percent of cash moved within standard
46.CashAvailabilityYes/no KPI indicates whether banks provide cash availability function.
47.BudgetVarianceIndicate the percent variance of actual operating expense from budgeted operating expense for Liquidity Management [Monthly] a. 0% - 1% b. 1% - 2% c. 2% - 5% d. More than 5%
Treasury
19mc.sgo1.Finance.ODFebruary 2013 © Lab Consulting Partnership, Inc. All Rights Reserved
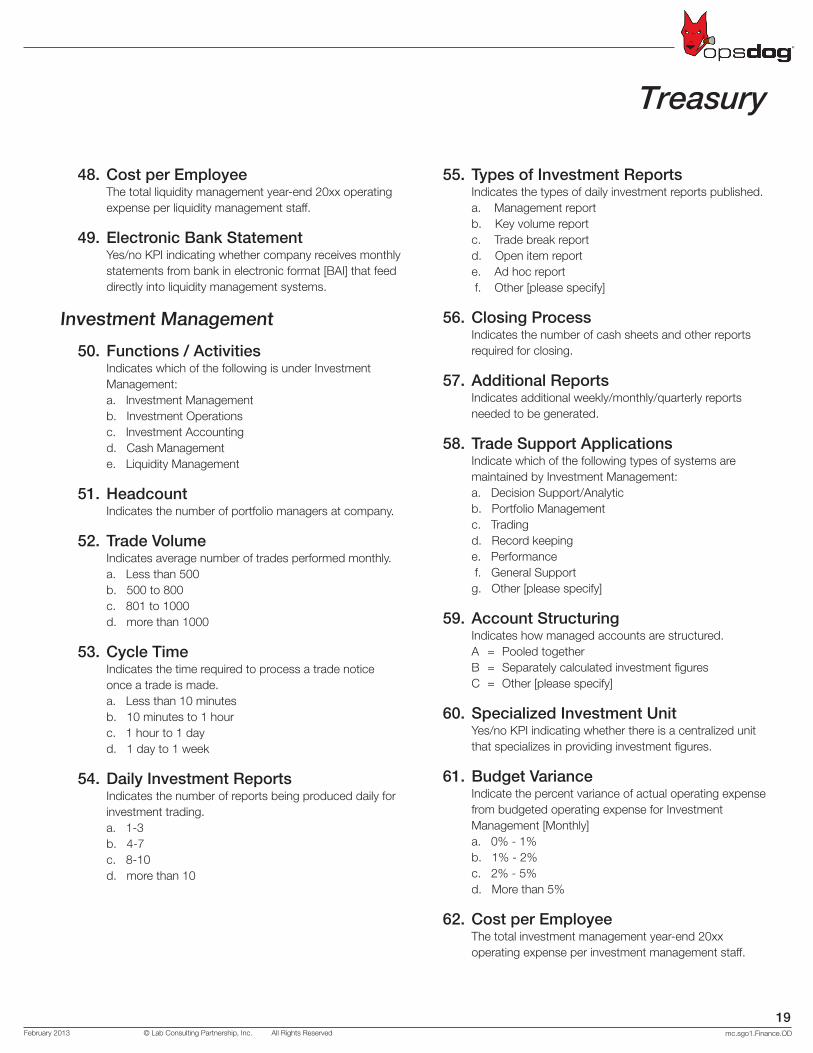
48.CostperEmployeeThe total liquidity management year-end 20xx operating expense per liquidity management staff.
49.ElectronicBankStatementYes/no KPI indicating whether company receives monthly statements from bank in electronic format [BAI] that feed directly into liquidity management systems.
InvestmentManagement
50.Functions/ActivitiesIndicates which of the following is under Investment Management: a. Investment Management b. Investment Operations c. Investment Accounting d. Cash Management e. Liquidity Management
51.HeadcountIndicates the number of portfolio managers at company.
52.TradeVolumeIndicates average number of trades performed monthly. a. Less than 500 b. 500 to 800 c. 801 to 1000 d. more than 1000
53.CycleTimeIndicates the time required to process a trade notice once a trade is made. a. Less than 10 minutes b. 10 minutes to 1 hour c. 1 hour to 1 day d. 1 day to 1 week
54.DailyInvestmentReportsIndicates the number of reports being produced daily for investment trading. a. 1-3 b. 4-7 c. 8-10 d. more than 10
55.TypesofInvestmentReportsIndicates the types of daily investment reports published. a. Management report b. Key volume report c. Trade break report d. Open item report e. Ad hoc report f. Other [please specify]
56.ClosingProcessIndicates the number of cash sheets and other reports required for closing.
57.AdditionalReportsIndicates additional weekly/monthly/quarterly reports needed to be generated.
58.TradeSupportApplicationsIndicate which of the following types of systems are maintained by Investment Management: a. Decision Support/Analytic b. Portfolio Management c. Trading d. Record keeping e. Performance f. General Support g. Other [please specify]
59.AccountStructuringIndicates how managed accounts are structured. A = Pooled together B = Separately calculated investment figures C = Other [please specify]
60.SpecializedInvestmentUnitYes/no KPI indicating whether there is a centralized unit that specializes in providing investment figures.
61.BudgetVarianceIndicate the percent variance of actual operating expense from budgeted operating expense for Investment Management [Monthly] a. 0% - 1% b. 1% - 2% c. 2% - 5% d. More than 5%
62.CostperEmployeeThe total investment management year-end 20xx operating expense per investment management staff.
Treasury

20mc.sgo1.Finance.ODFebruary 2013 © Lab Consulting Partnership, Inc. All Rights Reserved
63.CashForecastDataCollectionIndicate how data is collected to complete cash forecasting [check all that apply]: a. Standardized submission sheets b. Proprietary forecasting software c. Over-the-counter forecasting software
64.CashForecastCycleTimeIndicate the average amount of time [in days] devoted to cash forecast [checklist] a. 1-3 b. 4-6 c. 7-9 d. 10-12 e. 13 or more
65.CashForecastFrequencyIndicate how often peer conducts cash forecasts [that all that apply]: a. Daily b. Weekly c. Monthly d. Quarterly e. Semi-Annually
66.CommissionsIndicate the percentage of total compensation from performance-based commission for trade transactions for investment portfolio managers.
67.TradeSettlementIssueIndicate the number of trade settlement issues resolved per month a. Less than 50 b. 51-100 c. 100-200 d. More than 200
68.ElectronicBankStatementYes/no KPI indicating whether company receives monthly statements from bank in electronic format [BAI] that feed directly into investment management systems.
69.SupportStaffIndicate the number of administrative support staff per investment management staff.
70.PerformanceMeasuresIndicate [yes/no] the company evaluates investment management staff based on formal performance measures related to operations, such as accuracy of forecasting vs. daily balances, trade settlement issues resolved, etc..
71.EmployeeEducationalBackgroundIndicate the percentage of investment management employees have the following degree a. Four-year Bachelor or higher b. Two year junior/associate degree [accounting, etc] c. No college degree but with a high school diploma d. None of the above
72.ContinuingEducationYes/no indicating company adopts the following practice to increase employee satisfaction and reduce turnover rate a. Employees are encouraged to obtain certification
through taking part time classes outside of work b. Supervisors give employees structured advice/
guidance on continuing education issues
ForeignExchange
73.CurrenciesOfferedIndicates the number of major currencies of which the company provides exchange-related services: a. 1-10 b. 2-20 c. 20-30 d. 30-50 c. 50 or more
74.DepositFacilitiesIndicates the number of deposit facilities at company.
75.AccountTypesIndicates the type of account types available at company for foreign currency clients: a. Holding b. Clearing c. Custodial d. Prime e. Other [please specify]
76.BrokenDatesIndicates the number of uncompleted foreign currency transactions by end of business daily.
77.BudgetVarianceIndicate the percent variance of actual operating expense from budgeted operating expense for Foreign Exchange [Monthly] a. 0% - 1% b. 1% - 2% c. 2% - 5% d. More than 5%
Treasury

21mc.sgo1.Finance.ODFebruary 2013 © Lab Consulting Partnership, Inc. All Rights Reserved
78.CostperEmployeeThe total foreign exchange year-end 20xx operating expense per foreign exchange staff.
79.ElectronicBankStatementYes/no KPI indicating whether company receives monthly statements from bank in electronic format [BAI] that feed directly into foreign exchange systems.
BankReconciliation
80.ReconciliationVolumeIndicates the transaction volume for all bank-related reconciliation activities to ensure that all accounting items are resolved [i.e., administer rejected transactions, return of funds, receipt of funds, follow-up for cost basis information not initially supplied by banks, etc.].
81.TransactionCorrectionsIndicates the number of transactions that are incorrectly input into reconciliation system [due to incorrect cash movement ticket, manual error, other].
82.LateTransactionProcessingIndicates the average number of transactions that are not provided to bank reconciliation operations group “same day” [i.e., where transaction detail is received late in day or other].
83. IssuanceSystemsIndicates the type and number of check issuance systems utilized for bank reconciliation.
84.ReconciliationSystemTotalExpenseIndicates total systems costs related to banking reconciliation, include maintenance and development expenses. Inclusive of associated overhead [e.g., executive charges, corporate charges, rent, communications, recruiting, other]; direct staff related charges [e.g., salary, benefits, etc.]; consulting and part-time charges; technology charges; application service providers.
85.ReconciliationSystemsCostIndicates the costs associated with providing bank reconciliation services electronically.
a. “Light On” Service Costs [e.g., systems maintenance costs associated with providing the minimal level of systems support required to ensure that the reconciliation system continues to operate in a “status quo” state. Does not include systems enhancements or modifications. Includes licensing fees and staff related costs]
b. “Routine” Service Costs [e.g., systems enhancement costs required in order to support changing and/or expanding business/market/regulatory conditions that are anticipated as a normal course of doing business and include amortization of projects previously capitalized]
c. “Development” Costs [e.g., systems development costs required to modify and/or enhance systems infrastructures, replace legacy systems and develop and implement more robust functionality to support changing business/market/regulatory requirements and includes initial purchase cost of new applications]
86.ReportAutomationYes/no KPI indicates whether issuance reports are generated automatically.
87.AccountReconciliationIndicates the number of accounts reconciled monthly a. Less than 20 b. 20 to 50 c. 51 t0 100 d. More than 100
88.ExceptionItemsIndicates the number of line items in the exception reports.
89.CycleTimeIndicates the average amount of time [in days] devoted to reconciliation of a single bank account [checklist]: a. 1-3 minutes b. 4-6 minutes c. 7-9 minutes d. 10-12 minutes e. 13 or more minutes
Treasury

22mc.sgo1.Finance.ODFebruary 2013 © Lab Consulting Partnership, Inc. All Rights Reserved
90.ReconciliationFrequencyIndicates how often peer conducts formal account reconciliations [check all that apply]: a. Daily b. Weekly c. Monthly d. Quarterly e. Semi-annually
91.BenchmarksYes/no KPI indicating whether company internally benchmarks bank reconciliation and reports results on a regular basis.
92.ReconciliationInquiriesIndicates the number of reconciliation inquires received at company monthly. a. 1999 b. 2000 c. 2001
93.TradeSettlementIssuesIndicates the type of settlement issues experienced at company. a. Trade breaks b. Incorrect routing c. Wrong instructions d. Rejected transactions e. Other [please specify]
94.BacklogIndicates the backlog on hand [in days] for un-reconciled items.
95.ProductivityperFTEIndicates the number of account and bank transactions cleared daily divided by the number of Treasury employees
96.TurnoverRateIndicates the turnover rate in Treasury employees in 20xx.
97.ResearchCycleTimeIndicates the number of days required, on average, to research requests [domestic cash].
98.BudgetVarianceIndicate the percent variance of actual operating expense from budgeted operating expense for Bank Reconciliation [Monthly] a. 0% - 1% b. 1% - 2% c. 2% - 5% d. More than 5%
99.CostperEmployeeThe total bank reconciliation year-end 20xx operating expense per bank reconciliation staff
100. ReconciliationInquiriesIndicate the number of reconciliation-related research inquiries conducted per month a. Less than 50 b. 51-100 c. 100-200 d. More than 200
101. Un-recordedItemsIndicate the number of un-reconciled items per month a. Less than 50 b. 51-100 c. 100-200 d. More than 200
102. CheckImagingYes/no KPI indicating whether company utilizes imaging and email for check copy function instead of paper format to increase speed/efficiency and ensure accurate/timely distribution.
103. ElectronicBankStatementYes/no KPI indicating whether company receives monthly statements from bank in electronic format [BAI] that feed directly into reconciliation systems.
104. BenchmarksYes/no KPI indicating whether company internally benchmark bank reconciliation and reports results on a regular basis.
105. SupportStaffIndicate the number of administrative support staff per bank reconciliation staff.
Treasury

23mc.sgo1.Finance.ODFebruary 2013 © Lab Consulting Partnership, Inc. All Rights Reserved
106. PerformanceMeasuresIndicate [yes/no] the company evaluates bank reconciliation staff based on formal performance measures related to operations, such as frequency with which employees exceed standard deadline for open items, etc.
107. EmployeeEducationalBackgroundIndicate the percentage of reconciliation employees have the following degree a. Four-year Bachelor or higher b. Two year junior/associate degree [accounting, etc] c. No college degree but with a high school diploma d. None of the above
108. ContinuingEducationYes/no indicating company adopts the following practice to increase employee satisfaction and reduce turnover rate a. Employees are encouraged to obtain certification
through taking part time classes outside of work b. Supervisors give employees structured advice/
guidance on continuing education issues
WireTransfer
109. WireTransferActivitiesIndicates whether the following wire transfer activities are performed by: a. Business units b. Wire Transfer Unit c. Authorize wires d. Validate wires e. Process wires f. Reconcile daily activity g. Other [please specify]
110.MethodofWireTransferRequestIndicates format in which requests for wire transfers are submitted to processing site. A = Internal mail B = Phone C = Fax D = Computer network E = Other [please specify]
111.StandardizedRequestFormsYes/no KPI indicating whether a standardized wire transfer request form exists and is utilized by all business units
112. BusinessUnitAuthorizationYes/no KPI indicating whether business groups authorize and validate their own wire transfer requests before sending them to the wire transfer unit
113. LevelofAuthorizationIndicates level of authorization that is required for all wire transfer requests. A = Senior Executive officer B = Unit Manager C = Specialized [e.g., legal] authorization center D = Other [please specify]
114. UnitCostperWireIndicates the internal unit cost per wire transfer [in dollars], defined as cash management operating expense divided by number of wire transfers processed.
115. WireperAssociateIndicates the number of wire transactions processed per staff [processor] on a daily basis. a. Manual b. Automated
116. QualityControlIndicates types of controls utilized by peers to reduce errors and improve the quality of wire processing: B = Blind key functionality M = Manual checking E = Electronic checking O = Other [please specify]
117. PhysicalSecurityMeasuresIndicates measures taken to prevent wire transfer information from being lost, stolen or corrupted.A = Locked region B = ID card access C = Background check [credit and criminal] on
prospective employeesD = Other [Please specify]
Treasury

24mc.sgo1.Finance.ODFebruary 2013 © Lab Consulting Partnership, Inc. All Rights Reserved
AccountingandReporting
1.TotalOperatingExpenseTotal operating expense for accounting and reporting functions year-end 20xx. a. Total General Accounting expense b. Total Management Accounting expense c. Total Quality expense d. Total Accounting and Reporting Systems expense e. Other expense [please specify]
2.TotalEmployeeHeadcountTotal employee headcount for Accounting and Reporting functions year-end 20xx. a. Total General Accounting headcount b. Total Management Accounting headcount c. Total Quality headcount d. Total Accounting and Reporting Systems headcount e. Other headcount [please specify]
3.AccountingandReportingOrganizationIndicates whether the Accounting and Reporting function is centralized or decentralized. a. Centralized [single Accounting and Reporting group
within a central, corporate Accounting and Reporting department]
b. Located within business groups [separate Accounting and Reporting departments/functions oversee and are responsible for the Accounting and Reporting function within each business group, i.e., not corporate Accounting and Reporting]
c. Centralized at a shared service center [a “non-corporate” shared service center comprised of several support functions that oversee the Accounting and Reporting function for all business groups]
d. Mixed Accounting and Reporting function [Accounting and Reporting functional responsibilities and activities are distributed between a single corporate Accounting and Reporting department and business group Accounting and Reporting departments]
e. Other [please specify]
4.AccountingandReportingFunctionIndicates the structure of sub-groups within accounting and reporting functions.
a. Forecasting b. Accounting c. Reporting d. Financial Close e. Quality f. Account Management g. General Ledger h. Legal Reconciliation i. Account Reconciliation j. Analysis k. Tax l. Authorization Guidelines m. Other [please specify]
5.EmployeeCross-trainingYes/no KPI indicating whether the finance department cross-trains finance employees in the processing of financial data and the analysis for reporting
6.InternalPerformanceBenchmarkIndicates what measurements are utilized to gauge performance: a. On-time submission b. Cycle time c. Number of changes d. Number of errors e. Other [please specify]
7.InternalPerformanceBenchmarkFrequencyIndicates how often the company measures performance: a. On-time submission b. Cycle time c. Number of changes d. Number of errors e. Other [please specify]
8.BenchmarkingActivitiesIndicates type[s] of benchmarking activities performed within the accounting and reporting functions: I = Internal benchmarking E = External benchmarking N = No benchmarking conducted
O = Other [please specify]
General / Management Accounting

25mc.sgo1.Finance.ODFebruary 2013 © Lab Consulting Partnership, Inc. All Rights Reserved
9.BestPracticesDatabaseYes/no KPI indicating whether the accounting and reporting function maintains best practices database.
10.FinancialCalendarYes/no KPIs indicating whether the Quality division implements the corporate “Annual Financial Calendar
AccountReconciliation
11.ChartofAccountsYes/no KPI indicating whether the company has a consolidated “chart of accounts.”
12.ManualJournalEntryCorrectionIndicates the total number of journal entries requiring manual correction divided by the total number of journal entries received by the finance department.
13.CategoriesofAccountsIndicates how many account categories the company utilizes: a. 10 – 70 b. 20 – 100 c. 100 – 5,000 d. Other [please specify]
Quality
14.NumberofQualityFTE’sIndicates the number of full-time equivalent [FTE] employees directly involved in the quality function a. Total number of quality personnel [FTE]
b. Number of quality personnel [FTE] as a percentage of the total number of accounting and reporting employees
15.TotalOpenIssueIndicates the number of “open issues” identified on a weekly basis, on average.
16.TurnaroundTimeIndicates the length of time that it takes to close out or fix a problem, on average.
17.SubmissionGuidelinesYes/no KPIs indicating whether the Quality division implements the corporate “Annual Financial Calendar”.
18.QualityControlIndicates average time [in hours] spent fixing inbound quality information.
19.FinancialCloseAssuranceIndicate which of the following items are tracked in order to control quality: a. Open issues b. Open issues assessment c. Turnaround time of information d. Error tracking and resolution
20.QualityDivisionYes/no KPI indicating whether the company has a center/department dedicated to coordinate and oversee communication between the finance department and other areas and, to control quality and accuracy of information.
FinancialClose
21.FinancialCloseTeamsIndicates the number of employees that are involved in reporting and analysis during the financial close.
22.PeakSeasonSchedulingYes/no KPI indicating whether the organization provides peak hours scheduling to balance workload during Financial Close.
23.Outsourcing/InsourcingYes/no KPI indicating whether the areas participating in the closing process outsource work to third-party resource [including finance department].
24.TemporaryHiresIndicate the percentage of current workforce within the areas involved in the closing process that are considered ‘temps.’
25.ManualUpdatesIndicate the average number of times information is updated during close-end.
26.LateFindingIndicate the percentage of errors found late in the closing process.
27.ElectronicSubmissionYes/no KPI indicating whether the submission of information is electronic.
28.SubmissionRatioIndicates the ratio of information submitted electronically to manual submission of information.
General / Management Accounting

26mc.sgo1.Finance.ODFebruary 2013 © Lab Consulting Partnership, Inc. All Rights Reserved
29.VolumeofSubmissionIndicates the number of areas/departments that gather, submit, and route information that is utilized in the financial closing process [includes submission of information and gathering of financial data; not including finance department] a. Cost Accounting b. Tax c. Investment Accounting d. Investment Reporting e. Actuarial f. Other [please specify]
30.ClosingFrequencyIndicate the financial calendar to close the books. a. Monthly close b. Quarterly close c. Other [specify]
31.CycleTimeAverage number of business days it takes from the Business Unit modules to close to the G/L to actually produce the final reviewed financial statement: a. 0-10 b. 11-20 c. 20-30 d. 31 or more
32.ClosingRatioIndicates average time spent in closing the books vs. average time spent in analysis.
33.ClosingHeadcountNumber of FTEs needed to close the books within the close-end period. a. 1-3 b. 4-7 c. 7-10 d. 11 or more
34.RealTimeDataNumber of business days required to process reports at the close end of each financial close period: a. 1-5 b. 6-10 c. 11-20 d. 20 or more
35.ClosingTypeIndicate which types of closing types are utilized: a. By Company Code b. By Ledger Amount c. By Account Code d. By Accruals e. By GAAP f. By Stat g. By MGAAP h. Other
36.EffectivenessIndicate status of results submitted: a. Complete b. Accurate c. On schedule d. Within turnaround target
DataWarehousing
37. DataWarehouseYes/no KPI indicating whether the finance department maintains complete histories in ‘their own’ database, distinct from corporate operation histories [i.e., a data warehouse].
38. DataWarehouseAutoFeedsYes/no KPI indicating whether information is moved automatically and electronically from the various cost centers to the corporate data warehouse.
Systems
39. ReportingSystemsCapabilitiesIndicates capabilities of reporting systems: a. Compile data and download into common drive b. Ability to print selected information in one-page
overview c. Drill-down capabilities that ease reporting process
d. Standardized reports from database e. Use of template tools/shells to accelerate data entry
into the system f. Other [please specify]
40. SystemsFTE’sYes/no KPI whether the finance department has dedicated ‘finance’ employees to departmental technology maintenance and
development.
General / Management Accounting

27mc.sgo1.Finance.ODFebruary 2013 © Lab Consulting Partnership, Inc. All Rights Reserved
41. CustomorCommercialGeneralLedgerThis KPI identifies the use of technology invested in the creation and maintenance of the general ledger C = Customized M = Commercial product with more than two months
of customization O = Commercial, off-the-shelf product
42. QuarterlyReportsIndicates the method in which information is moved to the finance and reporting departments for quarterly reports P = Paper forms E = Electronic form reports A = ‘Auto-feed’ linkages
JournalEntry
43. JournalEntryIndicate volume information: a. Number of Journal Entries processed per close end b. Number of Journal Entries per FTE c. Number of miscellaneous Journal Entries processed per close end
44. CostperMiscellaneousJournalEntryIndicates the average cost incurred per miscellaneous journal entry input.
45. IncorrectInformationYes/no KPI indicating whether the company internally tracks wrong information
46. SubmissionofIncorrectInformationIndicate the actual number of incorrect information from departments in a given period of time.
47. SubmissionofUntimelyInformationIndicates the actual number of untimely information submitted in a given period of time.
GeneralLedgerOperations
48. ReportingDataSharingIndicates the level of data coordination between reporting areas. A = All data sets shared S = Some data sets shared D = Data ‘silos’ in which data sets are isolated from
one another
49. TopSideAdjustmentsIndicate volume information on ‘top adjustments’ prior to reporting a. Number of top side adjustments per close-end period b. Percentage of late entries adjustments
50. BudgetVarianceIndicates the budget variance between planned and actual for Tax function at year-end 20xx.
51. JournalVoucherEntriesIndicates the average number of monthly voucher entries.
52. ManualAdjustmentsYes/no KPI whether adjustments are performed manually
53. AccrualsIndicates volume of accruals at close-end.
54. GeneralLedgerOperationsSystemsInterfaceYes/no KPIs whether the company has an integrated General Ledger system.
55. GeneralLedgerFeedsYes/no KPIs whether the General Ledger has direct and indirect feeds a. Direct b. Indirect
56. GeneralLedgerSystemIndicate system utilized for processing financial informationa. SAP b. PeopleSoft c. Millennium d. Lotus Notes e. Oracle /Excel f. Various g. Other [specify]
57. GeneralLedgerDiscrepancyIndicates the number of discrepancies between the accounting system and the general ledger at month end for book value, interest/dividend income, amortization of premium or accrual of discount, gain or loss.
General / Management Accounting

28mc.sgo1.Finance.ODFebruary 2013 © Lab Consulting Partnership, Inc. All Rights Reserved
58. GeneralLedger/AccountingSystemsIndicate the level of detail maintained in the general ledger and the accounting system. a. Investment year b. Segment c. Asset Manager d. Asset Type e. Strategy f. Other
59. GeneralLedgerClosingIndicate when general ledger books are closed at the end of each month [e.g., first business day, second business day, etc.].
60. Non-TradeTransactionsIndicates the total number of transactions associated with the receipt principal and/or interest per year.
61. VolumeTotal number of FTEs entering data in the General Ledger per day.
62. PerformanceAnalysisIndicate General Ledger account transaction
AccountingProcedures
63. AuthorizationGuidelineTurnaroundTimeYes/no KPI whether the company has set deadline for managers to approve transactions.
64. ReconciliationofDataIndicates ratio of reconciled data prior submission to total data submitted.
65. ApprovalIndicates type of approval and conditions. a. Manual b. Electronic c. Both d. Exceptions
66. AccountReconciliationTotal number of account reconciliation. a. Adjusting entries b. Improving closing cycle
Reporting
67. EfficiencyIndicate how efficiently results are provided in terms of units per person and per day. a. Per Units b. Per Day
68. AdaptabilityIndicate how well the process can accommodate special needs and expectations a. 0-25% b. 25% - 50% c. 50% - 75% d. 75% - 100%
69. CashSheetsIndicate total number of cash sheets processed for the financial close-end process.
70. DailyReportTypesIndicates the types of daily reports utilized at company: a. Cash forecasts b. Borrowing and Investments c. Interest rate chart d. Portfolio reports e. Sales f. Purchases g. Other [please specify]
71. MonthlyReportTypesIndicate the types of monthly reports utilized at company: a. Portfolio yields b. Position reports c. Cash forecasting d. Financial exchange reports e. Four-month forecast of the intercompany flow of funds [e.g., loans, equity injections, intercompany AP and AR] f. Cost center reports g. Balance sheet
72. QuarterlyReportTypesIndicates the types of quarterly reports utilized at company: a. Cash forecast [12 month] b. Intercompany debt c. Debt report for prior quarter d. Sources and application report
General / Management Accounting

29mc.sgo1.Finance.ODFebruary 2013 © Lab Consulting Partnership, Inc. All Rights Reserved
73. AnnualReportTypesIndicates the types of annual reports utilized at company: a. Treasury department budgets b. Treasury financial plan c. Financial contingent liabilities report d. Analysis of revenues e. Treasury yearly activity report f. Debt and investment report g. Other [please specify]
74. NumberofLateReportSubmissionsIndicates the number of late report submissions: a. Quarterly financial package b. Monthly BAPS c. Premium & loss exhibit d. Interoffice trial balance e. IBNR worksheets f. U/W results by class
75. ErrorCorrectionsIndicates the number of error corrections per report: a. Quarterly financial package b. Monthly BAPS c. Premium & loss exhibit d. Interoffice trial balance e. IBNR worksheets f. U/W results by class
76. BenchmarksYes/no KPI indicating whether company internally benchmarks report content and reports results on a regular basis.
77. ReportingAverage number of ad-hoc reports generated within the close-end period.
78. LateReportsIndicates the number of late report submissions: a. Financial package b. BAPS c. Premium & loss exhibit d. Interoffice trial balance e. IBNR worksheets f. U/W results by class g. Investment Package h. Other [specify]
79. NumberofErrorCorrectionsIndicates the number of error corrections completed daily on average.
80. BenchmarksYes/no KPI indicating whether company internally benchmarks report content and report results on a regular basis
Controller
81. ControllerLocationIndicates the location of the controller function a. Within Accounting b. Outside Accounting [e.g., stand alone, direct to CFO & COO, internal policy and control] c. No group exists
82. ActivityofControllersIndicates the types of activities in the Controller function
a. Internal Audit b. Accounting c. Accounting Payable d. Payroll e. Budgeting f. Cost Accounting g. Special Projects h. GAAP Compliance i. Transaction Overnight Management j. Cashiers k. IPO Analysis l. Other [please specify]
FinancialControls
83. RatioofFinancialControlEmployeesRatio of total financial control employees to total number of firm-wide employees.
84. OutsourcingofFinancialControlFunctionYes/no KPI indicating whether company outsources the financial control function to a third-party vendor.
85. Authority-WriteOn/WriteOffIndicates who has the final say on decisions related to write-ons/write-offs. a. Financial Department b. Management c. Audit d. Human Resources e. Other [please specify]
86. AdditionalControlsIndicates controls implemented to monitor the reconciliation process.
General / Management Accounting

30mc.sgo1.Finance.ODFebruary 2013 © Lab Consulting Partnership, Inc. All Rights Reserved
Analysis
87. FinancialAnalysisIndicate main macro indicators [internal] a. Sales b. Premiums c. Assets under management d. Management GAAP e. Other [specify]
88. IndicatorsIndicate main macro indicators [external] a. Security Exchange Commission b. Other [specify]
Tax
89. TaxVolumeIndicates the volume of tax related transactions processed: a. Total tax adjustments processed at year-end b. Total number of tax reports and returns processed
per year-end c. Total number of tax payments per year-end
d. Total number of IRS Information Document Request processed per year-end
90. TaxFilingsPercentage of late and inaccurate tax filings.
91. FinesIncurredIndicates average of total fines incurred.
92. CycleTimeIndicate number of business days needed to run Preliminary Tax.
93. EffectivenessIndicates the method of tracking status of results submitted: a. Complete b. Accurate c. On schedule d. Within turnaround target
94. TaxSystemSystem Utilized for processing and reporting a. CorpTax b. Fast Tax c. APL d. Other [specify]
ManagementAccounting
95. ManagementAccountingIndicates the number of cost centers in the Management Accounting system. a. Less than 10 b. 10-20 c. 21-30 d. 31-40 e. 41-50 f. more than 50
96. CostNumbersIndicates the number of line codes or cost numbers in Management Accounting system. a. Less than 50 b. 50-100 c. 101-200 d. 201-300 e. more than 300
97. AutomationYes/no KPI indicates if the following automation is in place. a. Linkage between Payroll and Cost Centers b. Interface with Accounts Payable c. Interaction with other Accounting systems such as Journal Header, Journal Lines
98. CashSheetsIndicated the number of cash sheets and other reports produced for each monthly closing period. a. Less than 200 b. 200-500 c. 501-1000 d. more than 1000
General / Management Accounting

31mc.sgo1.Finance.ODFebruary 2013 © Lab Consulting Partnership, Inc. All Rights Reserved
Accounts Receivable and Payable
1.TotalOperatingExpenseTotal operating expense for accounts receivable and payable functions year-end 20xx. a. Accounts receivable expense b. Accounts payable expense
2.TotalEmployeeHeadcountTotal employee headcount for accounts receivable and payable functions year-end 20xx. a. Accounts receivable headcount b. Accounts payable headcount
3.AccountsReceivableandPayableOrganizationIndicates whether the Receivable and Payable function is centralized or decentralized. 1. Accounts Receivable 2. Accounts Payable
a. Centralized [single receivable and payable group within a central, corporate Accounts receivable and payable department]
b. Located within business groups [separate receivable and payable departments/functions oversee and are responsible for the receivable and payable function within each business group, i.e., not corporate receivable and payable]
c. Centralized at a shared service center [a “non corporate” shared service center comprised of several support functions that oversee the receivable and payable function for all business groups]
d. Mixed receivable and payable function [receivable and payable functional responsibilities and activities are distributed between a single corporate receivable and payable department and business group receivable and payable departments]
e. Other [please specify]
4.AccountsReceivableFunctionIndicates the structure of sub-groups within accounts receivable function. a. Billing b. Collections c. Remittance Posting d. Cash Receipt e. Other [please specify]
5 AccountsPayableFunctionIndicates the structure of sub-groups within accounts payable function. a. Invoice Processing / Receiving b. Invoice Payment c. Vendor Management d. Purchasing / Procurement
6.InternalPerformanceBenchmarksIndicates what measurements are utilized to gauge performance: a. On-time submission b. Cycle time c. Number of changes d. Number of errors e. Other [please specify]
7.InternalPerformanceBenchmarkFrequencyIndicates how often the company measures performance: a. On-time submission b. Cycle time c. Number of changes d. Number of errors e. Other [please specify]
8.BenchmarkingActivitiesIndicates type[s] of benchmarking activities performed within the receivable and payable functions: I = Internal benchmarking E = External benchmarking N = No benchmarking conducted
O = Other [please specify]
9.NumberofGroupsIndicates the total number of groups within Accounts Payable and Accounts Receivable: a. Accounts Payable b. Accounts Receivable
10.AccountsReceivableandPayableEmployee Headcount Indicates the number of full-time equivalent [FTEs] employees devoted to Accounts Payable or Receivable functions: a. Accounts Payable FTEs b. Accounts Receivable FTEs
32mc.sgo1.Finance.ODFebruary 2013 © Lab Consulting Partnership, Inc. All Rights Reserved
Accounts Receivable and Payable
11. ManagementLevelsNumber of management levels in Accounts Payable and Receivable from department head to lowest management level [e.g., from Vice President to Supervisor, inclusive]. a. Accounts Payable b. Accounts Receivable
12. SpanofControlIndicates the average number of direct reports per manager. a. Accounts Payable b. Accounts Receivable
InvoiceProcessing/Receiving
13. “FollowUp”CallsIndicates the average number of “follow-up” calls daily.
14. NumberofInvoicesIndicates the number of invoices [including purchase cards] processed monthly.
15. ProcessingRatioIndicates the number of invoices processed per AP FTE.
InvoiceBill/Payment
16. ProcessingPointsIndicates the number of hand-offs for standard general expense vouchers [e.g., from mail desk to final payment review, excluding duplicate payments, reissued or redeposited checks]
17. TransactionProcessingIndicates the average number of transactions processed by Accounts Payable each month a. General invoices b. Travel and entertainment expenses
18. ExceptionProcessingYes/no KPI indicating whether company allows special handling of payments: a. Check request from branches b. Vendors c. Other – Manual – Electronic
19. CheckProcessingIndicate number of checks requiring special handling per month due to unforeseen errors: a. Reissued checks b. Re-deposited checks c. Returned checks – Manual – Electronic
20. PaymentProcessingAverage number of business days to process an invoice a. Standard payment cycle time b. Percent of payments processed within standard
21. VolumeofTransactionsIndicates the total volume of payment processed. a. Paper processing b. Electronic
22. UnitCostperTransactionsIndicates the total unit cost [in dollars] per payment processed a. Paper b. Electronic
23. UnitCostperRushedCheckIndicates the total cost of rushed checks year-end 20xx.
24. StandardVolumeIndicates the existence of a standard number of payments processed per hour. a. Manual b. Electronic
25. TransactionsperHourIndicates the actual number of payments processed per hour. a. Manual b. Electronic
26. InvoiceTrackingProcessIndicates when invoices are logged as received and how invoices are located or tracked in the Accounts Payable system.
27. PaymentErrorRateIndicates the average errors per month as a percentage of total number of transactions: a. Submittal errors b. Compliance errors c. Payment errors
33mc.sgo1.Finance.ODFebruary 2013 © Lab Consulting Partnership, Inc. All Rights Reserved
Accounts Receivable and Payable
28. DuplicatePaymentControlsIndicate controls utilized by peer to minimize duplicate payment errors [check all that apply]: a. Manual checking b. Electronic controls c. Mixed d. Other [please explain]
29. SearchPeriodIndicate standard search period utilized to locate duplicate payments. a. 30 days b. 60 days c. 90 days d. Other [please specify]
30. PostPaymentReviewIndicates standard for automatic initiation of payment review [e.g., payments greater than $100.00].
31. CancelledOrderControlsIndicates controls utilized to eliminate processing invoices for cancelled orders. a. Manual checking b. Electronic controls c. Mixed d. Other [please specify]
32. AverageCostperPaymentIndicates the average total cost per payment in the Accounts Payable area.
33. ChargebackMethodologyIndicates cost centers for Accounts Payable services. a. Charged entirely to corporate b. According to use by each business group c. Divided evenly amongst business groups d. Other [please specify]
34. ChargebackForecastingFrequencyIndicates frequency of chargeback calculation. a. Annually b. Semi-annually c. Quarterly d. Monthly e. Other [please specify]
35. PaymentSegmentationIndicates the percentage of invoice payments made. a. Electronic [EFT] b. Manual c. Other [please specify]
36. PerformanceMeasuresYes/no KPI indicating the existence of formal performance standards. a. Account Payable b. Accounts Receivable
37. TypesofPerformanceIndicates the type of formal performance standards utilized a. Cycle Times b. Error rates c. Volumes Processed d. Other [please specify]
TravelandExpense
38. VolumeofTransactionsIndicates the total number of travel vouchers processed per day a. Paper b. Electronic
39. TransactionperHourandStandardIndicates the standard number of travel vouchers processed per hour a. Actual number of travel vouchers processed hourly b. Standard number of travel vouchers
Purchasing/Procurement
40. WebPaymentsIndicates the percentage of payments via the web.
34mc.sgo1.Finance.ODFebruary 2013 © Lab Consulting Partnership, Inc. All Rights Reserved
Other Finance
SystemandIT
1.LocationofSystemsSupportGroupIndicates division primarily responsible for managing the systems support group. A = IT B = Finance C = Business Unit D = Other [please specify]
2.SystemsAdministrationFTEsIndicates the total number of FTEs involved in systems operations. a. Indicate number of FTEs involved in Database
Administration b. Indicate number of FTEs involved in Application
Administration c. Indicates the percentage of systems maintenance
FTEs to total systems employees. d. Indicates the percentage of systems development
FTEs to Total systems employees.
3.FinanceSystemsTotalExpenseIndicates total systems costs related to Finance functions, include maintenance and development expenses. Inclusive of associated overhead [e.g., executive charges, corporate charges, rent, communications, recruiting, other]; direct staff related charges [e.g., salary, benefits, etc.]; consulting and part-time charges; technology charges; application service providers.
4.FinanceSystemsSpecializedCostIndicates the costs associated with Finance systems operations. a. “Light On” Service Costs [e.g., systems maintenance
costs associated with providing the minimal level of systems support required to ensure that systems continue to operate in a “status quo” state. Does not include systems enhancements or modifications. Includes licensing fees and staff related costs]
b. “Routine” Service Costs [e.g., systems enhancement costs required in order to support changing and/or expanding business/market/regulatory conditions that are anticipated as a normal course of doing business and include amortization of projects previously capitalized]
c. “Development” Costs [e.g., systems development costs required to modify and/or enhance systems infrastructures, replace legacy systems and develop and implement more robust functionality to support changing business/market/regulatory requirements and includes initial purchase cost of new applications]
5.ServiceCenterYes/no KPI indicating whether a separate division/unit/organization exists where incoming technology and systems service calls arereceived from internal customers [e.g., characteristics that generally define a service center include: main activity of center employees is receiving incoming calls, calls are distributed via an ACD, call statistics are tracked by the phone system].
6.ServiceCenterCostIndicates the costs associated with incoming customer service calls [includes those costs associated with CSR and IVR].
7.ProblemResolutionIndicates the average cycle time for problem resolution [from when call is received until issue is closed].
8.SystemsOutsourcingYes/no KPI indicating whether company relies on an outside entity for a systems or technology function, system or service by an outside contractor or third party administration.
9.TypesofSystemsIndicates the type of financial systems utilized. a. SmartStream b. Order Payment c. Proprietary d. Other [please specify]
10.SystemDowntimeIndicates average percentage of systems downtime experienced per month.
11.SystemSecurityIndicates the level of security maintained at the company a. Level 1 b. Level 2 c. Level 3 d. Other
12.SystemMaintenanceIndicate number of formal maintenance checks conducted per month.

35mc.sgo1.Finance.ODFebruary 2013 © Lab Consulting Partnership, Inc. All Rights Reserved
Other Finance
Payroll
13.RatioofPayrollAdministrationIndicates ratio of total dedicated payroll administrative personnel supporting total number of employees on
company payroll.
14.StructureofPayrollFunctionIndicates the structure of the payroll function: a. Payroll for all branches is performed in one central
location b. Each branch handles its own payroll function
c. Responsibility for payroll is shared between one central location and branches
d. Each business unit performs its own payroll e. Fully outsourced
15.KeyFunctionsIndicates key functions of payroll department: a. Processing checks b. Administrative duties c. Firm-wide accounting d. Business unit accounting e. Processing withholdings [e.g., personal, health] f. Tax related issues g. Processing data charges h. Other [please specify]
16.OutsourcingofPayrollFunctionYes/no KPI indicating whether company utilizes a third-party vendor payroll processing [i.e., cutting checks]. a. Branch payroll b. Global payroll c. Regional payroll d. Business unit payroll
17.OutsourcingofAdministrativeToolsYes/no KPI indicating whether administrative payroll tasks have been outsourced to a third-party vendor. a. Branch payroll b. Global payroll c. Regional payroll d. Business unit payroll
18.AccountingFunction-ResponsibilityIf located in payroll, indicates personnel responsible for performing accounting duties. a. Certified accountant b. Administrative personnel c. Other [please specify]
19.StandardizedProcessYes/no KPI indicating whether company utilizes a standard process to record employee information [e.g., standard firm-wide forms].
20.CostofFormProcessingIndicates cost to process payroll-related forms: a. F-8 b. W-2 c. ACFs d. Time Cards e. Other [please specify]
21.DataIntegrityIndicates the number of data errors in payroll-relates forms: a. F-8 b. W-2 c. ACFs d. Time Cards e. Other [please specify]
22.DataCaptureIndicates method by which payroll data is received. a. Interface [i.e., data goes directly into payroll] b. Hard copy c. Electronic copy [e.g., email to payroll] d. Other [please specify]
23.TurnaroundforPayrollAverage length of time, in days, necessary to process payroll.
24.BacklogIndicates the backlog in processing payroll at a given time, items at specific interest include number of checks/vouchers and number of W-2’s.
25.CycleTimeProcessChangesIndicates average time [in days] necessary between change in employee data until payroll information is updated. a. Information that has financial impact on employee
[e.g., base salary] b. Information that has no financial impact on employee
[e.g., address]
26. InternationalRelocationPaymentsIndicates location in which relocation payments are primarily processed. a. Payroll in country of original employment b. Local payroll c. Separate expatriate payroll

36mc.sgo1.Finance.ODFebruary 2013 © Lab Consulting Partnership, Inc. All Rights Reserved
FixedAssets
27.CapitalAssetTaggingIndicates the number of transactions tagged.
28.CapitalAssetTrackingIndicates the dollar amount of assets tracked
29.CapitalDepreciationIndicates the amount [inn dollars] of capital depreciation in 2001.
30.UnderConstructionIndicates the amount of fixed assets under construction.
31.DisposalIndicates the level of disposable fixed assets.
Actuarial
32.PricingAnalysisIndicates whether company conducts formal pricing analysis on a regular basis.
33.AnalysisCycleTimeIndicates the average cycle time for analysis/pricing models to be completed.
34.ResponseCycleTimeIndicates the average response time from receipt of inquiries/requests to answer.
35.AccuracyIndicates the percentage loss reserve accuracy.
36.ErrorsIndicates the number of errors in analysis/modeling.
37.CertificationsIndicates the ratio of staff passing CAS and IDMA exams.
Audit
38.AuditVolumeIndicates the number of formal audits completed in 2001: a. Full Audit b. Partial Audit c. Other [please specify]
39.StaffOverviewIndicates the percentage of Audit FTE’s professionally trained and certified.
40.AuditCostIndicates the average amount [in dollars] per audit [actual cost divided by audits completed]: a. Full Audit b. Partial Audit c. Other [please specify]
41.AuditCycleTimeIndicates the amount of time, on average, that an audit requires from start to finish: a. Full Audit b. Partial Audit c. Other [please specify]
42.AuditCharterIndicates the primary goals of internal audit group [check all that apply]:
a. Reliability and integrity of financial and operational information
b. Effectiveness and efficiency of operations c. Safeguarding of assets d. Compliance with laws, regulations and contracts e. Other [please specify]
43.AuditReportIndicates the number of audit reports published yearly: a. Full reports b. Recap reports c. Management reports d. Other [please specify]
44.AuditReportMake-UpIndicates the make-up of audit reports [in percentages]: a. Charts and graphs b. Descriptive written documentation c. Other [please specify]
45.AuditManagementReportIndicates the topics included in reports to senior management [check all that apply]: a. Audit purpose b. Authority c. Findings [i.e., satisfactory performance and overall
opinion] d. Performance relative to plan
e. Risk exposure and control issues f. Corporate governance issues g. Other [please specify]
Other Finance
37mc.sgo1.Finance.ODFebruary 2013 © Lab Consulting Partnership, Inc. All Rights Reserved
Other Finance
46.CostSavingsIndicates the amount of cost savings [in dollars] due to audit findings recommendations.
47.AuditProjectToolsYes/no KPI indicates whether standard format project tools are utilized to deliver audits on time and within budget targets.
48.AuditPlanningYes/no KPI indicates whether a planning tool is widely utilized to maximize travel [i.e., conduct multiple audits in remote locations together]
49.ErrorsorOmissionsIndicates the percentage of audits that are completed and then adjusted due to the subsequent identification of an error or omission.
50.VendorsYes/no KPI indicates whether external vendors are utilized to provide relevant assurance and consulting services.
51.AuditSystemsIndicates the types systems and electronic support utilized to perform audit [i.e., review of audit recommendations, adherence to corrective actions, etc.]
SharedServiceCenter
52.NumberofSharedServicesCenterIndicates total number Finance function services centers designed to service internal employees.
53.SharedServicesCenterSegmentationIndicates how shared services center are organized: C = Corporate Finance Service Center L = Line of Business Service Center O = Other [please specify]
54.NumberofSharedServicesCenterEmployeesTotal number of employees staffed to Finance Service Center[s].