Final Year Manuals - World College of Technology and ... final year lab...wireless and satellite...
139
Final Year Manuals
Transcript of Final Year Manuals - World College of Technology and ... final year lab...wireless and satellite...

Final Year Manuals

WIRELESS &
SATELLITE COMMUNICATION (ECE‐423‐F)
LAB MANUAL
VII SEMESTER

WIRELESS AND SATELLITE COMMUNICATION LAB MANUAL (ECE‐423‐F)
LIST OF EXPERIMENTS
S.NO
1.
NAME OF EXPERIMENT
To set up a satellite communication link and study of change in uplink and downlink frequency
To establish an Audio-Video satellite link between Transmitter and Receiver
To Study Frequency Hopping Spread Spectrum (FHSS) Modulation and Demodulation Technique
To study generation(spreading) & demodulation(Despreading) of DSSS modulated signal.
To study radiation pattern &calculate beam width for Yagi uda & folded dipole antenna
To study radiation pattern & calculate beam width for circular & triangular patch. antenna
Study of Data and PN Sequence Generation
To study GPS data like longitude, latitude using GPS receiver
Study of Minimum Shift Keying (MSK) Modulation Process
Study of Minimum Shift Keying (MSK) Demodulation Process
2.
3.
4.
5.
6.
7.
8.
9.
10.

WIRELESS AND SATELLITE COMMUNICATION LAB MANUAL (ECE‐423‐F)
EXPERIMENT NO. 1
AIM: To set up a satellite communication link and study of change in uplink and downlink frequency
BRIEF THEORY:
UPLINK TRANSMITTER: In up link station the signal has to be sent at a different frequency usually in higher 1GHz band to avoid interference with link signal. Another function performed by uplink station is to control highly internal function of satellite. up links are controlled so that transmitted micro wave beam is extremely narrow in order not to interface with adjacent satellite.
TRANSPONDER: Each satellite has a number of transponder witch access to a pair of receive / transmit antennas and associated electronics for each channel. For example in Europe the uplink sends a signal at a frequency of about 14 GHz. These are received downlink converted in frequency of about 11/ 12 GHz and boosted by high power amplifier for retransmission to earth. Separate transponder are used for each channel and are powered by solar panels with backup batteries for eclipse protection.
DOWN LINK RECIEVER: The medium used to transmit signal from satellite to earth is microwave electromagnetic radiation which is much higher in frequency normal broadcast TV signal in VHF / UHF bands. Microwave still exhibit a wave like nature, but inherit a tendency to serve attenuation by water vapors or any obstruction in line of sight of antenna. The transmitted micro wave power is extremely weak by the time it reaches earth and unless well designed equipment is used and certain installation precaution are taken, the back round noise can ruin the signal.
BLOCK DIAGRAM:
TRANSMITTER
TRANSPONDER RECEIVER
PROCEDURE:- 1 1 2
3 4 5 6 7 8 9
Connect the satellite uplink transmitter to AC mains. Switch on the transmitter by mains switch and frequency display will come on. The transmitting frequency can be selected by up –down switch. The frequency can be changed from 1200 -1250-1300 MHz. The transmitter on –off switch will switch on –off the transmission. Connect X1 antenna to uplink transmitter with BNC –BNC cable. Set the o/p gain of uplink transmitter to maximum. Place downlink receiver at a distance of 5-7 m. Connect the downlink receiver to the AC mains and switch it on by mains switch. The downlink receiver frequency can be changed from 1100 -1150 -1200 MHz. The downlink receiver also has tuning potentiometer, which can be use to tune any frequency from 950- 1500 MHz.

WIRELESS AND SATELLITE COMMUNICATION LAB MANUAL (ECE‐423‐F)
10 11 12 13 14
Keep the tuning POT fully anticlockwise. The downlink receiver on –off switch will switch on –off the receiver. Attach R2 antenna to the downlink receiver with BNC –BNC cables. Align both the transmitter and receiver antenna in line. Place a satellite transponder between transmitter and receiver at a distance of 5-7 m.
RESULT: -The link has been established between Transmitter and Receiver through satellite.
DISCUSSION: - The quality of signal is much improved with active satellite especially when distances between transmitter and receiver are considerable.
PRECAUTIONS: - 1. Connection should be tight. 2. Switch off power supply after performing the experiment.
DRONACHARYA COLLEGE OF ENGINEERING PAGE NO 4

WIRELESS AND SATELLITE COMMUNICATION LAB MANUAL (ECE‐423‐F) QUIZ: Q.1.What is passive satellite? Ans. These satellites simply reflect signal back to earth. Q 2. What is active satellite? Ans. These electronically repeat the signal and send it back to earth. Q .3. What is Non synchronous satellite? Ans. These satellites rotate around the earth in a low altitude elliptical or circular pattern. Q. 4. What is geosynchronous satellite? Ans. These satellite orbits in a circular pattern with an angular velocity equal to that of earth. Q. 5. Explain ITU? Ans. International Telecommunication Union. Q .6. Define Transponder. Ans. A microwave repeater, which receives, amplies, down converts and retransmits signals at a communication satellite. Q .7. Define Uplink. Ans. The earth station electronics and antenna which transmit information to a communication satellite. Q .8 Explain IFRB. Ans. International Frequency Registration Board. Q. 9. What is CCIR? Ans. International Radio Consultative Committee. Q .10 What is CCITT? Ans: International Telegraph and Telephone consultative Committee.

WIRELESS AND SATELLITE COMMUNICATION LAB MANUAL (ECE‐423‐F)
EXPERIMENT NO.2
AIM:-To establish an Audio-Video satellite link between Transmitter and Receiver.
APPARATUS REQUIRED: - Uplink Transmitter, Downlink Receiver, dish antennas, Transponder, monitor and connecting cables.
BRIEF THEORY: - The Uplink transmitter sends signals at an uplink frequency, which is higher than downlink frequency to avoid the interference. The quality of signal is much improved with active satellite specially when distances between transmitter and receiver are considerable.
BLOCK DIAGRAM :-
VCD PLAYER TRANSMITTER TRANSPONDER RECEIVER TV
PROCEDURE:- 1 Connect the satellite uplink transmitter to AC mains. 2 Switch on the transmitter by mains switch and frequency display will come on. 3 The transmitting frequency can be selected by up –down switch. The frequency can be changed from 1200 -1250-1300 MHz. 4 The transmitter on –off switch will switch on –off the transmission. 5 Connect X1 antenna to uplink transmitter with BNC –BNC cable. 6 Set the o/p gain of uplink transmitter to maximum. 7 Place downlink receiver at a distance of 5-7 m. 8 Connect the downlink receiver to the AC mains and switch it on by mains switch. 9 The downlink receiver frequency can be changed from 1100 -1150 -1200 MHz. 10 The downlink receiver also has tuning potentiometer, which can be used to tune any frequency from 950- 1500 MHz. 11 Keep the tuning POT fully anticlockwise. 12 The downlink receiver on –off switch will switch on –off the receiver. 13 Attach R2 antenna to the downlink receiver with BNC –BNC cables. 14 Align both the transmitter and receiver antenna in line. 15 Place a satellite transponder between transmitter and receiver at a distance of 5-7 m. 16 Connect the satellite transponder to the AC mains and switch it on by mains switch. 17 The receiver side of satellite Transponder has an on –off switch, which will switch off the receiver of the satellite. Similarly on –off switch on transmitter side will switch off transmitter of satellite. 18 Adjust transmitter uplink frequency to 1300 MHz and transponder receiver frequency also to 1300MHz. 19 Keep downlink frequency of Transponder to 1100MHz. 20 Keep the downlink receiver to 1100MHz. 21 Connect the Audio/Video signal at the input socket provided on the Uplink Transmitter, Video at video input and audio at audio 1 input. 22. Connect TV monitor to the Audio/Video o/p of downlink receiver. Set TV in AV mode.

WIRELESS AND SATELLITE COMMUNICATION LAB MANUAL (ECE‐423‐F)
23. The TV monitor will display video and audio signal that you have connected to uplink transmitter input.
RESULT: -The monitor display shows that a successful audio and video link has been establish between Transmitter and Receiver through satellite.
DISCUSSION: - The quality of signal is much improved with active satellite specially when distances
- 1. Connection should be tight. 2. Switch off power supply after performing the experiment.
between transmitter and receiver are considerable.
PRECAUTIONS:

WIRELESS AND SATELLITE COMMUNICATION LAB MANUAL (ECE‐423‐F) QUIZ:- Q.1What is PAL? Ans. Phase Alternate Line. The European color TV format which evolved from the American NTSC standard. Q.2 What is Pad? Ans. A concrete base upon which a supporting pole and antenna can be mounted. Q.3 What is Q Signal? Ans. One of two color video signal components used to modulate the color sub carrier. It represents the color range from yellow to green to magenta. Q.4 What is Raster? Ans. The random pattern of illumination seen on a television screen when no video signal is present. Q.5 What is SAW (Surface Acoustic Wave) filter? Ans. A solid state filter that yields a sharp transition between regions of transmitted and attenuated frequencies. Q.6 What is Reference signal? Ans. A highly stable signal used as a standard againsted which other variable signals may be compared and adjusted. Q.7 What is Vertical Blanking Pulse? Ans. A pulse used during the vertical retrace period at the end of each scanning field to extinguish illumination from the electron beam. Q. 8 What is the difference between TV transmission center and Satellite transmission center. Ans. TV transmitter transmits its signals in VHF/UHF range and Satellite transmitter uses SHF range. Q.10 What is the function of LNB? Ans. LNB is mounted on dish antenna so as to minimize the transmission losses, the these signals are sent to satellite receiver.

WIRELESS AND SATELLITE COMMUNICATION LAB MANUAL (ECE‐423‐F)
EXPERIMENT NO:3
AIM: - To Study Frequency Hopping Spread Spectrum (FHSS) Modulation and Demodulation Technique
APPRATUS REQUIRED: - Two Channel CDMA (DSSS and FHSS), 2 mm Banana cable, Oscilloscope
CIRCUIT DIAGRAM:-
BRIEF THEORY: - In Frequency Hoping Spectrum, available channel bandwidth is broken into a large number of non-overlapping frequency slots. Data is modulated onto time-varying, Pseudo random carrier frequencies. Transmitter “hops” between different narrowband Channels with centre frequency fi, and bandwidth B (instantaneous bandwidth). Spectrum BW (bandwidth) over which hopping occurs is called the total hopping. Data sent by hopping transmitter carrier to seemingly random channels which are known only to desired receiver. On each channel, data bursts are sent using conventional narrowband modulation hopping period/hop duration . There are generally two types of hopping schemes employed in FHSS
Fast Hopping: In this scheme the hopping rate is kept equal to or greater than the Data rate. The hopping rate should not be many time faster than the data rate. Generally it can be 2-3 times faster than the data rate.

WIRELESS AND SATELLITE COMMUNICATION LAB MANUAL (ECE‐423‐F) Slow Hopping: In this scheme the hopping rate is kept lower than the data rate. Also, the data rates which can be supported by FHSS system are quite lower than the data rates supported by DSSS systems.
PROCEDURE:-
1. Connect the power supply to ST2117 trainer board but do not switch ON the Power supply until all the connections is made.
2. Now connect ‘4 KHz’ clock signal from the ‘Clock Section’ to the ‘Data clock’ Socket of the ‘Clock Inputs’ section. This clock will drive the data generators.
3. Connect ‘8 KHz’ clock signal from the ‘Clock Section’ to the ‘PRNS Clock’ Socket of the ‘Clock Inputs’ section. This clock will drive PRN sequence Generators.
4. Connect inputs of the feedback XOR gate of ‘PRN Sequence 1’ to any two Sockets of the linear shift register.
5. Connect inputs of the feedback XOR gate of ‘PRN Sequence 2’ to any two Sockets of the linear shift register. Remember that these taping positions should be different from the one used in PRN sequence generator 2.
6. Connect ‘Data 1 O/P’ of ‘Data Generator 1’ to the ‘Data I/P’ of one of the two BFSK modulators under ‘Frequency Synthesis’ section. Connect the ‘PRNS 1 O/P’ of the ‘PRN Sequence 1’ generator to the input of Frequency synthesizer .
7. Connect ‘Data 2 O/P’ of ‘Data Generator 2’ to the ‘Data I/P’ of the second BFSK modulators under ‘Frequency Synthesis’ section. Connect the ‘PRNS 2 O/P’ of the ‘PRN Sequence 2’ generator to the input of second Frequency Synthesizer.
8. Now connect the output of BFSK modulators and frequency synthesizers to their respective modulators as indicated by the dashed lines.
9. Connect the outputs of the modulators to the respective inputs of the multiplexer.
10. Now switch ON the power supply.
11. Observe the data outputs of data generators and PRN sequence output of PRN sequence generators.
12. Observe the outputs of BFSK modulators and frequency synthesizers.
13. Observe the final multiplexed (composite) FHSS signal at the output of the multiplexer.
14. To demodulate the user data, connect the multiplexed FHSS signal to the input of FHSS demodulator.
15. Now apply the output of that frequency synthesizer for which the corresponding data has to be recovered from the multiplexed data.
16. Make rest of the connections as shown in the connection diagram.
17. Observe the final output and verify that the demodulator demodulates that channel data whose corresponding frequency synthesizer output is applied to the demodulator.
18. Follow the same procedure for slow hopping scheme by changing the data rate and PRN sequence rate as shown in the table above for slow hopping scheme.

WIRELESS AND SATELLITE COMMUNICATION LAB MANUAL (ECE‐423‐F) OBSERVATIONS DIAGRAM:-
CONCLUSION:-
1. The system efficiently multiplexes and demultiplexes the channels using separate PRN sequence driven Frequency synthesizer output for both the channels.
2. The receiver recovers the data of that particular channel, whose frequency synthesizer output is used for demodulation at the demodulator end.

WIRELESS AND SATELLITE COMMUNICATION LAB MANUAL (ECE‐423‐F) QUIZ:-
Q1:-What are the two common spread spectrum techniques used to transmit signals?
Ans:-Direct Sequence (DS) and Frequency Hopping (FH).
Q2: What is frequency Hopping method?
Ans:-The data signal is transmitted as a narrow band signal with a bandwidth only wide enough to carry the required data rate. At specific intervals, this narrow band signal is moved, or hopped, to different frequency within the allowed band. The sequence of frequencies follows a Pseudo - random sequence known to both the transmitter and receiver.
Q3:-What is direct Sequence Spread Spectrum?
Ans:-In Direct Sequence Spread Spectrum method, the signal is multiplied by a Pseudo random code sequence having a much faster bit rate. As a result, the bandwidth of the data signal gets spread. On the receiver side, this signal can then be multiplied with the same pseudo random sequence to demodulate the original data.
Q4:- Define Throughput?
Ans:-Throughput means what amount of data is actually carried by the system and is defined, as the average amount of data (per second) carried by the system.
Q5:-What is the rate of the system?
Ans:-The rate of a system is defined as the amount of data (per second) carried by a system when it is active.
WIRELESS AND SATELLITE COMMUNICATION LAB MANUAL (ECE‐423‐F)
EXPERIMENT NO: 4
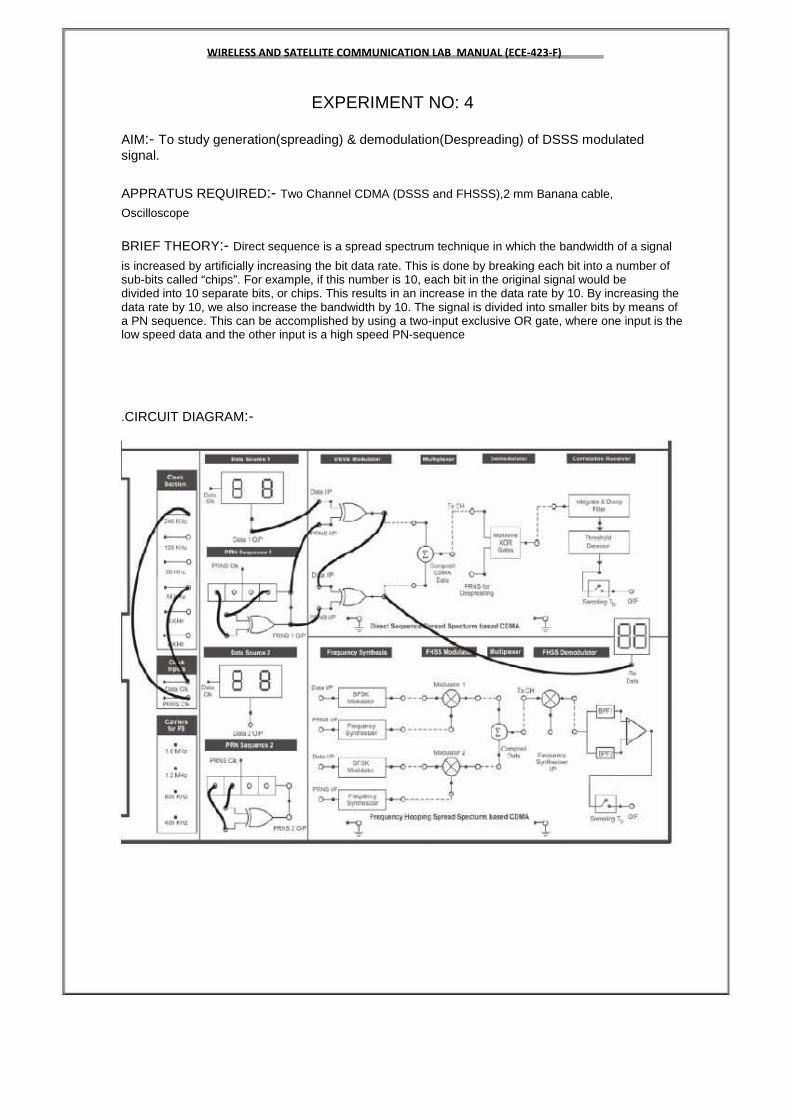
AIM:- To study generation(spreading) & demodulation(Despreading) of DSSS modulated signal.
APPRATUS REQUIRED:- Two Channel CDMA (DSSS and FHSSS),2 mm Banana cable, Oscilloscope
BRIEF THEORY:- Direct sequence is a spread spectrum technique in which the bandwidth of a signal is increased by artificially increasing the bit data rate. This is done by breaking each bit into a number of sub-bits called “chips”. For example, if this number is 10, each bit in the original signal would be divided into 10 separate bits, or chips. This results in an increase in the data rate by 10. By increasing the data rate by 10, we also increase the bandwidth by 10. The signal is divided into smaller bits by means of a PN sequence. This can be accomplished by using a two-input exclusive OR gate, where one input is the low speed data and the other input is a high speed PN-sequence
.CIRCUIT DIAGRAM:-

WIRELESS AND SATELLITE COMMUNICATION LAB MANUAL (ECE‐423‐F) PROCEDURE: -
DSSS Modulation:
1. Connect the power supply to the ST2117 trainer board
2. Now connect ‘16 KHz’ clock signal from the ‘Clock Section’ to the ‘Data Clock’ Socket of the ‘Clock Inputs’ section. This clock will drive the data generators.
3. Connect ‘240 KHz’ clock signal from the ‘Clock Section’ to the ‘PRNS Clock’ socket of the ‘Clock Inputs’ section. This clock will drive PRN sequence generators.
4. Connect inputs of the feedback XOR gate of ‘PRN Sequence 1’ to any two sockets of the linear shift register.
5. Connect ‘Data 1 O/P’ of ‘Data Generator 1’ to the ‘Data I/P’ of one of the two XOR gate under ‘DSSS Modulator’ section. Connect ‘PRNS I/P’ of the same gate to the ‘PRNS 1 O/P’ of the ‘PRN Sequence 1’ generator.
6. Now switch ON the power supply.
7. Check the data output and PRN sequence output using oscilloscope.
8. Observe the output of the XOR gate, which is used as the spreader, on the oscilloscope.
9. Change the data frequency to 8 KHz (or 16 KHz) and then observe the spreaded signal using oscilloscope.
10. Similarly change the PRN sequence clock frequency to 120 KHz (or 60 KHz)and then observe the output
DSSS Demodulation:-
1. Connect the spreaded data output from DSSS modulator (XOR gate) to the ‘Data I/P’ of the other XOR gate, which will be used here as DSSS-demodulator. Connect ‘PRNS I/P’ of this gate to the ‘PRNS 1 O/P’ of the ‘PRN sequence 1’ generator.
2. Observe the output of demodulator XOR gate.
3. Verify that the O/P of demodulator is same as the input data.
4. Repeat the same experiment with different data clock and PRN sequence clock and then verify the result with each combination. Also take care of the fact that the PRN sequence rate (chip rate) is kept many times higher than the data rate.

WIRELESS AND SATELLITE COMMUNICATION LAB MANUAL (ECE‐423‐F) OBSERVATIONS DIAGRAM: -
CONCLUSION:
1. Thus we conclude that the data can be spreaded by a PRN sequence using an XOR gate. Similarly Dispreading is done by again XORing the modulated Signal with the same PRN sequence used for spreading.
2. Spreading and Dispreading is done efficiently with different data rates and chip rates in a single user environment. The ratio of data rate to the chip rate is known as Processing Gain. In multi-user environment, the Processing gain should be high enough to recover the particular channel data.

WIRELESS AND SATELLITE COMMUNICATION LAB MANUAL (ECE‐423‐F) QUIZ:-
Q1:- What is the benefit of spread spectrum? Ans:-. It’s ideally suited to smooth out 'tone' interference or jamming, average over multi-path fading effects, and handle multi-user environments. Q2:-What is Processing Gain? Ans:-The ratio of data rate to the chip rate is known as Processing Gain. Q3:- What is Fast Hopping? Ans:- In this type of hopping, the hopping rate is kept equal to or greater than the data rate. The hopping rate should not be many time faster than the data rate. Generally it can be 2-3 times faster than the data rate. Q4:-what is slow hopping? Ans:-in this type of hopping, hopping rate is kept lower than the data rate. Q5:-What is Direct sequence is a spread spectrum technique Ans:- Direct sequence is a spread spectrum technique in which the bandwidth of a signal is increased by artificially increasing the bit data rate. This is done by breaking each bit into a number of sub-bits called “chips”.

WIRELESS AND SATELLITE COMMUNICATION LAB MANUAL (ECE‐423‐F)
EXPERIMENT 5
AIM:- To study radiation pattern &calculate beam width for Yagi uda & folded dipole antenna
APPARATUS REQUIRED: - RF Generator, Transmitting Mast, Receiving Mast, RF Detector, Matching Stub,Yagi Uda and folded diopole antenna.
BRIEF THEORY :
RF Generator Delivers a test signal to feed the antennas under test. The RF Generator operates at a frequency of 750 MHz approximately. The antenna is a reciprocal device, means it radiates or receives electromagnetic energy in the same way. Thus, although the radiation pattern is identified with an antenna that is transmitting power, the same properties would apply to the antenna even, if it was receiving power. Any difference between the received and radiated powers can be attributed to the difference between the feed networks and the equipment associated with the receiver and transmitter. The antenna radiates the greatest amount of power along its bore sight and also receives power most efficiently in this direction.
BLOCK DIAGRAM:
RF GENERATOR Transmitter Mast Receiver Mast RF detector
PROCEDURE:
1.Place the main unit on the table and connect power cord.
2.Adjust Level Potentiometer of RF generator to middle position. Select switch to ‘INT’ position and adjust Level
3. Select the switch to ‘FWD’ position and adjust FS ,ADJ Potentiometer to middle position.
4.Install Transmitting mast, place it beside the main unit and connect it to the .main unit’s ‘RF OUT’ using a BNC to BNC cable of 25” long.
5.Install Receiving mast and keep it at some distance from the Transmitter mast.
6.Place RF detector Unit beside the Receiving mast and connect it to the Receiving mast using a BNC to BNC cable of 25” long
7.Keep the base of Transmitting mast such that the ‘0’degree position of Goniometry should be directed towards the RF Detector and also align the marker of the mast with ‘0’ degree position.
8.Install Detector Antenna on the Receiving mast. Keep its direction towards the Transmitting mast by rotating it in counter clockwise direction.

WIRELESS AND SATELLITE COMMUNICATION LAB MANUAL (ECE‐423‐F) 9.Install folded Dipole Antenna on the Transmitting mast. Keep its direction towards the Receiving mast by rotating it in counter clockwise direction
10.Switch on the main unit and check the Display in DPM of Directional Coupler.
11.It will show some reading according to its level knob at starting.
12. Connect a +7.5 - 9V Adapter to the RF Detector unit, Switch it on and keep the Level knob at middle position. It will show some reading according to its level knob at starting. (In case of over loading, reduce it by level Potentiometer of RF detector)
13. Now vary the FS Adjust Potentiometer of Directional Coupler to make the display reading 100 Micro Amp and then adjust the Level of RF detector to show the ¾ reading of the main unit’s display.
14.Rotate the transmitting Antenna between 0-360 degrees and observe the display at RF Detector. The variation in reading indicates that the transmitter and receiver are working and radiation pattern is formed.
OBSERVATIONS:
Angles(in degree) Current (µA ) dB
GRAPH
WIRELESS AND SATELLITE COMMUNICATION LAB MANUAL (ECE‐423‐F) QUIZ:-
Q .1. What is Multiplexing?
Ans. Transmission of different signal in a form that these do not interfere with each other is termed multiplexing.
Q .2. What is Carson rule?
Ans. B=2(∆f +fm)
Q. 3. What is SCPC?
Ans. Single channel Per Carrier System.
Q. 4. Where it is used for?
Ans. It is used for earth stations with relatively few channels.
Q.5. What are advantage of SCPC?
Ans.It does not require expensive multiplexing and demultiplexing, hence cost reduced.
Q. 6. What is bit?
Ans. It is used for binary digit.
Q.7. What is baud?
Ans. It is unit of signaling speed.
Q.8. What is digital base band signal?
Ans. It is combination of logical ones and zero.
Q.9. What is orthogonal signal?
Ans. If inner product (Sr.Sj) =0
Q.10. What is ASK?
Ans. Amplitude Shift Keying.

WIRELESS AND SATELLITE COMMUNICATION LAB MANUAL (ECE‐423‐F)
EXPERIMENT 6
AIM:- To study radiation pattern & calculate beam width for circular & triangular patch. antenna
APPARATUS REQUIRED:- RF Generator, Transmitting Mast, Receiving Mast, RF Detector, Matching Stub, circular & triangular patch.
BRIEF THEORY :- RF Generator Delivers a test signal to feed the antennas under test. The RF Generator operates at a frequency of 750 MHz approximately. The antenna is a reciprocal device, means it radiates or receives electromagnetic energy in the same way. Thus, although the radiation pattern is identified with an antenna that is transmitting power, the same properties would apply to the antenna even, if it was receiving power. Any difference between the received and radiated powers can be attributed to the difference between the feed networks and the equipment associated with the receiver and transmitter. The antenna radiates the greatest amount of power along its bore sight and also receives power most efficiently in this direction.
BLOCK DIAGRAM:
RF GENERATOR Transmitter Mast Reciever Mast RF detector
PROCEDURE:
1.Place the main unit on the table and connect power cord.
2.Adjust Level Potentiometer of RF generator to middle position. Select switch to ‘INT’ position and adjust Level
3. Select the switch to ‘FWD’ position and adjust FS ,ADJ Potentiometer to middle position.
4.Install Transmitting mast, place it beside the main unit and connect it to the .main unit’s ‘RF OUT’ using a BNC to BNC cable of 25” long.
5.Install Receiving mast and keep it at some distance from the Transmitter mast.
6.Place RF detector Unit beside the Receiving mast and connect it to the Receiving mast using a BNC to BNC cable of 25” long
7.Keep the base of Transmitting mast such that the ‘0’degree position of Goniometry should be directed towards the RF Detector and also align the marker of the mast with ‘0’ degree position.
8.Install Detector Antenna on the Receiving mast. Keep its direction towards the Transmitting mast by rotating it in counter clockwise direction.

WIRELESS AND SATELLITE COMMUNICATION LAB MANUAL (ECE‐423‐F) 9.Install folded Dipole Antenna on the Transmitting mast. Keep its direction towards the Receiving mast by rotating it in counter clockwise direction
10.Switch on the main unit and check the Display in DPM of Directional Coupler.
11.It will show some reading according to its level knob at starting.
12. Connect a +7.5 - 9V Adapter to the RF Detector unit, Switch it on and keep the Level knob at middle position. It will show some reading according to its level knob at starting. (In case of over loading, reduce it by level Potentiometer of RF detector)
13. Now vary the FS Adjust Potentiometer of Directional Coupler to make the display reading 100 Micro Amp and then adjust the Level of RF detector to show the ¾ reading of the main unit’s display.
14.Rotate the transmitting Antenna between 0-360 degrees and observe the display at RF Detector. The variation in reading indicates that the transmitter and receiver are working and radiation pattern is formed.
OBSERVATIONS:
Angles(in degree) Current (µA ) dB
GRAPH:

WIRELESS AND SATELLITE COMMUNICATION LAB MANUAL (ECE‐423‐F) QUIZ:-
Q .1. Give another name of ASK.
Ans. OOK: - On Off Keying.
Q .2. What is PSK?
Ans. Phase Shift Keying.
Q. 3. What are main problems with comm. satellite reaching the orbit?
Ans. Launching and putting the satellite in to geostationary orbit maintaining it.
Q. 4. What is apogee?
Ans. The point where the satellite is farthest from the earth.
Q.5. What is perigee?
Ans.The point where satellite is closest from the earth.
Q. 6. What are look angle?
Ans. The look angles are the angles to which an earth station antenna must be pointed to communicate with the geosynchronous satellite.
Q.7. What is trace?
Ans. The movement of the electron beam from left to right on a television screen.
Q.8. What is threshold?
Ans. A minimal signal to noise input required to allow a video receiver to deliver an acceptable picture.
Q.9. What is thermal noise?
Ans. Random, undesired electrical signals caused by molecular motion, known more familiarly as noise.
Q.10. UHF stands for.
Ans. Ultraviolet High Frequency.

WIRELESS AND SATELLITE COMMUNICATION LAB MANUAL (ECE‐423‐F)
EXPERIMENT NO. 7
AIM:- Study of Data and PN Sequence Generation
APPARATUS REQUIRED:- Two Channel CDMA (DSSS and FHSS) Trainer ST2117, 2 mm Banana cable, Oscilloscope
THEORY :- A Pseudo-random Noise (PN) sequence is a sequence of binary numbers, e.g. ±1, which appears to be random; but is in fact perfectly deterministic. A software or hardware device designed to produce a PN sequence is called a PN Generator. Pseudo-random noise sequences or PN sequences are known Sequences that exhibit the properties or characteristics of random sequences. They can be used to logically isolate users on the same frequency channel. They can also be used to perform scrambling as well as spreading and dispreading functions. The reason we need to use PN sequences is that if the code sequences were deterministic, then everybody could access the channel. If the code sequences were truly random on the other hand, then nobody, including the intended receiver, would be able to access the channel
CIRCUIT DIAGRAM:-

WIRELESS AND SATELLITE COMMUNICATION LAB MANUAL (ECE‐423‐F) PROCEDURE: - 1. Connect the power supply mains cord to the ST2117, but do not turn on the power supply until connections are made for this experiment. 2. From Clock Section, connect 16 KHz Clock output to Data Clock input (Clock inputs). 3. Switch ON the power supply. 4. Observe data output of Data Source 1 on LED display given on-board and verify that correct data output is shown in LED display 5. Change input data through BCD switches and observe the output of Data Source1 6. Observe the data pattern on CRO screen. The data output is a repeating 8 bit serial sequence of the input data selected through BCD switches. 7. Change the clock input to 8 KHz or 4 KHz and then observe the data output. 8. The same sequence of experimental operation can be repeated with Data source 2 9. Connect slot B and Slot D of PRN Sequence 2 to input of XOR (Exclusive OR Gate) of PRN Sequence 2. 10. Connect oscilloscope CH1 to Data 1 O/P (output) and CH2 to PRNS 1 O/P. 11. Rotate the BCD switches of Data Source 1 to set data and observe the Data output wave form. 12. Connect Data 1 O/P to RX Data (Received Data) and observe data directly on display. 13. Connect oscilloscope CH1 to Data 2 O/P (output) and CH2 to PRNS 2 O/P. 14. Rotate the BCD switches of Data Source 2 to set data and observe the Data output waveform. 15. Connect Data 2 O/P to RX Data (Received Data) and observe data directly on display.
OBSERVATION DIAGRAM:-
CONCLUSION:
1. The data output of Data Sources are correct as per the input applied through BCD switches 2. The data output is appearing correctly with different data clock applied and the result is also verified on LED display given on board.

WIRELESS AND SATELLITE COMMUNICATION LAB MANUAL (ECE‐423‐F) QUIZ:-
Q1:- Define CDMA? Ans: - Code division Multiple Access technique
Q2:-Define Process Gain? Ans:-the process gain is defined as the difference between the output and input signal to noise ratio Q3:-Write the equation for process gain? Ans: - Process gain, Gp =BWrf Rinf
Q4:-What is the advantage of CDMA over other technique? Ans:- CDMA offers key advantage of flexible allocation of resources. There is no strict limit on number of users that can be supported.
Q5:- What are the basic properties of PN sequences? Ans:- Balance Property, Run Property, Correlation Property

WIRELESS AND SATELLITE COMMUNICATION LAB MANUAL (ECE‐423‐F)
EXPERIMENT NO :8
AIM: To study GPS data like longitude, latitude using GPS receiver.
APPARATUS REQUIRED : ST 2276 Kit, Connector, Power Supply, Software.
BRIEF THEORY : Earth Shape :A significant problem when using the GPS system is that there are very many coordinate systems worldwide. As a result, the position measured an calculated by the GPS system does not always coincide with one's supposed position. In order to understand how the GPS system functions, it is necessary to take a look at the basics of the science that deals with the surveying and mapping of the Earth surface, geodesy. Without this basic knowledge, it is difficult to understand why with a good portable GPS receiver the right combination has to be selected from more than 100 different map reference systems. If an incorrect choice is made, a position can be out by several hundred meters. Different Earth Shapes like : 1. Geoids 2. Spheroid 3. Worldwide reference ellipsoid WGS-84 Format of latitudes and longitudes :Where a numeric latitude or longitude is given, the two digits immediately to the left of the decimal point are whole minutes, to the right are decimals of minutes, and the remaining digits to the left of the whole minutes are whole degrees. Eg. 4533.35 is 45 degrees and 33.35 minutes. ".35" of a minute is exactly 21 seconds. Eg. 16708.033 is 167 degrees and 8.033 minutes. “.033” of a minute is about 2 seconds.
BLOCK DIAGRAM: GPS Satellite

WIRELESS AND SATELLITE COMMUNICATION LAB MANUAL (ECE‐423‐F) RECIEVER SATELLITE BLOCK DIAGRAM
PROCEDURE : Following steps has to be perform while doing the experiments. 1. Please go through the manual before performing any practical. 2. Install the software from the CD ie. Open WinZip from the CD and run the setup file. If you don't have WinZip then please install WinZip from the CD itself. 3. Connect mains cord to the trainer ST2276. Don't switch on the system now. 4. Connect serial cable to the port which is available on the trainer. Connect 5. another end of the cable to PC serial port (COM1, COM2, COM3 etc.). 6. Connect the patch antenna to SMA (subminiature) connector of the ST2276 trainer. 7. Place the antenna in the open space ie. Place the antenna outside the window. 8. Switch on the trainer ST2276. 9. Open software from start / program file /GPS Diag. Now click on option like COM1, if it is not possible to detect then check your PC com port. If your PC com port is COM2 then click COM2 in the software. As soon as you click on any of these com port according to your PC the software will start displaying some signals.
OBSERVATION TABLE
Latitude Longitude City State Country
PRECAUTION:
1. switch off the power while placing the antenna at different location. 2. Do touch the antenna while taking the reading
CONCLUSION: - The latitude, longitude of the city is calculated while placing the antenna at different location
WIRELESS AND SATELLITE COMMUNICATION LAB MANUAL (ECE‐423‐F)
QUIZ:- Q.1 What is blanking signal? Ans. Pulses used to extinguish the scan illumination during horizontal and vertical retrace periods. Q.2 What is board band? Ans. A device that processes a signal spanning a relatively board range of input frequencies. Q.3 What is clamp circuit? Ans. A circuit that removes the dispersion waveform from the downlink signal. Q.4 What is Conus? Ans. An abbreviation for the continental United States. Q.5 What is Composite Video Signal? Ans. The complete video signal consisting of the chrominance and luminance information as well as all sync and blanking pulses.

WIRELESS AND SATELLITE COMMUNICATION LAB MANUAL (ECE‐423‐F)
EXPERIMENT NO :9
AIM :TO Study of Minimum Shift Keying Modulation Process
APPARATUS REQUIRED: ST2116, MSK modulation /Demodulation Trainer Board, Cathode Ray Oscilloscope, 2MM Patch Cords.
BLOCK DIAGRAM :
Refer to the following figure to configure setup for the present experiment:
PROCEDURE :
1. Before making connections, make sure that power supply is switched off. 2. Refer to the figure 14 shown above while making connections. 3. Connect 16 KHz clock output of clock source to the data generator’s ‘CLK IN’ input. 4. Connect the ‘Data Out’ of data source to the ‘Data In’ of serial to parallel converter. 5. Connect 8 KHz clock out of clock source to the ‘CLK In’ of serial to parallel converter. 6. Now connect ‘Cos πt/2T’ and ‘Sin πt/2T’ output of ‘sinusoidal carrier for pulse shaping generator’ to the inputs of ‘Sin pulse shaper’ and ‘Cosine pulse shaper’. 7. Connect the Sine and Cosine carrier outputs of ‘sinusoidal carrier generator for modulation’

WIRELESS AND SATELLITE COMMUNICATION LAB MANUAL (ECE‐423‐F) block (32 KHz) to the carrier inputs of the modulators as shown above in the figure 15. 8. Now turn ‘On’ the Power supply and reset the data source. 9. Repeat the steps 4 to 14 of the Exp.1 and obtain the different waveforms. 10. Now observe the outputs of the multipliers. Compare these results with the theoretical diagram shown in figure 5. 11. Observe the output of the adder block. This is the complete MSK signal waveforms (See figure 16 given below). 12. View both the serial data and modulated signal simultaneously on the CRO screen. Make the waveforms stable by adjusting the time base of the CRO. Observe the frequency shift in the modulated waveform. Also this shift is much lesser then generally seen in an FSK waveform. By our intuitive observation of the modulated signal we can immediately make some conclusions such as the modulated waveform is not having any abrupt phase changes as was seen in BPSK, QPSK and OQPSK which assures that the modulated waveform does not contain very high frequency contents and also the frequency shift is very low. All these features suggest the improvements in the bandwidth of the Modulated signal. 13. Verify the phase continuity of the MSK waveform. Also verify that the modulated waveform has almost constant envelop.
OBSERVATION
RESULT: The MSK modulated wave form has observed

WIRELESS AND SATELLITE COMMUNICATION LAB MANUAL (ECE‐423‐F)
QUIZ:
Q.1 Define AFC?
Ans. A circuit which locks an electronic component in to a chosen frequency.
Q.2 Define AGC?
Ans. A circuit that uses feedback to maintain the o/p of an electronic component at a constant level.
Q.3 What is Back Porch?
Ans. That portion of the horizontal blanking pulse that follows the trailing edge of the horizontal sync pulse.
Q.4 What is Bird?
Ans. Jargon or nickname for communication satellite.
Q.5 What is blanking pulse level?
Ans. The reference level for video signal. The blanking pulses must be aligned at the i/p to the picture tube.

WIRELESS AND SATELLITE COMMUNICATION LAB MANUAL (ECE‐423‐F)
EXPERIMENT :10
AIM :Study of Minimum Shift Keying (MSK) Demodulation Process
APPARATUS REQUIRED: ST2116, MSK modulation /Demodulation Trainer Board, Cathode Ray Oscilloscope, 2MM Patch Cords.
BLOCK DIAGRAM :
Refer to the following diagram to configure your setup for the present experiment Setup for
PROCEDURE : 1. Make the connections for modulation as described in the Experiment 1 and 2. refer to the figure 15 and figure 16 for making connections. 2. For Demodulation connect the modulated signal to the input of demodulator. 3. Connect the orthogonal sinusoidal carriers to the input of the first stage of multipliers. 4. Connect the Wave shaping carriers to the second stage of multipliers. 5. Now turn ‘On’ the power supply. 6. Reset the data source and observe the MSK modulated waveform at the modulator Output. 7. Observe the outputs of first stage of multipliers in the demodulator section. 8. Observe the output of Second stage of multipliers in the demodulator section. 9. Observe the output of integrators and try to make some inferences from these waveforms.

WIRELESS AND SATELLITE COMMUNICATION LAB MANUAL (ECE‐423‐F) 10. Finally observe the output of parallel to serial converter and compare this recovered data with original modulating data. Verify that recovered data is received without any error.
OBSERVATION:-
RESULT: The MSK demodulated wave form has observed

WIRELESS AND SATELLITE COMMUNICATION LAB MANUAL (ECE‐423‐F)
QUIZ:- Q .1. Define VSWR. Ans. The ratio between the minimum and maximum voltage on a transmission line. Q .2. What is the Up converter? Ans. A device that increases the frequency of a transmitted signal. Q. 3. Define Trace. Ans. The movement of the electron beam from left to right on a television screen. Q. 4. What is threshold? Ans. A minimal signal to noise input required to allow a video receiver to deliver an acceptable picture. Q.5. What isVTO (Voltage Tuned Oscillator)? Ans.An electronic circuit whose o/p oscillator frequency is adjusted by voltage. Q. 6. What is Splitter? Ans. A device that takes a signal and splits it in to two to more identical but lower power signals. Q.7. What is Tap? Ans. A device that channels a specific amount of energy out the main distribution system to a secondary outlet. Q.8. PSD stands for. Ans. Polarity Selection Device. Q.9. What is Raster? Ans. The random pattern of illumination seen on a television screen when no video signal is present. Q.10. What is Hum Bars? Ans. A form of interference seen as horizontal bars or black regions passing across the field of a television.

WIRELESS AND SATELLITE COMMUNICATION LAB MANUAL (ECE‐423‐F) DISCUSSION: - Three separate signals can be successfully transmitted using satellite comm. link.
PRECAUTIONS: - 1. Connection should be tight.
2. Switch off power supply after performing the experiment.
QUIZ:-
Q.1 What is cross modulation?
Ans. A form of interference caused by the modulation of one carrier affecting that of another signal.
Q.2 What is Dc power Block?
Ans. A device which stops the flow of dc power but permits passage of higher frequency ac signals.
Q.3 What is Detent Tuning?
Ans. Tuning in to a satellite channel by selecting a preset resistance.
Q.4 What is Domsat?
Ans. Abbreviation for domestic communication Satellite.
Q.5 What is Drifting?
Ans. An instability in a preset voltage, frequency or other electronic circuit parameter.
Q.6 What is Elevation Angle?
Ans. The vertical angle measured from the horizontal up to a targeted Satellite.
Q.7 Define F/D Ratio?
Ans. The ratio of an antenna's focal length to diameter. It describes antenna “depth ˝.
Q.8 What is Inclinometer?
Ans. An instrument used to measure the angle of elevation to a satellite from the surface of the earth.
Q.9 What is Insertion Loss?
Ans. The amount of signal energy lost when a device is inserted in to a communication line. Also known as feed – through loss.
Q. 10 Define INTELSAT?
Ans. The International Telecommunication Satellite Consortium, a body of 154 countries working towards a common goal of improved worldwide satellite communications

)
DATA COMMUNICATION
(ECE‐427‐F)
LAB MANUAL
VII SEMESTER

DATA COMMUNICATION LAB (EE‐427‐F)
LIST OF EXPERIMENTS
S. No NAME OF THE EXPERIMENT Page No.
1.
2.
3.
4.
5.
6.
7.
8.
9.
10.
11.
12.
13.
14.
To study different types of transmission media.
To study quadrature phase shift keying modulation.
Study & analysis of QAM modulation.
To study serial interface RS– 232.
To study pc to pc communication using parallel port.
To study LAN using star topology.
To study LAN using bus topology.
To study LAN using tree topology.
To study configure modem of computer
To configure hub/switch.
To study interconnections of cables for data communication.
To study fiber optic communication.
To study wireless communication.
To study pc-pc communication using LAN.
2
5
10
14
17
19
22
25
27
30
32
36
40
42
LAB MANUAL (VII SEM ECE) Page 2

DATA COMMUNICATION LAB (EE‐427‐F)
EXPERIMENT NO. 1
AIM: - To Study Different Types of Transmission Media
THEORY: - Transmission Media - Guided
There are 2 basic categories of Transmission Media: Guided and Unguided.
Guided Transmission Media uses a "cabling" system that guides the data signals along a specific path. The data signals are bound by the "cabling" system. Guided Media is also known as Bound Media. Cabling is meant in a generic sense in the previous sentences and is not meant to be interpreted as copper wire cabling only.
Unguided Transmission Media consists of a means for the data signals to travel but nothing to guide them along a specific path. The data signals are not bound to a cabling media and as such are often called Unbound Media.
There 4 basic types of Guided Media:
•
•
•
•
Open Wire
Twisted Pair
Coaxial Cable
Optical Fiber
Coaxial cables have a copper wire running through the middle encased in plastic insulation. The plastic insulation is itself encased in a metal braid which is covered by an outer layer of plastic insulator. The electrical signals run through the central wire and the metal braid acts as both an earth and as a shield against electromagnetic interference.
DIAGRAM
A BNC connector on a network card
LAB MANUAL (VII SEM ECE) Page 3

DATA COMMUNICATION LAB (EE‐427‐F)
Coaxial cables are connected to devices by means of a special plug with a bayonet connection. This is called a BNC plug.
Fiber optic cables have a thin strand of glass in the centre that carries the light pulses.
Cable Type Open Cable
Twisted Pair
Coaxial Cable
Optical Fiber
Bandwidth 0 - 5 MHz
0 - 100 MHz
0 - 600 MHz
0 - 1 GHz
Transmission Media - Unguided Unguided Transmission Media is data signals that flow through the air. They are not guided or bound to a channel to follow. They are classified by the type of wave propagation.
RF Propagation There are 3 types of RF (Radio Frequency) Propagation:
•
•
•
Ground Wave,
Ionospheric and
Line of Sight (LOS) Propagation.
Ground Wave Propagation follows the curvature of the Earth. Ground Waves have carrier frequencies up to 2 MHz AM radio is an example of Ground Wave Propagation.
LAB MANUAL (VII SEM ECE) Page 4

DATA COMMUNICATION LAB (EE‐427‐F)
RESULT: - Thus different types of transmission media are studied
QUESTION /ANSWERS:- Q1.What are the four basic types of guided media? A1. Open wire, twisted pair, Coaxial cable and optical fiber.
Q2.Give three advantage of optical fiber? A2.Higher bandwidth, less attenuation, and immunity to electromagnetic interface
Q3.What are the disadvantages of optical fiber? A3. Installation / maintenance, Unidirectional, and cost
Q4.What are the application of twisted pair cable? A4.They are used in telephone lines, DSL line, and Local area network.
Q5.What is the applications of fiber optical cable? A5.The fiber optical cable is used in cable TV, local area network Wide band network
Q6.What are the different types of propagation modes in optical fiber? A6. The different types of propagation modes are multimode step and graded Index, single mode
Q7.What is the frequency range of microwave? A7.The frequency range of microwave is 1 and 300 GHz
Q8. What is max data capacity for optical fiber cable? A8.1000 mbps
Q9.Define ground wave propagation? A9. The propagation which follow the curvature of the earth. They carry frequencies up to 2Mhz. AM is an example of Ground waves
Q10.Give two examples of unguided media? A10.the two examples of unguided media are Wireless and Radio waves
LAB MANUAL (VII SEM ECE) Page 5

DATA COMMUNICATION LAB (EE‐427‐F)
EXPERIMENT NO – 2
AIM: - To Study Quadrature Phase Shift Keying Modulation.
APPARATUS REQUIRED: - CRO, experimental kit, power supply, connecting leads.
BRIEF THEORY:-
PSK: - PSK involves the phase change at the carrier sine wave between 0 to 180 in accordance with the data stream to be transmitted.
PSK modulator is similar to ASK modulator both used balanced modulator to multiply the carrier with balanced modulator signal. The digital signal with applied to modulation input for PSK generation is bipolar i.e. equal positive and negative voltage level.
When the modulating input is positive the output at modulator is a line wave in phase with the carrier input whereas for positive voltage level, the output of modulator is a sine wave which is switched out of phase by 180 from the carrier input.
Quadrature Phase-shift Keying (QPSK) QPSK: - In QPSK each pair at consecutive data bit is treated as a two bit code which is switch the phase of the carrier sine wave between one at four phase 90º apart. The four possible combinations at bib it code are 0º, 01, 10, and 11 each code represents either a phase of 45º, 185º, 225º, and 315º lagging, relative to the phase at the original un modulated carrier QPSK offers an advantage over PSK is a no carrier that how each phase represents a two bit code rather than a single bit. This means that either we can charge phase per sec. or the same amount of data can be transmitted with.
Constellation diagram for QPSK with Gray coding. Each adjacent symbol only differs by one bit.
Sometimes known as quaternary or quadriphase PSK or 4-PSK, QPSK uses four points on the constellation diagram, equispaced around a circle. With four phases, QPSK can encode two bits per symbol, shown in the diagram with Gray coding to minimize the BER — twice the rate of BPSK. Analysis shows that this may be used either to double the data rate compared to a BPSK system while maintaining the bandwidth of the signal or to maintain the data-rate of BPSK but halve the bandwidth needed.
LAB MANUAL (VII SEM ECE) Page 6

DATA COMMUNICATION LAB (EE‐427‐F)
Although QPSK can be viewed as a quaternary modulation, it is easier to see it as two independently modulated quadrature carriers. With this interpretation, the even (or odd) bits are used to modulate the in-phase component of the carrier, while the odd (or even)
bits are used to modulate the quadrature-phase component of the carrier. BPSK is used on both carriers and they can be independently demodulated
BLOCK DIAGRAM:-
Carrier Generator
Carrier Modulation Circuit
Data Generator
Unipolar to Bipolar Converter Summing
amplifier CRO
Quadrature Carrier Generator Carrier
Modulation Circuit
Data Generator
Unipolar to Bipolar Converter
Block diagram of QPSK
LAB MANUAL (VII SEM ECE) Page 7

DATA COMMUNICATION LAB (EE‐427‐F)
PROCEDURE:- 1. Keep pins SW3, SW5, SW6, SW7, and SW9 in off mode
2. Switch on the power supply
3. Connect the Test point TP6 on Channel 1& TP7 on Channel 2 of Oscilloscope
4. Set I&Q Channel data with the help of DIP switch SW5, SW6, SW7.
5. Switch on all the DIP switches on SW3.
6. Press SW8 (reset) Switch and then Press SW4 (start) Switch
7. Connect channels of oscilloscope to TP2 & TPI
8. Observe the wave form on the CRO
WAVE FORM:-
RESULT: - QPSK output is obtained on CRO
QUESTION /ANSWERS:- Q1: .In digital communication, why PCM (Pulse Code Modulation) is preferred than PAM (Pulse Amplitude Modulation). A1. (i) PCM is free from noise in interfering signals. It is also coded electrical signal. (ii) It permits use of repeater for long distance transmission.
Q2.Define Pulse Amplitude Modulation: A2.Amplitude of the pulse varies in accordance with the modulating signal
LAB MANUAL (VII SEM ECE) Page 8

DATA COMMUNICATION LAB (EE‐427‐F)
Q3. Define Pulse Position Modulation. : A3 Time of rise or fall of the pulse changes with the modulating signal
Q4. Define QAM?
A4. It is the form of modulation where the digital information is contained in both the amplitude and phase of the transmitted carrier
Q5. Define the bandwidth efficiency?
A5. Band width efficiency = Transmission rate (bps)/ Minimum band width (Hz)
Q6. Define QPSK - Quadrature Phase Shift Keying A6.Quadrature Phase Shift Keying employs shifting the phase of the carrier plus an encoding technique. QPSK is used in almost all modems. The digital information is encoded using 4 (Quad) level differential PSK. The data is encoded as follows:
DIBIT 00 01 10 11
PHASESHIFT +90 0 180 270
Q7. What are the three basic type of modulation technique used in modems? A7.The 3 basic types of modulation used in modems: o FSK - Frequency Shifted Keying o QPSK - Quadrature Phase Shifted Keying o QAM - Quadrature Amplitude Modulation
Q8.Write the truth table of QPSK
LAB MANUAL (VII SEM ECE) Page 9

DATA COMMUNICATION LAB (EE‐427‐F)
BINARY OUTPUT QI 00 01 10 11
Q9.What is another name of Quadrature PSK? A9. Quaternary Phase shift keying.
QPSK OUTPUT PHASE
-1350 -450 1350 450
Q10. What does the word Quaternary Signify? A10. Quaternary means “4” .QPSK is a M_ary encoding technique where M=4
LAB MANUAL (VII SEM ECE) Page 10

DATA COMMUNICATION LAB (EE‐427‐F)
EXPERIMENT NO – 3
AIM: - Study & Analysis of QAM Modulation. APPARATUS: - QAM kit, DATA GENERATOR kit, connecting leads and power cord
THEORY:
Quadrature Amplitude Modulation (QAM) The QAM is a digital modulation where the information is contained into the phase as well as the amplitude of the transmitted carrier.
8-QAM: In the 8-QAM the data are divided into groups of 3 bits (Tribit), one of which varies the amplitude of the carrier, the last two the phase. The modulated signal can take 4 different phases and 2 different amplitudes, for a total of 8 different states. 16-QAM:
In the 16-QAM the data are divided into groups of 4 bits (Quad bit). The 16 possible combinations change amplitude and phase of the carrier, which can take 16 different states .At the moment we reach to a data subdivision into groups of 9 bits, obtaining constellations with 512 modulation points.
Main aspects
The main aspects characterizing the QAM are:
Applications in modems for high speed data transmission (ITU-TV22bis, V29, V32, V32bis, V33, V34, V34bis, BELL 209) and digital radio transmission. It needs circuits of high complexity
Possibility of error higher than the PSK called Fb the bit transmission speed and "n" the number of bits. Considered for the modulation, the minimum spectrum BW of the modulated signal is equal to Ft/n
LAB MANUAL (VII SEM ECE) Page 11

DATA COMMUNICATION LAB (EE‐427‐F)
The transmission efficiency, defined as the ratio between Fb and B w, is equal to "nil
Modulator QAM: The functional diagram of a 8-QAM modulator,
Input 24 bit Data
I Channe l
Q Channe l
QAM Output
The 8-QAM signal can be seen as 4-PSK signal whose amplitude can take 2 different values. In this way, each "modulation interval" depends on the state of 3 data bits ("I", "Q", "C"): the first 2 ("I" and "Q") determine the phase of the output signal, the third ("C") the amplitude. PROCEDURE:
7. Switch ON all the DIP switches on SW3.
LAB MANUAL (VII SEM ECE) Page 12
1. Ensure the following initial conditions on ST2112 trainer:
2. SW3, SW5, SW6, SW7, SW9 should be in the OFF mode.
3. Power supply should be OFF. 4. Switch on the power supply. 5. Connect Test point TP6 on Channel 1 & TP7 on Channel 2 of Oscilloscope; you will observe 1 KHz sine & cosine wave.
6. Set I, Q & C Channel data with the help of DIP switch SW5, SW6, SW7. As there are 24 bits data available on the trainer so, first bit is I bit then second bit is Q bit then third bit is C bit. In this experiment you have to use I bit & Q bit & C bit so you can select combination according to your requirement.

DATA COMMUNICATION LAB (EE‐427‐F)
8. Now press SW8 which is reset switch then press SW4 which is start.
9. Now Channel 1 of Oscilloscope to TP2 & Channel 2 to TP 1, you can observe Clock & Data which you have set. ( if you are using logic analyzer then you are able to see all 24 bits)
10. Now to observe QAM modulated signal with respect to data, connect Channel l to TP I & Channel 2 to TP9. 11. You can add noise by using DIP switch SW9 (001/010/111)
12. Turn OFF the power.
a) ClOCK AND DATA:-
TP2
TP3
b.) I CHANNEL AND MODULATED SIGNAL:-
TP2
TP3
RESULT: QAM has been studied and waveform has been drawn
LAB MANUAL (VII SEM ECE) Page 13

DATA COMMUNICATION LAB (EE‐427‐F)
QUESTIONS/ANSWERS:
Q1.What does QAM stand for A1.Quadrature –Amplitude Modulation
Q2.In how many groups the data is divided in 8 QAM A2. Data is divided into three groups
Q3.What is the bit rate of individual group in 8 QAM A3. The bit rate is divided into one –third of the incoming data rate
Q4.What level of converter is used in I and Q channel? A4.2to 4 level converter is used in I and Q channel
Q5.What is the difference between 8 QAM and 16 QAM? A5.In 16 QAM m-array M=16 and in 8QAM M= 8
Q6.In how many groups the data is divided 16 QAM A6. Data is divided into four groups
Q7. What is the bit rate of individual group in 16 QAM? A7. The bit rate of a 16 –QAM is divided into one-fourth of the incoming data rate
Q8. Define Band with efficiency A8.transmission Bit rate/ minimum band width
Q9.How many 2 to 4 level converter is used in 16 QAM A9.Two 2 to 4 level converter is used in 16 -QAM
Q10. Different parts of communication System? A10. There are three parts of communication System: a) The information b) Medium c) The carrier
LAB MANUAL (VII SEM ECE) Page 14

DATA COMMUNICATION LAB (EE‐427‐F)
EXPERIMENT NO – 4
AIM: - To Study Serial Interface using Rs - 232.
APPRATUS REQUIRED: - Data Communication Kit
THEORY: - Introduction to Serial Communications
All IBM PC and compatible computers are typically equipped with two serial ports and one parallel port. Although these two types of ports are used for communicating with External devices, they work in different ways
A parallel port sends and receives data eight bits at a time over 8 separate wires. This allows data to be transferred very quickly; however, the cable required is more bulky because of the number of individual wires it must contain. Parallel ports are typically used to connect a PC to a printer and are rarely used for much else. A serial port sends and receives data one bit at a time over one wire. While it takes eight times as long to transfer each byte of data this way, only a few wires are required. In fact, two-way (full duplex) communications is possible with only three separate wires - one to send, one to Receive and a common signal ground wire. RS-232 stands for Recommend Standard number 232 and C is the latest revision of the standard. The serial ports on most computers use a subset of the RS-232C standard. The full RS-232C standard specifies a 25-pin "D" connector of which 22 pins are used. RS-232-C is divided into four groups
•
•
•
•
Data Signal
Control Signal
Timing Signal
Ground Signal
DIAGRAM:
25 Pin Connector on a DTE device (PC connection)
Male RS232 DB25
Pin Number
LAB MANUAL (VII SEM ECE) Page 15

DATA COMMUNICATION LAB (EE‐427‐F)
9 Pin Connector on a DTE device (PC connection)
Male RS232 DB9
PIN DIAGRAM OF RS-232
ADVANTAGES: It is applicable for long distance.
DISADVANTAGE: - Comparatively low speed.
RESULT: Thus studied RS – 232 standards.
LAB MANUAL (VII SEM ECE) Page 16

DATA COMMUNICATION LAB (EE‐427‐F)
Question/Answers Q1. Name different types of serial interfaces. A1. RS 232, RS449, RS- 423A etc.
Q2. How many pins RS – 232 consists of? A2. It consists of 25 pins.
Q3. Give the full form of RS. A3. It is Recommended Standard
Q4. What are the advantages of Rs – 232? A4. 1. It provides specific range of voltages for transmit and receive signals. 2 It can transmit and receive asynchronous and synchronous data.
Q5. State any two differences between Rs 232 and RS 449? A5.1 RS 232 is 25 pin interfaces while RS 449 is 37 pin interfaces 2 RS 232 specifies electrical, mechanical and functional specifications. While RS 449 outlines mechanical and functional standards
Q6.What is the drawbacks of RS – 232? A6. Distance Limitation and speed.
Q7.Which are the data pins of RS 232? A7 .Pin number 2,3,14 and 15.
Q8. Which are the timing pins of RS -232? A8. Pin number 15, 17 and 24 are timing pin
Q9. Which are the unassigned pins of Rs – 232? A9. Pin number 9, 10, 11, 18 and 25
Q10. How many pins of RS 232 are unassigned? A10. 5
LAB MANUAL (VII SEM ECE) Page 17

DATA COMMUNICATION LAB (EE‐427‐F)
EXPERIMENT NO – 5
AIM: - To Study PC to PC communication uses Parallel port.
APPARATUS REQUIRED:
ST5001 Trainer Kit, ST5001 Software, 11 Patch Cords (2mm), 2 Parallel Port Cables, Mains Power Cord
PROCEDURE:-
1. 2. 3.
4.
5.
Connect mains power cord to the trainer and switch ON the trainer. Connect the parallel port cables to both node l & node 2. To open the window, follow the steps. Run ST5001 software on both PCs
Click "Parallel Port Interface" image/press "Ctrl + P"/click "Options" on menu bar.
The very first· step is to select the port address of parallel port. Choose one correct option from the given three options.
Generally the address is "378", so the window will open with this option selected.
LAB MANUAL (VII SEM ECE) Page 18

DATA COMMUNICATION LAB (EE‐427‐F)
6.
7.
8.
9.
To send data to other node enter the text in the window titled as "Enter Data to Transmit". Click on "Send" button to transmit.
Transmitted data will be displayed in the "Received Data" window and the ASCII codes of each byte received is displayed in "Received Data in ASCII" window. A small window at sender side is given for transmission of ASCII code. Enter an ASCII code in the window and then click "Send" button. "Clear" buttons are given to clear all windows.
RESULT: - The parallel port has been studied.
QUESTION/ANSWERS:
Q. 1. What is parallel Interface? A1. It is the device through which 8 or more bits can be transmitted at a time. Q2. What are different types of parallel Interfaces? A2. These are Centronics, IEEE 488 etc. Q3. What is full form of GPIB? A3. General purpose Interface Bus. Q4. What is the advantage of parallel Transmission over serial transmission? A4. Data are transmitted faster than with serial interface. Q5.How many pins are there in Centronics A5. 36 pins Q6.Give one application of Centronics? A6.It is used in printers. Q7.What is the disadvantage of parallel transmission? A7.Higher transmission cost for transmission lines, especially when there are long distances between the transmitter and receiver. Q8.What does the term STB stand for? A8.STROBE Q9.What does the term AF stand for? A9.Auto feed Q10.What is the function for PRIME A10. It is an active low signal outputted by the computer to clear the printer memory, including the printer programming and the printer buffer.
LAB MANUAL (VII SEM ECE) Page 19

DATA COMMUNICATION LAB (EE‐427‐F)
EXPERIMENT NO – 6
AIM: - To Study LAN using Star Topology.
APPRATUS REQUIRED: - Four to Five computers, cables
THEORY: -
LAN: When two or more computers are connected directly within the small well defined area such as room, building etc. The physical topology of a network refers to the configuration of cables, computers, and other peripherals.
Main Types of Network Topologies
In networking, the term "topology" refers to the layout of connected devices on a network.
Network topologies are categorized into the following basic types:
•
•
•
•
•
•
Star Topology
Ring Topology
Bus Topology
Tree Topology
Mesh Topology
Hybrid Topology
More complex networks can be built as hybrids of two or more of the above basic topologies.
Star Topology Many home networks use the star topology. A star network features a central connection point called a "hub" that may be a hub, switch or router. Devices typically connect to the hub with Unshielded Twisted Pair (UTP) Ethernet.
Compared to the bus topology, a star network generally requires more cable, but a failure in any star network cable will only take down one computer's network access and not the entire LAN. (If the hub fails, however, the entire network also fails
LAB MANUAL (VII SEM ECE) Page 20

DATA COMMUNICATION LAB (EE‐427‐F)
DIAGRAM: -
PROCEDURE:- 1. Create folder of source name in both PC in C or D drive 2. Write text document in one PC (sender) 3. Open Star topology on both PC 4. Write destination IP address on both PC 5. Share folder 6. Open the folder 7. Save the parameters 8. Open the text document 9. Sent data 10. Received data on another PC
Advantages of a Star Topology •
•
•
•
•
•
Easy to install and wire.
No disruptions to the network then connecting or removing devices.
Easy to detect faults and to remove parts.
Requires more cable length than a linear topology.
If the hub or concentrator fails, nodes attached are disabled.
More expensive than linear bus topologies because of the cost of the concentrators.
Disadvantages of a Star Topology
The protocols used with star configurations are usually Ethernet or Local Talk. Token Ring uses a similar topology, called the star-wired ring.
RESULT: - Star Topology is studied.
LAB MANUAL (VII SEM ECE) Page 21

DATA COMMUNICATION LAB (EE‐427‐F)
QUESTIONS/ANSWERS
Q1. What are the different types of topology? A1.Different types of topology are star, bus, ring, tree, mesh.
Q2. What are the advantages of star topology? A2. Advantages are • Easy to install and wire.
•
•
No disruptions to the network then connecting or removing devices.
Easy to detect faults and to remove parts.
Q3. What are the disadvantages of star topology? A3.Disadvantages are: • Requires more cable length than a linear topology • More expensive than linear bus topologies because of the cost of the concentrators
Q4.What are the protocol used for the star topology? A4. The protocols used with star configurations are usually Ethernet or Local Talk.
Q5.What type of transmission media is used in star topology? A5.The transmission media used is twisted copper pair or optical fiber cable
Q6.Which topology can experience Contention and Collision? A6. The topology which can experience Contention and Collision is Star topology.
Q7. Define the term Contention? A7.When two or more station attempt to access a network at the same time.
Q8. What is a network? A8.A network is a system of interconnected communication
Q9.Define Node? A9. Entry or exit point of the network
Q10. Define protocols? A10.Set of rules for the successful communication between two or more nodes in a network
LAB MANUAL (VII SEM ECE) Page 22

DATA COMMUNICATION LAB (EE‐427‐F)
EXPERIMENT NO – 7
AIM: - To Study LAN using Bus Topology.
APPRATUS REQUIRED: - Four to Five computers, cables
THEORY: --
LAN: When two or more computers are connected directly within the small well defined area such as room, building etc. The physical topology of a network refers to the configuration of cables, computers, and other peripherals.
Bus Topology: A bus topology consists of a single cable connecting all nodes on a network without intervening connectivity devices .The single cable is called a bus and can support one channel for communication. Each node shares the bus’s total capacity
On bus topology network devices share the responsibility for getting the data from one point to another. Ethernet bus topologies are relatively easy to install and don't require much cabling compared to the alternatives. 10Base-2 ("ThinNet") and 10Base-5 ("ThickNet") both were popular Ethernet cabling options many years ago for bus topologies. However, bus networks work best with a limited number of devices. If more than a few dozen computers are added to a network.
DIAGRAM: -
LAB MANUAL (VII SEM ECE) Page 23

DATA COMMUNICATION LAB (EE‐427‐F)
PROCEDURE:-
1. 2. 3. 4. 5. 6. 7. 8.
Create folder of destination node (ECE COM 1, ECE COM 2) name in both PC. Click IPX protocol to enable it Select server on one PC. Select connect to network on another PC Open the text document Type the data on one PC Sent data Data is received on another PC
Advantages of a Linear Bus Topology •
•
•
•
•
•
Easy to connect a computer or peripheral to a linear bus.
Requires less cable length than a star topology.
Entire network shuts down if there is a break in the main cable.
Terminators are required at both ends of the backbone cable.
Difficult to identify the problem if the entire network shuts down.
Not meant to be used as a stand-alone solution in a large building
Disadvantages of a Linear Bus Topology
Result: - Data is transferred from one PC to another PC.
QUESTIONS/ANSWERS:
Q1. Define topology? A1.Physical composition of the network is defined as topology
Q2. What is poll? A2. Primary message inquiring if secondary has any traffic to send
Q3. What does the term “selection process” signify in bus topology? A3. Primary message inquiring if secondary is ready to receive traffic
Q4.What are the advantage of bus topology? A4. Easy to connect, requires less cable
Q5.What are the disadvantages of bus topology? A5. Entire network shuts down if there is a break in the main cable
LAB MANUAL (VII SEM ECE) Page 24

DATA COMMUNICATION LAB (EE‐427‐F)
Q6.In which topology terminators are required? A6.Bus Topology.
Q7. What is the central device in star topology?? A7.Hub/switch.
Q8. What are the different types of network? A8.LAN.GAN, WAN, MAN
Q9.What does the term GAN stand for? A9.Global area network
Q10.Define the term CAN? A10.Campus area network
LAB MANUAL (VII SEM ECE) Page 25

DATA COMMUNICATION LAB (EE‐427‐F)
EXPERIMENT NO – 8
AIM: - To Study LAN using Tree Topology.
Apparatus Required: Four to five Computers, cables.
Theory: --
Main Types of Network Topologies
In networking, the term "topology" refers to the layout of connected devices on a network.
Network topologies are categorized into the following basic types:
•
•
•
•
•
•
Star Topology
Ring Topology
Bus Topology
Tree Topology
Mesh Topology
Hybrid Topology
Tree Topology
Tree topologies integrate multiple star topologies together onto a bus. In its simplest form,
only hub devices connect directly to the tree bus and each hub functions as the "root" of a tree
of devices. This bus/star hybrid approach supports future expandability of the network much
better than a bus (limited in the number of devices due to the broadcast traffic it generates) or
a star (limited by the number of hub connection points) alone.
DIAGRAM: -
LAB MANUAL (VII SEM ECE) Page 26

DATA COMMUNICATION LAB (EE‐427‐F)
Advantages of a Tree Topology • Point-to-point wiring for individual segments. • Supported by several hardware and software venders.
Disadvantages of a Tree Topology • Overall length of each segment is limited by the type of cabling used. • If the backbone line breaks, the entire segment goes down. • More difficult to configure and wire than other topologies.
RESULT: - Thus Tree Topology is studied.
QUESTIONS/ANSWERS
Q1. Give two examples of hybrid topology? A1.Star and ring are the two examples of hybrid topology
Q2. What are the four basic type of topology? A2. Four basic type of topology are star, bus, ring, and mesh
Q3. Give one advantage of tree topology? A3. Point-to-point wiring for individual segments.
Q4. Give one disadvantage of tree topology? A4. Overall length of each segment is limited by the type of cabling used
Q5. What is a network? A5.A network is a system of interconnected communication
Q6.In which topology terminators are required? A6. Bus topology.
Q7. What is the central device in star topology? A7. Hub/switch.
LAB MANUAL (VII SEM ECE) Page 27

DATA COMMUNICATION LAB (EE‐427‐F)
Q8. What are the different types of network? A8.LAN.GAN, WAN.MAN
Q9.What does the term GAN stand for? A9.Global area network
Q10.Define the term CAN? A10.Campus area network
LAB MANUAL (VII SEM ECE) Page 28

DATA COMMUNICATION LAB (EE‐427‐F)
EXPERIMENT NO – 9
AIM: - To Study Configure Modem of Computer.
APPRATUS REQUIRED: - MODEM and Data communication kit
THEORY: -A modem is a device or a program that enables a computer to transmit data e.g. Telephone or cable lines. Computer information is stored digitally whereas information transmitted in the form of analog waves
Types of Modem Internal Internal modems are Compact, Inexpensive but difficult to set-up (if not pre-installed with computer package). External External modems are - Simple to set up, allow flexible usage but are more expensive than internal modems. In a configuration like this, a dumb terminal at an off-site office or store could "dial in" to a large, central computer. A dumb terminal is simply a keyboard and a screen. A very common dumb terminal at the time was called the DEC VT-100, and it became a standard of the day (now memorialized in terminal emulators worldwide). The VT-100 could display 25 lines of 80 characters each. When the user typed a character on the terminal, the modem sent the ASCII code for the character to the computer. The computer then sent the character back to the computer so it would appear on the screen. People got along at 300 bps for quite a while. The reason this speed was tolerable was because 300 bps represents about 30 characters per second, which is a lot more characters per second than a person can type or read. Once people started transferring large programs and images to and from bulletin board systems, however, 300 bps became intolerable. Modem speeds went through a series of steps at approximately two-year intervals: • 300 bps - 1960s through 1983 or so • 1200 bps - Gained popularity in 1984 and 1985 • 2400 bps • 9600 bps - First appeared in late 1990 and early 1991 • 19.2 kilobits per second (Kbps) • 28.8 Kbps • 33.6 Kbps • 56 Kbps - Became the standard in 1998 • ADSL, with theoretical maximum of up to 8 megabits per second (Mbps) - Gained popularity in 1999
LAB MANUAL (VII SEM ECE) Page 29

DATA COMMUNICATION LAB (EE‐427‐F)
DIAGRAM: -
PROCEDURE:-
1. 2. 3. 4. 5. 6. 7. 8.
Connect the main power cord to the trainer and switch on the trainer Connect the serial port cable between the two ports of the PC Open the window and click on “Modem Communication image” press “CTRL+M” Select the desired band rate Open the port by clicking open port button Transmit data Data trans mitted will be received in ASCII window Small window at sender side is given for transmission of ASCII code
RESULT: - Transmission of data using modem
QUESTIONS/ANSWERS:-
Q1.What does the term MODEM stands for? A1.MODEM stands for modulation and demodulation
Q2. In sending a binary data over an analog transmission line, what kind of device does the Conversion? A2.MODEM
Q3 .Cite one example of full –duplex transmission? A3 standard telephone system is an example of full-duplex transmission
Q4. What are voice modems? A4. Voice modems are regular modems that are capable of recording or playing audio over the telephone line. They are used for telephony applications
Q5.What are cellular modems?
LAB MANUAL (VII SEM ECE) Page 30

DATA COMMUNICATION LAB (EE‐427‐F)
A5. Modems which use mobile phone lines (GPRS, UMTS, HSPA, EVDO, WiMax, etc.), are known as cellular modems.
Q6. What is a Modem? A6. Modem is a device or program that enables a computer to transmit data over, for example, Telephone or cable lines.
Q7. Name the interface which is used to connect the external modem with the computer? A7.RS-232 is the interface which is used to connect the external MODEM with the computer.
Q8. What is a PC card modem? A8.some computers have an internal modem which is a built –in modem.
Q9. Define downstream transmission? A9. Internal computer modems are usually 56K modem which means that the modem is able to Receive 56 Kbits/s (56 kilobits or 56000 bits per second) of data, this kind of data transmission is Called downstream transmission.
Q10. What are cable modem? A10.The cable modem uses a coaxial cable television lines to provide a greater bandwidth than the Dial-up-computer modem
LAB MANUAL (VII SEM ECE) Page 31

DATA COMMUNICATION LAB (EE‐427‐F)
EXPERIMENT NO – 10
AIM: - To Study Configure Hub/Switch.
APPARATUS REQUIRED: - Hub, Switch and Cables
THEORY: - The Hubs are the physical hardware devices placed in central locations. The Hubs can be either multi-port repeaters or concentration. The Hubs can be of two types:- a) The Hubs with minimum intelligent (i.e. no microprocessors). b) Intelligent Hubs which can perform the basic diagnostics and task the nodes to see if they are operating correctly or not. The third category can be smart Hubs which can be polled and managed remotely Purpose of Hub Hubs are used to provide star topology. At the center of a star is the Hub or the switch with the n/w nodes located on the tips of the star. The hub is installed in a central wiring clost with all the cables extending out to the n/w nodes. The advantage of having a central wiring location i.e. it is easier to maintain to troubleshoot large n/w. All n/w cables come to the central hub. So it is especially easy to detect and fix the cable problems. The user can easily move a workstation in a star topology by changing the connection to the Hub at the central wiring closet.
BLOCK DIAGRAM: -
RESULT: - Thus Hub is studied
LAB MANUAL (VII SEM ECE) Page 32

DATA COMMUNICATION LAB (EE‐427‐F)
QUESTIONS/ANSWERS
Q1. Define Hub? A1. Common connection point for devices in a network. Hubs are commonly used to connect segments of a LAN. A hub contains multiple ports. When a packet arrives at one port, it is copied to the other ports so that all segments of the LAN can see all packets.
Q2. Define Switch? A2. In networks, a device that filters and forwards packets between LAN segments. Switches operate at the data link layer (layer 2) and sometimes the network layer (layer 3) of the OSI Reference Model and therefore support any packet protocol. Q3.Define Router? A3. A device that forwards data packets along networks. A router is connected to at least two networks, commonly two LANs or WANs or a LAN and its ISP.s network. Routers are located at gateways, the places where two or more networks connect.
Q4. How many pairs of stations can simultaneously communicate on Ethernet LAN? A4. One
Q5.A modem that is attached to the telephone system by jamming the phone's handset into two flexible receptacles in the coupler? A5. Acoustic coupler
Q6. On which layer does the hub work? A6. Hubs work at the physical layer (layer 1) of the OSI model.
Q7. As we know parallel transmission is faster than serial transmission. Name the device which converts parallel to serial transmission. A7. Multiplexer.
Q8. Give one example of circuit switching? A8.ISDN
Q9. Give an example of packet switching? A9.X.25
Q10. What are the different types of network? A10. LAN.GAN, WAN, MAN
LAB MANUAL (VII SEM ECE) Page 33

DATA COMMUNICATION LAB (EE‐427‐F)
EXPERIMENT NO –11
AIM: - To Study Interconnections of Cables for Data Communication.
APPRATUS REQUIRED: - Different types of cables
THEORY: - Ethernet Cables Comparison between CAT5, CAT5E, CAT6, CAT7 Cables
In the context of the 100-ohm UTP (Unshielded Twisted Pair) type of cable used for Ethernet wiring the only categories of interest are Cat3, Cat4, Cat5, Cat5e, Cat6, and Cat7. CATx is an abbreviation for the category number that defines the performance of building telecommunications cabling as outlined by the Electronic Industries Association (EIA) standards. Up until the late 1980s thick or thin coaxial cable was typically used for 10-Mbps Ethernet networks, but around that time, UTP cabling became more commonly used because it was easier to install and less expensive. UTP CAT3 and CAT4 were used for a quite limited time since the emergence of 100Base-TX networks meant a quick shift to CAT5. By the year 2000, moves to gigabit (1000Base-TX) Ethernet LANs created a need for another specification, CAT5e. CAT5e is now being superseded by CAT6 cable and there is a developing standard for CAT7.
Specifications for Cat3, Cat4, Cat5, CAT5E, Cat 6, and Cat 7 Cables
Category Type Spectral B/W Cat3UTP 16 MHz
Cat4 Cat5
Cat5e Cat6 Cat7
UTP 20 MHz UTP 100MHz
UTP 100MHz UTP 250MHz SCTP 600MHz
Length
100m
100m 100m
100m 100m 100m
LAN Applications
10Base-T, 4Mbps
16Mbps 100Base-Tx,ATM, CDDI 1000Base-T
Notes
Now mainly for telephone cables Rarely seen Common for current LANs
Common for current LANs Emerging
It might seem that CAT5 and CAT5e are the same. Pretty much they are, the CAT5e specification simply included some additional limits over the CAT5 specification. The reality is that most CAT5 cable is in fact CAT5e cable just not certified as such. Here is a comparison of those extra specifications.
LAB MANUAL (VII SEM ECE) Page 34

DATA COMMUNICATION LAB (EE‐427‐F)
CAT5, CAT5E, and CAT6 UTP Solid Cable Specifications Comparison
Category 5
Frequency
Attenuation (Min. at 100 MHz)
Characteristic Impedance
NEXT (Min. at 100 MHz)
PS-NEXT (Min. at 100 MHz)
ELFEXT (Min. at 100 MHz)
PS-ELFEXT (Min. at 100 MHz)
Return Loss (Min. at 100 MHz)
Delay Skew (Max. per 100 m)
100 MHz
22 dB
100 ohms ± 15%
32.3 dB
no specification
no specification
no specification
16.0 dB
no specification
Category 5E
100 MHz
22 dB
100 ohms ± 15%
35.3 dB
32.3 dB
23.8 dB
20.8 dB
20.1 dB
45 ns
Category 6
250 MHz
19.8 Db
100 ohms ± 15%
44.3 dB
42.3 dB
27.8 dB
24.8 dB
20.1 dB
45 ns
Some modern hubs don't care if you use crossover cables or straight through cables, they work out what you're using and configure themselves accordingly. As stated at the outset, the actual difference is in the wiring. Inside the UTP patch cable there are 8 physical wires although the network only uses 4 of them (the other 4 are simply wasted). The 8 wires are arranged in what's known as pairs and one pair is used to send information whilst the other pair is used to receive information. On a PC, the pair on pins 1 and 2 of the connector sends information, whilst the pair on pins 3 and 6 receives the information. To make PCs talk to each we therefore need to connect the send pair of one PC to the receive pair of the other PC (and vice-a-versa). That means we need a crossover cable. If we used a straight through cable the both be listening on the one pair - and hearing nothing, and sending on the one pair - achieving nothing. The most common cable is the straight through cable. In a home or small office network you might only have one crossover cable used - perhaps from the cable or DSL modem to the distribution hub. Color Codes
If a cable has 568A color wiring on both ends then it's a straight through cable. If a cable has 568B color wiring on both ends then it's also a straight through cable. If a cable has 568A color wiring on one end and 568B color coded wiring on the other end, then it's a crossover cable.
In fact, while the colors are standardized and usually followed, that's not the important part. What's more important is that one "pair" (wires that are twisted together inside the cable sheath) is used for the transmit side and another pair for the receive side. If pairs aren't used then it's likely your cable will not work. Pairs are identified by the colors. The orange wire and
LAB MANUAL (VII SEM ECE) Page 35

DATA COMMUNICATION LAB (EE‐427‐F)
the orange with white stripe (or sometimes white with orange stripe) wire are a pair. The brown wire and the brown with white stripe wire are a pair. Etc.
DIAGRAM: -
RESULT: - CAT types of cables are studied.
Question/Answers:-
Q1.What are the different Ethernet cables? A1. Cat3, Cat4, Cat5, CAT5E, Cat 6, and Cat 7 Cables
Q2.What is the spectral band width of CAT 3 cable? A2. Sixteen MHz
Q3. What is the spectral band width of CAT 4 cable? A4.Twenty MHz
Q4. What is the spectral band width of CAT 5 cable? A4.100 MHz
Q5. What is the length of CAT 3 Cable? A5.100m
Q6. What is the length of CAT 4 Cable?
LAB MANUAL (VII SEM ECE) Page 36

DATA COMMUNICATION LAB (EE‐427‐F)
A6.100m
Q7.What is the length of CAT 5 Cable? A7.100m
Q8.What is the bending radius of Cat 5 cable? A8. Most Cat.5 cables can be bent at a radius approximately 4 times the diameter of the cable
Q9. What are solid core cables? A9.Solid core cable is supposed to be used for long permanently installed runs. It is less flexible than stranded and more prone to failure if repeatedly flexed.
Q10.What is Stranded Cable? A10.Stranded cable is used for fly leads at patch panel and for connections from wall-ports to end Devices, as it resists cracking of the conductors. Stranded core is generally more expensive than Solid core.
LAB MANUAL (VII SEM ECE) Page 37

DATA COMMUNICATION LAB (EE‐427‐F)
EXPERIMENT NO. 12
AIM:-To Study Fiber Optic Communication. APPARATUS REQUIRED: ST5001, TRAINER kit, ST5001 Software, 2Patch
(2mm), Foe cable (0.5mjlm), Cords (2mm), 2serial Port Cables, and Main Power Cord
THEORY:-
The Fiber Optic Data Communications Link, End-to-End We consider the simple fiber optic data link given below. This is the basic building block for a fiber optic based network. A model of this simple link is shown in Fig.
The illustration indicates the Source-User pair, Transmitter and Receiver. It also clearly shows the fiber optic cable constituting the Transmission Medium as well as the connectors that provide the interface of the Transmitter to the Transmission Medium and the Transmission Medium to the Receiver. All of these are components of the simple fiber optic data line
TRANSMITTER:- The Transmitter component of serves two functions. First, it must be a source of the light coupled into the fiber optic cable. Secondly, it must modulate this light so as to represent the binary data that it is receiving from the Source. The Source provides the data to the Transmitter as some digital electrical signal. The Transmitter can then be thought of as Electro-.optical (EO) transducer. Within the context of a fiber optic data link the modulating signal, the Information, assumes only the values of '0' and '1.' The demodulation function in the Receiver will just be looking for the presence or absence of energy during a bit time interval.
LAB MANUAL (VII SEM ECE) Page 38

DATA COMMUNICATION LAB (EE‐427‐F)
RECEIVER: The Receiver component of serves two functions. First, it must sense or detect the light coupled out of the fiber optic cable then convert the light into an electrical signal. Secondly, it must demodulate this light to determine the identity of the binary data that it represents. In total, it must detect light and then measure the relevant Information bearing light wave parameters in the premises fiber optic data link context intensity in order to retrieve the Source's binary data. Receiver senses the light output of the fiber optic cable. Light is detected and then converted to an electrical signal. The demodulation process is carried out on the resulting electrical signal. The light detection is carried out by a photodiode. This senses light and converts it into an electrical current.
BLOCK DIAGRAM:-
Half duplex
Fig 1
LAB MANUAL (VII SEM ECE) Page 39

DATA COMMUNICATION LAB (EE‐427‐F)
PROCEDURE:-
1. Connect patch cords as shown in above figure. 2. Connect mains power cord to the trainer and switch ON the trainer. 3. Connect the serial port cables between one PC to Port l & another PC to Port2. 4. To open the window as shown in fig. 10, follow the steps. 5. Run ST5001 software on both PCs 6. Click "Fiber Optics Communication" image/press "Ctrl + F"/click "Options" on menu bar. . 7. The software will open with default settings. Set the same parameters on both the PCs. Baud rate can be varied from 2400bps to 1 15200bps. Select the desired baud rate. Select the desired port settings. 8. After the port settings are done, open the port by clicking "Open Port" button. 9. To send data to other node enter the text in the window titled as "Enter Data to Transmit". Click on "Send" button to transmit. 10. Transmitted data will be displayed in the "Received Data" window and the ASCII codes of each byte received is displayed in "Received Data in ASCII" window. 11. A small window at sender side is given for transmission of ASCII code. Enter an ASCII code in the window and then click "Send" button. 12. "Clear" buttons are given to clear all windows. 13. Before changing the port settings close the port by clicking "Close Port" button and after changing the parameters click "Open Port" button to reopen the port.
RESULT: - The fiber optics communication has been studied
QUESTIONS/ANSWERS
Q1. In selecting optical fibre, how does each of the following affect maximum distance? Span of a fibre run between switches? a) Fibre Quality b) Wavelength. A1. a) Fibre Quality
Q2. In optical fiber refractive index of cladding is less than core. Why? A2. It helps to undergo multiple total internal reflections through the optical fiber.
Q3. Define Acceptance angle? A3. Is the maximum angle to the axis at which light may enter the fiber in order to propagate?
Q4. Define Skew rays? A4. Rays, which greatly outnumber the meridional rays, follow a helical path through the fibre.
Q5.Write advantages of optical fibre communication. A5. Electrical isolation, Immunity to interference and crosstalk, Signal security, System reliability.
Q6. Define cladding?
LAB MANUAL (VII SEM ECE) Page 40

DATA COMMUNICATION LAB (EE‐427‐F)
A6. The cladding surrounds the core and supports the waveguide structure whilst, substantially reducing the radiation loss into the surrounding air.
Q7. Define Numerical aperture? A7. The relationship between the acceptance angle and the refractive indices of the three media involved namely, core, cladding and air. NA= n0 sin θa
Q8. Define mode? A8. The stable field distribution in the x direction with only periodic z dependence is known as a mode.
Q9.Disadvantage of fiber optics? A9. High initial cost, difficult to install.
Q10.Define reflective index? A10.ratio of the velocity of light in vacuum to the velocity of light in the medium
LAB MANUAL (VII SEM ECE) Page 41

DATA COMMUNICATION LAB (EE‐427‐F)
EXPERIMENT NO – 13
AIM: - To Study Wireless Communication. APPARATUS REQUIRED:- ST 5OO1 Trainer Kit, ST5001 Software, 2 Patch Cords (2mm), 2 Serial Port Cables, Mains Power Cord. THEORY: In wireless communication we are using Infrared signals. Infrared signals with
frequencies from 300 GHz to 400 GHz can be used for short range communication. Infrared
signals having high frequencies cannot penetrate walls. When we use our infrared remote
control, we do not interfere with the use of the remote by our neighbours. This advantageous
characteristic prevents interference between one system and another; a short range
communication system in one room cannot be affected by another system in the next room.
LAB MANUAL (VII SEM ECE) Page 42

DATA COMMUNICATION LAB (EE‐427‐F)
PROCEDURE:
1. Connect patch cords as shown in fig. 1 2. Connect mains power cord to the trainer and switch ON the trainer.
3. Connect the serial port cables between one PC to Port l & another PC to Port2.
4. To open the window as shown in fig. 12, follow the steps.
5. Run ST5001 software on both PCs
6. Click "Wireless Communication" image/press "Ctr + W"/click "Options" on menu bar. 7. The software will open with default settings. Set the same parameters on both the PCs. Baud rate can be varied from 300bps to 2400bps. Select the desired baud rate. Select the desired port settings. 8. After the port settings are done, open the port by clicking "Open Port" button.
9. To send data to other node enter the text in the window titled as "Enter Data to Transmit". Click on "Send" button to transmit.
10. Transmitted data will be displayed in the "Received Data" window and the ASCII codes of each byte received is displayed in "Received Data in ASCII" window.
11. A small window at sender side is given for transmission of ASCII code. Enter an ASCII code in the window and then click "Send" button. 12. "Clear" buttons are given to clear all windows.
13. Before changing the port settings close the port by clicking "Close Port" button and after changing the parameters click "Open Port" button to reopen the port.
RESULT: - The wireless communication has been studied.
QUESTIONS/ANSWERS:-
Q1. What are the two types of communication systems? A1. The two types are wired and wireless communication.
Q2. Which are different types of wireless communication? A2. Radio frequency, satellite communication, microwave etc.
Q3. What is the range microwave? A3. 1GHz to 300GHz.
Q4. What is the range of satellite communication? A4. 4GHz to 6GHz (uplink) and 6GHz to 10GHz (downlink)
Q5. State two applications of wireless communication. A5. Remote control devices, mobile communication.
Q6. What are the advantages of wireless communication?
LAB MANUAL (VII SEM ECE) Page 43

DATA COMMUNICATION LAB (EE‐427‐F)
A6. Increases capacity of system, Higher mobility of device.
Q7. What is disadvantage of wireless? A7. Dependence on weather condition, Spectrum allocation is fixed.
Q8. What are the different generations in wireless communication? A8. 2G, 2.5G, 3G
Q9. Which are different standards in wireless Communication? A9. EDGE, HPSCD, CDMA, TDMA
Q10. State any two wireless devices. A10. TV, Mobile.
LAB MANUAL (VII SEM ECE) Page 44

DATA COMMUNICATION LAB (EE‐427‐F)
EXPERIMENT NO – 14
AIM: To Study PC-PC Communication Using LAN
APPRATUS: LAN Trainer Kit
THEORY: The physical topology of a network refers to the configuration of cables, computers, and other
peripherals. Physical topology should not be confused with logical topology which is the
method used to pass information between workstations.
Tree Topology Tree topologies integrate multiple star topologies together onto a bus. In its simplest form,
only hub devices connect directly to the tree bus, and each hub functions as the "root" of a tree
of devices. This bus/star hybrid approach supports future expandability of the network much
better than a bus (limited in the number of devices due to the broadcast traffic it generates) or
a star (limited by the number of hub connection points) alone.
Advantages of a Tree Topology •
•
•
•
Point-to-point wiring for individual segments.
Supported by several hardware and software venders.
Overall length of each segment is limited by the type of cabling used.
If the backbone line breaks, the entire segment goes down.
Disadvantages of a Tree Topology
More difficult to configure and wire than other topologies
Bus Topology Ethernet bus topologies are relatively easy to install and don't require much cabling compared to the alternatives. 10Base-2 ("ThinNet") and 10Base-5 ("ThickNet") both were popular Ethernet cabling options many years ago for bus topologies. However, bus networks work best with a limited number of devices. If more than a few dozen computers are added to a network1
Advantages of a Linear Bus Topology •
•
Easy to connect a computer or peripheral to a linear bus.
Requires less cable length than a star topology.
Disadvantages of a Linear Bus Topology
LAB MANUAL (VII SEM ECE) Page 45

DATA COMMUNICATION LAB (EE‐427‐F)
•
•
•
•
Entire network shuts down if there is a break in the main cable.
Terminators are required at both ends of the backbone cable.
Difficult to identify the problem if the entire network shuts down.
Not meant to be used as a stand-alone solution in a large building
Star Topology Many home networks use the star topology. A star network features a central connection point called a "hub" that may be a hub, switch or router. Devices typically connect to the hub with Unshielded Twisted Pair (UTP) Ethernet.
Compared to the bus topology, a star network generally requires more cable, but a failure in any star network cable will only take down one computer's network access and not the entire LAN. (If the hub fails, however, the entire network also fails.
Advantages of a Star Topology •
•
•
•
•
•
Easy to install and wire.
No disruptions to the network then connecting or removing devices.
Easy to detect faults and to remove parts.
Requires more cable length than a linear topology.
If the hub or concentrator fails, nodes attached are disabled.
More expensive than linear bus topologies because of the cost of the concentrators.
Disadvantages of a Star Topology
The protocols used with star configurations are usually Ethernet or Local Talk. Token Ring uses a similar topology, called the star-wired ring.
PROCEDURE:
1. Implement Star topology with the help of ST5002 trainer kit. 2. Install the ST5002 Software on each node or system connected on trainer kit as per the given steps in 'installation procedure' in case it is not installed 3. Run ST5002 software on each node connected to the trainer
4. Click on 'Star Topology'
5. Enter remote nodes IP address or computer name in the 'Destination IP / Name text window. 6. Select the flow control 'Stop-N-Wait'
7. Select all other settings like; packet size, inter packet delay, & transmission error
8. Save all parameters by clicking on 'Save Parameters' button 9. Browse a file to transmit by clicking on 'Open' button
LAB MANUAL (VII SEM ECE) Page 46

DATA COMMUNICATION LAB (EE‐427‐F)
10. Click "Send' button to transmit the file.
11. To see the live packet details press 'Packet details'
12. Analyze the network statistics for the file transmission by clicking 'Statistics' button
RESULT: PC-PC communication using LAN has been studied
QUESTIONS/ANSWERS
Q1.Using internet, how can you transfer a file or software from one computer to another. Explain. A1.File Transfer Protocol (FTP)
Q2. Give two examples of hybrid topology A2.Star and ring are the two examples of hybrid topology
Q3. What are the four basic type of topology? A3. Four basic type of topology are star, bus, ring, and mesh
Q4. Give one advantage of tree topology? A4. Point-to-point wiring for individual segments.
Q5 Give one disadvantage of tree topology? A5. Overall length of each segment is limited by the type of cabling used
Q6 Define topology? A6.Physical composition of the network is defined as topology
Q7. What is poll? A7. Primary message inquiring if secondary has any traffic to send
Q8. What does the term “selection process” signify in bus topology? A8. Primary message inquiring if secondary is ready to receive traffic
Q9.What are the advantage of bus topology? A9. Easy to connect, requires less cable.
Q10.What are the disadvantages of bus topology? A10.Entire network shuts down if there is a break in the main cable.

DIGITAL SIGNAL PROCESSING
(ECE‐423‐F)
LAB MANUAL
VII SEMESTER

DIGITAL SIGNAL PROCESSING LAB (ECE‐429‐F)
LIST OF EXPERIMENTS
S.NO
1. (a)
NAME OF EXPERIMENT
To illustrate the simple mathematical expressions in Matlab. (b) To design a program to draw a unit circle
PAGE NO
3
2. To present basic signals(unit step, unit impulse, ramp, exponent, sine and cosine)
To develop a program for discrete convolution.
To develop a program for discrete correlation
To design Infinite Impulse Response (low pass filter) filter with cut of frequency of 4000 HZ .
To Design Finite Impulse Response.(FIR filter)
To study Linear Convolution technique.
To generate the Amplitude Shift Keying Modulation.
To generate the Frequency shift keying Modulation.
To Generate the sine, square, triangular wave using lookup table and produces an output stream.
9
3.
4.
5.
14
17
20
6.
7.
8.
9.
10.
24
28
32
38
44
LAB MANUAL (VII SEM ECE)
page 2

DIGITAL SIGNAL PROCESSING LAB (ECE‐429‐F)
EXPERIMENT NO. 1(a) AIM: - TO ILLUSTRATE THE SIMPLE MATHEMATICAL EXPRESSIONS IN MATLAB.
PROGRAM:- 1. clc; clear all;
close all;
x=2^5
y=x‐1
z=x/y
OUTPUT :‐ x= 32
y= 31
z=1.0323
2. clc; clear all;
close all;
x=3*sqrt(5)‐1
y=(sqrt(5)+1^2
z=x/y‐1
OUTPUT :‐ x= 5.7082
y= 10.4721
z=‐0.4549
3. clc; clear all;
LAB MANUAL (VII SEM ECE)
page 3

DIGITAL SIGNAL PROCESSING LAB (ECE‐429‐F)
close all;
r= pi^(1/3)‐1
area=pi*r^2
OUTPUT :‐ r= 0.4646
area=0.6781
4. clc; clear all;
close all;
r= sqrt(163)
t= exp(pi*r)
OUTPUT :‐ r= 12.7671
t= 2.6254e+017
5. clc; clear all;
close all;
x=(sin(pi/6))^2
y=(cos(pi/6))^2
t=x+y
OUTPUT :‐ x= 0.2500
y= 0.7500
t=1
6. clc;
LAB MANUAL (VII SEM ECE)
page 4

DIGITAL SIGNAL PROCESSING LAB (ECE‐429‐F)
clear all;
close all;
t=pi/4
x=exp(i*t)
OUTPUT :‐ t= 0.78.54
x= 0.7071+0.7071i
7. clc; clear all;
close all;
t= exp (pi/(4*i))
OUTPUT :‐ t= 32
y= 31
z=0.7071+0.7071i
8. clc; clear all;
close all;
t= 1:1:10
z= sin(t.^2)/ (t.^2)
OUTPUT :‐ t= 1 2 3 4 5 6 7 8 9 10
z= ‐0.0052
LAB MANUAL (VII SEM ECE)
page 5

DIGITAL SIGNAL PROCESSING LAB (ECE‐429‐F)
EXPERIMENT NO. 1(b)
AIM:- To design a program to draw a unit circle
PROGRAM:- clc; clear all; close all; r=('1'); theta=linespace(0,2*p,100); x=r*cos(theta); y=r*sin(theta); plot(x,y); xlable('x'); ylabel('y'); title('circle');
OUTPUT:-
LAB MANUAL (VII SEM ECE)
page 6

DIGITAL SIGNAL PROCESSING LAB (ECE‐429‐F)
QUESTIONS/ANSWERS
Q1.What is a MATLAB?.
A1. MATLAB (matrix laboratory) is a numerical computing environment andfourth-generation programming language
Q2 What are the various functions of MATLAB?
A2 MATLAB allows matrix manipulations, plotting of functions and data, implementation of algorithms, creation of user interfaces, and interfacing with programs written in other languages, including C, C++, Java, and Fortran Star and ring are the two examples of hybrid topology
Q3. What is the difference between an array and a vector?
A3. A vector refers to a one dimensional (1×N or N×1) matrix, commonly referred to as an array in other programming languages. A matrix generally refers to a 2-dimensional array, i.e. an m×n array where m and n are greater than 1.
Q4. What are the various windows in MATLAB?
A4 Command window, Editor window, Launch pad Window
Q5 What are variables?
A5. Variables are assigned numerical values by typing the expression directly, for example, typing
a = 1+2 yields: a = 3
The answer will not be displayed when a semicolon is put at the end of an expression, for example type a = 1+2;
Q6 What are the various arithmetic operators used in MATLAB?
A6. MATLAB utilizes the following arithmetic operators:
+ - * / ^ '
LAB MANUAL (VII SEM ECE)
addition subtraction multiplication division power operator transpose
page 7

DIGITAL SIGNAL PROCESSING LAB (ECE‐429‐F)
Q7. What are the various special type of matrices used in MATLAB?
A7. null matrix: nxm matrix of zeros: nxm matrix of ones: nxn identity matrix:
Q8. Is MATLAB a case sensitive?
A8. Yes. "a" and "A" are two different names.
Q9. How we define comment statements in MATLAB?
A9. Comment statements are preceded by a "%"..
Q10.What are M-files ?
A10. M-files are macros of MATLAB commands that are stored as ordinary text files with the extension "m", that is filename.m. An M-file can be either a function with input and output variables or a list of commands. All of the MATLAB examples in this textbook are contained in M-files that are available at the Math Works ftp site, ftp.mathworks.com in the directory pub/books/heck.
M = [ ]; M = zeros(n,m); M = ones(n,m); M = eye(n);
LAB MANUAL (VII SEM ECE)
page 8

DIGITAL SIGNAL PROCESSING LAB (ECE‐429‐F)
EXPERIMENT NO. 2
AIM:- To present basic signals(unit step, unit impulse, ramp, exponent, sine and cosine)
PROGRAM:- ** for unit step, unit impulse, ramp and exponent clc; clear all; close all; n=[0:0.5:20]; x=input('enter value of x'); y=exp(x*n); subplot(2,2,1); stem(n,y); xlabel ('x'); ylabel ('exponent'); title('expo1'); %clc; %clear all; %close all; n=[0:0.5:20]; a=input('enter value of a'); y=(a).^n; subplot(2,2,2); stem(n,y); xlabel('a'); ylabel('exponent'); title('expo2'); %clc; %clear all; %close all; n=[0:0.5:20]; subplot(2,2,3); stem(n,n); xlabel('x'); ylabel('y'); title('unit ramp');
LAB MANUAL (VII SEM ECE)
page 9

DIGITAL SIGNAL PROCESSING LAB (ECE‐429‐F)
%clc; %clear all; %close all; t=[-3:1:2]; n1=[zeros(1,3),ones(1,1),zeros(1,2)]; subplot(2,2,4); stem(t,n1); xlabel('x'); ylabel('y'); title('unit impulse');
**for sine and cosine clc; clear all; close all; t=[0:0.1:pi]; y=cos(2*pi*t); subplot(2,2,1); stem(t,y); xlabel('t'); ylabel('coz'); title('cos(2pit)'); %clc; %clear all; %close all; t=[0:0.1:pi]; y=sin(2*pi*t); subplot(2,2,2); stem(t,y); xlabel('t'); ylabel('sin'); title('sin(2pit)');
LAB MANUAL (VII SEM ECE)
page 10

DIGITAL SIGNAL PROCESSING LAB (ECE‐429‐F)
OUTPUT:-
LAB MANUAL (VII SEM ECE)
page 11

DIGITAL SIGNAL PROCESSING LAB (ECE‐429‐F)
QUESTIONS/ANSWERS
Q1. Which command is used to draw a continuous waveform?
A2 The command most often used for plotting is plot, which creates linear plots of vectors and matrices; plot(t,y) plots the vector t on the x-axis versus vector y on the y-axis
Q2 Which command is used to draw a discrete waveform?
A2 For discrete-time signals, use the command stem which plots each point with a small open circle and a straight line. To plot y[k] versus k, type stem(k,y).
Q3. Which command is used to plot two or more graphs on the same set of axes?
A3.To plot two or more graphs on the same set of axes, use the command plot (t1,y1,t2,y2),which plots y1 versus t1 and y2 versus t2.
Q4. Which command is used to label the axes?
A4 To label your axes , type e.g.
xlabel('time (sec)') ylabel('step response')
Q5 Which command is used to give a title name to the plot?
A5 To give the plot a title, type
Title ('My Plot')
Q6 Which command is used to add a grid to the plot?
A6 To add a grid to your plot to make it easier to read. Type
grid
Q7. Which command is used to plot more than one graph on the screen?
A7. To plot more than one graph on the screen, use the command subplot(mnp) which partitions the screen into an m x n grid where p determines the position of the particular graph counting the upper left corner as p=1. For example,
subplot(2,1,1)
LAB MANUAL (VII SEM ECE)
page 12

DIGITAL SIGNAL PROCESSING LAB (ECE‐429‐F)
Q8.For autoscaling of the axes which command is used?
A8: The auto scaling of the axes can be done by using the axis command after the plotting command:
axis([xmin xmax ymin ymax]);
where xmin, xmax, ymin, and ymax are numbers corresponding to the limits you desire for the axes. To return to the automatic scaling, simply type axis.
Q9. How the colour of plot can be changed?
A9 There are options on the line type and the color of the plot which are obtained using plot (t,y,'option'). The linetype options are '-' solid line (default), '--' dashed line, '-.' dot dash line, ':' dotted line. The points in y can be left unconnected and delineated by a variety of symbols: + . * o x. The following colors are available options:
r b g w k
red blue green white black
Q10.Which command is used to make the axis equal?
A10: axis (‘equal’)
LAB MANUAL (VII SEM ECE)
page 13
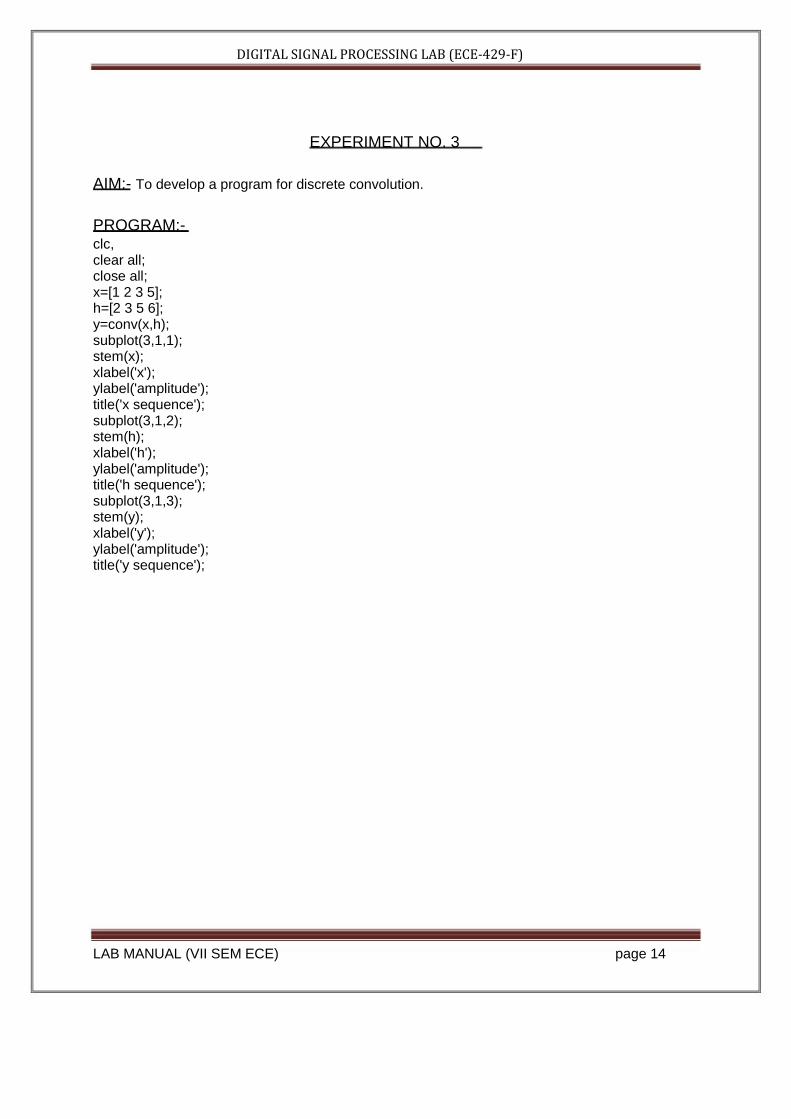
DIGITAL SIGNAL PROCESSING LAB (ECE‐429‐F)
EXPERIMENT NO. 3
AIM:- To develop a program for discrete convolution.
PROGRAM:- clc, clear all; close all; x=[1 2 3 5]; h=[2 3 5 6]; y=conv(x,h); subplot(3,1,1); stem(x); xlabel('x'); ylabel('amplitude'); title('x sequence'); subplot(3,1,2); stem(h); xlabel('h'); ylabel('amplitude'); title('h sequence'); subplot(3,1,3); stem(y); xlabel('y'); ylabel('amplitude'); title('y sequence');
LAB MANUAL (VII SEM ECE)
page 14

DIGITAL SIGNAL PROCESSING LAB (ECE‐429‐F)
OUTPUT:-
QUESTIONS/ANSWERS
Q1.What is convolution?
A1 In mathematics and, in particular, functional analysis, convolution is a mathematical operation on two functions f and g, producing a third function that is typically viewed as a modified version of one of the original functions, giving the area overlap between the two functions as a function of the amount that one of the original functions is translated.
Q2. What are the applications of convolution?
A2 It has applications that include probability, statistics, computer vision, image and signal processing, electrical engineering, and differential equations.
Q3. What is the difference between circular convolution and discrete convolution?
LAB MANUAL (VII SEM ECE)
page 15

DIGITAL SIGNAL PROCESSING LAB (ECE‐429‐F)
A3 the circular convolution can be defined for periodic functions (that is, functions on the circle), and the discrete convolution can be defined for functions on the set of integers.
Q4. What is deconvolution?
A4 Computing the inverse of the convolution operation is known as deconvolution. N two sequences
Q5 What is the symbol for convolution?
A5. The convolution of f and g is written f∗g, using an asterisk or star. It is defined as the integral of the product of the two functions after one is reversed and shifted.
Q6 Which command is used to find convolution between two sequences?
A6.If x & h are two sequences then the command used to find convolution between these sequences can be represented by Conv(x,h).
Q7. What are the various special type of matrices used in MATLAB?
A7. null matrix: nxm matrix of zeros: nxm matrix of ones: nxn identity matrix:
M = [ ]; M = zeros(n,m); M = ones(n,m); M = eye(n);
Q8. Is convolution obeys the algebraic properties?
A8. Yes. It satisfies associative , commutative , distributive algebraic properties.
Q9. What is a convolution matrix?
A9. A convolution matrix is a matrix, formed from a vector, whose inner product with another vector is the convolution of the two vectors.
Q10 Generate a simple convolution matrix.
A10. If h = [1 2 3 2 1]; convmtx(h,7);
LAB MANUAL (VII SEM ECE)
page 16

DIGITAL SIGNAL PROCESSING LAB (ECE‐429‐F)
EXPERIMENT NO. 4
AIM:- To develop a program for discrete correlation
PROGRAM:- clc, clear all; close all; x=[1 2 3 5]; h=[2 3 5 6]; y=xcorr(x,h); subplot(3,1,1); stem(x); xlabel('x'); ylabel('amplitude'); title('x sequence'); subplot(3,1,2); stem(h); xlabel('h'); ylabel('amplitude'); title('h sequence'); subplot(3,1,3); stem(y); xlabel('y'); ylabel('amplitude'); title('y sequence');
LAB MANUAL (VII SEM ECE)
page 17

DIGITAL SIGNAL PROCESSING LAB (ECE‐429‐F)
OUTPUT:-
QUESTIONS/ANSWERS
Q1.What is correlation?
A1 Correlation quantifies the strength of a linear relationship between two variables. When there is no correlation between two variables, then there is no tendency for the values of the variables to increase or decrease in tandem. Two variables that are uncorrelated are not necessarily independent, however, because they might have a nonlinear relationship.
Q2. What are the applications of correlation?
A2 It has applications that computes and plots the sample autocorrelation function (ACF) of a univariate, stochastic time series .
Q3. What is auto-correlation?
A3 The autocorrelation function of a random signal describes the general dependence of the values of the samples at one time on the values of the samples at another time.
Q4. What is cross-correlation?
LAB MANUAL (VII SEM ECE)
page 18

DIGITAL SIGNAL PROCESSING LAB (ECE‐429‐F)
A4 The cross correlation function however measures the dependence of the values of one signal on another signal.
Q5 Which command is used to find the correlation coefficients
A5.r=corr2(A,B) computes the correlation coefficient between A and B, where A and B are matrices or vectors of the same size.
Q6 Which command is used to find correlation between two sequences?
A6 If x & y are two sequences then
c=xcorr(x,y)
Q7. What command is used to find cross-correlation of two matrices?
A7:C = xcorr2(A,B) returns the cross-correlation of matrices A and B with no scaling. xcorr2 is the two-dimensional version of xcorr. It has its maximum value when the two matrices are aligned so that they are shaped as similarly as possible.
Q8. Is convolution obeys the algebraic properties?
A8. Yes. It satisfies associative , commutative , distributive algebraic properties.
Q9. What is a convolution matrix?
A9. A convolution matrix is a matrix, formed from a vector, whose inner product with another vector is the convolution of the two vectors.
Q10 Generate a simple convolution matrix.
A10. If h = [1 2 3 2 1]; convmtx(h,7);
LAB MANUAL (VII SEM ECE)
page 19

DIGITAL SIGNAL PROCESSING LAB (ECE‐429‐F)
EXPERIMENT NO. 5
AIM : To design Infinite Impulse Response (low pass filter) filter with cut of frequency of 4000hz .
PROGRAM : #include "dsk6713.h"//this file is added to initialize the DSK6713 #include "dsk6713_aic23.h" Uint32 fs = DSK6713_AIC23_FREQ_8KHZ; // set the sampling frequency, Different sampling frequencies supported by AIC23 codec are 8, 16, 24, 32, 44.1, 48, and 96 kHz.
// FILTER COFFICIENTS IS CALCULATED BY MATLAB
float fc [ ]={ 2.338110787e-019,6.936318823e-005,-0.0003181171778,0.0008399875951, - 0.001779771759,0.003340889933,-0.005792469252, 0.00948059652,- 0.01485389285, 0.02252536267,-0.03342207149, 0.04916161299, -0.07310581207, 0.1139752045, - 0.2039434612, 0.6338219047, 0.6338219047, -0.2039434612, 0.1139752045, - 0.07310581207, 0.04916161299, -0.03342207149, 0.02252536267, - 0.01485389285, 0.00948059652, -0.005792469252, 0.003340889933,- 0.001779771759,0.0008399875951, - 0.0003181171778, 6.936318823e-005,2.338110787e-019 };
static short in_buffer[18] ; void main( ) {
comm_intr(); while(1);
period Ts. } interrupt void c_int11( )
{ Uint32 indata; int i=0;
LAB MANUAL (VII SEM ECE)
// ISR function is called, using the given command // program execution halts and it starts listening for the interrupt which occur at every sampling
// ISR call, At each Interrupt, program execution goes to the interrupt service routine
//variable declaration
page 20

DIGITAL SIGNAL PROCESSING LAB (ECE‐429‐F)
signed int output=0;
indata = input_sample(); in_buffer[0] = indata;
for(i=17;i>=0;i--) in_buffer[i] = in_buffer[i-1];
for(i=0;i<18;i++) output = output + fc[i] * in_buffer[i];
output_sample(output);
}
OUTPUT :
//output filter,the value in the buffer yn indexed by the variable loop is written on to the codec.
//newest input @ top of buffer //new input at buffer[0]
//shuffle the buffer
LAB MANUAL (VII SEM ECE)
page 21

DIGITAL SIGNAL PROCESSING LAB (ECE‐429‐F)
QUESTION/ANSWER
Q1:-What are the advantages of IIR filters (compared to FIR filters)?
A1:-IIR filters can achieve a given filtering characteristic using less memory and calculations than a similar FIR filter
Q2:- What are the disadvantages of IIR filters (compared to FIR filters)?
A2:- They are more susceptable to problems of finite-length arithmetic, such as noise generated by calculations, and limit cycles. (This is a direct consequence of feedback: when the output isn't computed perfectly and is fed back, the imperfection can compound.)
• They are harder (slower) to implement using fixed-point arithmetic.
Q3:- Why is the impulse response "infinite"?
A3The impulse response is "infinite" because there is feedback in the filter; if you put in an impulse (a single "1" sample followed by many "0" samples), an infinite number of non-zero values will come out (theoretically).
Q4:- What are IIR filters? What does "IIR" mean?
IIR filters are one of two primary types of digital filters used in Digital Signal Processing (DSP) applications (the other type being FIR). "IIR" means "Infinite Impulse Response".
Q5:- Why is the impulse response "infinite"?
The impulse response is "infinite" because there is feedback in the filter; if you put in an impulse (a single "1" sample followed by many "0" samples), an infinite number of non-zero values will come out (theoretically).
Q6:- Give one advantage of digital filter over analog filter?
A1:- Digital filter can have characteristics which are not possible with analog filter
Q7:-What is the limitation of approximation method
A7:-This technique is not suitable for high-Pass or band –reject Filter
Q8:- What is the limitation of approximation method
A8:- This technique is not suitable for high-Pass or band –reject Filter
LAB MANUAL (VII SEM ECE)
page 22

DIGITAL SIGNAL PROCESSING LAB (ECE‐429‐F)
Q9:-What is bilinear Transformation
A9:- bilinear Transformation is one-to one mapping from s-domain to the z-domain
Q10:-What are the various methods to design IIR filters
A10:- The various methods are
1) Approximation of derivatives 2) Impulse invariant method 3) Bilinear Transformation
LAB MANUAL (VII SEM ECE)
page 23

DIGITAL SIGNAL PROCESSING LAB (ECE‐429‐F)
EXPERIMENT NO. 6
AIM : To Design Finite Impulse Response.
FIR filter:
lowpass 1500 Hz,
High pass,2200hz,
Bandpass 1750 Hz,
Band stops 790 Hz.
PROGRAM :
#include "DSK6713_AIC23.h"
#include "lowp1500.cof"
//this file is added to initialize the DSK6713
// coefficient of low-pass filter file calculated from
MATLAB
#include "highp2200.cof" // coefficient of high-pass filter file calculated from
MATLAB
#include "bpass1750.cof" // coefficient of band-pass filter file calculated from
MATLAB
#include "bstop790.cof" // coefficient of band-stop filter file calculated from
MATLAB
Uint32 fs=DSK6713_AIC23_FREQ_8KHZ; // set the sampling frequency, Different sampling
Frequencies supported by AIC23 codec are 8,
16, 24, 32, 44.1, 48, and 96 kHz.
short FIR_number = 0;
int yn = 0;
//filter number
//variable declaration
short dly[N];
LAB MANUAL (VII SEM ECE)
//declare delay buffer of n values
page 24

DIGITAL SIGNAL PROCESSING LAB (ECE‐429‐F)
short h[4][N]; //co-efficients of 4 different filters
interrupt void c_int11() // ISR call, At each Interrupt, program execution goes
to the interrupt service routine
{
short i;
dly[0] = input_sample();
yn = 0;
for (i = 0; i< N; i++)
//variable declaration
//newest input @ top of buffer
//initialize filter output
//for loop takes in the value of i from 0 to N
yn +=(h[FIR_number][i]*dly[i]); //y(n) += h(LP#,i)*x(n-i)
for (i = N-1; i > 0; i--)
dly[i] = dly[i-1];
output_sample(yn >> 15);
//starting @ bottom of buffer
//update delays with data move
//output filter,the value in the buffer yn indexed by
the variable loop is written on to the codec.
return; // program execution goes back to while(1) and then
again starts listening for next interrupt and this
process goes on
}
void main()
{
short i;
for (i=0; i<N; i++)
//variable declaration
//for loop which takes in the value of i from 0 to N=4
and switches to corresponding filter co-efficients
LAB MANUAL (VII SEM ECE)
page 25

DIGITAL SIGNAL PROCESSING LAB (ECE‐429‐F)
{
dly[i] = 0;
h[0][i] = hlp[i];
h[1][i] = hhp[i];
h[2][i] = hbp[i];
h[3][i] = hbs[i];
}
comm_intr(); // ISR function is called, using the given
command
while(1); //program execution halts and it starts listening
for the interrupt which occur at every sampling
period Ts.
}
OUTPUT :
//init buffer
//start addr of lp1500 coeff
//start addr of hp2200 coeff
//start addr of bp1750 coeff
//start addr of bs790 coeff
LAB MANUAL (VII SEM ECE)
page 26

DIGITAL SIGNAL PROCESSING LAB (ECE‐429‐F)
QUESTION/ANSWER
Q1:-Give one advantage of digital filter over analog filter? A1:- Digital filter can have characteristics which are not possible with analog filter Q2:-What are main disadvantages of digital filter compared with analog filter? A2:- Speed limitation Q3:-What does IIR filter stand for A3:- Infinite duration unit pulse response Q4:-What does FIR filter stand for A4:- Infinite duration unit pulse response Q5:-what is the advantage of FIR filter over IIR filter A5:- They are always stable, have exact linear phase Q6:- What are the methods of designing FIR filters A6:- Parks-McClellan, Windowing, Direct Calculation A6:-Fourier series Method, Frequency Sampling Method Q7:-What are the various window Techniques to design FIR filter A7: Rectangular window, Hamming Window Function, Hanning window, Function, Blackman Window Function Q8:-define the term Impulse Response of FIR filter A8- The "impulse response" of a FIR filter is actually just the set of FIR coefficients. (If you put an "impluse" into a FIR filter which consists of a "1" sample followed by many "0" samples, the output of the filter will be the set of coefficients, as the 1 sample moves past each coefficient in turn to form the output.) Q9:- Define the term Transition Band Transition Band - The band of frequencies between passband and stopband edges. The narrower the transition band, the more taps are required to implement the filter. (A "small" transition band results in a "sharp" filter.) Q10:- What is the Z transform of a FIR filter?
LAB MANUAL (VII SEM ECE)
page 27

DIGITAL SIGNAL PROCESSING LAB (ECE‐429‐F)
EXPERIMENT NO. 7
AIM : To study Linear Convolution technique.
PROGRAM :
# include<stdio.h> // stdio.h, which stands for "standard input/output header", is the header in the C standard library that contains macro definitions, constants, and declarations of functions and types used for various standard input and output operations.
// arrays initialization int x[15],h[15],y[15]; void main() { int i,j,m,n;
printf("enter the value of m");
scanf("%d",&m); printf("enter the value of n");
scanf("%d",&n);
printf("enter the value of input x");
for (i = 0;i<m;i++) scanf("%d",& x[i] ); printf("enter the value of input h");
for (i = 0;i<n;i++) scanf("%d",& h[i] );
// variable declaration
// displays the line on the CCS screen & ask the user to enter the no. of values of first sequences. // scans the user input & display it on the window // displays the line on the CCS screen & ask the user to enter the no. of values of second sequences // scans the user input & display it on the window
// enter the input sequence. it takes the no. of digits as specified earlier // in the loop it takes in the value of i less than m // scans the user input & display it on the window // enter the input sequence. it takes the no. of digits as specified earlier // in the loop it takes in the value of i less than n // scans the user input & display it on the window
//padding of zeros // makes all values of x equlas to zero to avoid the garbage value
// makes all values of h equlas to zero
for (i = m;i<=m+n-1;i++)
x[i] = 0; for (i = n;i<=m+n-1;i++) h[i] = 0;
// convolution operation for(i = 0;i<= m+n-1;i++) { y[i] = 0; for (j=0;j<=i;j++)
LAB MANUAL (VII SEM ECE)
// takes in values uptil m+n-1
page 28

DIGITAL SIGNAL PROCESSING LAB (ECE‐429‐F)
y[i] =y[i] + (x[j]* h[i-j]); multiplied with the
// second sequence i.e., h is shifted and is
first sequence x } for( i= 0;i<m+n-1;i++) printf("\n the value of output y[%d] = %d",i,y[i]); // displays the line on the CCS
window & displays the convolved output.
}
INPUT :
LAB MANUAL (VII SEM ECE)
page 29

DIGITAL SIGNAL PROCESSING LAB (ECE‐429‐F)
OUTPUT :
LAB MANUAL (VII SEM ECE)
page 30

DIGITAL SIGNAL PROCESSING LAB (ECE‐429‐F)
QUESTION/ANSWER
Q1:-how to classify signals? discreet time/continous time, periodic/nonperiodic Q2:-what is the use of random signals? for testing systems dynamic response statistically for very small amplitudes and time durations. Q3:-how to classify systems? A3:-linear, stable, time invariant Q4:-what's the difference between correlation & convolution? how to obtain convolution from correlation operator *? A4:-conv(h,x) = h*(-x) Q5:-what are the characteristics of a transient response of a system? A5:-decay time, rise time, peak time, max overshoot, settling time Q6.What is correlation? A6 Correlation quantifies the strength of a linear relationship between two variables. When there is no correlation between two variables, then there is no tendency for the values of the variables to increase or decrease in tandem. Two variables that are uncorrelated are not necessarily independent, however, because they might have a nonlinear relationship. Q7. What are the applications of correlation? A7. It has applications that computes and plots the sample autocorrelation function (ACF) of a univariate, stochastic time series . Q8. What is auto-correlation? A8 The autocorrelation function of a random signal describes the general dependence of the values of the samples at one time on the values of the samples at another time.
Q9. What is cross-correlation? A9 The cross correlation function however measures the dependence of the values of one signal on another signal. Q10:- Give one disadvantages of Fourier ? A10:-Fourier is not applicable for unit step, unit ramp and sinusoidal functions,this is overcome in Laplace.
LAB MANUAL (VII SEM ECE)
page 31

DIGITAL SIGNAL PROCESSING LAB (ECE‐429‐F)
EXPERIMENT NO. 8
AIM : To generate the Amplitude Shift Keying Modulation .
PROGRAM :
#include <std.h> #include "rtdxaskcfg.h"
#include "dsk6713_aic23.h" #include "dsk6713.h" #include <rtdx.h> #include "target.h"
//for input-output analyses //this configuration file is added for Real time analysis. It is a BIOS file //codec-DSK support file //codec-DSK support file //RTDX channel file is included //for init interrupt
#define BUFSIZE 64//# of points for buffer #define BUFFERLENGTH 64 #define SINE_TABLE_SIZE// Length of sine wave table #define table_size 4// size of table=8 Uint32 fs = DSK6713_AIC23_FREQ_24KHZ; //set sampling rate
/* Codec configuration settings */ DSK6713_AIC23_Config config = { 0x0017, // 0 DSK6713_AIC23_LEFTINVOL Left line input channel volume 0x0017, // 1 DSK6713_AIC23_RIGHTINVOL Right line input channel volume 0x00d8, // 2 DSK6713_AIC23_LEFTHPVOL Left channel headphone volume 0x00d8, // 3 DSK6713_AIC23_RIGHTHPVOL Right channel headphone volume 0x0011, // 4 DSK6713_AIC23_ANAPATH Analog audio path control 0x0000, // 5 DSK6713_AIC23_DIGPATH Digital audio path control 0x0000, // 6 DSK6713_AIC23_POWERDOWN Power down control 0x0043, // 7 DSK6713_AIC23_DIGIF Digital audio interface format 0x0001, // 8 DSK6713_AIC23_SAMPLERATE Sample rate control 0x0001 // 9 DSK6713_AIC23_DIGACT Digital interface activation }; typedef Int sample;// representation of a data sample from A2D sample inp_buffer[BUFSIZE];// Global declarations sample out_buffer[BUFFERLENGTH]; Int volume=0;// = MINVOLUME; the scaling factor for volume control
LAB MANUAL (VII SEM ECE)
page 32

DIGITAL SIGNAL PROCESSING LAB (ECE‐429‐F)
/* RTDX channels */ RTDX_CreateInputChannel(control_channel); RTDX_CreateInputChannel(A2D_channel); RTDX_CreateOutputChannel(D2A1_channel); RTDX_CreateOutputChannel(D2A2_channel); RTDX_CreateOutputChannel(D2A3_channel);
// create contol channel // create input channel // create output channel1 // create output channel2 // create output channel3
int sine_table[SINE_TABLE_SIZE]={0,7070,10000,7070,0,-7070,-10000,-7070}; //coefficients of Sine-wave int out_buffer[64];//output buffer int i,j=0,k=0,msec=0;//variable declaration int l=0,m=0,loop=0; int data_table[table_size];//data table array int sqr_data[64];//data table array int sine_buffer[64];//data table array sample *input = inp_buffer;// inp_buffer data is stored into a variable of pointer type Uns size = BUFSIZE;
void main() { DSK6713_AIC23_CodecHandle hCodec; DSK6713_init();
hCodec = DSK6713_AIC23_openCodec(0, &config); DSK6713_AIC23_setFreq(hCodec,fs); frequency TARGET_INITIALIZE();// Enable RTDX interrupt RTDX_enableInput(&control_channel);// enable volume control input channel while (TRUE) { puts("Amplitude Shift Keying Example Started");/ /prints the line on CCS window if (!RTDX_channelBusy(&control_channel))// Read a new volume when the hosts send it { RTDX_readNB(&control_channel, &volume, sizeof(volume)); } while (!RTDX_isInputEnabled(&A2D_channel))// checks if Input channel (A2D) of RTDX channel is not
LAB MANUAL (VII SEM ECE)
//initialize the CODEC // Initialize the board support library, must be called first // Start the codec // Set the codec sample rate
page 33

DIGITAL SIGNAL PROCESSING LAB (ECE‐429‐F)
enabled {
#if RTDX_POLLING_IMPLEMENTATION RTDX_Poll();/* poll comm channel for input*/ #endif
} /*
* A2D: get digitized input (get signal from the host through RTDX). * If A2D_channel is enabled, read data from the host. */ RTDX_read(&A2D_channel, input, size*sizeof(sample)); // read data by DSK /* fill the data table to genarate the square table*/ for(i=0; i<=table_size/2; i++)//set 1st half of buffer data_table[i] = 0x7FFF;//with max value (2^15)-1 for(i=table_size/2;i<table_size;i++)//set 2nd half of buffer data_table[i] = 0;//with -(2^15) i=0; /* store the squarewave in sqr_data to display on the graph*/ for(i=0; i<table_size/2; i++) { sqr_data[k] = data_table[i];//output to buffer k++; if(k==BUFFERLENGTH) k=0; } for(i=table_size/2;i<table_size;i++) { sqr_data[k] = data_table[i];//output to buffer k++; if(k==BUFFERLENGTH) k=0; } RTDX_write(&D2A1_channel,sqr_data, size*sizeof(sample));// sends the sqr_data value on outputchannel1
(D2A1) of the RTDX
while(RTDX_writing) {
#if RTDX_POLLING_IMPLEMENTATION RTDX_Poll();/* poll comm channel for output */
LAB MANUAL (VII SEM ECE)
page 34

DIGITAL SIGNAL PROCESSING LAB (ECE‐429‐F)
#endif } for(loop=0;loop<SINE_TABLE_SIZE;loop++)
{ sine_buffer[j]= sine_table[loop]; j++; if (j== BUFFERLENGTH) j=0;
} RTDX_write(&D2A2_channel,sine_buffer, size*sizeof(sample)); // sends the sine_buffer
value on output channel1 (D2A1) of the RTDX while(RTDX_writing)
{ #if
RTDX_POLLING_IMPLEMENTATION RTDX_Poll(); #endif }
/* poll comm channel for output */
/* store the result in to out_buffer*/ for(i=0;i<table_size;i++)
{ if(data_table[i]>0)
{
for(loop=0;loop<SINE_TABLE_SIZE;loop++) { out_buffer[j] = sine_table[loop]; j++; if(j==BUFFERLENGTH) j=0;
//output to buffer //increment buffer count //if @ bottom reinit count
} }
else for(loop=0;loop<SINE_TABLE_SIZE;loop++) { out_buffer[j] = 0; j++;
LAB MANUAL (VII SEM ECE)
//output to buffer //increment buffer count
page 35

DIGITAL SIGNAL PROCESSING LAB (ECE‐429‐F)
if(j==BUFFERLENGTH) j=0; //if @ bottom reinit count
} } RTDX_write(&D2A3_channel,out_buffer, size*sizeof(sample)); // sends the out_buffer value
on output channel1(D2A1) of the RTDX while(RTDX_writing)
{ #if
RTDX_POLLING_IMPLEMENTATION RTDX_Poll(); /* poll comm channel for
output */
#endif
} }
} //end of while-loop // end of main program
OUTPUT :
LAB MANUAL (VII SEM ECE)
page 36

DIGITAL SIGNAL PROCESSING LAB (ECE‐429‐F)
QUESTION/ANSWER :-
Q1:- ASK ,PSK ,FSK and QAM are examples of which conversion A1:- Analog to Digital Conversion Q2:-AM and FM are the examples of which conversion A2:-Analog To Analog Conversion Q3:-IF baud rate is 400 for QPSK ,what is the bit rate A3:-800 bps Q4:-How many carrier frequencies are used in BASK A4:-one Q5:-What is modulation A5:- The technique of superimposing the message signal on the carrier is known as modulation Q6:-What is the purpose of digital modulation A6:-The purpose of digital modulation is to convert an information bearing discrete-time symbol into a continuous-time waveform Q7:-What does BASK stand for A7:- Binary Amplitude shift key Q8:-define Modulation A8:- modulation is the process of varying one or more properties of a high-frequency periodic waveform, called the carrier signal, with a modulating signal which typically contains information to be transmitted Q9:- Define Pulse modulation A9:- transfers a narrowband analog signal over an analog baseband channel as a two-level signal by modulating a pulse wave. Q10:- Define Amplitude modulation A10:- It is a technique in which amplitude of the carrier signal is varied in accordance to the instantaneous amplitude of the modulating signal
LAB MANUAL (VII SEM ECE)
page 37

DIGITAL SIGNAL PROCESSING LAB (ECE‐429‐F)
EXPERIMENT NO. 9
AIM : To generate the Frequency shift keying Modulation .
PROGRAM :
#include<std.h> #include "rtdxfskcfg.h"
//for input-output analyses //this configuration file is added for Real time analysis. It is a BIOS file
//codec-DSK support file //codec-DSK support file //RTDX channel file is included //for init interrupt //# of points for buffer
#include "dsk6713_aic23.h" #include "dsk6713.h" #include <rtdx.h> #include "target.h" #define BUFSIZE 64 #define BUFFERLENGTH 256 /* Length of sine wave table */ #define SINE_TABLE_SIZE 8 #define SINE_TABLE 36 /* size of table=8*/ #define table_size 8 /* Codec configuration settings */ DSK6713_AIC23_Config config = { 0x0017,
0x0017,
// 0 DSK6713_AIC23_LEFTINVOL Left line input channel volume // 1 DSK6713_AIC23_RIGHTINVOL Right line input channel volume
// 2 DSK6713_AIC23_LEFTHPVOL Left channel headphone volume // 3 DSK6713_AIC23_RIGHTHPVOL Right channel headphone volume
// 4 DSK6713_AIC23_ANAPATH Analog audio path control // 5 DSK6713_AIC23_DIGPATH Digital audio path control // 6 DSK6713_AIC23_POWERDOWN Power down control // 7 DSK6713_AIC23_DIGIF Digital audio interface format // 8 DSK6713_AIC23_SAMPLERATE Sample rate control // 9 DSK6713_AIC23_DIGACT Digital interface activation
0x00d8,
0x00d8,
0x0011,
0x0000,
0x0000,
0x0043,
0x0001,
0x0001
};
LAB MANUAL (VII SEM ECE) page 38

DIGITAL SIGNAL PROCESSING LAB (ECE‐429‐F)
typedef Int sample; /* Global declarations */ sample inp_buffer[BUFSIZE]; sample out_buffer[BUFFERLENGTH]; Int volume=0;
// representation of a data sample from A2D
// = MINVOLUME; the scaling factor for volume control
/* RTDX channels */ RTDX_CreateInputChannel(control_channel);// create contol channel RTDX_CreateInputChannel(A2D_channel);// create input channel RTDX_CreateOutputChannel(D2A1_channel);// create output channel1 RTDX_Create Output Channel(D2A2_channel);// create output channel2 RTDX_Create Output Channel(D2A3_channel);// create output channel3 Uint32 fs = DSK6713_AIC23_FREQ_24KHZ;//set sampling rate int sine_table[SINE_TABLE_SIZE]={0,7070,10000,7070,0,-7070,-10000,-7070}; //coefficients of
Sine- wave int sin_table[SINE_TABLE] = {//coefficients of square-wave 0, 1736, 3420, 5000, 6427, 7660, 8660, 9396, 9848, 10000, 9848, 9396, 8660, 7660, 6427, 5000, 3420, 1736, 0, -1736, -3420,-5000,-6427,-7660,-8660,-9396,-9848, -10000, -9848,-9396, -8660,-7660,-6427,-5000,-3420,-1736};
int out_buffer[BUFFERLENGTH]; int i; int j=0,k=0,msec=0; int l=0,m=0,loop=0; int data_table[table_size]; int sqr_data[BUFFERLENGTH]; int sine_buffer[BUFFERLENGTH]; sample *input = inp_buffer;
//output buffer //for buffer count //variable declaration
//data table array //data table array //data table array // inp_buffer data is stored into a variable of pointer type
Uns size = BUFSIZE; void main() { TARGET_INITIALIZE(); RTDX_enableInput(&control_channel);
while (TRUE) {
LAB MANUAL (VII SEM ECE)
// Enable RTDX interrupt //enable volume control input channel
page 39

DIGITAL SIGNAL PROCESSING LAB (ECE‐429‐F)
puts("Frequency Shift Keying Example Started");
if (!RTDX_channelBusy(&control_channel))
{
//prints the line on CCS window // Read a new volume when the hosts send it
RTDX_readNB(&control_channel, &volume, sizeof(volume)); }
while (!RTDX_isInputEnabled(&A2D_channel)) {
#if RTDX_POLLING_IMPLEMENTATION RTDX_Poll();/* poll comm channel for input*/ #endif
} RTDX_read(&A2D_channel, input, size*sizeof(sample)); /* fill the data table to genarate the square table*/ for(i=0; i<=table_size/2; i++)//set 1st half of buffer data_table[i] = 0x7FFF;//with max value (2^15)-1 for(i=table_size/2;i<table_size;i++)//set 2nd half of buffer data_table[i] = 0; //with -(2^15) i=0; /* store the squarewave in sqr_data to display on the graph*/ for(i=0; i<table_size/2; i++) { sqr_data[k] = data_table[i];//output to buffer k++; if(k==BUFFERLENGTH) k=0; } for(i=table_size/2;i<table_size;i++) { sqr_data[k] = data_table[i];//output to buffer k++; if(k==BUFFERLENGTH) k=0; } //i=0; RTDX_write(&D2A1_channel,sqr_data, size*sizeof(sample)); //printf("hello"); while(RTDX_writing) { #if RTDX_POLLING_IMPLEMENTATION RTDX_Poll();/* poll comm channel for output */ #endif } for(m=0;m<SINE_TABLE_SIZE;m++) {
LAB MANUAL (VII SEM ECE)
page 40

DIGITAL SIGNAL PROCESSING LAB (ECE‐429‐F)
sine_buffer[l] = sine_table[m];//output to buffer l++; if(l==BUFFERLENGTH) l=0;//if @ bottom reinit count } RTDX_write(&D2A2_channel,sine_buffer, size*sizeof(sample)); //printf("hello"); while(RTDX_writing){ #if RTDX_POLLING_IMPLEMENTATION RTDX_Poll();/* poll comm channel for output */ #endif } /* store the result in to out_buffer*/ for(i=0;i<table_size;i++) { if(data_table[i]>0) { for(loop=0;loop<SINE_TABLE_SIZE;loop++) { out_buffer[j] = sine_table[loop];//output to buffer j++;//increment buffer count if(j==BUFFERLENGTH) j=0;//if @ bottom reinit count } } else for(loop=0;loop<SINE_TABLE;loop++) { out_buffer[j] = sin_table[loop];//output to buffer j++;//increment buffer count if(j==BUFFERLENGTH) j=0;//if @ bottom reinit count } } //loop=0; //i=0; RTDX_write(&D2A3_channel,out_buffer, size*sizeof(sample)); //printf("hello"); while(RTDX_writing) { #if RTDX_POLLING_IMPLEMENTATION RTDX_Poll();/* poll comm channel for output */ #endif } } }
LAB MANUAL (VII SEM ECE)
page 41

DIGITAL SIGNAL PROCESSING LAB (ECE‐429‐F)
OUTPUT :
LAB MANUAL (VII SEM ECE)
page 42

DIGITAL SIGNAL PROCESSING LAB (ECE‐429‐F)
QUESTION /ANSWERS:
Q1.What is the use of the command “include <std.h>”
A1.for input-output analyses
Q2. What is the use of the command “include rtdxfskcfg.h “
A2.In this command the configuration file is added for Real time Q3.What is the use of for loop A3. The for loop is used mainly to increment variables, or count or sort a quantity of data (usually stored in an array). Q4.Why do we use the command STRLEN in c A4. strlen calculates the number of characters in the given string
Q5 Why do we use of the command “STRREV” in C language
A5.”strrev reverses all characters in the given string (except the terminating character) and returns a pointer to the reversed string
Q6.Difference between deterministic and non deterministic signal
A6. Deterministic signal are random in nature
Q7.What is the difference between Fourier series and transform
A7.Fourier series is drawn for periodic signal and Fourier transform for non periodic signal
Q8.What is meant by discrete time processing
A8.discrete time processing is done by transforming the continous time signal into small interval by sampling the signal into discrete intervals
Q9 What is the purpose of digital modulation A9:-The purpose of digital modulation is to convert an information bearing discrete-time symbol into a continuous-time waveform Q10.What is digital filter A10. Digital filter is one in which both the i/p and o/p are discrete time signal
LAB MANUAL (VII SEM ECE)
page 43

DIGITAL SIGNAL PROCESSING LAB (ECE‐429‐F)
EXPERIMENT NO.10
AIM: ‐To Generate the sine ,square, triangular wave using lookup table and produces an
output stream.
PROGRAMS: ‐
Sine Wave: ‐
**Program To generate the sine wave.
#include <std.h>
#include <log.h>
#include <rtdx.h>
//for rtdx support
#include "rtdxsinecfg.h" //this configuration file is added for Real time
analysis. It is a BIOS file
#include "target.h"
#define BUFSIZE 64
#define BUFFERLENGTH 64
#define MINVOLUME 1
typedef Int sample; from A2D
// representation of a data sample
//for init interrupt
sample inp_buffer[BUFSIZE];
int out_buffer[BUFFERLENGTH];
Int volume=0;
LAB MANUAL (VII SEM ECE)
// Global declarations
// = MINVOLUME; the scaling factor for
page 44

DIGITAL SIGNAL PROCESSING LAB (ECE‐429‐F)
Volume control
/* RTDX channels */
RTDX_CreateInputChannel(control_channel); // create contol channel
RTDX_CreateInputChannel(A2D_channel); // create input channel
RTDX_CreateOutputChannel(D2A1_channel);
/*
* ======== main ========
*/
Void main()
{
sample *input = inp_buffer; // inp_buffer data is stored into a variable of
// create output channel
pointer type.
Uns size = BUFSIZE;
int sin_table[8] = {0,707,1000,707,0,‐707,‐1000,‐707}; //look‐up table for sine‐wave generation
int i=0,loop=0;
TARGET_INITIALIZE(); // init for interrupt
LOG_printf(&trace,"\n Sine Wave Example Started"); //print the specified line on CCS
// variable declaration
window
RTDX_enableInput(&control_channel);
LAB MANUAL (VII SEM ECE)
// enable input channel for control
// Infinite loop while (TRUE)
{
page 45
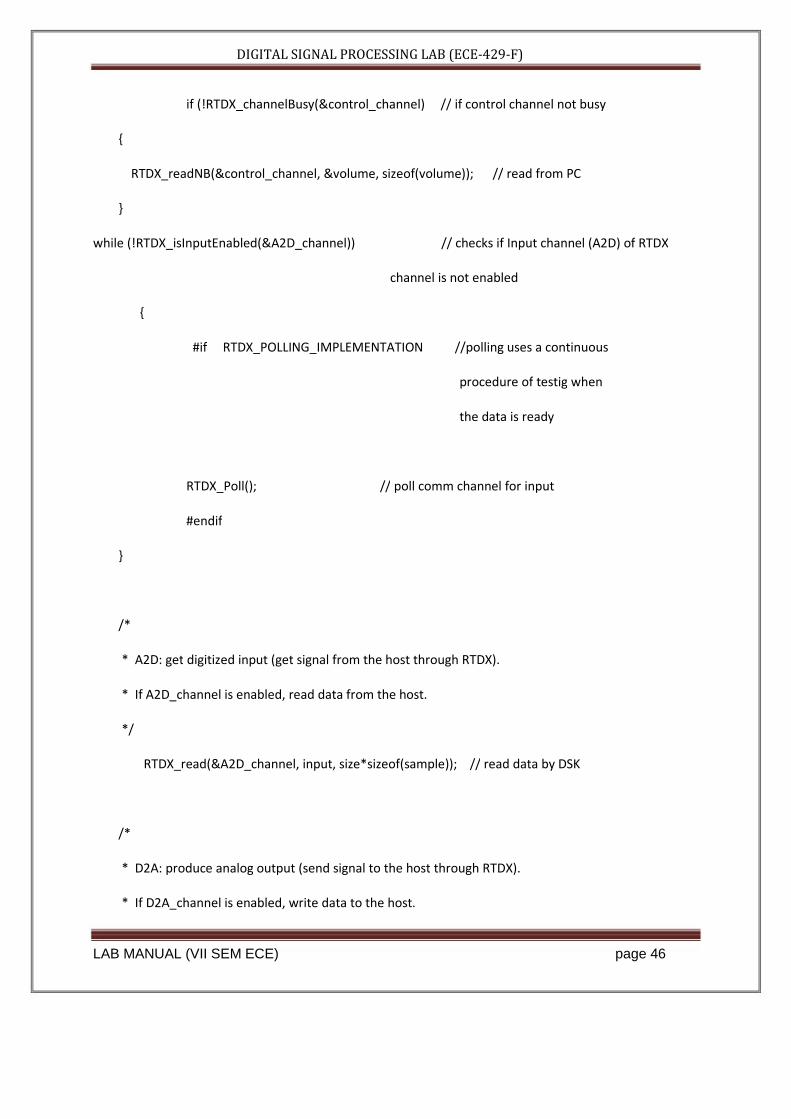
DIGITAL SIGNAL PROCESSING LAB (ECE‐429‐F)
{
if (!RTDX_channelBusy(&control_channel) // if control channel not busy
RTDX_readNB(&control_channel, &volume, sizeof(volume)); // read from PC
}
while (!RTDX_isInputEnabled(&A2D_channel)) // checks if Input channel (A2D) of RTDX
channel is not enabled
{
#if RTDX_POLLING_IMPLEMENTATION //polling uses a continuous
procedure of testig when
the data is ready
}
/*
* A2D: get digitized input (get signal from the host through RTDX).
* If A2D_channel is enabled, read data from the host.
*/
RTDX_read(&A2D_channel, input, size*sizeof(sample)); // read data by DSK
/*
* D2A: produce analog output (send signal to the host through RTDX).
* If D2A_channel is enabled, write data to the host.
LAB MANUAL (VII SEM ECE)
RTDX_Poll(); // poll comm channel for input
#endif
page 46

DIGITAL SIGNAL PROCESSING LAB (ECE‐429‐F)
*/
out_buffer[i]= sin_table[loop]; // puts the sine_table points &
stores it into output buffer
i++; // increment by 1 data from PC
if (i== BUFFERLENGTH) // takes in the value of sine‐
wave uptil the bufferlength
i=0;
if (++loop >7)
loop = 0;
RTDX_write(&D2A1_channel,out_buffer, size*sizeof(sample) // send data from DSK to
RTDX channel
printf("hello"); // prints "hello" on the
CCS window
while(RTDX_writing) // for writing on RTDX
channel
{
#if RTDX_POLLING_IMPLEMENTATION
RTDX_Poll(); // poll comm channel for output
#endif
} } }
Output: ‐
LAB MANUAL (VII SEM ECE)
page 47

DIGITAL SIGNAL PROCESSING LLAB (ECE‐4429‐F)
LAB MAANUAL (VII SEM ECE)
page 48

DIGITAL SIGNAL PROCESSING LAB (ECE‐429‐F)
Square Wave: ‐
**Program To generate the Square wave.
#include <std.h> #include "rtdxsqurecfg.h" //this configuration file is added for Real time analysis. It is a BIOS file #include "dsk6713_aic23.h" //this file is added to initialize the DSK6713 #include "dsk6713.h" #include <log.h> #include <rtdx.h> //for rtdx support #include "target.h" //for init interrupt // define the buffersize #define BUFSIZE 64 #define BUFFERLENGTH 64 // define the bufferlength #define table_size 8 //size of table=48 typedef Int sample; // representation of a data sample from A2D sample inp_buffer[BUFSIZE]; // Global declarations sample out_buffer[BUFFERLENGTH]; Int volume=0; // = MINVOLUME; the scaling factor for volume control /* RTDX channels */
LAB MANUAL (VII SEM ECE)
page 49

DIGITAL SIGNAL PROCESSING LAB (ECE‐429‐F)
RTDX_CreateInputChannel(control_channel); // create contol channel RTDX_CreateInputChannel(A2D_channel); // create input channel RTDX_CreateOutputChannel(D2A1_channel); // create output channel int data_table[table_size]; //data table array sample *input = inp_buffer; // inp_buffer data is stored into a variable of pointer type. Uns size = BUFSIZE; int i=0,j=0; // variable daclaration /* * ======== main ======== */ Void main() { TARGET_INITIALIZE(); // Enable RTDX interrupt LOG_printf(&trace,"\n Square Wave Example Started"); //print the specified line on CCS window RTDX_enableInput(&control_channel); // enable volume control input channel while (TRUE) { if (!RTDX_channelBusy(&control_channel)) // Read a new volume when the hosts send it { RTDX_readNB(&control_channel, &volume, sizeof(volume)); // read from PC } while (!RTDX_isInputEnabled(&A2D_channel)) { #if RTDX_POLLING_IMPLEMENTATION RTDX_Poll(); // poll comm channel for input #endif } /* * A2D: get digitized input (get signal from the host through RTDX). * If A2D_channel is enabled, read data from the host. */ RTDX_read(&A2D_channel, input, size*sizeof(sample)); // read data by DSK /* * D2A: produce analog output (send signal to the host through RTDX).
LAB MANUAL (VII SEM ECE)
page 50

DIGITAL SIGNAL PROCESSING LAB (ECE‐429‐F)
* If D2A_channel is enabled, write data to the host. */ for(i=0; i<=table_size/2; i++) //set 1st half of buffer { data_table[i] = 0x7FFF; //with max value (2^15)‐1 } for(i=table_size/2;i<table_size;i++) //set 2nd half of buffer { data_table[i] = ‐0x8000; //with ‐(2^15) } i = 0; for(i=0; i<table_size/2; i++) { out_buffer[j] = data_table[i]; //output to buffer j++; if(j==BUFFERLENGTH) j=0; } for(i=table_size/2;i<table_size;i++) { out_buffer[j] = data_table[i]; //output to buffer j++; if(j==BUFFERLENGTH) j=0; } i=0; RTDX_write(&D2A1_channel,out_buffer, size*sizeof(sample)); printf("hello"); // prints "hello" on the CCS window while(RTDX_writing) // for writing on RTDX channel { #if RTDX_POLLING_IMPLEMENTATION RTDX_Poll(); // poll comm channel for output #endi } } }
LAB MANUAL (VII SEM ECE)
page 51

DIGITAL SIGNAL PROCESSING LLAB (ECE‐4429‐F)
Output: ‐
LAB MAANUAL (VII SEM ECE)
page 52

DIGITAL SIGNAL PROCESSING LAB (ECE‐429‐F)
Triangular Wave: ‐
**Program To generate the Triangular wave.
#include <std.h> #include"rtdxtrangcfg.h" //this configuration file is added for Real time analysis. #include "dsk6713_aic23.h" //this file is added to initialize the DSK6713 #include "dsk6713.h" #include <log.h> #include <rtdx.h> //for rtdx support #include "target.h" //for init interrupt #define BUFSIZE 64 // define the buffersize #define BUFFERLENGTH 64 // define the bufferlength #define TABLE_SIZE 24 // Length of sine wave table typedef Int sample; // representation of a data sample from A2D sample inp_buffer[BUFSIZE]; // Global declarations Int volume=0; // = MINVOLUME; the scaling factor for volume control /* RTDX channels */ RTDX_CreateInputChannel(control_channel); // create control channel RTDX_CreateInputChannel(A2D_channel); // create input channel RTDX_CreateOutputChannel(D2A1_channel); // create output channel int out_buffer[64]; //output buffer int loop=0,i=0; // variable daclaration sample *input = inp_buffer; // inp_buffer data is stored into a variable of pointer type. Uns size = BUFSIZE; int trang_table[TABLE_SIZE]= // co‐efficients (points) for trangular wave generation { 0,2000,4000,6000,8000,10000,12000,10000,8000,6000, 4000,2000,0,‐2000,‐4000,‐6000,‐8000,‐10000,‐12000,‐10000, ‐8000,‐6000,‐4000,‐2000 }; //table values void main()
LAB MANUAL (VII SEM ECE)
page 53

DIGITAL SIGNAL PROCESSING LAB (ECE‐429‐F)
{ TARGET_INITIALIZE(); // Enable RTDX interrupt LOG_printf(&trace,"\n Trangularwave example started"); //print the specified line on CCS RTDX_enableInput(&control_channel); // enable volume control input channel while (TRUE) { if (!RTDX_channelBusy(&control_channel)) // Read a new volume when the h { RTDX_readNB(&control_channel, &volume, sizeof(volume)); // read from PC } while (!RTDX_isInputEnabled(&A2D_channel)) // checks if Input channel (A2D) of RTDX channel is not enabled { #if RTDX_POLLING_IMPLEMENTATION RTDX_Poll(); // poll comm channel for input #endif } /* * A2D: get digitized input (get signal from the host through RTDX). * If A2D_channel is enabled, read data from the host. */ RTDX_read(&A2D_channel, input, size*sizeof(sample)); // read data by DSK /* * D2A: produce analog output (send signal to the host through RTDX). * If D2A_channel is enabled, write data to the host. */ out_buffer[i] = trang_table[loop]; //output to buffer i++; if(i==BUFFERLENGTH) i=0; //if @ bottom reinit count if (++loop > 23) loop = 0; RTDX_write(&D2A1_channel,out_buffer, size*sizeof(sample)); // send data from DSK to RTDX c printf("hello"); // prints "hello" on the CCS window while(RTDX_writing) // for writing on RTDX channel
LAB MANUAL (VII SEM ECE)
page 54

DIGITAL SIGNAL PROCESSING LLAB (ECE‐4429‐F)
{ #if RTDX_POLLINGG_IMPLEMENTATION
oll(); // ppoll comm chhannel for ouutput RTDX_Po #endif } } }
Output: ‐
LAB MAANUAL (VII SEM ECE)
page 55

DIGITAL SIGNAL PROCESSING LAB (ECE‐429‐F)
QUESTION/ANSWER
Q1.What is look up table A1. A LookupTable is an unordered collection of values; each value indexed by a "key," which is a value of any type that's used to look up a value stored in the collection. In effect, this class provides what some programming languages call an "associative array," because it allows a value to be associated with an arbitrary key, and then efficiently found given the same key. Q2. Which operator we will use to create look up table A2: local tab = new LookupTable(); Q3 . What is a local block? A local block is any portion of a C program that is enclosed by the left brace ({) and the right brace (}). A C function contains left and right braces, and therefore anything between the two braces is contained in a local block. An if statement or a switch statement can also contain braces, so the portion of code between these two braces would be considered a local block. 4. When is a switch statement better than multiple if statements? A switch statement is generally best to use when you have more than two conditional expressions based on a single variable of numeric type. 5. Is a default case necessary in a switch statement? No, but it is not a bad idea to put default statements in switch statements for error- or logic- checking purposes. 6. Can the last case of a switch statement skip including the break? Even though the last case of a switch statement does not require a break statement at the end, you should add break statements to all cases of the switch statement, including the last case. You should do so primarily because your program has a strong chance of being maintained by someone other than you who might add cases but neglect to notice that the last case has no break statement. This oversight would cause what would formerly be the last case statement to "fall through" to the new statements added to the bottom of the switch statement. Putting a break after each case statement would prevent this possible mishap and make your program more "bulletproof." Besides, most of today's optimizing compilers will optimize out the last break, so there will be no performance degradation if you add it. 7. Other than in a for statement, when is the comma operator used? The comma operator is commonly used to separate variable declarations, function arguments, and expressions, as well as the elements of a for statement. 8. How can you tell whether a loop ended prematurely? Generally, loops are dependent on one or more variables. Your program can check those variables outside the loop to ensure that the loop executed properly. 9. What is the difference between goto and long jmp( ) and setjmp()? A goto statement implements a local jump of program execution, and the longjmp() and setjmp() functions implement a nonlocal, or far, jump of program execution. Generally, a jump in execution of any kind should be avoided because it is not considered good programming practice to use such statements as goto and longjmp in your program. A goto statement simply bypasses code in your program and jumps to a predefined position. To use the goto statement, you give it a labeled position to jump to. This predefined position must be within the same function.
LAB MANUAL (VII SEM ECE)
page 56

DIGITAL SIGNAL PROCESSING LAB (ECE‐429‐F)
10. 9. What is an l value? An l value is an expression to which a value can be assigned. The lvalue expression is located on the left side of an assignment statement, whereas an rvalue is located on the right side of an assignment statement. Each assignment statement must have an lvalue and an rvalue. The lvalue expression must reference a storable variable in memory. It cannot be a constant.
LAB MANUAL (VII SEM ECE)
page 57