
Final Technical Report - E-SMARRT Technical Report Report Date: July 22, 2011 Project Title: ......
112
Final Technical Report Report Date: July 22, 2011 Project Title: Simulation of Distortion and Residual Stress Development During Heat Treatment of Steel Castings DOE Award No: DE-FC36-04GO14230 Project Period: January 1, 2004 through June 30, 2011 Investigator: Christoph Beckermann (Principal Investigator) phone: (319) 335-5681 e-mail: [email protected] Kent Carlson (Author): phone: (319) 335-6075 e-mail: [email protected] Recipient Organization: The University of Iowa Iowa City, Iowa 52242 Partners: MAGMA Foundry Technologies Steel Founders’ Society of America (SFSA) SFSA Member Foundries Deformation Control Technology, Inc.
Transcript of Final Technical Report - E-SMARRT Technical Report Report Date: July 22, 2011 Project Title: ......
Final Technical Report
Report Date: July 22, 2011 Project Title: Simulation of Distortion and Residual Stress Development
During Heat Treatment of Steel Castings DOE Award No: DE-FC36-04GO14230 Project Period: January 1, 2004 through June 30, 2011 Investigator: Christoph Beckermann (Principal Investigator) phone: (319) 335-5681 e-mail: [email protected] Kent Carlson (Author): phone: (319) 335-6075 e-mail: [email protected] Recipient Organization: The University of Iowa Iowa City, Iowa 52242 Partners: MAGMA Foundry Technologies Steel Founders’ Society of America (SFSA) SFSA Member Foundries Deformation Control Technology, Inc.

i
Acknowledgement, Disclaimer and Proprietary Data Notice Acknowledgement: This report is based upon work supported by the U. S. Department
of Energy under Award No. DE-FC36-04GO14230. Disclaimer: Any findings, opinions, and conclusions or recommendations
expressed in this report are those of the authors and do not necessarily reflect the views of the Department of Energy.
Proprietary Data Notice: This report does not contain any proprietary data. Report Availability: Reports are available free via the U.S. Department of Energy (DOE) Information Bridge Website: http://www.osti.gov/bridge Reports are available to DOE employees, DOE contractors, Energy Technology Data Exchange (ETDE) representatives, and Informational Nuclear Information System (INIS) representatives from the following source: Office of Scientific and Technical Information P.O. Box 62 Oak Ridge, TN 37831 Tel: (865) 576-8401 FAX: (865) 576-5728 E-mail: [email protected] Website: http://www.osti.gov/contract.html

ii
Table of Contents List of Acronyms .......................................................................................................................... iii List of Figures .............................................................................................................................. iv List of Tables ................................................................................................................................ v List of Appendices ....................................................................................................................... vi Executive Summary ..................................................................................................................... 1 Introduction .................................................................................................................................. 2 Background .................................................................................................................................. 3 Results and Discussion ................................................................................................................ 5 Benefits Assessment .................................................................................................................... 15 Commercialization ...................................................................................................................... 16 Accomplishments ........................................................................................................................ 17 Conclusions ................................................................................................................................. 18 Recommendations ....................................................................................................................... 19 References ................................................................................................................................... 20 Appendices .................................................................................................................................. 21

iii
List of Acronyms CMM coordinate measurement machine OQ oil quenched PUNB phenolic urethane no-bake SFSA Steel Founders’ Society of America WQ water quenched
iv
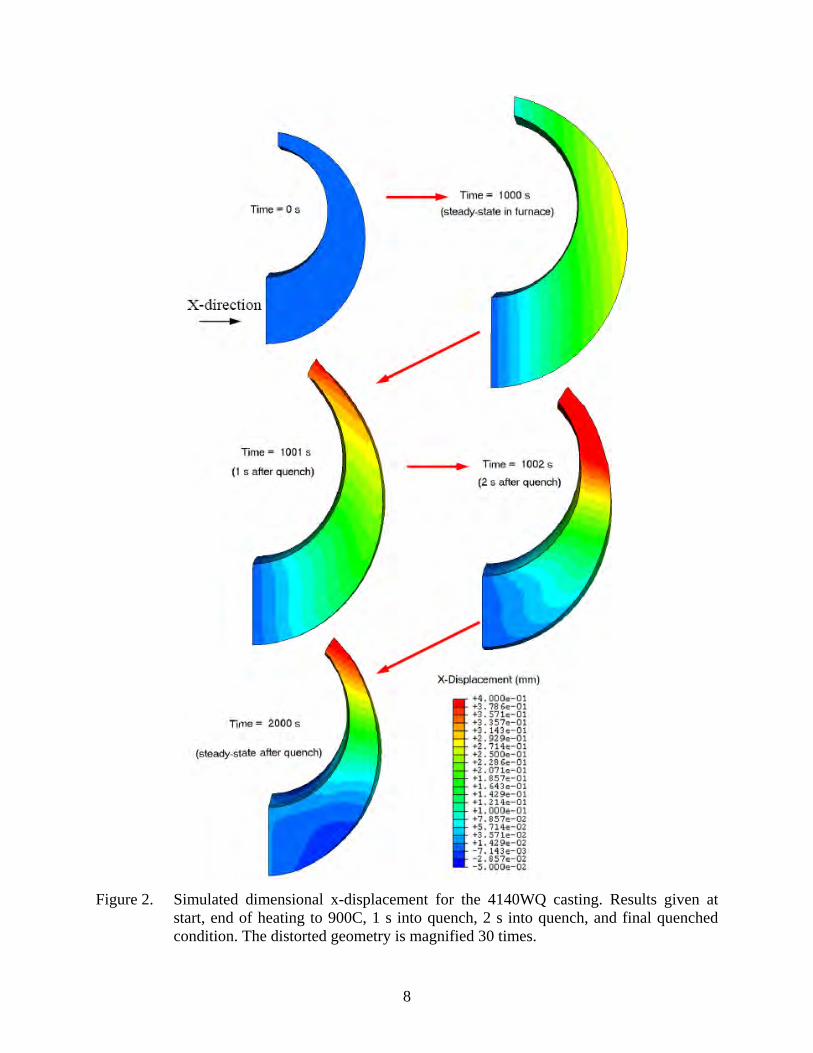
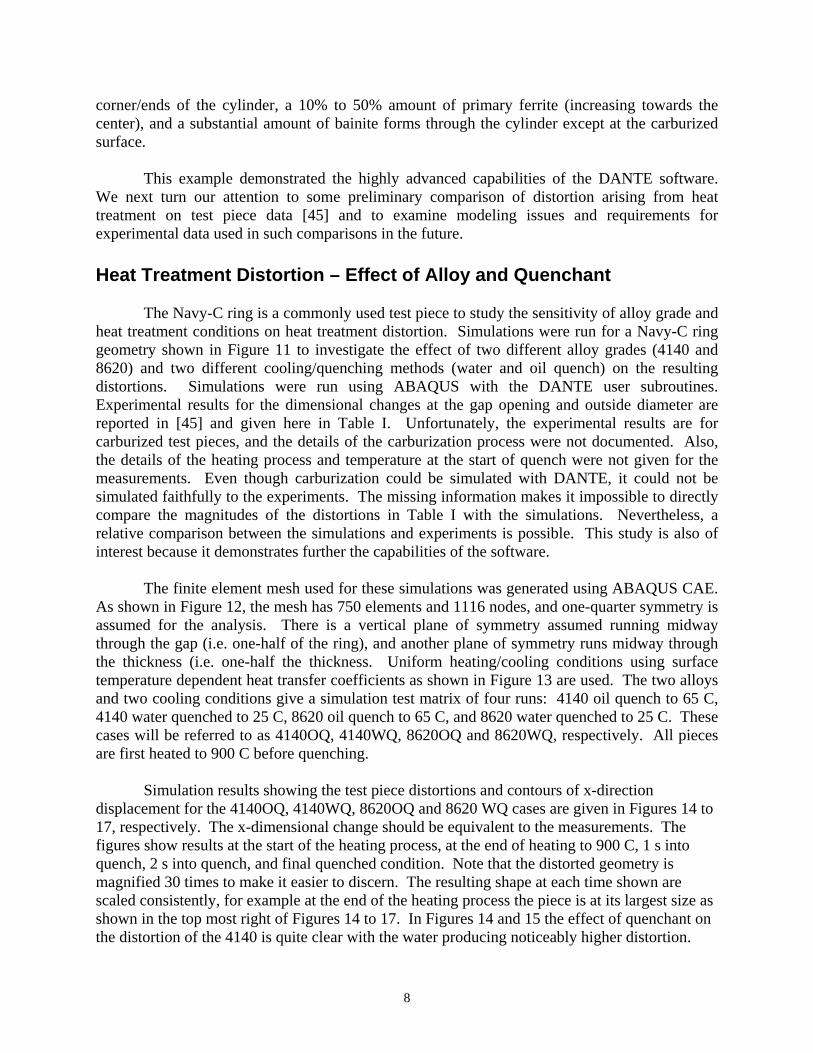
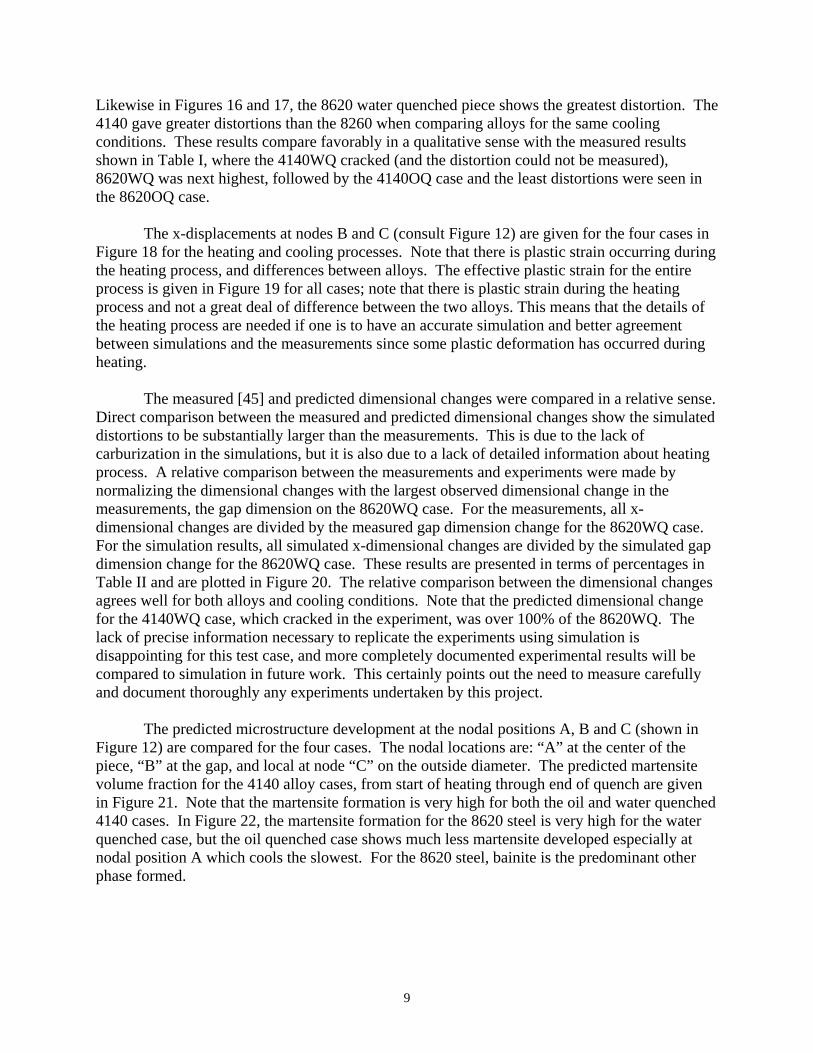
List of Figures Figure 1. Sketch of Navy-C ring test piece for quench distortion experiments from Ref. [3]. Figure 2. Simulated dimensional x-displacement for the 4140WQ casting. Results given at
start, end of heating to 900C, 1 s into quench, 2 s into quench, and final quenched condition. The distorted geometry is magnified 30 times.
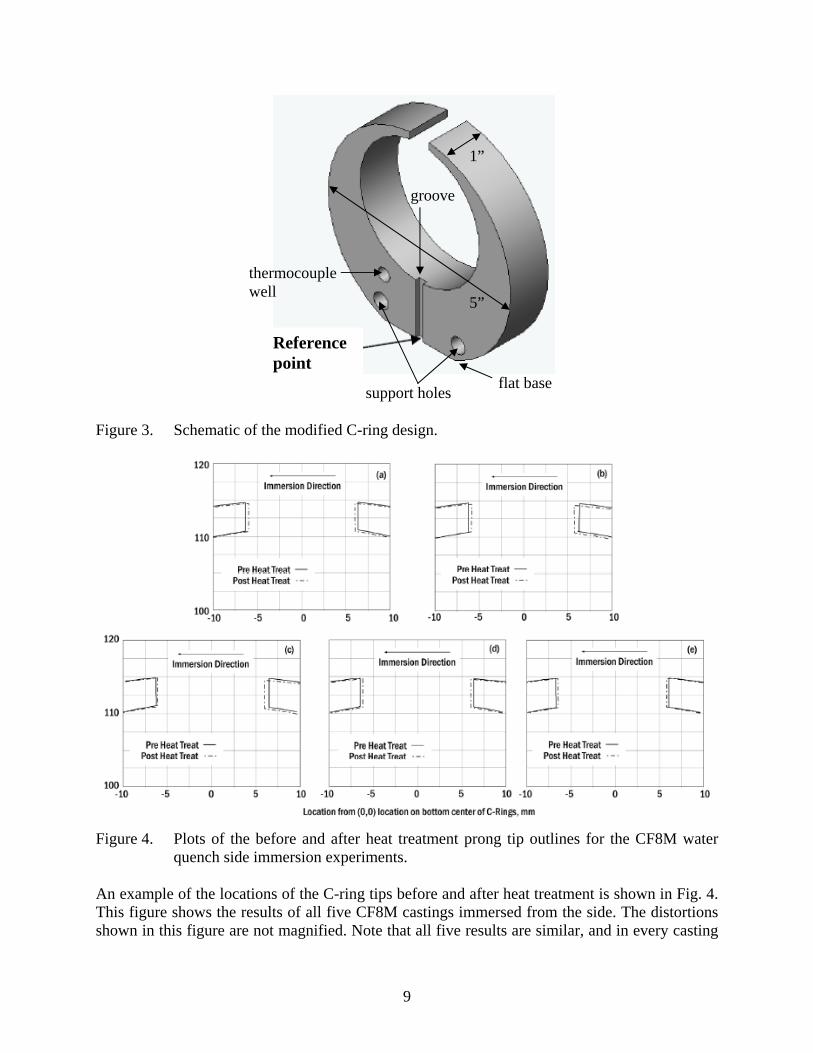
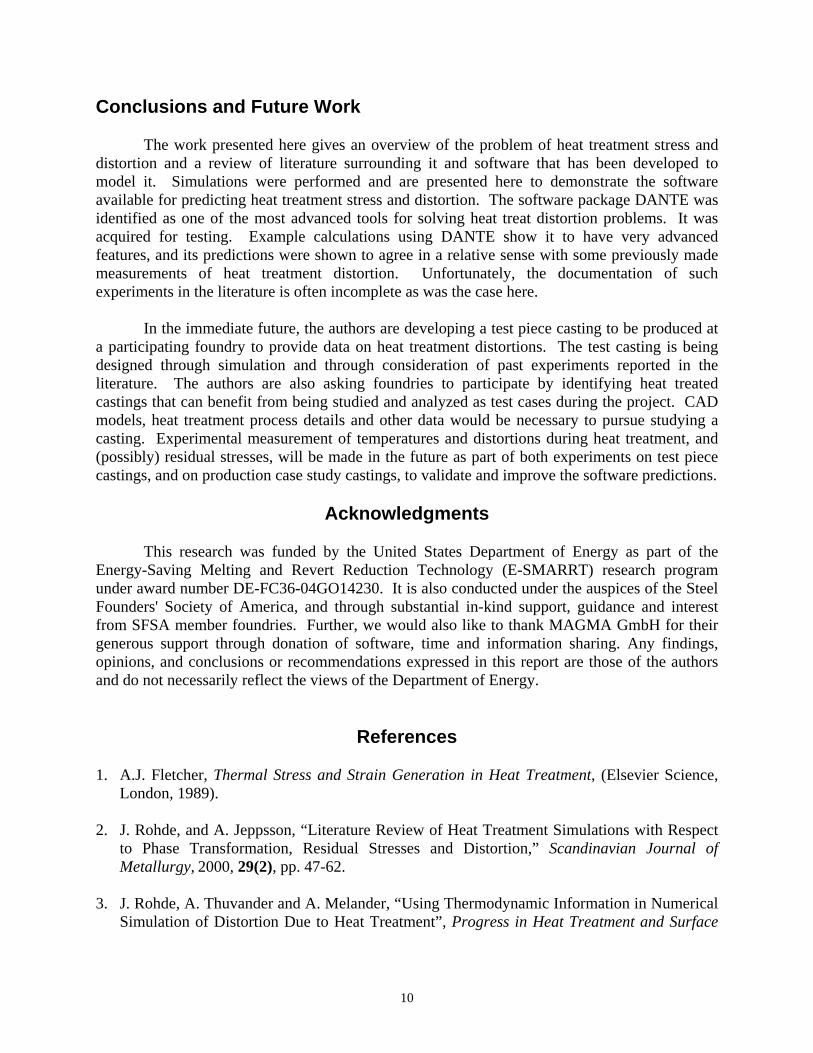
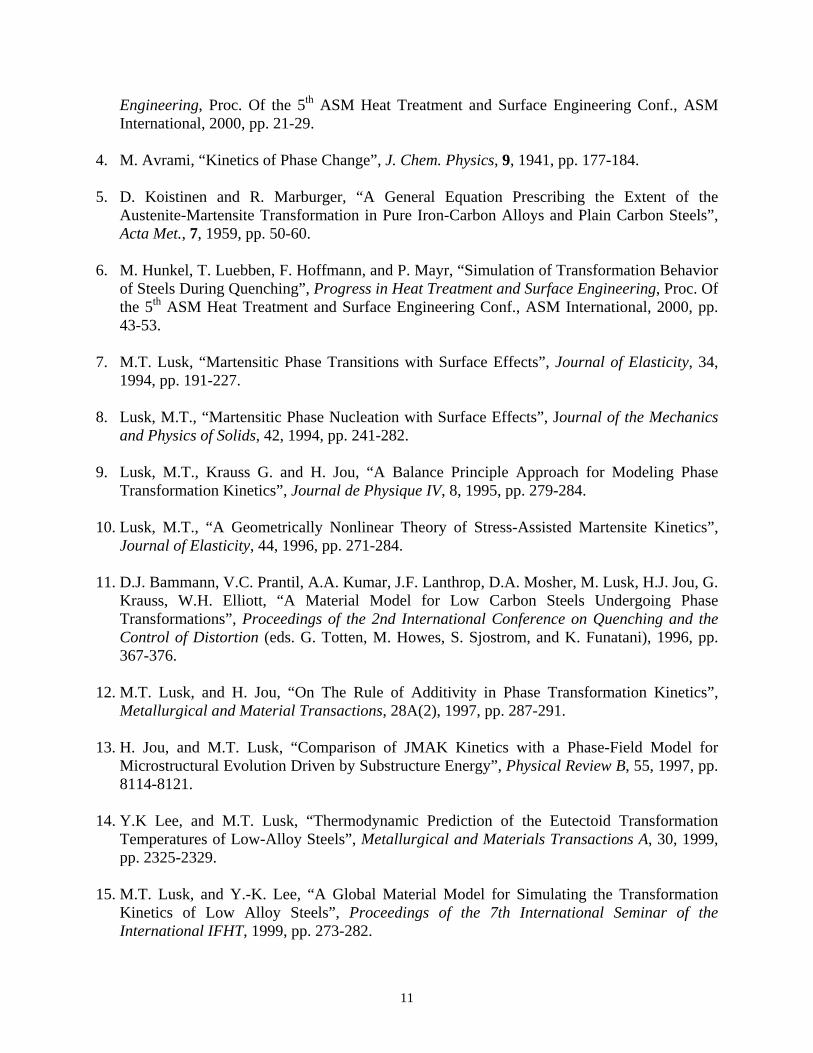
Figure 3. Schematic of the modified C-ring design. Figure 4. Plots of the before and after heat treatment prong tip outlines for the CF8M water
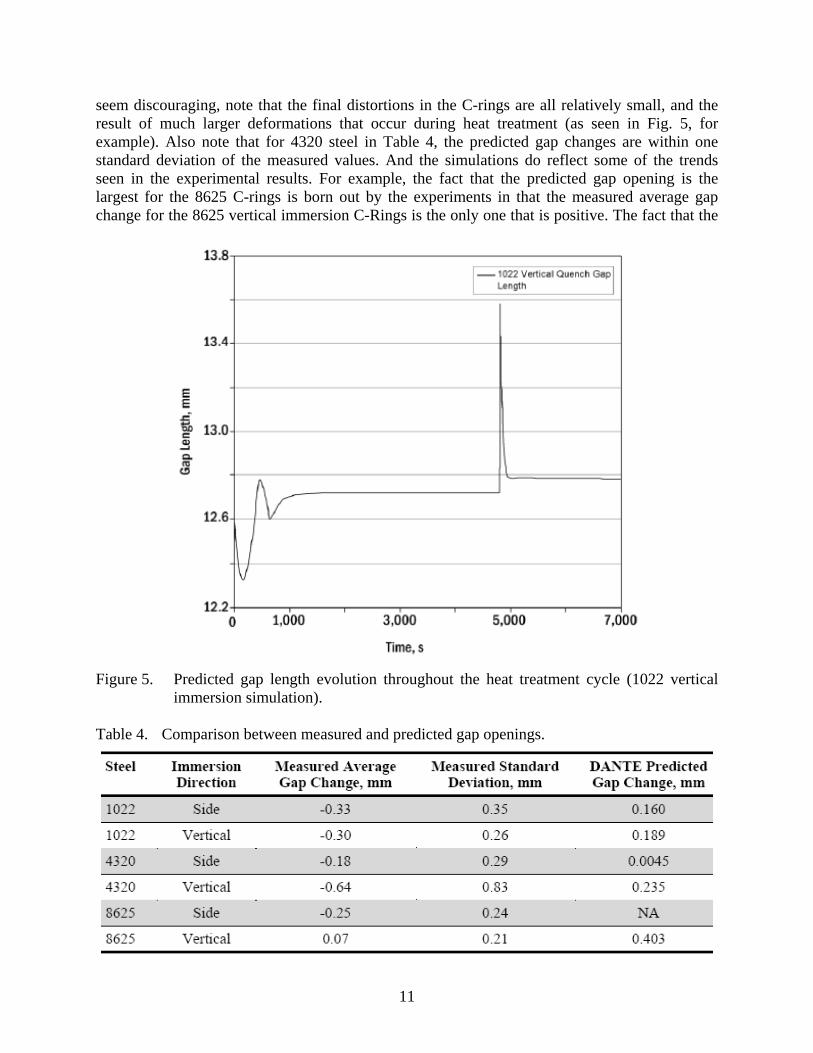
quench side immersion experiments. Figure 5. Predicted gap length evolution throughout the heat treatment cycle (1022 vertical
immersion simulation). Figure 6. Comparison of the elastic modulus variation with temperature for specimens heated
at 2°C/min and 8°C/min. Figure 7. Elastic modulus variation during heating and holding at an elevated temperature
until a constant steady-state value is attained. The holding temperatures are (a) 50°C, (b) 200°C, (c) 300°C, and (d) 370°C. The figures also show the measured retained elastic modulus after cooling to room temperature.

v
List of Tables Table 1. Dimensional changes in gap and diameter for Navy-C ring [3]. Table 2. Comparison between measured and predicted relative dimensional changes. Table 3. Summary of average gap openings for all eight sets of experiments. Table 4. Comparison between measured and predicted gap openings.

vi
List of Appendices Appendix A: “Simulation of Heat Treatment Distortion,” a paper by R.A. Hardin and C.
Beckermann in Proceedings of the 59th SFSA Technical and Operating Conference, 2005.
Appendix B: “Development of Heat Treatment Distortion of Cast Steel C-Rings,” a paper by
B.E. Brooks and C. Beckermann in Proceedings of the 61st SFSA Technical and Operating Conference, 2007.
Appendix C: “Measurement of Elastic Modulus of PUNB Bonded Sand as a Function of
Temperature,” a paper by J. Thole and C. Beckermann in Proceedings of the 63rd SFSA Technical and Operating Conference, 2009.
1
Executive Summary Heat treatment and associated processing, such as quenching, are critical during high strength steel casting production. These processes must be managed closely to prevent thermal and residual stresses that may result in distortion, cracking (particularly after machining), re-work, and weld repair. The risk of casting distortion limits aggressive quenching that can be beneficial to the process and yield an improved outcome. As a result of these distortions, adjustments must be made to the casting or pattern design, or tie bars must be added. Straightening castings after heat treatments can be both time-consuming and expensive. Residual stresses may reduce a casting’s overall service performance, possibly resulting in catastrophic failure. Stress relieving may help, but expends additional energy in the process. Casting software is very limited in predicting distortions during heat treatment, so corrective measures most often involve a tedious trial-and-error procedure. An extensive review of existing heat treatment residual stress and distortion modeling revealed that it is vital to predict the phase transformations and microstructure of the steel along with the thermal stress development during heat treatment. After reviewing the state-of-the-art in heat treatment residual stress and distortion modeling, an existing commercial code was selected because of its advanced capabilities in predicting phase transformations, the evolving microstructure and related properties along with thermal stress development during heat treatment. However, this software was developed for small parts created from forgings or machined stock, and not for steel castings. Therefore, its predictive capabilities for heat treatment of steel castings were investigated. Available experimental steel casting heat treatment data was determined to be of insufficient detail and breadth, and so new heat treatment experiments were designed and performed, casting and heat treating modified versions of the Navy-C ring (a classical test shape for heat treatment experiments) for several carbon and low alloy steels in order to generate data necessary to validate the code. The predicted distortions were in reasonable agreement with the experimentally measured values. However, the final distortions in the castings were small, making it difficult to determine how accurate the predictions truly are. It is recommended that further validation of the software be performed with the aid of additional experiments with large production steel castings that experience significant heat treatment distortions. It is apparent from this research that the mechanical properties of the bonded sand used for cores and sand molds are key in producing accurate stress simulation results. Because of this, experiments were performed to determine the temperature-dependent elastic modulus of a resin-bonded sand commonly utilized in the steel casting industry. The elastic modulus was seen to vary significantly with heating and cooling rates. Also, the retained room temperature elastic modulus after heating was seen to degrade significantly when the sand was heated above 125°C. The elastic modulus curves developed in this work can readily be utilized in casting simulation software. Additional experiments with higher heating rates are recommended to determine the behavior of the elastic modulus in the sand close to the mold-metal interface. The commercial heat treatment residual stress and distortion code, once fully validated, is expected to result in an estimated energy savings of 2.15 trillion BTU’s/year. Along with these energy savings, reduction of scrap and improvement in casting yield will result in a reduction of the environmental emissions associated with the melting and pouring of the metal which will be saved as a result of this technology.
2
Introduction Heat treatment and associated processing, such as quenching, are critical during high strength steel casting production. These processes must be managed closely to prevent thermal and residual stresses that may result in distortion, cracking (particularly after machining), re-work, and weld repair. The risk of casting distortion limits aggressive quenching that can be beneficial to the process and yield an improved outcome. As a result of these distortions, adjustments must be made to the casting or pattern design, or tie bars must be added. Straightening castings after heat treatments can be both time-consuming and expensive. Residual stresses may reduce a casting’s overall service performance, possibly resulting in catastrophic failure. Stress relieving may help, but expends additional energy in the process. Casting software is very limited in predicting distortions during heat treatment, so corrective measures most often involve a tedious trial-and-error procedure. The casting process must be considered when attempting to predict the final dimensions and residual stresses that may develop after heat treatment. As mentioned above, the present researchers are also investigating the stresses and distortions that develop during solidification and cooling, before the heat treatment stage begins. Extending modeling capabilities to the heat treatment processes, the researchers will examine micro-structural and property changes in the steel, in addition to heat transfer and stresses that develop during the heating and quenching processes. The proposed project will develop and verify a model for predicting the distortions and residual stresses that occur during heat treatment of steel castings. The goal of this project is to develop a model for predicting the distortions and residual stresses that develop during heat treatment of steel castings. Foundry engineers will then be able to reduce trial-and-error processing, and more economically use heat treatment resources. The impact of this model on the steel casting industry will be to provide a powerful new tool to aid in the design of high strength steel castings, allowing foundry engineers to accurately predict stress development and relief, as well as casting distortion, during heat treatment of castings. The impact of this software will be to prevent distortion, cracking, re-work and weld repair of heat treated castings. This will result in increased casting yield from reduced scrap, more efficient use of heat treatment resources, significant casting weight savings, as well as longer service lives for steel castings. Based on the Energy Benefits Table developed at the outset of this project, this new technology is expected to result in an estimated energy savings of 2.15 trillion BTU’s/year. Commercialization of this work will be straightforward upon completion of this project, because the model developed for this project is being developed using commercial casting simulation software, and thus it will be readily available once the project is complete.
3
Background This section discusses the current state of the art in the modeling of distortion and residual stress development during steel casting heat treatment. Further, this section explains how the research performed for this project advances the state of the art. The approach used in developing this new technology is also briefly discussed. Casting simulation software currently used by steel foundries is limited in its capabilities to predict distortions and stresses resulting from heat treatment. Consequently, heat treatment process design still involves a tedious trial-and-error process, often requiring corrective measures. In addition, the heat treatment computer models that are available to engineers are primarily targeted for forgings and machined parts, and they do not take the deformations that occur during the casting process into account. Ultimately, for steel foundry engineers, prediction of the final dimensions of and residual stresses in a steel casting after heat treatment requires consideration of the casting process itself, because distortions and stresses already develop during the solidification and initial cooling processes. There has been considerable interest in this topic in the past, and substantial research resources have been directed toward the prediction of residual stress and distortion arising during heat treatment. An excellent overview of the mathematical modeling of heat treatment distortion is presented by Fletcher [1], who also provides an overview of thermo-mechanical material properties dependent on temperature and microstructural phase. These material properties are necessary to accurately model heat treatment distortion. A more recent literature review on the topic is given by Rohde and Jeppsson [2], who consider the three main model components required to simulate heat treatment distortion: heat transfer analysis, phase transformations and mechanical response. To model heat treatment distortion and residual stresses, phase transformation and material constitutive models must be combined with a thermal stress computation. Commercial finite element software packages are readily capable of predicting heat transfer with stress and displacement, but these software packages do not provide prediction of microstructure or advanced multiphase material models necessary to predict the complete problem of heat treatment distortion. Thermal stress prediction that includes prediction of the phase transformations, evolving microstructure and properties is reported in the literature using research-oriented computer models that do not appear to be offered commercially. A thorough literature review of heat treatment distortion research is provided in Appendix A. The objective of this project is to develop a model for predicting the distortions and residual stresses that develop during heat treatment of steel castings. The planned approach to accomplish this objective involves four steps:
1. Develop a distortion and residual stress model: develop a model of distortion and residual stress development during heat treatment of steel castings.
2. Implement the model in commercial software. 3. Perform validation experiment and compare to the results of a simulation of the
experiment: perform a small-scale experiment to test and validate the model at participating steel foundries.

4
4. Perform a case study on production part illustrating the use of the model in foundry practice: carefully compare predictions of the model to casting measurements to illustrate the use of the model in foundry practice.
The present researchers have extensive experience modeling various casting phenomena, as well as experience implementing these models in commercial casting software. This experience will be utilized to guide the development and commercial implementation of the heat treatment distortion model.
5
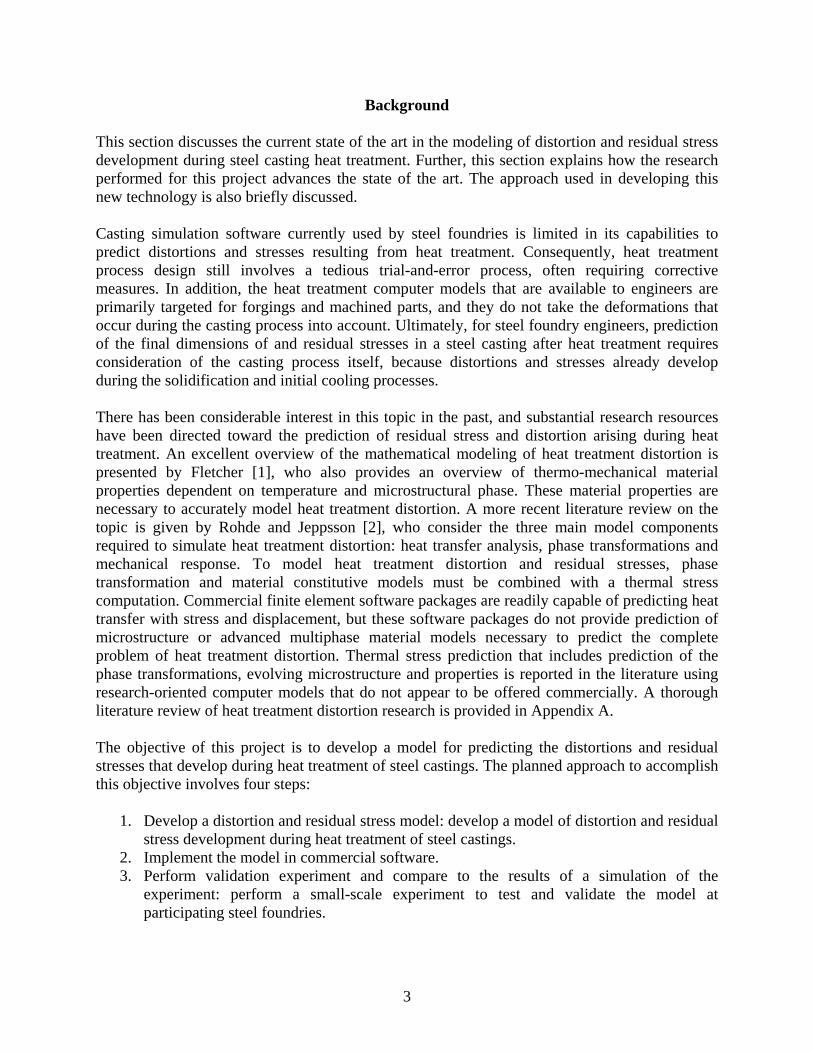
Results and Discussion The results of the research performed for this project are briefly presented and discussed in this section. The research is presented in full detail in the conference papers contained in Appendices A – C. The research regarding distortion and residual stress development during heat treatment of steel castings began with an extensive review of the literature on the subject (see Appendix A). In summary, previous research has determined that predicting the phase transformations and microstructure of the steel during heat treatment is very important. Consider, for example, when a region of a casting that is being heat treated undergoes a phase transformation from austenite to martensite. Martensite has about 5% greater specific volume than austenite, and thus the martensitic region of the casting will expand. Clearly, this can substantially affect the stresses and distortions in the casting. Also, research in the literature indicates that the constitutive behavior of the steel thermo-mechanical material properties during heat treatment is highly complex. In order to model the residual stresses and distortion, the phase transformation and material constitutive models must be combined with a thermal stress computation. Many commercial finite element software packages are capable of predicting heat transfer with stress and displacement. However, none of these programs predict the microstructure or the advanced multi-phase material models necessary to predict the complete problem of heat treatment distortion. There are several commercial models that perform thermal stress prediction including prediction of the phase transformations, evolving microstructure and properties. Based on the review of the current state-of-the-art, the original project plan to develop a new model for distortion and residual stress development was considered, but ultimately discarded. Rather than “re-invent the wheel,” the original plan was modified to assess the applicability of one of the commercial models that predicts phase transformations, evolving microstructure and properties along with thermal stress prediction. Among these models, one of the most advanced is the software package DANTE, which is a set of user subroutines that operate in conjunction with a finite element code (such as ABAQUS or Kiva). However, DANTE was not written for steel castings; the software was originally designed for analysis of small parts (gears, shafts, springs, etc.) that are typically forged or machined from stock. So the applicability and accuracy of its application for steel casting heat treatment must be verified. This was the first research task undertaken in this portion of the project. To determine the accuracy of the distortion predictions produced by DANTE, available distortion results for the Navy-C ring, a commonly used test casting, were employed. A schematic of the Navy-C ring is shown in Fig. 1. Experimental results for the dimensional changes at the gap opening and outside diameter are reported in Ref. [3] and given here in Table 1. Experiments were performed with two alloy grades (4140 and 8620 steels) and two cooling conditions [water quench (WQ) and oil quench (OQ)], leading to four combinations: 4140OQ, 4140WQ, 8620OQ and 8620WQ. Unfortunately, the experimental results are for carburized test pieces, and the details of the carburization process were not documented. Also, the details of the heating process and temperature at the start of quench were not given for the measurements. Even though carburization can be simulated with DANTE, it can not be simulated faithfully to the experiments. The missing information makes it impossible to directly compare the
6
Figure 1. Sketch of Navy-C ring test piece for quench distortion experiments from Ref. [3]. magnitudes of the distortions in Table 1 with the simulations. Nevertheless, a relative comparison between the simulations and experiments is possible. Simulations of the four cases in Table 1 were run using ABAQUS with the DANTE user subroutines. In all cases, the pieces were heated to 900°C prior to quenching. Invoking symmetry conditions, one-fourth of the Navy-C ring shown in Fig. 1 was simulated. Sample results for one case (4140WQ) are given in Fig. 2, which shows x-displacement contours and overall distortions (magnified 30x) at various times during the heat treatment process. The simulated and measured dimensional changes are compared in Table 2, where all dimensional changes have been normalized with respect to the 8620WQ results. Additional simulation results and discussion are given in Appendix A. The results in Table 2 indicate reasonably good agreement between simulated and measured relative dimensional changes for all four cases considered. Differences between the simulated and measured dimensional changes may be due to the lack of carburization in the simulations, as well as the lack of detailed information about the heating process. These results indicate a clear need to perform additional heat treatment experiments, where the specifics of the heat treatment process are carefully recorded so that simulation of the experiments can be performed using accurate input data.
7
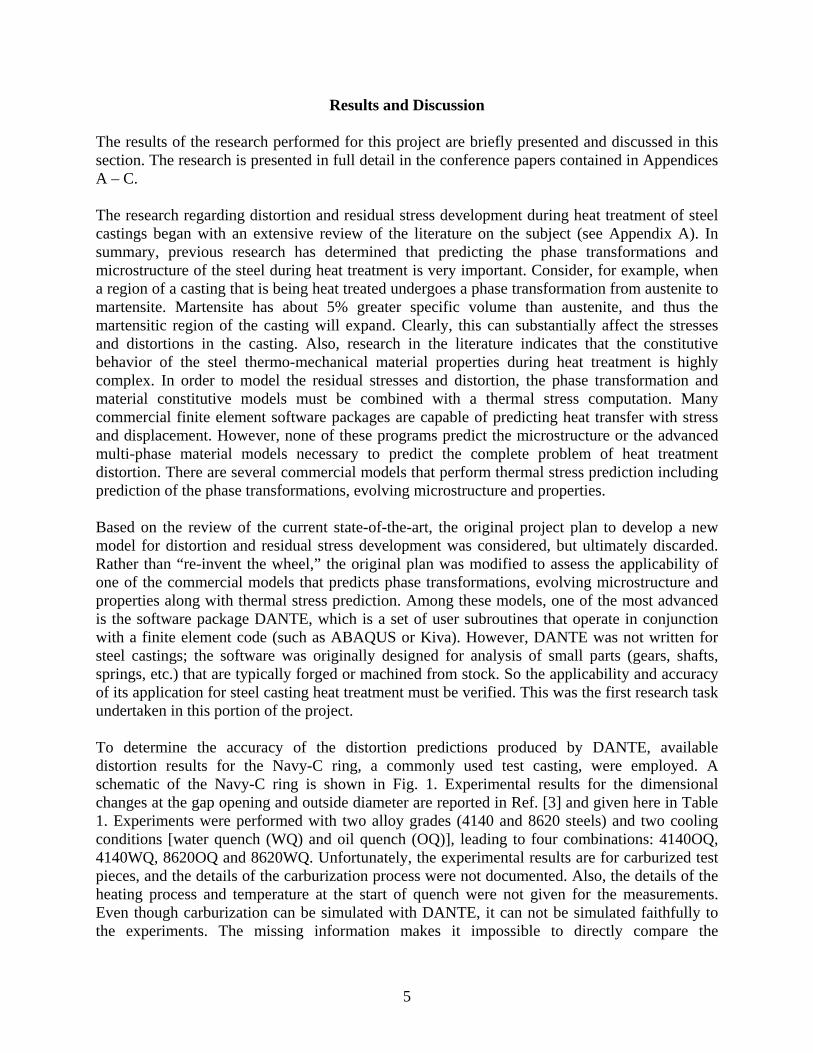
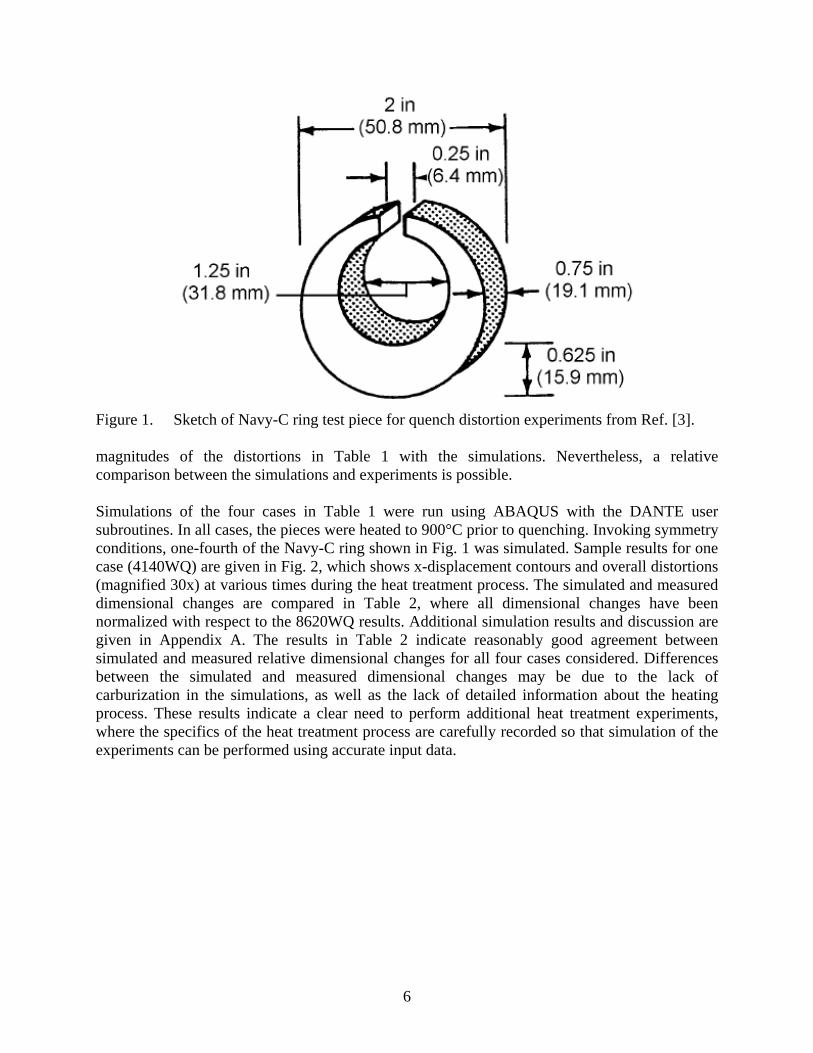
Table 1. Dimensional changes in gap and diameter for Navy-C ring [3].
Table 2. Comparison between measured and predicted relative dimensional changes.
Based on the initial simulation work described above, heat treatment experiments were performed for three different carbon and low alloy grades (1022, 4230 and 8625), as well as for stainless steel grade CF8M. The austenitic grade CF8M, which undergoes no phase changes during heat treatment, was included to aid in the evaluation of the experimental procedures and the simulation software. Navy-C ring castings, modified slightly to aid in casting, quenching and data measurement (see Fig. 3), were produced from each of these alloys, and then machined to remove rough surfaces and enable dimensional measurements. Dimensions of the machined C-rings were taken with a coordinate measurement machine (CMM). The C-rings were then heat treated in a foundry laboratory. Immersion into the quench tank was either done vertically (i.e., tips first) or from the C-ring side. Then, the C-ring dimensions were measured again, and the amount of heat treatment distortion was quantified. For each of the eight cases (4 alloys x 2 immersion directions), either four or five castings were heat treated and measured. See Appendix B for further experimental details as well as the heat treatment schedule.
8
Figure 2. Simulated dimensional x-displacement for the 4140WQ casting. Results given at
start, end of heating to 900C, 1 s into quench, 2 s into quench, and final quenched condition. The distorted geometry is magnified 30 times.
9
Figure 3. Schematic of the modified C-ring design.
Figure 4. Plots of the before and after heat treatment prong tip outlines for the CF8M water
quench side immersion experiments. An example of the locations of the C-ring tips before and after heat treatment is shown in Fig. 4. This figure shows the results of all five CF8M castings immersed from the side. The distortions shown in this figure are not magnified. Note that all five results are similar, and in every casting
groove
support holes
thermocouple well
Reference point
flat base
1”
5”
10
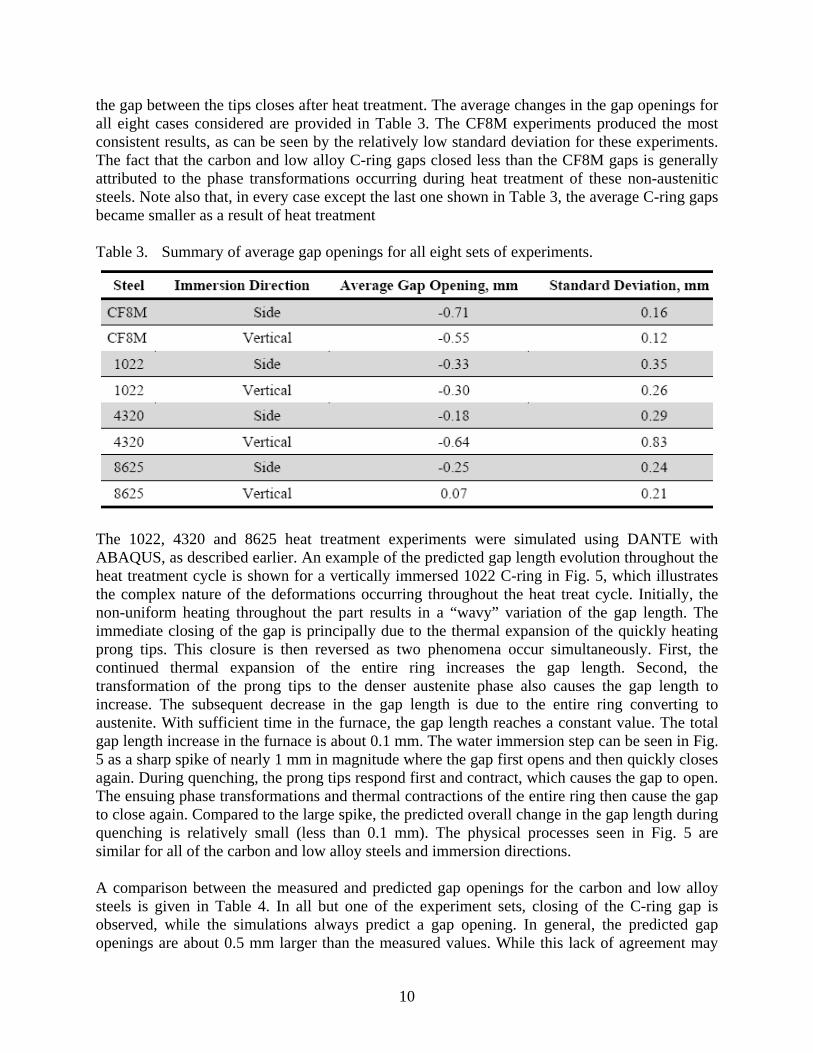
the gap between the tips closes after heat treatment. The average changes in the gap openings for all eight cases considered are provided in Table 3. The CF8M experiments produced the most consistent results, as can be seen by the relatively low standard deviation for these experiments. The fact that the carbon and low alloy C-ring gaps closed less than the CF8M gaps is generally attributed to the phase transformations occurring during heat treatment of these non-austenitic steels. Note also that, in every case except the last one shown in Table 3, the average C-ring gaps became smaller as a result of heat treatment Table 3. Summary of average gap openings for all eight sets of experiments.
The 1022, 4320 and 8625 heat treatment experiments were simulated using DANTE with ABAQUS, as described earlier. An example of the predicted gap length evolution throughout the heat treatment cycle is shown for a vertically immersed 1022 C-ring in Fig. 5, which illustrates the complex nature of the deformations occurring throughout the heat treat cycle. Initially, the non-uniform heating throughout the part results in a “wavy” variation of the gap length. The immediate closing of the gap is principally due to the thermal expansion of the quickly heating prong tips. This closure is then reversed as two phenomena occur simultaneously. First, the continued thermal expansion of the entire ring increases the gap length. Second, the transformation of the prong tips to the denser austenite phase also causes the gap length to increase. The subsequent decrease in the gap length is due to the entire ring converting to austenite. With sufficient time in the furnace, the gap length reaches a constant value. The total gap length increase in the furnace is about 0.1 mm. The water immersion step can be seen in Fig. 5 as a sharp spike of nearly 1 mm in magnitude where the gap first opens and then quickly closes again. During quenching, the prong tips respond first and contract, which causes the gap to open. The ensuing phase transformations and thermal contractions of the entire ring then cause the gap to close again. Compared to the large spike, the predicted overall change in the gap length during quenching is relatively small (less than 0.1 mm). The physical processes seen in Fig. 5 are similar for all of the carbon and low alloy steels and immersion directions. A comparison between the measured and predicted gap openings for the carbon and low alloy steels is given in Table 4. In all but one of the experiment sets, closing of the C-ring gap is observed, while the simulations always predict a gap opening. In general, the predicted gap openings are about 0.5 mm larger than the measured values. While this lack of agreement may
11
seem discouraging, note that the final distortions in the C-rings are all relatively small, and the result of much larger deformations that occur during heat treatment (as seen in Fig. 5, for example). Also note that for 4320 steel in Table 4, the predicted gap changes are within one standard deviation of the measured values. And the simulations do reflect some of the trends seen in the experimental results. For example, the fact that the predicted gap opening is the largest for the 8625 C-rings is born out by the experiments in that the measured average gap change for the 8625 vertical immersion C-Rings is the only one that is positive. The fact that the
Figure 5. Predicted gap length evolution throughout the heat treatment cycle (1022 vertical
immersion simulation). Table 4. Comparison between measured and predicted gap openings.
12
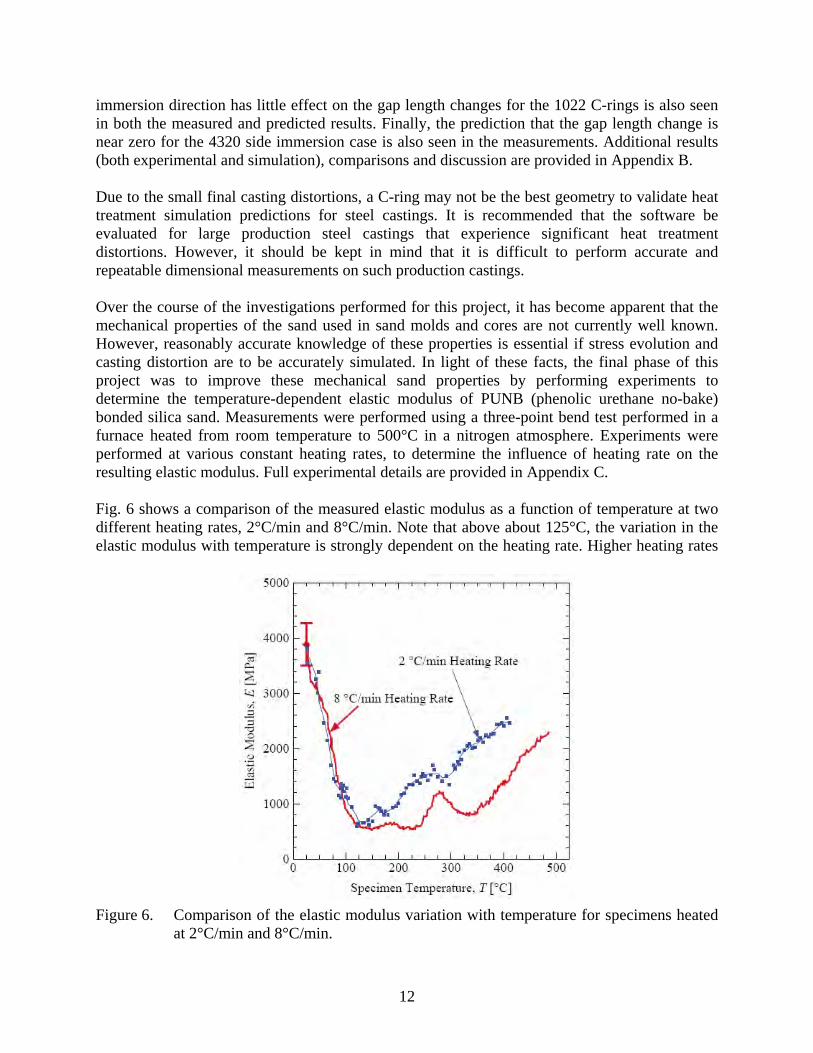
immersion direction has little effect on the gap length changes for the 1022 C-rings is also seen in both the measured and predicted results. Finally, the prediction that the gap length change is near zero for the 4320 side immersion case is also seen in the measurements. Additional results (both experimental and simulation), comparisons and discussion are provided in Appendix B. Due to the small final casting distortions, a C-ring may not be the best geometry to validate heat treatment simulation predictions for steel castings. It is recommended that the software be evaluated for large production steel castings that experience significant heat treatment distortions. However, it should be kept in mind that it is difficult to perform accurate and repeatable dimensional measurements on such production castings. Over the course of the investigations performed for this project, it has become apparent that the mechanical properties of the sand used in sand molds and cores are not currently well known. However, reasonably accurate knowledge of these properties is essential if stress evolution and casting distortion are to be accurately simulated. In light of these facts, the final phase of this project was to improve these mechanical sand properties by performing experiments to determine the temperature-dependent elastic modulus of PUNB (phenolic urethane no-bake) bonded silica sand. Measurements were performed using a three-point bend test performed in a furnace heated from room temperature to 500°C in a nitrogen atmosphere. Experiments were performed at various constant heating rates, to determine the influence of heating rate on the resulting elastic modulus. Full experimental details are provided in Appendix C. Fig. 6 shows a comparison of the measured elastic modulus as a function of temperature at two different heating rates, 2°C/min and 8°C/min. Note that above about 125°C, the variation in the elastic modulus with temperature is strongly dependent on the heating rate. Higher heating rates
Figure 6. Comparison of the elastic modulus variation with temperature for specimens heated
at 2°C/min and 8°C/min.
13
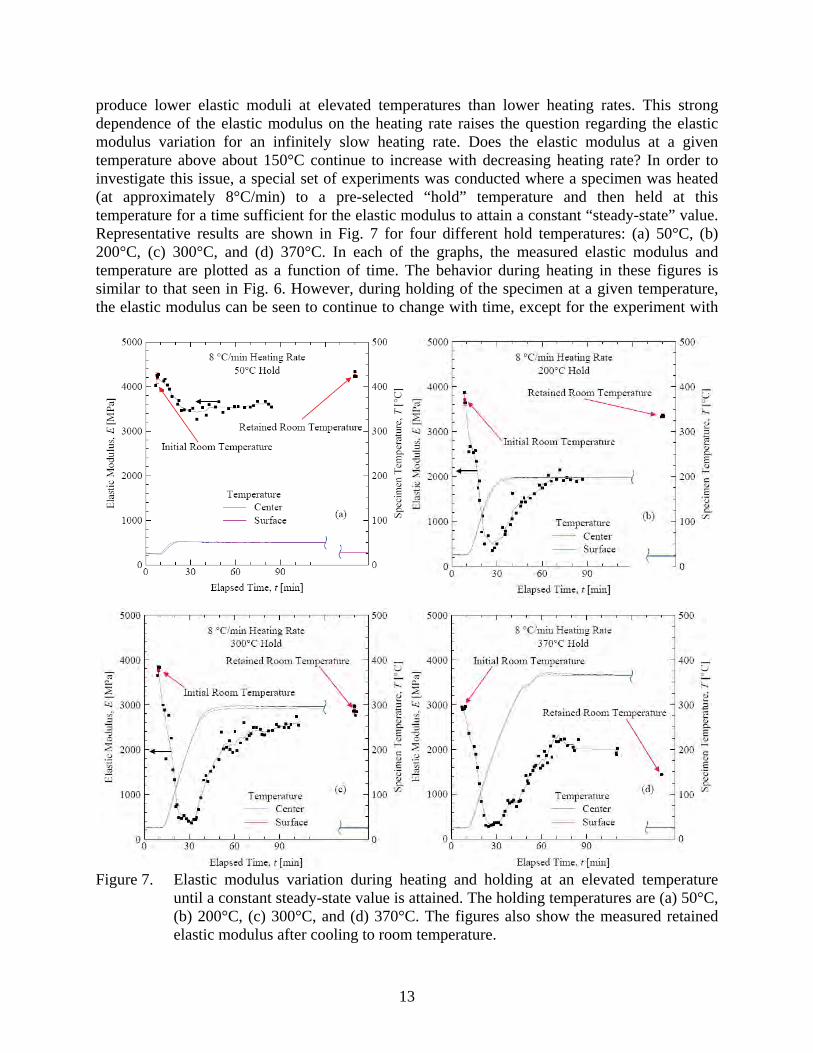
produce lower elastic moduli at elevated temperatures than lower heating rates. This strong dependence of the elastic modulus on the heating rate raises the question regarding the elastic modulus variation for an infinitely slow heating rate. Does the elastic modulus at a given temperature above about 150°C continue to increase with decreasing heating rate? In order to investigate this issue, a special set of experiments was conducted where a specimen was heated (at approximately 8°C/min) to a pre-selected “hold” temperature and then held at this temperature for a time sufficient for the elastic modulus to attain a constant “steady-state” value. Representative results are shown in Fig. 7 for four different hold temperatures: (a) 50°C, (b) 200°C, (c) 300°C, and (d) 370°C. In each of the graphs, the measured elastic modulus and temperature are plotted as a function of time. The behavior during heating in these figures is similar to that seen in Fig. 6. However, during holding of the specimen at a given temperature, the elastic modulus can be seen to continue to change with time, except for the experiment with
Figure 7. Elastic modulus variation during heating and holding at an elevated temperature
until a constant steady-state value is attained. The holding temperatures are (a) 50°C, (b) 200°C, (c) 300°C, and (d) 370°C. The figures also show the measured retained elastic modulus after cooling to room temperature.
14
the lowest holding temperature (Fig. 7a). For the higher three hold temperatures, the elastic modulus increases during the holding period, until the constant steady-state value is achieved. After the specimens represented in Fig. 7 were held at an elevated temperature for a long period of time, the specimens were cooled until they returned to room temperature. Then, measurements of the retained room temperature elastic modulus were performed for each specimen. These results are also shown in Fig. 7, listed as “Retained Room Temperature.” For the 50°C holding temperature (Fig. 7a), the specimen fully recovers its initial room temperature stiffness. However, for the higher hold temperatures, the retained elastic modulus at room temperature is significantly lower than the initial room temperature value before heating. This reduction in elastic modulus indicates permanent degradation of the binder when heated to temperatures above 125°C. These elastic modulus results reveal a complex behavior during heating and cooling. These temperature-dependent bonded sand properties are useful for stress simulations. However, further experiments at higher heating rates are necessary to determine the mechanical behavior of sand that is within about an inch of the mold-metal interface.
15
Benefits Assessment Due to the premature termination of this project, the commercial model to predict distortions and residual stresses that develop during heat treatment of steel castings has not yet been fully validated. However, the comparisons between predictions and experiments performed for this project show reasonable agreement thus far. When validation is complete, this model will provide the steel casting industry with a tool that will result in increased casting yield from reduced scrap, more efficient use of heat treatment resources, significant casting weight savings, as well as longer service lives for steel castings. This new technology was predicted to result in an average energy savings of 2.44 trillion BTU’s/year over a 10 year period (with full funding). With only 32.5% of proposed funding, current (2011) annual energy saving estimates, based on commercial introduction in 2012, a market penetration of 29% by 2020, and 10% reduction in energy usage per year, is 2.15 trillion BTU’s/year. Along with these energy savings, reduction of scrap and improvement in casting yield will result in a reduction of the environmental emissions associated with the melting and pouring of the metal which will be saved as a result of this technology. The average annual estimate of CO2 reduction per year through 2020 is 0.03 Million Metric Tons of Carbon Equivalent (MM TCE).
16
Commercialization Because this project was terminated before the originally planned project duration expired, the heat treatment residual stress/distortion model has not been completely verified and validated. Although additional work is required to fully validate the heat treatment residual stress/distortion model, completion of this additional work will automatically result in a commercially available product, since the model utilizes the commercial software packages DANTE and ABAQUS. In addition, technology transfer occurred in the form of the publication of papers describing the residual stress/distortion model, casting experiments performed for the purpose of validating the model, and the measurement of elastic modulus data (required for stress analysis) of bonded sand commonly used in sand casting (see Appendices A – C). Finally, the elastic modulus data developed in Appendix C can readily be implemented in commercial casting software.
17
Accomplishments A model to simulate residual stress development and distortion during heat treatment of steel castings has been tested, although not yet fully validated. This model is commercially available. Heat treatment distortion experiments have also been performed, expanding the available experimental database on this topic. Finally, experiments have been performed that yielded temperature-dependent elastic modulus data for PUNB bonded silica sand, which can be utilized in casting stress simulations. The work detailed in this report resulted in the publication of three papers available in technical conference proceedings (given in Appendices A – C). This research also resulted in two master’s theses (Brandon Brooks, 2007, “Prediction of Heat Treatment Distortion of Cast Steel C-Rings” and Jacob Thole, 2010, “Measurement of Elastic Modulus of PUNB Bonded Sand as a Function of Temperature”).
18
Conclusions After reviewing the state-of-the-art in heat treatment residual stress and distortion modeling, an existing commercial code was selected because of its advanced capabilities in predicting phase transformations, the evolving microstructure and related properties along with thermal stress development during heat treatment. However, this software was developed for small parts created from forgings or machined stock, and not for steel castings. Therefore, its predictive capabilities for heat treatment of steel castings were investigated. Available experimental steel casting heat treatment data was of insufficient detail and breadth, and so new heat treatment experiments were designed and performed, casting and heat treating modified versions of the Navy-C ring (a classical test shape for heat treatment experiments) for several carbon and low alloy steels in order to generate data necessary to validate the code. The predicted distortions were in reasonable agreement with the experimentally measured values. However, the final distortions in the castings were small, making it difficult to determine how accurate the predictions truly are. It is recommended that further validation of the software be performed with the aid of additional experiments with large production steel castings that experience significant heat treatment distortions. It is apparent from this research that the mechanical properties of the bonded sand used for cores and sand molds are key in producing accurate stress simulation results. Because of this, experiments were performed to determine the temperature-dependent elastic modulus of a resin-bonded sand commonly utilized in the steel casting industry. The elastic modulus was seen to vary significantly with heating and cooling rates. Also, the retained room temperature elastic modulus after heating was seen to degrade when the sand was heated above 125°C. The elastic modulus curves developed in this work can readily be utilized in casting simulation software. Additional experiments with higher heating rates are recommended to determine the behavior of the elastic modulus in the sand close to the mold-metal interface. The commercial heat treatment residual stress and distortion code, once fully validated, is expected to result in an estimated energy savings of 2.15 trillion BTU’s/year. Along with these energy savings, reduction of scrap and improvement in casting yield will result in a reduction of the environmental emissions associated with the melting and pouring of the metal which will be saved as a result of this technology.
19
Recommendations Concerning the modeling of steel casting heat treatment residual stress and distortion, it was seen that the final distortions in the experimental castings produced for this research were small, making it difficult to determine how accurate the model predictions truly are. It is recommended that further validation of the software be performed with the aid of additional experiments with large production steel castings that experience significant heat treatment distortions. However, it should be kept in mind that it is difficult to perform accurate and repeatable dimensional measurements on such production castings. Finally, in terms of modeling the elastic modulus of bonded sand used in steel casting for sand molds and cores, it is recommended that additional experiments with higher heating rates be performed to determine the behavior of the elastic modulus in the sand close to the mold-metal interface.

20
References [1] A.J. Fletcher, Thermal Stress and Strain Generation in Heat Treatment, Elsevier Science,
London, 1989.
[2] J. Rohde, and A. Jeppsson, Scandinavian Journal of Metallurgy, vol. 29(2), 2000, pp. 47-62.
[3] G.E. Totten, C.E. Bates, and N.A. Clinton, Handbook of Quenchants and Quenching Technology, ASM International, Materials Park, OH, 1993, p. 489.
21
Appendices The appendices include all the papers that were written based on the research performed for this project. Appendix A: “Simulation of Heat Treatment Distortion,” a paper by R.A. Hardin and C.
Beckermann in Proceedings of the 59th SFSA Technical and Operating Conference, 2005.
Appendix B: “Development of Heat Treatment Distortion of Cast Steel C-Rings,” a paper by
B.E. Brooks and C. Beckermann in Proceedings of the 61st SFSA Technical and Operating Conference, 2007.
Appendix C: “Measurement of Elastic Modulus of PUNB Bonded Sand as a Function of
Temperature,” a paper by J. Thole and C. Beckermann in Proceedings of the 63rd SFSA Technical and Operating Conference, 2009.
Simulation of Heat Treatment Distortion
R.A. Hardin1and C. Beckermann2
1Research Engineer, 2Professor, Department of Mechanical and Industrial Engineering,
The University of Iowa, Iowa City IA 52242
Abstract
This paper gives an overview of the problem of heat treatment stress and distortion and a review of literature surrounding it. Software developed to predict heat treat distortion is also reviewed. Simulations are presented for a quenched cylinder to demonstrate the capabilities of software available for predicting heat treatment stress and distortion. The software package DANTE was identified as one of the most advanced tools for solving heat treat distortion problems. Example calculations using DANTE show it to have very advanced features, and its predictions were shown to agree in a relative sense (within about 15%) with measurements reported in the literature of heat treatment distortion on Navy-C rings made from 4140 and 8620 steel quenched in water and in oil. Unfortunately, due to the lack of documentation on the heat treatment process details more quantitative comparison could not be made. As part of future work, the authors are developing a test piece casting to be produced at a participating foundry to provide data on heat treatment distortions. The test casting is being designed through simulation and through consideration of past experiments reported in the literature. Experimental measurement of temperatures and distortions during heat treatment, and (possibly) residual stresses, will be made in the future as part of both experiments on test piece castings, and on production case study castings, to validate and improve the software predictions.
becker
Text Box
Hardin, R.A., and Beckermann, C., “Simulation of Heat Treatment Distortion,” in Proceedings of the 59th SFSA Technical and Operating Conference, Paper No. 3.3, Steel Founders' Society of America, Chicago, IL, 2005.
2
Introduction
Heat treatment and processing associated with it, in particular quenching, are critical to the production of high strength steel castings. Numerous technical details and process parameters must be managed and carefully controlled to avoid damaged or scrapped castings. Thermal and residual stresses that develop during heat treatment and quenching can result in distortion, cracking (particularly troublesome after machining), and rework and weld repair. Furthermore, risk of casting distortion from quenching often limits the ability to quench aggressively, thus reducing the depth of quench-effect and the improvement in properties that might be possible. Distortions often require adjustments to the casting or pattern design, or the addition of tie bars. Many castings are straightened after heat treatment by pressing operations, which are time consuming and expensive. Finally, residual stresses can reduce the service performance of steel castings and result in catastrophic failure during service. Normalizing and stress relieving can be performed, but it results in additional energy use, or overuse. Because of these complexities, heat treatment processing is generally designed over time, based on experience and trial and error.
An accurate, user-friendly computer model for predicting the distortions and residual
stresses that develop during heat treatment of steel castings would be a powerful tool in the hands of foundry personnel. Having such predictive abilities, foundry engineers could reduce trial and error processing and use heat treatment resources more economically. Casting patterns could be designed with the heat treatment processing already considered. Foundries could take full advantage of improvements in furnace control, accurately predicting stress development and relief during austenitizing and tempering. This information could be very useful in efficiently managing the furnace, while achieving desired mechanical properties and an acceptable residual stress field. Unfortunately, the modeling of heat treatment and its effects on the stress state of a casting is not easy. It involves not just modeling the heat transfer and stresses in the casting, but also modeling the microstructural changes in the steel throughout processing. Changes in the steel microstructure are very important since they produce changes in mechanical properties (such as density and thermal expansion coefficient). Other technical obstacles to computer modeling include complex heat transfer (i.e. boiling regimes during quenching), quenchant properties, variable mechanical properties with temperature and microstructure, and non-uniform heat transfer conditions over the casting surface.
The casting simulation software currently used by steel foundries is limited in its
capabilities to predict distortions and stresses resulting from heat treatment. Consequently, heat treatment process design still involves a tedious trial-and-error process, often requiring corrective measures. In addition, the heat treatment computer models that are available to engineers are primarily targeted for forgings and machined parts, and they do not take the deformations that occur during the casting process into account. Ultimately, for steel foundry engineers, prediction of the final dimensions of and residual stresses in a steel casting after heat treatment requires consideration of the casting process itself, because distortions and stresses already develop during the solidification and initial cooling processes.
In addition to improved casting quality and streamlined heat treatment process design,
energy savings will result through the use of heat treatment models. Energy savings will result
3
from: dramatically reduced scrap, rework, and reduced trial and error processing, efficient management of the heat treatment process and improved control of heat treatment furnaces based on engineering and metallurgical principles. Improved casting performance and superior material properties will lead to additional energy savings, since superior mechanical properties provide significant weight savings and longer service life in properly design parts. These outcomes will result in an increase in casting yield and reduced energy consumed in the heat treatment process. These energy-savings are directly relevant to the goals of the United States Department of Energy (DoE) Metal Casting program through whose funding this research is being performed. A conservative estimate of the annual Net Melting Energy Reduction arising from this project is 1.43 trillion Btu/year within ten years of this technology’s implementation in SFSA member foundries. Review of Past Work
There has been considerable interest in this topic in the past, and substantial research
resources have been directed toward the prediction of residual stress and distortion arising during heat treatment. An excellent overview of the mathematical modeling of heat treatment distortion is presented by Fletcher [1]. Here the reader will find important background on the elastic-plastic and finite element modeling used to compute thermal stresses, as well as background on the relationship between microstructure and thermal stress. Fletcher [1] also provides an overview of thermo-mechanical material properties dependent on temperature and microstructural phase. Even though this reference reflects the state of capabilities in the 1980’s, and presents only two-dimensional modeling results for cylinders and plates, it presents the fundamentals of the models and issues that do not change. A recent literature review on the topic is given by Rohde and Jeppsson [2], where they present Figure 1. This figure is repeated here because it is an excellent graphical representation of the problem. Starting with the three main model components required to simulate heat treatment distortion (heat transfer analysis, phase transformations and mechanical response), Figure 1 gives their important factors, issues to be addressed, and the most critical results from heat treatment simulation: distortion, residual stress and microstructure. Using Figure 1 as a visual aid representing the complexity of the problem, it is easy to understand why the problem has been attacked in a piece by piece fashion over the years.
Predicting the phase transformations and microstructure is an important piece of this
puzzle. Rohde et al. [3] have presented an approach to determine the phase transformations using a database of time-temperature transformation (TTT) diagrams for available steels and the Avrami-type [4] equation for the diffusion transformations. Then, in the case of steels for which there is no TTT diagram, the program Thermo-Calc is used with the desired chemistry to calculate the thermodynamic temperatures (for example the austenite-ferrite transition A3, the eutectoid A1, the martensite start and finish, Ms and Mf , temperatures) along with a ”similar” TTT diagram to estimate the transformation data. The martensite transformation is time independent. Martensite transformation can be determined (as by Rohde et al. [3]) using the Koistinen-Marburger equation [5]. The effect of stress on the Ms is also considered [3]. A similar approach is taken by Hunkel et al. [6] to simulate the transformations in steel during quenching. Lusk and co-workers [7-17] have contributed substantially in this area, and have
4
produced a highly useful model [9,11] of phase transformations in steel. The Lusk et al. model [9,11] will be used in the model results presented in this paper.
The constitutive behavior of the steel thermo-mechanical material properties during heat
treatment is highly complex. The mechanical properties are dependent on temperature, phases present, deformation and deformation rate. Alberg et al. [18-20] have investigated and compared various constitutive material models. These material models are strain rate-independent plasticity, rate-dependent plasticity (where creep is considered as a special case), and unified plasticity models [18] that incorporate all effects. Substantial differences arise from using different constitutive models, and generally one would want to use the most sophisticated model possible. Unfortunately, more sophisticated models require more material parameters, which are determined by iterative or inverse solutions using the model to match experimental results. The best matching parameters are more easily determined for simpler models. Finding proper material model parameters can be challenging. Alberg demonstrates [19] that in some cases less sophisticated models (strain-rate independent, having fewer material parameters) can produce good enough results for use in heat treatment process design. A sophisticated internal state variable model has been developed to describe the mechanical behavior of single phase materials over a wide range of temperatures and strain rates, the Bammann, Chiesa and Johnson (BCJ) model [21]. This model has been extended to two-phase materials [22] and steel [11] having up to five-phases (austenite, pearlite, ferrite, bainite and martensite). A complete description of the BCJ model and its variants is beyond the scope of this paper. The interested reader is directed to references [11, and 21 to 23]. However, the complexity of the model is such that up 20 material constants must be determined for a material to describe its temperature and strain-rate dependence. These are determined by using nonlinear regression [24] on experimental data. The experiments necessary to determine the model parameters are uniaxial tension tests performed at different temperatures and strain rates on specimens of a given alloy [25]. Generally, the specimens are heated treated to isolate specific phases so that the phase dependence can be determined as well. Finally, reversed loading testing is also performed to determine constants related to the material’s hardening characteristics. Often times an exhaustive experimental test plan is not possible to determine all the model parameters with desired confidence. In such cases, data from a similar alloy must be used to fit a much more limited set of test data for the alloy of interest [25].
Returning to Figure 1, the phase transformation and material constitutive models must be
combined with a thermal stress computation. Commercial finite element software packages are readily capable of predicting un-coupled and coupled heat transfer with stress and displacement (ABAQUS, ANSYS, NASTRAN, ALGOR, and many others). These programs do not by themselves provide prediction of microstructure or advanced multiphase material models necessary to predict the complete problem of heat treatment distortion. Thermal stress prediction that includes prediction of the phase transformations, evolving microstructure and properties is reported using research-oriented computer models that do not appear to be offered commercially (as exemplified by [26-29]). Models offered commercially are SYSWELD [30, 31], HEAt tReaTment Simulation system (HEARTS) [32] and DEFORMTM-HT [33-35], TRAST [36, 37], and DANTETM [25, 38-41]. Of these the two that appear to have been researched and verified most in the literature appear to be DEFORMTM-HT [33, 34] and DANTETM [25, 38-40]. DEFORMTM-HT is a stand alone software package, incorporating a finite element solver, while
5
DANTETM is a set of user subroutines that requires the ABAQUS or Kiva finite element solvers. In addition to these software packages, MAGMA Giessereitechnologie GmbH has also investigated prediction of heat treatment distortion with their MAGMAsteel and MAGMAstress modules in the thesis by Weber [42].
DANTETM was chosen as the simulation software used in the present work. The primary
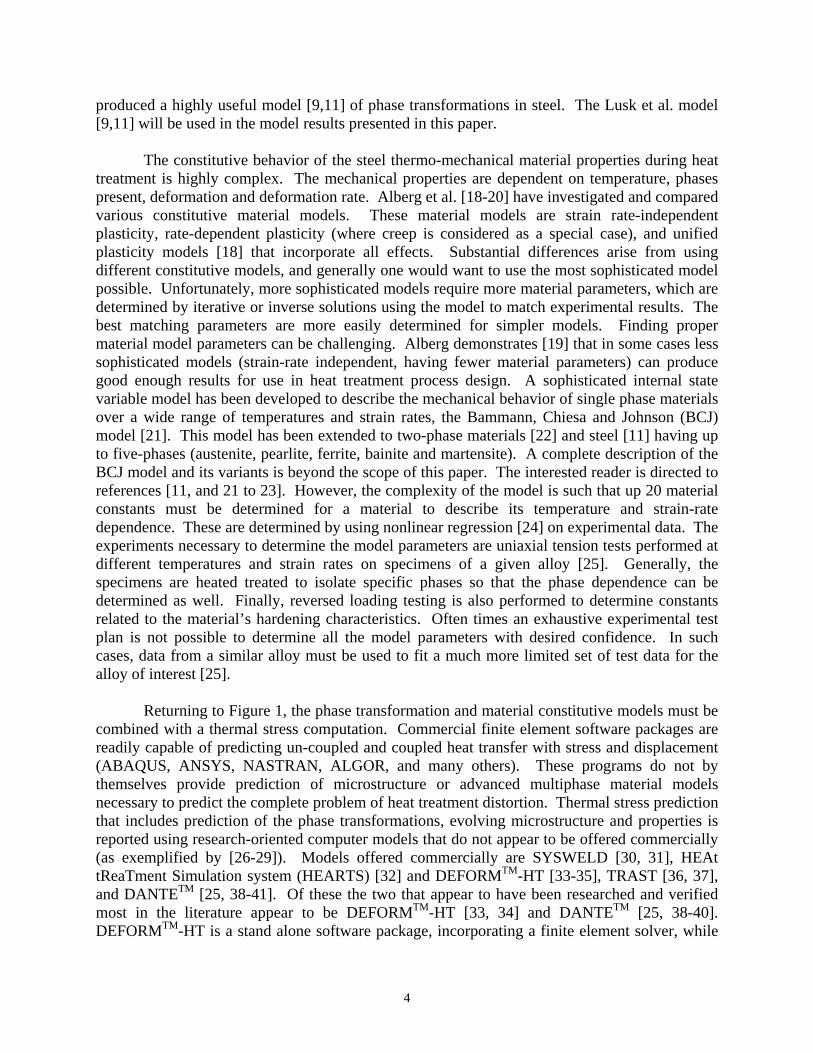
goal here is to investigate and demonstrate its abilities to predict heat treatment distortions and residual stresses in steel castings. We believe it to be the state of the art, being developed as part of a very large, ~$25 million project in heat treatment distortion simulation managed by the National Center for Manufacturing Sciences conducted at participating national labs (Lawrence Livermore, Los Alamos, Oak Ridge and Sandia), universities (Colorado School of Mines and IIT Research Institute) and industrial companies (Ford, GM, Eaton Corp. and Torrington Co.). DANTETM incorporates the phase transformation model of Lusk et al. [9,11,15 and 16] and the BCJ material model [11, 21-23]. In the remainder of the paper, the capabilities of DANTE will be demonstrated and discussed. A classic test problem, the heat treatment of a cylinder, will first be solved to demonstrate the fundamental issues arising during heat treatment, due to thermally induced plastic deformation and multiple phases present. Then some initial calculations using DANTETM will be made on a Navy C-ring test piece often used to evaluate cracking and distortion. Heat Treatment Residual Stress and Distortion with Software Demonstration A classic problem commonly used to visualize the formation of residual stresses is the cooling (or quenching) of a cylinder. Consider longitudinal stress and deformation in a section taken from a cylinder as cooling proceeds from steps “A” through “D” shown in Figure 2 a) and b), taken from [43, 44]. At step “B”, rapid cooling at the surface results in longitudinal tension near the surface, and compressive stress forms at the center. If plastic deformation occurs, the center contracts, and the surface expands relieving the stress – a final residual stress distribution shown at “D” results as shown in Figure 2 c). This process occurs simply due to thermal stresses forming as a result of temperature dependent material properties, without the consideration of phase changes. Commercial finite element software, such as ABAQUS used here, is readily capable of predicting these thermal stresses. Figure 3 shows the development of the thermal stress field simulated in a cylinder, assuming one-quarter symmetry. The cylinder is initially at 860 C, then air cooled to 25 C. The steel cylinder is 4 cm diameter x 20 cm long. In Figure 3 the stress field is shown on the left and temperature field on the right at the steps that correspond roughly to “A” through “D” in the quenching process shown in Figure 2. Note that the distorted geometry is scaled, and magnified 30 times, so the distortions are more apparent. The final longitudinal stress field is compressive at the surface and in tension at the center, and is due to the plastic deformation that occurred. Additional stress and deformation occurs in the presence of phase change due to differences in material properties (thermal expansion coefficient for example) of the phases present. The complexities associated with residual stress formation in the presence of phase changes are discussed in detail by Brooks [43]. Here we follow an example presented by Brooks to illustrate the nature of the stresses that form due to phase transformations and the final
6
microstructural variations in a part. Consider again a cylinder cooling, but now overlay the cooling curves for the surface and center of the cylinder onto a continuous cooling transformation diagram as shown in Figure 4 (taken from [43]). For the steel under consideration, the rapid cooling at the surface forms martensite, beginning at the martensite start temperature Ms indicated by point S1 in Figure 4. The surface continues cooling until the end of the martensitic reaction at point S2. The center cooling curve indicates that the austenite will decompose into pearlite beginning at point C1 until C2 when all the austenite has decomposed into pearlite.
Consider now the volumetric changes that occur in the metal when it changes phase. Martensite has about 5% greater specific volume than the austenite from which it forms. Even though the austenite from which the martensite is forming continues to contract on cooling, the formation of the martensite results in a net expansion of the steel. This can be visualized by imagining an entire cylinder being cooled under the conditions of the surface shown in Figure 5 from point S1 to S2. Point S1 indicates the start of expansion due to the beginning of martensite formation. Eventually, at point S2, the martensite is finished forming, and there is no further expansion due to the phase transformation. At this point, our imaginary cylinder undergoing the “surface” cooling conditions will continue to contract according to the thermal expansion coefficient of martensite until it reaches a final length LS as indicated in Figure 5. Visualize another imaginary cylinder being cooled under the conditions at the center. For the center cooling curve, pearlite begins to form at C1 shown in Figure 5. Since the specific volume of pearlite is larger than austenite (like martensite), it expands until the completion of the austenite decomposition to pearlite at C2. After C2, the pearlite will contract according to its thermal expansion coefficient to a final length of LC. Next imagine that we can join the material in the two imaginary cylinders (cooled at surface and center conditions) into one cylinder. Without restriction, the length of the surface of this cylinder would be LS and the center would be LC. However, they are restricted now by being joined together and since LC < LS, the surface pulls on the center section placing it in tension, while the center also resists being pulled placing the surface in compression. The resulting length of the joined-cylinder (having a center made of pearlite and a surface of martensite) will be between LC and LS and the longitudinal stress state will be compressive at the surface and in tension at the center. In the preceding discussion, the “thought” experiment conducted is meant to serve only as an example of a fundamental mechanism of stress formation due to phase transformation alone. One can readily see how a residual stress field can result even without the material plastically deforming. The resulting stress state in a part (even a simple cylinder) during heat treatment operations is highly complex, and even for a cylinder the stress state can vary considerably throughout the process depending on when phases form, and which phases are forming throughout the part. For example, the surface will be in considerable tension during the initial cooling before martensite forms, and volumetric contraction of the austenite is the driving mechanism of the stress formation. Consider too that phases have variable elastic-plastic mechanical properties, and a harder phase (like martensite) will resist stresses more than softer phases, and if plastic deformations occur, they will serve to relieve the stresses. Consideration of all these effects is very difficult and requires a model like DANTETM.
7
In Figures 6 through 10 results of ABAQUS calculations with the DANTE user subroutines are made for a AISI 5120 steel cylinder quench from 900 C to 65 C in an oil bath. The cylinder is 3 cm diameter by 8 cm long. As an added demonstration, the surface of the cylinder has been carburized using that feature of the DANTE software package. Three simulations were run the achieve these results:
1) A carburization (diffusion) calculation to establish the carbon distribution in the part from the carburization process.
2) A heat transfer simulation of the quenching process that accurately predicts the phase
transformations occurring in the cylinder in the presence of the non-uniform carbon distribution from carburization along with the thermal field. The increase in carbon due to the carburization process is incorporated by transferring the carbon field resulting from step 1) above while the cylinder is at the carburization temperature.
3) A thermal-stress calculation is made using the temperature, and phase dependent
material model (BCJ model) that includes the effect of the carbon distribution in the part.
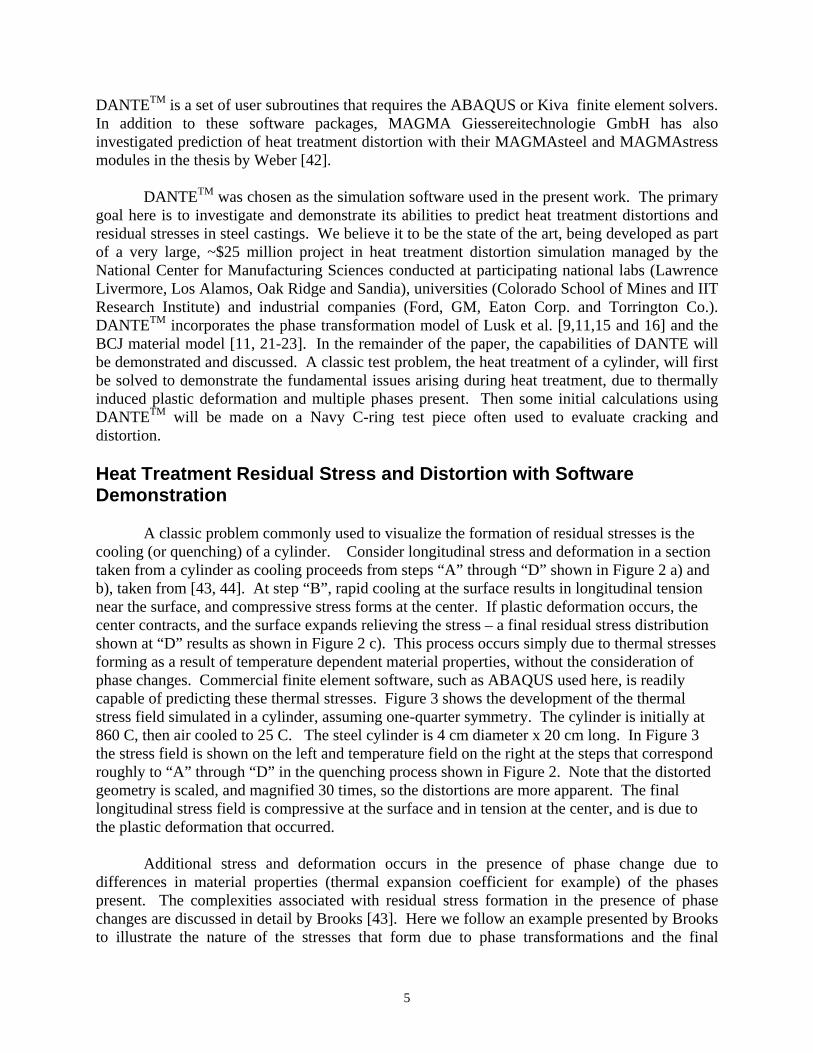
An additional feature demonstrated in this example is DANTE’s ability to simulate the immersion process of the part into the quenchant. This can be quite important for long parts or longer immersion times where substantial thermal gradients are induced in parts during the immersion process. In this case, immersion was set to take place over 5 seconds which is rather long for a cylinder this size, but this serves to demonstrate that a noticeable temperature gradient is developed. In Figure 6 the longitudinal stress and temperature fields at 0, 0.9, 2.7, 3.9 and 5.0 seconds into the immersion process are shown. The direction of the advance quenchant surface is shown also. The greatest temperature and stress field gradients along the length appear at 0.9 and 2.7 seconds. After immersion, the surface appears to be slightly in tension and the center in compression.
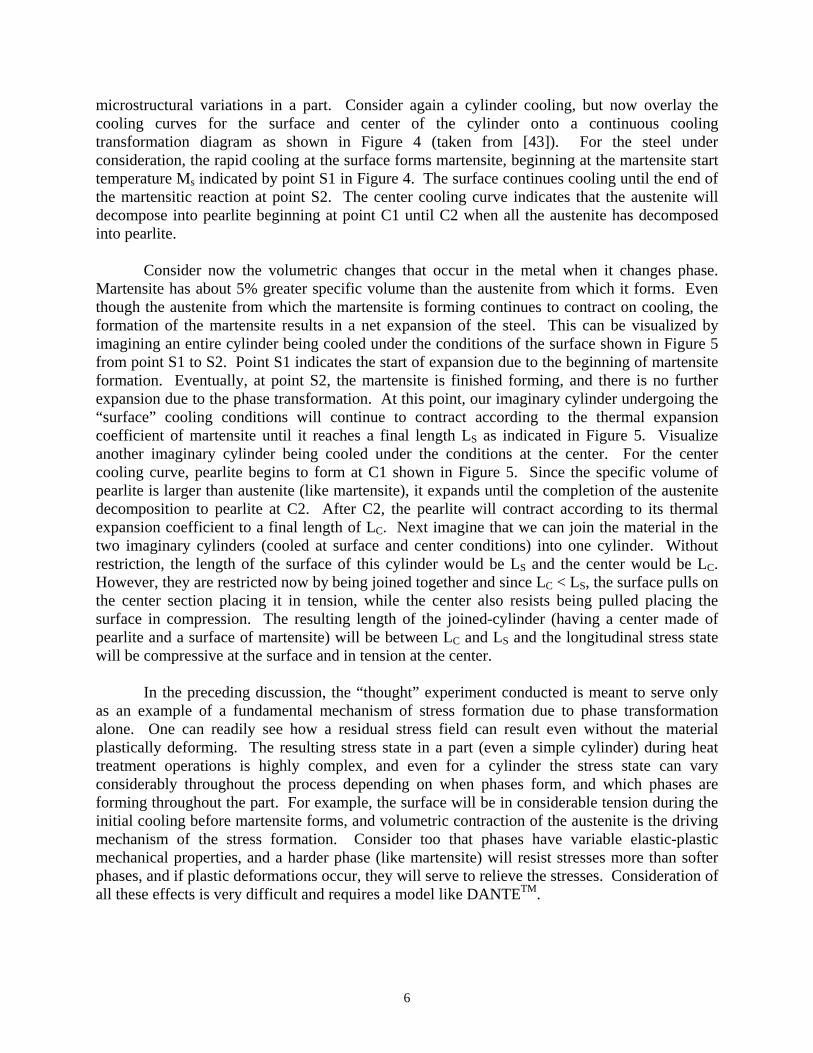
Figure 7 shows the stress field development after the immersion process, up to about 30 seconds after immersion is complete. Note the initial stress field at 0.8 seconds after immersion has a large tensile stress at the surface and compressive stresses at the center. As the rapid cooling proceeds, the stress field very nearly reverses itself at 4.6 seconds to high tension at the center and a region of compressive stress developing near (but still under) the surface; in this region austenite is decomposing to bainite resulting in phase transformation induced stresses such as those discussed in Figures 4 and 5. The surface has not yet begun to undergo transformation to martensite and remains in tension. At 29.8 seconds the surface appears to begin to show the development of compressive stresses due to the onset of martensite formation as shown in Figure 8. Beginning around 29.8 seconds, the martensite start temperature is reached for the carburized region near the surface and it proceeds to form as shown at 41.8 seconds until achieving its final distribution (shown here at 1000 seconds). As the martensite forms, a large compressive stress develops at the surface. There is not a great difference between the stress field at 41.8 seconds and the final stress field shown in Figure 9. The final microstructural phases resulting from the heat treatment process are shown in Figure 10. Martensite forms in amounts greater than 90% near the surface and to a smaller degree at the
8
corner/ends of the cylinder, a 10% to 50% amount of primary ferrite (increasing towards the center), and a substantial amount of bainite forms through the cylinder except at the carburized surface.
This example demonstrated the highly advanced capabilities of the DANTE software.
We next turn our attention to some preliminary comparison of distortion arising from heat treatment on test piece data [45] and to examine modeling issues and requirements for experimental data used in such comparisons in the future. Heat Treatment Distortion – Effect of Alloy and Quenchant
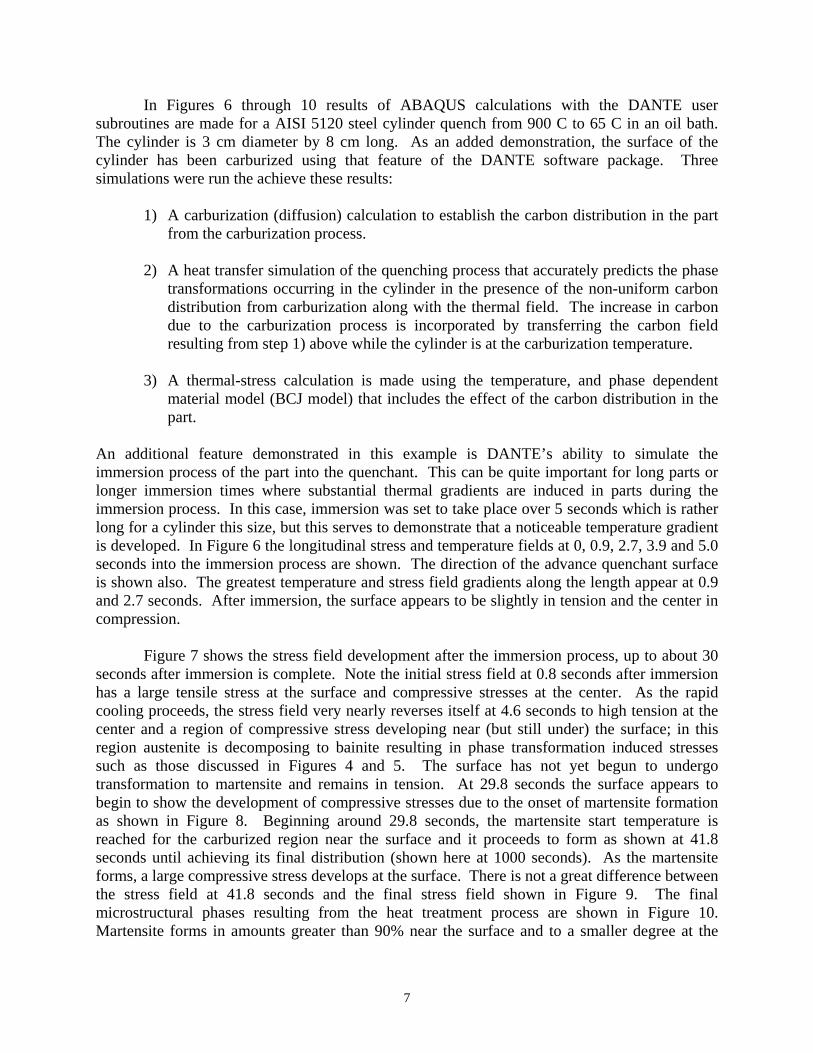
The Navy-C ring is a commonly used test piece to study the sensitivity of alloy grade and heat treatment conditions on heat treatment distortion. Simulations were run for a Navy-C ring geometry shown in Figure 11 to investigate the effect of two different alloy grades (4140 and 8620) and two different cooling/quenching methods (water and oil quench) on the resulting distortions. Simulations were run using ABAQUS with the DANTE user subroutines. Experimental results for the dimensional changes at the gap opening and outside diameter are reported in [45] and given here in Table I. Unfortunately, the experimental results are for carburized test pieces, and the details of the carburization process were not documented. Also, the details of the heating process and temperature at the start of quench were not given for the measurements. Even though carburization could be simulated with DANTE, it could not be simulated faithfully to the experiments. The missing information makes it impossible to directly compare the magnitudes of the distortions in Table I with the simulations. Nevertheless, a relative comparison between the simulations and experiments is possible. This study is also of interest because it demonstrates further the capabilities of the software. The finite element mesh used for these simulations was generated using ABAQUS CAE. As shown in Figure 12, the mesh has 750 elements and 1116 nodes, and one-quarter symmetry is assumed for the analysis. There is a vertical plane of symmetry assumed running midway through the gap (i.e. one-half of the ring), and another plane of symmetry runs midway through the thickness (i.e. one-half the thickness. Uniform heating/cooling conditions using surface temperature dependent heat transfer coefficients as shown in Figure 13 are used. The two alloys and two cooling conditions give a simulation test matrix of four runs: 4140 oil quench to 65 C, 4140 water quenched to 25 C, 8620 oil quench to 65 C, and 8620 water quenched to 25 C. These cases will be referred to as 4140OQ, 4140WQ, 8620OQ and 8620WQ, respectively. All pieces are first heated to 900 C before quenching. Simulation results showing the test piece distortions and contours of x-direction displacement for the 4140OQ, 4140WQ, 8620OQ and 8620 WQ cases are given in Figures 14 to 17, respectively. The x-dimensional change should be equivalent to the measurements. The figures show results at the start of the heating process, at the end of heating to 900 C, 1 s into quench, 2 s into quench, and final quenched condition. Note that the distorted geometry is magnified 30 times to make it easier to discern. The resulting shape at each time shown are scaled consistently, for example at the end of the heating process the piece is at its largest size as shown in the top most right of Figures 14 to 17. In Figures 14 and 15 the effect of quenchant on the distortion of the 4140 is quite clear with the water producing noticeably higher distortion.
9
Likewise in Figures 16 and 17, the 8620 water quenched piece shows the greatest distortion. The 4140 gave greater distortions than the 8260 when comparing alloys for the same cooling conditions. These results compare favorably in a qualitative sense with the measured results shown in Table I, where the 4140WQ cracked (and the distortion could not be measured), 8620WQ was next highest, followed by the 4140OQ case and the least distortions were seen in the 8620OQ case.
The x-displacements at nodes B and C (consult Figure 12) are given for the four cases in Figure 18 for the heating and cooling processes. Note that there is plastic strain occurring during the heating process, and differences between alloys. The effective plastic strain for the entire process is given in Figure 19 for all cases; note that there is plastic strain during the heating process and not a great deal of difference between the two alloys. This means that the details of the heating process are needed if one is to have an accurate simulation and better agreement between simulations and the measurements since some plastic deformation has occurred during heating. The measured [45] and predicted dimensional changes were compared in a relative sense. Direct comparison between the measured and predicted dimensional changes show the simulated distortions to be substantially larger than the measurements. This is due to the lack of carburization in the simulations, but it is also due to a lack of detailed information about heating process. A relative comparison between the measurements and experiments were made by normalizing the dimensional changes with the largest observed dimensional change in the measurements, the gap dimension on the 8620WQ case. For the measurements, all x-dimensional changes are divided by the measured gap dimension change for the 8620WQ case. For the simulation results, all simulated x-dimensional changes are divided by the simulated gap dimension change for the 8620WQ case. These results are presented in terms of percentages in Table II and are plotted in Figure 20. The relative comparison between the dimensional changes agrees well for both alloys and cooling conditions. Note that the predicted dimensional change for the 4140WQ case, which cracked in the experiment, was over 100% of the 8620WQ. The lack of precise information necessary to replicate the experiments using simulation is disappointing for this test case, and more completely documented experimental results will be compared to simulation in future work. This certainly points out the need to measure carefully and document thoroughly any experiments undertaken by this project. The predicted microstructure development at the nodal positions A, B and C (shown in Figure 12) are compared for the four cases. The nodal locations are: “A” at the center of the piece, “B” at the gap, and local at node “C” on the outside diameter. The predicted martensite volume fraction for the 4140 alloy cases, from start of heating through end of quench are given in Figure 21. Note that the martensite formation is very high for both the oil and water quenched 4140 cases. In Figure 22, the martensite formation for the 8620 steel is very high for the water quenched case, but the oil quenched case shows much less martensite developed especially at nodal position A which cools the slowest. For the 8620 steel, bainite is the predominant other phase formed.
10
Conclusions and Future Work
The work presented here gives an overview of the problem of heat treatment stress and distortion and a review of literature surrounding it and software that has been developed to model it. Simulations were performed and are presented here to demonstrate the software available for predicting heat treatment stress and distortion. The software package DANTE was identified as one of the most advanced tools for solving heat treat distortion problems. It was acquired for testing. Example calculations using DANTE show it to have very advanced features, and its predictions were shown to agree in a relative sense with some previously made measurements of heat treatment distortion. Unfortunately, the documentation of such experiments in the literature is often incomplete as was the case here.
In the immediate future, the authors are developing a test piece casting to be produced at
a participating foundry to provide data on heat treatment distortions. The test casting is being designed through simulation and through consideration of past experiments reported in the literature. The authors are also asking foundries to participate by identifying heat treated castings that can benefit from being studied and analyzed as test cases during the project. CAD models, heat treatment process details and other data would be necessary to pursue studying a casting. Experimental measurement of temperatures and distortions during heat treatment, and (possibly) residual stresses, will be made in the future as part of both experiments on test piece castings, and on production case study castings, to validate and improve the software predictions.
Acknowledgments
This research was funded by the United States Department of Energy as part of the
Energy-Saving Melting and Revert Reduction Technology (E-SMARRT) research program under award number DE-FC36-04GO14230. It is also conducted under the auspices of the Steel Founders' Society of America, and through substantial in-kind support, guidance and interest from SFSA member foundries. Further, we would also like to thank MAGMA GmbH for their generous support through donation of software, time and information sharing. Any findings, opinions, and conclusions or recommendations expressed in this report are those of the authors and do not necessarily reflect the views of the Department of Energy.
References 1. A.J. Fletcher, Thermal Stress and Strain Generation in Heat Treatment, (Elsevier Science,
London, 1989). 2. J. Rohde, and A. Jeppsson, “Literature Review of Heat Treatment Simulations with Respect
to Phase Transformation, Residual Stresses and Distortion,” Scandinavian Journal of Metallurgy, 2000, 29(2), pp. 47-62.
3. J. Rohde, A. Thuvander and A. Melander, “Using Thermodynamic Information in Numerical
Simulation of Distortion Due to Heat Treatment”, Progress in Heat Treatment and Surface
11
Engineering, Proc. Of the 5th ASM Heat Treatment and Surface Engineering Conf., ASM International, 2000, pp. 21-29.
4. M. Avrami, “Kinetics of Phase Change”, J. Chem. Physics, 9, 1941, pp. 177-184. 5. D. Koistinen and R. Marburger, “A General Equation Prescribing the Extent of the
Austenite-Martensite Transformation in Pure Iron-Carbon Alloys and Plain Carbon Steels”, Acta Met., 7, 1959, pp. 50-60.
6. M. Hunkel, T. Luebben, F. Hoffmann, and P. Mayr, “Simulation of Transformation Behavior
of Steels During Quenching”, Progress in Heat Treatment and Surface Engineering, Proc. Of the 5th ASM Heat Treatment and Surface Engineering Conf., ASM International, 2000, pp. 43-53.
7. M.T. Lusk, “Martensitic Phase Transitions with Surface Effects”, Journal of Elasticity, 34,
1994, pp. 191-227. 8. Lusk, M.T., “Martensitic Phase Nucleation with Surface Effects”, Journal of the Mechanics
and Physics of Solids, 42, 1994, pp. 241-282. 9. Lusk, M.T., Krauss G. and H. Jou, “A Balance Principle Approach for Modeling Phase
Transformation Kinetics”, Journal de Physique IV, 8, 1995, pp. 279-284. 10. Lusk, M.T., “A Geometrically Nonlinear Theory of Stress-Assisted Martensite Kinetics”,
Journal of Elasticity, 44, 1996, pp. 271-284. 11. D.J. Bammann, V.C. Prantil, A.A. Kumar, J.F. Lanthrop, D.A. Mosher, M. Lusk, H.J. Jou, G.
Krauss, W.H. Elliott, “A Material Model for Low Carbon Steels Undergoing Phase Transformations”, Proceedings of the 2nd International Conference on Quenching and the Control of Distortion (eds. G. Totten, M. Howes, S. Sjostrom, and K. Funatani), 1996, pp. 367-376.
12. M.T. Lusk, and H. Jou, “On The Rule of Additivity in Phase Transformation Kinetics”,
Metallurgical and Material Transactions, 28A(2), 1997, pp. 287-291. 13. H. Jou, and M.T. Lusk, “Comparison of JMAK Kinetics with a Phase-Field Model for
Microstructural Evolution Driven by Substructure Energy”, Physical Review B, 55, 1997, pp. 8114-8121.
14. Y.K Lee, and M.T. Lusk, “Thermodynamic Prediction of the Eutectoid Transformation
Temperatures of Low-Alloy Steels”, Metallurgical and Materials Transactions A, 30, 1999, pp. 2325-2329.
15. M.T. Lusk, and Y.-K. Lee, “A Global Material Model for Simulating the Transformation
Kinetics of Low Alloy Steels”, Proceedings of the 7th International Seminar of the International IFHT, 1999, pp. 273-282.
12
16. M.T. Lusk, Y.-K. Lee, H.-J. Jou, W.E. Elliott and G.M. Ludtka, “An Internal State Variable
Model for the Low Temperature Tempering of Low Alloy Steels”, Journal of Shanghai Jiaotong University: Proceedings of the 1st International Conference on Thermal Process Modeling and Computer Simulation, 2000.
17. M.T. Lusk, M.T., W. Wang, X. Sun and Y.-K. Lee, “On the Role of Kinematics in
Constructing Predictive Models of Austenite Decomposition”, Austenite Formation and Decomposition, (Eds. E.B. Damm and M.J. Merwin), Minerals, Metals and Materials Society, Warrendale, PA 2003, pp. 311-332.
18. H. Alberg, Material Modelling for Simulation of Heat Treatment, Licentiate Thesis Lulea
University of Technology. 19. H. Alberg and D. Berglund, “Comparison of Plastic, Viscoplastic, and Creep Models when
Modelling Welding and Stress Relief Heat Treatment”, Computer Methods in Applied Mechanics and Engineering, 192, 2003, pp. 5189-5208.
20. D. Berglund, H. Alberg and H. Runnemalm, “Simulation of Welding and Stress Relief Heat
Treatment of an Aero Engine Component”, Finite Elements in Analysis and Design, 39, 2003, pp. 865-881.
21. D.J. Bammann, M.L. Chiesa and G.C. Johnson, “Modeling Large Deformation and Failure in
manufacturing Processes”, Proc. of the 19th International Congress of Theoretical and Applied Mechanics, Tatsumi et al. eds, Kyoto, Japan, 1996, pp. 359-376.
22. D.J. Bammann, V.C. Prantil and J.F. Lanthrop, “A Plasticity Model for Materials
Undergoing Phase Transformations”, NUMIFORM’95: The 5th Int. Conf.on Numerical Methods in Industrial Forming Processes, Ithaca N.Y., 1995, pp. 219-223.
23. D.J. Bammann and A.R. Ortega, “The Influence of the Bauschinger Effect and Yield
Definition on the Modeling of Welding Processes”, Welding and Advanced Solidification Processes-VI, Piwonka, Voller and Katgerman, eds., The Minerals, Metals & Materials Society, Warrendale, PA, 1993, pp. 543-551.
24. J.F. Lathrop, B-FIT – A Program to Analyze and Fit the BCJ Model Parameters to
Experimental Data: Tutorial and User’s Guide, Sandia Report, SAND97-8218, Dec. 1996 25. V.C. Prantil, M.L. Callabresi, G.S. Ramaswamy, J. F. Lathrop, G.S. Ramaswamy, M.T.
Lusk, “Simulating Distortion and Residual Stresses in Carburized Thin Strips”, ASME Journal of Engineering Materials and Technology, 125(2), 2003, pp. 116-124.
26. C.H. Guer and A.E. Tekkaya, “Numerical Investigation of Non-homogeneous Plastic
Deformation in Quenching Process”,Materials Science and Engineering A319-321, 2001, pp. 164-169.
13
27. J.W. Jang, I.W. Park, K.H. Kim and S.S. Kang, “FE Program for Predicting Thermal Deformation in Heat Treatment”, Journal of Materials Processing Technology 130-131, 2002, pp. 546-550.
28. R. Kuebler, S. Zhang, H. Mueller and D. Loehe, “Simulation of Stresses, Residual Stresses
and Distortion in Specimens of AISI 52100 During Gas Quenching”, Progress in Heat Treatment and Surface Engineering, Proc. Of the 5th ASM Heat Treatment and Surface Engineering Conf., ASM International, 2000, pp. 31-41.
29. C. Lui, X. Xu and Z, Liu, “A FEM Modeling of Quenching and Tempering and Its
Application in Industrial Engineering” Finite Elements in Analysis and Design, 39, 2003, pp. 1053-1070.
30. SYSWELD – A Predictive Model for Heat Treat Distortion, Southwest Research Institute,
1992. 31. Homepage of SYSWELD software available from ESI-Group, http://www.esi-
group.com/SimulationSoftware/Welding_heat_treatment/heat_html. 32. T. Inoue, D.Y. Ju, and K. Arimoto, “Metallo-Thermo-Mechanical Simulation of Quenching
Process – Theory and Implementation of the Computer Code HEARTS”, 1st International Conference on Quenching and Distortion Control, G.E. Totten Ed., ASM International, 1992, pp. 205-212.
33. K. Arimoto, G. Li, A. Arvind and W.T. Wu, “Development of Heat Treatment Simulation
System DEFORMTM-HT”, Proceedings of the 18th Conference on Heat Treating, R.A. Wallis and H. Walton Eds., ASM International, 1998, pp. 639-654.
34. J. Cho, W. Kang, M. Kim, J. Lee, Y. Lee and W. Bae “Distortions Induced by Heat
Treatment of Automotive Bevel Gears”, Journal of Materials Processing Technology 153-154, 2004, pp. 476-481.
35. Homepage of Scientific Forming Technologies Corporation (SFTC), develops and supports
the DEFORM software, http://www.deform.com/. 36. N. Jarvstrat and S. Sjostrom, "Current Status of TRAST; a Material Model Subroutine
System for the Calculation of Quench Stresses in Steel", Proceedings of ABAQUS User's Meeting, 1993, pp.273-287.
37. Homepage of LiTeRaTi, vendors of TRAST, http://www.algonet.se/~literat/steel.htm. 38. C. Mgbokwere and M. Callabresi, “Numerical Simulation of a Heat-Treated Ring Gear
Blank”, ASME Journal of Engineering Materials and Technology, 122, 2000, pp. 305-314.
14
39. B.L. Ferguson, A. Freborg, G. Petrus and M. Callabresi, “Predicting the Heat-treat Response of a Carburized Helical Gear”, Gear Technology, November, 2002, pp. 20-25.
40. B.L. Ferguson, Z. Li and A.M. Freborg, “Modeling Heat Treatment of Steel Parts”,
Computational Materials Science, 2005, 34(3), pp. 274-281. 41. Homepage of DANTETM on Deformation Control Technology’s website,
http://www.deformationcontrol.com/dante_slide.htm. 42. M. Weber, Simulation der Waermebehandlung eines niedriglegierten Stahlgussteils mit dem
Simulationsprrogramm MAGMASOFTTM, Diplomarbeit, Institut fuer Werkstoffkunde I, Universitaet Karlsruhe, 2003.
43. C.R. Brooks, Principles of the Heat Treatment of Plain Carbon and Low Alloy Steels, ASM
International, Materials Park, OH, 1996, pp. 87-126. 44. As cited in reference [43], L.J. Ebert, Met. Trans., Vol. 9A, 1978, p. 1537. 45. G.E. Totten, C.E. Bates, and N.A. Clinton, Handbook of Quenchants and Quenching
Technology, ASM International, Materials Park, OH, 1993, p. 489.
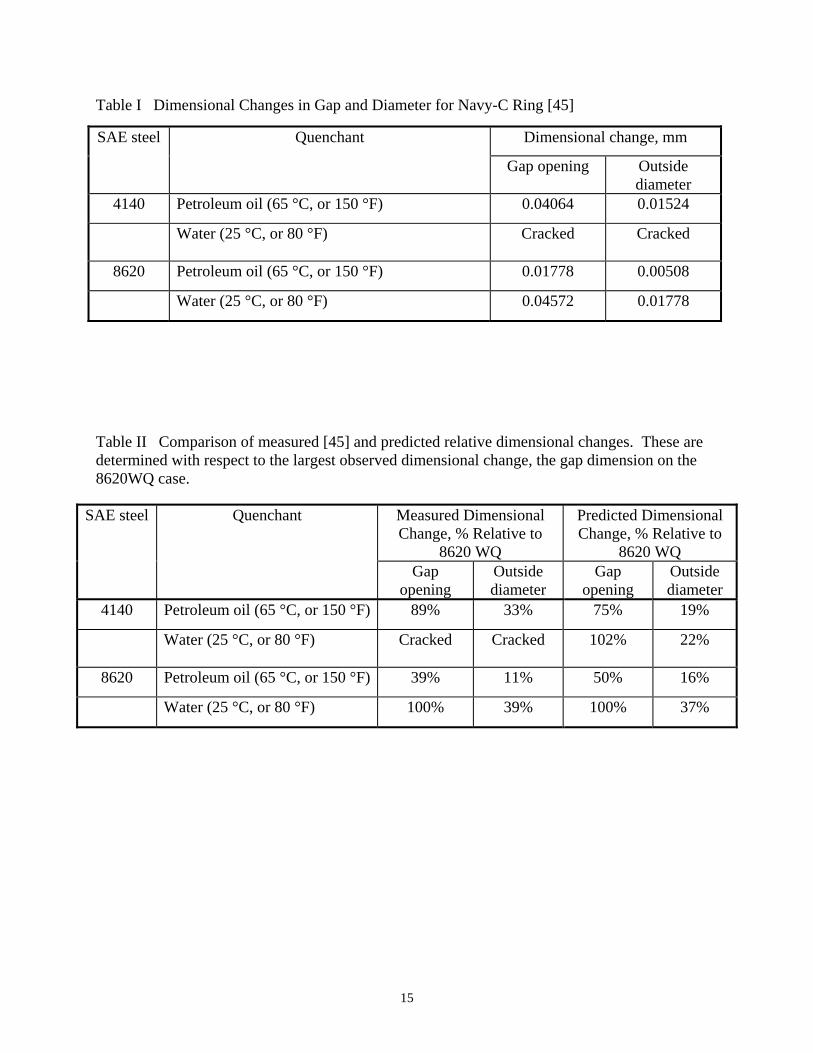
15
Table I Dimensional Changes in Gap and Diameter for Navy-C Ring [45]
Table II Comparison of measured [45] and predicted relative dimensional changes. These are determined with respect to the largest observed dimensional change, the gap dimension on the 8620WQ case.
SAE steel Quenchant Dimensional change, mm
Gap opening Outside diameter
4140 Petroleum oil (65 °C, or 150 °F) 0.04064 0.01524
Water (25 °C, or 80 °F)
Cracked
Cracked
8620 Petroleum oil (65 °C, or 150 °F) 0.01778 0.00508
Water (25 °C, or 80 °F) 0.04572 0.01778
SAE steel Quenchant Measured Dimensional Change, % Relative to
8620 WQ
Predicted Dimensional Change, % Relative to
8620 WQ Gap
opening Outside diameter
Gap opening
Outside diameter
4140 Petroleum oil (65 °C, or 150 °F) 89% 33% 75% 19%
Water (25 °C, or 80 °F)
Cracked
Cracked
102% 22%
8620 Petroleum oil (65 °C, or 150 °F) 39% 11% 50% 16%
Water (25 °C, or 80 °F) 100% 39% 100% 37%
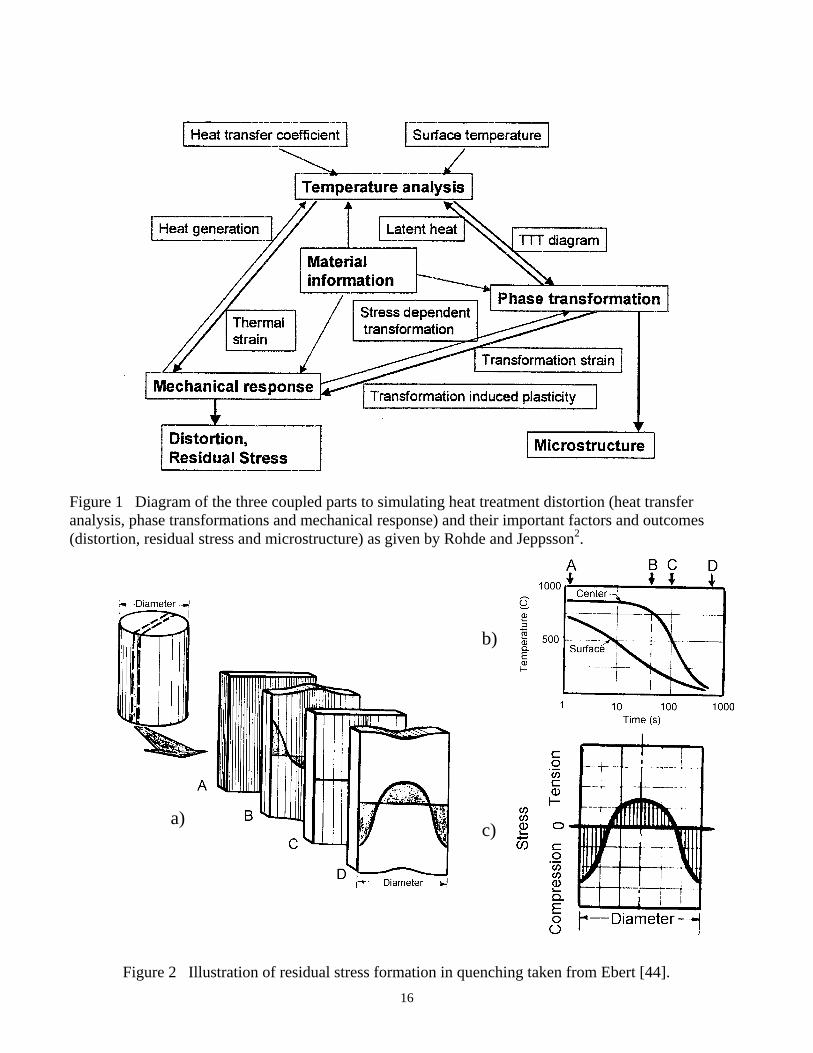
16
Figure 1 Diagram of the three coupled parts to simulating heat treatment distortion (heat transfer analysis, phase transformations and mechanical response) and their important factors and outcomes (distortion, residual stress and microstructure) as given by Rohde and Jeppsson2.
Figure 2 Illustration of residual stress formation in quenching taken from Ebert [44].
a)
b)
c)
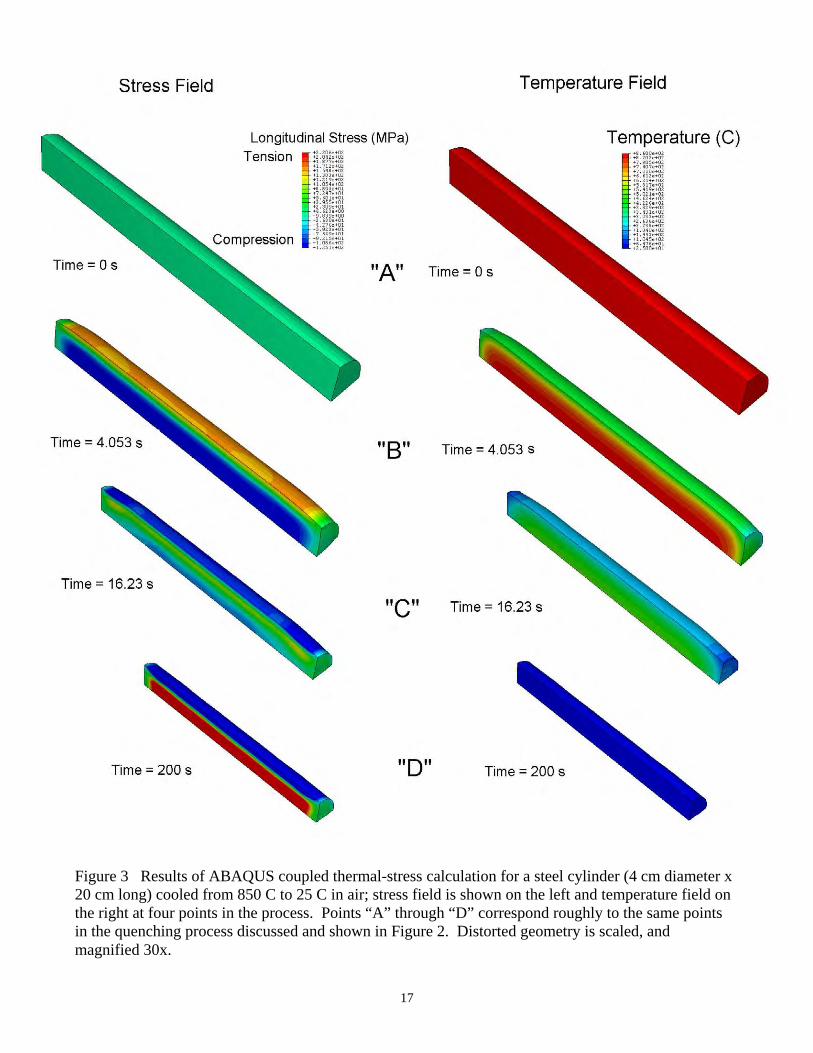
17
Figure 3 Results of ABAQUS coupled thermal-stress calculation for a steel cylinder (4 cm diameter x 20 cm long) cooled from 850 C to 25 C in air; stress field is shown on the left and temperature field on the right at four points in the process. Points “A” through “D” correspond roughly to the same points in the quenching process discussed and shown in Figure 2. Distorted geometry is scaled, and magnified 30x.
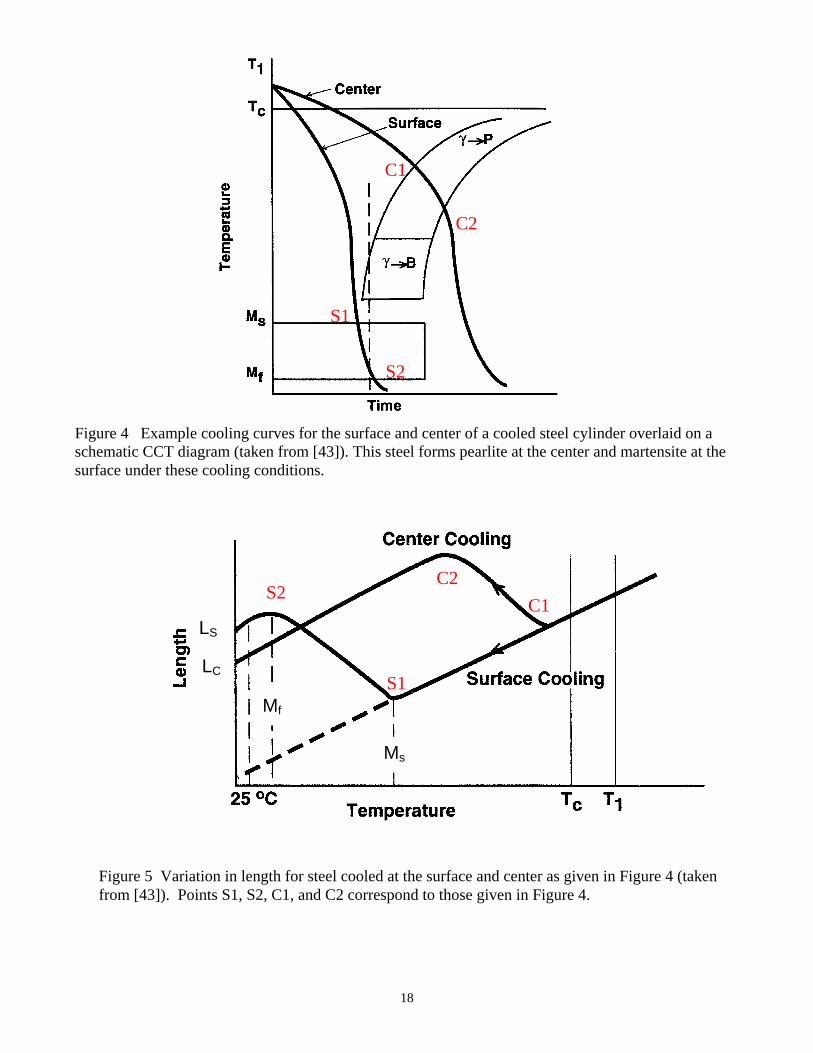
18
Figure 5 Variation in length for steel cooled at the surface and center as given in Figure 4 (taken from [43]). Points S1, S2, C1, and C2 correspond to those given in Figure 4.
Figure 4 Example cooling curves for the surface and center of a cooled steel cylinder overlaid on a schematic CCT diagram (taken from [43]). This steel forms pearlite at the center and martensite at the surface under these cooling conditions.
S1
C1
C2
S2
S1
C1
C2 S2
Ms
Mf
LC
LS
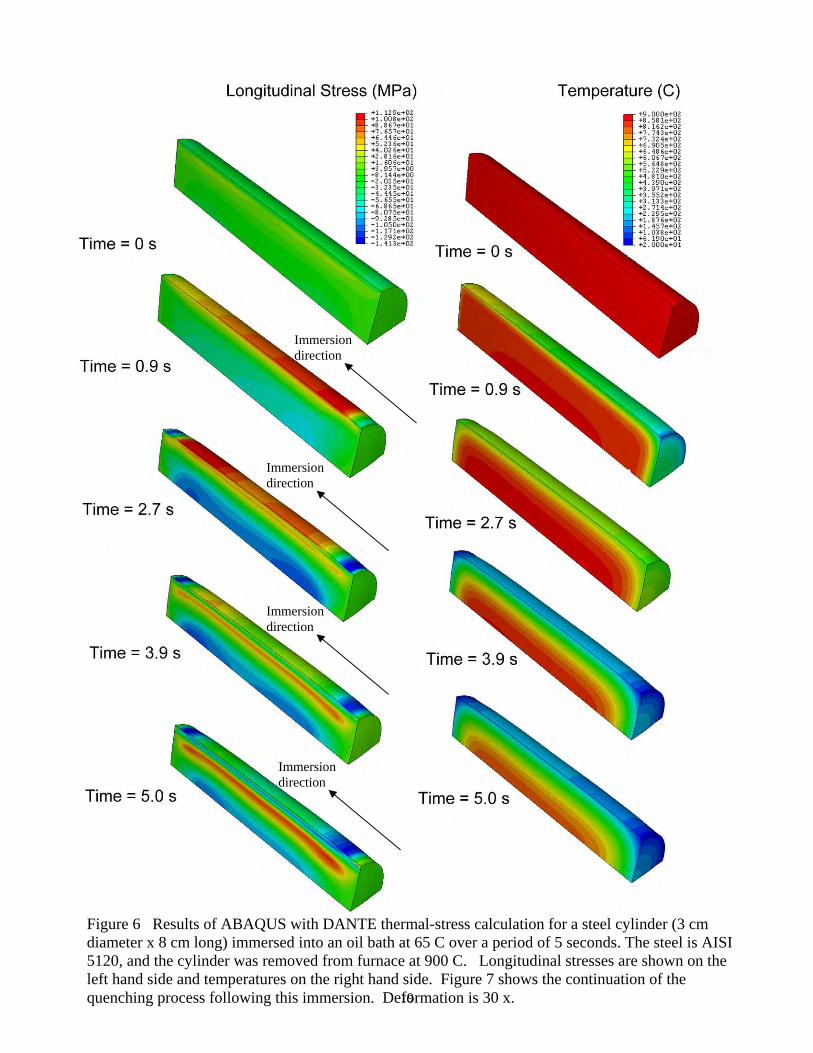
19
Figure 6 Results of ABAQUS with DANTE thermal-stress calculation for a steel cylinder (3 cm diameter x 8 cm long) immersed into an oil bath at 65 C over a period of 5 seconds. The steel is AISI 5120, and the cylinder was removed from furnace at 900 C. Longitudinal stresses are shown on the left hand side and temperatures on the right hand side. Figure 7 shows the continuation of the quenching process following this immersion. Deformation is 30 x.
Immersion direction
Immersion direction
Immersion direction
Immersion direction
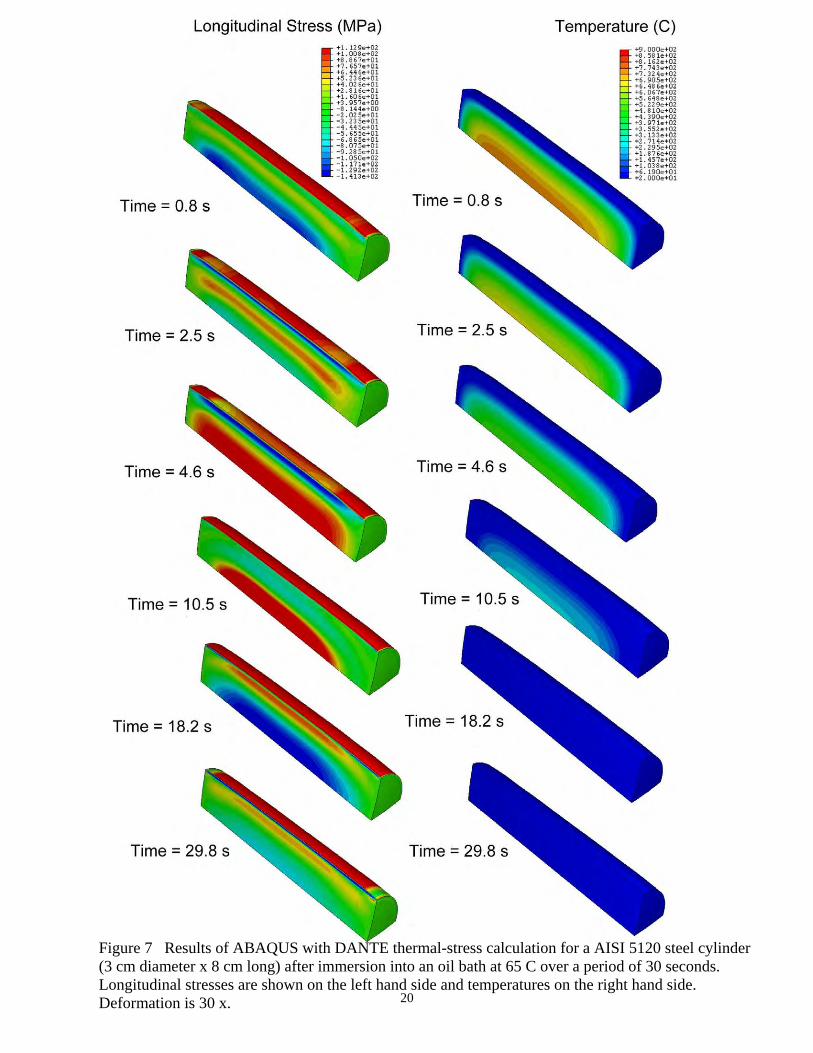
20
Figure 7 Results of ABAQUS with DANTE thermal-stress calculation for a AISI 5120 steel cylinder (3 cm diameter x 8 cm long) after immersion into an oil bath at 65 C over a period of 30 seconds. Longitudinal stresses are shown on the left hand side and temperatures on the right hand side. Deformation is 30 x.
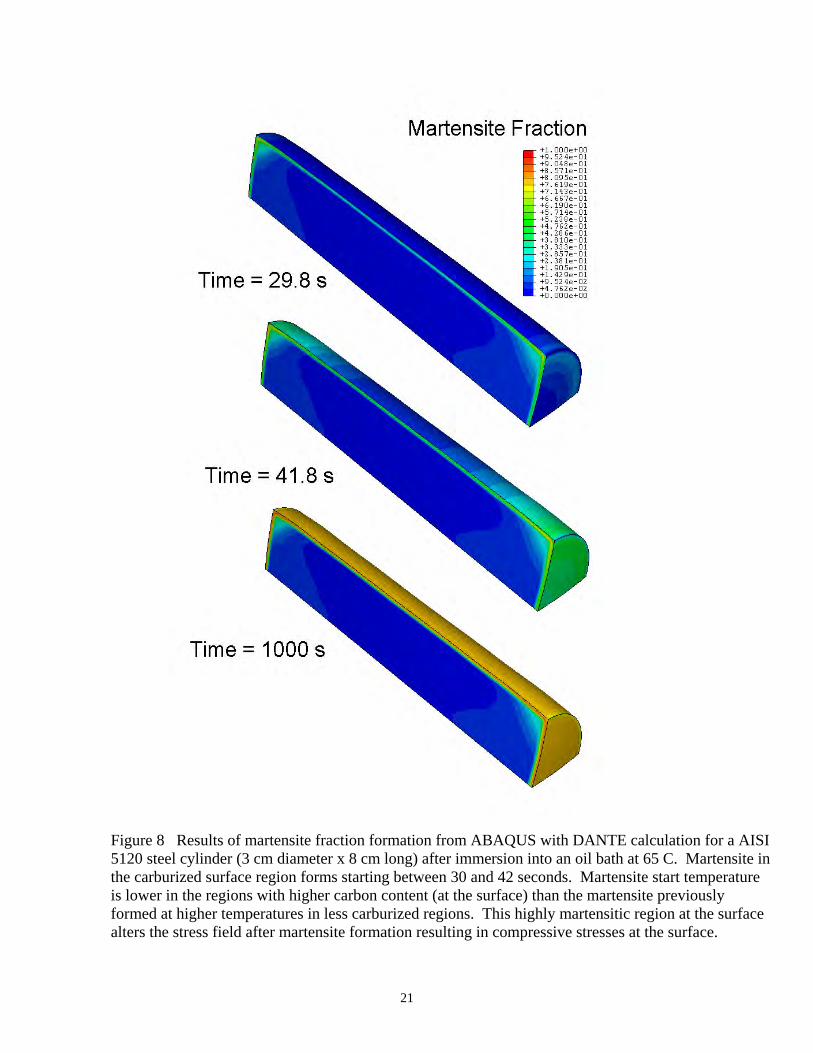
21
Figure 8 Results of martensite fraction formation from ABAQUS with DANTE calculation for a AISI 5120 steel cylinder (3 cm diameter x 8 cm long) after immersion into an oil bath at 65 C. Martensite in the carburized surface region forms starting between 30 and 42 seconds. Martensite start temperature is lower in the regions with higher carbon content (at the surface) than the martensite previously formed at higher temperatures in less carburized regions. This highly martensitic region at the surface alters the stress field after martensite formation resulting in compressive stresses at the surface.
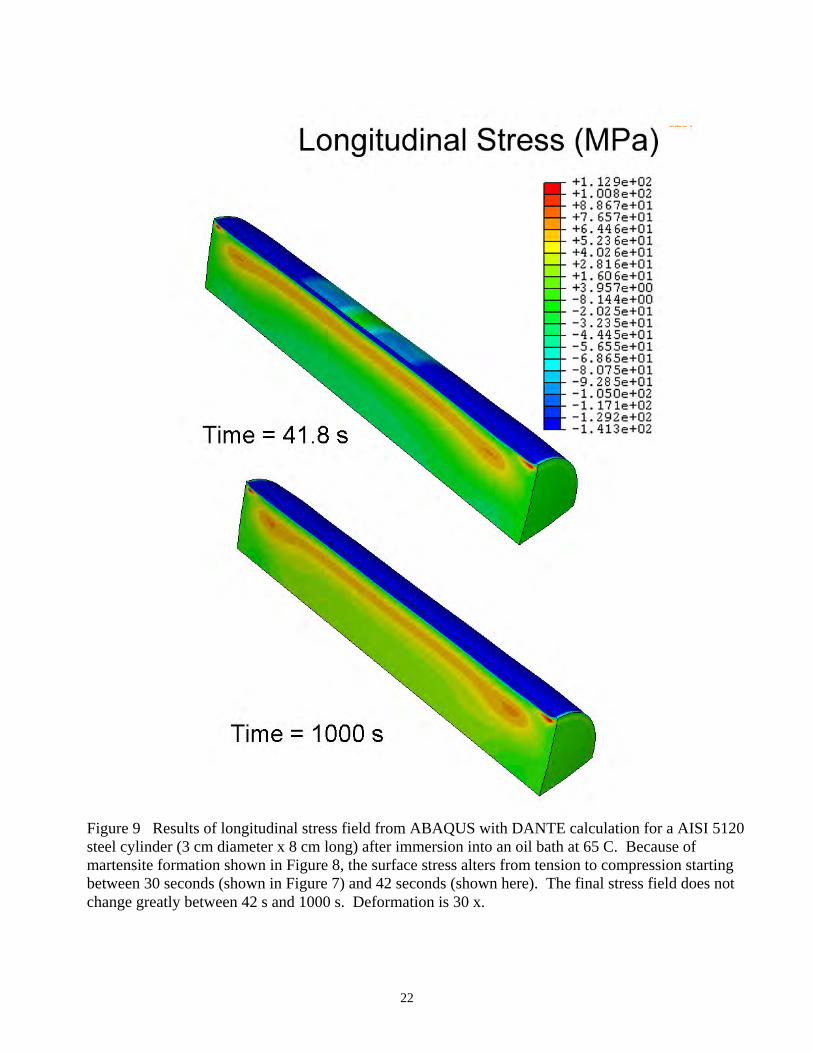
22
Figure 9 Results of longitudinal stress field from ABAQUS with DANTE calculation for a AISI 5120 steel cylinder (3 cm diameter x 8 cm long) after immersion into an oil bath at 65 C. Because of martensite formation shown in Figure 8, the surface stress alters from tension to compression starting between 30 seconds (shown in Figure 7) and 42 seconds (shown here). The final stress field does not change greatly between 42 s and 1000 s. Deformation is 30 x.
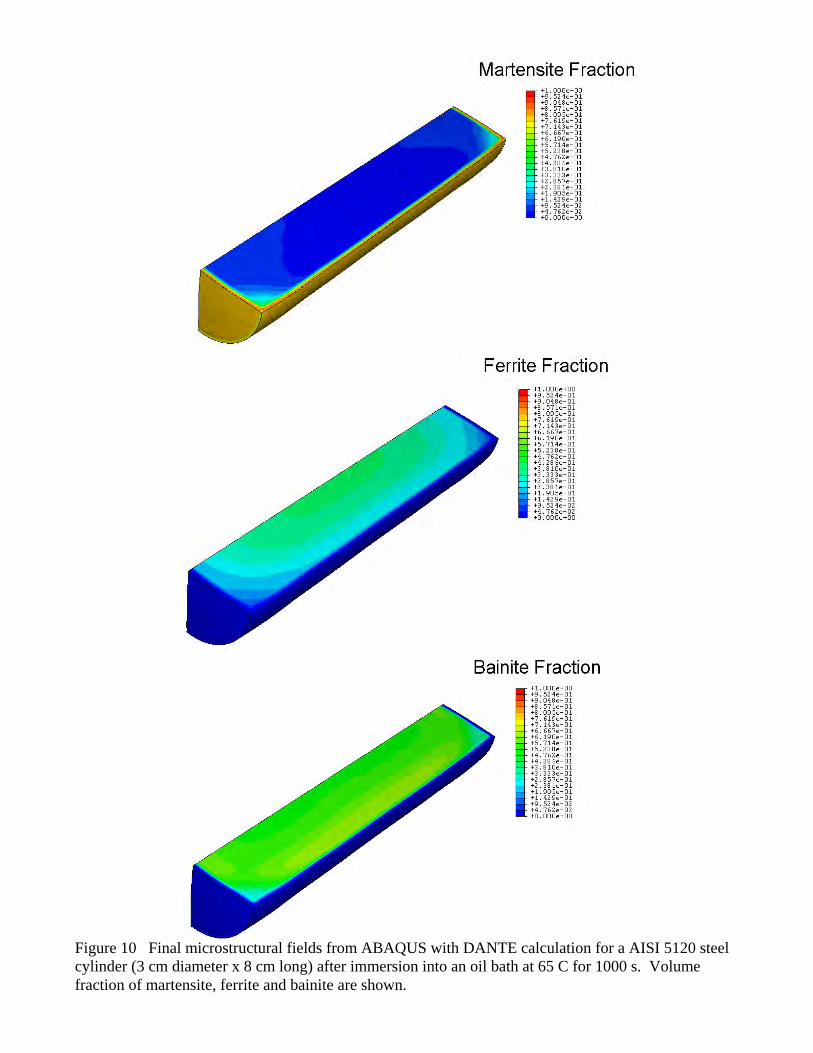
23
Figure 10 Final microstructural fields from ABAQUS with DANTE calculation for a AISI 5120 steel cylinder (3 cm diameter x 8 cm long) after immersion into an oil bath at 65 C for 1000 s. Volume fraction of martensite, ferrite and bainite are shown.
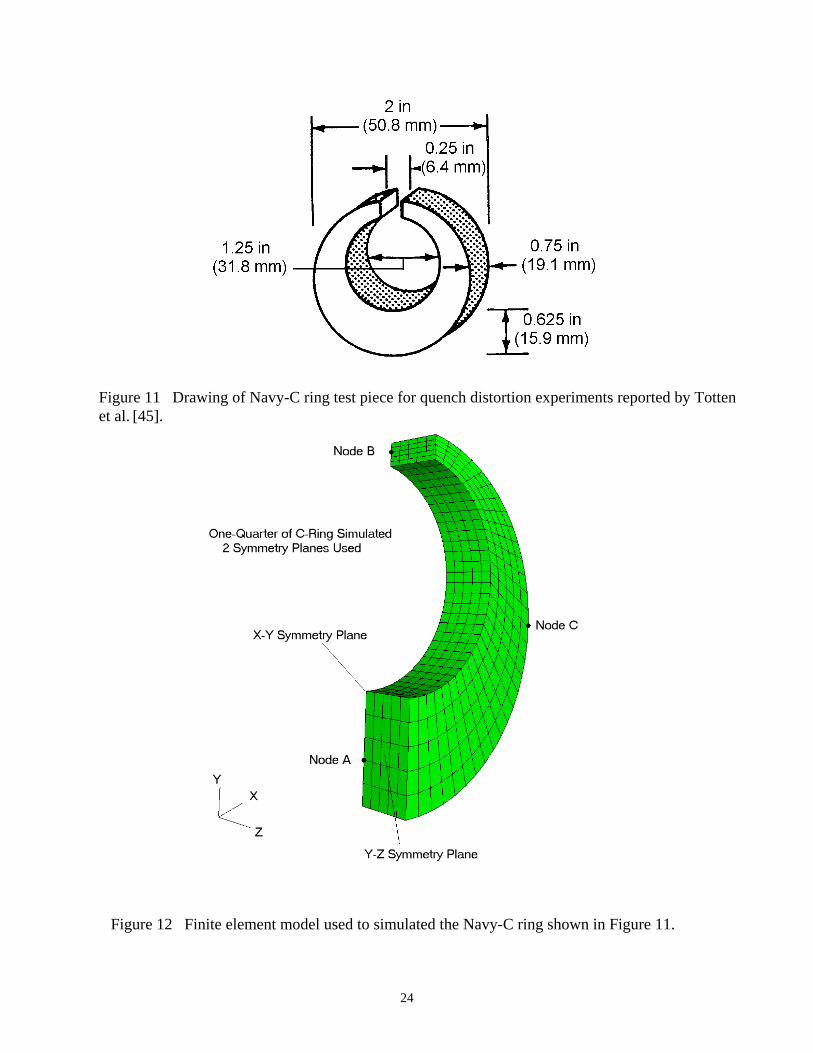
24
Figure 11 Drawing of Navy-C ring test piece for quench distortion experiments reported by Totten et al. [45].
Figure 12 Finite element model used to simulated the Navy-C ring shown in Figure 11.
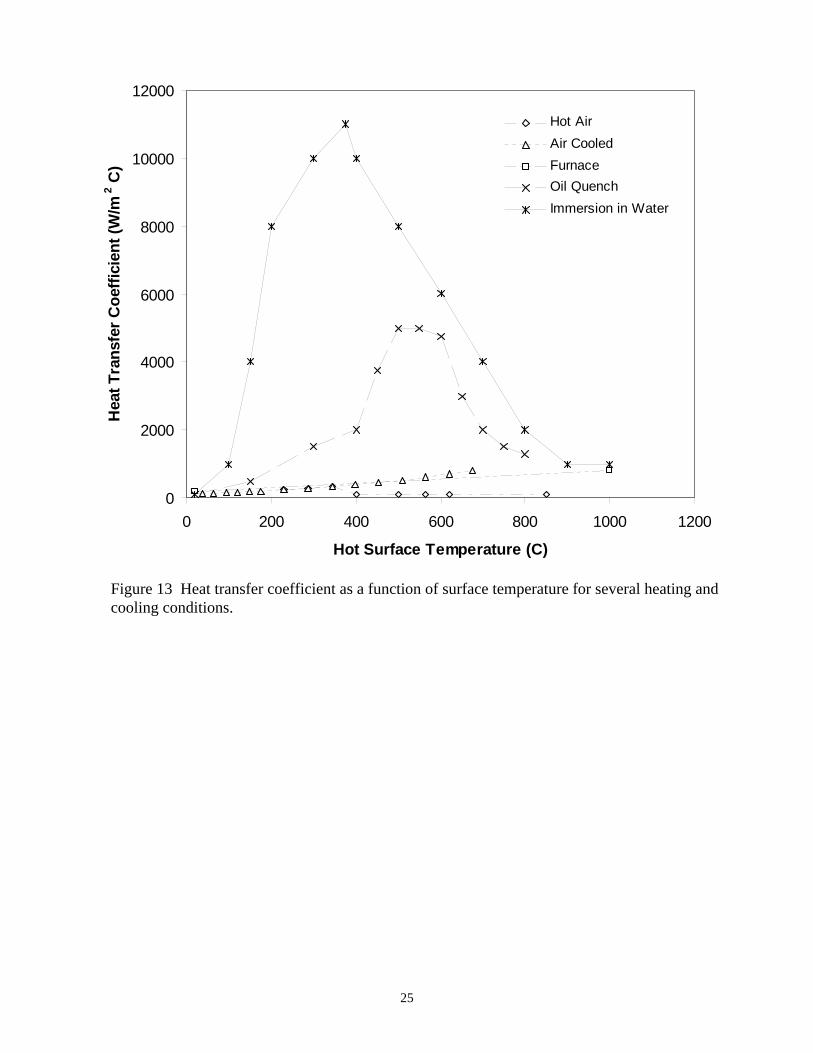
25
0
2000
4000
6000
8000
10000
12000
0 200 400 600 800 1000 1200
Hot Surface Temperature (C)
Hea
t Tra
nsfe
r Coe
ffici
ent (
W/m
2 C)
Hot Air
Air Cooled
Furnace
Oil Quench
Immersion in Water
Figure 13 Heat transfer coefficient as a function of surface temperature for several heating and cooling conditions.
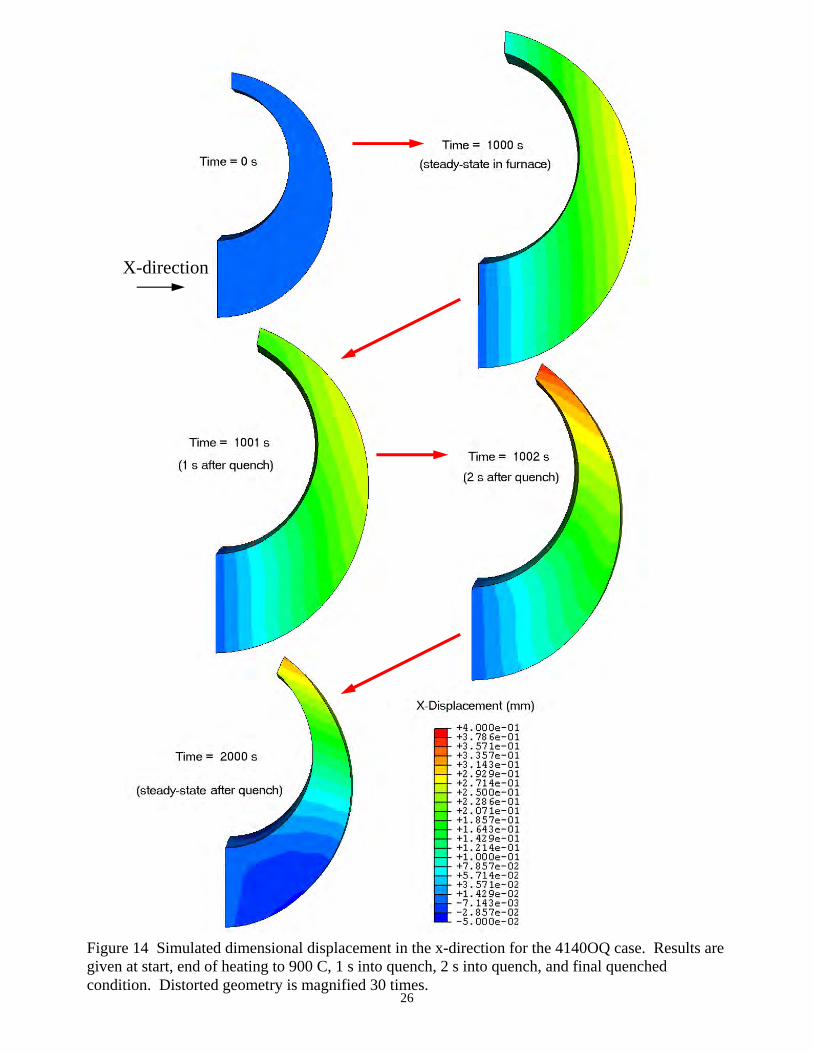
26
Figure 14 Simulated dimensional displacement in the x-direction for the 4140OQ case. Results are given at start, end of heating to 900 C, 1 s into quench, 2 s into quench, and final quenched condition. Distorted geometry is magnified 30 times.
X-direction
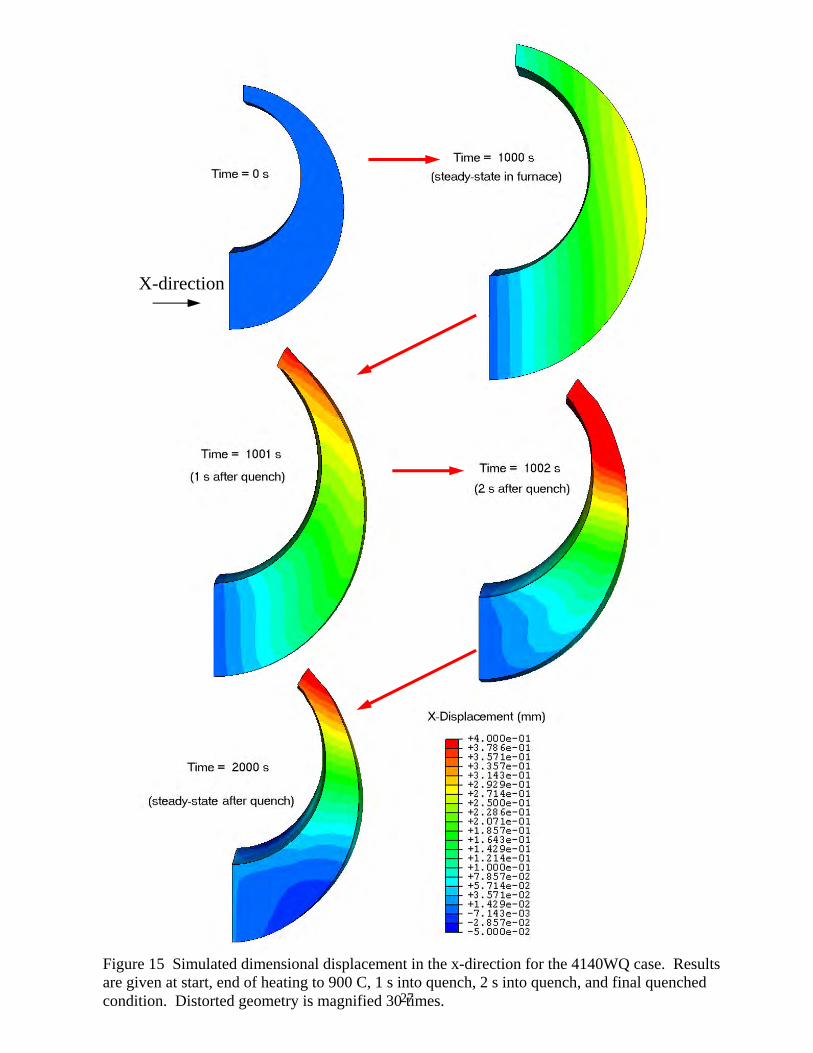
27
Figure 15 Simulated dimensional displacement in the x-direction for the 4140WQ case. Results are given at start, end of heating to 900 C, 1 s into quench, 2 s into quench, and final quenched condition. Distorted geometry is magnified 30 times.
X-direction
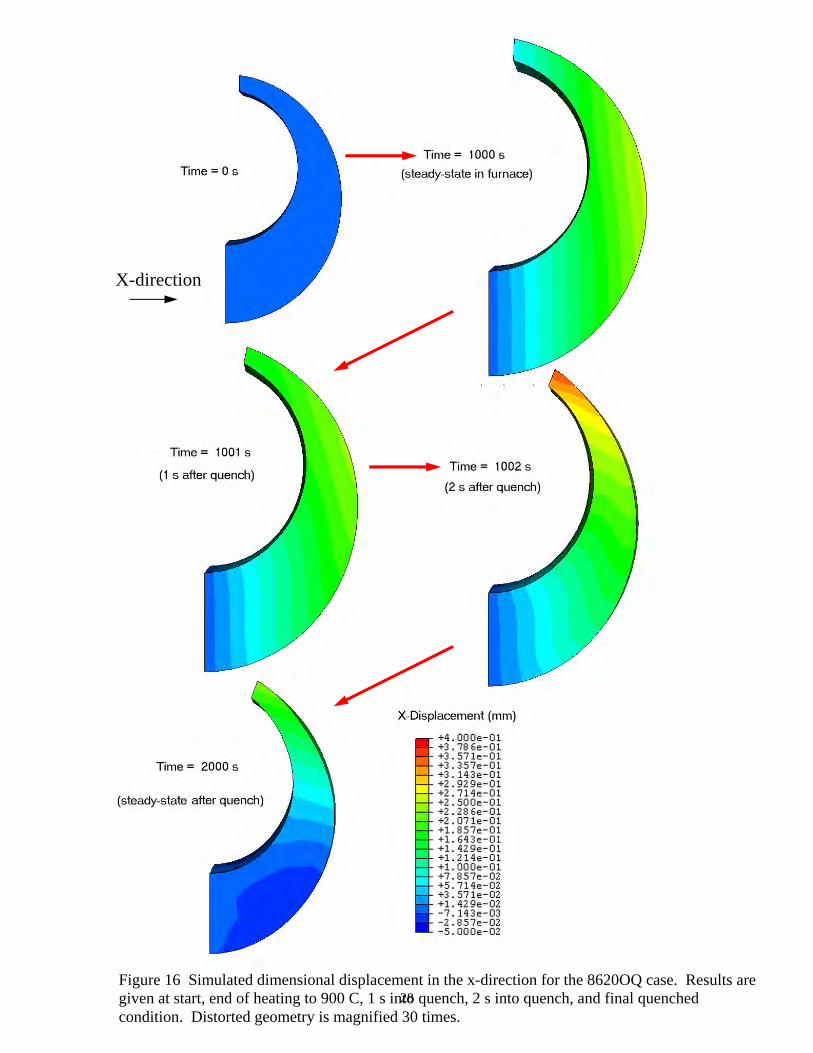
28Figure 16 Simulated dimensional displacement in the x-direction for the 8620OQ case. Results are given at start, end of heating to 900 C, 1 s into quench, 2 s into quench, and final quenched condition. Distorted geometry is magnified 30 times.
X-direction
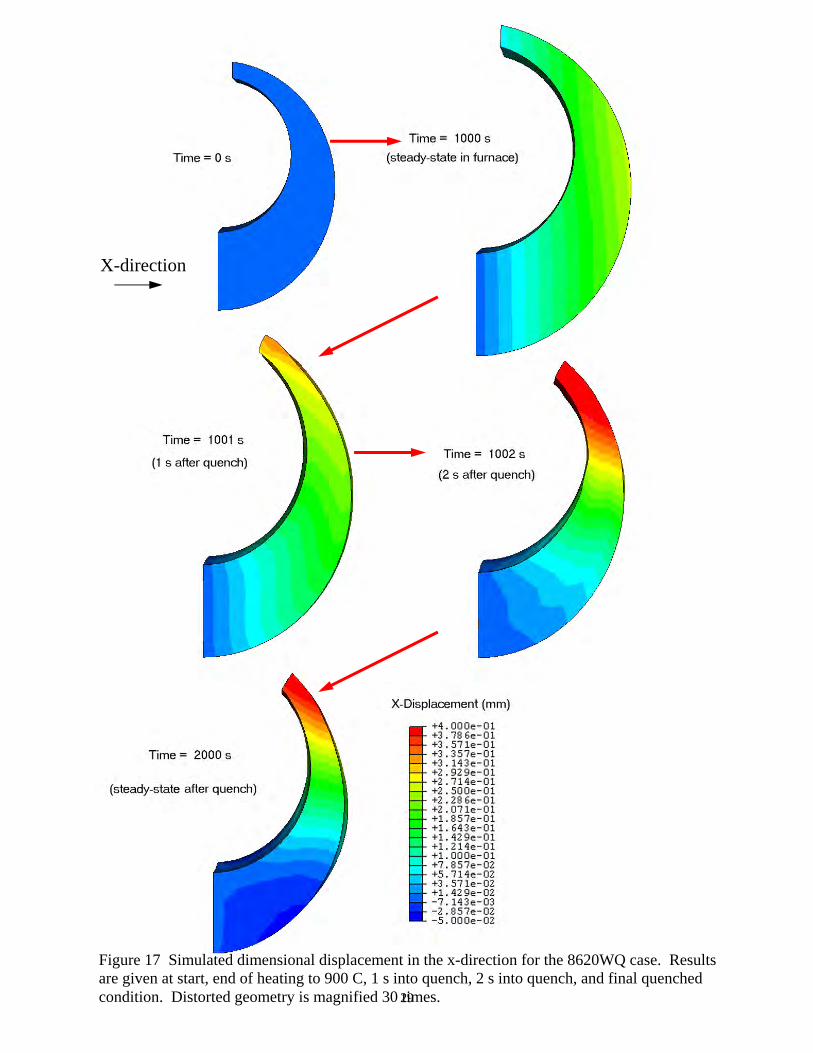
29
Figure 17 Simulated dimensional displacement in the x-direction for the 8620WQ case. Results are given at start, end of heating to 900 C, 1 s into quench, 2 s into quench, and final quenched condition. Distorted geometry is magnified 30 times.
X-direction
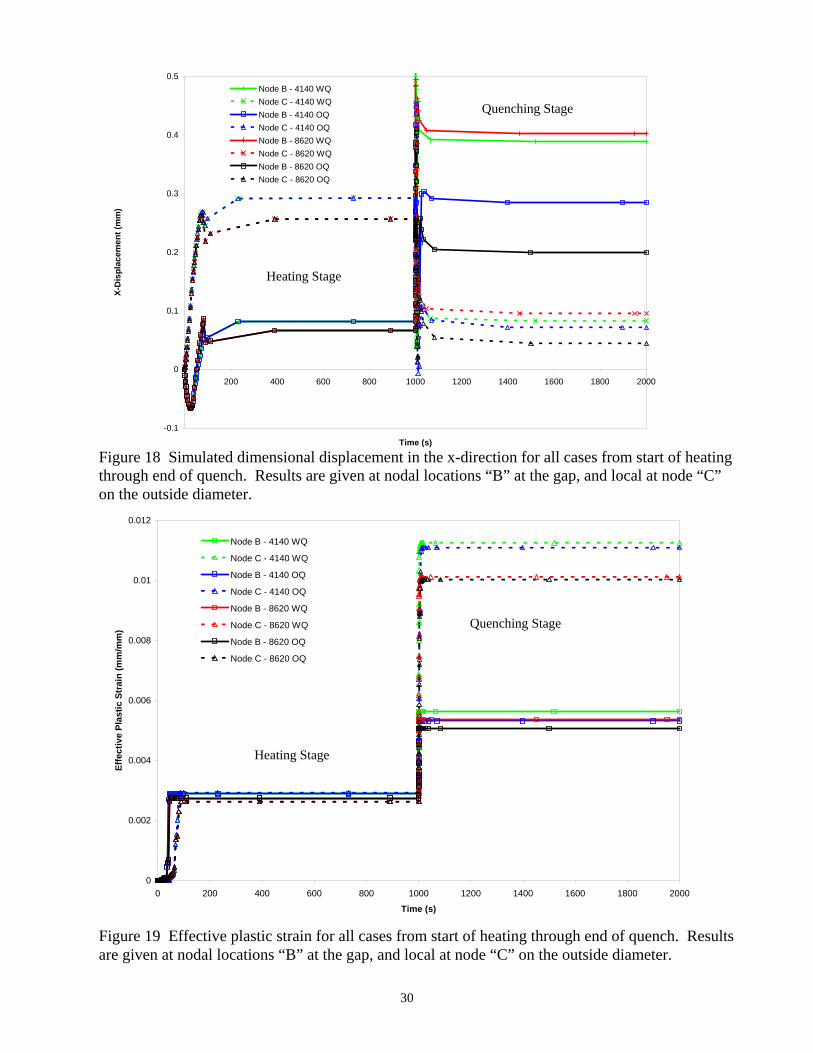
30
-0.1
0
0.1
0.2
0.3
0.4
0.5
0 200 400 600 800 1000 1200 1400 1600 1800 2000
Time (s)
X-D
ispl
acem
ent (
mm
)
Node B - 4140 WQ
Node C - 4140 WQ
Node B - 4140 OQ
Node C - 4140 OQ
Node B - 8620 WQ
Node C - 8620 WQ
Node B - 8620 OQ
Node C - 8620 OQ
0
0.002
0.004
0.006
0.008
0.01
0.012
0 200 400 600 800 1000 1200 1400 1600 1800 2000
Time (s)
Effe
ctiv
e Pl
astic
Str
ain
(mm
/mm
)
Node B - 4140 WQ
Node C - 4140 WQ
Node B - 4140 OQ
Node C - 4140 OQ
Node B - 8620 WQ
Node C - 8620 WQ
Node B - 8620 OQ
Node C - 8620 OQ
Figure 18 Simulated dimensional displacement in the x-direction for all cases from start of heating through end of quench. Results are given at nodal locations “B” at the gap, and local at node “C” on the outside diameter.
Figure 19 Effective plastic strain for all cases from start of heating through end of quench. Results are given at nodal locations “B” at the gap, and local at node “C” on the outside diameter.
Heating Stage
Quenching Stage
Heating Stage
Quenching Stage
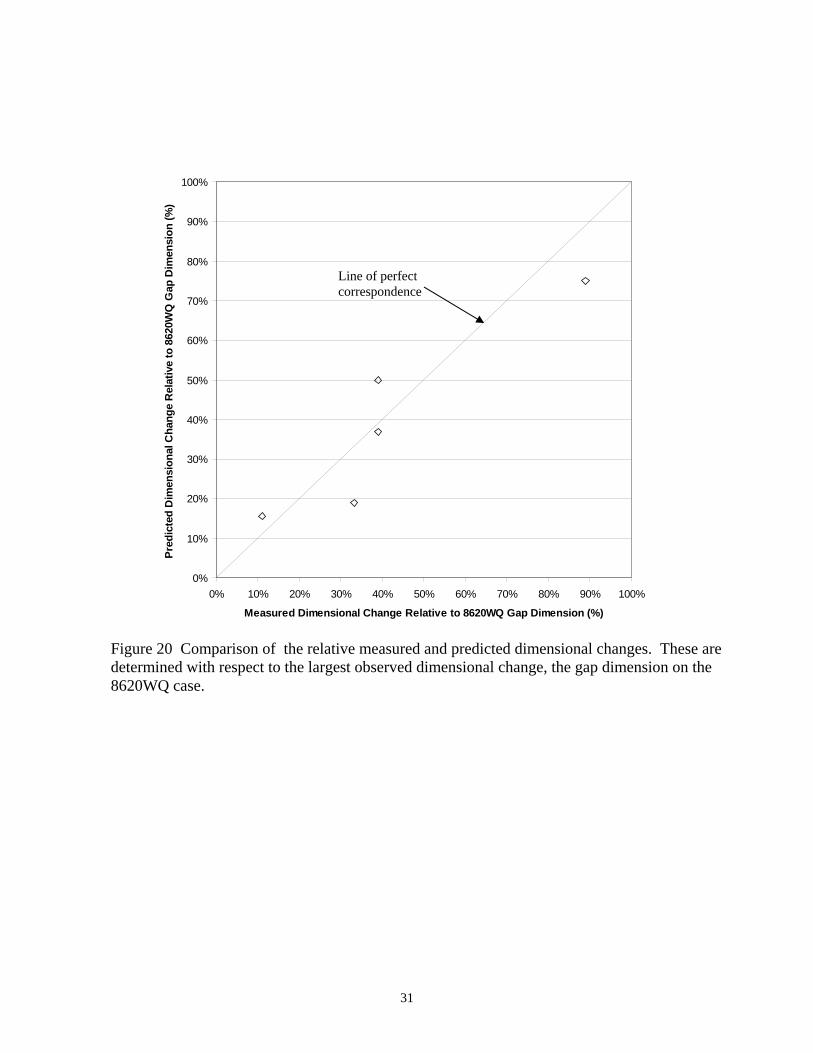
31
Figure 20 Comparison of the relative measured and predicted dimensional changes. These are determined with respect to the largest observed dimensional change, the gap dimension on the 8620WQ case.
0%
10%
20%
30%
40%
50%
60%
70%
80%
90%
100%
0% 10% 20% 30% 40% 50% 60% 70% 80% 90% 100%
Measured Dimensional Change Relative to 8620WQ Gap Dimension (%)
Pred
icte
d D
imen
sion
al C
hang
e R
elat
ive
to 8
620W
Q G
ap D
imen
sion
(%)
Line of perfect correspondence
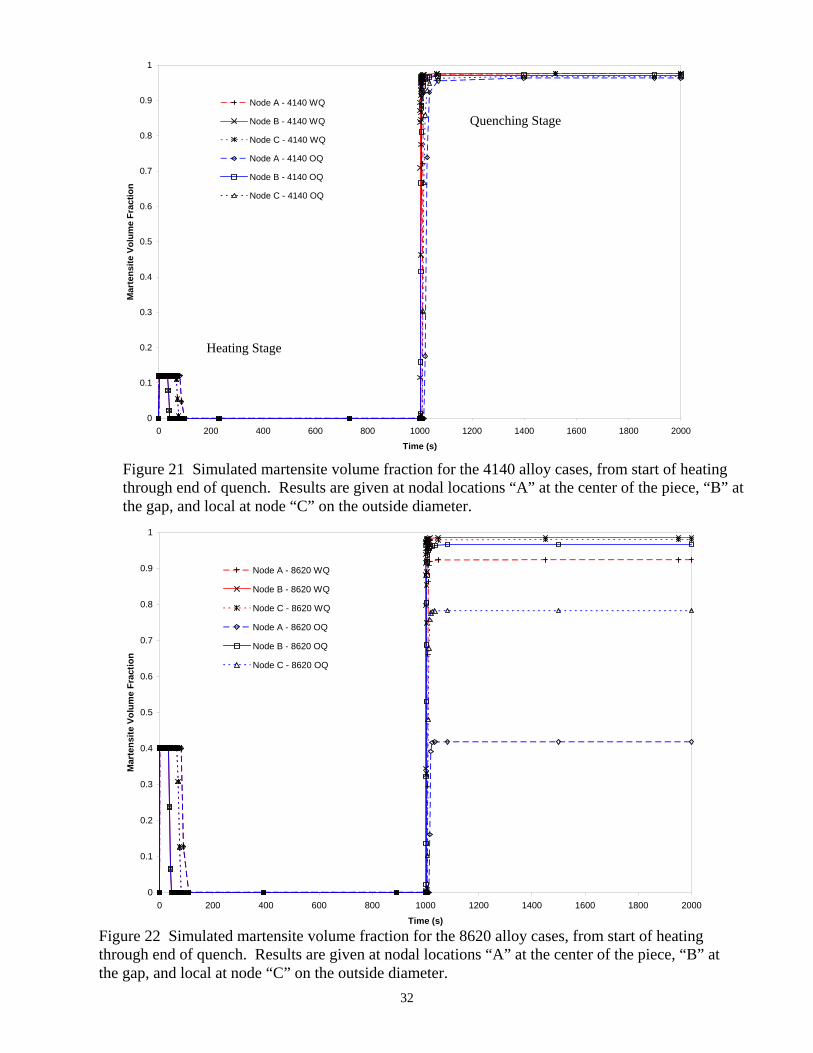
32
0
0.1
0.2
0.3
0.4
0.5
0.6
0.7
0.8
0.9
1
0 200 400 600 800 1000 1200 1400 1600 1800 2000
Time (s)
Mar
tens
ite V
olum
e Fr
actio
n
Node A - 4140 WQ
Node B - 4140 WQ
Node C - 4140 WQ
Node A - 4140 OQ
Node B - 4140 OQ
Node C - 4140 OQ
0
0.1
0.2
0.3
0.4
0.5
0.6
0.7
0.8
0.9
1
0 200 400 600 800 1000 1200 1400 1600 1800 2000
Time (s)
Mar
tens
ite V
olum
e Fr
actio
n
Node A - 8620 WQ
Node B - 8620 WQ
Node C - 8620 WQ
Node A - 8620 OQ
Node B - 8620 OQ
Node C - 8620 OQ
Figure 21 Simulated martensite volume fraction for the 4140 alloy cases, from start of heating through end of quench. Results are given at nodal locations “A” at the center of the piece, “B” at the gap, and local at node “C” on the outside diameter.
Figure 22 Simulated martensite volume fraction for the 8620 alloy cases, from start of heating through end of quench. Results are given at nodal locations “A” at the center of the piece, “B” at the gap, and local at node “C” on the outside diameter.
Heating Stage
Quenching Stage
PREDICTION OF HEAT TREATMENT DISTORTION OF CAST STEEL C-RINGS
Brandon Elliott Brooks1 and Christoph Beckermann2
1Graduate Research Assistant and 2Professor, Department of Mechanical and Industrial
Engineering, The University of Iowa, Iowa City, Iowa 52242, USA
Abstract
Navy C-Ring test parts were made of AISI 1022, 4320, 8625, and CF8M steels and heat treated in a designed experiment to evaluate the commercial heat treatment distortion simulation software DANTE. The parts were machined and then measured with a CMM for original dimensions. The parts were then heated and subsequently quenched in two different immersion orientations in agitated water. Temperature measurements were taken from the austenitic stainless steel parts to obtain heat transfer coefficients for the simulations. The part dimensions were re-measured and compared to pre-heat treatment values. The CF8M experiments show that the gap in the C-Ring closes due to thermal stresses. The cast carbon and low-alloy steel C-Rings resist the closure somewhat, though general trends toward closure are still apparent. This is in contrast to results shown in previous literature. The dimensional measurements for the different immersion directions and different alloys are compared and discussed. While the DANTE simulations are able to capture the general distortion trends seen in the experiments, they are not in complete agreement with the experimental results obtained here. Recommendations are made for future work.
Introduction
Optimal efficiency in the production of steel castings is often hindered by distortions that occur during heat treatment. These distortions can arise regardless of whether the parts are severely quenched, or normalized and annealed. Distortions can take place in castings of all sizes and shapes. Heat treatment distortion can be costly [1, 2]. The cost is normally incurred through extensive rework or redesign, recasting, or through additional machining steps. Predicting heat treatment distortion is difficult, and correcting distortion problems is often a lengthy trial-and-error process. There has been extensive interest in the prediction of heat treatment distortion via computer simulation for about the last 40 years. Original simulations designed to predict distortions seen in heat treated parts encompassed a single physical phenomenon, such as thermally induced stresses, in two dimensions. Simulations gradually grew in complexity to three-dimensional finite element analyses with multiple physical phenomena coupled together [1-29]. The parts studied to validate software packages are normally forged or machined from stock, and are small and carburized. As of the writing of this paper, no study has been identified in the literature that evaluates commercial heat treatment software programs specifically for steel castings. Many of the simulation results presented in the literature are shown to be in good agreement with experiments in terms of residual stress, carbon levels (for diffusion simulations), phases present,
1
becker
Text Box
Brooks, B.E., and Beckermann, C., “Prediction of Heat Treatment Distortion of Cast Steel C-Rings,” in Proceedings of the 61st SFSA Technical and Operating Conference, Paper No. 4.5, Steel Founders' Society of America, Chicago, IL, 2007.
and hardness. Most studies also report good agreement in terms of part distortion, but do so mostly qualitatively. Often, the methodology for measuring the parts is only briefly mentioned. Finally, there is still reason to believe that some of the predictions of distortion are completely erroneous. Some experiments show distortions that are unpredicted and unexplainable. Not only that, some research indicates that independent of the modeling methods employed, certain unknown factors can and will affect distortion measured in heat treated parts. Research is still needed to validate commercial heat treatment software for cast steel parts, by employing a variety of heat treatment schedules and steel alloys. The objective of the current research is to test the suitability of the commercial simulation software DANTE1 for predicting heat treatment distortion of steel castings. Work on this project was begun by Hardin and Beckermann in 2005 [4], and preliminary results were presented at the 2005 SFSA T&O conference that illustrate the simulation capabilities of the DANTE software [4]. Experiments were designed to encompass many of the lacking elements of the current literature. Multiple grades of carbon and low-alloy steel (AISI 1022, 4320 and 8625) were cast and machined into C-Ring test parts [30-32]. The C-Rings were heat treated, using both vertical (for symmetric distortions) and side (for asymmetrical distortions) immersion directions during water quenching. Dimensional measurements were performed in an accurate and repeatable manner. Austenitic CF8M steel C-Rings were cast and heat treated using the same schedule as for the carbon and low-alloy steels, in order to aid in the evaluation of the experimental procedures and the simulation software. Note that there are no phase transformations occurring during heat treatment of CF8M steel. Temperature measurements were taken during the heat treatment of the CF8M C-Rings, and a trial-and-error method was used to back out heat transfer coefficients for use in the DANTE simulations. The heat treatment was simulated for each carbon and low-alloy steel and for each immersion direction. Comparison between measured and predicted results was then used as a means of evaluating the suitability of the DANTE software for steel castings.
Background in Modeling Heat Treatment with DANTE
There have been numerous attempts at mathematically modeling the heat treatment of steel. Successful attempts at predicting heat treatment distortion always include three different analysis steps: phase transformation analysis, temperature analysis, and stress analysis. The analyses are performed with the aid of commercial finite element or computer aided engineering software packages. While the DANTE (Distortion ANalysis for Thermal Engineering) software program is being investigated in this paper, older programs such as HEARTS, and newer programs such as DEFORM-HT2 have also been studied [3, 4, 9, 17, 26]. DANTE is the result of a multi-million dollar investment of corporate, scholastic, and federal funds. DANTE is a series of subroutines that operate under the ABAQUS CAE3 finite element software that simulates the phase (or metallurgical) transformations, thermal evolution and the resulting mechanical response during heat treatment [1, 5, 6, 22-25, 29]. DANTE can also be used for the simulation of hardening processes through the use of a carbon-diffusion model.
1 http://www.deformationcontrol.com/ 2 http://www.deform.com/ht_brochure.pdf 3 http://www.simulia.com/
2
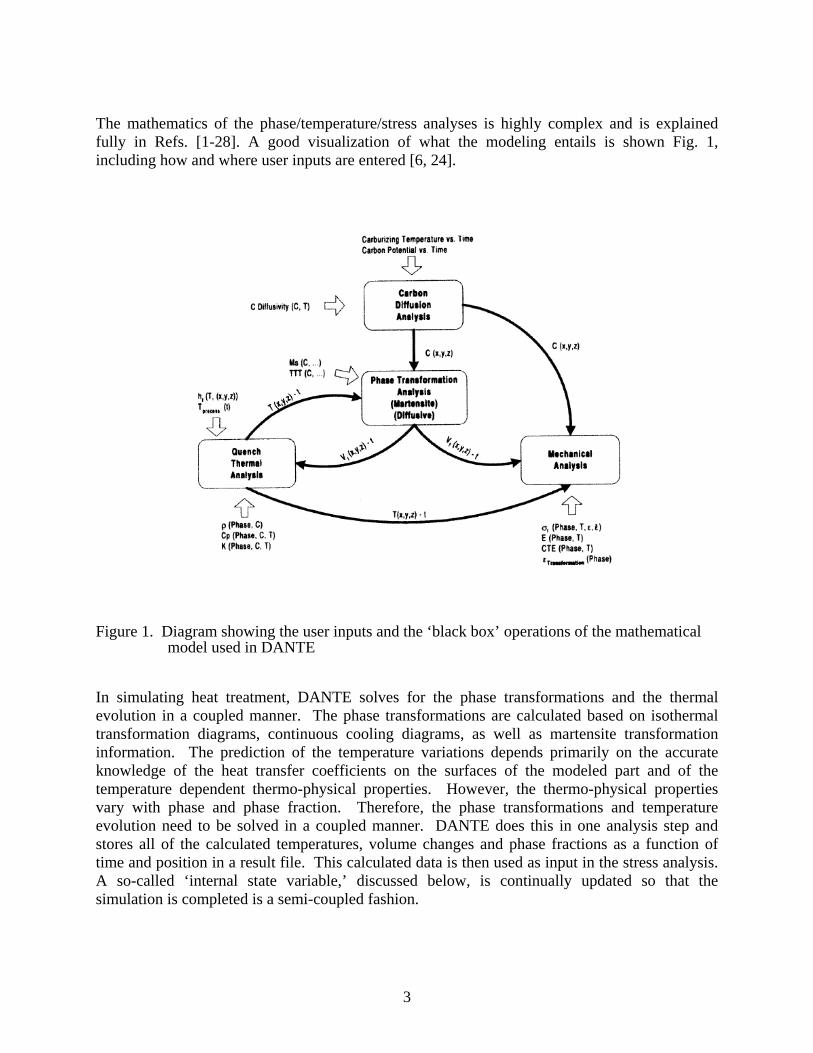
The mathematics of the phase/temperature/stress analyses is highly complex and is explained fully in Refs. [1-28]. A good visualization of what the modeling entails is shown Fig. 1, including how and where user inputs are entered [6, 24].
Figure 1. Diagram showing the user inputs and the ‘black box’ operations of the mathematical model used in DANTE
In simulating heat treatment, DANTE solves for the phase transformations and the thermal evolution in a coupled manner. The phase transformations are calculated based on isothermal transformation diagrams, continuous cooling diagrams, as well as martensite transformation information. The prediction of the temperature variations depends primarily on the accurate knowledge of the heat transfer coefficients on the surfaces of the modeled part and of the temperature dependent thermo-physical properties. However, the thermo-physical properties vary with phase and phase fraction. Therefore, the phase transformations and temperature evolution need to be solved in a coupled manner. DANTE does this in one analysis step and stores all of the calculated temperatures, volume changes and phase fractions as a function of time and position in a result file. This calculated data is then used as input in the stress analysis. A so-called ‘internal state variable,’ discussed below, is continually updated so that the simulation is completed is a semi-coupled fashion.
3
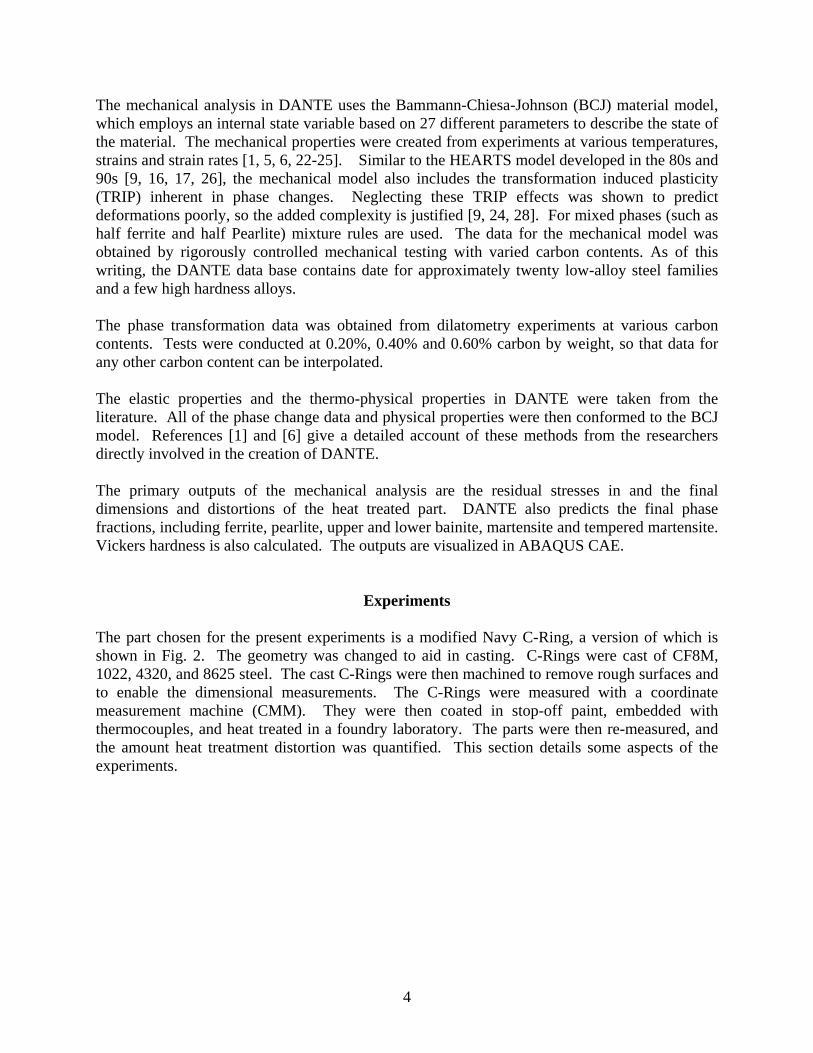
The mechanical analysis in DANTE uses the Bammann-Chiesa-Johnson (BCJ) material model, which employs an internal state variable based on 27 different parameters to describe the state of the material. The mechanical properties were created from experiments at various temperatures, strains and strain rates [1, 5, 6, 22-25]. Similar to the HEARTS model developed in the 80s and 90s [9, 16, 17, 26], the mechanical model also includes the transformation induced plasticity (TRIP) inherent in phase changes. Neglecting these TRIP effects was shown to predict deformations poorly, so the added complexity is justified [9, 24, 28]. For mixed phases (such as half ferrite and half Pearlite) mixture rules are used. The data for the mechanical model was obtained by rigorously controlled mechanical testing with varied carbon contents. As of this writing, the DANTE data base contains date for approximately twenty low-alloy steel families and a few high hardness alloys. The phase transformation data was obtained from dilatometry experiments at various carbon contents. Tests were conducted at 0.20%, 0.40% and 0.60% carbon by weight, so that data for any other carbon content can be interpolated. The elastic properties and the thermo-physical properties in DANTE were taken from the literature. All of the phase change data and physical properties were then conformed to the BCJ model. References [1] and [6] give a detailed account of these methods from the researchers directly involved in the creation of DANTE. The primary outputs of the mechanical analysis are the residual stresses in and the final dimensions and distortions of the heat treated part. DANTE also predicts the final phase fractions, including ferrite, pearlite, upper and lower bainite, martensite and tempered martensite. Vickers hardness is also calculated. The outputs are visualized in ABAQUS CAE.
Experiments
The part chosen for the present experiments is a modified Navy C-Ring, a version of which is shown in Fig. 2. The geometry was changed to aid in casting. C-Rings were cast of CF8M, 1022, 4320, and 8625 steel. The cast C-Rings were then machined to remove rough surfaces and to enable the dimensional measurements. The C-Rings were measured with a coordinate measurement machine (CMM). They were then coated in stop-off paint, embedded with thermocouples, and heat treated in a foundry laboratory. The parts were then re-measured, and the amount heat treatment distortion was quantified. This section details some aspects of the experiments.
4
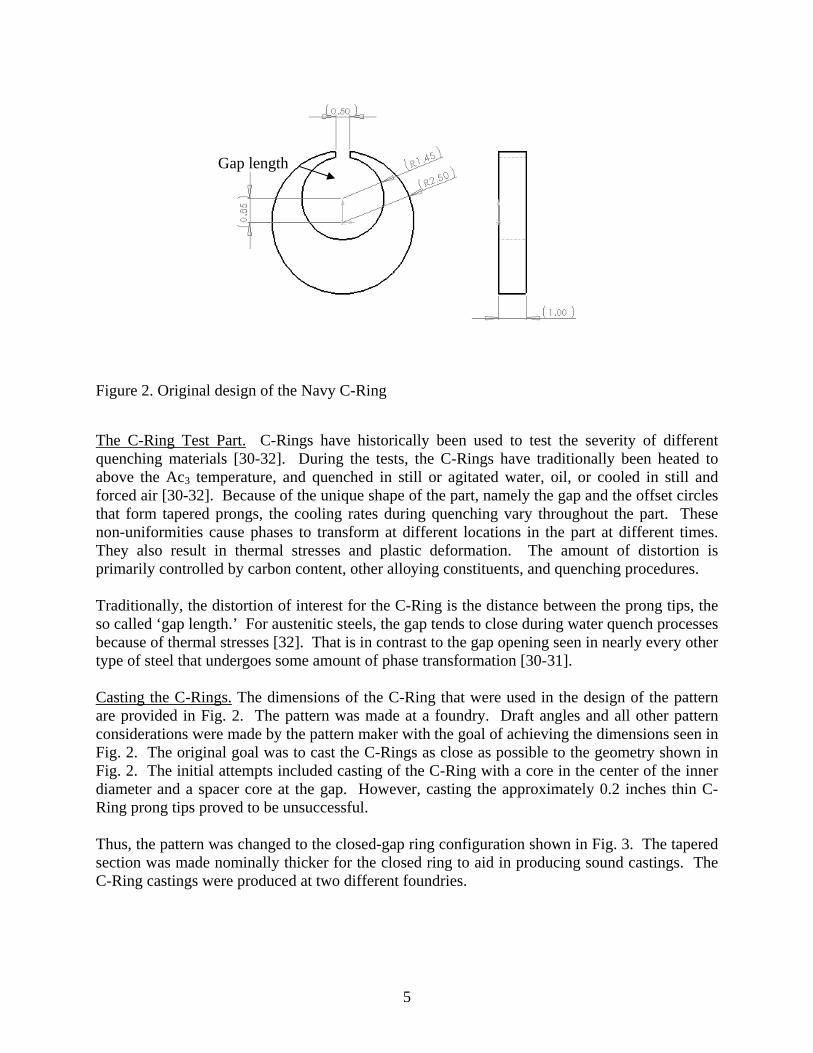
Gap length
Figure 2. Original design of the Navy C-Ring
The C-Ring Test Part. C-Rings have historically been used to test the severity of different quenching materials [30-32]. During the tests, the C-Rings have traditionally been heated to above the Ac3 temperature, and quenched in still or agitated water, oil, or cooled in still and forced air [30-32]. Because of the unique shape of the part, namely the gap and the offset circles that form tapered prongs, the cooling rates during quenching vary throughout the part. These non-uniformities cause phases to transform at different locations in the part at different times. They also result in thermal stresses and plastic deformation. The amount of distortion is primarily controlled by carbon content, other alloying constituents, and quenching procedures. Traditionally, the distortion of interest for the C-Ring is the distance between the prong tips, the so called ‘gap length.’ For austenitic steels, the gap tends to close during water quench processes because of thermal stresses [32]. That is in contrast to the gap opening seen in nearly every other type of steel that undergoes some amount of phase transformation [30-31]. Casting the C-Rings. The dimensions of the C-Ring that were used in the design of the pattern are provided in Fig. 2. The pattern was made at a foundry. Draft angles and all other pattern considerations were made by the pattern maker with the goal of achieving the dimensions seen in Fig. 2. The original goal was to cast the C-Rings as close as possible to the geometry shown in Fig. 2. The initial attempts included casting of the C-Ring with a core in the center of the inner diameter and a spacer core at the gap. However, casting the approximately 0.2 inches thin C-Ring prong tips proved to be unsuccessful. Thus, the pattern was changed to the closed-gap ring configuration shown in Fig. 3. The tapered section was made nominally thicker for the closed ring to aid in producing sound castings. The C-Ring castings were produced at two different foundries.
5
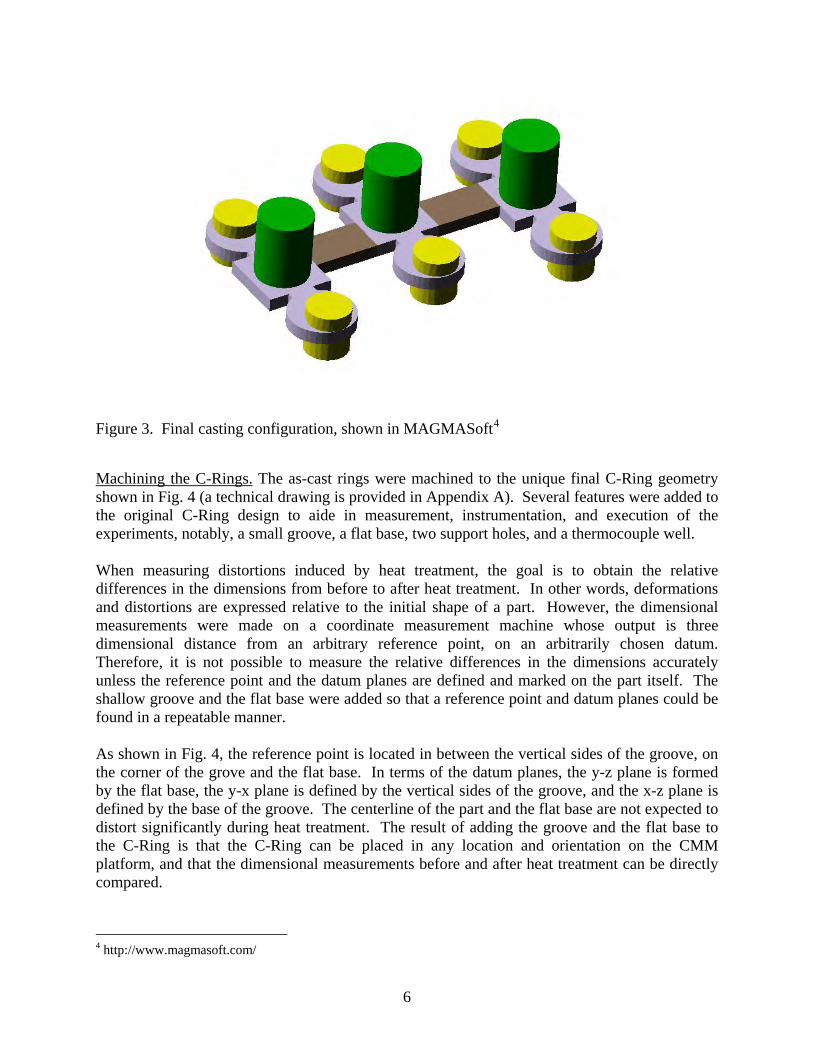
Figure 3. Final casting configuration, shown in MAGMASoft4
Machining the C-Rings. The as-cast rings were machined to the unique final C-Ring geometry shown in Fig. 4 (a technical drawing is provided in Appendix A). Several features were added to the original C-Ring design to aide in measurement, instrumentation, and execution of the experiments, notably, a small groove, a flat base, two support holes, and a thermocouple well. When measuring distortions induced by heat treatment, the goal is to obtain the relative differences in the dimensions from before to after heat treatment. In other words, deformations and distortions are expressed relative to the initial shape of a part. However, the dimensional measurements were made on a coordinate measurement machine whose output is three dimensional distance from an arbitrary reference point, on an arbitrarily chosen datum. Therefore, it is not possible to measure the relative differences in the dimensions accurately unless the reference point and the datum planes are defined and marked on the part itself. The shallow groove and the flat base were added so that a reference point and datum planes could be found in a repeatable manner. As shown in Fig. 4, the reference point is located in between the vertical sides of the groove, on the corner of the grove and the flat base. In terms of the datum planes, the y-z plane is formed by the flat base, the y-x plane is defined by the vertical sides of the groove, and the x-z plane is defined by the base of the groove. The centerline of the part and the flat base are not expected to distort significantly during heat treatment. The result of adding the groove and the flat base to the C-Ring is that the C-Ring can be placed in any location and orientation on the CMM platform, and that the dimensional measurements before and after heat treatment can be directly compared.
4 http://www.magmasoft.com/
6
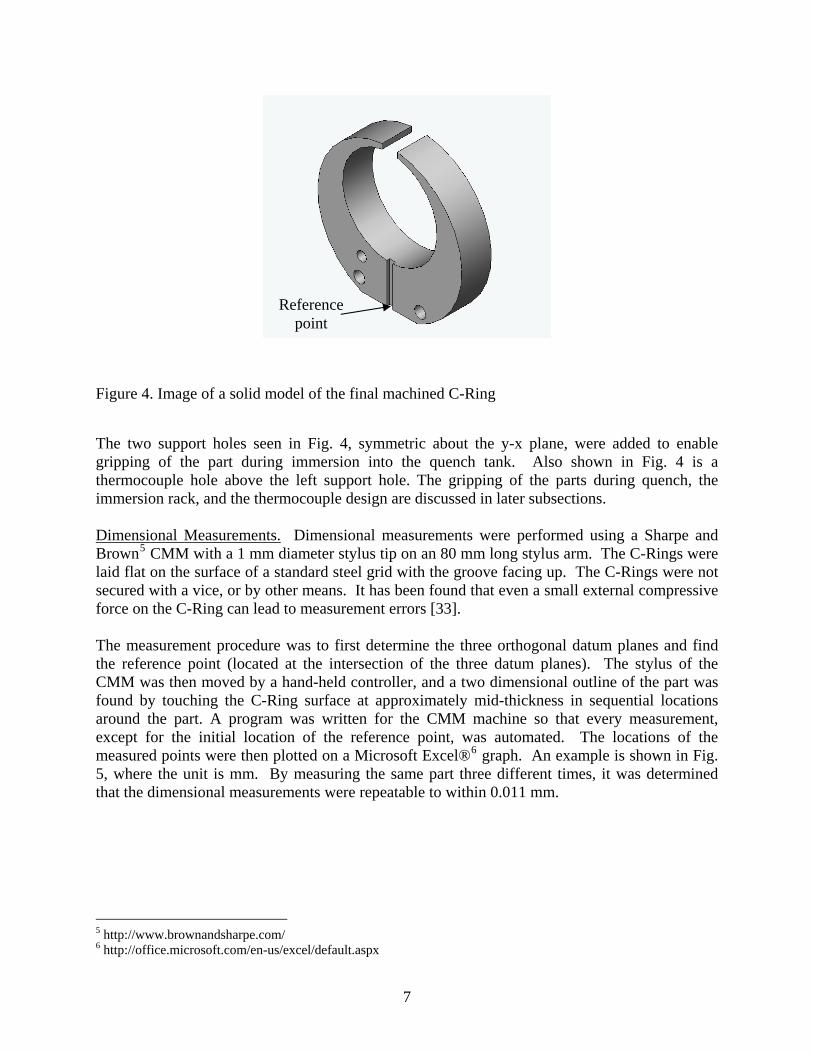
Reference point
Figure 4. Image of a solid model of the final machined C-Ring
The two support holes seen in Fig. 4, symmetric about the y-x plane, were added to enable gripping of the part during immersion into the quench tank. Also shown in Fig. 4 is a thermocouple hole above the left support hole. The gripping of the parts during quench, the immersion rack, and the thermocouple design are discussed in later subsections.
Dimensional Measurements. Dimensional measurements were performed using a Sharpe and Brown5 CMM with a 1 mm diameter stylus tip on an 80 mm long stylus arm. The C-Rings were laid flat on the surface of a standard steel grid with the groove facing up. The C-Rings were not secured with a vice, or by other means. It has been found that even a small external compressive force on the C-Ring can lead to measurement errors [33]. The measurement procedure was to first determine the three orthogonal datum planes and find the reference point (located at the intersection of the three datum planes). The stylus of the CMM was then moved by a hand-held controller, and a two dimensional outline of the part was found by touching the C-Ring surface at approximately mid-thickness in sequential locations around the part. A program was written for the CMM machine so that every measurement, except for the initial location of the reference point, was automated. The locations of the measured points were then plotted on a Microsoft Excel®6 graph. An example is shown in Fig. 5, where the unit is mm. By measuring the same part three different times, it was determined that the dimensional measurements were repeatable to within 0.011 mm.
5 http://www.brownandsharpe.com/ 6 http://office.microsoft.com/en-us/excel/default.aspx
7
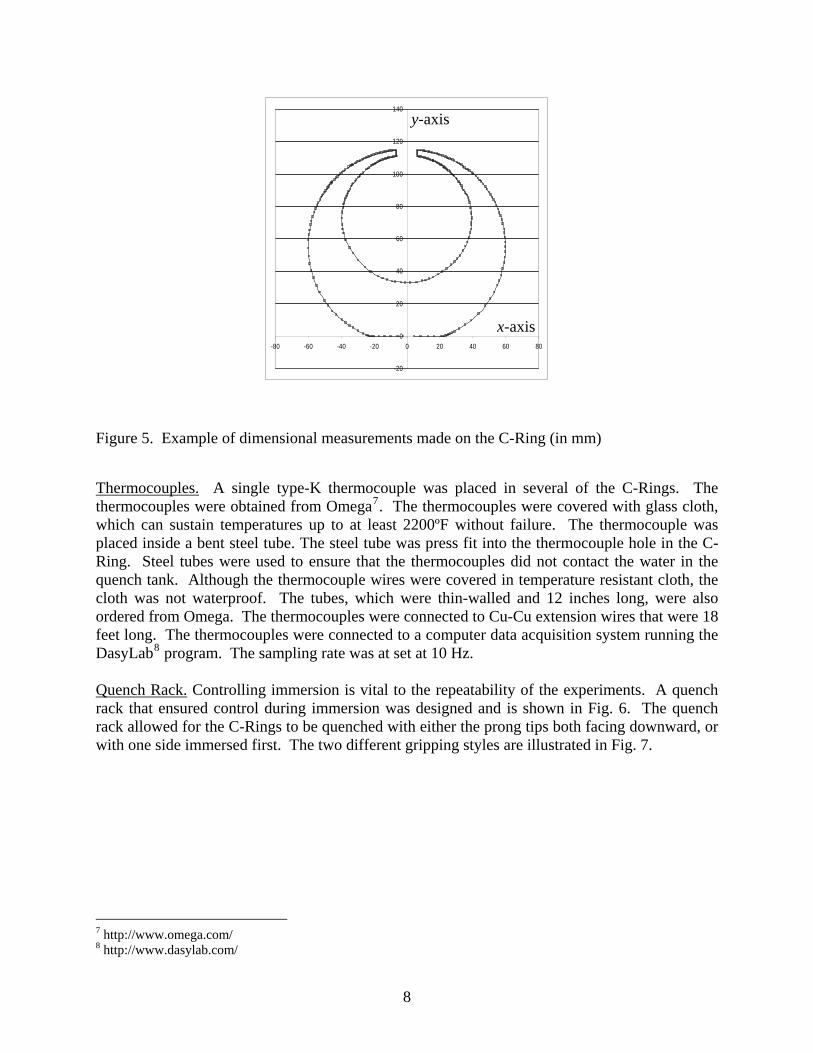
-20
0
20
40
60
80
100
120
140
-80 -60 -40 -20 0 20 40 60 80
y-axis
x-axis
Figure 5. Example of dimensional measurements made on the C-Ring (in mm)
Thermocouples. A single type-K thermocouple was placed in several of the C-Rings. The thermocouples were obtained from Omega7. The thermocouples were covered with glass cloth, which can sustain temperatures up to at least 2200ºF without failure. The thermocouple was placed inside a bent steel tube. The steel tube was press fit into the thermocouple hole in the C-Ring. Steel tubes were used to ensure that the thermocouples did not contact the water in the quench tank. Although the thermocouple wires were covered in temperature resistant cloth, the cloth was not waterproof. The tubes, which were thin-walled and 12 inches long, were also ordered from Omega. The thermocouples were connected to Cu-Cu extension wires that were 18 feet long. The thermocouples were connected to a computer data acquisition system running the DasyLab8 program. The sampling rate was at set at 10 Hz. Quench Rack. Controlling immersion is vital to the repeatability of the experiments. A quench rack that ensured control during immersion was designed and is shown in Fig. 6. The quench rack allowed for the C-Rings to be quenched with either the prong tips both facing downward, or with one side immersed first. The two different gripping styles are illustrated in Fig. 7.
7 http://www.omega.com/ 8 http://www.dasylab.com/
8
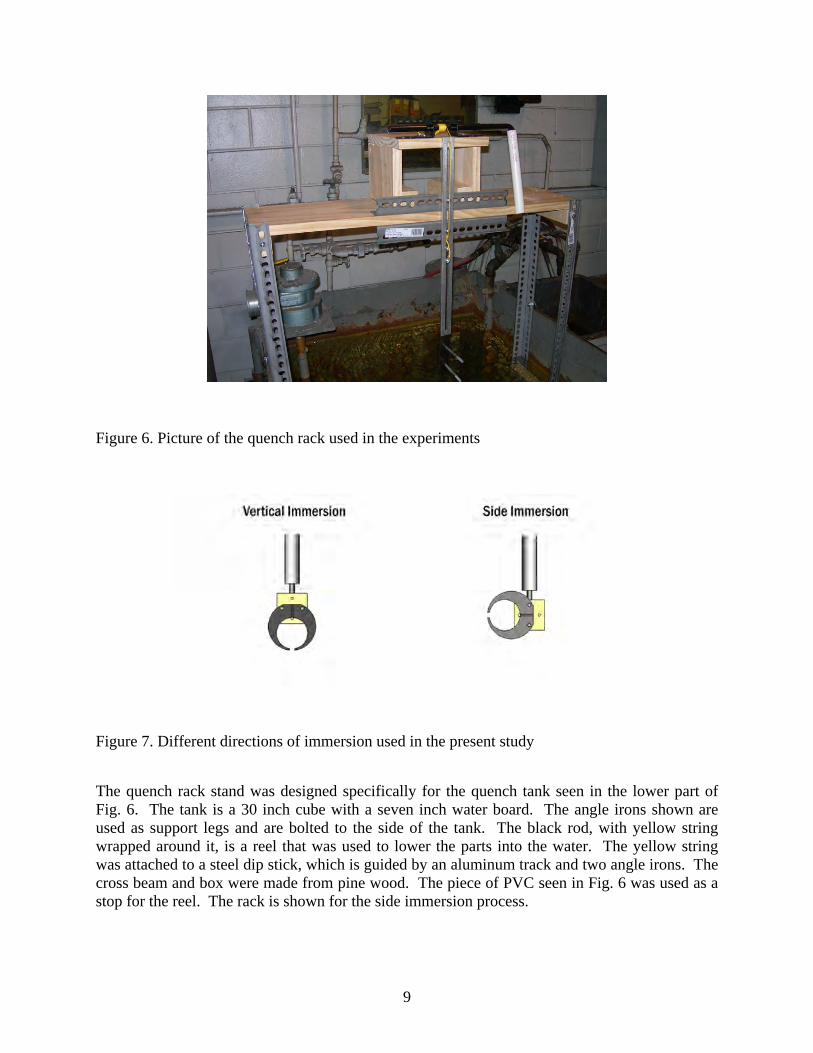
Figure 6. Picture of the quench rack used in the experiments
Figure 7. Different directions of immersion used in the present study
The quench rack stand was designed specifically for the quench tank seen in the lower part of Fig. 6. The tank is a 30 inch cube with a seven inch water board. The angle irons shown are used as support legs and are bolted to the side of the tank. The black rod, with yellow string wrapped around it, is a reel that was used to lower the parts into the water. The yellow string was attached to a steel dip stick, which is guided by an aluminum track and two angle irons. The cross beam and box were made from pine wood. The piece of PVC seen in Fig. 6 was used as a stop for the reel. The rack is shown for the side immersion process.
9
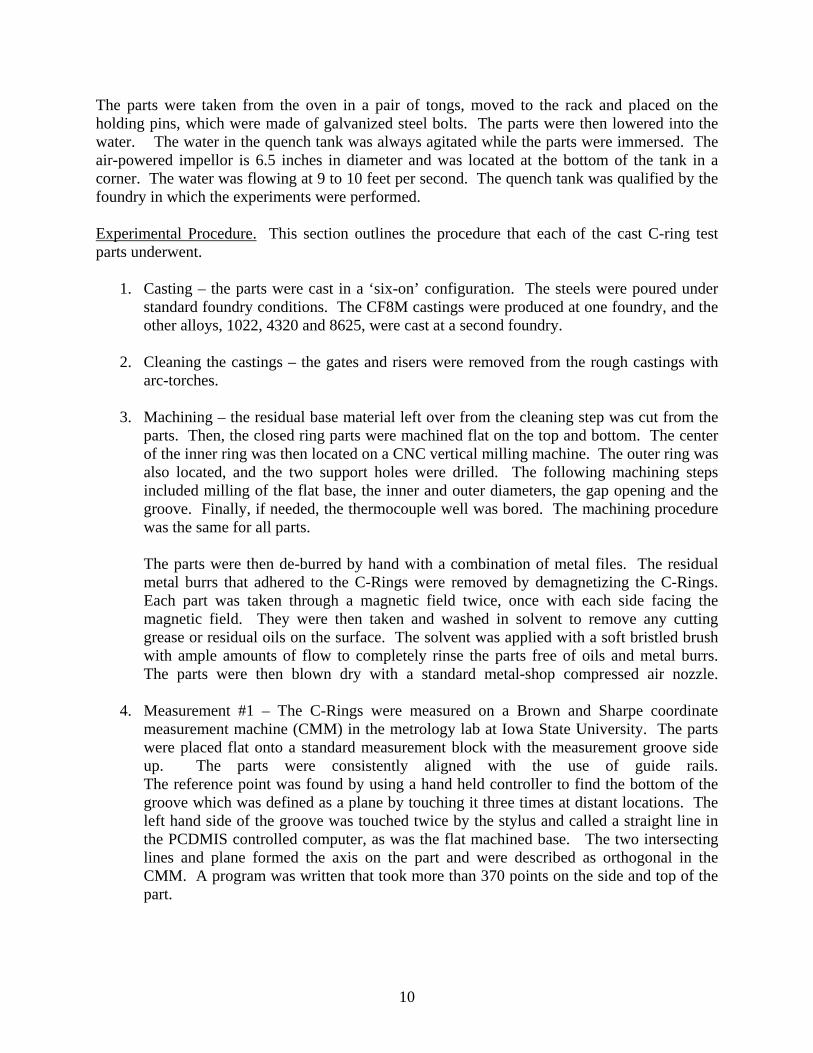
The parts were taken from the oven in a pair of tongs, moved to the rack and placed on the holding pins, which were made of galvanized steel bolts. The parts were then lowered into the water. The water in the quench tank was always agitated while the parts were immersed. The air-powered impellor is 6.5 inches in diameter and was located at the bottom of the tank in a corner. The water was flowing at 9 to 10 feet per second. The quench tank was qualified by the foundry in which the experiments were performed. Experimental Procedure. This section outlines the procedure that each of the cast C-ring test parts underwent.
1. Casting – the parts were cast in a ‘six-on’ configuration. The steels were poured under standard foundry conditions. The CF8M castings were produced at one foundry, and the other alloys, 1022, 4320 and 8625, were cast at a second foundry.
2. Cleaning the castings – the gates and risers were removed from the rough castings with
arc-torches. 3. Machining – the residual base material left over from the cleaning step was cut from the
parts. Then, the closed ring parts were machined flat on the top and bottom. The center of the inner ring was then located on a CNC vertical milling machine. The outer ring was also located, and the two support holes were drilled. The following machining steps included milling of the flat base, the inner and outer diameters, the gap opening and the groove. Finally, if needed, the thermocouple well was bored. The machining procedure was the same for all parts.
The parts were then de-burred by hand with a combination of metal files. The residual metal burrs that adhered to the C-Rings were removed by demagnetizing the C-Rings. Each part was taken through a magnetic field twice, once with each side facing the magnetic field. They were then taken and washed in solvent to remove any cutting grease or residual oils on the surface. The solvent was applied with a soft bristled brush with ample amounts of flow to completely rinse the parts free of oils and metal burrs. The parts were then blown dry with a standard metal-shop compressed air nozzle.
4. Measurement #1 – The C-Rings were measured on a Brown and Sharpe coordinate measurement machine (CMM) in the metrology lab at Iowa State University. The parts were placed flat onto a standard measurement block with the measurement groove side up. The parts were consistently aligned with the use of guide rails. The reference point was found by using a hand held controller to find the bottom of the groove which was defined as a plane by touching it three times at distant locations. The left hand side of the groove was touched twice by the stylus and called a straight line in the PCDMIS controlled computer, as was the flat machined base. The two intersecting lines and plane formed the axis on the part and were described as orthogonal in the CMM. A program was written that took more than 370 points on the side and top of the part.
10
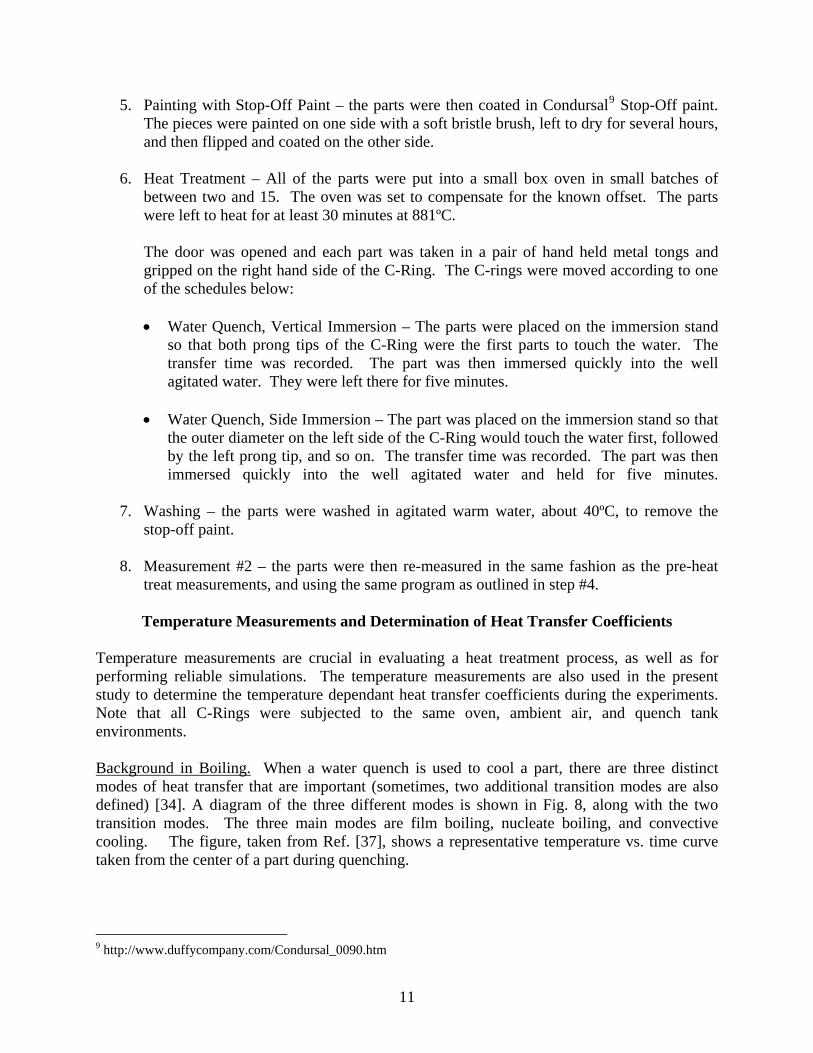
5. Painting with Stop-Off Paint – the parts were then coated in Condursal9 Stop-Off paint. The pieces were painted on one side with a soft bristle brush, left to dry for several hours, and then flipped and coated on the other side.
6. Heat Treatment – All of the parts were put into a small box oven in small batches of
between two and 15. The oven was set to compensate for the known offset. The parts were left to heat for at least 30 minutes at 881ºC.
The door was opened and each part was taken in a pair of hand held metal tongs and gripped on the right hand side of the C-Ring. The C-rings were moved according to one of the schedules below:
• Water Quench, Vertical Immersion – The parts were placed on the immersion stand
so that both prong tips of the C-Ring were the first parts to touch the water. The transfer time was recorded. The part was then immersed quickly into the well agitated water. They were left there for five minutes.
• Water Quench, Side Immersion – The part was placed on the immersion stand so that
the outer diameter on the left side of the C-Ring would touch the water first, followed by the left prong tip, and so on. The transfer time was recorded. The part was then immersed quickly into the well agitated water and held for five minutes.
7. Washing – the parts were washed in agitated warm water, about 40ºC, to remove the stop-off paint.
8. Measurement #2 – the parts were then re-measured in the same fashion as the pre-heat
treat measurements, and using the same program as outlined in step #4.
Temperature Measurements and Determination of Heat Transfer Coefficients Temperature measurements are crucial in evaluating a heat treatment process, as well as for performing reliable simulations. The temperature measurements are also used in the present study to determine the temperature dependant heat transfer coefficients during the experiments. Note that all C-Rings were subjected to the same oven, ambient air, and quench tank environments. Background in Boiling. When a water quench is used to cool a part, there are three distinct modes of heat transfer that are important (sometimes, two additional transition modes are also defined) [34]. A diagram of the three different modes is shown in Fig. 8, along with the two transition modes. The three main modes are film boiling, nucleate boiling, and convective cooling. The figure, taken from Ref. [37], shows a representative temperature vs. time curve taken from the center of a part during quenching.
9 http://www.duffycompany.com/Condursal_0090.htm
11
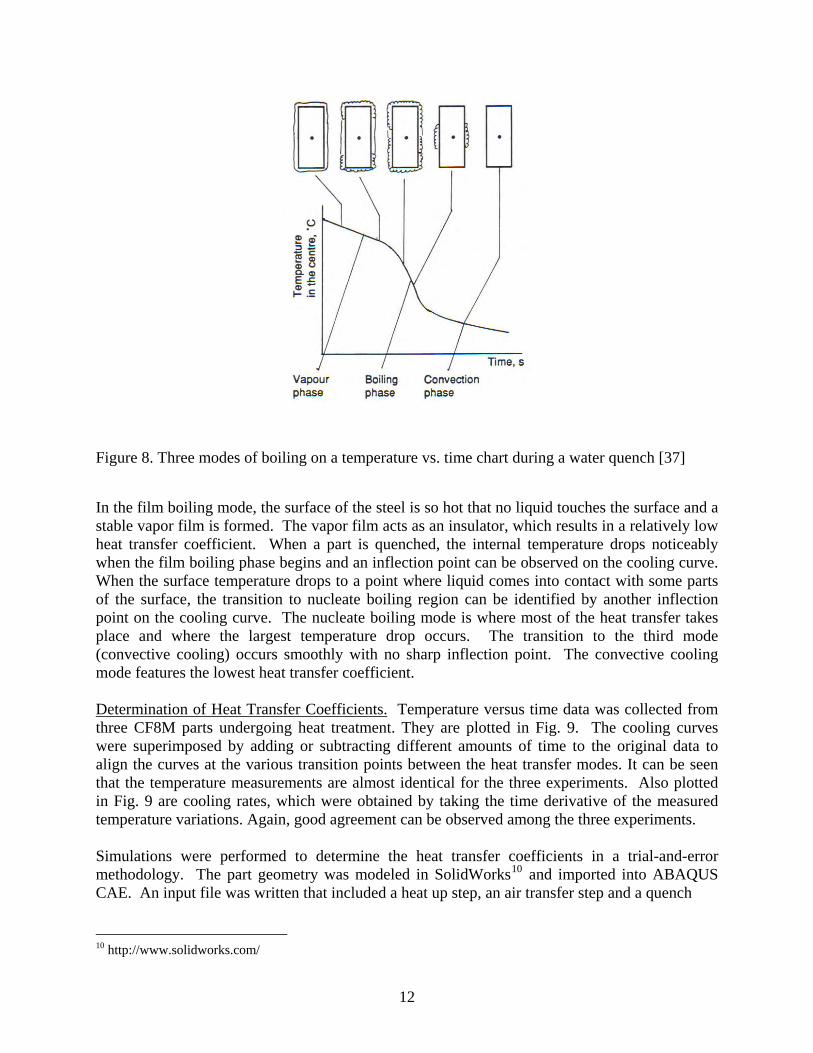
Figure 8. Three modes of boiling on a temperature vs. time chart during a water quench [37]
In the film boiling mode, the surface of the steel is so hot that no liquid touches the surface and a stable vapor film is formed. The vapor film acts as an insulator, which results in a relatively low heat transfer coefficient. When a part is quenched, the internal temperature drops noticeably when the film boiling phase begins and an inflection point can be observed on the cooling curve. When the surface temperature drops to a point where liquid comes into contact with some parts of the surface, the transition to nucleate boiling region can be identified by another inflection point on the cooling curve. The nucleate boiling mode is where most of the heat transfer takes place and where the largest temperature drop occurs. The transition to the third mode (convective cooling) occurs smoothly with no sharp inflection point. The convective cooling mode features the lowest heat transfer coefficient. Determination of Heat Transfer Coefficients. Temperature versus time data was collected from three CF8M parts undergoing heat treatment. They are plotted in Fig. 9. The cooling curves were superimposed by adding or subtracting different amounts of time to the original data to align the curves at the various transition points between the heat transfer modes. It can be seen that the temperature measurements are almost identical for the three experiments. Also plotted in Fig. 9 are cooling rates, which were obtained by taking the time derivative of the measured temperature variations. Again, good agreement can be observed among the three experiments. Simulations were performed to determine the heat transfer coefficients in a trial-and-error methodology. The part geometry was modeled in SolidWorks10 and imported into ABAQUS CAE. An input file was written that included a heat up step, an air transfer step and a quench
10 http://www.solidworks.com/
12
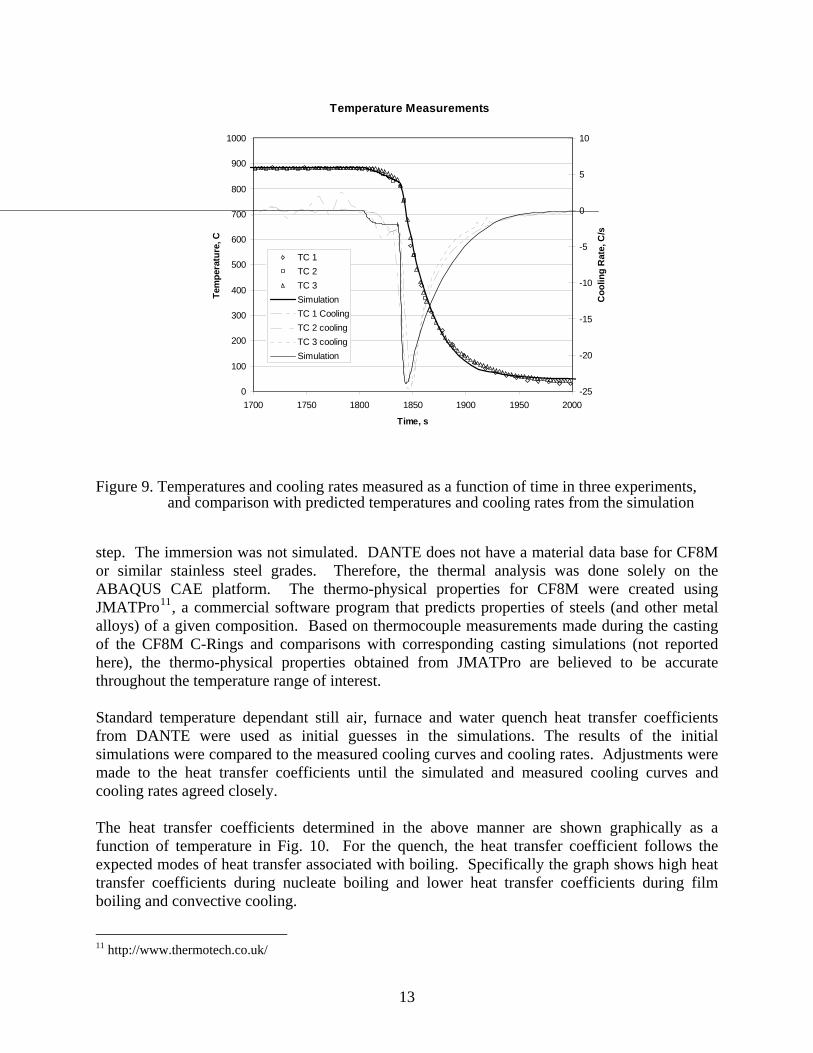
Temperature Measurements
0
100
200
300
400
500
600
700
800
900
1000
1700 1750 1800 1850 1900 1950 2000
Time, s
Tem
pera
ture
, C
-25
-20
-15
-10
-5
0
5
10
Coo
ling
Rat
e, C
/s
TC 1
TC 2
TC 3
Simulation
TC 1 Cooling
TC 2 cooling
TC 3 cooling
Simulation
Figure 9. Temperatures and cooling rates measured as a function of time in three experiments, and comparison with predicted temperatures and cooling rates from the simulation
step. The immersion was not simulated. DANTE does not have a material data base for CF8M or similar stainless steel grades. Therefore, the thermal analysis was done solely on the ABAQUS CAE platform. The thermo-physical properties for CF8M were created using JMATPro11, a commercial software program that predicts properties of steels (and other metal alloys) of a given composition. Based on thermocouple measurements made during the casting of the CF8M C-Rings and comparisons with corresponding casting simulations (not reported here), the thermo-physical properties obtained from JMATPro are believed to be accurate throughout the temperature range of interest. Standard temperature dependant still air, furnace and water quench heat transfer coefficients from DANTE were used as initial guesses in the simulations. The results of the initial simulations were compared to the measured cooling curves and cooling rates. Adjustments were made to the heat transfer coefficients until the simulated and measured cooling curves and cooling rates agreed closely. The heat transfer coefficients determined in the above manner are shown graphically as a function of temperature in Fig. 10. For the quench, the heat transfer coefficient follows the expected modes of heat transfer associated with boiling. Specifically the graph shows high heat transfer coefficients during nucleate boiling and lower heat transfer coefficients during film boiling and convective cooling.
11 http://www.thermotech.co.uk/
13
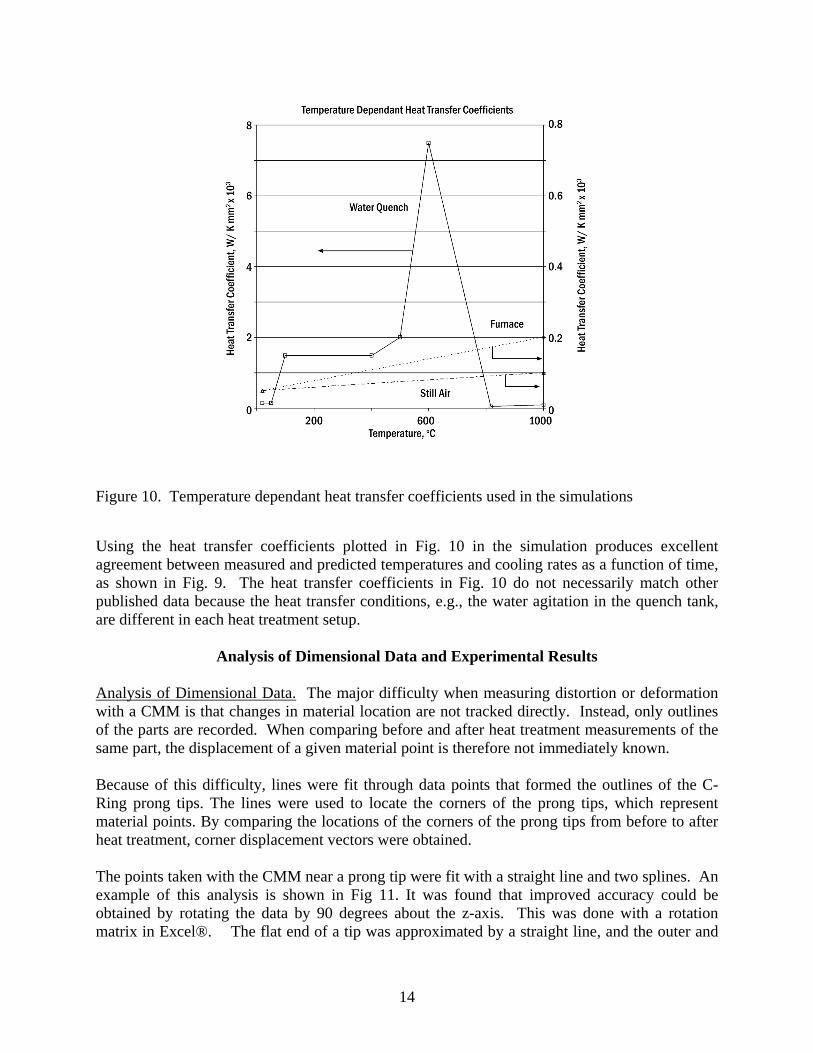
Figure 10. Temperature dependant heat transfer coefficients used in the simulations
Using the heat transfer coefficients plotted in Fig. 10 in the simulation produces excellent agreement between measured and predicted temperatures and cooling rates as a function of time, as shown in Fig. 9. The heat transfer coefficients in Fig. 10 do not necessarily match other published data because the heat transfer conditions, e.g., the water agitation in the quench tank, are different in each heat treatment setup.
Analysis of Dimensional Data and Experimental Results Analysis of Dimensional Data. The major difficulty when measuring distortion or deformation with a CMM is that changes in material location are not tracked directly. Instead, only outlines of the parts are recorded. When comparing before and after heat treatment measurements of the same part, the displacement of a given material point is therefore not immediately known. Because of this difficulty, lines were fit through data points that formed the outlines of the C-Ring prong tips. The lines were used to locate the corners of the prong tips, which represent material points. By comparing the locations of the corners of the prong tips from before to after heat treatment, corner displacement vectors were obtained. The points taken with the CMM near a prong tip were fit with a straight line and two splines. An example of this analysis is shown in Fig 11. It was found that improved accuracy could be obtained by rotating the data by 90 degrees about the z-axis. This was done with a rotation matrix in Excel®. The flat end of a tip was approximated by a straight line, and the outer and
14
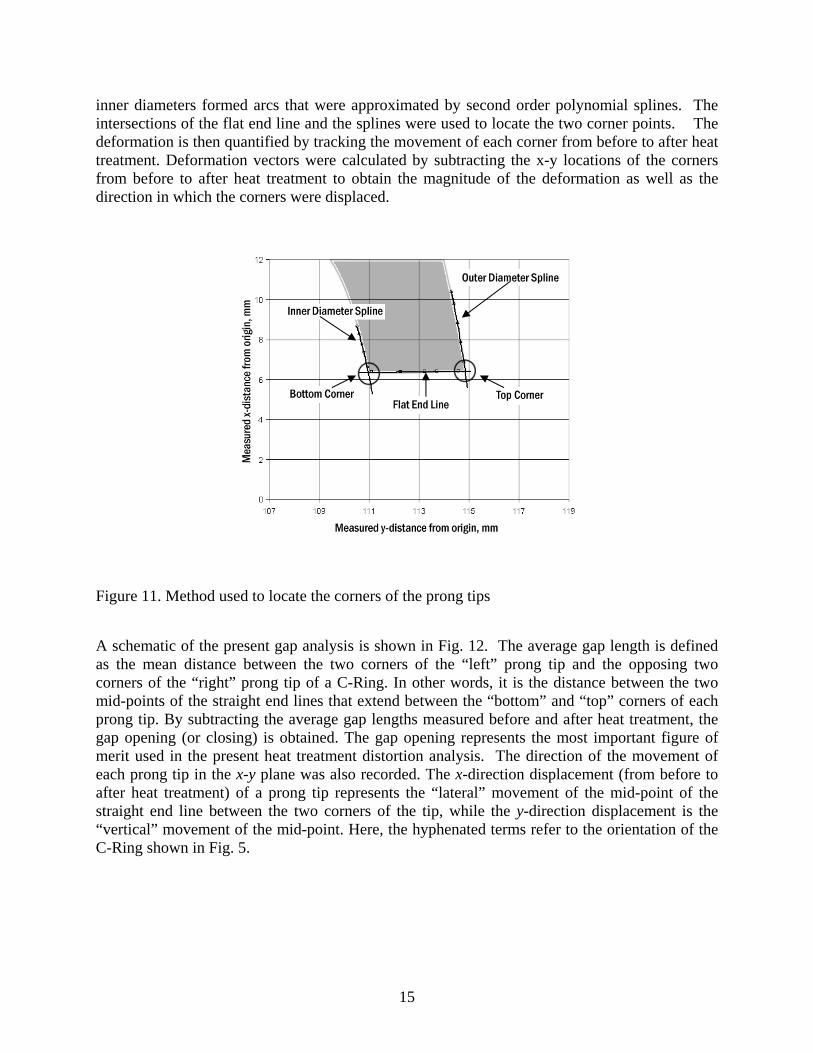
inner diameters formed arcs that were approximated by second order polynomial splines. The intersections of the flat end line and the splines were used to locate the two corner points. The deformation is then quantified by tracking the movement of each corner from before to after heat treatment. Deformation vectors were calculated by subtracting the x-y locations of the corners from before to after heat treatment to obtain the magnitude of the deformation as well as the direction in which the corners were displaced.
Figure 11. Method used to locate the corners of the prong tips
A schematic of the present gap analysis is shown in Fig. 12. The average gap length is defined as the mean distance between the two corners of the “left” prong tip and the opposing two corners of the “right” prong tip of a C-Ring. In other words, it is the distance between the two mid-points of the straight end lines that extend between the “bottom” and “top” corners of each prong tip. By subtracting the average gap lengths measured before and after heat treatment, the gap opening (or closing) is obtained. The gap opening represents the most important figure of merit used in the present heat treatment distortion analysis. The direction of the movement of each prong tip in the x-y plane was also recorded. The x-direction displacement (from before to after heat treatment) of a prong tip represents the “lateral” movement of the mid-point of the straight end line between the two corners of the tip, while the y-direction displacement is the “vertical” movement of the mid-point. Here, the hyphenated terms refer to the orientation of the C-Ring shown in Fig. 5.
15
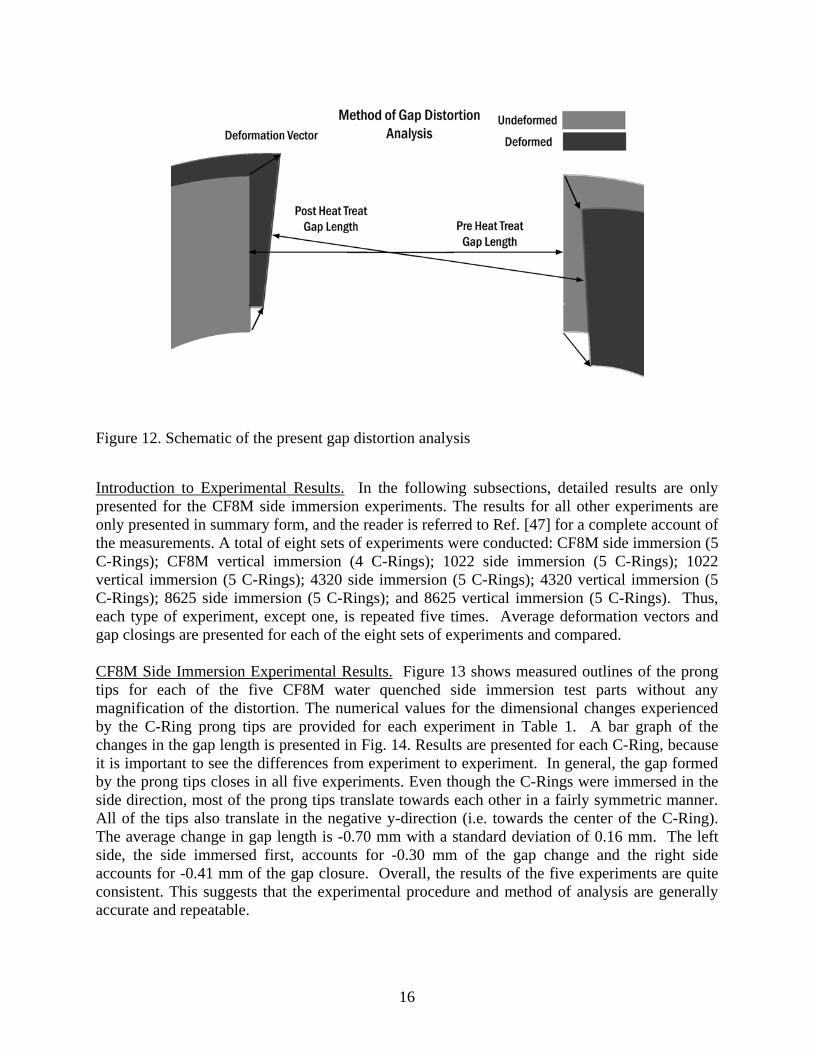
Figure 12. Schematic of the present gap distortion analysis
Introduction to Experimental Results. In the following subsections, detailed results are only presented for the CF8M side immersion experiments. The results for all other experiments are only presented in summary form, and the reader is referred to Ref. [47] for a complete account of the measurements. A total of eight sets of experiments were conducted: CF8M side immersion (5 C-Rings); CF8M vertical immersion (4 C-Rings); 1022 side immersion (5 C-Rings); 1022 vertical immersion (5 C-Rings); 4320 side immersion (5 C-Rings); 4320 vertical immersion (5 C-Rings); 8625 side immersion (5 C-Rings); and 8625 vertical immersion (5 C-Rings). Thus, each type of experiment, except one, is repeated five times. Average deformation vectors and gap closings are presented for each of the eight sets of experiments and compared. CF8M Side Immersion Experimental Results. Figure 13 shows measured outlines of the prong tips for each of the five CF8M water quenched side immersion test parts without any magnification of the distortion. The numerical values for the dimensional changes experienced by the C-Ring prong tips are provided for each experiment in Table 1. A bar graph of the changes in the gap length is presented in Fig. 14. Results are presented for each C-Ring, because it is important to see the differences from experiment to experiment. In general, the gap formed by the prong tips closes in all five experiments. Even though the C-Rings were immersed in the side direction, most of the prong tips translate towards each other in a fairly symmetric manner. All of the tips also translate in the negative y-direction (i.e. towards the center of the C-Ring). The average change in gap length is -0.70 mm with a standard deviation of 0.16 mm. The left side, the side immersed first, accounts for -0.30 mm of the gap change and the right side accounts for -0.41 mm of the gap closure. Overall, the results of the five experiments are quite consistent. This suggests that the experimental procedure and method of analysis are generally accurate and repeatable.
16
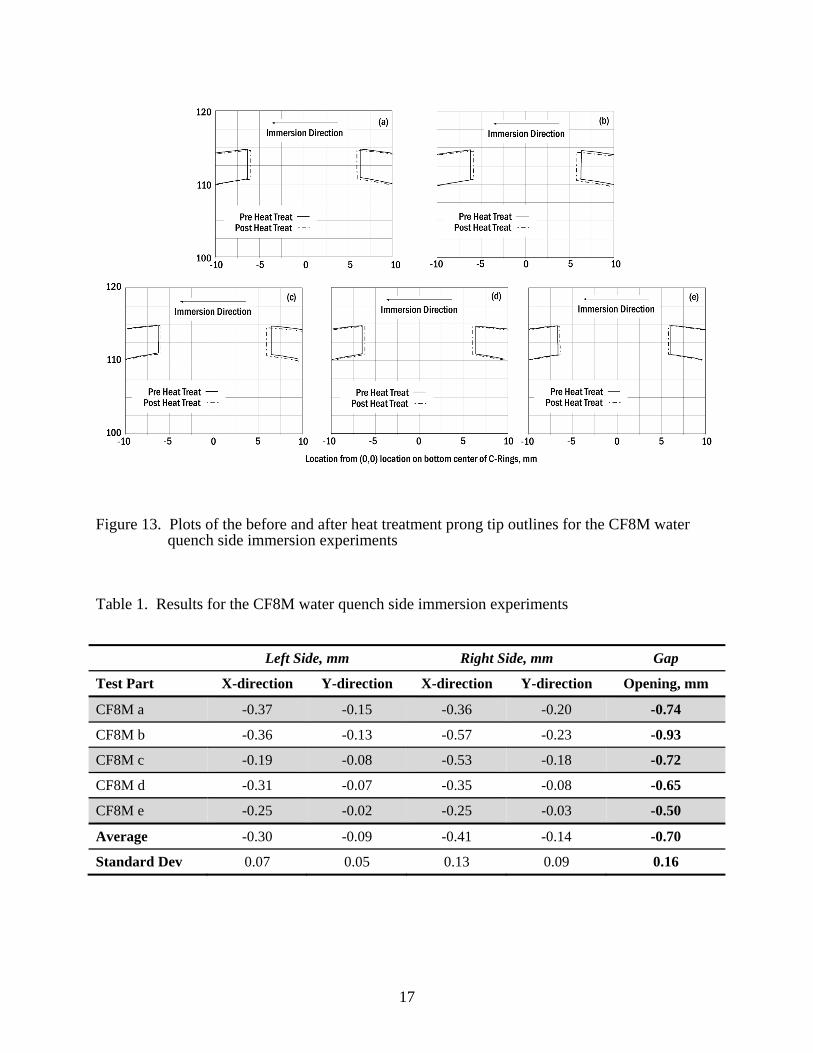
Figure 13. Plots of the before and after heat treatment prong tip outlines for the CF8M water quench side immersion experiments
Table 1. Results for the CF8M water quench side immersion experiments
Left Side, mm Right Side, mm Gap
Test Part X-direction Y-direction X-direction Y-direction Opening, mm
CF8M a -0.37 -0.15 -0.36 -0.20 -0.74
CF8M b -0.36 -0.13 -0.57 -0.23 -0.93
CF8M c -0.19 -0.08 -0.53 -0.18 -0.72
CF8M d -0.31 -0.07 -0.35 -0.08 -0.65
CF8M e -0.25 -0.02 -0.25 -0.03 -0.50
Average -0.30 -0.09 -0.41 -0.14 -0.70
Standard Dev 0.07 0.05 0.13 0.09 0.16
17
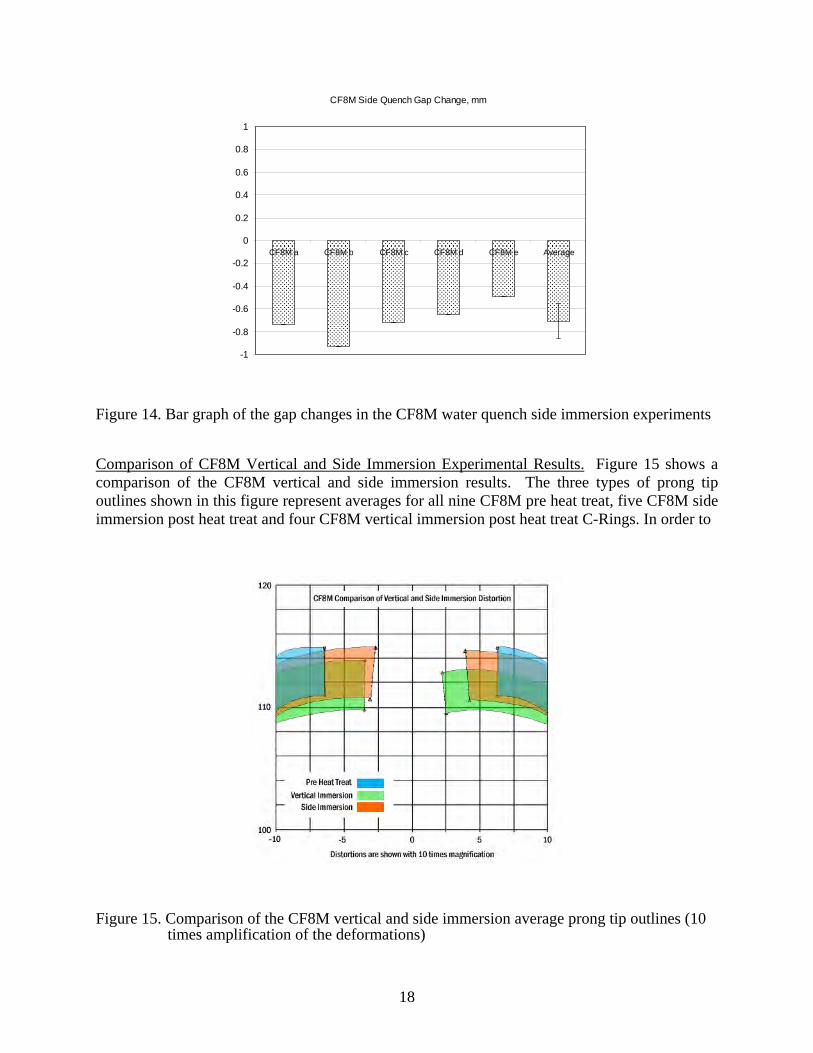
CF8M Side Quench Gap Change, mm
-1
-0.8
-0.6
-0.4
-0.2
0
0.2
0.4
0.6
0.8
1
CF8M a CF8M b CF8M c CF8M d CF8M e Average
Figure 14. Bar graph of the gap changes in the CF8M water quench side immersion experiments
Comparison of CF8M Vertical and Side Immersion Experimental Results. Figure 15 shows a comparison of the CF8M vertical and side immersion results. The three types of prong tip outlines shown in this figure represent averages for all nine CF8M pre heat treat, five CF8M side immersion post heat treat and four CF8M vertical immersion post heat treat C-Rings. In order to
Figure 15. Comparison of the CF8M vertical and side immersion average prong tip outlines (10 times amplification of the deformations)
18
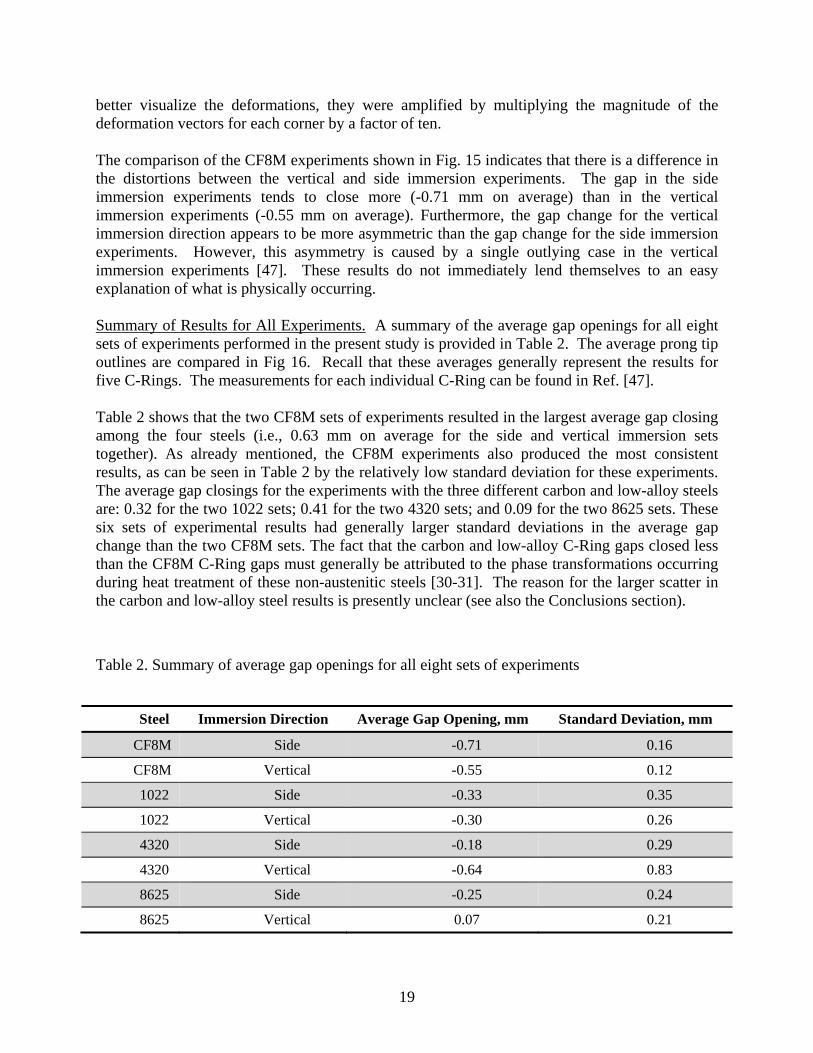
better visualize the deformations, they were amplified by multiplying the magnitude of the deformation vectors for each corner by a factor of ten. The comparison of the CF8M experiments shown in Fig. 15 indicates that there is a difference in the distortions between the vertical and side immersion experiments. The gap in the side immersion experiments tends to close more (-0.71 mm on average) than in the vertical immersion experiments (-0.55 mm on average). Furthermore, the gap change for the vertical immersion direction appears to be more asymmetric than the gap change for the side immersion experiments. However, this asymmetry is caused by a single outlying case in the vertical immersion experiments [47]. These results do not immediately lend themselves to an easy explanation of what is physically occurring. Summary of Results for All Experiments. A summary of the average gap openings for all eight sets of experiments performed in the present study is provided in Table 2. The average prong tip outlines are compared in Fig 16. Recall that these averages generally represent the results for five C-Rings. The measurements for each individual C-Ring can be found in Ref. [47]. Table 2 shows that the two CF8M sets of experiments resulted in the largest average gap closing among the four steels (i.e., 0.63 mm on average for the side and vertical immersion sets together). As already mentioned, the CF8M experiments also produced the most consistent results, as can be seen in Table 2 by the relatively low standard deviation for these experiments. The average gap closings for the experiments with the three different carbon and low-alloy steels are: 0.32 for the two 1022 sets; 0.41 for the two 4320 sets; and 0.09 for the two 8625 sets. These six sets of experimental results had generally larger standard deviations in the average gap change than the two CF8M sets. The fact that the carbon and low-alloy C-Ring gaps closed less than the CF8M C-Ring gaps must generally be attributed to the phase transformations occurring during heat treatment of these non-austenitic steels [30-31]. The reason for the larger scatter in the carbon and low-alloy steel results is presently unclear (see also the Conclusions section).
Table 2. Summary of average gap openings for all eight sets of experiments
Steel Immersion Direction Average Gap Opening, mm Standard Deviation, mm
CF8M Side -0.71 0.16
CF8M Vertical -0.55 0.12
1022 Side -0.33 0.35
1022 Vertical -0.30 0.26
4320 Side -0.18 0.29
4320 Vertical -0.64 0.83
8625 Side -0.25 0.24
8625 Vertical 0.07 0.21
19
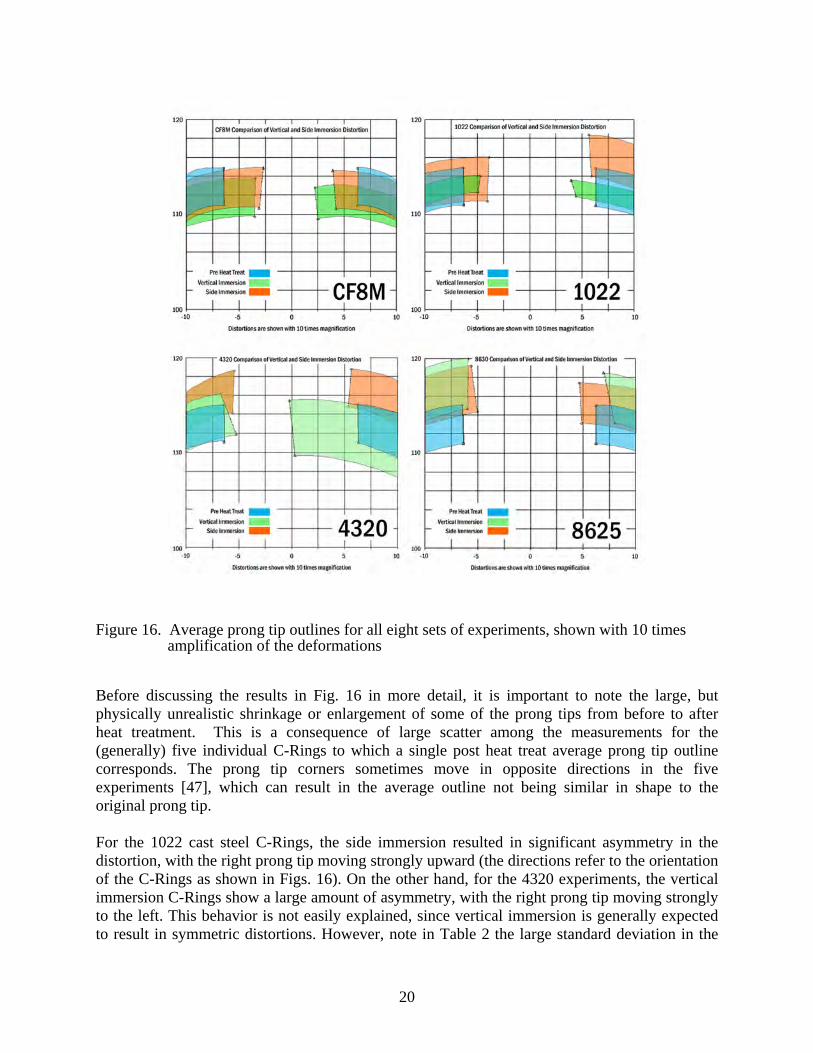
Figure 16. Average prong tip outlines for all eight sets of experiments, shown with 10 times amplification of the deformations
Before discussing the results in Fig. 16 in more detail, it is important to note the large, but physically unrealistic shrinkage or enlargement of some of the prong tips from before to after heat treatment. This is a consequence of large scatter among the measurements for the (generally) five individual C-Rings to which a single post heat treat average prong tip outline corresponds. The prong tip corners sometimes move in opposite directions in the five experiments [47], which can result in the average outline not being similar in shape to the original prong tip. For the 1022 cast steel C-Rings, the side immersion resulted in significant asymmetry in the distortion, with the right prong tip moving strongly upward (the directions refer to the orientation of the C-Rings as shown in Figs. 16). On the other hand, for the 4320 experiments, the vertical immersion C-Rings show a large amount of asymmetry, with the right prong tip moving strongly to the left. This behavior is not easily explained, since vertical immersion is generally expected to result in symmetric distortions. However, note in Table 2 the large standard deviation in the
20
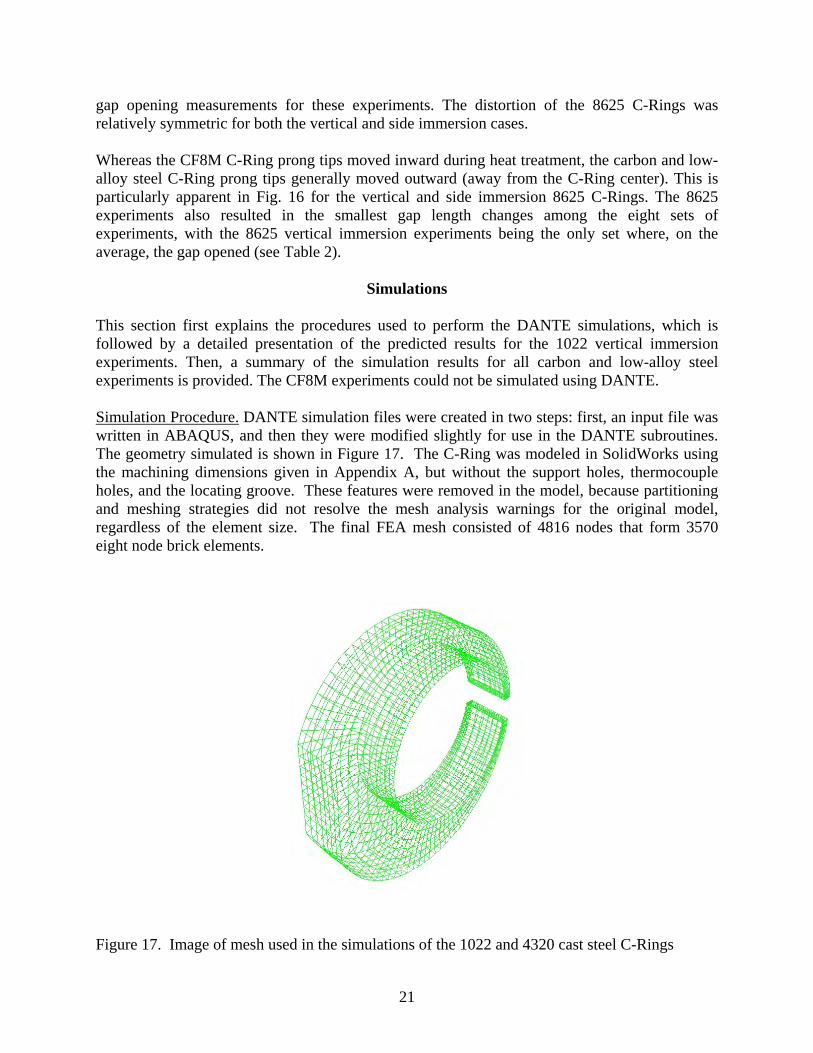
gap opening measurements for these experiments. The distortion of the 8625 C-Rings was relatively symmetric for both the vertical and side immersion cases. Whereas the CF8M C-Ring prong tips moved inward during heat treatment, the carbon and low-alloy steel C-Ring prong tips generally moved outward (away from the C-Ring center). This is particularly apparent in Fig. 16 for the vertical and side immersion 8625 C-Rings. The 8625 experiments also resulted in the smallest gap length changes among the eight sets of experiments, with the 8625 vertical immersion experiments being the only set where, on the average, the gap opened (see Table 2).
Simulations
This section first explains the procedures used to perform the DANTE simulations, which is followed by a detailed presentation of the predicted results for the 1022 vertical immersion experiments. Then, a summary of the simulation results for all carbon and low-alloy steel experiments is provided. The CF8M experiments could not be simulated using DANTE. Simulation Procedure. DANTE simulation files were created in two steps: first, an input file was written in ABAQUS, and then they were modified slightly for use in the DANTE subroutines. The geometry simulated is shown in Figure 17. The C-Ring was modeled in SolidWorks using the machining dimensions given in Appendix A, but without the support holes, thermocouple holes, and the locating groove. These features were removed in the model, because partitioning and meshing strategies did not resolve the mesh analysis warnings for the original model, regardless of the element size. The final FEA mesh consisted of 4816 nodes that form 3570 eight node brick elements.
Figure 17. Image of mesh used in the simulations of the 1022 and 4320 cast steel C-Rings
21
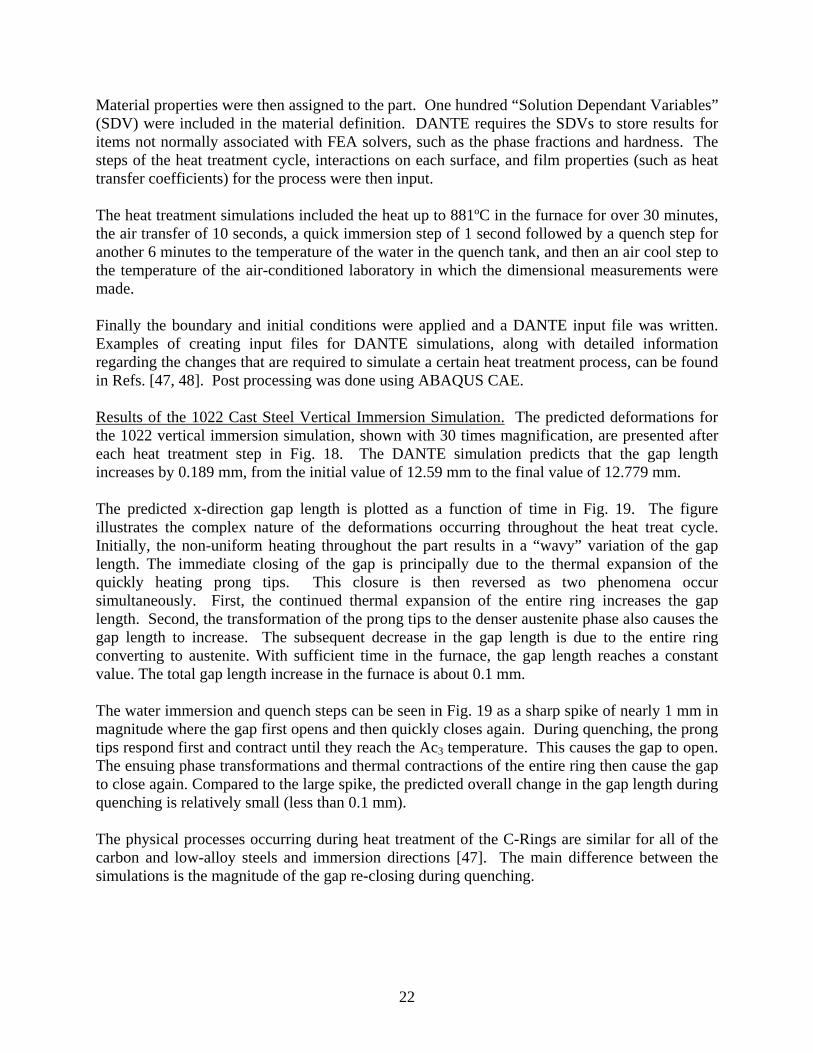
Material properties were then assigned to the part. One hundred “Solution Dependant Variables” (SDV) were included in the material definition. DANTE requires the SDVs to store results for items not normally associated with FEA solvers, such as the phase fractions and hardness. The steps of the heat treatment cycle, interactions on each surface, and film properties (such as heat transfer coefficients) for the process were then input. The heat treatment simulations included the heat up to 881ºC in the furnace for over 30 minutes, the air transfer of 10 seconds, a quick immersion step of 1 second followed by a quench step for another 6 minutes to the temperature of the water in the quench tank, and then an air cool step to the temperature of the air-conditioned laboratory in which the dimensional measurements were made. Finally the boundary and initial conditions were applied and a DANTE input file was written. Examples of creating input files for DANTE simulations, along with detailed information regarding the changes that are required to simulate a certain heat treatment process, can be found in Refs. [47, 48]. Post processing was done using ABAQUS CAE. Results of the 1022 Cast Steel Vertical Immersion Simulation. The predicted deformations for the 1022 vertical immersion simulation, shown with 30 times magnification, are presented after each heat treatment step in Fig. 18. The DANTE simulation predicts that the gap length increases by 0.189 mm, from the initial value of 12.59 mm to the final value of 12.779 mm. The predicted x-direction gap length is plotted as a function of time in Fig. 19. The figure illustrates the complex nature of the deformations occurring throughout the heat treat cycle. Initially, the non-uniform heating throughout the part results in a “wavy” variation of the gap length. The immediate closing of the gap is principally due to the thermal expansion of the quickly heating prong tips. This closure is then reversed as two phenomena occur simultaneously. First, the continued thermal expansion of the entire ring increases the gap length. Second, the transformation of the prong tips to the denser austenite phase also causes the gap length to increase. The subsequent decrease in the gap length is due to the entire ring converting to austenite. With sufficient time in the furnace, the gap length reaches a constant value. The total gap length increase in the furnace is about 0.1 mm. The water immersion and quench steps can be seen in Fig. 19 as a sharp spike of nearly 1 mm in magnitude where the gap first opens and then quickly closes again. During quenching, the prong tips respond first and contract until they reach the Ac3 temperature. This causes the gap to open. The ensuing phase transformations and thermal contractions of the entire ring then cause the gap to close again. Compared to the large spike, the predicted overall change in the gap length during quenching is relatively small (less than 0.1 mm). The physical processes occurring during heat treatment of the C-Rings are similar for all of the carbon and low-alloy steels and immersion directions [47]. The main difference between the simulations is the magnitude of the gap re-closing during quenching.
22
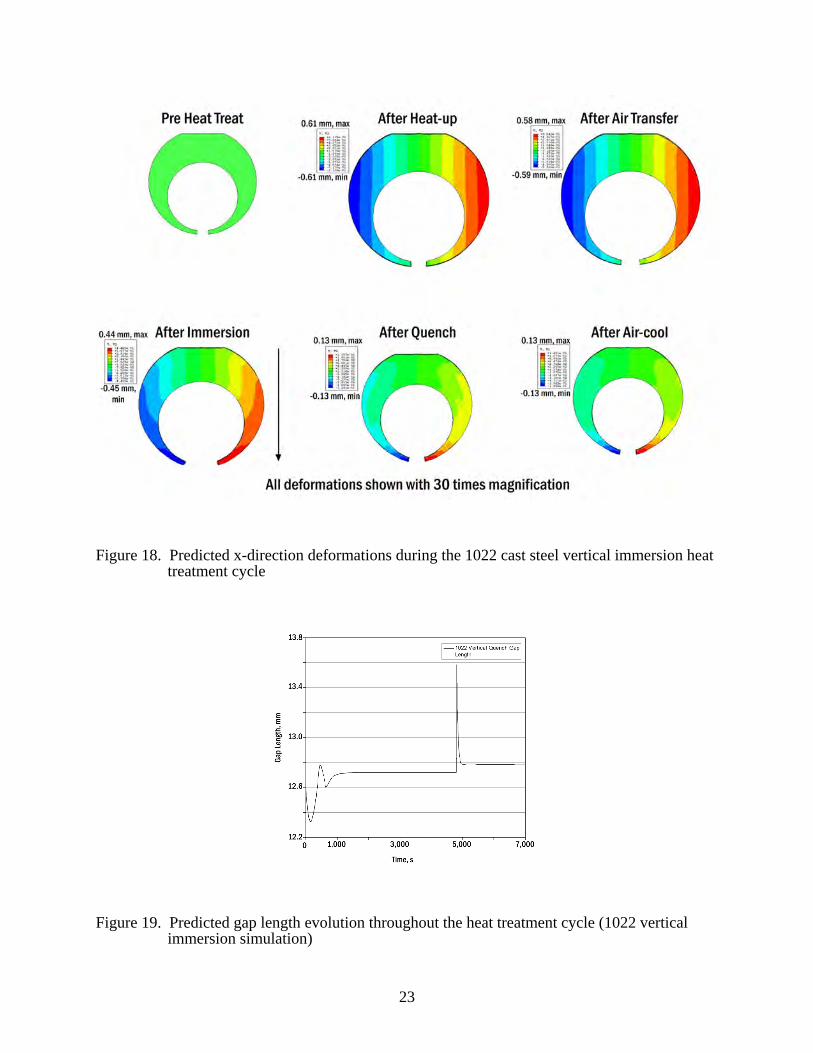
Figure 18. Predicted x-direction deformations during the 1022 cast steel vertical immersion heat treatment cycle
Figure 19. Predicted gap length evolution throughout the heat treatment cycle (1022 vertical immersion simulation)
23
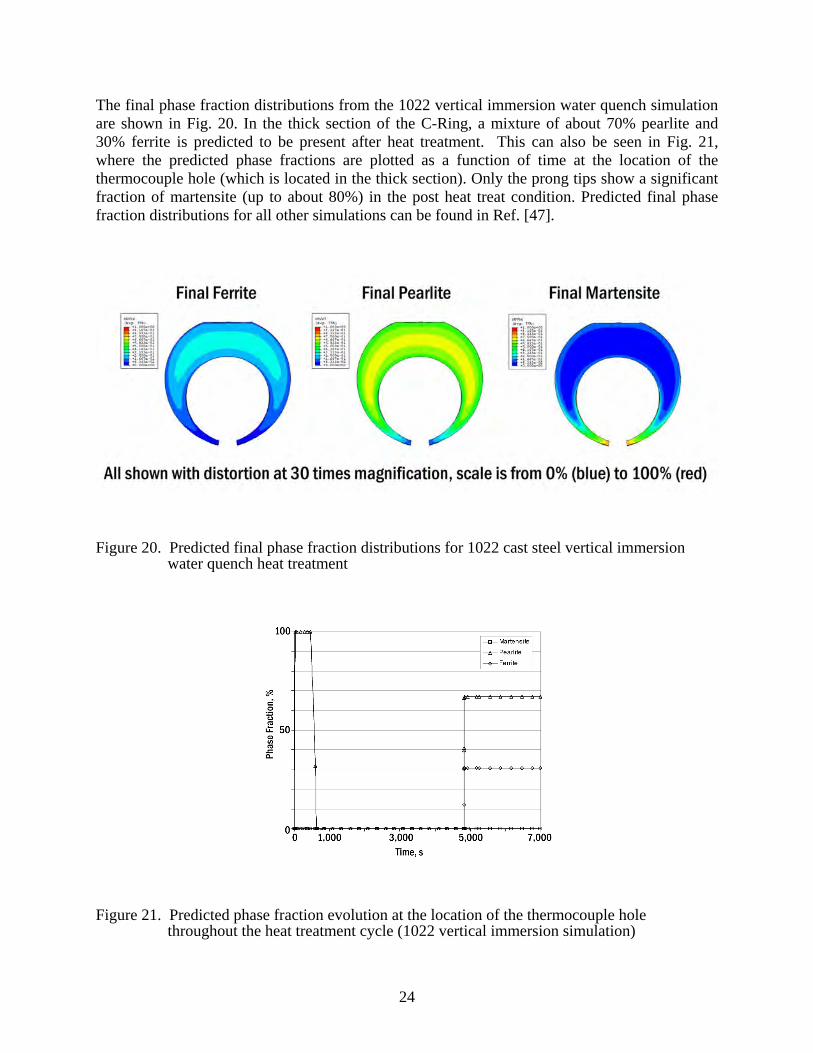
The final phase fraction distributions from the 1022 vertical immersion water quench simulation are shown in Fig. 20. In the thick section of the C-Ring, a mixture of about 70% pearlite and 30% ferrite is predicted to be present after heat treatment. This can also be seen in Fig. 21, where the predicted phase fractions are plotted as a function of time at the location of the thermocouple hole (which is located in the thick section). Only the prong tips show a significant fraction of martensite (up to about 80%) in the post heat treat condition. Predicted final phase fraction distributions for all other simulations can be found in Ref. [47].
Figure 20. Predicted final phase fraction distributions for 1022 cast steel vertical immersion water quench heat treatment
Figure 21. Predicted phase fraction evolution at the location of the thermocouple hole throughout the heat treatment cycle (1022 vertical immersion simulation)
24
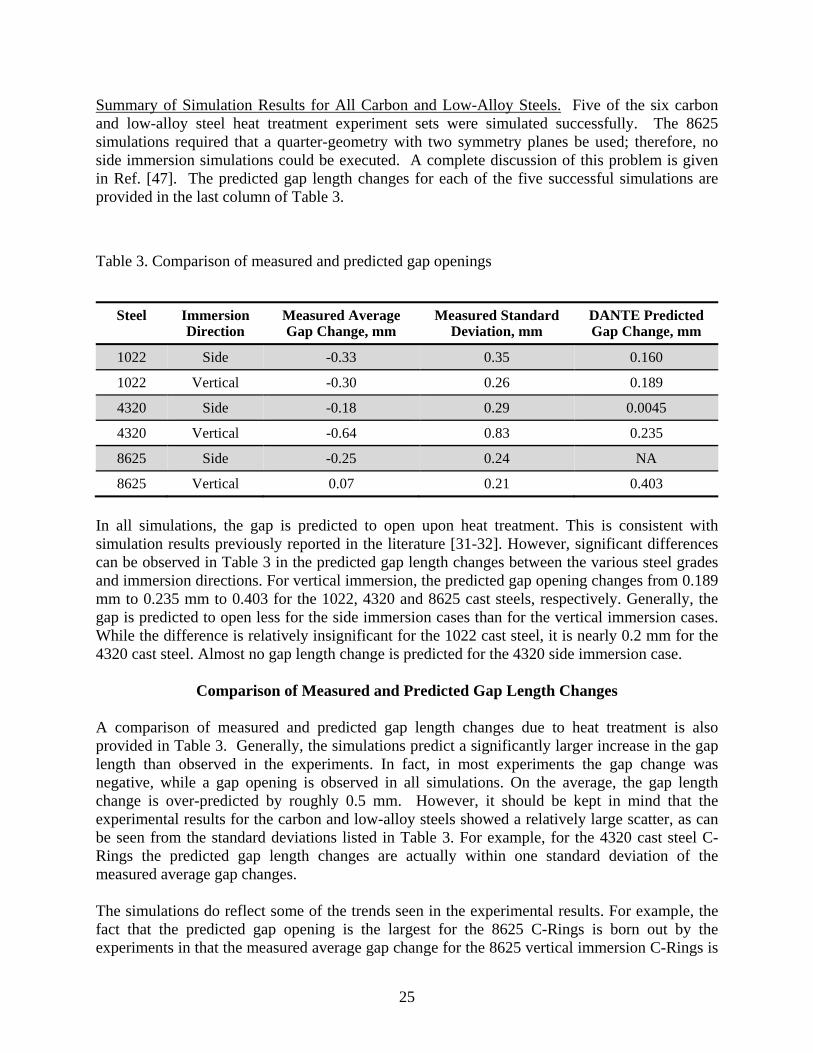
Summary of Simulation Results for All Carbon and Low-Alloy Steels. Five of the six carbon and low-alloy steel heat treatment experiment sets were simulated successfully. The 8625 simulations required that a quarter-geometry with two symmetry planes be used; therefore, no side immersion simulations could be executed. A complete discussion of this problem is given in Ref. [47]. The predicted gap length changes for each of the five successful simulations are provided in the last column of Table 3.
Table 3. Comparison of measured and predicted gap openings
Steel Immersion Direction
Measured Average Gap Change, mm
Measured Standard Deviation, mm
DANTE Predicted Gap Change, mm
1022 Side -0.33 0.35 0.160
1022 Vertical -0.30 0.26 0.189
4320 Side -0.18 0.29 0.0045
4320 Vertical -0.64 0.83 0.235
8625 Side -0.25 0.24 NA
8625 Vertical 0.07 0.21 0.403
In all simulations, the gap is predicted to open upon heat treatment. This is consistent with simulation results previously reported in the literature [31-32]. However, significant differences can be observed in Table 3 in the predicted gap length changes between the various steel grades and immersion directions. For vertical immersion, the predicted gap opening changes from 0.189 mm to 0.235 mm to 0.403 for the 1022, 4320 and 8625 cast steels, respectively. Generally, the gap is predicted to open less for the side immersion cases than for the vertical immersion cases. While the difference is relatively insignificant for the 1022 cast steel, it is nearly 0.2 mm for the 4320 cast steel. Almost no gap length change is predicted for the 4320 side immersion case.
Comparison of Measured and Predicted Gap Length Changes A comparison of measured and predicted gap length changes due to heat treatment is also provided in Table 3. Generally, the simulations predict a significantly larger increase in the gap length than observed in the experiments. In fact, in most experiments the gap change was negative, while a gap opening is observed in all simulations. On the average, the gap length change is over-predicted by roughly 0.5 mm. However, it should be kept in mind that the experimental results for the carbon and low-alloy steels showed a relatively large scatter, as can be seen from the standard deviations listed in Table 3. For example, for the 4320 cast steel C-Rings the predicted gap length changes are actually within one standard deviation of the measured average gap changes. The simulations do reflect some of the trends seen in the experimental results. For example, the fact that the predicted gap opening is the largest for the 8625 C-Rings is born out by the experiments in that the measured average gap change for the 8625 vertical immersion C-Rings is
25
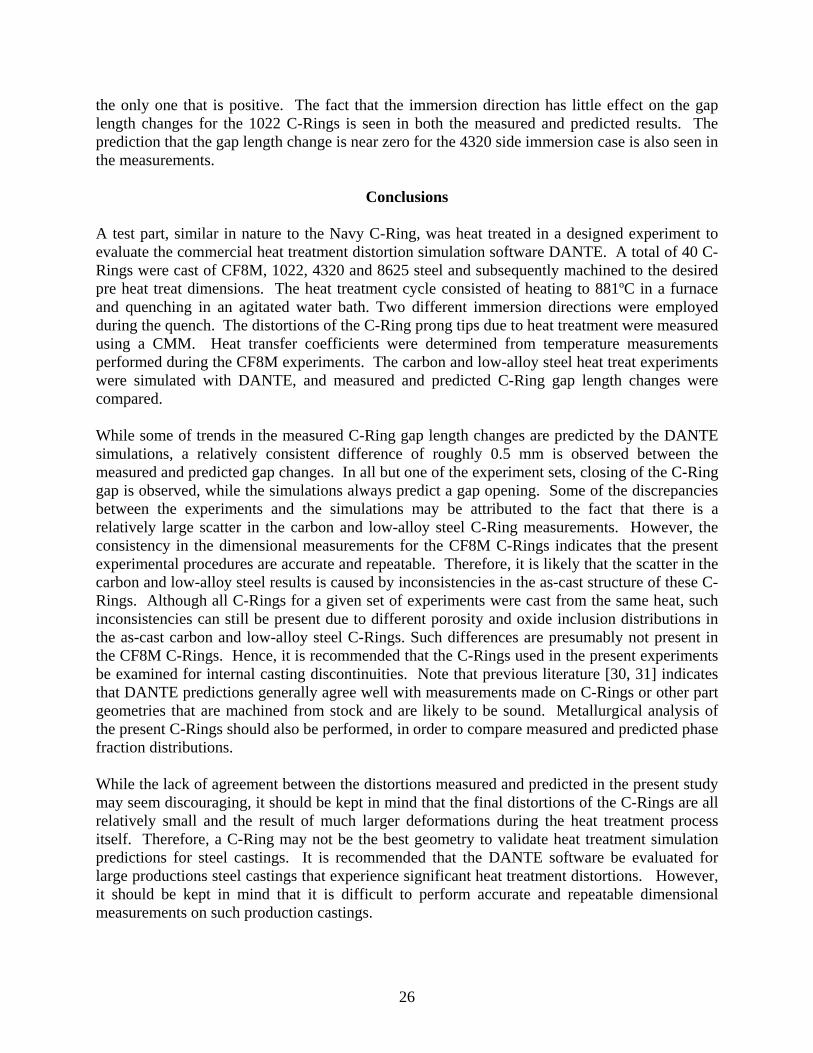
the only one that is positive. The fact that the immersion direction has little effect on the gap length changes for the 1022 C-Rings is seen in both the measured and predicted results. The prediction that the gap length change is near zero for the 4320 side immersion case is also seen in the measurements.
Conclusions
A test part, similar in nature to the Navy C-Ring, was heat treated in a designed experiment to evaluate the commercial heat treatment distortion simulation software DANTE. A total of 40 C-Rings were cast of CF8M, 1022, 4320 and 8625 steel and subsequently machined to the desired pre heat treat dimensions. The heat treatment cycle consisted of heating to 881ºC in a furnace and quenching in an agitated water bath. Two different immersion directions were employed during the quench. The distortions of the C-Ring prong tips due to heat treatment were measured using a CMM. Heat transfer coefficients were determined from temperature measurements performed during the CF8M experiments. The carbon and low-alloy steel heat treat experiments were simulated with DANTE, and measured and predicted C-Ring gap length changes were compared. While some of trends in the measured C-Ring gap length changes are predicted by the DANTE simulations, a relatively consistent difference of roughly 0.5 mm is observed between the measured and predicted gap changes. In all but one of the experiment sets, closing of the C-Ring gap is observed, while the simulations always predict a gap opening. Some of the discrepancies between the experiments and the simulations may be attributed to the fact that there is a relatively large scatter in the carbon and low-alloy steel C-Ring measurements. However, the consistency in the dimensional measurements for the CF8M C-Rings indicates that the present experimental procedures are accurate and repeatable. Therefore, it is likely that the scatter in the carbon and low-alloy steel results is caused by inconsistencies in the as-cast structure of these C-Rings. Although all C-Rings for a given set of experiments were cast from the same heat, such inconsistencies can still be present due to different porosity and oxide inclusion distributions in the as-cast carbon and low-alloy steel C-Rings. Such differences are presumably not present in the CF8M C-Rings. Hence, it is recommended that the C-Rings used in the present experiments be examined for internal casting discontinuities. Note that previous literature [30, 31] indicates that DANTE predictions generally agree well with measurements made on C-Rings or other part geometries that are machined from stock and are likely to be sound. Metallurgical analysis of the present C-Rings should also be performed, in order to compare measured and predicted phase fraction distributions. While the lack of agreement between the distortions measured and predicted in the present study may seem discouraging, it should be kept in mind that the final distortions of the C-Rings are all relatively small and the result of much larger deformations during the heat treatment process itself. Therefore, a C-Ring may not be the best geometry to validate heat treatment simulation predictions for steel castings. It is recommended that the DANTE software be evaluated for large productions steel castings that experience significant heat treatment distortions. However, it should be kept in mind that it is difficult to perform accurate and repeatable dimensional measurements on such production castings.
26
Acknowledgements
This research was funded by the United States Department of Energy as part of the Energy-Saving Melting and Revert Reduction Technology (E-SMARRT) research program under award number DE-FC36-04GO14230. It is also conducted under the auspices of the Steel Founders' Society of America, and through substantial in-kind support, guidance and interest from SFSA member foundries. The authors would like to thank DTC Inc. and MAGMA GmbH for their generous support through donation of software, time and information. Personally, the authors would like to thank Dr. F. Peters of Iowa State University, Mr. Z. Li of DTC Inc., Mr. B. Bryant of Keokuk Steel Castings, Mr. H. Davis and Mr. T. Alias of Sivyer Steel Corp. and Mr. D. Daily of Wollaston Alloys. Mr. J.R. Pratt is thanked for his help with the dimensional measurements. Any findings, opinions, and conclusions or recommendations expressed in this paper are those of the authors and do not necessarily reflect the views of the Department of Energy.
References
1. Ferguson, B. L., Freborg, A. M., Petrus, G., and Callabresi, M. L., Gear Technology, November/December 2002, 20-25.
2. Cho, J. R., Kang, W. J., Kim, M. G., Lee, J. H., Lee, Y. S., Bae, W. B., J. of Mat. Proc. Tech., 153-154 (2004) 476-481.
3. Rohde, J., Jeppsson, A., Scandinavian Journal of Metallurgy, 29 (2000) 47-62. 4. Hardin, R., Beckermann, C., SFSA 59th T&O Conference, Chicago IL, 2005. 5. Ferguson, B. L., Li, Z., Freborg, A. M., Comp. Mat. Sci., 34 (2005) 274-281. 6. Prantil, V. C., Callabresi, M. L., Lathrop, J. F., Ramaswamy, G. S., Lusk, M. T., Eng. Mat.
and Tech. Trans. of the ASME, 125 (2003) 116-124. 7. Ju., D.Y., Zhang, W.M., Zhang, Y., Mat. Sci. and Eng. A, 438-440 (2006) 246-250. 8. Chen, J.R., Tao, Y.Q., Wang, H.G., J. of Mat. Proc. Tech., 63 (1997) 554-558. 9. Inoue, T., Arimoto, K., Proc. of the First Int. Conf. on Quenching and Control of Distortion,
Chicago IL, 1992. 10. Krauss, G., Proc. of the First Int. Conf. on Quenching and Control of Distortion, Chicago IL,
1992. 11. Henriksen, M., Larson, D.B., Van Tyne, C.J., Proc. of the First Int. Conf. on Quenching and
Control of Distortion, Chicago IL, 1992. 12. Buchmayr, B., Kirkaldy, J.S., Proc. of the First Int. Conf. on Quenching and Control of
Distortion, Chicago IL, 1992. 13. Clements, T.E., Chuzhoy, L., Shareef, I., Proc. of the Second Int. Conf. on Quenching and
Control of Distortion, Chicago, IL, 1996. 14. Denis, A., Simon, A., Proc. of the Second Int. Conf. on Quenching and Control of Distortion,
Chicago, IL, 1996. 15. Chen, X.L., Meekisho, L., Proc. of the Second Int. Conf. on Quenching and Control of
Distortion, Chicago, IL, 1996. 16. Ju. D.Y., Sahashi, M., Omori, T., Inoue, T., Proc. of the Second Int. Conf. on Quenching and
Control of Distortion, Chicago, IL, 1996. 17. Ikuta, F., Arimoto, K., Inoue, T., Proc. of the Second Int. Conf. on Quenching and Control of
Distortion, Chicago, IL, 1996.
27
18. Oldenburg, M., Bergman, G., Sandberg, L., Jonsson, M., Proc. of the Second Int. Conf. on Quenching and Control of Distortion, Chicago, IL, 1996.
19. Baker, A.J., Manhardt, P.D., Orzechowski, J.A., Proc. of the Second Int. Conf. on Quenching and Control of Distortion, Chicago, IL, 1996.
20. Gur, C.H., Tekkaya, A.E., Ozturk, T., Proc. of the Second Int. Conf. on Quenching and Control of Distortion, Chicago, IL, 1996.
21. Palafox, M.G., Colas, R., Proc. of the Second Int. Conf. on Quenching and Control of Distortion, Chicago, IL, 1996.
22. Dowling Jr., W., Shick, D., Pattock, T., Gu, H.Y., Ferguson, B.L., Howes, M., Proc. of the Second Int. Conf. on Quenching and Control of Distortion, Chicago, IL, 1996.
23. Shick, et al., Proc. of the Second Int. Conf. on Quenching and Control of Distortion, Chicago, IL, 1996.
24. Bammann, D., Prantil, V., Kumar, A., Lathrop, J., Mosher, D., Callabresi, M., et al, Proc. of the Second Int. Conf. on Quenching and Control of Distortion, Chicago, IL, 1996.
25. Anderson, C., Goldman, P., Rangaswamy, P., et al, Proc. of the Second Int. Conf. on Quenching and Control of Distortion, Chicago, IL, 1996.
26. Wei, S., Zhuang, L., “Prediction of Internal Stresses, Phase Transformations and Research on Numerical Simulation of Quenching,” Proc. of the Fourth Int. Conf. on Quenching and Control of Distortion, Beijing, 2003.
27. Li, M.V., Totten, G.E., Proc. of the Fourth Int. Conf. on Quenching and Control of Distortion, Beijing, 2003.
28. Wei, S., Ke-fu, Y., Chun-cheng, L., Zhuang, L., Proc. of the Fourth Int. Conf. on Quenching and Control of Distortion, Beijing, 2003.
29. Deformation Control Technology, Inc., website homepage, http://deformationcontrol.com/, 2006.
30. French, H.J., The Quenching of Steels, American Society for Steel Treating, Cleveland, OH, 1930.
31. Li, Z., Ferguson, B.L., Sun, X., Bauerle, P., Proc. of the 23rd ASM Heat Treating Society Conference, Pittsburgh, PA, 2005.
32. Hernandez-Morales, B., Barba-Mendez, O., Ingalss-Cruz, A., Barrera-Godinez, J.A., Int J. of Mat. and Product Tech., 24 (2005) 306-318.
33. Personal correspondence with researchers with experience using CMM for deformation measurements, 2006.
34. Carey, V.P., Liquid-Vapor Phase-Change Phenomena: An Introduction to the Thermophysics of Vaporization and Condensation Processes in Heat Transfer Equipment, Taylor & Francis, 1992.
35. Totten, G.E., Bates, C.E., Clinton, N.A., Handbook of Quenchants and Quenching Technology, ASM International Press, Materials Park, OH, 1993.
36. Kuyucak, S., Newcombe, P., Bruno, P., Grozdanich, R., Looney, G., SFSA T&O Conference, Chicago, IL, 2001.
37. Segerberg, S., Bodin, J., Proc. of the First Int. Conf. on Quenching and Control of Distortion, Chicago IL, 1992.
38. Bates, C.E., “Evaluating the Effects of Quenching Variables of Hardening Steels, SFSA Technical Paper 95,” Carbon and Low-alloy Research Committee, 1982.
39. Beck, J.V., Blackwell, B., St. Clair, C.R. Jr., Inverse Heat Conduction: Ill-Posed Problems, Wiley-Interscience, 1985.
28
40. Franca, F.H.R., Ezekoye, O.A., Howell, J.R., Trans. Of ASME, 123 (2001) 884-891. 41. Vynnycky, M., Ferrari, J., Lior, N., J. of Heat Transfer, 125 (2003) 1-10. 42. Zhou, J.W., Mahulikar, S.P., Experimental Heat Transfer, 19 (2006) 297-308. 43. Penha, R.N., Canale, L.C.F., Totten, G.E., Sarmiento, G.S., Venture, J.M., J. of ASTM
International, 3 No. 5, (2006). 44. Sozbir, N., Chang, Y.W., Yao, S.C., Transaction of the ASME, 125 (2003) 70-74. 45. Ozenik, M.N., Inverse Heat Transfer: Fundamentals and Applications, Taylor & Francis,
2001. 46. Varkey, V.K., Voight, R.C., SFSA 55th T&O Conference, Chicago, IL, 2001. 47. Brooks, B., The Prediction of Heat Treatment Distortion of Cast Steel C-Rings, Masters
Thesis, The University of Iowa, 2007. 48. Help file from DANTE, Version 3.0.
29
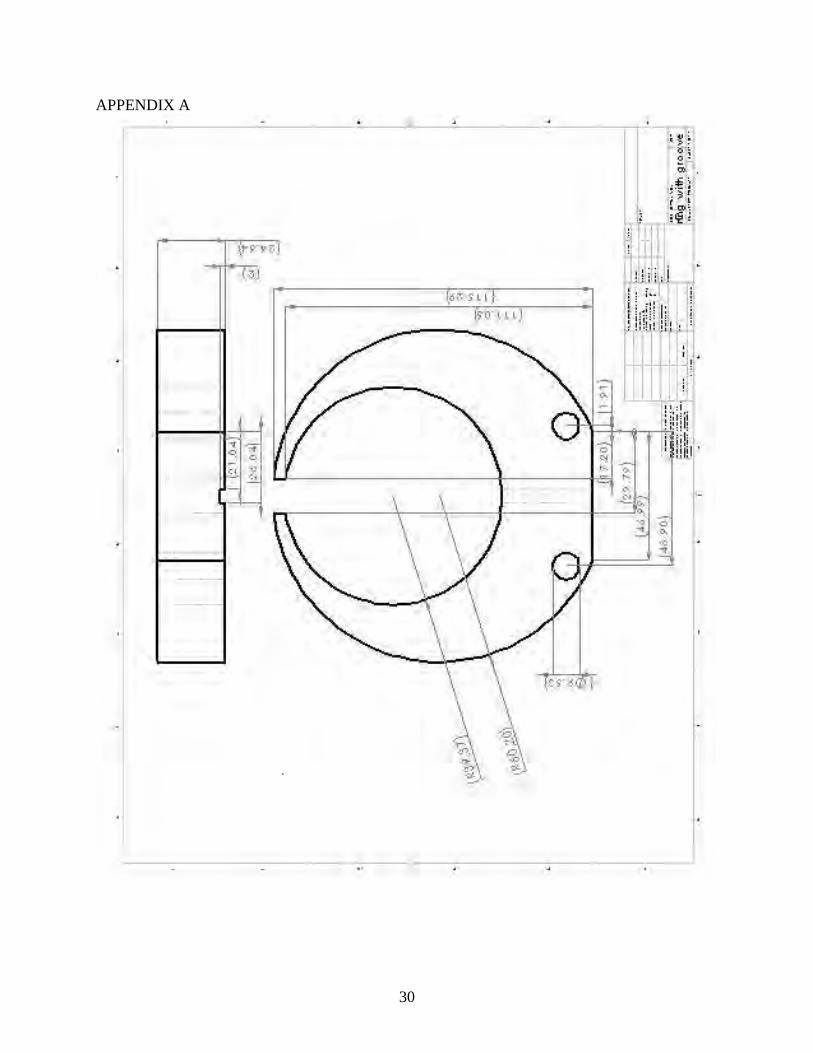
APPENDIX A
30
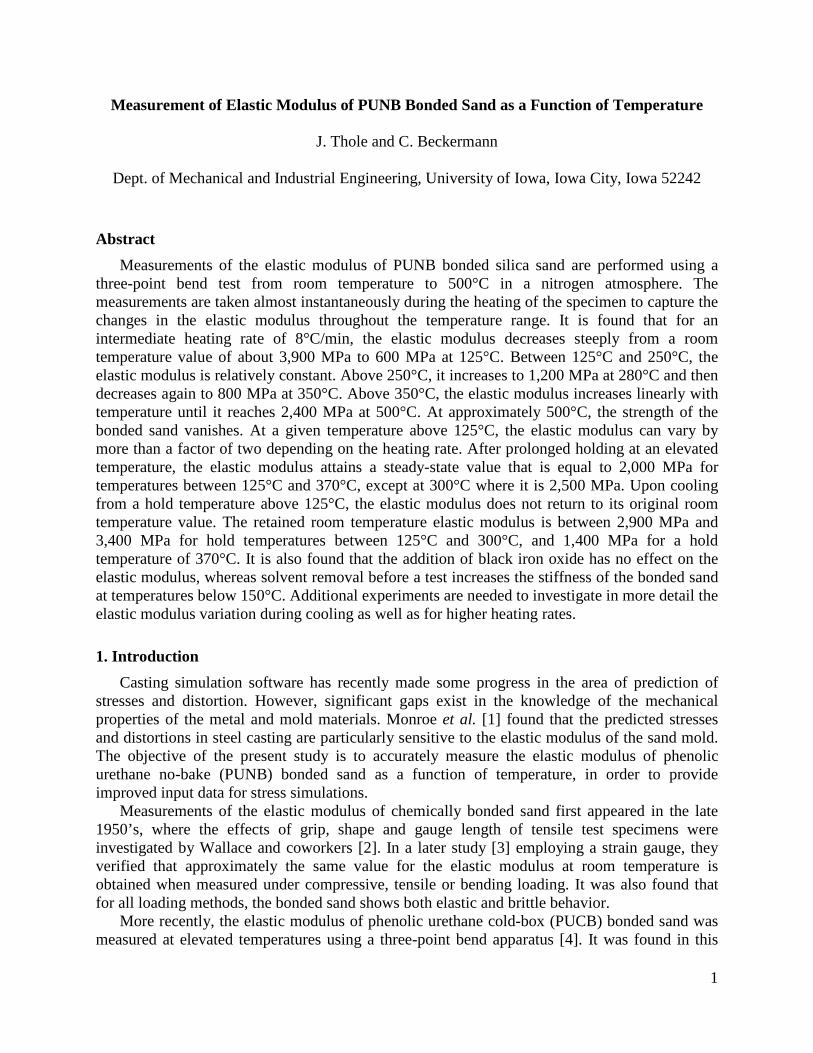
1
Measurement of Elastic Modulus of PUNB Bonded Sand as a Function of Temperature
J. Thole and C. Beckermann
Dept. of Mechanical and Industrial Engineering, University of Iowa, Iowa City, Iowa 52242
Abstract
Measurements of the elastic modulus of PUNB bonded silica sand are performed using a three-point bend test from room temperature to 500°C in a nitrogen atmosphere. The measurements are taken almost instantaneously during the heating of the specimen to capture the changes in the elastic modulus throughout the temperature range. It is found that for an intermediate heating rate of 8°C/min, the elastic modulus decreases steeply from a room temperature value of about 3,900 MPa to 600 MPa at 125°C. Between 125°C and 250°C, the elastic modulus is relatively constant. Above 250°C, it increases to 1,200 MPa at 280°C and then decreases again to 800 MPa at 350°C. Above 350°C, the elastic modulus increases linearly with temperature until it reaches 2,400 MPa at 500°C. At approximately 500°C, the strength of the bonded sand vanishes. At a given temperature above 125°C, the elastic modulus can vary by more than a factor of two depending on the heating rate. After prolonged holding at an elevated temperature, the elastic modulus attains a steady-state value that is equal to 2,000 MPa for temperatures between 125°C and 370°C, except at 300°C where it is 2,500 MPa. Upon cooling from a hold temperature above 125°C, the elastic modulus does not return to its original room temperature value. The retained room temperature elastic modulus is between 2,900 MPa and 3,400 MPa for hold temperatures between 125°C and 300°C, and 1,400 MPa for a hold temperature of 370°C. It is also found that the addition of black iron oxide has no effect on the elastic modulus, whereas solvent removal before a test increases the stiffness of the bonded sand at temperatures below 150°C. Additional experiments are needed to investigate in more detail the elastic modulus variation during cooling as well as for higher heating rates.
1. Introduction
Casting simulation software has recently made some progress in the area of prediction of stresses and distortion. However, significant gaps exist in the knowledge of the mechanical properties of the metal and mold materials. Monroe et al. [1] found that the predicted stresses and distortions in steel casting are particularly sensitive to the elastic modulus of the sand mold. The objective of the present study is to accurately measure the elastic modulus of phenolic urethane no-bake (PUNB) bonded sand as a function of temperature, in order to provide improved input data for stress simulations.
Measurements of the elastic modulus of chemically bonded sand first appeared in the late 1950’s, where the effects of grip, shape and gauge length of tensile test specimens were investigated by Wallace and coworkers [2]. In a later study [3] employing a strain gauge, they verified that approximately the same value for the elastic modulus at room temperature is obtained when measured under compressive, tensile or bending loading. It was also found that for all loading methods, the bonded sand shows both elastic and brittle behavior.
More recently, the elastic modulus of phenolic urethane cold-box (PUCB) bonded sand was measured at elevated temperatures using a three-point bend apparatus [4]. It was found in this
becker
Text Box
Thole, J., and Beckermann, C., “Measurement of Elastic Modulus of PUNB Bonded Sand as a Function of Temperature,” in Proceedings of the 63rd SFSA Technical and Operating Conference, Paper No. 4.7, Steel Founders' Society of America, Chicago, IL, 2009.
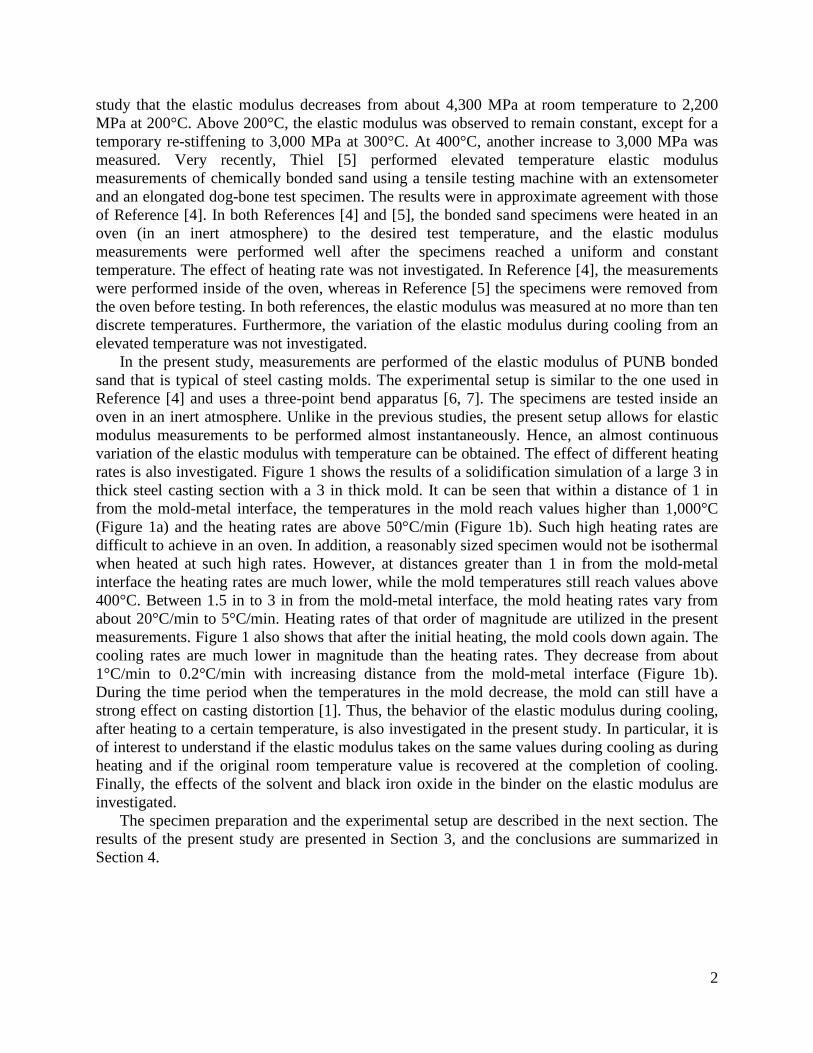
2
study that the elastic modulus decreases from about 4,300 MPa at room temperature to 2,200 MPa at 200°C. Above 200°C, the elastic modulus was observed to remain constant, except for a temporary re-stiffening to 3,000 MPa at 300°C. At 400°C, another increase to 3,000 MPa was measured. Very recently, Thiel [5] performed elevated temperature elastic modulus measurements of chemically bonded sand using a tensile testing machine with an extensometer and an elongated dog-bone test specimen. The results were in approximate agreement with those of Reference [4]. In both References [4] and [5], the bonded sand specimens were heated in an oven (in an inert atmosphere) to the desired test temperature, and the elastic modulus measurements were performed well after the specimens reached a uniform and constant temperature. The effect of heating rate was not investigated. In Reference [4], the measurements were performed inside of the oven, whereas in Reference [5] the specimens were removed from the oven before testing. In both references, the elastic modulus was measured at no more than ten discrete temperatures. Furthermore, the variation of the elastic modulus during cooling from an elevated temperature was not investigated.
In the present study, measurements are performed of the elastic modulus of PUNB bonded sand that is typical of steel casting molds. The experimental setup is similar to the one used in Reference [4] and uses a three-point bend apparatus [6, 7]. The specimens are tested inside an oven in an inert atmosphere. Unlike in the previous studies, the present setup allows for elastic modulus measurements to be performed almost instantaneously. Hence, an almost continuous variation of the elastic modulus with temperature can be obtained. The effect of different heating rates is also investigated. Figure 1 shows the results of a solidification simulation of a large 3 in thick steel casting section with a 3 in thick mold. It can be seen that within a distance of 1 in from the mold-metal interface, the temperatures in the mold reach values higher than 1,000°C (Figure 1a) and the heating rates are above 50°C/min (Figure 1b). Such high heating rates are difficult to achieve in an oven. In addition, a reasonably sized specimen would not be isothermal when heated at such high rates. However, at distances greater than 1 in from the mold-metal interface the heating rates are much lower, while the mold temperatures still reach values above 400°C. Between 1.5 in to 3 in from the mold-metal interface, the mold heating rates vary from about 20°C/min to 5°C/min. Heating rates of that order of magnitude are utilized in the present measurements. Figure 1 also shows that after the initial heating, the mold cools down again. The cooling rates are much lower in magnitude than the heating rates. They decrease from about 1°C/min to 0.2°C/min with increasing distance from the mold-metal interface (Figure 1b). During the time period when the temperatures in the mold decrease, the mold can still have a strong effect on casting distortion [1]. Thus, the behavior of the elastic modulus during cooling, after heating to a certain temperature, is also investigated in the present study. In particular, it is of interest to understand if the elastic modulus takes on the same values during cooling as during heating and if the original room temperature value is recovered at the completion of cooling. Finally, the effects of the solvent and black iron oxide in the binder on the elastic modulus are investigated.
The specimen preparation and the experimental setup are described in the next section. The results of the present study are presented in Section 3, and the conclusions are summarized in Section 4.
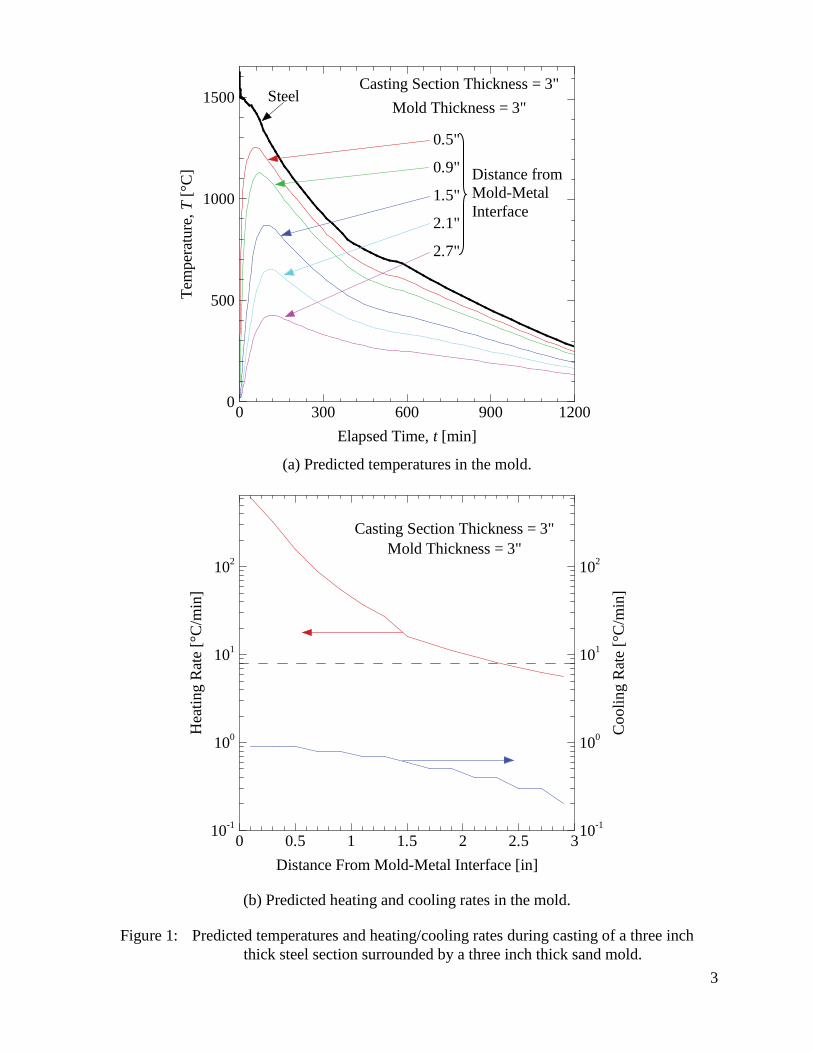
3
(a) Predicted temperatures in the mold.
Elapsed Time, t [min]
Tem
pera
ture
,T[°
C]
0 300 600 900 12000
500
1000
1500Casting Section Thickness = 3"
Mold Thickness = 3"Steel
0.5"
0.9"
1.5"
2.1"
2.7"
Distance from Mold-Metal Interface
Distance From Mold-Metal Interface [in]
Hea
ting
Rat
e[°
C/m
in]
Coo
ling
Rat
e[°
C/m
in]
0 0.5 1 1.5 2 2.5 310-1
100
101
102
10-1
100
101
102
Casting Section Thickness = 3"Mold Thickness = 3"
(b) Predicted heating and cooling rates in the mold.
Figure 1: Predicted temperatures and heating/cooling rates during casting of a three inch thick steel section surrounded by a three inch thick sand mold.
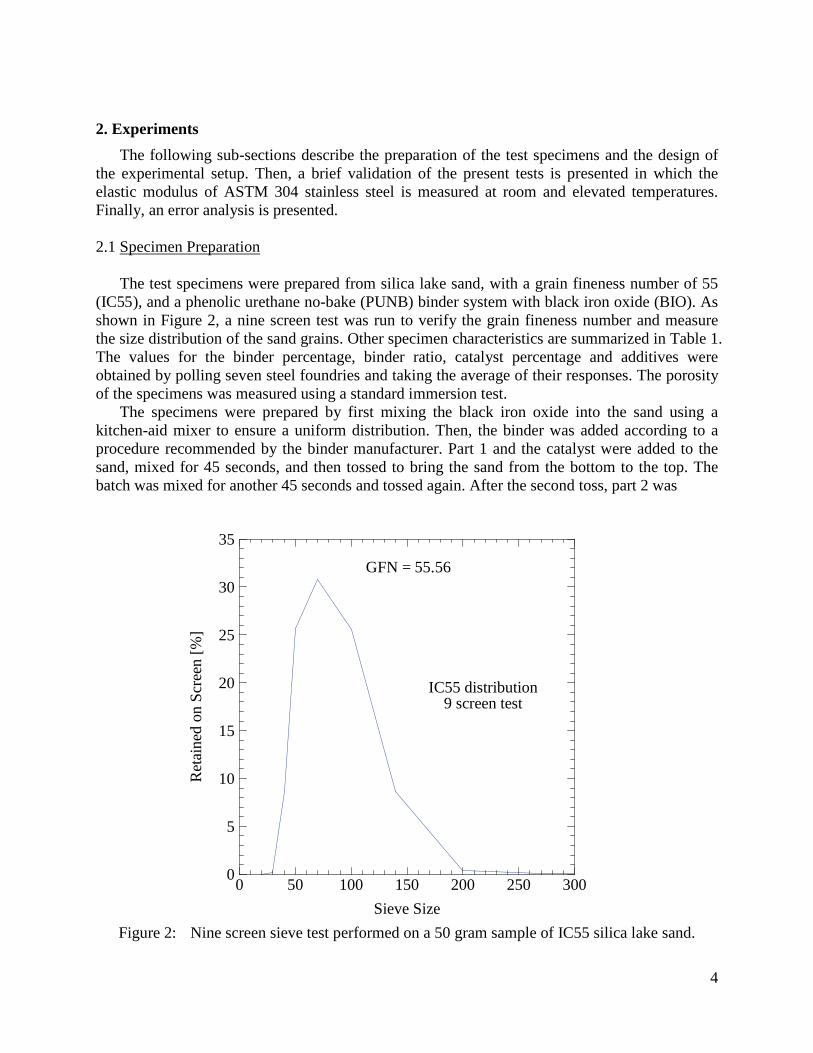
4
2. Experiments
The following sub-sections describe the preparation of the test specimens and the design of the experimental setup. Then, a brief validation of the present tests is presented in which the elastic modulus of ASTM 304 stainless steel is measured at room and elevated temperatures. Finally, an error analysis is presented. 2.1 Specimen Preparation
The test specimens were prepared from silica lake sand, with a grain fineness number of 55 (IC55), and a phenolic urethane no-bake (PUNB) binder system with black iron oxide (BIO). As shown in Figure 2, a nine screen test was run to verify the grain fineness number and measure the size distribution of the sand grains. Other specimen characteristics are summarized in Table 1. The values for the binder percentage, binder ratio, catalyst percentage and additives were obtained by polling seven steel foundries and taking the average of their responses. The porosity of the specimens was measured using a standard immersion test.
The specimens were prepared by first mixing the black iron oxide into the sand using a kitchen-aid mixer to ensure a uniform distribution. Then, the binder was added according to a procedure recommended by the binder manufacturer. Part 1 and the catalyst were added to the sand, mixed for 45 seconds, and then tossed to bring the sand from the bottom to the top. The batch was mixed for another 45 seconds and tossed again. After the second toss, part 2 was
Sieve Size
Ret
aine
don
Scr
een
[%]
0 50 100 150 200 250 3000
5
10
15
20
25
30
35
IC55 distribution9 screen test
GFN = 55.56
Figure 2: Nine screen sieve test performed on a 50 gram sample of IC55 silica lake sand.
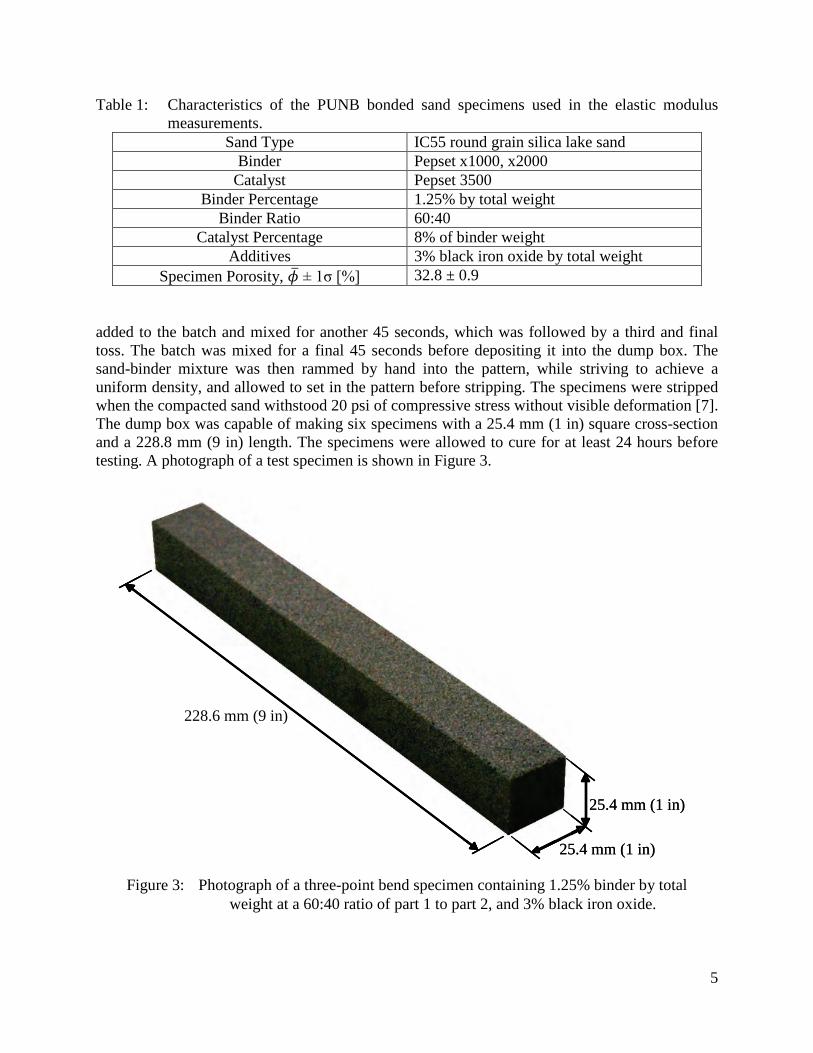
5
Table 1: Characteristics of the PUNB bonded sand specimens used in the elastic modulus measurements.
Sand Type IC55 round grain silica lake sand Binder Pepset x1000, x2000
Catalyst Pepset 3500 Binder Percentage 1.25% by total weight
Binder Ratio 60:40 Catalyst Percentage 8% of binder weight
Additives 3% black iron oxide by total weight Specimen Porosity, 𝜙𝜙� ± 1σ [%] 32.8 ± 0.9
added to the batch and mixed for another 45 seconds, which was followed by a third and final toss. The batch was mixed for a final 45 seconds before depositing it into the dump box. The sand-binder mixture was then rammed by hand into the pattern, while striving to achieve a uniform density, and allowed to set in the pattern before stripping. The specimens were stripped when the compacted sand withstood 20 psi of compressive stress without visible deformation [7].
The dump box was capable of making six specimens with a 25.4 mm (1 in) square cross-section and a 228.8 mm (9 in) length. The specimens were allowed to cure for at least 24 hours before testing. A photograph of a test specimen is shown in Figure 3.
228.6 mm (9 in)
25.4 mm (1 in)
25.4 mm (1 in)
228.6 mm (9 in)
25.4 mm (1 in)
25.4 mm (1 in)
Figure 3: Photograph of a three-point bend specimen containing 1.25% binder by total weight at a 60:40 ratio of part 1 to part 2, and 3% black iron oxide.
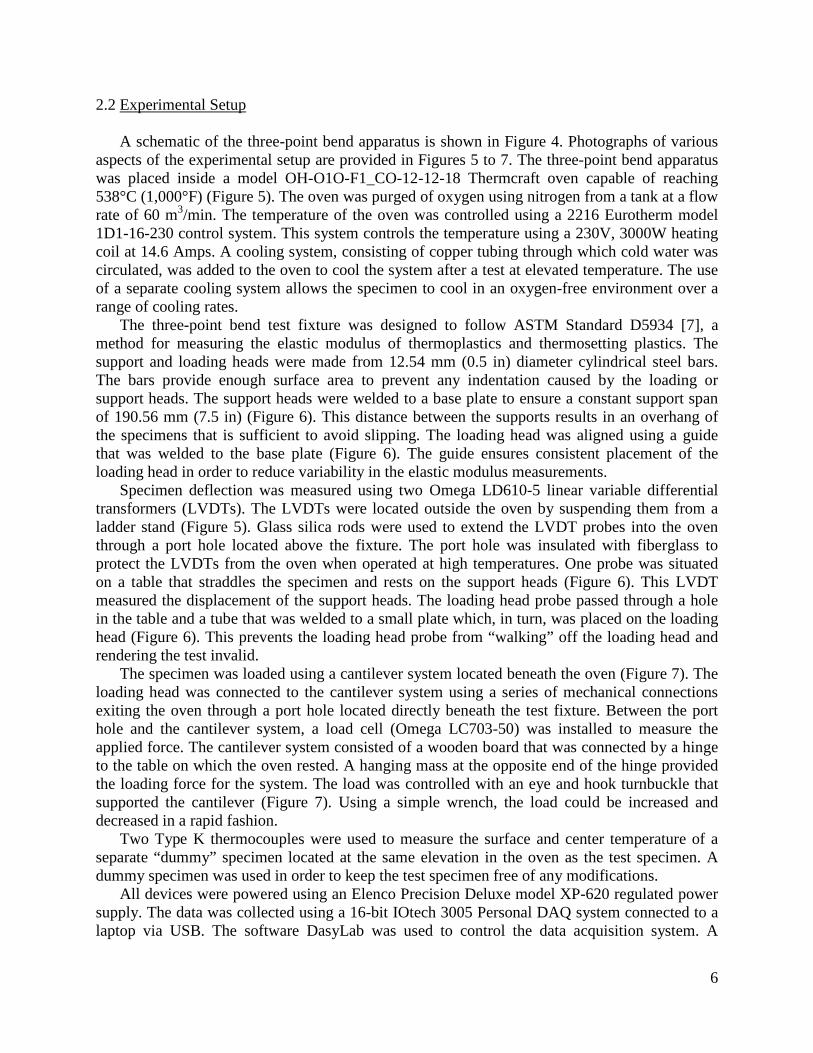
6
2.2 Experimental Setup
A schematic of the three-point bend apparatus is shown in Figure 4. Photographs of various aspects of the experimental setup are provided in Figures 5 to 7. The three-point bend apparatus was placed inside a model OH-O1O-F1_CO-12-12-18 Thermcraft oven capable of reaching 538°C (1,000°F) (Figure 5). The oven was purged of oxygen using nitrogen from a tank at a flow rate of 60 m3/min. The temperature of the oven was controlled using a 2216 Eurotherm model 1D1-16-230 control system. This system controls the temperature using a 230V, 3000W heating coil at 14.6 Amps. A cooling system, consisting of copper tubing through which cold water was circulated, was added to the oven to cool the system after a test at elevated temperature. The use of a separate cooling system allows the specimen to cool in an oxygen-free environment over a range of cooling rates.
The three-point bend test fixture was designed to follow ASTM Standard D5934 [7], a method for measuring the elastic modulus of thermoplastics and thermosetting plastics. The support and loading heads were made from 12.54 mm (0.5 in) diameter cylindrical steel bars. The bars provide enough surface area to prevent any indentation caused by the loading or support heads. The support heads were welded to a base plate to ensure a constant support span of 190.56 mm (7.5 in) (Figure 6). This distance between the supports results in an overhang of the specimens that is sufficient to avoid slipping. The loading head was aligned using a guide that was welded to the base plate (Figure 6). The guide ensures consistent placement of the loading head in order to reduce variability in the elastic modulus measurements.
Specimen deflection was measured using two Omega LD610-5 linear variable differential transformers (LVDTs). The LVDTs were located outside the oven by suspending them from a ladder stand (Figure 5). Glass silica rods were used to extend the LVDT probes into the oven through a port hole located above the fixture. The port hole was insulated with fiberglass to protect the LVDTs from the oven when operated at high temperatures. One probe was situated on a table that straddles the specimen and rests on the support heads (Figure 6). This LVDT measured the displacement of the support heads. The loading head probe passed through a hole in the table and a tube that was welded to a small plate which, in turn, was placed on the loading head (Figure 6). This prevents the loading head probe from “walking” off the loading head and rendering the test invalid.
The specimen was loaded using a cantilever system located beneath the oven (Figure 7). The loading head was connected to the cantilever system using a series of mechanical connections exiting the oven through a port hole located directly beneath the test fixture. Between the port hole and the cantilever system, a load cell (Omega LC703-50) was installed to measure the applied force. The cantilever system consisted of a wooden board that was connected by a hinge to the table on which the oven rested. A hanging mass at the opposite end of the hinge provided the loading force for the system. The load was controlled with an eye and hook turnbuckle that supported the cantilever (Figure 7). Using a simple wrench, the load could be increased and decreased in a rapid fashion.
Two Type K thermocouples were used to measure the surface and center temperature of a separate “dummy” specimen located at the same elevation in the oven as the test specimen. A dummy specimen was used in order to keep the test specimen free of any modifications.
All devices were powered using an Elenco Precision Deluxe model XP-620 regulated power supply. The data was collected using a 16-bit IOtech 3005 Personal DAQ system connected to a laptop via USB. The software DasyLab was used to control the data acquisition system. A
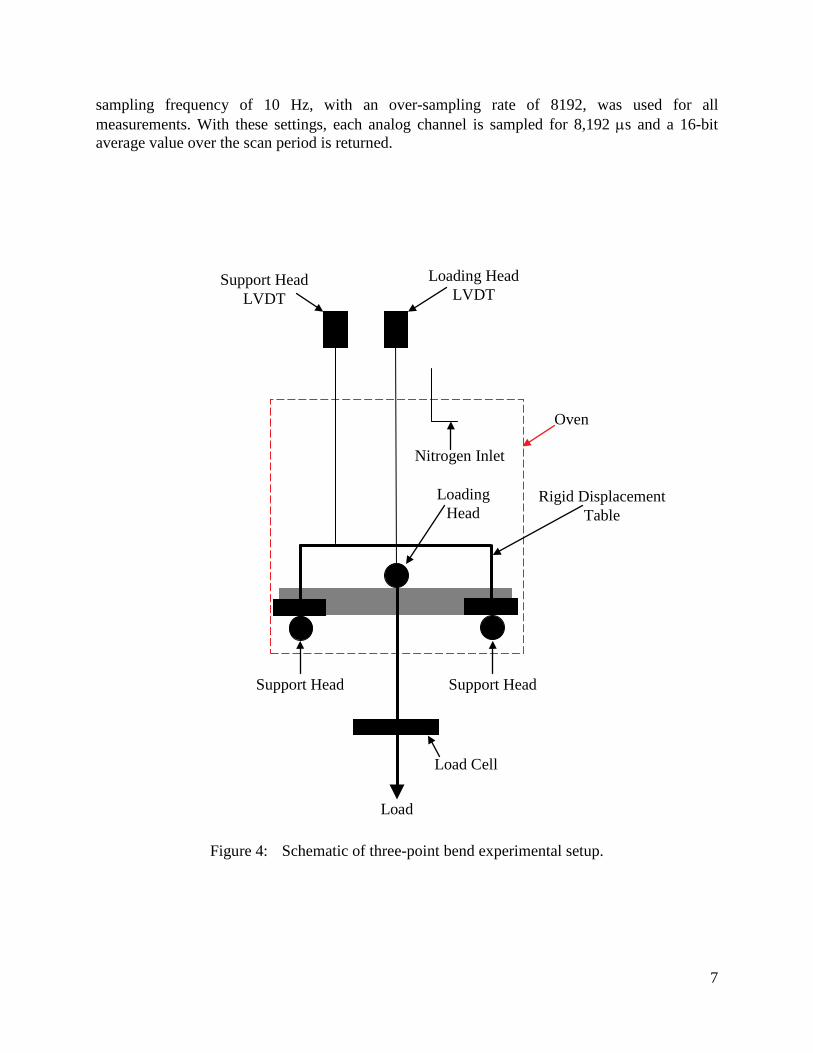
7
sampling frequency of 10 Hz, with an over-sampling rate of 8192, was used for all measurements. With these settings, each analog channel is sampled for 8,192 µs and a 16-bit average value over the scan period is returned.
Support Head LVDT
Loading Head LVDT
Oven
Rigid Displacement Table
Loading Head
Support Head
Load Cell
Support Head
Load
Nitrogen Inlet
Figure 4: Schematic of three-point bend experimental setup.
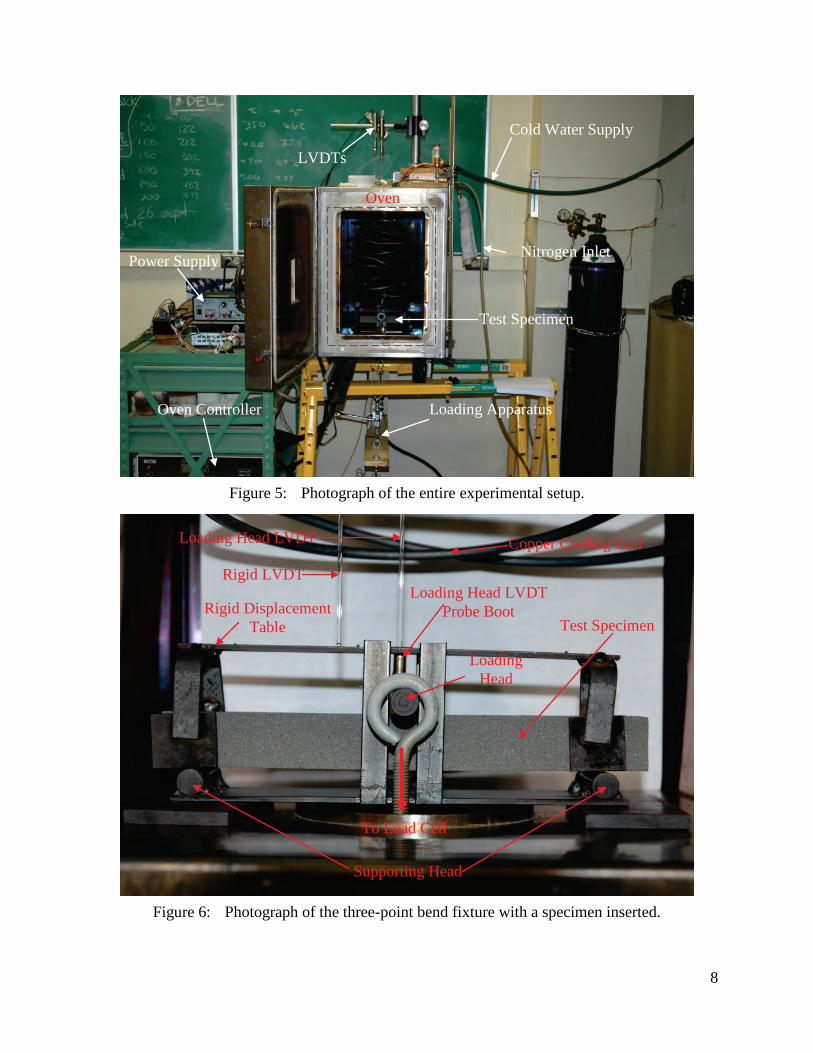
8
Loading Head LVDT
Rigid LVDT
Copper Cooling Coil
Rigid Displacement Table
Loading Head LVDT Probe Boot
Loading Head
Supporting Head
To Load Cell
Test Specimen
Figure 6: Photograph of the three-point bend fixture with a specimen inserted.
Oven Controller
LVDTs
Nitrogen Inlet
Cold Water Supply
Oven
Loading Apparatus
Test Specimen
Power Supply
Figure 5: Photograph of the entire experimental setup.
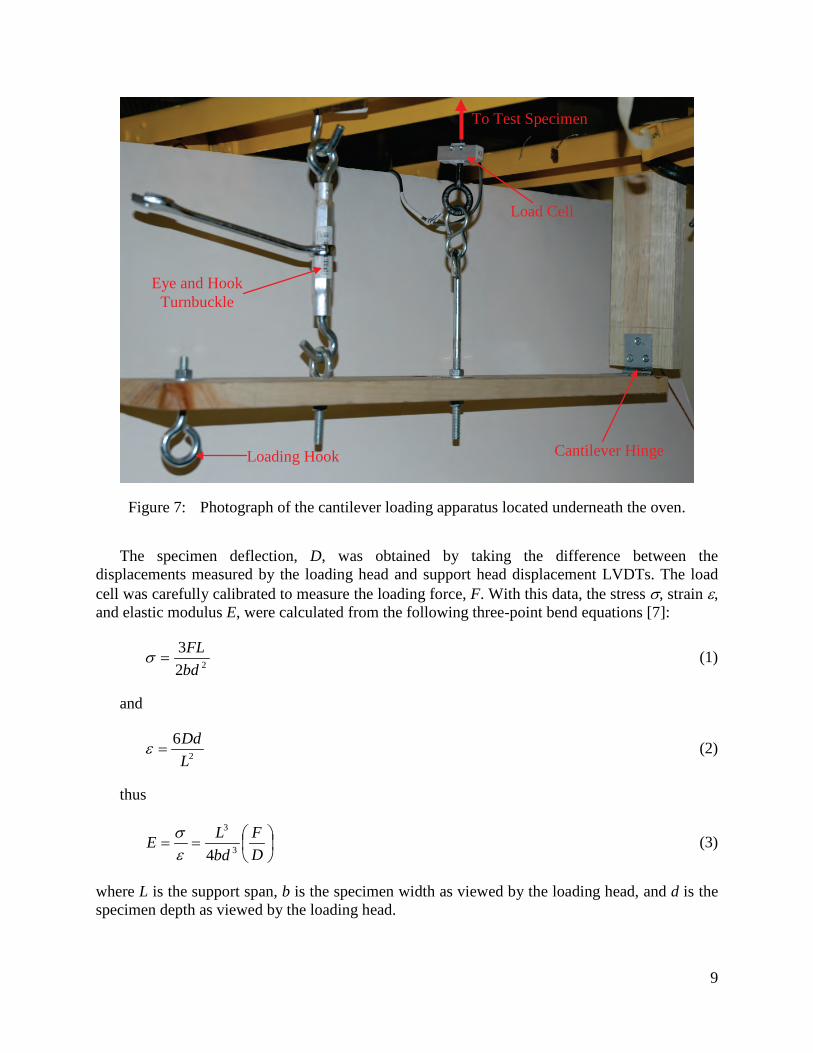
9
The specimen deflection, D, was obtained by taking the difference between the displacements measured by the loading head and support head displacement LVDTs. The load cell was carefully calibrated to measure the loading force, F. With this data, the stress σ, strain ε, and elastic modulus E, were calculated from the following three-point bend equations [7]:
(1)
and
(2)
thus
==
DF
bdLE
3
3
4εσ
(3)
where L is the support span, b is the specimen width as viewed by the loading head, and d is the specimen depth as viewed by the loading head.
22
3
bdFL
=σ
2
6
LDd
=ε
Loading Hook
Eye and Hook Turnbuckle
Cantilever Hinge
Load Cell
To Test Specimen
Figure 7: Photograph of the cantilever loading apparatus located underneath the oven.
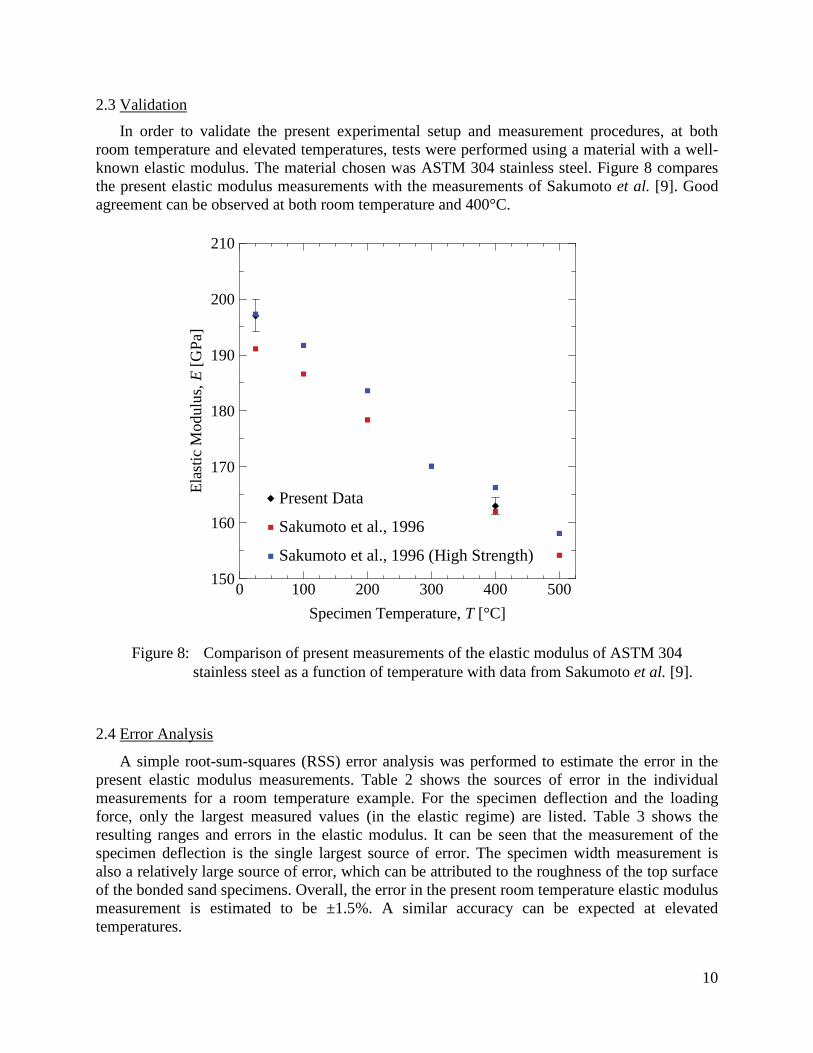
10
2.3
In order to validate the present experimental setup and measurement procedures, at both room temperature and elevated temperatures, tests were performed using a material with a well-known elastic modulus. The material chosen was ASTM 304 stainless steel. Figure 8 compares the present elastic modulus measurements with the measurements of Sakumoto et al. [9]. Good agreement can be observed at both room temperature and 400°C.
Validation
2.4
A simple root-sum-squares (RSS) error analysis was performed to estimate the error in the present elastic modulus measurements. Table 2 shows the sources of error in the individual measurements for a room temperature example. For the specimen deflection and the loading force, only the largest measured values (in the elastic regime) are listed. Table 3 shows the resulting ranges and errors in the elastic modulus. It can be seen that the measurement of the specimen deflection is the single largest source of error. The specimen width measurement is also a relatively large source of error, which can be attributed to the roughness of the top surface of the bonded sand specimens. Overall, the error in the present room temperature elastic modulus measurement is estimated to be ±1.5%. A similar accuracy can be expected at elevated temperatures.
Error Analysis
Specimen Temperature, T [°C]
Ela
stic
Mod
ulus
,E[G
Pa]
0 100 200 300 400 500150
160
170
180
190
200
210
Present Data
Sakumoto et al., 1996
Sakumoto et al., 1996 (High Strength)
Figure 8: Comparison of present measurements of the elastic modulus of ASTM 304 stainless steel as a function of temperature with data from Sakumoto et al. [9].
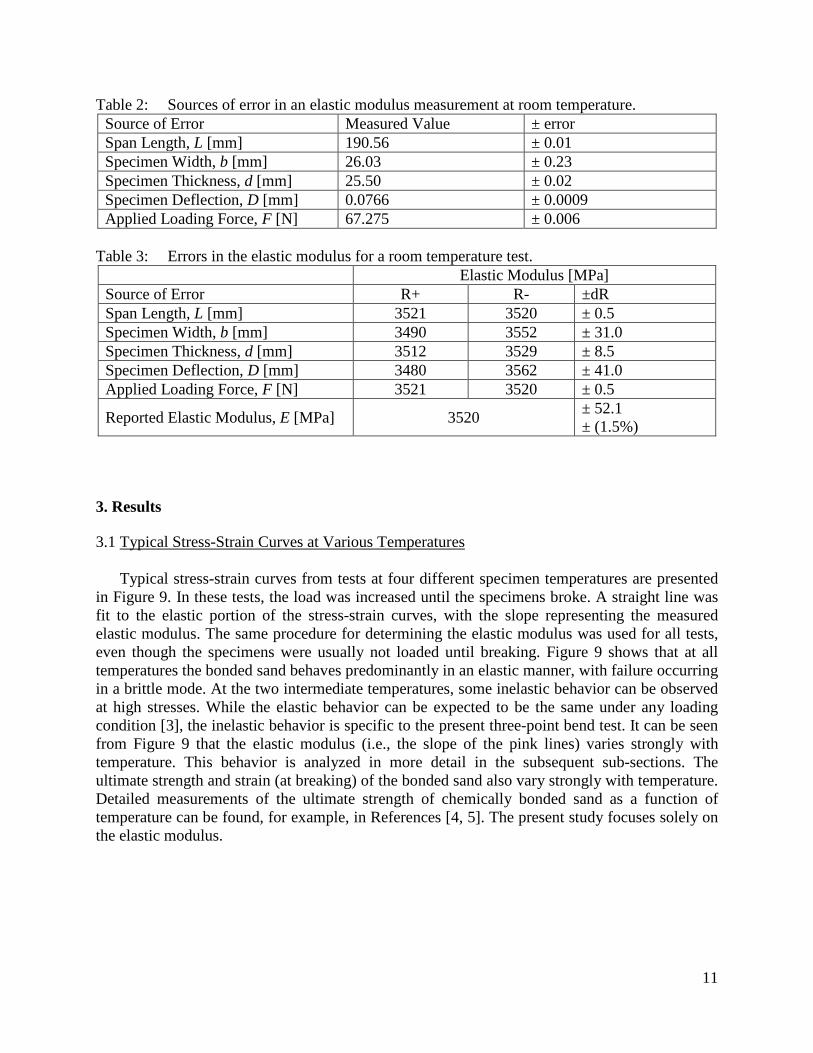
11
Table 2: Sources of error in an elastic modulus measurement at room temperature. Source of Error Measured Value ± error Span Length, L [mm] 190.56 ± 0.01 Specimen Width, b [mm] 26.03 ± 0.23 Specimen Thickness, d [mm] 25.50 ± 0.02 Specimen Deflection, D [mm] 0.0766 ± 0.0009 Applied Loading Force, F [N] 67.275 ± 0.006
Table 3: Errors in the elastic modulus for a room temperature test.
Elastic Modulus [MPa] Source of Error R+ R- ±dR Span Length, L [mm] 3521 3520 ± 0.5 Specimen Width, b [mm] 3490 3552 ± 31.0 Specimen Thickness, d [mm] 3512 3529 ± 8.5 Specimen Deflection, D [mm] 3480 3562 ± 41.0 Applied Loading Force, F [N] 3521 3520 ± 0.5
Reported Elastic Modulus, E [MPa] 3520 ± 52.1 ± (1.5%)
3. Results
3.1 Typical Stress-Strain Curves at Various Temperatures
Typical stress-strain curves from tests at four different specimen temperatures are presented in Figure 9. In these tests, the load was increased until the specimens broke. A straight line was fit to the elastic portion of the stress-strain curves, with the slope representing the measured elastic modulus. The same procedure for determining the elastic modulus was used for all tests, even though the specimens were usually not loaded until breaking. Figure 9 shows that at all temperatures the bonded sand behaves predominantly in an elastic manner, with failure occurring in a brittle mode. At the two intermediate temperatures, some inelastic behavior can be observed at high stresses. While the elastic behavior can be expected to be the same under any loading condition [3], the inelastic behavior is specific to the present three-point bend test. It can be seen from Figure 9 that the elastic modulus (i.e., the slope of the pink lines) varies strongly with temperature. This behavior is analyzed in more detail in the subsequent sub-sections. The ultimate strength and strain (at breaking) of the bonded sand also vary strongly with temperature. Detailed measurements of the ultimate strength of chemically bonded sand as a function of temperature can be found, for example, in References [4, 5]. The present study focuses solely on the elastic modulus.
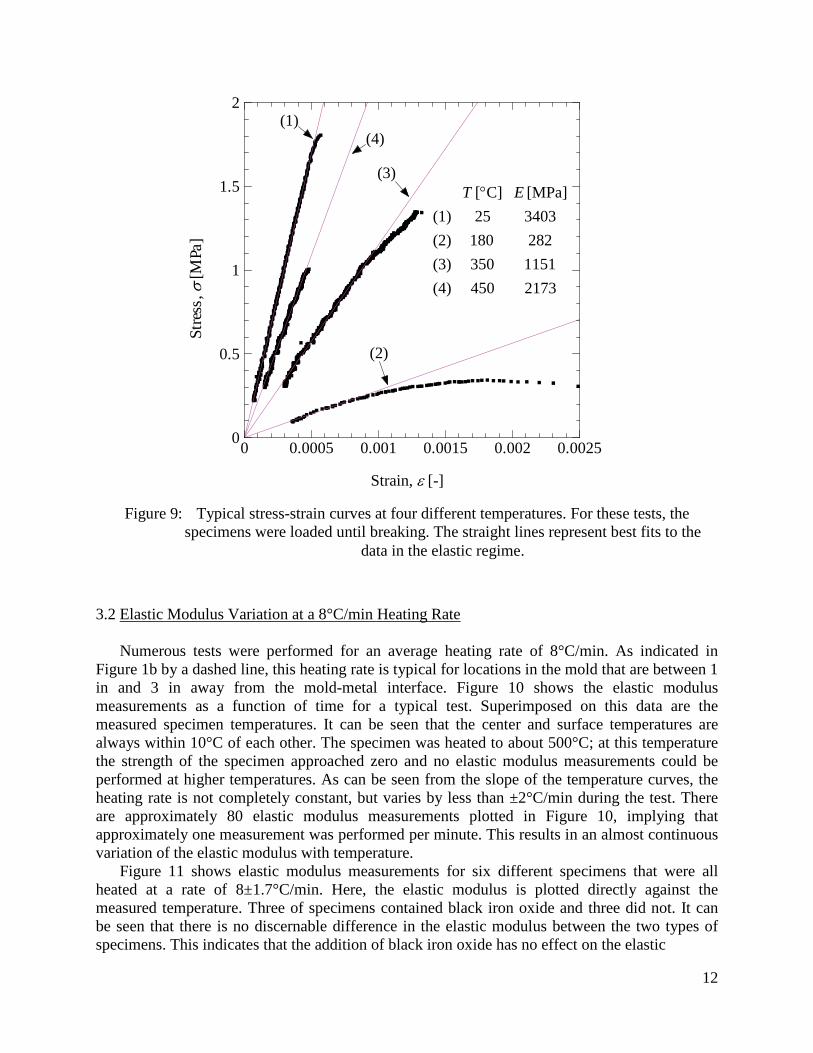
12
3.2 Elastic Modulus Variation at a 8°C/min Heating Rate
Numerous tests were performed for an average heating rate of 8°C/min. As indicated in Figure 1b by a dashed line, this heating rate is typical for locations in the mold that are between 1 in and 3 in away from the mold-metal interface. Figure 10 shows the elastic modulus measurements as a function of time for a typical test. Superimposed on this data are the measured specimen temperatures. It can be seen that the center and surface temperatures are always within 10°C of each other. The specimen was heated to about 500°C; at this temperature the strength of the specimen approached zero and no elastic modulus measurements could be performed at higher temperatures. As can be seen from the slope of the temperature curves, the heating rate is not completely constant, but varies by less than ±2°C/min during the test. There are approximately 80 elastic modulus measurements plotted in Figure 10, implying that approximately one measurement was performed per minute. This results in an almost continuous variation of the elastic modulus with temperature.
Figure 11 shows elastic modulus measurements for six different specimens that were all heated at a rate of 8±1.7°C/min. Here, the elastic modulus is plotted directly against the measured temperature. Three of specimens contained black iron oxide and three did not. It can be seen that there is no discernable difference in the elastic modulus between the two types of specimens. This indicates that the addition of black iron oxide has no effect on the elastic
Stre
ss, σ
[MPa
]
Strain, ε [-]
Figure 9: Typical stress-strain curves at four different temperatures. For these tests, the specimens were loaded until breaking. The straight lines represent best fits to the
data in the elastic regime.
0 0.0005 0.001 0.0015 0.002 0.00250
0.5
1
1.5
2
(3)
(1)
(2)
(4)
2173450(4)
1151350(3)
282180(2)
340325(1)
[MPa] C][ ET °
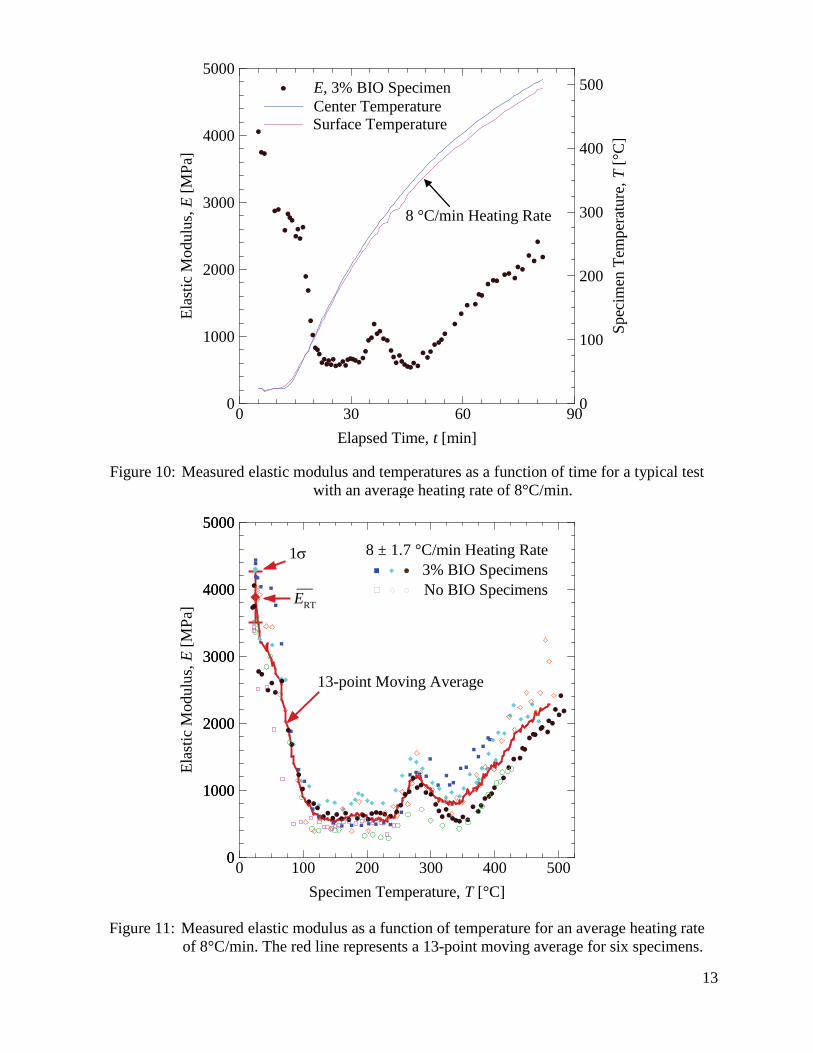
13
Figure 11: Measured elastic modulus as a function of temperature for an average heating rate of 8°C/min. The red line represents a 13-point moving average for six specimens.
Specimen Temperature, T [°C]
Ela
stic
Mod
ulus
,E[M
Pa]
0 100 200 300 400 5000
1000
2000
3000
4000
5000
0
1000
2000
3000
4000
5000
8 ± 1.7 °C/min Heating Rate3% BIO SpecimensNo BIO Specimens
13-point Moving Average
1σ
__ERT
Figure 10: Measured elastic modulus and temperatures as a function of time for a typical test with an average heating rate of 8°C/min.
Elapsed Time, t [min]
Ela
stic
Mod
ulus
,E[M
Pa]
Spe
cim
enT
empe
ratu
re,T
[°C
]
0 30 60 900
1000
2000
3000
4000
5000
0
100
200
300
400
500E, 3% BIO Specimen Center Temperature Surface Temperature
8 °C/min Heating Rate
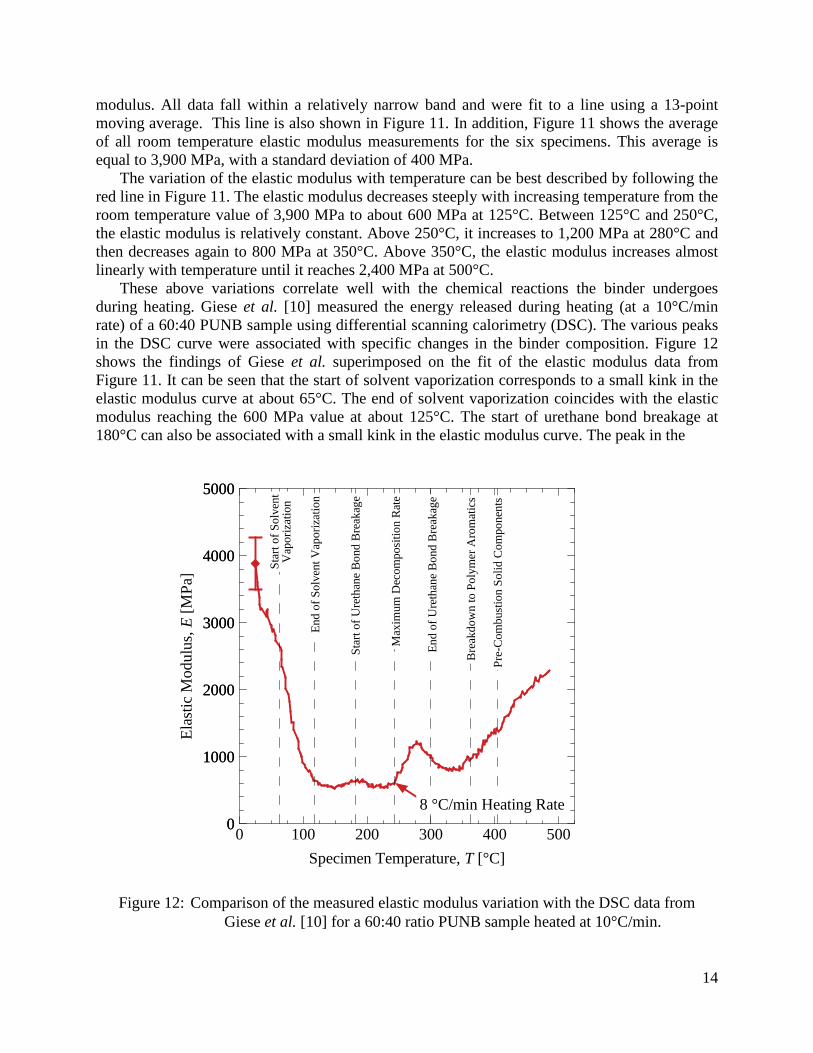
14
modulus. All data fall within a relatively narrow band and were fit to a line using a 13-point moving average. This line is also shown in Figure 11. In addition, Figure 11 shows the average of all room temperature elastic modulus measurements for the six specimens. This average is equal to 3,900 MPa, with a standard deviation of 400 MPa.
The variation of the elastic modulus with temperature can be best described by following the red line in Figure 11. The elastic modulus decreases steeply with increasing temperature from the room temperature value of 3,900 MPa to about 600 MPa at 125°C. Between 125°C and 250°C, the elastic modulus is relatively constant. Above 250°C, it increases to 1,200 MPa at 280°C and then decreases again to 800 MPa at 350°C. Above 350°C, the elastic modulus increases almost linearly with temperature until it reaches 2,400 MPa at 500°C.
These above variations correlate well with the chemical reactions the binder undergoes during heating. Giese et al. [10] measured the energy released during heating (at a 10°C/min rate) of a 60:40 PUNB sample using differential scanning calorimetry (DSC). The various peaks in the DSC curve were associated with specific changes in the binder composition. Figure 12 shows the findings of Giese et al. superimposed on the fit of the elastic modulus data from Figure 11. It can be seen that the start of solvent vaporization corresponds to a small kink in the elastic modulus curve at about 65°C. The end of solvent vaporization coincides with the elastic modulus reaching the 600 MPa value at about 125°C. The start of urethane bond breakage at 180°C can also be associated with a small kink in the elastic modulus curve. The peak in the
Specimen Temperature, T [°C]
Ela
stic
Mod
ulus
,E[M
Pa]
0 100 200 300 400 5000
1000
2000
3000
4000
5000
0
1000
2000
3000
4000
5000
8 °C/min Heating Rate
Sta
rtof
Sol
vent
Vap
oriz
atio
n
End
ofS
olve
ntV
apor
izat
ion
Sta
rtof
Ure
than
eB
ond
Bre
akag
e
Max
imum
Dec
ompo
sitio
nR
ate
End
ofU
reth
ane
Bon
dB
reak
age
Bre
akdo
wn
toP
olym
erA
rom
atic
s
Pre
-Com
bust
ion
Sol
idC
ompo
nent
s
Figure 12: Comparison of the measured elastic modulus variation with the DSC data from Giese et al. [10] for a 60:40 ratio PUNB sample heated at 10°C/min.
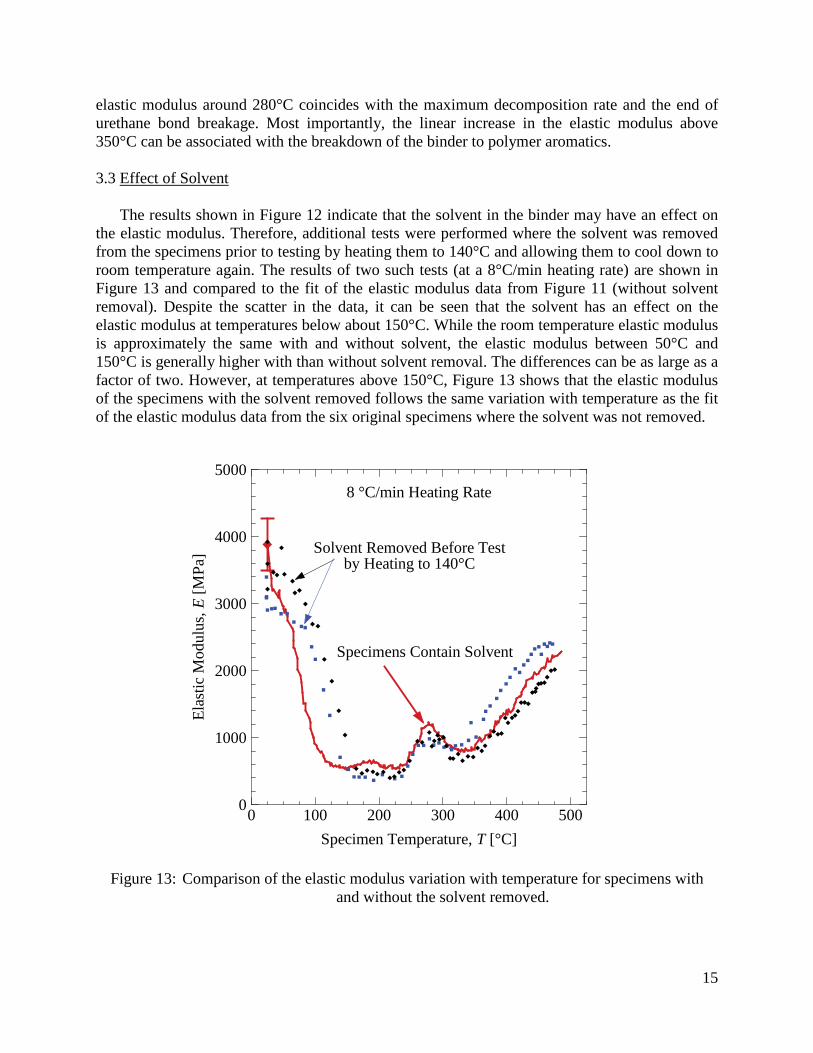
15
elastic modulus around 280°C coincides with the maximum decomposition rate and the end of urethane bond breakage. Most importantly, the linear increase in the elastic modulus above 350°C can be associated with the breakdown of the binder to polymer aromatics. 3.3 Effect of Solvent
The results shown in Figure 12 indicate that the solvent in the binder may have an effect on the elastic modulus. Therefore, additional tests were performed where the solvent was removed from the specimens prior to testing by heating them to 140°C and allowing them to cool down to room temperature again. The results of two such tests (at a 8°C/min heating rate) are shown in Figure 13 and compared to the fit of the elastic modulus data from Figure 11 (without solvent removal). Despite the scatter in the data, it can be seen that the solvent has an effect on the elastic modulus at temperatures below about 150°C. While the room temperature elastic modulus is approximately the same with and without solvent, the elastic modulus between 50°C and 150°C is generally higher with than without solvent removal. The differences can be as large as a factor of two. However, at temperatures above 150°C, Figure 13 shows that the elastic modulus of the specimens with the solvent removed follows the same variation with temperature as the fit of the elastic modulus data from the six original specimens where the solvent was not removed.
Figure 13: Comparison of the elastic modulus variation with temperature for specimens with and without the solvent removed.
Specimen Temperature, T [°C]
Ela
stic
Mod
ulus
,E[M
Pa]
0 100 200 300 400 5000
1000
2000
3000
4000
5000
Solvent Removed Before Testby Heating to 140°C
8 °C/min Heating Rate
Specimens Contain Solvent
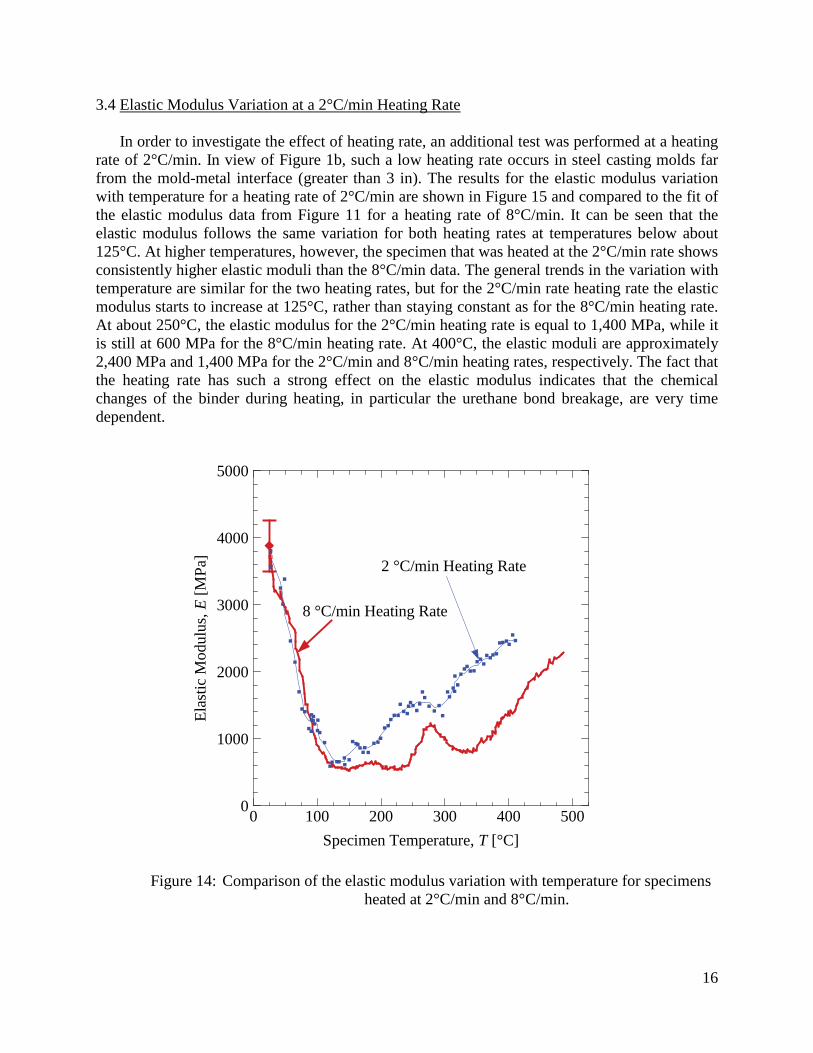
16
3.4 Elastic Modulus Variation at a 2°C/min Heating Rate
In order to investigate the effect of heating rate, an additional test was performed at a heating rate of 2°C/min. In view of Figure 1b, such a low heating rate occurs in steel casting molds far from the mold-metal interface (greater than 3 in). The results for the elastic modulus variation with temperature for a heating rate of 2°C/min are shown in Figure 15 and compared to the fit of the elastic modulus data from Figure 11 for a heating rate of 8°C/min. It can be seen that the elastic modulus follows the same variation for both heating rates at temperatures below about 125°C. At higher temperatures, however, the specimen that was heated at the 2°C/min rate shows consistently higher elastic moduli than the 8°C/min data. The general trends in the variation with temperature are similar for the two heating rates, but for the 2°C/min rate heating rate the elastic modulus starts to increase at 125°C, rather than staying constant as for the 8°C/min heating rate. At about 250°C, the elastic modulus for the 2°C/min heating rate is equal to 1,400 MPa, while it is still at 600 MPa for the 8°C/min heating rate. At 400°C, the elastic moduli are approximately 2,400 MPa and 1,400 MPa for the 2°C/min and 8°C/min heating rates, respectively. The fact that the heating rate has such a strong effect on the elastic modulus indicates that the chemical changes of the binder during heating, in particular the urethane bond breakage, are very time dependent.
Specimen Temperature, T [°C]
Ela
stic
Mod
ulus
,E[M
Pa]
0 100 200 300 400 5000
1000
2000
3000
4000
5000
2 °C/min Heating Rate
8 °C/min Heating Rate
Figure 14: Comparison of the elastic modulus variation with temperature for specimens heated at 2°C/min and 8°C/min.
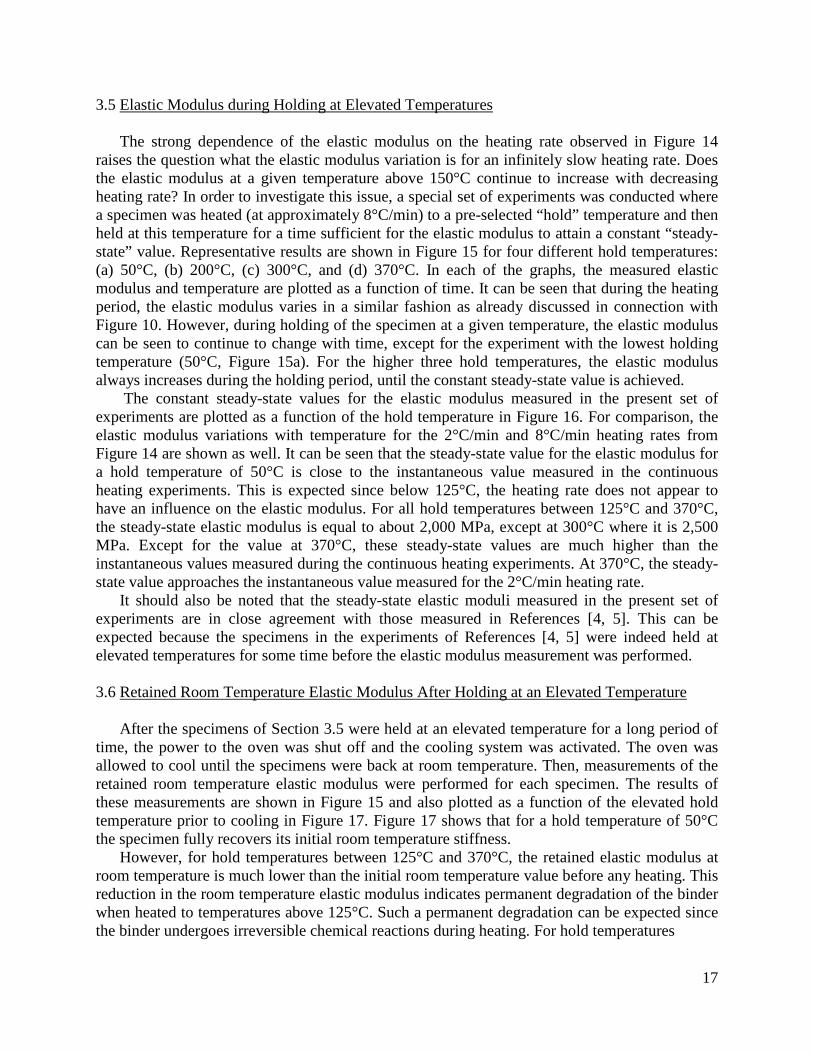
17
3.5 Elastic Modulus during Holding at Elevated Temperatures
The strong dependence of the elastic modulus on the heating rate observed in Figure 14 raises the question what the elastic modulus variation is for an infinitely slow heating rate. Does the elastic modulus at a given temperature above 150°C continue to increase with decreasing heating rate? In order to investigate this issue, a special set of experiments was conducted where a specimen was heated (at approximately 8°C/min) to a pre-selected “hold” temperature and then held at this temperature for a time sufficient for the elastic modulus to attain a constant “steady-state” value. Representative results are shown in Figure 15 for four different hold temperatures: (a) 50°C, (b) 200°C, (c) 300°C, and (d) 370°C. In each of the graphs, the measured elastic modulus and temperature are plotted as a function of time. It can be seen that during the heating period, the elastic modulus varies in a similar fashion as already discussed in connection with Figure 10. However, during holding of the specimen at a given temperature, the elastic modulus can be seen to continue to change with time, except for the experiment with the lowest holding temperature (50°C, Figure 15a). For the higher three hold temperatures, the elastic modulus always increases during the holding period, until the constant steady-state value is achieved.
The constant steady-state values for the elastic modulus measured in the present set of experiments are plotted as a function of the hold temperature in Figure 16. For comparison, the elastic modulus variations with temperature for the 2°C/min and 8°C/min heating rates from Figure 14 are shown as well. It can be seen that the steady-state value for the elastic modulus for a hold temperature of 50°C is close to the instantaneous value measured in the continuous heating experiments. This is expected since below 125°C, the heating rate does not appear to have an influence on the elastic modulus. For all hold temperatures between 125°C and 370°C, the steady-state elastic modulus is equal to about 2,000 MPa, except at 300°C where it is 2,500 MPa. Except for the value at 370°C, these steady-state values are much higher than the instantaneous values measured during the continuous heating experiments. At 370°C, the steady-state value approaches the instantaneous value measured for the 2°C/min heating rate.
It should also be noted that the steady-state elastic moduli measured in the present set of experiments are in close agreement with those measured in References [4, 5]. This can be expected because the specimens in the experiments of References [4, 5] were indeed held at elevated temperatures for some time before the elastic modulus measurement was performed. 3.6 Retained Room Temperature Elastic Modulus After Holding at an Elevated Temperature
After the specimens of Section 3.5 were held at an elevated temperature for a long period of time, the power to the oven was shut off and the cooling system was activated. The oven was allowed to cool until the specimens were back at room temperature. Then, measurements of the retained room temperature elastic modulus were performed for each specimen. The results of these measurements are shown in Figure 15 and also plotted as a function of the elevated hold temperature prior to cooling in Figure 17. Figure 17 shows that for a hold temperature of 50°C the specimen fully recovers its initial room temperature stiffness.
However, for hold temperatures between 125°C and 370°C, the retained elastic modulus at room temperature is much lower than the initial room temperature value before any heating. This reduction in the room temperature elastic modulus indicates permanent degradation of the binder when heated to temperatures above 125°C. Such a permanent degradation can be expected since the binder undergoes irreversible chemical reactions during heating. For hold temperatures
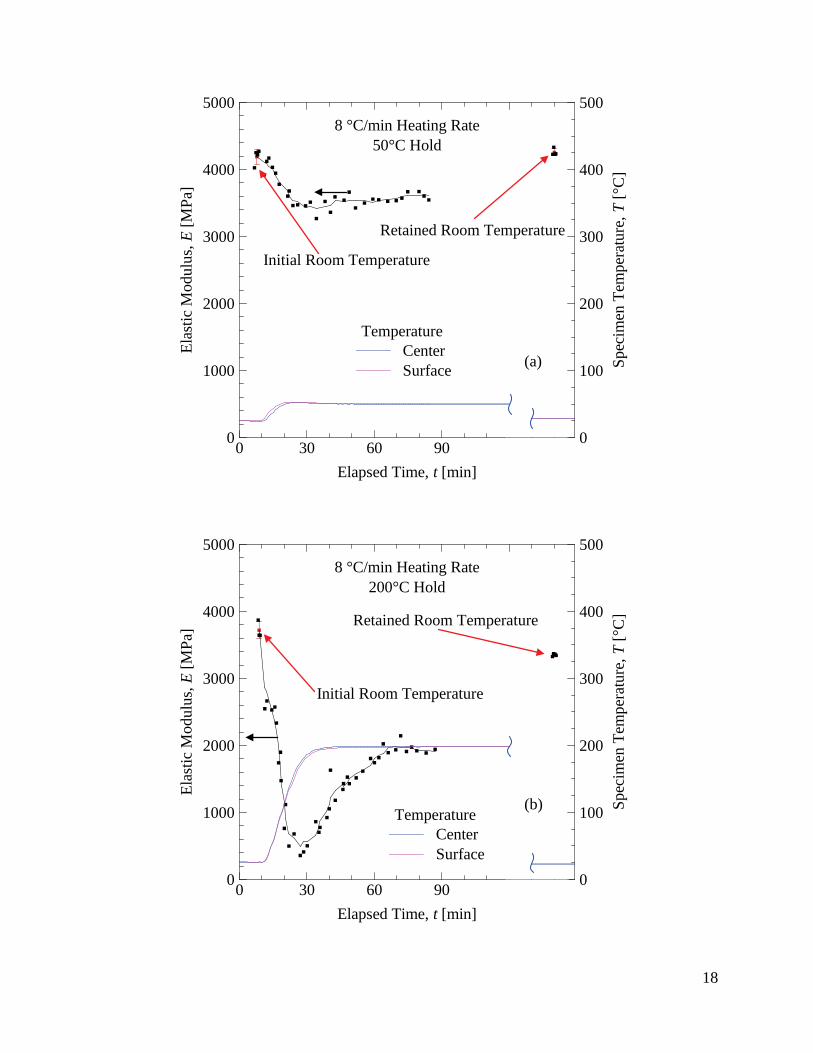
18
Elapsed Time, t [min]
Ela
stic
Mod
ulus
,E[M
Pa]
Spe
cim
enT
empe
ratu
re,T
[°C
]
0 30 60 90 1200
1000
2000
3000
4000
5000
0
100
200
300
400
500
Elapsed Time, t [min]
Ela
stic
Mod
ulus
,E[M
Pa]
Spe
cim
enT
empe
ratu
re,T
[°C
]
0 30 60 90 1200
1000
2000
3000
4000
5000
0
100
200
300
400
500
Initial Room Temperature
Retained Room Temperature
CenterSurface
Temperature
(a)
Initial Room Temperature
Retained Room Temperature
8 °C/min Heating Rate200°C Hold
CenterSurface
Temperature (b)
8 °C/min Heating Rate50°C Hold
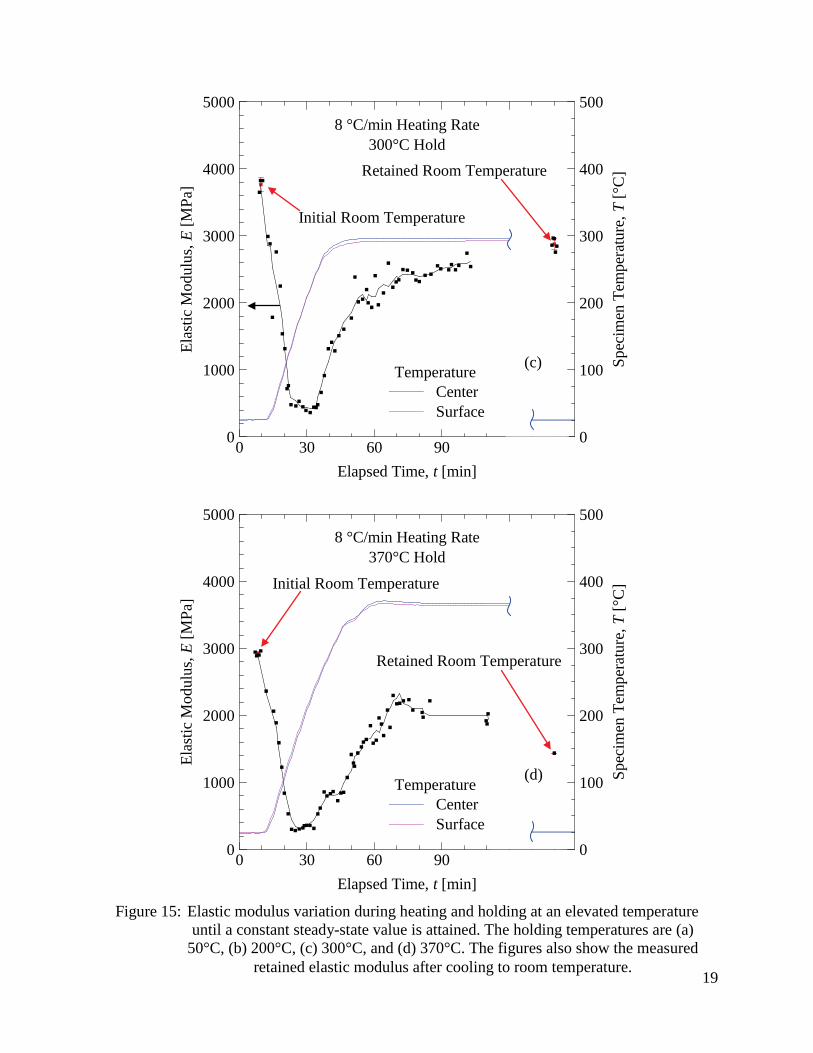
19
Figure 15: Elastic modulus variation during heating and holding at an elevated temperature until a constant steady-state value is attained. The holding temperatures are (a)
50°C, (b) 200°C, (c) 300°C, and (d) 370°C. The figures also show the measured retained elastic modulus after cooling to room temperature.
Elapsed Time, t [min]
Ela
stic
Mod
ulus
,E[M
Pa]
Spe
cim
enT
empe
ratu
re,T
[°C
]
0 30 60 90 1200
1000
2000
3000
4000
5000
0
100
200
300
400
500
Elapsed Time, t [min]
Ela
stic
Mod
ulus
,E[M
Pa]
Spe
cim
enT
empe
ratu
re,T
[°C
]
0 30 60 90 1200
1000
2000
3000
4000
5000
0
100
200
300
400
500
Initial Room Temperature
Retained Room Temperature
CenterSurface
Temperature (c)
Initial Room Temperature
Retained Room Temperature
8 °C/min Heating Rate
370°C Hold
CenterSurface
Temperature (d)
8 °C/min Heating Rate300°C Hold
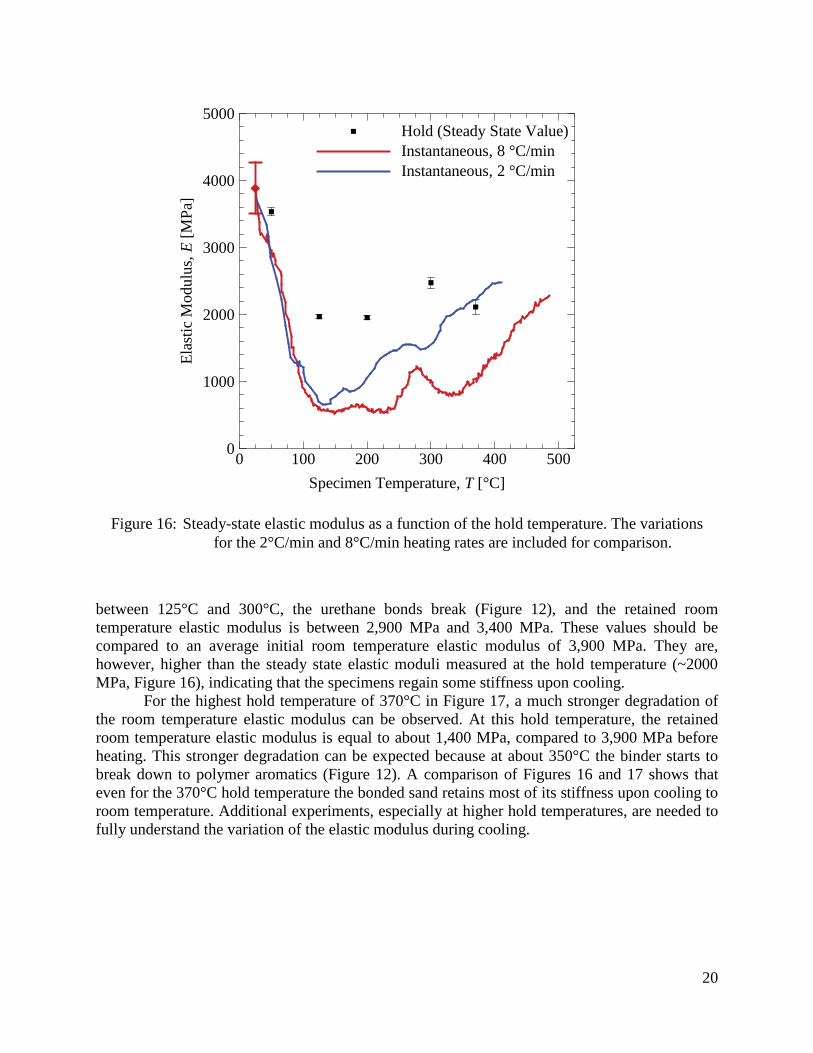
20
between 125°C and 300°C, the urethane bonds break (Figure 12), and the retained room temperature elastic modulus is between 2,900 MPa and 3,400 MPa. These values should be compared to an average initial room temperature elastic modulus of 3,900 MPa. They are, however, higher than the steady state elastic moduli measured at the hold temperature (~2000 MPa, Figure 16), indicating that the specimens regain some stiffness upon cooling.
For the highest hold temperature of 370°C in Figure 17, a much stronger degradation of the room temperature elastic modulus can be observed. At this hold temperature, the retained room temperature elastic modulus is equal to about 1,400 MPa, compared to 3,900 MPa before heating. This stronger degradation can be expected because at about 350°C the binder starts to break down to polymer aromatics (Figure 12). A comparison of Figures 16 and 17 shows that even for the 370°C hold temperature the bonded sand retains most of its stiffness upon cooling to room temperature. Additional experiments, especially at higher hold temperatures, are needed to fully understand the variation of the elastic modulus during cooling.
Figure 16: Steady-state elastic modulus as a function of the hold temperature. The variations for the 2°C/min and 8°C/min heating rates are included for comparison.
Specimen Temperature, T [°C]
Ela
stic
Mod
ulus
,E[M
Pa]
0 100 200 300 400 5000
1000
2000
3000
4000
5000Hold (Steady State Value)Instantaneous, 8 °C/minInstantaneous, 2 °C/min
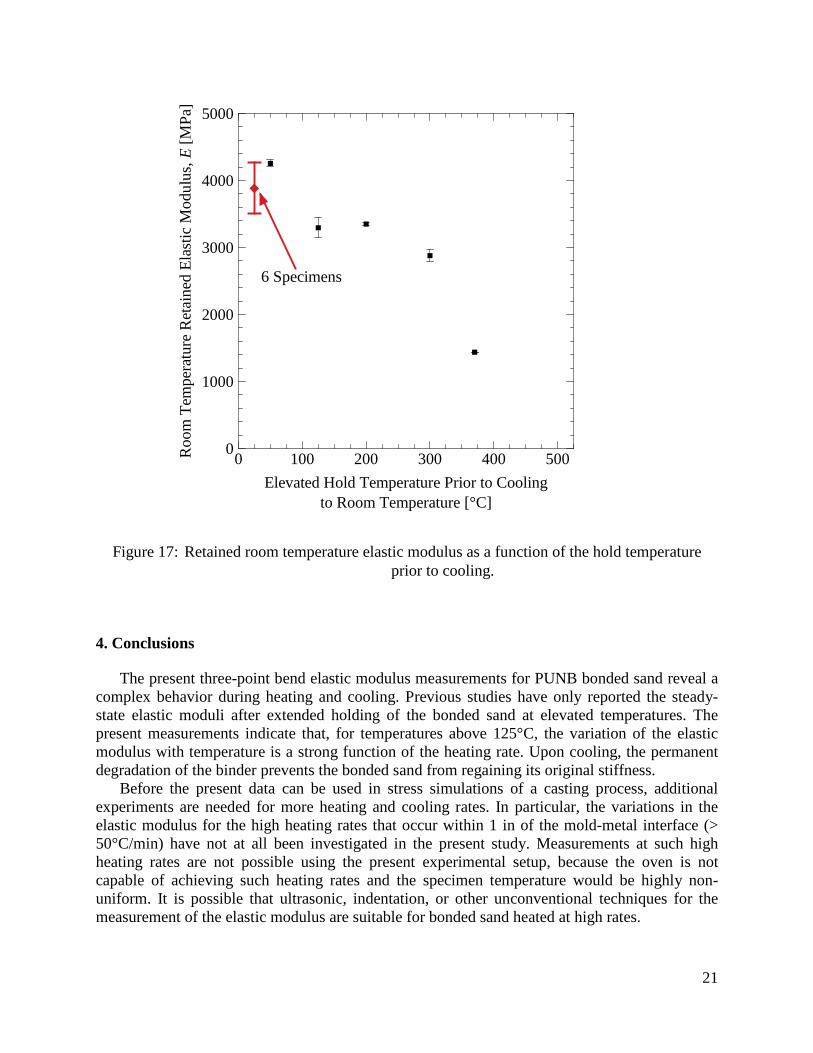
21
4. Conclusions
The present three-point bend elastic modulus measurements for PUNB bonded sand reveal a complex behavior during heating and cooling. Previous studies have only reported the steady-state elastic moduli after extended holding of the bonded sand at elevated temperatures. The present measurements indicate that, for temperatures above 125°C, the variation of the elastic modulus with temperature is a strong function of the heating rate. Upon cooling, the permanent degradation of the binder prevents the bonded sand from regaining its original stiffness.
Before the present data can be used in stress simulations of a casting process, additional experiments are needed for more heating and cooling rates. In particular, the variations in the elastic modulus for the high heating rates that occur within 1 in of the mold-metal interface (> 50°C/min) have not at all been investigated in the present study. Measurements at such high heating rates are not possible using the present experimental setup, because the oven is not capable of achieving such heating rates and the specimen temperature would be highly non-uniform. It is possible that ultrasonic, indentation, or other unconventional techniques for the measurement of the elastic modulus are suitable for bonded sand heated at high rates.
Figure 17: Retained room temperature elastic modulus as a function of the hold temperature prior to cooling.
Roo
mT
empe
ratu
reR
etai
ned
Ela
stic
Mod
ulus
,E[M
Pa]
0 100 200 300 400 5000
1000
2000
3000
4000
5000
6 Specimens
Elevated Hold Temperature Prior to Coolingto Room Temperature [°C]
22
Acknowledgements
This article is based upon work supported by the U.S. Department of Energy under Award No. DE-FC36-04GO14230. The authors would like to thank the Steel Founders’ Society of America for their support of this work. The authors would also like to express their gratitude to Mr. Jerry Thiel and staff of the University of Northern Iowa for their help with making the dump box and test specimens, and to Prof. Colby Swan of the University of Iowa for the use of lab space and equipment.
References
1. Monroe, C.A., Beckermann, C., and Klinkhammer, J., "Simulation of Deformation and Hot Tear Formation Using a Visco-Plastic Model with Damage," in Modeling of Casting, Welding, and Advanced Solidification Processes - XII, eds. S.L. Cockcroft and D.M. Maijer, TMS, Warrendale, PA, 2009, pp. 313-320.
2. P.J. Ahearn, F. Quigley, J.I. Bluhm, and J.F. Wallace, “Some Considerations On The Tensile And Transverse Strength Testing Of Shell Mold And Core Sands,” AFS Transactions, vol. 64, 1956, pp. 125-132.
3. F. Quigley, P.J. Ahearn, and J.F. Wallace, “Influence Of Various Bonding Materials On Stress-Strain Characteristics Of Bonded Sands,” AFS Transactions, vol. 65, 1957, pp 319-322.
4. “Final Report,” Arbeitsgemeinschaft Industrieller Forschungsvereinigungen Otto von Guericke, e.V. (AiF), 2008.
5. J. Thiel, “High Temperature Physical Properties of Chemically Bonded Sands Provide Insight into Core Distortion,” Proc. 62nd SFSA Technical and Operating Conference, Chicago, Illinois, December 2008.
6. ASTM Standard C1211, 2002 (2008), “Standard Test Method for Flexural Strength of Advanced Ceramics at Elevated Temperatures,” ASTM International, West Conshohocken, PA, 2008, DOI: 10.1520/C1211-02R08, www.astm.org.
7. ASTM Standard D5934, 2002 “Standard Test Method for Determination of Modulus of Elasticity for Rigid and Semi-Rigid Plastic Specimens by Controlled Rate of Loading Using Three-Point Bending,” ASTM International, West Conshohocken, PA, 2002, DOI: 10.1520/D5934-02, www.astm.org.
8. R.L. Naro and J.F. Hart, “Phenolic Urethane No-Bake Binders: Ten Years of Progress,” AFS Transactions, vol. 88, 1980, pp 57-66.
9. Y. Sakumoto, T. Nakazato, and A. Matsuzaki, “High-Temperature Properties of Stainless Steel for Building Structures,” Journal of Structural Engineering, vol. 122, n 4, pp. 399-406, April 1996.
10. S.R. Giese, S.C. Roorda, and M.A. Patterson, “Thermal Analysis of Phenolic Urethane Binder and Correlated Properties,” AFS Transactions, vol. 117, 2009, Paper# 09-112.