Final Report - Washington State Institute for Public...
20
The Washington State legislature directed the Washington State Institute for Public Policy (WSIPP) to develop “a repository of research and evaluations of the cost-benefits of various K–12 educational programs and services.” 1 In this report, we analyze a K–12 policy question: do the long-term benefits of full-day kindergarten (in comparison with half-day) outweigh the costs? We researched this question by reviewing all credible evaluation studies from the United States and elsewhere. We systematically analyzed the studies to estimate whether full-day kindergarten has a cause-and-effect relationship with student outcomes. We then calculated whether the long- term monetary benefits of full-day kindergarten exceed the operating and capital costs. In this report, we describe our research approach and highlight our findings on full-day kindergarten. An appendix provides technical details. 1 Engrossed Substitute Senate Bill 6386, Chapter 372, Laws of 2006. January 2014 Full-Day Kindergarten: A Review of the Evidence and Benefit-Cost Analysis Summary WSIPP updated its 2007 analysis of the research evidence regarding full-day kindergarten. Over half of Washington’s public school kindergarteners attend full-day programs, and the state is expanding funding for this option. In this report, we analyze average impacts on student outcomes from full-day kindergarten across the United States and elsewhere. We also examine whether benefits are likely to exceed costs. To investigate, we conducted a systematic review of research by collecting all studies we could find on the topic. We screened for scientific rigor and only analyzed studies with strong research methods. We identified ten credible evaluations of full-day kindergarten’s cause-and-effect relationship with student test score outcomes. The studies estimate the relative impact of full-day in comparison with half-day programs. Improvement in standardized test scores was the only outcome measured in the studies that we reviewed. Other outcomes of interest such as social and emotional learning and high school graduation have not been examined consistently in the research literature. Our bottom-line findings. Full-day kindergarten leads to higher standardized test scores than half- day programs, but this effect appears to fade out within a few years. More information about how to sustain the early gains from investments in full-day kindergarten is needed as Washington State continues to expand this option for public school students. 110 Fifth Avenue SE, Suite 214 ● PO Box 40999 ● Olympia, WA 98504 ● 360.586.2677 ● www.wsipp.wa.gov Washington State Institute for Public Policy Suggested citation: Kay, N. & Pennucci, A. (2014). Full-day kindergarten: A review of the evidence and benefit-cost analysis (Doc. No. 14-01-2202). Olympia: Washington State Institute for Public Policy.
Transcript of Final Report - Washington State Institute for Public...
110 Fifth Avenue SE, Suite 214 ● PO Box 40999 ● Olympia, WA 98504 ● 360.586.2677 ● www.wsipp.wa.gov
The Washington State legislature directed the
Washington State Institute for Public Policy
(WSIPP) to develop “a repository of research and
evaluations of the cost-benefits of various K–12
educational programs and services.” 1
In this report, we analyze a K–12 policy question:
do the long-term benefits of full-day kindergarten
(in comparison with half-day) outweigh the costs?
We researched this question by reviewing all
credible evaluation studies from the United States
and elsewhere. We systematically analyzed the
studies to estimate whether full-day kindergarten
has a cause-and-effect relationship with student
outcomes. We then calculated whether the long-
term monetary benefits of full-day kindergarten
exceed the operating and capital costs.
In this report, we describe our research approach
and highlight our findings on full-day
kindergarten. An appendix provides technical
details.
1 Engrossed Substitute Senate Bill 6386, Chapter 372, Laws of 2006.
January 2014
Full-Day Kindergarten:
A Review of the Evidence and Benefit-Cost Analysis
Summary
WSIPP updated its 2007 analysis of the research
evidence regarding full-day kindergarten.
Over half of Washington’s public school
kindergarteners attend full-day programs, and the
state is expanding funding for this option. In this
report, we analyze average impacts on student
outcomes from full-day kindergarten across the
United States and elsewhere. We also examine
whether benefits are likely to exceed costs.
To investigate, we conducted a systematic review of
research by collecting all studies we could find on
the topic. We screened for scientific rigor and only
analyzed studies with strong research methods.
We identified ten credible evaluations of full-day
kindergarten’s cause-and-effect relationship with
student test score outcomes. The studies estimate
the relative impact of full-day in comparison with
half-day programs.
Improvement in standardized test scores was the
only outcome measured in the studies that we
reviewed. Other outcomes of interest such as social
and emotional learning and high school graduation
have not been examined consistently in the research
literature.
Our bottom-line findings. Full-day kindergarten
leads to higher standardized test scores than half-
day programs, but this effect appears to fade out
within a few years.
More information about how to sustain the early
gains from investments in full-day kindergarten is
needed as Washington State continues to expand
this option for public school students.
110 Fifth Avenue SE, Suite 214 ● PO Box 40999 ● Olympia, WA 98504 ● 360.586.2677 ● www.wsipp.wa.gov
Washington State Inst itute for Publ ic Pol icy
Suggested citation: Kay, N. & Pennucci, A. (2014). Full-day
kindergarten: A review of the evidence and benefit-cost analysis (Doc.
No. 14-01-2202). Olympia: Washington State Institute for Public
Policy.
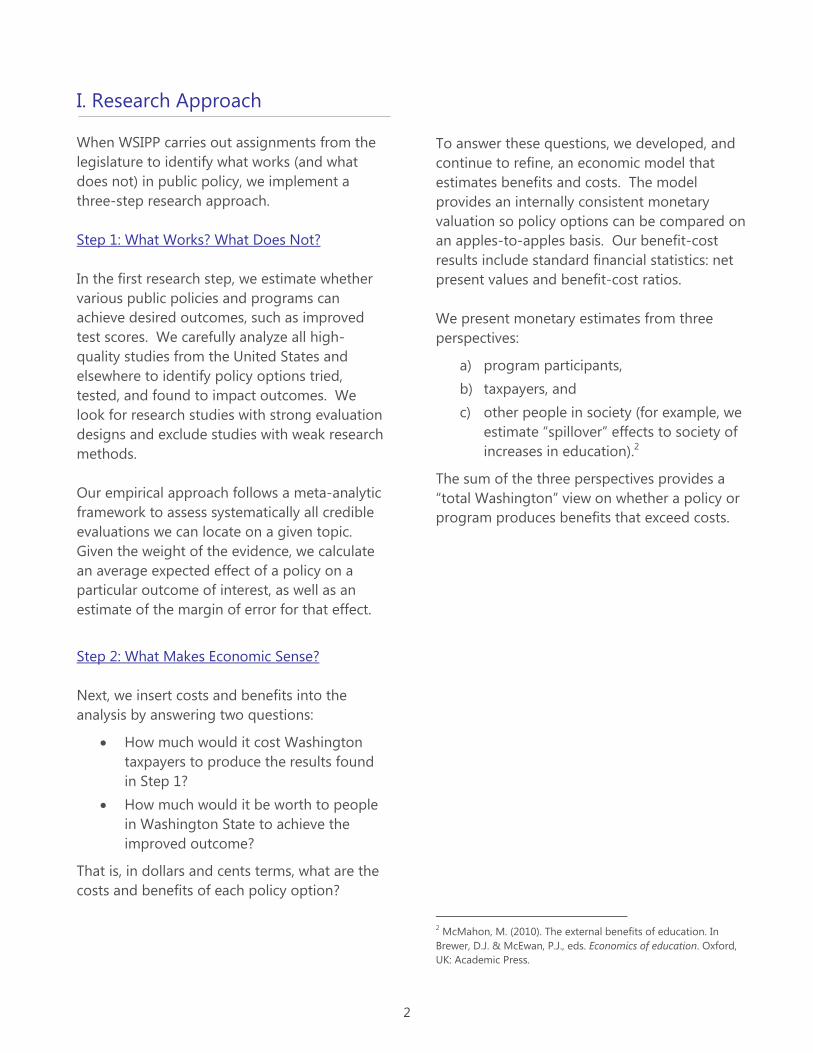
I. Research Approach
When WSIPP carries out assignments from the
legislature to identify what works (and what
does not) in public policy, we implement a
three-step research approach.
Step 1: What Works? What Does Not?
In the first research step, we estimate whether
various public policies and programs can
achieve desired outcomes, such as improved
test scores. We carefully analyze all high-
quality studies from the United States and
elsewhere to identify policy options tried,
tested, and found to impact outcomes. We
look for research studies with strong evaluation
designs and exclude studies with weak research
methods.
Our empirical approach follows a meta-analytic
framework to assess systematically all credible
evaluations we can locate on a given topic.
Given the weight of the evidence, we calculate
an average expected effect of a policy on a
particular outcome of interest, as well as an
estimate of the margin of error for that effect.
Step 2: What Makes Economic Sense?
Next, we insert costs and benefits into the
analysis by answering two questions:
How much would it cost Washington
taxpayers to produce the results found
in Step 1?
How much would it be worth to people
in Washington State to achieve the
improved outcome?
That is, in dollars and cents terms, what are the
costs and benefits of each policy option?
To answer these questions, we developed, and
continue to refine, an economic model that
estimates benefits and costs. The model
provides an internally consistent monetary
valuation so policy options can be compared on
an apples-to-apples basis. Our benefit-cost
results include standard financial statistics: net
present values and benefit-cost ratios.
We present monetary estimates from three
perspectives:
a) program participants,
b) taxpayers, and
c) other people in society (for example, we
estimate “spillover” effects to society of
increases in education).2
The sum of the three perspectives provides a
“total Washington” view on whether a policy or
program produces benefits that exceed costs.
2 McMahon, M. (2010). The external benefits of education. In
Brewer, D.J. & McEwan, P.J., eds. Economics of education. Oxford,
UK: Academic Press.
2

Step 3: What is the Risk in the Benefit-Cost
Findings?
Any tabulation of benefits and costs involves a
degree of risk about the estimates calculated.
This is expected in any investment analysis,
whether in the private or public sector. To
assess the riskiness of our conclusions, we
perform a “Monte Carlo simulation” in which we
vary key factors in our calculations. The
purpose of this analysis is to determine the
odds that a particular policy option will at least
break even.
Thus we produce two “big picture” findings:
expected benefit-cost results and, given our
understanding of the risks, the odds that the
policy will at least have benefits that are greater
than the costs. Readers interested in an in-
depth description of the research methods for
these three steps can reference our Technical
Manual.3 A brief Technical Appendix is included
at the end of this report.
3 Washington State Institute for Public Policy, (2013). Benefit-cost
technical manual: Methods and user guide. (Doc. No. 13-09-
1201b). Olympia, WA: Author.
II. Full-Day Kindergarten
In the United States, the percentage of students
attending full-day kindergarten has steadily
increased since the 1970s.4 In 2012, 76% of
students in the United States attended full-day
kindergarten, compared with 28% in 1977.5
Many public school districts have adopted full-
day kindergarten as a strategy to support
academically at-risk students.
Currently, 11 states and Washington, D.C. fund
full-day kindergarten for all students.6 In most
states, however, the decision to offer full-day
kindergarten is made at the local level.
Washington State began to fund voluntary full-
day kindergarten for schools with the highest
poverty levels during the 2007-08 school year.
The 2007 Legislature established the goal of
funding full-day kindergarten in all public
schools by the 2017-18 school year.7
Almost half of Washington’s public school
kindergarteners attend full-day kindergarten. In
2012, 22% were enrolled in a full-day program
funded by the state.8 An additional 25% of
Washington kindergarteners attending public
4 Education Commission of the States. (2005). Full-day
Kindergarten: A Study of State Policies in the United States.
http://fcd-us.org/sites/default/files/FullDayKindergarten.pdf 5 Child Trends. (2013). Full-day Kindergarten: Indicators on
Children and Youth. http://www.childtrends.org/?indicators=full-
day-kindergarten 6 Children’s Defense Fund. (2013). Full-day Kindergarten in the
States. http://www.childrensdefense.org/child-research-data-
publications/data/state-data-repository/full-day-k/full-day-
kindergarten-states-2012.html 7 RCW 28A.150.315
8 Office of Superintendent of Public Instruction. (2013). Q&A for
State-funded Full-day Kindergarten and the Washington
Kindergarten Inventory of Developing Skills (WaKIDS) Webinar.
http://www.k12.wa.us/EarlyLearning/pubdocs/QAforSFDKWaKIDS
WebinarMay13-2013.pdf
3

school were enrolled in full-day programs
funded by local sources or tuition.9
WSIPP previously published findings on full-day
kindergarten in 2007.10 This report updates our
analysis of evaluations of full-day kindergarten
compared with half-day kindergarten. The
studies we include in our analysis meet our
minimum standards for scientific rigor (such as
having a valid comparison group; see the
Technical Appendix for details). These criteria
give us increased confidence that any changes
in outcomes are caused by the intervention and
not by unknown factors.
This analysis examines the short-term impact of
full-day kindergarten on standardized academic
test scores. Unfortunately, longer-term
measures such as high school graduation or
labor market outcomes were not measured
consistently across studies and, thus, could not
be analyzed for this report.
We only examine academic outcomes in this
report. “Non-cognitive” outcomes such as
social and emotional learning are a growing
area of research and of interest to the
legislature and educators.11 However, we could
not include these outcomes in our analysis for
two reasons. First, the studies we reviewed did
not measure social and emotional learning
consistently. Second, we do not currently have
9 Office of Superintendent of Public Instruction. (2013). October
Enrollment Report, 2012-2013 as of 12/10/2012.
http://www.k12.wa.us/DataAdmin/GenderEthnicity.aspx 10
Aos, A., Miller, M., & Mayfield, J.. (2007). Benefits and costs of k–
12 educational policies: Evidence-based effects of class size
reductions and full-day kindergarten. (Doc. No. 07-03-2201).
Olympia: Washington State Institute for Public Policy. 11
Recent studies by Duckworth et al., 2013 and Heckman et al.,
2006 investigate the association between social and emotional
skills in adolescents and future earnings. Duckworth, K., Duncan, G.
J., Kokko, K., Lyyra, A., Metzger, M., & Simonton, S. (2012). The
relative importance of adolescent skills and behaviors for adult
earnings: A cross-national Study (DoQSS Working Paper No. 12-03).
Heckman, J. J., Stixrud, J., & Urzua, S. (2006). The effects of cognitive
and noncognitive abilities on labor market outcomes and social
behavior (NBER Working Paper 12006).
sufficient data to link full-day kindergarten to
social and emotional outcomes and subsequent
monetary benefits and costs. As scientific
consensus emerges on “non-cognitive” skills,
WSIPP’s findings will be updated to incorporate
monetary benefits from these outcomes.
Meta-Analysis Findings
We identified ten studies that met our criteria
for scientific rigor and measured academic test
scores of full-day kindergarteners in
comparison with half-day. Most studies
measured student test scores at the end of
kindergarten. A few followed students for
additional years (in grades one through five),
which allows us to examine whether the early
test score impacts persist over time.
The results of our updated meta-analysis are
similar to our 2007 findings and are displayed in
Exhibit 1. On average, students in full-day
kindergarten had significantly higher test scores
at the end of the school year in comparison
with similar students in half-day kindergarten
(effect size=0.16). The initial boost in test
scores, however, appears to fade out to almost
zero by grades two through five.
This meta-analytic finding represents the
average impact of full-day kindergarten for all
students, regardless of income level or other
characteristics. Since full-day kindergarten is
often used as an intervention for disadvantaged
students, we also examined the average effect
size among low-income students.
The results are similar for low-income students.
We estimate a positive effect immediately after
kindergarten (effect size=0.12), but, again, the
impact fades out to nearly zero by grades two
through five.
4

95% confidence intervals are shown for each effect size
Exhibit 1
Meta-Analytic Findings for Full-Day Kindergarten (versus Half-Day)
-0.20
-0.15
-0.10
-0.05
0.00
0.05
0.10
0.15
0.20
0.25
0.30
Eff
ect
size
Grade level when test scores were measured (number of effect sizes)
K
(4 ES)
1st
(2 ES)
2nd-5th
(3 ES)
Low
er
test
sco
res
Hig
her
test
sco
res
5

Benefit-Cost Analysis
As noted earlier, we use WSIPP’s standard
benefit-cost model to determine whether the
early gains from full-day programs offset the
operating and capital investments necessary to
expand the school day for kindergarteners. We
estimate that it costs approximately $2,650 per
student to expand from half-day to full-day
kindergarten. The estimated costs are
described in detail in the Technical Appendix.
We assume that a portion of full-day
kindergarten costs would be offset by lower
participation in state-subsidized child care.
We estimate that over their lifetimes, full-day
kindergarten participants—because their
cognitive skills improved only slightly over the
long term—make just $833 more in labor
market earnings than half-day kindergarten
participants, on average.
These labor market benefits, based on test
scores alone, are less than the program cost.
Thus, this policy has a relatively low probability
of monetarily breaking even (14%).
This unfavorable result for full-day kindergarten
depends critically on the degree to which the
initial test score gains fade out in later grades.
In Exhibit 2 we show benefit-cost analyses for
three scenarios: (a) the test score gains fade out
as reported in Exhibit 1; (b) the gains fade out at
a rate typical of early childhood education
programs; and (c) the gains are sustained
through the end of high school.12
12
The typical rate of test score decay is described in Kay &
Pennucci (2014). Kay, N., & Pennucci, A. (2014). Early childhood
education for low-income students: A review of the evidence and
benefit-cost analysis (Doc. No. 14-01-2201). Olympia: Washington
State Institute for Public Policy.
Exhibit 2
Benefit-Cost Results: Full-Day Kindergarten (versus Half-Day)
Benefits Costs Summary statistics
Benefits
from labor
market
earnings
“Deadweight”
cost of
taxation
Net
benefits
Net
program
costs
Benefits
minus
costs
(net
present
value)
Benefit
to cost
ratio
Odds of a
positive net
present
value
(a) Full-day kindergarten
with test score fadeout as
reported in this study
$833 ($1,323) ($490) ($2,649) ($3,140) ($0.19) 14%
(b) Full-day kindergarten
with typical early
childhood education test
score fadeout
$4,882 ($1,323) $3,559 ($2,646) $912 $1.35 63%
(c) Full-day kindergarten
with no test score fadeout $16,506 ($1,318) $15,188 ($2,648) $12,540 $5.75 98%
The estimates are present-value, life-cycle benefits and costs expressed in 2012 dollars. See the Technical Appendix for additional detail. Net
program costs differ due to the use of uncertainty ranges in the Monte Carlo simulation.
6
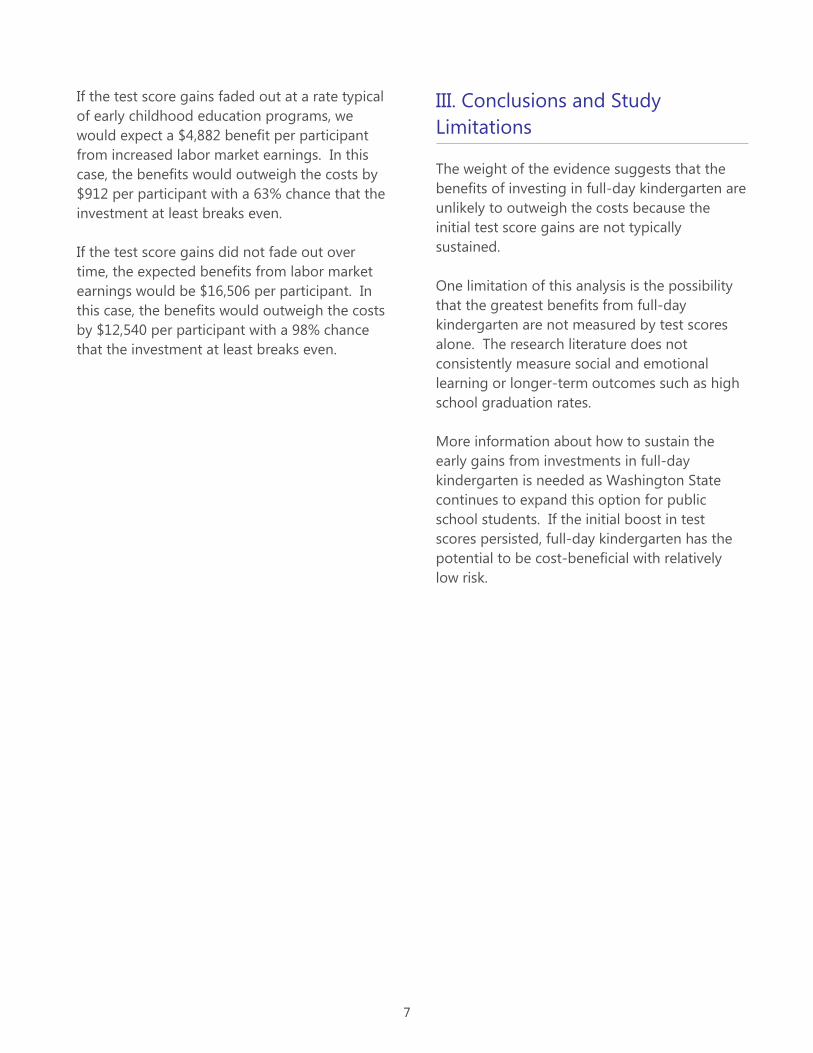
If the test score gains faded out at a rate typical
of early childhood education programs, we
would expect a $4,882 benefit per participant
from increased labor market earnings. In this
case, the benefits would outweigh the costs by
$912 per participant with a 63% chance that the
investment at least breaks even.
If the test score gains did not fade out over
time, the expected benefits from labor market
earnings would be $16,506 per participant. In
this case, the benefits would outweigh the costs
by $12,540 per participant with a 98% chance
that the investment at least breaks even.
III. Conclusions and Study
Limitations
The weight of the evidence suggests that the
benefits of investing in full-day kindergarten are
unlikely to outweigh the costs because the
initial test score gains are not typically
sustained.
One limitation of this analysis is the possibility
that the greatest benefits from full-day
kindergarten are not measured by test scores
alone. The research literature does not
consistently measure social and emotional
learning or longer-term outcomes such as high
school graduation rates.
More information about how to sustain the
early gains from investments in full-day
kindergarten is needed as Washington State
continues to expand this option for public
school students. If the initial boost in test
scores persisted, full-day kindergarten has the
potential to be cost-beneficial with relatively
low risk.
7
A1. Meta-Analysis Methodology…………………………………………………………………………………………………………..……..8
A2. Full-Day Kindergarten Analysis Details ………………………………………………………………………………………………..13
A3. Citations to Studies Used in the Meta-Analyses…………………………………………………………………………………..19
Technical Appendix Full-Day Kindergarten: A Review of the Evidence and Benefit-Cost Analysis
A1. Meta-Analysis Methodology
A1a. Study Selection and Coding Criteria
A meta-analysis is only as good as the selection and coding criteria used to conduct the study.13
Following are the
key choices we made and implemented.
Study Selection. We use four primary means to locate studies for meta-analysis of programs: (1) we consult the
bibliographies of systematic and narrative reviews of the research literature in the various topic areas; (2) we
examine the citations in the individual studies themselves; (3) we conduct independent literature searches of
research databases using search engines such as Google, Proquest, Ebsco, ERIC, PubMed, and SAGE; and (4) we
contact authors of primary research to learn about ongoing or unpublished evaluation work. After first identifying
all possible studies via these search methods, we attempt to determine whether the study is an outcome
evaluation that has a valid comparison group. If a study meets this criterion, we secure a full copy of the study for
our review.
Peer-Reviewed and Other Studies. We examine all evaluation studies we can locate with these search procedures.
Many studies are published in peer-reviewed academic journals while others are from reports obtained from the
agencies themselves. It is important to include non-peer reviewed studies, because it has been suggested that
peer-reviewed publications may be biased to show positive program effects. Therefore, our meta-analysis
includes all available studies that meet our other criteria, regardless of publication source.
Control and Comparison Group Studies. Our analysis only includes studies that have a control or comparison
group or use a quasi-experimental design such as regression discontinuity with multiple, sophisticated controls.
We do not include studies with a single-group, pre-post research design. This choice was made because it is only
through rigorous studies that causal relationships can be reliably estimated.
Random Assignment and Quasi-Experiments. Random assignment studies are preferred for inclusion in our review,
but we also include non-randomly assigned comparison groups. We only include quasi-experimental studies if
sufficient information is provided to demonstrate comparability between the treatment and comparison groups
on important pre-existing conditions such as age, gender, and pre-treatment characteristics such as test scores.
13
All studies used in the meta-analysis are identified in the references to this paper. Many other studies were reviewed but did not meet the
criteria set for this analysis.
8
Enough Information to Calculate an Effect Size. Following the statistical procedures in Lipsey and Wilson,14
a study
has to provide the necessary information to calculate an effect size. If the necessary information is not provided,
and we are unable to obtain the necessary information directly from the study’s author(s), the study is not
included in our review.
Mean-Difference Effect Sizes. For this study, we code mean-difference effect sizes for continuous measures
following the procedures outlined in Lipsey and Wilson.15
For dichotomous measures, we use the d-Cox
transformation to approximate the mean difference effect size, as described in Sánchez-Meca, Marín-Martínez,
and Chacón-Moscoso.16
We choose to use the mean-difference effect size rather than the odds ratio effect size
because we frequently code both dichotomous and continuous outcomes (odds ratio effect sizes could also be
used with appropriate transformations).
Outcome Measures of Interest. In this analysis we are interested in academic achievement, long-term outcomes
and social and emotional learning. We include standardized, validated assessments of student learning. Reading
and math test scores are the most frequently measured outcomes.
Since long-term outcomes and social and emotional learning were not measured consistently in the studies we
reviewed, they are not included in this report.
A1b. Procedures for Calculating Effect Sizes
Effect sizes summarize the degree to which a program or policy affects an outcome. In experimental settings this
involves comparing the outcomes of treated participants relative to untreated participants. Several methods are
used by analysts to calculate effect sizes, as described in Lipsey and Wilson.17
The most common effect size
statistic is the standardized mean difference effect size and that is the measure we use in this analysis.
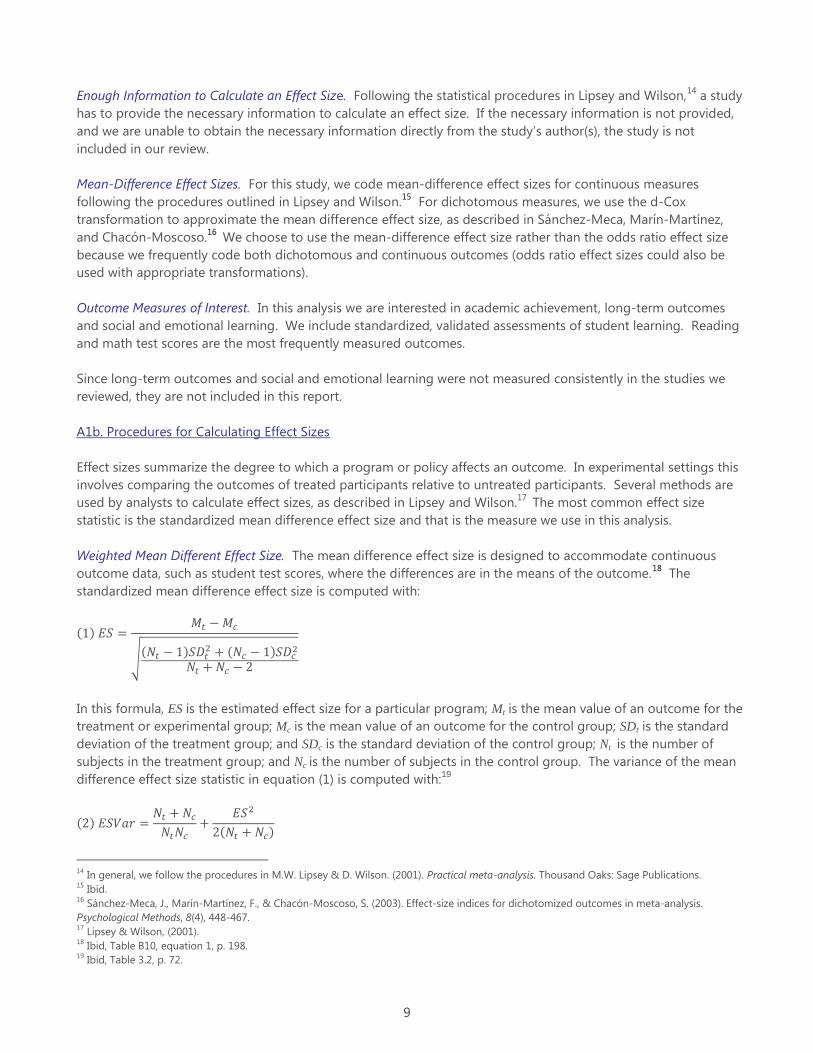
Weighted Mean Different Effect Size. The mean difference effect size is designed to accommodate continuous
outcome data, such as student test scores, where the differences are in the means of the outcome.18
The
standardized mean difference effect size is computed with:
( )
√( )
( )
In this formula, ES is the estimated effect size for a particular program; Mt is the mean value of an outcome for the
treatment or experimental group; Mc is the mean value of an outcome for the control group; SDt is the standard
deviation of the treatment group; and SDc is the standard deviation of the control group; Nt is the number of
subjects in the treatment group; and Nc is the number of subjects in the control group. The variance of the mean
difference effect size statistic in equation (1) is computed with:19
( )
( )
14
In general, we follow the procedures in M.W. Lipsey & D. Wilson. (2001). Practical meta-analysis. Thousand Oaks: Sage Publications. 15
Ibid. 16
Sánchez-Meca, J., Marín-Martínez, F., & Chacón-Moscoso, S. (2003). Effect-size indices for dichotomized outcomes in meta-analysis.
Psychological Methods, 8(4), 448-467. 17
Lipsey & Wilson, (2001). 18
Ibid, Table B10, equation 1, p. 198. 19
Ibid, Table 3.2, p. 72.
9

In some random assignment studies or studies where treatment and comparison groups are well-matched,
authors provide only statistical results from a t-test. In those cases, we calculate the mean difference effect size
using:20
( ) √
In many research studies, the numerator in equation (1), Mt - Mc, is obtained from a coefficient in a regression
equation, not from experimental studies of separate treatment and control groups. For such studies, the
denominator in equation (1) is the standard deviation for the entire sample. In these types of regression studies,
unless information is presented that allows the number of subjects in the treatment condition to be separated
from the total number in a regression analysis, the total N from the regression is used for the sum of Nt and Nc,
and the product term NtNc is set to equal (N/2)2.
Pre/Post Measures. When authors report pre- and post-treatment measures without other statistical adjustments,
we start by calculating two between-groups effect sizes: (a) at pre-treatment and, (b) at post-treatment. Then, we
calculate the overall effect size by subtracting the post-treatment effect size from the pre-treatment effect size.
Adjusting Effect Sizes for Small Samples. Since some studies have very small sample sizes, we follow the
recommendation of many meta-analysts and adjust for this. Small sample sizes have been shown to upwardly
bias effect sizes, especially when samples are less than 20. Following Hedges,21
Lipsey and Wilson22
report the
“Hedges correction factor,” which we use to adjust all mean-difference effect sizes, (where N is the total sample
size of the combined treatment and comparison groups):
( ) [
]
Adjusting Effect Sizes and Variances for Multi-Level Data Structures. Most studies in the education field use data
that are hierarchical in nature. That is, students are clustered in classrooms, classrooms are clustered within
schools, schools are clustered within districts, and districts are clustered within states. Analyses that do not
account for clustering will underestimate the variance in outcomes at the student level (the denominator in
equation 1 and, thus, may over-estimate the precision of magnitude on effect sizes). In studies that do not
account for clustering, effect sizes and their variance require additional adjustments.23
There are two types of
studies, each requiring a different set of adjustments.24
First, for student-level studies that ignore the variance due
to clustering, we make adjustments to the mean effect size and its variance,
( ) √ ( )
20
Ibid, Table B10, equation 2, p. 198. 21
Hedges, L. V. (1981). Distribution theory for Glass’s estimator of effect size and related estimators. Journal of Educational Statistics, 6(2), 107-
128. 22
Lipsey & Wilson, (2001), equation 3.22, p. 49. 23
Studies that employ hierarchical linear modeling, or fixed effects with robust standard errors, or random effects models account for variance
and need no further adjustment for computing the effect size, but adjustments are made to the inverse variance weights for meta-analysis
using these methods. 24
These formulas are taken from: Hedges, L. (2007). Effect sizes in cluster-randomized designs. Journal of Educational and Behavioral Statistics,
32(4), 341-370.
10

( ) { } (
) ( ) (
( )( ) ( ) ( ) ( )
( ) ( ) ( ) )
where is the intraclass correlation, the ratio of the variance between clusters to the total variance; N is the total
number of individuals in the treatment group, Nt , and the comparison group, Nc; and n is the average number of
persons in a cluster, K. In the educational field, clusters can be classes, schools, or districts. We used 2006
Washington Assessment of Student Learning (WASL) data to calculate values of for the school-level ( = 0.114)
and the district level ( = 0.052). Class-level data were not available, so we use a value of = 0.200 for class-level
studies.
Second, for studies that report means and standard deviations at a cluster level, we make adjustments to the
mean effect size and its variance:
( ) √ ( )
√
( ) { } {(
) ( ( )
)
( )
( )}
We do not adjust effect sizes in studies reporting dichotomous outcomes. This is because the d-Cox
transformation assumes the entire normal distribution at the student level.25
However, when outcomes are
dichotomous, or an effect size is calculated from studies where authors control for clustering with robust standard
errors or hierarchical linear modeling, we use the “design effect” to calculate the “effective sample size.”26
The
design effect is given by:
( ) ( )
The effective sample size is the actual sample size divided by the design effect. For example, the effective sample
size for the treatment group is:
( ) ( )
A1c. Adjusting Effect Sizes for Study Design, Research Involvement and Study Setting
In this report we show the results of our meta-analyses calculated with the standard meta-analytic formulas
described above. Typically, we list the “Adjusted Effect Size” that is used in the benefit-cost analysis in our reports.
These adjusted effect sizes, which are derived from the unadjusted results, may be smaller, larger, or equal to the
unadjusted effect sizes we report. In this analysis we considered adjusting effect sizes for research design,
researcher involvement in the intervention, and laboratory (not “real world”) settings. For a full description of the
rationale for these adjustments see WSIPP’s Technical Manual.27
Since the studies we reviewed for our analysis of full-day kindergarten all had similar research designs, we could
not conduct a meta-regression to determine if there were systematic differences due to research design.
We, therefore, made adjustments for research design based on our analysis of early childhood education
25
Mark Lipsey (personal communication, November 11, 2007). 26
Formulas for design effect and effective sample size were obtained from the Cochrane Reviewers Handbook, section 16.3.4, Approximate
analyses of cluster-randomized trials for a meta-analysis: effective sample sizes. http://www.cochrane-handbook.org/ 27
Washington State Institute for Public Policy, (2013). http://www.wsipp.wa.gov/TechnicalManual/WsippBenefitCostTechnicalManual.pdf
11

programs.28
For early childhood education programs we found that research design did predict the magnitude of
the effect size, thus no adjustments were made for this factor in the full-day kindergarten analysis. None of the
full-day kindergarten studies took place in a setting that was not a “real world” environment and no researchers
were involved in the implementation of these studies; therefore, no adjustments were made for these conditions.
In this report, we refer to all effect sizes as weighted average effect sizes since no adjustments were made for
study design, researcher involvement, or study setting.
Computing Weighted Average Effect Sizes, Confidence Intervals, and Homogeneity Tests. Once effect sizes are
calculated for each program effect, and any necessary adjustments for clustering are made, the individual
measures are summed to produce a weighted average effect size for a program area. We calculate the inverse
variance weight for each program effect and these weights are used to compute the average. The calculations
involve three steps. First, the standard error, SET of each mean effect size is computed with:29
( ) √
( )
Next, the inverse variance weight w is computed for each mean effect size with:30
( )
The weighted mean effect size for a group with i studies is computed with:31
( ) ∑(
)
∑
Confidence intervals around this mean are then computed by first calculating the standard error of the mean
with:32
( ) √
∑
Next, the lower, ESL, and upper limits, ESU, of the confidence interval are computed with:33
( ) ( ) ( )
( ) ( ) ( )
In equations (15) and (16), z(1-) is the critical value for the z-distribution (1.96 for = .05). The test for
homogeneity, which provides a measure of the dispersion of the effect sizes around their mean, is given by:34
28
Kay & Pennucci, (2014). 29
Lipsey & Wilson, (2001), equation 3.23, p. 49. 30
Ibid., equation 3.24, p. 49. 31
Ibid., p. 114. 32
Ibid. 33
Ibid. 34
Ibid., p. 116.
12

( ) (∑ )
(∑ )
∑
The Q-test is distributed as a chi-square with k-1 degrees of freedom (where k is the number of effect sizes).
Computing Random Effects Weighted Average Effect Sizes and Confidence Intervals. Next, a random effects model
is used to calculate the weighted average effect size. Random effects models allow us to account for between-
study variance in addition to within-study variance.35
This is accomplished by first calculating the random effects
variance component, v:36
( ) ( )
∑ (∑ ∑ ⁄ )
Where wsqi is the square of the weight of ESi. This random variance factor is then added to the variance of each
effect size and finally all inverse variance weights are recomputed, as are the other meta-analytic test statistics. If
the value of Q is less than the degrees of freedom (k-1), there is no excess variation between studies and the initial
variance estimate is used.
A2. Full-Day Kindergarten Meta-Analysis and Cost Estimation
Meta-analysis
We located ten evaluations of full-day kindergarten (versus half-day programs) that met our criteria for meta-
analysis. Three studies used state or school district data; seven studies used the Early Childhood Longitudinal
Program Kindergarten Class of 1998-99 (ECLS-K), a large national study that followed a cohort of children from
kindergarten to middle school.37
To account for the use of the same data set, we computed an average effect size
for the seven studies that used ECLS-K data and included this summary effect size in the meta-analysis. Thus, for
the immediate post-kindergarten measurement, four effect sizes are included: the ECLS-K summary effect and the
three state/district effects.
We reviewed all studies included in the previous full-day kindergarten meta-analysis using our criteria for scientific
rigor and method for coding effect sizes. Seventeen studies that were included in the previous WSIPP analysis
were not included in the current analysis because they did not meet the criteria for strong research design or
provide sufficient information to compute an effect size.38
Some of the studies followed students in later grade levels. Exhibit A1 presents meta-analytic results for students
at the end of kindergarten, first grade, and later grades (two through five). At the end of the kindergarten school
year, students in full-day kindergarten had higher test scores (unadjusted ES = 0.16), on average, than students in
half-day programs. That impact, however, appears to fade out in subsequent years (unadjusted ES = 0.01 in
grades two through five).39
35
Borenstein, M., Hedges, L. V., Higgins, J. P. T., & Rothstein, H. R. (2010). A basic introduction to fixed-effect and random-effects models for
meta-analysis. Research Synthesis Methods, 1(2), 97-111. 36
Ibid., p. 134. 37
http://nces.ed.gov/ecls/kindergarten.asp 38
After re-reviewing the studies in our 2007 analysis, we concluded that a number of the studies did not have adequate comparison groups or
sufficient statistical controls to include in our current review. 39
Another recent meta-analysis of full-day kindergarten had similar findings. Cooper, H., Allen, A. B., Patall, E. A., & Dent, A. L. (2010). Effects of
full-day kindergarten on academic achievement and social development. Review of Educational Research, 80(1), 34-70.
13

Exhibit A1
Meta-Analysis Results: Full-Day Kindergarten Impacts on Test Scores
(in Comparison with Half-Day Programs)
Follow-up time
(end of school year)
No.
effect
sizes
Weighted
average
effect size
Standard
error
p-
value
Combined N in
treatment
group
All students
Kindergarten 4 0.16 0.03 0.00 53,818
First grade 2 0.06 0.06 0.28 39,566
2nd
-5th
grades 3 0.01 0.05 0.27 27,100
Low-income
students
Kindergarten 2 0.12 0.03 0.00 48,870
First grade 2 0.00 0.04 0.98 33,339
2nd
-5th
grades 2 0.00 0.04 0.99 21,184
Since the relationships in the economic literature between test scores and labor market earnings are based on test
scores late in high school, it is critical to adjust earlier measurements of test scores appropriately for use in the
benefit-cost model. Typically, the magnitude of gains in standardized test scores of children who participate in an
educational intervention does not remain constant over time. WSIPP has modeled test score decay or “fadeout”
based on our meta-analysis of early childhood education programs.40
To calculate the impact of full-day
kindergarten on test scores at the end of high school we use the effect size at the highest grade level of
measurement in the studies we reviewed and then use the fadeout model to estimate the test score decay to age
17. Using this methodology, we estimate the impact of full-day kindergarten on test scores at the end of high
school as 54% of the 2nd
-5th
grade effect size.
We also estimate effect sizes at the end of high school for two hypothetical cases of fadeout in order to calculate
the benefits and costs for these scenarios. In the first hypothetical scenario we assume that test scores fadeout is
the same as a typical early childhood education program. Using the model of early childhood education program
fadeout described above, we estimate the impact of full-day kindergarten on test scores in the hypothetical
scenario as 31% of the end of kindergarten effect size. The second hypothetical scenario assumes a case where
there is no test score fadeout. For this scenario we use the effect size at the end of kindergarten as the effect size
at the end of high school.
40
Kay & Pennucci, (2014).
14
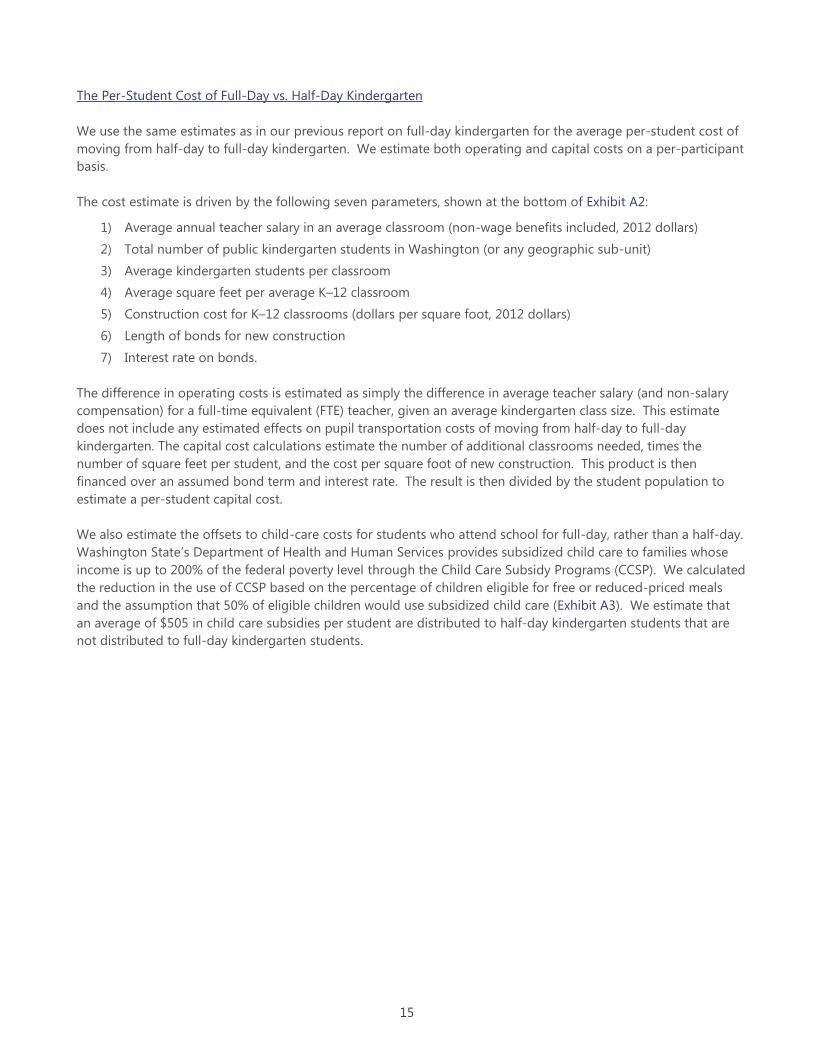
The Per-Student Cost of Full-Day vs. Half-Day Kindergarten
We use the same estimates as in our previous report on full-day kindergarten for the average per-student cost of
moving from half-day to full-day kindergarten. We estimate both operating and capital costs on a per-participant
basis.
The cost estimate is driven by the following seven parameters, shown at the bottom of Exhibit A2:
1) Average annual teacher salary in an average classroom (non-wage benefits included, 2012 dollars)
2) Total number of public kindergarten students in Washington (or any geographic sub-unit)
3) Average kindergarten students per classroom
4) Average square feet per average K–12 classroom
5) Construction cost for K–12 classrooms (dollars per square foot, 2012 dollars)
6) Length of bonds for new construction
7) Interest rate on bonds.
The difference in operating costs is estimated as simply the difference in average teacher salary (and non-salary
compensation) for a full-time equivalent (FTE) teacher, given an average kindergarten class size. This estimate
does not include any estimated effects on pupil transportation costs of moving from half-day to full-day
kindergarten. The capital cost calculations estimate the number of additional classrooms needed, times the
number of square feet per student, and the cost per square foot of new construction. This product is then
financed over an assumed bond term and interest rate. The result is then divided by the student population to
estimate a per-student capital cost.
We also estimate the offsets to child-care costs for students who attend school for full-day, rather than a half-day.
Washington State’s Department of Health and Human Services provides subsidized child care to families whose
income is up to 200% of the federal poverty level through the Child Care Subsidy Programs (CCSP). We calculated
the reduction in the use of CCSP based on the percentage of children eligible for free or reduced-priced meals
and the assumption that 50% of eligible children would use subsidized child care (Exhibit A3). We estimate that
an average of $505 in child care subsidies per student are distributed to half-day kindergarten students that are
not distributed to full-day kindergarten students.
15
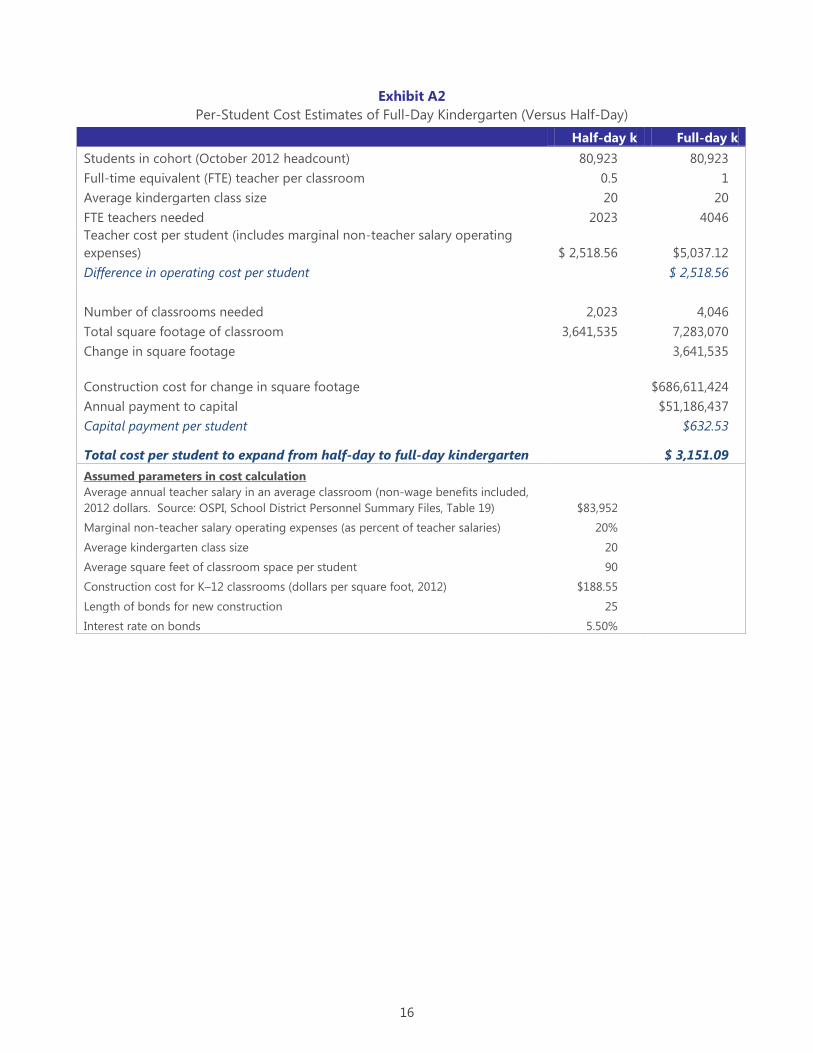
Exhibit A2
Per-Student Cost Estimates of Full-Day Kindergarten (Versus Half-Day)
Half-day k Full-day k
Students in cohort (October 2012 headcount) 80,923 80,923
Full-time equivalent (FTE) teacher per classroom 0.5 1
Average kindergarten class size 20 20
FTE teachers needed 2023 4046
Teacher cost per student (includes marginal non-teacher salary operating
expenses) $ 2,518.56 $5,037.12
Difference in operating cost per student
$ 2,518.56
Number of classrooms needed 2,023 4,046
Total square footage of classroom 3,641,535 7,283,070
Change in square footage
3,641,535
Construction cost for change in square footage
$686,611,424
Annual payment to capital $51,186,437
Capital payment per student
$632.53
Total cost per student to expand from half-day to full-day kindergarten
$ 3,151.09
Assumed parameters in cost calculation
Average annual teacher salary in an average classroom (non-wage benefits included,
2012 dollars. Source: OSPI, School District Personnel Summary Files, Table 19) $83,952
Marginal non-teacher salary operating expenses (as percent of teacher salaries) 20%
Average kindergarten class size 20
Average square feet of classroom space per student 90
Construction cost for K–12 classrooms (dollars per square foot, 2012) $188.55
Length of bonds for new construction 25
Interest rate on bonds 5.50%
16
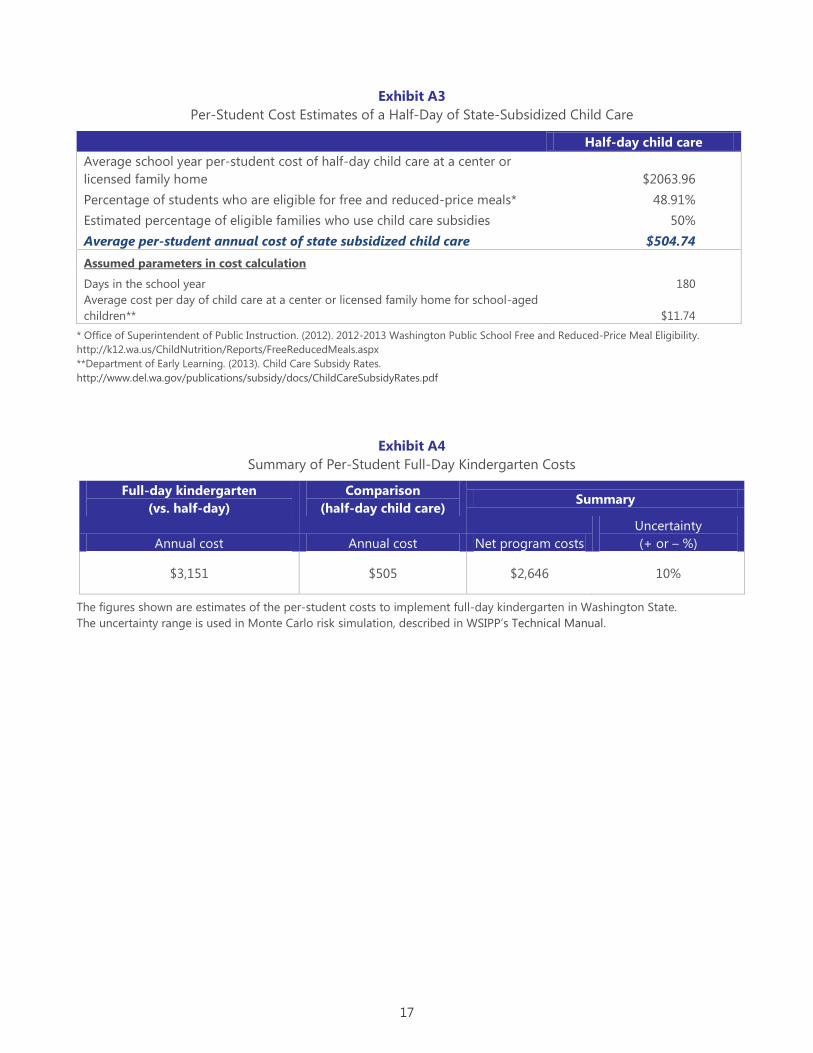
Exhibit A3
Per-Student Cost Estimates of a Half-Day of State-Subsidized Child Care
Half-day child care
Average school year per-student cost of half-day child care at a center or
licensed family home $2063.96
Percentage of students who are eligible for free and reduced-price meals* 48.91%
Estimated percentage of eligible families who use child care subsidies 50%
Average per-student annual cost of state subsidized child care $504.74
Assumed parameters in cost calculation
Days in the school year 180
Average cost per day of child care at a center or licensed family home for school-aged
children** $11.74
* Office of Superintendent of Public Instruction. (2012). 2012-2013 Washington Public School Free and Reduced-Price Meal Eligibility.
http://k12.wa.us/ChildNutrition/Reports/FreeReducedMeals.aspx
**Department of Early Learning. (2013). Child Care Subsidy Rates.
http://www.del.wa.gov/publications/subsidy/docs/ChildCareSubsidyRates.pdf
Exhibit A4
Summary of Per-Student Full-Day Kindergarten Costs
Full-day kindergarten
(vs. half-day)
Comparison
(half-day child care) Summary
Annual cost Annual cost Net program costs
Uncertainty
(+ or – %)
$3,151 $505 $2,646 10%
The figures shown are estimates of the per-student costs to implement full-day kindergarten in Washington State.
The uncertainty range is used in Monte Carlo risk simulation, described in WSIPP’s Technical Manual.
17
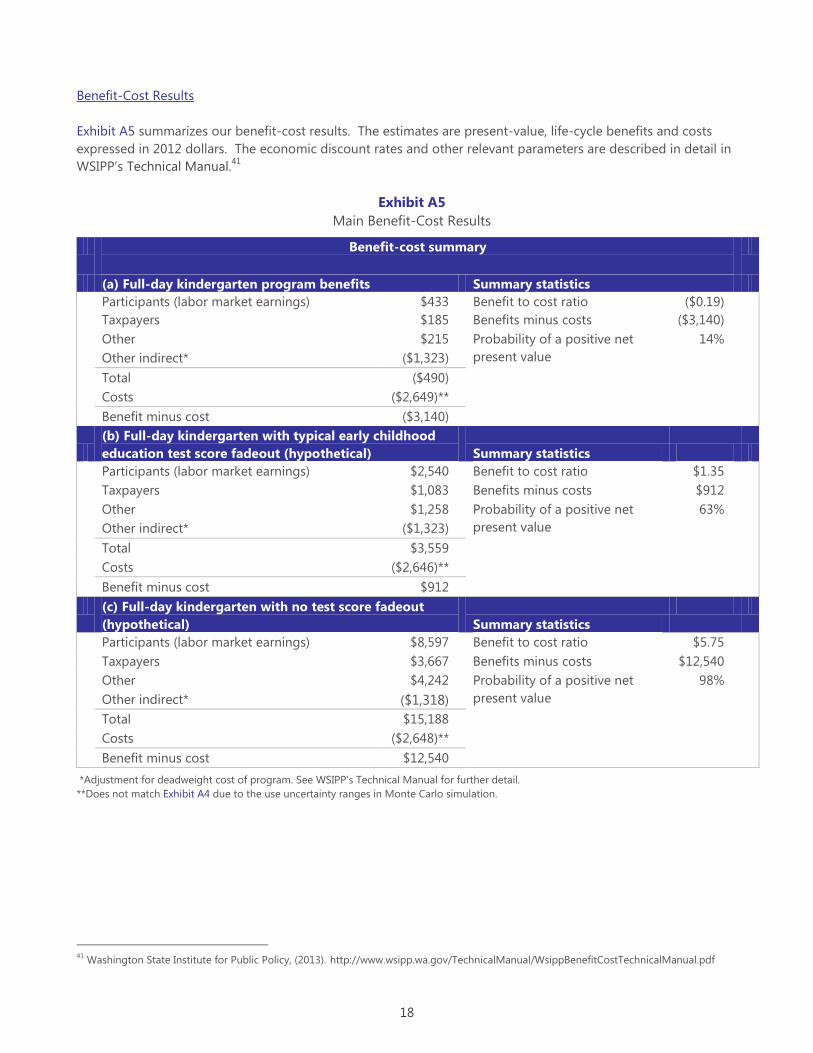
Benefit-Cost Results
Exhibit A5 summarizes our benefit-cost results. The estimates are present-value, life-cycle benefits and costs
expressed in 2012 dollars. The economic discount rates and other relevant parameters are described in detail in
WSIPP’s Technical Manual.41
Exhibit A5
Main Benefit-Cost Results
Benefit-cost summary
(a) Full-day kindergarten program benefits Summary statistics
Participants (labor market earnings) $433 Benefit to cost ratio ($0.19)
Taxpayers $185 Benefits minus costs ($3,140)
Other $215 Probability of a positive net
present value
14%
Other indirect* ($1,323)
Total ($490)
Costs ($2,649)**
Benefit minus cost ($3,140)
(b) Full-day kindergarten with typical early childhood
education test score fadeout (hypothetical) Summary statistics
Participants (labor market earnings) $2,540 Benefit to cost ratio $1.35
Taxpayers $1,083 Benefits minus costs $912
Other $1,258 Probability of a positive net
present value
63%
Other indirect* ($1,323)
Total $3,559
Costs ($2,646)**
Benefit minus cost $912
(c) Full-day kindergarten with no test score fadeout
(hypothetical) Summary statistics
Participants (labor market earnings) $8,597 Benefit to cost ratio $5.75
Taxpayers $3,667 Benefits minus costs $12,540
Other $4,242 Probability of a positive net
present value
98%
Other indirect* ($1,318)
Total $15,188
Costs ($2,648)**
Benefit minus cost $12,540
*Adjustment for deadweight cost of program. See WSIPP’s Technical Manual for further detail.
**Does not match Exhibit A4 due to the use uncertainty ranges in Monte Carlo simulation.
41
Washington State Institute for Public Policy, (2013). http://www.wsipp.wa.gov/TechnicalManual/WsippBenefitCostTechnicalManual.pdf
18

A3. Studies Used in the Meta-Analyses
Cannon, S. J., Jacknowitz, A., & Painter, G., (2006). Is full better than half? Examining the longitudinal effects of full-day
kindergarten attendance. Journal of Policy Analysis and Management, 25(2), 299-321.
Cannon, J. S., Jacknowitz, A., & Painter, G. (2011). The effect of attending full-day kindergarten on English learner students.
Journal of Policy Analysis and Management, 30(2), 287-309.
Chang, M., & Singh, K. (2008). Is all-day kindergarten better for children's academic performance? Evidence from the Early
Childhood Longitudinal Study. Australian Journal of Early Childhood, 33(4), 35-42.
DeCicca, P. (2007). Does full-day kindergarten matter? Evidence from the first two years of schooling. Economics of Education
Review, 26(1), 67-82.
Holmes, C. T., & McConnell, B. M. (1990). Full-day versus half-day kindergarten: An experimental study. Paper presented at the
Annual Meeting of the American Educational Research Association: Boston, MA.
Le, V.-N., Kirby, S. N., Barney, H., Setodji, C. M., & Gershwin, D. (2006). School readiness, full-day kindergarten, and student
achievement: An empirical investigation. Santa Monica, CA: RAND Corporation.
Lee, V. E., Burkam, D. T., Ready, D. D., Honigman, J., & Meisels, S. J. (2006). Full-day versus half-day kindergarten: In which
program do children learn more? American Journal of Education, 112(2), 163-208.
Votruba-Drzal, E., Li-Grining, C. P., & Maldonado-Carre o, C. (2008). A developmental perspective on full- versus part-day
kindergarten and children's academic trajectories through fifth grade. Child Development, 79(4), 957-978.
Warburton, W. P., Warburton, R. N., & Hertzman, C. (2012). Does full day kindergarten help kids? Canadian Public Policy, 38(4),
591-603.
Zvoch, K., Reynolds, R. E., & Parker, R. P. (2008). Full-day kindergarten and student literacy growth: Does a lengthened school
day make a difference? Early Childhood Research Quarterly, 23(1), 94-107.
19

For further information, contact:
Noa Kay at 360.586.2794, [email protected] Document No. 14-01-2202
W a s h i n g t o n S t a t e I n s t i t u t e f o r P u b l i c P o l i c y
The Washington State Legislature created the Washington State Institute for Public Policy in 1983. A Board of Directors—representing the
legislature, the governor, and public universities—governs WSIPP and guides the development of all activities. WSIPP’s mission is to carry
out practical research, at legislative direction, on issues of importance to Washington State.