
FINAL REPORT Space Administration for research supported ... · PDF fileNational Aeronautics...
18
wt_.. _- "_ NASA-¢R-196619 FINAL REPORT to National Aeronautics and Space Administration for research supported during the period 5/1/82 - 6/30/92 Under Grant NAG5'604 PRINCIPAL INVESTIGATOR: Robert H. Holzworth, Associate Professor Geophysics Program, AK-50 College of Arts & Sciences University of Washington Seattle, WA 98195 (206)685-7410 e-mail: [email protected] GRANT TITLE: Middle Atmospheric Electric Fields over Thunderstorms (1990 Mod to: Middle Atmospheric and Ionosphere Electrodynamics) This report includes a summary of accomplishments, a list of publications and an appendix with abstracts of published works. (NASA-CR-1946Ig) HIODLE ATMDSPHERIC ELECTRIC FIELDS OVER THUNDERSTORMS Final Report, i May I982 - 30 Jun. 1992 (Washington Univ.) I8 p N94-I6493 Unclas G3/47 0191264 https://ntrs.nasa.gov/search.jsp?R=19940012020 2018-05-24T07:48:16+00:00Z
Transcript of FINAL REPORT Space Administration for research supported ... · PDF fileNational Aeronautics...
wt_.. _- "_
NASA-¢R-196619
FINAL REPORT
to
National Aeronautics and Space Administration
for research supported during the period
5/1/82 - 6/30/92
Under Grant NAG5'604
PRINCIPAL INVESTIGATOR:Robert H. Holzworth, Associate Professor
Geophysics Program, AK-50College of Arts & Sciences
University of WashingtonSeattle, WA 98195
(206)685-7410
e-mail: [email protected]
GRANT TITLE:
Middle Atmospheric Electric Fields over Thunderstorms
(1990 Mod to: Middle Atmospheric and Ionosphere Electrodynamics)
This report includes a summary of accomplishments, a list of publications and an appendix with abstracts
of published works.
(NASA-CR-1946Ig) HIODLE
ATMDSPHERIC ELECTRIC FIELDS OVER
THUNDERSTORMS Final Report, i May
I982 - 30 Jun. 1992 (Washington
Univ.) I8 p
N94-I6493
Unclas
G3/47 0191264
https://ntrs.nasa.gov/search.jsp?R=19940012020 2018-05-24T07:48:16+00:00Z

ACCOMPLISHMENTS
This grant has supported a variety of investigations all having to do with the external electrodynamics ofthunderstorms. The grant was a continuation of work begun while the PI was at the Aerospace Corporation
(under NASA Grant NAS6-3109) and the general line of investigation continues today under NASA GrantsNAGS-685 and NAG6-111. This report will briefly identify the subject areas of the research and associated
results.
The period actually covered by the grant NAG5-604 included the following analysis and flights:
1. Analysis of five successful balloon flights in 1980 and 1981 (under the predecessor NASA grant) in the strato-
sphere over thunderstorms,
2. Development and flight of the Hy-wire tethered balloon system for direct measurement of the atmospheric
potential to 250kV. This involved multiple tethered balloon flight periods from 1981 through 1986 from several
locations including Wallops Island, VA, Poker Flat and Ft. Greely, AK and Holloman AFB, NM.
3. Balloon flights in the stratosphere over thunderstorms to measure vector electric fields and associated parame-
ters in 1986 (2 flights), 1987 (4 flights) and 1988 (2 flights).
4. Rocket-borne optical lightning flash detectors on two rocket flights (1987 and 1988) (the same detector designthat was used for the balloon flights listed under #3).
In summary this grant supported 8 stratospheric zero-pressure balloon flights, tethered aerostat flights every yearbetween 1982-1985, instruments on 2 rockets and analysis of data from 6 stratospheric flights in 1980/81 (pay-
loads built under predecessor grant).
Analysis of the data obtained from these flights has resulted in 12 refereed journal papers, one PhD thesis,a NASA Technical Report and numerous contributed and invited papers presented at national and international
scientific meetings. The research has included many discoveries and has been filled with exciting new under-
standing of how the electrodynamic properties and dynamics of thunderstorms affects the middle atmosphere andionosphere. I think it is fair to say that prior to this research it was thought that thunderstorms and lightning
had little direct affect on the ionosphere and magnetosphere (VLF whistler research not withstanding). Thediscoveries of this combined middle atmosphere - ionosphere (balloon - rocket) research program have demon-
strated convincingly that thunderstorms do have a major affect on the ionosphere and middle atmosphere and
that at times lightning may be the major energy source to the middle atmosphere and lower ionosphere.
It is important to keep in mind that this "final report" is not "final" in any way except bureaucratically.
The only phase of the research that is presently awaiting future plans is that involving the use of tethered bal-
loons in the Hy-wire experiment to detect the global return currents of thunderstorms. The Hy-wire experimentwas highly successful by all standards but dramatic new advances using that technology will require multiple,
simultaneous flights - a level of financial commitment that has not been approved. On the other hand, the free
flight balloons, and the rocket experiments directly over thunderstorms are continuing today under two grants:NAG5-685 (with Croskey at Penn State) for multiple balloons simultaneously flown with mesospheric rockets,
and NAG6-111 (with Kelley at Cornell) a rocket experiment for high resolution studies of lightning pulses in the
ionosphere.
--i " 3 "
BIBLIOGRAPHY
Publications Specifically Acknowledging NAG5-604 (see Appendix for abstracts):
PhD Thesis:
Li, Ya Qi, "Ionospheric VLF Waves and Optical Phenomena Over Active Thunderstorms", Geophysics Program,
Univ. of Washington, Seatde, WA, 1993.
Refereed Publications:
1. Holzworth, R. H., Hy-wire measurements of Atmospheric Potential, J. Geophys. Res., 89, 1395-1401, 1984.
2. Holzworth, R. H. On the Interpretation of Hy-wire Atmospheric Potential Measurements at Wallops Island: A
Reply, J. Geophys. Res., 89, 2637, 1984.
3. Kelley, M. C., C. L. Siefring, R. P. Pfaff, P. M. Kintner, M. Larsen, R. Green, R. H. Holzworth, L. C. Hale,J. D. Mitchell and D. LeVine, Electrical Measurements in the Atmosphere and in the Ionosphere over an
Active Thunderstorm, 1. Campaign Overview and initial ionospheric results, J. Geophys. Res., 90, 9815-
9823, 1985.
4. Holzworth, R. H., M. C. Kelley, C. L. Siefring, L. C. Hale and J. D. Mitchell, Electrical Measurements in theAtmosphere and the Ionosphere over an Active Thunderstorm: 2. Direct Current Electric Fields and Con-
ductivity, J. Geophys. Res., 90, 9824-9830, 1985.
5. Holzworth, R. H. and H. Volland, Do we need a geoelectric index?, EOS Trans. Am. Geophys. Union, 67,545-548, 1986.
6. Woosley, J. D. and R. H. Holzworth, Electrical Potential Measurements in the Lower Atmosphere, J. Geo-
phys. Res., 92, 3127-3134, 1987.
7. Holzworth, R. H., Electric Fields in the Middle Atmosphere, Physica Scripta, T18, 298-308, 1987.
8. Hu, H., R. H. Holzworth and Y. Li, Storm related variations in stratospheric conductivity measurements, J.
Geophys. Res., 94, 16429, 1989
9. Kelley, M. C., J. G. Ding and R. H. Holzworth, Intense ionospheric electric field pulses generated by lightn-
ing, Geophys. Res. Lett., 17, 2221, 1990.
10. Li, Ya Qi, Robert H. Holzworth, Hua Hu,Michael McCarthy, Dayle Massey, Paul M. Kintner, Juan Rodri-
guez, Umran S. Inan and William C. Armstrong, Anomalous Optical Events Detected by Rocket- and
Balloon-Mounted Detectors in the WIPP Campaign, J. Geophys. Res. 96, 1315-1326, 1991.
11. Holzworth, R. H., Atmospheric Electrodynamics in the US:1987-1990, Reviews of Geophysics, 29, (U.S.
Report to IUGG - Supplement), pp. 115-120, 1991.
12. Rodriguez, J. V., U. S. Inan, Y. Q. Li, R. H. Holzworth, A. J. Smith, R. E. Orville and T. J. Rosenberg, A
case study of lightning, whistlers and associated ionospheric effects during a substorm particle injection
event, J. Geophys. Res., 97, 65-76, 1992.
NASA Technical Report:
Holzworth, R. H. and D. M. LeVine, "Hy-wire and fast electric field change measurements near an isolated
thunderstorm", NASA TM 85072, Goddard Space Flight Center, Greenbelt, MD, 1983.

i • - 4 °
ABSTRACTS of PUBLICATIONS
prepared under NASA Grant NAG5-604
Principal Investigator: R. H. Holzworth/Univ. of Washington

- 5-
6
!
zO
_9
z
_ o
c_2
5 ¸
o
0
R _ m

1
- 6-
JOI.RNAI.()F(;I(qqI'IgIt\I RI_SE,,\R('tI. VO[.. _'_. N(_ l)l 1_\(iF_ 1';'_"-1401. I:I!I_RUARY 20. [984
Hy-Wire Measurernents of Atmospheric Potentialo_ / 7"--
R()Bt-Rr H. H()i,zw(_Rrtl
Grophysics Proqram, Unirersit) ,!1 tl',]shmgt,'nq
A method of dircctl) measuring the electric potential drop across the lowest portion of the atmosphere
by using an apparatus called Hy-wire is described. This tethered balloon-borne system has been operatedextensively at altitudes near 0.62 km at which voltages over 150 kV were measured with a high im-pedance device. Also described are measurements of system parameters such as system capacitance (5.6pf'm), impedance (10 _° f/), and response time {tens of seconds). H3-wire measurements from an around-the-clock experiment at Wallops Island, Va., having a characteristic repetitive diurnal pattern of varia-bility exceeding 40'!. of the mean, are presented. This diurnal pattern is discussed in terms of both localand global current sources. A demonstration using Hy-wire as a lightning channel model is also present-ed. These experiments have st', far been conducted at mid-latitudes but can also be flown from otherlocations in an effort to determine whether the lowest atmospheric electric circuit is affected by high
altitude and possibly global current systems, and if so how much. The data presented in this paper arenot definitive about the source of potential variations. The data are, howe_er, representative of the new
H_r-wire technique and demonstrative of the potential usefulness of this technique.
|NTRODUCTION
Two centuries ago, electric fields were discovered in the fair
weather atmosphere [Ldttlotttqier, 1752]. Since that time a large
body of literature which documents the global nature of the
field and its variability [cf. Dotezah'k and Relier, 1977] has
been developed. In the past decade, physicists have begun to
recognize that a significant interaction occurs between upper
and lower atmospheric electric current systems on a global
scale. Stratospheric balloon-borne measurements clearly indi-
cate a mixing of electric fields due to ionospheric and weather
related sources [cf. Mo:er, 1971].
To further the understanding of the dynamics of this system
of electric fields and currents, a new device, lofted by a teth-
ered balloon and called Hy-wire, has been developed. Hy-wire
can continuously monitor, by a direct high impedance voltage
measurement, the fair weather atmospheric potential which
exists across the lower atmosphere. The Hy-wire experiment
concept was developed by ttolzworth et al. [1981] and a series
of test flights from mid-latitudes was begun. In this paper we
will briefly describe how the Hy-wire system works and give
details of the system impedance, capacitance, noise, and lin-
earity. The Hy-wire data from several days of continuous
measurements will be presented to show the diurnal varia-
bility in the potential over Wallops Island, Va. We will then
discuss various interpretations of the diurnal variability in
terms of both global and local sources.
HY-WIRE INSTRUMI-NTATION
The idea of using tethered balloons or kites to lift payloads
to altitudes of several kilometers for studies of the atmospheric
electric field is not new [Peltier, 1840]. Many difficulties in-
herent in ground-based, field-mill measurements of electricfields are due to the small-scale size of the fields measured
(turbulence scale sizes of 1 m can strongly influence the
measurements). Using an antenna which bridges the mixed
layer (below I-2 km usually) can reduce the influence ofsmall-scale electric field variations. Vonne.qut et al. [1973]
showed that it is possible to bridge the lower atmospheric
Copyright 1984 by the American Geophy,,ical Union.
Paper number 3C 1525.0148-(1227/84/(_13C-1525505.00
layers with a single long wire and make direct potential
measurements. Other flights with a similar system have been
conducted by Willett and Rust [1981]. Vonnegut's low im-
pedance system involved the generation of a substantialcorona current over a large portion of the wire, which could
interfere with the potential measurement [WiUett, 1981]. The
tty-wire system uses a different concept involving an insulated
wire and a high impedance measurement at the bottom of the
wire.
As described by ltolzworth et al. [1981], the Hy-wire system
consists of a long, high-voltage, insulated conductor connected
at the top to a wire-mesh braid and terminated at the bottom
inside a large-diameter corona ball, mounted on 1 m Teflon
legs (see Figure I). The tethered balloon is used only to sup-
port the insulated wire which hangs slack (vertically) below
the balloon. Since the bottom end (corona ball) is insulated to
10 _'t f_ at 100 kV, the capacitance of the long insulated wire
can only be charged by currents flowing at the braid (upper)
end of the wire. Thus, corona currents will flow until the
capacitance of the long wire is charged to a potential below
the corona limit for the fine mesh braid (1.3 kV measured in
the laboratory in dry air at sea level). At that point the entire
Hy-wire system, braid, wire, and corona ball is at the potential
of the atmosphere near the upper end within a few kilovolts. A
field meter (Monroe electrostatic voltmeter model 144S used
throughout these experiments) near the corona ball can then
be used to record this potential. This requires a small high-
voltage power supply for calibrationpurposes but results in a
totally corona-free, high-impedance system. '.The type of high-
voltage wire and other engineering specifications were given
by llolzworth et al. [ 198 I].Two series of Hy-wire flights have given us a better under-
standing of the system's capabilities. As discussed by ttolz-
worth et al. [1981], we can directly meastire the. system im-
pedance and capacitance by first discharging Hy-wi're through
a known resistor and then tefloating the syklem. For a resistor
R- 10 _ f/, the lime constant of the discharge typically is
mcasurcd to bc in the range of 0.5 s per 100 meter altitude,
corresponding to a capacitance
r t'fc=k_5--m
for a tolal system capacitance of a few thousand picofarads.
139_

- 7 -J(_t R\_I _I:(;I-(_PFtY_;ICAI. RI _;I \R_II. V_I ,_'_, N_ [)2, I'._,(;I.IS _6_r-26_8. \I'RII 2U. 1'_84
Reply if/cA 3/_-q D
R()BI-RT H. lt()I.ZWORTH
Sp,_¢' ._Ci_'lll't'_Dirisi, m. ¢h'ophvxics P,',,!Ir_ml, _:nirersffy of l,t'ashin_.tton
I. I NTRO1)trcTION
A technique for directly measuring vertical atmospheric po-
tential differences called tty-wire has been reported by ftol:-
worth er al. [1981"] and tlolzworth [1984-1. These papers de-
scribe a measurement process which is a substantial modifi-
cation of a similar tethered balloon technique first reported by
Vonne_tut et al. [1973]. The major difference between the two
tethered balloon techniques is that the Vc, nnegut et al device
operates at low impedance using a high voltage generator,
while the fly-wire technique uses an inherently high im-
pedance (> 10 t_ ohmsl device One reason for going to the
trouble of solving the high vohage, high impedance problem
was to eliminate the corona discharge inherent in the Vonne-
gut et al. technique [of. Wilh,tt, 1981]. To test the Ily-wire
technique, several tcthcrcd balloon flights from the NASA
Wallops Flight Facility (%'I:I:) at Wallops island, Virginia,have been conducted Thc site was chosen because of close
logistic support and the desire to fly in restricted air space to
avoid airplane mishaps. It was recognized at the outsct that
WFF was in a region where land-sea intcractions might sub-
stantially affect the electrodynamics. Wc did not prcjudgc
what we should scc because it was clear that if the tty-wire
technique worked we could casily move it to a "clean air"
location to do global circuit studics. As it turned out, substan-
tial unexplained atmospheric potentials were seen at WFF
which warranted an attempt at an explanation, although not
conclusive, in ttolzworth [1984].
Now Markson [this issue] reports that instead of determin-
ing that no simple explanation (e.g., neither global not local)
can explain the data, I should have concluded that local me-
teorology was responsible for the potential variations. Fur-
thcrmore, Markson claims that the Hl,'-wire technique did not
work propcrly. The first section of this reply will address a
fundamental point of disagreemcnt between myself and
Markson {i.e., Markson claims that the global circuit has a
natural daily UT variability "resembling thc Carnegie curve
which should be expected on each individual day" [Markson,
this issue]). The first section will show this to be totally unsub-
stantiated by the facts.
On the b_tsis of the above premise that each day should
look like the Carnegie curve Markson attacks thc tty-wire
data as not possibly being due to global vari:tlions because
they do not look like the Carnegie curve. Therefore, in section
3 I address the major individual points of Markson [this issue]
to show that many of his interpretations of the Hy-wire data
are not correct.
2. GI.OBAI CIRCUIT VARIABII,ITY
The global circuit idea stems from a suggestion first made
by Apph, ton [1925] that the universal time variation of the fair
Copyright 1984 by the Amcric;m (]coph)qcal IMion.
Paper number 3DI9810148-0227 84. {X]3D- I9,q I$05.O0
weather vertical electric field might bc the same as that due to
worldv,'ide thunderstorms. Since that time, many authors have
helped dcvclop the idea of a global circuit in which the action
of all thunderstorms working together charges the ionosphere
factually the electrospherc) relative to the earth, and this
charge leaks back to the ground through the conducting at-
mosphere in fair weather regions. One early example of the
universal time variation is given by Mtmchly [1923] from data
collected by the Carnegie research vessel. This so-called Car-
ncgic curve is based on a few months of averaged, near-surface
electric licld measurements over the ocean, it is interesting and
significant that since the 1920's several other people (notable
in this case is the work of Markson, [1977]) have found that
when many days or weeks of potential differences or total
potential soundings are averagcd, one continues to find a UT
variability resembling the Carnegie curve. I too agree that
there must exist some real forcing function, such as global
thunderstorms, which acts to provide a variability in potential
which withstands such heavy averaging. The point I want to
make is precisely that the Carnegie curve is an average. Indi-
vidual days could vary significantly from the mean. Markson
claims an.', daily variability is due to local meteorological phe-
nomcna. Thus, says Markson, while the global circuit is really
functioning like the Carnegie curve, local measurements at
Wallops Island just cannot see the UT variation. I do not
belicvc this position is supportable by the evidence. If, as Mar-
kson states, the global circuit is driven by global thunder-
storms, then why is it so difficult to believe that there can be
substantial daily global thunderstorm variations? For in-
stance, the peak of the Carnegie curve at 1900 UT comeswhen the American continents are in the local afternoon.
Thus, American convective thunderstorm activity would be
highest (on the average) and this would "'pump up" the iono-
spheric potential. However, it is clear from daily weather maps
that occasionally there are days when an entire continent is
substantially cloud free. Thus, such a day would be a time
when the American continents would not act to charge the
ionosphere. The same goes for any specific land mass•
More generally, satellite measurements of lightning fre-
quency distributions [Orrille and Spenser, 1979; Turman and
Ed_lar, 1982] indicate substantial variation on a month tomonth basis of the location of maximum thunderstorm ac-
tivity. Recently, the space shuttle astronauts_ have photo-
graphed and w'itnessed the phenomena of'.simultaneous light-
ning covering perhaps 500,000 square miles [Vonneq,4t et al.,
1983]. It appears that an initial lightning stroke will often
cause a chain reaction such that within seconds lightning will
occur in many adjacent thunderstorms• This might abruptly •
affect the rate at which these thunderstorms are driving cur-
rent to the ionosphere. "
It would be begging the question to use the measured dec-
trical data to determine what caused the electrical variations
in that data set. That is, it is just as incorrect to state that "the
data follow the Carnegie curve and therefore must be due to
the global circuit" as it is In state "'the data do not follow the
2637

J.
- 8 -
J<;,I:RN\I.OF GF()PJIYSICA[_ RI!SFAR(II. V()L.90,N() Aft}.PA(;I!SqXl_;'_g2_.O(•T()P,liR I,1985
Electrical Measurements in tile Atmosphere and tile Ionosphere
Over an Active Thunderstorm
1. Campaign Overview and Initial Ionospheric Results
I_t. C. KEI.I.EY, I C. L. SIEFRING, I R. F. PFAFF, I P. M. KINTNER, t M. LARSEN, I R. GREEN, I
R. H. ||OLZWORTH, ;_ L. C. HALE, 3 J. D. MITCIIF.LL, 3 AND D. LE ViNE 4
The first simultaneous electric field observations performed in the ionosphere and atmosphere over anactive nighttime thunderstorm are reported here. In the stratosphere, typical storm-related dc electricfields were dcleclcd from a horizontal distance of ~ I00 kin, and transient el¢clric fields due to lightningv,rerc measured at several different allitudes. In the ionosphere and mesosphere, lightning-induced tran-sient electric fields in the range of tens of millivolts per meter were detecled with rise times at least as fastas 02 ms and typical duration or 10--20 ms. The transients had significant components parallel to themagnetic field at 150 km altitude. This implies that either conskterable Joule heating occurs or acollective inslabilily is present because of the high drift velocities induced by the transient electric fields.Copious numbers of whistlers were genrated by the storm and were detected above but not below thebase oi" the ionosphere. We present here the outline of a new model for direct whistler wave generationover an active thunderstorm based on these observations. The intensity of the observed two-hop whis-tlers implies that they were amplified along their propagation path and suggests thai particles wereprecipitated in both hemispheres.
INTRODUCTION
Lightning, and thunderstorms in general_ inviblve a variety
of fascinating physical processes. The e/_perimental program
described here was designed to determine the effects of this
meleorological phenomenon on the ionosphere and also to
investigate electrical effects in the stratosphere and meso-
sphere• To this end, a thunderstorm electric field campaign
was organized and carried out during an active nighttime
thunderstorm which moved through the rocket range at the
NASA Wallops Fligltl Cenlcr, Wallops Island, Virginia (lati-tude = 37.8", longitude = 284.5°).
A 10-cm radar located at Wallops Island was used to moni-
tor the backscatter intensity due to hydrometeors. The radar,
along with visual and RF" observations, yielded a good indica-
tion or thunderstorm activity. A ground-based fiat plate an-
tenna also provided valuable diagnostic data.
Two high flying ballistic trajectory payloads were developed
to make measurements in the mesosphere and ionosphere over
a thunderstorm. One payload had an apogee of 89 km, and
the other 154 kin. To our knowledge these rockets were the
first dedicated to the study of the upward coupling of light-
ning and thunderstorm from electric fields into the ionosphere.In addition, a zero-pressure balloon was flown at an altitude
of near 25 km, and a rocket-borne parachute payload with an
apogee of _75 km carried electric field sensors aloft to
characterize the elcctric ficld signatures at various altitudes in
the atmosphere.
The slratosphcric balloon was instrumented with both
quasi-static vector electric field detectors and a broadband
VLF electric field detector with a maximum frequency of ZOO
i School of Electrical Engineering, Cornell University, Ithaca, NewYork..
2 Space Sciences Division, Geophysics Program, University of, Washington, Seattle.
J Department of Electrical Engineering, Pennsylvania Stale Uni-versity, University Park.
4 NASA Goddard Space Flight Center, Greenbeh, Maryhmd.
Copyright 1985 by the American Geophysical Union.
Paper number 4A8386.OI48-0227/85/O04A-R 186505.00
kHz. The e!eclric field detectors consisted of six spherical sen-
sors (I foot in diameter) mounted on three sets of orthogonal
booms (length 3 m) [Mo:er aml Serlin, 1969]. Conductivity
measulements using the relaxation time constant method were
obtained every 30 rain. Similar instrumentation packages have
been flown before and are described by tlolzworth 1"1981] and
ltolzwortli atJd Chiu 1,1982]. More details on the ballooon
system are. givcn in the companion paper [Holzworth et al.,
this issue], hereinafter referred to as paper 2.
The Super-Arcus parachute paylod carried a blunt-probe dc
electric field sensor (with a maximum frequency of about 100
Hz) and a Gerdien condenser to measure atmospheric conduc-tivilies. More detailed information on this measurement con-
figuration can be found in the works by ltale, et al. [1981] and
Mitchell et al. 1,1982] and in paper 2.
Both ballistic payloads were instrumented with dipole elec-
tric field detectors employing spherical sensors mounted on
the end of extendable booms. The ionospheric rocket, known
as Thunder Iti, had two sets of booms of length 5.5 m mount-
ed orthogonally to each other (and to the spin axis of the
rocket) with a vertical separation of 1.5 m between boom sets.
Thunder Ili also carried a. fixed bias Langmuir probe operated
in the electron saturation region to measure relative electron
densities. The mesospheric rocket (Thunder Lo), which is also
dcscribed by Kelle), et al. [1983], had two boom sets of
lengths 4.0 m and 5.5 m, oricnled perpendicular to the spin
axis along with a vertical probe of length 1.3 m along the axis.
Both payloads were de,,;igned to make de, low-frequency, and
broadband veclor electric field measurements. The highest-
frequency response for one component of the electric field was
48 k llz. The response lime for a full veclor measurement was14 kltz on 'l'ht, nder Iti and 8 kllz on Thunder Lo.
The storm consisted of four major cells• Figure I shows the
position of each cell at the launch lime of Thunder Lo'(August
9, 1981, 0208:00 UT) and 15 s before the launch or Thunder
I li. The locations of Wallops lshmd and the stratospheric bal-
loon are indicated alone_ with the trajectories of the three
rocket payloads. Vertical radar scans of each cell just before
launch indicalcd heavy precipitation reaching up to at least an
alliludc of 13 kin. Radiosonde data indicated that the tropo-
" pause Icmperah, re minimum was al 16 kin, and we estimate
9815 ORJC_tNAL P.OCE IS
OF POOR QUALITY

- 9-
JOI.'RN._I OFGFOPIIYSIC.&L RESEARCIt, VOL qO, NO. AI0, PAGESqR24 9830, OCTOBER 1, 1985
Electrical Measurements in the Atmosphere and the Ionosphere
Over an Active Thunderstorm pl s o
2. Direct Current Electric Fields and Conductivity gNtv 7.3,2.7/
R. H. HOLZWORTIi
Space Sciences Division, Geophysics Prooram, University of Washinoton, Seattle
M. C. KELLEY AND C. L. SIEFRING
Department of Electrical Enoineerin#, Cornell University, Ithaca, New York
L. C. HALE AND J. D. MITCItELL
Department of Electrical Engineerino, Pennsylvania State University, University Park
On August 9, 1981, a series of three rockets were launched over an air mass thunderstorm off theeastern seaboard of Virginia while ,_imultaneous stratospheric and ground-based electric field measure-ments were made. The conductivity was substantially lower at most altitudes than the conductivityprofiles used by theoretical models. Direct current electric fields over 80 mV/m were measured as faraway as 96 km from the storm in the stratosphere at 23 km altitude. No dc electric fields above 75 kmaltitude could be identified with the thunderstorm, in agreement with theory. However, vertical currentdensities over 120 pA/m 2 were seen well above the classical "eleclrosphere" (at 50 or 60 kin). Frequent dcshifts in the electric field following lightning transients were seen by both balloon and rocket payloads.These dc shifts are clearly identifiable with either cloud-to-ground (increases) or intercloud (decreases)lightning flashes.
INTRODUCTION
Thunderstorms are known to be the source of the largest
atmospheric electric fields at altitudes up to several tens of
kilometers [Mozer, 1971; Holzworth, 1981]. The question of
just how far the electrical influence of an isolated thunder-
storm extends was the subject of a collaborative rocket, bal-
loon, and ground-based measurement program at Wallops
Island, Virginia, in August 198 I. (See Kelley et al. [this issue]
hereinafter referred to as paper I.) On August 8 at 2215 UT a
balloon was launched which reached a ceiling of 30 km about
2 hours prior to the near-simultaneous launch of three rock-
ets. These rockets had trajectories taking them over an air
mass thunderstorm with heavy precipitation reaching up to
over 13 km (the tropopause was near 16 km). The rocket
apogees were 74 km, 88 km, and 154 km altitude, respectively,
while the balloon was about 100 km northwest or the storm
and drifting down from 30 km to about 20 km over the courseof 3 hours. Ground-based electric field measurements were
made on Wallops Island within a few kilometers of the rocketlaunch sites.
An overview of the campaign including the transient and ac
electrical phenomena has been addressed in paper I. The mea-
sured dc electric field and conductivity data presented here
yield a picture which supports as well as disputes sometheories about the extent of thunderstorm dc electrical effects.
The long-held philosophy [cf. Chalmers, 1967] that the atmo-
spheric electric circuit is confined below an "electrosphere" of
50 km is not supported by these data. Vertical electric currents
over 80 pA/m 2 at 70 km were measured. As the conductivity
Copyright 1985 by the American Geophysical Union.
Paper number 4A8389.0148-0227/85/004A-8389505.00
increased, the electric fields became small, and no identifiable
storm-related dc electric fields have been found above 74 km
(except intense lightning-induced fields as discussed in paper
1). Fields of the order of 100 mV/m were seen both in the
mesosphere at 70 km altitude over the storm and in the strato-
sphere at a horizontal range of 96 km. These measurements
will be presented along with a comparison to various theories
of electric field mapping in the atmosphere.
I NSTRUMENTATION
A detailed discussion of the complete instrumentation is
given in paper 1. Pertinent to the present paper are the follow-
ing measurements. The vector electric field was measured in
the stratosphere on a free-flying balloon using the double
Langmuir probe technique [Mozer and Serlin, 1969]. These
data are accurate to less than I mV/m for horizontal electric
fields and _+ 15 mV/m for vertical fields. The balloon payload
also measured electrical conductivity by the relaxation time
constant method [cf. Holzworth, 1981].
The parachute-borne electrodynamics payload, which ejec-
ted from the rocket at apogee (75 kin), included a Gerdien
condenser for measuring both polar components of electrical
conductivity [Mitchell et al., 1982] and a sensor for simulta-
neously measuring the potential difference between a l-m me-
tallized section of the parachute's lanyar d and the payioad's
outer metallic surface [ltate and Croskey, 1979]. (The overalldil_ole length of this vertical E field probe w_ts 2 m.) Since the
flight was at night, there were none of tlae well-known photo-
emission problems due to the probe asymmetry; however, a
residual work function offset limited the absolute accuracy of
these electric field measurements to about 0.1 V/m.
Two high-altitude rockets, Thunder Hi and Thunder Lo,
also measured vector electric field, to altitudes of 154 km and
88 km, respectively. As with the balloon, double Langmuir
9824

Do We Need aGeoelectric Index?R. HoIzworthUniversit) of WashingtonSeattle
H. VollandRadioastrnnomisches i/st/rut,
University of Bonn,Bonn-E/de/k h,
Federal Republic of (;ermany
Introduction
We might put tile question slightly differ-
end)': What scientific problems require
knowledge of the gh)bal variahility of lower
atmospheric electric generators? In this pa-
per, we present our view of the necessity of
quantifying global electrical variability anddiscuss some potential uses of and available
methods for producing a geoelectric index.
During this last decade, we have observed
an increasing interest in the field of atmo-
spheric electricity. At the 1985 AGU
Fall Meeting in San Francisco, Calif., there
were seven half-day sessions on various as-
pects of atmospheric electricity--a great in-
crease over past years (see the abstract listings
for the Atmospheric Sciences and SPR: Mag-
netospheric Physics sessions in Eos, November
12, 1985, pp. 815-842 and 1028-1055). Thisarea of interest covers thunderstorm electrifi-
cation, lightning, and sferics, as well as light-
ning-induced magnetospheric effects and so-
lar-terrestrial electromagnetic coupling. For
many aspects of these studies, it would be ad-
vantageous to have a number that is a mea-
sure of present global electrical activity, suchas thumlerstorm occurrence, number of
lighming events, or ionospheric electric po-tential relative to the earth [see also Markson
and Muir, 1980]. Furthermore, there are
many other areas of research that would ben-efit from a geoe[ectric index, such as meteo-
rology and atmospheric science.A geoelectrk index should be similar in
utility to other solar-terrestrial activity indica-tors, such as the well-known solar sunspot
number or the various geomagnetic indices[see Rostoker, 1972]. These numbers are rela-
tively, simple to derive from ground-based ob-
servations on a routine basis. They are reli-
able, reproducible from alternative data sets,
and historically available for many decades.
Although the solar sunspot number is not an
optimum index of solar activity (the 10.7--cmsolar radio emission or the satellite-based UV
observations are better), its simplicity and the
length of the available data base outweigh its
disadvantages. Tile same is true for the geo-magnetic indices. Geomagnetic observatories
exist all over the world. They continuously
report data of the variable geomagnetic field,
which (when appropriately sampled) gives afair indk _,tion of the ceaselessly varying iono
spherk and m;/gnetospheric electric currentsystems
The usefulness of these indices is beyond
doubt, aml the question may therefore bc
raised whether a geoelectric index might be
of m-mpalahlc value in tile near or distant fu
lure Along thi_ line, it is interesting to notethat recent tt'.;ear( h has shown that tile large
scale return currents of the global circuit are
variable by lactors of two from the mean dai-
ly variation lt,lzworth et al. [1984] report thatsimuhaneous balloon-borne electric field
measurements from widely separated bal-
loons (over 1000 km)in the stratosphere of-
ten have the same magnitude and the same
temi_ral variation but nonetheless differ
drasticall) from the "expected" CarnegieCurve (which represents the average umver-sal time variation of the surface electric field:
ab<)ut + 20'7c/-15ek variahility from the
mean; compare Whipple [1929]). Thus we
now suspect that the glohal circuit is variableon a time scale of tens of minutes.
Who Are the Potential Usersof a Geoelectric Index?
Before we evaluate the different possible
meth(_ls tilt deriving a geoelectric index, we
will first deal with the question of who might
be interested in using such an index and why.
We will limit ourselves to three general areas
that world greatly benefit from a geoelectric
index: atmospheric and space electrodynam-
ics, amlospheric science, and meteorological
forecasting. For each of these research areas,we will illustrate basic science problems that
might not be solved without a quantitative
measure of global electrical activity or thesource distribution function. Within atmo-
spheric and space electrodynamics, we will
discuss outstanding scientific questions con-
cerning the global circuit, solar-terrestrial
coupling, lightning effects on the ionosphere
and magnetosphere, and the possible identifi-
cation of mesospheric electric field genera-
tors. Atmospheric science examples will in-
dude thunderstorm-generated or -transport-ed molecules, which play an important role in
stratospheric chemistry and planetary waveforcing by thunderstorms. Under meteorolo-
g],', we will discuss the need for better fog
forecasting.
Problems in Atmospheric and Space
Electrodynamics
The Global Circuit
Wil,on'_ [ 1920] hypothesis is that thunder-
storms are the main generators of the global
electric circuit, causing an electric potential
between earth and the ionosphere ofabout_200-500 kV and electric current den-
sity within the fair weather areas of a few pi-
coamperes per .square meter. Although it is
widely accepted, this hypothesis has not yet
been proven beyond doubt [see Dolezalek,1972]. We know that a typical thunderstorm
generates an upward dc electric current ofthe order of l A and that extrapolation from
meteorological data suggests that -1000-
2000 thunderstorms are active at any time.
On the other hand, lighming currents are as-
sunled to close (at least partly) tile glohal cir-
cuit I_'tween the ground an<l the storm
clouds (Figure I). The existing data do not
- 10 -
[Oe, O,gphe r e
Earth
a)
go
Rt
b]
F/g. I. Electronic circuit equivalent to
global electric circuit [from Volland, 1984].
allow the determination of a quantitative rela-
tionship between the various parts of the
global electric circuit. A geoelectric index,
along with an extensive short-term measure-
ment program .of electrical parameters by air-borne, balloon-borne, and satellite-borne de-
tectors, will be necessary to quantitatively un-
derstand the global circuit.
Solar-Terrestrial Coupling Processes
It is now widely recognized that the current
systems driven by global thunderstorms and
by magnetospheric plasma phenomena coex-ist in the middle atmosphere and above. For
instance, recent models of thunderstorm cur-
rent systems [e.g., Tzur and Roble, 1985] showthat most of the return current from a thun-
derstorm generator that penetrates the tropo-
pause flows globally through the ionosphereand along plasmaspheric magnetic field lines.
Furthermore, the first experimental evidenceof these thunderstorm dc current systems up
to at least 70 km altitude (well above the clas-
sic "electrosphere": see Chalmers, [1967])has
just been reported [tlolzworth et al., 1985].
The opposite situation occurs for large-scaleelectric fields in the magnetosphere, which
have long been known to drive current sys-tems down at least to the stratosphere [Mozer
and Serlin, 1969]. Furthermore, the typical
temporal variability of a magnetospheric sub-storm is of the same order as a large thun-
derstorm (about I hour, say). For these rea-
sons, we suggest that a quantitative estimate
of the dynamical variability of the tropo-
spheric source of electric phenomena (such asthunderstorms) is.necessary before the im-
portance of upward or downward coupling of
electrical phenomena can be clearly ad-dressed. For instance, identifying an effect of
a 10% variation in the ionospheric potential
caused by solar or magnetospheric phenome-na [Iferman and Goldberg, 1978] would be
nearly impossible without knowledge of thenatural variations of the ionospheric potential
caused by global thunderstorms (or other tro-
pospheric generators).
(:,ql',ti_.ht I!INI; hx tlw .\nleri_an (;eol}hysic:ll t.'ni, nl

- 11 -
.IOtRN._.L _)f Ci[_)I"IIYS1CAL RESEARUII, v('_l_ q2. "_¢_ I-_. P'kGI_S 3127 3134. \l,_R('ll 20. I9_7
Electrical Potential Measurements in the Lower Atmosphere
J. D. Wooster AND R. H ttot;_voRnl
Space So&rices Division, Geophysics Program, University of Washington, Seattle
I.owcr-atmospheric potential measurements obtained in ]983 through 1985 using the fly-wire technique aresummarized in this paper. Observed values of the polential were in the range of 50-100 kV in Fairbanks,Alaska, compared with 100-200 kV at Wallops Island, Virginia. While differences are seen in absolute potentialfor different sites, the daily variations are similar in character. When I-hoar averages are formed from the entire
data set the result is a unitary variation very reminiscent of both the Carnegie curve and more rectmt stratos-pheric electric field data. A comparison with an aircraft Potential measurement in the same vicinity during April1983 demonstrates that the two techniques yield rough])' similar results, except that the lly-wire measurementswere 20-30% lower in absolute value. For the Alaska data, no clear effect on the potential was seen during a
400-nT auroral magnetic perturbation.
1. L'¢I'RODUCTION
In this paper we report the results of a series of long-term
(several days at a time) continuous measurements of the electri-
cal potential across the lower 1.5 km of the atmosphere. Meas-
urements have been made in North America during local spring
and summer at both mid-latitudes and in the auroral zone. The
measurement system described in this paper is based on the Hy-
wire technique developed with a smaller system by Ifolzworth
[1981] and described by llolzworth et al. [1981] and tlolzworth
[1984a]. Hy-wire is a device capable of making a continuous
high-impedance dc potential measurement across the lower 1.5
km of the troposphere. This potential difference measurement is
made with a time resolution on the order of 30 s, and the device
can be operated continuously for a period of weeks. Continuous
data for long periods with this time resolution are not available
from the integrated electric field sounding technique [e.g.,
Muhleisen, 1971, 1977; Markson, 1977, 1985]. Additionally,
this high-impedance Hy-wire method avoids the corona
discharge problems inherent in the otherwise similar low-
impedance tethered balloon experiments described by Vonnegut
et al. [1973] and Willett and Rust [1981]. Their corona prob-
lem is tleated theoretically by Willett [1981].
The heart of the Hy-wire system is a long insulated high-
voltage cable reinforced with a Kevlar core. The insulation is
stripped from the upper end of the cable and the internal con-ductor is connected to a 10-m wire mesh, which is flayed at the
ends to form corona points [lolzworth [1984a]. This end is
then attached to a 1060-m 3 aerostat with a 15-m piece of ordi-
nary 3/8-inch (0.95-cm) nylon rope and raised to an altitude of
1.5 km agl. (above ground level). The aerostat itself is secured
with a separate insulating tether to minimize perturbation of theambient electrical environment. The detailed specifications of
this special, custom-made cable are given in Table 1.
The lower end of the wire is connected, through a cablc reel,
to a cylindrical ahuninum "tank" with hemispherical conducting
ends (Figure 1). Whcn the external ground strap is removed, the
tank becomes electrically insulated from the ground (on l-m
Teflon legs) with a measuri:d impedance of ->5 × l013 .Q under
potcntial differences of < 200 kV. This is oonceptually similar to
Ben Franklin's "sentry box" experiment, except that our
Copyright 1987 by the American Geophysical Union.
Paper number 6I"30630.
0148 -0227/87/006D-0630$05.00
impedance is higher and we use electronic detectors instead of
our fingers!
While the tank is grounded, the wire is first raised to operat-
ing altitude. At that time there is a potential difference on the
order of 100 kV between the upper end of the grounded cable
and the surrounding atmosphere, due to the fair-weather electric
field. It is thus in corona and will emit a space charge plume.
When the ground is removed, the apparatus (tank, wire, and
braid) is electrically floating and is thus charged by the corona
current until the potential difference (between the wire and the
surrounding air) falls below the corona initiation voltage (< 1
kV). The time constant for this equalization has been measured
and is on the order of 30 s. This sets the upper ]imit of the
system's time response for dc potential measurements. Addi-
tionally, the system has a fast, capacitively coupled ac response
[flolzworth and LeVine, 1983]. A few time constants after the
removal of the ground strap, the wire and tank are at the poten-
tial of the ambient air at 1.5 km, relative to the ground (to
within 1% = (corona initiation voltage) / (operating voltage); see
llolzworth, [1984a ]). The field due to charge stored on the tank
at a given potential is measured with an electrostatic voltmeter
(Monroe Electronics Incorporated, model 244), previously cali-
brated with a small high-voltage generator. The apparatus as a
whole thus gives us a measurement of ambient potential at 1.5
km relative to the ground, while avoiding any direct connection
with the high-voltage tank. Relevant system parameters are
given in Table 2.
During the Hy-wire flight at Wallops Island, Virginia, in April
1983, the original Hy-wire system [llolzworth et al., 1981] was
operated simultaneously with the new s)_tem at another sea
level site separated by about 3 km horizontally. Grounding and
refloating either system had no discernible effect on the potential
measured by the other, even though clearly visible on nearby
field mills 10-20 m away. A different comparison was made for
the June 1984 flight in Poker Flat, Alaska. Two ground-based
field mills built by the University of Minnesota were operated
(by a team under the direction of the late Don Olson) during part
of the Hy-wire flight. One was placed about 100 m from the
Hy-wire site on the ground, and the second field mill was placed
about 11300 m away on a hillside, at an altitude of =150 m (slant
range = 1.7 km to top of Hy-wire) relative to the site (see inset,
Figure 5). This second field mill did not show any electric field
variations related to the groundings and refloatings of the Hy-
wire, although a series of careful coincidence experiments wereconducted. The first field mill, at the 100-m distance, showed
312"

i._
I
!I',ff
t!
t_
- ].2 -
/Electric Fields in the Middle Atmosphere
Robert H. Holz_orth
SpaceScienceDivision.GeophysicsProgramAK-50,UniversityofWashington,Seattle,WA 9RIgLUSA
Received September 15.1986.acceptedocwber 30. 1986
Abstract velocity of the ith charge carriers, we can write the mobilityof the ith species as _c_= V,/E.
All of ihe solar electromagneticenergy impinging on the earth must pass Much effort continues to go into the measurement ofthrough the middle atmosphere in some form. "l'his weakly conductingregion betweenthe cloud tops and theionosphere has often been considered conductivity in the middle atmosphere. While it is not theto Ix electrically passive.This paper will review what is known about the purpOSe of this paper to critically evaluate the measurementslarge scaleelectrodynamicsof the middleatmosphere and present the results , tof and techniques for determining conductivity, mobility'of some recent researchwhich contradicts the historical viewof the region: or charge density, I will discuss the present level of under-One key 1o understanding middleatmospheric electrodynamics is a good standing of middle atmospheric conductivity and identifyunderstandingof the temporally and spatially varyingelectrical conduc-tivity. With the knowledge of the conductivity, the middle atmosphericeffects of external electric generatorscan often be determined by solvingatime dependent boundary valueproblem often referred to as "mapping" theelectricfield.This has beenauseful techniqueforstudyof current generatorsboth below and abovethe middleatmosphere. Furthermore,contrary to theclassical picture, there may be sourcesof electric fields within the middleatmosphere. Certainly there are sourcesof variability in the conductivitywhich aclively modify the expected signal from external generators. Themany-fold increase in available electric parameter data from within themiddleatmosphere has been a great stimulusto recent research,tlowever.this reviewwiltconcludethat these measurementshave tendedto raisemorequestions than answers. That is a clear indication that the fieldof middleatmospheric electrodynamicsis ripe for breakthrough research which willonly come as a result of a newand vigorousmeasurement program.
1. The electrical environment
This is the first of three main sections of the paper in which
I will discuss the background electrical environment of themiddle atmosphere• The second section will present a reviewof the main sources for electric fields and currents within the
middle atmosphere. This will in turn be followed in the thirdsection with the latest results on variability of these sources
along with a discussion of the possibility of a new sourcewithin the middle atmosphere.
The electrical environment of the middle atmosphere is
characterized by a conductivity which varies by 10 orders ofmagnitude from about 10 -t2 S/m at the tropopause to about10 -_ S/m at the base of the ionosphere. The degree to whichelectric fields and currents can penetrate into and through the
region is a strong function of the local, time-dependent con-ductivity profile in altitude. In the simplest formulation,appropriate throughout most of the middle atmosphere, thetime dependent electrical conductivity (a_) for a particul'_.rspecies (i) of charge carrier (e,) is a function of numberdensity (n,) and mobility (_-,): a_ = e,n_K, The conductivity iscollision dominated throughout most of the middle atmos:
phere so that in addition to the species mass (m,) the mobilityis controlled by the ion-neutral collision frequency v_. Theconductivity is given by the slandard Spitzcr resistivity [I]:a, = n_e_/m,v, so that _c,= e,]m,v,. Throughout the middle
atmosphere the relation between current density and electricfield is given by Ohm's Law J = aE (for isotropic conduc-tivity). For completeness we note that, from the defiuition of
the charge density J = Z, n,e,l_, with V,,being the bulk drift
some limitations we should all keep in mind when discussing
' middle atmospheric electric fields and currents. Figure 1 from
Hale [2] is a recent compilation of many measurements ofconductivity which serves to emphasize the degree of time
dependence of the atmospheric conductivity• This Figureshows that one can reasonably expect a one to two order of
magnitude daily variability in conductivity at any altitudeand that at some altitudes the range of possibilities is over six
orders of magnitude. With this level of variability we must be
very careful to understand the source of the conductivityprofile used in any theoretical study. In other words, anyattempt to relate electrical observations at one altitude tosources in different locations must use the actual conductivity
on that day in that location and avoid using a summaryprofile or other guess such as the average of all the data inFig. I. Furthermore, there are only a very limited number ofrocket ranges in the world from which data such as those inFig. I can be taken. Thus one should also be careful tounderstand the basis for global extrapolation of averagesfrom selected sites. Another way to look at Fig. I is thatthe altitudes above balloon heights'(say 40km) and belowaccurate radar measurements of number density (say 90 km)show the widest variability because of lack of measurements.
Researchers often summarize the conductivity between the
ground and the ionosphere with a single exponential profilein altitude (z) with scale height H such as a = ao e::n. Forinstance in the case of Fig. I one might lay a ruler along theplot and conclude that a fit giving a = 10-_4 at the groundand a = I0 -_ at 100kin would be a good average represen-
.ttation which might be reasonably useful as a global quitea.verage. That would be a scale height of H = 3.62 km whichis much less than is used in many models [3-5]. The effect of
th'is difference in scale height is dramatically obvious in
, Ogawa's article [5]• Ogawa derives an estimate of the current"to the ionosphere from a thunderstorm (.based on a Holzerand Saxon cloud model [6]) to be as much as 17"/, of thethunderstorm source current (see eq. (5), [5]) usingH = 6km. If we set H = 3.62km that number would be
only I1% or nearly a factor of two from his rounded upestimate of "as much as 20%" (p. 5952. Ogawa [5]) of the
current output from a storm going up to the ionosphere. Byextrapolation of this result one might conclude the current tothe global circuit was on the average twice as large as can be
justified from the average of data in Fig. 1.
Physica Scripra TI8

- 13 -
JOURNAI.()[:(;Ii()P|IYSI(AI RFS[ ,%RCIt. V()I, 94. N(). 111_. I',\(il >, 16.42 _1_1f_.4"_5. N()X[ MBI{R 20. ['lgq
Thunderstorm Relaied Varialions in Stratospheric Conductivity
Ih ,_ th, ROtiI3RT It.t|oi./.W_mtil+ ,t'm Y _ Ol I.l
._,p,*,<' S<'/cm c Division. GCollhvxic.c Program. l _uil'l't _tl_ ,q It o_hillk'lOtl, ,gi'ttllll +
Moasuronlonls
3 iOi$ ca
q o a t 'i"/Tile vector elcclric licld and polai conducli'.ilies were ii_ea4ured b) lero-presqlre ball_k_ll-bom¢ payloads
launched fronl Wallops Island. Virginia during tile summers of lug7 alld lUNg, Dala were collectcx.l oxcr Ihllil
derslorrils (or electrilied clouds) during 6-hour flights at altitudc_ ilear 3("1kill. The vet.'tor electric' lield inea_;ure -
menls were made with the double l.angmuir probe high-imp..'dance method, aild Ihe direct conduciivil)measure-ments were obtained with the relaxation technique. We show evidence for conductivity variations over thunder-
storms (or electrified clouds}. We lind that h)th positive anti negative polar conduclivily data do show variations
of up to a factor of 2 from arrlbient values associated with the disturbed periods. Some ideas for possible physi-. cal mechanisms which may be responsible for the conductivity variations over dmndcrstonns are also discussed
in this paper.
INTRODUCTION
Following a suggestion of thunderstoml related stratospheric
conductivity varialions by Benhrook et al. [19741, Bering el al.
[1980] interpreted their conductivity measurements over a thun-
derstorm as being affected by the presence of Ihe stem1 itself.
However, it was not until recenl years that a statistical survey
about the conductivity variations over thundcrstom_s was con-
dueled by tlolzworth e/ al. [1996]. They reported 23 cases for
which conductivity mea,surements oblaincd by balloon-borne
instrumentation at 26-kin altitude over thunderstorms showed
significant variations from the fair-wcathcr values. In several
cascs these variations exceeded 50c/< of the mean fair-weather
conductivity value. More recently, Pinto e/ al. [19881 also
found significant perturbation in the conductivity measurements
at 26-kin altitude over electrified convective clouds. However,
these new results at first seem to bc contrary to previous work
[cf. Stergis et aL, 1957; Mozer, 1971; f#olzworth, 1981; Barcus
et al., 1986] in which no significant thunderstorm related con-
ductivity perlurbation in the stralosphere was noted. A recent
exchange of papers between Vottnegut am/ Moore [1988] and
Holzworth et al. [19881 has served to focus the issues involved
with making these measurements over thtmderstorms. One com-
mon conclusion of these papers is that further measurements are
necessary in order to judge the validity of the reported conduc-
tivity variations in the stratosphere. This present paper
addresses this suggestion with new data.
it has been known for some time that understanding middle
atmospheric conductivity is of primarY importance for solving
electrodynamic coupling problems bctwccn the ground and iono-
sphere [of. Reid, 1986]. Therefore if these thunderstorm related
conductivity variations are indeed real, then our current view of
the behavior of the global circuit needs to be reexamined. For
example, direct thunderstorn_ models as well as models about
large-scale current systems related to thunderstorms which use a
fair-weather conductivity profile may need to be considerably
modified.
In this paper, we report our htlesl results of conductivity
measurements over thunderstorms (.or electrified clouds) by
using zero-t_.essure balloons launched from Wallops Island, Vir-
ginia (latitude = 37.8 °, longitude = 284.5°), in July 1987 and
Copyright 19149by the American Get,physical Uni_u'i.
Paper number RgJD01521.
(ll 4g-11227/gg/ROJ D-01521 $02 iX)
July 1988. We v, ill show' two cases in which conduclivi!y meas-
urements do pre,_ent varialions while our balloons arc over thun-
derstorm (or eleclrificd cloud) systems. These variations are
found to be up to a fuctor of 2 above fair-weather values.
Mechanisms for the conductivity variations over thunderstorms
are as ycl unknown; however, we will discuss some ideas for
possible physical mechanisms which might accounl for these
nleasurements.
OBSERVATION
The balloons were of zero-pressure type, with float altitudes
near 30 kin. Wc note this altitude is nearly a full conductivity
scale height above the float altitudes repotled in Hol:worth et al.
[19861. On each balloon, the payload to measure the electric
field and conductivity was designed in a manner similar to that
described earlier by Mozcr and Serlin [1969] and Holzworth
[1977]. Three components of electric field were determined by
the potential difference measured on orthogonal pairs of isolated,
aquadag-coaled, spherical conductors using the double-Langmuir
probe technique. The accuracy of the electric field measure-
mcnts was aboul +_1 mV/m for horizontal components and +15
mV/m for the vertical component. Direct conductivity measure-
ments were obtained by the relaxation time conslant method.
First, the upper and lower vertical conductors were biased to
+2.5 V and -2.5 V, respectively, and then allowed to float back
to ambient values by collecting ions of different signs. High
resolution telemetered data obtained simultaneously from each
refloated conductor are separately least squares fit to an
exponential equation to get the relaxation lime constants ('el).
The polar conductivities arc then given by o+ = E° / t+, and
= e / "t, where f:: is the pcmfiitivily of free space. The conduc-e " O
tivity measurements were made evcry 10 rain.
The lighming flash rate presented in this paper was deter-
mined by thc number of lighming flashes per minute as seen in
the balloon electric field data. The balloons were tracked by
radar throughout each flight. Thunderstorm systems were
identified by salcllile weather observation (Le., deep convective
clouds) and by the State Univergity of New York at Albany
(.SLINYA) lighming dctcction network. Therefore the balloon
position relative to a lhundcrsloml system could be determined
independently lronl the payload measuren'lenls.
The balloon of July 9, 1988, was released at 2339 UT and
attained a lhnit altiludc of 30 krrl at 0114 UT on July 10. It was
lemlinalcd at {150() UT after aboul it 6-tutor flight period Figure
I shows the areas covered by thundcrsitwm', during this balhxm
Ilight given by St'"q',"\ lightning deiccliorl nctv, ork. The little
1¢,.42'I
/ (;l:()l'll'_%lt.,\l- Rl:bl:At_,ll I hI It R_, x,I)l_ 17, N() _2, t'A(;I-S 2221 2224, ,,.¢)V_.\_I',I I_ ','j'j!;- 14 -
/INTENSE IONOSPHERIC ELECTRIC AND MAGNETIC FIELD PULSES
GENERATED BY LIGHTNING
M, C. Kelley and J. G. Ding
School of Electrical Engineering, Comell University
54-'6. T
.zso
R. H. Holzworth
Geophysics Program, University of Washington
/kb_.s.Ka_. Electric and magnetic field measurements havebeen made in the ionosphere over an active thunderstorm and
an optical detector onboard the same rocket yielded anexcellent time base for the study of waves radiated into spacefrom the discharge. In addition to detection of intense, but
generally well understood whistler mode waves, very unusualelectric and magnetic field pulses preceded the 1-10 kHz
component of the radiated signal. These pulses lasted severalms and had a significant electric field component parallel to the
magnetic field. No known propagating wave mode has thispolarization nor a signal propagation velocity as high as wehave measured. We have investigated and rejected an
explanation based on an anomalous skin depth effect.Although only a hypothesis at this time, we are pursuing amore promising explanation involving the generation of the
pulse via a nonlinear decay of whistler mode waves in the
frequency range 10-80 kHz.
Introduction
In situ data from a number of spacecraft-borne instruments
have indicated that transient ionospheric effects accompany
lightning discharges [Kelley et al., 1985; Siefring, 1988; Vosset al., 1984]. These are direct electrical transients in the
ionosphere over thunderstorms as distinct from the wellknown packets of whistler mode waves [c.f. Helliwell, 1965],
which propagate throughout the magnetosphere and, whenamplified by wave-particle processes can result in ionospheric
perturbations by precipitated electrons (Trimpi events). It isthe direct transient and not the Trimpi event which interests ushere. Previous work has described early observations of theelectrical transient [Kelley et. al., 1985] as well as associated
optical effects [Li et al., 1990]. In this letter we report on anew rocket experiment designed specifically to study this
direct transient phenomenon.The experiment, called Thunderstorm 1I, was carried out at
the Wallops Island Flight Facility in July 1988. It involved thesimultaneous launch of two high flying rockets (apogees over300 km) with electric field and panicle detectors. Regional
lightning location information was available in real time fromthe East Coast Lightning Network run by the State Universityof New York at Albany (SUNYA). The main Thunderstorm
II payload was on a magnetically oriented Black Brant IXrocket which was launched over a small thunderstorm cell at
• roughly midnight true local time. The cell was pan of a 500km long line of thunderstorms which developed over the
Copyright 1990 by the American Geophysical Union.
Paper number 90GL02044
0094-8276/90190GL-02044503.00
mountains and slowly died out as the wind patterns caused the
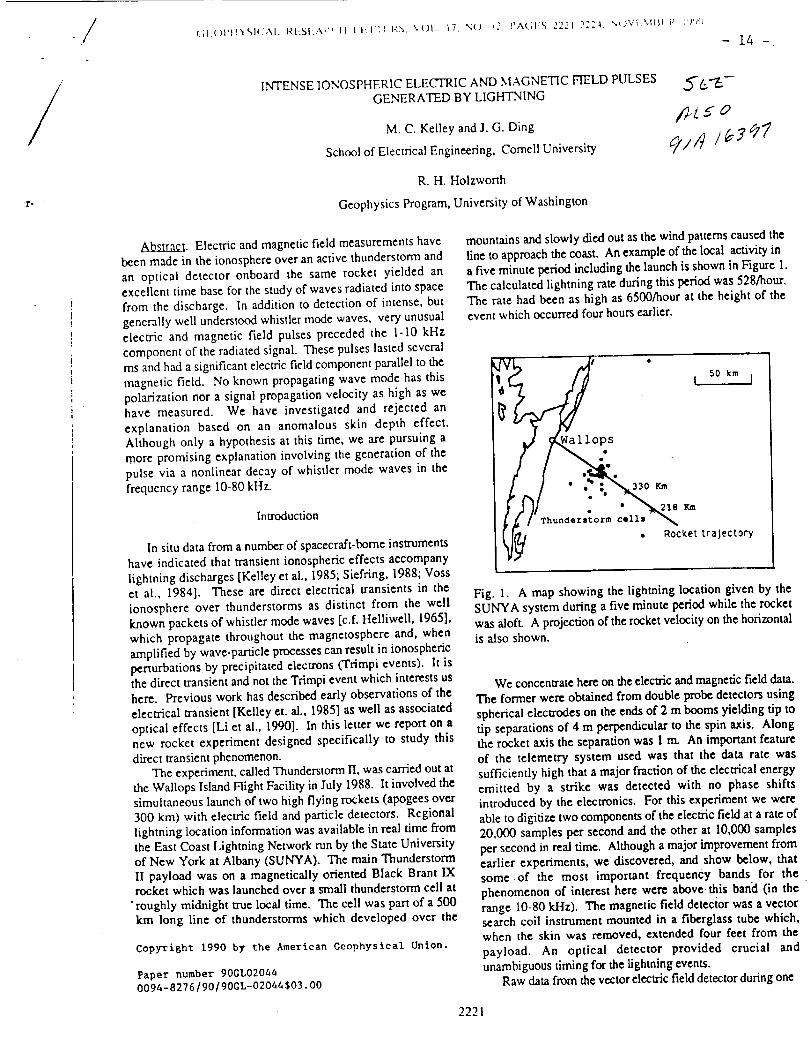
line to approach the coast. An example of the local activity ina five minute period including the launch is shown in Figure 1.The calculated lightning rate during this period was 528/hour.The rate had been as high as 6500/hour at the height of theevent which occurred four hours earlier.
s
( •, " _18 Km
Thunderstorm cells
, Rocket trajectory
Fig. 1. A map showing the lightning location given by theSUNYA system during a five minute period while the rocketwas aloft. A projection of the rocket velocity on the horizontal
is also shown•
We concentrate here on the electric and magnetic field data.
The former were obtained from double probe detectors using
spherical electrodes on the ends of 2 m booms yielding tip totip separations of 4 m perpendicular to the spin axis. Alongthe rocket axis the separation was 1 m. An important feature
of the telemetry system used was that the data rate wassufficiently high that a major fraction of the electrical energyemitted by a strike was detected with no phase shiftsintroduced by the electronics. For this experiment we were
able to digitize two components of the electric field at a rate of20,000 samples per second and the other at 10,000 samples
per second in real time. Although a major improvement fromearlier experiments, we discovered, and show below, thatsome of the most important frequency bands for the
phenomenon of interest here were above this band (in the "range 10-80 kHz). The magnetic field detecior was a vectorsearch coil instrument mounted in a fiberglass tube which,when the skin was removed, extended four feet from the
payload. An optical detector provided crucial andunambiguous timing for the lightning events.
Raw data from the vector electric field detector during one
2221
JOtR'< %1
- 15 -
(}FGI;OPItYSICAI. RtiSILAR(It. V()I. '_t_. N(). AZ. PA(iI-_S I'_l_,-I_Zh, I:tlIIRi'.\RY I. 1991
Anomalous optical Events Detected by Rocket-Borne _/,,q _5-5"_(..
Sensor in the WIPP Campaign
YA Qt LI, 1ROBERT H HoLzwor'nt, t HUA Hu, t MICttAV.LMcCARTHY, t R DArt.I- MASSE','. l
PAUL M KhVI"NqSR, 2 JUAN V. RODRIGUES, 3 UMRAN S. INAN, 3 AND W. C. ARMSTRONG 3,4
A photodiode sensor has been designed and flown in an experiment to measure the broadband optical power
of lightning. Several such sensors were launched on one rocket-borne payload (apogee over 400 kin) and four
balloon-borne payloads (float altitudes over 30 kin) during the Wave Induced Particle Precipitation (WIPP) cam-
paign (Kintner el al., 1987) at Wallops Island during the summer of 1987. Sensors aloft measured the optical
power of events occurring below the payloads along with the waveforms of electric field transients. The same
transients were recorded simultaneously by a ground-based VLF receiver with a magnetic (loop) antenna.
Rocket and balloon sensors detected a great majority of lightning flashes also recorded by the State University of
New York at Albany (SUNYA) lightning locating network. Many other signatures which were similar to those
of lightning but were not recorded by SUNYA were also detected. Overall during the 10-min flight, more than
500 lightning-related events were detected in the (wide) field of view of the rocket-borne pho_odiode sensor.
Among these is a class of about 23 events all having an anomalous signalure, with obvious clustering of optical
impulses or continuous emissions, and resulting durations of several hundred milliseconds. Such durations are
much longer than typical for the lightning-related events recorded at the rocket, which are more frequent overall.
Every anomalous optical event (AOE) was accompanied by broadband VLF signals of a distinctive character,
signals which were received on the balloon, the rocket, and the ground. No such AOEs were ever detected by
the balloon optical photodiode sensor even when the data suggested that a signal from the AOFs also should
have been detectable at the balloon. In fact, no such unusually long-enduring optical events were ever detected
by a balloon phot_iode sensor on any of six separate flights in 1987 and 1988 under similar experimental con-
ditions. Responses excluded so definitively from detection at the balloons are consistent with events originating
primarily at altitudes above the 30 km balloon altitude. In considering possible sources above 30 km we find that
the AOEs do not seem to resemble other natural optical phenomena, such as meteors which bum up well above
30 km in the nfid-latimdc atmosphere.
1. INTRODUCTION
During the summer of 1987, as part of the Wave Induced Par-
ticle Precipitation (WIPP) Campaign [Kintner et al., 1987], one
rocket (apogee over 400 kin) and four balloons (float altitudes
over 30 km), were launched near thunderstorms from the NASA
Wallops Flight Facility (37.8 ° N, 75.4 ° W). The rocket was
launched at about 0353:49 UT on the night of July 31, 1987,
and achieved an altitude of about 412 km 5.5 min later, while a
balloon launched about 2 hours earlier floated at an altitude of
31 km. A photodiode sensor for measuring the broadband optical
power of lighming and a broadband VLF receiver for measuring
electric field were included in both the rocket- and balloon-borne
payloads. Two narrow-band photometers and a Reticon imager,
provided by George Parks (described by Massey et al. [1990]),
were also mounted on the rocket. Even though its spatial resolu-
tion was relatively low the imager was intended to provide a
means for locating (roughly) any important optical events
observed.
During the 10-min rocket flight, more than 500 events were
detected by the optical sensors on the rocket and balloon
together. Many of these events were individually correlated with
cloud-ground (C-G) lightning flashes located by the State
University of New York at Albany (SUNYA) lightning network.
tSpace Sciences Division, Geophysics Program, University of Washing-
. ton, Seatde.
/'School of Electrical Engineering, Comell University, Ithaca. NewYork.
3STAR Lab, Stanford Univcrsity, Stanford, California.
'lAlso at Armstrong Enterprises, Palo Alto, California.
Copyright 1991 by the American Geophysical Union.
Paper number 90JA01727.
01484)227/91/90JA-01727505.00
A number of other events not indicated in the SUNYA data can
probably be attributed to intracloud (I-C) lightning or to C-G
lightning missed by the network. In addition to all these sup-
posed lightning events the rocket detected a third class of optical
events which have anomalous signatures. These involve many
more optical impulses and longer optical duration (about several
hundred milliseconds) than typical of lightning events. These
anomalous optical events (AOEs) were always accompanied by
characteristic radio signals detected primarily by the ground-
based VLF receiver in the form of a strong clustering of VLF
impulses embedded in mostly weaker, more continuous noise. At
the rocket and balloon the detected amplitude of these charac-
teristic signals was generally less than that of the typical VLF
radio impulses or "atmospherics" usually produced by the light-
ning.
None of the long-duration AOEs were detected by the WIPP
balloon photodiode sensor. This is true even though the data
from the Reticon imager on the rocket indicated that some of
them were from localized sources which should have been visi-
ble to the balloon sensor. By this we mean primarily that we
have been able to localize some of the AOEs to regions from
which the balloon did detect most of the SUNYA-located light-
ning flashes which were nearly simultaneous with some of the
AOEs. In fact, no AOEs of the WIPP or any other type were
ever seen by any of thc six balloon payloads which were floated
in similar situations (four flights in 1987, two flights in 1988;
see tlu et al. [1989]). This suggests the possibility that the
AOEs reported here for the .WIPP rocket flight may have
occurred above the balloon, that ig _.t some altitude above 30
kiD..
Lightning discharges in the Earth's atmosphere typically occur
below the tropopause at about 15 km altitude maximum. The
few reports available indicate that lightning which sometimes
goes upw_d to the clear air above 15 km is uncommott

- 16 -
REVIEWS OF GEOPHYSICS, SUPPLEMENT, PAGES 115-120, APRII. 100 I
U.S. NATIONAL REPORT TO INTERNATIONAL UNION OF GEODESY AND GEOPttYSICS 1987[ 1990
Sez -
Atmospheric Electrodynamics in the US: 1987-1990 ,,qxY
Geophysics Program, University ofWa._hington, Seattle
This paper summarizes published atmospheric electrodynamics research of the past few years, h concentratc-son the work of US rtsearchers and does not claim to provide a full bibliography. The paper is divided into threegeneral areas: I. The ionosphere as a source for middle atmospheric electrodynamics; 2. Regional and globalscale eleetrodynamics; and 3. Thunderstorms and lightning.
]N_FRODUCrION
In the lasthalfof the 1980's we have seen an increase in
researchspanning the traditionallyseparateddisciplinesof tro-
posphericand ionospheric electrodynamics. We now have strong
evidence for the importance of thunderstorm electrodynamics to
the mesosphere and ionosphere. Likewise, our understanding of
the downward penetration of ionospheric and magnetospheric
current systems has grown. We have witnessed an important
expansion in our understanding of middle-atmosphere electro-
dynamics covering a region some have referred to as the ignoro-
sphere. Coordinated thunderstorm campaigns have begun to pro-
vide the kind of high resolution parameter measurements with
which detailed thunderstorm electrification and lightning models
can be tested. Similarly, recent satellite programs have provided
us a new diagnostic for large-scale ionospheric electric fields and
current systems that are important to atmospheric electrodynam-
ics. Even since the publication of the NRC report [Krider and
Roble, 1986] there have been developments in our understanding
of the global circuit which indicate the inadequacy of simplistic
models of global electrification (see Regional and Global Scale
Electrodynamics section below). It is fair to say that we have
no existing models of either global electrodynamics, or indeed of
thunderstorm electrification which can accurately predict the
occurrence or intensity of either.
Much of the recent growth in understanding of atmospheric
electrodynamics has come from new experimental efforts.
Recent balloon flights have resulted in the discovery of previ-
ously unknown regional scale generators. Airborne and balloon
measurements in and through thunderstorms have given us the
beginnings of a comprehensive data base for use in modeling
thunderstorms. Rocket and satellite flights have given us the
first direct evidence for energetic electron precipitation due to
lightning as well as the importance of electrodynamics to mesos-
pheric phenomena such as noctilucent clouds.
This paper will provide an overview of United States spon-
sored research developments in atmospheric electrodynamics
during the last few years. In this formidable task I have exten-
sive help from some key, recent reviews within the field. There
was no paper in the previous IUGG report on the broad subject
of atmospheric electrodynamics (AE) primarily because at the
time the National Research Council had just published a book
covering much of the subject [Krfder and Rob&, 1986]. Other
recent reviews covering various aspects of AE will be mentioned
in the topical discussion to follow. In particular, one should
Copyright 1991 by the American Geophysical Union.
Paper number 91RG00719.g755-1209/91/91RG00719 $15.00
take advantage of the recent special issue of JGR which sum-
marized the previous, International Commission of Atmospheric
Electricity meeting in 1988 [see J. Geophysical Res., 94, Sep-
tember 30, 1989].
As is always the case for the IUGG reports, I will be concen-
trating on investigations by US scientists. Such a review cannot
and should not be considered a full field review of a subject in
which important contributions are regularly made by scientists in
dozens of countries. This review is also complicated by the
extreme pressure to keep articles short. I have divided the paper
into three more general topic areas and follow with a brief dis-
cussion of some key improvements in technique. Working from
the top down I will review the recent US work in ionospheric
and magnetospheric electromagnetic component to atmospheric
electrodynamics, regional and global scale electrodynamics, and
electrified clouds and lightning.
IONOSPttERIC AND MAGNETOSPIW_IC
ELECTRODYNAMICS IMPORTANT To AE
tligh Altitude Sources of Middle-Atmosphere Electrodynamics
Since it was demonstrated by Mozer and Serlin [1969] that
large scale ionospheric electric fields drive important current
systems in the stratosphere, there has been a steadily growing
body of research on the influence on middle-atmosphere electro-
dynamics by ionospheric and magnetospheric phenomena.
Ionospheric and magnetospheric current generators are responsi-ble for one of the main atmospheric heating effects at high lati-
tudes in the mesosphere and thermosphere: Joule heating. The
coupling of these current systems to the neutral atmosphere has
been extensively modeled [Roble et al., 1987] and during a solar
proton event has been shown to be responsible for a 1° -
3°K/day heating rate, exceeding the daytime ozone heating in the
altitude range of 70 to 80 kin. Heating rates above 100 km were
even higher. Walker and Bhamagar [1989] combine both the
energetic particle and joule heating to calculate that in the upper
mesosphere the heating rates can exceed 10°K/day. Recentsatellite statistical studies [lleppner, 1987] and Lundquist [1990]
provide an updated view of the large scale ionospheric electric
field.
One of the more hotly debated subjects .is the possible direct
influence of magnetopause recormection, called flux transfer
events (FTE's), on ionospheric and atmospheric elei:tric fields
and on plasma flows [see Lanzerotti et aL, 1987]. 'rile magnetic
boundary between open and closed magnetospheric field lines
intersects the ionosphere variously between 65 and 75 degrees
and the magnetopause near its crossing of the earth-sun line.
Thus ionospheric current systems, such as those described in the
model of Crooker [19901. flow in response to the FTE in the
form of closure currents. Bering et al. [1989] report balloon-
115
- 17 -
J()I'RN.\I t)l (;IfJPFtY'-;IC._I. RESEAR(II. V()I. ,)" N_) \1. P\(;Ig _5-75. J.'_NI;..\RY I. Iq92
A Case Study of Lightning, Whistlers, and Associated Ionospheric
Effects During a Substornl Particle Injection Event
J. V. RODRIGUEZ, I U. S. INAN, 1 Y. Q. LI, 2 R. 1t. IIOLZWORTH, 2
A. J. SMITIt, 3 1_. E. ORVILLE, 4 AND T. J. ROSENBERG 5
Simultaneous ground-based observations of narrowband and broadband VLF radio waves and of cloud-to-
ground lightning were made at widely spaced locations during the 1987 Wave-Induced Particle Precipitation
0grIpP) campaign, conducted from Wallops Island, Virginia. Based on these observations, the first case studyhas been made of the relationships among located cloud-to-ground (CG) lightning flashes, whistlers, and
associated ionospheric effects during a substorm particle injection event. This event took place 2 days after
the strongest geomagnetic storm of 1987, during a reintensification in geomagnetic activity (Kp = 5) that didnot affect the high rate of whistlers observed at Faraday Station, Antarctica (L = 2.46). At the time of the
injection event, several intense nighttime thunderstorms were located over Long Island and the coast of New
"England, between 400 km northwest and 600 km north of the region geomagnetically conjugate to Faraday.About two thirds of the CG flashes that were detected in these thunderstorms during the hour following the
injection event onset were found to be causatively associated with whistlers received at Faraday. During the
same period the amplitude of the 24.0-kllz signal from the NAA transmitter in Cutler, Maine, propagatingover the thunderstorm centers toward Wallops Island was repeatedly perturbed in a manner characteristic of
previously reported VLF signatures of transient and localized ionization enhancements at D region altitudes.
Though such enhancements may have been caused by whistler-induced burst electron precipitation from the
magnctosphere, the data in this case are insufficient to establish a clear connection between the NAA amplitude
perturbations and the Faraday Station whistlers. In view of the proximity of the NAA great circle path to the
storm center, heating of the lower ionosphere by intense radiation from lightning may also have played a rolein the observed VLF perturbations. The onset of each of the NAA signal perturbation events coincided with an
intense cluster of radio atmospherics. Detailed temporal variations in the ELF (0.3-3 kHz) and VLF (3-30 kltz)
power of similar "sferic clusters" correlated well with variations in the power of simultaneous "anomalous"
optical events (AOEs) observed by a down-looking photodiode detector on a rocket at altitudes between 150and 412 kin.
/ L56
¢:/¢/e¢/
1. INTRODUCTION
Lightning is a frequent and powerful source of electromagnetic
radiation that can couple the neutral atmosphere, the ionosphere,
and the magnetosphere. At ELF (0.3-3 kHz) and VLF (3-30 kHz)
frequencies, such radiation propagates in the magnetosphere in
the whistler mode [llelliwell, 1965]. Interactions in the magne-
tosphere between whistler mode waves and electrons are a form
of coupling between atmospheric regions that is well documented
but still not completely understood. The whistler mode wave can
exchange energy through gyroresonant interactions with trapped
energetic electrons at or near the geomagnetic equator, lowering
the mirror height of some of the electrons and causing them to pre-
cipitate into the atmosphere, either directly in the hemisphere in
which the wave originated or in the conjugate hemisphere follow-
ing mirroring or backscattering front the top of the neutral atmo-
sphere [Chang and lnan, 1985]. Bursts of precipitating electrons
associated with whistlers have been measured in situ by rockets
I Space, Telecommunications and Radioscience Laboratory, Stanford
University, Stanford, California.z Space Sciences Division, Geophysics Program. University of Wash-
ington, Seaule.3 British Antarctic Survey (NERC), tligh Cross, Madingley Road, Cam-
bridge, England.
,t Department of Atmospheric Science, State University of New York
at Albany.s Institute for Physical Science and Technology, University of Mary-
land, College Park.
Copyright 1992 by the American Geophysical Union.
Paper number 91JA02583.0148-0227/92/91JA-O2583$05.C0
[Rycrofi, 1973; Goldberg et al., 1986] and satellites [e.g., Voss et
at., 19841. Prccipitation due to whistler-triggered emissions prop-
agating outside the plasmapause has been detected as secondary
brcmsstrahlung X rays and optical emissions [Rosenberg et al.,
1971; Bering et al., 1980; llelliwell et al., 1980; Doolittle and
Carpenter, 19831.
Secondary ionization due to whistler-induced burst electron pre-
cipitation has been causatively associated with characteristic am-
plitude and phase perturbations of VLF, LF, MF, and HF radio
signals propagating in the Earth-ionosphere waveguide [Baum,
1963; Helliwell et al., 1973; Carpenter et al., 1984; Moser et al.,
1988]. The secondary ionization causes a localized increase in
the ionization density at D region altitudes that, analogous to a
dent in a metallic waveguide, perturbs the mode structure of the
propagating wave. The ensuing constructive or destructive inter-
ference between the modes causes a temporary perturbation of the
amplitude and/or phase of the signal that is often referred to as
a "Trimpi" event [Wolf and lnan, 1990]. The delay between the
causative radio atmospheric and the "'Trimpi" event onset ("onset
delay") typically is less than 1 s [lnan and Carpenter, 1986], the
onset duration typically is less than 2 s, and the recovery lasts
about 10-100 s [Carpenter et al., 1984]. (A "radio atmospheric"
or "sferic" is the electromagnetic impulse from a discharge in the
atmosphere, such as a return stroke in a cloud-to-ground (CG)
lightning flash.)
Some VLF anlplitude perturbations have been observed with
onset delays and/or onset durations of <50 ms, too short to be at-
tributed to whistler-induced burst electron precipitation, although
the magnitude and recovery time of the perturbation are consistent
with a localized increase in the ionization density at D region alti-
tudes as described above [Arrrt¢trong, 1983; Inan et al., 1988a, b].
Such events are thus considered "early" and/or "fast" with respect

- 18 -
/06
Technical Memorandum 85072
HY-WIRE AND FAST ELECTRIC FIELD CHANGE MEASUREMENTS NEAR AN ISOLATED
THUNDERSTORM
Roberl H. Holzworlh
Unil'ersil v (_./ IVashinglon
S('_tltJ_', Washington
and
David M. Le Vine
NASA/Goddard Spa ce Flight Ce,ter
Greenbelt,/Ilarvhmd
ABSTRACT
F,lectric field measurements near an isolated tht.nderstorm at 6.4 km distance are presented
from both a tethered balloon experiment called I ly-wire and also from ground based fast and slow
electric field change systems. Simultaneous measurements were made of the electric fields during
several lightning flashes at the beginning of the storm which the data clearly indicate were cloud-to-
ground flashes. In addition to providing a comparison between the Ily-wire technique for measuring
electric fields and more traditional methods, these duta are interesting because the lightning flashes
occurred prior to changes in the dc electric field, although lty-wire measured changes in the dc field
of uf) to 750 V/in in the direction opposite to thc fair weather field a short time later. Also, the dc
electric field was observed to decay back Ioils i_rc-Ilash valtlc after each llash. The data suggest
that Ily-wire was at the field reversal tlisl;incc for Ihis ._torm ,rod suggest that charge realignment was
t_tking pl_lce in the cloud with a time constant on the order of 20 seconds.