Final Report NCCRP Baseline Study TEF/JBDC
67
BASELINE REPORT: STUDY OF THE CRAFT SECTOR ON THE NORTH COAST CORRIDOR NORTH COAST CRAFT REVITALIZATION PROJECT Prepared and Submitted by: Jamaica Business Development Corporation 14 Camp Road, Kingston 4 Jamaica Tele: 928-5161-5 Email: [email protected] Website: www.jbdc.net 2013
-
Upload
jamaica-business-development-corporation -
Category
Documents
-
view
222 -
download
2
description
Â
Transcript of Final Report NCCRP Baseline Study TEF/JBDC

BASELINE REPORT:
STUDY OF THE CRAFT SECTOR ON THE NORTH COAST CORRIDOR
NORTH COAST CRAFT REVITALIZATION PROJECT
Prepared and Submitted by:
Jamaica Business Development Corporation 14 Camp Road, Kingston 4
Jamaica Tele: 928-5161-5
Email: [email protected] Website: www.jbdc.net
2013

1
List of Plates Plate I Craft Producers at their workshop in Cambridge St James
Plate II Craft Producers displaying their wares in Coopers Pen Trelawny
Plate III Typical Tools shared by craftsmen in Mt Zion St Ann
List of Charts Chart 1 Organizations Recognized as Assisting Craft Producers
Chart 2 Additional Products Desired by Craft Producers in St Ann
Chart 3 Additional Products Desired by Craft Producers in Trelawny
Chart 4 Additional Products Desired by Craft Producers in St James
Chart 5 Diversity of Customer Base – All Producers
Chart 6 Methods Used for Keeping Records of Earnings
Chart 7 Methods Used for Keeping Records of Expenses
Chart 8 Methods Used for Keeping Track of Expenses
List of Figures Figure 1 Core Business Processes for Aboriginal Art (Simplified)
Figure 2 Core Business Processes for Leather Craft (Simplified)
Figure 3 Core Business Processes for Needle-craft- Dressmaking (Simplified)
List of Tables Table 1 Average Age of Proprietor by Sex and by Parish
Table 2 Average Number of Employees per Producer Organization
Table 3 Knowledge of Organizations or Groups that Support Craft Producers
Table 4 Assistance from Organizations that Support Craft Producers
Table 5 Nature of Assistance Received From Support Organizations by Parish
Table 6 Requirement for Additional Support by Parish
Table 7 Expected Impact of Additional Support – St Ann Producers

2
Table 8 Expected Impact of Additional Support – Trelawny Producers
Table 9 Expected Impact of Additional Support – St James Producers
Table 10 Producer/Employee Skills for Craft Producing Organizations (that employ workers)
Table 11 Producer/Employee Skills for Craft Producing Organizations (that do not employ
workers)
Table 12 Frequency Table for Skills Required in the Parish of St Ann
Table 13 Frequency Table for Skills Required in the Parish of Trelawny
Table 14 Frequency Table for Skills Required in the Parish of St James
Table 15 Craft Items by Product Group
Table 16 Product Profile of Craft in the Parish of St Ann
Table 17 Product Profile of Craft in the Parish of Trelawny
Table 18 Product Profile of Craft in the Parish of St James
Table 19 Years in Operation for the Typical Craft Producing Organization
Table 20 Future Products Desired by Parish
Table 21 Major Challenges Foreseen to Launch Future Products (St Ann Producers)
Table 22 Major Challenges Foreseen to Launch Future Products (Trelawny Producers)
Table 23 Major Challenges Foreseen to Launch Future Products (St James Producers)
Table 24 Tools and Technologies Used to Make Products
Table 25 Adequacy of Current Tools for the Undertaking of Production
Table 26 Tools and Technologies of Craft Producers by Product Group
Table 27 Market Segmentation for Craft Producers by Parish
Table 28 Distribution Channels – St Ann
Table 29 Distribution Channels – Trelawny
Table 30 Distribution Channels – St James
Table 31 Marketing Methods Used by Parish
Table 32 Level of Export of Craft Items by Parish
Table 33 Price Determination Methods by Parish
Table 34 Average Revenue and Expenditure Reported by Craft Producers by Parish
Table 35 Craft Producers who have a Designated Bank Account for their Business

3
Table 36 Where Money is kept when there is no Bank Account for Business
Table 37 Number of Businesses and Registration by Parish
Table 38 Overall Level of Education of Craft Producers
Table 39 Education Level of Staff Members
Table 40 Ability of Craft Producers to Use a Computer
Table 41 Number of Craft Producers who desire Computer Training
List of Acronyms JAMPRO Jamaica Promotion
JBDC Jamaica Business Development Corporation
TEF Tourism Enhancement Fund
UK United Kingdom
USA United States of America
List of Appendices Appendix I – Instruments
Attachment I – Producer Questionnaire
Attachment II – Focus Group Guide

4
Table of Contents
EXECUTIVE SUMMARY .......................................................................................................................... 6
1.0 INTRODUCTION ............................................................................................................................ 8
1.1 Background to the North Coast Craft Sector ................................................................................ 8
1.2 Objectives of the Baseline Study .................................................................................................. 8
1.3 Scope of Work and Deliverables .................................................................................................. 9
1.4 Technical Approach and Methodology ......................................................................................... 9
1.4.1 Work plan and Timelines .................................................................................................... 10
1.4.2 Geographical Areas Covered .............................................................................................. 10
1.4.3 Nature and Overall Behaviour of Respondents ................................................................... 10
1.5 Limitations .................................................................................................................................. 10
2.0 NORTH COAST CORRIDOR CRAFT SECTOR REPORT ........................................................ 11
2.1 Environmental Setting................................................................................................................. 11
2.1.1 Situational Analysis ............................................................................................................ 15
2.1.2 Screening Question A1 ............................................................................................................ 17
2.1.3 Demographic Description of Producers ........................................................................... 18
2.2 Membership Structure ................................................................................................................ 18
2.2.1 Leadership and Management .............................................................................................. 18
2.2.2 Employee Profile................................................................................................................. 19
2.2.3 Current Ventures ................................................................................................................. 20
2.3 Existing Skills ............................................................................................................................. 24
2.3.1 Craft Related Skills ............................................................................................................. 24
2.3.2 Other Skills ......................................................................................................................... 28
2.4 Products and Production Processes ............................................................................................. 29
2.4.1 Types of Products................................................................................................................ 29
2.4.2 Details of Operations .......................................................................................................... 34
2.4.3 Future Products ................................................................................................................... 37
2.4.4 Tools and Technologies ...................................................................................................... 39
2.5 Markets ....................................................................................................................................... 41
2.5.1 Current Markets and Targeted Customers .......................................................................... 42
2.5.2 Distribution Channels ......................................................................................................... 43
2.6 Marketing Methods ..................................................................................................................... 44

5
2.6.1 Sales Strategies ................................................................................................................... 44
2.6.2 Exports ................................................................................................................................ 45
2.6.3 Pricing and Competitor Analyses ....................................................................................... 46
2.7 Finances ...................................................................................................................................... 46
2.7.1 Revenue and Expenditure ................................................................................................... 46
2.7.2 Financial Management ........................................................................................................ 47
2.8 Support Services ......................................................................................................................... 50
2.8.1 Permits and Licenses ........................................................................................................... 50
2.9 Legal Status of Business ............................................................................................................. 50
2.9.1 Registration ......................................................................................................................... 50
2.10 Business Development ................................................................................................................ 51
2.10.1 Extent of Business Formulation .......................................................................................... 51
2.10.2 Literacy and Numeracy ....................................................................................................... 51
2.10.3 Previous Exposure to Business ........................................................................................... 52
2.10.4 Computer Literacy .............................................................................................................. 52
3.0 CONCLUSION ............................................................................................................................... 54
PLATES ...................................................................................................................................................... 55

6
EXECUTIVE SUMMARY
The current situation with respect to craft producer organizations on the North Coast Corridor is
one which sees the following:
1. They are predominantly micro-producers who operate on a small scale having,
businesses which are predominantly unregistered (with the Companies office of
Jamaica).
2. The craft producers represent strong personal and business ties which have endured
sometimes for more than a generation within communities. However these relations
have not yet been formalized into advocacy groups in order to minimize the current
common challenges faced in the sector.
3. Training is in many cases informal (and strongly linked to personal talent) and there are
no industry-wide standards within which craft producers (in their various trades)
operate.
4. Products made are done under highly labour intensive conditions.
5. There are high transaction costs in some cases especially that of transportation of goods
and raw materials.
6. The industry has a plethora of small firms which struggle to expand based on financial
constraints, lack of required training, machinery and tools. This poses a risk to the
sector especially in current times of economic austerity.
7. The sector offers a significant opportunity to improve employment specifically youth
employment.
Based on the field survey, the average craft producing organization, along the North Coast
Corridor has been in operation for an average of approximately 20 years. This is almost half the
life of the owner/proprietor who is on average 48.63 years. Information from the study shows
that almost 70 per cent of such enterprises do not employ people. The average workforce size
(mean) of these organizations is 3.1 persons (1.8 part time and 1.4 full time).
Employees are in many cases family members (e.g. spouses and children) who assist in the
business or who are undergoing apprenticeship training. Additional staff is sometimes hired
seasonally to do part time work in most organizations. The majority of respondents can be

7
deemed both literate and numerate with the average proprietor having acquired secondary level
education (40 per cent). In addition 39 per cent have completed primary school and 9 per cent
tertiary education. Assessment of workers in craft producing organizations shows that the
average employee has 12.47 years of schooling (those who reported).
With respect to tools and technologies used these vary significantly by individual craft
producer and also by type of craft being produced. Only 28 per cent of respondents stated that
they used their hands only as 69 per cent of respondents stated that they used a combination of
hand, machinery and other tools. Discussions with craft producers show that they would like
more electrical tools to improve production.
The typical customer targeted by craft producers is a tourist as stated by 41 per cent of
respondents. However more detailed analysis shows that producers cater to more than one niche
market as evidenced by the fact that 24 per cent of respondents stated that they catered to more
than three major markets.
The craft market is the dominant distribution channel followed by the use of contacts in
hotels. The majority of respondents (54.5 per cent) stated in the questionnaire that they did not
do any form of marketing advertisement marketing and/promotion. More than half of same
stated that the major reason that they participate in no form of advertising, marketing
and/promotion is due to the fact that they have a ready market and also their products (and in
some cases their customers) are well known.
There is low exporting as less than 8 per cent of craft producers in the target area reported
that they directly exported products. With respect to the pricing of goods, the dominant rationale
for a final price is that of the cost of raw materials and the time taken to make the product (66.3
per cent of respondents). The size of the finished product (18.8 per cent) and prevailing market
conditions (14.9 per cent) are also significant considerations.
Based on revenue and expenditure data given by craft producers the average organization
shows that no profit is earned. In addition financial management data shows that there is also a
lack of fiscal discipline existing in day to day management of these organizations. This is
evidenced by high incidences of no records being kept and also the lack of a designated bank
account for the business.

8
1.0 INTRODUCTION
1.1 Background to the North Coast Craft Sector
The Jamaican Craft Sector is not only a significant aspect of the Tourism Industry but also a
major aspect of economic activity across Jamaica. In many communities (especially those in and
around the North Coast), this sector is a stalwart contributor to employment and creates
backward and forward linkages. These linkages are not just to communities where there are craft
producers but also those that provide raw materials and distribute finished products.
Notwithstanding this, the sector is far from maximizing its returns. There are now
poignant issues related to quality of finish, distribution channels, access to markets, pricing, the
influence of middlemen and traders and training. These are needed especially for the North
Coast Corridor; including the parishes of St Ann, Trelawny and St James which are areas with
internationally famous attractions.
It is within this context that the Jamaica Business Development Corporation (JBDC) and
the Tourism Enhancement Fund (TEF) has commissioned a study of Craft Producers from the
parishes of St Ann, Trelawny and St James. The project will seek to address the current
shortfalls in areas such as product development and design; business and professional skills;
marketing and market development
1.2 Objectives of the Baseline Study
This assignment provided baseline information of the target group to guide the development of
the work plan for the North Coast Craft Revitalization Project. It provided current, accurate and
relevant information regarding the size, location and areas of specialization of the craft
producing sector in the target area. The study also examined the challenges faced by the
producers and their needs.

9
1.3 Scope of Work and Deliverables
The major requirements of the study included:
1. A comprehensive report on Craft Producers/Businesses within the target area. Report should
provide adequate information as outlined in the Scope.1
2. A comprehensive database of craft producers and craft association in the target areas (St.
James, Trelawny and St. Ann) including information such as:
Contact Person
Telephone / Email
Address / Location
Major Products / Services
Major Business Constraints
Skill Level
Types of Assistance being received (if any)
1.4 Technical Approach and Methodology
The baseline database and comprehensive report was compiled from both primary and secondary
data sources. With respect to secondary sources, past reports of a similar nature were collected
and sourced and also community profiles from organizations such as the Social Development
Commission (SDC).
With respect to primary data collection, the sampling technique used was purposive
sampling. Primary data was collected mainly through direct discussions, interviews and field
observations in the parishes of St Ann, Trelawny and St James. The major instruments and
collection methods used were:
1. A direct six (6) page questionnaire was filled out by 101 craft producers from the
parishes of St Ann (46), St James (31) and Trelawny (24). The majority of these
questionnaires were executed through in-depth face to face interviews with five (5)
done through telephone conversations.
1 Based on the Term of Reference [Section 3.2] the major areas required for research are: [a] environmental setting, [b] membership structure, [c]
existing skills, [d] products, [e] products, [f] markets, [g] marketing methods, [h] finances, [i] legal status, [j] support services and [k] business development.

10
2. Three (3) focus groups (each comprising five respondents) were kept for each parish
being studied i.e. St Ann, Trelawny and St James on August 14, 2013.
3. Field trips to three (3) communities with craft producers ; Mt Zion in St Ann, Coopers
Pen in Trelawny and Cambridge in St James.
4. A (non-coded) database in MS Excel was developed for the results of the 101
questionnaires
Data analysis included both quantitative and qualitative methods. Typical quantitative methods
included the employment of basic descriptive statistical methods while quantitative methods
included the use of case studies, SWOT analyses and flow charting.
1.4.1 Work plan and Timelines
The stipulated time for the assignment was four (4) weeks.
1.4.2 Geographical Areas Covered
Field trips took place over the period August 12 to 15, 2013. These were in the subject parishes
of St James, Trelawny and St Ann inclusive of direct visits to communities with craft producers
in all three parishes. These included Mt Zion district (St Ann), Coopers Pen (Trelawny) and
Cambridge (St James).
1.4.3 Nature and Overall Behaviour of Respondents
Respondents showed willingness to being interviewed and contributed to frank discussions about
the challenges they faced being craft producers. There were also cases of scepticism and lack of
trust (where some respondents thought that this was another attempt to get taxes).
Notwithstanding this all producers approached in the respective parishes agreed to do the
interview.
1.5 Limitations
The major limitation in undertaking this task was time due to the fact that this is the first project
of its nature being undertaken on such a large scale for craft producers. The lack of a pilot study
or a pre-testing exercise created limitations in the design of instruments; being largely
exploratory and open-ended. With respect to the results, some respondents may have
underreported in some cases, especially with respect to raw materials (for example for knitting
some may not have stated needles as a raw material).
11
2.0 NORTH COAST CORRIDOR CRAFT SECTOR REPORT
2.1 Environmental Setting
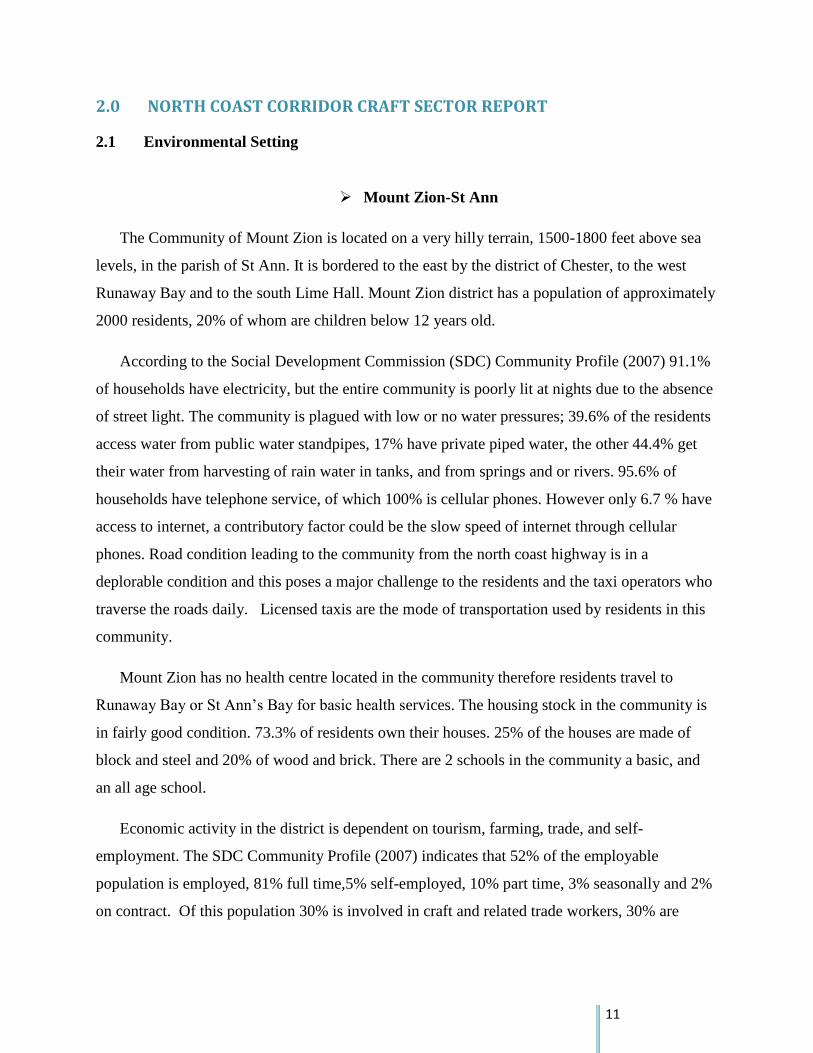
Mount Zion-St Ann
The Community of Mount Zion is located on a very hilly terrain, 1500-1800 feet above sea
levels, in the parish of St Ann. It is bordered to the east by the district of Chester, to the west
Runaway Bay and to the south Lime Hall. Mount Zion district has a population of approximately
2000 residents, 20% of whom are children below 12 years old.
According to the Social Development Commission (SDC) Community Profile (2007) 91.1%
of households have electricity, but the entire community is poorly lit at nights due to the absence
of street light. The community is plagued with low or no water pressures; 39.6% of the residents
access water from public water standpipes, 17% have private piped water, the other 44.4% get
their water from harvesting of rain water in tanks, and from springs and or rivers. 95.6% of
households have telephone service, of which 100% is cellular phones. However only 6.7 % have
access to internet, a contributory factor could be the slow speed of internet through cellular
phones. Road condition leading to the community from the north coast highway is in a
deplorable condition and this poses a major challenge to the residents and the taxi operators who
traverse the roads daily. Licensed taxis are the mode of transportation used by residents in this
community.
Mount Zion has no health centre located in the community therefore residents travel to
Runaway Bay or St Ann’s Bay for basic health services. The housing stock in the community is
in fairly good condition. 73.3% of residents own their houses. 25% of the houses are made of
block and steel and 20% of wood and brick. There are 2 schools in the community a basic, and
an all age school.
Economic activity in the district is dependent on tourism, farming, trade, and self-
employment. The SDC Community Profile (2007) indicates that 52% of the employable
population is employed, 81% full time,5% self-employed, 10% part time, 3% seasonally and 2%
on contract. Of this population 30% is involved in craft and related trade workers, 30% are

12
service workers, shop and market sales workers, 15% are professionals, senior officials and
technicians and 25 are engaged in agriculture and plant and machine operators.
Environmental challenges being faced by the community are blocked drains caused by the
illegal dumping of garbage. This is a catalyst for environmental damage caused from flooding,
landslides, and rock falls. There is also the possibility of poor water quality. This is so as 38.4%
of residents utilize water closets not linked to sewer, 24% uses pit latrines and so there is a strong
possibility of raw sewage seeping into water resources in and around the community.
Cambridge , St James
The Community of Cambridge, the first rural town in St James, is located in a partially hilly
and undulating terrain, in the south easterly section of the parish of St James, 18 miles from
Montego Bay.
Cambridge district has a population of approximately 4811 residents of which there are 55%
females and 45% males. 36.62% of the population are children below 14 years old. There is 1162
household. This community is deemed to have low levels of volunteerism, civic pride and
community spirit.
According to the Social Development Commission (SDC) Community Profile (2009) 92.9%
of households have electricity, 6.2% uses oil lamps and .9% uses candles. In the community
24.8% of the residents access water from public water standpipes, 20.4 % have private piped
water, 39.9% have public piped water. 94% of households have telephone service, of which 74.5
% have cellular phones and 24.6% uses both land lines and cellular phones. However only 17.3
% have access to internet, a contributory factor could be the slow speed of internet through
cellular phones. Main road leading to the community from Montego Bay is in good condition,
however, the secondary and arterial roads are in a deplorable condition and this poses a major
challenge to the residents and vehicular traffic which traverse the roads daily. For transportation
to and from the community 81.4% of the residents use buses, 8.8% private cars and .9% donkey.
Cambridge has a type 11 health centre located in the community which is utilized by
approximately 30.93% of the residents. The housing stock in the community is in fairly good

13
condition. 77.6% of the houses are made of block and steel and 48% of board. There are 4
schools in the community a basic, infant, all age and high school.
Economic activity in the district is mainly focused on the provision of services and is
dependent on construction, cabinet making, farming, beauty care, and secretarial. The SDC
Community Profile (2009) indicates that 66% of the heads of households who are trained in
specific areas are employed using the training received. Highest areas of skill for female are
hospitality (31%) and professional and technical services (29%); for male construction and
cabinet making (30.5%) and machine and appliance (22%). There is 52% unemployment among
the youth between the ages of 14-29.
Main challenges affecting businesses in the community, are high transportation and
labour costs, high unemployment and low levels of disposable income.
Environmental challenges being faced by the community are blocked drains due to illegal
dumping of garbage. This is a catalyst for environmental damage caused from flooding and land
slides. There is also the possibility of poor water quality. This is so as 16.1% of residents utilize
water closets not linked to sewer, 15.4% uses pit latrines and so there is a strong possibility of
raw sewage seeping into water resources in and around the community.
Coopers Pen , Falmouth, Trelawny
The Community of Coopers Pen a district of Falmouth, is located mainly on 11 acres of
beach land, in the north easterly section of the parish of Trelawny, 2 miles from Falmouth.
Coopers Pen community has a population of approximately 2785 residents occupying 202
households.
According to the Social Development Commission (SDC) Community Profile on the
wider community of Falmouth (2009) 97% of households have electricity, 3% uses oil lamps. In
the community 7.7 % access water from private catchments, 48.5 % have private piped water,
39.3% have public piped water. 99% of households have telephone service, of which 66 % have
cellular phones and 33 % uses both land lines and cellular phones and 1% landlines only.
However 28 % have access to internet. The main roads leading to the community from the North

14
Coast Highway is in good condition. For transportation to and from the community 79% of the
residents use licensed taxis, 15.1% robots, 25 % private cars and 11.8 % the bus system .
Falmouth has 2 type 1V health centre and one type C hospital located in the community
which is utilized by approximately 27 % and 86% of the residents respectively. The housing
stock in the community is in fairly good condition. 67.4 % of the houses are made of block and
steel and 24.3 % of board. All houses in the Coopers Pen district are of block and steel. There
are 10 schools in the Falmouth community.
Economic activity in the district is mainly focussed on the provision of services and is
dependent on construction, cabinet making, farming, beauty care, secretarial. The SDC
Community Profile (2009) indicates that 72 % of the heads of households are employed; of the
male headed households 83.6% are employed and 57.1% of the female headed households. Of
the employed groups 24.6% are service workers and shop and market sales workers, 14.3% are
professionals, 13.6% are craft producers and workers, 7.4% are elementary occupation and 3.3%
are involved in agriculture. Unemployment is highest among the seniors aged 60 and over. 29%
of this unemployment is due to retirement.
Challenges affecting businesses in the community are high transportation and labour
costs, high unemployment and low levels of disposable income. Environmental challenges being
faced by the community are blocked drains due to illegal dumping of garbage. This is a catalyst
for environmental damage caused from flooding and landslides. There is also the possibility of
poor water quality. This is so as 50.7 % of residents utilize water closets not linked to sewer and
35.7 % use ones that are linked to sewer , 14.7 % uses pit latrines and so there is a strong
possibility of raw sewage seeping into water resources in and around the community. There is
also dumping of the mangroves (a breeding ground for lobster and fish) for housing
developments. Waste water is also being channelled into the sea which affects the foreshore and
the marine environment

15
2.1.1 Situational Analysis
Assessments of the three craft producing communities showed the following strengths:
A sense of unity and mutual support among craftsmen – this is more so in sites visited
in Mt Zion and Cambridge where tools are shared by workers
Organizations at the community level are quite resilient, built upon long forged
informal networks of family, friends and acquaintances
There are scale benefits as raw material, transportation and distribution costs are shared
among craftsmen
A market exists nearby – this is the case only for Coopers Pen where producers are near
the pier and also near a major local hotel where they have access to sell to the tourist
directly 7 days per week. They also sell in bulk to craft traders, this helps to increase
the average price for products overall.
Wood carvers in Coopers Pen are known for their high quality finished products
Wood carvers in Mount Zion, Coopers Pen and Cambridge have been carving in these
communities for over 20 years.
Highly intelligent, high school graduates are among the woodcarvers in the 3 areas
There is real time information and skills exchange where in some areas (Cambridge and
Mt Zion) carving is done at one physical site and actual production and learning takes
place almost simultaneously
The following weaknesses were identified:
In many cases craftsmen produce the same type of products.
For the most part, craft producers seem to be price takers (low market power in the
setting of a market price). Producers also lack knowledge on how to price their
products, as they have very , poor record-keeping skills.
There are no major industry standards with respect to work quality.
Transportation and distribution costs can be high as many producers do not have their
own transportation especially those in deep rural areas. Areas such as Mt Zion had
almost impassable roads.

16
Numerous distances sometimes have to be travelled to get raw materials for example
trees/wood for carving.
Some areas are highly gender biased which limits the talent pool e.g. wood carving is
male dominated.
More modern tools are required to improve product quality and productivity. In some
cases almost 20 individuals shared the same set of tools (Mt Zion).
There is not much value added in properly ‘finishing work’ from the stand point of the
craft producer. This excludes them from a major aspect of the value chain.
Critical markets are not accessible to them and this limits their production levels. For
example producers in Cambridge state that the fact that they do not have direct access
to hotels and tourists have been a critical obstacle to doing business.
Not many community and advocacy groups represent craft producers at the local level.
More formal training may be required to harness and improve existing talent.
Low levels of formal business training and acumen. This has seen low levels of record
keeping, business strategy planning and other critical steps required to be not just a
subsistence activity but one which is profitable.
Wood craft producers use cedar trees as their main source of raw material, but they do
not replant trees in the community.
They are not organized into formal groups although they have been working as groups
for years.
The woodcraft producers do not have proper shelter/workshop for example producers in
Mount Zion workshop is under a tree from which they have been working for many
years, those in Cambridge have limited covering and would also be affected by the bad
weather. This lack of proper workshops, does hamper production during rainy seasons.
The major opportunities open to craft producers are:
Major markets still remain untapped e.g. discussions show that Kingston and other
local urban areas have not been fully exposed to Jamaican craft producers.
The access of social media to promote products.
The sector has survived numerous downfalls e.g. natural disasters but has still been
resilient.

17
To formalize training and apprenticeship schemes that will involve youth. This
demographic currently has the highest unemployment rate nationally.
Grant funding available to groups for product development
The major threats that exist in the sector are:
Existing regime of devaluation and related austerity measures. This has been quite
impactful with respect to raw materials and utility bills.
Cheap imported goods which are said to be of lesser quality which is gradually
marginalizing the local industry.
The ageing demographic which is now participating in the craft producing trades will
threaten a loss of skills over time which will not be passed on to present and future
generations.
2.1.2 Screening Question Results A1
All respondents who were approached and fulfilled the criteria (i.e. being a craft producer
and working or residing in the parishes of St Ann, Trelawny and St James) agreed to participate
in the interview process.
Efforts were therefore made at the start of the interview process to ensure that all
respondents were craft producers who made craft items themselves. With respect to question 1A
all producers gave their names and there was no producer group (1B) stated. With regard to
availability of a contact number (Ques. 4) only seven (7) respondents in all parishes surveyed
could not provide a cell phone contact at all. On the other hand only two (2) respondents
provided a separate work phone and only two (2) respondents provided a separate home phone.
All respondents in all parishes (Ques. 5) surveyed provided an address (inclusive of the parish).2
With respect to an email address (Ques. 6) only thirteen (13) respondents (12.9 per cent) could
furnish the interviewer with this when asked.
2 Note that this address was either their workplace or home (or some cases this was one and the same place)

18
2.1.3 Demographic Description of Producers
The craft sector in the three parishes (St Ann, Trelawny and St James) shows a higher level of
males participating than females overall (Producer Questionnaire – Quest 2). However based on
the survey data, St James sees a dominance of women. There are also marginal differences in
their respective ages by parish (Quest. 3). Further details are shown in Table 1 below.
Table 1: Average Age of Proprietor by Sex and by Parish
Parish Male Female Total Avg. Age
(Years)
Modal
Age
Median
Age
Min
Value
Max
Value
St Ann 24 22 46 48.31 55 50 23 69
Trelawny 19 5 24 49.09 52 51 26 68
St James 14 17 31 48.76 48 48 31 66
All Parishes
Surveyed 57 44 101 48.63
52 49.5 23 69
Source: North Coast Corridor Craft Baseline Study 2013
2.2 Membership Structure
2.2.1 Leadership and Management
Leadership and management is to some extent automatic in these entities; in many cases
respondents are sole traders who are using craft production to support themselves and their
dependents. Their daily activities include the ability to co-ordinate resources to achieve a
common goal (whether this is for survival or profit). Discussions with most craft producers
show many elements of leadership such as resilience, initiative, and decision-making. Focus
groups, interviews and community discussions show that to operate a craft organization
successfully requires these and related traits such as fortitude, initiative and a high tolerance for
risk.

19
However to become more competitive and to have more sustainable organizations,
respondents agree that there is the need for improvement in areas such as advocacy,
professionalism, goal setting and adherence to production standards. This is not just lacking at
the firm level but sector wide. In addition, at the community level although craft producers have
taken initiatives to work together including sharing of tools and other resources, they have not
formed themselves into formally registered groups. For instance field interactions and
discussions in focus groups show that craft producers are just starting to form themselves into
advocacy groups e.g. Jamaica Independent Artisan Cooperative Society (JAMIA).
2.2.2 Employee Profile
Overall 29.7 per cent of respondents in all three parishes stated that their organization
employed someone other than the owner proprietor (Quest 13). When broken down by parish,
nine (9) respondents from St Ann (19.6 per cent) stated that they employed people in their
organizations. For Trelawny there were ten (10) respondents (41 per cent) who stated that they
had hired staff. Responses in St James saw eleven (11) respondents (35.5 per cent of
respondents) stating that they hired staff.
Average employment by organization varied marginally by parish with St James
organizations having the highest levels. Further details are shown in table 2 below.
Table 2: Average Number of Employees per Producer Organization
Parish Avg. Number
Employed
Avg. Number Full
Time
Avg. number Part-Time
St Ann
2.7
2
1
Trelawny
2.7
1.4
1.4
St James
3.8
2.0
1.8
All Parishes Surveyed - Mean
3.1
1.8
1.4
Mode of All Parishes
2.0
1.0
1.0
Median of All Parishes
2.0
1.0
1.0
Max Value – All Parishes
12
10
5
Min Value – All Parishes3
1
1
1
3 It is assumed that the owner is also provided with employment.

20
Observations and discussions show that in many cases, micro-enterprises predominantly hire a
family member or close associate and the payment is that of a stipend [Section 2.7]. In many
cases this is also an apprenticeship arrangement with not many workers being formally trained in
their respective skills [Section 2.3.1].
2.2.3 Current Ventures
With respect to knowledge of organizations that support craft producers (Quest 44) 30.7 per cent
of all respondents (in all three parishes) stated that they knew of such organizations. Further
details by parish are shown in table below.
Table 3: Knowledge of Organizations or Groups that Support Craft Producers
Parish Knowledge of Support
Organizations that Assist Craft
Producers
No Knowledge of Support
Organizations that Assist Craft
Producers
St Ann
16(34.8 per cent)
30 (65.2 per cent)
Trelawny
5 (20.9 per cent)
19 (79.1 per cent)
St James
10 (47.6 per cent)
21 (42.4 per cent)
All Parishes Surveyed
31 (30.7 per cent)
60 (69.3 per cent)
The organizations recognized by craft producers as supportive to their ventures (Quest 45) are
shown in Chart 1 below.
Jamaica National, 3, 10%
JAMAIA, 4, 13%
Things Jamaican, 3, 10%
TPDCo, 10, 32%
JAMPRO, 6, 19%
Other, 5, 16%
0 5 10 15
Jamaica National
JAMAIA
Things Jamaica
TPDCo
JAMPRO
Other
Chart 1: Organizations recognized as Assisting Craft Producers

21
With respect to organizations benefiting from assistance in the past (Quest 46) details are shown
by parish in table 4 below
Table 4: Assistance from Organizations that Support Craft Producers
Parish Benefited from Assistance in the
Past
Did not Benefit From Assistance
in the Past
St Ann
8 (17.4 per cent)
38 (82.6 per cent)
Trelawny
2 (8.3 per cent)
22 (91.6 per cent)
St James
10 (32.3 per cent)
21 (67.7 per cent)
All Parishes Surveyed
20 (19.8 per cent )
81 (80.2 per cent)
With respect to the nature of assistance received from support organizations (Quest 47) this is
shown in the Table below.
Table 5: Nature of Assistance Received From Support Organizations by Parish
Parish Organization Types Nature of Assistance Service Improvements
Reported as a Result of
Assistance
St Ann
(note that only 7 people
responded in this parish
to this section)
Tourism Development
and Attractions – 57.14
per cent
Technical (Craft Related)
– 14.29 per cent
Financial – 28.57 per cent
Trade licence
Visits to shows
overseas
Visa to import goods
Selling spaces
Appraisal of items
Loans
Reponses here were not very
clear only two respondents
stated categorically that they
were able to access raw
materials as a result of the
assistance.
Trelawny
(note that only 3 people
responded in this parish
to this section)
Tourist Development –
33.33 per cent
Small Business
Development – 33.33 per
cent
Financial – 33.33 per cent
Seminar
Loan
Training
Learn about Jamaica
Better pricing and presentation
of items
St James
(note that only five
respondents were tallied
in this section
Investment – 60 per cent
Tourism Development –
40 per cent
Certification
Only two respondents
contributed here and they both
stated that the assistance was
instrumental in them knowing
more about other customs and
the customs of Jamaica

22
With respect to additional support required (Quest 48) these are shown in detail in table below.
Table 6: Requirement for Additional Support by Parish
Parish Needs Additional Support at this
Time
Do Not Need Additional Support at
this Time
St Ann
45 ( 97.8 per cent)
1 (2.2 per cent)
Trelawny
24 (100 per cent)
0
St James
31 (100 per cent)
0
All Parishes Surveyed
100 (99 per cent)
1 (1 per cent)
With respect to the expected impact of additional support (Quest. 49) the major responses are
shown in Tables 7-9 below. It is important to note that responses here are not mutually exclusive
as some respondents stated multiple support needs.
Table 7: Expected Impact of Additional Support – St Ann Producers
Assistance Needed
Frequency (Percentage)
Forecasted Impact
Equipment and Raw
Materials
54.4 per cent
Increased production – 76 per cent
Reduces strenuous work 8 per cent
Better storage and inventory management – 8 per cent
Increase sales overall – 8 per cent
Financial Assistance
43.5 per cent
Increase employment and training – 35 per cent
Expand business and diversify product line – (50 per
cent)
Produce more and improve product quality – 15 per
cent
Market Access and
Sales Promotion
19.6 per cent
Improved sales revenue – 44.44 per cent
Improved innovation and quality – 22.22 per cent
Other (e.g. increased customer service, ability to get
better prices for product, etc) – 33.34 per cent
Additional Employees
and Training
Programmes
4.3 per cent
Increased employment – 50 per cent
Improve exports – 50 per cent

23
Table 8: Expected Impact of Additional Support – Trelawny Producers
Assistance Needed Frequency (Percentage) Forecasted Impact
Equipment and Space
58.3 per cent
Increased production – 78.6 per cent
Other (inclusive of purchase of more stock, expanded
markets, increased revenues) – 21.4 per cent
Financial Assistance
33.3 per cent
More tools and materials – 37.5 per cent
Produce more goods – 37.5 per cent
Other( improve product quality, pass on knowledge to
others, upgrade business facilities etc) – 25 per cent
Market Access,
Promotion and
Distribution
33.3 per cent
Increased sales revenue – 62.5 per cent
Other (passing on of knowledge, improved product
quality, employment, etc) – 37.5 per cent
Training and Materials
12.5 per cent
Improved products and revenue (all respondents)
Table 9: Expected Impact of Additional Support – St James Producers
Assistance Needed Frequency (Percentage) Forecasted Impact
Equipment and Space
38.7 per cent
Increased employment – 25 per cent
Increased production – 50 per cent
Other (producing genuine Jamaican goods, increased
sales, export development, etc) – 25 per cent
Finance and Raw
Materials
48.4 per cent
Increased production – 26.7 per cent
Employ more people – 26.7 per cent
Improved distribution systems and inventory – 13.3
Increased sales revenue – 13.3 per cent
Other (ability to export, work faster, etc) – 20 per cent
Marketing and Training
41.9 per cent
Expanded market – 30.8 per cent
Increased sales – 38.5 per cent
Other (improved business skills, expanded export
operations, no response) 30.7 per cent
There are presently not many ventures which support craft producers along the North
Coast Corridor. Based on information from one on one discussions, community visits and focus
groups only a few communities currently have mechanisms in place that fully support craft
production. For example discussions in focus groups show that communities such as Catadupa
have made skills training a major aspect of early education as shown through activities in local 4-
H clubs and annual displays. This although talked about, is quite rare in other communities.

24
Focus groups with Trelawny craft producers had discussions centred on the new trend for carvers
which is the use of the dolomite stone and shell jewellery.
Visits to other communities (Mt Zion – St Ann, Coopers Pen-Trelawny and Cambridge –
St James) show that all out community support to craft production is still in fledgling stages.
More is still required with respect to training, raw material provisions, work environment and
related business support services for such activities. They are recognized and respected in their
respective localities but the multiplier effects of craft production are still low. These arguments
are also supported by the fact that in the survey there was a relatively low level of positive
responses with respect to those craft producers who knew of organizations and or agencies that
assisted craft producers. [Table 3]
2.3 Existing Skills
2.3.1 Craft Related Skills
With respect to the profile of people employed in organizations, the Table below shows skills,
sources and training reported for employees (Quest 15). Note that in many cases employees
have more than one skill.
Table 10: Producer/Employee Skills for Craft Producing Organizations (that employ workers)
Parish Typical Skills Reported Average
Tenure (Yrs)4
Source of Skill/Training Reported
for Employees
St Ann
Carving – 4 organizations (44.44 per
cent of those reporting)
Not yet trained/apprentice – 2 (22.22 per
cent of those reporting)
Leather craft and jewelry - 1
organization (11.1 per cent of those
reporting)
Doll making 1 organization (11.11 per
cent of those reporting)
Painting – 1 organization (11.11 per cent
of those reporting)
10.63
High School/Heart Academy – 2
organizations (28.6 [per cent of
those reporting)
Self-taught/Talent – 3
organizations (42.8 per cent of
those reporting)
Apprenticeship – 2 organizations
(28.6 per cent of those reporting)
Trelawny
Carvers - 63.6 per cent of organizations
Dressmaking and needlecraft – 36.4 per
cent of organizations
8.13
Self-taught/talent – 30 per cent of
organizations reporting
Apprenticeship – 70 per cent of
those reporting
Carving and furniture making – 41.2 per Self-taught/talent – 16.67 per cent
4 It is important to note that these were crude estimates as advised by respondents as many did not recall precisely how long their workers were at their establishment.

25
St James cent of organizations
Dressmaking and needlecraft skills -
Leather craft – 16.6 percent of
organizations
Jewellery – 25 per cent of organizations
Decorative art (e.g. aboriginal art) – 8.3
per cent of organizations
Other (including basket weaving, etc) –
8.3 per cent of organizations
6.75 of those reporting
Apprenticeship/on the job training
– 75.03 per cent
Formal institution – 8.3 per cent
All Parishes
Surveyed
8.42
In addition to existing skills there are situations from the survey where employees
(including the proprietor) required more skills. For those that employ people (Quest. 16) St Ann
craft producers had five (5) respondents (41.3 per cent) who stated that they required more
training at their organization. It is important to note that nine (9) respondents (19.6 per cent) did
not answer this question and 39.1 per cent represented those who stated categorically that they
did not require any further training. The specific skills required (Quest. 17) were; time
management, painting, machinery and symmetric skills and one respondent saying that he
needed nothing specific just anything that provides all round improvement. With respect to any
attempt made to acquire theses skills (Quest 18) only two (2) respondents from St Ann stated that
they took any initiative on this. The challenges that they faced were [a] language barriers and [b]
not finding the right instructors (Quest 19-20).
For Trelawny craft producers (who employ people) fifteen (15) respondents did not
answer this question (62.5 per cent), four (4) respondents (12.5 per cent) stated that their
organizations required more training while five (5) respondents (20.8 per cent) stated
categorically that they did not require any training. The required training was centred on: [1]
design training, [2] carving techniques, [3] leather craft, [4] marketing and [5] jewellery making.
One respondent stated that training was sought but the availability of machinery and/or
equipment to train with was a problem.
For St James twenty (20) respondents (64.5 per cent) did not give a response to this
question while nine (9) respondents (25.8 per cent) stated categorically that their organization
required additional training. One (1) respondent categorically stated that no training was
required. For the nine (9) who stated that they needed training in their organizations this

26
included: [1] detailed operations on operating respective machinery (2 responses), [2] systems
operations, [3] ice carving, [4] management marketing and customer relations (3 responses), [5]
internet sales. Two (2) respondents stated that they made attempts to acquire these skills and
both stated that they experienced challenges. These challenges were: [1] skills were not readily
available and [2] being nervous at the last opportunity to train.
With respect to the skills profile of organizations that do not employ people (Quest. 21)
details are shown in Table below. Note that some owner/proprietors have more than one craft
skill.
Table 11: Producer/Employee Skills for Craft Producing Organizations (that do not employ workers)
Parish Craft Skills Reported Source of Craft
Skill/Training
Reported for
Employees
Non Craft Training
Skills Reported
Method of Access
for Skills
St. Ann
Carving – 42.5 per
cent
Needlecraft and
sewing – 17.5 per cent
Bracelet and jewellery
making – 30 per cent
Other (e.g. painting
and doll making) – 10
per cent
Self-taught/talent
– 42.1 per cent
Formal training at
an institution –
32.68 per cent
Apprenticeship/on
the job training –
22.25 per cent
Construction
related trades –
33.33 percent
Secretarial and
sales – 22.22 per
cent
Housekeeping –
11.11 per cent
Other (e.g. spear
fishing, cake
decorating,
gardening etc) –
33.33 per cent
Enlisted in a
course – 31.25
per cent
Observation/Self
Visualization –
34.85. per cent
At the workplace
– 34.85 per cent
Trelawny
Carving – 61.5 per
cent
Needlecraft and
sewing – 23.1 per cent
Bracelet and
Jewellery making –
15.4 per cent
Self-taught/talent
– 58.33 per cent
Formal training at
an institution –
8.34
Apprenticeship –
33. 33 per cent
1 person –
domestic helper
Enlisted in a
course – 20 per
cent
Observation/Self
Visualization –
20 per cent
At the workplace
– 60 per cent
St. James
Carving – 30 per cent
Weaving and basket
making – 20 per cent
Needlecraft – 20 per
cent
Painting and
decorative art – 15 per
cent
Other – 15 per cent
Apprenticeship –
47.3 per cent
Self-taught/talent
– 31.57 per cent
Formal training –
21.13 percent
1 person
bartending
1 person
business classes
Carpentry
Enrolled in an
institution –
15.80 per cent
Observation/self-
visualization –
68.40
At the workplace
– 15.80 per cent

27
When organizations who hired no employees (other than owner/proprietor) were
questioned with respect to current skill and training requirements (Quest. 22) the results varied
by parish. For St Ann organizations twenty (20) respondents stated that they required training
(43.5 per cent) while seventeen (17) respondents (37 per cent) stated that they required no
training. Altogether nine (9) respondents (19.5 per cent) did not give a reply. With respect to
the type of training required (Quest. 23) these are shown in Table below.
Table 12: Frequency Table for Skills Required in the Parish of St Ann
Training
Required
Needlecraft
/Sewing
Art/Painting Wood
Carving/Finishing
Jewellery
Making/Basket
Weaving
Business
Training/Computing
Other
Training
Frequency
(No.)
9
2
2
3
3
1
Five (5) respondents from this parish stated that they sought to acquire the skills/training that
they needed while fifteen (15) said that they did not seek to acquire such skills (Quest 24).
There were seven (7) respondents (29.2 per cent) who stated that they required training
for their organization in Trelawny. Four (4) respondents stated that they did not require any
training (16.67 per cent) while one organization stated that it did not know/was not sure (4.2 per
cent). There were eleven (11) respondents who did not provide an answer to this question from
this parish (45.8 per cent).
Table 13: Frequency Table for Skills Required in the Parish of Trelawny
Training Required Art/Painting Leather and Mat making Jewellery Making/Basket
Weaving
Frequency (No.)
2
1
2
For Trelawny only one (1) respondent sought the training required. The major challenge faced
was that of unavailability of machinery to train workers (Quest 24).
For St James respondents ten (10) stated that they required more skills training (32.3 per
cent), ten (10) also stated that they did not require any training or skill requirement. Note also
that ten (10) did not provide an answer to this question. Five respondents (5) stated that they had

28
made attempts to acquire these skills and of these one (1) stated the challenges experienced was
that of improper tutoring. The frequency of skills required is shown in Table below.
Table 14: Frequency Table for Skills Required in the Parish of St James
Training
Required
Management and
Marketing
Weaving
and
Furniture
Making
Knitting
Machine
Potter/Wire
Art
Better
Finishing
Training
Music
Frequency
(No.)
5
1
1
1
1
1
There are numerous craft production skills which were picked up via the field survey
questionnaire. The dominant reported skills were wood carvings, knitting and related
needlecraft, doll making jewellery, leather specialists and miscellaneous items ( e.g. making of
key chains, refrigerator magnets etc)
2.3.2 Other Skills
Site visits and focus group discussions show that some craft producers have other support
jobs which are typically low paying in the sectors such as agriculture and fisheries, construction
trades and the hospitality industry. For St Ann 39.1 per cent of respondents stated that they had a
non-craft skill or training, for Trelawny respondents this figure was 4.1 per cent and St James
16.5 per cent.
It is also important to note that as reported from focus groups there are other non-craft
skills required especially to operate the organization. These are inclusive of being high risk
takers, an acumen for business, having mental toughness, discipline and the ability to negotiate
plan and organize.

29
2.4 Products and Production Processes
2.4.1 Types of Products
Examination of products (Quest. 27) show that there are at least five or six major product areas
with many craft producers doing more than one type of product. This is shown in Table below.
Table 15: Craft Items by Product Group
PRODUCT GROUP TYPICAL SUB PRODUCTS FREQUENCY (from
Questionnaire Interview)
Carvings Wood carvings
Stonework
38
Dolls Pencil dolls
Reggae dolls
Animated dolls
10
Needle Craft t-shirts
swimwear,
dresses
crochet
knitted headwear
bags
34
Jewellery Bracelets
Organic jewellery
Earrings
Anklets
23
Leather Items Leather and leatherette products 7
Miscellaneous Items Key chains
Coins
Basket weaving
Paintings
6
For craft producers in the parish of St Ann the typical product profiles (Quest 27) are shown in
Table below.
Table 16: Product Profile of Craft in the Parish of St Ann
Product Typical Raw Materials
Used
Location of Raw
Material
Supplier/Source of
Raw Material
Average/Typical
Prices Per Unit
(J$)
Carvings –
40 per cent
of St Ann
Craft
Producers
Wood/Lumber - 79 per
cent of respondents who
do carving)
Bamboo – 21 per cent of
respondents who do
carving)
Additives and Finishing’s
(Sandpaper lacquer,
Wood/Lumber/bamboo
Not easy to access
– 15.7 per cent.
easy to access –
84.3 per cent
Additives and Finishing
100 per cent easy
to access locally
Deep rural
farmers
Lumberyards in
and around Ocho
Rios
Local hardware
stores (e.g. Ocho
Rios)
Trees – $12,200.00
ea
Cut Lumber –
$125/ft
Bamboo – no cost
Sandpaper –
$120/ft

30
thinner, sealer) – 10 per
cent of respondents
reported this overall
Lacquer – $200
per bottle
Dolls –
21.7 per
cent of St
Ann Craft
Producers
Wool – 71.4 per cent of
respondents (who do
dolls)
Thread5 – (28.5 per cent )
Pencil – 57.1 per cent of
all respondents who do
dolls
Sponge – 14.3 per cent of
respondents who do dolls
Cloth/material – 85.71
per cent of respondents6
Beads – 71.4 per cent of
respondents who do dolls
All respondents stated
that materials are easy
to access (in and around
Ocho Rios). Only one
respondent (14.3 per
cent) imports (material
only).
Local hardwares and
haberdasheries (Ocho
Rios) and imported.
Wool – $ 675/yd
Thread - $686.67
per roll7
Pencil - $100 per
dozen
Sponge/Stuffing -
$200/lb
Material -
$232.85/yd
Beads - $550 per
bag
Needle
Craft –
21.7 per
cent of
craft
producers
in St Ann
Material/Fabric – (44.44
per cent of respondents
who do needlecraft)
Needles – 33.33 per cent 8
Thread – 88.88 per cent9
Wool – 55.55 per cent of
respondents who do
needlecraft
Zippers – 11.11 per cent
of respondents who do
needlecraft
All located and easy to
access in Ocho Rios.
Only 22.22 per cent of
respondents imported
fabric
Ocho Rios shops and
haberdasheries
Imported from
overseas suppliers
Needles - $400 per
pack or 50 each
Thread - $725.00
per roll
Wool – $537.50 per
yard
Zippers – $150 per
dozen
Jewellery –
34.8 per
cent of
craft
producers
in St Ann
Wire/fish line- 42.8 per
cent of those who do
jewellery
Earring sticks – 7.1 per
cent
Shells and cow horn –
21.4 per cent
33.33 per cent of
respondents stated that
they had to import
goods from overseas
(e.g. beads wire fittings
and stones)
All other respondents
state that raw materials
are easy to access
Ocho Rios
Overseas (e.g.
Panama)
Wire/Fish Line -
$140 per roll10
Shells - $300 per
bag
Cow Horn - $500
per bag
5 May be underreported based on the fact that all dolls seen were sewn. 6 May be underreported as all dolls need materials 7 Thread has high variations ranging from $160 per roll to $1500 per roll. It is assumed that this is dependent on type and quality. 8 May be underreported and must be assumed to be 100 per cent 9 Must be assumed under reported 10 Ranges from $50-$310.00

31
Beads - 85.7 per cent
Stones – 16.67 per cent
locally
Beads - $100/ string
or $600 per bag
(US5.00 for bagel
beads)
Stones – $250 per
string or $50 per bag
Leather
Items – 4.3
per cent of
all St Ann
producers
Leather and Leatherette –
all respondents
Not easy to access (2
respondents)
Sometimes imported
(2 respondents)
No price given
Paintings –
6.5 per
cent of
producers
in St Ann
Paint /Brushes/Canvas –
used by all respondents
Easy to access locally
Haberdasheries in
Ocho Rios
Canvas - $350 per
yard
Brushes – $450/pk
Paint - $600 per
Tube/$2000 per
gallon
For craft producers in the parish of Trelawny the product profiles are shown in Table below.
Table 17: Product Profile of Craft in the Parish of Trelawny
Product Typical Raw
Materials Used
Location of Raw
Material
Supplier/Source of
Raw Material
Average/Typical
Prices Per Unit
(J$)
Carvings – 66.66 per
cent of all craft
producers in
Trelawny
Wood - 77.8 per cent
of all respondents
doing carvings
Stone – 5.6 per cent
of all respondents
doing carvings
Marine Artefacts –
5.6 per cent of all
respondents doing
carvings
Bamboo/Calabash,etc
– 5.6 per cent of all
respondents doing
carvings11
Additives and
Finishes – 61.11 per
cent of all carvers
62.3 per cent of
wood carvers say
wood is hard to
access (outside of
parish or deep rural
Trelawny)
Stone – seas and
mountains (not hard
to access)
Bamboo/Calabash –
easy to access
Wood – hills of
Trelawny and other
parishes,
lumberyards
Wood – $8,593.75
per tree
Calabash – $1500
ea
Bamboo – $500 ea
Sandpaper -
$120/ft
Lacquer –
$135/quart
Polish – $50 ea
1111 One person here also does basket weaving in addition to carving.

32
Needlecraft/Clothing
– 25 per cent of
producers in
Trelawny
Thread – all
respondents doing
needlecraft
Wool – 40 per cent of
all respondents doing
needlecraft
Material – 20 per cent
of needle craft
workers
Needles – mentioned
by one person
(underreported)
Only 20 per cent of
respondents stated
that some items were
not always easy to
locate (belt buckle
and wool
sometimes)
Local stores
(Montego Bay)
Kingston Stores
Material – $380/yd
Wool - $328.33
per roll
Thread – $400/roll
Jewellery – 20.8 per
cent of craft
producers
Beads – 50 per cent
of respondents doing
jewellery products
Stones - 16.67 per
cent of jewellery
producers
Lines and latches –
16.67 per cent of
jewellery producers
(may be
underreported)
All raw materials
easy to access most
of the time
Local stores in and
around the parish
and Montego Bay
Beads – $200/pk
Stones - no cost
Hooks and Latches
– $120 ea
Misc. e.g. Leather
Products - 4.2 per
cent of respondents
Leatherette – all
respondents (only one
respondent)
Easy to access in and
around the areas
Fabric stores
Leatherette -
$375/yd
For craft producers in the parish of St James the typical product profiles are shown in Table
below
Table 18: Product Profile of Craft in the Parish of St James
Product Typical Raw
Materials Used
Location of Raw
Material
Supplier/Source of
Raw Material
Average/Typical
Prices Per Unit (J$)
Carvings and
Woodwork – 25.8
per cent of
respondents from St
James
Wood – all
respondents doing
carvings
Additives and
Finishes – 8.3 per
cent of all carvers
(may be
underreported)
41.7 per cent of
respondents state
that wood is not
easily accessible.
Carpentry and
hardware stores in
Montego Bay and
environs.
Tree - $11,500 ea
Wood – $130/ft
Varnish - $700/qt
Sandpaper – $130/ft
Glue – $130/qt

33
Needlecraft/Clothing
/Dolls – 35.5 per
cent of respondents
from St James
Wool – 66.66 per
cent of those in
needlecraft
Material (cloth,
burlap, raffia)- 50
per cent of those in
needlecraft
Thread – 75 per cent
of those in
needlecraft (may be
underreported)
Needles – 16.67 per
cent of respondents
in needlecraft (may
be underreported)
Raw materials in and
around the parish
easy to access for all
respondents (only
acrylic sometimes
not easy)
Local shops and
haberdasheries
Burlap – 100/yd
Wool - $687.50/roll
Thread - $283.33
Material - $275/yd
Needles – $50/pk
Raffia - $90/bundle
Paint – $500/tube
Jewellery – 12.5 per
cent of respondents
Organic materials
(e.g. goat skin, cow
hides, horns etc) –
20 per cent of all
jewellers
Stones – 20 per cent
of all jewellers
Beads – 60 per cent
of all jewellers
80 per cent of
respondents state
that materials easy to
access in and around
the parish. Polish
has to be imported
for organic jewellery
Butchers,
haberdasheries,
other local shops.
Goat skin - $600/lb
Cow hide - $700/lb
Cow horn - $1000
per bag
Seashells - $1500
per bag
Beads -100 per bag
Souvenir Items (e.g.
magnets, key rings
etc) – 12.5 per cent
of respondents
Coconut Shells – all
respondents in
souvenir items
Rings – 66 per cent
of all respondents
use ring
Magnets – 33 per
cent use magnets
Additive and
Finishes – 66 per
cent use additives
and finishes (may be
underreported)
33 per cent report
that magnets are
hard to get locally
otherwise other
materials are easy to
access
Hardware stores and
related shops in
Montego bay
Coconut shells -
$200/bag
Paint – $500/tube
Rings – $1000/100
Labels - $1/ea
Leather craft – 12.5
per cent of
respondents
Animal hides – all
respondents
Additives and
Finishes – all
respondents
50 per cent of
respondents state
that leather and
polish is not easy to
access.
Local farmers
Overseas
Animal hide –$
650/lb

34
Decorative Baskets
and Art – 25 percent
of respondents.
Straw – 60 per cent
of respondents
Zip and lining – 20
per cent of
respondents
Additives and
finishes – 40 per
cent of respondents
Canvas – 20 per cent
of respondents
All easy to access
and available in
parish
Carpentry stores,
local hardwares and
haberdasheries
Canvas - $500/yd
Acrylic – $500/tube
Straw –
$2000/bundle
Zips – $150/doz
Focus group discussions with respect to products raised the issue of quality and the
dominant responses were centred on the fact that producers do not think that local craft is being
produced to an international standard. They actually require that some basic standards be set in
the sector with more prominent roles for organizations such as Things Jamaican and also the
Edna Manley School for the Arts especially in appraisal and quality control. They also suggest
the need for exchange programmes (including alliances with overseas partners) and more
research and development in the craft producing sector
It was also stated that there is the need for more prominent use of indigenous materials
and assistance in patents and property rights to protect local art and craft. Training must also be
directed at craft producers with respect to areas project and product management and the proper
use of machinery.
2.4.2 Details of Operations
Based on data gathered from the field interviewer survey, the typical craft producing
organization has on average been in operation for approximately 20 years – which is roughly half
the life of the owner; who in many cases started the firm on his/her own. With respect to years
in operations (Quest. 9) there were some producers who did not respond to this as in some cases
they could not remember precisely. For St Ann ten (10) respondents (22 per cent) could not
precisely state for how long they were in operation. For Trelawny there were two (8 per cent)
such respondents and for St James one respondent (3 per cent) could not recall the length of time
of operations.

35
Table 19: Years in Operation for the Typical Craft Producing Organization
Parish Avg. (Mean) Years in
Operation
Mode Median Min Max
St Ann
20.2
10
22.5
0.3
38
Trelawny
21.2
30
19.5
2
43
St James
19.7
20
20
3
37
All Parishes Surveyed
20.2
25
20.5
0.3
43
Discussions (i.e. direct interviews, focus groups and community discussions) also show that the
typical operations are strongly related to those of micro-enterprises i.e.
Working Hours - Craft producers state in discussions that their typical working hours vary.
For those who do unfinished products and sell to craft vendors their working hours are
dependent on orders and also seasonality (i.e. high and low tourist seasons). For those who
make craft and sell in the craft markets (and other retail outlets) the working hours are more
regular as (evidenced by visits) some arrive even before 7:00 am to prepare for a typical
working day.
Small tools and low levels of mechanization and automation – operations are highly labour
intensive where in most cases more than half the work is done by hand
Sharing of equipment – there are cases where equipment has to be shared
Distribution Chain – the distribution chain in most cases seem to be dependent on public
transport as numerous producers state that do not have personal transport.
It is important to note that technical operations vary according to the type of craft being
produced. Each product has various steps but generally speaking there are universal steps in the
process that can be identified. These include the formulation of a concept, the acquisition of the
necessary materials, initial creations, finishing work, packaging and sales. Simplified steps for
three (3) various craft/skills are shown below in Figures 1-3:

36
CONCEPT/
VISUALIZATION
ACCESS RAW
MATERIAL (e.g.
Wood)
CARVE WOOD
TO REQUIRED
SPECIFICATIONS
SAND
PRIME
SEAL
COLOUR AND
DECORATE
PACKAGE AND
DISPLAY
Figure 1: Core Business Processes for Aboriginal Art/Wood Products (Simplified)
CONCEPT
(Normally a
Sketch)
SETTING OF
PATTERNS
ACQUIRE AND
SKETCH
LEATHER
OVERLAYING OF
EXACT
PATTERNS
FITTING
DYEING AND
LACQUERING
SANDING AND
POLISHING
PACKAGING
AND DISPLAYS
Figure 2: Core Business Processes for Leather Craft (Simplified)
CUSTOMER
CONCEPT
PROCUREMENT
OF REQUIRED
MATERIALS
TAKE
MEASUREMENT
S
CUTTING STITCHINGFINAL FIT AND
STITCHTRIM AND IRON PACKAGING
Figure 3: Core Business Processes for Needle-craft- Dressmaking (Simplified)
Discussions in focus groups showed that the average craft producer has more to do regarding
operations such as the securing of funding for the purchase of raw materials, and establishing
strong linkages to markets.

37
2.4.3 Future Products
With respect to future products (Quest 28) almost all respondents answered this question
(approx. 99 per cent). The details are shown in Table below
Table 20: Future Products Desired by Parish
Parish More Products Desired No more products desired
St Ann
28 (60.9 per cent)
18 (39.1 per cent)
Trelawny
11 (45.8 per cent)
13 (54.2 per cent)
St James
12 (38.7 per cent)
19 (61.3 per cent)
All Parishes Surveyed
51 (50.5 per cent)
50 (49.5 per cent)
With respect to the additional products respondents desired to produce (Quest 29) these varied
significantly by parish. With respect to St Ann craft producers the major additional products are
shown below in the Chart.
Seventeen (17) respondents from this parish (37 per cent of all producers) do not see a problem
in launching these products (Quest 29) while eleven (11) expected challenges (23.9 per cent).
Wood and Other Carvings, 4
Paintings, 3
Needlecraft and Related Products, 12
Jewellery and Related, 3 Leather Prod. 3
Basket Weaving and Related Prod, 3
Fre
qu
en
cy (
No
)
Products
Chart 2: Additional Products Desired by Craft Producers in St Ann

38
The major challenges foreseen are shown in Table below. Note that in this parish many
respondents saw more than one major challenge.
Table 21: Major Challenges Foreseen to Launch Future Products (St Ann Producers)
Major
Challenge
Foreseen
Lack of
Capital
Competition Training Lack of Tools and
Machinery
Need to
Improve
Marketing
Frequency of
response (No.)
7
4
1
2
1
With respect to Trelawny craft producers the major additional products desired by craft
producers are shown in Chart below.
Six (6) respondents (25 per cent) did not see a problem in launching these products (Quest. 29).
Five respondents (20.8 per cent) stated that there would be challenges. These challenges are
stated below
Table 22 Major Challenges Foreseen to Launch Future Products (Trelawny Producers)
Major Challenge
Foreseen
Lack of Capital Marketing and Access to
Markets
Lack of Equipment and Tools
Frequency of response
(No.)
2
2
1
Jewellery , 3 Paintings and Canvas Art, 3
Carvings and Related Products,
4
Pottery , 1 Sewing and
needlework, 1 Fre
qu
en
cy (
No
)
Products
Chart 3: Additional Products Desired by Craft Producers in Trelawny

39
For St James producers the major additional products desired are shown in the Chart below.
Five (5) respondents from this parish did not see a challenge in launching these products while
eight (8) respondents saw challenges. The major challenges foreseen are shown in Table below
Table 23: Major Challenges Foreseen to Launch Future Products (St James Producers)
Major Challenge
Foreseen
Training and Tools Competition from imports Lack of resources
Frequency of
response (No.)
5
1
2
2.4.4 Tools and Technologies
When asked about tools and equipment used to make their products (Quest 32) the responses
from craft producers are shown in Table below:
Table 24: Tools and Technologies Used to Make Products
Parish By Hand Machine And
Related Tools
Combination Of Both
St Ann
11 (23.9 per cent)
3 (6.5 per cent)
32 (69.5 per cent)
Trelawny
5 (20.8 per cent)
1 (4.2 per cent)
18 (75 per cent)
St James
12 (38.7 per cent)
0
19 (61.3 per cent)
All Parishes Surveyed
28 (27.7 per cent)
4 (4 per cent)
69 (68.3 per cent)
Jewellery and Jewellery boxes, 2
Painting and fine art, 4 Other Products , 4
Fre
qu
en
cy (
No
)
Products
Chart 4: Additional Products Desired by Craft Producers in St James

40
With respect to the adequacy of tools and/or machinery in the making of their products (Quest
34), the responses are shown in Table below
Table 25: Adequacy of Current Tools for the Undertaking of Production
Parish Current Tools Are
Adequate
Current Tools
Inadequate
No Answer
St Ann
16 (34.8 per cent)
27 (58.7 per cent)
3 (6.5 per cent)
Trelawny
5 (20. 8 per cent)
17 (70.8 per cent)
2 (8.4 per cent)
St James
7 (22.6 per cent)
23 (74.2 per cent)
1 (3.2 per cent)
All Parishes Surveyed
28 (27.7 per cent)
67 (66.3 per cent)
6 (5.9 per cent)
Tools stated by respondents with respect to craft product were varied and dependent on the type
of craft being produced. Table 2 below shows typical tools used and desired by craft producers
on the North Coast Corridor (Quest. 33 and 35).
Table 26: Tools and Technologies of Craft Producers by Product Group
PRODUCT GROUP TYPICAL MACHINES AND TOOLS
CURRENTLY USED
TYPICAL MACHINERY AND
TOOLS DESIRED
Carvings
Machete, gouges, chisels, jigsaws, coping
saws, drills, Vs, power saws, blade files,
sandpaper/sandpaper belts, drummel, etc
Power saws, rotor saws, sanders,
power drummel air compressors,
band saws, chopsaws, bamboo cutter
Dolls
Needles, surger, sewing machine
Sewing machine, surger. Computer
aided design fabricator (CADE)
Needle Craft
Needles, raffia needles, sewing machine
Sewing machine, needles, industrial
machine
Jewellery
Coping saw, buffing wheel, diamond blade
Gemstone cutter, buffing machine,
special diamond saw.
Leather Items
Pattern tools, swivel, edging tools, mallets,
ply-board, stitching machine, press, mill
Insole cutting machines, strap
cutting machines, skiver, clicker,
sanding machine
Of the visits to three (3) sites and workshops within the parishes of St Ann, Trelawny and
St James only one site (Cambridge) had anything close to a fully fitted workshop (inclusive of
electrically powered equipment). There is also extensive tool sharing in other areas such as Mt

41
Zion (St Ann) and Coopers Pen (Trelawny). Most sites and individual work areas showed non
powered hand tools as the major equipment used to produce craft.
Focus group discussions with respect to tools and technologies revealed that there are
advanced technology available. This will increase the quality and quantity of goods produced.
The major drawback however is the prohibitive costs which the average craft producer faces.
Suggestions by group members to alleviate these costs were to advocate for incentives in the
importation of such equipment and machinery.
2.5 Markets
Discussions in focus groups and site visits show that access to markets and marketing are
currently a major challenge to craft producers. They state that first market access is highly
restricted although they are producers as they are sometimes at the mercy of more powerful
lobby groups such as hotels, craft vendors and other middlemen. There are also high incidences
of bribery and corruption in many spheres. This has affected them negatively where there is
sometimes next to no business regardless of the number of visitors to the island. They provide
examples where they state that if 10,000 tourists come almost 9,500 will visit Dunns River and
they are not given enough time to visit other areas and they are also detoured from certain areas
by guides. They are therefore faced under conditions where a restricted market exists.
In addition to the tourist market, focus group members are also acutely aware that they
have not exploited other markets. These include the market for locals (especially those in
Kingston) and the market for the Jamaican Diaspora. This they say will require improved uses
of the electronic media such as the internet, Facebook and the development and design of web
pages.

42
2.5.1 Current Markets and Targeted Customers
When queried as to who their customers are (Quest 40) the results show that the tourist
market is the largest for craft producers along the North Coast Corridor as shown in Table below.
Table 27: Market Segmentation for Craft Producers by Parish
Parish Tourists Hotels Overseas
Importers
Local Buyers
Retail
Shops Other
St Ann
33
(39.8 per cent)
9
(10.8 per
cent)
1
(1.2 per cent)
31
(37.4 per cent)
6
(7.2 per cent)
3
(3.6 per cent)
Trelawny
16
(44.4 per cent)
2
(5.6 per cent)
1
(2.8 per cent)
12
(36.1 per cent)
1
(2.8 per cent)
4
(11.1 per cent)
St James
22
(40.7 per cent)
4
(7.4 per cent)
0
17
(31.5 per cent)
1
(1.9 per cent)
10
(18.5 per cent)
All Parishes
Surveyed
71
(41 per cent)
15
(8.7 per
cent)
2
(1.2 per cent)
60
(34.7 per cent)
8
(4.6 per cent)
17
(9.8 per cent)
Some craft producers have varied customer bases as shown in Chart below where some have
even have three or more different types of customers.
One Customer Only, 40.1 Two Customers,
36.6
Three or More Customers, 22.8
Pe
r ce
nt
of
Cra
ft P
rod
uce
rs
Number of Customers
Chart 5: Diversity of Customer Base - All Craft Producers

43
2.5.2 Distribution Channels
When queried with respect to distribution channels (Quest 39) responses are shown by parish in
Tables 28-30 below. Note that in many instances producers used more than one channel for
distributing their goods.
Table 28: Distribution Channels – St Ann
Distribution Channels Frequency
Distribution
(No.)
Typical Location of Distribution Channels
Trade shows 7 28.5 per cent report trade shows such as Denbigh, trade show
in Miami
Hotels 13 15.4 per cent report hotels such as Jewels, Jamaica Grand and
Royal Decameron
Craft markets 41 43.9 per cent report Pineapple Place Craft Market
22 per cent Ocho Rios craft market
Others mentioned – old craft market and coconut grove
Pharmacies 7 Only one person reported organizations in Ocho Rios
Supermarkets 4 Only one person reported organizations in Ocho Rios
Variety stores 5 60 per cent stated Ocho Rios and 20 per cent Montego Bay
while the others did not report
Send items overseas (export) 1 No channels reported
Things Jamaican -
I walk and sell 8 37.5 per cent reported that they walked and sold goods in and
around the Ocho Rios area. Others did not report.
Other - Cruise ship pier
5 80 per cent report the Ocho Rios Pier as their location.
Others did not report.
Table 29: Distribution Channels - Trelawny
Distribution Channels Frequency
Distribution (No.)
Typical Location of Distribution Channels
Trade shows 1 No report
Hotels 8 37.5 per cent state Trelawny Beach. Others stated are
Sandals, Royal Decameron Montego Bay and Breezes
Craft markets 5 60 per cent Montego Bay craft markets
40 per cent Pineapple Place Craft Market
40 per cent Falmouth Craft Market
20 per cent Negril Craft Market
Pharmacies -
Supermarkets -
Variety stores -
Send items overseas (export) 1 No report
Things Jamaican -
I walk and sell 1 Shipping port and street side
Other - Pier
Art Galleries
9
2
Falmouth/Trelawny cruise ship pier reported by 88.9 per
cent of respondents
Bolivar Art Gallery and other galleries in Kingston
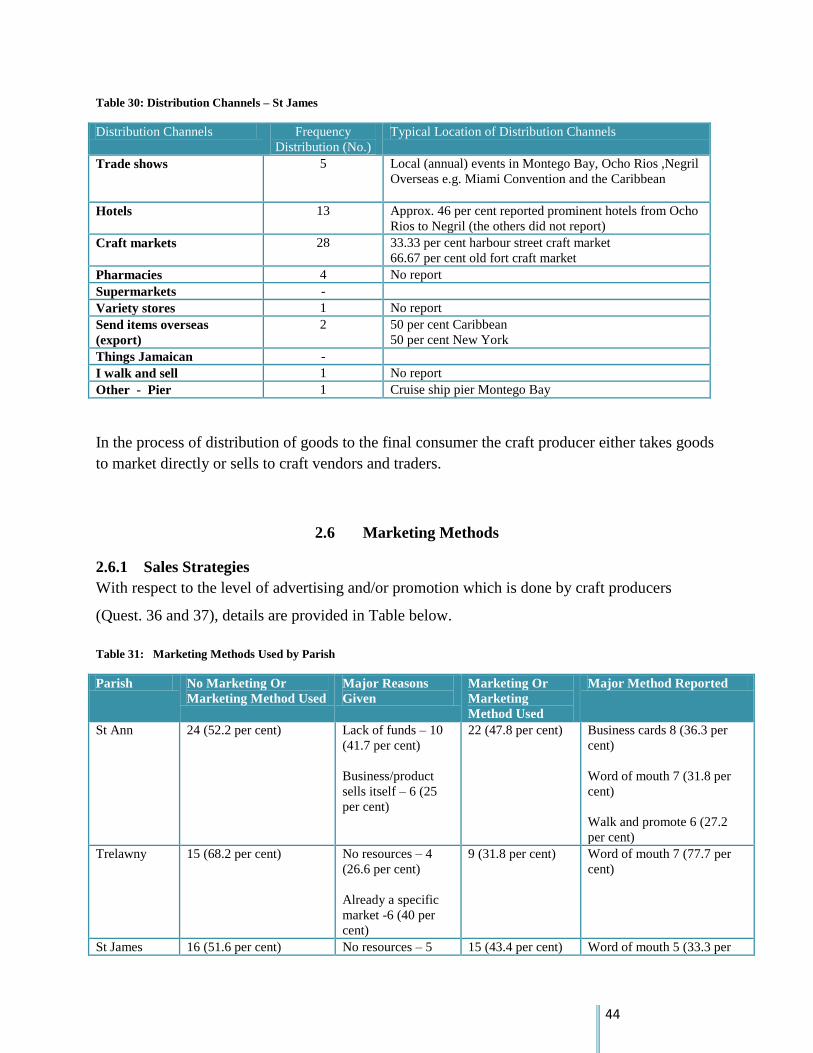
44
Table 30: Distribution Channels – St James
Distribution Channels Frequency
Distribution (No.)
Typical Location of Distribution Channels
Trade shows 5 Local (annual) events in Montego Bay, Ocho Rios ,Negril
Overseas e.g. Miami Convention and the Caribbean
Hotels 13 Approx. 46 per cent reported prominent hotels from Ocho
Rios to Negril (the others did not report)
Craft markets 28 33.33 per cent harbour street craft market
66.67 per cent old fort craft market
Pharmacies 4 No report
Supermarkets -
Variety stores 1 No report
Send items overseas
(export)
2 50 per cent Caribbean
50 per cent New York
Things Jamaican -
I walk and sell 1 No report
Other - Pier 1 Cruise ship pier Montego Bay
In the process of distribution of goods to the final consumer the craft producer either takes goods
to market directly or sells to craft vendors and traders.
2.6 Marketing Methods
2.6.1 Sales Strategies
With respect to the level of advertising and/or promotion which is done by craft producers
(Quest. 36 and 37), details are provided in Table below.
Table 31: Marketing Methods Used by Parish
Parish No Marketing Or
Marketing Method Used
Major Reasons
Given
Marketing Or
Marketing
Method Used
Major Method Reported
St Ann 24 (52.2 per cent) Lack of funds – 10
(41.7 per cent)
Business/product
sells itself – 6 (25
per cent)
22 (47.8 per cent) Business cards 8 (36.3 per
cent)
Word of mouth 7 (31.8 per
cent)
Walk and promote 6 (27.2
per cent)
Trelawny 15 (68.2 per cent) No resources – 4
(26.6 per cent)
Already a specific
market -6 (40 per
cent)
9 (31.8 per cent) Word of mouth 7 (77.7 per
cent)
St James 16 (51.6 per cent) No resources – 5 15 (43.4 per cent) Word of mouth 5 (33.3 per

45
Only word of mouth
needed – 4
Market already there
– 3
cent)
Business cards 6 (40 per
cent)
Facebook and internet 3 (20
per cent)
All Parishes
Surveyed 55 (54.5 per cent) 46 (45.6 per cent)
2.6.2 Exports
With respect to the export of craft items (Quest 41) the responses by parish are shown in Table
below
Table 32: Level of Export of Craft Items by Parish
Parish EXPORTS CRAFT
ITEMS
DOES NOT EXPORT
CRAFT ITEMS
NO ANSWER
St Ann
3 (6.5 per cent)
42 (91.3 per cent)
1 (2.2 per cent)
Trelawny
3 (12.5 per cent)
21 (87.5 per cent)
St James
2 (6.5 per cent)
29 (93.5 per cent)
All Parishes Surveyed
8 (7.9 per cent)
92 (91.1 per cent)
1
Note that the number of craft producers who are directly exporting products overseas is very
small. This currently represents approximately 8 per cent of all respondents. The major
countries (Quest 42) are the wider Caribbean, UK, USA and Canada. From discussions craft
producers stated that they are also unable to export their products because of a few issues. First
they do not produce the required quality and the requisite quantities in some cases (lack of
capital, proper machinery etc) and secondly it is costly to package and ship art.
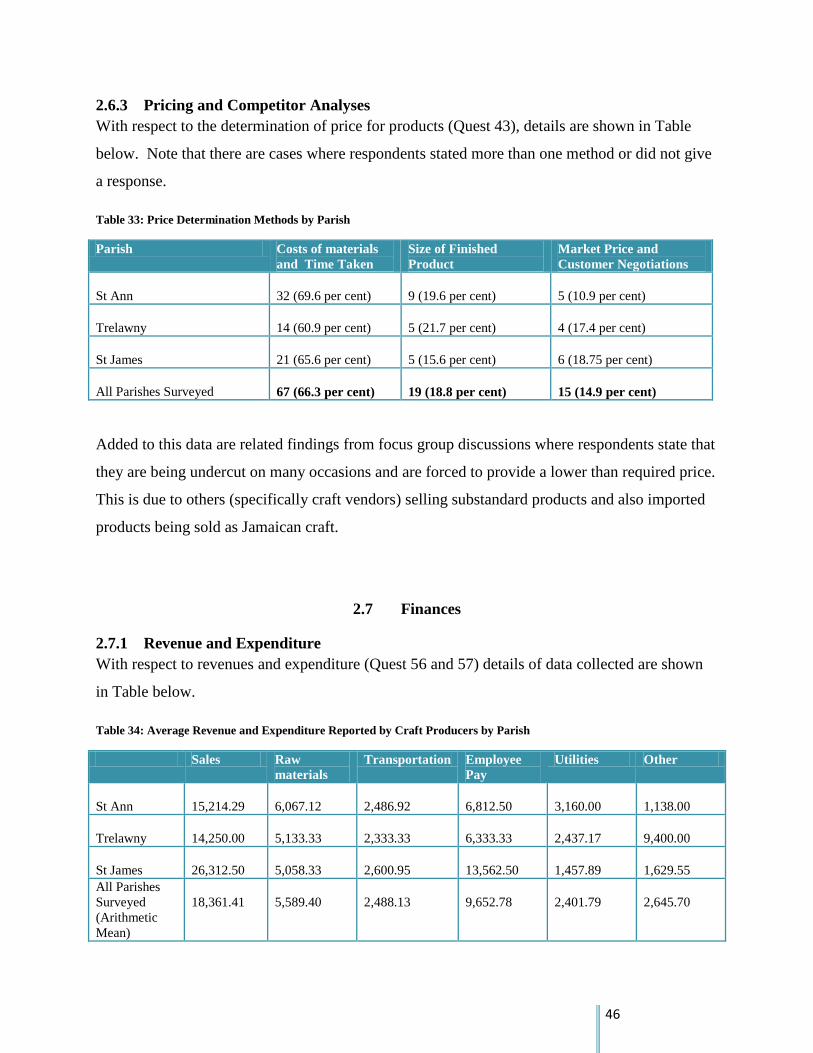
46
2.6.3 Pricing and Competitor Analyses
With respect to the determination of price for products (Quest 43), details are shown in Table
below. Note that there are cases where respondents stated more than one method or did not give
a response.
Table 33: Price Determination Methods by Parish
Parish Costs of materials
and Time Taken
Size of Finished
Product
Market Price and
Customer Negotiations
St Ann
32 (69.6 per cent)
9 (19.6 per cent)
5 (10.9 per cent)
Trelawny
14 (60.9 per cent)
5 (21.7 per cent)
4 (17.4 per cent)
St James
21 (65.6 per cent)
5 (15.6 per cent)
6 (18.75 per cent)
All Parishes Surveyed
67 (66.3 per cent)
19 (18.8 per cent)
15 (14.9 per cent)
Added to this data are related findings from focus group discussions where respondents state that
they are being undercut on many occasions and are forced to provide a lower than required price.
This is due to others (specifically craft vendors) selling substandard products and also imported
products being sold as Jamaican craft.
2.7 Finances
2.7.1 Revenue and Expenditure
With respect to revenues and expenditure (Quest 56 and 57) details of data collected are shown
in Table below.
Table 34: Average Revenue and Expenditure Reported by Craft Producers by Parish
Sales Raw
materials
Transportation Employee
Pay
Utilities Other
St Ann
15,214.29
6,067.12
2,486.92
6,812.50
3,160.00
1,138.00
Trelawny
14,250.00
5,133.33
2,333.33
6,333.33
2,437.17
9,400.00
St James
26,312.50
5,058.33
2,600.95
13,562.50
1,457.89
1,629.55
All Parishes
Surveyed
(Arithmetic
Mean)
18,361.41
5,589.40
2,488.13
9,652.78
2,401.79
2,645.70

47
Modal Value –
All Parishes
$10,000.00
$4,000.00
$1,000.00
$2,000.00
$1,000.00
$400.00
Median Value
– All Parishes
$10,000.00
$3,500.00
$1,500.00
$3,500.00
$1,000.00
$1,200.00
Max Value –
All Parishes
$200,000.00
$50,000.00
$15,000.00
$77,500.00
$18,000.00
$21,000.00
Min Value –all
Parishes
$1,000.00
$300.00
$60.00
$1,000.00
$150.00
$100.00
2.7.2 Financial Management
With respect to how craft producers keep a record of the money they earn (Quest 58) details are shown in
Chart below
No Record, 42%
Written Record/Reciepts,
36%
Mental Note, 23%
No Record
WrittenRecord/Reciepts
Mental Note
0 10 20 30 40 50
Chart 6: Methods Used for Keeping Records of Earnings (All Craft Producers)

48
With respect to how expenses are recorded (Quest 59) details are shown in Chart below
With respect to how expenses are tracked (Quest 60) details are shown in Chart below.
No Record, 41%
Written Record/Reciept
s, 32%
Mental Note, 15%
No Response, 13%
No Record
Written Record/Reciepts
Mental Note
No Response
0 10 20 30 40 50
Chart 7: Methods Used for Keeping Records of Expensess (All Craft Producers)
No Record, 41%
Written Record/Reciepts,
31%
Mental Note, 17%
No Response, 12%
No Record
WrittenRecord/Reciepts
Mental Note
No Response
0 10 20 30 40 50
Chart 8: Methods Used for Keeping Track of Expensess (All Craft Producers)

49
With respect to having a bank account designated for the business (Quest 61) details are shown in Table
below
Table 35: Craft Producers who have a Designated Bank Account for their Business
Parishes Bank Account For
Business Exists
No Bank Account Specific
For Business
St Ann
4 (9.5 per cent)
42 (91.3 per cent)
Trelawny
2 ( 8.3 per cent)
22 (91.7 per cent)
St James
5 (16.1 per cent)
26 (83.9 per cent)
All Parishes Surveyed
11 (10.9 per cent)
90 (89.1 per cent)
With respect to how business money is kept if there is no designated bank account (Quest 62)
details are shown below in Table
Table 36: Where Money is kept when there is no Bank Account for Business
Parish In Personal
Account
Not Enough
Money Made
Money Goes
Back Into
Business
No Response
St Ann
15
(32.6 per cent)
7
(15.2 per cent)
14
(30.43 per cent)
10
(21.7 per cent)
Trelawny
7
(29.2 per cent)
1
(4.2 per cent)
7
(29.2 per cent)
9
(37.5 per cent)
St James
9
(29 per cent)
5
(16.1 per cent)
3
(9.7 per cent)
14
(45.2 per cent)
All Parishes
Surveyed
31
(30.7 per cent)
13
(12.9 per cent)
24
(23.8 per cent)
33
(32.7 per cent)
These trends are also evident in focus groups where group members state that they themselves
are not as disciplined as would be required. In some cases in one focus group some members
were dependent on family members to assist them with book and record keeping. This they say
is also a type of support which will be required to assist them in managing their concerns.

50
2.8 Support Services
In focus group discussions and field visits all members state that all round support to craft
producers are very low. In many cases for issues such as training they do not know who to
contact in their area. All this is supported by evidence from the field data collection [Section
2.2.3]
2.8.1 Permits and Licenses
When asked about special permits and licenses to operate (Quest 10), 48.9 per cent of
respondents said yes this was required. Note that when further queried as to whether or not they
had been granted or acquired such a licence (Quest 11) 30.6 per cent stated that they had a
license. The dominant permit craft producers speak about is the TPDCO/JTB/Team Jamaica
which represented over 90 per cent of the licenses discussed. Further investigations show that
this is actually an operator’s license for craft vendors. Note that only 22 per cent of all craft
producers have such a license.
2.9 Legal Status of Business
2.9.1 Registration
With respect to the type of business and the level of registration (Quest 8) with the Companies
Office of Jamaica (COJ), please see Table below:
Table 37: Number of Businesses and Registration by Parish
Parish No. Of Sole
Traders
No. Of
Partnerships
Other Registered
With The CoJ
Not
Registered
St Ann
45
1
-
3
43
Trelawny
22
2
- -
24
St James
28
3
-
3
28
All Parishes Surveyed
95
6
-
6
95

51
2.10 Business Development
2.10.1 Extent of Business Formulation
Discussions and direct interviews show that with respect to business formulation these
are in many cases fledgling micro-enterprises. They are typified by lack of medium and long
term strategy formulation by the majority of respondents, as discussions in focus groups show
that most organizations have to be living from day to day.
All respondents are acutely aware that their enterprises require some support. This is
evidenced by the fact that only one respondent stated that no additional business support was
required at this time.
2.10.2 Literacy and Numeracy
With respect to overall level of education of craft producers (Quest 50) details are shown in Table below.
Table 38: Overall Level of Education of Craft Producers
Parish Partially
completed
primary school
Completed
Primary
School
Partially
completed high
school
Completed high
school
Tertiary
Undergraduate
No response
St Ann
1
(2.2 per cent)
16
(37.9 per cent)
3
(6.5 per cent)
20
(43.5 per cent)
6
(13 per cent)
Trelawny
-
12
(50 per cent)
3
(12.5 per cent)
4
(16.7 per cent)
2
(8.3 per cent)
3
(12.5 per cent)
St James
2
(6.5 per cent)
11
(35.5 per cent)
1
(3.2 per cent)
16
(51.6)
1
(3.2 per cent)
All
Parishes
Surveyed
3
(3 per cent
39
(38.6 per cent)
7
(6.9 per cent)
40
(39.6 per cent)
9
(8.9 per cent)
3
(3 per cent)
The overall educational level of staff members (Quest 53) including computer literacy (Question
54) is shown in Table12
below.
12 Note that this was highly underreported as many owners/operators did not know much about the education (and sometimes skill level) of their staff members.

52
Table 39: Education Level of Staff Members
Parish Average reported years of
schooling of staff members
Number of staff members classified
as computer literate
St Ann
9
1.5
Trelawny
13.67
1.2
St James
13
1.9
All Parishes Surveyed
12.47
1.6
2.10.3 Previous Exposure to Business
Discussions within focus groups and also with interviewed respondents show that in many cases
craft production was their first business attempt and was initiated out of desperation due to
current economic times. In addition some respondents (particularly females) state that they were
exposed to business through their spouses (some respondents had spouses who were carpenters).
Note also that some respondents had other jobs such as farming and worked in construction and
related trades.
2.10.4 Computer Literacy
With respect to having the ability to use a computer (Quest 52) the responses are shown in Table
below.
Table 40: Ability of Craft Producers to Use a Computer
Parishes Able To Use The
Computer
Unable To Use The
Computer
St Ann
11 (23.9 per cent)
35 (76.1 per cent)
Trelawny
8 (33.3 per cent)
16 (66.7 per cent)
St James
11 (35.5 per cent)
20 (64.5 per cent)
All Parishes Surveyed
30 (29.7 per cent)
71 (70.3 per cent)

53
With respect to the desire for training in computing (Quest 55) the results are shown in Table
below.
Table 41: Number of Craft Producers who desire Computer Training
Training Required No Training
Required
St Ann
41 (89.1)
5 (10.9 per cent)
Trelawny
23 (95.8 per cent)
1 (4.2 per cent)
St James
29 (93.5 per cent)
2 (6.5 per cent)
All Parishes Surveyed
93 (92.1 per cent)
8(7.9 per cent)

54
3.0 CONCLUSION
The onset of the North Coast Revitalization Project is timely as research shows that there
is need for support in areas of financing, training and other operational related areas. There is
also the challenge of organization at the community level by craft producers themselves as this
has affected them not only in the lack of effective advocacy but also market power, standard
setting and pricing of products. It is also important to note that, the mechanisms that are to be
employed to assist producers, stakeholders must be cognizant of the fact that many producers are
in deep rural areas.
Examination of the study’s objective and work scope shows that the Baseline Study for
the craft sector on the North Coast Corridor has achieved some major objectives. First there is
now the availability of data (including a map of craft producers along the North CoastCorridor)
to assist stakeholders in the making of critical executive decisions for the sector. Also the
knowledge of key areas such as market segments and product varieties are now available. For
instance craft in the study area has defined sub-areas such as carving, needlecraft, jewellery and
related areas. These were not known with such clarity before this exercise.

55
PLATES
Plate I: Craft Producers at their workshop in Cambridge St James

56
Plate II: Craft Producers displaying their wares in Coopers Pen Trelawny

57
Plate III: Typical Tools shared by craftsmen in Mt Zion St Ann

58
Appendix 1:
BASELINE STUDY OF THE CRAFT
SECTOR ON THE NORTH COAST
PRODUCERS QUESTIONNAIRE
August 1, 2013

59
A. SCREENING QUESTION
The Jamaica Business Development Corporation (JBDC) and the Tourism Enhancement Fund (TEF) has
collaborated to provide business and technical support to selected craft producers in the parishes of St.
James, Trelawney and St. Ann over a two (2) year period. The purpose of the project is to improve the
competitiveness and income generating capabilities of craft producers from these parishes. Over the two
year period indicated, the project will seek to address: product development and enhancement, the use of
appropriate technologies and equipment, business and marketing skills and improved and diversified
product ranges.
Are you willing to participate in the project now that you are aware of its purpose? (Tick appropriate)
A1. 1. Yes 2. No (If no, abort the interview)
Do you make craft items yourself?
AZ. 1. Yes 2. No (If no, abort the interview)
B. PRODUCER / ORGANIZATION BIODATA – BACKGROUND DATA ON ORGANIZATIONAL
STRUCTURE, STAFFING, LEGAL STATUS, ETC.
1. A. Name of Producer:_____________________ or B. Producer Group:
2. Gender: 1. Male 2. Female (Tick appropriate)
3. Age at last birthday: __________ years
4. Tel (cell): (wk): ________________(hm): ____________
3. Address:
4. Email:
5. Contact Person: b. Tel:
6. With respect to the current nature of your organization, please tell us which category best describes
your organization:
Registration Details
Registered with
Companies Office of
Jamaica
Not Registered with
Companies of Jamaica
Year of Registration (if
applicable)
Sole trader
Partnership and have a
business
Other (specify details)
7. (If a business or other group), how long has your organization been in operation?
________years or __________months (specify).
8. Are there any special permits or licenses that you require to operate [Tick appropriate]
1. YES 2. NO
Indicate Parish: St. Ann St. James Trelawny

60
9. If Yes (Qu. 8 above), please state
10. Have you been granted or acquired such permits or licenses [Tick appropriate] 1. YES 2. NO
11. Do you currently employ any one? [Tick appropriate] 1. YES 2. NO
For producers who employ people (Questions 12-18)
12. If Yes (Qu. 11 above), how many persons do you employ? Total Full-time: Part-time:
__
13. Provide us with information about the people who you employ and their skills as it relates to the
creation of craft items and otherwise (complete the table below):
FULL NAME STAFF
POSITION
YEARS
AT ORG.
SKILLS/
TRAINING
(craft)
SOURCE OF
SKILLS/TRAINING
(craft)
SKILLS /
TRAINING (non-
craft)
14. Are there any skills or areas of training that your organization need at this time? [Tick Appropriate]
1. YES 2. NO
15. If Yes (Qu. 14 above), please state the skills or training that is needed
_________________________________________________________________________________
_________________________________________________________ ________
16. Have you sought to acquire skills or training that are not present in your organization? [Tick
Appropriate] 1. YES 2. NO
17. If Yes (Qu. 16 above), did you experience any challenges? [Tick Appropriate]. 1. YES 2. NO
18. If Yes (Qu. 17 above), please tell us about these challenges (space overleaf).
_________________________________________________________________________________
___________________________________________________________ _______

61
For producers who do not employ anyone (Questions 19-24)
19. Provide us with information about the skills or training that you have as it relates to the creation of
craft items and otherwise (complete the table below):
SKILLS (craft) TRAINING (craft) SKILLS /
TRAINING
(NON-CRAFT)
HOW DID YOU
ACQUIRE THIS
SKILL
HOW DID YOU
ACCESS THE
TRAINING
20. Are there any skills or areas of training that you need at this time? [Tick Appropriate]
1. YES 2. NO
21. If Yes (Qu. 19), please state the skills or training that is needed
_________________________________________________________________________________
___________________________________________________________________ ______
22. Have you sought to acquire this particular skill/s or training needed? [Tick Appropriate]
1. YES 2. NO
23. If Yes (Qu. 21), did you experience any challenges? [Tick Appropriate] 1. YES 2. NO
24. If Yes (Qu. 22), please state these challenges
_________________________________________________________________________________
_________________________________________________________________________________
C. PRODUCTS AND PRODUCT DEVELOPMENT - TYPES OF PRODUCTS AND PRODUCTION
PROCESS, LOCATION, DETAILS OF OPERATIONS INCLUDING FACILITY, RAW MATERIAL
ACCESS, FUTURE PRODUCTS, TOOLS & TECHNOLOGY IN PLACE OR REQUIRED
25. Please tell us about the craft items that you make and the major sources of raw materials used:
PRODUCTS RAW
MATERIAL
USED
LOCATION OF RAW MATERIAL
(tick response)
SOURCE/
SUPPLIER
OF RAW
MATERIAL
PRICE PER UNIT
FOR RAW
MATERIAL
Easy to access
(located in
parish)
Not easy
to access
(outside of
parish)
Imported

62
26. Do you desire to produce any other products for the market? [Tick Appropriate]
1. YES 2. NO
27. If Yes (Qu. 25), what additional products do you desire to provide?
28. Do you foresee any problems in launching these products? [Tick Appropriate]
1. YES 2. NO
29. If Yes (Qu. 27), please tell us about the problems you foresee?
30. How do you make your products? [Tick Appropriate]
1. By hand 2. Machine and other tools and equipment
3. Other, Specify
31. If you make your products using a machine or any other tool, please tell us the name of the equipment
used in the craft-making process
_________________________________________________________________________________
___________________________________________________________________
32. Are these all the tools and technologies you need? [Tick Appropriate] 1. YES 2. NO
33. If no, what else do you require?
_________________________________________________________________________________
___________________________________________________________________
D. MARKETS AND MARKETING METHODS – CURRENT MARKETS AND DISTRIBUTION
CHANNELS
34. Do you undertake any form of advertising, marketing OR promotion of the products that you make?
[Tick Appropriate] 1. YES 2. NO
35. If Yes (Qu. 33), please state the methods you use to promote or advertise your products
36. If No (Qu. 33), please state why you do not promote your services

63
37. How are your products distributed or sold?
Distribution Channels Yes No Location of Distribution Channels
Trade shows
Hotels
Craft markets
Pharmacies
Supermarkets
Variety stores
Send items overseas (export)
Things Jamaican
I walk and sell
Other (specify)
__________________________
38. Who are your customers? [Tick Appropriate]
1. Tourists 2. Local buyers (retail)
3. Hotels 4. Shops
5. Overseas importers 6. Other (specify) ____________________________
39. Do you export craft items? [Tick Appropriate] 1. YES 2. NO
40. If Yes (Qu. 38), please state the country(ies) to which they are exported: _______________________
41. Please tell us how you determine the price at which you sell your products / craft items
_________________________________________________________________________________
___________________________________________________________________
_________________________________________________________________________________
E. SUPPORT ORGANIZATIONS AND SERVICES: ASSISTANCE RECEIVED FROM AGENCIES
COMMUNITY ORGANIZATIONS, PROVIDERS BOARDS ETC.
42. Do you know of any organizations or groups that support or assist craft producers? [Tick
Appropriate] 1. YES 2. NO
43. If Yes (Qu. 41), please tell us the name of the organization or group:
_________________________________________________________________________________
44. Have you benefited from any form of assistance in the past from any organization or entity as it
relates to your business? [Tick Appropriate] 1. YES 2. NO

64
45. If Yes (Qu. 43), please complete the following table:
ORGANIZATION
/ AGENCY
ORGANIZATION
TYPE
NATURE OF
ASSISTANCE
SERVICE IMPROVEMENTS AS A
RESULT OF ASSISTANCE
46. Do you need any additional support at this time? [Tick Appropriate] 1. YES 2. NO
47. If Yes (Qu. 45), please describe the additional support that you need and state how this will impact
your business?
Assistance Needed Forecasted Impact
F. BUSINESS DEVELOPMENT - EXTENT OF BUSINESS FORMALIZATION; LITERACY,
NUMERACY, COMPREHENSION SKILLS AND COMPETENCIES; PREVIOUS EXPOSURE TO
BUSINESS TRAINING, COMPUTER LITERACY; OWN ASSESSMENT OF BUSINESS DEVELOPMENT
NEEDS
48. What is your overall level of education? [Tick Appropriate]
1. Didn’t complete primary school 2. Completed primary school
3. Partially completed high school 4. Completed high school
5. Tertiary (undergraduate/bachelors) 6. Tertiary (masters & higher)
7. Didn’t attend school 8. Other (specify)
49. Do you know how to use the computer? [Tick Appropriate] 1. YES 2. NO
50. If yes, please state two computer programs that you know how to use
_______________________________________________________________________
51. What is the overall education level of your staff members? (if producer employs anyone)
STAFF MEMBER POSITION YEARS OF
SCHOOLING
DIRECT BUSINESS
TRAINING DONE

65
52. How many of your staff members can be classified as computer literate? ________________
53. Do you desire any training in the area of computers and computer literacy [Tick Appropriate]
1.YES 2. NO
G. FINANCES – REVENUE AND EXPENDITURE, FINANCIAL MANAGEMENT METHODS
54. What is your weekly sales amount? $
55. Please give a breakdown of weekly expenses (table below has examples):
Expense Associated Cost
Raw material purchase
Transportation
Employee pay
Utilities
Other, Specify:
56. How do you keep record of the money that you earn?
57. How do you record your expenses?
58. How do you keep track of your expenses?
59. Do you have a bank account that is designated for this business? [Tick Appropriate]
1. YES 2.NO
60. If no, how do you keep the money that is made from your business?
_________________________________________________________________________________
_________________________________________________________________________________
END OF QUESTIONAIRE – THANK YOU FOR PARTICIPATING

66
Appendix 1 cont’d
Focus Group Guide
1. What do you know about the North Coast Revitalization Project?
2. What current ventures exist in your community with respect to craft production?
3. What are the typical steps you have to employ to make your product
4. What are the skills/training/abilities required to manage a craft producer organization
5. What are the major challenges (in order of importance) that a typical craft producing organization
faces in Jamaica today?
6. What can craft producers do to lessen these challenges?
7. Do you think support services offered by agencies currently assist you in dealing with these
challenges
8. what more can these agencies do to assist the craft sector?
9. What challenges exist with respect to Product Development?
10. Are there changes needed with respect to technology
11. do you think the quality of craft items produced is up to an international standard? Explain your
answer
12. If quality is to be maintained what mechanisms must be in place to ensure this?
13. If quality is to be improved what mechanisms must be in place to ensure this?
14. How do you market currently? Is this an adequate approach?
15. What more do you need to do to improve marketing.
16. What currently restricts you from your current target market?