Final Report Ip Ptc
71
1 Introduction Background The concept for the International Pilot Project for Technology Cooperation (IPPTC) originated in the United States Department of Defense in an effort to help answer one of the most frequently asked que- stions in humanitarian demining, "Which is the best metal detector to use?". The project, although conceived in October 1997, did not actually become reality until December 1998, when voluntary participants from Canada, the Netherlands, the United Kingdom and the European Commission’s JRC teamed with the United States to lay the groundwork. The pilot project took 21 months to complete, with actual testing being conducted in several phases. Laboratory testing took place in the Netherlands and Canada, followed by field-testing in both Cambodia and Croatia. Purpose The purpose of the pilot project was to conduct a coordinated, multi-national, technical evaluation of metal detectors suitable for use in humanitarian demining. The project sought to demonstrate, throu- gh a "consumer reports" type of evaluation, the mine detection capabilities of commercial-off-the-shelf (COTS) metal detectors. The report is available in the public domain. The background information is avai- lable to governments and organizations and indivi- duals involved in the global humanitarian demining effort at the discretion of the holder of the detailed report on that aspect of the results. It is hoped that this document will assist organiza- tions in selecting the detector(s) most suitable for their particular environment or unique operational conditions. The pilot project also served as a test vehicle to identify and resolve problems in demining technology cooperation as the lead effort for the International Test and Evaluation Program (ITEP). Project Overview The detectors involved in the evaluation were pur- chased after soliciting the recommendations of all manufacturers known to the IPPTC team as to which detectors were suitable for humanitarian demining applications (see Annex C Invitations to partici- pants). No model recommended by a manufacturer was excluded. Some manufacturers did not respond, while others offered prototype models still under development, which were not evaluated. Since the initiation of the project, several new detector models have entered the market and are currently being offered to the humanitarian demining community. Finally, some models currently available may be dif- ferent from the equivalent models utilized in the pilot project. Readers interested in purchasing detectors are encouraged to contact manufacturers about implications of actual and potential changes prior to acquisition. The solicitation resulted in the purchase of three copies of each of 25 different detector models from 13 manufacturers. Some detectors had more than one type of search head, resulting in a total of 29 different sensors for evaluation. The detectors finally included in the IPPTC tests were the following: Adams AD2500 and AD2600S Ebinger EBEX 420 GC and EBEX 535 Fisher 1235-X, 1266-XB, and Impulse Foerster MINEX 2FD 4.400.01 Giat Model F1 (DHPM-1A) Guartel MD4, MD8, MD2000 LG Precision PRS-17K Minelab F1A4 CMAC and F1A4 MIM Pro-Scan Mark 2 VLF Reutech Midas PIMD Schiebel AN-19/2, ATMID, MIMID Vallon ML 1620C and VMH2 White's AF-108, DI-PRO 5900 and Spectrum XLT 1. Introduction
-
Upload
bruno-benard -
Category
Documents
-
view
235 -
download
2
Transcript of Final Report Ip Ptc
1Introduction
BackgroundThe concept for the International Pilot Project forTechnology Cooperation (IPPTC) originated in theUnited States Department of Defense in an effort tohelp answer one of the most frequently asked que-stions in humanitarian demining, "Which is the bestmetal detector to use?".
The project, although conceived in October 1997,did not actually become reality until December1998, when voluntary participants from Canada,the Netherlands, the United Kingdom and theEuropean Commission’s JRC teamed with the UnitedStates to lay the groundwork. The pilot project took21 months to complete, with actual testing beingconducted in several phases. Laboratory testing tookplace in the Netherlands and Canada, followed byfield-testing in both Cambodia and Croatia.
PurposeThe purpose of the pilot project was to conduct acoordinated, multi-national, technical evaluation ofmetal detectors suitable for use in humanitariandemining. The project sought to demonstrate, throu-gh a "consumer reports" type of evaluation, the minedetection capabilities of commercial-off-the-shelf(COTS) metal detectors. The report is available in thepublic domain. The background information is avai-lable to governments and organizations and indivi-duals involved in the global humanitarian deminingeffort at the discretion of the holder of the detailedreport on that aspect of the results.
It is hoped that this document will assist organiza-tions in selecting the detector(s) most suitable fortheir particular environment or unique operationalconditions. The pilot project also served as a testvehicle to identify and resolve problems in deminingtechnology cooperation as the lead effort for theInternational Test and Evaluation Program (ITEP).
Project OverviewThe detectors involved in the evaluation were pur-chased after soliciting the recommendations of allmanufacturers known to the IPPTC team as to whichdetectors were suitable for humanitarian deminingapplications (see Annex C Invitations to partici-pants). No model recommended by a manufacturerwas excluded. Some manufacturers did not respond,while others offered prototype models still underdevelopment, which were not evaluated. Since theinitiation of the project, several new detector modelshave entered the market and are currently beingoffered to the humanitarian demining community.Finally, some models currently available may be dif-ferent from the equivalent models utilized in the pilotproject. Readers interested in purchasing detectorsare encouraged to contact manufacturers aboutimplications of actual and potential changes prior toacquisition.
The solicitation resulted in the purchase of threecopies of each of 25 different detector models from13 manufacturers. Some detectors had more thanone type of search head, resulting in a total of 29different sensors for evaluation. The detectors finallyincluded in the IPPTC tests were the following:
Adams AD2500 and AD2600SEbinger EBEX 420 GC and EBEX 535Fisher 1235-X, 1266-XB, and ImpulseFoerster MINEX 2FD 4.400.01Giat Model F1 (DHPM-1A)Guartel MD4, MD8, MD2000LG Precision PRS-17KMinelab F1A4 CMAC and F1A4 MIMPro-Scan Mark 2 VLFReutech Midas PIMDSchiebel AN-19/2, ATMID, MIMIDVallon ML 1620C and VMH2White's AF-108, DI-PRO 5900 and Spectrum XLT
1. Introduction
2 IPPTC Report 2001
Project engineers, as well as indigenous deminers,evaluated the detectors against the following inertanti-personnel (AP) landmines: PMN, PMN-2, PMA-2, PMA-3, Type 72, R2M2, PMD-6, and simulants:G0, I0, M0 (see page 126 for full description of testtargets).
Project MethodologyThe overall approach in designing the pilot projectevaluation was progressive in that the detectorswould be evaluated from the more controlled condi-tions (the laboratory tests in Canada and TheNetherlands), to the less controlled (the field tests inCambodia and Croatia).
The evaluation included assessments of detector sen-sitivity in air, in a variety of soil conditions, and envi-ronmental effects such as moisture on the sensorhead. 'Human Factors' such as weight and ease ofuse were also evaluated, along with other aspectssuch as cost and ruggedness.
In designing the field tests, 5 and 10 cm were cho-sen as the two depths at which targets would beburied. It is recognized that the United Nations hasestablished a 20-cm clearance standard for landmi-nes and unexploded ordnance. However, in practiceAP mines are mostly found at substantially less than20 cm, and realistically not many detectors could beexpected to find low-metal content mines at thatdepth. This performance assumption was validatedduring the conduct of the pilot project.
Inert target mines were utilized in as realistic a man-ner as possible. For example, all mines were set inthe firing position with their detonating mechanismsblocked. This ensured that all metallic componentswere in the position that would generally be encoun-tered during field conditions. Although all mineswere buried in a level manner, in the field tests nosystematic records were kept on the orientation oftheir firing mechanisms to the direction of minedetection.
The lanes chosen for the In-Soil Test are believed tobe representative of many humanitarian deminingscenarios throughout the world. Specifically, lanes
consisting of sand, clay, peat and ferruginous soilswere chosen. In Cambodia, test mines were placedin both clay and laterite soils. In Croatia, mines wereplaced in the soil predominantly available, whichwas highly metallic. In both field locations, hostnation requests to test detectors against typical minetarget configurations were also honored.Although the testing covered many technical andenvironmental factors, some elements could not beevaluated due to time and budgetary constraints.These included: sustainability, the effects of electro-magnetic interference and the use of multiple fieldtest locations.
How to use this reportThe body of this report contains summaries of the fulltechnical reports from the In-Air Tests, In-Soil Tests,In-Country Field Tests and the Human Factors assess-ment. Copies of the comprehensive test results canbe requested from the responsible agencies found inthe References Section of this report. The respectiveagencies have agreed to evaluate each request on acase-by-case basis, with the desire to share the fulldetails of the pilot project as much as possible.
This report should be of interest to a variety of rea-ders including deminers and other operational users,donors, manufacturers of equipment and resear-chers. The report discusses results from basic labo-ratory tests through to field tests. Readers are encou-raged to consider the relevance and value of eachphase of testing to their particular situation.
The section describing the In Air Test results shouldprovide the reader an understanding of the basicvariables that affect the detector's performance, aswell as the capability of the detector unencumberedby human factors or environment. As such, theseresults should not be used as the sole indicator of thedetector's operational capability but will give anindication of the factors that may cause degradationof performance in the field.
The In-Soil Test, conducted in the Netherlands, wasintended to approximate a number of representativesoil types that deminers are likely to contend with. Toachieve a certain degree of scientific rigor, the soil
Phase I, Acquisition of Detectors and Targets March - May 1999 United StatesPhase II, Training and Entrance Test May - June 1999 The NetherlandsPhase III, In-Soil Tests June - September 1999 The NetherlandsPhase IV, In-Air Tests/Human Factors October 1999 - January 2000 CanadaPhase V, Field Tests: March 2000 Cambodia
June 2000 Croatia
The project established the following timeline and locations for the various phases of testing:
3Introduction
test lanes were in a controlled environment. Theseresults should help the reader to understand theeffect of various soil types on detector performance.
In the section pertaining to field tests, the reader willfind test results that may have more bearing on real-world demining applications. However, the resultscontained in this section may not be applicable toother regions of the world. These results were achie-ved in the less controlled field environment.
The Human Factors Assessment provides users with asubjective analysis of detector characteristics that donot lend themselves to scientific measurement. Manyof these factors have significant bearing on thesafety, usefulness and acceptability of equipment inthe field. For example, an incomplete understandingon the part of the user of how the demining equip-ment functions, or the adjustment of the wrong con-trol could easily lead to failure to detect an anti-per-sonnel mine by the deminer - possibly resulting insevere or even fatal injury.
The results from both the In-Air Tests and the HumanFactors Assessment can be used to improve trainingand operating procedures. In an effort to providereaders with specific test details pertaining to eachdetector evaluated, the report also contains indivi-dual detector data sheets (see Annex A). This sectionshows the individual detector performance from
various tests relative to the performance of all otherdetectors evaluated. The results are depicted graphi-cally for easy reference. Additionally, each datasheet includes information from the detector manu-facturer related to cost, weight, and dimensions.Selected strengths and weaknesses of each detectorare l is ted, based upon the Human FactorsAssessment. The intent of this section is to providereaders more detailed information on a specificdetector's performance and specifications, as well ascomparative performance charts to aid the reader inselecting appropriate detectors for his situation.
A rating system (similar to ones used in some consu-mer reports) to rank the overall performance of thedetectors was considered. However, in keeping withthe original commitment not to convey a bias, nosuch rating is provided. Instead the results are pre-sented in an objective manner. The data allows thereader, if he so chooses, to devise his own ratingsystem to match his particular requirement.
The results as presented will allow the reader toidentify groups of detectors with above averageperformance capabilities for a variety of deminingenvironments. Therefore, it should be possible for thereader to focus his investigations on a few appro-priate detectors in order to answer the question,"Which detector is the best for my needs?".
4 IPPTC Report 2001
ObjectiveThe objective of the Training and Entrance Test wasto unpack and register the detectors and to train thepersonnel involved. Within this phase was a simpleentrance test to identify any shortcomings and toensure that all detector types met a minimum detec-tion distance of 5 cm in air using the standard testobject M0. The training and entrance test took placeat the Miner Training Centre of the Dutch RoyalEngineers in Reek (the Netherlands). The test teamconsisted mainly of the same people that were invol-ved during the other phases of the IPPTC.
Registration and trainingThree copies of each detector type were purchased.The test team unpacked each detector type, registe-red it, and familiarised themselves with its operation.In order to keep all parts of the same detectortogether and to keep track of all the events a detec-tor would go through during the IPPTC tests, eachdetector was given a unique code. This code – desi-gnated the IPPTC code - is used interchangeably withthe detector name, and can be found on pages 5and 127. It was put on all detector parts andcasings. All information (including test incidentreports) was noted in a logbook, which went withthe detectors through all phases of the IPPTC.
In most cases, a short self-administered training ses-sion was conducted by studying the manual orinstruction video and by using the detector outsidethe building. Some manufacturers took up theopportunity to provide a short on-site training ses-sion (Giat, Minelab, and Vallon). A questionnairewas filled-in to support the assessment of human fac-tors in a later phase of the IPPTC.
Entrance testTo make sure that each copy of a certain detectortype worked properly, a simple entrance test wasdefined. As part of this test a single operator deter-mined the maximum (open-air) detection distance.
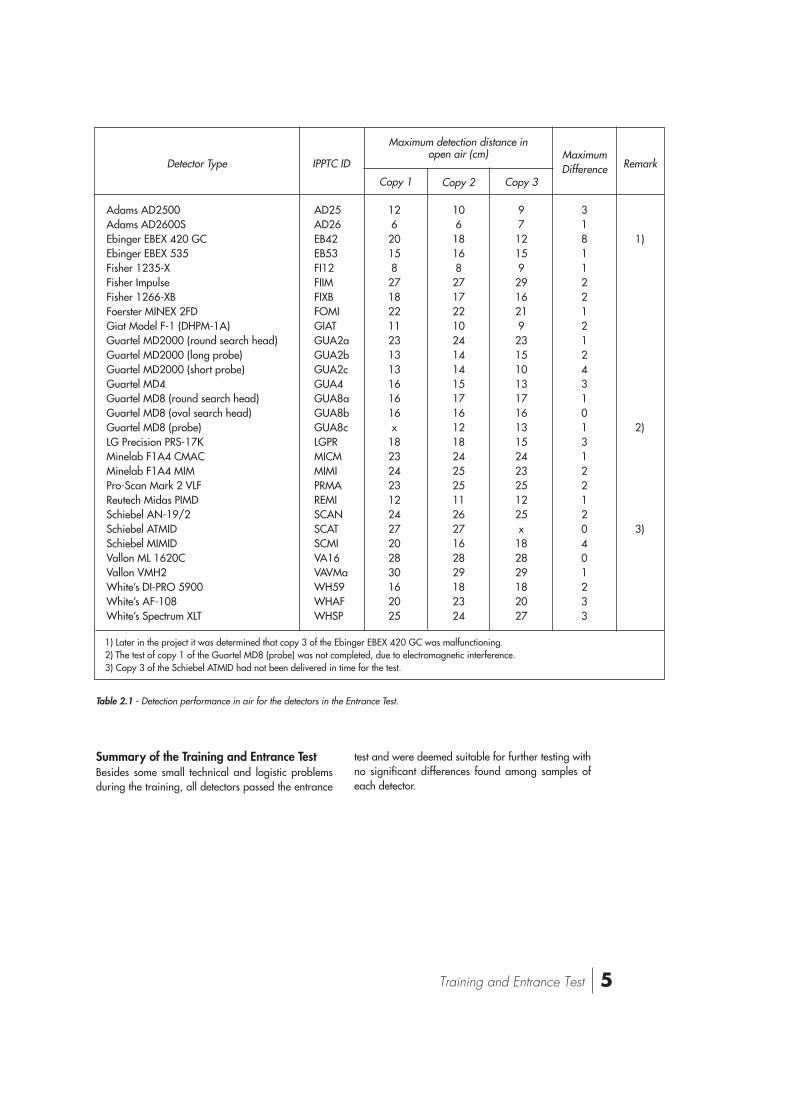
The detector was placed in a fixed position in ametal-free environment. A minimum warm-up timeof three minutes was applied, unless the manualrequired otherwise. In general, the detectors weretested at the most sensitive settings. The M0 test piecewas moved manually across the detector head to sti-mulate a detector response. The distance from targetto sensor head was raised in increments of one cen-timetre up to the distance that no signal was heardwhen the M0 test piece was moved across the sensorhead. This was repeated for all three copies of eachdetector. Table 2-1 shows the results of this test.
2. Training and Entrance Test
5Training and Entrance Test
Summary of the Training and Entrance TestBesides some small technical and logistic problemsduring the training, all detectors passed the entrance
Table 2.1 - Detection performance in air for the detectors in the Entrance Test.
Adams AD2500Adams AD2600SEbinger EBEX 420 GCEbinger EBEX 535Fisher 1235-XFisher ImpulseFisher 1266-XBFoerster MINEX 2FDGiat Model F-1 (DHPM-1A)Guartel MD2000 (round search head)Guartel MD2000 (long probe)Guartel MD2000 (short probe)Guartel MD4Guartel MD8 (round search head)Guartel MD8 (oval search head)Guartel MD8 (probe)LG Precision PRS-17KMinelab F1A4 CMACMinelab F1A4 MIMPro-Scan Mark 2 VLFReutech Midas PIMDSchiebel AN-19/2Schiebel ATMIDSchiebel MIMIDVallon ML 1620CVallon VMH2White’s DI-PRO 5900White’s AF-108White’s Spectrum XLT
AD25AD26EB42EB53FI12FIIMFIXBFOMIGIATGUA2aGUA2bGUA2cGUA4GUA8aGUA8bGUA8cLGPRMICMMIMIPRMAREMISCANSCATSCMIVA16VAVMaWH59WHAFWHSP
1262015827182211231313161616x
18232423122427202830162025
10618168271722102414141517161218242525112627162829182324
9712159291621923151013171613152423251225x
182829182027
31811221212431013122120401233
1)
2)
3)
Detector Type
Maximum detection distance inopen air (cm)
IPPTC IDMaximumDifference Remark
Copy 1 Copy 2 Copy 3
1) Later in the project it was determined that copy 3 of the Ebinger EBEX 420 GC was malfunctioning.2) The test of copy 1 of the Guartel MD8 (probe) was not completed, due to electromagnetic interference.3) Copy 3 of the Schiebel ATMID had not been delivered in time for the test.
test and were deemed suitable for further testing withno significant differences found among samples ofeach detector.
6 IPPTC Report 2001
This section summarizes the results of the In-Air Testconducted during the International Pilot Project forTechnology Cooperation. It is derived from the fulltechnical report [1,2].
ObjectiveThe tests conducted in a controlled laboratory envi-ronment focus on a detector's ability to detect objectsin air (also referred to as its in-air sensitivity) andassess how this sensitivity is affected by variousparameters that reflect real-world conditions. In-Airtests are conducted in a controlled environment inwhich the only variable is the detector with its opera-tor. While a detector's ability to detect objects in airdoes not directly indicate its ability to detect objectsburied in the ground, such controlled tests are essen-tial for an objective comparison of basic performan-ce factors.
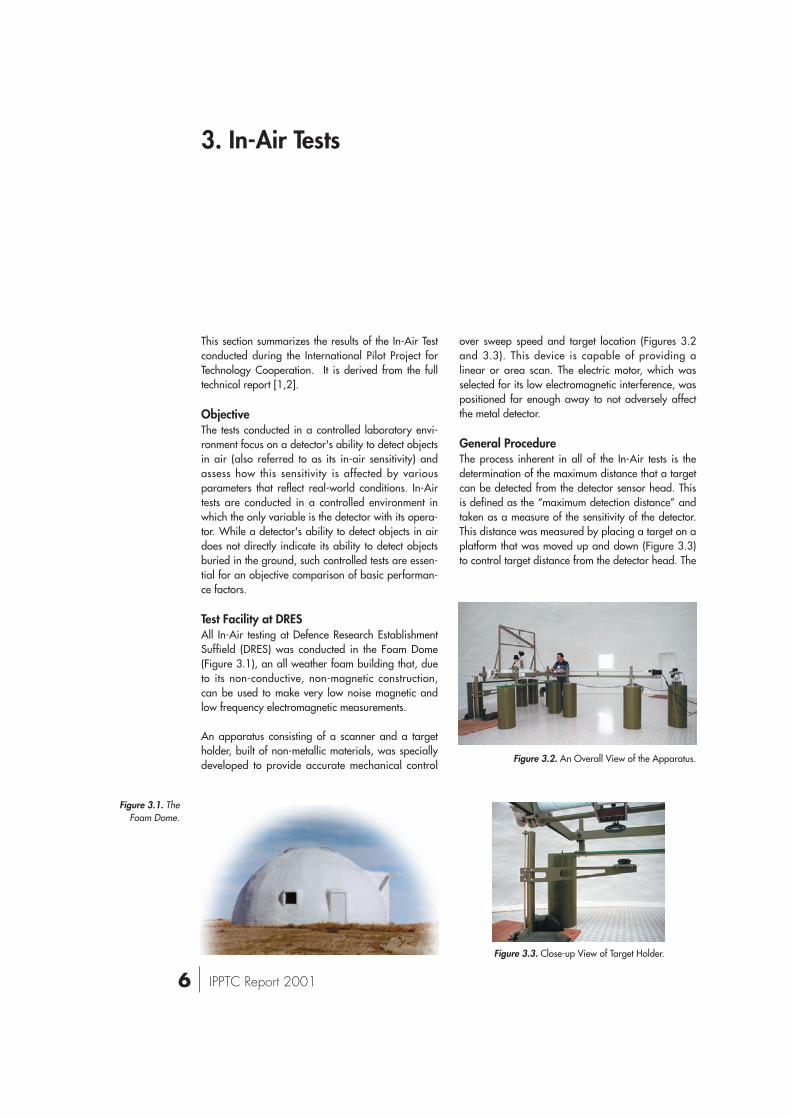
Test Facility at DRESAll In-Air testing at Defence Research EstablishmentSuffield (DRES) was conducted in the Foam Dome(Figure 3.1), an all weather foam building that, dueto its non-conductive, non-magnetic construction,can be used to make very low noise magnetic andlow frequency electromagnetic measurements.
An apparatus consisting of a scanner and a targetholder, built of non-metallic materials, was speciallydeveloped to provide accurate mechanical control
over sweep speed and target location (Figures 3.2and 3.3). This device is capable of providing alinear or area scan. The electric motor, which wasselected for its low electromagnetic interference, waspositioned far enough away to not adversely affectthe metal detector.
General ProcedureThe process inherent in all of the In-Air tests is thedetermination of the maximum distance that a targetcan be detected from the detector sensor head. Thisis defined as the “maximum detection distance” andtaken as a measure of the sensitivity of the detector.This distance was measured by placing a target on aplatform that was moved up and down (Figure 3.3)to control target distance from the detector head. The
3. In-Air Tests
Figure 3.1. TheFoam Dome.
Figure 3.2. An Overall View of the Apparatus.
Figure 3.3. Close-up View of Target Holder.
7In-Air Tests
detector head was scanned on a horizontal planeabove the target. The target distance from the sensorhead was increased in one-centimeter incrementsuntil the operator judged that the detection signaldisappeared. Although a number of operators wereused during the tests, to the extent possible the sameoperator carried out all the tests for a given detectorsample.
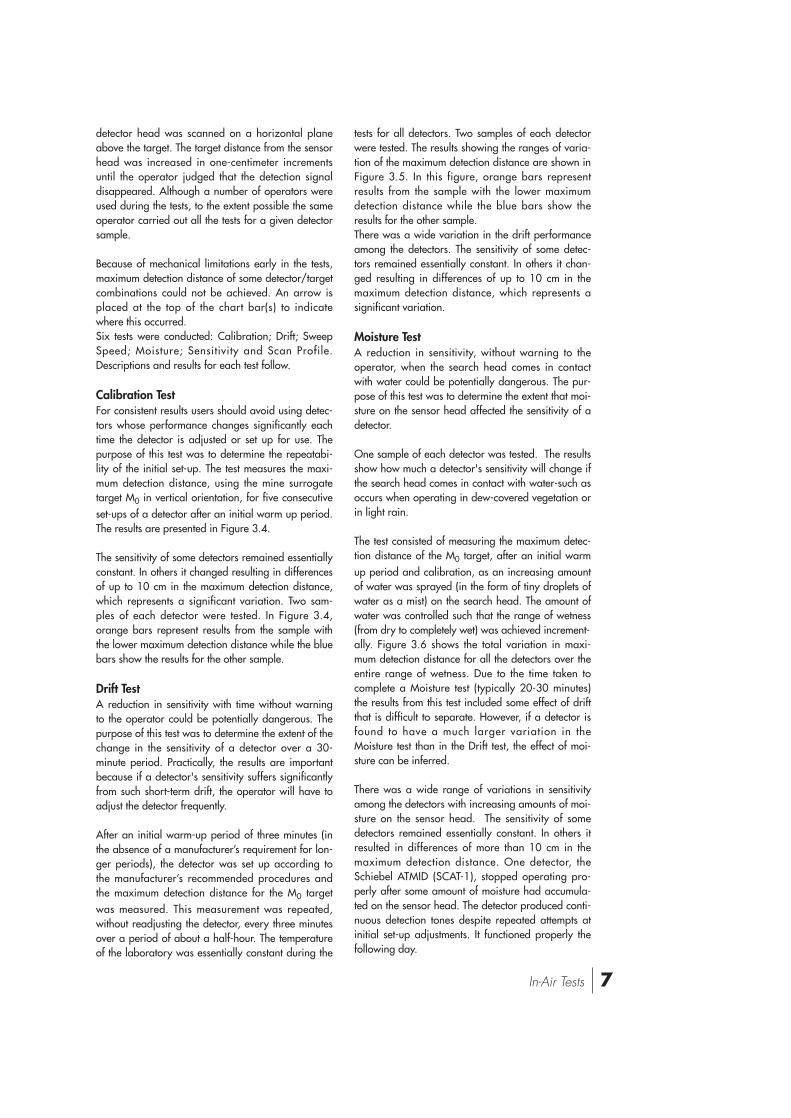
Because of mechanical limitations early in the tests,maximum detection distance of some detector/targetcombinations could not be achieved. An arrow isplaced at the top of the chart bar(s) to indicatewhere this occurred. Six tests were conducted: Calibration; Drift; SweepSpeed; Moisture; Sensitivity and Scan Profile.Descriptions and results for each test follow.
Calibration TestFor consistent results users should avoid using detec-tors whose performance changes significantly eachtime the detector is adjusted or set up for use. Thepurpose of this test was to determine the repeatabi-lity of the initial set-up. The test measures the maxi-mum detection distance, using the mine surrogatetarget M0 in vertical orientation, for five consecutiveset-ups of a detector after an initial warm up period.The results are presented in Figure 3.4.
The sensitivity of some detectors remained essentiallyconstant. In others it changed resulting in differencesof up to 10 cm in the maximum detection distance,which represents a significant variation. Two sam-ples of each detector were tested. In Figure 3.4,orange bars represent results from the sample withthe lower maximum detection distance while the bluebars show the results for the other sample.
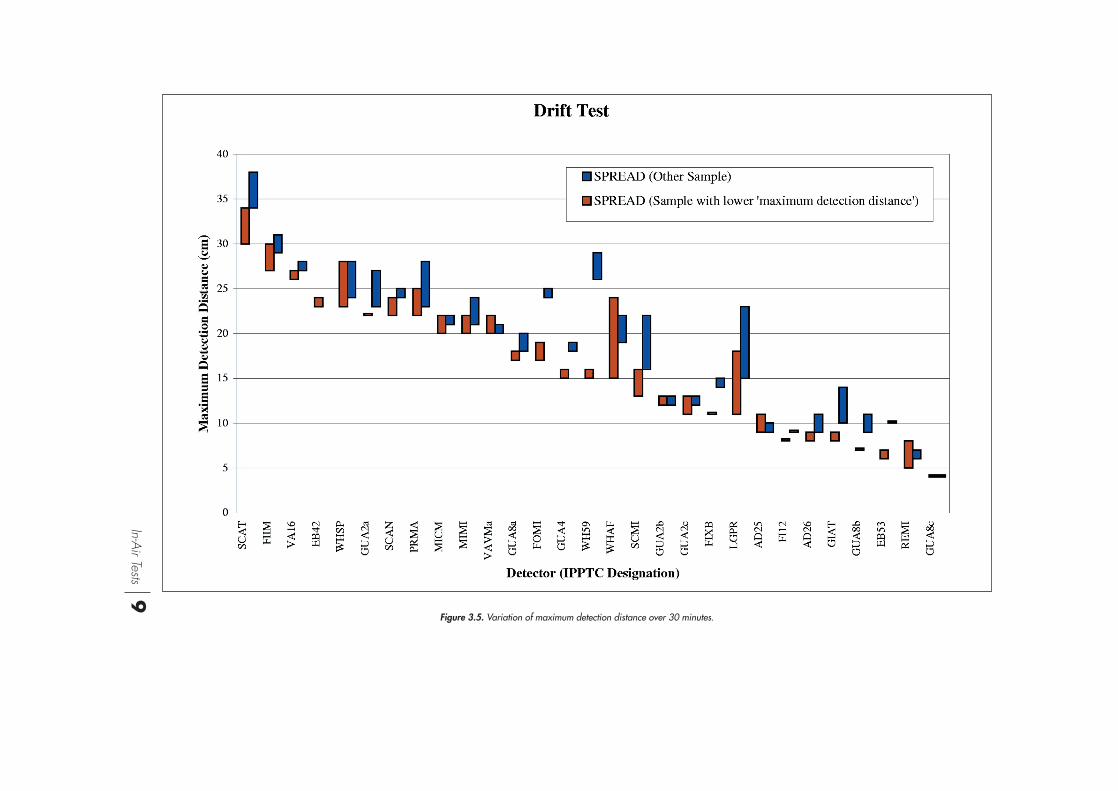
Drift TestA reduction in sensitivity with time without warningto the operator could be potentially dangerous. Thepurpose of this test was to determine the extent of thechange in the sensitivity of a detector over a 30-minute period. Practically, the results are importantbecause if a detector's sensitivity suffers significantlyfrom such short-term drift, the operator will have toadjust the detector frequently.
After an initial warm-up period of three minutes (inthe absence of a manufacturer’s requirement for lon-ger periods), the detector was set up according tothe manufacturer’s recommended procedures andthe maximum detection distance for the M0 targetwas measured. This measurement was repeated,without readjusting the detector, every three minutesover a period of about a half-hour. The temperatureof the laboratory was essentially constant during the
tests for all detectors. Two samples of each detectorwere tested. The results showing the ranges of varia-tion of the maximum detection distance are shown inFigure 3.5. In this figure, orange bars representresults from the sample with the lower maximumdetection distance while the blue bars show theresults for the other sample. There was a wide variation in the drift performanceamong the detectors. The sensitivity of some detec-tors remained essentially constant. In others it chan-ged resulting in differences of up to 10 cm in themaximum detection distance, which represents asignificant variation.
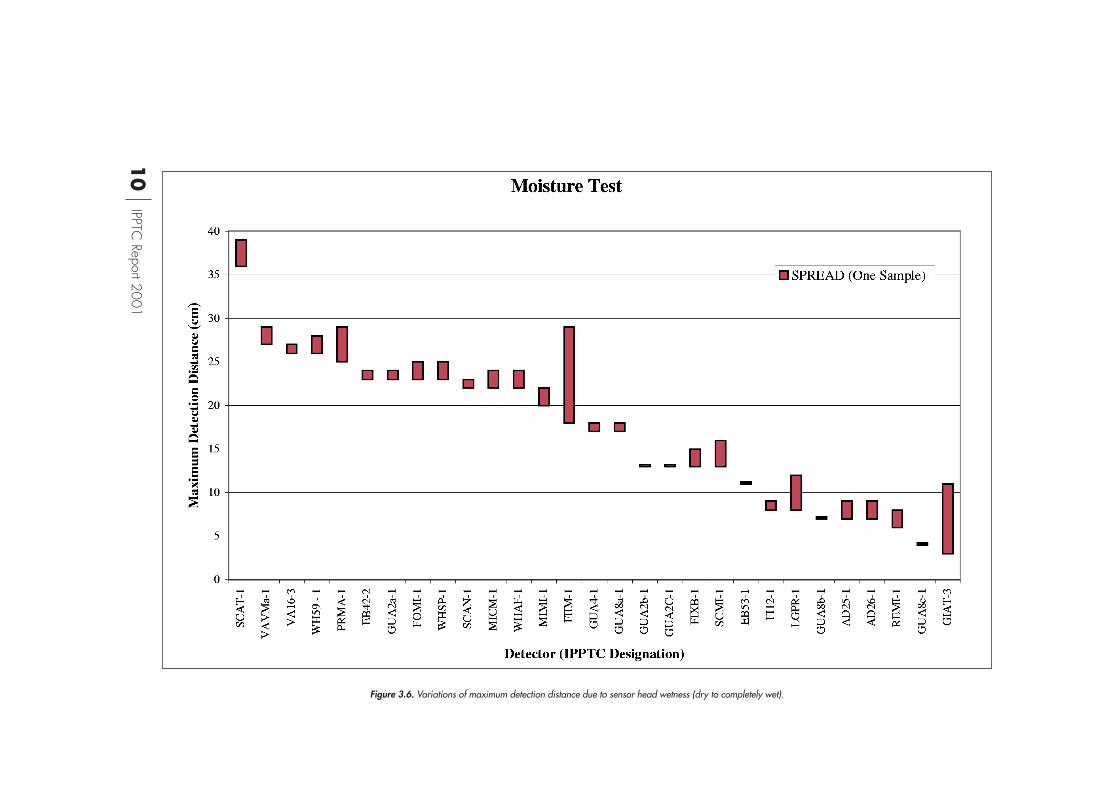
Moisture TestA reduction in sensitivity, without warning to theoperator, when the search head comes in contactwith water could be potentially dangerous. The pur-pose of this test was to determine the extent that moi-sture on the sensor head affected the sensitivity of adetector.
One sample of each detector was tested. The resultsshow how much a detector's sensitivity will change ifthe search head comes in contact with water-such asoccurs when operating in dew-covered vegetation orin light rain.
The test consisted of measuring the maximum detec-tion distance of the M0 target, after an initial warmup period and calibration, as an increasing amountof water was sprayed (in the form of tiny droplets ofwater as a mist) on the search head. The amount ofwater was controlled such that the range of wetness(from dry to completely wet) was achieved increment-ally. Figure 3.6 shows the total variation in maxi-mum detection distance for all the detectors over theentire range of wetness. Due to the time taken tocomplete a Moisture test (typically 20-30 minutes)the results from this test included some effect of driftthat is difficult to separate. However, if a detector isfound to have a much larger variation in theMoisture test than in the Drift test, the effect of moi-sture can be inferred.
There was a wide range of variations in sensitivityamong the detectors with increasing amounts of moi-sture on the sensor head. The sensitivity of somedetectors remained essentially constant. In others itresulted in differences of more than 10 cm in themaximum detection distance. One detector, theSchiebel ATMID (SCAT-1), stopped operating pro-perly after some amount of moisture had accumula-ted on the sensor head. The detector produced conti-nuous detection tones despite repeated attempts atinitial set-up adjustments. It functioned properly thefollowing day.
8IPPTC
Report 2001
Figure 3.4. Variation of maximum detection distance for five consecutive set-ups. Arrow explained in 2.3 General Procedures.
9In-A
ir Tests
Figure 3.5. Variation of maximum detection distance over 30 minutes.
10
IPPTC Report 2001
Figure 3.6. Variations of maximum detection distance due to sensor head wetness (dry to completely wet).
11
In-Air Tests
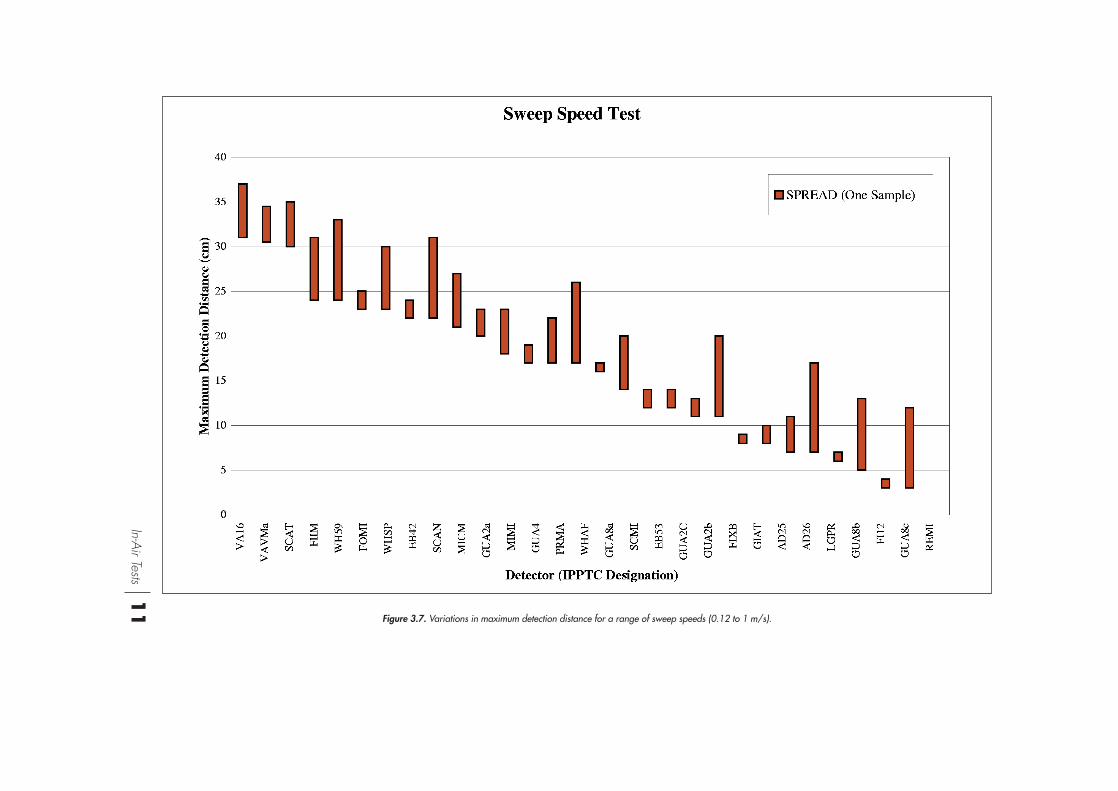
Figure 3.7. Variations in maximum detection distance for a range of sweep speeds (0.12 to 1 m/s).
12 IPPTC Report 2001
All tests were conducted at the laboratory ambienttemperature (20 – 22°C).
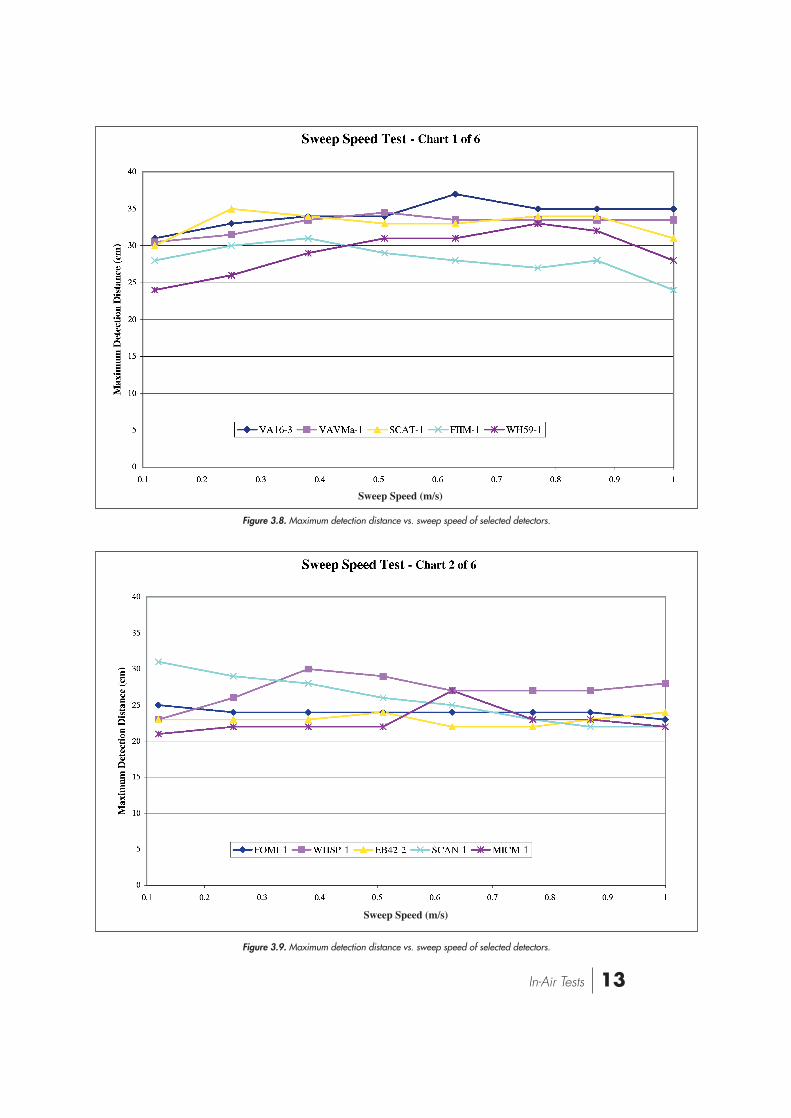
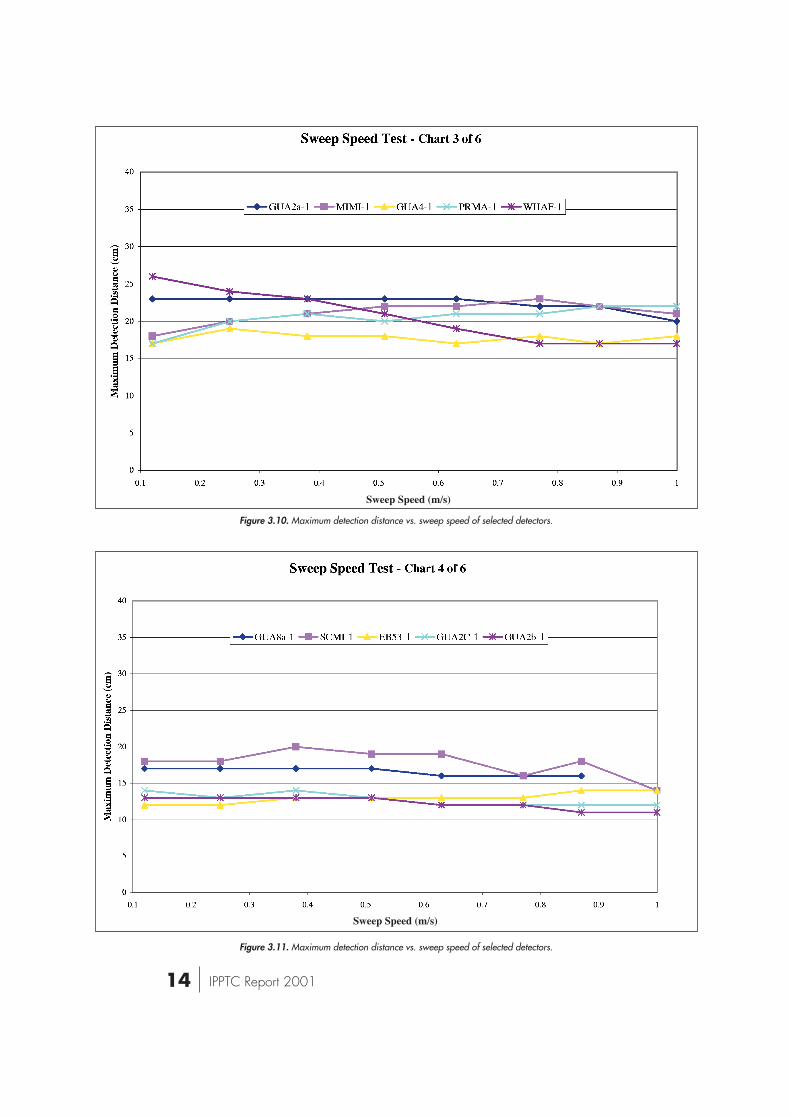
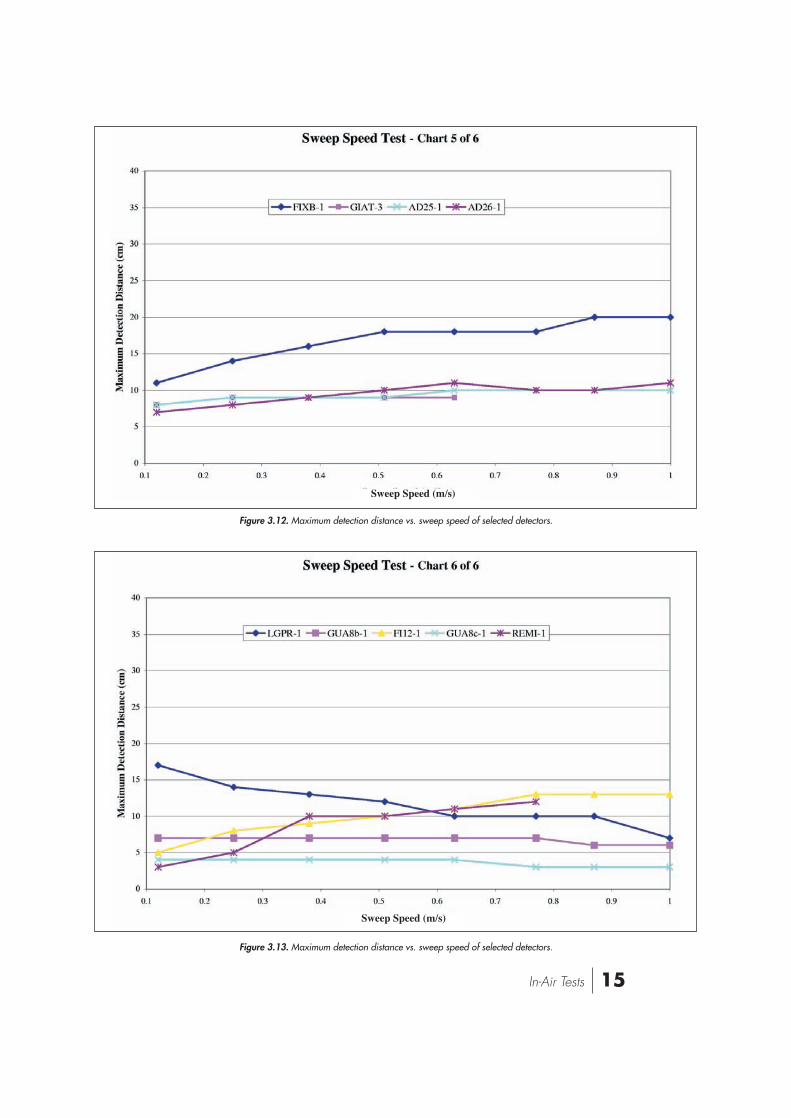
Sweep Speed TestA reduction in sensitivity due to a change in sweepspeed could be potentially dangerous since no cur-rent detectors give a warning to the operator if thiswere to happen. The purpose of this test was todetermine how the sensitivity changes as a functionof the speed with which the detector head is sweptover a target. Results show what effect differentsweep speeds had on sensitivity.
The test measured the maximum detection distancefor the M0 target, after an initial warm up periodand calibration, for sweep speeds varying from0.12 to 1 m/s. One sample of each detector wastested. Figure 3.7 shows the total variation in maxi-mum detection distance recorded for all the detectorsover the sweep speed range. The details of thisvariation as a function of sweep speed for eachdetector are shown in Figures 3.8 to 3.13. Althoughwe did not test for it, we noted that some detectorswould not detect targets when stationary. The usershould make a particular point of knowing if this isthe case for a chosen detector in order to develop aproper operating procedure.
There was a wide range of variation in sensitivity asa function of sweep speed among the detectors. Thesensitivity of some detectors remained essentiallyconstant. In others it resulted in differences of morethan 10 cm in the maximum detection distance. Insome models, sensitivity decreased as sweep speedincreased while in others sensitivity increased withspeed. In still other detectors, sensitivity initiallyincreased and then decreased as the speed increa-sed. End users should be made aware of this beha-vior whenever such detectors are employed.
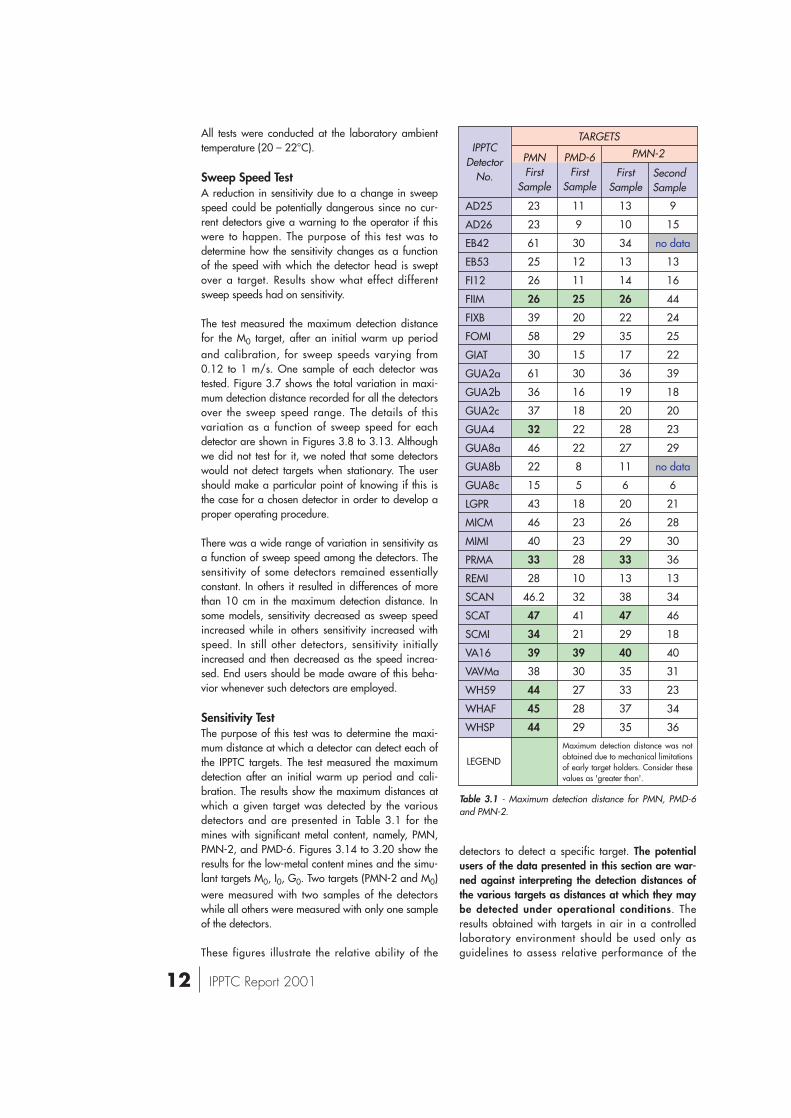
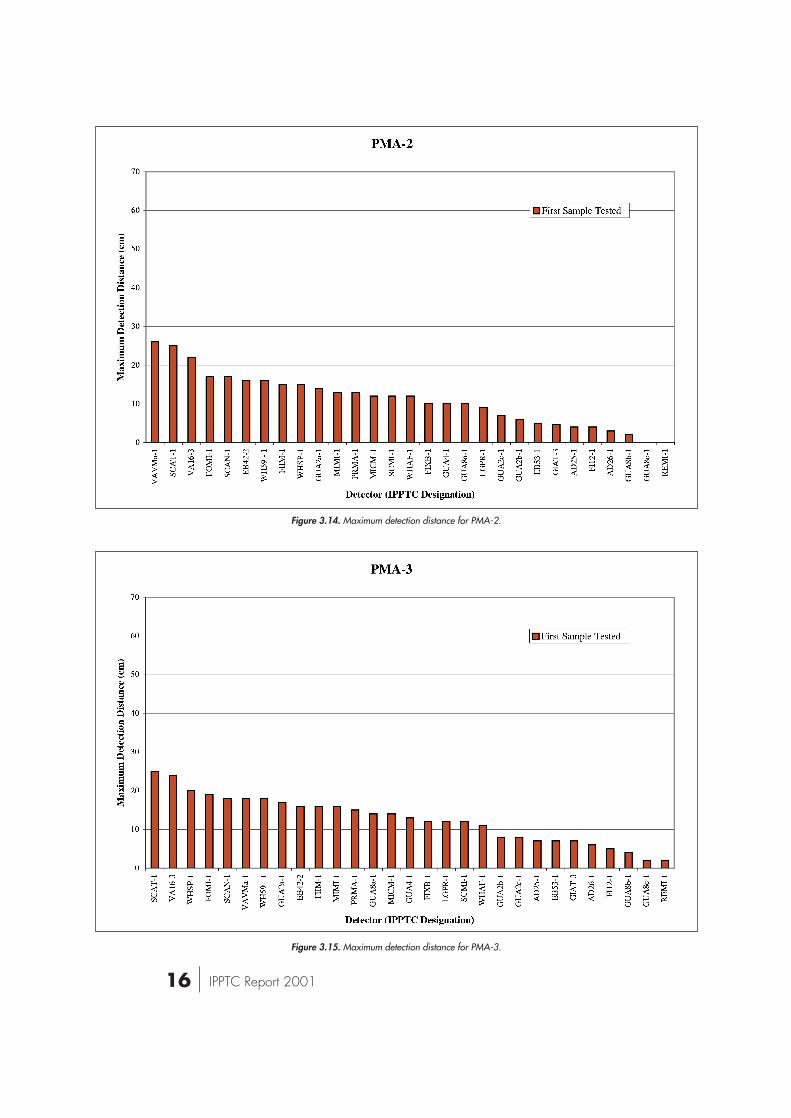
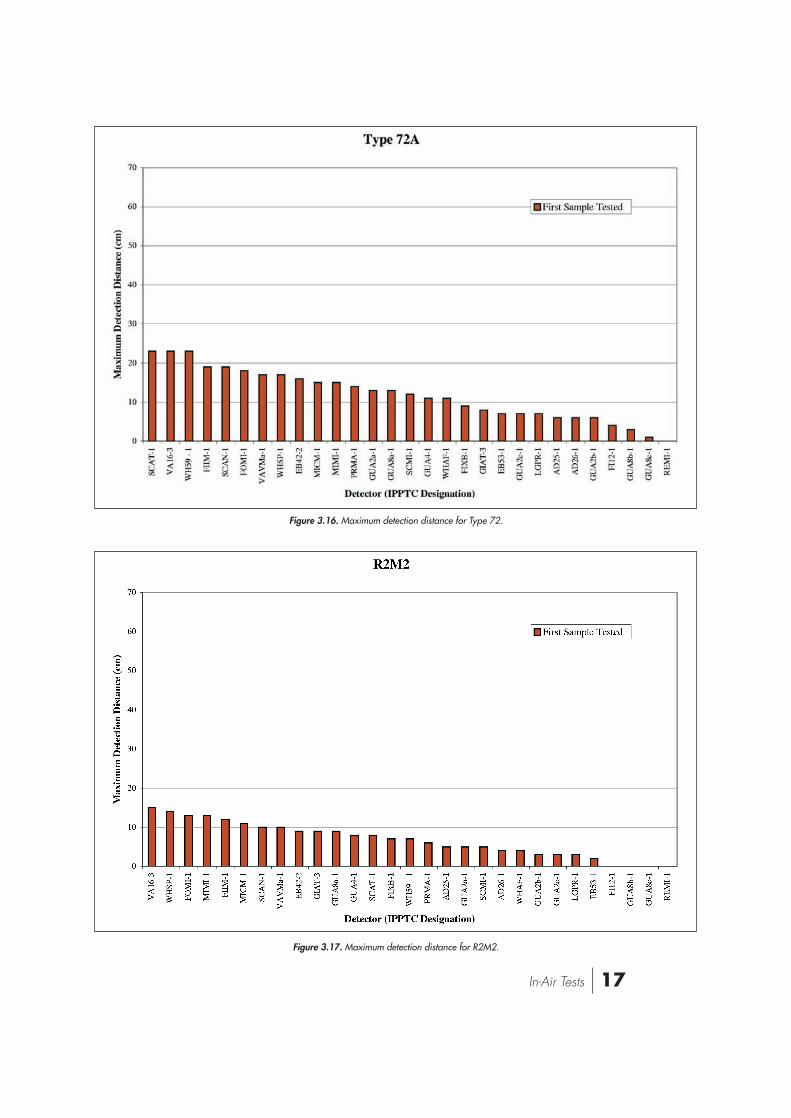
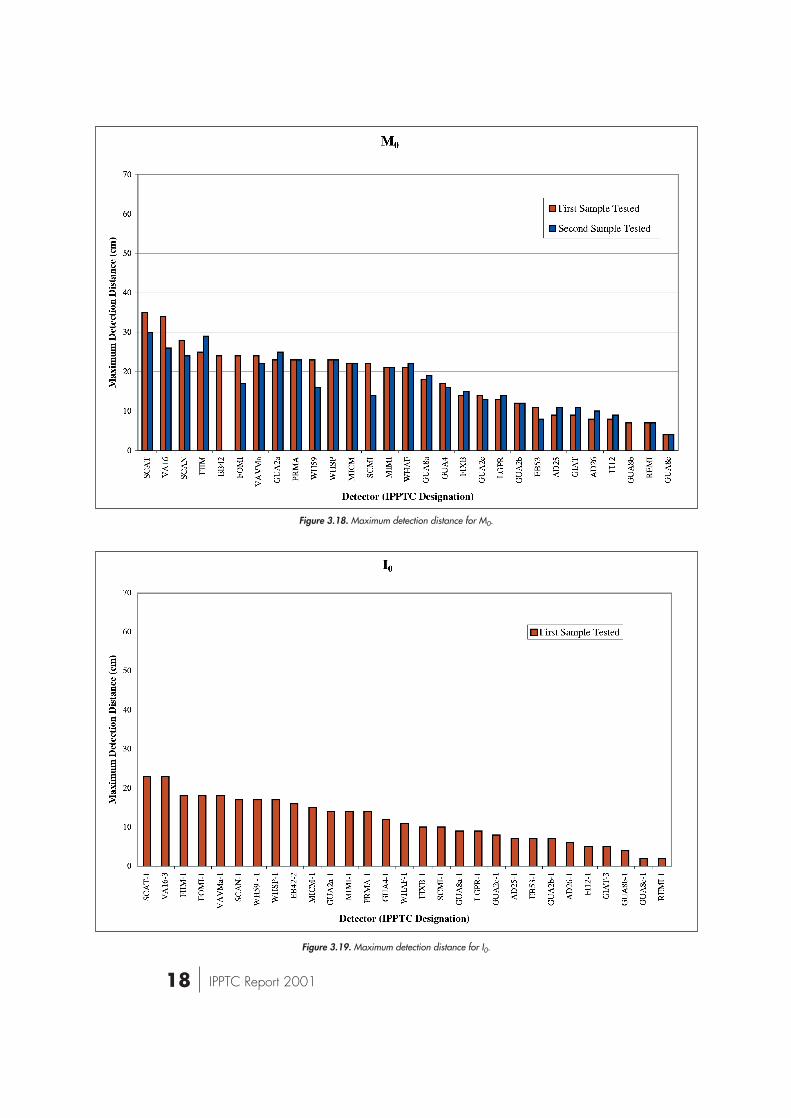
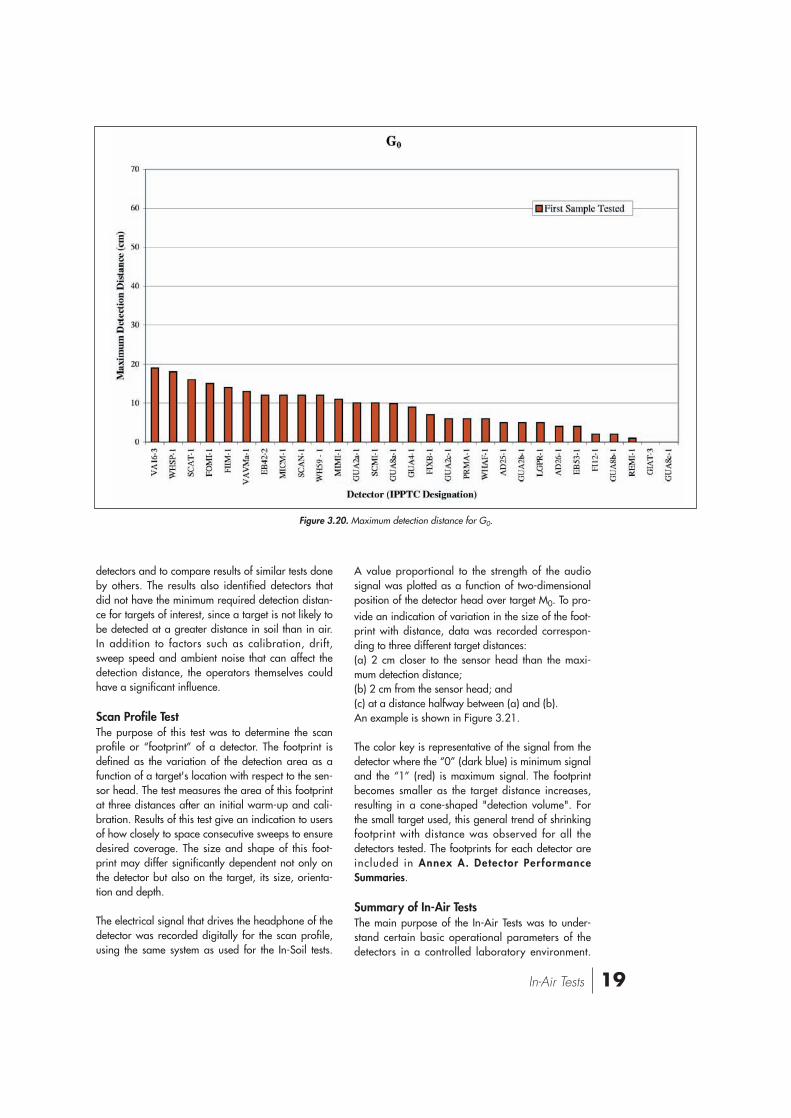
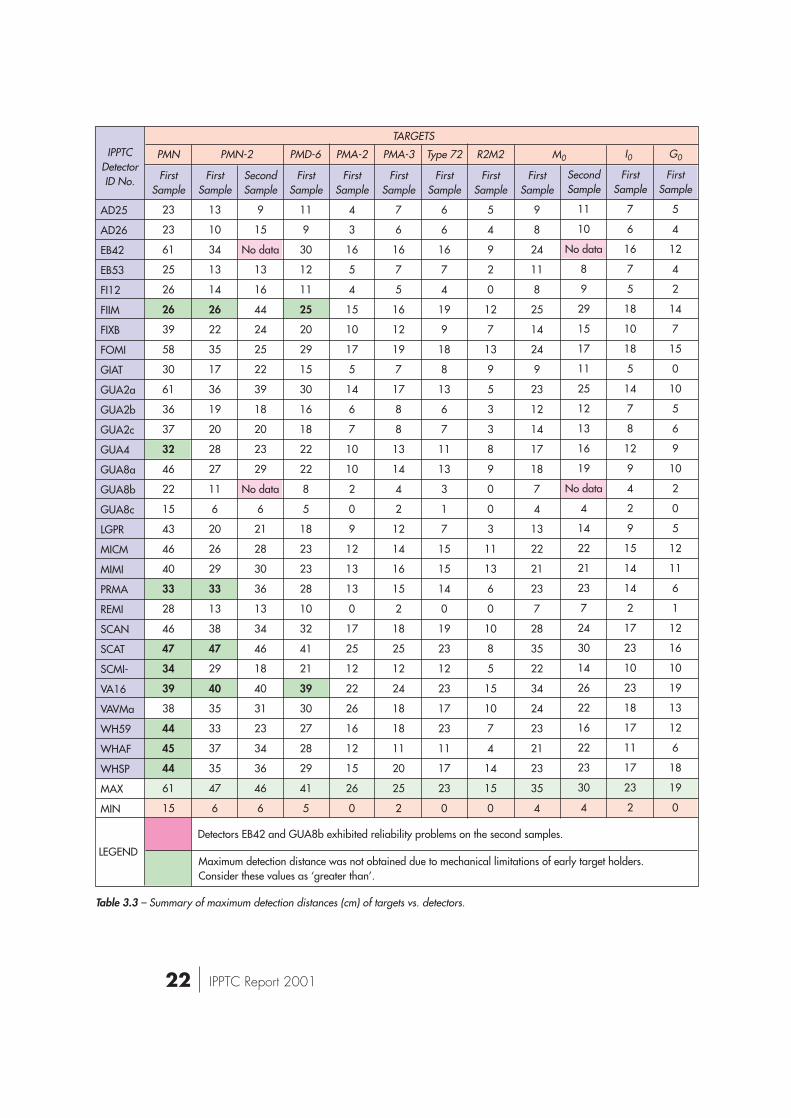
Sensitivity TestThe purpose of this test was to determine the maxi-mum distance at which a detector can detect each ofthe IPPTC targets. The test measured the maximumdetection after an initial warm up period and cali-bration. The results show the maximum distances atwhich a given target was detected by the variousdetectors and are presented in Table 3.1 for themines with significant metal content, namely, PMN,PMN-2, and PMD-6. Figures 3.14 to 3.20 show theresults for the low-metal content mines and the simu-lant targets M0, I0, G0. Two targets (PMN-2 and M0)were measured with two samples of the detectorswhile all others were measured with only one sampleof the detectors.
These figures illustrate the relative ability of the
detectors to detect a specific target. The potentialusers of the data presented in this section are war-ned against interpreting the detection distances ofthe various targets as distances at which they maybe detected under operational conditions. Theresults obtained with targets in air in a controlledlaboratory environment should be used only asguidelines to assess relative performance of the
23
23
61
25
26
26
39
58
30
61
36
37
32
46
22
15
43
46
40
33
28
46.2
47
34
39
38
44
45
44
11
9
30
12
11
25
20
29
15
30
16
18
22
22
8
5
18
23
23
28
10
32
41
21
39
30
27
28
29
13
10
34
13
14
26
22
35
17
36
19
20
28
27
11
6
20
26
29
33
13
38
47
29
40
35
33
37
35
9
15
no data
13
16
44
24
25
22
39
18
20
23
29
no data
6
21
28
30
36
13
34
46
18
40
31
23
34
36
AD25
AD26
EB42
EB53
FI12
FIIM
FIXB
FOMI
GIAT
GUA2a
GUA2b
GUA2c
GUA4
GUA8a
GUA8b
GUA8c
LGPR
MICM
MIMI
PRMA
REMI
SCAN
SCAT
SCMI
VA16
VAVMa
WH59
WHAF
WHSP
LEGEND
Maximum detection distance was notobtained due to mechanical limitationsof early target holders. Consider thesevalues as 'greater than'.
IPPTCDetector
No.
PMNFirst
Sample
PMD-6First
Sample
PMN-2
FirstSample
SecondSample
TARGETS
Table 3.1 - Maximum detection distance for PMN, PMD-6and PMN-2.
13In-Air Tests
Figure 3.9. Maximum detection distance vs. sweep speed of selected detectors.
Figure 3.8. Maximum detection distance vs. sweep speed of selected detectors.
Sweep Speed (m/s)
Sweep Speed (m/s)
14 IPPTC Report 2001
Figure 3.11. Maximum detection distance vs. sweep speed of selected detectors.
Figure 3.10. Maximum detection distance vs. sweep speed of selected detectors.
Sweep Speed (m/s)
Sweep Speed (m/s)
15In-Air Tests
Figure 3.13. Maximum detection distance vs. sweep speed of selected detectors.
Figure 3.12. Maximum detection distance vs. sweep speed of selected detectors.
Sweep Speed (m/s)
Sweep Speed (m/s)
16 IPPTC Report 2001
Figure 3.15. Maximum detection distance for PMA-3.
Figure 3.14. Maximum detection distance for PMA-2.
17In-Air Tests
Figure 3.17. Maximum detection distance for R2M2.
Figure 3.16. Maximum detection distance for Type 72.
18 IPPTC Report 2001
Figure 3.19. Maximum detection distance for I0.
Figure 3.18. Maximum detection distance for M0.
19In-Air Tests
Figure 3.20. Maximum detection distance for G0.
detectors and to compare results of similar tests doneby others. The results also identified detectors thatdid not have the minimum required detection distan-ce for targets of interest, since a target is not likely tobe detected at a greater distance in soil than in air.In addition to factors such as calibration, drift,sweep speed and ambient noise that can affect thedetection distance, the operators themselves couldhave a significant influence.
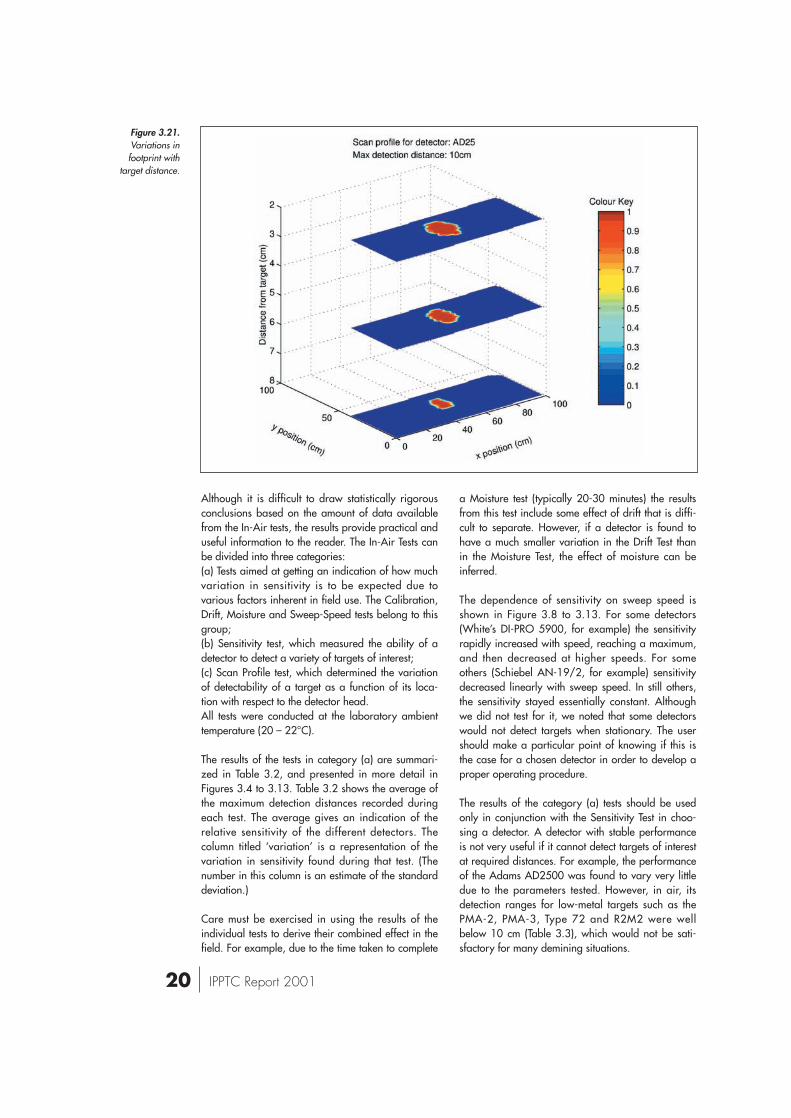
Scan Profile TestThe purpose of this test was to determine the scanprofile or “footprint” of a detector. The footprint isdefined as the variation of the detection area as afunction of a target's location with respect to the sen-sor head. The test measures the area of this footprintat three distances after an initial warm-up and cali-bration. Results of this test give an indication to usersof how closely to space consecutive sweeps to ensuredesired coverage. The size and shape of this foot-print may differ significantly dependent not only onthe detector but also on the target, its size, orienta-tion and depth.
The electrical signal that drives the headphone of thedetector was recorded digitally for the scan profile,using the same system as used for the In-Soil tests.
A value proportional to the strength of the audiosignal was plotted as a function of two-dimensionalposition of the detector head over target M0. To pro-vide an indication of variation in the size of the foot-print with distance, data was recorded correspon-ding to three different target distances: (a) 2 cm closer to the sensor head than the maxi-mum detection distance; (b) 2 cm from the sensor head; and (c) at a distance halfway between (a) and (b). An example is shown in Figure 3.21.
The color key is representative of the signal from thedetector where the “0” (dark blue) is minimum signaland the “1” (red) is maximum signal. The footprintbecomes smaller as the target distance increases,resulting in a cone-shaped "detection volume". Forthe small target used, this general trend of shrinkingfootprint with distance was observed for all thedetectors tested. The footprints for each detector areincluded in Annex A. Detector PerformanceSummaries.
Summary of In-Air TestsThe main purpose of the In-Air Tests was to under-stand certain basic operational parameters of thedetectors in a controlled laboratory environment.
20 IPPTC Report 2001
Figure 3.21.Variations infootprint with
target distance.
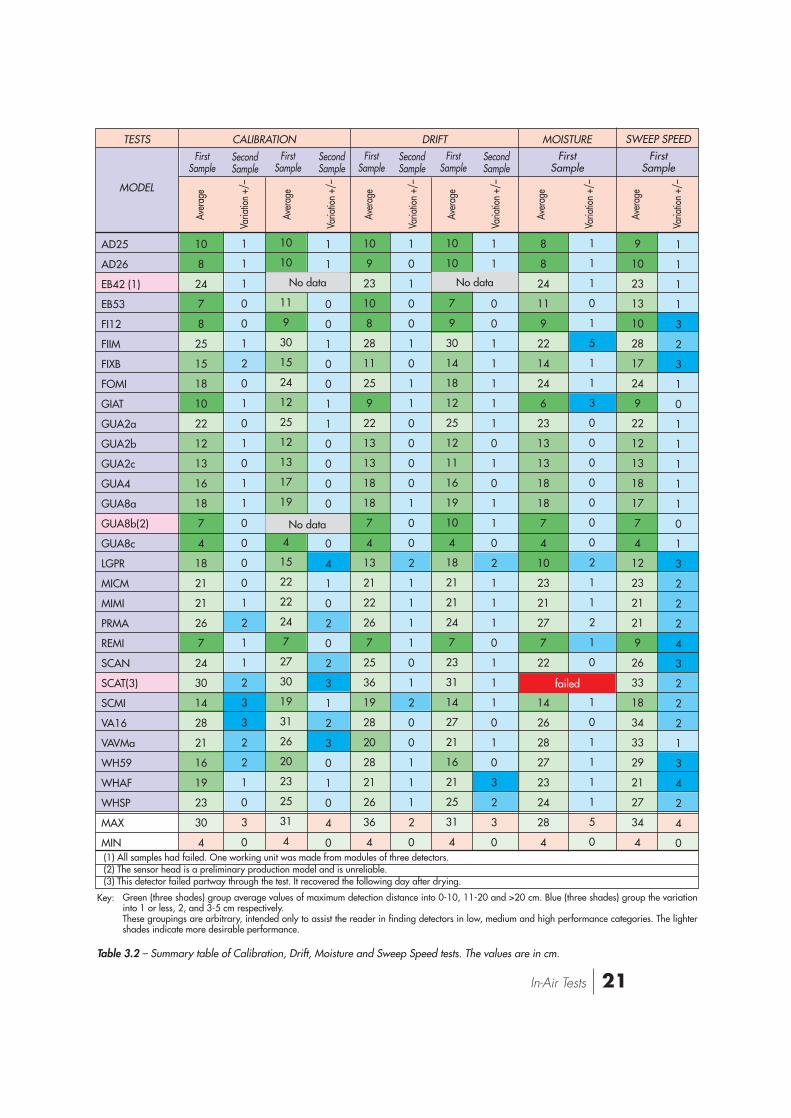
Although it is difficult to draw statistically rigorousconclusions based on the amount of data availablefrom the In-Air tests, the results provide practical anduseful information to the reader. The In-Air Tests canbe divided into three categories: (a) Tests aimed at getting an indication of how muchvariation in sensitivity is to be expected due tovarious factors inherent in field use. The Calibration,Drift, Moisture and Sweep-Speed tests belong to thisgroup;(b) Sensitivity test, which measured the ability of adetector to detect a variety of targets of interest;(c) Scan Profile test, which determined the variationof detectability of a target as a function of its loca-tion with respect to the detector head.All tests were conducted at the laboratory ambienttemperature (20 – 22°C).
The results of the tests in category (a) are summari-zed in Table 3.2, and presented in more detail inFigures 3.4 to 3.13. Table 3.2 shows the average ofthe maximum detection distances recorded duringeach test. The average gives an indication of therelative sensitivity of the different detectors. Thecolumn titled ‘variation’ is a representation of thevariation in sensitivity found during that test. (Thenumber in this column is an estimate of the standarddeviation.)
Care must be exercised in using the results of theindividual tests to derive their combined effect in thefield. For example, due to the time taken to complete
a Moisture test (typically 20-30 minutes) the resultsfrom this test include some effect of drift that is diffi-cult to separate. However, if a detector is found tohave a much smaller variation in the Drift Test thanin the Moisture Test, the effect of moisture can beinferred.
The dependence of sensitivity on sweep speed isshown in Figure 3.8 to 3.13. For some detectors(White’s DI-PRO 5900, for example) the sensitivityrapidly increased with speed, reaching a maximum,and then decreased at higher speeds. For someothers (Schiebel AN-19/2, for example) sensitivitydecreased linearly with sweep speed. In still others,the sensitivity stayed essentially constant. Althoughwe did not test for it, we noted that some detectorswould not detect targets when stationary. The usershould make a particular point of knowing if this isthe case for a chosen detector in order to develop aproper operating procedure.
The results of the category (a) tests should be usedonly in conjunction with the Sensitivity Test in choo-sing a detector. A detector with stable performanceis not very useful if it cannot detect targets of interestat required distances. For example, the performanceof the Adams AD2500 was found to vary very littledue to the parameters tested. However, in air, itsdetection ranges for low-metal targets such as thePMA-2, PMA-3, Type 72 and R2M2 were wellbelow 10 cm (Table 3.3), which would not be sati-sfactory for many demining situations.
21In-Air Tests
(1) All samples had failed. One working unit was made from modules of three detectors. (2) The sensor head is a preliminary production model and is unreliable.(3) This detector failed partway through the test. It recovered the following day after drying.
MODEL
TESTS CALIBRATION DRIFT MOISTURE SWEEP SPEED
Table 3.2 – Summary table of Calibration, Drift, Moisture and Sweep Speed tests. The values are in cm.
FirstSample
SecondSample
Aver
age
Varia
tion
+/–
FirstSample
SecondSample
Aver
age
Varia
tion
+/–
FirstSample
SecondSample
Aver
age
Varia
tion
+/–
FirstSample
SecondSample
Aver
age
Varia
tion
+/–
FirstSample
Aver
age
Varia
tion
+/–
FirstSample
Aver
age
Varia
tion
+/–
Green (three shades) group average values of maximum detection distance into 0-10, 11-20 and >20 cm. Blue (three shades) group the variationinto 1 or less, 2, and 3-5 cm respectively. These groupings are arbitrary, intended only to assist the reader in finding detectors in low, medium and high performance categories. The lightershades indicate more desirable performance.
Key:
AD25
AD26
EB42 (1)
EB53
FI12
FIIM
FIXB
FOMI
GIAT
GUA2a
GUA2b
GUA2c
GUA4
GUA8a
GUA8b(2)
GUA8c
LGPR
MICM
MIMI
PRMA
REMI
SCAN
SCAT(3)
SCMI
VA16
VAVMa
WH59
WHAF
WHSP
MAX
MIN
10
8
24
7
8
25
15
18
10
22
12
13
16
18
7
4
18
21
21
26
7
24
30
14
28
21
16
19
23
30
4
10
10
11
9
30
15
24
12
25
12
13
17
19
4
15
22
22
24
7
27
30
19
31
26
20
23
25
31
4
10
9
23
10
8
28
11
25
9
22
13
13
18
18
7
4
13
21
22
26
7
25
36
19
28
20
28
21
26
36
4
10
10
7
9
30
14
18
12
25
12
11
16
19
10
4
18
21
21
24
7
23
31
14
27
21
16
21
25
31
4
1
1
0
0
1
1
1
1
1
0
1
0
1
1
0
2
1
1
1
0
1
1
1
0
1
0
3
2
3
0
8
8
24
11
9
22
14
24
6
23
13
13
18
18
7
4
10
23
21
27
7
22
14
26
28
27
23
24
28
4
1
1
1
0
1
5
1
1
3
0
0
0
0
0
0
0
2
1
1
2
1
0
1
0
1
1
1
1
5
0
9
10
23
13
10
28
17
24
9
22
12
13
18
17
7
4
12
23
21
21
9
26
33
18
34
33
29
21
27
34
4
1
1
1
1
3
2
3
1
0
1
1
1
1
1
0
1
3
2
2
2
4
3
2
2
2
1
3
4
2
4
0
1
1
1
0
0
1
2
0
1
0
1
0
1
1
0
0
0
0
1
2
1
1
2
3
3
2
2
1
0
3
0
1
1
0
0
1
0
0
1
1
0
0
0
0
0
4
1
0
2
0
2
3
1
2
3
0
1
0
4
0
1
0
1
0
0
1
0
1
1
0
0
0
0
1
0
0
2
1
1
1
1
0
1
2
0
0
1
1
1
2
0
No data
No data
No data
failed
22 IPPTC Report 2001
AD25
AD26
EB42
EB53
FI12
FIIM
FIXB
FOMI
GIAT
GUA2a
GUA2b
GUA2c
GUA4
GUA8a
GUA8b
GUA8c
LGPR
MICM
MIMI
PRMA
REMI
SCAN
SCAT
SCMI-
VA16
VAVMa
WH59
WHAF
WHSP
MAX
MIN
FirstSample
23
23
61
25
26
26
39
58
30
61
36
37
32
46
22
15
43
46
40
33
28
46
47
34
39
38
44
45
44
61
15
FirstSample
13
10
34
13
14
26
22
35
17
36
19
20
28
27
11
6
20
26
29
33
13
38
47
29
40
35
33
37
35
47
6
SecondSample
9
15
No data
13
16
44
24
25
22
39
18
20
23
29
No data
6
21
28
30
36
13
34
46
18
40
31
23
34
36
46
6
FirstSample
11
9
30
12
11
25
20
29
15
30
16
18
22
22
8
5
18
23
23
28
10
32
41
21
39
30
27
28
29
41
5
FirstSample
4
3
16
5
4
15
10
17
5
14
6
7
10
10
2
0
9
12
13
13
0
17
25
12
22
26
16
12
15
26
0
FirstSample
7
6
16
7
5
16
12
19
7
17
8
8
13
14
4
2
12
14
16
15
2
18
25
12
24
18
18
11
20
25
2
FirstSample
9
8
24
11
8
25
14
24
9
23
12
14
17
18
7
4
13
22
21
23
7
28
35
22
34
24
23
21
23
35
4
FirstSample
6
6
16
7
4
19
9
18
8
13
6
7
11
13
3
1
7
15
15
14
0
19
23
12
23
17
23
11
17
23
0
FirstSample
5
4
9
2
0
12
7
13
9
5
3
3
8
9
0
0
3
11
13
6
0
10
8
5
15
10
7
4
14
15
0
SecondSample
11
10
No data
8
9
29
15
17
11
25
12
13
16
19
No data
4
14
22
21
23
7
24
30
14
26
22
16
22
23
30
4
FirstSample
7
6
16
7
5
18
10
18
5
14
7
8
12
9
4
2
9
15
14
14
2
17
23
10
23
18
17
11
17
23
2
FirstSample
5
4
12
4
2
14
7
15
0
10
5
6
9
10
2
0
5
12
11
6
1
12
16
10
19
13
12
6
18
19
0
IPPTCDetectorID No.
TARGETS
PMN PMD-6 PMA-2 PMA-3 R2M2 M0 I0 G0Type 72PMN-2
Detectors EB42 and GUA8b exhibited reliability problems on the second samples.
Maximum detection distance was not obtained due to mechanical limitations of early target holders.Consider these values as ‘greater than’.
Table 3.3 – Summary of maximum detection distances (cm) of targets vs. detectors.
LEGEND
23In-Soil Tests
This section summarizes the results of the In-Soils Testconducted during the International Pilot project forTechnology Cooperation. It is derived from the fulltechnical report. [3,4]
ObjectiveThe objective of In-Soil Tests was to determine thedetection performance of the metal detectors whenused for the detection of AP mines, buried in fourdifferent types of soil. To this end the detectors weretested against the defined IPPTC targets at the out-door test lanes of TNO Physics and ElectronicsLaboratory (TNO-FEL) in the Netherlands.
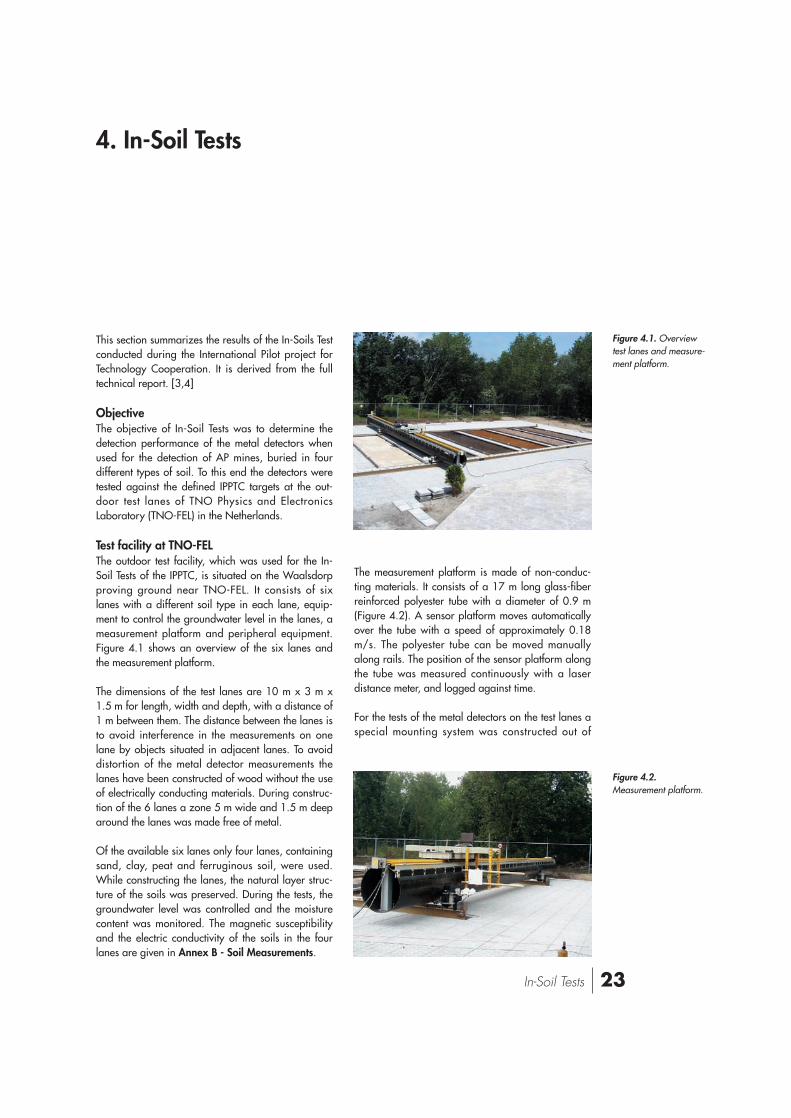
Test facility at TNO-FELThe outdoor test facility, which was used for the In-Soil Tests of the IPPTC, is situated on the Waalsdorpproving ground near TNO-FEL. It consists of sixlanes with a different soil type in each lane, equip-ment to control the groundwater level in the lanes, ameasurement platform and peripheral equipment.Figure 4.1 shows an overview of the six lanes andthe measurement platform.
The dimensions of the test lanes are 10 m x 3 m x1.5 m for length, width and depth, with a distance of1 m between them. The distance between the lanes isto avoid interference in the measurements on onelane by objects situated in adjacent lanes. To avoiddistortion of the metal detector measurements thelanes have been constructed of wood without the useof electrically conducting materials. During construc-tion of the 6 lanes a zone 5 m wide and 1.5 m deeparound the lanes was made free of metal.
Of the available six lanes only four lanes, containingsand, clay, peat and ferruginous soil, were used.While constructing the lanes, the natural layer struc-ture of the soils was preserved. During the tests, thegroundwater level was controlled and the moisturecontent was monitored. The magnetic susceptibilityand the electric conductivity of the soils in the fourlanes are given in Annex B - Soil Measurements.
The measurement platform is made of non-conduc-ting materials. It consists of a 17 m long glass-fiberreinforced polyester tube with a diameter of 0.9 m(Figure 4.2). A sensor platform moves automaticallyover the tube with a speed of approximately 0.18m/s. The polyester tube can be moved manuallyalong rails. The position of the sensor platform alongthe tube was measured continuously with a laserdistance meter, and logged against time.
For the tests of the metal detectors on the test lanes aspecial mounting system was constructed out of
4. In-Soil Tests
Figure 4.1. Overviewtest lanes and measure-ment platform.
Figure 4.2.Measurement platform.
24 IPPTC Report 2001
plastic. This mounting system was fixed to the sensorplatform and adjusted to mount the different metaldetectors.
The weather conditions during the In-Soil Tests weremeasured and recorded with two meteorological sta-tions, one at 30 cm above ground level and one at aheight of three metres. The standard meteorologicalobservations were recorded: solar radiation, airtemperature, relative humidity of the air, wind speedand direction, and precipitation.
Equipment and materials
Metal detectorsTwo samples of each detector model were tested. Incase of a detector failure, the third sample of theconcerned detector model was used.
During the project the manufacturer indicated thatthe oval search head of the Guartel MD8 was a pre-liminary product with reliability concerns. Therefore,this detector head was not included in the analysis ofthe In-Soil Tests.
Data acquisition hardware and softwareThe main functions of the data acquisition system forthe In-Soil Tests were:
Recording the audio signals of the detectors;Recording the position of the detector;Playing back the recorded detector audio signal.
To record the audio signals of the detectors, the ori-ginal headphones (all detectors were provided withheadphones or a headphone connector) were adap-ted with a T-connector to allow simultaneous recor-ding by the computer system and monitoring by thetest operator. The computer to record the signals wassituated in a ‘Portacabin’ at the test facility.
Procedures
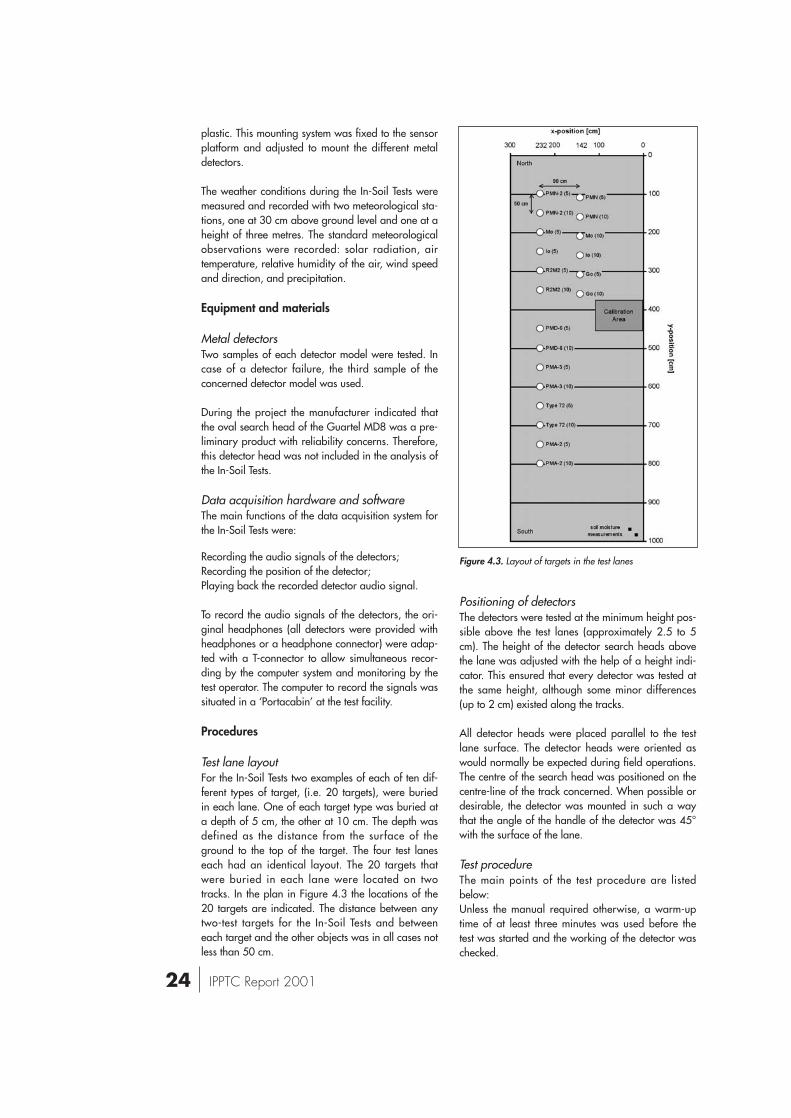
Test lane layout For the In-Soil Tests two examples of each of ten dif-ferent types of target, (i.e. 20 targets), were buriedin each lane. One of each target type was buried ata depth of 5 cm, the other at 10 cm. The depth wasdefined as the distance from the surface of theground to the top of the target. The four test laneseach had an identical layout. The 20 targets thatwere buried in each lane were located on twotracks. In the plan in Figure 4.3 the locations of the20 targets are indicated. The distance between anytwo-test targets for the In-Soil Tests and betweeneach target and the other objects was in all cases notless than 50 cm.
Positioning of detectorsThe detectors were tested at the minimum height pos-sible above the test lanes (approximately 2.5 to 5cm). The height of the detector search heads abovethe lane was adjusted with the help of a height indi-cator. This ensured that every detector was tested atthe same height, although some minor differences(up to 2 cm) existed along the tracks.
All detector heads were placed parallel to the testlane surface. The detector heads were oriented aswould normally be expected during field operations.The centre of the search head was positioned on thecentre-line of the track concerned. When possible ordesirable, the detector was mounted in such a waythat the angle of the handle of the detector was 45°with the surface of the lane.
Test procedureThe main points of the test procedure are listedbelow:Unless the manual required otherwise, a warm-uptime of at least three minutes was used before thetest was started and the working of the detector waschecked.
Figure 4.3. Layout of targets in the test lanes
25In-Soil Tests
The detectors were tested at the most sensitive settingfor the specific soil type. When appropriate ornecessary, the detectors were calibrated over thecalibration part of each test lane before the start ofthe actual test on that lane.During the test, the data was recorded in both direc-tions (north to south and south to north). All detectors were tested at the maximum velocity ofthe measurement platform (approximately 0.18m/s).
Data analysis and resultsThe analysis of the In-Soil Test data gives an indica-tion of the performance of the detectors. This analy-sis does not lead to a statistically rigorous statementon the detection probability of the detectors, becausethe number of targets in the test lanes is too small toobtain a reliable value for the detection probability.Instead the absolute number of detections is given.Due to the method of scoring, no statements can bemade on the false alarm rate of the detectors.
Scoring methodologyThe detector audio output recorded during the In-Soil Test was used to obtain a score of the detectionsof the detectors. For this purpose the audio files fromeach detector-run were played back. The correspon-ding position data was graphically displayed at thesame time, with markers indicating the location ofthe buried targets.
Each run was assessed for the detection of each tar-get and the ability to distinguish each target from itspredecessor. For the scores, signals from both direc-tions were taken into account. If a signal wasencountered in either direction that correlated withthe position of a target, it was counted as a detec-tion. Some signals were influenced by adjacent tar-gets, which were spaced at 50 cm. This causedapparent masked signals. Such signals appeared tobe a prolonged single indication, but were actuallycounted as a detection for each target.
Most detector models did not show large differencesbetween the performances of the two samples tested.For that reason, only the sample with the highestnumber of detections was considered in the analysis.
Three detector models did exhibit significant diffe-rences between the two samples tested. Investigationof possible causes did not give a clear explanation.Because no re-testing of these detectors was possi-ble, the sample with the highest number of signalsabove targets was considered in the analysis.Affected detectors are identified in the tables.
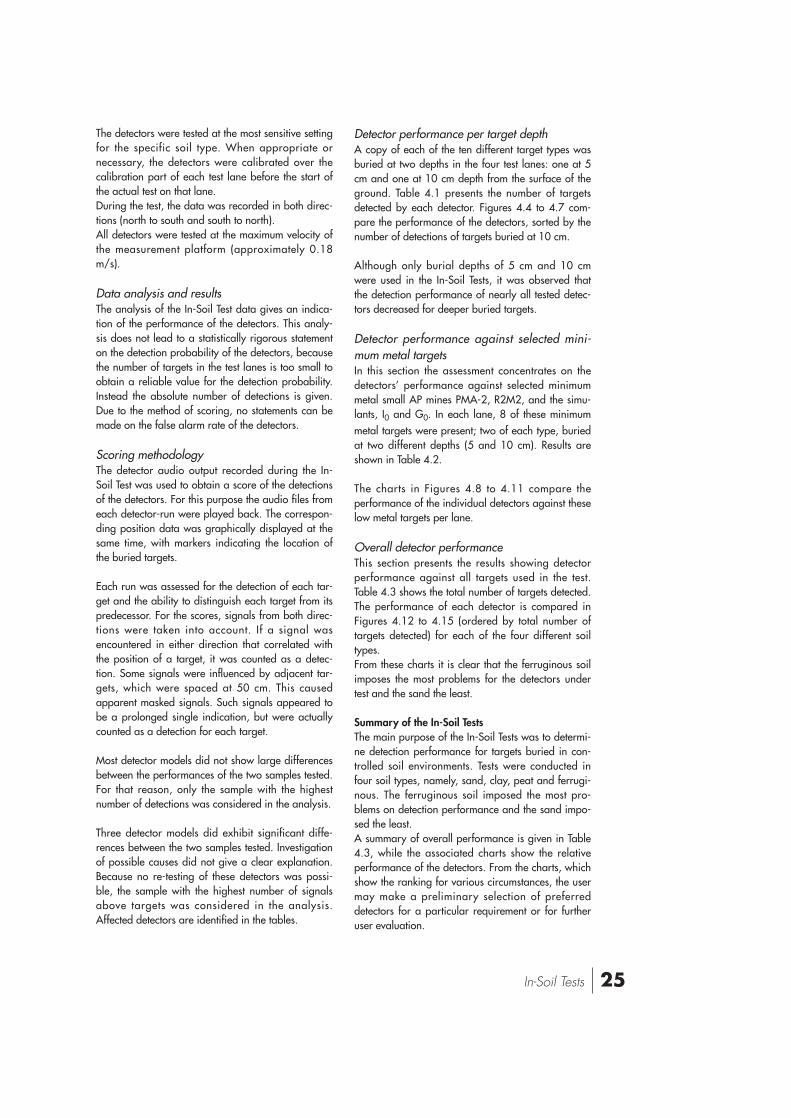
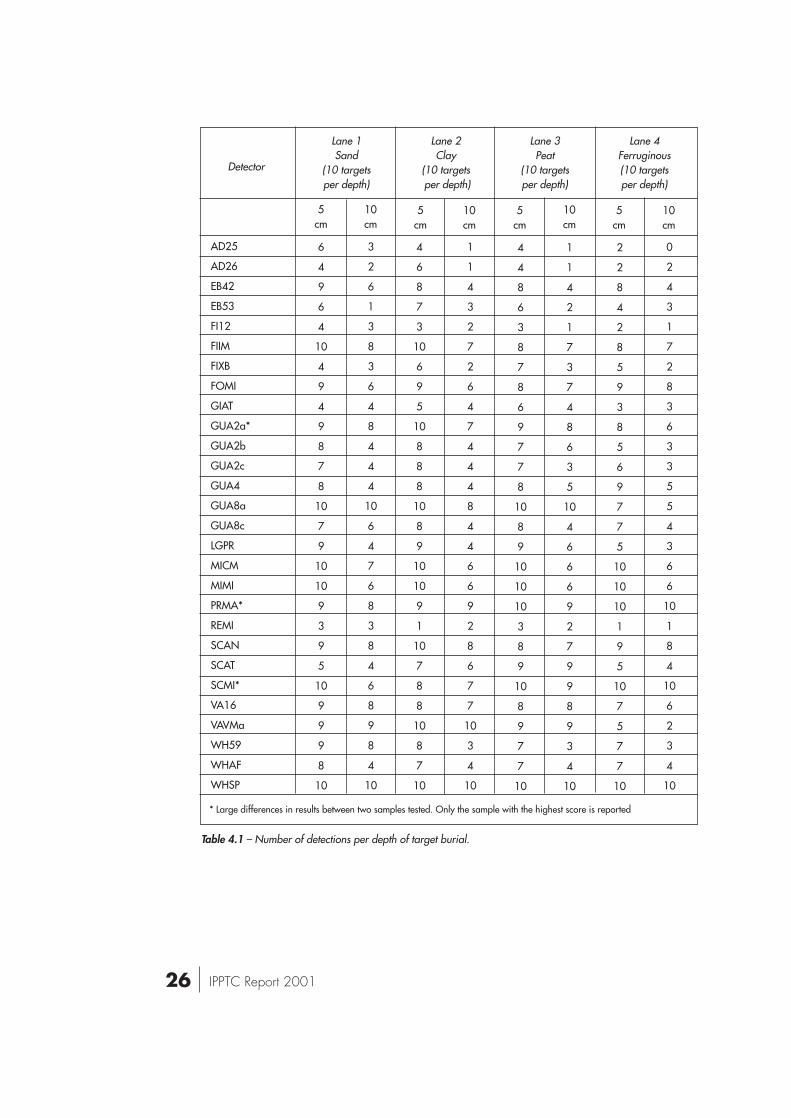
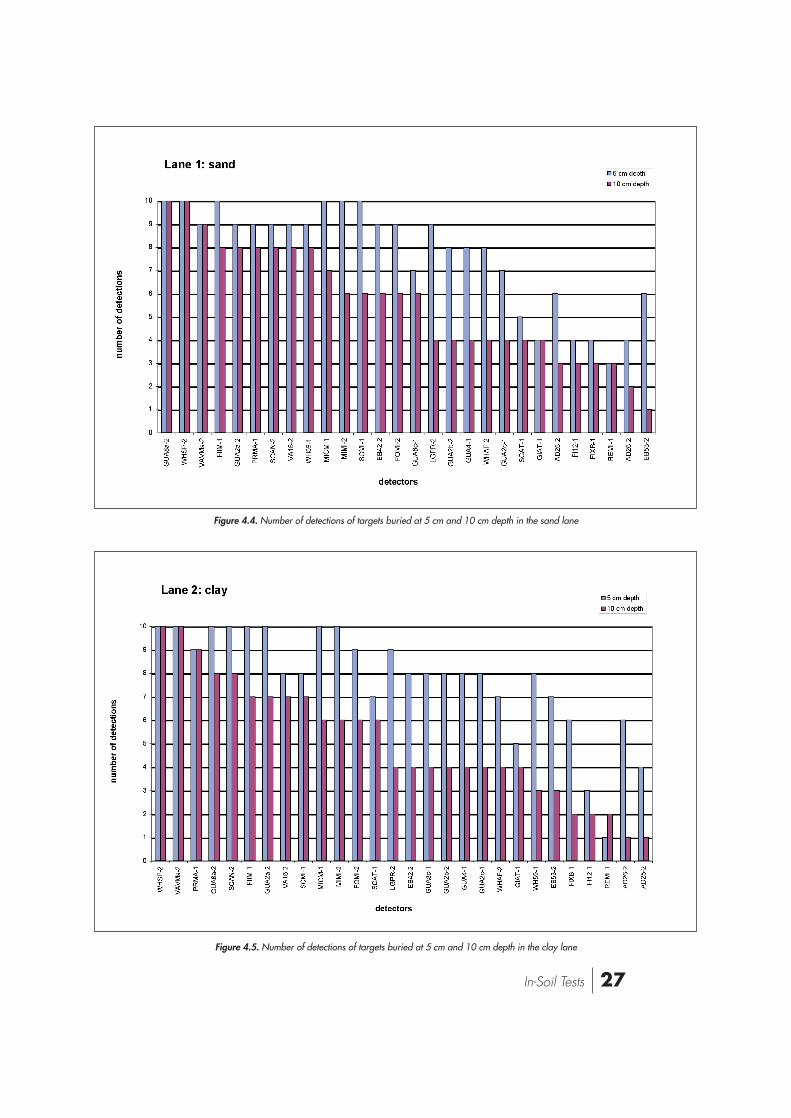
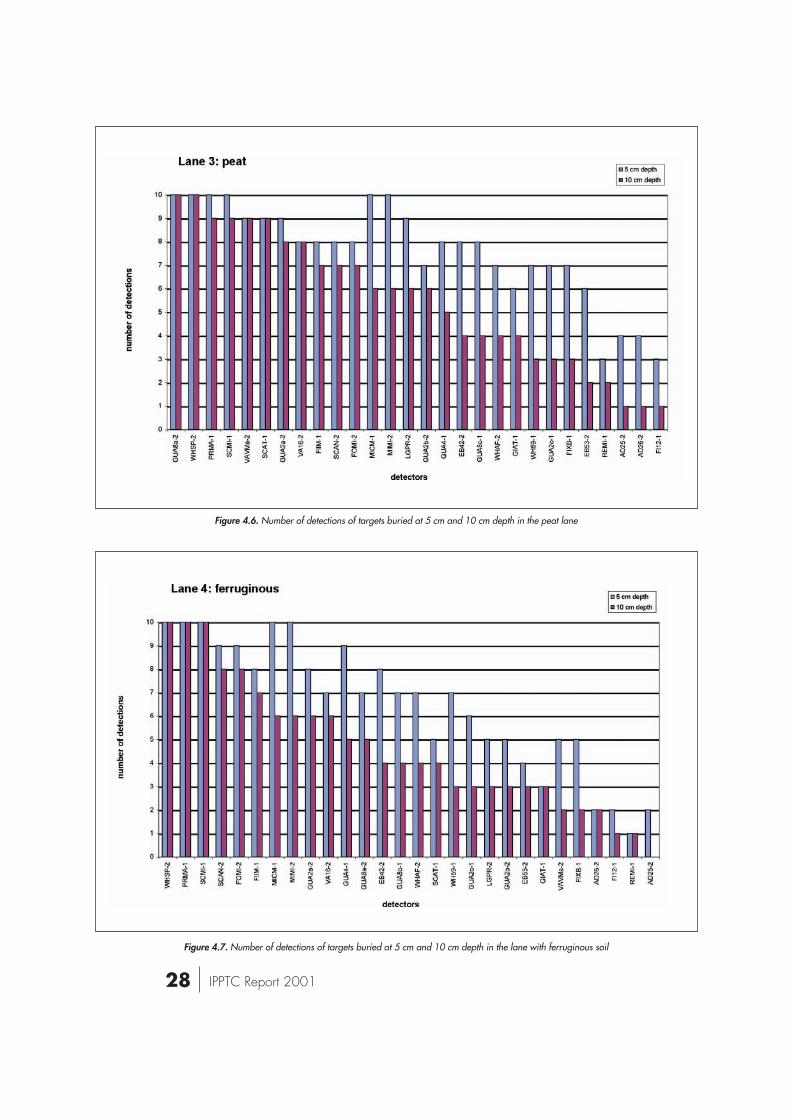
Detector performance per target depthA copy of each of the ten different target types wasburied at two depths in the four test lanes: one at 5cm and one at 10 cm depth from the surface of theground. Table 4.1 presents the number of targetsdetected by each detector. Figures 4.4 to 4.7 com-pare the performance of the detectors, sorted by thenumber of detections of targets buried at 10 cm.
Although only burial depths of 5 cm and 10 cmwere used in the In-Soil Tests, it was observed thatthe detection performance of nearly all tested detec-tors decreased for deeper buried targets.
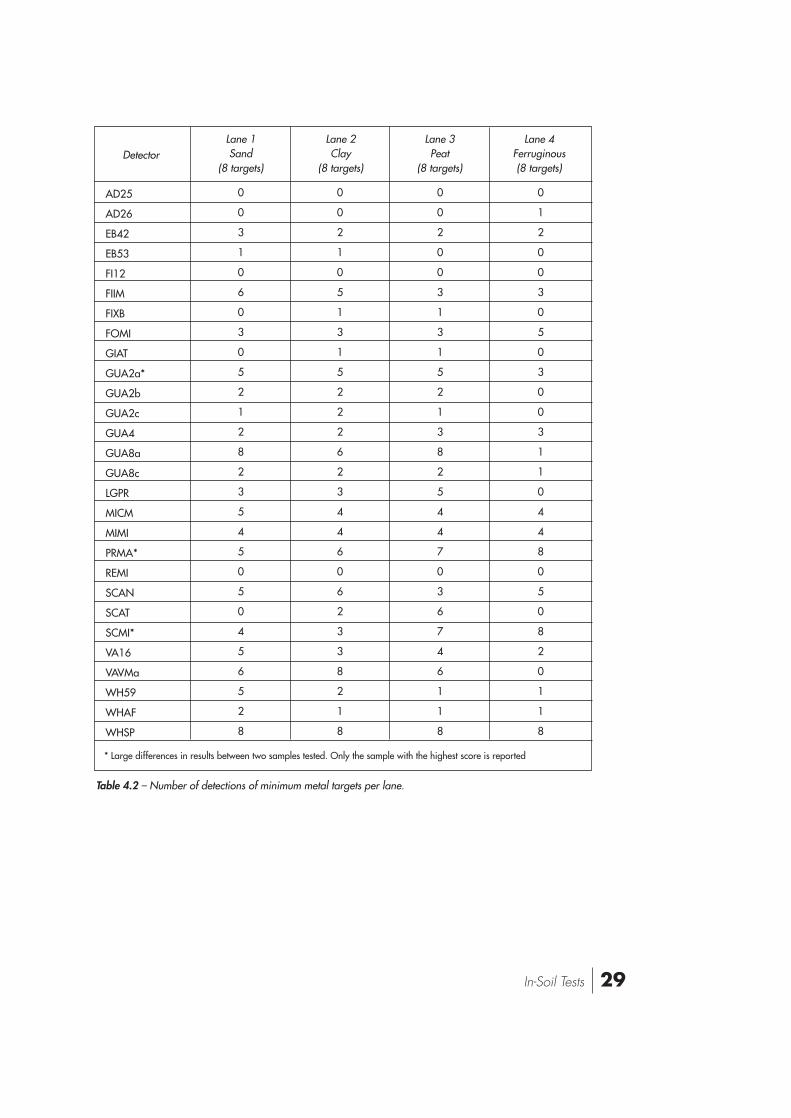
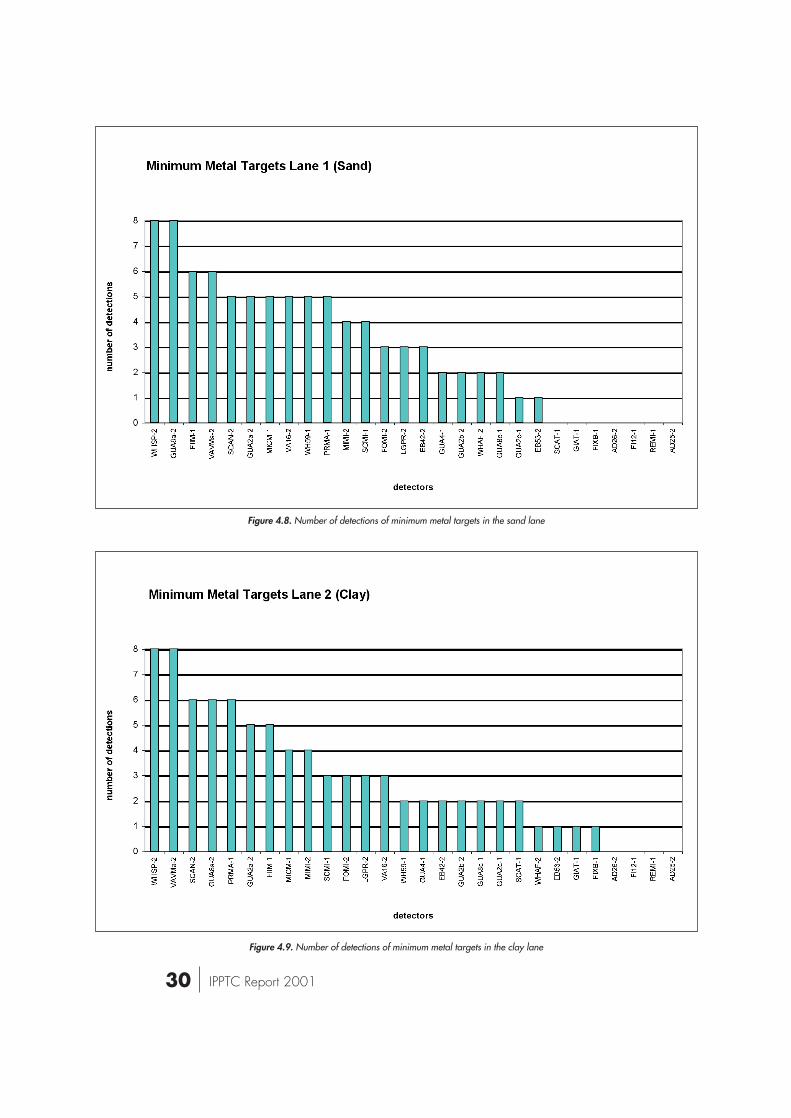
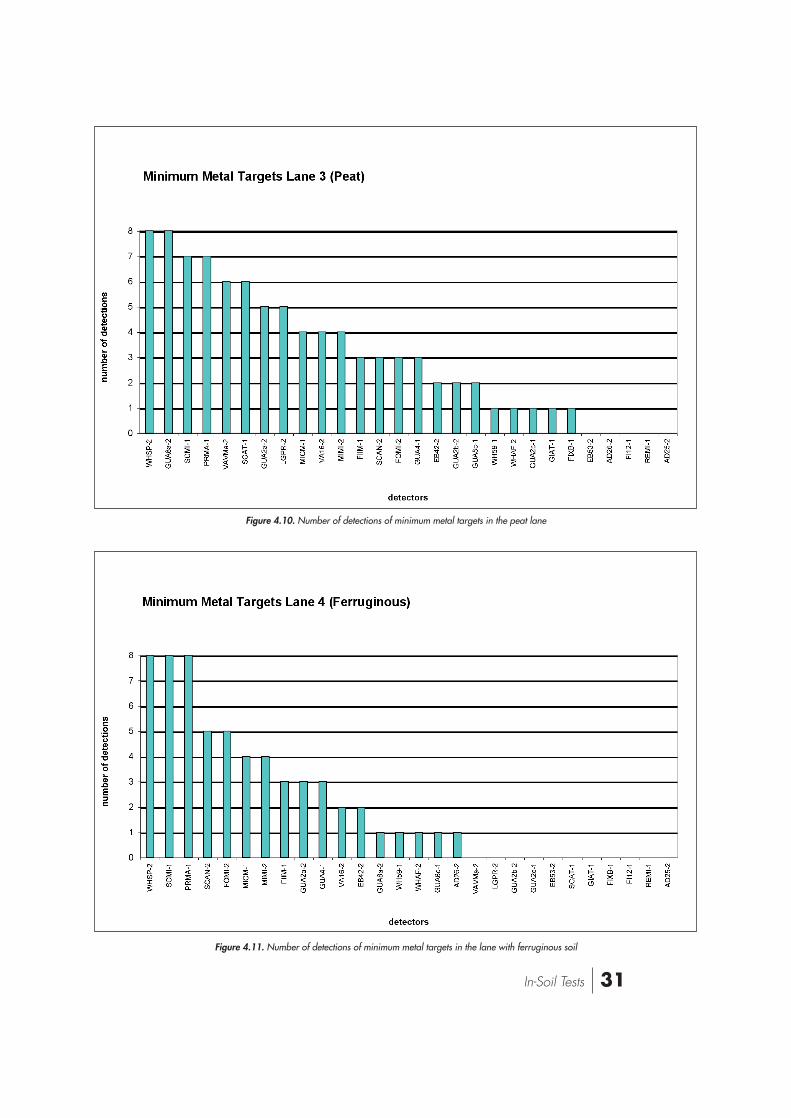
Detector performance against selected mini-mum metal targetsIn this section the assessment concentrates on thedetectors’ performance against selected minimummetal small AP mines PMA-2, R2M2, and the simu-lants, I0 and G0. In each lane, 8 of these minimummetal targets were present; two of each type, buriedat two different depths (5 and 10 cm). Results areshown in Table 4.2.
The charts in Figures 4.8 to 4.11 compare theperformance of the individual detectors against theselow metal targets per lane.
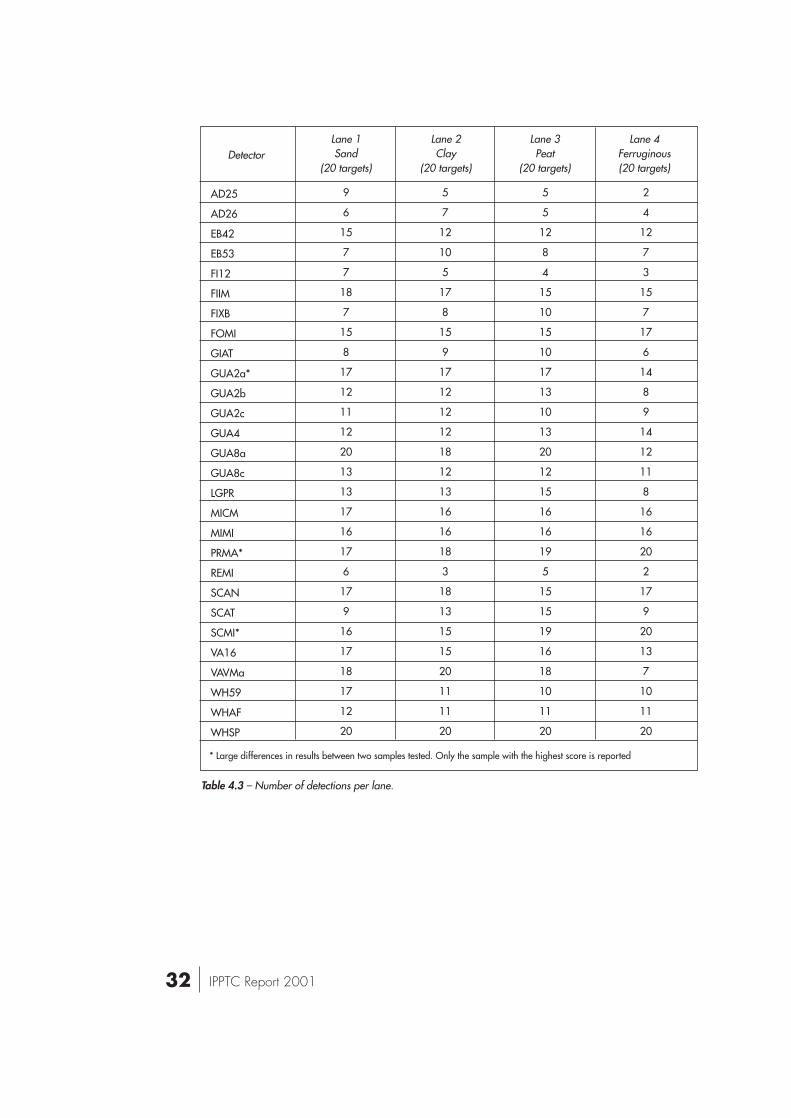
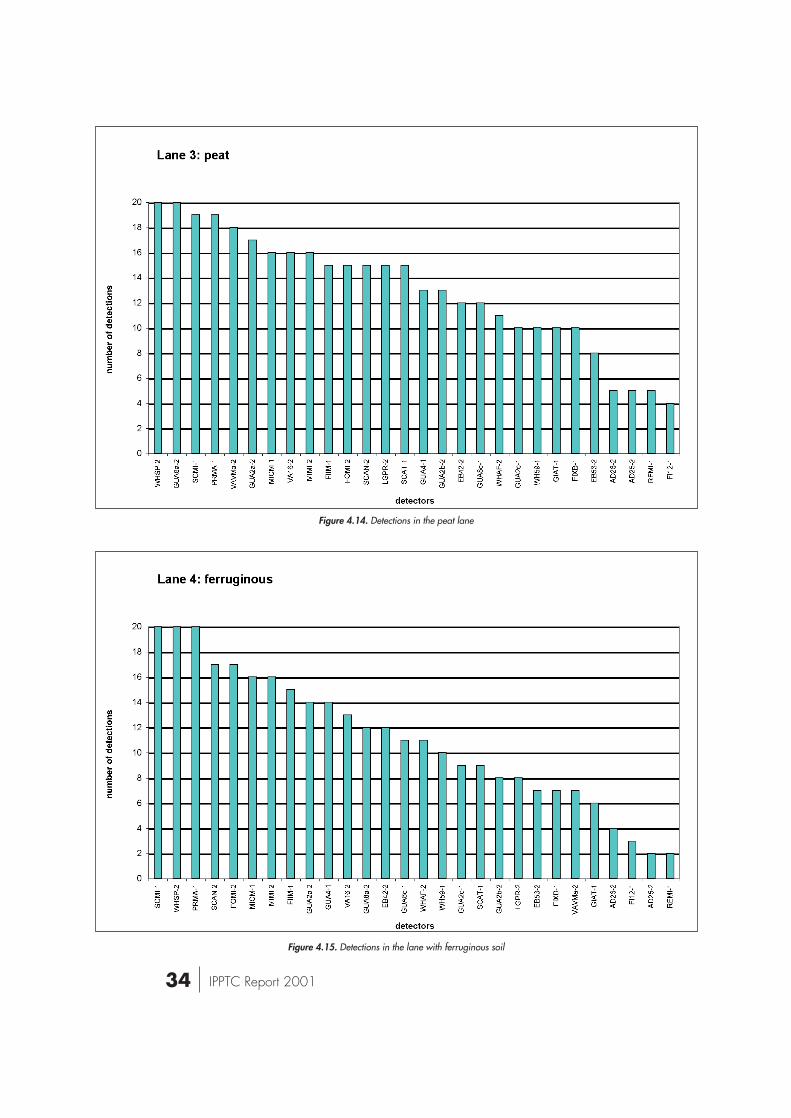
Overall detector performanceThis section presents the results showing detectorperformance against all targets used in the test.Table 4.3 shows the total number of targets detected.The performance of each detector is compared inFigures 4.12 to 4.15 (ordered by total number oftargets detected) for each of the four different soiltypes.From these charts it is clear that the ferruginous soilimposes the most problems for the detectors undertest and the sand the least.
Summary of the In-Soil TestsThe main purpose of the In-Soil Tests was to determi-ne detection performance for targets buried in con-trolled soil environments. Tests were conducted infour soil types, namely, sand, clay, peat and ferrugi-nous. The ferruginous soil imposed the most pro-blems on detection performance and the sand impo-sed the least. A summary of overall performance is given in Table4.3, while the associated charts show the relativeperformance of the detectors. From the charts, whichshow the ranking for various circumstances, the usermay make a preliminary selection of preferreddetectors for a particular requirement or for furtheruser evaluation.
26 IPPTC Report 2001
AD25
AD26
EB42
EB53
FI12
FIIM
FIXB
FOMI
GIAT
GUA2a*
GUA2b
GUA2c
GUA4
GUA8a
GUA8c
LGPR
MICM
MIMI
PRMA*
REMI
SCAN
SCAT
SCMI*
VA16
VAVMa
WH59
WHAF
WHSP
6
4
9
6
4
10
4
9
4
9
8
7
8
10
7
9
10
10
9
3
9
5
10
9
9
9
8
10
3
2
6
1
3
8
3
6
4
8
4
4
4
10
6
4
7
6
8
3
8
4
6
8
9
8
4
10
4
6
8
7
3
10
6
9
5
10
8
8
8
10
8
9
10
10
9
1
10
7
8
8
10
8
7
10
1
1
4
3
2
7
2
6
4
7
4
4
4
8
4
4
6
6
9
2
8
6
7
7
10
3
4
10
4
4
8
6
3
8
7
8
6
9
7
7
8
10
8
9
10
10
10
3
8
9
10
8
9
7
7
10
1
1
4
2
1
7
3
7
4
8
6
3
5
10
4
6
6
6
9
2
7
9
9
8
9
3
4
10
2
2
8
4
2
8
5
9
3
8
5
6
9
7
7
5
10
10
10
1
9
5
10
7
5
7
7
10
0
2
4
3
1
7
2
8
3
6
3
3
5
5
4
3
6
6
10
1
8
4
10
6
2
3
4
10
Lane 1Sand
(10 targets per depth)
Lane 2Clay
(10 targetsper depth)
Lane 3Peat
(10 targets per depth)
Lane 4Ferruginous(10 targets per depth)
Detector
* Large differences in results between two samples tested. Only the sample with the highest score is reported
Table 4.1 – Number of detections per depth of target burial.
5cm
10cm
5cm
10cm
5cm
10cm
5cm
10cm
27In-Soil Tests
Figure 4.5. Number of detections of targets buried at 5 cm and 10 cm depth in the clay lane
Figure 4.4. Number of detections of targets buried at 5 cm and 10 cm depth in the sand lane
28 IPPTC Report 2001
Figure 4.7. Number of detections of targets buried at 5 cm and 10 cm depth in the lane with ferruginous soil
Figure 4.6. Number of detections of targets buried at 5 cm and 10 cm depth in the peat lane
29In-Soil Tests
AD25
AD26
EB42
EB53
FI12
FIIM
FIXB
FOMI
GIAT
GUA2a*
GUA2b
GUA2c
GUA4
GUA8a
GUA8c
LGPR
MICM
MIMI
PRMA*
REMI
SCAN
SCAT
SCMI*
VA16
VAVMa
WH59
WHAF
WHSP
0
0
3
1
0
6
0
3
0
5
2
1
2
8
2
3
5
4
5
0
5
0
4
5
6
5
2
8
0
0
2
1
0
5
1
3
1
5
2
2
2
6
2
3
4
4
6
0
6
2
3
3
8
2
1
8
0
0
2
0
0
3
1
3
1
5
2
1
3
8
2
5
4
4
7
0
3
6
7
4
6
1
1
8
0
1
2
0
0
3
0
5
0
3
0
0
3
1
1
0
4
4
8
0
5
0
8
2
0
1
1
8
Lane 1Sand
(8 targets)
Lane 2Clay
(8 targets)
Lane 3Peat
(8 targets)
Lane 4Ferruginous(8 targets)
Detector
* Large differences in results between two samples tested. Only the sample with the highest score is reported
Table 4.2 – Number of detections of minimum metal targets per lane.
30 IPPTC Report 2001
Figure 4.9. Number of detections of minimum metal targets in the clay lane
Figure 4.8. Number of detections of minimum metal targets in the sand lane
31In-Soil Tests
Figure 4.11. Number of detections of minimum metal targets in the lane with ferruginous soil
Figure 4.10. Number of detections of minimum metal targets in the peat lane
32 IPPTC Report 2001
AD25
AD26
EB42
EB53
FI12
FIIM
FIXB
FOMI
GIAT
GUA2a*
GUA2b
GUA2c
GUA4
GUA8a
GUA8c
LGPR
MICM
MIMI
PRMA*
REMI
SCAN
SCAT
SCMI*
VA16
VAVMa
WH59
WHAF
WHSP
9
6
15
7
7
18
7
15
8
17
12
11
12
20
13
13
17
16
17
6
17
9
16
17
18
17
12
20
5
7
12
10
5
17
8
15
9
17
12
12
12
18
12
13
16
16
18
3
18
13
15
15
20
11
11
20
5
5
12
8
4
15
10
15
10
17
13
10
13
20
12
15
16
16
19
5
15
15
19
16
18
10
11
20
2
4
12
7
3
15
7
17
6
14
8
9
14
12
11
8
16
16
20
2
17
9
20
13
7
10
11
20
Lane 1Sand
(20 targets)
Lane 2Clay
(20 targets)
Lane 3Peat
(20 targets)
Lane 4Ferruginous(20 targets)
Detector
* Large differences in results between two samples tested. Only the sample with the highest score is reported
Table 4.3 – Number of detections per lane.
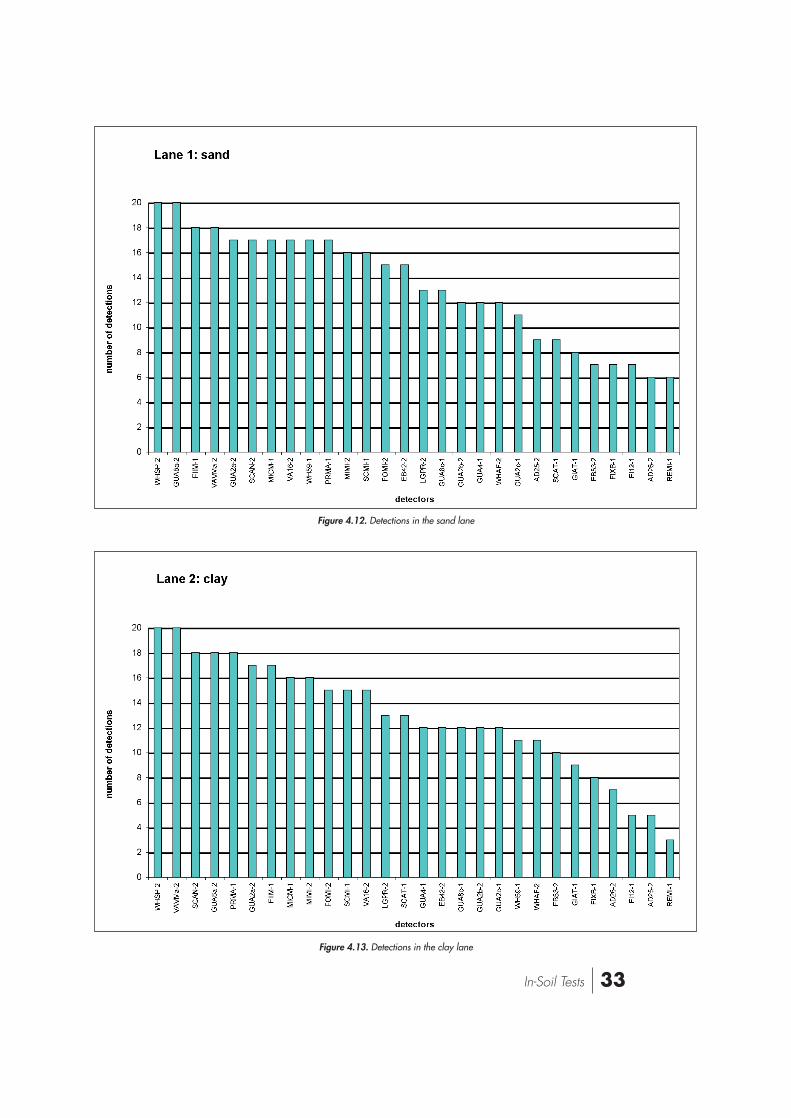
33In-Soil Tests
Figure 4.13. Detections in the clay lane
Figure 4.12. Detections in the sand lane
34 IPPTC Report 2001
Figure 4.15. Detections in the lane with ferruginous soil
Figure 4.14. Detections in the peat lane
35Field Tests
This section summarizes the results of theCambodian and Croatian Field Tests conductedduring the International Pilot Project for TechnologyCooperation. It is derived from the full technicalreports. [5, 6]
ObjectiveThe objective of these field tests was to evaluate anddetermine the detection performance and humanfactors characteristics of the 29 different detectors, intest fields in Cambodia and Croatia. All detectorshad been tested previously in laboratory settings (In-Soil, In-Air and preliminary Human Factors tests).The factors considered in this evaluation included:detection of targets buried at 5 cm and 10 cmdepths; occurrence of false positives1; detection oftargets buried in typical Cambodian configurationsor additional depths of interest to Croatia; andhuman factors. For the human factors evaluation, aquestionnaire was given to each deminer to establishthe perceived ergonomics, ruggedness, and level ofdifficulty in using each detector. The analyses of thequestionnaire inputs were combined with a previou-sly conducted Human Factors Assessment and arepresented elsewhere in this report.
MethodologyIn order to train local instructors and deminers ade-quately on given detectors, without impacting theoverall schedule, training and testing was conductedin a parallel and staggered fashion. After two IPPTCmilitary instructors had trained local instructors anddeminers, a pair of deminers was selected to con-duct each test run. The deminers calibrated a givendetector, in accordance with the manufacturer’sinstruction manual, against known targets and soiltypes to optimize the detector sensitivity. They practi-
ced in calibration lanes until they felt proficient withthe detectors’ operation. Operators were instructedto operate their equipment according to standarddemining practice. However, they were requested todisregard any visual clues and rely only on thedetector signals to ensure that the detectors weregiven an objective evaluation. Once the training andpractice was complete, the operators began theactual testing in the test lanes.
The training area for the Croatian field test useduncovered targets placed in open holes in the cali-bration area. The holes were left uncovered to helpthe deminers train on just the signals from the targetswithout the distraction of the signals that were preva-lent all over the training area, presumably from acombination of metal objects and effects from themetallic minerals in the soil. This was different fromthe training regimen in the Cambodian field test.
Each operator started at the beginning of each laneand moved forward as he swept the lane, placing amarking chip at the center of each suspected targetlocation. At the completion of each test lane, IPPTCteam members measured and recorded the x-y coor-dinate of each marker chip. The location of eachmarker was compared to ground truth. A target wasconsidered to have been detected when a markerwas placed within 20 cm from the center of the tar-get. This “halo size” was used to allow for operatorinaccuracy in placing markers precisely in the centerof a suspected target. When a marking chip fell out-side of the halo, it was considered a “false positive.”In the field tests, no attempt was made to determinethe source of each false positive. During the testingprocedure, a human factor questionnaire was com-pleted.
Cambodian Field Test The Cambodian field test was performed with thesupport of the Cambodian Mine Action Center(CMAC). The personnel who participated in the testconsisted of six IPPTC members and 33 CMAC mem-
5. Field Tests
1 A ‘false positive’ is defined for the purpose of this report asa response from a metal detector indicating presence of ametal object in a place that was believed, on the basis ofprevious searches to be free from metallic pollution andwhere no target for this test had been placed.
36 IPPTC Report 2001
bers. The support from CMAC was in the areas ofoperating detectors, administration, logistics, facilita-tion of training/test, and construction of test lanes.The 16 operators who participated in the test wereall experienced deminers from a single deminingunit with at least one year of operational field expe-rience.
Test Site The training and testing were conducted at theCMAC Training Center in Kampong Chhnang,Cambodia.
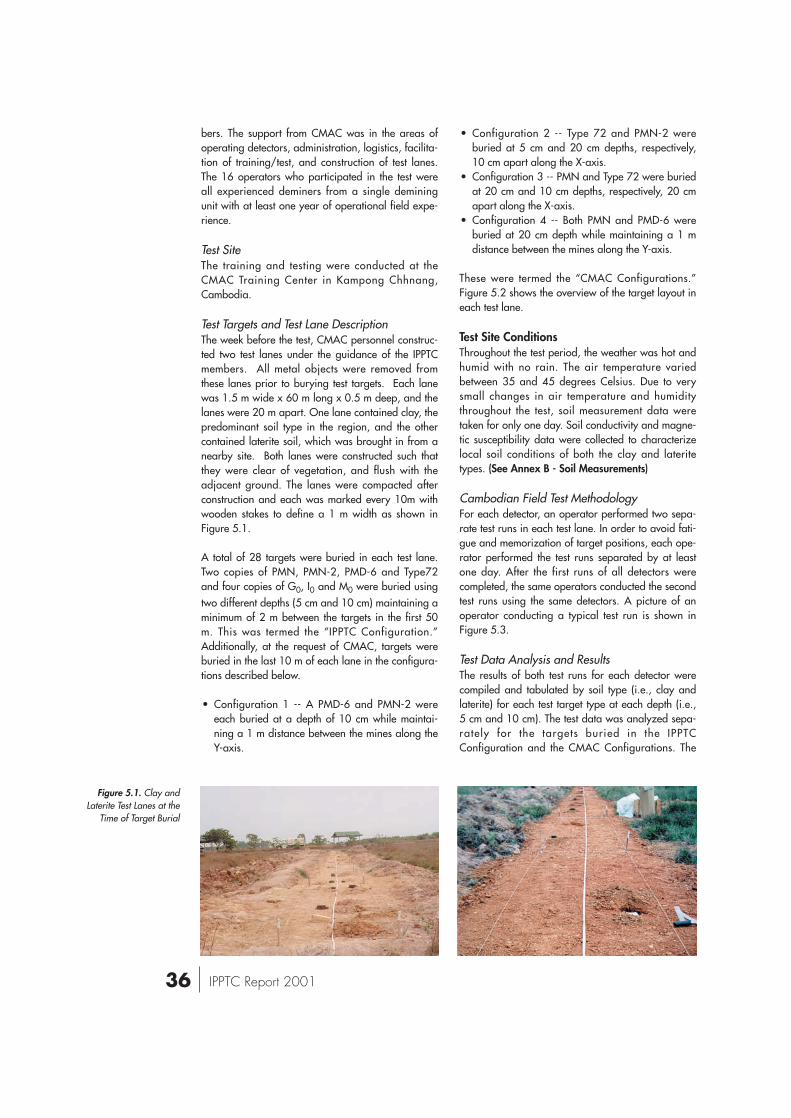
Test Targets and Test Lane DescriptionThe week before the test, CMAC personnel construc-ted two test lanes under the guidance of the IPPTCmembers. All metal objects were removed fromthese lanes prior to burying test targets. Each lanewas 1.5 m wide x 60 m long x 0.5 m deep, and thelanes were 20 m apart. One lane contained clay, thepredominant soil type in the region, and the othercontained laterite soil, which was brought in from anearby site. Both lanes were constructed such thatthey were clear of vegetation, and flush with theadjacent ground. The lanes were compacted afterconstruction and each was marked every 10m withwooden stakes to define a 1 m width as shown inFigure 5.1.
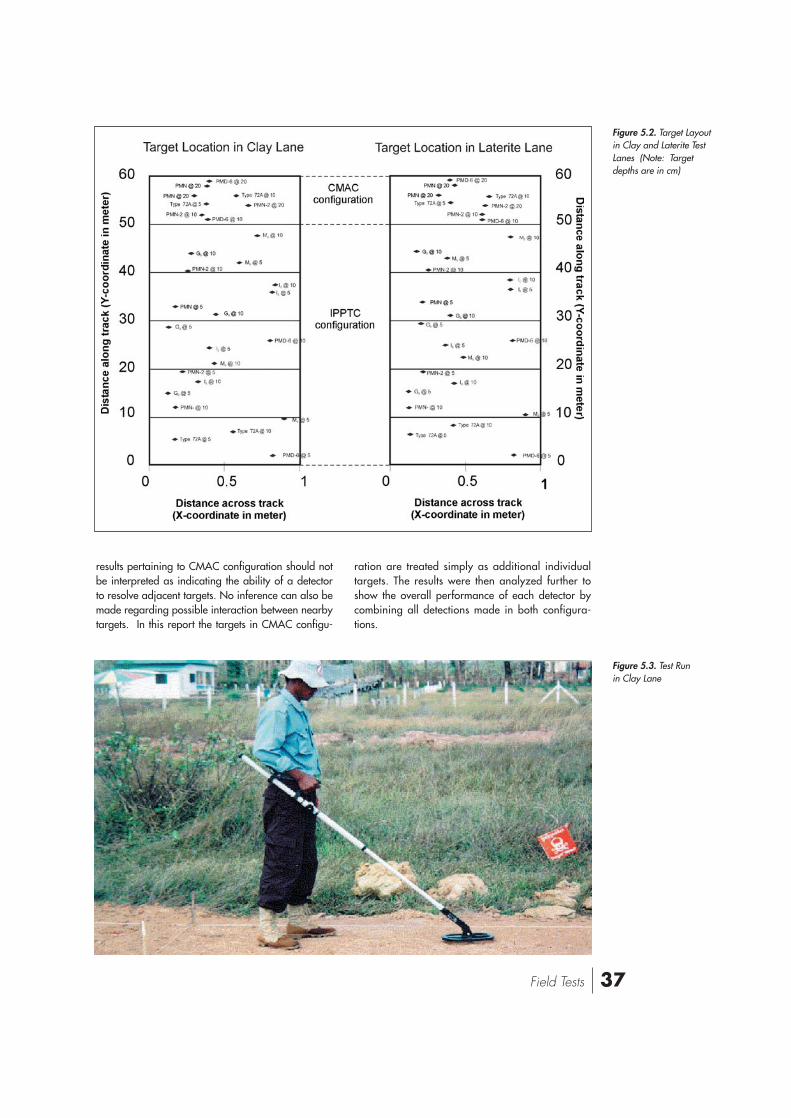
A total of 28 targets were buried in each test lane.Two copies of PMN, PMN-2, PMD-6 and Type72and four copies of G0, I0 and M0 were buried usingtwo different depths (5 cm and 10 cm) maintaining aminimum of 2 m between the targets in the first 50m. This was termed the “IPPTC Configuration.”Additionally, at the request of CMAC, targets wereburied in the last 10 m of each lane in the configura-tions described below.
• Configuration 1 -- A PMD-6 and PMN-2 wereeach buried at a depth of 10 cm while maintai-ning a 1 m distance between the mines along theY-axis.
• Configuration 2 -- Type 72 and PMN-2 wereburied at 5 cm and 20 cm depths, respectively,10 cm apart along the X-axis.
• Configuration 3 -- PMN and Type 72 were buriedat 20 cm and 10 cm depths, respectively, 20 cmapart along the X-axis.
• Configuration 4 -- Both PMN and PMD-6 wereburied at 20 cm depth while maintaining a 1 mdistance between the mines along the Y-axis.
These were termed the “CMAC Configurations.”Figure 5.2 shows the overview of the target layout ineach test lane.
Test Site ConditionsThroughout the test period, the weather was hot andhumid with no rain. The air temperature variedbetween 35 and 45 degrees Celsius. Due to verysmall changes in air temperature and humiditythroughout the test, soil measurement data weretaken for only one day. Soil conductivity and magne-tic susceptibility data were collected to characterizelocal soil conditions of both the clay and lateritetypes. (See Annex B - Soil Measurements)
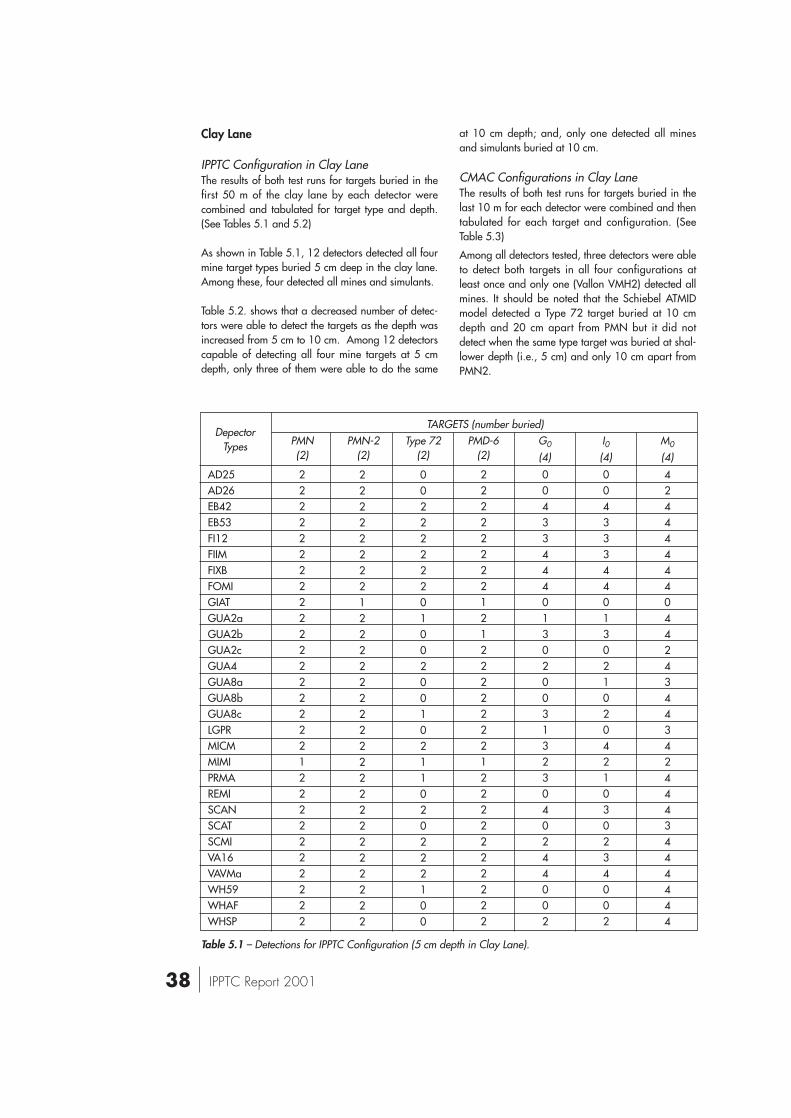
Cambodian Field Test MethodologyFor each detector, an operator performed two sepa-rate test runs in each test lane. In order to avoid fati-gue and memorization of target positions, each ope-rator performed the test runs separated by at leastone day. After the first runs of all detectors werecompleted, the same operators conducted the secondtest runs using the same detectors. A picture of anoperator conducting a typical test run is shown inFigure 5.3.
Test Data Analysis and ResultsThe results of both test runs for each detector werecompiled and tabulated by soil type (i.e., clay andlaterite) for each test target type at each depth (i.e.,5 cm and 10 cm). The test data was analyzed sepa-rately for the targets buried in the IPPTCConfiguration and the CMAC Configurations. The
Figure 5.1. Clay andLaterite Test Lanes at the
Time of Target Burial
37Field Tests
results pertaining to CMAC configuration should notbe interpreted as indicating the ability of a detectorto resolve adjacent targets. No inference can also bemade regarding possible interaction between nearbytargets. In this report the targets in CMAC configu-
ration are treated simply as additional individualtargets. The results were then analyzed further toshow the overall performance of each detector bycombining all detections made in both configura-tions.
Figure 5.2. Target Layoutin Clay and Laterite TestLanes (Note: Targetdepths are in cm)
Figure 5.3. Test Runin Clay Lane
38 IPPTC Report 2001
Clay Lane
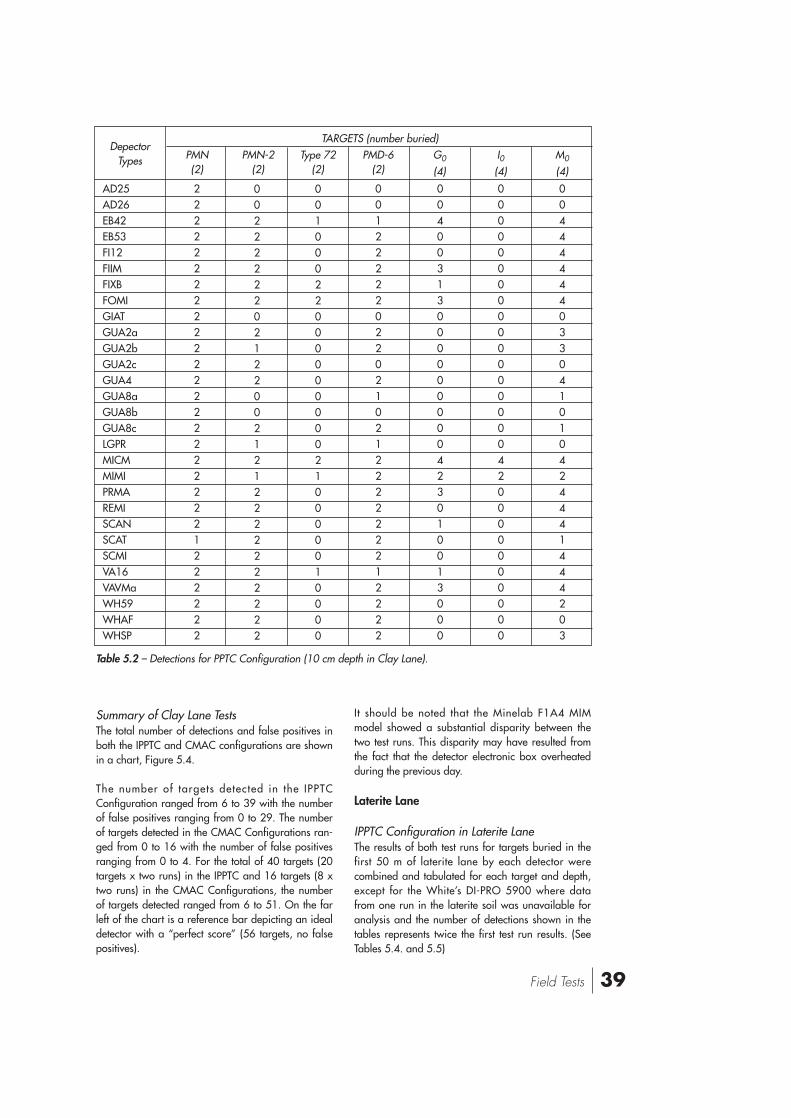
IPPTC Configuration in Clay LaneThe results of both test runs for targets buried in thefirst 50 m of the clay lane by each detector werecombined and tabulated for target type and depth.(See Tables 5.1 and 5.2)
As shown in Table 5.1, 12 detectors detected all fourmine target types buried 5 cm deep in the clay lane.Among these, four detected all mines and simulants.
Table 5.2. shows that a decreased number of detec-tors were able to detect the targets as the depth wasincreased from 5 cm to 10 cm. Among 12 detectorscapable of detecting all four mine targets at 5 cmdepth, only three of them were able to do the same
at 10 cm depth; and, only one detected all minesand simulants buried at 10 cm.
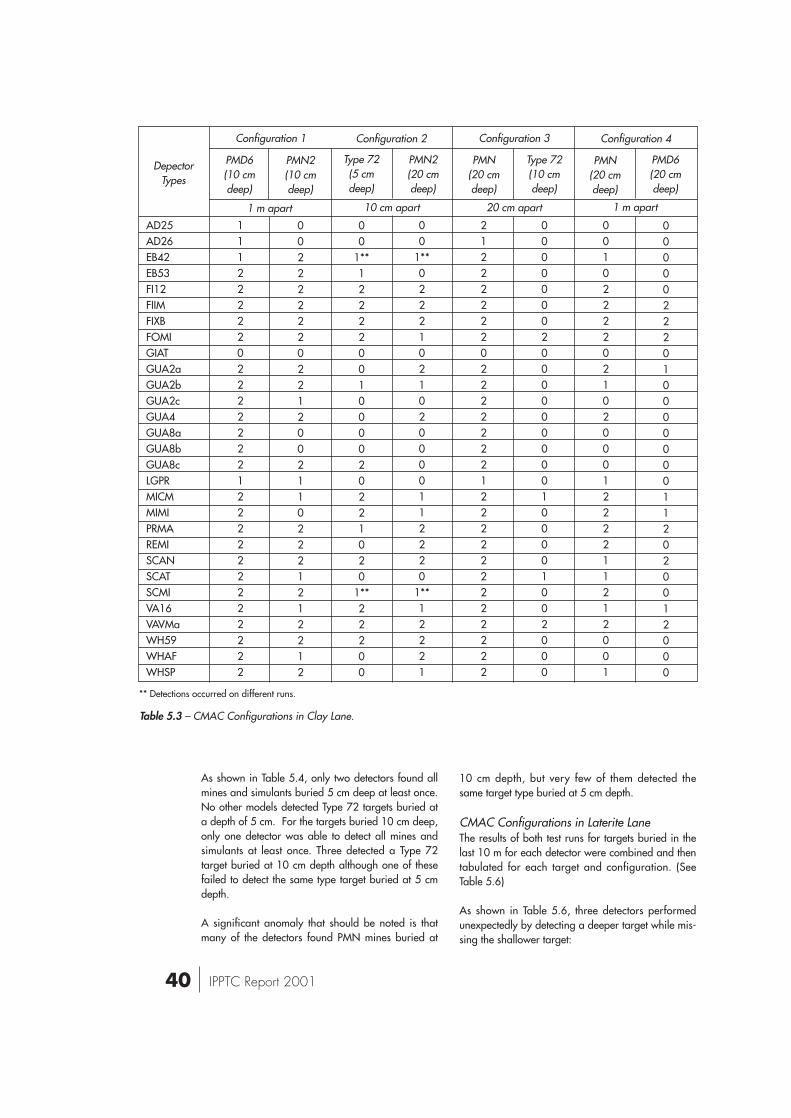
CMAC Configurations in Clay LaneThe results of both test runs for targets buried in thelast 10 m for each detector were combined and thentabulated for each target and configuration. (SeeTable 5.3)
Among all detectors tested, three detectors were ableto detect both targets in all four configurations atleast once and only one (Vallon VMH2) detected allmines. It should be noted that the Schiebel ATMIDmodel detected a Type 72 target buried at 10 cmdepth and 20 cm apart from PMN but it did notdetect when the same type target was buried at shal-lower depth (i.e., 5 cm) and only 10 cm apart fromPMN2.
AD25AD26EB42EB53FI12FIIMFIXBFOMIGIATGUA2aGUA2bGUA2cGUA4GUA8aGUA8bGUA8cLGPRMICMMIMIPRMAREMISCANSCATSCMIVA16VAVMaWH59WHAFWHSP
22222222222222222212222222222
22222222122222222222222222222
00222222010020010211020222100
22222222121222222212222222222
00433444013020031323040244002
00433344013021020421030234002
42444444044243443424443444444
Table 5.1 – Detections for IPPTC Configuration (5 cm depth in Clay Lane).
PMN(2)
DepectorTypes
TARGETS (number buried)PMN-2
(2)PMD-6
(2)G0
(4)I0(4)
M0
(4)Type 72
(2)
39Field Tests
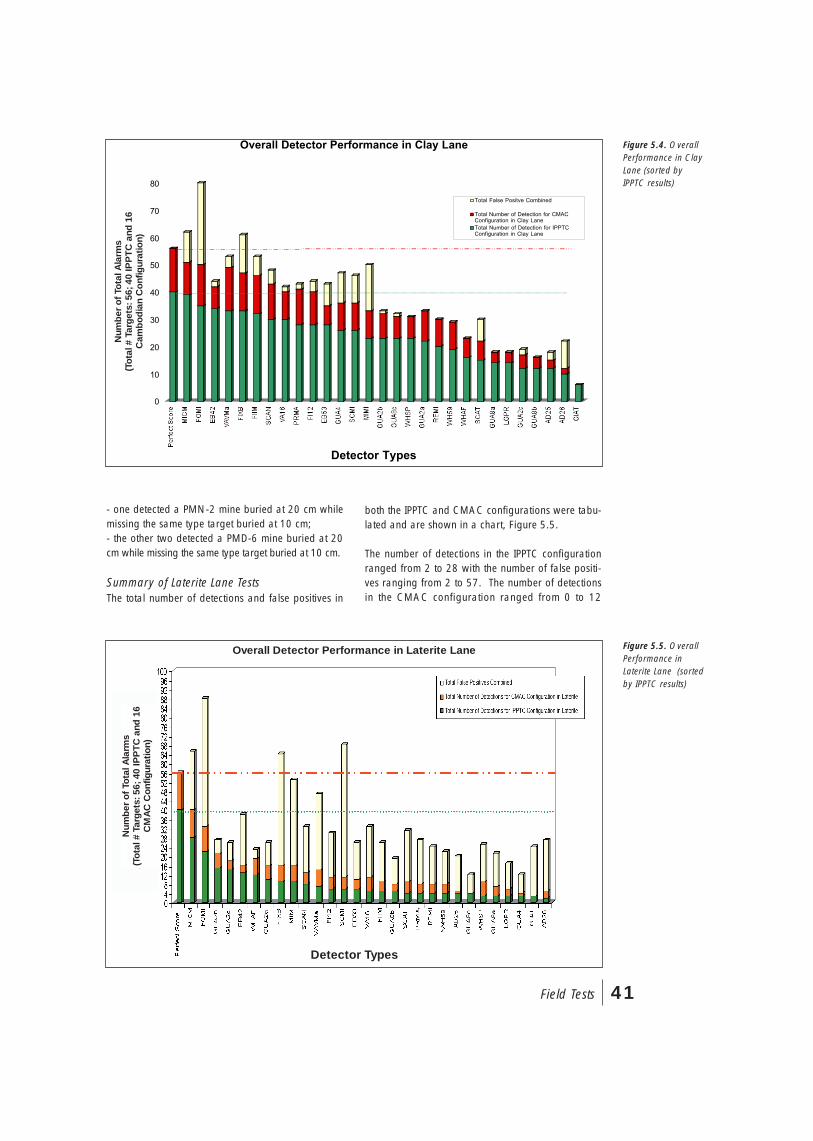
Summary of Clay Lane TestsThe total number of detections and false positives inboth the IPPTC and CMAC configurations are shownin a chart, Figure 5.4.
The number of targets detected in the IPPTCConfiguration ranged from 6 to 39 with the numberof false positives ranging from 0 to 29. The numberof targets detected in the CMAC Configurations ran-ged from 0 to 16 with the number of false positivesranging from 0 to 4. For the total of 40 targets (20targets x two runs) in the IPPTC and 16 targets (8 xtwo runs) in the CMAC Configurations, the numberof targets detected ranged from 6 to 51. On the farleft of the chart is a reference bar depicting an idealdetector with a “perfect score” (56 targets, no falsepositives).
It should be noted that the Minelab F1A4 MIMmodel showed a substantial disparity between thetwo test runs. This disparity may have resulted fromthe fact that the detector electronic box overheatedduring the previous day.
Laterite Lane
IPPTC Configuration in Laterite LaneThe results of both test runs for targets buried in thefirst 50 m of laterite lane by each detector werecombined and tabulated for each target and depth,except for the White’s DI-PRO 5900 where datafrom one run in the laterite soil was unavailable foranalysis and the number of detections shown in thetables represents twice the first test run results. (SeeTables 5.4. and 5.5)
AD25AD26EB42EB53FI12FIIMFIXBFOMIGIATGUA2aGUA2bGUA2cGUA4GUA8aGUA8bGUA8cLGPRMICMMIMIPRMAREMISCANSCATSCMIVA16VAVMaWH59WHAFWHSP
22222222222222222222221222222
00222222021220021212222222222
00100022000000000210000010000
00122222022021021222222212222
00400313000000000423010013000
00000000000000000420000000000
00444444033041010424441444203
Table 5.2 – Detections for PPTC Configuration (10 cm depth in Clay Lane).
PMN(2)
DepectorTypes
TARGETS (number buried)PMN-2
(2)PMD-6
(2)G0
(4)I0(4)
M0
(4)Type 72
(2)
40 IPPTC Report 2001
As shown in Table 5.4, only two detectors found allmines and simulants buried 5 cm deep at least once.No other models detected Type 72 targets buried ata depth of 5 cm. For the targets buried 10 cm deep,only one detector was able to detect all mines andsimulants at least once. Three detected a Type 72target buried at 10 cm depth although one of thesefailed to detect the same type target buried at 5 cmdepth.
A significant anomaly that should be noted is thatmany of the detectors found PMN mines buried at
10 cm depth, but very few of them detected thesame target type buried at 5 cm depth.
CMAC Configurations in Laterite LaneThe results of both test runs for targets buried in thelast 10 m for each detector were combined and thentabulated for each target and configuration. (SeeTable 5.6)
As shown in Table 5.6, three detectors performedunexpectedly by detecting a deeper target while mis-sing the shallower target:
AD25AD26EB42EB53FI12FIIMFIXBFOMIGIATGUA2aGUA2bGUA2cGUA4GUA8aGUA8bGUA8cLGPRMICMMIMIPRMAREMISCANSCATSCMIVA16VAVMaWH59WHAFWHSP
11122222022222221222222222222
00222222022120021102221212212
00
1**12222001000020221020
1**22200
00
1**02221021020000112220
1**12221
21222222022222221222222222222
00000002000000000100001002000
00102222021020001222211212001
00000222010000000112020012000
Table 5.3 – CMAC Configurations in Clay Lane.
PMD6(10 cmdeep)
PMD6(20 cmdeep)
PMN2(10 cmdeep)
Type 72(5 cmdeep)
PMN2(20 cmdeep)
PMN(20 cmdeep)
PMN(20 cmdeep)
Type 72(10 cmdeep)
DepectorTypes
Configuration 1 Configuration 2 Configuration 3 Configuration 4
1 m apart1 m apart 10 cm apart 20 cm apart
** Detections occurred on different runs.
41Field Tests
- one detected a PMN-2 mine buried at 20 cm whilemissing the same type target buried at 10 cm;- the other two detected a PMD-6 mine buried at 20cm while missing the same type target buried at 10 cm.
Summary of Laterite Lane TestsThe total number of detections and false positives in
both the IPPTC and CMAC configurations were tabu-lated and are shown in a chart, Figure 5.5.
The number of detections in the IPPTC configurationranged from 2 to 28 with the number of false positi-ves ranging from 2 to 57. The number of detectionsin the CMAC configuration ranged from 0 to 12
0
10
20
30
40
50
60
70
80
Detector Types
Overall Detector Performance in Clay Lane
Total False Positve Combined
Total Number of Detection for CMACConfiguration in Clay LaneTotal Number of Detection for IPPTCConfiguration in Clay Lane
Figure 5.4. OverallPerformance in ClayLane (sorted byIPPTC results)
Figure 5.5. OverallPerformance inLaterite Lane (sortedby IPPTC results)
Overall Detector Performance in Laterite Lane
Num
ber
of
Tota
l Ala
rms
(To
tal #
Tar
get
s: 5
6; 4
0 IP
PT
C a
nd 1
6C
amb
od
ian
Co
nfig
urat
ion)
Detector Types
Num
ber
of
Tota
l Ala
rms
(To
tal #
Tar
get
s: 5
6; 4
0 IP
PT
C a
nd 1
6C
MA
C C
onf
igur
atio
n)
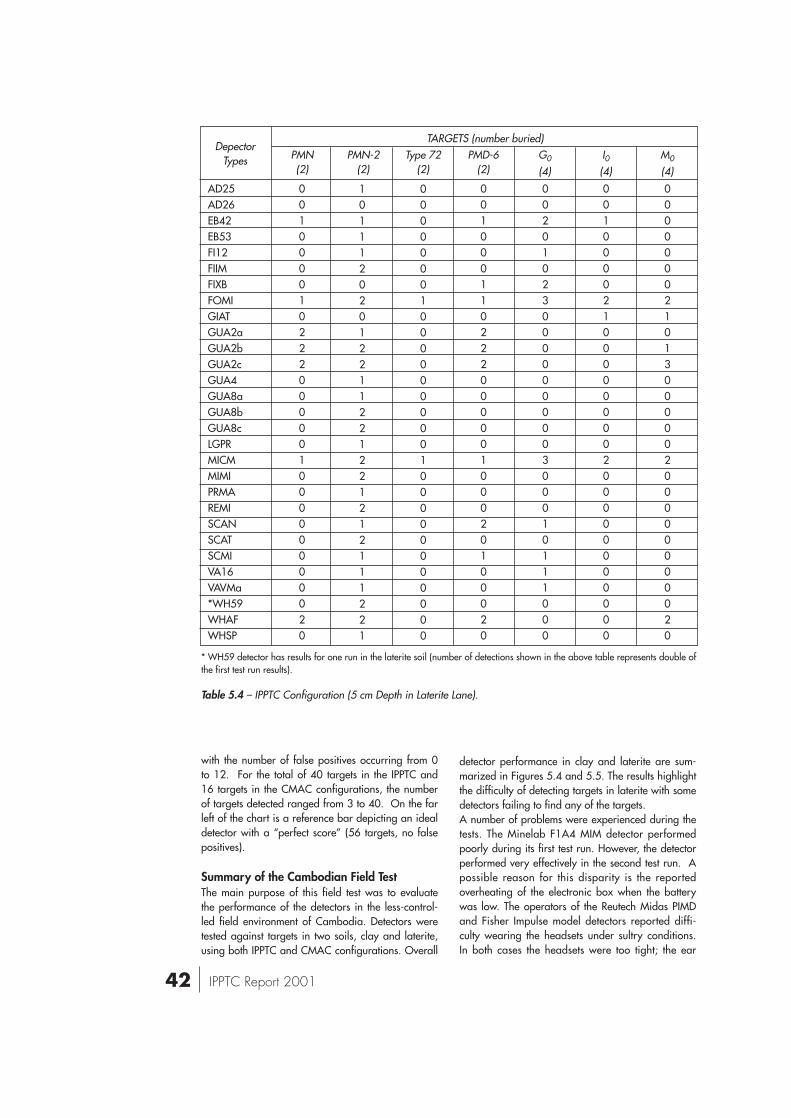
42 IPPTC Report 2001
with the number of false positives occurring from 0to 12. For the total of 40 targets in the IPPTC and16 targets in the CMAC configurations, the numberof targets detected ranged from 3 to 40. On the farleft of the chart is a reference bar depicting an idealdetector with a “perfect score” (56 targets, no falsepositives).
Summary of the Cambodian Field TestThe main purpose of this field test was to evaluatethe performance of the detectors in the less-control-led field environment of Cambodia. Detectors weretested against targets in two soils, clay and laterite,using both IPPTC and CMAC configurations. Overall
detector performance in clay and laterite are sum-marized in Figures 5.4 and 5.5. The results highlightthe difficulty of detecting targets in laterite with somedetectors failing to find any of the targets.A number of problems were experienced during thetests. The Minelab F1A4 MIM detector performedpoorly during its first test run. However, the detectorperformed very effectively in the second test run. Apossible reason for this disparity is the reportedoverheating of the electronic box when the batterywas low. The operators of the Reutech Midas PIMDand Fisher Impulse model detectors reported diffi-culty wearing the headsets under sultry conditions.In both cases the headsets were too tight; the ear
AD25AD26EB42EB53FI12FIIMFIXBFOMIGIATGUA2aGUA2bGUA2cGUA4GUA8aGUA8bGUA8cLGPRMICMMIMIPRMAREMISCANSCATSCMIVA16VAVMa*WH59WHAFWHSP
00100001022200000100000000020
10111202012211221221212111221
00000001000000000100000000000
00100011022200000100020100020
00201023000000000300010111000
00100002100000000200000000000
00000002101300000200000000020
Table 5.4 – IPPTC Configuration (5 cm Depth in Laterite Lane).
PMN(2)
DepectorTypes
TARGETS (number buried)PMN-2
(2)PMD-6
(2)G0
(4)I0(4)
M0
(4)Type 72
(2)
* WH59 detector has results for one run in the laterite soil (number of detections shown in the above table represents double ofthe first test run results).
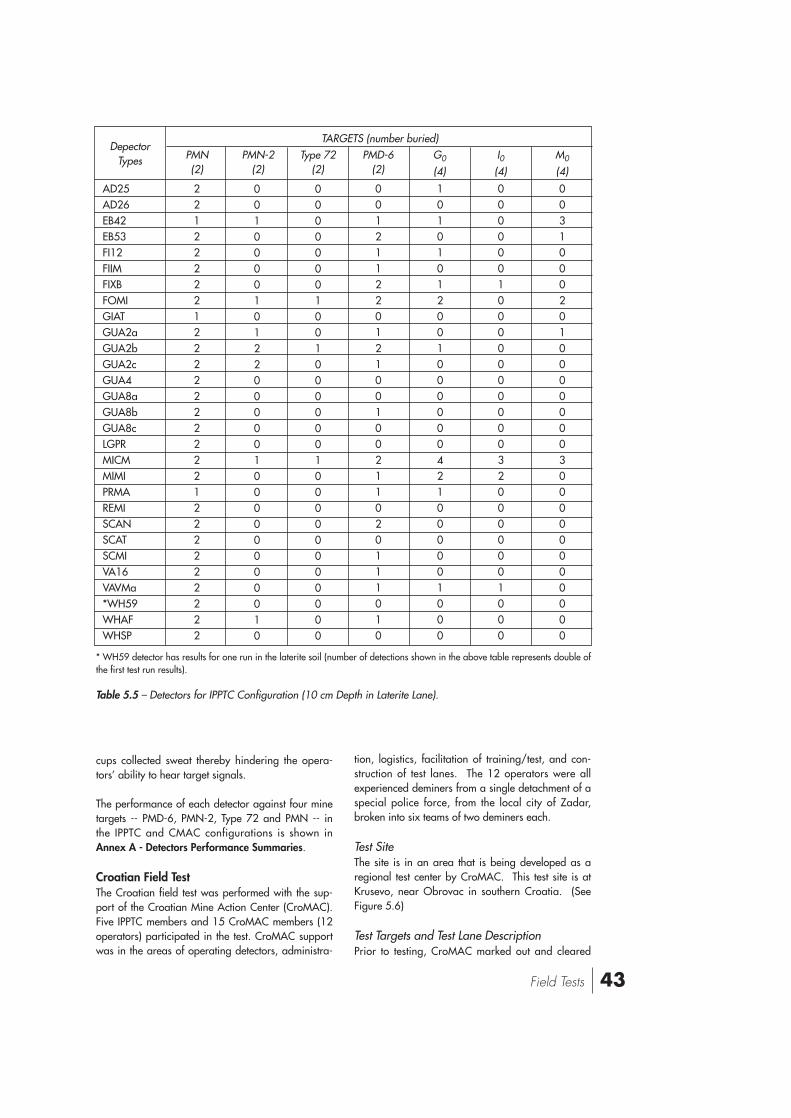
43Field Tests
cups collected sweat thereby hindering the opera-tors’ ability to hear target signals.
The performance of each detector against four minetargets -- PMD-6, PMN-2, Type 72 and PMN -- inthe IPPTC and CMAC configurations is shown inAnnex A - Detectors Performance Summaries.
Croatian Field TestThe Croatian field test was performed with the sup-port of the Croatian Mine Action Center (CroMAC).Five IPPTC members and 15 CroMAC members (12operators) participated in the test. CroMAC supportwas in the areas of operating detectors, administra-
tion, logistics, facilitation of training/test, and con-struction of test lanes. The 12 operators were allexperienced deminers from a single detachment of aspecial police force, from the local city of Zadar,broken into six teams of two deminers each.
Test SiteThe site is in an area that is being developed as aregional test center by CroMAC. This test site is atKrusevo, near Obrovac in southern Croatia. (SeeFigure 5.6)
Test Targets and Test Lane DescriptionPrior to testing, CroMAC marked out and cleared
AD25AD26EB42EB53FI12FIIMFIXBFOMIGIATGUA2aGUA2bGUA2cGUA4GUA8aGUA8bGUA8cLGPRMICMMIMIPRMAREMISCANSCATSCMIVA16VAVMa*WH59WHAFWHSP
22122222122222222221222222222
00100001012200000100000000010
00000001001000000100000000000
00121122012100100211020111010
10101012001000000421000001000
00000010000000000320000001000
00310002010000000300000000000
Table 5.5 – Detectors for IPPTC Configuration (10 cm Depth in Laterite Lane).
PMN(2)
DepectorTypes
TARGETS (number buried)PMN-2
(2)PMD-6
(2)G0
(4)I0(4)
M0
(4)Type 72
(2)
* WH59 detector has results for one run in the laterite soil (number of detections shown in the above table represents double ofthe first test run results).
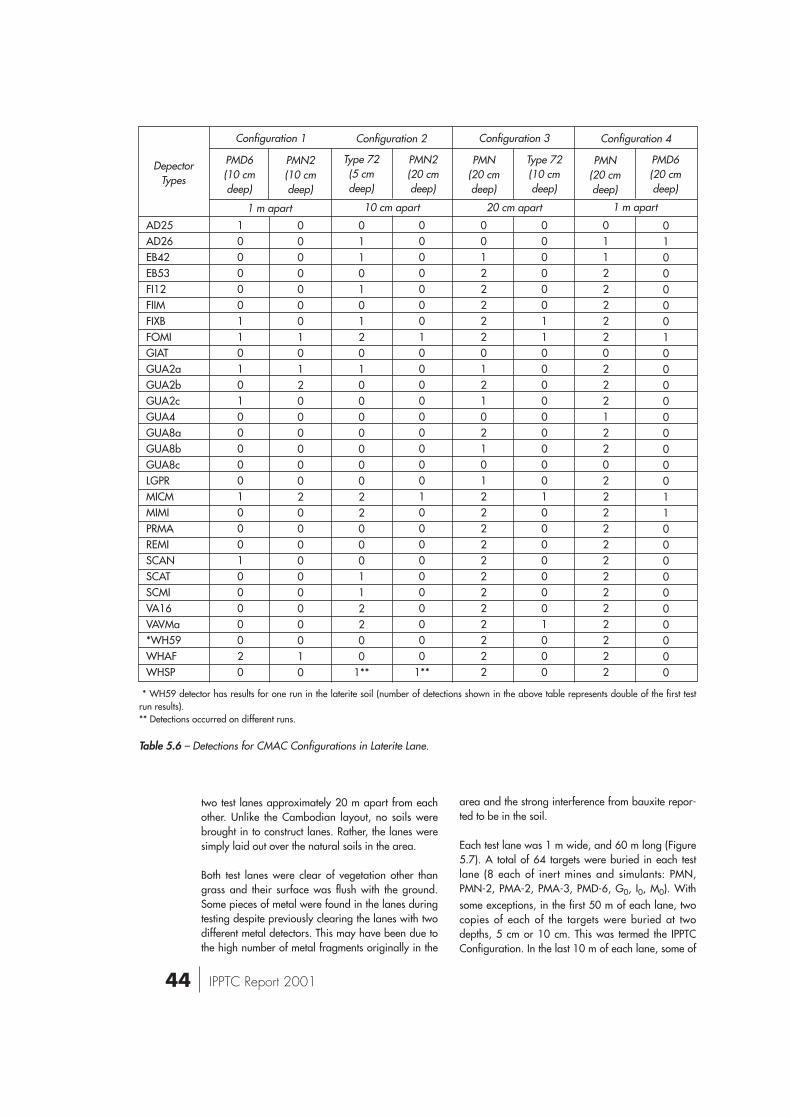
44 IPPTC Report 2001
two test lanes approximately 20 m apart from eachother. Unlike the Cambodian layout, no soils werebrought in to construct lanes. Rather, the lanes weresimply laid out over the natural soils in the area.
Both test lanes were clear of vegetation other thangrass and their surface was flush with the ground.Some pieces of metal were found in the lanes duringtesting despite previously clearing the lanes with twodifferent metal detectors. This may have been due tothe high number of metal fragments originally in the
area and the strong interference from bauxite repor-ted to be in the soil.
Each test lane was 1 m wide, and 60 m long (Figure5.7). A total of 64 targets were buried in each testlane (8 each of inert mines and simulants: PMN,PMN-2, PMA-2, PMA-3, PMD-6, G0, I0, M0). Withsome exceptions, in the first 50 m of each lane, twocopies of each of the targets were buried at twodepths, 5 cm or 10 cm. This was termed the IPPTCConfiguration. In the last 10 m of each lane, some of
AD25AD26EB42EB53FI12FIIMFIXBFOMIGIATGUA2aGUA2bGUA2cGUA4GUA8aGUA8bGUA8cLGPRMICMMIMIPRMAREMISCANSCATSCMIVA16VAVMa*WH59WHAFWHSP
10000011010100000100010000020
00000001012000000200000000010
0110101201000000022000112200
1**
0000000100000000010000000000
1**
00122222012102101222222222222
00000011000000000100000001000
01122222022212202222222222222
01000001000000000110000000000
Table 5.6 – Detections for CMAC Configurations in Laterite Lane.
PMD6(10 cmdeep)
PMD6(20 cmdeep)
PMN2(10 cmdeep)
Type 72(5 cmdeep)
PMN2(20 cmdeep)
PMN(20 cmdeep)
PMN(20 cmdeep)
Type 72(10 cmdeep)
DepectorTypes
Configuration 1 Configuration 2 Configuration 3 Configuration 4
1 m apart1 m apart 10 cm apart 20 cm apart
* WH59 detector has results for one run in the laterite soil (number of detections shown in the above table represents double of the first testrun results).** Detections occurred on different runs.
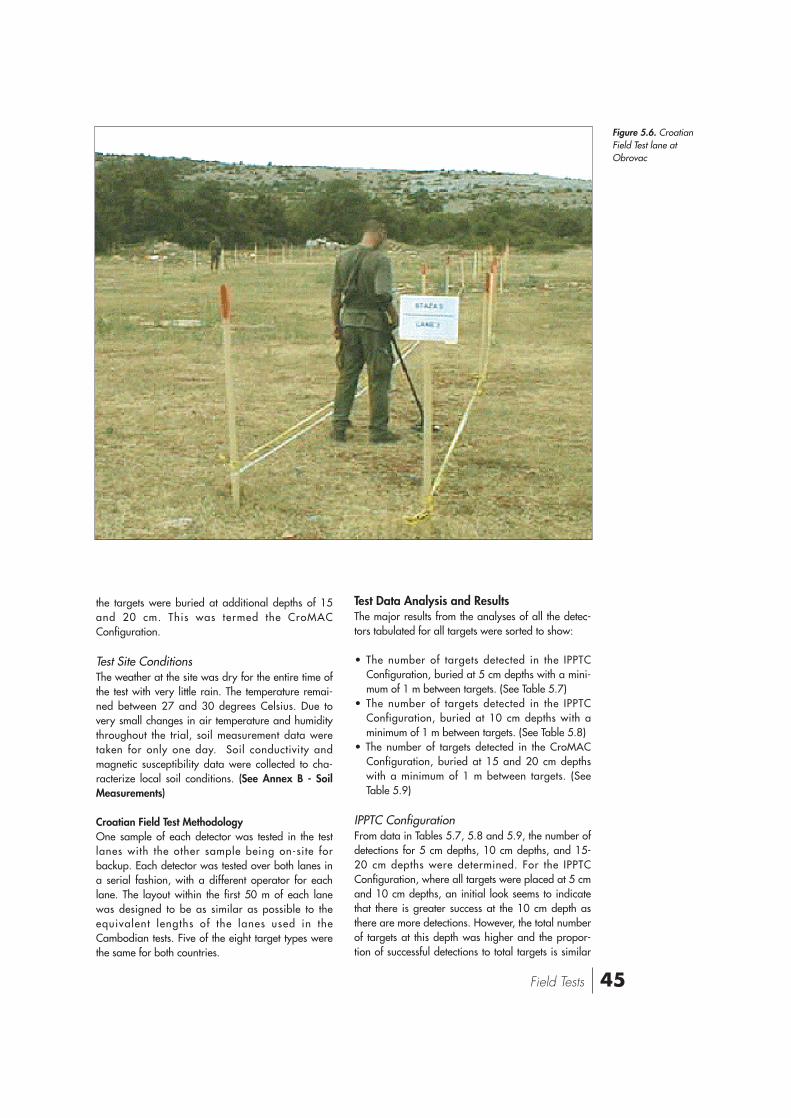
45Field Tests
the targets were buried at additional depths of 15and 20 cm. This was termed the CroMACConfiguration.
Test Site ConditionsThe weather at the site was dry for the entire time ofthe test with very little rain. The temperature remai-ned between 27 and 30 degrees Celsius. Due tovery small changes in air temperature and humiditythroughout the trial, soil measurement data weretaken for only one day. Soil conductivity andmagnetic susceptibility data were collected to cha-racterize local soil conditions. (See Annex B - SoilMeasurements)
Croatian Field Test MethodologyOne sample of each detector was tested in the testlanes with the other sample being on-site forbackup. Each detector was tested over both lanes ina serial fashion, with a different operator for eachlane. The layout within the first 50 m of each lanewas designed to be as similar as possible to theequivalent lengths of the lanes used in theCambodian tests. Five of the eight target types werethe same for both countries.
Test Data Analysis and ResultsThe major results from the analyses of all the detec-tors tabulated for all targets were sorted to show:
• The number of targets detected in the IPPTCConfiguration, buried at 5 cm depths with a mini-mum of 1 m between targets. (See Table 5.7)
• The number of targets detected in the IPPTCConfiguration, buried at 10 cm depths with aminimum of 1 m between targets. (See Table 5.8)
• The number of targets detected in the CroMACConfiguration, buried at 15 and 20 cm depthswith a minimum of 1 m between targets. (SeeTable 5.9)
IPPTC ConfigurationFrom data in Tables 5.7, 5.8 and 5.9, the number ofdetections for 5 cm depths, 10 cm depths, and 15-20 cm depths were determined. For the IPPTCConfiguration, where all targets were placed at 5 cmand 10 cm depths, an initial look seems to indicatethat there is greater success at the 10 cm depth asthere are more detections. However, the total numberof targets at this depth was higher and the propor-tion of successful detections to total targets is similar
Figure 5.6. CroatianField Test lane atObrovac
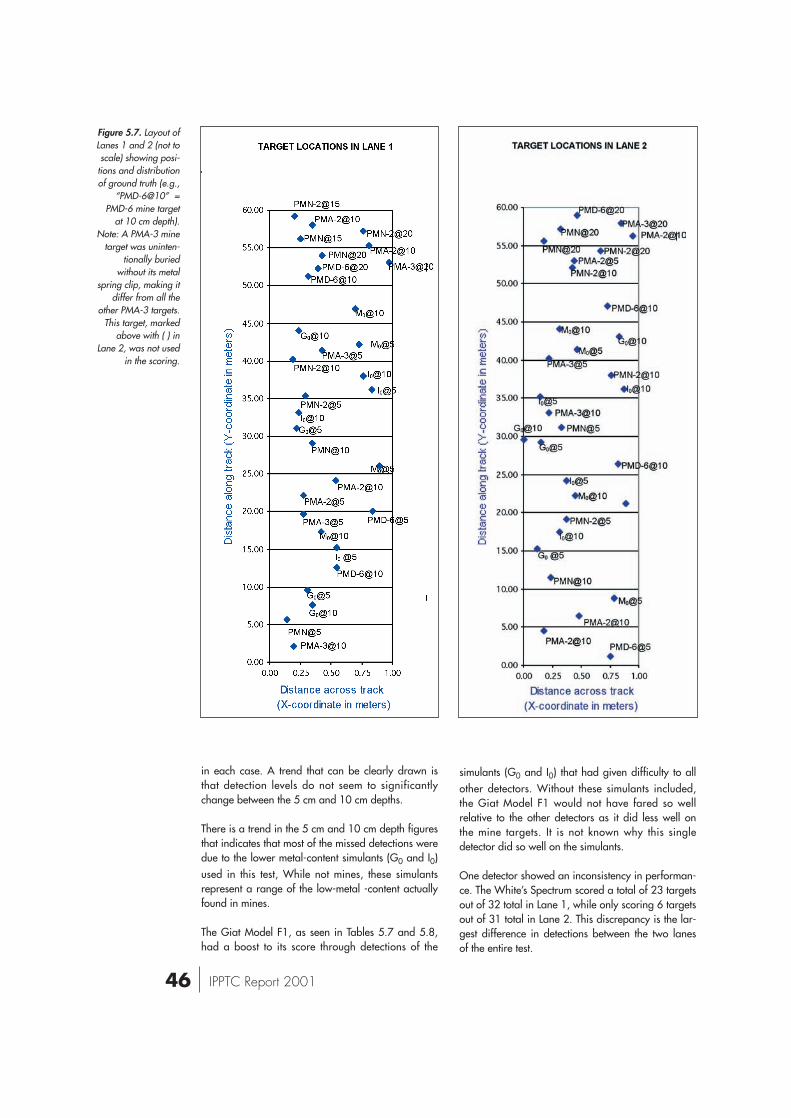
46 IPPTC Report 2001
in each case. A trend that can be clearly drawn isthat detection levels do not seem to significantlychange between the 5 cm and 10 cm depths.
There is a trend in the 5 cm and 10 cm depth figuresthat indicates that most of the missed detections weredue to the lower metal-content simulants (G0 and I0)used in this test, While not mines, these simulantsrepresent a range of the low-metal -content actuallyfound in mines.
The Giat Model F1, as seen in Tables 5.7 and 5.8,had a boost to its score through detections of the
simulants (G0 and I0) that had given difficulty to allother detectors. Without these simulants included,the Giat Model F1 would not have fared so wellrelative to the other detectors as it did less well onthe mine targets. It is not known why this singledetector did so well on the simulants.
One detector showed an inconsistency in performan-ce. The White’s Spectrum scored a total of 23 targetsout of 32 total in Lane 1, while only scoring 6 targetsout of 31 total in Lane 2. This discrepancy is the lar-gest difference in detections between the two lanesof the entire test.
Figure 5.7. Layout ofLanes 1 and 2 (not toscale) showing posi-
tions and distributionof ground truth (e.g.,
“PMD-6@10” =PMD-6 mine target
at 10 cm depth).Note: A PMA-3 mine
target was uninten-tionally buried
without its metalspring clip, making it
differ from all theother PMA-3 targets.
This target, markedabove with ( ) in
Lane 2, was not usedin the scoring.
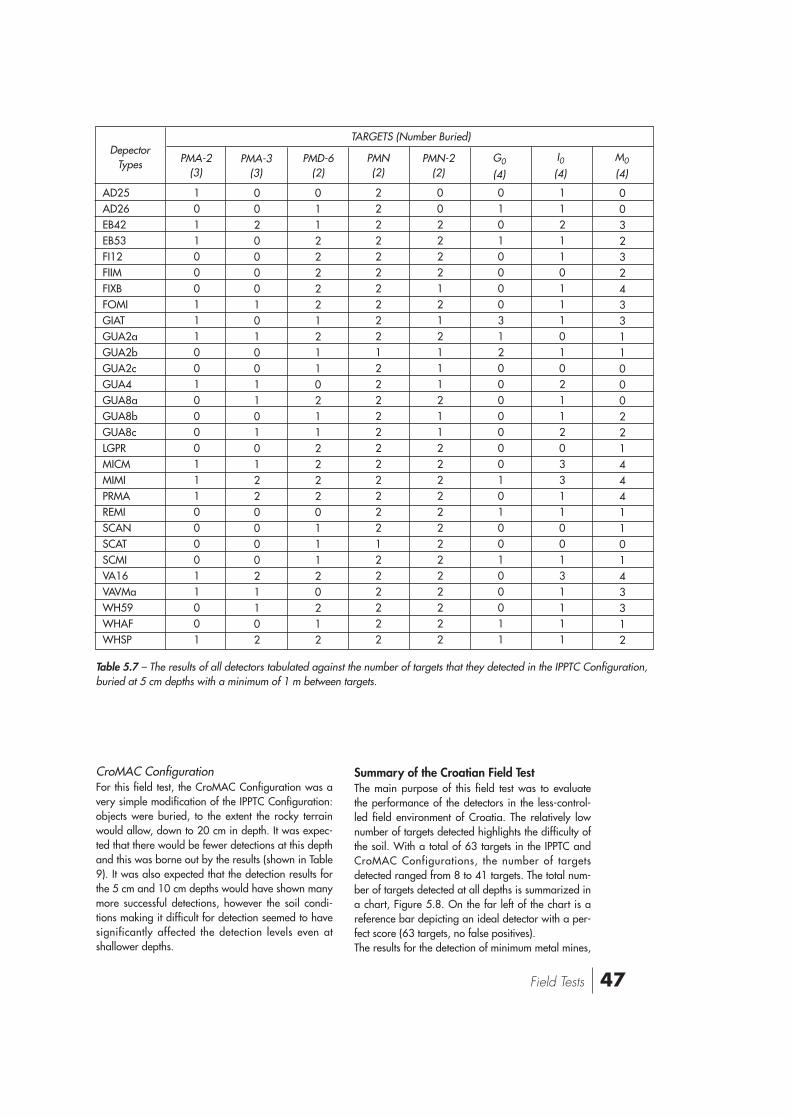
47Field Tests
CroMAC ConfigurationFor this field test, the CroMAC Configuration was avery simple modification of the IPPTC Configuration:objects were buried, to the extent the rocky terrainwould allow, down to 20 cm in depth. It was expec-ted that there would be fewer detections at this depthand this was borne out by the results (shown in Table9). It was also expected that the detection results forthe 5 cm and 10 cm depths would have shown manymore successful detections, however the soil condi-tions making it difficult for detection seemed to havesignificantly affected the detection levels even atshallower depths.
Summary of the Croatian Field TestThe main purpose of this field test was to evaluatethe performance of the detectors in the less-control-led field environment of Croatia. The relatively lownumber of targets detected highlights the difficulty ofthe soil. With a total of 63 targets in the IPPTC andCroMAC Configurations, the number of targetsdetected ranged from 8 to 41 targets. The total num-ber of targets detected at all depths is summarized ina chart, Figure 5.8. On the far left of the chart is areference bar depicting an ideal detector with a per-fect score (63 targets, no false positives).The results for the detection of minimum metal mines,
AD25AD26EB42EB53FI12FIIMFIXBFOMIGIATGUA2aGUA2bGUA2cGUA4GUA8aGUA8bGUA8cLGPRMICMMIMIPRMAREMISCANSCATSCMIVA16VAVMaWH59WHAFWHSP
10110001110010000111000011001
00200001010011010122000021102
01122222121102112222011120212
22222222221222222222221222222
00222212121112112222222222222
01010000312000000010100100011
11211011101021120331100131111
00323243311000221444110143312
Table 5.7 – The results of all detectors tabulated against the number of targets that they detected in the IPPTC Configuration,buried at 5 cm depths with a minimum of 1 m between targets.
PMA-2(3)
PMA-3(3)
PMN-2(2)
PMD-6(2)
PMN(2)
G0
(4)
I0(4)
M0
(4)
DepectorTypes
TARGETS (Number Buried)
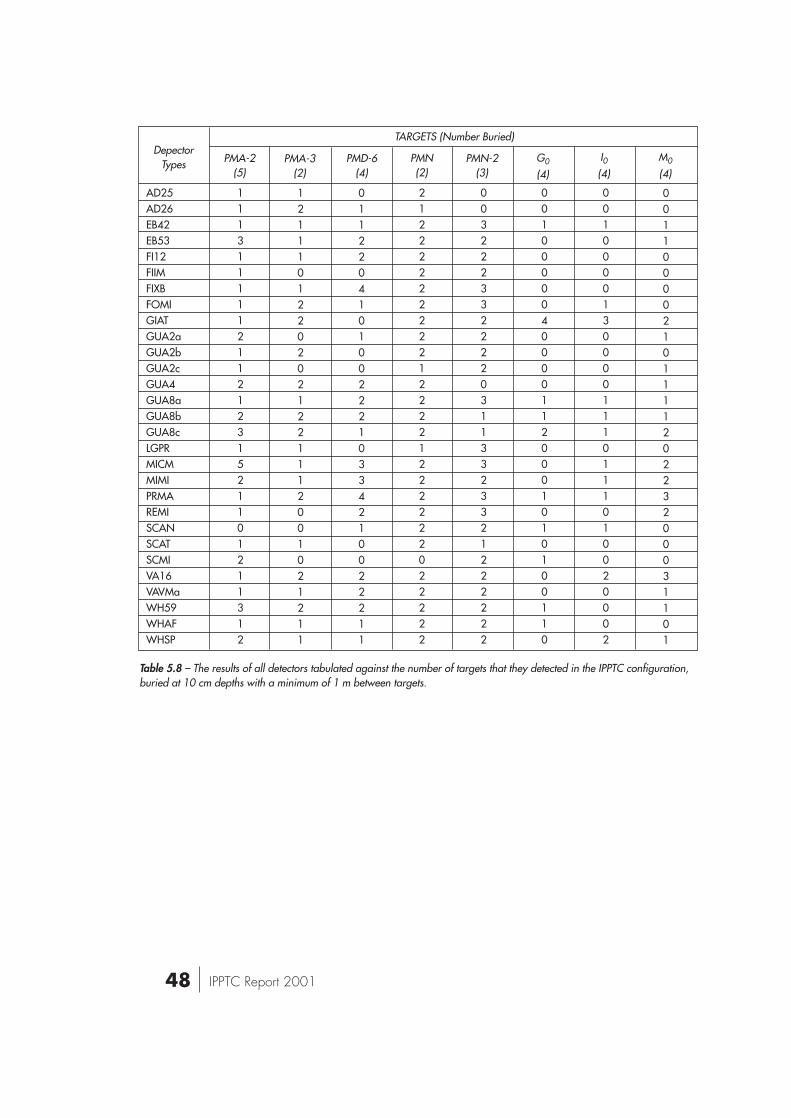
48 IPPTC Report 2001
AD25AD26EB42EB53FI12FIIMFIXBFOMIGIATGUA2aGUA2bGUA2cGUA4GUA8aGUA8bGUA8cLGPRMICMMIMIPRMAREMISCANSCATSCMIVA16VAVMaWH59WHAFWHSP
11131111121121231521101211312
12111012202021221112001021211
01122041010022210334210022211
21222222222122221222222022222
00322233222203113323321222222
00100000400001120001010100110
00100001300001110111010020002
00110000210111120223200031101
Table 5.8 – The results of all detectors tabulated against the number of targets that they detected in the IPPTC configuration,buried at 10 cm depths with a minimum of 1 m between targets.
PMA-2(5)
PMA-3(2)
PMN-2(3)
PMD-6(4)
PMN(2)
G0
(4)
I0(4)
M0
(4)
DepectorTypes
TARGETS (Number Buried)
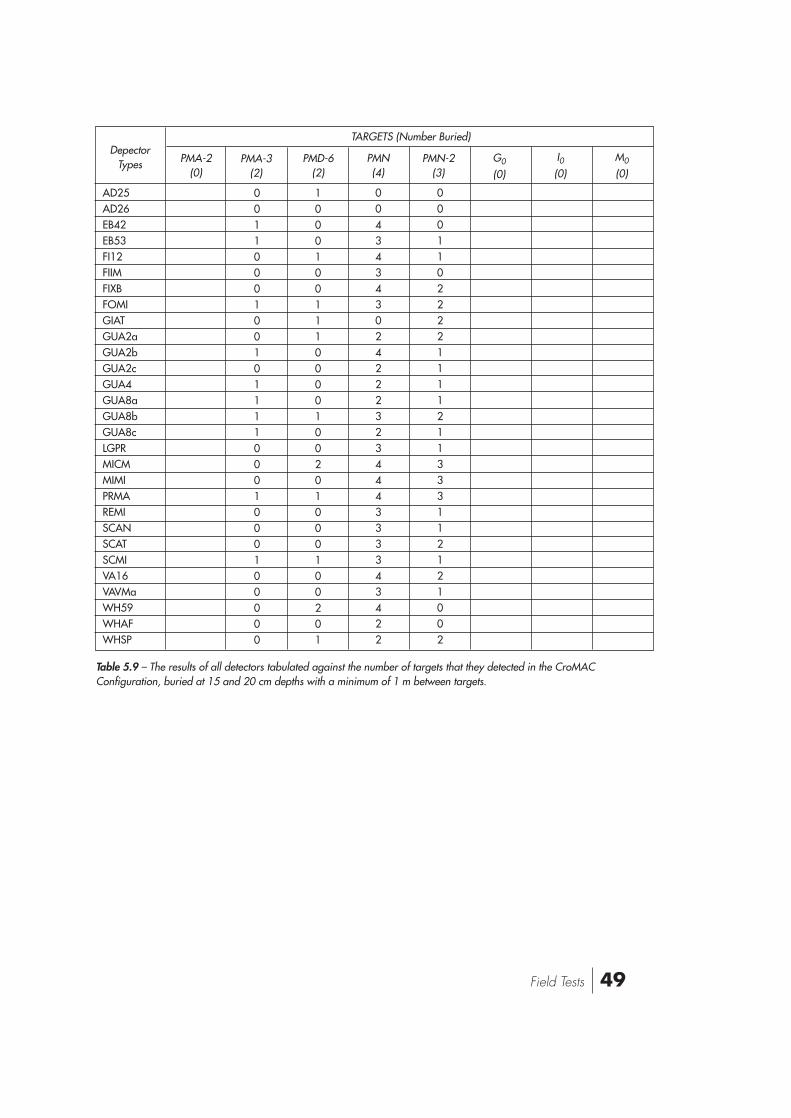
49Field Tests
AD25AD26EB42EB53FI12FIIMFIXBFOMIGIATGUA2aGUA2bGUA2cGUA4GUA8aGUA8bGUA8cLGPRMICMMIMIPRMAREMISCANSCATSCMIVA16VAVMaWH59WHAFWHSP
00110001001011110001000100000
10001001110000100201000100201
00434343024222323444333343422
00011022221111211333112121002
Table 5.9 – The results of all detectors tabulated against the number of targets that they detected in the CroMACConfiguration, buried at 15 and 20 cm depths with a minimum of 1 m between targets.
PMA-2(0)
PMA-3(2)
PMN-2(3)
PMD-6(2)
PMN(4)
G0
(0)
I0(0)
M0
(0)
DepectorTypes
TARGETS (Number Buried)
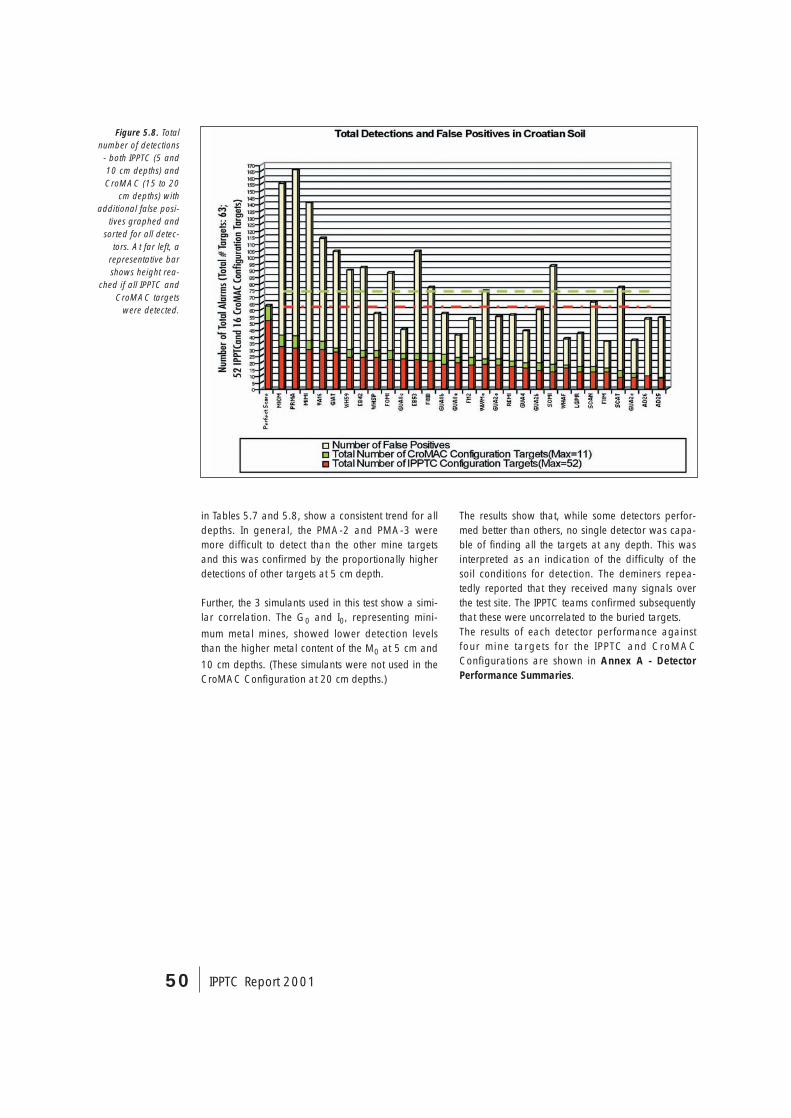
50 IPPTC Report 2001
in Tables 5.7 and 5.8, show a consistent trend for alldepths. In general, the PMA-2 and PMA-3 weremore difficult to detect than the other mine targetsand this was confirmed by the proportionally higherdetections of other targets at 5 cm depth.
Further, the 3 simulants used in this test show a simi-lar correlation. The G0 and I0, representing mini-mum metal mines, showed lower detection levelsthan the higher metal content of the M0 at 5 cm and10 cm depths. (These simulants were not used in theCroMAC Configuration at 20 cm depths.)
The results show that, while some detectors perfor-med better than others, no single detector was capa-ble of finding all the targets at any depth. This wasinterpreted as an indication of the difficulty of thesoil conditions for detection. The deminers repea-tedly reported that they received many signals overthe test site. The IPPTC teams confirmed subsequentlythat these were uncorrelated to the buried targets.The results of each detector performance againstfour mine targets for the IPPTC and CroMACConfigurations are shown in Annex A - DetectorPerformance Summaries.
Figure 5.8. Totalnumber of detections- both IPPTC (5 and10 cm depths) andCroMAC (15 to 20
cm depths) withadditional false posi-
tives graphed andsorted for all detec-
tors. At far left, arepresentative barshows height rea-
ched if all IPPTC andCroMAC targets
were detected.

51Human Factors Assessment
This section summarizes the results of the HumanFactors Assessment conducted during theInternational Pi lot Project for TechnologyCooperation. It is derived from the full technicalreport [7].
The Human Factors laboratory assessment was car-ried out at the Defence Research EstablishmentSuffield (DRES), Alberta, Canada. Field assessmentswere conducted within the tests in Cambodia andCroatia.
ObjectiveThe objective of the Human Factors Assessment wasto evaluate the ergonomic aspects of the detectors,and determine their level of suitability for humanita-rian demining operations.
In contrast to many consumer products intended foreveryday use by the general public, the consequen-ces of poor ergonomics in the context of humanita-rian demining are rather more severe. For example,an incomplete understanding on the part of the userof how the demining equipment functions, or theadjustment of the wrong control could easily lead tofailure to detect an anti-personnel mine by the demi-ner – possibly resulting in severe or even fatal injury.
Laboratory AssessmentA human factors assessment of the metal detectorswas conducted by DERA Centre for Human Sciences(CHS), and Subject Matter Experts (SMEs) on thetopic of humanitarian demining. The Guartel MD8and 2000 were both assessed as single detectors,even though they contained multiple detector heads.The necessary steps to be followed, in order to use adetector were analyzed to provide a baselinedescription of the demining task (Figure 6.1). Thistask description formed the basis of a systematicassessment of each detector. The subtasks and asso-ciated questions were drawn together in the form ofthe Usability Assessment Questionnaire, which wasfollowed by the SMEs over the course of each eva-
luation. The purpose of the Usability AssessmentQuestionnaire was to evaluate, systematically andcomprehensively, each detector in a consistent man-ner. Whilst the primary task was to capture the fulldetail of the assessment for each detector, a secon-dary requirement was to support a top-level compa-rison between detectors.The following topics were considered in the labora-tory assessment:• Suitability for prolonged use• Simplicity of functions• Robustness and weatherproofing of equipment• Suitability of transit and field casings• Type and amount of feedback to user (audio and
visual)• Adequacy of basic controls• Batteries/power supply
Field AssessmentSubjective data was collected at both field trials(Cambodia and Croatia) using a questionnaire pre-pared by the CHS and SMEs. The field trials consisted of a small number of userstesting between two and four detectors each. Thesmall sample size of responses to the questionnairefor each detector means that statistical analysis can-not be applied to the findings. Comparisons betweenresponses must be treated cautiously due to the indi-vidual preferences, tendencies and biases that wereinevitably present within the sample of users. Thiscomparison did allow support for the laboratory fin-dings to be identified from the field trials data wherethere was agreement between them. Also, this pro-cess allowed differences or contradictions betweenthe laboratory and field trials to be highlighted (seeTable 6.1 under “Notes- Lab. Assessments andNotes- Field Trials”).
ResultsTable 6.1 summarizes the laboratory and field asses-sments.Table 6.2 summarizes the laboratory assessments forpracticality, simplicity and usability. For each
6. Human Factors Assessment
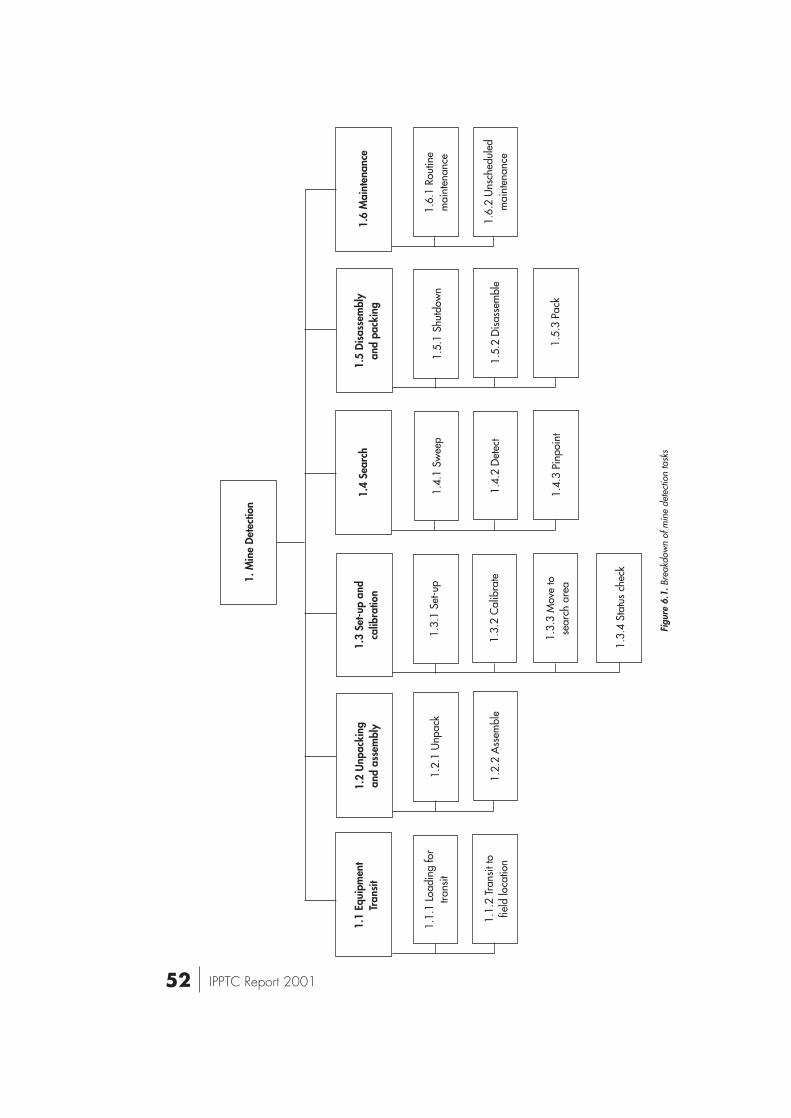
52 IPPTC Report 2001
1. M
ine
Det
ectio
n
1.1
Equi
pmen
tTr
ansi
t
1.1.
1 Lo
adin
g fo
rtra
nsit
1.2.
1 U
npac
k1.
3.1
Set-u
p1.
4.1
Swee
p1.
5.1
Shut
dow
n1.
6.1
Rout
ine
mai
nten
ance
1.6.
2 U
nsch
edul
edm
aint
enan
ce1.
5.2
Dis
asse
mbl
e
1.5.
3 Pa
ck
1.4.
2 D
etec
t
1.4.
3 Pi
npoi
nt
1.3.
2 C
alib
rate
1.3.
4 St
atus
che
ck
1.3.
3 M
ove
tose
arch
are
a
1.2.
2 A
ssem
ble
1.1.
2 Tr
ansi
t to
field
loca
tion
1.2
Unp
acki
ngan
d as
sem
bly
1.3
Set-u
p an
dca
libra
tion
1.5
Dis
asse
mbl
yan
d pa
ckin
g1.
4 Se
arch
1.6
Mai
nten
ance
Figu
re 6
.1.B
reak
dow
n of
min
e de
tect
ion
task
s
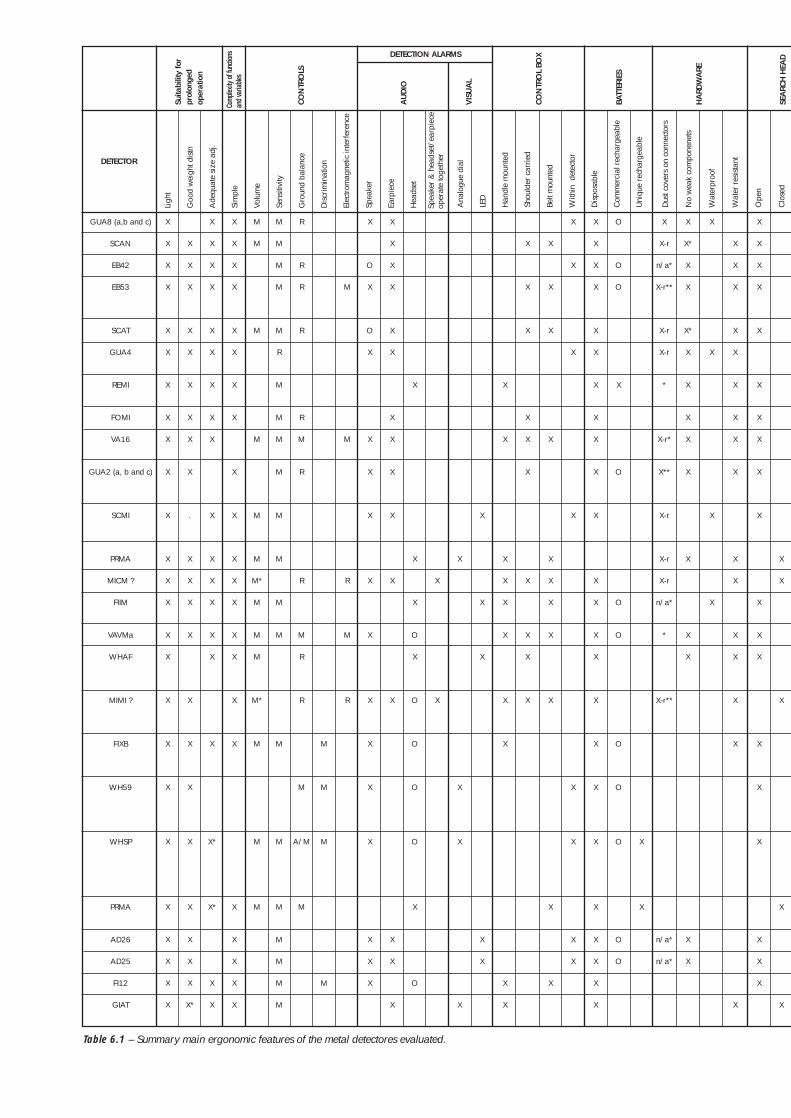
Table 6.1 – Summary main ergonomic features of the metal detectores evaluated.
X
X
X
X
X
X
X
X
X
X
X
X
X
X
X
X
X
X
X
X
X
X
X
X
X
X
X
X
X
X
X
X
X
X
.
X
X
X
X
X
X
X
X
X
X
X
X
X*
X
X
X
X
X
X
X
X
X
X
X
X
X
X
X
X
X*
X*
X
X
X
X
X
X
X
X
X
X
X
X
X
X
X
X
X
X
X
X
X
X
X
X
M
M
M
M
M
M
M*
M
M
M
M*
M
M
M
M
M
M
M
M
R
M
M
M
M
M
M
M
M
M
M
M
M
M
M
M
R
R
R
R
R
M
R
R
M
R
R
M
A/M
M
M
M
M
M
M
M
R
M
R
X
O
X
O
X
X
X
X
X
X
X
X
X
X
X
X
X
X
X
X
X
X
X
X
X
X
X
X
X
X
X
X
X
X
X
O
X
O
O
O
O
X
O
X
X
X
X
X
X
X
X
X
X
X
X
X
X
X
X
X
X
X
X
X
X
X
X
X
X
X
X
X
X
X
X
X
X
X
X
X
X
X
X
X
X
X
X
X
X
X
X
X
X
X
X
X
X
X
X
X
X
X
X
X
X
X
X
X
X
X
X
X
X
O
O
O
X
O
O
O
O
O
O
O
O
X
X
X
X-r
n/a*
X-r**
X-r
X-r
*
X-r*
X**
X-r
X-r
X-r
n/a*
*
X-r**
n/a*
n/a*
X
X*
X
X
X*
X
X
X
X
X
X
X
X
X
X
X
X
X
X
X
X
X
X
X
X
X
X
X
X
X
X
X
X
X
X
X
X
X
X
X
X
X
X
X
X
X
X
X
X
X
X
X
X
X
X
X
X
X
X
X
X
X
X
GUA8 (a,b and c)
SCAN
EB42
EB53
SCAT
GUA4
REMI
FOMI
VA16
GUA2 (a, b and c)
SCMI
PRMA
MICM ?
FIIM
VAVMa
WHAF
MIMI ?
FIXB
WH59
WHSP
PRMA
AD26
AD25
FI12
GIAT
Ligh
t
Goo
d w
eigh
t dis
tn
Ade
quat
e si
ze a
dj.
Sim
ple
Volu
me
Sens
itivi
ty
Gro
und
bala
nce
Dis
crim
inat
ion
Elec
trom
agne
tic in
terf
eren
ce
Spea
ker
Earp
iece
Hea
dset
Ana
logu
e di
al
LED
Han
dle
mou
nted
Shou
lder
car
ried
Belt
mou
nted
With
in d
etec
tor
Dis
posa
ble
Com
mer
cial
rec
harg
eabl
e
Uni
que
rech
arge
able
Dus
t cov
ers
on c
onne
ctor
s
No
wea
k co
mpo
nene
ts
Wat
erpr
oof
Wat
er r
esis
tant
Ope
n
Clo
sed
Spea
ker
& h
eads
et/e
arpi
ece
oper
ate
toge
ther
CON
TRO
LS
CON
TRO
L BO
X
BATT
ERIE
S
HA
RDW
ARE
SEA
RCH
HEA
D
AU
DIO
VIS
UA
L
Comp
lexity
of fu
nctio
nsan
d var
iables
Suita
bilit
y fo
rpr
olon
ged
oper
atio
n
DETECTION ALARMS
DETECTOR
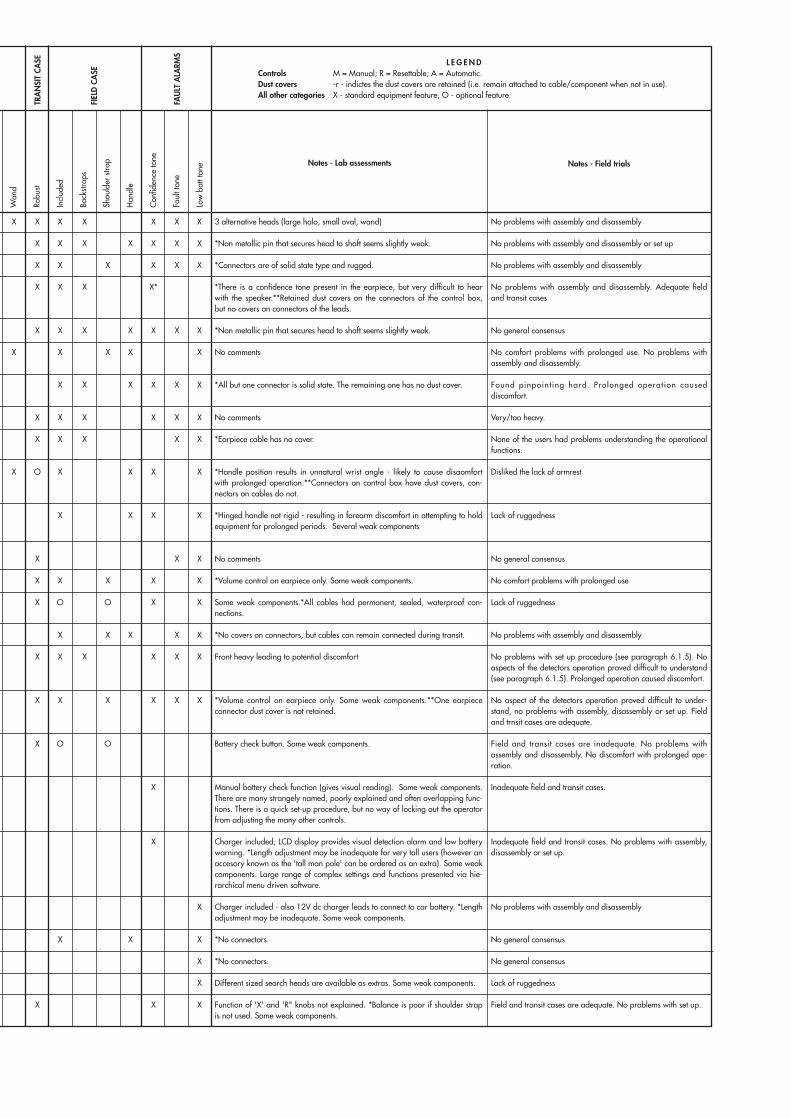
No problems with assembly and disassembly
No problems with assembly and disassembly or set up
No problems with assembly and disassembly
No problems with assembly and disassembly. Adequate fieldand transit cases
No general consensus
No comfort problems with prolonged use. No problems withassembly and disassembly.
Found pinpointing hard. Prolonged operation causeddiscomfort.
Very/too heavy.
None of the users had problems understanding the operationalfunctions.
Disliked the lack of armrest
Lack of ruggedness
No general consensus
No comfort problems with prolonged use
Lack of ruggedness
No problems with assembly and disassembly
No problems with set up procedure (see paragraph 6.1.5). Noaspects of the detectors operation proved difficult to understand(see paragraph 6.1.5). Prolonged operation caused discomfort.
No aspect of the detectors operation proved difficult to under-stand, no problems with assembly, disassembly or set up. Fieldand trnsit cases are adequate.
Field and transit cases are inadequate. No problems withassembly and disassembly. No discomfort with prolonged ope-ration.
Inadequate field and transit cases.
Inadequate field and transit cases. No problems with assembly,disassembly or set up.
No problems with assembly and disassembly
No general consensus
No general consensus
Lack of ruggedness
Field and transit cases are adequate. No problems with set up.
3 alternative heads (large halo, small oval, wand)
*Non metallic pin that secures head to shaft seems slightly weak.
*Connectors are of solid state type and rugged.
*There is a confidence tone present in the earpiece, but very difficult to hearwith the speaker.**Retained dust covers on the connectors of the control box,but no covers on connectors of the leads.
*Non metallic pin that secures head to shaft seems slightly weak.
No comments
*All but one connector is solid state. The remaining one has no dust cover.
No comments
*Earpiece cable has no cover.
*Handle position results in unnatural wrist angle - likely to cause disaomfortwith prolonged operation.**Connectors on control box have dust covers, con-nectors on cables do not.
*Hinged handle not rigid - resulting in forearm discomfort in attempting to holdequipment for prolonged periods. Several weak components
No comments
*Volume control on earpiece only. Some weak components.
Some weak components.*All cables had permanent, sealed, waterproof con-nections.
*No covers on connectors, but cables can remain connected during transit.
Front heavy leading to potential discomfort
*Volume control on earpiece only. Some weak components.**One earpiececonnector dust cover is not retained.
Battery check button. Some weak components.
Manual battery check function (gives visual reading). Some weak components.There are many strangely named, poorly explained and often overlapping func-tions. There is a quick set-up procedure, but no way of locking out the operatorfrom adjusting the many other controls.
Charger included; LCD display provides visual detection alarm and low batterywarning. *Length adjustment may be inadequate for very tall users (however anaccesory known as the 'tall man pole' can be ordered as an extra). Some weakcomponents. Large range of complex settings and functions presented via hie-rarchical menu driven software.
Charger included - also 12V dc charger leads to connect to car battery. *Lengthadjustment may be inadequate. Some weak components.
*No connectors.
*No connectors.
Different sized search heads are available as extras. Some weak components.
Function of 'X' and 'R" knobs not explained. *Balance is poor if shoulder strapis not used. Some weak components.
X
X
X
X
X
X
X
X
X
X
O
X
X
X
X
X
X
X
X
X
X
X
X
X
X
X
X
X
X
X
O
X
X
X
O
X
X
X
X
X
X
X
X
X
X
X
X
O
X
X
O
X
X
X
X
X
X
X
X
X
X
X
X*
X
X
X
X
X
X
X
X
X
X
X
X
X
X
X
X
X
X
X
X
X
X
X
X
X
X
X
X
X
X
X
X
X
X
X
X
X
X
X
X
X
X
X
X
Wan
d
Robu
st
Incl
uded
Back
strap
s
Shou
lder
stra
p
Han
dle
Con
fiden
ce to
ne
Faul
t ton
e
Low
bat
t ton
e
TRA
NSI
T CA
SE
FAU
LT A
LARM
S
FIEL
D C
ASE
Notes - Lab assessments Notes - Field trials
L E G E N DControls M = Manual; R = Resettable; A = Automatic.Dust covers -r - indictes the dust covers are retained (i.e. remain attached to cable/component when not in use).All other categories X - standard equipment feature, O - optional feature.
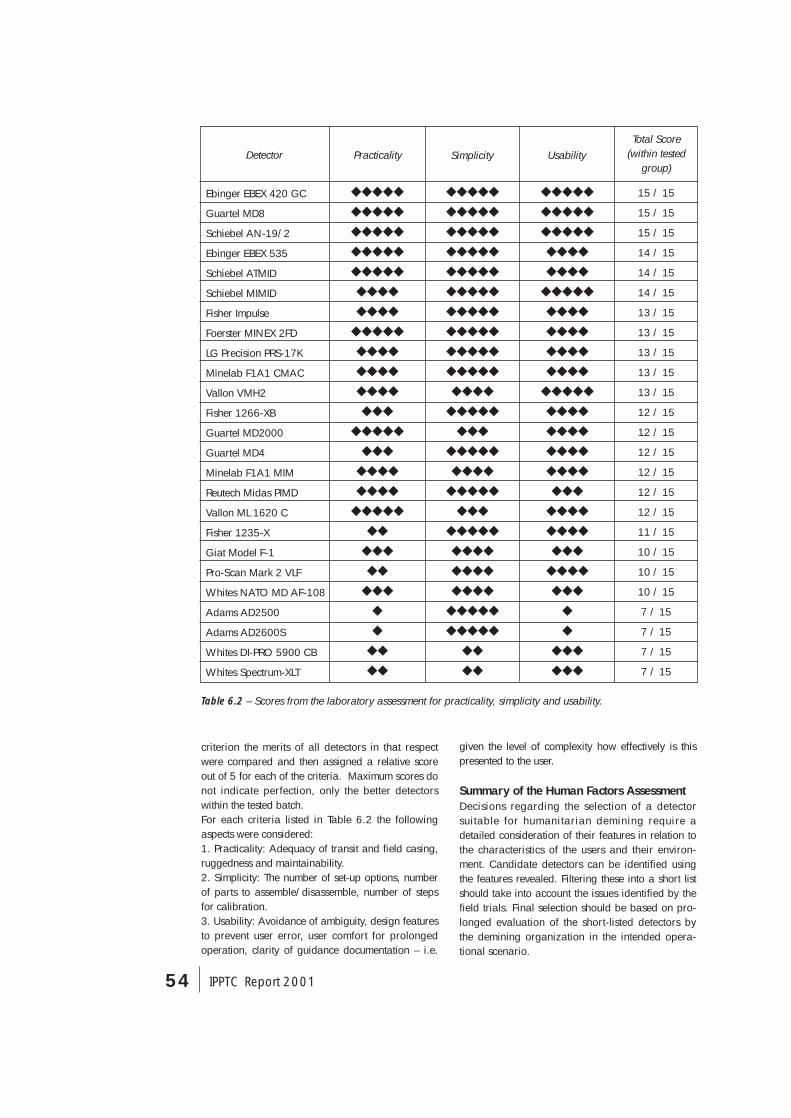
54 IPPTC Report 2001
criterion the merits of all detectors in that respectwere compared and then assigned a relative scoreout of 5 for each of the criteria. Maximum scores donot indicate perfection, only the better detectorswithin the tested batch.For each criteria listed in Table 6.2 the followingaspects were considered:1. Practicality: Adequacy of transit and field casing,ruggedness and maintainability.2. Simplicity: The number of set-up options, numberof parts to assemble/disassemble, number of stepsfor calibration.3. Usability: Avoidance of ambiguity, design featuresto prevent user error, user comfort for prolongedoperation, clarity of guidance documentation – i.e.
given the level of complexity how effectively is thispresented to the user.
Summary of the Human Factors AssessmentDecisions regarding the selection of a detectorsuitable for humanitarian demining require adetailed consideration of their features in relation tothe characteristics of the users and their environ-ment. Candidate detectors can be identified usingthe features revealed. Filtering these into a short listshould take into account the issues identified by thefield trials. Final selection should be based on pro-longed evaluation of the short-listed detectors bythe demining organization in the intended opera-tional scenario.
Ebinger EBEX 420 GC
Guartel MD8
Schiebel AN-19/2
Ebinger EBEX 535
Schiebel ATMID
Schiebel MIMID
Fisher Impulse
Foerster MINEX 2FD
LG Precision PRS-17K
Minelab F1A1 CMAC
Vallon VMH2
Fisher 1266-XB
Guartel MD2000
Guartel MD4
Minelab F1A1 MIM
Reutech Midas PIMD
Vallon ML 1620 C
Fisher 1235-X
Giat Model F-1
Pro-Scan Mark 2 VLF
Whites NATO MD AF-108
Adams AD2500
Adams AD2600S
Whites DI-PRO 5900 CB
Whites Spectrum-XLT
�����
�����
�����
�����
�����
����
����
�����
����
����
����
���
�����
���
����
����
�����
��
���
��
���
�
�
��
��
�����
�����
�����
�����
�����
�����
�����
�����
�����
�����
����
�����
���
�����
����
�����
���
�����
����
����
����
�����
�����
��
��
�����
�����
�����
����
����
�����
����
����
����
����
�����
����
����
����
����
���
����
����
���
����
���
�
�
���
���
15 / 15
15 / 15
15 / 15
14 / 15
14 / 15
14 / 15
13 / 15
13 / 15
13 / 15
13 / 15
13 / 15
12 / 15
12 / 15
12 / 15
12 / 15
12 / 15
12 / 15
11 / 15
10 / 15
10 / 15
10 / 15
7 / 15
7 / 15
7 / 15
7 / 15
Practicality Simplicity UsabilityTotal Score
(within testedgroup)
Detector
Table 6.2 – Scores from the laboratory assessment for practicality, simplicity and usability.
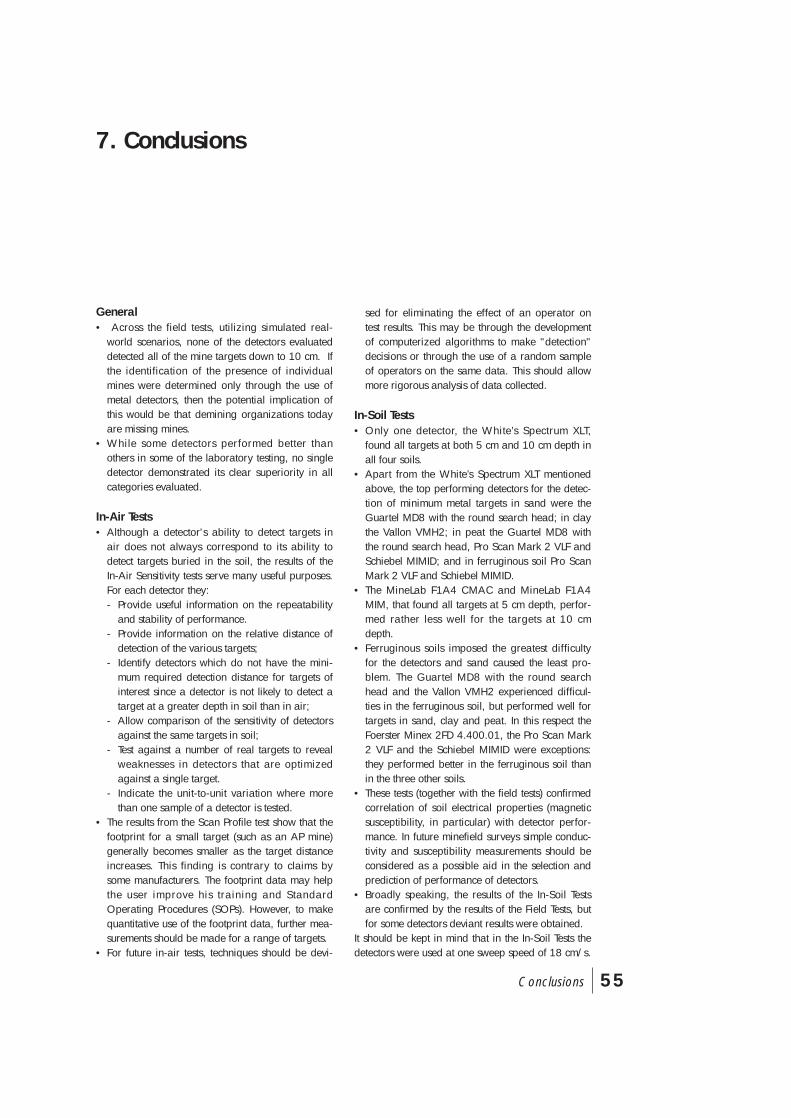
55Conclusions
General• Across the field tests, utilizing simulated real-
world scenarios, none of the detectors evaluateddetected all of the mine targets down to 10 cm. Ifthe identification of the presence of individualmines were determined only through the use ofmetal detectors, then the potential implication ofthis would be that demining organizations todayare missing mines.
• While some detectors performed better thanothers in some of the laboratory testing, no singledetector demonstrated its clear superiority in allcategories evaluated.
In-Air Tests• Although a detector's ability to detect targets in
air does not always correspond to its ability todetect targets buried in the soil, the results of theIn-Air Sensitivity tests serve many useful purposes.For each detector they:- Provide useful information on the repeatability
and stability of performance. - Provide information on the relative distance of
detection of the various targets; - Identify detectors which do not have the mini-
mum required detection distance for targets ofinterest since a detector is not likely to detect atarget at a greater depth in soil than in air;
- Allow comparison of the sensitivity of detectorsagainst the same targets in soil;
- Test against a number of real targets to revealweaknesses in detectors that are optimizedagainst a single target.
- Indicate the unit-to-unit variation where morethan one sample of a detector is tested.
• The results from the Scan Profile test show that thefootprint for a small target (such as an AP mine)generally becomes smaller as the target distanceincreases. This finding is contrary to claims bysome manufacturers. The footprint data may helpthe user improve his training and StandardOperating Procedures (SOPs). However, to makequantitative use of the footprint data, further mea-surements should be made for a range of targets.
• For future in-air tests, techniques should be devi-
sed for eliminating the effect of an operator ontest results. This may be through the developmentof computerized algorithms to make "detection"decisions or through the use of a random sampleof operators on the same data. This should allowmore rigorous analysis of data collected.
In-Soil Tests• Only one detector, the White’s Spectrum XLT,
found all targets at both 5 cm and 10 cm depth inall four soils.
• Apart from the White’s Spectrum XLT mentionedabove, the top performing detectors for the detec-tion of minimum metal targets in sand were theGuartel MD8 with the round search head; in claythe Vallon VMH2; in peat the Guartel MD8 withthe round search head, Pro Scan Mark 2 VLF andSchiebel MIMID; and in ferruginous soil Pro ScanMark 2 VLF and Schiebel MIMID.
• The MineLab F1A4 CMAC and MineLab F1A4MIM, that found all targets at 5 cm depth, perfor-med rather less well for the targets at 10 cmdepth.
• Ferruginous soils imposed the greatest difficultyfor the detectors and sand caused the least pro-blem. The Guartel MD8 with the round searchhead and the Vallon VMH2 experienced difficul-ties in the ferruginous soil, but performed well fortargets in sand, clay and peat. In this respect theFoerster Minex 2FD 4.400.01, the Pro Scan Mark2 VLF and the Schiebel MIMID were exceptions:they performed better in the ferruginous soil thanin the three other soils.
• These tests (together with the field tests) confirmedcorrelation of soil electrical properties (magneticsusceptibility, in particular) with detector perfor-mance. In future minefield surveys simple conduc-tivity and susceptibility measurements should beconsidered as a possible aid in the selection andprediction of performance of detectors.
• Broadly speaking, the results of the In-Soil Testsare confirmed by the results of the Field Tests, butfor some detectors deviant results were obtained.
It should be kept in mind that in the In-Soil Tests thedetectors were used at one sweep speed of 18 cm/s.
7. Conclusions
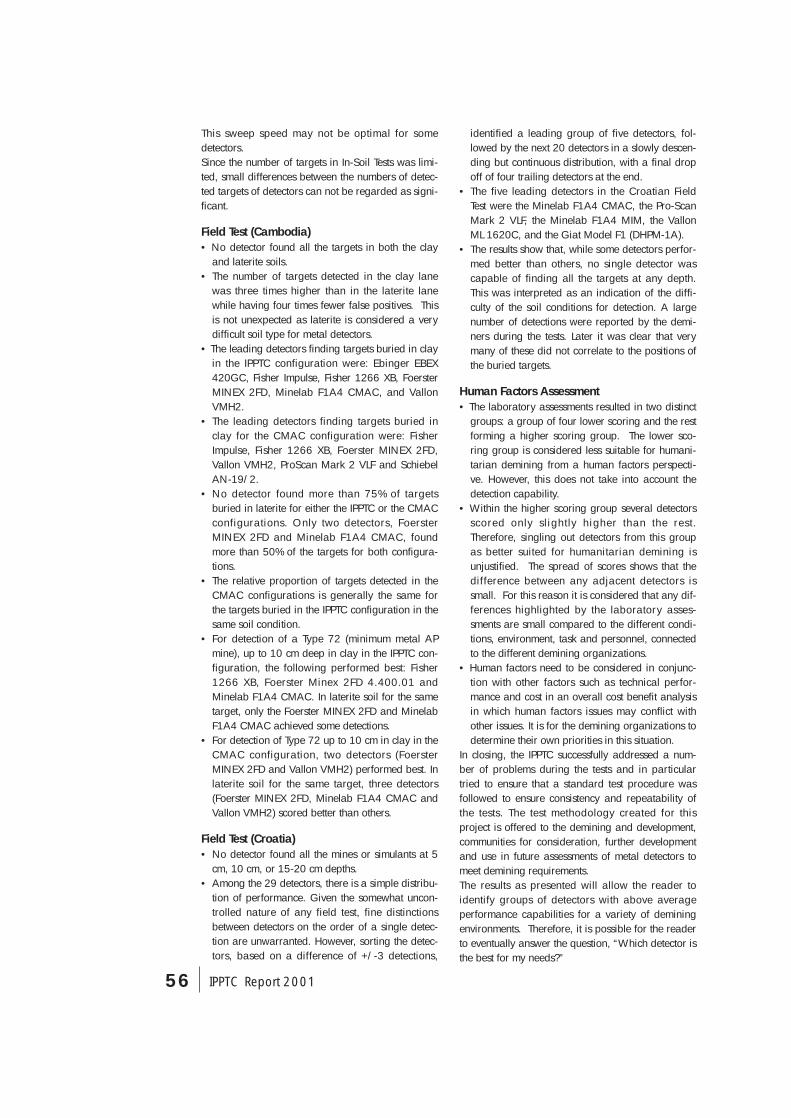
56 IPPTC Report 2001
This sweep speed may not be optimal for somedetectors.Since the number of targets in In-Soil Tests was limi-ted, small differences between the numbers of detec-ted targets of detectors can not be regarded as signi-ficant.
Field Test (Cambodia)• No detector found all the targets in both the clay
and laterite soils.• The number of targets detected in the clay lane
was three times higher than in the laterite lanewhile having four times fewer false positives. Thisis not unexpected as laterite is considered a verydifficult soil type for metal detectors.
• The leading detectors finding targets buried in clayin the IPPTC configuration were: Ebinger EBEX420GC, Fisher Impulse, Fisher 1266 XB, FoersterMINEX 2FD, Minelab F1A4 CMAC, and VallonVMH2.
• The leading detectors finding targets buried inclay for the CMAC configuration were: FisherImpulse, Fisher 1266 XB, Foerster MINEX 2FD,Vallon VMH2, ProScan Mark 2 VLF and SchiebelAN-19/2.
• No detector found more than 75% of targetsburied in laterite for either the IPPTC or the CMACconfigurations. Only two detectors, FoersterMINEX 2FD and Minelab F1A4 CMAC, foundmore than 50% of the targets for both configura-tions.
• The relative proportion of targets detected in theCMAC configurations is generally the same forthe targets buried in the IPPTC configuration in thesame soil condition.
• For detection of a Type 72 (minimum metal APmine), up to 10 cm deep in clay in the IPPTC con-figuration, the following performed best: Fisher1266 XB, Foerster Minex 2FD 4.400.01 andMinelab F1A4 CMAC. In laterite soil for the sametarget, only the Foerster MINEX 2FD and MinelabF1A4 CMAC achieved some detections.
• For detection of Type 72 up to 10 cm in clay in theCMAC configuration, two detectors (FoersterMINEX 2FD and Vallon VMH2) performed best. Inlaterite soil for the same target, three detectors(Foerster MINEX 2FD, Minelab F1A4 CMAC andVallon VMH2) scored better than others.
Field Test (Croatia)• No detector found all the mines or simulants at 5
cm, 10 cm, or 15-20 cm depths.• Among the 29 detectors, there is a simple distribu-
tion of performance. Given the somewhat uncon-trolled nature of any field test, fine distinctionsbetween detectors on the order of a single detec-tion are unwarranted. However, sorting the detec-tors, based on a difference of +/-3 detections,
identified a leading group of five detectors, fol-lowed by the next 20 detectors in a slowly descen-ding but continuous distribution, with a final dropoff of four trailing detectors at the end.
• The five leading detectors in the Croatian FieldTest were the Minelab F1A4 CMAC, the Pro-ScanMark 2 VLF, the Minelab F1A4 MIM, the VallonML 1620C, and the Giat Model F1 (DHPM-1A).
• The results show that, while some detectors perfor-med better than others, no single detector wascapable of finding all the targets at any depth.This was interpreted as an indication of the diffi-culty of the soil conditions for detection. A largenumber of detections were reported by the demi-ners during the tests. Later it was clear that verymany of these did not correlate to the positions ofthe buried targets.
Human Factors Assessment• The laboratory assessments resulted in two distinct
groups: a group of four lower scoring and the restforming a higher scoring group. The lower sco-ring group is considered less suitable for humani-tarian demining from a human factors perspecti-ve. However, this does not take into account thedetection capability.
• Within the higher scoring group several detectorsscored only sl ight ly higher than the rest.Therefore, singling out detectors from this groupas better suited for humanitarian demining isunjustified. The spread of scores shows that thedifference between any adjacent detectors issmall. For this reason it is considered that any dif-ferences highlighted by the laboratory asses-sments are small compared to the different condi-tions, environment, task and personnel, connectedto the different demining organizations.
• Human factors need to be considered in conjunc-tion with other factors such as technical perfor-mance and cost in an overall cost benefit analysisin which human factors issues may conflict withother issues. It is for the demining organizations todetermine their own priorities in this situation.
In closing, the IPPTC successfully addressed a num-ber of problems during the tests and in particulartried to ensure that a standard test procedure wasfollowed to ensure consistency and repeatability ofthe tests. The test methodology created for thisproject is offered to the demining and development,communities for consideration, further developmentand use in future assessments of metal detectors tomeet demining requirements. The results as presented will allow the reader toidentify groups of detectors with above averageperformance capabilities for a variety of deminingenvironments. Therefore, it is possible for the readerto eventually answer the question, “Which detector isthe best for my needs?”

57Annex A
This annex presents, in a concise form, the results for each detector type that was measured in the InternationalPilot Project for Technology Co-operation.At the top of the first page of each detector summary, information is given about the main characteristics of thedetector. This is based on manufacturer provided data1. Following this, the test results are summarised, startingwith extracts from the Human Factors assessment intended to highlight the major findings from this part of theproject.Performance tests are then presented starting with the field tests for Cambodia and Croatia. For each field testtwo charts are presented showing: • the number of detection declarations classified by soil type made for each detector compared with the
spread of results from all the detectors tested; and • the number of detections declared, classified by mine type, again overlaid on a bar indicating the full range
of detections declared from all the detectors.
On the second page the results of the In-soil test (conducted at the TNO test site in the Netherlands on fourexample soils) are presented as:• Number of detections classified by soil type, and• Number of detections by mine type viewed over all the test soils.
As on page 1 the results of the detector under discussion are shown against a background that depicts therange of detections achieved by the whole range of detector types tested.
The In-air test results are presented finally as:• Maximum detection distance, classified by mine target,• Detection distance in air determined under the conditions specified for the Calibration, and the effects of:
- drift, - moisture,- sweep speed.
Where, during the tests it had been possible to record results from two samples of the detector type, bothvalues are shown.
A fuller description of each measurement process is given in the appropriate section of this report. Also inthose sections the reference to the full report of that aspect of the project is identified.
ANNEX A - Detector Performance Summaries
1 Telepnone numbers are given in the form +NN__. The + signifies the number to be dialed to make an international call,which varies according to the country where the call originates. In EU, Canada and USA + signifies 00 - however there areexceptions.
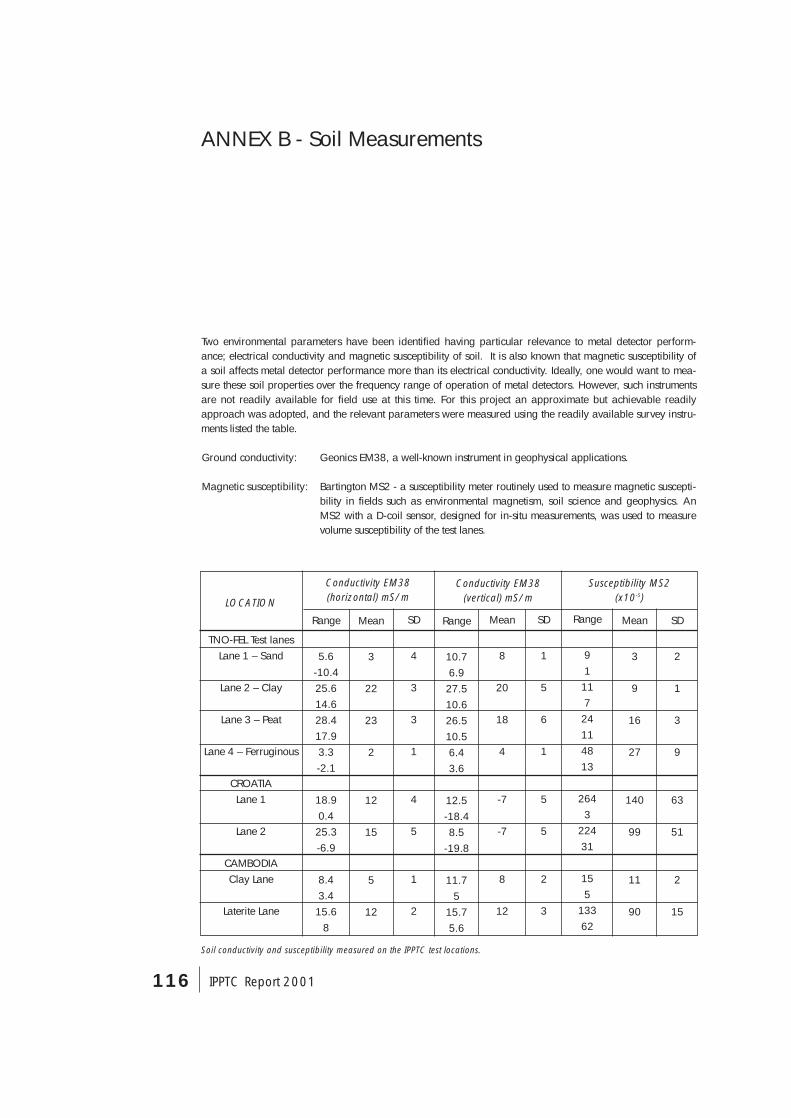
116 IPPTC Report 2001
Two environmental parameters have been identified having particular relevance to metal detector perform-ance; electrical conductivity and magnetic susceptibility of soil. It is also known that magnetic susceptibility ofa soil affects metal detector performance more than its electrical conductivity. Ideally, one would want to mea-sure these soil properties over the frequency range of operation of metal detectors. However, such instrumentsare not readily available for field use at this time. For this project an approximate but achievable readilyapproach was adopted, and the relevant parameters were measured using the readily available survey instru-ments listed the table.
Ground conductivity: Geonics EM38, a well-known instrument in geophysical applications.
Magnetic susceptibility: Bartington MS2 - a susceptibility meter routinely used to measure magnetic suscepti-bility in fields such as environmental magnetism, soil science and geophysics. AnMS2 with a D-coil sensor, designed for in-situ measurements, was used to measurevolume susceptibility of the test lanes.
ANNEX B - Soil Measurements
TNO-FEL Test lanesLane 1 – Sand
Lane 2 – Clay
Lane 3 – Peat
Lane 4 – Ferruginous
CROATIALane 1
Lane 2
CAMBODIAClay Lane
Laterite Lane
Mean
3
22
23
2
12
15
5
12
Range
5.6-10.425.614.628.417.93.3-2.1
18.90.425.3-6.9
8.43.415.6
8
Range
10.76.927.510.626.510.56.43.6
12.5-18.48.5
-19.8
11.75
15.75.6
Range
9111724114813
2643
22431
155
13362
SD
4
3
3
1
4
5
1
2
Mean
8
20
18
4
-7
-7
8
12
SD
1
5
6
1
5
5
2
3
Mean
3
9
16
27
140
99
11
90
SD
2
1
3
9
63
51
2
15
Conductivity EM38(horizontal) mS/m
Conductivity EM38(vertical) mS/m
Susceptibility MS2(x10-5)LOCATION
Soil conductivity and susceptibility measured on the IPPTC test locations.

117Annex B
For details of the measurement steps using these instruments, the approximations and errors involved, the rea-der should consult the relevant operational manuals [8, 9, 10].
At the Cambodia Field Test site, conductivity (mS/m) and susceptibility (MKS units) were measured every 1meter along a straight line over the center of each of the two test lanes. Similar measurements were carried outover the soil lanes at TNO-FEL and over the Croatian test lanes. The mean values and their standard deviationsare summarized in the table.
As seen from the table, the EM38 electrical conductivity is measured in two modes (vertical and horizontal).The horizontal mode is most sensitive at the surface and decreases with depth. The vertical mode is less sensiti-ve to surface material (zero at the surface) and more sensitive at depth. The results for all the lanes are quitesmall (less than 24 mS/m) and are thought to have had no influence on detector performance.
Magnetic susceptibility varied significantly among the lanes – from a small value of 3 for the TNO-FEL sandlane to a value of 140 in the Croatian Lane 1. A value of the order of 140 will have an effect on metal detec-tors. The soils, listed in order of difficulty of detection of the targets for metal detectors, with most difficult soilfirst, are:
1. Croatia Lane 12. Croatia Lane 23. Cambodia Laterite Lane4. TNO-FEL Lane 4 – Ferruginous5. TNO-FEL Lane 3 – Peat6. Cambodia Clay Lane7. TNO-FEL Lane 2 – Clay8. TNO-FEL Lane 1 – Sand

118 IPPTC Report 2001
ANNEX C - Invitations to Participants
Examples of IPPTC Communications to Product Manufacturers and Test Facility Providers
This annex contains copies of three letters, sent by the US Department of Defense, relating to the initiation andin-country test phases of the IPPTC project.
1) Letter, dated 25 March 1999, requesting information from a manufacturer (White’s of Mid-Atlantic) onCommercial Off the Shelf metal detector that could be suitable for the IPPTC action. An individual version of this letter was sent to each of the manufacturers of metal detectors that could beidentified by the project team. The purchase of 29 examples of metal detector, used in the Pilot Project,resulted from these solicitation letters.
2) Letter, dated 19 January 2000, to Mr Khem Sophoan of the Cambodian Mine Action Center requestingsupport to the Pilot Project from CMAC.
3) Letter, dated 19 January 2000, to the Scientific Council of the Croatian Mine Action Center requesting sup-port to the Pilot Project from CroMAC.
119Annex C
120 IPPTC Report 2001

121Annex C
122 IPPTC Report 2001

123References
1. Das Y., Toews J. D. Russell K., and Lewis S., Results of In-Air Testing of Metal Detectors (U), Technical Report TR-2000-185, Defence Research Establishment Suffield, Ralston, Alberta, Canada, December 2000.
2. Das Y., and Toews J. D., A Plan for In-Air Testing of Metal Detectors (U), Technical Memorandum TM-2000-184,Defence Research Establishment Suffield, Ralston, Alberta, Canada, December 2000.
3. Veer, Maj. Ir. P.J. de, Schoolderman Dr. A.J., In-Soil tests International Pilot Project for Technology Co-operation,TNO-report FEL-99-C253, (IPPTC) in metal (mine) detection (Commercial Confidential), Technical ReportABWM/18082 & FEL-00-A246, Royal Netherlands Army & TNO Physics and Electronics Laboratory,Netherlands, October 2000.
4. Schoolderman, Dr. A.J., Wolf F.J. de, Test Plan for Soil Tests, International Pilot Project for Technology Co-opera-tion, TNO-report FEL-99-C253, TNO Physics and Electronics Laboratory, The Hague, Netherlands, December1999.
5. Lee Christine J., International Pilot Project for Technology Co-operation, Cambodia Field Test Report, U.S. ArmyCommunications and Electronics Command, Night Vision and Electronic Sensors Directorate, Fort Belvoir, VA,USA.
6. Reidy, D. M., International Pilot Project for Technology Co-operation: Croatia Field Test Report, U.S. ArmyCommunications and Electronics Command, Night Vision and Electronic Sensors Directorate, Fort Belvoir, VA,USA.
7. Hooper A. and Mead R., IPPTC Humanitarian Mine Detection: Human Factors Assessments;DERA\LWS\LSAA\TR000599\1.0; DERA, Chertsey, UK, Nov. 2000.
8. EM-38 Ground Conductivity Operating Manual, Geonics Ltd., 8-1745 Meyerside Drive, Mississauga, Ontario,Canada, L5T 1C6, March 1999.
9. Dearing J., Environmental Magnetic Susceptibility: Using the Bartington MS2 System, Bartington Instruments Ltd.,10 Thorney Leys Business Park, Witney, Oxford, OX8 7GE, England, 1994.
10. Bartington MS2 Operation Manual.
References
124 IPPTC Report 2001
Canada
Dr. Yogadhish DasDefence Research Establishment SuffieldMilitary Engineering SectionBox 4000Medicine Hat, Alberta T1A 8K6Canada
Mr. Jack D. ToewsDefence Research Establishment SuffieldThreat Detection Group
The Netherlands
Mr. Jacques RoosenboomMOD NetherlandsLandmacht, Directie MaterieelSysteemgroep WTSFrederikkazerne, v. d. Burchlaan 312597 PC Den HaagThe Netherlands
Dr. Arnold SchooldermanTNO Physics and Electronics LaboratoryOude Waalsdorperweg 63P.O. Box 968642509 JG The HagueThe Netherlands
Major Pieter Jan de VeerLegerplaats bij OldebroekMPC 58A8084 HE ‘t HardeThe Netherlands
United Kingdom
Mr. Richard BeechDERA ChertseyChobham LaneChertseySurrey KT16 OEEUnited Kingdom
Mr. David LewisDERA Chertsey
United States
Mr. Harold E. BertrandInstitute for Defense Analysis (IDA)Science and Technology Division1801 N. Beauregard StreetAlexandria, VA 22311-1772USA
Ms. Karin BreiterU.S. Army CECOM NVESDATTN: AMSEL-RD-NV-CM-HD10221 Burbeck Road, Suite 430Fort Belvoir, VA 22060-5806USA
Mrs. Christine LeeU.S. Army CECOM NVESD
Dr. Denis ReidyU.S. Army CECOM NVESD
Colonel George Zahaczewsky(Project Coordinator)U.S. Department of DefenseOASD(SO/LIC)SOP&S(PR&A)2500 Defense Pentagon, Room 1A674BWashington, DC 20301-2500USA
European Commission
Mr. John DeanEC Joint Research CentreInstitute for Systems, Informatics and Safety, TDPUnit, TP 272Via E. FermiI-21020 ISPRA (Va), Italy
Mr. Steve LewisEC Joint Research Centre
(Please note that where addresses are similar, the fullmail address is given only for the first participantfrom each center.)
Participants

125Acknowledgements
Canada
Canadian Centre for Mine Action Technologies
Major (retd) Al Carruthers Dr. Robert Suart
Defence Research Establishment Suffield:
Mr. Doug BensonMr. Kevin RussellMr. Lyle SidorMr. Wayne Sirovyak
The Netherlands
Ministry of Defence
Warrant Officer Adrian HolWarrant Officer Dirk Keij
Royal Netherlands Embassy, Washington, DC
Lieutenant Colonel Peter van der Togt
TNO Physics and Electronics Laboratory
Mr. Bert BlokMr. Peter FritzMs. Yvonne JanssenMr. Marco RoosMr. Robin de RooyMr. Frank de Wolf
United Kingdom
DERA Chertsey
Mr. Phil BestMr. Peter GardinerMr. Neville GoultonMr. Andy Hooper
DERA Farnborough
Mr. Nick Beagley
United States
Joint UXO Coordination Office (JUXOCO)
Ms. Mary SherlockMr. Richard Weaver
U.S. Army AMC RDEC
Sergeant Craig SmithStaff Sergeant Alton Stewart
U.S. Army CECOM NVESD
Mrs. Beverly BriggsMr. Sean BurkeDr. Zenon Derzko
U.S. Department of Defense
Mr. Robert Doheny
European Commission
EC Joint Research Centre
Mr. Bjoern A. DietrichDr. Adam LewisDr. Alois Seiber
Demining Consultants
Cambodian Mine Action CenterMr. Ian Bullpit
C King Associates, Ltd.Mr. Colin King
Thailand Mine Action CenterMr. David McCracken
Acknowledgements

126 IPPTC Report 2001
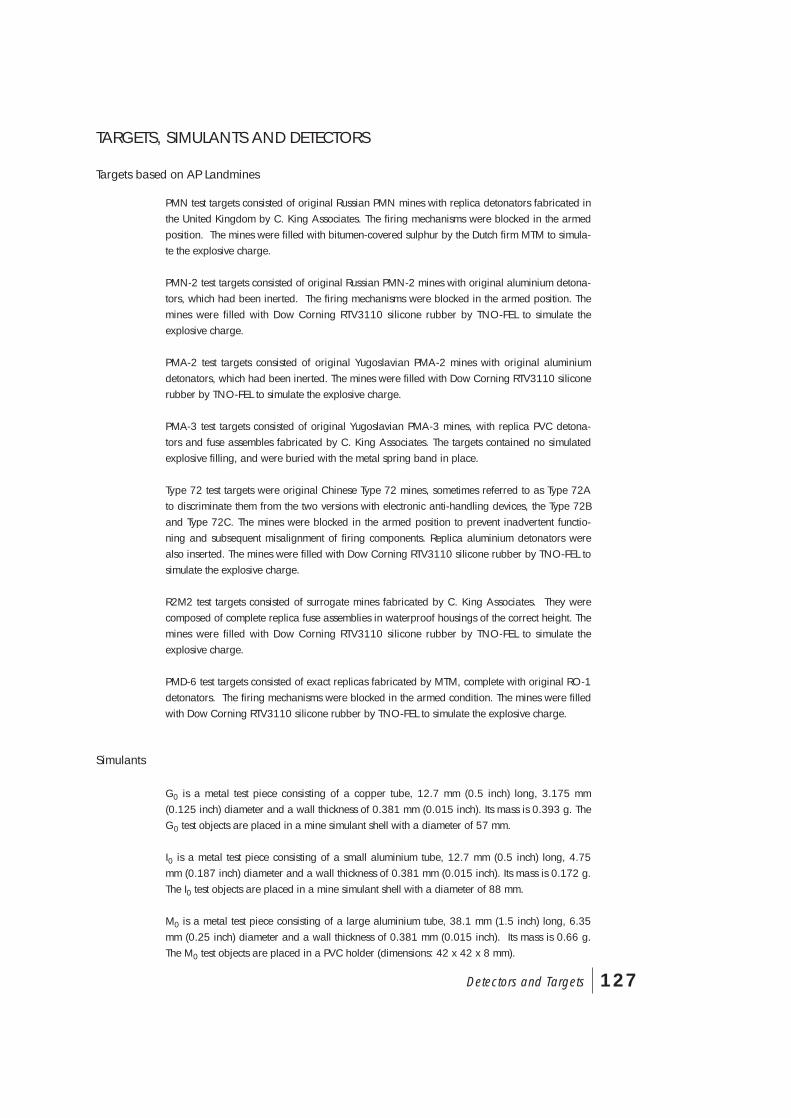
127Detectors and Targets
PMN test targets consisted of original Russian PMN mines with replica detonators fabricated inthe United Kingdom by C. King Associates. The firing mechanisms were blocked in the armedposition. The mines were filled with bitumen-covered sulphur by the Dutch firm MTM to simula-te the explosive charge.
PMN-2 test targets consisted of original Russian PMN-2 mines with original aluminium detona-tors, which had been inerted. The firing mechanisms were blocked in the armed position. Themines were filled with Dow Corning RTV3110 silicone rubber by TNO-FEL to simulate theexplosive charge.
PMA-2 test targets consisted of original Yugoslavian PMA-2 mines with original aluminiumdetonators, which had been inerted. The mines were filled with Dow Corning RTV3110 siliconerubber by TNO-FEL to simulate the explosive charge.
PMA-3 test targets consisted of original Yugoslavian PMA-3 mines, with replica PVC detona-tors and fuse assembles fabricated by C. King Associates. The targets contained no simulatedexplosive filling, and were buried with the metal spring band in place.
Type 72 test targets were original Chinese Type 72 mines, sometimes referred to as Type 72Ato discriminate them from the two versions with electronic anti-handling devices, the Type 72Band Type 72C. The mines were blocked in the armed position to prevent inadvertent functio-ning and subsequent misalignment of firing components. Replica aluminium detonators werealso inserted. The mines were filled with Dow Corning RTV3110 silicone rubber by TNO-FEL tosimulate the explosive charge.
R2M2 test targets consisted of surrogate mines fabricated by C. King Associates. They werecomposed of complete replica fuse assemblies in waterproof housings of the correct height. Themines were filled with Dow Corning RTV3110 silicone rubber by TNO-FEL to simulate theexplosive charge.
PMD-6 test targets consisted of exact replicas fabricated by MTM, complete with original RO-1detonators. The firing mechanisms were blocked in the armed condition. The mines were filledwith Dow Corning RTV3110 silicone rubber by TNO-FEL to simulate the explosive charge.
G0 is a metal test piece consisting of a copper tube, 12.7 mm (0.5 inch) long, 3.175 mm(0.125 inch) diameter and a wall thickness of 0.381 mm (0.015 inch). Its mass is 0.393 g. TheG0 test objects are placed in a mine simulant shell with a diameter of 57 mm.
I0 is a metal test piece consisting of a small aluminium tube, 12.7 mm (0.5 inch) long, 4.75mm (0.187 inch) diameter and a wall thickness of 0.381 mm (0.015 inch). Its mass is 0.172 g.The I0 test objects are placed in a mine simulant shell with a diameter of 88 mm.
M0 is a metal test piece consisting of a large aluminium tube, 38.1 mm (1.5 inch) long, 6.35mm (0.25 inch) diameter and a wall thickness of 0.381 mm (0.015 inch). Its mass is 0.66 g.The M0 test objects are placed in a PVC holder (dimensions: 42 x 42 x 8 mm).
Targets based on AP Landmines
TARGETS, SIMULANTS AND DETECTORS
Simulants
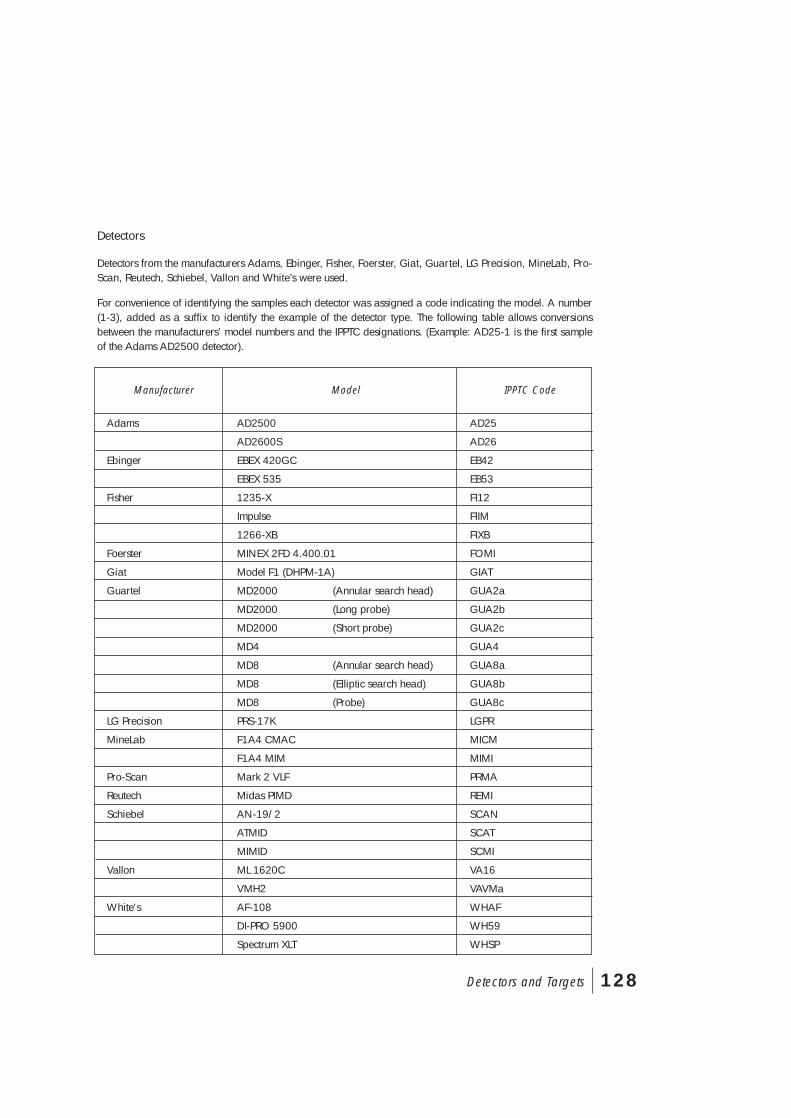
128Detectors and Targets
Detectors
Detectors from the manufacturers Adams, Ebinger, Fisher, Foerster, Giat, Guartel, LG Precision, MineLab, Pro-Scan, Reutech, Schiebel, Vallon and White’s were used.
For convenience of identifying the samples each detector was assigned a code indicating the model. A number(1-3), added as a suffix to identify the example of the detector type. The following table allows conversionsbetween the manufacturers’ model numbers and the IPPTC designations. (Example: AD25-1 is the first sampleof the Adams AD2500 detector).
Manufacturer
Adams
Ebinger
Fisher
Foerster
Giat
Guartel
LG Precision
MineLab
Pro-Scan
Reutech
Schiebel
Vallon
White's
Model
AD2500
AD2600S
EBEX 420GC
EBEX 535
1235-X
Impulse
1266-XB
MINEX 2FD 4.400.01
Model F1 (DHPM-1A)
MD2000 (Annular search head)
MD2000 (Long probe)
MD2000 (Short probe)
MD4
MD8 (Annular search head)
MD8 (Elliptic search head)
MD8 (Probe)
PRS-17K
F1A4 CMAC
F1A4 MIM
Mark 2 VLF
Midas PIMD
AN-19/2
ATMID
MIMID
ML 1620C
VMH2
AF-108
DI-PRO 5900
Spectrum XLT
IPPTC Code
AD25
AD26
EB42
EB53
FI12
FIIM
FIXB
FOMI
GIAT
GUA2a
GUA2b
GUA2c
GUA4
GUA8a
GUA8b
GUA8c
LGPR
MICM
MIMI
PRMA
REMI
SCAN
SCAT
SCMI
VA16
VAVMa
WHAF
WH59
WHSP