Final Report for the Green Valley Creek Winter Refugia ... Report for the Green Valley Creek Winter...
18
Final Report for the Green Valley Creek Winter Refugia Enhancement Project Monitoring December 2016 Prepared by: Mariska Obedzinski and Sarah Nossaman University of California Cooperative Extension & California Sea Grant 133 Aviation Boulevard, Suite 109, Santa Rosa, CA 95403
Transcript of Final Report for the Green Valley Creek Winter Refugia ... Report for the Green Valley Creek Winter...

Final Report for the Green Valley Creek Winter Refugia Enhancement Project Monitoring
December 2016
Prepared by:
Mariska Obedzinski and Sarah Nossaman
University of California Cooperative Extension & California Sea Grant
133 Aviation Boulevard, Suite 109, Santa Rosa, CA 95403

2
I. Introduction
Background University of California Cooperative Extension and California Sea Grant’s Russian River Salmon and Steelhead Monitoring Program (UC) has monitored wild and hatchery coho salmon populations in the Russian River watershed since 2004 as part of the Russian River Coho Salmon Captive Broodstock Program (Broodstock Program). Green Valley Creek is one of the focus streams for local coho salmon recovery efforts, as it was the last tributary in the Russian River watershed known to contain three consecutive year classes of wild coho and because the relatively high-quality fish habitat found there makes it a critical refuge for the endangered salmon. Coho salmon typically exhibit a three-year life cycle that begins with adults spawning in the stream environment. Eggs are laid in gravel substrate during the winter season, the eggs hatch in early spring, and juveniles rear in the stream environment for approximately one year before they migrate out to the ocean as smolts—generally between March and June the following year. After feeding in the ocean for approximately one and a half years, they return to the streams to spawn, once again. As part of a coho salmon recovery effort in the Russian River watershed, the Broodstock Program releases thousands of juvenile coho each year into Green Valley and Purrington creeks, several kilometers upstream of the Green Valley Creek Winter Refugia Enhancement Project (enhancement reach). Approximately 15% of these fish are implanted with Passive Integrated Transponder (PIT) tags prior to release from Don Clausen Fish Hatchery. The release of these PIT-tagged fish provided a unique opportunity to evaluate use of the enhancement reach by juvenile coho. The primary objective of the Green Valley Creek Winter Refugia Enhancement Project was to create off-channel habitat to provide velocity refugia for overwintering juvenile coho salmon. The goal of the project monitoring conducted by UC was to document habitat use by coho pre- and post-project implementation. Prior to project implementation, our objectives were to estimate the number and rate of movement of juvenile coho moving through the mainstem of Green Valley Creek past the project site. For two years following project implementation, we aimed to estimate the number (and proportion) of juvenile coho that entered the newly-created side channel habitat while they were moving through the mainstem of Green Valley Creek, as well as rates of movement past the project site and residence time in the side channel. Through installation and operation of PIT tag detection systems (antennas) placed in the main and side channels at the project site, UC biologists collected data to address these objectives. From November 2013 through June 2014, UC conducted pre-project monitoring in the enhancement reach (year one). The off-channel enhancement was completed during the summer of 2014 and the post-project monitoring occurred from October to June of 2014/15 and 2015/16 (years two and three).
II. Methods
Study Population Each year from 2013 through 2016, juvenile coho were PIT tagged by US Army Corps of Engineers personnel at the Don Clausen Fish Hatchery at Warm Springs Dam and released into Green Valley and

3
Purrington creeks upstream of the enhancement reach (Table 1, Figure 1). Releases included three groups each year; spring (young-of-year), fall (young-of-year) and smolt (age-1). In 2015, an additional age-1 pre-smolt release occurred in February. The spring and fall release groups were the primary fish of interest for this study because they were stocked early enough in the year that they had the opportunity to acclimate to the stream environment prior to winter rains, and were therefore most appropriate for examining winter movement behavior. Because so few fish were released each spring of the study period and very few of them survived the summer, results primarily reflect movement behavior of the fall release group. The pre-smolt group, released in February 2015, also provided useful information because the release occurred during the winter, prior to the typical smolt outmigration period; however, this group did not provide as clear a picture of winter movement patterns because hatchery-released fish typically exhibit a flight response in the first few days following stocking, which can mask natural winter habitat use patterns. Smolt releases occurred in late March through May of each year at times when the side channel was not inundated and were, therefore, excluded from the results as there was no possibility of them entering the side channel.
Table 1. Number and locations of juvenile coho released into the Green Valley watershed from June 2013 through May 2016 and proportions of each release group that were PIT-tagged.
Cohort
(Hatch Year)
Release
Date
Release
Tributary
Release
Group
Release Location
(RiverKm)
Distance
Upstream of
Project Site (km)
Number of PIT-
tagged Fish
Released
Total Number
of Fish
Released
Proportion
PIT-tagged
2013 6/13/2013 Green Valley spring 13.40-13.62 7.27-7.49 209 210 1.00
2013 12/12/2013 Green Valley fall 9.32-12.49 3.19-6.36 2,995 7,146 0.42
2013 11/15/2013 Purrington fall 1.24-2.10 5.44-6.30 453 3,041 0.15
2013 4/24/2014 Green Valley smolt 9.32 3.19 300 2,098 0.14
2013 5/8/2014 Green Valley smolt 9.32 3.19 302 2,096 0.14
2014 6/12/2014 Green Valley spring 13.40-13.62 7.27-7.49 505 505 1.00
2014 12/9/2014 Green Valley fall 12.27-13.84 6.14-7.71 1,514 10,088 0.15
2014 12/9/2014 Purrington fall 1.25-2.15 5.45-6.35 759 5,012 0.15
2014 2/17/2015 Green Valley pre-smolt 9.32 3.19 1,762
2014 2/17/2015 Green Valley pre-smolt 7.8 1.67 524
2014 3/30/2015 Green Valley smolt 9.32 3.19 463 3,104 0.15
2014 4/20/2015 Green Valley smolt 9.32 3.19 464 3,050 0.15
2015 6/18/2015 Green Valley spring 13.40-13.62 7.27-7.49 305 305 1.00
2015 12/9/2015 Green Valley fall 12.01-13.81 5.88-7.68 2,715 8,989 0.30
2015 4/18/2016 Green Valley smolt 9.32 3.19 744 2,536 0.29
2015 5/2/2016 Green Valley smolt 9.32 3.19 745 2,328 0.32
15,248 0.15

4
Figure 1. Map of spawning habitat, release sites, and Broodstock Program antenna locations in relation to the enhancement reach on Green Valley Creek.

5
PIT Tag Detection Systems On November 14, 2013, prior to project implementation, two PIT antenna arrays were installed in the main channel of Green Valley Creek, upstream (GRE-6.13) and downstream (GRE-6.01) of the planned side channel inlet and outlet (Figure 2, Figure 3). These antenna arrays tracked PIT-tagged coho salmon passage through the mainstem of Green Valley Creek, adjacent to the proposed side channel. A solar power system was constructed by UC to power installed and proposed antenna arrays. Following completion of the side channel in the summer of 2014, UC constructed and installed two additional PIT antenna arrays, GRE-6.09 and GRE-6.03, at the side channel inlet and outlet in November 2014 to capture movement of PIT-tagged individuals into and through the side channel (Figure 2, Figure 4). The main channel arrays from the pre-project phase remained in operation to capture movement of fish through the main channel section of the enhancement reach. The main channel PIT antenna arrays (GRE-6.01 and GRE-6.13, Figure 2) collected data continuously from the time of installation in November 2013 through June 2016, with the exception of occasional outages due to technical failure. The side channel antennas at GRE-6.03 and GRE-6.09 (Figure 2) were operated continuously from the time of installation in November 2014 through June of 2016, with the exception of occasional outages due to technical failure; however, the channel was only active at the highest streamflows during that time. Individual antenna data was recorded on a single transceiver, which was downloaded every two weeks. This data included the unique tag number of each detected PIT-tagged fish, along with the date and time of detection on each individual antenna. Since each antenna array consisted of both upstream and downstream antennas, the migration direction could often be determined. Antenna data was uploaded to a Microsoft Access database maintained by UC, which includes tag-associated information for all individual PIT-tagged fish released within the Russian River watershed. Fish origin, age, stocking season and stream were later determined. Antenna efficiencies were estimated for each array by dividing the number of detections on the array by the total number of fish known to migrate past that array. For example, to estimate the efficiency of GRE-6.13, we divided the number of unique PIT-tagged fish detected on both GRE-6.01 and GRE-6.13 by the number detected on GRE-6.01, making the assumption that stocked fish passing GRE-6.01 had to swim over the GRE-6.13 array. Antenna efficiencies were then used, along with known proportions of tagged-to-untagged hatchery coho, to estimate the total number of hatchery juvenile coho salmon migrating past the enhancement corridor and the number entering the side channel. Migration rates through the enhancement reach were estimated for coho detected at both main-channel antenna arrays and were based on the first and last detections of each PIT-tagged fish on the two arrays. Residence time in the side channel was calculated the same way, using detection data collected at GRE-6.09 and GRE-6.03.

6
Figure 2. PIT antenna arrays and pressure transducer gauge locations in the Green Valley Creek enhancement reach.
Figure 3. PIT antenna arrays in the main channel of Green Valley Creek upstream and downstream of the proposed side channel inlet and outlet. GRE-6.13, a four-antenna array, is on the left. GRE-6.01, a two-antenna array (antennas circled), is on the right.
Green Valley Creek
GRE-6.13
GRE-6.03 GRE-6.01
Side channel
flow
flow
GRE-6.09
Thomas Creek
flow
Main channel
flow gauge
Side channel
flow gauge

7
Figure 4. Off-Channel PIT antenna sites prior to winter flows (top) and after the habitat was activated (bottom). The off-channel inlet array, GRE-6.09, is on the right and the off-channel outlet array, GRE-6.03, is on the left.
Streamflow In November 2013, an InSitu LevelTROLL pressure transducer gauge was installed in the mainstem of Green Valley Creek adjacent to the planned side-channel enhancement area. In November 2014, following project implementation, a second LevelTROLL gauge was added to the downstream end of the side channel (Figure 2). Both gauges recorded stage depth (feet) at fifteen minute intervals through June 30, 2016. Discharge was measured periodically in both the main channel and side channel at a range of stages and flows using Rickly Hydrological Price current meters. Stage depth records were downloaded and compared to discharge measurements in order to develop a rating curve and assign discharge values to each 15-minute interval (Buchanan and Somers 1969). Where these efforts were successful, discharge was then summarized as average daily flow in cubic feet per second (ft3/s) and used to draft hydrographs to plot against fish movement. In the absence of sufficient discharge data to support a rating curve, average daily stream depth (stage) was used instead. UC evaluated camera footage from GRRCD in an attempt to determine the number of days when each side channel antenna array was submerged and accessible to fish. Time-lapse footage of the array at the side channel inlet (GRE 6.09) indicated that it was inundated by flow from the main channel at a depth

8
of 0.80’ on the side channel gauge. We were able to determine the lowest point at which the antenna array at the side channel outlet (GRE 6.03) was submerged (0.28’), but cameras did not capture the angle needed to identify the precise point when the array became accessible to fish from the main channel. Because of this, the lowest side channel stage depth at which coho were detected on the GRE 6.03 array (0.54’) was used as the threshold depth at which fish could have been detected at that antenna site. This is a conservative estimate, as fish might have had access to that array at a slightly lower depth. At the request of UC staff, an additional camera was installed and aimed at the spillway at the upstream end of the side channel in March 2016. Time-lapse footage was evaluated to define the depth at which water flowed over the highest elevation point in the side channel, connecting it for the entire length; 1.74’ on the side channel gauge. These thresholds were used to determine the number of days during the 2014/15 and 2015/16 monitoring periods when each of the antenna arrays in the side channel were inundated, and when water was flowing through the entire length of the side channel.
III. Results For the purposes of this study, we were primarily interested in movement activity of the spring and fall release groups during the winter period (November 1 through March 1) because the goal of the project was to improve overwinter rearing habitat, and juveniles were not likely to be actively migrating to the ocean as smolts during that time. Based on average precipitation patterns, there was also the highest likelihood that the side channel would be inundated and accessible to juvenile coho during the winter period.
Pre-project Monitoring (November 2013 - June 2014)
Streamflow The winter of 2013/14 was unusual in that the first significant rainstorm to increase flow in Green Valley Creek to a level that would allow fish to move through the stream channel did not occur until February 7, 2014, approximately two months later than it occurs in most years. In the 2013/14 study year, discharge data was insufficient to support flow data development for the main channel within a reasonable level of accuracy, so average daily stage (stream depth) was used instead.
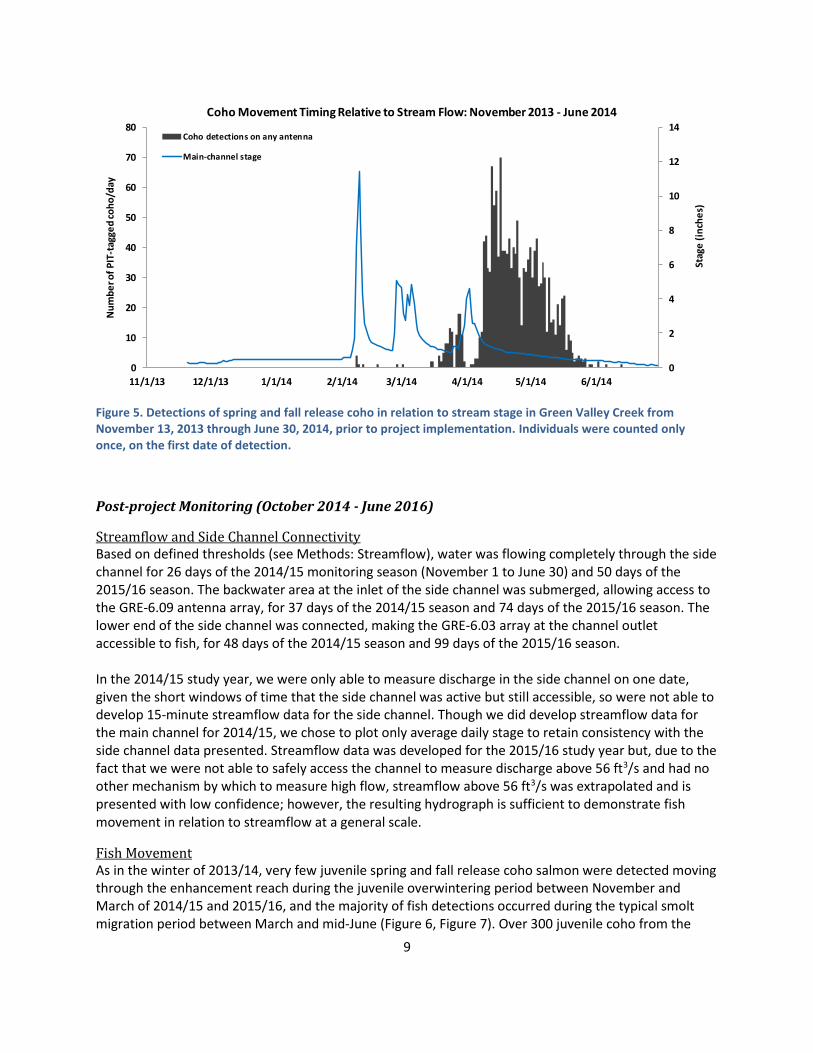
Fish Movement Antenna detections of spring and fall release coho were plotted along with main channel stage to examine the relationship between juvenile movement and stream depth (Figure 5). The majority of the detections (1,541) occurred during the typical spring smolt migration period beginning in early March, with only eight fish detected during the winter period when the two largest storm events occurred (Figure 5).
Antenna efficiencies for the GRE-6.01 and GRE-6.13 arrays were estimated at 0.877 and 0.998, respectively. Antenna efficiencies and known ratios of PIT-tagged to non-PIT-tagged fish were used to estimate that a total of 4,385 juvenile hatchery coho (spring and fall release groups only) passed through the mainstem adjacent to the proposed enhancement reach between November 13, 2013 and June 30, 2014. Nineteen (0.4%) of these fish are estimated to have passed the site during the overwintering season (<3/1). Five individuals were detected on both antenna arrays (GRE-6.01 and GRE-6.13) during the winter period and the average time it took for them to pass the project reach was 15 minutes (range 8 to 38 min).
9
Figure 5. Detections of spring and fall release coho in relation to stream stage in Green Valley Creek from November 13, 2013 through June 30, 2014, prior to project implementation. Individuals were counted only once, on the first date of detection.
Post-project Monitoring (October 2014 - June 2016)
Streamflow and Side Channel Connectivity Based on defined thresholds (see Methods: Streamflow), water was flowing completely through the side channel for 26 days of the 2014/15 monitoring season (November 1 to June 30) and 50 days of the 2015/16 season. The backwater area at the inlet of the side channel was submerged, allowing access to the GRE-6.09 antenna array, for 37 days of the 2014/15 season and 74 days of the 2015/16 season. The lower end of the side channel was connected, making the GRE-6.03 array at the channel outlet accessible to fish, for 48 days of the 2014/15 season and 99 days of the 2015/16 season. In the 2014/15 study year, we were only able to measure discharge in the side channel on one date, given the short windows of time that the side channel was active but still accessible, so were not able to develop 15-minute streamflow data for the side channel. Though we did develop streamflow data for the main channel for 2014/15, we chose to plot only average daily stage to retain consistency with the side channel data presented. Streamflow data was developed for the 2015/16 study year but, due to the fact that we were not able to safely access the channel to measure discharge above 56 ft3/s and had no other mechanism by which to measure high flow, streamflow above 56 ft3/s was extrapolated and is presented with low confidence; however, the resulting hydrograph is sufficient to demonstrate fish movement in relation to streamflow at a general scale.
Fish Movement As in the winter of 2013/14, very few juvenile spring and fall release coho salmon were detected moving through the enhancement reach during the juvenile overwintering period between November and March of 2014/15 and 2015/16, and the majority of fish detections occurred during the typical smolt migration period between March and mid-June (Figure 6, Figure 7). Over 300 juvenile coho from the
0
2
4
6
8
10
12
14
11/1/13 12/1/13 1/1/14 2/1/14 3/1/14 4/1/14 5/1/14 6/1/14
0
10
20
30
40
50
60
70
80
Stag
e (
inch
es)
Nu
mb
er o
f P
IT-t
agge
d c
oh
o/d
ayCoho Movement Timing Relative to Stream Flow: November 2013 - June 2014
Coho detections on any antenna
Main-channel stage

10
pre-smolt release were detected passing through the enhancement reach during the week following their release upstream of the project site on February 17, 2015. These fish passed the project site at a time when only the antenna array at the outlet to the side channel was inundated and accessible to fish (Figure 8). Antenna efficiencies were estimated for each array for the two years of post-project monitoring (Table 2). Because antenna efficiencies typically decrease with increasing flows, we estimated separate efficiencies during “high” flows, when side channel stage was at or above 0.54’ (the point at which the GRE-6.03 outlet antenna array was known to connect to the main channel) and “low” flows, when side channel stage was less than 0.54’ and the side channel was not accessible to fish (Table 2). As expected, antenna efficiencies of the main channel arrays (GRE-6.01 and GRE-6.13) were higher in low flows (Table 2). Because so few fish were detected on the side channel arrays, we were either not able to estimate antenna efficiencies for those arrays, or, in the one case that we were (GRE-6.09 in 2015/16), we had very low confidence in the estimate due to the small sample size. Antenna efficiencies and known ratios of PIT-tagged to non-PIT-tagged fish were used to estimate the total number of fish migrating through the enhancement reach, as well as the total number to enter the side channel during the two years following project implementation (Table 3). In general, very few juveniles entered the side channel during the two years of post-project monitoring (Table 3). In all three years of data collection (pre- and post-project), very few spring and fall release juveniles passed through the mainstem channel of the enhancement reach during winter storms prior to the spring smolt migration, suggesting that there were very few fish actually in the vicinity of the side channel during the time of expected use (Figure 5- Figure 7). The pre-smolt release fish in 2014/15 were an exception, with thousands of fish estimated to have passed through the mainstem of the enhancement reach in February, immediately following their release (Figure 8). However, these fish appeared to be exhibiting a flight response commonly observed in fish during the first week after they are stocked, in which they move downstream immediately. Because of the very small number of fish passing through the main channel or entering the side channel during the winter season, it was difficult to evaluate migration time through the main channel or residence time in the side channel. In 2014/15, only four fall release individuals were detected moving through the mainstem past the enhancement reach during the winter period (November 1 - March 1). Of these, one moved through at a time when the side channel was fully connected and a second moved through at a time when only the antennas at the side channel outlet were inundated (Figure 6). Neither of these fish were detected on the side channel antennas. Only one of the four fish was detected on both the GRE-6.01 and GRE-6.13 antenna arrays and that individual passed through the enhancement reach in 39 minutes. Five hundred and two PIT-tagged pre-smolts were detected migrating through the enhancement reach between February 17 (date of release) and March 1, 2015. One hundred and twenty-two of them were detected on both main channel arrays during this window of time, with an average travel time through the reach of 1.2 days (range 5.5 minutes to 10.3 days). Downstream and upstream movements were observed, suggesting that there was some milling behavior within the reach. Eleven of the pre-smolts were detected in the side channel; however, all of them were only detected once at the lowest antenna of the GRE-6.03 array at a time when the channel was barely connected to the mainstem and only the GRE-6.03 antennas were inundated, so we were unable to calculate residence time in the side channel.

11
During the winter of 2015/16, ten fall release fish were detected moving through the enhancement reach during the winter period before March 1. Seven were detected on both main channel arrays and average travel time through the reach was 21.4 hours (range 7.4 minutes to 4.4 days). Three fall release fish were detected in the side channel in late January when the side channel was flowing through. Two of the three were detected only on the inlet channel antenna array and one was detected moving through the side channel from upstream to downstream and it moved through the channel in 1.9 minutes.
Figure 6. Detections of spring and fall release coho in relation to stream stage in Green Valley Creek from November 1, 2014 through June 30, 2015, following project implementation. Individuals were counted only once on the first date of detection. Note that the antennas were shut off from 1/18/15 through 1/20/15 due to technical issues.

12
Figure 7. Detections of spring and fall release coho in relation to stream stage in Green Valley Creek from November 1, 2015 through June 30, 2016, following project implementation. Individuals were counted only once on the first date of detection. High flow data extrapolated above 56 ft3/s in the main channel and 12 ft3/s in the side channel is presented with low confidence.
Figure 8. Detections of pre-smolt release coho in relation to stream stage in Green Valley Creek from November 1, 2014 through June 30, 2015, following project implementation. Individuals were counted only once on the first date of detection.

13
Table 2. Estimated efficiencies of antenna arrays at high flows (at or above side channel stage 0.54' when at least antenna array GRE-6.03 was connected to the main channel) and low flows (side channel stage was less than 0.54') for years two and three of the post-project monitoring.
Table 3. Estimated number of juvenile coho entering the side channel in relation to number passing through the main channel of Green Valley Creek in the project reach.
Juvenile Straying from Other Russian River Tributaries Over the course of the study, seven juveniles that had previously been stocked into other streams within the watershed were detected on the antenna arrays in the main channel of the enhancement reach (Table 4). Four of the stray fish spent approximately a month or longer in Green Valley Creek before migrating back downstream (range 28 to 86 days). Five of the fish were originally stocked into streams in the Dry Creek watershed, which enters the Russian River upstream of Green Valley Creek, and two of the fish migrated upstream in the mainstem of the river in order to enter Green Valley Creek.
Total Detections
on Antenna Array
Total Known to Pass
Over Antenna Array
(based on detections
on other arrays)
Estimated
Efficiency
Total Detections
on Antenna Array
Total Known to Pass
Over Antenna Array
(based on detections
on other arrays)
Estimated
Efficiency
GRE 6.01 71 182 0.39 995 1,089 0.91
GRE 6.13 69 383 0.18 995 1,145 0.87
GRE 6.03 11 1 NA NA NA NA NA
GRE 6.09 no detections NA NA NA NA NA
GRE 6.01 37 70 0.53 402 516 0.78
GRE 6.13 37 79 0.47 402 677 0.59
GRE 6.03 1 1 NA NA NA NA NA
GRE 6.09 1 2 0.50 NA NA NA
1 All detections were on the lowest antenna in the GRE 6.03 array only, therefore we were unable to estimate efficiency for the array.
2014/15
main
side
2015/16
main
side
Winter Channel Antenna Array
High Flows (side channel inundated) Low Flows (side channel not connected)
Year Release Groups
Total number of
juvenile coho
stocked upstream
of site
Estimated number passing
through main channel of
enhancement reach
between 11/1 and 6/30
Estimated number passing through main channel
adjacent to enhancement reach when at least
one side channel antenna was accesible to fish
from the mainstem
Estimated number
(and proportion)
entering side
channel
2013-2014 spring and fall 10,397 4,394 NA NA
spring and fall 15,605 2,841 34 0 (0)
pre-smolt 30,853 13,637 6,411 73 (0.01)
2015-2016 spring and fall 9,294 2,908 971 20 (0.02)
2014-2015

14
Table 4. PIT-tagged individuals detected straying into Green Valley Creek at the enhancement reach site.
Adult Use of Side-Channel Habitat During the winter of 2014/15, eleven PIT-tagged adult coho were detected moving through the enhancement reach during the early December and February storm events. Five of these adults were detected in the off-channel habitat, although only at the inlet side channel array (GRE-6.09). This suggests that upstream spawning adults may benefit from the additional off-channel refugia created by the enhancement project, most likely as a resting opportunity before continuing upstream to spawning habitat in Green Valley Creek. During the winter of 2015/16, three PIT-tagged adult coho were detected in the enhancement reach on the main channel arrays, but not on the side channel arrays.
Movement Patterns within the Green Valley Creek Watershed Since the fall of 2014, UC has been operating additional antenna arrays upstream of the enhancement reach (GRE-9.98 and GRE-13.40, Figure 1) for other studies. To better understand movement patterns within the watershed, we plotted PIT-tag detections of spring and fall release coho at all three antenna locations for years 2014/15 and 2015/16 (Figure 9, Figure 10). In both years of data collection, we observed pulses of fish moving downstream past the upper two antenna arrays during the winter season. The largest pulses occurred immediately following the fall release, which is likely explained by a flight response following their release into the stream environment. Smaller pulses occurred on the upper two arrays at additional times during the winter season, and appeared to be associated with storm events (Figure 9, Figure 10). Interestingly, the winter pulses did not occur at the array in the enhancement reach (furthest downstream), suggesting that fish were overwintering upstream of the enhancement reach.
To further understand watershed-scale movement patterns, we examined the movement timing of fish that were detected at all three arrays, and found that the majority of juveniles that were detected moving downstream prior to the spring smolt migration in March overwintered upstream of the enhancement reach. In 2014/15, we detected 184 fish on all three arrays. Sixty percent (111) of these fish moved downstream of GRE-13.40 prior to March 1, while 40% remained upstream until the spring migration period. Of the 111 fish that moved downstream during the winter, 68% overwintered between river kilometers 9.98 and 13.40 and 32% overwintered between river kilometers 6.13 and 9.98. None of the 184 moved downstream of GRE-6.13 during the winter period.
Cohort Tag Number
Release
Tributary
Release
Season
Min
Detection
Max
Detection
384.1B796E2B20 Mill Creek fall 3/27/2014 4/24/2014
384.1B796E7475 Pena Creek fall 3/28/2014 4/26/2014
3DD.003BCDB843 Freezeout Creek fall 2/26/2015 4/16/2015
3DD.003BCE00DB Pena Creek fall 3/12/2015 3/12/2015
3DD.003BD00573 Dry Creek winter 11/21/2016 11/21/2016
3DD.003BD00EE1 Dry Creek winter 11/21/2016 11/21/2016
2015 3DD.003BD07008 Dutch Bill Creek fall 1/9/2016 4/4/2016
2013
2014

15
In 2015/16, we detected 440 fish on all three arrays. Seventy-five percent (332) of these fish moved downstream of GRE-13.40 prior to March 1, while 25% remained upstream until the spring migration period. Of the 332 fish that moved downstream during the winter (prior to March 1), 78% overwintered between river kilometers 9.98 and 13.40, 21% overwintered between river kilometers 6.13 and 9.98, and 1% moved downstream of the enhancement reach antenna arrays.

16
Figure 9. Daily proportions of PIT-tag detections of juvenile spring and fall release coho salmon at three antenna sites within the Green Valley Creek watershed. Kilometers from the mouth of Green Valley Creek to detection points are indicated in the title of each graph. Stream stage data is from the main channel in the enhancement reach. Shaded background indicates that the antennas were operating and white background indicates times of technical failure. Note the differences in the y-axis scale on the three antenna sites.
0
2
4
6
8
10
12
0.0
0.1
0.2
0.3
0.4
11/1
11/1
5
11/2
9
12/1
3
12/2
7
1/1
0
1/2
4
2/7
2/2
1
3/7
3/2
1
4/4
4/1
8
5/2
5/1
6
5/3
0
6/1
3
6/2
7
Stag
e (i
nch
es)
Pro
po
rtio
n o
f fis
h/d
ayGRE-13.40 Detections, Spring and Fall Releases, 2014/15
proportion of fish
fall release date
stage
n = 815
0
2
4
6
8
10
12
0.00
0.05
0.10
0.15
11/1
11/1
5
11/2
9
12/1
3
12/2
7
1/1
0
1/2
4
2/7
2/2
1
3/7
3/2
1
4/4
4/1
8
5/2
5/1
6
5/3
0
6/1
3
6/2
7
Stag
e (i
nch
es)
Pro
po
rtio
n o
f fis
h/d
ay
GRE-9.98 Detections, Spring and Fall Releases, 2014/15
proportion of fish
fall release date
stage
n = 1,037
0
2
4
6
8
10
12
0.00
0.01
0.02
0.03
0.04
0.05
11/1
11/1
5
11/2
9
12/1
3
12/2
7
1/1
0
1/2
4
2/7
2/2
1
3/7
3/2
1
4/4
4/1
8
5/2
5/1
6
5/3
0
6/1
3
6/2
7
Stag
e (i
nch
es)
Pro
po
rtio
n o
f fis
h/d
ay
GRE-6.13 Detections, Spring and Fall Releases, 2014/15
proportion of fish
fall release date
stage
n = 437

17
Figure 10. Daily proportions of PIT tag detections of juvenile spring and fall release coho salmon at three antenna sites within the Green Valley Creek watershed. Kilometers from the mouth of Green Valley Creek to detection points are indicated in the title of each graph. Shaded background indicates that the antennas were operating and white background indicates times of technical failure. Note the differences in the y-axis scale on the three antenna sites.
0
500
1,000
1,500
2,000
0.00
0.10
0.20
0.30
0.40
11/1
11/1
5
11/2
9
12/1
3
12/2
7
1/1
0
1/2
4
2/7
2/2
1
3/6
3/2
0
4/3
4/1
7
5/1
5/1
5
5/2
9
6/1
2
6/2
6
Stre
am d
isch
arge
(ft3 /
s)
Pro
po
rtio
n o
f fis
h/d
ayGRE-13.40 Detections, Spring and Fall Releases, 2015/16
proportion of fish
fall release date
discharge
n = 1,336
0
500
1,000
1,500
2,000
0.00
0.02
0.04
0.06
0.08
0.10
0.12
0.14
11/1
11/1
5
11/2
9
12/1
3
12/2
7
1/1
0
1/2
4
2/7
2/2
1
3/6
3/2
0
4/3
4/1
7
5/1
5/1
5
5/2
9
6/1
2
6/2
6
Stre
am d
isch
arge
(ft3 /
s)
Pro
po
rtio
n o
f fis
h/d
ay
GRE-9.98 Detections, Spring and Fall Releases, 2015/16
proportion of fish
fall release date
discharge
n = 1,500
0
500
1,000
1,500
2,000
0.00
0.01
0.02
0.03
0.04
0.05
11/1
11/1
5
11/2
9
12/1
3
12/2
7
1/1
0
1/2
4
2/7
2/2
1
3/6
3/2
0
4/3
4/1
7
5/1
5/1
5
5/2
9
6/1
2
6/2
6
Stre
am d
isch
arge
(ft3 /
s)
Pro
po
rtio
n o
f fis
h/d
ay
GRE-6.13 Detections, Spring and Fall Releases, 2015-2016
proportion of fish
fall release date
discharge
n = 1,212

18
IV. Discussion Overall, we documented very few detections of juvenile hatchery coho entering the side channel during the two years following project implementation. This can be explained by the fact that the majority of the fish were overwintering upstream of the enhancement reach, and is not an indication that the newly-created habitat is not suitable for overwintering juvenile salmon. As the coho population in Green Valley Creek begins to grow and expand over time with recovery efforts, this newly-created habitat will likely play an important role in providing resting and feeding refuge for juveniles through the winter season. It is also important to note that our study did not include monitoring of wild coho or steelhead populations, which may have benefited from the enhancement project over the past two years. Furthermore, the fact that 45% of the 11 adult fish detected in the mainstem of Green Valley Creek in the project reach in the winter of 2014/15 were also detected on the antenna array at the side-channel inlet indicates that adult salmonids are likely benefitting from the flow refugia provided by the off-channel habitat.
Operation of the antennas in the enhancement reach, as well as two arrays further upstream in the watershed, has provided valuable information about juvenile salmon winter movement patterns in Green Valley Creek that can be used to help to guide and support future habitat enhancement work. Because the majority of the juveniles that moved downstream during the winter season appeared to overwinter between river kilometers 9.98 and 13.40, we suggest implementing projects further upstream in the watershed, in closer proximity to the highest-quality spawning and summer-rearing habitat where fish are present at higher densities. We also documented overwintering of juveniles between the GRE-9.98 array and the enhancement reach; a reach that encompasses the confluence of Atascadero with the mainstem of Green Valley Creek. Although it is outside the scope of our current monitoring work, it is likely that this reach offers important overwintering habitat for salmon and steelhead populations in Green Valley Creek and improvements to habitat in that area could also help set the stage for population expansion.
V. References Buchanan, T.J., and Somers, W.P. 1969. Discharge measurements at gaging stations: U.S. Geological Survey Techniques of Water-Resources Investigations, Book 3, Chapter A8, 65 p. (Also available at http://pubs.usgs.gov/twri/twri3a8/.)