FINAL REPORT - codot.gov
23
Applied Research and Innovation Branch FINAL REPORT Effectiveness of Two Reflection Crack Attenuation Techniques Scott Shuler Report No. CDOT-2015-10 September 2015
Transcript of FINAL REPORT - codot.gov

Applied Research and Innovation
Branch
FINAL REPORT
Effectiveness of Two Reflection
Crack Attenuation Techniques
Scott Shuler
Report No. CDOT-2015-10
September 2015

The contents of this report reflect the views of the
author, who is responsible for the facts and accuracy
of the data presented herein. The contents do not
necessarily reflect the official views of the Colorado
Department of Transportation or the Federal Highway
Administration. This report does not constitute a
standard, specification, or regulation.

1. Report No.
CDOT-2015-10
Technical Report Documentation Page 2. Government Accession No. 3. Recipient's Catalog No.
4. Title and Subtitle
Effectiveness of Two Reflection Crack Attenuation
Techniques
5. Report Date
September 2015
6. Performing Organization Code
7. Author(s)
Scott Shuler 8. Performing Organization Report No.
CDOT-DTD-R-2015-10
9. Performing Organization Name and Address
Colorado Department of Transportation - Research 4201 E. Arkansas Ave. Denver, CO 80222
Colorado State University
Ft. Collins, CO 80523-1584
10. Work Unit No. (TRAIS)
11. Contract or Grant No.
Performed internally by CDOT-Research Office and Colorado State University
12. Sponsoring Agency Name and Address
Colorado Department of Transportation - Research 4201 E. Arkansas Ave. Denver, CO 80222
15. Supplementary Notes
13. Type of Report and Period Covered
Final Report, September 2015
14. Sponsoring Agency Code
Study #11.50
Prepared in cooperation with the US Department of Transportation, Federal Highway Administration
16. Abstract
Asphalt overlays are one of the most common tools for rehabilitating existing asphalt and concrete pavements.
However, the performance of new overlays is often jeopardized by the cracking distress in the existing
pavement. This existing cracking propagates, or reflects, through the new overlay to the surface of the new
overlay. The rate at which this reflection cracking propagates to the surface is a function of overlay thickness,
crack severity, traffic loading and subgrade or subbase support. Once reflection cracks appear on the surface
of the new pavement, water and debris can enter the subbase and subgrade which can affect pavement strength
and reduce the life of the overlay. Therefore, reducing the rate at which these reflection cracks propagate to
the surface of the pavement is desirable in order to lengthen the time between rehabilitation projects or crack
sealing operations.
Various methods have been used in past decades in an attempt to reduce the rate of reflection crack
propagation. These include geosynthetic membranes and asphalt stress absorbing interlayers.
This study compares performance of a grid reinforcing system, a polymer modified asphalt-rich interlayer
system and control pavement test sections.
After five years of performance monitoring differences between the attenuation systems and the controls have
appeared.
17. Keywords: Reflection crack attenuation, asphalt overlay
reflection cracking, reflection crack interlayers
18. Distribution Statement
No restrictions. This document is available to the public
through the National Technical Information Service
Springfield, VA 22161; www.ntis.gov
19. Security Classif. (of this report)
Unclassified 20. Security Classif. (of this page)
Unclassified 21. No. of Pages
22. Price
Form DOT F 1700.7 (8-72) Reproduction of completed page authorized
ii

1
ACKNOWLEDGEMENTS
Many thanks to study panel members Gary DeWitt, CDOT Region 4 Materials, Skip Outcalt,
Research Branch, Richard Griffin, Research Branch, Michael Stanford, CDOT Materials and
Geotechnical Laboratory, Shamshad Hussain, CDOT Region 1 Materials, Donna Harmelink,
CO. Div. of FHWA, and Robert Shanks, R-5 Materials.
EXECUTIVE SUMMARY
Asphalt overlays are one of the most common tools for rehabilitating existing asphalt and
concrete pavements. Rehabilitation of existing pavements is often necessary after several years
due to distress such as cracking, moisture damage and permanent deformation. However, the
performance of new overlays is often jeopardized by the cracking distress in the existing
pavement. This existing cracking will propagate, or reflect, through the new overlay to the
surface of the new overlay. The rate at which this reflection cracking propagates to the surface
is a function of overlay thickness, crack severity, traffic loading and subgrade or subbase
support. Once reflection cracks appear on the surface of the new pavement, water and debris
can enter the subbase and subgrade which can affect pavement strength and reduce the life of
the overlay. Therefore, reducing the rate at which these reflection cracks propagate to the
surface of the pavement is desirable in order to lengthen the time between rehabilitation
projects.
Various methods have been used in past decades in an attempt to reduce the rate of reflection
crack propagation. These include geosynthetic interlayers and asphalt stress absorbing
interlayers between existing pavements and relatively thin overlays.
Two reflection crack attenuation techniques have been installed by CDOT: Tensar, a grid
reinforcing system, and a polymer modified asphalt-rich interlayer system called Reflection
Crack Interlayer or RCI. Locations where these systems were installed with control sections
are on I-70 at M.P. 255/256 (Tensar) and on US85 in Greeley and on US34 east of Kersey
(RCI).
This study presents the differences in performance after five years’ service for the two
reflection crack attenuation systems and the comparable control pavement test sections.
2
CONTENTS
ACKNOWLEDGEMENTS ....................................................................................................... 1
EXECUTIVE SUMMARY ........................................................................................................ 1
INTRODUCTION ...................................................................................................................... 3
BACKGROUND ......................................................................................................................... 3
EXPERIMENTAL METHOD .................................................................................................. 4
REFLECTION CRACK ATTENUATING METHODS ....................................................... 4
GlasGrid® .................................................................................................................................. 4
Reflective Crack Interlayer (RCI) ............................................................................................ 5
PAVEMENT TEST SECTIONS............................................................................................... 6
I-70 Golden ............................................................................................................................... 6
US85-Greeley ........................................................................................................................... 8
US34-Kersey East ..................................................................................................................... 9
PERFORMANCE ...................................................................................................................... 9
I-70 GlasGrid ............................................................................................................................ 9
Eastbound Right (Driving) Lane ......................................................................................... 10
Westbound Right (Driving) Lane ....................................................................................... 11
Eastbound Center Lane ....................................................................................................... 13
Eastbound Median Lane ..................................................................................................... 14
US 85 - Greeley ...................................................................................................................... 14
US 34 – Kersey East ............................................................................................................... 16
ANALYSIS ................................................................................................................................ 17
I-70 Golden ............................................................................................................................. 17
US85-Greeley ......................................................................................................................... 17
US34-Kersey East ................................................................................................................... 17
CONCLUSIONS ...................................................................................................................... 18
REFERENCES ......................................................................................................................... 19
3
INTRODUCTION
Asphalt overlays are one of the most common tools for rehabilitating existing asphalt and
concrete pavements. Rehabilitation of existing pavements is often necessary after several years
due to distress such as cracking, moisture damage and permanent deformation. However, the
performance of new overlays is often jeopardized by the cracking distress in the existing
pavement. This existing cracking will propagate, or reflect, through the new overlay to the
surface of the new overlay. The rate at which this reflection cracking propagates to the surface
is a function of overlay thickness, crack severity, traffic loading and subgrade or subbase
support. Once reflection cracks appear on the surface of the new pavement, water and debris
can enter the subbase and subgrade which can affect pavement strength and reduce the life of
the overlay. Therefore, reducing the rate at which these reflection cracks propagate to the
surface of the pavement is desirable in order to lengthen the time between rehabilitation
projects.
Various methods have been used in past decades in an attempt to reduce the rate of reflection
crack propagation. These include geosynthetic interlayers and asphalt stress absorbing
interlayers between existing pavements and relatively thin overlays.
Two reflection crack attenuation techniques have been installed by CDOT: Tensar, a grid
reinforcing system, and a polymer modified asphalt-rich interlayer system called Reflection
Crack Interlayer or RCI. Tensar was installed on I-70 at M.P. 255/256 while RCI was installed
on US85 in Greeley and on US34 east of Kersey. For each location a control section was set
aside where no reflective crack reduction treatment was used.
This study presents the differences in performance after five years’ service for these two
reflection crack attenuation systems and the comparable control pavement test sections.
BACKGROUND
When asphalt overlays are placed on substrate surfaces containing cracks the anecdotal rule-of-
thumb regarding the rate the cracks will appear in the new surface is usually considered to be
one inch per year. So, a two inch thick asphalt overlay placed on top of a cracked substrate
pavement should display cracks reflected through from below in two years. As stated above
there are many factors that affect this leading to either faster or slower crack growth than
predicted. However, the underlying cracks almost always reappear unless the overlay
thickness is substantial.
Many different techniques have been attempted to reduce or even eliminate these so-called
reflection cracks. These include stress-absorbing membrane interlayers (SAMI) (Epps,
Heitzman, Shuler), geotextiles (Bush et al, Button et al, Buttlar et al, Cleveland et al, Hutter),
large aggregate layers, cracking and seating, rubblizing and, most recently, low modulus hot
mix asphalt (Makowski et al) and fiber glass reinforced grid systems (Vespa et al). Fracture
mechanics indicates that if a material of low stiffness modulus is sandwiched between two
layers of higher modulus, energy generated at the tip of a crack during propagation will be
4
dissipated in the low modulus layer and further movement of the crack will cease (Sanford
1997). Although this theory is sound for homogeneous, linear elastic materials it has been less
successful when predicting crack growth in non-homogeneous, viscoelastic and thermoplastic
materials (Germann and Lytton).
Various reflection crack attenuation techniques have demonstrated varying degrees of success
over the past 40 years, none of which, to the knowledge of this writer, and after reviewing the
literature completely halt reflection cracking. Indeed, most suppliers of reflection crack
attenuation materials or methods would agree the materials and methods are intended to slow
the progression of the reflection cracks, not stop progression. However, the economics of
reflection crack interlayers can work if the interlayer slows crack progression enough to
postpone maintenance activities.
EXPERIMENTAL METHOD
This report summarizes the performance of two types of reflection crack attenuation systems
over a five year period of service. These systems were installed in three different pavements as
test sections with corresponding control sections. One system was placed on one pavement
and the other placed on two pavements. Performance of the test sections was evaluated using
visual condition survey methods (SHRP 1990) for five years in the case of one system and two
years in the case of the other.
REFLECTION CRACK ATTENUATING METHODS
Two types of reflection crack attenuation processes were evaluated in this research study.
These are described below.
GlasGrid®
This is a patented product of Saint-Gobain ADFORS, distributed for use in the U.S. by Tensar
International Corporation. Saint-Gobain describes this product as a “Pavement Reinforcement
System composed of fiberglass strands coated with an elastomeric polymer and formed into a
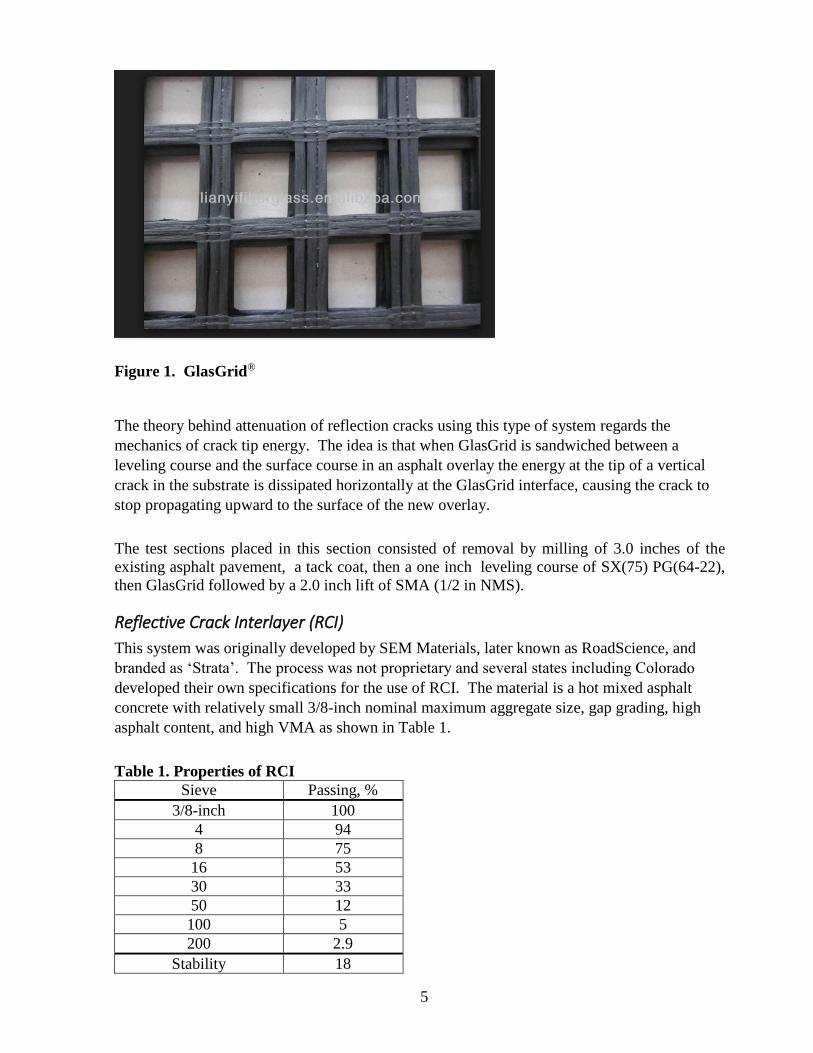
grid structure” as shown in Figure 1.
5
Figure 1. GlasGrid®
The theory behind attenuation of reflection cracks using this type of system regards the
mechanics of crack tip energy. The idea is that when GlasGrid is sandwiched between a
leveling course and the surface course in an asphalt overlay the energy at the tip of a vertical
crack in the substrate is dissipated horizontally at the GlasGrid interface, causing the crack to
stop propagating upward to the surface of the new overlay.
The test sections placed in this section consisted of removal by milling of 3.0 inches of the
existing asphalt pavement, a tack coat, then a one inch leveling course of SX(75) PG(64-22),
then GlasGrid followed by a 2.0 inch lift of SMA (1/2 in NMS).
Reflective Crack Interlayer (RCI)
This system was originally developed by SEM Materials, later known as RoadScience, and
branded as ‘Strata’. The process was not proprietary and several states including Colorado
developed their own specifications for the use of RCI. The material is a hot mixed asphalt
concrete with relatively small 3/8-inch nominal maximum aggregate size, gap grading, high
asphalt content, and high VMA as shown in Table 1.
Table 1. Properties of RCI
Sieve Passing, %
3/8-inch 100
4 94
8 75
16 53
30 33
50 12
100 5
200 2.9
Stability 18
6
VTM, % 4.5
VMA, % 23.5
AC, % 9.5
PG Grade 70-28
Compaction, gyrations 50
The material is placed as a 1-inch interlayer sandwiched between the cracked substrate
pavement and the new overlay. The idea of RCI systems is to create a lower modulus layer
between the substrate and the overlay that will cause crack tip energy to dissipate in the RCI
and not propagate upward to the pavement surface.
PAVEMENT TEST SECTIONS
Test sites are located on I-70 east of Golden, on US85 in Greeley and on US34 east of Kersey.
The vicinity of these sites are shown in Figures 2, 3, and 4.
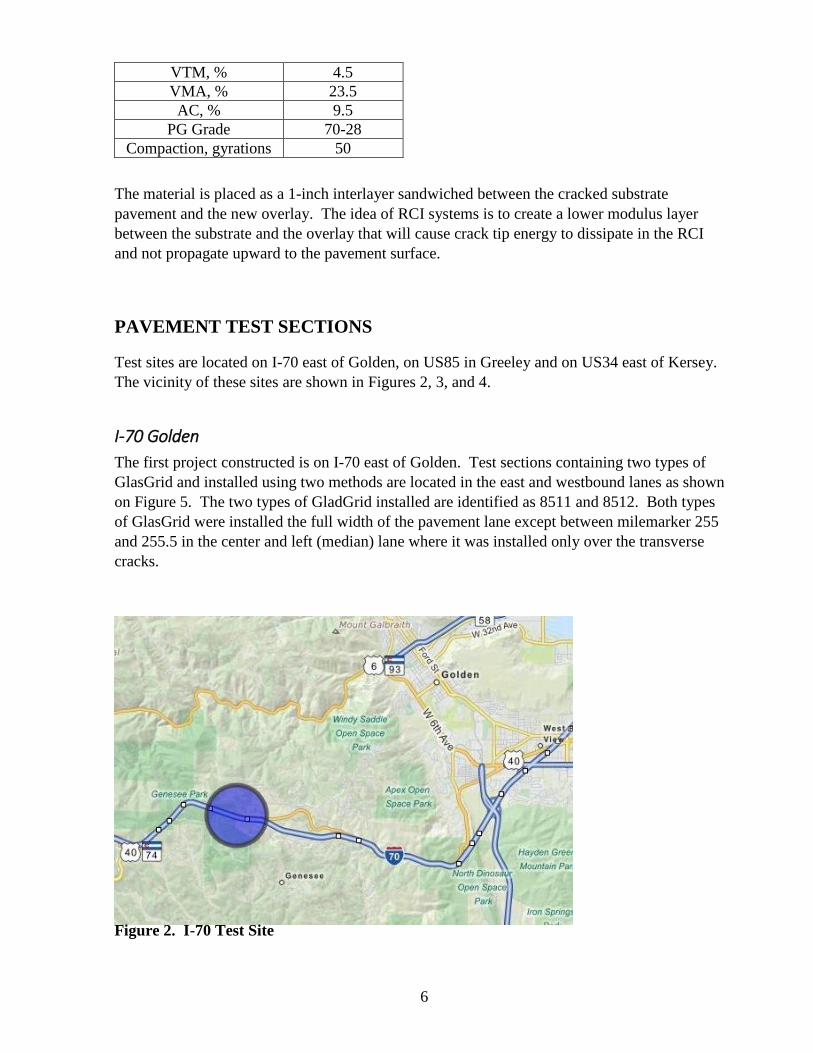
I-70 Golden
The first project constructed is on I-70 east of Golden. Test sections containing two types of
GlasGrid and installed using two methods are located in the east and westbound lanes as shown
on Figure 5. The two types of GladGrid installed are identified as 8511 and 8512. Both types
of GlasGrid were installed the full width of the pavement lane except between milemarker 255
and 255.5 in the center and left (median) lane where it was installed only over the transverse
cracks.
Figure 2. I-70 Test Site

7
Figure 3. US85 Test Site
Figure 4. US34 Test Site

8
Figure 5. I-70 Test Section Locations
US85-Greeley
The second test sections were constructed on US85 in Greeley as shown in Figure 6. These
test sections were constructed with an RCI system in the northbound lanes between 24th and
26th Streets, in the southbound driving lane, and in the passing lane from 25th to 26th Streets. A
control section was included in the southbound passing lane from 24th to 25th Streets.
This section consists of a 3.0 inch hot mixed asphalt surface course and a 1.0 inch RCI layer
placed over the original jointed concrete pavement.
Figure 6. US85 Test Section Locations
9
US34-Kersey East
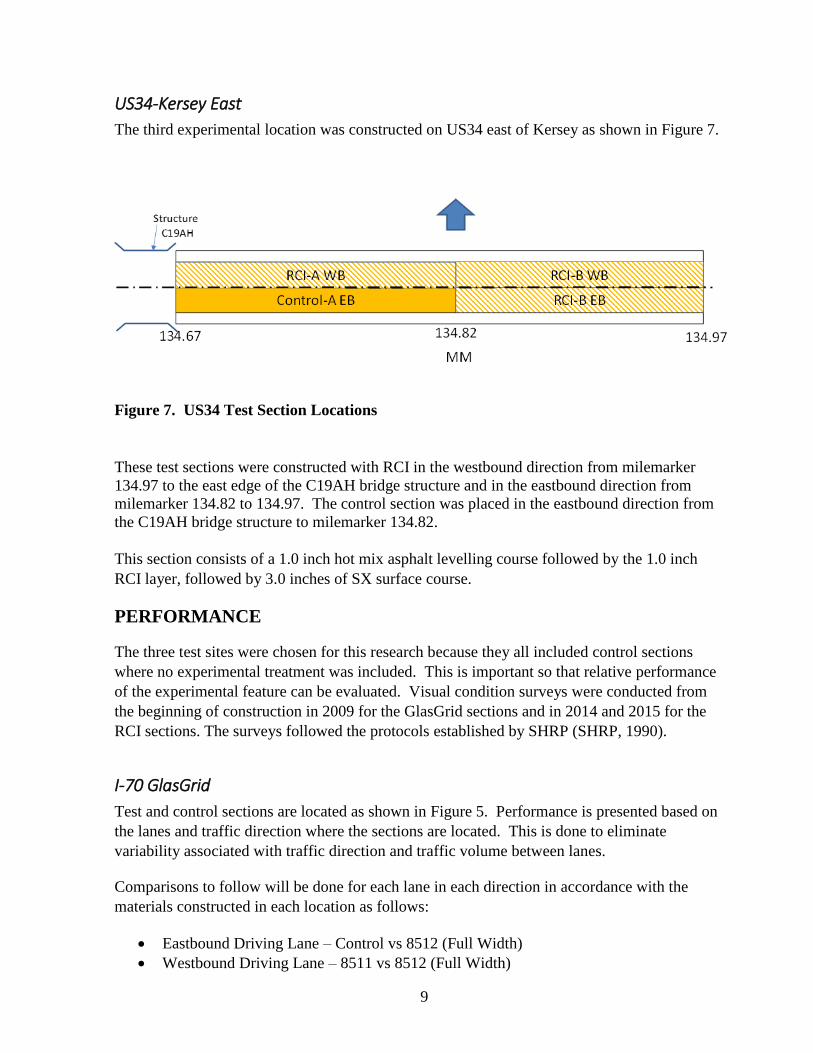
The third experimental location was constructed on US34 east of Kersey as shown in Figure 7.
Figure 7. US34 Test Section Locations These test sections were constructed with RCI in the westbound direction from milemarker
134.97 to the east edge of the C19AH bridge structure and in the eastbound direction from
milemarker 134.82 to 134.97. The control section was placed in the eastbound direction from
the C19AH bridge structure to milemarker 134.82.
This section consists of a 1.0 inch hot mix asphalt levelling course followed by the 1.0 inch
RCI layer, followed by 3.0 inches of SX surface course.
PERFORMANCE
The three test sites were chosen for this research because they all included control sections
where no experimental treatment was included. This is important so that relative performance
of the experimental feature can be evaluated. Visual condition surveys were conducted from
the beginning of construction in 2009 for the GlasGrid sections and in 2014 and 2015 for the
RCI sections. The surveys followed the protocols established by SHRP (SHRP, 1990).
I-70 GlasGrid
Test and control sections are located as shown in Figure 5. Performance is presented based on
the lanes and traffic direction where the sections are located. This is done to eliminate
variability associated with traffic direction and traffic volume between lanes.
Comparisons to follow will be done for each lane in each direction in accordance with the
materials constructed in each location as follows:
Eastbound Driving Lane – Control vs 8512 (Full Width)
Westbound Driving Lane – 8511 vs 8512 (Full Width)
10
Eastbound Center Lane – 8511 vs 8512 (Cracks Only) vs Control
Eastbound Median Lane - 8511 vs 8512 (Cracks Only) vs Control
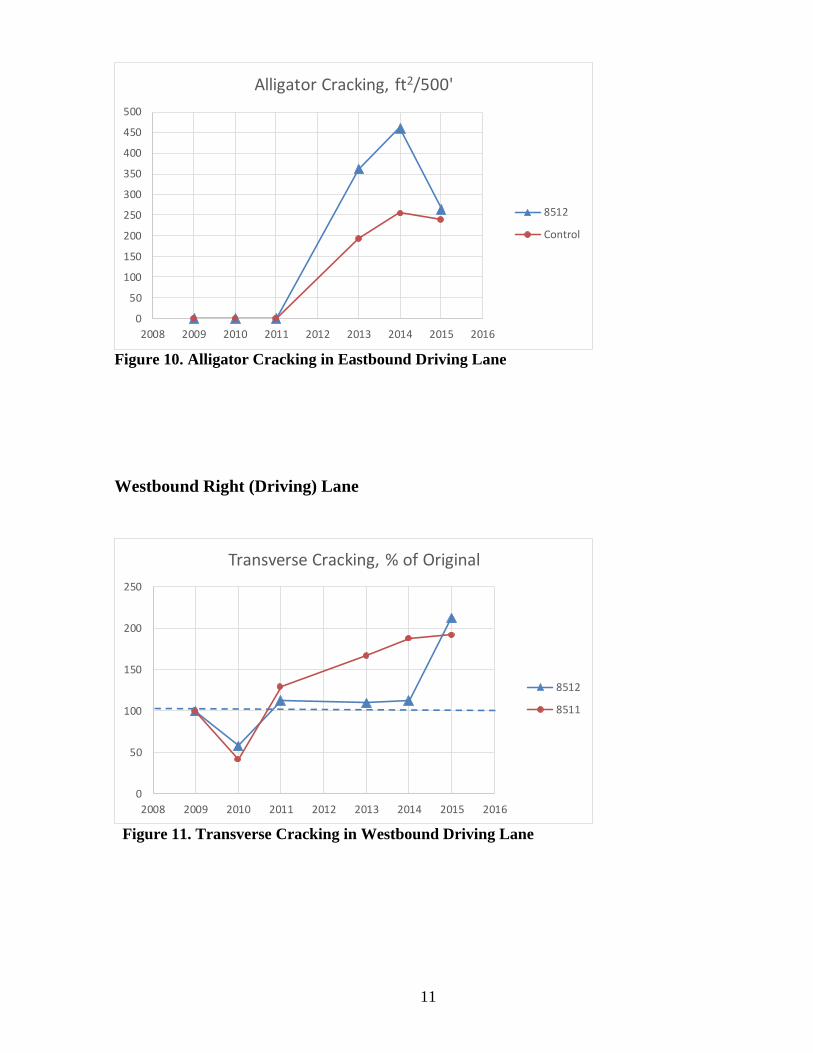
Distress in these test sections consists of longitudinal, transverse and alligator cracking. Results
are presented as a percentage of the original cracking when that form of distress was present in
the original pavement. However, when no distress was present in the original pavement,
results are shown as the amount of cracking observed in square feet or linear feet for alligator
and longitudinal, respectively, for the length of the evaluation sections.
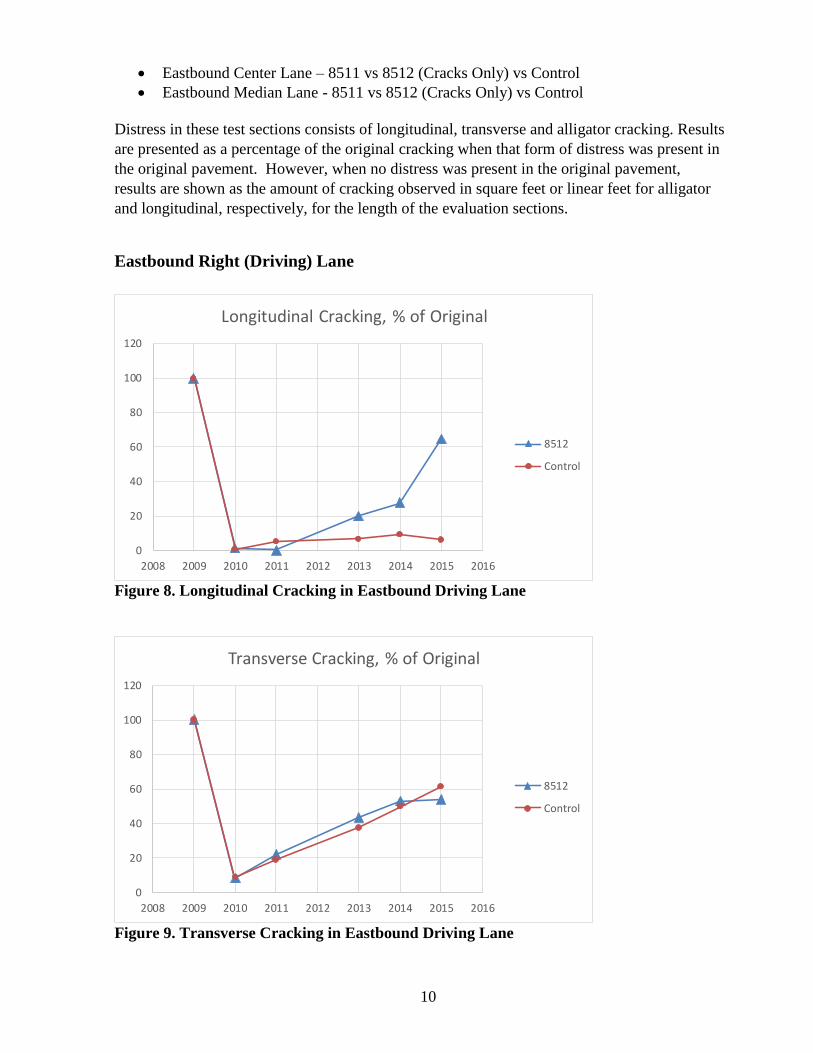
Eastbound Right (Driving) Lane
0
20
40
60
80
100
120
2008 2009 2010 2011 2012 2013 2014 2015 2016
Longitudinal Cracking, % of Original
8512
Control
Figure 8. Longitudinal Cracking in Eastbound Driving Lane
0
20
40
60
80
100
120
2008 2009 2010 2011 2012 2013 2014 2015 2016
Transverse Cracking, % of Original
8512
Control
Figure 9. Transverse Cracking in Eastbound Driving Lane
11
0
50
100
150
200
250
300
350
400
450
500
2008 2009 2010 2011 2012 2013 2014 2015 2016
Alligator Cracking, ft2/500'
8512
Control
Figure 10. Alligator Cracking in Eastbound Driving Lane
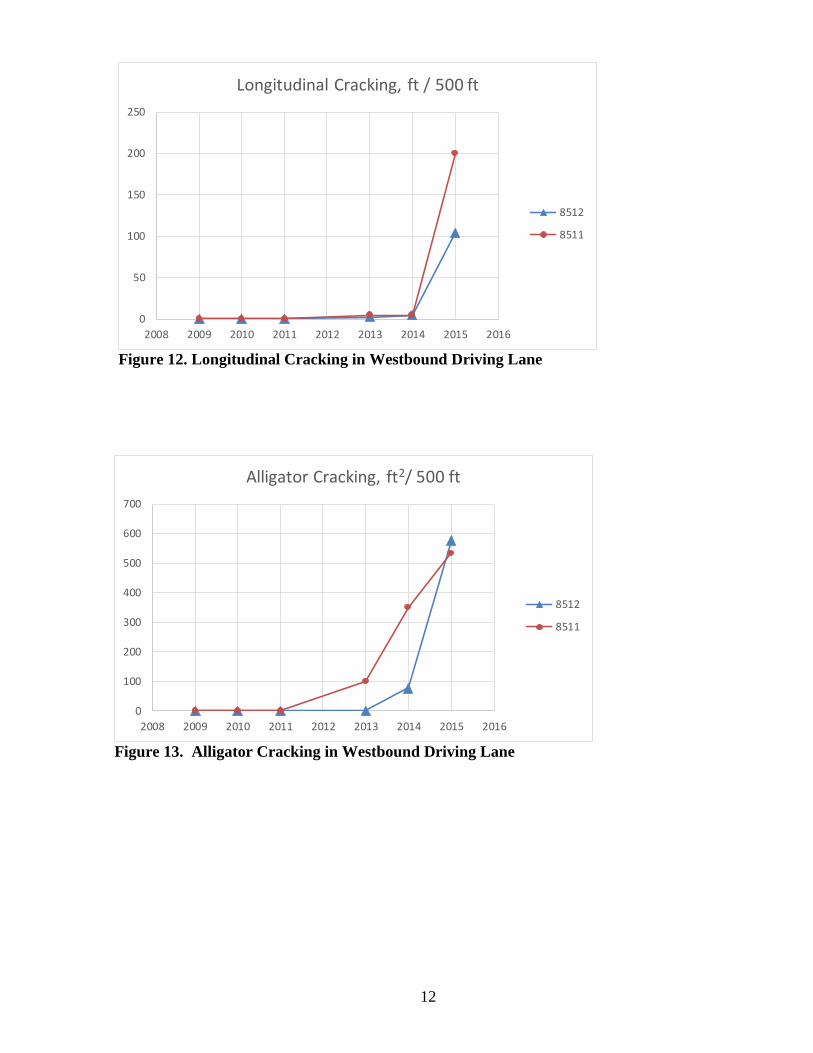
Westbound Right (Driving) Lane
0
50
100
150
200
250
2008 2009 2010 2011 2012 2013 2014 2015 2016
Transverse Cracking, % of Original
8512
8511
Figure 11. Transverse Cracking in Westbound Driving Lane
12
0
50
100
150
200
250
2008 2009 2010 2011 2012 2013 2014 2015 2016
Longitudinal Cracking, ft / 500 ft
8512
8511
Figure 12. Longitudinal Cracking in Westbound Driving Lane
0
100
200
300
400
500
600
700
2008 2009 2010 2011 2012 2013 2014 2015 2016
Alligator Cracking, ft2/ 500 ft
8512
8511
Figure 13. Alligator Cracking in Westbound Driving Lane
13
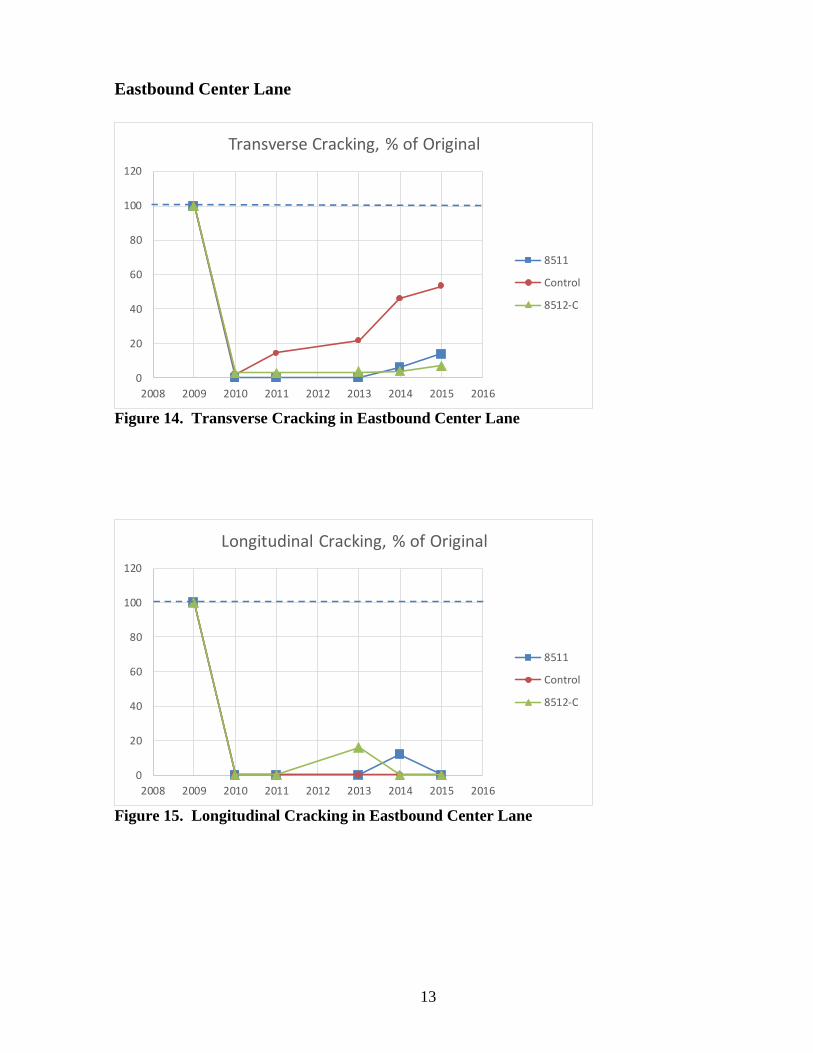
Eastbound Center Lane
0
20
40
60
80
100
120
2008 2009 2010 2011 2012 2013 2014 2015 2016
Transverse Cracking, % of Original
8511
Control
8512-C
Figure 14. Transverse Cracking in Eastbound Center Lane
0
20
40
60
80
100
120
2008 2009 2010 2011 2012 2013 2014 2015 2016
Longitudinal Cracking, % of Original
8511
Control
8512-C
Figure 15. Longitudinal Cracking in Eastbound Center Lane
14
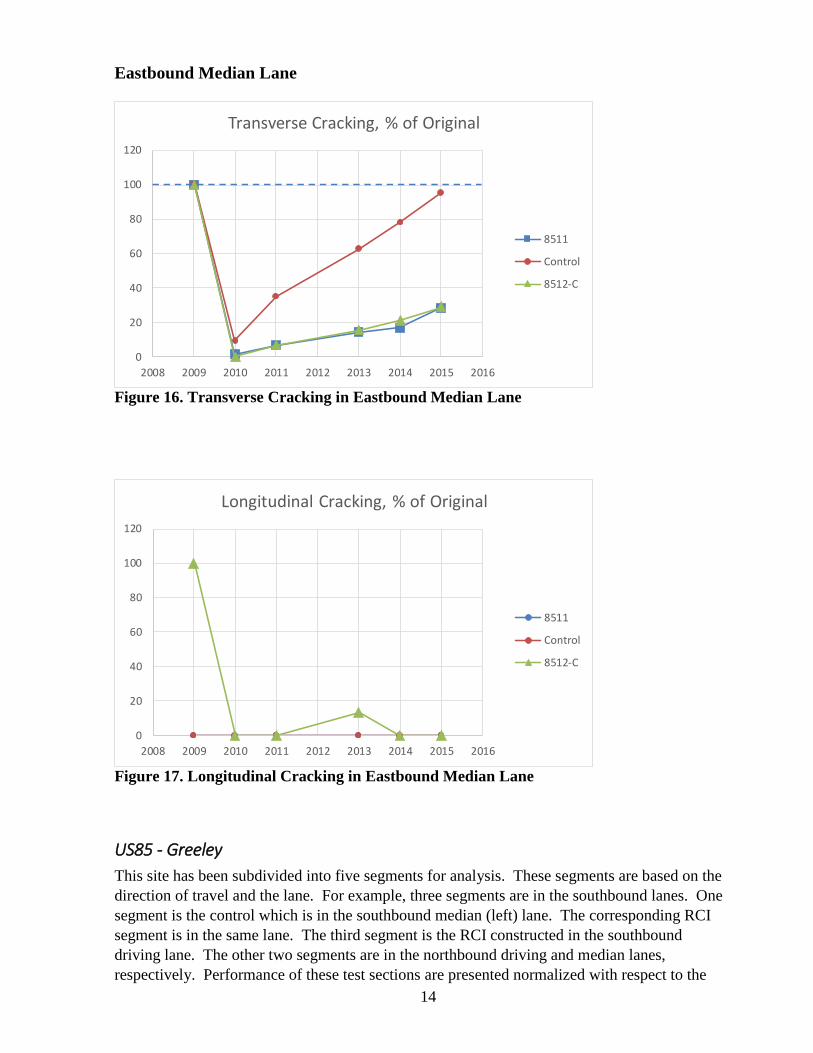
Eastbound Median Lane
0
20
40
60
80
100
120
2008 2009 2010 2011 2012 2013 2014 2015 2016
Transverse Cracking, % of Original
8511
Control
8512-C
Figure 16. Transverse Cracking in Eastbound Median Lane
0
20
40
60
80
100
120
2008 2009 2010 2011 2012 2013 2014 2015 2016
Longitudinal Cracking, % of Original
8511
Control
8512-C
Figure 17. Longitudinal Cracking in Eastbound Median Lane
US85 - Greeley
This site has been subdivided into five segments for analysis. These segments are based on the
direction of travel and the lane. For example, three segments are in the southbound lanes. One
segment is the control which is in the southbound median (left) lane. The corresponding RCI
segment is in the same lane. The third segment is the RCI constructed in the southbound
driving lane. The other two segments are in the northbound driving and median lanes,
respectively. Performance of these test sections are presented normalized with respect to the
15
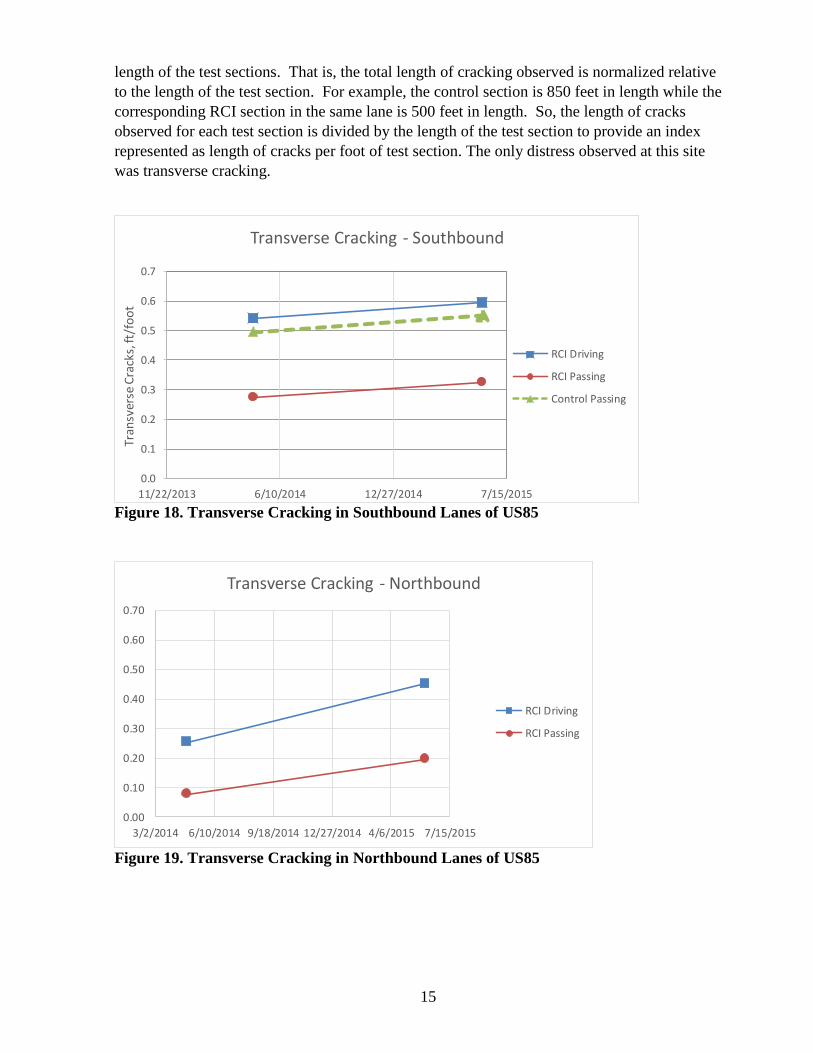
length of the test sections. That is, the total length of cracking observed is normalized relative
to the length of the test section. For example, the control section is 850 feet in length while the
corresponding RCI section in the same lane is 500 feet in length. So, the length of cracks
observed for each test section is divided by the length of the test section to provide an index
represented as length of cracks per foot of test section. The only distress observed at this site
was transverse cracking.
0.0
0.1
0.2
0.3
0.4
0.5
0.6
0.7
11/22/2013 6/10/2014 12/27/2014 7/15/2015
Tran
sver
se C
rack
s, ft
/fo
ot
Transverse Cracking - Southbound
RCI Driving
RCI Passing
Control Passing
Figure 18. Transverse Cracking in Southbound Lanes of US85
0.00
0.10
0.20
0.30
0.40
0.50
0.60
0.70
3/2/2014 6/10/2014 9/18/2014 12/27/2014 4/6/2015 7/15/2015
Transverse Cracking - Northbound
RCI Driving
RCI Passing
Figure 19. Transverse Cracking in Northbound Lanes of US85
16
US34 – Kersey East
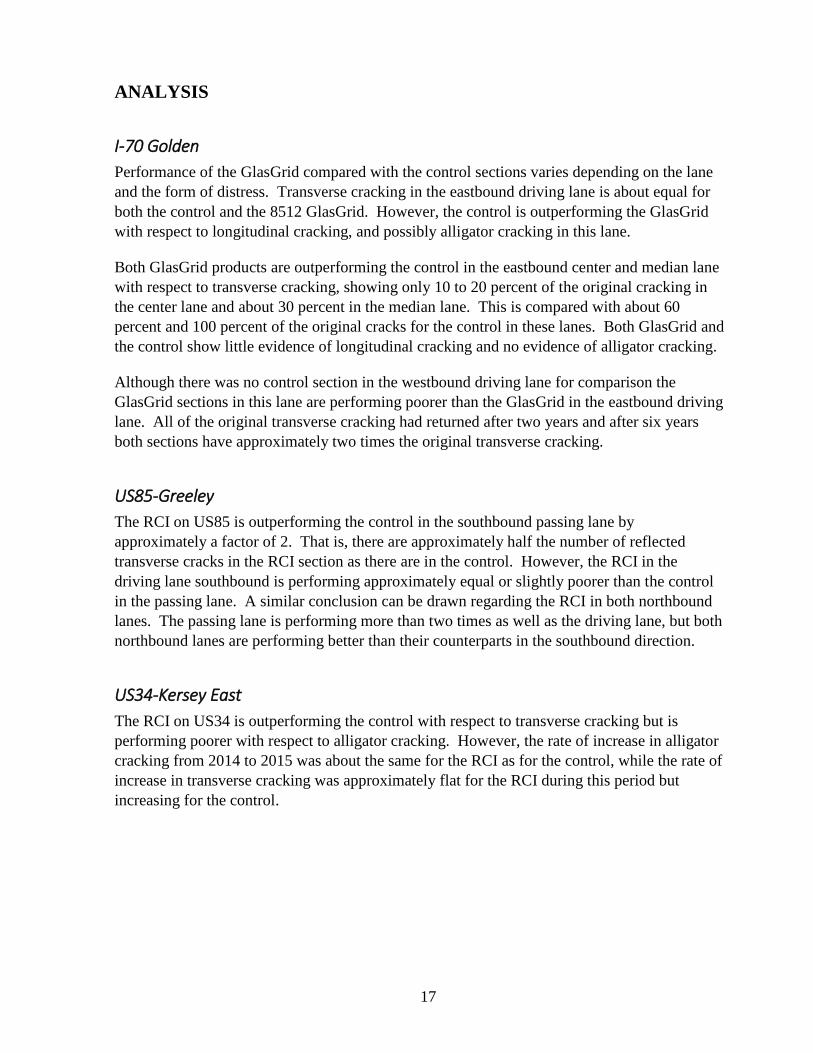
This site has been subdivided into four segments for analysis. These segments are based on the
direction of travel and whether east or west of the center of the evaluation area. Each segment
is the same length, so normalization of data was not required as for US85. Transverse cracking
and alligator cracking are the only distresses present, to date. Since the amount of cracking
seemed to be significantly lower near the east end of the test area, the analysis has been divided
into two portions labelled ‘A’ and ‘B’ for the west and east portions, respectively. The control
section in the eastbound lane and the corresponding RCI section in the opposite lane is the ‘A’
portion immediately east of the bridge structure. The RCI sections to the east of the control are
the ‘B’ portions. Performance of these sections are shown in Figures 20 and 21.
0
50
100
150
200
250
300
350
Mar-14 Jun-14 Sep-14 Dec-14 Apr-15 Jul-15
Tran
sver
se C
rack
ing,
ft
Transverse Cracking-US34 Kersey
A-Control-EB
A-RCI-WB
B-RCI-EB
B-RCI-WB
Figure 20. Transverse Cracking on US34
0
50
100
150
200
250
300
350
400
Mar-14 Jun-14 Sep-14 Dec-14 Apr-15 Jul-15
Alli
gato
r C
rack
ing,
sq
ft
Alligator Cracking-US34 Kersey
A-Control-EB
A-RCI-WB
B-RCI-EB
B-RCI-WB
Figure 21. Alligator Cracking on US34
17
ANALYSIS
I-70 Golden
Performance of the GlasGrid compared with the control sections varies depending on the lane
and the form of distress. Transverse cracking in the eastbound driving lane is about equal for
both the control and the 8512 GlasGrid. However, the control is outperforming the GlasGrid
with respect to longitudinal cracking, and possibly alligator cracking in this lane.
Both GlasGrid products are outperforming the control in the eastbound center and median lane
with respect to transverse cracking, showing only 10 to 20 percent of the original cracking in
the center lane and about 30 percent in the median lane. This is compared with about 60
percent and 100 percent of the original cracks for the control in these lanes. Both GlasGrid and
the control show little evidence of longitudinal cracking and no evidence of alligator cracking.
Although there was no control section in the westbound driving lane for comparison the
GlasGrid sections in this lane are performing poorer than the GlasGrid in the eastbound driving
lane. All of the original transverse cracking had returned after two years and after six years
both sections have approximately two times the original transverse cracking.
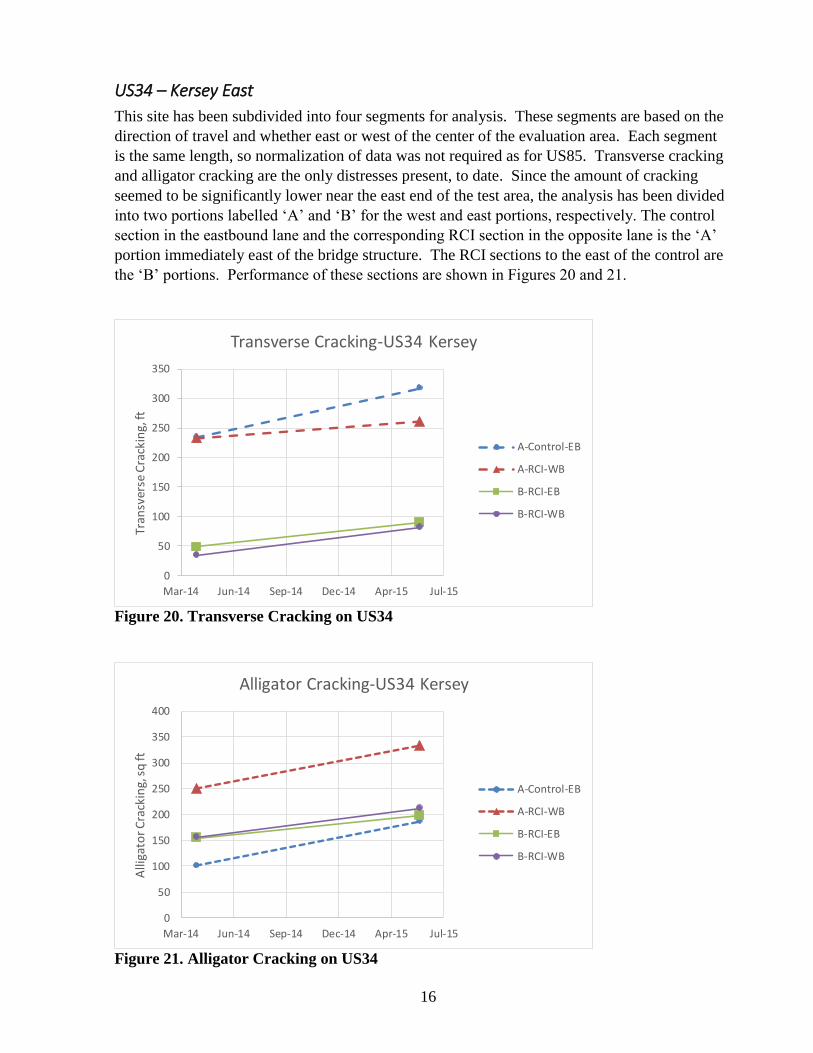
US85-Greeley
The RCI on US85 is outperforming the control in the southbound passing lane by
approximately a factor of 2. That is, there are approximately half the number of reflected
transverse cracks in the RCI section as there are in the control. However, the RCI in the
driving lane southbound is performing approximately equal or slightly poorer than the control
in the passing lane. A similar conclusion can be drawn regarding the RCI in both northbound
lanes. The passing lane is performing more than two times as well as the driving lane, but both
northbound lanes are performing better than their counterparts in the southbound direction.
US34-Kersey East
The RCI on US34 is outperforming the control with respect to transverse cracking but is
performing poorer with respect to alligator cracking. However, the rate of increase in alligator
cracking from 2014 to 2015 was about the same for the RCI as for the control, while the rate of
increase in transverse cracking was approximately flat for the RCI during this period but
increasing for the control.

18
CONCLUSIONS
1. The GlasGrid on I-70 is performing approximately equal to the control section with
respect to transverse cracking in the eastbound driving lane; both sections having
approximately 60 percent of the original transverse cracks present after six years.
However, the two GlasGrid sections in the westbound driving lane are performing
significantly poorer; with approximately two times the original transverse cracking.
2. The control section is performing better than the GlasGrid in the eastbound driving lane
with respect to longitudinal and alligator cracking.
3. The GlasGrid in the center and left (median) lane is performing better than the control
section with respect to transverse cracking.
4. The RCI on US85 in the southbound direction is outperforming the control section in
the passing lane by a factor of two. However, the RCI in the driving lane adjacent to
the control is performing slightly poorer than the control. RCI in the northbound
passing lane is performing more than two times as well as the RCI in the driving lane,
but both northbound lanes are performing better than their counterparts in the
southbound direction.
5. The RCI on US34 is outperforming the control with respect to transverse cracking but
is performing poorer with respect to alligator cracking.

19
REFERENCES
1. Bush, A.J. and E.W. Brooks. Geosynthetic Materials in Reflective Crack Prevention.
Research Report No. SR 537, Research Unit, Oregon Department of Transportation,
Salem, Oregon, 2007.
2. Buttlar, W.G., D. Bozkurt, and B.J. Dempsey. Cost-Effectiveness of Paving Fabrics
Used to Control Reflective Cracking. Transportation Research Record 1730,
Transportation Research Board, National Academy of Sciences, 2000, pp. 139–149.
3. Button, J. W. and A. Chowdhury. Field Tests Using Geosynthetics in Flexible and
Rigid Pavements to Reduce Reflection Cracking. Research Report No. FHWA/TX-
06/1777-2, Texas Transportation Institute, Texas A&M University, College Station,
Texas, 2006.
4. Cleveland, G.S., J.W. Button, and R.L. Lytton. Geosynthetics in Flexible and Rigid
Pavement Overlay Systems to Reduce Reflection Cracking. Research Report No.
FHWA/TX-02/1777-1, Texas Transportation Institute, Texas A&M University, College
Station, Texas, 2002.
5. Epps, Jon A., “Uses of Recycled Rubber Tires in Highways,” NCHRP Synthesis 198,
Transportation Research Board, 1994.
6. Germann, F.P. and R.L. Lytton. Methodology for Predicting the Reflection Cracking
Life of Asphalt Concrete Overlays. Research Report FHWA/TX-79/09+207-5, Texas
Transportation Institute, Texas A&M University, College Station, Texas, 1979.
7. Heitzman, M., “State of the Practice – Design and Construction of Asphalt Paving
Materials with Crumb Rubber Modifier,” FHWA-SA-92-202, Federal Highway
Administration, May 1992.
8. Sanford, R. J., “Selected Papers on Crack Tip Stress Fields”, Society for Experimental
Mechanics (SEM). See also MS 137, a companion volume of Selected Papers on
Foundations of Linear Elastic Fracture Mechanics, R.J. Sanford, Editor, University of
Maryland, College Park, Dept. of Mechanical Engineering, 676 pages/61 papers,
Published 1997.
9. Hutter, W. Crack Reduction Strategies on a Pavement Warranty Project (Interstate 25 at
Fountain, Colorado). Report No. CDOT-DTD-R-2003-5, Colorado Department of
Transportation, Denver, Colorado, 2003.
10. Makowski, L., D.L. Bischoff, P. Blankenship, D. Sobczak, and F. Haulter. Wisconsin
Experiences with Reflective Crack Relief Projects. Transportation Research Record
1905, Transportation Research Board, National Academy of Sciences, Washington,
D.C., 2005, pp. 44–55.
11. Distress Identification Manual for the Long-Term Pavement Performance Studies.
Report No. SHRP-LTPP/FR-90-001, Strategic Highway Research Program, National
Research Council, Washington, D.C., 1990.
12. Vespa, J.W. An Evaluation of Interlayer Stress Absorbing Composite (ISAC)
Reflective Crack Relief System. Report No. FHWA/IL/PRR 150, Illinois Department
of Transportation, Bureau of Materials and Physical Research, Springfield, Illinois,
2005.