Final project dabur
43
Session 2012-13 CONTENTS Sl. No. Topics Pg. No. 1. Introduction 2 2. Objectives of the Study 3 3. Research Design of the Study 4 4. Methodology 4 5. Tools used for Analysis of Financial Statements 4 6. Limitation of the Study 5 7. Company Profile 6 8. Financial Statements Analysis 9-20 9. Ratio Analysis 21 10. Findings (Interpretation) 23 11. Suggestions 24 12. Conclusion 25 13. References 1 | Page Roll No.: 68203U09038
-
Upload
ashis-mohapatra -
Category
Education
-
view
238 -
download
5
Transcript of Final project dabur
Session 2012-13
CONTENTS
Sl. No. Topics Pg. No.
1. Introduction 2
2. Objectives of the Study 3
3. Research Design of the Study 4
4. Methodology 4
5. Tools used for Analysis of Financial Statements 4
6. Limitation of the Study 5
7. Company Profile 6
8. Financial Statements Analysis 9-20
9. Ratio Analysis 21
10.Findings (Interpretation) 23
11.Suggestions 24
12.Conclusion 25
13.References
1 | P a g e Roll No.: 68203U09038
Session 2012-13
INTRODUCTION
Financial analysis is the starting point for making plans, before using any
sophisticated forecasting and planning procedures. Understanding the past is a
prerequisite for anticipating the future. Financial analysis is the process of
identifying the financial strength and weakness of the firm by properly
establishing relationship between the items of the balance sheet and the profit
and loss account. Financial analysis can be undertaken by management of the
firm, or by parties outside the firm, viz. owners, creditors, investors and others.
The nature of analysis will differ depending on the purpose of the analyst.
The story of Dabur began with a small, but visionary endeavour by Dr. S. K.
Burman, a physician tucked away in Bengal. His mission was to provide effective
and affordable cure for ordinary people in far-flung villages. With missionary
zeal and fervour, Dr. Burman undertook the task of preparing natural cures for
the killer diseases of those days, like cholera, malaria and plague.
Soon the news of his medicines traveled, and he came to be known as the trusted
'Daktar' or Doctor who came up with effective cures. And that is how his venture
Dabur got its name - derived from the Devanagri rendition of Daktar Burman.
Dr. Burman set up Dabur in 1884 to produce and dispense Ayurvedic medicines.
Reaching out to a wide mass of people who had no access to proper treatment.
Dr. S. K. Burman's commitment and ceaseless efforts resulted in the company
growing from a fledgling medicine manufacturer in a small Calcutta house, to a
household name that at once evokes trust and reliability.
2 | P a g e Roll No.: 68203U09038
Session 2012-13
OBJECTIVES TO THE STUDY
The objectives of the study are to evaluate the financial position and
performance of the “TATA Consultancy Services” The purpose of the study
aims at a critical analysis of the financial statements of the Company. And makes
attempt to get better insight about the financial strength and weakness of the
organisation by analyzing and interpreting the data for a period of 2 years i.e.
2010 and 2011.
To study the financial performance of “TATA Consultancy Services”.
To determine the profitability or earning capacity of the concern
To analyze the strength and weakness of the organisation on the basis of its
financial position.
To suggest solution, if any, to the unfavorable financial conditions and
financial performance.
To act of analysis may also reveal areas where control is deficit and
desirable for the efficient operating of the organisation which in turn
help to achieve organizational goals.
To know the solvency of the company.
To make comparative study with other year performance.
To know the capability of payment of dividend and interest.
To know the profitability of the company in the form of ratios
3 | P a g e Roll No.: 68203U09038
Session 2012-13
RESEARCH DESIGN OF THE STUDY
Research design means a search of facts, answers to question and solution
to the problems. It is a prospective investigation. Research is a systematical
logical study of an issue or problem through scientific method. It is a
systematic and objective analysis and recording of controlled observation that
may lead to the development of generalization, principles, resulting in
prediction ultimate control of events.
Research design is the arrangement of conditions for the collection and
analysis of data in manner that aims to combine relevance to the research
purpose with relevance to economy. There are various designs, which are
descriptive and helpful for analytical research.
METHODOLOGY
Sources of data can be classified into two groups they are:
Primary data and
Secondary data
In this project all the data are analyzed on the basis of secondary data.
Secondary Sources:
The investigation relied on books, documents, annual report, financial
assessments, literature, files and personal observation to have an idea about
the organizational set up, functions of financial department and other groups.
4 | P a g e Roll No.: 68203U09038
Session 2012-13
TOOLS USED FOR ANALYSIS OF FINANCIAL STATEMENTS:
The numbers given in the financial statement are not of much use to the
decision maker. These numbers are to be analysed over a period of time or
relation to other numbers so that significant conclusions could be drawn
regarding the strengths and weakness of a business enterprise. The tools of
financial analysis help in this regard. These tools include:
Comparative Statements;Common-size Statements;Comparative Balance Sheet;Common Size Balance Sheet;Ratio Analysis;Cash flow Statements;Changes in Financial Position.
In this project we show or discuss:
1. Profit & Loss Account
2. Balance Sheet
3. Comparative Statements.
4. Common-Size Statements &
5. Comparative Balance Sheet;
6. Common Size Balance Sheet;
7. Ratio Analysis of financial statement of “TATA Consultancy Services”
Limitation of the Study:
Every work has its own limitation. During the process of conducting the
research study the following limitations may be faced:-
Due to insufficient time I have analyzed only two years financial
analysis of this company.
Statistical tools used limits the testing and findings
Findings are general.
Due to non-availability of sufficient time and money a detailed study
could not be made.
5 | P a g e Roll No.: 68203U09038
Session 2012-13
COMPANY PROFILE
Tata Consultancy Services started in 1968. Mr.F.C Kohli who is presently the
Deputy Chairman was entrusted with the job of steering TCS. The early days
marked TCS resonsibility in managing the punch card operations of Tisco. The
company, which was into management consultancy from day one, soon felt the
need to provide solutions to its clients as well.TCS was the first Indian company
to make forays into the US market with clients ranging from IBM, American
Express, Sega etc. TCS is presently the top software services firm in Asia.
During the Y2K buildup, TCS had setup a Y2Kfactory in Chennai as a short-term
strategy. Now, with E-business being the buzzword, the factory is developing
solutions for the dotcom industries. Today, about 90 percent of TCS' revenue
comes from consulting, while the rest from products. TCS has great training
facilities. In addition to training around 5 percent of the revenue is spent upon its
R&D centres like the Tata Research Design and Development Centre at Pune,
along with a host of other centres at Mumbai and Hyderabad.
It benchmarked its quality standing, invested heavily in software engineering
practices and built intellectual property-in terms of patents,code and branded
products. At the same time, it expanded its relationships with technology
partners and organisations, increased linkages with academic institutions and
incubated technologies and ideas of people within TCS and outside. TCS has
already patented 12 E-Commerce solution product packages and has filed six
more applications for patent licences.
Over $25 million were spent on enhancing hardware and software infrastructure.
The company now has 72 offices worldwide. As many as seven centres were
assessed at SEI CMM Level 5 last year(3.4 mistakes in a million
oppurtunities).These include Chennai, Mumbai, Bangalore, Calcutta, Hyderabad
and Lucknow.Several business and R&D relationship with global firms like IBM,
General Electric, Unigraphics Solutions have been made.
6 | P a g e Roll No.: 68203U09038
Session 2012-13
The present CEO of the company is Mr.S.Ramadorai. The companies strength is
about 14,000.
Tata Consultancy Services Limited (TCS) is engaged in providing information
technology (IT) services, business solutions and outsourcing. The Company’s
services portfolio consists of application development and maintenance, business
intelligence, enterprise solutions, assurance, engineering and industrial services,
IT infrastructure services, business process outsourcing, consulting and asset
leveraged solutions. TCS also services several other industries, such as life
sciences and healthcare, hi-tech, energy, resources and utilities, media and
entertainment and travel, transportation and hospitality. On August 31, 2010,
Diligenta Limited acquired Unisys Insurance Services Limited (UISL). On October
4, 2010, Tata America International Corporation acquired MS CJV Investments
Corporation. On October 8, 2010, the Company acquired SUPERVALU Services
India Private Limited.
History
1968 to 2000
Tata Consultancy Services (TCS) was founded in 1968. Its early contracts
included providing punched card services to sister company TISCO
(now Tata Steel), working on an Inter-Branch Reconciliation System for
the Central Bank of India, and providing bureau services to Unit Trust of
India.
In 1975, TCS conducted its first campus interviews, held at IISc, Bangalore.
The recruits comprised 12 Indian Institutes of Technology graduates and
three IISc graduates, who became the first TCS employees to enter a
formal graduate trainee programme.
In 1979, TCS delivered an electronic depository and trading system called
SECOM for the Swiss company SIS SegaInterSettle. TCS followed this up
with System X for the Canadian Depository System and automating
7 | P a g e Roll No.: 68203U09038
Session 2012-13
the Johannesburg Stock Exchange. TCS associated with a Swiss partner,
TKS Teknosoft, which it later acquired.
In 1981, TCS established India's first dedicated software research and
development center, the Tata Research Development and Design Center
(TRDDC) in Pune. In 1985 TCS established India's first client-dedicated
offshore development center, set up for client Tandem.
In the early 1990s the Indian IT outsourcing industry grew rapidly due to
the Y2K bug and the launch of a unified European currency, Euro. TCS
created the factory model for Y2K conversion and developed software
tools which automated the conversion process and enabled third-party
developer and client implementation.
2000 to present
By 2004, TCS's e-business activities were generating over US$500 million
in annual revenues.
On 25 August 2004 TCS became a publicly listed company.
In 2005 TCS became the first India-based IT services company to enter
the bioinformatics market.
In 2006 TCS designed an ERP system for the Indian Railway Catering and
Tourism Corporation.
In 2008 TCS undertook an internal restructuring exercise which aimed to
increase the company's agility.
TCS entered the small and medium enterprises market for the first time in
2011, with cloud-based offerings. On the last trading day of 2011, TCS
overtook RIL to achieve the highest market capitalisation of any India-
based company.
In the 2011/12 fiscal year TCS achieved annual revenues of over U$10
billion for the first time.
8 | P a g e Roll No.: 68203U09038
Session 2012-13
Full Services Portfolio
Our full services portfolio enables us to provide integrated solutions that help
you recognize value quickly by reducing costs and improving business agility.
Our full services portfolio combines traditional IT and Remote Infrastructure
services with knowledge-based services such as Consulting and Business Process
Outsourcing. The efficiency and seamlessness of our engagements makes TCS an
excellent partner to companies looking for an integrated approach to managing
all IT and operational programs.
Our intellectual property—from software products, to technology and business
components, to service and process frameworks—is the culmination of our
business knowledge, technology excellence and process innovation and helps
transform businesses around the world.
Industry specific software products in Banking and Financial
Services, Insurance, Retail,Healthcare, Telecom, Government and High
Tech sectors provide our customers with a competitive edge. Our library of
Technology and Domain components enable us to build high quality solutions
and bring them to market faster. Our service and process frameworks improve
operational efficiencies and business agility.
Corporate Facts
Who We Are: Tata Consultancy Services is an IT services, business solutions and
outsourcing organization that delivers real results to global businesses, ensuring
a level of certainty that no other firm can match.
What We Offer: TCS offers a consulting-led integrated portfolio of IT and IT-
enabled services delivered through its unique Global Network Delivery Model™
(GNDM™), recognized as the benchmark of excellence in software development.
Lineage: TCS is part of the Tata group, one of India’s largest industrial
conglomerates and most respected brands.
9 | P a g e Roll No.: 68203U09038

Session 2012-13
History: TCS was established in 1968 as a division of Tata Sons Limited. TCS Ltd.
got incorporated as a separate entity on January 19, 1995.
Mission: To help customers achieve their business objectives by providing
innovative, best-in-class consulting, IT solutions and services. To make it a joy for
all stakeholders to work with us.
Values: Leading change, Integrity, Respect for the individual, Excellence,
Learning and sharing.
Workforce: TCS has over 254,000 of the world’s best-trained IT consultants
in 44 countries.
Full Services Portfolio: Application Development and Maintenance, Business
Intelligence,Enterprise Solutions, Assurance Services, Engineering and Industrial
Services, IT Infrastructure Services, Business Process
Outsourcing, Consulting and Asset Leveraged Solutions. Newer services
include Mobility, Connected Marketing, Social Computing, Big Data and Cloud.
Industries Serviced: Banking, Financial Services and Insurance, Retail and
Consumer Packaged Goods, Telecom, Media and Information Services, High
Tech, Manufacturing, Life Sciences and Healthcare, Energy, Resources and
Utilities, and Travel, Transportation and Hospitality.
Financial Information: Revenue of $10.17 billion, up 24.2% over prior year;
operating margin of 27.6% and net income margin of 21.8% (fiscal year ending
March 31, 2012). For detailed financial information quarterly statements, annual
reports and operating metrics, visit the Financial Information page.
Stock Symbols
NSE (National Stock Exchange of India): TCS
BSE (Bombay Stock Exchange of India): 532540
Quality Framework: We are the world’s first organization to achieve an
enterprise-wide Maturity Level 5 on CMMI® and P-CMM® based on SCAMPISM,
the most rigorous assessment methodology.
10 | P a g e Roll No.: 68203U09038
Session 2012-13
TCS Integrated Quality Management System (iQMS) integrates processes,
people and technology maturity through various established frameworks and
practices, including IEEE, ISO 9001: 2000, CMMi, SW-CMM, P-CMM and Six-
Sigma.
Board of Directors: TCS has 11 non-executive and two executive board
members.
Leadership Team:
N Chandrasekaran, Chief Executive Officer and Managing Director
S Mahalingam, Chief Financial Officer and Executive Director
The TCS Advantage: Features like TCS’ GNDM™, Customer-centric Engagement
Model, Full Services Portfolio, and Innovation Labs and Co-innovation Network
(COIN™) set us apart. Read more about the TCS advantage here.
Alliances: TCS has a strong network of strategic and solution partners with a
joint objective of helping its customers become high-performance businesses by
maximizing the value of their technology investments. Visit TCS’ Global Alliances.
Subsidiaries: TCS has 58 subsidiaries.
11 | P a g e Roll No.: 68203U09038
Session 2012-13
12 | P a g e Roll No.: 68203U09038
Session 2012-13
COMPARATIVE STATEMENT:
It refers to the comparison of financial statements of an enterprise for two
consecutive periods. It measures the efforts of the farm by giving a clear sight of the
performance.
Comparative statements are of two types.
Comparative Income Statement
Comparative Balance Sheet.
The comparative income statements.
The comparative income statements reflect the operating activities of the
business where as the comparative. Balance Sheet reflects the finance & investing
activities of the enterprise. In such statement the figures are shown as.
1) In terms of absolute monetary value.
2) Increase/Decrease in absolute value.
3) Proportionate changes by way of Percentage.
13 | P a g e Roll No.: 68203U09038
Session 2012-13
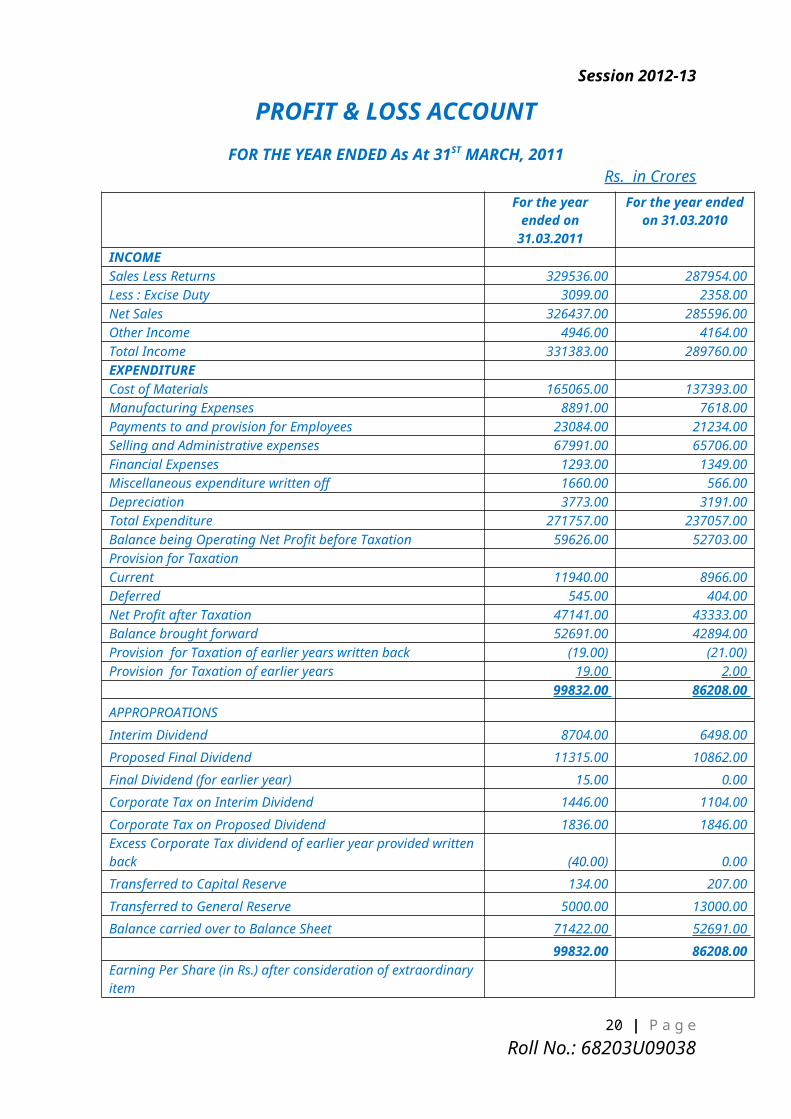
PROFIT & LOSS ACCOUNTFOR THE YEAR ENDED As At 31ST MARCH, 2011
Rs. in CroresFor the year ended
on 31.03.2011For the year ended
on 31.03.2010INCOMESales Less Returns 329536.00 287954.00 Less : Excise Duty 3099.00 2358.00 Net Sales 326437.00 285596.00 Other Income 4946.00 4164.00 Total Income 331383.00 289760.00 EXPENDITURECost of Materials 165065.00 137393.00 Manufacturing Expenses 8891.00 7618.00 Payments to and provision for Employees 23084.00 21234.00 Selling and Administrative expenses 67991.00 65706.00 Financial Expenses 1293.00 1349.00 Miscellaneous expenditure written off 1660.00 566.00 Depreciation 3773.00 3191.00 Total Expenditure 271757.00 237057.00 Balance being Operating Net Profit before Taxation 59626.00 52703.00 Provision for TaxationCurrent 11940.00 8966.00 Deferred 545.00 404.00 Net Profit after Taxation 47141.00 43333.00 Balance brought forward 52691.00 42894.00 Provision for Taxation of earlier years written back (19.00) (21.00)Provision for Taxation of earlier years 19.00 2.00
99832.00 86208.00
APPROPROATIONS
Interim Dividend 8704.00 6498.00
Proposed Final Dividend 11315.00 10862.00
Final Dividend (for earlier year) 15.00 0.00
Corporate Tax on Interim Dividend 1446.00 1104.00
Corporate Tax on Proposed Dividend 1836.00 1846.00 Excess Corporate Tax dividend of earlier year provided written back (40.00) 0.00
Transferred to Capital Reserve 134.00 207.00
Transferred to General Reserve 5000.00 13000.00
Balance carried over to Balance Sheet 71422.00 52691.00
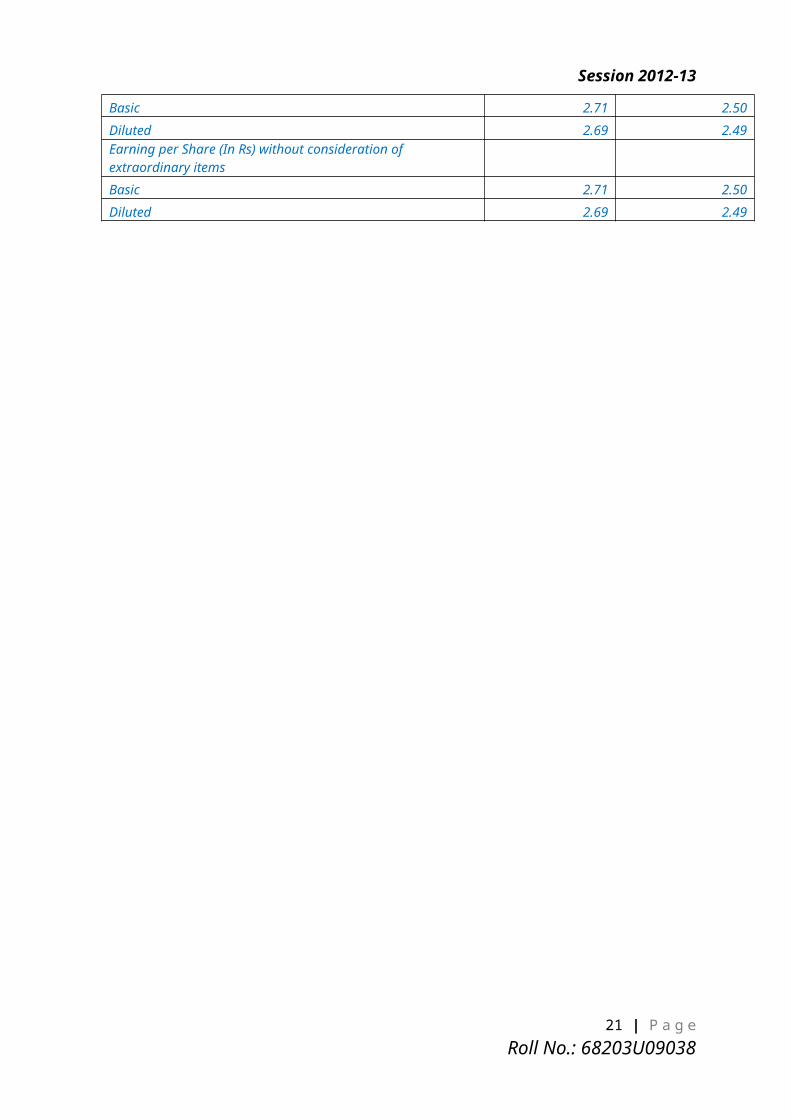
99832.00 86208.00 Earning Per Share (in Rs.) after consideration of extraordinary item
Basic 2.71 2.50
Diluted 2.69 2.49 Earning per Share (In Rs) without consideration of extraordinary items
Basic 2.71 2.50
Diluted 2.69 2.49
14 | P a g e Roll No.: 68203U09038
Session 2012-13
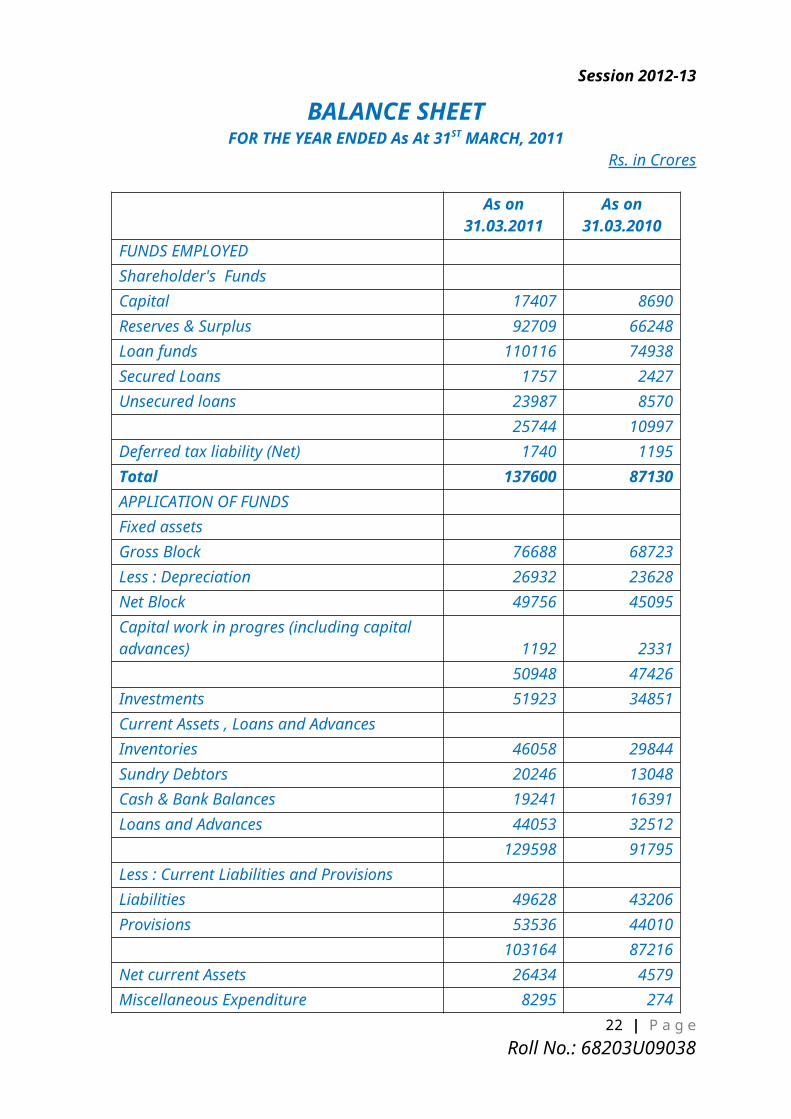
BALANCE SHEETFOR THE YEAR ENDED As At 31ST MARCH, 2011
Rs. in Crores
As on 31.03.2011
As on 31.03.2010
FUNDS EMPLOYEDShareholder's FundsCapital 17407 8690Reserves & Surplus 92709 66248Loan funds 110116 74938Secured Loans 1757 2427Unsecured loans 23987 8570
25744 10997Deferred tax liability (Net) 1740 1195Total 137600 87130APPLICATION OF FUNDSFixed assetsGross Block 76688 68723Less : Depreciation 26932 23628Net Block 49756 45095Capital work in progres (including capital advances) 1192 2331
50948 47426Investments 51923 34851Current Assets , Loans and AdvancesInventories 46058 29844Sundry Debtors 20246 13048Cash & Bank Balances 19241 16391Loans and Advances 44053 32512
129598 91795Less : Current Liabilities and ProvisionsLiabilities 49628 43206Provisions 53536 44010
103164 87216Net current Assets 26434 4579Miscellaneous Expenditure 8295 274Total 137600 87130
15 | P a g e Roll No.: 68203U09038
Session 2012-13
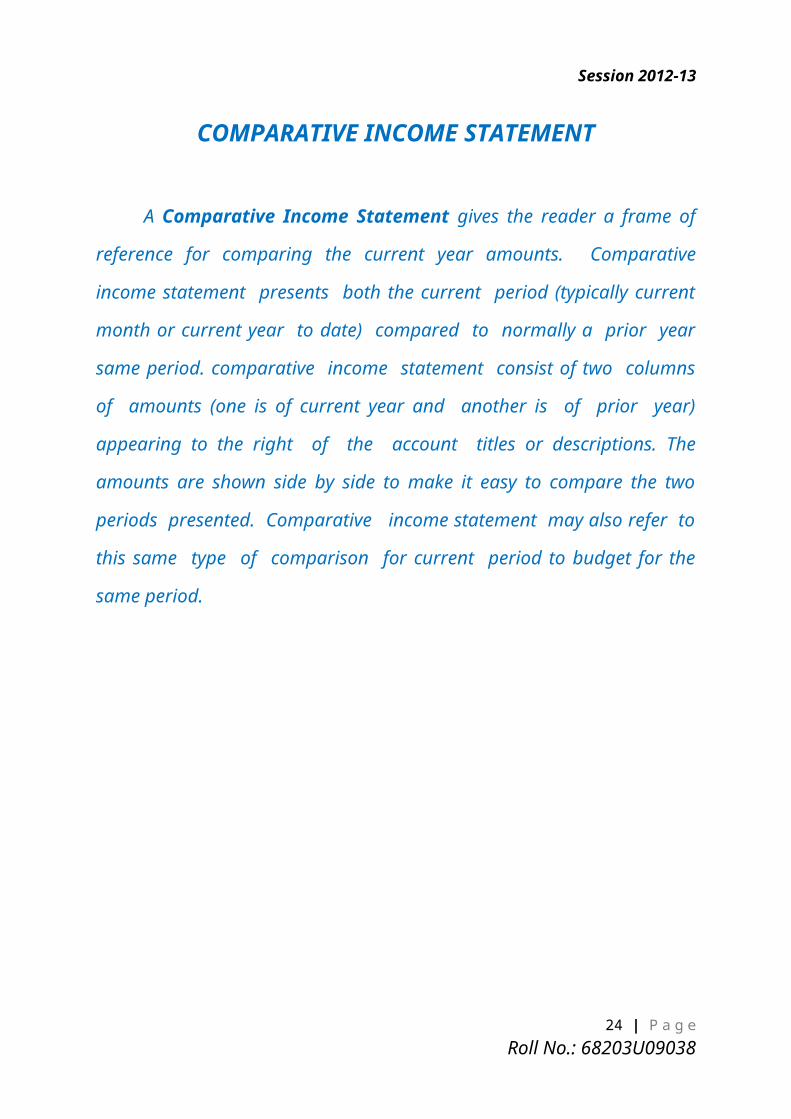
COMPARATIVE INCOME STATEMENT
A Comparative Income Statement gives the reader a frame of
reference for comparing the current year amounts. Comparative income
statement presents both the current period (typically current month or
current year to date) compared to normally a prior year same period.
comparative income statement consist of two columns of amounts (one is
of current year and another is of prior year) appearing to the right of the
account titles or descriptions. The amounts are shown side by side to make it
easy to compare the two periods presented. Comparative income statement
may also refer to this same type of comparison for current period to
budget for the same period.
16 | P a g e Roll No.: 68203U09038
Session 2012-13
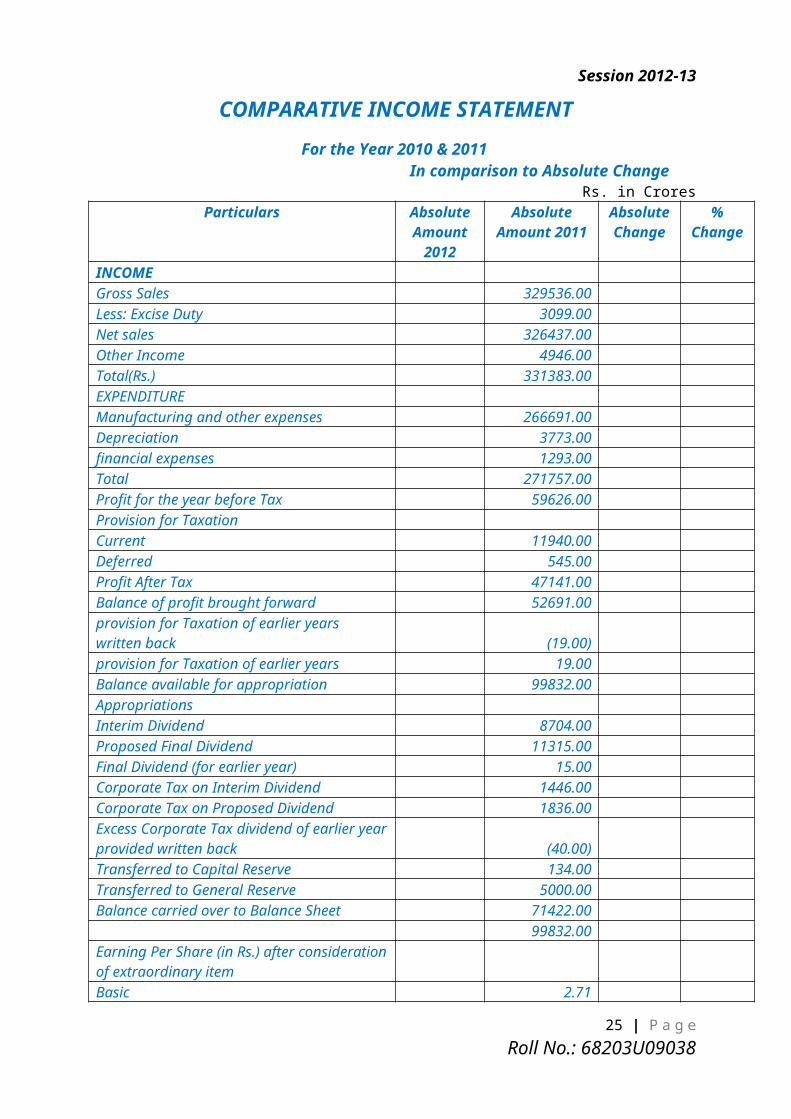
COMPARATIVE INCOME STATEMENT
For the Year 2010 & 2011In comparison to Absolute Change
Rs. in CroresParticulars Absolute
Amount 2012
Absolute Amount 2011
Absolute Change
% Change
INCOMEGross Sales 329536.00 Less: Excise Duty 3099.00 Net sales 326437.00 Other Income 4946.00 Total(Rs.) 331383.00 EXPENDITURE Manufacturing and other expenses 266691.00 Depreciation 3773.00 financial expenses 1293.00 Total 271757.00 Profit for the year before Tax 59626.00 Provision for TaxationCurrent 11940.00 Deferred 545.00 Profit After Tax 47141.00 Balance of profit brought forward 52691.00 provision for Taxation of earlier years written back (19.00)provision for Taxation of earlier years 19.00 Balance available for appropriation 99832.00 Appropriations Interim Dividend 8704.00 Proposed Final Dividend 11315.00 Final Dividend (for earlier year) 15.00 Corporate Tax on Interim Dividend 1446.00 Corporate Tax on Proposed Dividend 1836.00 Excess Corporate Tax dividend of earlier year provided written back (40.00)Transferred to Capital Reserve 134.00 Transferred to General Reserve 5000.00 Balance carried over to Balance Sheet 71422.00
99832.00 Earning Per Share (in Rs.) after consideration of extraordinary itemBasic 2.71 Diluted 2.69 Earning per Share (In Rs) without consideration of extraordinary itemsBasic 2.71 2.50 Diluted 2.69 2.49
17 | P a g e Roll No.: 68203U09038
Session 2012-13
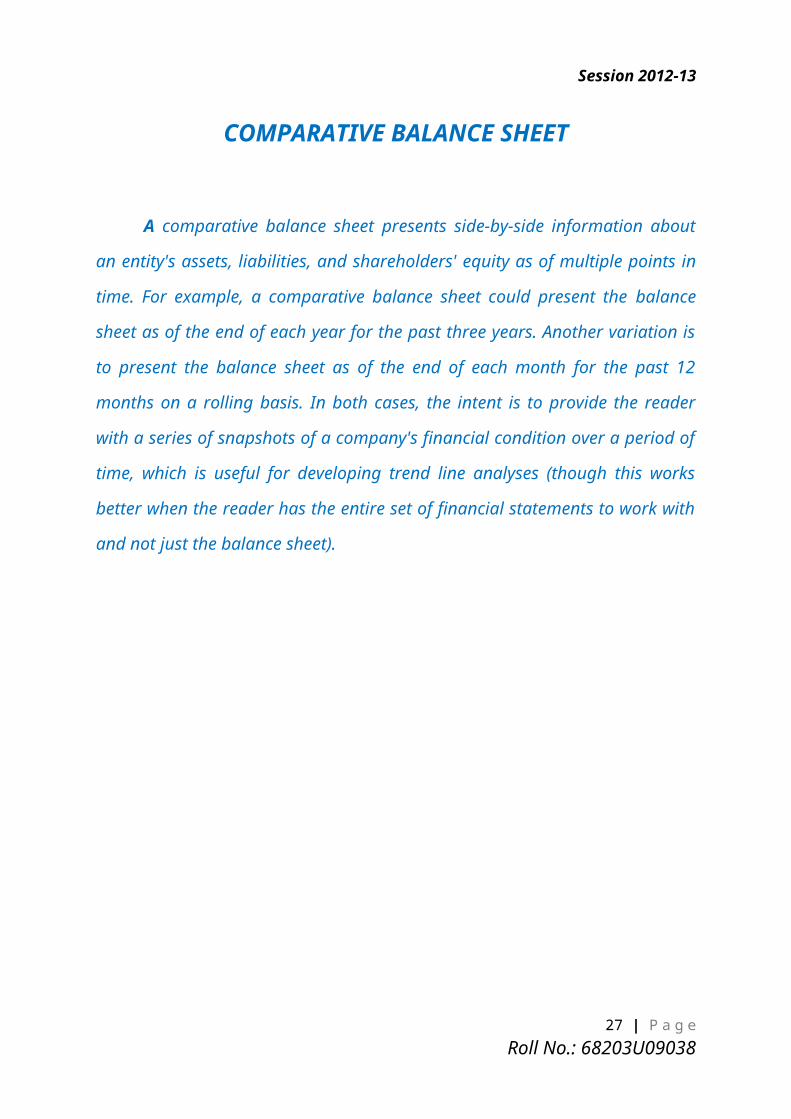
COMPARATIVE BALANCE SHEET
A comparative balance sheet presents side-by-side information about an
entity's assets, liabilities, and shareholders' equity as of multiple points in time. For
example, a comparative balance sheet could present the balance sheet as of the end
of each year for the past three years. Another variation is to present the balance
sheet as of the end of each month for the past 12 months on a rolling basis. In both
cases, the intent is to provide the reader with a series of snapshots of a company's
financial condition over a period of time, which is useful for developing trend line
analyses (though this works better when the reader has the entire set of financial
statements to work with and not just the balance sheet).
18 | P a g e Roll No.: 68203U09038
Session 2012-13
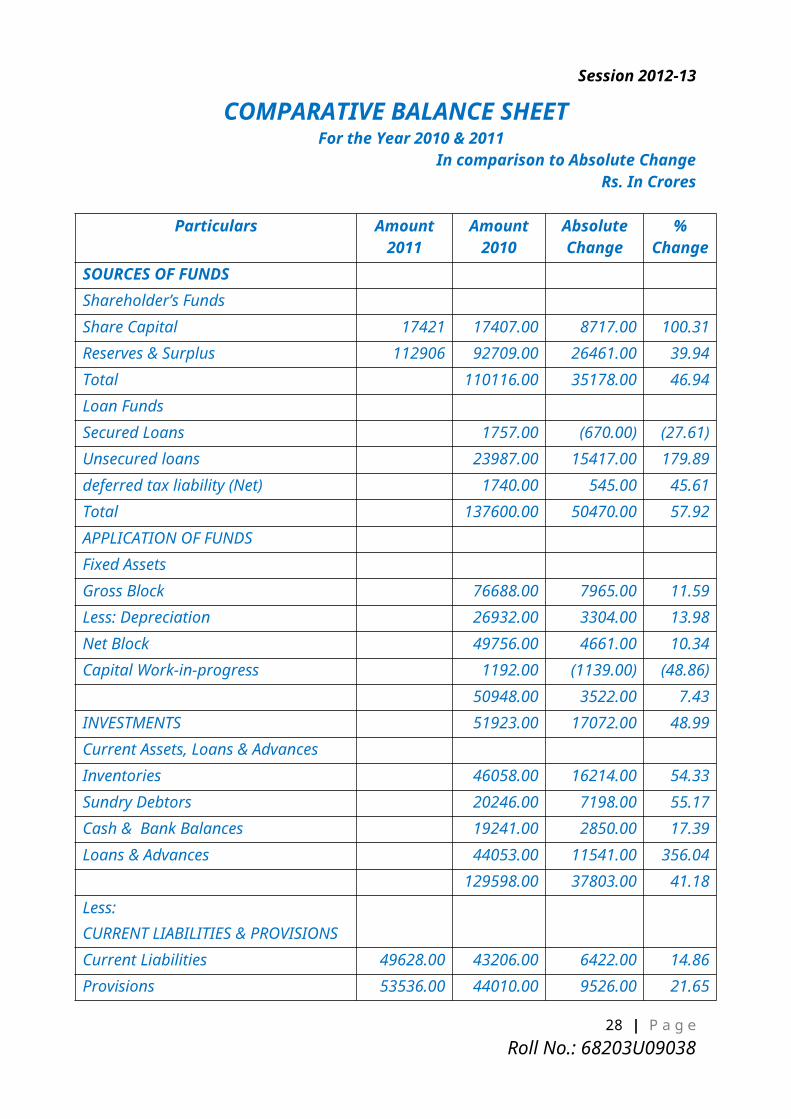
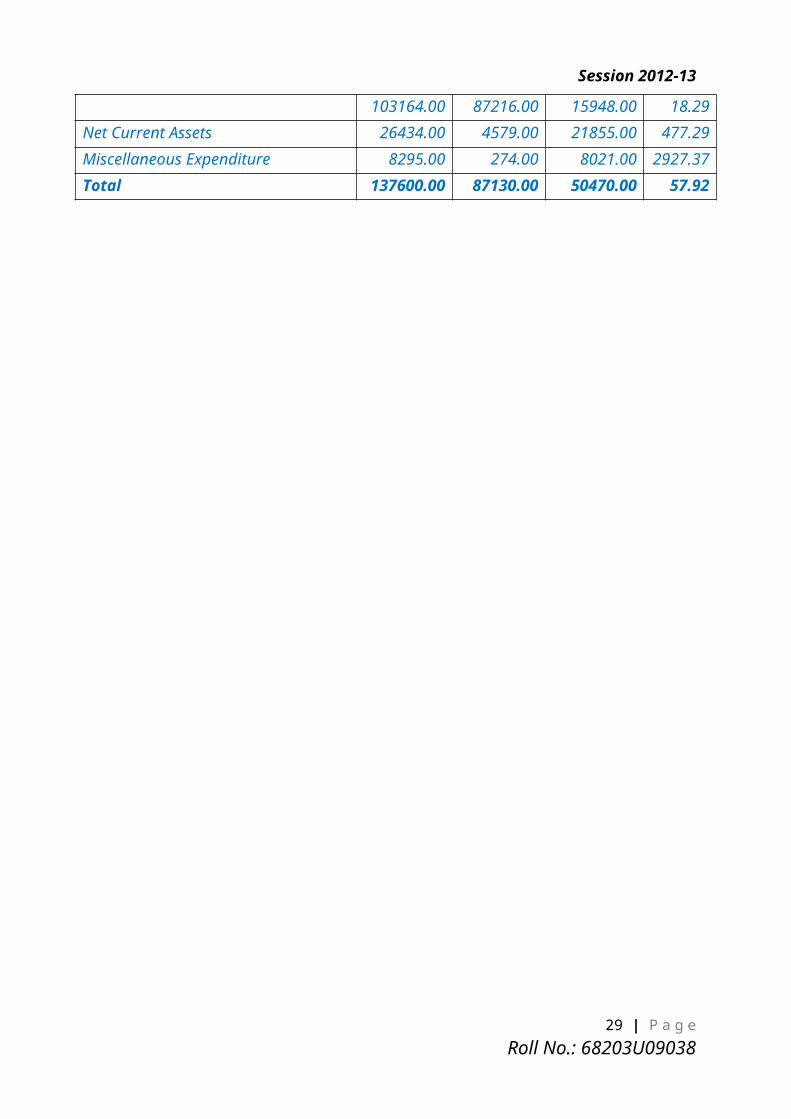
COMPARATIVE BALANCE SHEETFor the Year 2010 & 2011
In comparison to Absolute Change Rs. In Crores
Particulars Amount 2011
Amount 2010
Absolute Change
% Change
SOURCES OF FUNDS
Shareholder’s Funds
Share Capital 17421 17407.00 8717.00 100.31
Reserves & Surplus 112906 92709.00 26461.00 39.94
Total 110116.00 35178.00 46.94
Loan Funds
Secured Loans 1757.00 (670.00) (27.61)
Unsecured loans 23987.00 15417.00 179.89
deferred tax liability (Net) 1740.00 545.00 45.61
Total 137600.00 50470.00 57.92
APPLICATION OF FUNDS
Fixed Assets
Gross Block 76688.00 7965.00 11.59
Less: Depreciation 26932.00 3304.00 13.98
Net Block 49756.00 4661.00 10.34
Capital Work-in-progress 1192.00 (1139.00) (48.86)
50948.00 3522.00 7.43
INVESTMENTS 51923.00 17072.00 48.99
Current Assets, Loans & Advances
Inventories 46058.00 16214.00 54.33
Sundry Debtors 20246.00 7198.00 55.17
Cash & Bank Balances 19241.00 2850.00 17.39
Loans & Advances 44053.00 11541.00 356.04
129598.00 37803.00 41.18
Less: CURRENT LIABILITIES & PROVISIONS
Current Liabilities 49628.00 43206.00 6422.00 14.86
Provisions 53536.00 44010.00 9526.00 21.65
103164.00 87216.00 15948.00 18.29
Net Current Assets 26434.00 4579.00 21855.00 477.29
Miscellaneous Expenditure 8295.00 274.00 8021.00 2927.37
Total 137600.00 87130.00 50470.00 57.92
19 | P a g e Roll No.: 68203U09038
Session 2012-13
COMMON SIZE INCOME STATEMENT
Common size income statements are basically used for analysis purposes
where each item on the face of income statement is expressed in relation to revenue
so that users can easily understand that how different expenses and other incomes
and gains adds up to gross profit and net profit. This is widely used in ratio analysis
and serve as a vital tool start up a financial analysis of the key areas of
performance and then detailed ratios are applied on each item afterwards.
Although common size income statements do not provide a detailed financial
analysis of income statement and its items but it does help in comparing the
financial performance of the company with the preceding accounting periods
known as trend-analysis or time-series analysis. We can also compare financial
information of one company with other companies in the industry which is known
as cross-sectional analysis. The good thing about common-size analysis is that it is
really easily to do and also interpreting the results is not so difficult. Even the users
who are not proficient in analysis techniques can gain insight of company’s
financial performance to some extent from common size financial statements i.e.
income statement and statement of financial position.
20 | P a g e Roll No.: 68203U09038
Session 2012-13
COMMON SIZE INCOME STATEMENT
FOR YEAR 2010 & 2011Rs. in Crores.
Amount2011
Amount2010
% of Sales 2011
% of Sales 2010
% Change
Net Sales 326437.00 285596.00 100.00 100.00 0.00
(-) Operating Expenses 197040.00 166245.00 60.36 58.21 2.15
Operating Profit 129397.00 119351.00 39.64 41.79 (2.15)
(-) Non Operating Expenses 70944.00 67621.00 21.73 23.68 (1.94)
(+) Non Operating Income 4946.00 4164.00 1.52 1.46 0.06
Net Profit Before Tax & Depreciation 63399.00 55894.00 19.42 19.57 (0.15)
(-) Depreciation 3773.00 3191.00 1.16 1.12 0.04
Net Profit Before Tax 59626.00 52703.00 18.27 18.45 (0.19)
Tax (Net of Deferred Tax) 12485.00 9370.00 3.82 3.28 0.54
Net Profit 47141.00 43333.00 14.44 15.17 (0.73)
21 | P a g e Roll No.: 68203U09038
Session 2012-13
COMMON SIZE BALANCE SHEET
A common size balance sheet presents not only the standard information
contained in a balance sheet, but also a column that notes the same information as
a percentage of the total assets (for asset line items) or as a percentage of total
liabilities and shareholders' equity (for liability or shareholders' equity line items).
It is extremely useful to construct a common size balance sheet that itemizes
the results as of the end of multiple time periods, so that you can construct trend
lines to ascertain changes over longer time periods. The common size balance sheet
is also useful for comparing the proportions of assets, liabilities, and equity between
different companies, particularly as part of an industry analysis or an acquisition
analysis.
22 | P a g e Roll No.: 68203U09038
Session 2012-13
COMMON SIZE BALANCE SHEET
For the Year 2010 & 2011 In comparison to Capital Employed
Rs. in Crores
Particulars Amount 2011
Amount 2010
% of capital Employed
2011
% of capital Employed
2010
% Change
Fixed Asset 50948.00 47426.00 37.73 54.43 (16.70)
Investment 51923.00 34851.00 37.73 40.00 (2.26)
Working Capital
i. Current Asset 129598.00 91795.00 94.18 105.35 (11.17)
ii. Current Liability 103164.00 87216.00 74.97 100.10 74.97
Working Capital (i-ii) 26434.00 4579.00 19.21 5.26 13.96
Miscellaneous Expenditure 8295.00 274.00 6.03 0.31 5.71
Capital Employed (A+B+C) 137600.00 87130.00 100.00 100.00 0.00
(-)Deferred Tax Net 1740.00 1195.00 1.26 1.37 (0.11)
(-) Long Term Loan 25744.00 10997.00 18.71 12.62 6.09
110116.00 74938.00 80.03 86.01 (5.98)
Shares Holders Fund
Share Capital 17407.00 8690.00 12.65 9.97 2.68
Reserve & Surplus 92709.00 66248.00 67.38 76.03 (8.66)
Total Share Holders Fund 110116.00 74938.00 80.03 86.01 (5.98)
23 | P a g e Roll No.: 68203U09038
Session 2012-13
RATIO ANALYSIS:
Ratio analysis is a powerful tool of financial analysis. A ratio is defined as ‘the indicated quotient of two mathematical expressions’ and “The relationship between two or more things.”
In financial analysis, a ratio is used as a benchmark for evaluating the financial position and performance of a firm. The absolute accounting figures reported in the financial statements do not provide a meaningful understanding of the performance and financial position of firm.
A. Short term Solvency:-
Current Ratio:
It is an indicator used to measure the Short term Solvency of a company. The ideal
ratio is 2:1
Current ratio = Current Asset/ Current Liability =
129598/103164= 1.25:1
It indicates that the current ratio of the company is above the norm & hence the short term
solvency of the company is sound enough to meet the short term obligations of the
company.
B. Long Term Solvency:
Debt equity Ratio:
It is a measure to ascertain the long term financial policies of Company. The ideal
ratio is 1:1
Debt equity ratio= Long Term Debt/Share Holders Funds
= 25744/ 110116=0.23:1
The company does have a debt equity ratio higher than the standard for the company. Or
in other words the company has enough share holders funds to repay the debts.
C. Capital Turnover Ratio:
It shows whether the capital utilization leads to higher profit or not.
Capital Turnover Ratio= Sales / Capital Employed
= 326437/ 137600=2.37:1
The capital has been utilized properly as indicated from the above ratio.
24 | P a g e Roll No.: 68203U09038
Session 2012-13
D. Fixed asset Turnover ratio:
It shows the extent to which the investment of the fixed assets contributes to words sales:
Fixed asset turnover ratio: Net Sales/Net Fixed Assets
= 326437/ 50948 = 6.41:1
It indicates that fixed assets contribute a much to the sales in the current year.
E. Net Working Capital Turnover Ratio:
It shows the unit utilized in the working capital to which extent it generates sales.
Net working capital turnover ratio= Sales / Net Working Capital
= 326437/ 26434= 12.25:1
It shows the working capital was properly utilized.
F. Net profit Ratio:
It measures the relationship between Net Profit & Net Sales. It determines the overall
probability due to various factors such as operational efficiency, trading on equity etc.
Higher the ratio greater is the capacity of the firm to withstand adverse economic
condition.
Net Profit Ratio = Net Profit x 100/ Net Sales
= 47141/ 326437X 100= 14.44%
The company does maintain a healthy net profit ratio, however there has been an decrease
in net profit ratio as the company had a net profit ratio of 14.44% in the previous year.
Therefore it can be said that the company has not been able to hold on to the previous year
results during the current year.
25 | P a g e Roll No.: 68203U09038

Session 2012-13
FINDINGS: (INTERPRETATION)
Analysis of Comparative Income Statement
On comparison of the above two years figures it is observed that the sales of the company has increased by 14.30% over previous year and other incomes have increased by 18.78%. Direct costs have increased by 14.70% and interest (net) has decreased by 4.15% over previous year. Profit before tax has increased by 13.14% and profit after tax has increased by 8.79% over previous year. The company performed better during the current year. Dividend proposed is Rs.11315 crores in the current year against Rs.10862 Crores in the previous year. The earnings per share have also increased by 8.40% over previous year. It can therefore be said that the company has been able to satisfy both the customers and the share holders during the current fiscal.
Analysis of Comparative Balance Sheet
On comparison of balance sheet of above two years it is observed that the fixed assets have increased by 10.34% over previous year. The capital work in progress has decreased by Rs.1139 Crores which shows that few of the capital works in progress has been completed during the current year. The loan funds have increased by 134.10% which implies that the company has raised a further long term loan. Sundry debtors have increased by 55.17% which means that the company has not been able to decrease the credit sales. Cash & bank balance have increased by a whooping Rs. 2850 crores which implies that the company is having surplus funds unutilized. The total current assets have increased by 41.18% over previous year where current liabilities has been increased by a 18.29% over previous year.
Analysis of Common Size Income Statement
On comparison of the income statement figures in relation to sales it is observed that the operating expenses have increased by 2.15% which is reflected in the decrease in operating profit by the equal amount. There has also been an increase in non operating income by 0.06% over previous year. The profit before tax has also decreased by 0.19% over previous year and the profit after tax has decreased by 0.73 over previous year. It can therefore be said that the company has not performed better than the level operation of previous year during the current year.
Analysis of Common Size Balance Sheet
On comparison of the balance sheet figures in relation to the total capital employed it is observed that fixed assets have increased by 10.34% and investments have increased by 48.99% over previous year. Current assets have increased by 41.18% and current liabilities have increased by 18.29% over previous year in relation to the total capital employed. The total capital has increased by 50470 crores over previous year. It can be said that the short term solvency of the company is in dire straits.
26 | P a g e Roll No.: 68203U09038
Session 2012-13
SUGGESTIONS:
In my opinion and to the best of my knowledge , It can be said that
although the company has fared up well on basis of operations in the current
but the financial status of the company is not well. So in order to increase the
performance of the company there should be an adequate internal control
system commensurate with the size of the Company and the nature of its
business with regard to purchases of inventory and fixed assets and the sale
of goods and services. However the working capital of the company is in a
positive which is a good sign and the only weak link of the company as a
result of increase in short term loans. Sundry debtors have increased
significantly as compared to its previous year figure .So there should be an
adequate internal control over it’s credit sales.
27 | P a g e Roll No.: 68203U09038
Session 2012-13
CONCLUSION:
The company has been able to increase its sales but there was a decrease in
profit during the year as there was a significant increase in operating expenses
during the year. The operations of the company has not therefore improved as
compared to the previous year. The net profits ratio has not increased which
proves that the company has not been able to control the costs effectively. The
depreciation has been increased significantly as a result of huge addition in fixed
asset. Cash & bank balance have increased by a whooping which implies that the
company is having surplus funds unutilized. The current assets of the company
are enough to meet the current liabilities. The loan funds have been increased
which implies that the company has been raised further loan. Dabur holding the
highest share market and does enjoy a good credibility which is evident in the
amount of current liabilities held at the balance sheet date but the current ratio
should be at least 1:1 keeping in view the size of the company and its activities.
From the share holder’s point of view the company has been a profitable venture
as the proposed dividend has increased. The earning per share has increased in
comparison to previous year as a result of decrease in profit after tax.
28 | P a g e Roll No.: 68203U09038
Session 2012-13
References:
1. General Accountancy
by Gupta and Agarwal
2. Fundamental of Accounting
By S PAUL
3. Advanced Accounting
by Paul M. Fischer, William J. Taylor, Rita H. Cheng,
4. Accounting Information Systems
by Marshall B. Romney, Paul John Steinbart
5. Management Accounting
by Tata McGraw Hill – Khan & Jain
Newspapers & Magazines:
1. Economics Times
2. India Today
3. Business Times
Websites:
1. www.dabur.com
2. www.equitymaster.com
3. www.moneycontrol.com
4. www.google.com
29 | P a g e Roll No.: 68203U09038