Final NMMI Report-Revised Rashmi
178
1
Transcript of Final NMMI Report-Revised Rashmi

1
2
i
i
PREFACE
The growing need for food security and increased population has resulted in higher demand for irrigation water which could only be met by judicious use of available water resources The Government therefore launched a Centrally Sponsored Scheme on Micro Irrigation in January 2006 with the an objective to increase the area under improved methods of irrigation for better water use efficiency to provide stimulus to agricultural growth The scheme was further upscaled into Mission Mode in 2010 as the National Mission on Micro Irrigation (NMMI) The Mission has now completed almost 8 years and has made significant progress in achieving its objectives The Department of Agricultural and Cooperation in association with National Committee on Plasticulture Applications in Horticulture (NCPAH) therefore selected Ms Global AgriSystem Pvt Ltd to undertake the Impact Evaluation Study in 13 selected States The study was carried out in 64 districts of the country and more than 7400 beneficiaries and non-beneficiaries were interviewed The study reveals that the scheme has benefitted the farmers in term of enhanced productivity and reduced cost on electricity and fertilizers The average productivity of fruits and vegetables has increased about 4230 percent and 5280 percent respectively Besides the Scheme has also succeeded in reducing the irrigation cost which was found to have been reduced by 20-50 percent with average of 3230 percent Use of micro irrigation system has also helped the farmers in cutting down the electrical consumption which was found to have been reduced by about 31 percent Successful implementation of the Scheme has also led to average reduction in fertilizer usage with average reduction of about 28 percent in total fertilizer consumption in the surveyed states The study received continuous support and encouragement from Mr Sanjeev Chopra Joint Secretary amp Mission Director (MIDH) MoA Government of India and I extend my heartfelt thanks to Mr Chopra for his continuous support and guidance in preparing this report We gratefully extend our appreciation to Mr Krish S Iyengar Executive Director and Mr Naresh Modi Mr Alok Mishra Mr Rohit Lall of the National Committee of Plasticulture Application in Horticulture (NCPAH) for sparing their valuable time to guide us during the entire project duration We also appreciate the help provided by Mrs Sadhna Khanna under Secretary MoA GoI and Dr Jose C Samuel Chief Consultant (NHM)
ii
It would have been impossible to complete this study without the support of 7400 farmers and other stakeholders such as system suppliers financial institutions NGOs PRIs etc spread over 13 states We extend our gratitude to these farmers who deserve special appreciation for extending their willing cooperation in giving their valuable time responding to the questionnaire and share their views and concerns during the field study We also take opportunity to thank State Agriculture as well as Horticulture Department amp other stakeholders of the 13 States where the study was undertaken Members of the team have put in lots of hard work and duly deserve appreciation for carrying out the survey Prof BK Sikka Agro Economist and Prof JN Raina eminent Soil Scientist deserve our special appreciation for their guidance
If the study helps the policy makers to make this scheme more effective and useful we would feel that the effort has been worth it
Gokul Patnaik (Chairman)
i
Table of Contents Contents Executive Summary I
1 Introduction 1
11 Project Background 1
12 Salient Features of the Scheme 2
13 The Assignment 4
14 Objectives of the Study 4
2 Approach and Methodology 5
21 Approach 5
22 Methodology 6
221 Sources of Data Collection 7
222 Sampling 8
223 The Sample Design 8
224 Selection of Beneficiaries and Non-beneficiaries 9
23 Limitations of the Study 11
3 Assessment of Current Status 13
31 Performance of MI Scheme 13
32 State wise Performance 15
33 Targets and Achievements 15
34 Performance of Scheme for Area Coverage as Compared to Potential 21
35 Pattern of Assistance 22
351 Indicative Cost of Installing Micro Irrigation System 22
352 State-wise Pattern of Assistance 23
353 Quantum of Subsidy and Adoption of MI System by Farmers 24
354 State Implementing Agencies 25
355 Extent of Convergence with Other Schemes 26
356 Food Security and the Micro Irrigation Scheme 27
36 Mission Structure Review 29
361 National Level 29
362 State Level Micro Irrigation Committee (SMIC) 30
ii
363 District Level Micro Irrigation Committee (DMIC) 33
364 Improving Efficacy of the Institutional Mechanism 34
37 Role of Panchayati Raj Institutions (PRIs) in NMMI Scheme 35
4 Primary Survey Respondentsrsquo Profile and Findings 36
41 Demographic Profile (Sampled Beneficiaries amp Non-beneficiaries) 36
411 Size of Land Holding 36
412 Categories of Farmers 38
413 Gender 39
414 Educational Status 39
415 Status of Communication Facilities 41
42 Results and Discussions 42
421 Quality of soil and irrigation water 42
422 Sources of Irrigation 44
423 Water Table 45
424 Sources of Awareness about NMMI Scheme 46
425 Reasons for Non-adoption of Micro Irrigation Systems 48
426 Willingness of Non Beneficiaries to Adopt MI System 49
427 Progress of Installation of MI System 50
428 Average Cost of Installing the MI System 50
429 Factors Influencing Farmers to Adopt MI system 51
4210 Subsidy Disbursement 52
4211 Sources of Margin Money 53
4212 Interest Rates on Borrowing 53
4213 Type of MI system and Area Coverage 54
4214 System Demonstration 64
4215 Training and Capacity Building 64
4216 Availability of Electricity 68
4217 Capacity of Pump Sets 69
4218 Irrigation Filters 69
4219 Type of Emitters in drip system 72
4220 Type of Sprinkler 73
4221 Farmersrsquo opinion on System Supply and Installation related constraints 74
4222 After Sales Service 75
iii
4223 Warranty 77
4224 Promotional Activities 78
43 Observations of Field Staff on MI System 79
44 Assessment of the System Design 80
45 System Suppliers 82
5 Impact Evaluation 87
51 Crop Diversification 87
52 Area Expansion under Micro Irrigation 89
53 Increase in Irrigated Area due to Water Saving 89
54 Development of marginal and wasteland by beneficiaries 90
55 Dripper spacing 91
56 Reduction in Cost of Irrigation 94
57 Electricity Consumption 94
58 Economy in Fertilizer Use 95
59 Increase in Crop Productivity 96
510 Reduction in these Cost of Inputs of Irrigation amp Productivity Enhancement Crop-wise 98
511 Introduction of New Crops 102
512 Increase in Farmerrsquos Income 104
513 Benefit-Cost Ratio 105
514 Increase in Area 108
515 Potential area that can be brought under Micro Irrigation 109
516 Employment Opportunities 110
5161 On Farm Employment Generation 111
5162 Off-Farm Employment Generation 111
517 Impact on Employment 111
6 Conclusions amp Recommendations 113
References 125
Appendices 127
iv
Annexure I Processes of Implementation 127
Annexure II State wise Physical amp Financial Targets amp Achievements 136
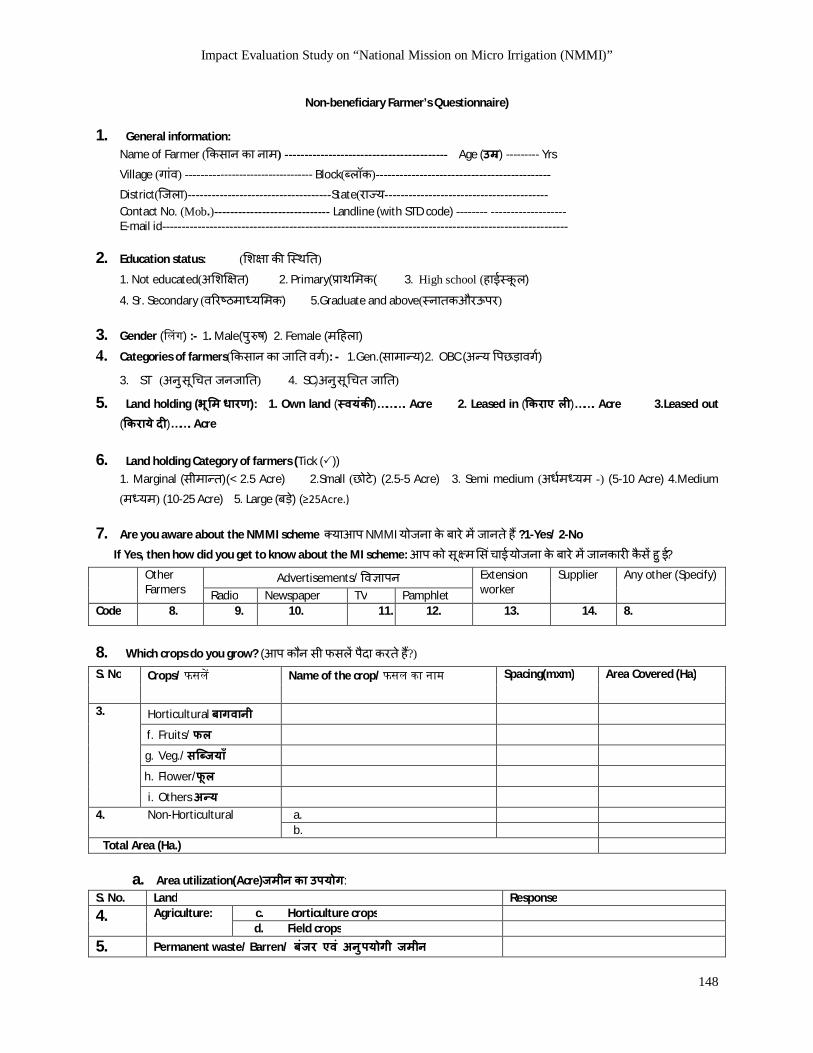
Annexure III Questionnaires 140
List of Tables
Table 1 Methodology Adopted for Impact Assessment 6 Table 2Sampling Plan 8 Table 3 State wise List of Sampled Districts Covered in the Study 9 Table 4 State wise Sample Distribution for the Study 10 Table 5 Year wise Area under Different MI Systems of Sampled Beneficiaries 14 Table 6 Comparison of Subsidy between Pre and Post NMMI Scheme 14 Table 7 State wise Cumulative Physical amp Financial Targets and Achievements 16 Table 8 Year wise Cumulative Physical and Financial Targets and Achievements 17 Table 9 Year amp State wise Physical Targets and Achievements (lsquo000rsquo ha) 19 Table 10 Year and State wise Financial Targets and Achievements (Rs Crores) 20 Table 11 Potential and Actual area under Drip amp Sprinkler Irrigation 21 Table 12 State wise Quantum of Subsidy to Different Categories of Farmers 23 Table 13 State wise Quantum of Subsidy and Area Coverage 24 Table 14 State-Implementing Agencies for NMMI 25 Table 15 Performance of the Functioning of SMICs in Sampled States 32 Table 16 Performance of the Functioning of DMICs in Sampled States 34 Table 17 Land Holding Status of Beneficiary and Non Beneficiary Farmers 37 Table 18 Size and Distribution of Operational Holdings 38 Table 19 Category wise Proportion of Beneficiary and Non Beneficiary Farmers 38 Table 20 Gender Status of Beneficiaries and Non Beneficiaries 39 Table 21 Education Status of Beneficiaries and Non-beneficiaries 40 Table 22 Mobile Phone Ownership 41 Table 23 Extent of Soil Salinity (in sampled states) and Beneficiaryrsquos Responses on Soil and Water
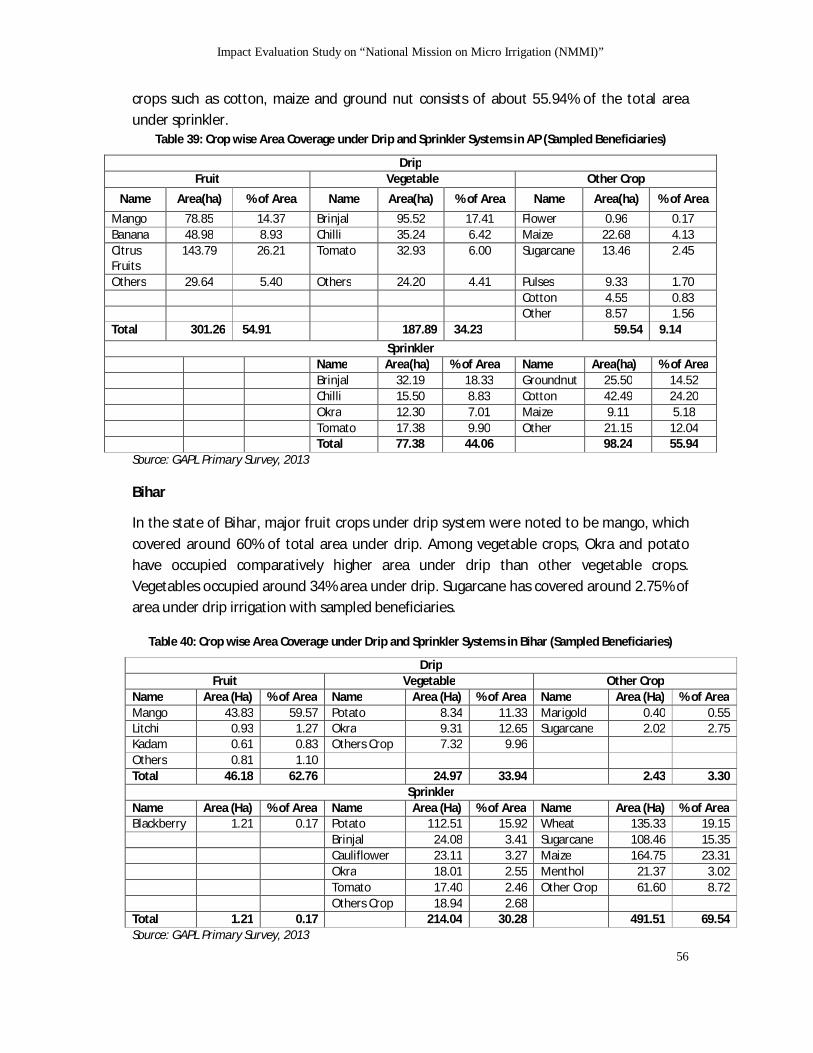
Testing 43 Table 24 Extent of Awareness about Important Soil and Water Quality Parameters 44 Table 25 Source of Irrigation Water 45 Table 26 State wise Water Table Depth 45 Table 27 Sources of Awareness Reported by Beneficiaries () 47 Table 28 Source of Awareness of Scheme Reported by Non-beneficiary () 48 Table 29 Reasons for Non-adoption of NMMI Scheme () 49 Table 30 Willingness of Non-beneficiaries to Install MI System 49 Table 31 Year of Installation of MI System () 50 Table 32 Average Cost of Installing MI System (Rsha) 50 Table 33 Reasons for Adoption of Micro Irrigation Systems 51 Table 34 Farmerrsquos Responses for Time Taken to Sanction Subsidy () 52 Table 35 Source of Finance for Meeting Beneficiary Share for Installation of MI System 53 Table 36 Rate of Interest Paid by the Beneficiaries on Borrowed Funds 54 Table 37 Proportion of Farmers having Drip and Sprinkler MI Systems 54 Table 38 Drip amp Sprinkler System wise Area Coverage by Sampled Beneficiaries 55 Table 39 Crop wise Area Coverage under Drip and Sprinkler Systems in AP (Sampled Beneficiaries) 56
v
Table 40 Crop wise Area Coverage under Drip and Sprinkler Systems in Bihar (Sampled Beneficiaries) 56
Table 41 Crop wise Area Coverage under Drip and Sprinkler Systems in Chhattisgarh (Sampled Beneficiaries) 57
Table 42 Crop wise Area Coverage under Drip and Sprinkler Systems in Gujarat (Sampled Beneficiaries) 58
Table 43 Crop wise Area Coverage under Drip and Sprinkler Systems in Haryana (Sampled Beneficiaries) 58
Table 44 Crop wise Area Coverage under Drip and Sprinkler Systems in Karnataka (Sampled Beneficiaries) 59
Table 45 Crop wise Area Coverage under Drip and Sprinkler Systems in Maharashtra (Sampled Beneficiaries) 59
Table 46 Crop wise Area Coverage under Drip and Sprinkler Systems in Odisha (Sampled Beneficiaries) 60
Table 47 Crop wise area Coverage under Drip and Sprinkler Systems in Rajasthan (Sampled Beneficiaries) 61
Table 48 Crop wise Area Coverage under Drip and Sprinkler Systems in Sikkim (Sampled Beneficiaries) 61
Table 49 Crop wise Area Coverage under Drip and Sprinkler Systems in Tamil Nadu (Sampled Beneficiaries) 62
Table 50 Crop wise Area Coverage under Drip and Sprinkler Systems in UP (Sampled Beneficiaries) 63 Table 51 Crop wise Area Coverage under Drip and Sprinkler Systems in Uttarakhand (Sampled
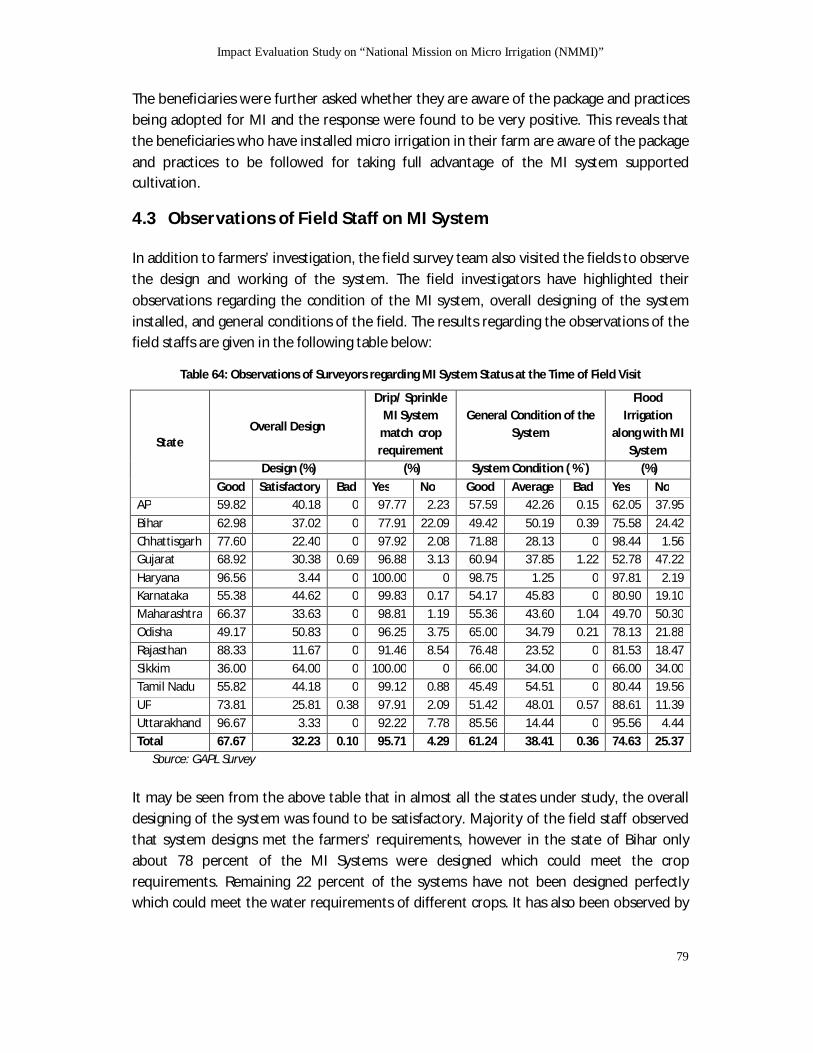
Beneficiaries) 63 Table 52 Exposure of Beneficiary Farmers to MI Demonstrations 64 Table 53 Topic Covered in Training for Beneficiary Farmers 66 Table 54 Institution for Training as Reported by Respondents ( Beneficiaries) 67 Table 55 Availability of Electricity (Beneficiaries and Non Beneficiaries) 68 Table 56 Capacity of Pump Sets Used by Beneficiaries 69 Table 57 Type of Irrigation Filters Used by Farmers 71 Table 58 Type of Emitters Used by Beneficiaries 73 Table 59 Type of Sprinklers Used by Beneficiaries 74 Table 60 Constraints Faced by Beneficiary Farmers () 75 Table 61 Status Reported by Beneficiaries Regarding lsquoAfter Sales Servicesrsquo 76 Table 62 Status of Warranty for MI System () 77 Table 63 Awareness about Promotional Activities 78 Table 64 Observations of Surveyors regarding MI System Status at the Time of Field Visit 79 Table 65 Assessment of the System Design 81 Table 66 State Wise List of Registered MI System Suppliers 83 Table 67 Impact on Crop Diversification and Usage of Marginal and Degraded Land by
Beneficiaryrsquos data 88 Table 68 Increase reported by Beneficiaries in Irrigated Area (ha) after Installation of MI System 90 Table 69 Marginal Degraded Land brought under Cultivation after Installation of MI System by
Beneficiaries 91 Table 70 Spacing followed by Sampled Beneficiaries for Fruit Crops (m) 92 Table 71 Spacing followed by Sampled Beneficiaries for Vegetables Flowers and Other Crops (m) 93 Table 72 Reduction in Cost of Irrigation with MI system 94 Table 73 Reduction in Electricity Consumption 95 Table 74 Reduction in Fertilizer Consumption 96
vi
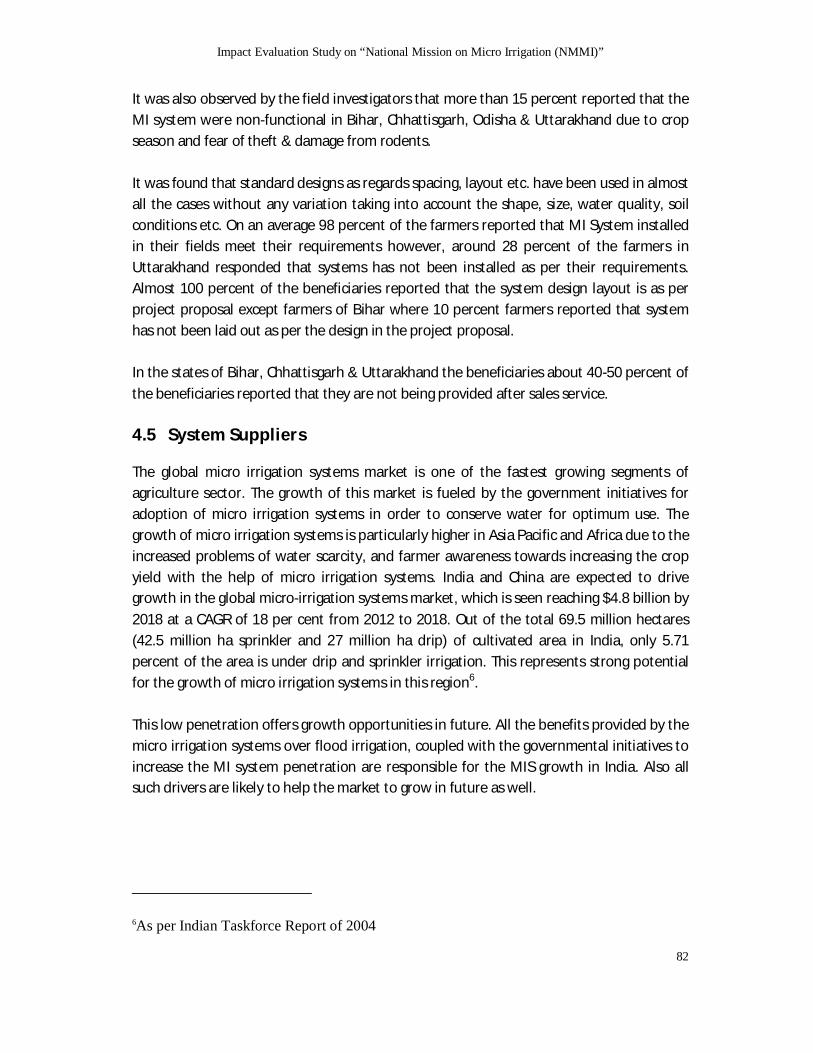
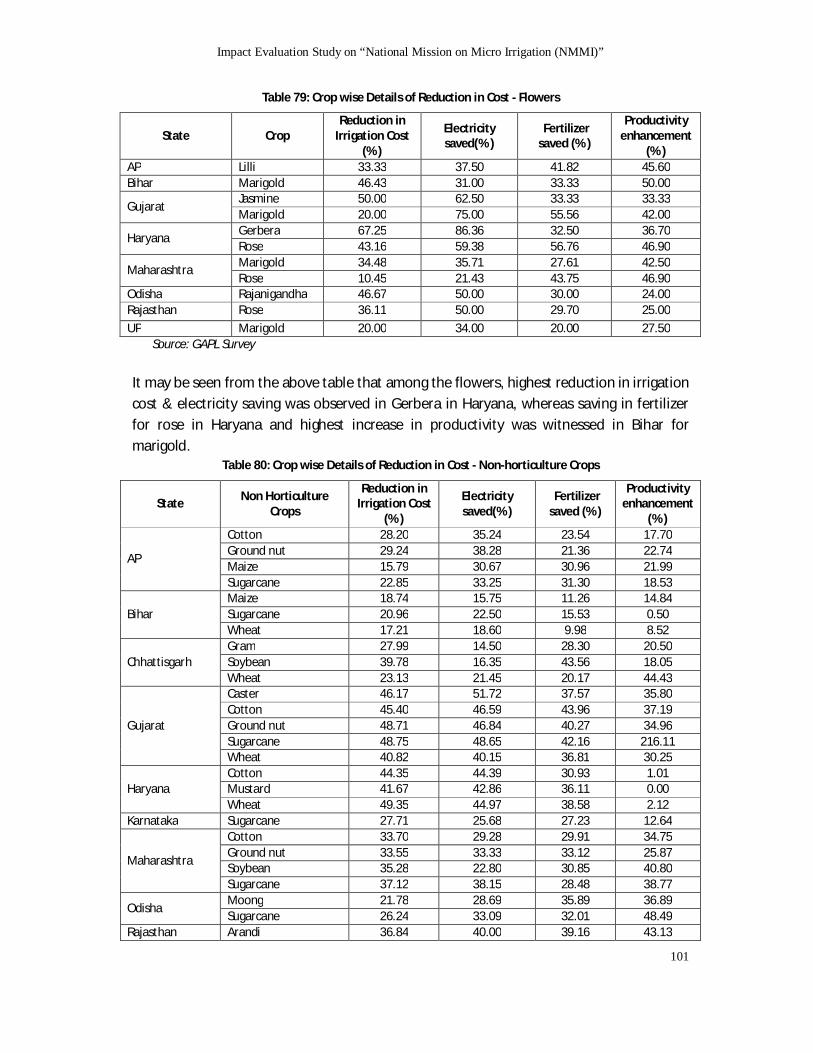
Table 75 Productivity Enhancement of Fruit Crops (MTha) 97 Table 76 Productivity Enhancement of Vegetable Crops (MTha) 97 Table 77 Crop wise Details of Reduction in Cost - Fruits 98 Table 78 Crop wise Details of Reduction in Cost - Vegetables 99 Table 79 Crop wise Details of Reduction in Cost - Flowers 101 Table 80 Crop wise Details of Reduction in Cost - Non-horticulture Crops 101 Table 81 Crops Adopted after Installation of MI System 102 Table 82 Extent of Adoption of New Crops after Installation of MI System 103 Table 83 Increase in Farmerrsquos Income 104 Table 84 Benefit Cost Ratio of MI System for Important Fruit Crops 106 Table 85 Benefit Cost Ratio of MI System for Important Vegetable Crops 107 Table 86 Benefit Cost Ratio of MI System for Important Floriculture Crops 108 Table 87 Percent Increase in Irrigated Area on Installation of MI System 108 Table 88 District wise Potential for Installation of MI System in Study Area 109 Table 89 Change in Manpower Requirement for Cultivation (per ha per crop cycle) 112 Table 90 State wise Physical and Financial Target amp Achievements during 2005-06 136 Table 91 State wise Physical and Financial Targets amp Achievements during 2006-07 136 Table 92 State wise Physical and Financial Targets amp Achievements during 2007-08 137 Table 93 State wise Physical and Financial Targets amp Achievements during 2008-09 137 Table 94 State wise Physical and Financial Targets amp Achievements during 2009-10 138 Table 95 State wise Physical and Financial Targets amp Achievements during 2010-11 138 Table 96 State wise Physical and Financial Targets amp Achievements during 2011-12 139 Table 97 State wise Physical and Financial Targets amp Achievements during 2012-13 139
List of Figures Figure 1 Percentage Annual Allocation (share in availability) of Water 1 Figure 2 States Covered for Study (Star Marked) 5 Figure 3 Physical and Financial Performance of NMMI Scheme 13 Figure 4 State wise Central Subsidy (Rs Crores) and Area Coverage (lsquo000rsquo ha) under NMMI 15 Figure 5 Year wise Targets and Achievements 17 Figure 6 State wise Cumulative Targets and Achievements (2005-06 to 2012-13) 18 Figure 7 Proportion of Area under Drip and Sprinkler Irrigation 22 Figure 8 Level of Satisfaction regarding lsquoAfter Sale Servicesrsquo 77 Figure 9 Increase in Irrigated Area () among Beneficiaries after Adoption of MI 90 Figure 10 Reduction in Fertilizer Consumption () 96 Figure 11 Extent of Adoption of New Crops by Beneficiaries () 103 Figure 12 Increase in the Income of Beneficiaries () 104 Figure 13 Subsidy Process under GGRC 130 Figure 14 Subsidy Process under APMIP 131
vii
Abbreviations Acronyms
AampC Agriculture amp Cooperation AP Andhra Pradesh APMIP Andhra Pradesh Micro Irrigation Project BIS Bureau of Indian Standards CHRBKB Chhattisgarh Rajya Beej and Krishi Vikas Ltd CIPET Central Institute of Plastic Engineering and Technology CSS Centrally Sponsored Scheme CWC Central Water Commission DMIC District Micro Irrigation Committee DoA Directorate of Agriculture DoH Directorate of Horticulture DRDA District Rural Development Agency EC Electrical Conductivity FGD Focused Group Discussion GAPL Global AgriSystem Pvt Ltd GGRC Gujarat Green Revolution Company GoI Government of India HDC Horticulture Development Society HDPE High Density Polyethylene HP Horse Power IA Implementing Agency ICT Information amp Communication Technology IEC Information Education amp Communication KGK Krishi Gyan Kendra KVK Krishi Vigyan Kendra MI Micro Irrigation MI System Micro Irrigation System Mha Million hectare Mhm Million hectare metre MIDH MoA Mission for Integrated Development Ministry of Agriculture MoWR Ministry of Water Resources NCPAH National Committee on Plasticulture Applications in Horticulture NHM National Horticulture Mission NMMI National Mission on Micro Irrigation PFDC Precision Farming Development Centre RKVY Rashtriya Krishi Vikas Yojana SAU State Agricultural University SC Scheduled Cast SMIC State Micro Irrigation Committee SPV Special Purpose Vehicle ST Scheduled Tribes ToR Terms of Reference UP Uttar Pradesh
Impact Evaluation Study of ldquoNational Mission on Micro Irrigation (NMMI)rdquo
I
Executive Summary Micro irrigation technologies (MI) are being promoted in India by the central and state governments by providing different kinds of financial institutional and technical support These technologies are promoted primarily as (1) a means to save water in irrigated agriculture (2) as a strategy to increase income and reduce poverty and (3) to enhance the food and nutritional security of rural households Despite the reported significant economic advantages and the concerted support of the government and NGOs the current area under micro irrigation in India remains an insignificant proportion of its potential Rising demand for irrigation water in the face of its inefficient use and concerns of growing water scarcity which has brought into renewed focus for conserving water and combating water scarcity including efforts in improving water use efficiency with the available water resources The real thrust on promoting MI adoption largely started with the recommendations of the Report of the Task Force on Micro Irrigation in 2004 The report sought to increase the emphasis on MI technology and recommended the Centrally Sponsored Scheme (CSS) in 2005-06 The Scheme was further upscaled into Mission Mode in 2010 to accelerate the rate of adoption of micro irrigation technologies under central sector programs
Government of India Ministry of Agriculture Department of Agriculture and Cooperation assigned the study on ldquoImpact Evaluation of National Mission on Micro Irrigation (NMMI)rdquo to access the performance of the programme implementation and access the impact of this Scheme on increase in farmersrsquo income through adoption of the MI system
The study was conducted in 13 states comprising of 64 districts in the sampled states namely Andhra Pradesh (AP) Bihar Chhattisgarh Gujarat Haryana Karnataka Maharashtra Odisha Rajasthan Tamil Nadu Sikkim Uttar Pradesh (UP) and Uttarakhand The field survey to get first-hand information was conducted for a total sample of 7400 comprising beneficiary and non-beneficiary farmers in these selected states by adopting stratifiedndashpurposive-sampling design Apart from this information was also collected from MI system suppliers and government officials under State Horticulture Mission and related departments Owing to promotional schemes introduced by the state and central governments the area under micro irrigation has increased from 11817 ha in 2005-06 to over 361
Impact Evaluation Study of ldquoNational Mission on Micro Irrigation (NMMI)rdquo
II
million ha in 2012-131 under NMMI in the country Despite having many advantages over conventional method of irrigation the area under micro-irrigation presently occupies only about 571 percent of the total potential area As per the available data only 285 percent of total irrigated area is under drip irrigation and 286 percent is under sprinkler irrigation Findings of the Study
A Current Status
i The Scheme since its inception in 2005-06 has made rapid stride across the country It has succeeded in bringing about 356 million ha area under micro irrigation in the sampled 13 states2 The physical targets for the period 2005-06 to 2012-13 were fixed to the extent of 383 million ha out of which 356 million ha has been brought under MI The Targets and achievements for financial outlay were Rs50128 and Rs50065 crores respectively The overall physical and financial achievements thus come out to be 9299 amp 9987 percent The extent of achievements however varied among different states States like Bihar Karnataka Odisha Rajasthan and Sikkim achieved more than 90 percent of the set physical and financial targets Uttarakhand could achieve only 21 percent of physical and 31 percent of the financial targets Other States such as AP Chhattisgarh Gujarat Haryana Maharashtra and Tamil Nadu succeeded to achieve more than 70 of their physical targets
ii AP Gujarat amp Maharashtra are leading states in the every aspect of performance the different activities involved in the process streamlined in the guideline of NMMI While Bihar UP Sikkim amp Uttarakhand states are lacking in terms of the functions mentioned in the guidelines
B Pattern of Assistance (subsidy)
i Most of the states are giving subsidy of more than 70 percent for installation of MI system However comparison of various states and analysis clearly demonstrates that increased subsidy had no significant impact on the increase of area coverage under MI system Farmers in
1 NCPAH 2 Ministry of Agriculture
Impact Evaluation Study of ldquoNational Mission on Micro Irrigation (NMMI)rdquo
III
Maharashtra Gujarat and Haryana were 223 140 and 100 percent respectively in case of sampled beneficiaries while pertinent subsidy component in these states was 60 50 and 90 percent respectively Similarly area coverage in Rajasthan Tamil Nadu and Bihar was noted to be 73 45 and 31 percent respectively and the corresponding figures for subsidy were 90 75 and 90 percent The aforesaid observation clearly suggests that increase in subsidy component beyond a limit has little or no impact on area coverage under MI system The relationship between area expansion under MI and quantum of subsidy has been computed considering beneficiariesrsquo data on area expansion in different states before and after adoption of MI system Hence the relationship of subsidies with area expansion as such does not refer to any specific year
ii The efficiency of scheme implementing agency is very high as most of the farmers have reported that their applications are processed and sanctioned in less than 40 days as against 60 days specified in the guidelines Similarly in most of the sample states beneficiaries are reported to be satisfied with respect to the procedure for filing the application till disbursement of the subsidy amount
iii Presently subsidy is limited to maximum area of 5 hectare per beneficiary which is an impediment to the growth of area under micro-irrigation The data on size and distribution of operational land holdings in the country also suggest that medium and large farmers accounted about 15 percent of total land holdings but occupying more than 5542 percent of the total area Therefore increase in the limit of maximum area per beneficiary would lead to combat water scarcity as well as the sustainable agriculture
iv All the states have reported convergence of Mission interventions with different schemes of the Government of India and State level programmes Most of the districts have converged NFSM and other programmes such as RKVY ICDP Farm Mechanization NHM etc
C Sources of Awareness and Reasons of Non-adoption
i The major sources of awareness about the NMMI scheme were MI system suppliers followed by fellow farmers and extension workers
Impact Evaluation Study of ldquoNational Mission on Micro Irrigation (NMMI)rdquo
IV
ii The non-beneficiaries farmers had mix responses for not adopting the scheme because of lack of awareness regarding subsidies lack of technical knowledge high capital cost and system being not economic for their crops and therefore not required
iii As per primary survey of the sampled beneficiaries about 59 percent of the respondents were small amp marginal farmers and 13 percent were women farmers who have taken the advantage of the Scheme
D System Cost and Sources of Fund
i On an average the cost of system per hectare incurred by the beneficiaries ranged between Rs 5445736 to Rs 7208631 in drip system and Rs 20481 to Rs 28171 in sprinkler irrigation system depending on the cropping pattern crop spacing etc
ii Almost in all states farmer beneficiaries use their own funds for contributing margin money (9866) Other sources albeit a small proportion constitutes banking KCC amp money lenders
iii Most of the farmers borrowed money at less than 10 percent of rate of interest from banks and KCCs
E Technical Observations about MI System
i It was observed that about 64 percent of the beneficiaries installed drip system 34 percent sprinkler system and 2 percent have installed both the systems in their fields The highest proportion of drip was observed in Karnataka because of higher proportion of area under horticulture crops whereas adoption of sprinkler was higher in Bihar because of higher proportion of area under field crops
ii The majority of the beneficiaries (about 6887) farmers of all the 13 states have got their soil and water tested In Gujarat UP Maharashtra amp Rajasthan soil testing adopted by 6927 5275 7337 and 7913 of respondents respectively
iii More than 70 percent of the respondent farmers of AP Gujarat Sikkim and Odisha were using in-line drip irrigation system whereas more than 45
Impact Evaluation Study of ldquoNational Mission on Micro Irrigation (NMMI)rdquo
V
percent beneficiaries of Haryana and Uttarakhand reported to practice on-line drip irrigation system
iv The farmers were using screen filters centrifugal separators hydro-cyclone filter disc filter sand media filters depending on the need The data reveals that screen filters are being commonly used by the beneficiaries in most of the sampled states except Haryana where more than 65 percent beneficiaries are using hydrocyclone and screen filters in combination due to the water quality as they are using canal water Moreover additional subsidy is being provided on hydrocyclone type of filters to ensure the complete removal of organic and inorganic contaminants
v The farmers in almost all the states reported that components of MI System met the BIS norms The average figure for all the sampled states where system components were as per the BIS norms came out to be around 98 percent
vi It was informed that the systems were well designed except in case of Sikkim and Odisha where the systems were functional but not able to meet the farmers expectation in totality
F After Sales Services
i On an average 91 of the beneficiaries across the sampled states reported that after sales services are being provided to them amp also they receive the services at the required time Most of the sampled beneficiaries revealed that they are getting warranty of the MI system
ii In almost all the states the sampled beneficiaries revealed that no technical support guidance on agronomic practices are extended to the users as they generally tell to take the help of extension agencies
G Impact Analysis
i The irrigated area has increased in all the surveyed states after the introduction of NMMI Scheme The Irrigated area within the 5892 sampled beneficiaries of the 13 states before adoption of MI system was found to be 1332086 ha which became 1444147 ha after adoption of MI system It is therefore concluded that total percentage increase in irrigated area with
Impact Evaluation Study of ldquoNational Mission on Micro Irrigation (NMMI)rdquo
VI
the sampled beneficiaries in 13 states after adoption of MI system was noted to be 841 from same source of water Maharashtra has topped the list with 2228 growth in irrigated area followed by Chhattisgarh
ii Farmers of all the states have shown an increase in area under horticulture crops after the adoption of the MI system The cropped area after implementation of CSS for promotion of MI during 2005-06 and subsequently NMMI has shown an increase which may be due to utilization of degraded marginal land into cultivable land amp increase in cropping intensity
iii Scheme has performed well in terms of reduction in input cost and significant cost saving has been observed for irrigation in all the surveyed states Irrigation cost is reduced by 20-50 with average of 323 Reduction in electricity consumption after installation of MI system Average electricity consumption has been reduced by about 31 after using the micro irrigation system Saving of fertilizers with averages reduction of about 28 in total fertilizer consumption in the surveyed states Fertilizer saving vary from 7- 42
iv Micro irrigation has generated benefits to the farmers in terms of enhancement of the productivity The average productivity of fruits and vegetables has increased about 423 and 528 respectively mainly because of crop spacing judicious use of water and other inputs etc
v The overall benefits accrued from the micro irrigation system are reflected in the income enhancement of the farmers All the surveyed states reported increase in farmerrsquos income in the range of 20 to 68 with an average increase of 485
vi Benefit Cost (BC) ratio of installing micro irrigation system is greater than ldquo1rdquo across the states and across the crops which signifies the importance of MI system in net income enhancement of the farmers The BC ratio was observed to be highest in Odisha among fruits amp vegetables whereas in flowers Rajasthan amp Haryana beneficiary farmers achieved higher BC ratio
vii The positive outcomes have made the food security effective due to the increase in the production and productivity of different crops and increased area under irrigation from same source of water Area under horticulture crops as well as nutritional security has also enhanced
Impact Evaluation Study of ldquoNational Mission on Micro Irrigation (NMMI)rdquo
VII
H Employment Generation
i Beneficiaries of all the states under study have shown decrease in utilization of the labor in pre-harvest practices that is labor saving on irrigation weeding fertilization and other operations It shows that the use of human labor after the use of micro irrigation has decreased significantly and ranges between 741 to 1875 percent But in post-harvest operations right from harvesting to handling and disposal of the produce there is an increase in labor utilization and it ranges between 2119 to 5023 percent due to the increase in the production which requires more of the labor for harvesting assembling and grading handling transportation and disposal of the produce
I Training and Capacity Building
i Among the surveyed states more than 90 percent of the sampled beneficiary farmers in the state of Haryana Karnataka Sikkim amp Tamil Nadu had training on different aspects of MI System whereas farmers of Bihar amp Odisha only 20 amp 52 percent of the beneficiaries have received the training
ii Results of survey revealed that the system suppliers manufacturers are the major sources for imparting training as more than 90 percent of the farmers received training from them Very less proportion of the respondents reported to have training from other sources such as SAUs KVKs etc The participant beneficiaries revealed that the duration of training period generally was of 1-2 days Almost all the respondents of Tamil Nadu UP Chhattisgarh Haryana were given training materials during the training while few beneficiaries of the Bihar and Uttarakhand Karnataka were provided such training materials
iii Key areas for training were operation and maintenance of the system adoption of package practices under MI and opportunities for introducing new crops Demonstration was other means of motivation and capacity building It was also found to be a good means of promotion
J Promotional Activities
i The farmers of the majority of the states acknowledged that the implementing agencies are promoting NMMI schemes in local language
Impact Evaluation Study of ldquoNational Mission on Micro Irrigation (NMMI)rdquo
VIII
however were not aware of the dedicated website for MI scheme in their state It is due to the fact that most farmers do not have access or willingness to use internet for information gathering
ii It was noted that maximum beneficiaries of Haryana (98) followed by Sikkim (80) Rajasthan (64) and Uttarakhand (63) have visited the demonstration trials laid out in the nearby areas
Thus it may be concluded that positive outcomes in terms of crop productivity enhancement due to implementation of MI Scheme have contributed significantly to food and nutritional security requirements The NMMI has helped to widen the food basket of the country with significant contributions coming from the bringing more area under irrigation and with judicious use of water New farm practices and innovations with support of government have encouraged the farmers to shift toward new crops giving higher income
It is noteworthy that the incremental net returns were observed to be generally higher for cash crops such as fruits vegetables groundnut cotton etc than for food crops viz bajra and wheat
Recommendations and Policy Implications
Given the vast potential benefits of micro-irrigation and fast decline of availability of water for irrigation in the country a number of technical and policy interventions are required to be introduced so as to increase the adoption of micro-irrigation in India The needed recommendations and interventions are presented below
A Scheme Related
1) The rate of subsidy provided under NMMI through central government is fixed uniformly for different categories of farmer with a limit of 5 hectare This needs to be restructured as about 15 of the large and medium farmersrsquo accounts for more than 5542 of the land in India Therefore this limit of five hectares needs to be enhanced for extending the subsidy
2) States often compete with each other to increase the subsidy component However it has been noted that higher subsidy does not necessarily lead to more area coverage under MI system as the highest increase in area under MI has been achieved by states which offer subsidy in the range of 50-75 percent eg Maharashtra Chhattisgarh Gujarat and Odisha In case of AP which increased subsidy from 70 to 90 percent in 2011-12 the additional area to come under MI in
Impact Evaluation Study of ldquoNational Mission on Micro Irrigation (NMMI)rdquo
IX
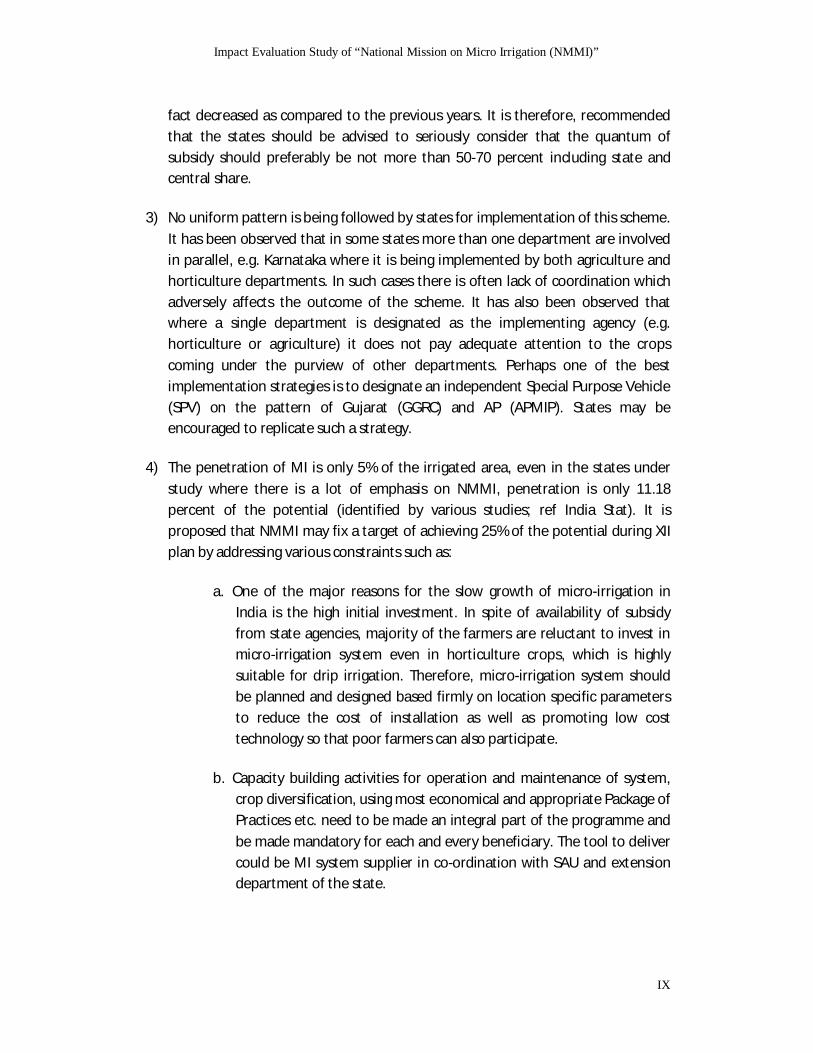
fact decreased as compared to the previous years It is therefore recommended that the states should be advised to seriously consider that the quantum of subsidy should preferably be not more than 50-70 percent including state and central share
3) No uniform pattern is being followed by states for implementation of this scheme It has been observed that in some states more than one department are involved in parallel eg Karnataka where it is being implemented by both agriculture and horticulture departments In such cases there is often lack of coordination which adversely affects the outcome of the scheme It has also been observed that where a single department is designated as the implementing agency (eg horticulture or agriculture) it does not pay adequate attention to the crops coming under the purview of other departments Perhaps one of the best implementation strategies is to designate an independent Special Purpose Vehicle (SPV) on the pattern of Gujarat (GGRC) and AP (APMIP) States may be encouraged to replicate such a strategy
4) The penetration of MI is only 5 of the irrigated area even in the states under study where there is a lot of emphasis on NMMI penetration is only 1118 percent of the potential (identified by various studies ref India Stat) It is proposed that NMMI may fix a target of achieving 25 of the potential during XII plan by addressing various constraints such as
a One of the major reasons for the slow growth of micro-irrigation in India is the high initial investment In spite of availability of subsidy from state agencies majority of the farmers are reluctant to invest in micro-irrigation system even in horticulture crops which is highly suitable for drip irrigation Therefore micro-irrigation system should be planned and designed based firmly on location specific parameters to reduce the cost of installation as well as promoting low cost technology so that poor farmers can also participate
b Capacity building activities for operation and maintenance of system crop diversification using most economical and appropriate Package of Practices etc need to be made an integral part of the programme and be made mandatory for each and every beneficiary The tool to deliver could be MI system supplier in co-ordination with SAU and extension department of the state
Impact Evaluation Study of ldquoNational Mission on Micro Irrigation (NMMI)rdquo
X
5) Micro irrigation System is mostly promoted through subsidy schemes and not as an on-farm water and land management strategy In certain states under subsidy scheme the requisite consideration have not been given in respect of field size shape topography type and location of water source seasonal fluctuations type of soil and crop to be grown As a result in certain cases the subsidy may not match the specific situation of an individual farmer consequently the system may not match the site specific situations of an individual farmers consequently the system may not operate to the complete satisfaction of the farmer
B Technology Related
1) There is a need to establish a Central Testing Facility (CTF) to deal comprehensively with the design development and testing of all equipments devices machines used in micro irrigation systems using state-of art technology It is suggested that the Government may consider contacting regular and random technical audit of the system to cover about 2-3 percent beneficiaries within first and second year of the installation This will keep check on to quality and suppliers will be more vigilant to supply good quality of system
2) It is suggested that the implementing agencies should be more vigilant regarding warranty and after sales service of the system provided by the suppliers It is proposed that 10 percent of the subsidy may be released after one year subject to satisfactory performance of the system as certified by the beneficiary Maintenance manual in vernacular language should be made available to the beneficiaries at the time of installation of the system
3) It is observed that the cost of micro-irrigation accessories such as emitters filters laterals etc vary between shops and places Sometimes farmers do face problem in getting spare parts in time It is necessary to provide quality materials in time for farmers for the speedy adoption of micro-irrigation
4) Inadequate information about the operation maintenance as well as the usefulness of micro irrigation is one of the main reasons for its uneven spread across regions in India Farmers still do not have full knowledge regarding the usefulness of the micro irrigation Even the adopters do not know fully how much of subsidy is available per hectare for different crops
5) Clogging of drippers mainly due to poor quality of water helps in bacterial growth which can be controlled by using chlorination which acts as a powerful oxidizing agent and vigorously attack micro-organisms such as algae fungi and bacteria
Impact Evaluation Study of ldquoNational Mission on Micro Irrigation (NMMI)rdquo
XI
Also acid is injected into drip irrigation system to lower the pH of the irrigation water and this helps in preventing the precipitation of salts such as calcium carbonate magnesium carbonate or ferric oxide It has been observed during the course of survey that the availability of sulphuric acid in the nearby towns is a major constraint and farmers are forced to purchase new spares by discarding clogged drippers It is therefore recommended that system suppliers should make acid available to the growers as part of their after sales service obligation Therefore studies need to be carried out to device efficient eco friendly de-clogging measures so that farmers do not suffer from such problems
C Awareness and Capacity Building
1) The extension network currently operated mainly by government agencies does not seem to be making significant impact on the adoption of this technology Therefore there is a need to revamp the entire extension network by involving the MI system manufactures in order to increase amp improvise the existing quality of extension services
2) MI system manufacturers should be involved intensively in promoting micro-irrigation by introducing frequent demonstration at farmersrsquo field and strategic locations in the district state The MI system manufacturers should be involved in providing advice on agronomic packages to the farmers so as to encourage the adoption of micro irrigation at a large scale
3) Since MI system suppliers are one of the major sources of creating awareness among potential beneficiaries their involvement in laying down demonstration may be increased Similarly imparting training on technical and operational aspects of the system be included as mandatory part of the training of the farmers by the system suppliers The training may also include aspects of package of practices which may be standardized by the SAUs amp other related organization and supplied to system suppliers for further dissemination to the farmers
4) Awareness on MI system is low in states like Bihar UP and Odisha Special drive is needed for exposure visits trainings to make them aware about the benefits and operation of the system The number of demonstration farms should also be increased
5) It is understood from the field study that the officials who are involved in promoting micro-irrigation technology under the GoI Scheme have inadequate knowledge about the technical and other details of MI Therefore the state
Impact Evaluation Study of ldquoNational Mission on Micro Irrigation (NMMI)rdquo
XII
government extension staffs need to undergo lsquoRefresher Courses and exposure visitsrsquo to have basics of micro-irrigation thereby enabling their role in the implementation of the scheme
D Follow up Actions
1) Though micro-irrigation has been in use in different States since mid-eighties State-wise potential area is not estimated as of today Therefore it is essential to prepare State-wise and crop-wise potential area for MI A detailed estimate on State-wise potential would be useful to fix the target to be achieved and further to develop the road map for MI adoption in the country
2) It is evident from field study that capital cost required to install micro irrigation system is relatively high Because of this reason considerable percentage of farmers have expressed that they are unable to adopt this technology for low value crops There has been a significant development in the MI technology and efforts should be on developing and popularizing low cost technologies This would help reducing the cost of the system and increasing the adoption of micro-irrigation at a large scale
3) At least one percent of the outlay on micro-irrigation needs to be earmarked for research on micro-irrigation technology and development of package of practices as well as crop diversification potential
4) The information regarding all the activities under NMMI scheme at national and state level should be under public domain Although presently very few farmers are using internet based information yet this is becoming popular and it is expected that in next few years websites and internet will become a major source of information particularly among younger population Therefore the website of NCPAH be made more popular and content may also be increased to include PoP and crop diversification
Impact Evaluation Study of ldquoNational Mission on Micro Irrigation (NMMI)rdquo
1
1 Introduction 11 Project Background Water is one of the most critical inputs for agriculture however the share of water availability to the agriculture sector is declining at an alarming rate due to its ever increasing demand for the energy industry and domestic purposes Much of the available irrigation water in India is applied through the conventional surface irrigation methods which involve huge conveyance and distribution losses resulting in low overall irrigation efficiencies (35-40) The poor irrigation efficiency of these systems not only reduce the anticipated outcomes from investments in the water resources but also create environmental problems like lowering of water table due to over-exploitation of sub-surface water resources water-logging and soil salinity thereby adversely affecting the crop yields
Figure 1 Percentage Annual Allocation (share in availability) of Water
Source Central Water Commission MoWR GoI
On the other hand the situation of cropping under irrigated and rain fed conditions is quite decimal There is a decimal chance of further enhancement to the area under irrigation which calls for improving the water use efficiency of the available water resources which can be accomplished through the proven water saving technologies such as micro irrigation systems The term micro irrigation describes irrigation systems that deliver water through small devices directly in the plant root zone at prescribed rate at regular interval of time
Impact Evaluation Study of ldquoNational Mission on Micro Irrigation (NMMI)rdquo
2
In countries like Israel the water-use efficiency in agriculture sector has been improved in physical (technical) terms of water use per tonne of output (or hectare irrigated) due to improvements in agricultural water use efficiency As a consequence the share of agriculture in total water use fell from over 70 percent in 1980 to 57 percent by 2005 and further it is projected to decline to 52 percent by 20253 Even in Indian scenario Micro-irrigation (MI) methods have been found to have significant water saving and crop productivity benefits Studies have claimed water saving of 40 ndash 80 percent and productivity gains up to 100 percent (Raina et al 1999 2013 Sivanappan 1994 Palanisami et al 2011) Keeping these advantages in view the Government of India (GoI) constituted a Task Force in 2004 to assess the potential of MI technologies in the country The Report of the Task Force sought to increase the emphasis on MI technology and recommended a broader framework viewing adoption of MI technologies as a part of the overall water management strategy It also recommended allocation of more financial resources of subsidies for MI adoption with state governments contributing 10 percent of the cost while the central funds would account for 40 percent and advised greater flexibility for states to determine their appropriate implementation structure and institutional mechanisms for subsidy disbursement The main objectives of the National Mission on Micro Irrigation are as follows
To increase the area under micro irrigation through improved technologies To enhance the water use efficiency in the country To increase the productivity of crops and farmersrsquo income To establish convergence amp synergy among on-going Government
programmes To promote develop and disseminate micro irrigation technology for
agriculture horticulture development with modern scientific knowledge To create employment opportunities for skilled and unskilled person especially
unemployed youth
12 Salient Features of the Scheme NMMI is a Centrally Sponsored Scheme in which 40 of the cost of the MI system is borne by the Central Government 10 by the State Government and the remaining amount is borne by the beneficiary either through his her own resources or loan
3 OEDC-FAO Agricultural Outlook 2012-2021
Impact Evaluation Study of ldquoNational Mission on Micro Irrigation (NMMI)rdquo
3
from financial institutions In respect of small and marginal farmers the share of Central Government increases by 10 to make 50 of the cost of the system The main features of the scheme are
All categories of farmers are eligible to avail assistance under this scheme Assistance to farmers is limited to a maximum area of five (5) ha per
beneficiary Assistance for laying down demonstration on farmers field are given 75
subsidy for a maximum area of 05 ha per demonstrate and is met entirely by the Central Government
Assistance is available for both drip and sprinkler irrigation for wide spaced as well as close spaced crops However assistance for sprinkler irrigation system is available only for those crops where drip irrigation is uneconomical
Assistance is available for irrigation systems for protected cultivation including greenhouses polyhouses and shade net houses
The subsidy amount is calculated taking into consideration cost of fertigation with fertilizer tank venturi systems sand filters media filters hydro-cyclone filters sand separators and other different type of filters and valves required for MI system
Panchayati Raj Institutions (PRIs) are involved in promoting the scheme identification of priority areas identification of beneficiaries and organizing interactive meetings with the representatives of micro irrigation industry
At the National Level the Executive Committee of NMMI reviews the progress of NMMI and approve the Annual Action Plans of States At the State level the State Micro Irrigation Committee (SMIC) oversees the implementation of the Mission programme in districts The District Micro Irrigation Committee (DMIC) coordinates the implementation of NMMI programme at the District level NCPAH coordinate and monitor the programme of NMMI in different States
The scheme is implemented by an implementing Agency (IA) at the State level duly appointed by the State Government Funds are released directly to the IA on the basis of approved plans for each year
The IA prepares the Annual Action Plan for the State on the basis of the district plans and get it forwarded by SMIC for approval of the Executive Committee (EC) of NMMI
The State Level Micro Irrigation Committee (SMIC) undertakes registration of System Manufacturers who are authorized to supply systems to the farmers under the NMMI subsidy scheme One of the important criteria for registration is that these manufacturers should be able to supply the systems as Bureau of
Impact Evaluation Study of ldquoNational Mission on Micro Irrigation (NMMI)rdquo
4
Indian Standards (BIS) marking and provide proper after sales service to the satisfaction of the farmers
13 The Assignment NMMI has now been in operation effectively for more than six years and the government feels that this is the right time to asses and quantify the impact of Scheme The Govt of India Ministry of Agriculture Department of Agriculture and Cooperation Krishi Bhawan New Delhi has engaged Global AgriSystem through open bid to carry out an Impact Evaluation Study of National Mission on Micro Irrigation (NMMI) Scheme 14 Objectives of the Study The ldquoNational Mission on Micro Irrigation (NMMI)rdquo was to be evaluated in terms of water saving increase in area production and productivity of major crops so as to serve various objectives of National Food Security crop diversification with the changing food consumption habits saving of various inputs such as fertilizer power etc that are of paramount importance to the country The prime purpose objectives of the study are as follows
i Transparency in identification of beneficiaries prioritizing for release of funds in order of the application approval of system suppliers timely release of financial assistance dovetailing of various MI schemes effectiveness of various MI technologies methodology adopted for record keeping auditing and effectiveness of the state implementing agencies
ii Overall performance of the programme implementation and whether the programme is being implemented as the operational guidelines of NMMI in various states
iii Employment generated due to the implementation of NMMI and efforts laid for the development of human resources wrt Micro Irrigation between FY 2005-06 to 2011-12
Impact Evaluation Study of ldquoNational Mission on Micro Irrigation (NMMI)rdquo
5
2 Approach and Methodology The evaluation study of the ldquoNational Mission on Micro Irrigationrdquo (NMMI) scheme requires a wholesome approach to find out proper impact of the scheme at the ground level Keeping in view the scope of work given ToRrsquos and with the understanding of the objectives the approach and methodologies adopted by the Consultants are summarized in the following paragraphs 21 Approach The approach adopted for the present impact evaluation study is based on use of both the secondary as well as primary data collected from 13 states conducting interviews of various stakeholders (Figure 2)
Figure 2 States Covered for Study (Star Marked)
Impact Evaluation Study of ldquoNational Mission on Micro Irrigation (NMMI)rdquo
6
The study comprised primarily adopting the following steps
Beneficiaries who availed the assistance to install MI system and non-beneficiaries from the same area village who did not install MI
Mobilisation of the study team Continuous contact and consultations with the various concern agencies and
the Client Sharing of information throughout the study period with the Client and flexibility to respond to desired changes and directions
Collection and review of reports documents government policies plans and programs
Development of questionnaires and checklists for primary data collection Interaction and interview with policy makers planners bureaucrats
development workers traders and etc Field survey in the selected areas Analysis of secondary and primary data using appropriate tools Survey of beneficiaries amp non-beneficiaries to arrive at a comparative analysis
of the advantages derived by the adopters
22 Methodology Based on above approach following methodology is adopted to carry out the evaluation study
Table 1 Methodology Adopted for Impact Assessment
Sl No Description of the Method Description of the Units Covered
1 Survey Method a Sample
Survey Selected beneficiary and non-beneficiary households
2
Rapid Appraisal Method a Focus group
discussions Beneficiary and non-beneficiary households
b Semi Structured interviews with key informants
Various implementing agencies at district and block levels Manufacturers service providers Non-Governmental Organizations(NGOs) Financial Institutions Village elders community leaders and Knowledgeable persons
Source GAPL
Impact Evaluation Study of ldquoNational Mission on Micro Irrigation (NMMI)rdquo
7
221 Sources of Data Collection
The primary data has been collected through participatory discussions and structural interviews semi- structured questionnaires for covering various evaluation parameters from various stakeholders
Farmers Officials of horticultureagriculture departments Officials of Irrigation department Scientists from Krishi Vigyan Kendras and agricultural universities Banks amp other financial institutions Social mobilizers Pradhan Opinion leadersprogressive farmers Industry
Secondary data regarding physical and financial targets amp achievements was obtained from Ministry of Agriculture amp NCPAH Other sources of published data such as NHB statistics Published research in the reputed journals GoI publications as well as Statistics from State and District level have been utilized for secondary data
Task 1 Review of Secondary Information
A desk review of secondary data regarding overall area under irrigation research work on potential of MI cropping pattern and land use progress position regarding distribution Similarly physical and financial performance relating to various components of the Scheme has been collected from MoA NCPAH and State Government agencies The information collected has thereafter been analyzed for reaching to conclusions
Task 2 Field Research and Primary Data
In depth field study has been carried out to find out stakeholdersrsquo perception and impact assessment of the scheme Field study included three segments
i A detailed survey of farmers( both beneficiaries and non-beneficiaries) through a structured questionnaire and PRA techniques
ii Implementing agencies and officials to assess the efficiency and efficacy of implementation of the scheme
iii Institutions ndash an interaction with officials of the agriculture universities to understand current technologies in micro-irrigation their adaptability to India agriculture and sustainability in the long rum
Impact Evaluation Study of ldquoNational Mission on Micro Irrigation (NMMI)rdquo
8
Task 3 Developing the Sampling Plan for primary survey and the Associated Fieldwork Schedules 222 Sampling The evaluation study was conducted in the given 13 states The detailed sampling plan followed for the evaluation study was as under
Table 2Sampling Plan
Sl No
Stage of Sampling
Sampling Unit
Criteria for Selection of
Sample Units
Sample Method Adopted
Description of the Sample Units
Number of Sample Units
1 I Stage Agro climatic regions
As per state classification Micro units Best and average
performing See Table 4
2 II Stage District
Level of Micro Irrigation coverage as proxy for development
Stratified Purposive Sampling
Additional area brought under irrigation
Best and average performing districts in ratio of 7525
4-6 districts in plain areas and 2-3 in hilly states In all 64 districts have been selected
2 III Stage Blocks Level of Development
Stratified Purposive Sampling
Additional area brought under irrigation in the block
Best and average performing blocks in ratio of 7525
5-8 blocks in plains and 5-7 in hilly states covering from each sample district A total of 398 blocks were finally selected
3 IV Stage Villages Coverage of Programmes
Stratified Purposive cum cluster Sampling
Best and average geographical connectivity
4 V Stage Households
Beneficiaries on random basis amp non beneficiaries from similar conditions
Stratified Purposive Random Sampling
Proportionate sample according to size of holding and area under micro irrigation
7400 farmers including 5892 beneficiary household from 13 states
Source GAPL
223 The Sample Design Multi-stage - stratified - purposive ndashrandom sampling design has been adopted in the study The samples have been collected from all the identified states The consultant has applied Stratified Random Sampling Method The sample is representative and has been covering all categories of farmers The sampling has been taken into account the extent of implementation of NMMI Scheme in the State
Impact Evaluation Study of ldquoNational Mission on Micro Irrigation (NMMI)rdquo
9
Selection of districts and blocks Selection has been done in a manner so as a representative data emerged from that particular sampled state The sample has covered selected districts in 13 states as per the ToR The details of sample size both of beneficiaries and a non-beneficiary across the states has been summarized in Table 4
Districts have been selected from each selected region of the state Four to seven districts (two to four from hilly states) from each state have been selected The selected districts were ranked as per their performances where one district each from the high good average amp poor performance were included for drawing samples as summarized in the following table
Table 3 State wise List of Sampled Districts Covered in the Study
S No
States Districts
1st 2nd 3rd 4th 5th 6th 7th 1 AP Anantpur Medak Nalgonda Adilabad Nellore Krishna Vishakhapatnam 2 Bihar WestChamparan Rohtas Gaya Madhepura 3 Chhattisgarh Durg Sarguja Kanker Jashpur 4 Gujarat Banaskantha Bhavnagar Jamnagar Bharuch Mehsana Anand 5 Haryana Bhiwani Sirsa Fatehabad Karnal 6 Karnataka Belgaum Hasan Bidar Chitradurga Mysore Bellary 7 Maharashtra Jalgaon Ahmednagar Jalna Kolhapur Wardha Ratnagiri 8 Odisha Ganjam Mayurbhanj Boundh Nayagarh Bhadrak 9 Rajasthan Jalore S Madhopur Jodhpur Jhalawar Hanumangarh Udaipur 10 Tamil Nadu Erode Tirunelveli The Nilgiris Thiruvarur Villupuram
11 UP Jhansi Balia Saharanpur Siddharth Nagar Kannauj Aligarh
12 Sikkim Gangtok Mangan 13 Uttarakhand U S Nagar Haridwar Nainital
Source GAPL
Further blocks were selected on the basis of coverage in area under irrigation which is taken as a proxy of development of micro irrigation infrastructure From each sample district 5-8 blocks - best and average performed blocks (7525 ratio) were selected randomly among those where MI systems have been installed 224 Selection of Beneficiaries and Non-beneficiaries Villages have been purposively selected on the basis of coverage of the programme The selection of the sampled beneficiary farmerhouseholds has been made randomly for each selected village A complete list of beneficiaries are drawn and divided into various size classes In the each selected village the households were finalized on the
Impact Evaluation Study of ldquoNational Mission on Micro Irrigation (NMMI)rdquo
10
basis of their farm holding socio-economic status and coverage of programmes Besides this non-beneficiaries were also selected to identify reasons for their non-participation in the programmes and also to compare the benefits drawn by beneficiaries compared to this category This in fact facilitated the impact evaluation study based on lsquowith and withoutrsquo approach The farmers selected for the primary survey include various categories of farmers Besides it also includes PRIs and district amp state level concerned functionaries It is pertinent to mention here that the sampling design has taken care that the beneficiaries selected are representative of overall population of the beneficiaries at State and District levels The total sample comprises of beneficiaries and non-beneficiaries in the ratio of 8020
Table 4 State wise Sample Distribution for the Study
Sl No
Name of State UT
Sample Districts
Sample Blocks district
Farmers per
block
Total respondents
Beneficiaries Non
beneficiaries
1 AP 7 6 20 840 672 168 2 Bihar 4 8 20 644 516 128 3 Chhattisgarh 4 6 20 480 384 96 4 Gujarat 6 6 20 720 576 144 5 Haryana 4 5 20 401 320 81 6 Karnataka 6 6 20 720 576 144 7 Maharashtra 6 7 20 881 672 169 8 Odisha 5 6 20 600 480 120 9 Rajasthan 6 6 20 712 574 138
10 Tamil Nadu 5 6 20 575 455 120 11 UP 6 7 20 695 527 168 12 Sikkim 2 5 6 60 50 10 13 Uttarakhand 3 6 6 112 90 22
Total 64 7400 5892 1508
Task 4 Validation of Sampling Plan and Questionnaires
Field research has been carried out on the predefined and approved questionnaires in active consultations with DAC The final sampling plan and questionnaires and field survey plans have been validated by DAC
Task 5 Pilot Testing amp Survey Preparation
In order to validate that the questionnaire were able to gather information as per design and to train the supervisors of the survey team a pilot survey was undertaken in Uttarakhand and Maharashtra The main purpose of pilot testing the survey was to check the validity of the questionnaire by finding questions or words that might be misinterpreted misread or misunderstood as well as to check the functionality of the
Impact Evaluation Study of ldquoNational Mission on Micro Irrigation (NMMI)rdquo
11
questionnaire in the field Training of the interviewers and supervisors which is one of the most important stages prior to conduct of field work was done to familiarize the interviewers with the survey instruments Task 6 Constituting Field Work Teams and Briefing Meeting with Field Supervisors and Felid Investigators
On acceptance of the final questionnaires and the sample plan the field teams were gathered in Delhi and a briefing meeting and training session had been held for the field research teams
Task 7 Primary Data Collection Exercise
During the fieldwork face to face interviews were held with various types of respondents including State Agriculture Horticulture departments and other stake holder as mentioned above were interviewed with structured information schedules and information was collected accordingly
Task 8 Stakeholder Discussion
Participatory discussion was arranged with various stakeholders at various levels as follows
I Stage At inception stage to discuss and finalize work plan questionnaire and methodology
II Stage After completion of field survey to discuss preliminary finding
III Stage After submission of DPR to discuss the recommendation and finalize the report
Task 9 Data Entry Analysis of Secondary and Primary Data and Report Writing
Both primary and secondary data is being collected compiled and tabulated and analyzed to arrive at appropriate conclusions 23 Limitations of the Study The study was conducted for 13 states and the consultant completed this study under certain limitations which were as follows
a Like any study based on sampling method the findings of the response of respondents have been extrapolated to the entire scheme for the purpose of
Impact Evaluation Study of ldquoNational Mission on Micro Irrigation (NMMI)rdquo
12
studying the achievements amp objectives of the scheme impact of the scheme and methodology of the implementation of the scheme etc
b It took almost more than one month to get the comments on the Inception Report as well as questionnaires which led to delays in the mobilization of the field work
c The consultant and the survey team got stuck during the study period due to the complications amp coordination between state amp central government authorities
d Due to natural disaster taking place in Uttarakhand the districts to be covered were changed as it was difficult to reach the selected districts
e The field work coincides with rainy season and this year there were heavy rains in few states which also hampered the field study Moreover the information regarding beneficiaries of the selected states was not provided in time therefore the survey team had to visit those areas more than one time For example in case of Haryana the survey team visited state authorities with list of districts identified for survey by consultant in consideration with MoA and NCPAH but the state authorities did not agree and wanted some time to suggest changes and therefore survey team had to wait which led to delay
f In the states like UP and Tamil Nadu the state government officials did not cooperate to provide information of beneficiaries in the beginning and consultants had to mobilize GoI authorities to send communication for co-operation which caused delay in starting field work
g In the state of UP the designed sample size has not been achieved for covering 168 farmers (beneficiaries) as number of beneficiary farmers in selected districts was less therefore the sample size has been constraint accordingly
In spite of these limitations efforts were made by the consultant to complete the study in time
Impact Evaluation Study on ldquoNational Mission on Micro Irrigation (NMMI)rdquo
13
3 Assessment of Current Status 31 Performance of MI Scheme Micro Irrigation industry in India is driven by the assistance from the central and the state governments The NMMI has given major impetus to the growth of the industry In fact the growth of the MI industry can be viewed as per growth of fund allocation to MI scheme The trend of area coverage and total subsidy advanced in the states under study has been shown in the figure 3
Annual subsidy advanced has shown increasing trends continuously except for the year 2008-09 whereas the growth of area coverage has witnessed some fluctuations in the year 2007-08 and 2012-13 Despite this fluctuation the growth in the area coverage is not proportional to the growth in fund spent The both trend lines witness convergence in growth up to 2009-10 but there after witnessed the divergence in growth
The fund spent has witnessed sudden jump after the conversion of the NMMI scheme from CSS in the year 2010-11 The fund spent has increase by about 62 percent from 2009-10 to 2010-11 and the increase in area coverage is 1538 percent in corresponding period This fact was further analyzed and the main reason for high subsidy amount is the reason of revision in the cost norm per hectare and more area coverage under drip system
The cumulative area coverage since the launch of scheme to 2012-13 in the states under study is about 356 Million ha and the total subsidy advanced till 2012-13 stood at Rs 5006 crores in the same states
Figure 3 Physical and Financial Performance of NMMI Scheme
Source Ministry of Agriculture
Impact Evaluation Study on ldquoNational Mission on Micro Irrigation (NMMI)rdquo
14
Table 5 Year wise Area under Different MI Systems of Sampled Beneficiaries
Year Area under Drip
Irrigation (ha) Area Under Sprinkler
Irrigation (ha) 2000 223 162 2001 445 000 2005 101 000 2006 15279 546 2007 17656 8282 2008 60209 21929 2009 64467 22961 2010 76567 46818 2011 128797 78328 2012 421496 202578 2013 30784 31355
Source GAPL survey
The above table depicts that the year wise area under drip is expanding more in comparison to the area under sprinklers that leads to higher system cost This may be the reason for splitting lines of physical and financial achievements after 2009 in the figure 2 It may also be inferred from the table 5 that subsidy has been increased in most of the states that caused increase in financial achievement than physical achievement which led to splitting trend line of physical and financial achievements
Table 6 Comparison of Subsidy between Pre and Post NMMI Scheme
SNo State
Total Subsidy of the farmers ()
Pre NMMI Scheme
Post NMMI Scheme Small amp
Marginal Farmers
General Farmers
1 AP 70 90 75 2 Bihar 90 90 80 3 Chhattisgarh 70 75 50 4 Gujarat 50 50 50 5 Haryana 90 90 90 6 Karnataka 75 80 50 7 Maharashtra 50 60 50 8 Odisha 70 90 80 9 Rajasthan 70 70 70
10 Sikkim 60 60 11 Tamil Nadu 65 100 75 12 UP 50 90 75 13 Uttarakhand 50 60 60
Impact Evaluation Study on ldquoNational Mission on Micro Irrigation (NMMI)rdquo
15
32 State wise Performance
AP and Gujarat were the pioneer states which harnessed the benefits of the scheme with area coverage of about 678 thousands and 504 thousands ha In 2006-07 more states were brought under the scheme and by the end of 2007-08 all the states under study except Sikkim and Uttarakhand were covered during 2011-12 The states of AP followed by Maharashtra are top in the list of area coverage as well as total subsidy advanced under MI The total cumulative central subsidy advanced and total area covered since the launch of the scheme is shown in the graph
Figure 4 State wise Central Subsidy (Rs Crores) and Area Coverage (lsquo000rsquo ha) under NMMI
Source Ministry of Agriculture
33 Targets and Achievements The states under study have achieved 9987 financial targets but the achievement of physical targets stood at 9299 The states of Gujarat and Maharashtra have achieved 100 financial targets but have not met the physical targets In Gujarat the financial utilization is 10026 due to inclusion of interest amount The state of Bihar Karnataka Odisha Rajasthan and Sikkim which have achieved more than 100 physical targets without utilizing the total allotted fund
Impact Evaluation Study on ldquoNational Mission on Micro Irrigation (NMMI)rdquo
16
It is pertinent to mention that achievements are exceeding the value of 100 percent Since the preceding year unspent balance has been brought forward to next year The scheme was launched in 2011-12 in Sikkim and Uttarakhand and the Sikkim has performed much better in physical target achievement as compared to Uttarakhand In fact Sikkim is the top performer in physical target achievements whereas the Uttarakhand is least one among the states under study as the scheme is launched few years back only The state wise cumulative (2005-06 to 2012-13) physical and financial targets vs achievement are given in the table below
Table 7 State wise Cumulative Physical amp Financial Targets and Achievements
State Physical (lsquo000rsquoha) Financial (Rs in lakh)
Target Achievement
Achievement Target Achievement
Achievement AP 87116 77205 8862 13714800 13517558 9856 Bihar 6676 7880 11804 813210 726062 8928 Chhattisgarh 13515 12602 9324 1371370 1323969 9654 Gujarat 46102 43172 9364 7247100 7265900 10026 Haryana 6638 5783 8712 882086 804293 9118 Karnataka 51096 53668 10503 6088932 5981226 9823 Maharashtra 94179 69605 7391 11542800 11542800 10000 Odisha 5406 6302 11658 506200 468763 9260 Rajasthan 57640 66307 11504 5039296 4946894 9817 Tamil Nadu 11897 11767 9890 2961660 2937490 9918 UP 2712 1883 6941 279904 254098 9078 Uttarakhand 101 022 2139 22500 7000 3111 Sikkim 039 051 13002 60000 40000 6667 Total 383117 356246 9299 50128009 50064490 9987
Source Ministry of Agriculture The major inferences drawn from table below are as follows
The scheme made rapid stride after the launch and achieved more than 80 of the targets both physical and financial in 2006-07 and the physical and financial targets have been achieved more than 100 in the subsequent year ie 2007-08 to 2009-10
The financial target achievement has been more than 100 on 2007-08 onwards except for the year 2011-12 whereas the physical target achievement has been declined after 2009-10
The Scheme has performed best in terms of both physical and financial targets achievement with around 130 achievement
The year wise cumulative (2005-06 to 2012-13) physical and financial targets vs achievement is given in table below
Impact Evaluation Study on ldquoNational Mission on Micro Irrigation (NMMI)rdquo
17
Table 8 Year wise Cumulative Physical and Financial Targets and Achievements
SNo Year Physical Financial
Target (Ha)
Achievement (Ha)
Achievement
Target (Rs)
Achievement (Rs)
Achievement
1 2005-06 18022300 1181700 656 2328415 163517 702 2 2006-07 39736500 33430060 8413 4457599 3659033 8209 3 2007-08 32404870 42117390 12997 3989632 4729348 11854 4 2008-09 42309500 51633800 12204 4172462 4678426 11213 5 2009-10 42576400 55475277 13030 4353157 5664040 13011 6 2010-11 66770000 64006900 9586 9008411 9173680 10183 7 2011-12 69819700 55752143 7985 10829000 10807615 9980 8 2012-13 71478800 52648500 7366 10989300 11188800 10182
Total 383118070 356245770 9299 50127976 50064459 9987 Source Ministry of Agriculture
Figure 5 Year wise Targets and Achievements
Impact Evaluation Study on ldquoNational Mission on Micro Irrigation (NMMI)rdquo
18
Figure 6 State wise Cumulative Targets and Achievements (2005-06 to 2012-13)
The performance of the scheme in different states and in different tenure can be sum up as under
The scheme created a good imprint in 2006-07 and achieved 8213 and 8209 of physical and financial targets respectively in the states under study In this year state of Gujarat Karnataka Maharashtra and Rajasthan achieved more than 100 of physical targets
The performance of scheme contributed to be extremely well in the year 2007-08 to 2009-10 and registered more than 100 achievement of both physical as well as financial target
Impact Evaluation Study on ldquoNational Mission on Micro Irrigation (NMMI)rdquo
19
Table 9 Year amp State wise Physical Targets and Achievements (lsquo000rsquo ha)
State 2005-06 2006-07 2007-08 2008-09 2009-10 2010-11 2011-12 2012-13 (March 13)
T A T A T A T A T A T A T A T A AP 4552 678 19346 8462 4639 11485 8521 12358 11445 13834 16550 12276 8895 10506 13169 7607 Bihar - - 1422 - - 023 - 031 - 011 - 1349 196 2329 5057 4137 Chhattisgarh - - 2875 460 1006 2083 1363 3057 1764 1577 2878 2183 1717 1839 1912 1402 Gujarat 1672 504 1825 2434 4516 4304 3356 5343 3333 6625 8034 7829 13029 6510 10338 9623 Haryana - - 537 282 722 778 3240 2230 158 326 443 934 612 579 928 654 Karnataka 2523 - 2374 3885 5352 6294 8417 9262 8131 10821 7270 8745 6317 5801 10713 8861 Maharashtra 4186 - 6512 10826 10367 8222 12876 10041 8467 9451 11803 11803 27194 11600 12775 7662 Odisha - - 331 122 103 307 375 250 758 1278 934 1201 1152 1184 1752 1961 Rajasthan 1303 - 3975 6772 4471 7374 4023 7773 8521 9556 14800 14761 10707 12218 9840 7854 Tamil Nadu 2895 - 540 - 1230 782 - 1160 - 1801 3500 2615 - 2755 3732 2654 Uttar Pradesh 891 - - 186 - 466 138 129 - 197 559 311 - 379 1125 214 Uttarakhand - - - - - - - - - - - - - - 101 022 Sikkim - - - - - - - - - - - - - 051 039 - Sub Total 18022 1182 39737 33430 32405 42117 42310 51634 42576 55475 66770 64007 69820 55752 71479 52649 Source Ministry of Agriculture
Impact Evaluation Study on ldquoNational Mission on Micro Irrigation (NMMI)rdquo
20
Table 10 Year and State wise Financial Targets and Achievements (Rs Crores)
State 2005-06 2006-07 2007-08 2008-09 2009-10 2010-11 2011-12 2012-13 (March 13)
T A T A T A T A T A T A T A T A AP 6129 934 19520 11277 5748 14559 9727 10836 14311 17829 24000 24000 28720 28720 28993 27021 Bihar - - 2482 - - 026 - 022 - 011 - 826 450 2167 5200 5340 Chhattisgarh - - 3033 256 783 1751 954 2060 1252 1193 1019 1801 3500 3500 3172 2678 Gujarat 2182 701 3356 3931 7350 4927 4899 7396 4447 5426 12000 12000 16664 16695 18200 18201 Haryana - - 444 232 604 508 1207 1278 212 385 1361 1402 1993 1667 3000 2571 Karnataka 3584 - 2457 4452 6865 7598 7319 5845 6381 8685 9254 8945 10965 9165 14065 15122 Maharashtra 4808 - 8797 13466 13897 12792 14748 13444 10707 13226 22237 22265 24980 24980 15018 15221 Odisha - - 454 143 108 101 338 293 528 871 810 697 823 893 2000 1690 Rajasthan 1048 - 2833 2687 2341 2908 2382 3009 5693 6073 12000 11620 13095 12824 11000 10347 Tamil Nadu 4291 - 1201 - 2200 1560 - 2367 - 2558 6591 7797 6625 6625 8300 13235 UP 1242 - - 146 - 562 150 235 - 381 812 383 - 441 595 393 Uttarakhand - - - - - - - - - - - - 075 - 150 070 Sikkim - - - - - - - - - - - - 400 400 200 - Sub Total 23284 1635 44576 36590 39896 47293 41725 46784 43532 56640 90084 91737 108290 108076 109893 111888
T Target A Achievement Source Ministry of Agriculture
Impact Evaluation Study on ldquoNational Mission on Micro Irrigation (NMMI)rdquo
21
34 Performance of Scheme for Area Coverage as Compared to Potential
Potential of different MI Systems in terms of drip and sprinkler has been assessed by various researchers by using the secondary data For assessing the potential of MI in different states the variables considered were state-wise and source-wise irrigation area cropped area and crops wise suitability for different MI systems Potential area is calculated on the basis of area already brought under MI system from the existing irrigated area While calculating potential area in sampled states we have also considered area under paddy which may diversify into horticultural and other cash crops in future For the purpose of arriving at some conclusion regarding performance of MI under the states data on potential area and actual area brought under drip and sprinkler irrigation in the states (NCPAH) has been analyzed
Table 11 Potential and Cumulative area under Drip amp Sprinkler Irrigation
StatesUTs
Total (Area in ldquo000 ha) Drip (Area in ldquo000 ha) Sprinkler (Area in ldquo000 ha)
PotentialIrrigated area
Cumulative area under
MI till 2012-13
Balance Potential area for
MI
Potential
area ()
Potential area
Cumulative area under
drip till 2012-13
Balance Potential
Area
Potential area ()
Potential area for
Sprinkler
Cumulative area under
sprinkler till 2012-13
Balance Potential
Area
Potential area ()
AP 6785 77100 601400 8864 506840 57605 449235 6621 171661 19495 152166 2243 Bihar 5158 7867 507933 9847 11863 181 11682 226 503937 7686 496251 9621 Chhattisgarh 1648 15655 149145 9050 12525 1172 11353 689 152275 14483 137792 8361 Gujarat 4137 43669 370031 8944 230017 24260 205757 4974 183683 19409 164274 3971 Haryana 5680 5753 562247 9899 149384 1539 147845 2603 418616 4214 414402 7296 Karnataka 4137 41485 372215 8997 156379 15697 140682 3401 257321 25788 231533 5597 Maharashtra 3806 64797 315803 8298 229882 45609 184273 4842 150718 19188 131530 3456 Odisha 1437 5199 138501 9638 28740 1042 27698 1927 114960 4157 110803 7711 Rajasthan 8903 64423 825877 9276 89030 6421 82609 928 801270 58002 743268 8349 Tamil Nadu 3519 11760 340140 9666 343103 11530 331573 9422 8797 230 8567 243 UP 19354 1869 1933531 9990 1035439 1004 1034435 5345 899961 865 899096 4646
Source Directorate of Economics amp Statistics MoA GoI NCPAH (excluding Uttarakhand amp Sikkim) Note - Analysis by GAPL It has been assessed that there is potential of bringing area under MI system is around 6117 million ha in the states under study (excluding Sikkim amp Uttarakhand) Out of this about 3490 million ha is having potential for sprinkler irrigation for crops like cereals pulses and oilseeds in addition to fodder crops The potential area for drip has been estimated in the study to be around 2627 million ha suitable for cotton sugarcane fruits and vegetables spices and condiments and some pulses crops like red gram etc The percentage of actual area against the potential estimated under drip irrigation in different states varied between 6621 in Andhra Pradesh followed by Uttar Pradesh (5345) Gujarat (4974) and Maharashtra with 4842 In case of sprinkler irrigation the percentage of actual area against the potential estimated was 243 (Tamil Nadu) and
Impact Evaluation Study on ldquoNational Mission on Micro Irrigation (NMMI)rdquo
22
the highest of 9621 (Bihar) Compared to the potential of 6117 million ha in the all eleven states the present area under MI accounts for 339 million ha (166 million ha under drip and 173 million ha under sprinkler) which is about 555 (Table 11) The present figures thus reflect the extent of MI systems covered under different government programme as well as own investment by the farmers However the actual area under MI may vary according to the extent of use by the farmers
Figure 7 Proportion of Area under Drip and Sprinkler Irrigation
Source GAPL Analysis
35 Pattern of Assistance
351 Indicative Cost of Installing Micro Irrigation System
As per the guidelines of NMMI the States have been categorized in the following categories
Category A States where more than 20000 hectares have been brought under drip irrigation come under lsquoArsquo Category This would include the States of AP Gujarat Karnataka Maharashtra Madhya Pradesh Punjab Rajasthan and Tamil Nadu
Category B All the states except those covered under the category lsquoArsquo and those falling in the Himalayan belt would come under this category
Category C All the North Eastern States Sikkim Himachal Pradesh Jammu amp Kashmir Uttarakhand and Darjeeling district of West Bengal
Impact Evaluation Study on ldquoNational Mission on Micro Irrigation (NMMI)rdquo
23
Keeping in view the level of awareness proximity to the manufacturing units distance involved in transportation potential for drip irrigation the cost of drip system in Category lsquoBrsquo States is estimated to be 15 higher than Category lsquoArsquo States while for Category lsquoCrsquo States it is estimated to be 25 higher than Category lsquoArsquo States Cooperative SocietiesSelf Help GroupsIncorporated Companies are also entitled to avail assistance on behalf of its members In such cases the individual beneficiary receives assistance through the Cooperative Society SHGIncorporate company and not directly 352 State-wise Pattern of Assistance It was observed that the states are giving subsidy on MI ranging from 50 percent to 100 percent depending on the size of the holding and category of the farmers in different states However the central share is same across the states It may be seen from the Table 12that in Tamil Nadu the quantum of subsidy is 100 percent for small amp marginal farmers whereas in AP for SCST farmers the quantum is cent percent
Table 12 State wise Quantum of Subsidy to Different Categories of Farmers
SNo State
Percentage of subsidy to small
amp marginal farmers
Percentage of subsidy to other farmers
Remarks
1 AP 90 75
APMIP arranges the following Micro Irrigation systems to farmers with government subsidy (SCST 100 subsidy) (others 90 75 60) for Drip (Inline amp Online) Semi-Permanent Sprinklers and Rain Guns
2 Bihar 90 80 About 98 area is under sprinkler irrigation 3 Chhattisgarh 75 50 About 93 area is under sprinkler irrigation
4 Gujarat 50 50 Uniform pattern of subsidy Gujarat Green Revolution Company Limited (GGRC)
5 Haryana 90 90 Additional subsidy is provided for hydro-cyclone filters
6 Karnataka 80 50 For the first 2 ha out of 5 ha per beneficiary ceiling on the area to be undertaken under the scheme
7 Maharashtra 60 50 25 per cent of the beneficiaries are small and marginal farmers
8 Odisha 90 80 Subsidy rate under NMMI wef 2013-14
9 Rajasthan 70 70 90 for drip 70 for sprinkler(mini) 60amp 50 for portable sprinkler for SCST and General Category respectively
10 Sikkim 60 60 NMMI scheme was launched in 2011-12
11 Tamil Nadu 100 75 ldquoTamil Nadu Horticulture Development Agencyrdquo (TANHODA) Subsidy effective from 2511 2011
12 UP 90 75 Subsidy rate under NMMI wef 2012-13 13 Uttarakhand 60 60 NMMI scheme was launched in 2011-12
Note The Central Government share in total subsidy is 50 for small marginal OBC SCST amp women categories and 40 for general categories Sources State Level Nodal Agencies
Impact Evaluation Study on ldquoNational Mission on Micro Irrigation (NMMI)rdquo
24
353 Quantum of Subsidy and Adoption of MI System by Farmers Increase in area under MI has not been found to be significantly higher in case of the states giving higher subsidy quantum and vice versa The Data on area coverage under MI System amp extent of subsidy provided clearly demonstrates that increasing the extent of subsidy had no significant impact on area coverage under MI system The case in point pertains to increase in area under MI in Maharashtra and Gujarat where the subsidy for small amp marginal is 60 percent and 50 percent respectively whereas the area increase was 223 and 140 percent respectively Similarly area coverage in Haryana Tamil Nadu and Bihar was noted to be 73 45 and 31 percent respectively the corresponding figures for subsidy were 90 75 and 90 percent The increase in area under MI was only 13 and 73 percent respectively for UP amp Rajasthan where subsidy level was 90 and 70 percent as per the data available from implementing agencies The aforesaid observation clearly suggests that increasing the subsidy component had no impact on area coverage under MI system The relationship between area expansion under MI and quantum of subsidy has been computed considering beneficiariesrsquo data on area expansion in different states before and after adoption of MI system A critical perusal of data on area coverage collected by our team and also the one quoted by India Statistics portal vis-a-vis the magnitude of subsidies suggests that the states should be advised to seriously consider that the quantum of subsidy to be restricted between 50-70 percent including state and central share and depicted in the table 13
Table 13 State wise Quantum of Subsidy and Area Coverage
State
Total Cultivated
Area (000 ha)
Net Irrigated
area (000 ha)
Area under NMMI
(000 ha)
Percent Irrigated
Area under MI
Area under MI Percent Increase
(Beneficiaries)
Quantum of Subsidy
() for General
Category
Quantum of Subsidy () for Small amp Marginal farmers
AP 1341500 503400 77090 1531 1240 7500 9000 Bihar 617900 303000 7870 260 310 8000 9000 Chhattisgarh 494900 135600 15650 1154 1500 5000 7500 Gujarat 1068100 423300 43660 1031 1400 5000 5000 Haryana 364000 288700 5750 199 1000 9000 9000 Karnataka 1172200 349000 41490 1189 260 5000 8000 Maharashtra 1877200 325600 64790 1990 2230 5000 6000 Odisha 555900 128400 5190 404 1100 8000 9000 Rajasthan 1958400 666100 64420 967 730 7000 7000 Sikkim 8200 1400 NA NA 070 6000 6000 Tamil Nadu 596900 291200 11760 404 450 7500 10000 UP 1780800 1338600 1860 014 130 7500 9000 Uttarakhand 76600 33600 NA NA 160 6000 6000
Source GAPL Analysis As per records of Directorate of Economics and Statistics As per records of NCPAH As per our survey in the sampled states
Impact Evaluation Study on ldquoNational Mission on Micro Irrigation (NMMI)rdquo
25
354 State Implementing Agencies The NMMI scheme is being implemented by specially designated agencies by the respective state governments and is provided one percent of the annual outlay actual release of funds for administering and monitoring the scheme at district level It has been observed that Directorate of Horticulture is the implementing agency for NMMI in nine states The scheme is implemented by Directorate of Agriculture in Maharashtra and Chhattisgarh Rajya Beej amp Krishi Vikas Ltd (CHRBKV) in Chhattisgarh In case of AP and Gujarat the scheme is being implemented by AP Micro Irrigation Project (APMIP) and Gujarat Green Revolution Company (GGRC) respectively
Table 14 State-Implementing Agencies for NMMI
State Implementing Agency Focus Nature of Association
AP APMIP Micro Irrigation SPV- relatively autonomous unit within Horticulture Department
Bihar DoH Agriculture amp Horticulture Government Department
Chhattisgarh CHRBKB Agriculture amp Horticulture Government Department
Gujarat GGRC Micro Irrigation Registered Under Companys Act Public Ltd
Haryana DoH Agriculture amp Horticulture Government Department
Karnataka DoA ampDoH Agriculture amp Horticulture Government Departments
Maharashtra DoA Agriculture amp Horticulture
Government Department
Odisha Horticulture
Development Society (OHDC)
Nodal Agency for NHM
Registered under Society Registration Act
Rajasthan Rajasthan Horticulture Development Society
(RHDS)
Agriculture amp Horticulture
Horticulture Development Society (RHDC)
Tamil Nadu DoH Agriculture amp Horticulture Government Department
UP DoH Agriculture amp Horticulture
Government Department
Sikkim DoH Agriculture amp Horticulture Government Department
Uttarakhand DoH Agriculture amp Horticulture Government Department
Source State Departments
Micro irrigation has been an integral component in some of the schemes of Horticulture Division such as schemes for area expansion The quantum of subsidy varies in these schemes as compared to NMMI scheme This goes against the principle of convergence of schemes It is recommended that assistance for micro irrigation component on pattern of NMMI may be made available under ongoing area expansion schemes
Impact Evaluation Study on ldquoNational Mission on Micro Irrigation (NMMI)rdquo
26
It has been observed that the scheme implemented by the state departments such as horticulture agriculture and others are not fully yielding the desired results because of the following
1) The state departments are also occupied with their own targets and other related activities and are not able to devote desirable time for the implementation of NMMI activities
2) This also creates bias toward their own field such as horticulture department may not give due consideration to field crops etc
3) The extension workers of state departments are involved in providing extension services training and field demonstrations etc of their parent department which affects their working
It is being proposed that separate institute may be created in the line of AP and Gujarat model so that effectiveness transparency monitoring and targets are fully achieved The subsidy process flow charts for AP amp Gujarat are given in Annexure I The consultant has no bias against state departments or government institutions but for meeting the objectives of NMMI such recommendations have been proposed
355 Extent of Convergence with Other Schemes
One of the objectives NMMI scheme is to establish convergence and synergy among different on- going programmes in the country During the course of the study it was observed that in case of NMMI scheme there has been convergence among various on- going programmes such as National Food Security Mission (NFSM) NHM RADP RKVY Integrated Scheme of Oilseeds Pulses Oil palm and Maize (ISOPOM) Technology Mission on Cotton (TMC) and number of state level schemes being implemented by respective states
Rainfed Area Development Programme (RADP) - A Sub-Scheme under Rashtriya Krishi Vikas Yojana (RKVY) The basic premise of the proposed programme is to encourage exploitation of the potential of different farming systems based upon the natural resource assetsendowments (ponds land development nursery etc) created either by the farmers or through schemes like MGNREGA RKVY NHM and Watershed Projects This may act as a catalyst to accomplish the ultimate objective of enhancing productivity minimizing the risk of crop losses due to uncertainties of weather conditions harnessing efficiency of resources assuring food and livelihood income security at farm level and strengthen the farmersrsquo capacity to adapt to climatic changes Therefore converging the upgraded utilities developed through watershed development programmes MGNREGA in terms of water harvesting and micro water storages through effective application and distribution systems like improved conveyance field channels pressurized irrigation water lifting devices etc
Impact Evaluation Study on ldquoNational Mission on Micro Irrigation (NMMI)rdquo
27
to enhance the potential of farming systems The subsidy under this scheme is also extended for installation of pressurized micro irrigation as per norms of NMMI only if not possible through convergence All the States have reported convergence of Mission interventions with different schemes of the Government of India and State level programmes Most of the districts have converged NFSM interventions with programmes such as RKVY ICDP Farm Mechanization NHM Micro-Irrigation and other State programmes 356 Food Security and the Micro Irrigation Scheme To achieve required food production with increasing population India has to enhance the current irrigation potential of 91 M ha to 160 M ha but the total water resources estimated are 230 M hm4 to cater the need to the non-agricultural uses also The country is likely to be water stressed in the coming years Therefore hand in hand with technologies for water harvesting and storage technologies for precision water application methods need to be adopted The food security primarily has the three objectives of ensuring production of adequate food supplies maximizing stability in the flow of supplies and securing access to available supplies on the part of those who need them Access to food has two defined components to it One interventions aimed at boosting agricultural productivity and the second adopting strategies to promote employment social protection measures cash transfers to the poor to improve their access to the available food India has already in place social protection as a component of food security As mentioned earlier several projects for utilization of surface water as well as ground water resources have been undertaken However in some cases the unplanned development has led to over exploitation of the resource affecting the physical sustainability The adverse impact of such unplanned development is evident from the alarming decline in water table in some areas The developmental activities for utilization of water resources as also the development in other sectors particularly industrial sector coupled with urbanization have resulted in water pollution ndash both surface water as well as ground water Further the utilization of the created facilities is far from optimal as the water sector in India suffers from (a) relatively low water use efficiency and (b) increasing gap between the created irrigation potential and the utilized irrigation potential
In this regard it may also be important to note that the future development of water resources are bound to be more challenging as the easy options particularly from the
4Micro Irrigation Management in Cotton CICR Technical Bulletin No 31
Impact Evaluation Study on ldquoNational Mission on Micro Irrigation (NMMI)rdquo
28
topographical and geological considerations have since been tapped Further the future water resources development projects would need rigorous environmental and social evaluations In view of above mentioned challenges and particularly to address the two serious issues namely ldquofood securityrdquo and ldquoimpact of climate changerdquo initiatives have been taken by the Ministry of Water Resources to identify the most appropriate approach for water resources management and also to assign priorities Despite variations in availability of water both within and over the years the long term average available water resources of the country may be considered to remain unchanged Therefore the increasing demand for water for various purposes are bound to result in competition among the ldquousesrdquo as well as among the ldquouser groupsrdquo and with time such competitions are becoming fiercer and fiercer The conflicts among the ldquousers groupsrdquo are visible in the form of increasing inter-State issues The prioritization of water uses for different purposes at different point of in the planning process as also during the operation is becoming more and more challenging in view of conflicting social and economic considerations Such changing scenario calls for identification of most appropriate strategies for effectively addressing the future challenges At the current cereal intake of 143 kgs per capitalannum cereal requirement for household consumption will be around 192 million tons in 2020 The requirement will be more if the increase in household demand due to income growth is also considered At 5 per cent per annum growth in total expenditure and population of 1343 billion household cereal demand works out to 221 million tons in 2020 and for food grains 241 million tons With a grossing factor of 114 the total (household plus non-household) demand for cereals may be around 253 million tons The above cereal demand projections are made with the assumption of stability of tastes and preferences in food consumption If the trend of food grain production as witnessed during the last two decades is sustained the production of additional 57 million tons of cereals and 76 million tons of total food grains in the coming two decades may not be out of reach for India The demand projections may turn out to be on a higher side if the secular trend of change in consumer preferences away from cereal consumption persists Demand for superior food items such as dairy and animal husbandry products sugar fruits and vegetables are expected to grow much faster during the coming decades The estimated demand in 2020 for milk and milk products will be around 166 million tons edible oils 11 million tons meat fish and eggs 11 million tons sugar and gur 25 million tons and fruits and vegetables 113 million tons It may be noted that food grains pulses oilseeds sugar fruits and vegetables poultry dairy meat fish etc constitute the bulk of the output in the agriculture sector The performance of agriculture is important for availability and access to food as more than 55
Impact Evaluation Study on ldquoNational Mission on Micro Irrigation (NMMI)rdquo
29
per cent people in the country are dependent on this sector There are both short run and long run problems in agriculture Farmersrsquo suicides continue unabated even increasing in some states as growth rate in yield is on the decline Farming is fast becoming a non-viable activity Further scope for increase in net sown area is limited Land degradation in the form of depletion of soil fertility erosion and water logging has increased There has been decline in the surface irrigation expansion rate and a fall in the level of the ground water table Exposure of domestic agriculture to international competition has resulted in a high order of volatility in prices Disparities in productivity across regions and crops and between rain fed and irrigated areas has increased Long term factors like steeper decline in per capita land availability and shrinking of farm size are also responsible for the agrarian crisis Land issues such as SEZs land going to non-agriculture alienation of tribal land etc are becoming important The Steering Committee report on agriculture for the Eleventh Plan (GoI 2007) has identified the possible reasons for deceleration in agriculture since the mid- 1990s According to the report the major sources of agricultural growth are public and private investment in agriculture and rural infrastructure including irrigation technological change diversification of agriculture and fertilizersA major challenge to food security comes from dietary diversification of the poor If cereal pricing is left to the market forces government playing the facilitating role land may be released from rice and wheat cultivation to meet the growing demand for non-cereal crops such as oilseeds fruits and vegetables in accordance with diet diversification The micro irrigation system is a proven technology that helps in improving the productivity of crops by judicious use of water MI system has resulted in improving the productivity of wheat maize and pulses by 2405 1348 and 2869 respectively Area under horticulture crops as well as nutritional security has also enhanced The positive outcomes on the food security due to the increase in the production amp productivity of different crops and increased area under irrigation from same source of water However keeping in view the growth population of the country we need to boost the production that can be possible with the help of innovation amp transparency in the irrigation system in NMMI scheme 36 Mission Structure Review 361 National Level National Level The Horticulture Division in the Department of Agriculture amp Cooperation Ministry of Agriculture coordinates the overall activities and review the progress of implementation of the Mission in the country The Executive Committee (EC) of is chaired
Impact Evaluation Study on ldquoNational Mission on Micro Irrigation (NMMI)rdquo
30
by Secretary (AampC) Department of Agriculture amp Cooperation to oversee the activities of the Mission and to approve the State Annual Action Plans besides projects on technology transfer etc National Committee on Plasticulture Applications in Horticulture (NCPAH) is entrusted in the monitoring and reviewing the progress of the scheme Executive Committee (EC) reallocates resources across States and approves programmes on the basis of approved subsidy norms EC is empowered to approve special interventions for tackling emergent requirements EC can also constitute Sub-Committee (SC) Empowered Committee (EMC) and delegate power to SC EMC for emergent requirements like revision of cost norms inclusion of equipment etc if required based on the recommendations of EC of NMMI 362 State Level Micro Irrigation Committee (SMIC) At the State level State Micro Irrigation Committee (SMIC) under the Chairmanship of Agriculture Production Commissioner Principal Secretary (Horticulture Agriculture) oversees the implementation of the scheme in their respective States The Panchayati Raj Institutions in the State are also member of the SMIC represented in the SMIC and involved in the implementation of the Scheme The Chairman at his discretion can co-opt officials experts as invitees The SMIC meeting is held once in every quarter The state level micro irrigation committees have been assigned to perform the following functions as per the guidelines
1 Organise base line survey and feasibility studies in different parts of the state covering various crops and technologies
2 Ensure smooth implementation of Micro irrigation programme in different districts of the state
3 Ensure allocation of state share required for implementing the scheme and make it available to the implementing Agency
4 Finalise and forward the consolidated actions plans of the Districts to DAC
5 Register the System Manufacturers and circulate the list of System Manufacturerrsquos registered with SMIC along with the quoted price to the District Micro Irrigation Committee (DMIC) and Implementing agencies They will also indicate the quantum of money to be paid by the beneficiariesbanks to the manufacturers before installing the system
6 Mobilize credit requirement of the farmers through the Financial Institutions for installing Micro Irrigation System
7 Organise various training and extension programmes for farmers officials NGOrsquos entrepreneurs etc involving PFDCs
Impact Evaluation Study on ldquoNational Mission on Micro Irrigation (NMMI)rdquo
31
8 Host a website indicating the details and status of the progress of NMMI scheme in different districts of the state
During the course of discussions qualitative assessment was made on the basis of these parameters such as organise base line survey and feasibility studies in different parts of the state covering various crops and technologies are regularly prepared and accordingly assessment has been made Similarly the same criterion was adopted in other parameters to arrive at final assessment and these were summarized in the table 15 It may be seen from the table that the states of AP Gujarat Maharashtra are performing better than other states as far as their functions and responsibilities are concerned whereas Bihar and UP are the laagered states in this regard It may be premature to comment on the performance of Sikkim and Uttarakhand states because the scheme is recently implemented
Impact Evaluation Study on ldquoNational Mission on Micro Irrigation (NMMI)rdquo
32
Table 15 Performance of the Functioning of SMICs in Sampled States
Functions States
Base line survey and feasibility
studies
Implementation
Allocation of the State Share Action Plan
Registration of the System Suppliers
Mobilize Credit for Farmers
Capacity Building
Programme
Website Hosting Assessment
AP Medium High High High High Low-medium Medium Medium Medium-high
Bihar Low Low Low Low-medium Low-medium Low Low Low Low
Chhattisgarh Low-medium Medium Medium Medium High Low-medium Low-medium Low-medium Medium Gujarat Medium High High High High Low-medium Medium Medium Medium-high Haryana Low-medium Medium Low-medium High Low-medium Low-medium Low-medium Medium Low-medium Karnataka Low-medium Medium High High High Low-medium Medium High Medium-high Maharashtra Medium Medium High High High Low-medium Medium Medium Medium-high Odisha Low-medium Medium Low-medium High High Low-medium Low-medium Low-medium Medium Rajasthan Low-medium Medium High High High Low-medium Medium Medium Medium-high Tamil Nadu Medium Medium Medium High High Low-medium Medium High Medium-high UP Low Low Low Low Low-medium Low Low Low Low
Sikkim Low Low Low Low-
medium Low-medium Low Low Low Low
Uttarakhand Low Low Low High Medium Low Low Low Low Source GAPL analysis
Note High Response is more than 80 Medium Response is between 50 to 70 Low Response is below 50
Impact Evaluation Study on ldquoNational Mission on Micro Irrigation (NMMI)rdquo
33
The above table shows the assessment of performance amp functioning configuration The scales are used to represent the intensity of the functions ongoing into the sampled state The registration of the system suppliers are scaled as per the number of manufacturers in proportion to the size of the state It has been observed that AP Gujarat amp Maharashtra are leading states in the every aspect of the different activities involved in the process streamlined those are mentioned in the NMMI guidelines It has further been observed that Bihar UP Sikkim amp Uttarakhand states are lacking in terms of the functions mentioned in the guidelines There are still many dots to be connected in these states to get the desired and satisfactory results 363 District Level Micro Irrigation Committee (DMIC) At the District level District Micro Irrigation Committee (DMIC) headed by the Chief Executive Officer (CEO) of Zila Parishad District Rural Development Agency (DRDA) Collector of the District with members representatives from concerned departments viz Agriculture Horticulture Rural Development Irrigation and Water Resources Growersrsquo Association Krishi Vigyan Kendras (KVKs) and local lead Banks are responsible for implementing the NMMI programme in the district The DMIC meeting is held once in every month The DMIC performs the following functions as per the guidelines
1 Forward the District Action Plan to SMIC for compilation of State Action Plan and forward it to the Ministry of Agriculture
2 Mobilize credit requirement of the farmers through the Financial Institutions for installing Micro Irrigation System
3 Monitor and review the physical amp financial progress of implementation of Mission programme
4 Review the submission of utilization certificate by the implementing agency
5 Provide Feedback to SMIC on monthly basis by 6th7th of each month
It was observed that DMIC in almost all the states are preparing their district plans regularly and in time except for Bihar UP Sikkim and Uttarakhand and accordingly assessment has been made Similarly the same criterion was adopted in other parameters to arrive at final assessment The table below shows the extent of functioning at the district level It is also portraying almost the same picture that is being shown under the state level
Impact Evaluation Study on ldquoNational Mission on Micro Irrigation (NMMI)rdquo
34
Table 16 Performance of the Functioning of DMICs in Sampled States
Functions States
District Plan
Mobilizing Credit Review amp
Monitoring
Submission of
Utilization Certificates
Monthly Feedback amp Reporting
Own Assessment
AP High Low-medium High Medium High Medium-high Bihar Medium Low Low-medium Low Low-medium Low Chhattisgarh High Low-medium Medium Low-medium Medium Low-medium Gujarat High Medium High Medium High Medium-high Haryana High Low Medium Medium Medium Medium Karnataka High Medium High Medium High Medium-high Maharashtra High Medium High Medium High Medium-high Odisha High Low-medium Low-medium Low-medium Medium Medium Rajasthan High Low-medium High Medium High Medim-high Tamil Nadu High Low-medium Medium Medium Medium Medium UP Medium Low Low-medium Low Low-medium Low Sikkim Medium Low Low-medium Low Low-medium Low Uttarakhand Medium Low Low-medium Low Low-medium Low
Source GAPL analysis
Note High Response is more than 80 Medium Response is between 50 to 70 Low Response is below 50 364 Improving Efficacy of the Institutional Mechanism The following measures may be taken to improve the efficacy of the institutions involved in the implementation of the scheme
1 The utilization certificates to be submitted in time for the prompt release of the funds
2 SPV on the pattern AP state and separate institute like GGRC in Gujarat may be adopted for improving the efficiency and transparency
3 The meeting of various committees formed under the programme should be held regularly The meetings of the SMIC should be convened on quarterly basis and the same may also not tagged with other meetings in order to give proper focus on the implementation of the programme
4 Human Resource Development is one of the key factors for successful implementation of other sub components of any programme The capacity building at all levels -farmers field level workers technical officers and scientists and developing orientation skills of all the stake holders in the context of changing needs of agriculture to be intensified More training programmes for all the stakeholders should be organized
Impact Evaluation Study on ldquoNational Mission on Micro Irrigation (NMMI)rdquo
35
37 Role of Panchayati Raj Institutions (PRIs) in NMMI Scheme Panchayats have been entrusted mainly in identification of the beneficiaries in their respective jurisdiction The interested farmer put his application to the Panchayat and after verification the case is recommended Panchayati Raj Institutions are involved in the following activities i Selection of crops and identification of priority areas for implementation
ii Authorization of beneficiaries compilation of application forms proforma invoices and
creation of local initiatives in promotion of micro irrigation technology iii Organization of interactive meetings with the representatives of MI industry iv Training extension and awareness creation (added as per GoI notification dated 208
2013)
However during the course of discussions it was observed that PRIs role is not only limited to compilation of necessary documents required for submission of application forms but also involved in Information-Communication-Education (IEC) activities as shown it the
The major activities and roles of PRIs practiced in different sampled states are as follows
A Issues no objection certificate on first come first serve basis Gram Panchayat informs to Gram Sabha regarding the selection of NMMI beneficiaries as well as verification of the land ownership
B Verification amp certification of the farmersrsquo ownership amp domicile involved in IEC activities Issues no objection certificate on first come first serve basis
C Verification amp certification of farmersrsquo domicile Issues no objection certificate on first come first serve basis
D Verification amp certification of the farmersrsquo ownership amp domicile involved in IEC activities recommendation of farmersrsquo Issues no objection certificate on first come first serve basis
E It is suggested that Panchayati Raj Institutions are required to be more effective in their roles amp responsibilities as per the guidelines for which sensitization exercises through training and capacity building programmes may be initiated
Impact Evaluation Study on ldquoNational Mission on Micro Irrigation (NMMI)rdquo
36
4 Primary Survey Respondentsrsquo Profile and Findings Primary survey of 7400 farmers was conducted in 13 states as per the sampling plan detailed in chapter 2 The coverage is quite systematic amp comprehensive hence no distortion in the findings is expected due to disproportionate representation of any specific category
The purpose of analyzing the profiles of different respondents and deriving the findings was to evaluate the overall impact created by the scheme and to find the gap between planned objectives and outcome after the execution of the scheme along with identifying the best possible solution to fill the gap if any 41 Demographic Profile (Sampled Beneficiaries amp Non-beneficiaries) The socio economic conditions of the target group indicate their basic characteristics which may be instrumental in the adoption of new technologies and interventions The demographic profile of the farmers covered in the survey in terms of their education profile gender category etc is presented in the following section 411 Size of Land Holding The benefit of the NMMI scheme is extended to the farmers on the basis of size of holding As per the norms at least 33 percent of the allocation is to be utilized for the small marginal and women farmers Similarly the quantum of the subsidy is more for small and marginal farmers The beneficiaries in case of small and marginal farmers are eligible for subsidy up to 60 percent of the cost of drip sprinkler irrigation system and the remaining 40 percent have to borne by the farmers However in the case of general categories of the farmers subsidy assistance is 50 percent of the cost of the system which is shared in the ratio of 401050 by the central state government and the beneficiaries The states are free to provide additional subsidy to the beneficiaries from their own resources Keeping the above factor in view the sampled farmers were categorized as per the prescribed guidelines (Table 18) into three categories based on their land holdings such as marginal amp small farmer under 2 hectares medium between 2-10 hectares and large above 10 hectares The results on distribution of the farmers according to their land holding category have been presented in the table 17 for both beneficiaries and non-beneficiaries
Impact Evaluation Study on ldquoNational Mission on Micro Irrigation (NMMI)rdquo
37
Table 17 Land Holding Status of Beneficiary and Non Beneficiary Farmers
State
Beneficiaries Non Beneficiaries
Total Beneficiaries
Category of Farmers () Total Non-Beneficiary
Category of Farmers (`) Marginal amp
Small Medium Large Marginal amp Small Medium Large
AP 672 9241 759 000 168 9643 357 000 Bihar 516 1105 7945 950 128 5391 4453 156 Chhattisgarh 384 8359 1589 052 96 9375 625 000 Gujarat 576 4132 566 208 144 5833 3819 348 Haryana 320 3344 6062 594 81 4568 5185 247 Karnataka 576 7691 2292 017 144 8333 1667 000 Maharashtra 672 8304 1666 030 169 8343 1657 000 Odisha 480 5250 4708 042 120 5500 4417 083 Rajasthan 574 3711 6028 261 138 6884 2899 217 Sikkim 50 10000 000 000 10 9000 1000 000 Tamil Nadu 455 8286 1714 000 120 8333 1667 000 UP 527 3397 6546 057 168 6667 3273 060 Uttarakhand 90 5000 4667 333 22 7727 2273 000 Total 5892 5874 3943 183 1508 7308 2600 092 Source GAPL survey
Marginal small and medium category of farmers accounted for 5874 and 3944 percent of the beneficiaries where as 183 percent farmers are reported to be under large category among beneficiaries while among non-beneficiaries 73 percent farmers fall under the category of marginal-small farmers and 26 percent are under medium land holding category The distribution of large farmers among non-beneficiaries are not observed in Andhra Pradesh Chhattisgarh Karnataka Maharashtra Sikkim Tamil Nadu and Uttarakhand
The above table reveals that the proportion of a small and marginal farmers are observed to be highest in Sikkim followed by Andhra Pradesh Chhattisgarh Maharashtra and Tamil Nadu among the sampled farmers The proportion of medium and large farmers accounted for 3943 percent of the total beneficiaries
The data on size and distribution of operational land holdings in the country (Table 18) also suggest that medium and large farmers accounted about 15 percent of total land holdings thus occupying approximately 5542 percent of the total area The average size of land holding with the medium and large category of farmers was also noted to be 608 and 1810 hectare respectively
Impact Evaluation Study on ldquoNational Mission on Micro Irrigation (NMMI)rdquo
38
Table 18 Size and Distribution of Operational Holdings
SNo Category of Holding Size Group (Ha) Holding
()
Total Area Coverage
()
Average Size (Ha)
1 Marginal lt 10 671 225 039 2 Small 10 - 20 1791 2208 142
Sub Total 8501 4458 3 Semi Medium 20 - 40 1004 2363 271 4 Medium 40 - 100 425 212 576 5 Large gt 1000 07 1059 1738
Sub Total 1499 5542 Total 100 100 115
Source Agriculture Census -2010
In light of these facts the present limit of area up to 5 hectare under NMMI scheme needs to be re-looked and calls for relaxation of farm size limitations in providing subsidies This will not only increase the area under MI and improve the water use efficiency but will also contribute significantly towards food security on sustainable basis 412 Categories of Farmers The NMMI scheme is extended to all the categories of the farmers and the mission has earmarked the total allocation to SCST farmers as per their proportion to the population in the district The following table summarizes the categories on their category both for beneficiaries and non-beneficiaries
Table 19 Category wise Proportion of Beneficiary and Non Beneficiary Farmers
State Beneficiaries Non Beneficiaries
Total Beneficiaries
Farmers Categories () Total Non-Beneficiaries
Farmers Categories () Gen OBC ST SC Gen OBC ST SC
AP 672 2768 5074 1116 1042 168 3750 4345 1131 774 Bihar 516 3643 5853 213 291 128 2734 6641 391 234 Chhattisgarh 384 3438 2891 3307 365 96 1563 3854 3646 938 Gujarat 576 7222 2083 556 139 144 7569 2083 208 139 Haryana 320 8219 1656 000 125 81 6914 2716 000 370 Karnataka 576 6424 2049 712 816 144 6111 2431 903 556 Maharashtra 672 7574 2247 104 074 169 7633 2012 178 178 Odisha 480 5458 3354 917 271 120 5500 2667 1500 333 Rajasthan 574 3711 5279 714 296 138 3043 6522 290 145 Sikkim 50 2400 2200 5400 000 10 7000 2000 1000 000 Tamil Nadu 455 4044 5187 066 703 120 5750 3583 000 667 UP 527 4156 5408 019 417 168 2679 6131 119 1071 Uttarakhand 90 5444 1556 111 2889 22 4545 2273 000 3182 Total 5892 5097 3744 696 463 1508 4867 3919 683 531
Impact Evaluation Study on ldquoNational Mission on Micro Irrigation (NMMI)rdquo
39
It may also be seen from the above table which shows coverage of different categories of farmers selected for primary survey on random basis the implementing agencies in various states under study were able to provide the benefits of NMMI scheme to all the categories of the farmers based on its norms 413 Gender The role of the women in agriculture is more than 60 percent for conducting different farm activities like tending of animals farm operations ( except ploughing ) and other farms house activities In the guidelines of the NMMI schemes a special mention has been made for the benefits to be extended under the scheme to the women farmers Therefore the coverage of number of male and female beneficiaries in the survey is presented in the following table
Table 20 Gender Status of Beneficiaries and Non Beneficiaries
State
Beneficiaries Non Beneficiaries Total
Beneficiaries Gender () Total Non-
Beneficiary Gender ()
Male Female Male Female AP 672 8348 1652 168 9702 298 Bihar 516 9399 601 128 9688 313 Chhattisgarh 384 8932 1068 96 9271 729 Gujarat 576 9427 573 144 9792 208 Haryana 320 3781 6219 81 10000 000 Karnataka 576 8628 1372 144 9931 069 Maharashtra 672 9345 655 169 9822 178 Odisha 480 8896 1104 120 9833 167 Rajasthan 574 9059 941 138 9710 290 Sikkim 50 8800 1200 10 9000 1000 Tamil Nadu 455 8835 1165 120 9833 167 UP 527 8843 1157 168 9821 179 Uttarakhand 90 8667 1333 22 10000 000
Total 5892 8681 1319 1508 9768 236 Source GAPL Survey It may be seen from the above that proportion of male among the entire sampled respondent is higher than 85 percent in case of beneficiaries and non-beneficiaries both This may be due to the fact that in most cases the land is generally in the name of head of the family and being a patriarchic society land ownership rests with the male gender 414 Educational Status Education plays an important role in the development and the same is true for the NMMI schemes Therefore the education status of sampled farmers both beneficiaries and non-beneficiaries was enquired This information is summarized in table below
Impact Evaluation Study on ldquoNational Mission on Micro Irrigation (NMMI)rdquo
40
Table 21 Education Status of Beneficiaries and Non-beneficiaries
State
Beneficiary Non Beneficiary
Total Beneficiary
Education status () Total No of Non-
Beneficiary
Education status ( ) Not
Educated Primary High
School Sr
Secondary Graduate
and Above
Not Educated
Primary High school
Sr Secondary
Graduate and
above AP 672 223 2232 4435 2515 595 168 060 1964 5298 2321 357 Bihar 516 659 2035 3120 1667 2519 128 1016 2891 2813 1328 1953 Chhattisgarh 384 1120 3568 2526 1589 1198 96 521 4167 3125 1771 417 Gujarat 576 1128 2917 3073 1632 1250 144 1389 2986 3194 1042 1389 Haryana 320 2094 1438 2469 1438 2563 81 370 2716 3210 1852 1852 Karnataka 576 313 3090 4288 1354 955 144 625 3681 3264 1667 764 Maharashtra 672 298 2321 4003 1622 1756 169 414 2249 4201 1775 1361 Odisha 480 688 2708 3229 1750 1625 120 917 3250 3167 1250 1417 Rajasthan 574 784 4268 3937 557 453 138 1232 4275 4275 217 000 Sikkim 50 200 1600 3000 2000 3200 10 1000 1000 3000 2000 3000 Tamil Nadu 455 352 2374 4505 1165 1604 120 583 3917 4500 917 083 UP 527 607 3454 4023 1195 721 168 476 2560 4107 2024 833 Uttarakhand 90 1111 1889 2000 3556 1444 22 3636 1364 2727 1818 455 Avg Total 5892 677 2766 3664 1556 1336 1508 729 3037 3806 1499 928
Source GAPL Survey
Impact Evaluation Study on ldquoNational Mission on Micro Irrigation (NMMI)rdquo
41
In most of the sampled areas the most of the farmers are educated except in Haryana where about 21 percent of the beneficiaries reported to be not educated The higher proportion of graduate among beneficiaries in most of the states as compared to non-beneficiaries clearly indicates that educated and informed farmers are more likely to adopt MI Systems
415 Status of Communication Facilities
Communication Media is an important tool of flow of information particularly in agriculture as pre and post-harvest operation are time bound as well as subject to use of resources Quick and authentic information are required for weather forecast agriculture operations and practices information about the markets for disposal etc Numbers of portals such as AGMARKNET have been launched to benefit the farming community
Table 22 Mobile Phone Ownership
State Beneficiary having
Mobile () Non Beneficiary
having Mobile () AP 1979 1190 Bihar 8043 6016 Chhattisgarh 3854 625 Gujarat 8767 6597 Haryana 6719 5926 Karnataka 2934 903 Maharashtra 2426 414 Odisha 3333 1917 Rajasthan 5505 5507 Sikkim 7400 9000 Tamil Nadu 2462 250 UP 1195 1607 Uttarakhand 3556 1364 TOTAL 4189 2699
The consultants have captured the status of mobile ownership among beneficiaries as well as non-beneficiaries for the comparison purpose The following facts have been observed from the table above
40 percent of the farmers are having access to mobile phones The table further reveals that the maximum number of beneficiaries possessing mobile phones were in Gujarat (88) followed by Bihar (80) Sikkim (74) and Haryana (67)
This is an encouraging trend as farmers are making use of the Information and Communication Technology
Less than 27 percent of the non-beneficiaries have access to the mobile phones whereas the average of mobile holders among beneficiaries was noted to be around 42 percent
Impact Evaluation Study on ldquoNational Mission on Micro Irrigation (NMMI)rdquo
42
In may further be added here that total number of mobile users as per ldquoIndia Mobile Landscaperdquo (IML) 2013 study were 5548 crores and out of this about 298 crores (537) are 22 percent are in rural areas
Further if we analyze the overall scenario of mobile penetration it comes to about 25 percent The penetration of this technology was noted to be much higher in case of beneficiaries using mobiles
The field observations gathered from the farmers of sampled states correlates that with increase in income due to MI technologies the beneficiary farmers have started use of this technology
It shows that the different positive attributes of MI technology enabling adopters to access the technology updating themselves with the mobile technology that lead the beneficiaries towards attaining better social status due to increase of their income and purchasing power As for the availability of email IDs with the sampled farmers is concerned negligible number of farmers had this mode of communication 42 Results and Discussions 421 Quality of soil and irrigation water Irrigation with saline water through the conventional methods like flooding results in accumulation of salts in soil profile resulting in reduced availability of water to plants poor to delayed germination and slow vegetative growth rate However with the use of micro-irrigation systems (dripsprinkler) the saline water is applied frequently in lesser amounts due to which the evaporation losses of irrigation water are very less which prevents the accumulation of salts and keep their concentrations well below the harmful limit in crop root zone Thus at places where the fresh water resources are limited alternative non-conventional water resources like saline water aquifer may be exploited to feed the expansion drive for irrigation In this context the scientific use of saline water in conjunction with adaptable water use technologies has been advocated as a perfect proxy for irrigation The electrical conductivity of saline soils is gt 4 dSm and pH is gt 80 In the areas having problems of soil salinity the soil and water testing are specifically important to adopt the appropriate measures to draw full advantage of the micro irrigation system The data on extent of saline soils in the sampled states coupled with the farmers responses on getting their soils and water tested are cited in table 23 It has been documented that clogging factor in MI system is minor moderate and severe in water samples having EC values lt 080 08-31 and gt 31 dSm respectively Such values for pH have been reported to be lt70 70-80 and gt 80 (Patil 2001)
Impact Evaluation Study on ldquoNational Mission on Micro Irrigation (NMMI)rdquo
43
Table 23 Extent of Soil Salinity (in sampled states) and Beneficiaryrsquos Responses on Soil and Water Testing
State Status (000 ha)
Total Beneficiaries
Percent Response of the sample beneficiaries on
soil amp water testing Saline soils
Sodic Soil
Total Yes No
AP 7760 19661 27421 672 6146 3854 Bihar 4730 10585 15315 516 6705 3295 Chhattisgarh NA NA NA 384 6458 3542 Gujarat 168057 54143 222200 576 6927 3073 Haryana 4916 18340 23256 320 7781 2219 Karnataka 189 14814 15003 576 6910 3090 Maharashtra 18409 42267 60676 672 7336 2664 Odisha 14714 000 14714 480 6375 3625 Rajasthan 19557 17937 37494 574 7913 2087 Sikkim NA NA NA 50 5400 4600 Tamil Nadu 1323 35478 36801 455 5758 4242 UP 2199 134697 136896 527 5275 4725 Uttarakhand 000 000 000 90 7778 2222 Total 241854 347922 589776 5892 6887 3113 Source Central Soil Salinity Research Institute Karnal Haryana-20105
In the sampled states magnitude of soil salinity was noted to be highest in Gujarat followed by UP which was followed by Maharashtra and Rajasthan There is thus a strong need to launch special drives to motivate the farmers to get their soil and water samples tested This may enable them to adopt the recommended measures to prevent the clogging of emitters and enhance the crop productivity with the adoption of MI systems As per the guidelines of NMMI It is mandatory to conduct soil and water tests by MI system suppliers registered under the scheme Though about 6887 of sampled beneficiaries of all the 13 sampled states have got their soil amp water tested In Gujarat UP Maharashtra amp Rajasthan soil testing adopted by 6927 5275 7337 and 7913 of respondents respectively
It was further investigated if beneficiaries are aware about the importance of soil and water quality on the performance of the MI systems the results are presented in the table below
5Technical Bulletin CSSRIKarnal22010 Computerized Database on Salt Affected Soils in India AK Mandal RC Sharma Gurbachan Singh and JC Dagar 2010
Impact Evaluation Study on ldquoNational Mission on Micro Irrigation (NMMI)rdquo
44
Table 24 Extent of Awareness about Important Soil and Water Quality Parameters
State
Total Beneficiary
Soil quality testing Water quality testing pH EC pH EC
Yes ()
No ()
Yes ()
No ()
Yes ()
No ()
Yes ()
No ()
AP 672 238 9762 030 9970 000 10000 000 10000 Bihar 516 097 9903 058 9942 058 9942 058 9942 Chhattisgarh 384 000 10000 000 10000 000 10000 000 10000 Gujarat 576 521 9479 382 9618 434 9566 434 9566 Haryana 320 000 10000 000 10000 000 10000 000 10000 Karnataka 576 000 000 000 000 000 000 000 000 Maharashtra 672 313 9688 238 9762 283 9717 238 9762 Odisha 480 333 9667 333 9667 146 9854 146 9854 Rajasthan 574 9913 087 9913 087 9861 139 9843 157 Sikkim 50 1400 8600 000 10000 000 10000 000 10000 Tamil Nadu 455 000 000 000 000 000 000 000 000 UP 527 5275 4725 3226 6774 3529 6471 4288 5712 Uttarakhand 90 000 10000 000 10000 000 10000 000 10000 Total 5892 1599 6651 1354 6896 1368 6882 1429 6821
Source GAPL Survey
It has also been noted that farmers in most of the sampled states were not even aware of the importance of soil and water testing (Table 24)There is thus a dire need to create awareness about the importance of soil and water testing among farmers and make them aware of consequent clogging of emitters 422 Sources of Irrigation There are number of water sources in different parts of the states country such as bore well canals ponds tube wells etc from which the farmers get the irrigation water for their fields In this context information on the availability of water sources was compiled The following inferences have been drawn
Bore well is the most preferred source of water supply among the users of MI systems proportion being about 82 as may be seen from the table below
Further it may be seen that 100 percent of the farmers of Karnataka and AP have own bore wells followed by the farmers of Bihar UP Tamil Nadu Odisha Chhattisgarh Rajasthan and Gujarat The other important sources are canal well and spring water
Over 62 percent farmers of Sikkim reported to have farm ponds at their farms and remaining 38 percent from spring water which is an exception as compared to other states covered in the survey
Impact Evaluation Study on ldquoNational Mission on Micro Irrigation (NMMI)rdquo
45
It may also be inferred that more than 92 percent (bore well well and farm pond) of the beneficiaries have owned water sources which facilitates them to operate the MI systems as per the crop needs
Table 25 Source of Irrigation Water ()
State Total Beneficiary
Bore well Well Farm
Ponds Canals Bore well amp Canals
Canals amp Farm Ponds Others
AP 672 9970 000 000 000 000 000 030 Bihar 516 9845 000 019 058 078 000 000 Chhattisgarh 384 8464 000 026 000 000 000 1510 Gujarat 576 7517 2309 035 069 000 000 069 Haryana 320 4625 000 281 313 781 1406 2594 Karnataka 576 10000 000 000 000 000 000 000 Maharashtra 672 3958 5342 119 446 074 000 060 Odisha 480 9250 750 000 000 000 000 000 Rajasthan 574 7631 976 000 697 314 279 105 Sikkim 50 000 000 6200 000 000 000 3800 Tamil Nadu 455 9495 264 000 242 000 000 000 UP 527 9696 304 000 000 000 000 000 Uttarakhand 90 7667 000 000 000 000 000 2333 Total 5892 8181 1039 088 166 088 104 334 Source GAPL Survey
423 Water Table The cost of irrigation depends on the depth of the water available from the ground water sources In this regard the beneficiaries were asked to narrate the depth of the water table at their farms The pertinent data has been summarized in Table 26 which helps in the selection of appropriate capacity of the pump for smooth and efficient functioning of the system
Table 26 State wise Water Table Depth
State Total Beneficiaries
Water availability depth () 0-50 Ft 50-100 Ft 100-150 Ft 150-200 Ft 200-250 Ft gt250 Ft
AP 672 030 060 104 1845 7723 238 Bihar 516 4574 5000 426 000 000 000 Chhattisgarh 384 1198 1563 4661 1615 703 260 Gujarat 576 833 3090 1337 1424 660 2656 Haryana 320 2875 3438 1625 1000 438 625 Karnataka 576 000 538 972 1771 6493 226 Maharashtra 672 4613 2649 997 1280 357 104 Orissa 480 9792 208 000 000 000 000 Rajasthan 574 767 1760 3397 1446 348 2282 Sikkim 50 - - - - - - Tamil Nadu 455 000 1319 2396 5758 484 044 UP 527 3397 5028 1480 076 019 000 Uttarakhand 90 889 2444 667 000 778 5222 Total 5892 2436 2167 1439 1421 1775 677
Note The beneficiaries of Sikkim are not aware of the depth of water availability Source GAPL Survey
Impact Evaluation Study on ldquoNational Mission on Micro Irrigation (NMMI)rdquo
46
424 Sources of Awareness about NMMI Scheme The Table 27 shows that the mix trend among the farmers and the major sources of awareness was through fellow farmers service providers suppliers extension workers etc The highest proportion of awareness revealed in Chhattisgarh was through fellow farmers in Uttarakhand UP and Sikkim through extension workers It is interesting to note that the suppliersrepresentatives of the manufacturers are the major sources of awareness to the beneficiaries This may be due to the reason that the supplier of the system have their own interest in this competitive trade and motivate as well as facilitate the farmers in applying for the benefit
Impact Evaluation Study on ldquoNational Mission on Micro Irrigation (NMMI)rdquo
47
Table 27 Sources of Awareness Reported by Beneficiaries ()
State Total
Beneficiaries Fellow
Farmers Radio Newspaper TV Pamphlet
Extension worker
Supplier Fellow
Farmers amp Supplier
Fellow Farmers amp Extension
worker
Fellow Farmers amp Newspaper
Extension worker amp Supplier
Others
AP 672 2664 000 015 060 030 2217 4628 149 149 000 089 000 Bihar 516 2597 000 019 000 000 562 3450 1667 407 000 155 1143 Chhattisgarh 384 5365 000 000 000 000 130 3411 859 078 000 052 104 Gujarat 576 2153 000 122 156 069 226 1563 3941 694 226 035 816 Haryana 320 1813 094 000 000 000 6938 531 125 250 094 000 156 Karnataka 576 2396 017 017 017 000 069 1684 3663 694 1111 278 052 Maharashtra 672 2515 045 119 045 000 908 2247 3051 551 253 164 104 Orissa 480 2479 021 250 146 000 208 2021 3479 583 354 333 125 Rajasthan 574 3136 000 122 017 105 2596 3972 017 000 017 000 017 Sikkim 50 1600 000 000 000 000 4000 200 1200 1400 1000 000 600 Tamil Nadu 455 1516 154 000 000 000 088 1582 3934 703 1407 242 374 UP 527 2220 000 000 000 000 5674 1727 228 057 019 019 057 Uttarakhand 90 889 444 333 000 222 5444 1889 000 111 000 000 667 Total 5892 2561 032 068 042 024 1721 2514 1937 390 314 124 273
Note Other source of awareness includes multiple sources of different combinations Source GAPL Survey
Impact Evaluation Study on ldquoNational Mission on Micro Irrigation (NMMI)rdquo
48
Following the same pattern of the sources of awareness for beneficiary farmers the same was asked from the non-beneficiary farmers and their responses are summarized in the Table 28
Almost 1149 non adopters out of sampled 1508 are aware about the scheme that is about 76 percent It may be seen from the following table that the major sources of awareness for no adopters are other farmers suppliers and extension workers It may also be seen here that the awareness in most of the states is more than 70 percent except for Uttarakhand Rajasthan and Gujarat
Table 28 Source of Awareness of Scheme Reported by Non-beneficiary ()
State Total Beneficiaries
Other Farmers Radio Newspaper TV Extension
worker Supplier
Other Farmers
and Supplier
Other Farmers amp Newspaper
Others
AP 116 4655 172 690 086 1207 1638 517 431 603 Bihar 95 5684 000 000 000 526 2632 947 211 000 Chhattisgarh 53 9434 000 000 000 000 189 000 189 189 Gujarat 95 4737 105 000 105 000 316 3368 421 947 Haryana 69 7971 000 000 000 1014 435 290 290 000 Karnataka 126 5794 000 000 000 000 397 2381 1349 079 Maharashtra 154 5000 065 195 065 584 1429 1883 584 195 Odisha 98 4898 000 102 000 204 714 2551 1122 408 Rajasthan 95 6632 000 316 000 947 2000 105 000 000 Sikkim 10 5000 000 000 000 000 2000 3000 000 000 Tamil Nadu 106 3774 000 000 000 000 1226 2642 2358 000 UP 120 7583 000 000 167 1917 083 250 000 000 Uttarakhand 12 000 000 000 000 5000 5000 000 000 000 Total 1149 5701 035 131 044 653 1097 1462 661 218
Note The total number of non-beneficiaries in the above table is only those who are aware about the NMMI scheme Source GAPL Survey
425 Reasons for Non-adoption of Micro Irrigation Systems
The non-beneficiaries farmers were further asked the reasons for not adopting this technology Table 29 reveals following mix responses such as
Lack of awareness regarding subsidies lack of technical knowledge high capital cost and system is not required perception that the system is not economical therefore not required for the cropping pattern adopted by them
The 50 percent farmers from Sikkim reported that they have applied for the benefit but have not received the sanction so far
The farmers of Sikkim (50) Tamil Nadu (30) Odisha amp Rajasthan (23) and Karnataka (20) also reported that they have applied for the grant of subsidy for the installation of the system but have yet to receive the sanction
Impact Evaluation Study on ldquoNational Mission on Micro Irrigation (NMMI)rdquo
49
Table 29 Reasons for Non-adoption of NMMI Scheme ()
State Total non-Beneficiaries
Less awareness
about subsidy
Lack of technical
knowledge
Lengthy procedure
High capital
cost
Application pending
for clearance
Not required
Less awareness
about subsidy amp technical
knowledge
Less awareness
about subsidy amp
Lengthy procedure
Others
AP 168 595 536 000 3036 536 060 1964 179 3095 Bihar 128 938 2266 156 1250 938 313 1328 234 2578 Chhattisgarh 96 208 208 000 4479 000 000 625 000 4479 Gujarat 144 139 278 069 3889 1042 208 069 903 3403 Haryana 81 1975 000 000 1975 000 741 3827 000 1481 Karnataka 144 1875 2014 1944 2222 1944 000 000 000 000 Maharashtra 169 237 1124 059 3846 2367 118 769 592 888 Odisha 120 167 2250 000 3167 2333 000 083 167 1833 Rajasthan 138 1087 1232 145 2029 072 000 1957 362 3116 Sikkim 10 000 4000 000 000 5000 1000 000 000 000 Tamil Nadu 120 1000 2917 1583 1500 3000 000 000 000 000 UP 168 595 119 000 2679 060 179 3333 179 2857 Uttarakhand 22 909 000 909 455 909 000 000 2273 4545 Total 1508 756 1174 365 2712 1174 133 1227 292 2168
Source GAPL Survey 426 Willingness of Non Beneficiaries to Adopt MI System
In order to understand willingness of the non-beneficiary farmers for installation of micro irrigation system in their farms a specific question was raised during interviews The responses have been compiled in the following table which shows that more than three-fourth of the farmers of all the states are willing to install micro irrigation systems except in case of Chhattisgarh where more than half of the respondents reported that they are not willing to adopt the system This response shows that when awareness of the benefits of micro irrigation systems is created (it seems during the interview respondents realized the advantages) most non-beneficiaries indicated their willingness to adopt MI
Table 30 Willingness of Non-beneficiaries to Install MI System ()
State Total Non-Beneficiaries
Response in Percent Yes No
AP 168 9762 238 Bihar 128 9922 078 Chhattisgarh 96 4583 5417 Gujarat 144 7708 2292 Haryana 81 9136 864 Karnataka 144 9792 208 Maharashtra 169 9704 296 Odisha 120 9667 333 Rajasthan 138 9203 797 Sikkim 10 8000 2000 Tamil Nadu 120 8917 1083 UP 168 8036 1964 Uttarakhand 22 9545 455
Source GAPL Survey
Impact Evaluation Study on ldquoNational Mission on Micro Irrigation (NMMI)rdquo
50
427 Progress of Installation of MI System The sampled beneficiaries were asked when they installed the system in their respective fields The results are presented in the following table
Table 31 Year of Installation of MI System ()
States 2005-06 2006-07 2007-08 2008-09 2009-10 2010-11 2011-12 2012-13 AP 104 149 060 521 1667 3170 3080 1250 Bihar NA NA NA NA 329 1860 7287 523 Chhattisgarh NA 911 2188 1458 859 2578 1979 026 Gujarat 017 191 903 1146 1233 2465 3733 313 Haryana NA 469 969 813 969 2031 4750 NA Karnataka NA 382 938 1406 1719 1476 2951 1128 Maharashtra NA 699 595 1205 2396 2857 2158 089 Odisha NA 354 396 854 1125 1333 4271 1667 Rajasthan NA 505 540 575 836 2509 4808 226 Sikkim NA NA NA NA NA NA 7400 2600 UP NA 1575 1973 474 1120 702 3510 645 Uttarakhand NA NA NA NA NA NA 2889 7111 Tamil Nadu NA NA 088 2264 879 2044 2330 2396
Source GAPL Survey
The above table reveals that in the beginning of the scheme the response was slow and gradually picked up The momentum of adoption got accelerated after the up gradation of the scheme into the mission mode in 2010 428 Average Cost of Installing the MI System The state wise average system costs as reported by the respondents have been compiled in the table below
Table 32 Average Cost of Installing MI System (Rsha)
State Drip Sprinkler
AP 61474 20572 Bihar 61109 21380 Chhattisgarh 68797 25418 Gujarat 72086 26390 Haryana 66355 25699 Karnataka 59452 27062 Maharashtra 60531 21102 Odisha 54457 20860 Rajasthan 63258 28171 Sikkim 59654 22143 Tamil Nadu 60676 24450 UP 61766 20481 Uttarakhand 59373 25932
Source GAPL Survey
Impact Evaluation Study on ldquoNational Mission on Micro Irrigation (NMMI)rdquo
51
The following facts may be observed by analyzing the responses of sampled beneficiaries
On an average the cost of system incurred by the beneficiaries of various states ranged between Rs 5445736 Rsha to Rs 7208631 Rsha for drip system depending on the crop type spacing material components used etc
As per the NMMI guidelines the indicative cost for installation of drip system for
wide space crops varies from Rs 18820 to Rs 63598 per hectare whereas for close space crops it falls in the range of Rs 74437 to Rs 97598 per hectare
Comparatively high cost incurred by the sampled farmers in Gujarat is probably attributed to the fact that more area under drip is occupied by close spaced (0-10 m2 spacing) crops Detailed analysis of higher average cost of drip in Gujarat is given in annexure IV The average cost of sprinkler in the sampled states varied between Rs 20481 to Rs 28171per hectare which falls near the specified indicative cost of overhead sprinkler systems
429 Factors Influencing Farmers to Adopt MI system To validate the outcome of the slated objectives of the scheme the beneficiaries were asked to give the reasons for adoption of the scheme and the same are presented in the following table
Table 33 Reasons for Adoption of Micro Irrigation Systems ()
State Total Beneficiaries
Because of
Subsidy
Quality of
Produce
Water Saving
Proper Utilization
of Land
Labor Saving
Time Saving
Fertilizer Saving
Early Fruiting
Higher Production
AP 672 2113 1622 5298 2917 3333 5744 2054 1637 1295 Bihar 516 2054 1143 9012 1415 4089 9244 2500 116 3779 Chhattisgarh 384 599 651 9766 1693 2370 8464 4063 1667 7083 Gujarat 576 3524 1667 8090 938 5486 2118 3507 052 2969 Haryana 320 9813 5938 9969 5719 9313 9656 9563 4281 8500 Karnataka 576 469 712 8455 2396 6719 5434 3715 434 2292 Maharashtra 672 3006 1042 7589 1458 4375 4524 2813 699 2113 Odisha 480 1229 667 7813 1938 3896 4896 1854 458 4438 Rajasthan 574 523 1359 7735 2979 4843 3066 1969 557 244 Sikkim 50 000 800 9600 4400 7200 5000 4400 600 1800 Tamil Nadu 455 1319 1297 7121 2000 5099 6571 4308 462 2308 UP 527 5617 3435 8235 3416 7002 6983 5977 2732 5617 Uttarakhand 90 3111 1222 5111 556 111 000 3000 000 6667 Total 5892 2529 1621 7890 2323 4963 5667 3557 1042 3340
Note Multiple Responses have been given to this question
It may be seen from the above table that in all nine reasons were revealed by the farmers for adopting the scheme which include (a) water saving (b) time saving (c) labor saving (d) fertilizer saving (e) higher production (f) because of subsidy (g) proper utilization of land (h) quality of produce and (i) early fruiting
Impact Evaluation Study on ldquoNational Mission on Micro Irrigation (NMMI)rdquo
52
It may further be observed that majority of the farmers reported that due to MI system they are able to save the water time and labor It is also revealed that the farmers are not installing the system because of subsidy only but also on account of other benefits In Haryana (98) ampUP (56) farmers have installed MI system due to the subsidy It is therefore concluded from here that higher amount of subsidy is not leading to more area under micro irrigation but it is due to other reasons such as reduction in cost of cultivation and higher production because of judicious use of irrigation as well as shifting towards high value income crops 4210 Subsidy Disbursement As per the operational guidelines of NMMI scheme the system in the beneficiariesrsquo field should be installed within sixty days from the date of filing the application Similarly the amount of subsidy should also be released to the suppliers service providers within 60 days Most of the farmers of Chhattisgarh (96) followed by Haryana Karnataka Tamil Nadu and Sikkim have reported that their applications are processed in less than 20 days and more than 90 percent of the farmers across states have reported that they got the sanction letter less than 40 days Only in case of Uttarakhand 50 percent of the farmers reported they got sanction after 100 days which resulted mainly due to the delayed receipt of money from the concerned quarters The following table further reveals that the 97 percent of the farmers of Bihar followed by Chhattisgarh (90) Haryana (85) amp Karnataka (78) and about 70 percent of the farmers of Odisha and Sikkim got their system installed in less than 20 days About 60 percent of Gujarat farmers 50 percent of Maharashtra followed by Tamil Nadu (48) and AP (45) reported that they got their system installed in 20-40 days
Table 34 Farmerrsquos Responses for Time Taken to Sanction Subsidy ()
State Total Beneficiary
Application to Sanction(Days) Sanction to installation (Days)
0-20 20-40 40-60 60-80 80-100 gt100 0-20 20-40 40-60 60-80 80-100 gt100 AP 672 5342 4583 074 000 000 000 4955 4524 506 000 000 015 Bihar 516 5252 4128 388 174 058 000 9690 291 000 019 000 000 Chhattisgarh 384 9583 417 000 000 000 000 8984 911 078 000 000 026 Gujarat 576 4878 4826 243 052 000 000 3281 6024 434 174 000 087 Haryana 320 9000 750 000 156 094 000 8469 1344 000 188 000 000 Karnataka 576 8559 1441 000 000 000 000 7830 1597 556 000 000 017 Maharashtra 672 4628 5372 000 000 000 000 4807 4926 253 015 000 000 Odisha 480 6229 3417 229 125 000 000 7104 2854 021 021 000 000 Rajasthan 574 5610 4338 052 000 000 000 5035 4669 244 052 000 000 Sikkim 50 6600 3400 000 000 000 000 7200 2800 000 000 000 000 Tamil Nadu 455 7385 2527 088 000 000 000 4593 4791 505 110 000 000 UP 527 4858 5047 076 000 000 019 2543 4269 1139 1537 285 228 Uttarakhand 90 000 222 667 1333 2333 5444 444 1111 6111 2333 000 000 Total 5892 6139 3557 114 059 046 085 5813 3461 448 219 025 034
Source GAPL survey
Impact Evaluation Study on ldquoNational Mission on Micro Irrigation (NMMI)rdquo
53
4211 Sources of Margin Money The contribution of the cost of MI system has to be borne by the farmers depending on the quantum of the subsidy available It was observed that in almost all the states beneficiary farmers contribute their own funds for contributing margin money Other sources albeit a small proportion constitutes banking KCC amp money lenders It may be seen from the following table that a very few beneficiaries have availed the bank loan for margin money
Table 35 Source of Finance for Meeting Beneficiary Share for Installation of MI System
State Total
Beneficiary
Source of Beneficiary Share of MI ()
Own sources
Bank KCC Money Lenders
AP 672 9807 000 104 089 Bihar 516 10000 000 000 000 Chhattisgarh 384 10000 000 000 000 Gujarat 576 9583 417 000 000 Haryana 320 9344 031 438 063 Karnataka 576 10000 000 000 000 Maharashtra 672 9911 060 030 000 Odisha 480 9979 000 021 000 Rajasthan 574 10000 000 000 000 Sikkim 50 10000 000 000 000 Tamil Nadu 455 10000 000 000 000 UP 527 9734 000 133 133 Uttarakhand 90 10000 000 000 000 Total 5892 9866 049 053 025
Source GAPL Survey
4212 Interest Rates on Borrowing
The number of beneficiaries who borrowed funds from different sources was less than 2 percent and only 049 percent borrowed from banks as stated above The beneficiaries borrowed money from various sources on differential rates of interest and their responses have been summarized in the following table which reveals that most of the farmers who borrowed money at less than 10 percent of rate of interest from banks amp KCCs
Impact Evaluation Study on ldquoNational Mission on Micro Irrigation (NMMI)rdquo
54
Table 36 Rate of Interest Paid by the Beneficiaries on Borrowed Funds
State No of Beneficiaries
10 amp less 10-12 12-15 gt15 AP 13 0 0 0 Bihar 0 0 0 0 Chhattisgarh 0 0 0 0 Gujarat 4 16 4 0 Haryana 14 3 2 1 Karnataka 0 0 0 0 Maharashtra 4 1 1 0 Odisha 1 0 0 0 Rajasthan 0 0 0 0 Sikkim 0 0 0 0 Tamil Nadu 0 0 0 0 UP 14 0 0 0 Uttarakhand 0 0 0 0 Total 50 20 7 1
4213 Type of MI system and Area Coverage 42131 Technology wise area coverage The emitting devices (inline or online emitters) are designed to discharge water at prescribed rates depending on the specific requirements of various crops In the sprinkler irrigation system water is discharge under pressure in the air through a set of nozzles attached to a network of high density polyethylene (HDPE) pipes simulating rainfall and are suitable where the plant density is very high It is widely used in field crops The sprinkler irrigation system may be portable semi-permanent or large systems (Rain guns) The cost of all the system varies across the states
Table 37 Proportion of Farmers having Drip and Sprinkler MI Systems
State Total No of Beneficiaries
Drip Sprinkler Both AP 672 499 7426 166 2470 7 104 Bihar 516 6 116 450 821 60 1163 Chhattisgarh 384 152 3958 227 5911 5 130 Gujarat 576 452 7847 115 1997 9 156 Haryana 320 228 7125 82 2563 10 313 Karnataka 576 571 9913 4 069 1 017 Maharashtra 672 589 8765 72 1071 11 164 Odisha 480 114 2375 349 7271 17 354 Rajasthan 574 354 6167 216 3763 4 070 Sikkim 50 40 8000 9 1800 1 200 Tamil Nadu 455 385 8462 69 1516 1 022 UP 527 311 5901 214 4061 2 038 Uttarakhand 90 58 6444 32 3556 0 000 Grand Total 5892 3759 6380 2005 3403 128 217
Source GAPL Survey
Impact Evaluation Study on ldquoNational Mission on Micro Irrigation (NMMI)rdquo
55
The data on area coverage under drip and sprinkler irrigation system with the beneficiary farmers in the sampled states are cited in Table 37 It is evident that drip system is more popular than sprinkler in most of the states under study The data documents that on and average area coverage under drip was about to 64 34 sprinkler and about 2 of the beneficiaries have reported both the system The respective area coverage under drip in Karnataka Tamil Nadu Sikkim AP Gujarat and Maharashtra reported more than 75 area under drip However in case of sprinkler irrigation system Bihar registered highest area under the system followed by Odisha and Chhattisgarh The inference may be drawn here that the technology wise area coverage is shifting more towards the horticulture crops and less for the field crops
Table 38 Drip amp Sprinkler System wise Area Coverage by Sampled Beneficiaries
Technology wise area coverage (ha)
State Total Area
under MI
Area under Drip
Area under Drip
Area under Sprinkler
Area under Sprinkler
AP 72431 54869 7575 17562 2425 Bihar 78034 7357 943 70676 9057 Chhattisgarh 67933 27161 3998 40773 6002 Gujarat 120259 87156 7247 33103 2753 Haryana 64800 53741 8293 11058 1707 Karnataka 76113 76113 10000 000 000 Maharashtra 86433 76210 8817 10222 1183 Odisha 85221 29212 3428 56009 6572 Rajasthan 67101 58554 8726 8546 1274 Sikkim 3132 2728 8708 405 1292 Tamil Nadu 53953 47468 8798 6485 1202 UP 81932 55069 6721 26864 3279 Uttarakhand 8347 7021 8412 1325 1588
Source GAPL Survey 42132 The Crop wise Area Coverage The crop wise area coverage was computed from the total area under drip and sprinkler irrigation system the pertinent results are enumerated in table below Andhra Pradesh
In the state of AP major fruit crops under drip system were noted to be mango citrus and banana which covered around 5491 of total area under drip Among vegetable crops brinjal chilli and tomato occupied comparatively higher area under drip than other vegetable crops Vegetables occupied around 3424 area under drip Flower maize and sugarcane covered around 1085 of area under drip irrigation with sampled beneficiaries Out of total area under MI in AP 2424 of the area was noted under sprinkler system About 4406 of area under sprinkler was occupied by vegetable crops whereas other
Impact Evaluation Study on ldquoNational Mission on Micro Irrigation (NMMI)rdquo
56
crops such as cotton maize and ground nut consists of about 5594 of the total area under sprinkler
Table 39 Crop wise Area Coverage under Drip and Sprinkler Systems in AP (Sampled Beneficiaries)
Drip Fruit Vegetable Other Crop
Name Area(ha) of Area Name Area(ha) of Area Name Area(ha) of Area Mango 7885 1437 Brinjal 9552 1741 Flower 096 017 Banana 4898 893 Chilli 3524 642 Maize 2268 413 Citrus Fruits
14379 2621 Tomato 3293 600 Sugarcane 1346 245
Others 2964 540 Others 2420 441 Pulses 933 170 Cotton 455 083 Other 857 156 Total 30126 5491 18789 3423 5954 914
Sprinkler Name Area(ha) of Area Name Area(ha) of Area Brinjal 3219 1833 Groundnut 2550 1452 Chilli 1550 883 Cotton 4249 2420 Okra 1230 701 Maize 911 518 Tomato 1738 990 Other 2115 1204 Total 7738 4406 9824 5594
Source GAPL Primary Survey 2013 Bihar
In the state of Bihar major fruit crops under drip system were noted to be mango which covered around 60 of total area under drip Among vegetable crops Okra and potato have occupied comparatively higher area under drip than other vegetable crops Vegetables occupied around 34 area under drip Sugarcane has covered around 275 of area under drip irrigation with sampled beneficiaries
Table 40 Crop wise Area Coverage under Drip and Sprinkler Systems in Bihar (Sampled Beneficiaries)
Drip Fruit Vegetable Other Crop
Name Area (Ha) of Area Name Area (Ha) of Area Name Area (Ha) of Area Mango 4383 5957 Potato 834 1133 Marigold 040 055 Litchi 093 127 Okra 931 1265 Sugarcane 202 275 Kadam 061 083 Others Crop 732 996 Others 081 110 Total 4618 6276 2497 3394 243 330
Sprinkler Name Area (Ha) of Area Name Area (Ha) of Area Name Area (Ha) of Area Blackberry 121 017 Potato 11251 1592 Wheat 13533 1915 Brinjal 2408 341 Sugarcane 10846 1535 Cauliflower 2311 327 Maize 16475 2331 Okra 1801 255 Menthol 2137 302 Tomato 1740 246 Other Crop 6160 872 Others Crop 1894 268 Total 121 017 21404 3028 49151 6954 Source GAPL Primary Survey 2013
Impact Evaluation Study on ldquoNational Mission on Micro Irrigation (NMMI)rdquo
57
Chhattisgarh
In the state of Chhattisgarh major fruit crops under drip system were noted to be banana Papaya and watermelon which covered around 345 of total area under drip Among vegetable crops Cucumber brinjal tomato and bitter gourd occupied comparatively higher area under drip than other vegetable crops Vegetables occupied around 9655 area under drip Out of total area under MI in Chhattisgarh 3998 of the area was noted under sprinkler system About 2562 of area under sprinkler was occupied by vegetable crops whereas other crops such as wheat gram and soybean consist of about 7438 of the total area
Table 41 Crop wise Area Coverage under Drip and Sprinkler Systems in Chhattisgarh (Sampled Beneficiaries)
Drip Sprinkler Fruit Vegetable Vegetable Other Crop
Name Area (ha)
of Area Name Area(ha) of
Area Name Area (ha)
of Area Name Area
(ha) of Area
Banana 340 125 Tomato 6462 2379 Okra 2865 703 Wheat 9348 2293 Papaya 374 138 Cucumber 3887 1431 Tomato 3115 764 Pulses 9576 2349 Watermelon 223 082 Brinjal 2414 889 Bottle Gourd 1319 324 Other
Crop 11402 2796
Bitter Gourd 3416 1258 Others Crop 3148 772 Others Crop 10045 3698 Total 937 345 26224 9655 10447 2562 30325 7438
Source GAPL Primary Survey 2013 Gujarat
In the state of Gujarat major fruit crops under drip system were noted to be banana Papaya and pomegranate which covered around 1225 of total area under drip Among vegetable crops Chili tomato potato and onion occupied comparatively higher area under drip than other vegetable crops Vegetables occupied around 1636 area under drip Flower cotton sugarcane and caster covered around 7139 of area under drip irrigation with sampled beneficiaries Out of total area under MI in Gujarat 2752 of the area was noted under sprinkler system About 2574 of area under sprinkler was occupied by fruits and vegetable crops whereas other crops such as flower cotton groundnut and caster consist of about 7427 of the total area
Impact Evaluation Study on ldquoNational Mission on Micro Irrigation (NMMI)rdquo
58
Table 42 Crop wise Area Coverage under Drip and Sprinkler Systems in Gujarat (Sampled Beneficiaries)
Drip Fruit Vegetable Other Crop
Name Area(ha) of Area Name Area(ha) of Area Name Area(ha) of Area Banana 6303 723 Chilli 5274 605 Flower 020 002 Papaya 1113 128 Tomato 3337 383 Caster 6414 736 Pomegranate 1072 123 Potato 2113 242 Cotton 49859 5721 Others 2185 251 Onion 2408 276 Sugarcane 1417 163 Others Crop 1129 130 Other Crop 4512 518 Total 10674 1225 14260 1636 62222 7139
Sprinkler Name Area(ha) of Area Name Area(ha) of Area Name Area(ha) of Area
Pomegranate 890 269 Potato 6322 1910 Flower 182 055 Water Melon 101 031 Others Crop 1204 364 Cotton 5099 1540 Ground nut 4800 1450 Caster 3217 972 Bajra 5783 1747 Other Crop 5503 1662 Total 992 300 7526 2274 24585 7427
Source GAPL Primary Survey 2013 Haryana
In the state of Haryana major fruit crops under drip system were noted to be Kinnow lemon strawberry and watermelon which covered around 7771 of total area under drip Among vegetable crops tomato potato and cucumber occupied comparatively higher area under drip than other vegetable crops Vegetables occupied around 1905 area under drip Flower and cotton covered around 324 and 396 of area respectively under drip irrigation with sampled beneficiaries Out of total area under MI in Haryana 1706 of the area was noted under sprinkler system About 9250 of area under sprinkler was occupied by fruits and vegetable crops whereas other crops such as cotton and wheat consist of about 750 of the total area under sprinkler
Table 43 Crop wise Area Coverage under Drip and Sprinkler Systems in Haryana (Sampled Beneficiaries) Drip
Fruit Vegetable Other Crop Name Area(ha) of Area Name Area(ha) of Area Name Area(ha) of Area Kinnow 36321 6759 Tomato 2408 448 Flower 344 064 Lemon 1781 331 Cucumber 1568 292 Cotton 1396 260 Water Melon 1396 260 Potato 2355 438 Strawberry 1012 188 Others Crop 3905 727 Other Crops 1255 233 Total 41764 7771 10237 1905 1740 324
Sprinkler Name Area(ha) of Area Name Area(ha) of Area Name Area(ha) of Area Musk Melon 283 256 Tomato 3693 3339 Cotton 364 329 Water Melon 152 137 Potato 1194 1080 Wheat 465 421 Chilli 1113 1006 Others Crop 3794 3431 Total 435 393 9794 8856 830 750
Source GAPL Primary Survey 2013
Impact Evaluation Study on ldquoNational Mission on Micro Irrigation (NMMI)rdquo
59
Karnataka
In the state of Karnataka major fruit crops under drip system were noted to be banana areca nut pomegranate and mango which covered around 8425 of total area under drip Among vegetable crops tomato chilli and ginger occupied comparatively higher area under drip than other vegetable crops Vegetables occupied around 1161 area under drip Turmeric Pepper and others crops covered around 1396 1331 and 425 of area under drip irrigation with sampled beneficiaries Table 44 Crop wise Area Coverage under Drip and Sprinkler Systems in Karnataka (Sampled Beneficiaries)
Drip Fruit Vegetable Other Crop
Name Area (Ha)
of Area
Name Area (Ha)
of Area
Name Area (Ha)
of Area
Banana 26716 3510 Tomato 3790 498 Turmeric 1396 183 Pomegranate 7684 1010 Chilli 2252 296 Pepper 1331 175 Areca nut 8503 1117 Ginger 1076 141 Other Crop 425 056 Mango 5704 749 Others Crop 1718 226 Others 15516 2039 Total 64124 8425 8837 1161 3153 414 Source GAPL Primary Survey 2013
Maharashtra
In the state of Maharashtra major fruit crops under drip system were noted to be banana mango citrus fruits and grapes which covered around 4283 of total area under drip Among vegetable crops tomato brinjal and chili occupied comparatively higher area under drip than other vegetable crops Vegetables occupied around 757 area under drip Flower sugarcane cotton and other crops covered around 061 2012 2697 and 190 of area under drip irrigation with sampled beneficiaries Under sprinkler system about 158 of area occupied by vegetable crops whereas other crops such as flower cotton ground nut black gram and soybean consist of about 9842 of the total area
Table 45 Crop wise Area Coverage under Drip and Sprinkler Systems in Maharashtra (Sampled Beneficiaries)
Drip Sprinkler Fruit Vegetable Other Crop Vegetable Other Crop
Name Area (Ha)
of Area Name Area
(Ha) of Area Name Area
(Ha) of Area Name Area
(Ha) of Area Name Area
(Ha) of Area
Banana 12043 1580 Brinjal 2590 340 Flower 465 061 Brinjal 051 049 Flower 081 079 Mango 7838 1028 Tomato 1718 225 Cotton 20553 2697 Peas 040 040 Cotton 3497 3421 Grapes 587 077 Chilli 1055 138 Sugarcane 15334 2012 Tomato 071 069 Soybean 2929 2865 Citrus Fruits
4110 539 Others 405 053 Other Crop 1446 190 Ground nut
946 925
Others 8066 1058 Black Gram
1384 1354
Others 1224 1198 Total 32643 4283 5768 757 37799 4960 162 158 10060 9842
Source GAPL Primary Survey 2013
Impact Evaluation Study on ldquoNational Mission on Micro Irrigation (NMMI)rdquo
60
Odisha
In the state of Odisha major fruit crops under drip system were noted to be mango banana and cashew nut which covered around 7090 of total area under drip Among vegetable crops tomato brinjal and Okra occupied comparatively higher area under drip than other vegetable crops Vegetables occupied around 2515 area under drip Flower moong and sugarcane covered around 395 of area under drip irrigation with sampled beneficiaries Under sprinkler system about 8741 of area was occupied by fruits and vegetable crops whereas other crops such as moong maize sugarcane and others crop consist of about 455 148 217 and 439 of the total area
Table 46 Crop wise Area Coverage under Drip and Sprinkler Systems in Odisha (Sampled Beneficiaries)
Drip Fruit Vegetable Other Crop
Name Area (Ha) of Area Name Area (Ha) of Area Name Area (Ha) of Area Mango 8771 3002 Tomato 1803 617 Flower 121 042 Banana 3602 1233 Brinjal 1497 513 Moong 364 125 Cashew nut 2165 741 Okra 1042 357 Sugarcane 202 069 Others 6174 2113 Others Crop 3005 1029 Other Crop 465 159 Total 20711 7090 7347 2515 1153 395
Sprinkler Name Area (Ha) of Area Name Area (Ha) of Area Name Area (Ha) of Area
Pineapple 182 033 Brinjal 10350 1848 Moong 2550 455 Watermelon 324 058 Tomato 9410 1680 Maize 830 148 Okra 6297 1124 Sugarcane 1214 217 Cauliflower 5585 997 Other Crop 2459 439 Others Crop 16809 3001 Total 506 090 48451 8651 7052 1259
Source GAPL Primary Survey 2013
Rajasthan
In the state of Rajasthan major fruit crops under drip system were noted to be kinnow orange and mango which covered around 43 of total area under drip Among vegetable crops onion carrot and tomato occupied comparatively higher area under drip than other vegetable crops Vegetables occupied around 24 area under drip Flower cotton arandi and guar covered around 32 of area under drip irrigation with sampled beneficiaries Out of total area under MI in Rajasthan more of the area was noted under sprinkler system About 56 of area under sprinkler was occupied by fruits and vegetable crops whereas other crops such as flower wheat Mustard and cotton consist of about 44 of the total area
Impact Evaluation Study on ldquoNational Mission on Micro Irrigation (NMMI)rdquo
61
Table 47 Crop wise area Coverage under Drip and Sprinkler Systems in Rajasthan (Sampled Beneficiaries)
Drip Fruit Vegetable Other Crop
Name Area of Area Name Area of Area Name Area of Area Kinnow 6523 1114 Onion 5315 908 Flower 656 112 Orange 13019 2223 Tomato 2832 484 Cotton 11881 2029 Lemon 1854 317 Cauliflower 1510 258 Arandi 1730 295 Mango 1017 174 Others Crop 4396 751 Guwar 1463 250 Other Crops 3149 538 Other Crop 3209 548 Total 25563 4366 14052 2400 18939 3234
Sprinkler Name Area of Area Name Area of Area Name Area of Area Lemon 202 237 Carrot 3954 4626 Mustard 2488 2912 Others Crop 623 729 Wheat 647 757 Other Crop 631 739 Total 202 237 4577 5356 3767 4407 Source GAPL Primary Survey 2013
Sikkim
In the state of Sikkim major fruit crops under drip system were noted to be orange and guava which covered around 41 of total area under drip Among vegetable crops tomato and brinjal occupied comparatively higher area under drip than other vegetable crops Vegetables occupied around 42 area under drip Wheat and mustard covered around 313 of area under drip irrigation with sampled beneficiaries Out of total area under MI in About 70 of area under sprinkler was occupied by the vegetable crops whereas other crops such as wheat and turmeric consist of about 30 of the total area Table 48 Crop wise Area Coverage under Drip and Sprinkler Systems in Sikkim (Sampled Beneficiaries)
Drip Fruit Vegetable Other Crop
Name Area (Ha)
of Area Name Area
(Ha) of Area Name Area
(Ha) of Area
Orange 939 3442 Tomato 555 2036 Large Cardamom
142 519
Guava 182 668 Brinjal 263 964 Turmeric 243 890 Other Crop 333 1220 Other Crop 071 260 Total 1121 4110 1151 4221 455 1669
Sprinkler
Name Area of Area Name
Area (Ha)
of Area Name
Area (Ha)
of Area
Tomato 081 2000 Turmeric 081 2000 Cauliflower 081 2000 Other Crop 040 1000 Barackoli 081 2000 Others Crop 040 1000 Total 283 7000 121 3000 Source GAPL Primary Survey 2013
Impact Evaluation Study on ldquoNational Mission on Micro Irrigation (NMMI)rdquo
62
Tamil Nadu
In the state of Tamil Nadu major fruit crops under drip system were noted to be banana tapioca coconut and aonla which covered around 5528 of total area under drip Among vegetable crops tomato chili and brinjal occupied comparatively higher area under drip than other vegetable crops Vegetables occupied around 1780 area under drip Turmeric and sugarcane covered around 2692 of area under drip irrigation with sampled beneficiaries Out of total area under MI in Tamil Nadu 1202 of the area was noted under sprinkler system About 9923 of area under sprinkler was occupied by fruits and vegetable crops whereas other crops such as turmeric consist of about 078 of the total area Table 49 Crop wise Area Coverage under Drip and Sprinkler Systems in Tamil Nadu (Sampled Beneficiaries)
Drip Fruit Vegetable Other Crop
Name Area (Ha) of Area Name Area (Ha) of Area Name Area (Ha) of Area Banana 7875 1659 Chilli 2025 427 Turmeric 9501 2002 Tapioca 4994 1052 Brinjal 1720 362 Sugarcane 3278 691 Coconut 4953 1044 Tomato 1761 371 000 Aonla 3458 728 Others Crop 2944 620 Others Crop 4958 1045 Total 26238 5528 8451 1780 12779 2692
Sprinkler Name Area (Ha) of Area Name Area (Ha) of Area Name Area (Ha) of Area Carrot 081 125 Chilli 3197 4930 Turmeric 051 078 Potato 1740 2683 Carrot 1234 1903 Others Crop 182 281 Total 081 125 6354 9797 051 078 Source GAPL Primary Survey 2013 Uttar Pradesh In the state of UP major fruit crops under drip system were noted to be banana mango and guava which covered around 81 of total area under drip Among vegetable crops tomato potato and chili occupied comparatively higher area under drip than other vegetable crops Vegetables occupied around 19 area under drip Maize wheat and other crops covered around 144 of area under drip irrigation with sampled beneficiaries Out of total area under MI in UP about one-third of the area was noted under sprinkler system About 88 of area under sprinkler was occupied by fruits and vegetable crops whereas other crops such as wheat consist of about 12 of the total area
Impact Evaluation Study on ldquoNational Mission on Micro Irrigation (NMMI)rdquo
63
Table 50 Crop wise Area Coverage under Drip and Sprinkler Systems in UP (Sampled Beneficiaries)
Drip Fruit Vegetable Other Crop
Name Area of Area Name Area of Area Name Area of Area Banana 13173 2392 Potato 2752 500 Maize 263 048 Guava 12363 2245 Tomato 2863 520 Sunflower 020 004 Mango 16431 2984 Chilli 1295 235 Litchi 1538 279 Cabbage 911 165 Others Crop 951 173 Others Crop 2509 456 Total 44456 8073 10330 1876 283 051
Sprinkler Name Area of Area Name Area of Area Name Area of Area Strawberry 040 015 Peas 9611 3578 Flower 081 030 Tomato 4037 1503 Wheat 2703 1006 Brinjal 2529 942 Other Crop 314 117 Okra 1457 542 Others Crop 6091 2267 Total 040 015 23725 8832 3098 1153 Source GAPL Primary Survey 2013 Uttarakhand In the state of Uttarakhand major fruit crops under drip system were noted to be peach mango litchi and guava which covered around 96 of total area under drip Among vegetable crops only peas occupied around 201 area under drip Out of total area under MI in Uttarakhand about one-fourth of the area was noted under sprinkler system About 100 of area under sprinkler was occupied by vegetable crops
Table 51 Crop wise Area Coverage under Drip and Sprinkler Systems in Uttarakhand (Sampled Beneficiaries)
Drip Sprinkler Fruit Vegetable Other Crop Vegetable
Name Area (Ha)
of Area Name Area
(Ha) of Area Name Area
(Ha) of Area Name Area
(Ha) of Area
Mango 3217 4582 Peas 101 144 Popular Tree
202 288 Peas 1062 8015
Peach 1356 1931 Tomato 263 1985 Guava 1477 2104 Litchi 668 951 Total 6718 9568 101 144 202 288 1325 10000 Source GAPL Primary Survey 2013
The above tables also shows that crops as brinjal chilli Okra flower tomato bottle gourd pomegranate etc are irrigated with micro sprinkler irrigation system by the beneficiaries However during the course of discussion with experts it was observed that irrigation through this system is not recommended because it harms the crop at the flowering stage Therefore it is recommended that farmers should be advised at the time of installation to use drip irrigation for such crops or they may avoid use of sprinkler during flowering stage and irrigate through alternative means
Impact Evaluation Study on ldquoNational Mission on Micro Irrigation (NMMI)rdquo
64
4214 System Demonstration The outcome demonstration particularly in rural area where exposure is limited remains an important instrument in educating the rural folks because only physical or concrete evidence is convincing for them Seen evidence can be easily and correctly interpreted when in fact interpretation may be difficult thus gives better results NMMI scheme has a component of demonstrations at the farmersrsquo fields to educate the farmers of that particular cluster In this regard the farmers were asked whether they have exposure to any field visit demonstration MI system
Table 52 Exposure of Beneficiary Farmers to MI Demonstrations
State Participated () Yes No
AP 1250 8750 Bihar 3721 6279 Chhattisgarh 4896 5104 Gujarat 2830 7170 Haryana 9844 156 Karnataka 2726 7274 Maharashtra 4747 5253 Odisha 4167 5833 Rajasthan 6463 3537 Sikkim 8000 2000 Tamil Nadu 2330 7670 UP 2144 7856 Uttarakhand 6333 3667
Source GAPL Survey
It may be seen from the above table that the beneficiaries of Haryana (98) followed by Sikkim (80) Rajasthan (64) and Uttarakhand (63) attended the demonstration nearby their areas Whereas majority of the farmers AP UP Tamil Nadu Karnataka Gujarat Bihar have reported that they have not visited any demonstration It is therefore suggested that more efforts may be put to expose the farmers regarding demonstration of MI system and its benefits 4215 Training and Capacity Building The training and capacity building is an integral component of the MI initiatives This component has been inbuilt to upgrade the capacity building of farmers and field functionaries through training and demonstrations carried out by state agricultural universities Precision Farming Development Centers (PFDCs) and the industry In light of
Impact Evaluation Study on ldquoNational Mission on Micro Irrigation (NMMI)rdquo
65
these observations our survey gave due attention to the training component and the obtained results are enumerated in table 53 The data revealed that almost all the respondents of Tamil Nadu UP Chhattisgarh Haryana were given training materials during the training while few beneficiaries of the Bihar Uttarakhand amp Karnataka received such training materials It has also been noted that farmers were imparted training on operation and maintenance of the system adoption of package practices under MI opportunities for introducing new crops with the help of micro irrigation system As far as field visits are concerned most of the beneficiaries reported that they have visited the fields of progressive farmers and demonstration fields except for Chhattisgarh Rajasthan and Uttarakhand where few farmers have reported that they have visited the demonstration fields
Impact Evaluation Study on ldquoNational Mission on Micro Irrigation (NMMI)rdquo
66
Table 53 Topic Covered in Training for Beneficiary Farmers ()
State Total
Beneficiary
Training Material Provided
Topic Covered in the Training
Joined Any Field Visit
Satisfied with the Learning
Operation of the System
Maintenance of the System
Package of Practices for
the Crops
Opportunities for Introduction
of New Crop
Other Related Schemes
Yes No Yes No Yes No Yes No Yes No Yes No Yes No Yes No AP 672 7188 878 7991 074 7917 149 7113 952 5580 2485 6592 1473 6696 3304 7307 759 Bihar 516 950 1047 1977 019 1977 019 1453 543 601 1395 194 1802 446 9360 620 019 Chhattisgarh 384 9714 208 9922 000 9896 026 9766 156 7057 2865 7083 2839 8073 1927 7995 078 Gujarat 576 4531 313 4705 139 4653 174 3264 1580 1094 3750 1510 3333 3767 6233 3715 052 Haryana 309 9363 637 9385 615 9341 659 9099 901 6286 3714 6154 3846 8330 1670 9319 681 Karnataka 576 2638 6357 8937 057 8748 247 4459 4535 2979 6015 1575 7419 4592 5408 5047 342 Maharashtra 672 7188 878 7991 074 7917 149 7113 952 5580 2485 6592 1473 6696 3304 7307 759 Odisha 480 5878 253 6131 000 6116 015 5193 938 3929 2202 4926 1205 5744 4256 6086 045 Rajasthan 574 8171 261 8432 000 8223 209 8031 401 6707 1725 7038 1394 679 2735 6951 314 Sikkim 50 4771 438 5146 063 5167 042 4479 729 2396 2813 2833 2375 4333 5667 5000 208 Tamil Nadu 455 9965 035 9965 035 9931 069 9080 920 6059 3941 5955 4045 8507 1493 9670 330 UP 527 9800 000 9800 000 9800 000 8400 1400 5000 4800 4800 5000 8000 2000 9800 000 Uttarakhand 90 667 2667 2889 444 2889 444 778 2556 556 2778 444 2889 1111 2222 1556 1778
Source GAPL Survey
Impact Evaluation Study on ldquoNational Mission on Micro Irrigation (NMMI)rdquo
67
The farmers were asked whether they are satisfied from the training they received The beneficiaries of almost all the states gave positive response in this regard It is recommended that training on innovative techniques relevant to the MI Systems should cover topics such as high density plantation canopy management intercropping and use of mulch materials The beneficiaries were further asked about the institutions from which they have got the training about the MI system The obtained responses of the sampled beneficiaries are presented in the following table
Table 54 Institution for Training as Reported by Respondents ( Beneficiaries)
State Total Responses
SAUs KVKs PFDC
State Govt
Agencies
System Supplier Others
SAUs KVKs amp State Govt
Agencies
SAUs KVKs amp System Supplier
State Govt
Agencies amp System Supplier
AP 542 073 3229 6605 018 000 000 074 Bihar 103 1359 291 7961 000 000 291 097 Chhattisgarh 381 1365 079 4331 000 131 3832 262 Gujarat 279 359 430 9176 000 036 000 000 Haryana 309 194 906 8641 032 000 032 194 Karnataka 575 504 522 8974 000 000 000 000 Maharashtra 412 1360 437 7597 024 024 097 461 Odisha 250 240 160 8800 040 040 680 040 Rajasthan 484 534 331 9029 000 000 000 103 Sikkim 49 612 6531 2449 000 000 204 204 Tamil Nadu 427 211 000 9789 000 000 000 000 UP 474 211 211 9557 000 000 000 021 Uttarakhand 30 333 667 8667 000 000 000 333
Source GAPL Survey sharing of source technical Information regarding micro irrigation system scheme Note The duration of training has been reported to be of 1-2 days as revealed by the participant beneficiaries It may be seen from the above table that the system suppliers manufacturers are the major sources who imparted the training as more than 90 percent of the farmers of Tamil Nadu UP Gujarat Rajasthan and Karnataka received the training from suppliers Other sources of training are state government agencies and SAUsKVKs PFDC etc Most of the manufacturers imparted training at the time of system installation However it was revealed by the beneficiaries that after installation training on system operation is not provided to them as per their needs As such most of the farmers fail to draw full advantage of the MI system There is thus a dire need to provide technical support for system operation after installation It is recommended that regular trainings under MI system may be made mandatory on the part of system suppliers after the installation of the system as they are closely associated with the beneficiaries and have in-depth knowledge of the installed system
Impact Evaluation Study on ldquoNational Mission on Micro Irrigation (NMMI)rdquo
68
4216 Availability of Electricity The micro irrigation system runs on power and is a pre requisite for the installation of system therefore availability of power is an important parameter in this regard The following table shows the availability of electricity among all the states
Table 55 Availability of Electricity (Beneficiaries and Non Beneficiaries)
Beneficiaries Non Beneficiaries
State Total
Beneficiary
Availability of electricity () Availability of electricity () 0-4
HrsDay 4-8
HrsDay 8-12
HrsDay 12-16
HrsDay 16-20
HrsDay 20-24
HrsDay Total Non-
beneficiaries 0-4
HrsDay 4-8
HrsDay 8-12
HrsDay 12-16
HrsDay 16-20
HrsDay
AP 672 104 7113 2768 015 000 000 168 179 7560 2202 060 000 Bihar 516 1492 7888 581 039 000 000 128 1094 4844 2578 1484 000 Chhattisgarh 384 7943 1979 000 078 000 000 96 000 313 2083 5729 1875 Gujarat 576 000 9010 573 260 156 000 144 139 069 9722 069 000 Haryana 320 094 1719 6719 1438 000 031 81 123 1728 7284 864 000 Karnataka 576 000 9410 590 000 000 000 144 139 9444 556 000 000 Maharashtra 672 015 1994 7366 625 000 000 169 059 3018 6331 592 000 Odisha 480 083 1563 3104 4354 896 000 120 250 2250 2750 4500 250 Rajasthan 574 1690 6429 1376 505 000 000 138 145 9348 435 072 000 Sikkim 50 000 10000 000 000 000 000 10 000 8000 000 000 000 Tamil Nadu 455 000 10000 000 000 000 000 120 000 10000 000 000 000 UP 527 000 2068 7078 816 038 000 168 119 2143 6905 833 000 Uttarakhand 90 333 8778 000 000 889 000 22 1364 5909 2273 000 455
Source GAPL Survey
It may be seen that the supply of electricity in different states only one farmer among the beneficiaries that two of Haryana reported that the electricity available for 24 hrs It may further be seen that 100 percent of the farmers of Sikkim and Tamil Nadu reported to get electricity for 4-8 hrs in a day In other states it was observed that electricity is available for less than 16 hrs a day and out of which maximum reported to be between 12-16 hrs a days It may further be seen that farmers of Tamil Nadu Karnataka Rajasthan Sikkim and AP reported that they are getting electricity for 8 hrs whereas rest of the farmers reported that they are getting electricity up to 16 hrs a day The availability of electricity to beneficiaries and non-beneficiaries are showing the same trend
Impact Evaluation Study on ldquoNational Mission on Micro Irrigation (NMMI)rdquo
69
4217 Capacity of Pump Sets It may be seen from the following table that the majority of the farmers are using pump sets ranging upto 5 hp In AP and Maharashtra about 74 and 63 percent of beneficiaries reported that they are using the pump sets of 5-10 hp at their farms However about 59 54 41 percent farmers of Gujarat Haryana and UP respectively revealed that that they are having the pump sets of more than 10 hp The variations in the capacities of installed pump sets are attributed to the depth of water farm size type of MI system installed Most of the farmers reported that pump sets of appropriate capacity have been installed which thoroughly meet the system requirements and they are not facing any problem to irrigate the crops as per their requirements
Table 56 Capacity of Pump Sets Used by Beneficiaries
States Total
Beneficiary Power of the Pump Set ()
0-5 hp 5-10 hp 10-15 hp AP 672 2307 7426 267 Bihar 516 9845 097 058 Chhattisgarh 384 9896 000 104 Gujarat 576 347 3715 5938 Haryana 320 469 4094 5437 Karnataka 576 6319 3681 000 Maharashtra 672 2842 6295 863 Odisha 480 6771 3000 229 Rajasthan 574 8449 436 1115 Sikkim 50 6200 3800 000 Tamil Nadu 455 3275 6725 000 UP 527 493 5446 4061 Uttarakhand 90 4111 4444 1445
Source GAPL Survey 4218 Irrigation Filters Clean water is crucial for proper and effective long term operation of micro irrigation systems Water filtration is important for all irrigation systems Clogging of nozzles emittersdrippers reduce the efficiency of the MI system which ultimately results in increase in energy consumption and maintenance as well as cost of irrigation Filters can help extend the life of and lower the maintenance on sprinkler system For drip systems they are a necessity to prevent emitters from becoming plugged The yield is also affected because of clogging In drip and sprinkler irrigation the quality of water being pumped into the irrigation system is the most important factor in filter selection Filtration may be accomplished through use of filters They are sand separators media filter screen filter disc filter and settling basin
Impact Evaluation Study on ldquoNational Mission on Micro Irrigation (NMMI)rdquo
70
Sand separator or hydro cyclone filter is a type of filter that separates the particles from water according to the principle of gravitational settling and centrifugal force These are effective to remove suspended particles which have specific gravity more than 265 gcc (JISL) and are larger than 75 micron Such filters are suited for water type where a lot of sand is present in the water as they dont clog up nearly as quickly as other types of filters The dirty water enters the filter where it is swirled around the inside of a cylinder These filters are reasonably inexpensive very simple and are very effective for removing sand from water
Screen filters are probably the most common filters and in most case the least expensive and are excellent for removing hard particulates from water such as sand They are not so good at removing organic materials such as algae mold slime and other unmentionables These non-solid materials tend to embed themselves into the screen material from where they are very difficult to remove In other cases they simply slide through the holes in the screen by temporarily deforming their shape Screen filters are cleaned by flushing them with a stream of water or removing the screen and cleaning it by hand
Media filters clean the water by forcing it through a container filled with a small sharp edgedgranulated media In most cases the media material is uniform sized crushed silica sand The water passes through the small spaces between the media grains and the debris is stopped when it cant pass through these spaces Media filters are best for removing organic material from the water Media filters are the type of filters most commonly used for high volume cleaning of water from rivers and lakes Disc filters are a cross between a screen filter and a media filter with many of the advantages of both Disc filters are good at removing both particulates like sand and organic matter The pertinent information has been summarized in the following table below
Impact Evaluation Study on ldquoNational Mission on Micro Irrigation (NMMI)rdquo
71
Table 57 Type of Irrigation Filters Used by Farmers
Type of Irrigation Filters used by the Farmers () State Total
Beneficiary Total
Responses Hydro-cyclone
Filter
Screen filters
Sand Media Filters
Disc Filters
Hydro-cyclone
Filter ampScreen
filters
Hydro-cyclone Filter amp
Sand Media Filters
Hydro-cyclone Filter amp
Disc Filters
Screen filters
amp Sand Media Filters
Screen filters amp Disc Filters
Sand Media Filters ampDisc Filters
Hydro-cyclone Filter amp Screen
filters amp Sand
Media Filters
Hydro-cyclone Filter amp Screen
filters amp Disc
Filters
AP 672 672 015 9583 402 000 000 000 000 000 000 000 000 000 Bihar 516 6 000 8333 000 000 000 000 000 000 1667 000 000 000 Chhattisgarh 384 156 449 3141 000 5449 000 000 385 000 577 000 000 000 Gujarat 576 517 2244 1876 019 1973 348 019 2340 019 1103 058 000 000 Haryana 320 320 125 219 000 000 6469 125 031 1875 000 000 1094 063 Karnataka 576 576 035 7969 417 1580 000 000 000 000 000 000 000 000 Maharashtra 672 670 149 8478 075 1045 000 000 000 060 030 164 000 000 Odisha 480 480 021 9438 021 396 000 000 000 104 021 000 000 000 Rajasthan 574 568 141 8680 1056 000 000 018 000 053 035 018 000 000 Sikkim 50 50 000 9800 000 200 000 000 000 000 000 000 000 000 Tamil Nadu 455 455 044 8725 637 593 000 000 000 000 000 000 000 000 UP 527 524 248 8473 000 000 1240 000 000 038 000 000 000 000 Uttarakhand 90 90 000 10000 000 000 000 000 000 000 000 000 000 000
Source GAPL Survey
Impact Evaluation Study on ldquoNational Mission on Micro Irrigation (NMMI)rdquo
72
Different types of filters are mainly used for drip irrigation system whereas its use for sprinkler system is required under very specific water quality characteristics Some beneficiaries reported that they were using filters in sprinkler systems to check the plugging etc The beneficiary farmers using drip irrigation system were asked about the type of filters being used by them It may be seen from the table 58 that farmers are using screen filters centrifugal separators hydro-cyclone filter disc filter sand media filters depending on the need The data cited in the above table reveal that screen filters are being commonly used by the beneficiaries in most of the sampled states except Haryana where screen filters are being used in combination with hydrocyclone filters The combined use of filters in Haryana is attributed to the fact that additional subsidy is being given on hydro-cyclone type of filters In fact a combination of three filters (hydro-cyclone screen amp sand filter) is also being used by some beneficiaries of Haryana The use of such combinations may be ascribed to the fact that since Haryana government is extending financial assistance to construct water storage tanks as such many farmers prefer to store the water in such structures The incidence of different types of contaminations is higher in the stored water thus farmers are using combination of three types of filters to ensure the removal of all types of organic and inorganic materials Disc filters are used by about 55 percent farmers of Chhattisgarh followed by Gujarat (20) Karnataka (16) About 10 percent of the farmers of Rajasthan followed by 6 percent Tamil Nadu and 4 from AP are using sand filters may be because they are getting water from canals which has high dirt load of organic and inorganic materials The size of filter installed with MI system depends on the area being irrigated and the quantum of water being pumped It has been noted by the field staff that in most of the cases size of filters was appropriate as per the area soil and water quality characteristics 4219 Type of Emitters in drip system There are two categories of emitters usually installed with drip system in the field
a) In-line emitters These are used in row crops such as vegetables where water needs to be applied effectively near the root zone area
b) On-line emitters These are suitable to orchard crops such as apples mangoes etc These drippers are fixed on the laterals and can be opened for cleaning It provides uniform water distribution in the root zone The drippers may clog with physical impurities like minerals amp salts and also due to poor maintenance Further rodents and insects can damage lateral pipes of the drip irrigation system
Drip irrigation system left above the ground tends to clog less as in underground system chances of deposition of algae and soil particles is high It is also easy to lift while
Impact Evaluation Study on ldquoNational Mission on Micro Irrigation (NMMI)rdquo
73
preparing the fields for seed sowing or transplantation of seedlings Use of plastic mulch in conjunction with drip irrigation system has been reported to be more beneficial in saving water and improving the crop yields It was assessed during the course of study whether the sampled beneficiaries were using in-line or on-line drip system the pertinent data on type of emitters are cited in the following table
Table 58 Type of Emitters Used by Beneficiaries
State Total
Responses Inline Online
in Inline Online
AP 512 414 98 8086 1914 Bihar 6 4 2 6667 3333 Chhattisgarh 153 98 55 6405 3595 Gujarat 450 344 106 7644 2356 Haryana 236 128 102 5424 4576 Karnataka 575 359 216 6243 3757 Maharashtra 577 366 211 6343 3657 Odisha 118 84 34 7119 2881 Rajasthan 118 79 39 6695 3305 Sikkim 45 34 11 7556 2444 Tamil Nadu 384 256 128 6667 3333 UP 322 220 102 6832 3168 Uttarakhand 30 12 18 4000 6000
Source GAPL Survey It may be seen from the above table that more than 70 percent of the respondent farmers of AP Gujarat Sikkim and Odisha were using in-line drip irrigation system whereas more than 45 percent beneficiaries of Haryana and Uttarakhand reported to practice on-line drip irrigation system 4220 Type of Sprinkler Under sprinkler irrigation water is sprinkled under pressure on to the crop through a set of nozzles attached to network of pipes in the form of rainfall The sprinkler system sets unlike drip system are moveable Hence one sprinkler set could cover more than one hectare by shifting from one place to another Assistance for sprinkler irrigation is limited to only those crops where drip irrigation is uneconomical
Impact Evaluation Study on ldquoNational Mission on Micro Irrigation (NMMI)rdquo
74
Table 59 Type of Sprinklers Used by Beneficiaries
State Total Responses Percentage
Portable MiniMicro Rain gun AP 160 2072 7928 000 Bihar 510 9471 529 000 Chhattisgarh 231 7745 2251 000 Gujarat 126 8810 1111 079 Haryana 84 9524 476 000 Karnataka 87 3218 6667 114 Maharashtra 95 9368 632 000 Odisha 362 9613 387 000 Rajasthan 356 7556 2444 000 Sikkim 10 8000 2000 000 Tamil Nadu 71 9718 282 000 UP 205 9707 293 000 Uttarakhand 60 8833 1167 000
Source GAPL Survey It may be seen from the above table that majority of the beneficiaries of Tamil Nadu Rajasthan Odisha Bihar Maharashtra Gujarat and Uttarakhand states were using portable sprinkler irrigation system The use of rain gun was reported by one farmer only in Gujarat as it is most suitable to the large area under cultivation It is noted to be appropriate type of sprinkler system for larger areas as it can rotate 30 to 360 circle covering 25 meter radius with a discharge rate 175 lps 4221 Farmersrsquo opinion on System Supply and Installation related constraints The farmers were asked to reveal the difficulties faced by them right from the filing of application till receiving the after sales service including procedures quality of the systems supplied prices charged by empanelled system suppliers delay in installation after the placement of orders and any additional charges claimed by the supplies The response of the beneficiaries has been summarized in the table below
Impact Evaluation Study on ldquoNational Mission on Micro Irrigation (NMMI)rdquo
75
Table 60 Constraints Faced by Beneficiary Farmers ()
State Total
Beneficiaries
Procedure Related
Quality Issues
Higher Prices Charged
under Scheme then Available
in Market
Delay in System Supply
(Committed date vs Actual
date
Other Charges (Not covered in
the scheme additional
money paid) Yes No Yes No Yes No Yes No Yes No
AP 672 000 10000 060 9940 060 9940 060 9940 015 9985 Bihar 516 078 9922 155 9845 155 9845 252 9748 717 9283 Chhattisgarh 384 026 9974 000 10000 000 10000 000 10000 000 10000 Gujarat 576 25 975 313 9688 191 9809 278 9722 139 9861 Haryana 320 094 9906 094 9906 063 9938 281 9719 000 10000 Karnataka 576 000 10000 000 10000 000 10000 000 10000 000 10000 Maharashtra 672 030 9970 089 9911 074 9926 104 9896 074 9926 Odisha 480 000 10000 000 10000 000 10000 479 9521 021 9979 Rajasthan 574 1359 8641 854 9146 1045 8955 1045 8955 1045 8955 Sikkim 50 000 10000 200 9800 000 10000 000 10000 000 10000 Tamil Nadu 455 000 10000 000 10000 000 10000 000 10000 000 10000 UP 527 152 9848 209 9791 114 9886 285 9715 019 9981 Uttarakhand 90 3556 6444 3889 6111 5444 4556 3556 6444 889 9111 Total 5892 233 9767 229 9771 246 9754 304 9696 205 9795
Source GAPL Survey It is evident from the data that in most of the sample states beneficiaries did not face much of the difficulties related to the procedures quality prices delay in system installation etc 4222 After Sales Service The information on magnitude and quality of after sales services being provided by the suppliers has been summarized in table 61 On an average 91 percent of the beneficiaries across the sampled states reported that after sales services are being provided to them However about 34 percent beneficiaries from Bihar and 22 percent beneficiaries from Gujarat amp Maharashtra each informed that they did not receive the after sales services As for the timely and regular availability of after sales services is concerned about 87 percent beneficiaries reported that they receive the services at the required time
Impact Evaluation Study on ldquoNational Mission on Micro Irrigation (NMMI)rdquo
76
Table 61 Status Reported by Beneficiaries Regarding lsquoAfter Sales Servicesrsquo
State Total Beneficiary Provided by the vendor () If yes then ()
Yes No Timely Late Irregular AP 672 10000 000 8051 1949 000 Bihar 516 6570 3430 8378 1563 059 Chhattisgarh 384 10000 000 10000 000 000 Gujarat 576 7778 2222 8973 558 469 Haryana 320 10000 000 9156 438 406 Karnataka 576 9896 104 9045 920 035 Maharashtra 672 7768 2232 7854 1897 249 Odisha 480 9229 771 8871 880 248 Rajasthan 574 9582 418 9327 618 055 Sikkim 50 10000 000 9800 200 000 Tamil Nadu 455 9890 110 8813 1187 000 UP 527 9772 228 8854 1126 019 Uttarakhand 90 10000 000 2000 2222 5778 Total 5892 9085 915 8697 1083 220
Source GAPL Survey
The respondents were further enquired regarding the level of satisfaction with respect to after sale services and their responses are given in the Figure 8 It is well evident that on an average 87 percent of the beneficiaries across the entire 13 states received the after sales services to their complete satisfaction
During the course of field survey the respondents were asked whether this system supplier have given after sale service for the MI system installed at their farms The results regarding this issue have been summarized in above table It may be seen from the table that the farmers of Chhattisgarh AP Sikkim and Uttarakhand have reported that 100 percent after sale service was provided to them whereas two-third of the farmers reported regarding after sale service The farmers of the most of the states have got the benefit of this service
It is suggested that the implementing agencies should be more vigilant regarding warranty and after sales service of the system provided by the suppliers The question of releasing 10 percent of the cost of the system after one year subject to satisfactory performance of the system as certified by the beneficiary may be considered Maintenance manual in vernacular language should be made available to the beneficiaries at the time of installation of the system
Impact Evaluation Study on ldquoNational Mission on Micro Irrigation (NMMI)rdquo
77
Figure 8 Level of Satisfaction regarding lsquoAfter Sale Servicesrsquo
Source GAPL Survey
4223 Warranty As per the norms of NMMI the system suppliers are supposed to extend warranty to the beneficiaries regarding MI system installed at their farms In this regard the beneficiaries were asked regarding issue of warranty to them and their replies are summarized in table 62
Table 62 Status of Warranty for MI System ()
State Total
Beneficiary Warranty () If yes then () Yes No lt6 Months 1 Yr 1-2 Yr 2-3 Yr gt3 Yr
AP 672 10000 000 000 104 565 6533 2798 Bihar 516 3527 6473 000 165 275 5769 3791 Chhattisgarh 384 9948 052 000 000 052 890 9058 Gujarat 576 9948 052 000 017 035 070 9878 Haryana 320 10000 000 000 000 031 9969 000 Karnataka 576 10000 000 000 017 087 8906 990 Maharashtra 672 10000 000 000 238 491 3557 5714 Odisha 480 10000 000 000 021 167 2042 7771 Rajasthan 574 10000 000 000 087 3101 976 5836 Sikkim 50 10000 000 000 9000 000 800 200 Tamil Nadu 455 10000 000 000 022 044 7736 2198 UP 527 9981 019 000 019 646 8422 913 Uttarakhand 90 10000 000 667 3556 1667 4111 000 Source GAPL Survey
It may be seen from the above table that the beneficiaries of all the states under study have reported that they have got the warranty as per the requirement except for Bihar
Impact Evaluation Study on ldquoNational Mission on Micro Irrigation (NMMI)rdquo
78
were majority of the farmers reported that they did not get this benefit The farmers were further asked the duration of the warranty issue to them by the company Almost all the farmers of Chhattisgarh and Gujarat have reported that they received this facility for three years and the farmers of other state reported that they got warranty for their system for less than two years It is important that system suppliers should give two years warranty as per the guidelines of the scheme and it is proposed that in order to enforce this clause 5 percent subsidy may be released after the completion of warranty period 4224 Promotional Activities NMMI agencies are promoting the adoption of micro irrigation and its benefits to the growersrsquo awareness through various promotional tools such as publicity through newspapers radios TV and other sources which are summarized in the following table
Table 63 Awareness about Promotional Activities ()
State Total
Beneficiary
Publicity of the MI Scheme in local
language
Awareness of the dedicated website for MI Scheme in
the State
Awareness of the package of
practices being adopted for MI
Yes No Yes No Yes No AP 672 9866 134 9226 774 9940 060 Bihar 516 9128 872 000 10000 9729 271 Chhattisgarh 384 9948 052 9453 547 9844 208 Gujarat 576 7604 2396 7118 2882 8854 1146 Haryana 320 9719 281 6688 3313 9656 344 Karnataka 576 9965 035 2587 7413 9965 035 Maharashtra 672 9628 372 9003 997 9940 060 Odisha 480 9813 188 083 9917 9917 083 Rajasthan 574 9826 174 645 9355 9303 697 Sikkim 50 10000 000 200 9800 9800 200 Tamil Nadu 455 10000 000 9868 132 9956 044 UP 527 8235 1765 2694 7306 9127 873 Uttarakhand 90 9444 556 8000 2000 8444 1556 Total 5892 9411 589 5204 4796 9637 367 Source GAPL Survey
It may be seen from the above table that the farmers of the majority of the states that the implement agencies are promoting NMMI schemes in local language and almost 100 percent results were observed in Tamil Nadu Sikkim Odisha Rajasthan Chhattisgarh Karnataka and Maharashtra It is interesting to note that awareness of the dedicated website for MI scheme was limited
Impact Evaluation Study on ldquoNational Mission on Micro Irrigation (NMMI)rdquo
79
The beneficiaries were further asked whether they are aware of the package and practices being adopted for MI and the response were found to be very positive This reveals that the beneficiaries who have installed micro irrigation in their farm are aware of the package and practices to be followed for taking full advantage of the MI system supported cultivation
43 Observations of Field Staff on MI System In addition to farmersrsquo investigation the field survey team also visited the fields to observe the design and working of the system The field investigators have highlighted their observations regarding the condition of the MI system overall designing of the system installed and general conditions of the field The results regarding the observations of the field staffs are given in the following table below
Table 64 Observations of Surveyors regarding MI System Status at the Time of Field Visit
State
Overall Design
Drip Sprinkle MI System
match crop requirement
General Condition of the System
Flood Irrigation
along with MI System
Design () () System Condition ( `) () Good Satisfactory Bad Yes No Good Average Bad Yes No
AP 5982 4018 0 9777 223 5759 4226 015 6205 3795 Bihar 6298 3702 0 7791 2209 4942 5019 039 7558 2442 Chhattisgarh 7760 2240 0 9792 208 7188 2813 0 9844 156 Gujarat 6892 3038 069 9688 313 6094 3785 122 5278 4722 Haryana 9656 344 0 10000 0 9875 125 0 9781 219 Karnataka 5538 4462 0 9983 017 5417 4583 0 8090 1910 Maharashtra 6637 3363 0 9881 119 5536 4360 104 4970 5030 Odisha 4917 5083 0 9625 375 6500 3479 021 7813 2188 Rajasthan 8833 1167 0 9146 854 7648 2352 0 8153 1847 Sikkim 3600 6400 0 10000 0 6600 3400 0 6600 3400 Tamil Nadu 5582 4418 0 9912 088 4549 5451 0 8044 1956 UP 7381 2581 038 9791 209 5142 4801 057 8861 1139 Uttarakhand 9667 333 0 9222 778 8556 1444 0 9556 444 Total 6767 3223 010 9571 429 6124 3841 036 7463 2537
Source GAPL Survey It may be seen from the above table that in almost all the states under study the overall designing of the system was found to be satisfactory Majority of the field staff observed that system designs met the farmersrsquo requirements however in the state of Bihar only about 78 percent of the MI Systems were designed which could meet the crop requirements Remaining 22 percent of the systems have not been designed perfectly which could meet the water requirements of different crops It has also been observed by
Impact Evaluation Study on ldquoNational Mission on Micro Irrigation (NMMI)rdquo
80
the field investigators that some of the farmers have adopted innovative plant management techniques especially high density plantation in fruit crops and intercropping In almost all the states the sampled beneficiaries also revealed that no technical support guidance on agronomic practices are extended to the users by MI system suppliers as they generally tell the beneficiaries to take the help of extension agencies It was also observed that most of the beneficiary farmers have been using both the techniques of water application that is flood and the micro irrigation 44 Assessment of the System Design
Selection of MI Companies participating in NMMI at State level are based on the following parameters
a Manufacturing capacities of various equipment
b Financial strength of the company
c Dealer network
d Working experience in projects
e Availability of technical manpower
At the time of registration of the manufacturers it is mandatory that the quality of the system should be of BIS standards and the design must meet the requirements of the farmers in terms of its suitability to crops and field situations The conditions for providing after sale service and the warranty of the system are also laid at the time of registration To validate these parameters the beneficiaries were inquired regarding such issues and their responses are summarized in the table 65
The data indicate that the farmers in almost all the states reported that components of MI System met the BIS norms The average figure for all the sample states where system components were as per the BIS norms came out to be around 98 percent There is a need that variations reported in terms of not having BIS components as per NMMI guidelines may be brought to the notice of respective implementing agencies for further necessary action In more than 95 percent cases size of pumps was reported to be as per crop water amp plot size requirements except for the state of Bihar where around 18 percent respondents gave a negative reply
Impact Evaluation Study on ldquoNational Mission on Micro Irrigation (NMMI)rdquo
81
Table 65 Assessment of the System Design ()
State Total
Beneficiary
System components supplied are as per the
BIS
Pump size is proper to the field plot size wrt crop water requirements
MI system meets requirements
Design layout is as per project proposal
After sales service has been provided by the
MI system suppliers
MI systems found to be functional in
the field
Yes No Yes No Yes No Yes No Yes No Yes No AP 672 9970 030 9955 045 9955 045 9970 030 9940 060 9926 074 Bihar 516 9476 524 8217 1783 9845 155 8740 1047 6337 3663 6880 3120 Chhattisgarh 384 9974 026 10000 000 9974 026 10000 000 7396 2604 7552 2448 Gujarat 576 9722 278 9861 139 9635 365 9618 365 9520 480 9427 573 Haryana 320 10000 - 9938 063 9875 125 10000 000 9375 625 9281 719 Karnataka 576 10000 - 10000 000 10000 000 10000 000 10000 000 9549 451 Maharashtra 672 9732 268 9970 030 9985 015 9717 283 7842 2158 9821 179 Odisha 480 9896 104 9958 042 9958 042 9896 104 8646 1354 6667 3333 Rajasthan 574 9599 400 9425 575 9077 923 9408 610 9181 836 8798 1202 Sikkim 50 9600 400 10000 000 10000 000 10000 000 10000 000 9000 1000 Tamil Nadu 455 10000 - 10000 000 10000 000 10000 000 10000 000 9055 945 UP 527 9526 474 9962 038 9829 171 9943 057 9791 209 6603 1499 Uttarakhand 90 9778 222 8778 1222 7222 2778 9222 778 4889 5111 8222 1778
Source GAPL Survey
Impact Evaluation Study on ldquoNational Mission on Micro Irrigation (NMMI)rdquo
82
It was also observed by the field investigators that more than 15 percent reported that the MI system were non-functional in Bihar Chhattisgarh Odisha amp Uttarakhand due to crop season and fear of theft amp damage from rodents It was found that standard designs as regards spacing layout etc have been used in almost all the cases without any variation taking into account the shape size water quality soil conditions etc On an average 98 percent of the farmers reported that MI System installed in their fields meet their requirements however around 28 percent of the farmers in Uttarakhand responded that systems has not been installed as per their requirements Almost 100 percent of the beneficiaries reported that the system design layout is as per project proposal except farmers of Bihar where 10 percent farmers reported that system has not been laid out as per the design in the project proposal In the states of Bihar Chhattisgarh amp Uttarakhand the beneficiaries about 40-50 percent of the beneficiaries reported that they are not being provided after sales service 45 System Suppliers The global micro irrigation systems market is one of the fastest growing segments of agriculture sector The growth of this market is fueled by the government initiatives for adoption of micro irrigation systems in order to conserve water for optimum use The growth of micro irrigation systems is particularly higher in Asia Pacific and Africa due to the increased problems of water scarcity and farmer awareness towards increasing the crop yield with the help of micro irrigation systems India and China are expected to drive growth in the global micro-irrigation systems market which is seen reaching $48 billion by 2018 at a CAGR of 18 per cent from 2012 to 2018 Out of the total 695 million hectares (425 million ha sprinkler and 27 million ha drip) of cultivated area in India only 571 percent of the area is under drip and sprinkler irrigation This represents strong potential for the growth of micro irrigation systems in this region6 This low penetration offers growth opportunities in future All the benefits provided by the micro irrigation systems over flood irrigation coupled with the governmental initiatives to increase the MI system penetration are responsible for the MIS growth in India Also all such drivers are likely to help the market to grow in future as well
6As per Indian Taskforce Report of 2004
Impact Evaluation Study on ldquoNational Mission on Micro Irrigation (NMMI)rdquo
83
After initial scrutiny a committee consisting of experts examines the facilities at manufacturing site for verification of establishment details The list of the registered system suppliers is given below in table
Table 66 State Wise List of Registered MI System Suppliers
SNo State Name Suppliers Name
1 Andhra Pradesh
Ms EPC Industries Ltd (A Mahindra Group of Company) Ms Jain Irrigation Systems Ltd Ms Premier Irrigation Equipment Ltd Ms Rungta Irrigation Ltd Ms Greenfield Irrigation Ltd Ms Sudhakar Plastic Ltd Ms Nagarjuna Palma India Ltd Ms Kumar Enterprises Ms Nandi Plasticisers Ltd Ms Godavari Polymers Pvt Ltd Ms Haritha Irrigation Products Pvt Ltd Ms Netafem Irrigation India Pvt Ltd Ms Megha Agrotech Private Ltd Ms Satya Sai Polymers
2 Bihar
Ms Jain Irrigation Systems Ltd Ms EPC Industries Ltd (A Mahindra Group of Company) Ms Aaram Plastics Pvt Ltd Ms Sai Irrigation Ms Kishan Enterprise Ms Venkatesh Irrigation Ms Premier Irrigation Adritec Pvt Ltd Ms Netafim Irrigation India Pvt Ltd
3 Chhattisgarh Ms Netafim Irrigation India Pvt Ltd Ms Paras Drip Irrigation Ms Jain Irrigation Systems Ltd
4 Gujarat
Ms Dutron Polymers Ltd Ms Harvel Agua India Pvt Ltd Ms Jain Irrigation Systems Ltd Ms Netafim Irrigation India Pvt Ltd Ms Paragon Synthetics amp Polymers Ltd Ms Parixit Industries Limited Ms EPC Industries Ltd (A Mahindra Group of Company) Ms Plastro Plasson Industries (I) Ltd Ms Captain Irrigation System Ms Finolex Plasson Industries Pvt Ltd Ms Kothari Industries Ms Premier Irrigation Adritec Private Ltd Ms Transchem Agritech Ltd
5 Haryana Ms Jain Irrigation Systems Ltd Ms Netafim Irrigation India Pvt Ltd
Impact Evaluation Study on ldquoNational Mission on Micro Irrigation (NMMI)rdquo
84
Ms Balaji Agro-Systems Pvt Ltd Ms Ajay Industrial CorporationLtd Ms Apollo Pipes Ltd Ms Pioneer Plastics Industries Ltd Ms Rungta Irrigation Ltd Ms Nagarjuna fertilizers and chemicals limited Ms Harwel Agro India Limited Ms Finolex Plastic India Ltd Ms Vindhya Pipes amp plastics Ltd Ms Rungta Irrigation Ltd Ms Nirmal Polyfab Pvt Ltd
6 Karnataka
Ms Finolex Plasson Industries Ltd Ms Metro Drip Irrigation (P) Limited Ms EPC Industries Ltd (A Mahindra Group of Company) Ms Megha Agro Tech Pvt Ltd Ms Pioneer Plastic Industries Ltd Ms Jain Irrigation Systems Ltd Ms Agroplast Karnataka
7 Maharashtra
Ms Alphaplast Irrigation System Ms Aquaguard Plastics And Polymers Ms Datta Irrigation Company Ms Donga Watertech Ms Drip India Ms EPC Industries Ltd (A Mahindra Group of Company) Ms Finolex Plasson Industries Ltd Ms Godavari Polymers Ms Greengold Irrigation Ms Jain Irrigation Systems Ltd Ms Jaldhara Drip Irrigation Pvt Ltd Ms Kothari Agritech Pvt Ltd Ms Mohak Agro Industries Ms Nagarjuna fertilizers and chemicals limited Ms Neer Irrigation Ms Netafim Irrigation India Pvt Ltd Ms Nimbus Pipes Ltd Ms Paras Drip Irrigation
8 Odisha
Ms Jain irrigation system Ltd Ms Netafim Irrigation India Pvt Ltd Ms Premier Irrigation Adritec Pvt Ltd Ms Rungta Irrigation Ltd Ms Oasis Irrigation Equipment Co Ltd Ms Nagarjuna Fertilizers amp Chemicals Limited Ms Sujay Irrigation Pvt Ltd Ms Finolex Plasson Industries Pvt Ltd Ms Kirti Industries (India) Ltd Ms Relpol Plastic Products Ltd
9 Rajasthan Ms Netafim Irrigation India Pvt Ltd
Impact Evaluation Study on ldquoNational Mission on Micro Irrigation (NMMI)rdquo
85
Ms Khushboo Polymers Pvt Ltd Ms Shree Irrigation Systems P Ltd Ms Excellent Irrigation P Ltd Ms EPC Industries Ltd (A Mahindra Group of Company) Ms Purma Plast Ltd Ms Jamna Industries Ms Dinesh Irrigation P Ltd Ms Aaram Plastic Pvt Ltd Ms Jain irrigation system Ltd
10 Sikkim Ms Jain Irrigation Systems Ltd Ms Netafim Irrigation India Pvt Ltd
11 Tamil Nadu
Ms Agro Plast Ms AGS Irrigation (P) Ltd Ms Alpha Irritech Pvt Ltd Ms EPC Industries Ltd (A Mahindra Group of Company) Ms Elgi Ultra Industries Ltd Ms Finolex Plasson Industries Ltd Ms Jain Irrigation Systems Ltd Ms Krishi Irrigation Pvt Ltd Ms Mega Agrotech Pvt Ltd Ms Netafim Irrigation India Pvt Ltd Ms Parixit Industries Limited Ms Pragati Irrigation Systems Pvt Ltd Ms Premier Irrigation Adritec Pvt Ltd Ms Rungta Irrigation Ltd Ms Sujay Irrigation Private Limited
12 Uttar Pradesh
Ms Jain irrigation system Ltd Ms Nagarjuna fertilizers and chemicals limited Ms Sterling Irrigation Ltd Ms EPC Industries Ltd (A Mahindra Group of Company) Ms Netafim Irrigation India Pvt Ltd
13 Uttarakhand
Ms Jain Irrigation Systems Ltd Ms Netafim Irrigation India Pvt Ltd Ms Harvel Agua India Pvt Ltd Ms Pioneer Plastics Industries Ltd Ms Premier Irrigation Adritec Private Ltd
The success of the micro irrigation system is solely dependent on the quality of material used and after sale service Therefore the NMMI guidelines have given due consideration to this very component and have made it mandatory to register the system manufacturers and the same is done by State Micro Irrigation Committee (SMIC) Only those manufacturing companies which insure the quality of the product as per BIS and can promptly provide after sale service are registered for three years The registered company need to declare the technical details of the components proposed to be supplied and which would be verified by the technical committee Further frequent surveillance by
Impact Evaluation Study on ldquoNational Mission on Micro Irrigation (NMMI)rdquo
86
inspection team comprising from NCPAH PFDC CIPET Irrigation Association of India is necessary The Manufacturers have to insure the network for providing after sale services in their area of operation They have to further provide operation and maintenance manuals in vernacular language at the time of installation They should also have the facilities to provide technical guidance on agronomic practices system maintenance schedules spare parts warrantee etc Free after sale service shall be provided by manufacture or authorized distributors for at least three years It has been observed almost all the states that the material supplied to the farmersbeneficiaries is of BIS and also gives warranty for three years However during the course of the investigation it was reported by beneficiaries that the after sale service is provided only in the initial phase and simple instructions are given for using the system No technical support guidance on agronomic practices are extended to the users as they generally tell the beneficiaries to take the help of extension agencies The distributors dealers operating in various sampled states reported that they get the subsidy within 15-20 days of applying but sometime they face the delay in release of subsidy due to non-availability of funds under scheme at district state level Further they also reported that due to delay in trial run inspection also leads to delay in release of the subsidy It is suggested that it would be better if subsidy is directly passed on to the beneficiaries to expedite the release disbursement of subsidy under the scheme
Impact Evaluation Study on ldquoNational Mission on Micro Irrigation (NMMI)rdquo
87
5 Impact Evaluation A number of studies have been conducted to assess the impact of micro irrigation particularly that of drip which have shown encouraging results of farm variables It has also helped in bringing crop diversification from rain fed crops to horticulture crops and have also brought cultivable wastelands under high value such as horticulture crops reduction in cost of production higher yield etc The impact of the scheme on various parameters detailed below has been evaluated to arrive at conclusion about achievement of the scheme objectives as well as general benefit to the agricultural economy of the country Some sequences are in following paragraphs
1 Area Expansion under MI and additional area irrigated by installing MI in place of conventional irrigation and waste marginal land development with the same amount of water
2 Savings in labor fertilizers and electricity thereby reducing cost of cultivation 3 Study of productivity enhancement for various crops 4 Whether the adoption of MI has given rise to crop diversification adoption of high
value crops etc 5 Innovative crop management techniques facilitated through adoption of MI which
are canopy management high density plantation inter cropping etc 6 Contribution of MI towards National food security
51 Crop Diversification
Crop diversification in India is generally viewed as a shift from traditionally grown crops to more remunerative crops With the advent of modern agricultural technology especially during the period of the Green Revolution in the late sixties and early seventies there is a continuous surge for diversified agriculture in terms of crops primarily on economic considerations
Crop diversification is intended to give a wider choice in the production of a variety of crops in a given area so as to expand production related activities on various crops and also to minimize risk The survey has measured impact of installation of MI systems on crop diversification The result of the beneficiariesrsquo responses is summarised in the following table
Impact Evaluation Study on ldquoNational Mission on Micro Irrigation (NMMI)rdquo
88
Table 67 Impact on Crop Diversification and Usage of Marginal and Degraded Land by Beneficiaryrsquos data
SNo State Total
cultivable area (Ha)
Horticulture Crop Area (Ha) Field crop Area (Ha) Marginal degraded Land
( Waste Land) (Ha)
Area Before
MI
Area After MI
Change in Area
Area Before
MI
Area After MI
Change in Area
Area Area after MI
Change in area Before
MI 1 AP 149122 39388 88038 12351 68932 59550 -1361 16953 1534 -9095
2 Bihar 140742 37989 54002 4215 95641 86619 -943 202 121 -4000
3 Chhattisgarh 58406 8719 33495 28415 46502 24211 -4794 1016 700 -3108
4 Gujarat 167639 32040 44131 3773 122983 120072 -237 8373 3436 -5897
5 Haryana 135990 19628 64972 23102 133613 71018 -4685 769 000 -10000
6 Karnataka 111046 68571 85818 2515 34908 23447 -3283 2570 1781 -3071
7 Maharashtra 133667 17384 43304 14910 96225 82488 -1428 22659 7875 -6524
8 Odisha 141309 58179 92107 5832 76276 44435 -4174 7657 4767 -3774
9 Rajasthan 162365 65643 102036 5544 83881 52539 -3736 16410 7790 -5253
10 Sikkim 7327 6149 6639 797 1020 587 -4246 101 101 000
11 Tamil Nadu 76488 44887 53142 1839 32862 23306 -2908 299 040 -8649
12 UP 164662 23078 79251 24341 134278 85249 -3651 2942 162 -9450
13 Uttarakhand 32295 9075 9278 223 18707 18727 011 4573 4290 -619 Source GAPL Survey
Impact Evaluation Study on ldquoNational Mission on Micro Irrigation (NMMI)rdquo
89
It may be observed from above table that the farmers of all the states have shown increase in area under horticulture crops after the adoption of the system The highest increase has been observed in Haryana followed by Chhattisgarh UP Maharashtra and AP whereas the lowest in case of Uttarakhand and Sikkim which may be because of the reason that both the states have proportionately higher area under horticulture crops 52 Area Expansion under Micro Irrigation The GoI MI scheme has succeeded in bringing around 3812 lakh ha under micro irrigation with total subsidy amounting to Rs 546801 crores since the launch of the scheme in 2005-06 in India This represents about 257 of the total cultivated area in the country and 569 of the total irrigated area of the country The area expansion under MI system in the country has grown at 36 23 and 18 respectively for last three years (as per official records) Eventually the growth trend is quite impressive yet overall proportion of land under MI is quite low and as such more efforts such as creating awareness among the farmers through electronic and print media exhibition fares PRIs etc need to be initiated to bring the significant area under MI 53 Increase in Irrigated Area due to Water Saving Drip irrigation is being practiced in the different parts of the country since 80s to improve the water use efficiency water savings and productivity enhancement Through the saving of water due to adoption of MI technologies it is possible for beneficiaries to increase the area under cultivation by way of efficient use of water In order to understand that how much additional area has been brought under irrigation the irrigated area before and after installation of MI was taken into consideration (Table 68) In order to have better comprehension of area increased due to MI the percent increase in different schemes was given a graphical shape (Figure 9) After adoption of MI system sampled beneficiaries were able to bring their irrigated area under irrigation from same source of water which otherwise was not being utilized for cultivation due to limited availability of water The Irrigated area within the 5892 sampled beneficiaries of the 13 states before adoption of MI system was found to be 1332086 ha which 1444147 became ha after adoption of MI system It is therefore concluded that total percentage increase in irrigated area with the sampled beneficiaries in 13 states after adoption of MI system was noted to be 841
Impact Evaluation Study on ldquoNational Mission on Micro Irrigation (NMMI)rdquo
90
Table 68 Increase reported by Beneficiaries in Irrigated Area (ha) after Installation of MI System
State Total Irrigated Area before
installation of Micro Irrigation system (ha)
Total Irrigated Area after installation of Micro Irrigation
system (ha)
increase in irrigated Area
AP 101343 113941 1243 Bihar 229656 236802 311 Chhattisgarh 49474 57196 1561 Gujarat 135891 155007 1407 Haryana 123368 136263 1045 Karnataka 103805 106492 259 Maharashtra 102551 125400 2228 Odisha 124189 138310 1137 Rajasthan 100577 107850 723 Sikkim 6040 6081 067 Tamil Nadu 70956 74116 445 Uttar Pradesh 158370 160415 129 Uttarakhand 25862 26275 160 Grand Total 1332086 1444147 841
Source GAPL Survey
Figure 9 Increase in Irrigated Area () among Beneficiaries after Adoption of MI
54 Development of marginal and wasteland by beneficiaries
Degraded land which can be brought under vegetative cover with reasonable effort and which is currently under-utilized and land which is deteriorating for lack of appropriate water and soil management or on account of natural causes The total cultivable waste land in the country at present is about 1283 million hectares Based on the feedback received from the sampled beneficiaries it was observed that during survey in the sampled states beneficiaries sampled farmers were able to convert
Impact Evaluation Study on ldquoNational Mission on Micro Irrigation (NMMI)rdquo
91
their marginal amp rainfed land into cultivable land due to efficient use of water resources available with them In 13 surveyed states 5892 sampled farmers holding 1481058 hectares of land reveals that around 84540 ha of land was not being used for cultivation as they were either waste or degraded land Farmers reported that after adoption of MI system they were able to bring around 51943 ha of land under cultivation The data reveals that adoption of MI system has helped the sampled beneficiaries in bringing around 371 of land under cultivation Maximum and minimum area conversion with the beneficiaries was noted in Andhra Pradesh and Sikkim respectively
Table 69 Marginal Degraded Land brought under Cultivation after Installation of MI System by Beneficiaries
States Total no of
Sampled Beneficiaries
Total area of Sampled
beneficiaries (Ha)
No of sampled farmer with
wastedegraded
Area under wastedegraded
land before NMMI (ha)
Converted area after
adoption of NMMI (ha)
AP 672 149122 242 16953 15419 Bihar 516 140742 2 202 081 Chhattisgarh 384 58406 8 1016 318 Gujarat 576 167639 57 8374 4939 Haryana 320 13599 2 769 769 Karnataka 576 111046 11 2572 789 Maharashtra 672 133667 126 22666 14791 Odisha 480 141309 70 7660 2893 Rajasthan 574 162365 39 16410 8620 Sikkim 50 7327 4 101 000 UP 527 76488 32 2942 2780 Uttarakhand 90 164662 46 4575 284 Tamil Nadu 455 32295 10 300 260 Total 5892 1481058 649 84540 51943
Source GAPL Survey
55 Dripper spacing The dripper spacing is important as it accommodates higher plant population resulting more number of fruits which increases total yield and net returns It is also a factor to commensurate water requirement and root zone of the plant However wide dripper spacing saves more water total irrigation time minimized the diseases and weeds incidence as compared to closer dripper spacing in each years The recommended spacing for different crops under Micro Irrigation system has been presented in the following tables below During the course of field survey the beneficiary farmers were asked to specify the spacing of the crops they are following The responses of the farmers are given in the table 70 amp 71 for different crops in sampled states
Impact Evaluation Study on ldquoNational Mission on Micro Irrigation (NMMI)rdquo
92
Table 70 Spacing followed by Sampled Beneficiaries for Fruit Crops (m)
SNo State Fruits
Banana Lemon Mango Papaya Watermelon Orange Litchi Guava Pomegranate Grapes Coconut Cashewnut Aonla 1 AP 15 15 55 99 1818 66 2 Bihar 1010 55 3 Chhattisgarh 1818 1506 4 Gujarat 1818 1818 5 Haryana 0404 1010 88 6 Karnataka 22 88 22 44 315 7 Maharashtra 1515 1010 33 88 77 8 Odisha 22 66 55 22 7575 77 9 Rajasthan 66 66 5555 66 55
10 Sikkim 1515 55 33 11 Tamil Nadu 22 55 66 66 55 12 UP 1515 66 1010 1010 1010 13 Uttarakhand 88 33
Source GAPL Survey
Impact Evaluation Study on ldquoNational Mission on Micro Irrigation (NMMI)rdquo
93
Table 71 Spacing followed by Sampled Beneficiaries for Vegetables Flowers and Other Crops (m)
SNo State Vegetables Flowers and other important Crops
Brinjal Okra Tomato Potato Cucumber Onion Cabbage Cauliflower Chili Cotton Sugarcane Groundnut Lilli Rose 1 AP 0606 0404 1204 1212 1205 1515 11 2 Bihar 21 055022 1509 3 Chhattisgarh 1503 0502 1503 4 Gujarat 1404 06015 07015 1404 1505 07005 5 Haryana 105 102 0501 0606 103 0505 6 Karnataka 1206 1206 1806 0609 7 Maharashtra 0606 1204 1204 1503 15075 1205 8 Odisha 06045 045045 0603 045030 0603 9 Rajasthan 1030 1020 025025 055055 066066 1030
10 Sikkim 108 66 108 11 Tamil Nadu 0606 06045 1503 1212 24075 12 UP 06075 0604 1204 07503 1509 13 Uttarakhand
Source GAPL Survey
It may be seen that crop spacing is more or less as per recommendations In few cases the spacing is even less It is clearly indicates that farmers adopting MI system also adopt proper practices
Impact Evaluation Study on ldquoNational Mission on Micro Irrigation (NMMI)rdquo
94
56 Reduction in Cost of Irrigation The data cited in table 73 indicate the cost of irrigation incurred by beneficiary farmers before and after installation of MI system It is well evident that Irrigation cost was reduced by 20-50 percent with the use of MI system The states of Gujarat Haryana and Rajasthan have witnessed more than 40 cost reduction The reduction in cost resulted primarily because of savings in the man power and electricity consumption
Table 72 Reduction in Cost of Irrigation with MI system
State Cost of Irrigation before MI ( Rs ha)
Cost of irrigation after MI (Rs ha) decrease in cost
AP 7200 5721 2050 Bihar 8734 6234 2860 Chhattisgarh 5602 3557 3650 Gujarat 11046 5599 4930 Haryana 7346 3749 4900 Karnataka 8215 6182 2470 Maharashtra 11204 7736 3100 Odisha 8895 6541 2650 Rajasthan 7193 3925 4540 Sikkim 3932 2836 2790 Tamil Nadu 6368 4792 2480 UP 6657 4819 2760 Uttarakhand 10693 8203 2330
Source GAPL Survey
57 Electricity Consumption The figures on consumption of electricity before and after installation of MI system by the beneficiary farmers have been tabulated in Table 73 The data clearly indicate that savings of electricity across the sampled states varied from 151 to 494 percent average being 306 percent It is pertinent to mention here that in the states of Bihar and Chhattisgarh almost all the beneficiaries have been using diesel kerosene to operate their pump sets For these two states reduction in consumption of electricity has been computed considering the reduction in use of diesel kerosene The variations in the extent of electricity savings among different states may be attributed to the type of system installed besides depth of water and area brought under MI
Impact Evaluation Study on ldquoNational Mission on Micro Irrigation (NMMI)rdquo
95
Table 73 Reduction in Electricity Consumption
State Electricity used
before MI( hrday) Electricity used
after MI( hrday) saving of electricity
AP 679 528 2233 Bihar 5000 3000 4000 Chhattisgarh 4500 2800 3778 Gujarat 678 407 3992 Haryana 835 423 4939 Karnataka 590 432 2675 Maharashtra 703 468 3348 Odisha 798 619 2246 Rajasthan 864 501 4208 Sikkim 262 170 3511 Tamil Nadu 578 491 1510 UP 225 184 1843 Uttarakhand 301 211 2989 Total 537 373 3065
Source GAPL Survey Diesel Kerosene consumed (ltrs day) for Bihar and Chhattisgarh
58 Economy in Fertilizer Use The information on use of fertilizers before and after installation of MI system was sought from the beneficiary farmers the obtained data have been enumerated in Table 74 In order to comprehend the information on fertilizers saving across the 13 states the data on fertilizer saving was given a graphical presentation (Figure 10) It is well evident that MI system resulted in significant savings of fertilizers The extent of fertilizer saving in the states under study varied from 759 to 4383 percent with an average savings of about 28 percent The obtained results are in-conformity with the various research findings wherein fertilizer savings through drip fertigation have been reported in the range of 30-35 percent (Raina et al 2013)The exceptionally low fertilizer savings observed in Bihar are attributed to the fact that more than 90 percent area in Bihar is under sprinkler irrigation
Impact Evaluation Study on ldquoNational Mission on Micro Irrigation (NMMI)rdquo
96
Table 74 Reduction in Fertilizer Consumption
States Fertilizer Consumption(
Kgha) Before MI
Fertilizer Consumption( Kgha)
after MI
saving of Fertilizer
AP 24152 17185 2885 Bihar 18198 16816 759 Chhattisgarh 28872 17219 4036 Gujarat 15893 9103 4273 Haryana 20297 12682 3752 Karnataka 21549 15471 2821 Maharashtra 31005 23887 2296 Odisha 27240 21547 2090 Rajasthan 29523 16582 4383 Sikkim 15860 9380 4086 Tamil Nadu 21147 15421 2708 UP 24220 18704 2277 Uttarakhand 10620 8712 1796 Total 23526 16826 2848
Source GAPL Survey
Figure 10 Reduction in Fertilizer Consumption ()
59 Increase in Crop Productivity
Micro irrigation has generated benefits to the farmers in terms of enhancement of the productivity The average productivity Fruit crops have increased about 423 percent (Table 75) with maximum enhancement in the state of Gujarat followed by Rajasthan which was followed by Chhattisgarh In fact the productivity enhancement in these states was comparable
Impact Evaluation Study on ldquoNational Mission on Micro Irrigation (NMMI)rdquo
97
Table 75 Productivity Enhancement of Fruit Crops (MTha)
State Before MI After MI increase AP 732 874 1937 Bihar 273 315 1518 Chhattisgarh 012 020 6200 Gujarat 515 893 7348 Haryana 586 810 3825 Karnataka 4532 5810 2820 Maharashtra 2166 3232 4918 Odisha 2741 3699 3497 Rajasthan 538 917 7056 Sikkim 543 580 682 Tamil Nadu 2473 2902 1736 UP 710 953 3414 Uttarakhand 585 775 3242 Total 1352 1925 4234
Source GAPL Survey The average productivity of the vegetables has increased by 528 after using the MI irrigation system (Table 76) The states of Chhattisgarh Gujarat and Sikkim registered tremendous increase in vegetable productivity after using micro irrigation system
Table 76 Productivity Enhancement of Vegetable Crops (MTha)
State Before MI After MI increase
AP 991 1329 3409 Bihar 1122 1476 3162 Chhattisgarh 2779 5526 9885 Gujarat 709 1196 6859 Haryana 2066 2523 2213 Karnataka 1109 1430 2900 Maharashtra 348 448 2876 Odisha 1088 1395 2819 Rajasthan 607 846 3942 Sikkim 1894 3157 6662 Tamil Nadu 1137 1437 2640 UP 825 1079 3071 Uttarakhand 317 475 4965 Total 1140 1741 5276
Source GAPL Survey
The data on crop wise productivity enhancement in different states has also been enumerated and explained in the next section
Impact Evaluation Study on ldquoNational Mission on Micro Irrigation (NMMI)rdquo
98
510 Reduction in these Cost of Inputs of Irrigation amp Productivity Enhancement Crop-wise
MI technology is introduced mainly to increase the water use efficiency in agriculture and also provides many other socio-economic benefits in the society The use of MI has led to significant reduction cost of irrigation electricity saving fertilizer saving amp productivity enhancement As per the data collected from the sample beneficiaries significant increase has been observed in terms of reduction in different costs for different crops and enhancing the productivity The same trend is observed in fruits vegetables flowers and other non-horticulture crops The detailed state and crop wise impact percentages of the reduction in irrigation cost electricity savings fertilizer saving and increase in productivity of the sampled beneficiaries are as follows
Table 77 Crop wise Details of Reduction in Cost - Fruits
State Fruit Reduction in Irrigation Cost ( )
Electricity saved ( )
Fertilizer saved ( )
Productivity enhancement ( )
AP
Banana 2987 3660 2833 2089 Guava 1087 2830 2651 3521 Lemon 2839 3339 2676 1708 Mango 2338 3301 3157 3051 Orange 3160 3571 3233 3478
Bihar
Guava 2308 1827 2000 1250 Kadam 1228 2250 1385 1563 Mango 1731 1450 1167 1211 Litchi 2857 1180 1429 1077
Chhattisgarh Banana 2500 2460 1667 5000 Papaya 3889 2850 3333 8750
Gujarat
Banana 4490 4712 3954 4344 Papaya 4692 4000 4565 6235 Pomegranate 4565 2895 4407 4000 Watermelon 5682 5750 4068 5000
Haryana Kinnow 4847 4005 3945 2500 Strawberry 4196 3837 4110 2000 Watermelon 3421 4565 4150 5000
Karnataka
Banana 2769 2030 2743 3380 Mango 2576 3472 2636 2673 Papaya 2836 3622 2907 2441 Pomegranate 2250 2363 3038 3520 Fig 1250 3333 2222 2500 Areca nut 2918 3276 3085 2205
Maharashtra
Banana 3070 3069 3122 5215 Cashew nut 3117 1940 4247 4000 Grapes 3016 2069 2047 7143 Mango 3553 2815 2895 1672 Mousami 4375 2000 2000 8750 Orange 4689 3059 2766 3000 Sweet Orange 3553 3137 2198 3627 Areca nut 1833 3500 5000 3333
Impact Evaluation Study on ldquoNational Mission on Micro Irrigation (NMMI)rdquo
99
Odisha
Aonla 3529 3889 2500 3333 Banana 3577 3391 3124 2447 Cashew nut 2713 3131 3120 3062 Guava 3481 3692 3216 4430 Mango 3576 3551 3027 3039 Papaya 2806 2903 3532 1768 Chikoo 667 2500 4000 1111
Rajasthan
Bel 5714 5000 5714 1550 Guava 1965 4746 4077 5000 Kinnow 5869 4982 4904 4648 Lemon 3052 4519 3560 4118 Mango 3053 4839 3282 6000 Orange 2565 4187 3535 4229
Sikkim Banana 3750 4000 3000 000 Orange 3933 2766 4087 4000 Litchi 5000 2000 4000 000
Tamil Nadu
Aonla 2313 3298 2817 4032 Banana 3684 3495 2607 2990 Cashew nut 3579 3333 2222 3333 Coconut 2882 3511 2714 3333 Mango 2410 3418 2926 2697 Tapioca 3258 3422 2429 3327
UP
Banana 2961 6000 2746 4792 Guava 2555 3636 2350 2147 Mango 2463 3957 2415 3373 Litchi 2753 4167 2717 3393
Uttarakhand
Guava 2167 NA 1638 NA Mango 2281 3636 1633 NA Peach 2293 NA 2855 NA Litchi 2892 3333 2044 NA
Source GAPL Survey
It may be seen from the above table that among the fruit crops highest reduction in irrigation cost was observed in Kinnow crop in Rajasthan amp lowest in guava in AP whereas maximum saving in electricity was observed in Haryana and saving in fertilizer in a Bel in Rajasthan and further highest increase in productivity is witnessed in Papaya in Chhattisgarh
Table 78 Crop wise Details of Reduction in Cost - Vegetables
State Vegetables Name
Reduction in Irrigation Cost ( )
Electricity Saved ( )
Fertilizer saved ( )
Productivity enhancement ( )
AP
Brinjal 2470 3450 2932 1950 Chilli 2104 3213 2662 2580 Okra 1545 3079 3337 2654 Tomato 2100 3458 3280 2837
Bihar
Brinjal 1931 2780 1073 1522 Cauliflower 1850 3244 1415 760 Okra 2188 2250 1283 1671 Potato 2282 4655 1006 1105
Chhattisgarh Cauliflower 3438 3480 4065 7377 Tomato 4420 4750 4580 11454
Impact Evaluation Study on ldquoNational Mission on Micro Irrigation (NMMI)rdquo
100
Bitter Gourd 4934 3690 4746 11081 Okra 4365 4250 4484 8642
Gujarat
Chilli 4532 4341 4393 4708 Fennel 3000 5000 5625 2000 Onion 4983 4792 4094 2435 Potato 4523 4547 3602 3504 Tomato 5102 4620 4245 7962
Haryana
Chilli 4364 4470 3264 5000 Cucumber 5494 6081 3989 4122 Potato 4406 5809 3321 1651 Tomato 4833 5161 3556 5632
Karnataka Chilli 3088 3021 2839 3187 Ginger 2941 3651 2906 2450 Tomato 2275 3218 2971 1870
Maharashtra Brinjal 3041 3870 2604 2195 Chilli 2702 3268 3672 3310 Tomato 2763 3641 2940 3184
Odisha
Bitter Gourd 3629 3660 3024 2826 Bottle Gourd 4040 3435 2700 2916 Brinjal 2979 3164 3084 2804 Cauliflower 3141 3291 2980 2542 Okra 3399 3302 2982 3216 Tomato 2978 3179 3225 3534
Rajasthan
Brinjal 6452 2500 5429 NA Carrot 5718 2965 4789 2097 Onion 3713 3840 3992 3117 Tomato 2950 4526 3520 4619
Sikkim Brinjal 2200 4118 3818 6949 Cauliflower 4500 2000 4250 769 Tomato 3542 3729 4161 6889
Tamil Nadu Brinjal 2930 3264 2973 3407 Chilli 3049 3633 2902 2551 Tomato 2545 3495 3167 2176
UP
Brinjal 2336 4032 2153 2481 Chilli 2473 5000 2052 3130 Peas 2155 3752 3005 3254 Potato 2897 4412 2591 2802 Tomato 2521 3721 2420 2822
Uttarakhand Peas 2572 NA 1672 NA Tomato NA 3333 2018 NA
Source GAPL Survey It may be seen from the above table that among the vegetable crops highest reduction in irrigation cost was observed in brinjal in Rajasthan amp lowest in lady finger in AP whereas maximum saving in electricity was observed in Haryana for cucumber amp potato and saving in fertilizer for fennel in Gujarat and further highest increase in productivity is witnessed in Chhattisgarh for tomato
Impact Evaluation Study on ldquoNational Mission on Micro Irrigation (NMMI)rdquo
101
Table 79 Crop wise Details of Reduction in Cost - Flowers
State Crop Reduction in
Irrigation Cost ( )
Electricity saved( )
Fertilizer saved ( )
Productivity enhancement
( ) AP Lilli 3333 3750 4182 4560 Bihar Marigold 4643 3100 3333 5000
Gujarat Jasmine 5000 6250 3333 3333 Marigold 2000 7500 5556 4200
Haryana Gerbera 6725 8636 3250 3670 Rose 4316 5938 5676 4690
Maharashtra Marigold 3448 3571 2761 4250 Rose 1045 2143 4375 4690
Odisha Rajanigandha 4667 5000 3000 2400 Rajasthan Rose 3611 5000 2970 2500 UP Marigold 2000 3400 2000 2750 Source GAPL Survey It may be seen from the above table that among the flowers highest reduction in irrigation cost amp electricity saving was observed in Gerbera in Haryana whereas saving in fertilizer for rose in Haryana and highest increase in productivity was witnessed in Bihar for marigold
Table 80 Crop wise Details of Reduction in Cost - Non-horticulture Crops
State Non Horticulture Crops
Reduction in Irrigation Cost
( )
Electricity saved( )
Fertilizer saved ( )
Productivity enhancement
( )
AP
Cotton 2820 3524 2354 1770 Ground nut 2924 3828 2136 2274 Maize 1579 3067 3096 2199 Sugarcane 2285 3325 3130 1853
Bihar Maize 1874 1575 1126 1484 Sugarcane 2096 2250 1553 050 Wheat 1721 1860 998 852
Chhattisgarh Gram 2799 1450 2830 2050 Soybean 3978 1635 4356 1805 Wheat 2313 2145 2017 4443
Gujarat
Caster 4617 5172 3757 3580 Cotton 4540 4659 4396 3719 Ground nut 4871 4684 4027 3496 Sugarcane 4875 4865 4216 21611 Wheat 4082 4015 3681 3025
Haryana Cotton 4435 4439 3093 101 Mustard 4167 4286 3611 000 Wheat 4935 4497 3858 212
Karnataka Sugarcane 2771 2568 2723 1264
Maharashtra
Cotton 3370 2928 2991 3475 Ground nut 3355 3333 3312 2587 Soybean 3528 2280 3085 4080 Sugarcane 3712 3815 2848 3877
Odisha Moong 2178 2869 3589 3689 Sugarcane 2624 3309 3201 4849
Rajasthan Arandi 3684 4000 3916 4313
Impact Evaluation Study on ldquoNational Mission on Micro Irrigation (NMMI)rdquo
102
Cotton 5118 3750 4708 2765 Guwar 5605 4375 5250 4889 Mustard 3283 4373 4313 3433 Wheat 3025 3666 3923 3631
Sikkim Mustard 4286 2000 3600 000 Wheat 3333 2759 3600 556
Tamil Nadu Sugarcane 2879 3427 2873 990
UP Maize 2732 4662 2334 470 Sugarcane 2316 2200 3050 2877 Wheat 2538 3776 2484 4116
Uttarakhand Sugarcane 2562 2385 2088 2950 Source GAPL Survey It may be seen from the table 77 that among the non-horticulture crops also reduction in irrigation cost saving in electricity saving in fertilizer and increase in productivity was witnessed From the above it may be concluded that with the adoption of micro irrigation technologies significant increase has been observed in productivity enhancement in all the states for all the major crops being cultivated under the scheme Further reduction in input factors such as irrigation cost saving in electricity amp saving in fertilizer was also observed 511 Introduction of New Crops During the course of the study and field survey it was observed that the beneficiaries have switched to new crops mostly high value as enlisted in table 82 below with the adoption of micro irrigation technology In the fruit crops high density plantations having drip irrigation system have been adopted by some of the farmers
Table 81 Crops Adopted after Installation of MI System
Fruits Aonla Areca nut Banana Cashew nut Sapota Coconut Grapes Guava Litchi Mango Mosambi Orange Papaya Pineapple Pomegranate Strawberry Sweet orange watermelon
Vegetables Broccoli Bitter gourd Bottle gourd Brinjal Cabbage Capsicum Cauliflower Cucumber Chilli Ginger Okra Onion Spinach Papaya Potato Radish Tomato
Floricultural Marigold Tuberose (Rajnigandha) Rose Lilly
Other crop Cotton Groundnut Sunflower Turmeric Arhar Black gram Maize Moong Mustard Pulses Soyabean Sugarcane Urad Wheat
Impact Evaluation Study on ldquoNational Mission on Micro Irrigation (NMMI)rdquo
103
Table 82 Extent of Adoption of New Crops after Installation of MI System
State Total
Beneficiary No of Farmers
Introduced New Crops Farmers
Introduced New Crop () AP 672 278 4137 Bihar 516 8 155 Chhattisgarh 384 206 5365 Gujarat 576 67 1163 Haryana 320 315 9844 Karnataka 576 154 2674 Maharashtra 672 126 1875 Odisha 480 221 4604 Rajasthan 574 3 052 Sikkim 50 26 5200 Tamil Nadu 455 53 1165 UP 527 330 6262 Uttarakhand 90 2 222 Total 5892 1789 3036
Figure 11 Extent of Adoption of New Crops by Beneficiaries ()
It may be seen from the above table that almost all the beneficiaries of Haryana have shifted towards new crops with the adoption MI system followed by UP Sikkim Chhattisgarh Odisha and AP The lowest response was observed in Rajasthan Bihar and Uttarakhand which is due to the fact that MI systems in majority of the cases have been installed to irrigate horticultural crops
It is therefore recommended that special drives be taken to motivate the farmers in the state of Bihar Uttarakhand amp Rajasthan for crop diversification to accrue the full advantage of MI system
Impact Evaluation Study on ldquoNational Mission on Micro Irrigation (NMMI)rdquo
104
512 Increase in Farmerrsquos Income
The overall benefits accrued from the micro irrigation system are reflected in the income enhancement of the farmers All the surveyed states reported increase in farmerrsquos income by 20- 68 with an average increase of 485 The maximum increase in income has been reported in Gujarat followed by Chhattisgarh
Table 83 Increase in Farmerrsquos Income
State Income ( Rs ha)
before MI Income ( Rs ha)
after MI
Increase
in Income AP 60273 79929 3261 Bihar 31132 41333 3277 Chhattisgarh 62785 105059 6733 Gujarat 55703 93593 6802 Haryana 73917 117532 5901 Karnataka 82303 105061 2765 Maharashtra 68459 99786 4576 Odisha 61846 85660 3850 Rajasthan 125753 191731 5247 Sikkim 81510 111891 3727 Tamil Nadu 74100 98800 3333 UP 58495 87391 4940 Uttarakhand 140098 168234 2008 Total 976374 1386001 4195
Source GAPL Survey
Figure 12 Increase in the Income of Beneficiaries ()
Impact Evaluation Study on ldquoNational Mission on Micro Irrigation (NMMI)rdquo
105
513 Benefit-Cost Ratio The BC ratio has been based on the estimates of incremental return income from MI system that is taken into account the increase in individual farmerrsquos income and MI system cost and crop wise average increase in income and average MI cost for each state were worked out from the same MI system cost has been amortized equally for 10 years considering the economic life of the system for the same period The income enhancement of the beneficiary farmers after installation of the MI system has been attributed to MI system The Benefit-cost analysis was carried out for important crops in all the 13 states under study on the basis of data collected from sampled beneficiaries This ratio gives the estimates of returns on the investment made in MI system Performance in term of BC ratio varies from state to state even for the same crop due to varied reasons like agro-climatic conditions agronomic practices soil productivity system cost marketing of produce etc the BC ratio of installing micro irrigation system is above one across the states and across the crops which signifies the importance of MI system in net income enhancement of the farmers The state wise BC ratio of installing MI system for different crops is given in the table for important fruits vegetables amp flowers grown in the states under study
Impact Evaluation Study on ldquoNational Mission on Micro Irrigation (NMMI)rdquo
106
Table 84 Benefit Cost Ratio of MI System for Important Fruit Crops
Fruits AP Bihar Chhattisgarh Gujarat Haryana Karnataka Maharashtra Odisha Rajasthan Sikkim Tamil Nadu UP Uttarakhand Aonla - - - - - - - - 269 - 294 234 - Areca nut - - - - - 259 221 - - - - - - Banana 266 - 266 187 - 277 291 182 - 272 290 276 - Bel - - - - - - - - 209 - - - - Blackberry - 171 - - - - - - - - - - - Carrot - - - - - - - - - - 291 - - Cashew nut - - - - - - 270 259 - - 264 - - Coconut 226 - - - - 263 244 272 - - 251 - - Cucumber - - - - 206 131 - - - - - - - Custard Apple - - - - - 219 - - - - - - - Fig - - - - - 266 - - - - - - - Grapes - - - - - 258 293 - - - - - - Guava 242 297 - 269 212 204 294 256 229 294 - 286 276 Kadam - 121 - - - - - - - - - - - Kinnow - - - - 284 - - - 231 - - - - Lemon 267 - - 280 - 288 148 298 231 - 209 236 - Litchi - 111 - - - - - 252 - 267 - 272 227 Mango 284 226 - 292 - 257 265 245 273 - 275 295 287 Musk Melon - - - - 227 - - - - - - - - Oil Palm 229 - - - - - - 278 - - - - - Orange 240 - - - - - 215 - 287 280 - - - Papaya 133 125 242 - - 279 234 268 - - 230 274 - Peach - - - - - - - - - - - - 219 Pineapple - - - - - - 241 298 - - - - - Pomegranate 234 - - 242 - 209 266 231 297 - - - - Sapota - - - - - 294 - 299 - - 245 - - Strawberry - - - - 119 - - - - - - 297 - Tapioca - - - - - - - - - - 223 - - Water Melon - - 257 211 221 288 267 298 - - - - - Source GAPL Survey
Impact Evaluation Study on ldquoNational Mission on Micro Irrigation (NMMI)rdquo
107
Table 85 Benefit Cost Ratio of MI System for Important Vegetable Crops
Vegetable AP Bihar Chhattisgarh Gujarat Haryana Karnataka Maharashtra Odisha Rajasthan Sikkim Tamil Nadu UP Uttarakhand Alovera 145 - - - - - - - - - - - Arabi - - - - - - 178 - - - - - Bitter Gourd 200 268 214 295 - - 239 - - 286 258 - Boda 112 251 - - - - - - - - - - Bottle Gourd 124 190 234 239 - - 267 133 - - 257 - Brinjal 215 218 144 145 185 215 298 238 230 257 166 257 - Broccoli - - 017 - - - - - - - - - Cabbage - 274 217 - - 250 218 - 167 275 222 - Capsicum 262 262 - 274 - - 161 - - - 229 - Carrot - - - 206 - - - 251 - - - - Cauliflower 117 - - 288 268 - 256 229 229 285 274 - Chilli 156 172 210 265 258 233 273 228 179 259 181 282 - Cucumber - 162 - 132 198 - 149 222 - - - - Fennel - - 281 - - - - - - - - - Garlic - - - 069 - - - 246 - - - - Ginger 220 - - - - 236 - 226 - - - - - Kundru - 125 - - - - - - - - - - Okra 170 219 238 189 174 281 271 287 - 225 232 279 - Lemon - - - - - - 224 - - - - - Methi - - - 190 - - - - - - - - Onion - 236 176 210 - 270 293 239 - 251 193 - Palak - - - - - - - - - - 183 - Pointed Gourd - - 182 - - - - - - - - - Peas - - - 197 - 236 298 - - - 235 269 Potato 182 248 260 226 270 233 - 261 282 - 158 286 - Pumpkin 135 146 013 - - - - 182 - 159 - - Radish - - - - - - - - - - 238 - Cluster Bean - 174 - - - - - - - - - - Round Guard - - - 254 - - - - - - - - Tomato 252 265 242 200 230 208 294 214 294 238 232 278 Sponge Guard - 137 - - - - - 274 - - - - Turmeric 179 - - - - - - - - - - - SourceGAPLSurvey
Impact Evaluation Study on ldquoNational Mission on Micro Irrigation (NMMI)rdquo
108
Table 86 Benefit Cost Ratio of MI System for Important Floriculture Crops
State Flower Name BC Ratio AP Lilli 121 Bihar Marigold 218
Gujarat Jasmine 272 Marigold 167
Haryana Gerbera 292 Rose 141
Karnataka Marigold 225 Rose 160
Odisha Rajnigandha 255 Rajasthan Rose 294 UP Marigold 276 Uttarakhand Gladiolus 272
Performance in terms of BC ratio varies from state to state and crop to crop Thus it may be concluded that these analysis confirm that the farmers are getting higher income with the adoption of MI technology 514 Increase in Area The irrigated area has increased in all the surveyed states after the introduction of NMMI Scheme Irrigated area has been increased by 841 for total surveyed farmers in the given states The state of Maharashtra has topped the list with 2228 growth in irrigated area followed by Chhattisgarh There has been very little growth in case of Sikkim UP Uttarakhand amp Karnataka
Table 87 Percent Increase in Irrigated Area on Installation of MI System
State Irrigated Area (Ha) Percent
Increase in Irrigated
Area Before MI After MI
AP 101302 113895 1243 Bihar 129482 140935 885 Chhattisgarh 49454 57172 1561 Gujarat 135837 154944 1407 Haryana 123318 136208 1045 Karnataka 103763 106449 259 Maharashtra 102510 125349 2228 Odisha 124139 138254 1137 Rajasthan 100536 107806 723 Sikkim 6038 6079 067 Tamil Nadu 70928 74086 445 UP 158306 160350 129 Uttarakhand 25852 26265 160
Impact Evaluation Study on ldquoNational Mission on Micro Irrigation (NMMI)rdquo
109
515 Potential area that can be brought under Micro Irrigation The potential for Micro Irrigation for each surveyed district has been worked out on the basis of field survey and secondary information
The following information has been taken account to work out MI potential from Secondary sources
A Total Irrigated area B Paddy area C Area under MI
Total Potential area has been worked out by subtracting the area under MI and Paddy from total irrigated area of the district considering that paddy area has no potential for the MI system This potential area has been depicted as percentage of total irrigated area The district wise potential for MI as well as the crop potential is given in the table below
Table 88 District wise Potential for Installation of MI System in Study Area
State District
Area Based on Secondary Data Potential Crops Under MI
Irrigated Area
(ldquo000 ha)
Area under MI (ldquo000 ha)
MI Potential
Area (ldquo000 ha)
MI Potential Area ()
Fruits Vegetables Other Crops
AP
Adilabad 10152 2544 7608 7494
Mango Citrus and Banana
Brinjal Chilli Tomato and Okra
Maize Sugarcane Cotton and Ground Nut
Anantpur 24721 12773 11948 4833 Krishna 18067 1572 16495 9130 Medak 9955 4946 5009 5031 Nalgonda 27570 7180 20390 7396 Nellore 8464 2158 6306 7450 Vishakhapatnam 22077 825 21252 9627
Bihar
Gaya 4979 253 4726 9492 Mango Kadam and Litchi
Okra Potato Cauliflower and Brinjal
Sugarcane Wheat and Maize
Madhepura 48788 095 48693 9980 Rohtas 8601 339 8262 9605 W Champaran 6238 542 5696 9131
Chhattisgarh
Durg 7750 2768 4982 6428 Banana Papaya and Watermelon
Cauliflower Tomato Bitter Gourd and Okra
Wheat Gram and Soybean
Jashpur 1109 068 1041 9387 Kanker 1377 1222 155 1130
Sarguja 1194 303 891 7462
Gujarat
Anand 10410 238 10172 9771 Banana Papaya Pomegranate and Watermelon
Chilli Tomato Onion Potato and Fennel
Cotton Sugarcane Wheat Groundnut and Caster
Banaskantha 39630 8150 31480 7943 Bharuch 9264 1073 8191 8842 Bhavnagar 16880 2788 14093 8349 Jamnagar 8330 1728 6602 7926 Mehsana 19698 624 19074 9683
Haryana
Bhiwani 24937 2429 22508 9026 Kinnow Lemon Watermelon and Muskmelon
Tomato Cucumber and Potato
Cotton and Wheat
Fatehabad 11443 110 11333 9904 Karnal 12960 086 12874 9934
Sirsa 14587 631 13956 9567
Karnataka Belgaum 45594 4394 41200 9036 Banana Areca Tomato Pepper and
Impact Evaluation Study on ldquoNational Mission on Micro Irrigation (NMMI)rdquo
110
Bellary 7348 397 6951 9459 nut Pomegranate Mango and Papaya
Chilli and Ginger
Turmeric Bidar 5873 2322 3551 6046 Chitradurga 2243 2963 1520 6788 Hassan 8661 1175 7486 8643 Mysore 13194 1376 11818 8957
Maharashtra
Ahemadnagar 26000 3049 22951 8827
Banana Mango Citrus and Grapes
Tomato Chilli and Brinjal
Cotton Sugarcane and Soybean
Jalgaon 23909 7611 16298 6817 Jalna 7850 2660 5180 6611 Kolhapur 27500 453 27047 9835 Ratnagiri 1500 111 1389 9262 Wardha 1630 1630 810 4971
Odisha
Bhadrak 2775 104 2671 9625 Mango Banana Cashew nut and Papaya
Tomato Brinjal Okra Bottle gourd and Cauliflower
Moong and Sugarcane
Ganjam 3600 299 3301 9168 Mayurbhanj 4105 553 3552 8654 Nayagarh 2966 164 2802 9447 Boudh NA 201 NA NA
Rajasthan
Hanumangarh 31071 1505 29566 9516 Orange Kinnow Mango Bel Guava and Lemon
Onion Carrot and Tomato
Cotton Arandi Guar Mustard and Wheat
Jalore 29081 11897 17184 5909 Jhalawar 23349 1569 21780 9328 Jodhpur 31000 5712 25288 8157 S Madhopur 19448 676 18772 9652 Udaipur 7139 580 6559 9187
Sikkim
East Gangtok 697 NA
NA NA Orange and Guava
Tomato Brinjal Cauliflower and Barackoli
Wheat Mustard and Turmeric Mangaon 135
NA NA NA
Tamil Nadu
Erode 13195 1090 12105 9174 Banana Tapioca Coconut Aonla and Carrot
Chili Brinjal Tomato Potato Carrot and Turmeric
Sunflower
Nilgiri 650 213 437 6729 Thiruvarur 6036 094 5942 9844 Tirunelveli 6429 299 6130 9534
Villupuram 14167 550 13617 9611
UP
Aligarh 16441 005 16436 9997
Banana Mango and Guava
Tomato Potato Chilli Peas Brinjal and Arbi
Maize and Wheat
Ballia 11578 025 11553 9979 Jhansi 17920 099 17821 9944 Kannauj 13016 019 12997 9985 Saharanpur 21567 078 21489 9964 Siddharth Nagar 10212 038 10174 9963
Uttarakhand
Udhamsingh Nagar 15330 NA - - Mango Peach Litchi and Guava
Peas and Tomato Haridwar 6088 NA - -
Nainital 3780 NA - -
Source Data Portal India and GAPL Field Survey Analysis
516 Employment Opportunities
The NMMI has helped to widen the food basket of the country with significant contributions coming from the bringing more area under irrigation and with judicious use of water New farm practices and innovations with support of government have encouraged the farmers to shift toward high value a crop which in turn gives better income and more employment opportunities
Impact Evaluation Study on ldquoNational Mission on Micro Irrigation (NMMI)rdquo
111
5161 On Farm Employment Generation Following are the sectors of on farm employment opportunities for farmers and related stakeholders being generated through implementation of NMMI
Higher production requires more man days for operations like harvesting on farm handling and logistics
Soil water quality and inputs testing laboratory service center Plant protection service center (Pest surveillance diagnostic and control services
including Integrated Pest Management) Maintenance repairs and custom hiring of agricultural implements and machinery
including micro irrigation systems (sprinkler and drip) Agri Service Centre includes at least the above three activities (Group Activity)
5162 Off-Farm Employment Generation
With the initiation of National Mission on Micro Irrigation (NMMI) not only the farm employment has increased but it has generated lot of off-farm opportunities which would further give more employment in the future This initiative also aims at farm mechanization which not only includes tractors and its implements but also use of other components such as pumps micro irrigation etc An attempt has been made in this section to estimate the additional employment generated from various initiatives available under mission Apart from this indirect labors for the logistic service are also generated to accomplish the above mentioned activities Each of the suppliers has 5-7 skilled and semi-skilled employees to support in installation of the system training after sales service etc Services of casual labor are also hired during the time of installing the system which results in indirect opportunities 517 Impact on Employment The implementation of NMMI scheme in the different states generated employment opportunities mainly due to increase in production which requires more of the man days as well as post handling operations micro irrigation resulted in considerable savings of labor as is evident from the data cited in table 93 This is true for pre-harvest practices The increased yield due to MI systems called for involvement of more labor for handling the harvesting and post-harvest operations
The basis for computing the manpower involved before and after installation of MI system related primarily to application of irrigations hoeing weeding fertilizer insecticide pesticide applications harvesting threshing assembling cleaning grading packaging transportation logistics etc It may be seen from the above table that in all the states under study have shown decrease in utilization of the labor in pre-harvest practices that is labor saving on irrigation weeding fertilization and other operations It shows that the use of
Impact Evaluation Study on ldquoNational Mission on Micro Irrigation (NMMI)rdquo
112
human labor after the use of micro irrigation has decrease significantly and ranges between 741 to 1875 percent
The employment generations through adoption of micro irrigation in the farms by the farmers before the adoption of the MI and after the installation and results have been presented in the following table below
Table 89 Change in Manpower Requirement for Cultivation (per ha per crop cycle)
State Pre harvest practices Harvesting Post-harvest handling Total Man dayscrops No of man days
before NMMI
No of man days after
NMMI
Change in man Power
()
No of man days
before NMMI
No of man days after
NMMI
Change in man Power
()
No of man days
before NMMI
No of man days after
NMMI
Change in man Power
()
No of man days
before NMMI
No of man days after
NMMI
Change in man Power
() AP 49 41 -1633 36 42 1667 16 19 1875 101 102 099 Bihar 52 45 -1346 29 35 2069 13 16 2308 94 96 213 Chhattisgarh 59 50 -1525 31 36 1613 20 24 2000 110 110 000 Gujarat 48 39 -1875 35 41 1714 20 24 2000 103 104 097 Haryana 40 35 -1250 30 35 1667 16 21 3125 86 91 581 Karnataka 48 42 -1250 34 40 1765 19 23 2105 101 105 396 Maharashtra 58 52 -1034 33 39 1818 23 29 2609 114 120 526 Odisha 46 41 -1087 32 37 1563 18 19 556 96 97 104 Rajasthan 58 53 -862 25 33 3200 18 20 1111 101 106 495 Sikkim 54 50 -741 29 33 1379 19 24 2632 102 107 490 Tamil Nadu 50 44 -1200 27 32 1852 21 23 952 98 99 102 UP 55 46 -1636 25 32 2800 20 24 2000 100 102 200 Uttarakhand 47 41 -1277 29 36 2414 23 29 2609 99 106 707
The table further reveals that in post-harvest operations right from harvesting to handling and disposal of the produce there is an increase in labor utilization and it ranges between 2119 to 5023 percent From here it may be concluded that the decrease in utilization of the labor in the pre harvest activities are offset by the increase in the production which requires more of the labor for harvesting assembling and grading handling transportation and disposal of the produce
Impact Evaluation Study on ldquoNational Mission on Micro Irrigation (NMMI)rdquo
113
6 Conclusions amp Recommendations Micro irrigation technologies are being promoted in India by the central and state governments by providing different kinds of financial institutional and technical support These technologies are promoted primarily because of (1) as a means to save water in irrigated agriculture (2) as a strategy to increase income and reduce poverty and (3) to enhance the food and nutritional security of rural households Despite the reported significant economic advantages and the concerted support of the government and NGOs the current micro irrigation area in India remains an insignificant proportion of its potential Rising demand for irrigation water in the face of its inefficient use amid concerns of growing water scarcity has brought into renewed focus the need for conserving water and improving water use efficiency
The real thrust on promoting MI adoption largely started with the recommendations of the Report of the Task Force on Micro Irrigation in 2004Their report sought to increase the emphasis on MI technology and recommended a broader framework viewing MI technologies as a part of the overall water management strategy It also recommended that more financial resources for subsidies with state governments taking up 10 percent of the cost while the central funds would account for 40 percent and advised greater flexibility for states to determine their appropriate implementation structure and institutional mechanisms for subsidy disbursement (Ministry of Agriculture 2004) Based on these recommendations in 2006 the Centrally Sponsored Scheme (CSS) on MI was launched The `National Mission on Micro Irrigationrsquo (NMMI) in 2010 revising and reformulating the Centrally Sponsored Scheme (CSS) on Micro-Irrigation which was introduced
In this study an attempt is made to study the Impact Evaluation of micro irrigation in 13 states of India by using the available information and field surveys of 7400 respondents inclusive of both adopters and non-adopters
Owing to promotional schemes introduced by the state and central governments the area under micro irrigation has increased from 11817 ha in 2005-06 to over 361 million ha in 2012-13 In spite of having many advantages over conventional method of irrigation the area under micro-irrigation presently occupies only about 571 percent of the total irrigated area As per the latest information only 285 percent of total irrigated area under drip irrigation and 286 percent is under sprinkler irrigation
Government of India Ministry of Agriculture Department of Agriculture and Cooperation assigned the study on ldquoImpact Evaluation of National Mission on Micro Irrigationrdquo (NMMI) scheme to access the performance of the programme implementation and access the impact of this scheme on increase in farmersrsquo income through adoption of the MI system The study was conducted in 13 states comprising of 64 districts from the sampled states namely AP Bihar Chhattisgarh Gujarat Haryana Karnataka Maharashtra Odisha
Impact Evaluation Study on ldquoNational Mission on Micro Irrigation (NMMI)rdquo
114
Rajasthan Tamil Nadu Uttar Pradesh Sikkim and Uttarakhand The field survey to get the first hand information was conducted for a total sample of 7400 comprising beneficiary and non-beneficiary farmers in these selected states through adopting stratifiedndashpurposive-sampling design Apart from this information was also collected from system suppliers government officials
Major Outcomes of the Study
A Current Status i The Scheme since its inception in 2005-06 has made rapid stride across the
country It has succeeded in bringing about 356 million ha area under micro irrigation in the sampled 13 states7 The physical targets for the period 2005-06 to 2012-13 were fixed to the extent of 383 million ha out of which 356 million ha has been brought under MI The Targets and achievements for financial outlay were Rs50128 and Rs50065 crores respectively The overall physical and financial achievements thus come out to be 9299 amp 9987 percent The extent of achievements however varied among different states States like Bihar Karnataka Odisha Rajasthan and Sikkim achieved more than 90 percent of the set physical targets Uttarakhand could achieve only 21 percent of physical and 31 percent of the financial targets Other States such as AP Chhattisgarh Gujarat Haryana Maharashtra and Tamil Nadu succeeded to achieve more than 70 of their physical targets
ii AP Gujarat amp Maharashtra are leading states in the every aspect of performance the different activities involved in the process streamlined in the guideline of NMMI While Bihar UP Sikkim amp Uttarakhand states are lacking in terms of the functions mentioned in the guidelines
B Pattern of Assistance
i Most of the states are giving subsidy of more than 70 percent for installation of
MI system However comparison of various states and analysis clearly demonstrates that increased subsidy had no significant impact on the increase of area coverage under MI system Farmers in Maharashtra Gujarat and Haryana were 223 140 and 100 percent respectively in case of sampled beneficiaries while pertinent subsidy component in these states was 60 50 and 90 percent respectively Similarly area coverage in Rajasthan Tamil Nadu and Bihar was noted to be 73 45 and 31 percent respectively and the corresponding figures
7 Ministry of Agriculture
Impact Evaluation Study on ldquoNational Mission on Micro Irrigation (NMMI)rdquo
115
for subsidy were 90 75 and 90 percent The aforesaid observation clearly suggests that increase in subsidy component beyond a limit has little or no impact on area coverage under MI system The relationship between area expansion under MI and quantum of subsidy has been computed considering beneficiariesrsquo data on area expansion in different states before and after adoption of MI system Hence the relationship of subsidies with area expansion as such does not refer to any specific year
ii The efficiency of scheme implementing agency is very high as most of the farmers have reported that their applications are processed and sanctioned in less than 40 days as against 60 days specified in the guidelines Similarly in most of the sample states beneficiaries are reported to be satisfied with respect to the procedure for filing the application till disbursement of the subsidy amount
iii Presently subsidy is limited to maximum area of 5 hectare per beneficiaries which is an impediment to the growth of area under micro-irrigation The data on size and distribution of operational land holdings in the country also suggest that medium and large farmers accounted about 15 percent of total land holdings thus occupying approximately 5542 percent of the total area
iv All the states have reported convergence of Mission interventions with different schemes of the Government of India and State level programmes Most of the districts have converged NFSM interventions with programmes such as RKVY ICDP Farm Mechanization NHM and other programmes
C Sources of Awareness and Reasons of Non-adoption i The major sources of awareness about the NMMI scheme were through service
providers suppliers followed by fellow farmers extension workers
ii The non-beneficiaries farmers had mix responses for not adopting the scheme because of lack of awareness regarding subsidies lack of technical knowledge high capital cost and system being not economical therefore not required
iii As per primary survey of the sampled beneficiaries about 59 percent of the respondents were small amp marginal farmers and 13 percent were women farmers who have taken the advantage of the Scheme
Impact Evaluation Study on ldquoNational Mission on Micro Irrigation (NMMI)rdquo
116
D System Cost and Sources of Fund i On an average the cost of system per hectare incurred by the beneficiaries
ranged between Rs 5445736 to Rs 7208631 in drip system and Rs 20481 to Rs 28171 in sprinkler irrigation system depending on the cropping pattern crop spacing etc in the states under study
ii Almost in all states farmer beneficiaries use their own funds for contributing margin money (9866) Other sources albeit a small proportion constitutes banking KCC amp money lenders
iii Most of the farmers borrowed money at less than 10 percent of rate of interest from banks and KCCs
E Technical Observations about MI System i It was observed that about 64 percent of the beneficiaries installed drip system
34 percent sprinkler system and 2 percent have installed both the systems in their fields The highest proportion of drip was observed in Karnataka whereas adoption of sprinkler was higher in Bihar
ii The majority of the beneficiaries (about 6887) farmers of all the 13 states have got their soil and water tested In Gujarat UP Maharashtra amp Rajasthan soil testing adopted by 6927 5275 7337 and 7913 of respondents respectively
iii More than 70 percent of the respondent farmers of AP Gujarat Sikkim and Odisha were using in-line drip irrigation system whereas more than forty five percent beneficiaries of Haryana and Uttarakhand reported to practice on-line drip irrigation system
iv The farmers were using screen filters centrifugal separators hydro-cyclone filter disc filter sand media filters depending on the need The data reveals that screen filters are being commonly used by the beneficiaries in most of the sampled states except Haryana where more than 65 percent beneficiaries are using hydro-cyclone and screen filters in combination due to the water quality as they are using canal water
v There is an increasing emphasis on conserving water and using it more efficiently Micro irrigation technologies based on drip and sprinkler irrigation systems provide some hope for achieving this The government has been
Impact Evaluation Study on ldquoNational Mission on Micro Irrigation (NMMI)rdquo
117
providing substantial financial incentives in the form of capital cost subsidies to farmers to invest in these technologies Most drip equipment sales in the study areas are subsidy driven Manufacturers and market estimates suggest that most of the MI system sales are subsidy linked Partly as a result of the existing subsidy delivery mechanism drip technology has failed to capture the kind of market that would have been expected given the many advantages and water saving potential the technology offers
vi The farmers in almost all the states reported that components of MI System met the BIS norms The average figure for all the sampled states where system components were as per the BIS norms came out to be around 98 percent
vii As far as overall designing of the system is concerned it was found that the systems were well designed except in case of Sikkim and Odisha where the systems were functional but not able to meet the farmers expectation It is therefore suggested that extensive involvement of the extension staff may be ensured to install the system as per requirement of ground conditions and once the system is installed regular monitoring particularly during the warranty period of the installation be carried out so that defects if any be got rectified by the suppliers
F After Sales Service
i On an average 91 of the beneficiaries across the sampled states reported that
after sales services are being provided to them amp also they receive the services at the required time Most of the sampled beneficiaries revealed that they are getting warranty of the MI system
ii In almost all the states the sampled beneficiaries revealed that no technical support guidance on agronomic practices are extended to the users as they generally tell to take the help of extension agencies
G Impact Analysis i The irrigated area has increased in all the surveyed states after the introduction
of NMMI Scheme The Irrigated area within the 5892 sampled beneficiaries of the 13 states before adoption of MI system was found to be 1332086 ha which became 1444147 ha after adoption of MI system It is therefore concluded that total percentage increase in irrigated area with the sampled beneficiaries in 13 states after adoption of MI system was noted to be 841 from same source of water Maharashtra has topped the list with 2228 growth in irrigated area
Impact Evaluation Study on ldquoNational Mission on Micro Irrigation (NMMI)rdquo
118
ii Farmers of all the states have shown an increase in area under horticulture crops after the adoption of the system The cropped area after implementation of NMMI has shown an increase which may be due to utilization of degraded marginal land into cultivable land amp increase in cropping intensity
iii Scheme has performed well in terms of reduction in irrigation cost and significant cost saving has been observed for irrigation in all the surveyed states Irrigation cost is reduced by 20-50 with average of 323 Reduction in electricity consumption after installation of MI system Average electricity consumption has been reduced by about 31 after using the micro irrigation system Saving of fertilizers with averages reduction of about 28 in total fertilizer consumption in the surveyed states Fertilizer saving vary from 7- 42
iv Micro irrigation has generated benefits to the farmers in terms of enhancement of the productivity The average productivity of fruits and vegetables has increased about 423 and 528 respectively
v The overall benefits accrued from the micro irrigation system are reflected in the income enhancement of the farmers All the surveyed states reported increase in farmerrsquos income in the range of 20 to 68 with an average increase of 485
vi Given the high benefit-cost ratios which is more than one in almost all crops and states we also find that the present form for delivery of public support in the nature of a capital cost subsidy is constraining both to the widespread adoption of the technology by farmers and to innovation in technology development and marketing This has made the entire gamut of manufacturing sales adoption and use of drip technology subservient to government support The present study has put forward an alternate system wherein the subsidy is given directly to farmers willing to invest in a drip system With a given amount of funds available the proposed model can provide subsidies to a much larger number of farmers can bring a much larger area under drip irrigation resulting in lower subsidy outgo per hectare of drip irrigated area would still incentivise the farmers to invest in drip systems lower the cost of subsidy outgo easy to manage and govern less prone to interference and whims and fancies of officials and lead to more efficient use of available subsidy without distorting the market Thus on all indicators the proposed subsidy scheme of direct delivery far outweighs the existing subsidy scheme of subsidizing the manufacturers in the name of the farmersBC ratio of installing micro irrigation system is above one across the states and across the crops which signifies the importance of MI system in net income enhancement of the farmers The BC ratio was observed to
Impact Evaluation Study on ldquoNational Mission on Micro Irrigation (NMMI)rdquo
119
be highest in Odisha among fruits amp vegetables whereas in flowers Rajasthan amp Haryana beneficiary farmers achieved higher BC ratio
vii The positive outcomes have made the food security effective due to the increase in the production and productivity of different crops and increased area under irrigation from same source of water Area under horticulture crops as well as nutritional security has also enhanced
viii The NMMI has helped to widen the food basket of the country with significant contributions coming from the bringing more area under irrigation and with judicious use of water New farm practices and innovations with support of government have encouraged the farmers to shift toward crops giving higher income
H Employment Generation i Beneficiaries of all the states under study have shown decrease in utilization of
the labor in pre-harvest practices that is labor saving on irrigation weeding fertilization and other operations It shows that the use of human labor after the use of micro irrigation has decreased significantly and ranges between 741 to 1875 percent But in post-harvest operations right from harvesting to handling and disposal of the produce there is an increase in labor utilization and it ranges between 2119 to 5023 percent due to the increase in the production which requires more of the labor for harvesting assembling and grading handling transportation and disposal of the produce
I Training and Capacity Building i Among the surveyed states more than 90 percent of the sampled beneficiary
farmers in the state of Haryana Karnataka Sikkim amp Tamil Nadu had training on different aspects of MI System whereas farmers of Bihar amp Odisha only 20 amp 52 percent of the beneficiaries have received the training
ii Results of survey revealed that the system suppliers manufacturers are the major sources for imparting training as more than 90 percent of the farmers received training from them Very less proportion of the respondents reported to have training from other sources such as SAUs KVKs etc The participant beneficiaries revealed that the duration of training period generally was of 1-2 days Almost all the respondents of Tamil Nadu UP Chhattisgarh Haryana were given training materials during the training while few beneficiaries of the Bihar and Uttarakhand Karnataka were provided such training materials
Impact Evaluation Study on ldquoNational Mission on Micro Irrigation (NMMI)rdquo
120
iii Key areas for training were operation and maintenance of the system adoption
of package practices under MI and opportunities for introducing new crops Demonstration was other means of motivation and capacity building It was also found to be a good means of promotion
J Promotional Activities
i The farmers of the majority of the states acknowledged that the implementing
agencies are promoting NMMI schemes in local language however were not aware of the dedicated website for MI scheme in their state It is due to the fact that farmers do not have access or willingness to use internet for information gathering
ii On farm demonstrations particularly in rural area where exposure is limited are very important means in educating the rural folks It was noted that maximum beneficiaries of Haryana (98) followed by Sikkim (80) Rajasthan (64) and Uttarakhand (63) have visited the demonstration laid out in the nearby areas Whereas majority of the farmers of AP UP TN Karnataka Gujarat Bihar have reported that they have not visited any demonstration farm It is therefore suggested that more efforts may be put to expose the farmers regarding demonstration of MI system and its benefits
Thus it may be concluded that positive outcomes in terms of crop productivity enhancement due to implementation of MI Scheme have contributed significantly to the food requirements The NMMI has helped to widen the food basket of the country with significant contributions coming for bringing more area under irrigation and with judicious use of water New farm practices and innovations with support of government have encouraged the farmers to shift forward crop giving higher income
It is noteworthy that the incremental net returns were observed to be generally higher for cash crops such as fruits vegetables ground nut cotton etc than for food crops viz bajra and wheat This is in conformation with the results of research studies
Key Recommendations and Policy Implications
For the food security and sustainability to match the growing population priorities are to bring more area under irrigation through judicious use of irrigation water Keeping this aspect in view the Government of India launched the Central Sponsored Scheme for Micro Irrigation in 2005-06 which was up scaled as National Mission on Micro Irrigation in 2010 Micro irrigation system being capital intensive in nature and the adoption cannot be increased without providing subsidy Subsidy can be a necessary condition for encouraging the adoption of micro-irrigation but cannot be a sufficient condition for sustaining the
Impact Evaluation Study on ldquoNational Mission on Micro Irrigation (NMMI)rdquo
121
growth of it as many other factors determine the adoption of the same Even though subsidy is not needed to enhance the economic viability of the system it is still needed to enhance the incentive for the widespread adoption of MI particularly among the resource poor farmers (marginal and small categories) Therefore there is a need to find out the ways and means to convince the farmers about the economic and social feasibility of micro-irrigation Since it involves relatively higher amount of fixed investment farmers often ask the questions regarding the payback period viability water saving and the productivity gains It appears that these questions arise mainly because of poor exposure about the social and economic advantages of the technology Thus efforts are needed to convince the farmers through quality extension network as Indiarsquos highly successful green revolution was also the result of extension innovations as much as technology Considering the fast decline of irrigation potential and competing demand for water from different sectors all possible efforts are needed to increase the adoption of water saving technologies so as to avoid water scarcity in the future
Given the vast potential benefits of micro-irrigation and fast decline of availability of water for irrigation in the country a number of technical and policy interventions are required to be introduced so as to increase the adoption of micro-irrigation in India The needed recommendations and interventions are presented below
A Scheme Related 1) The rate of subsidy provided under NMMI through central government is fixed
uniformly for different categories of farmer with a limit of 5 hectare This needs to be restructured as about 15 of the large and medium farmersrsquo accounts for more than 5542 of the land in India Therefore this limit of five hectares needs to be enhanced for extending the subsidy
2) States often compete with each other to increase the subsidy component However it has been noted that higher subsidy does not necessarily lead to more area coverage under MI system as the highest increase in area under MI has been achieved by states which offer subsidy in the range of 50-75 percent eg Maharashtra Chhattisgarh Gujarat and Odisha In case of AP which increased subsidy from 70 to 90 percent in 2011-12 the additional area to come under MI in fact decreased as compared to the previous years It is therefore recommended that the states should be advised to seriously consider that the quantum of subsidy should preferably be not more than 50-70 percent including state and central share
3) No uniform pattern is being followed by states for implementation of this scheme It has been observed that in some states more than one department are involved in parallel eg Karnataka where it is being implemented by both agriculture and horticulture departments In such cases there is often lack of coordination which adversely affects
Impact Evaluation Study on ldquoNational Mission on Micro Irrigation (NMMI)rdquo
122
the outcome of the scheme It has also been observed that where a single department is designated as the implementing agency (eg horticulture or agriculture) it does not pay adequate attention to the crops coming under the purview of other departments Perhaps one of the best implementation strategies is to designate an independent Special Purpose Vehicle (SPV) on the pattern of Gujarat (GGRC) and AP (APMIP) States may be encouraged to replicate such a strategy
4) One of the major reasons for the slow growth of micro-irrigation in India is the high initial investment In spite of availability of subsidy from state agencies majority of the farmers are reluctant to invest in micro-irrigation system even in horticulture crops which is highly suitable for drip irrigation Therefore micro-irrigation system should be tailored made ie planned and designed based firmly on location specific parameters to reduce the cost of installation
5) Micro irrigation System is mostly promoted through subsidy schemes and not as an on-farm water and land management strategy In certain states under subsidy scheme the requisite consideration have not been given in respect of field size shape topography type and location of water source seasonal fluctuations type of soil and crop to be grown As a result in certain cases the subsidy may not match the specific situation of an individual farmer consequently the system may not match the site specific situations of an individual farmers consequently the system may not operate to the complete satisfaction of the farmer
B Technology Related 1) There is a need to establish a Central Testing Facility (CTF) to deal comprehensively with
the design development and testing of all equipments devices machines used in micro irrigation systems using state-of art technology It is suggested that the Govt may consider contacting regular and random technical audit of the system to cover about 2-3 percent beneficiaries within first and second year of the installation This will keep check on to quality and suppliers will be more vigilant to supply good quality of system
2) It is suggested that the implementing agencies should be more vigilant regarding warranty and after sales service of the system provided by the suppliers The question of releasing 10 percent of the cost of the system after one year subject to satisfactory performance of the system as certified by the beneficiary may be considered Maintenance manual in vernacular language should be made available to the beneficiaries at the time of installation of the system
3) It is observed that the cost of micro-irrigation accessories such as emitters filters laterals etc vary between shops and places Sometimes farmers do face problem in
Impact Evaluation Study on ldquoNational Mission on Micro Irrigation (NMMI)rdquo
123
getting spare parts in time It is necessary to provide quality materials in time for farmers for the speedy adoption of micro-irrigation
4) Inadequate information about the operation maintenance as well as the usefulness of micro irrigation is one of the main reasons for its uneven spread across regions in India Farmers still do not have full knowledge regarding the usefulness of the micro irrigation Even the adopters do not know fully how much of subsidy is available per hectare for different crops
5) Clogging of drippers mainly due to poor quality of water helps in bacterial growth which can be controlled by using chlorination which acts as a powerful oxidizing agent and vigorously attack micro-organisms such as algae fungi and bacteria Also acid is injected into drip irrigation system to lower the pH of the irrigation water and this helps in preventing the precipitation of salts such as calcium carbonate magnesium carbonate or ferric oxide It has been observed during the course of survey that the availability of sulphuric acid in the nearby towns is a major constraint and farmers are forced to purchase new spares by discarding clogged drippers Recently some farmers have started applying phosphoric acid to get dual benefit such as flushing of impurities and adding P fertilizer to the soil but the same is not recommended and also not very effective It is therefore recommended that system suppliers should make acid available to the growers as part of their after sales service obligation It is realized that the normal acid treatment does not help to mitigate the problem Therefore studies need to be carried out to devise de-logging measures in such areas
C Awareness and Capacity Building
1) The extension network currently operated mainly by government agencies does not
seem to be making significant impact on the adoption of this technology Therefore there is a need to revamp the entire extension network by involving the MI system manufactures in order to increase amp improvise the existing quality of extension services
2) System manufacturers should be involved intensively in promoting micro-irrigation by introducing frequent demonstration at farmersrsquo field and strategic locations in the district state The micro Irrigation system manufacturers should be involved in providing advice on agronomic packages to the farmers so as to encourage the adoption of micro irrigation at a large scale
3) Since MI system suppliers are one of the major sources of creating awareness among potential beneficiaries their involvement in laying down demonstration may be increased Similarly imparting training on technical and operational aspects of the system should be included as mandatory part of the training of the farmers by the
Impact Evaluation Study on ldquoNational Mission on Micro Irrigation (NMMI)rdquo
124
system suppliers The training may also include aspects of packages of practices which may be standardized by the SAUs amp other related organization and supplied to system suppliers for further dissemination to the farmers
4) Awareness on MI system is low in states like Bihar UP and Odisha Special drive is needed for exposure visits trainings to make them aware about the benefits and operation of the system The number of demonstration farms should also be increased
5) It is understood from the field study that the officials who are involved in promoting micro-irrigation technology under the GoI Scheme have inadequate knowledge about the technical and other details of MI Therefore the state government extension staff need to undergo lsquoRefresher Courses and exposure visitsrsquo to have basics of micro-irrigation thereby enabling their role in the implementation of the scheme
D Follow up Action 1) Though micro-irrigation has been in use in different States since mid-eighties State-
wise potential area is not estimated as of today Therefore it is essential to prepare State-wise and crop-wise potential area for MI A detailed estimate on State-wise potential would be useful to fix the target to be achieved and further to develop a road map for MP adoption in the country
2) It is evident from field study that capital cost required to install micro irrigation system is relatively high Because of this reason considerable percentage of farmers have expressed that they are unable to adopt this technology for low value crops There has been a significant development in the MI technology and efforts should be on developing and popularizing low cost technologies This would help reducing the cost of the system and increasing the adoption of micro-irrigation at a large scale and at least one percent of the outlay on micro-irrigation needs to be earmarked for micro-irrigation research
The information regarding all the activities under NMMI scheme at national and state level should be under public domain The information available at NCPAH website is qualitative and it should be quantitative to make it more clear and informative Similarly information at state level is hardly available in the website and it should be mandatory for implementing agencies to host their websites as is being done in case of Tamil Nadu
Impact Evaluation Study on ldquoNational Mission on Micro Irrigation (NMMI)rdquo
125
References Ahuja Usha Ram Singh PKJoshi and Neelu Nanwani 2012 Micro Irrigation Economics and Outreach in Haryana Chandrasekaran M and D Suresh Kumar 012 Micro Irrigation Economics and Outreach in Tamil Nadu
Dhawan BD 2000 Drip Irrigation Evaluating Returns Economic and Political Weekly 35 42 (Oct 14-20 2000) pp 3775-3780 Dhawan B D 2002 Technological change in irrigated agriculture A study of water saving methods New Delhi Commonwealth Publishers Government of India 2010 National Mission on Micro Irrigation Operational Guidelines New Delhi Ministry of Agriculture November 2010 Government of India 2004 Report of the Task Force on Micro irrigation Ministry of Agriculture New Delhi January 2004 INCID 1994 Drip Irrigation in India New Delhi Indian National Committee on Irrigation and Drainage Malik DP and MS Luhach 2002 Economic dimensions of drip irrigation in context of fruit Crops Paper presented at International Workshop on Economics of Water and Agriculture held at Institute of Food Agriculture and Environmental Sciences The Hebrew University Jerusalem Israel 18-20 December NABCONS 2009 Evaluation study of centrally sponsored scheme on Micro Irrigation Mumbai NABARD Consultancy Services Namara R E Upadhyay B Nagar R K 2005 Adoption and impacts of micro irrigation technologies Empirical results from selected localities of Maharashtra and Gujarat states of India Research Report 93 Colombo Sri Lanka International Water Management Institute Narayanamoorthy A 2012 Drip Method of Irrigation in Maharashtra Status Economics and Outreach I Narayanamoorthy A 2009 Drip and Sprinkler Irrigation in India Benefits Potential and Future Directions in Amarasinghe U T Shah RPS Malik (eds) Strategic Linking of the National River Linking Project (NRLP) of India Series 1 International Water Management Institute Colombo Narayanamoorthy A 2004 Impact assessment of drip irrigation in India The case of sugarcane Development Policy Review 22(4) 443-462 Narayanamoorthy A 2003 Averting water crises by drip method of irrigation A study of two water intensive crops Indian Journal of Agricultural Economics 58 (3) 427-437 Narayanamoorthy A 2001 Impact of drip irrigation on sugarcane cultivation in Maharashtra Agro Economic Research Centre Gokhale Institute of Politics and Economics Pune India Narayanamoorthy A 1997 Economic analyses of drip irrigation An empirical analysis from Maharashtra Indian Journal of Agricultural Economics 52 (4) 728-739 Narayanamoorthy A 1996 Evaluation of drip irrigation system in Maharashtra Mimeographed series No 42 Agro Economic Research Centre Gokhale Institute of Politics and Economics Pune India Malik RPS and MS Rathore2012 AgWater Solutions Project Case Study Accelerating Adoption of Drip Irrigation in Madhya Pradesh India
Impact Evaluation Study on ldquoNational Mission on Micro Irrigation (NMMI)rdquo
126
Palanisami K S Raman Kadiri Mohan 2012 Micro Irrigation- Economics and Outreach Macmillan Publishers India Ltd for International Water Management Institute Palanisami K Kadiri Mohan K R Kakumanu S Raman 2011 Spread and Economics of Micro irrigation in India Evidence from Nine States Economic and Political Weekly XLVI Nos 2627 June 25 2011 Patil RG (2001) water filtration for micro irrigation system In Micro irrigation Eds HP singh SP Kaushik Ashwani Kumar TS Murthy Jose C PP 574 Phansalkar SJ 2002 Appropriate Irrigation Technologies promoted by IDE A Socio Economic Assessment Raina JN Thakur BC and ML Verma (1999) Effect of drip irrigation and polyethylene mulch on yield quality and water use efficiency of tomato (Lycopersicon esculentum) Indian J Agric Sci 69 (6) 430-33 Raina JN Suman SKumar P and RSSephia (2013) Effect of Drip Fertigation With and Without Mulch on Soil Hydrothermal Regimes Growth Yield and Quality of Apple (Malus domestica Borkh Comm in Soil Sci amp Pl Annual 44 1-11 Regassa E Namara Bhawana Upadhyay and R K Nagar 2005 Adoption and Impacts of Micro irrigation Technologies Empirical Results from Selected Localities of Maharashtra and Gujarat States of India Research Report 93 Colombo Sri Lanka International Water Management Institute Sankaranarayanan KP Nalayini M Sabesh S Usha Rani R P Nachane and N Gopalakrishnan 2011 Low Cost Drip ndash Cost Effective and Precision Irrigation Tool in Bt Cotton Technical Bulletin No12011 Coimbatore Sharma RC (1998) Nature Extent and Classification In Agricultural Salinity Management in India Central Soil Salinity Research Institute Karnal UpadhyayB2003 Drip irrigation An appropriate technology for women Appropriate Technology Vol 30 (4) Verma S Tsephal S and Jose T 2004 Pepsee systems Grass root innovation underground stress Water policy 6 (2004) 1-16 Verma SR Impact of Agricultural Mechanization on Production Productivity Cropping Intensity Income Generation and Employment of Labor Status of Farm Mechanization of India 133-153 (wwwagricoopnicin)
Impact Evaluation Study on ldquoNational Mission on Micro Irrigation (NMMI)rdquo
127
Appendices Annexure I Processes of Implementation
Process for Implementation of Micro Irrigation Scheme
The Block Development Officer will receive Gram Sabha approved applications with the required documents on basis of ldquofirst come first servedrdquo basis from the farmers interested in availing benefit under the scheme through Village Horticulture Extension Officer Horticulture Development Officer and other sources such as regional workersdealers of registered manufacturing companies Action Block Development Officer At Block Development level the compiled applications will be put in a register according to priority and registered number and date will be assigned The registration number and date will be informed to beneficiary in written (Form-One) Action Block Development Officer Within three days of receiving the application a visit to farmerrsquos field will be made with Village Horticulture Extension Officer to confirm the information entered in application and field notes will be compiled in a folder (Form-Two) Action Block Development Officer Time Limit Three days After the field visits the applications will be arranged in an ordered list and sent to District Horticulture Office along with application form-three A copy of list and application will remain with Block Development Officer (Form-Three) Action Block Development Officer Time Limit Four days At district level development block wise received list will be registered and kept in same order in block wise registers From every Block Development list each application will be accepted in order Time Limit Three days Action Member Secretary District Micro Irrigation Committee (DMIC) The estimation of proposed area and cost will be made according to received applications district level integrated Action Plan will be formulated and District Micro Irrigation Committeersquos sanction proposal will be sent to State Micro Irrigation Committee Time Limit Ten days Action Member Secretary State Micro Irrigation Committee (SMIC) On the basis of district level Action Plans state level Action Plan will be prepared and after approval from State Micro Irrigation Committee (SMIC) will be sent to central governmentrsquos Department of Agriculture amp Cooperation New Delhi Time Limit Ten days Action Member Secretary State Micro Irrigation Committee (SMIC) Part-Two The information received about district wise Action Plan approved by central governmentrsquos Department of Agriculture amp Cooperation will be shared with DMIC Time Limit Three days Action Member Secretary State Micro Irrigation Committee (SMIC)
(a) After receiving information about approved Action Plan for district each block wise registered application will be forwarded to manufacturing companies which were selected by farmers for survey drawingdesign etc in an order (Form- Four) Time Limit Three days Action Member Secretary District Micro Irrigation Committee (DMIC)
Impact Evaluation Study on ldquoNational Mission on Micro Irrigation (NMMI)rdquo
128
(b) After getting the approval from the bank bank loan application will be send to the micro irrigation Company for the further required action Micro Irrigation Company will prepare drawing design etc of the farmerrsquos field in which system has to be established and make them available to Block Development Officer and Senior Horticulture Development Officer Time Limit Three days Action Micro Irrigation Company After receiving documents from Micro Irrigation Company Block Development Officer will visit concerned farmerrsquos field and will make initial physical verification of irrigation water and available energy for the proposed system which is to be established After initial physical verification required documents along with recommendation of Block Development Officer should be sent to Member Secretary DMIC (Form Five) Time Limit Three days Action Block Development Officer After receiving approved applications from Block Development Officer within stipulated time limit Member Secretary DMIC will issue administrative approval and give work orders to micro irrigation Company to accomplish work (Form- Six) Time Limit Three days after receiving applications Action Member Secretary District Micro Irrigation Committee (DMIC) After receiving work direction from Member Secretary District Micro Irrigation Committee (DMIC) Micro Irrigation Company will establish system in working condition at the site selected by concerned farmer It will give required training to farmer and manual in Hindi The satisfaction certificate will then be obtained from farmer should be sent to Member Secretary along with bills (Form- Seven) Time Limit Seven days Action Micro Irrigation Company After receiving information about system establishment from micro irrigation companies group of nominated officers from DMIC will physically verify the established system and report will be presented in prescribed form After receiving correct physical verification report the approved grant payment will be issued in prescribed form (Form-Nine) and action for payment will be ensured (Form- Eight) Time Limit Ten days Action Nominated Group for physical verification
Note (1) The process of making payments to the suppliers of materials under scheme should be made after physical verification and other necessary formalities have been completed The payment should be made according to priority (2) During physical verification concerned officials will see that system has been established according to the drawingdesign presented initially by micro irrigation Company The standard material has been provided in prescribed quantity The distribution of irrigated water is uniform at all the places The farmer has been trained to operate the system maintain it etc and manual in Hindi has been provided If during physical verification the facts are presented showing incomplete provision of system and supply of non-standard material Member Secretary will have a responsibility to inform micro irrigation Company that it should establish the system according to the presented proposal The physical verification of system should be done again before taking action to make payment to company Time Limit 3 days Action Member Secretary DMIC It will be responsibility of Head DMIC that the above action is taken in stipulated time Action Head DMIC
Impact Evaluation Study on ldquoNational Mission on Micro Irrigation (NMMI)rdquo
129
The person getting benefit out of micro irrigation scheme has to submit an affidavit on a 5 rupees stamp paper along with the necessary forms to the Assistant Director Horticulture Joint Member Secretary District Micro Irrigation Committee declaring that he will not transfer the dripsprinkler system to any other farmer neither sells it (Form- Ten) Action Beneficiary Answerable Block Development Officer The beneficiaries of this scheme will have to give in written that they or any member of their family (if combined) has not taken benefit from any Govt state Govt scheme of providing dripsprinkler for irrigation (Form- Eleven) Action Beneficiary Answerable Block Development Officer
Impact Evaluation Study on ldquoNational Mission on Micro Irrigation (NMMI)rdquo
130
Figure 13 Subsidy Process under GGRC Source Kumar amp Pullabhotla
Farmers
Approaches to MI Companies of
their choice
Application is submitted to GGRC with design and cost
estimation and 5 advance money by farmer
Get cost estimate for the installation after survey
Work Order released with 25 money to MI companies by
GGRCBank
Tri-party agreement (TPA) Collection of Management ChargesDifferent Amount
Submission of Performa Invoice for advanse payment
Installation amp trial run of MIS Third party inspection Issuance of
Insurance Cirtificate Submission of Final Bill
Payment of Balance Amount (75) by GGRCBank to MI
comp
Impact Evaluation Study on ldquoNational Mission on Micro Irrigation (NMMI)rdquo
131
Figure 14 Subsidy Process under APMIP
Source Adapted from Horticulture Department Note Abbreviations used MIAO ndash Micro-irrigation Area Officer AOHO ndash AgricultureHorticulture officer MCO ndash Micro-irrigation coordinators
Farmers
Application submitted to MIAOAgri OffHorti Off
Application form forwarded for village revenue officersquos
signature along with title deed
Forwarded to MI Company (Choice of company indicated
by farmer at the time of submission of application)
Company prepares the
design amp survey
Sent back to AOHO or
MIAO
Forwarded to AOHOMIAO who sends it
to Mandal Co-ordination Office
Will inform through MIAO to farmer of how much to
pay
Application + farmers DD (30 or farmerrsquos share)
submitted to MIAO
At district office administrative sanction
after scrutiny of documents
10 of cost released to
company as mobilization fund
Material delivery and installation to be undertaken by company within 15 days
Upon receiving completion certificate 85 of cost released to company
MCO has to inspect and furnish completion certificete
along with photograph
5 of cost is held as a guarantee for providing service Released
to company if bank guarantee is furnished
Impact Evaluation Study on ldquoNational Mission on Micro Irrigation (NMMI)rdquo
132
Box 1 Online Micro Irrigation Farmerrsquos Subsidy Management System in Tamil Nadu Subsidy Management System
Online Micro Irrigation Farmerrsquos Subsidy Management System in Tamil Nadu Subsidy Management System
With a mission to improve and increase the performance the Micro Irrigation (MI) for Horticulture and Non Horticulture crops across every region in all states of India web based software for centralized subsidy allocation and management monitoring software is developed This software was developed by Maruti Computers Private Limited (MCL) Chennai is proved to be very successful after its implementation in the state of Tamil Nadu This web based application software is an end-to-end tool which simplifies and facilitates the entire process of release of subsidy to the beneficiaries This system provides required information to all stake holders in a very transparent manner and provides paperless office and e-governance functionalities This software was developed with latest technologies and fully complies with current guidelines of Central Government MI Scheme The software is continually updated with the changes in rules and regulations and for the technology changes This software addresses the core need for this application - speedy processing of farmerrsquos subsidy requests in a transparent manner
Overview
The software was developed as per the guidelines of the MI Scheme This software is available in multiple languages For a specific state this is available in bilingual languages for various applications and annexure This will enable the beneficiary to understand the content of the application in the local language and fill without any errors
To increase the accuracy and correctness of the information submitted by the farmers software enables them to re-verify the entire data to be submitted by them System helps the applicant to correct the data before submitting to department On completion of various applications at their convenience the beneficiary can submit the application on-line
Once the entire application is in complete form system accepts the application for further processing A unique16 digit Application Id is generated by the system and with Id of the application The authorities will be able to identify the district taluka block etc along with date amp time seal The Beneficiary farmers may also submit their application online with the help of designated agencies (District Agriculture and Horticulture departments) or Sugar Mills or Micro Irrigation Companies who are all one of the stake holders of the scheme
The software and the data within the software are highly secured with access control privileges for various levels of users Data within the system cannot be manipulated or altered where they lack authority The software can generate various types of MIS reports and all stake holders The Government of India who is the sponsor of the scheme can generate reports on demand for monitoring the scheme The system has intelligence to identify and mark duplicate application Through this facility duplicate or fraudulent applicants are identified and removed from further processing The software is user friendly menu driven open-ended for future enhancements and is secure
Subsidy Processing and Monitoring The fully completed applications are then processed by the District Technical Committee Their decision of approving or rejecting the applications is fed online On approval a work order for installing the system is issued to the respective Micro Irrigation companies The Micro Irrigation companies after installing the system in the field they submit the completion certificate and their Invoice online Subsequently check Measurement done for the implementation of the system is then fed online Once check measurement is submitted Invoice submitted by the MI Companies gets approved for release of their payment and subsidy to the beneficiary
Process flow The software is built with Business Process Management (BPM) concepts BPM provides the workflow or process management capability ndash that helps an organization to formulate a step by step flow of a process and stipulate conditions for flow from one step to another It also provides tight security as who can move from one step to another
Impact Evaluation Study on ldquoNational Mission on Micro Irrigation (NMMI)rdquo
133
Box 2 Possibilities for Modifications
Possibilities for Modifications
The administrator of the system can make majority of operational changes without any programming changes The system is built on a rule driven and data driven architecture Hence by changing the data and rules the system behavior can be modified Process flow control can be managed by changing the business process flow with use of Ganges
The software application will be continuously updated MCL for the following items
-Central Government and state regulations
-Software upgrades for technology related items
Setting up of a company ndash Special Purpose Vehicle (SPV) to deal with the Micro Irrigation scheme in the states
Both the APMIP and GGRC models are different to the other State Implementing Agencies (SIA) in nature process and functioning the A key contrasting feature of this process between the two models is that under the GGRC system the farmer directly approaches the MI firm of his choice usually through a dealer whereas in the SIAAPMIP system the farmerrsquos point of contact is the local officer who has jurisdiction in the area The farmer indicates his choice of the company at the time of submitting his application and a number of additional approvals are needed before the company receives the farmerrsquos demand and proceeds to prepare the cost estimate This feature adds another layer of delay and unnecessary scrutiny in the subsidy disbursement process This is not the case under the GGRC model
Both APMIP and GGRC are independent and are not under any specific state department such as agriculture or horticulture has no crop specific crop bias
In many instances in these models the MI dealer or firm has an incentive to take up the responsibility of much of the administrative procedures such as collecting the relevant documents facilitating access to bank documentation (in case the farmer wants to avail of credit) submitting the application to the implementation authorities etc in order to speed up their own business
The GGRC encourages the suppliers to motivate the farmer for timely submission of application under MI Schemersquo and educate the farmer for availing loan procedures of Bank
Impact Evaluation Study on ldquoNational Mission on Micro Irrigation (NMMI)rdquo
134
under MI scheme This design reduces some transactional costs of availing the subsidy from farmers to MI suppliers and enhances efficiency
The implementing agency as the private sector also encourages devoting some of its own resources to promote and educate the farmers about the subsidy scheme and its guidelines in addition to the public extension efforts
Both these models however allow for various checks to scrutinize such misappropriation of subsidy through their design of the payment process and via third party verification procedures
Both APMIP and GGRC follow similar procedures for collecting the farmerrsquos share of the cost of the MI system and incorporate provisions to safeguard farmersrsquo interests The farmer pays his share to the implementing agency rather than directly to the MI firm Both the agencies releases only some portion of the amount to the supplier prior to the delivery and installation of the system as a mobilization fund
Only after the system has been installed a trial run undertaken and verified by a third party monitoring agency and with the farmer acknowledging the system performance is the complete amount (farmerrsquos contribution along with the subsidy component) released to the supplier
In view of above the GGRC model and to some extent the APMIP model incorporate useful design elements that align incentives for suppliers (of MI technology as well as credit and insurance suppliers) in a manner that is advantageous to farmers
Set up an SPV on the lines of GGRC (Gujarat) and APMIP (Andhra Pradesh) Dedicated and trained staff Timely subsidy disbursal Detailed information of the scheme to farmers All the paper work Demonstrations Warranty After Sales Services Monitoring of the companies operating in the state Monitoring of the companies operating in the state Regular training of farmers Agronomic support to farmers Make available loans and insurance to farmers
The above diagram clearly states the advantages of having the Special Purpose Vehicle (SPV) for Micro Irrigation There will be dedicated and trained staff to deal with the farmersrsquo queries and to work on the MI scheme full time The funds which do not come on time or are not properly managed will be taken care of by the SPV Often the farmers complain of not getting information on time or the complication of the Govt processes This will be dealt with once the SPV is there The SPV will help people with the paperwork and other
Impact Evaluation Study on ldquoNational Mission on Micro Irrigation (NMMI)rdquo
135
official documentation Regular demonstrations will be held and so will the work of creating awareness amongst the farmers about MI will be done The work of the registered companies will be monitored and it will be ensured that warranty and after sales service be provided to the customers The company will conduct regular training programs not only on MI but also on several other advanced topics of horticulture In addition the company will have agronomists to guide the farmers for obtaining higher yield The loan and insurance problems faced by the farmers will also be taken care of by the company by making arrangements which would be convenient to the farmers
Impact Evaluation Study on ldquoNational Mission on Micro Irrigation (NMMI)rdquo
136
Annexure II State wise Physical amp Financial Targets amp Achievements
Table 90 State wise Physical and Financial Target amp Achievements during 2005-06
State 2005-06
Physical (ha) Financial (Rs in lakh) T A A T A A
AP 45521 6775 1488 612923 934 1524 Bihar - - - - - - Chhattisgarh - - - - - - Gujarat 16720 5042 3016 218201 70117 3213 Haryana - - - - - - Karnataka 25234 - - 35841 - - Maharashtra 41856 - - 480809 - - Odisha - - - - - - Rajasthan - - - 104802 - - Sikkim - - - - - - Tamil Nadu 28950 - - - - - UP 8910 - - 124174 - - Uttarakhand - - - - - - Grand Total 180223 11817 656 2328415 163517 702
Source Ministry of Agriculture Note T- Target A- Achievement
Table 91 State wise Physical and Financial Targets amp Achievements during 2006-07
State 2006-07
Physical (ha) Financial (Rs in lakh) T A A T A A
AP 193459 84623 4374 1951968 11277 5777 Bihar 14223 - - 24821 - - Chhattisgarh 28748 4600 16 303288 25621 845 Gujarat 18247 24338 13338 33559 393095 11714 Haryana 5365 2823 5262 44389 23179 5222 Karnataka 23737 38850 16367 245675 445169 1812 Maharashtra 65119 108260 16625 879655 1346637 15309 Odisha 3314 1222 3687 45426 14319 3152 Rajasthan 39751 67721 17036 283334 268746 9485 Sikkim - - - - - - Tamil Nadu 5402 - - 120064 - - UP - 18636 - - - - Uttarakhand - - - - - - Grand Total 397365 3343006 8413 4457599 3659033 8209
Source Ministry of Agriculture Note T- Target A- Achievement
Impact Evaluation Study on ldquoNational Mission on Micro Irrigation (NMMI)rdquo
137
Table 92 State wise Physical and Financial Targets amp Achievements during 2007-08
State 2007-08
Physical (ha) Financial (Rs in lakh) T A A T A A
AP 46385 114846 24759 574776 1455942 25331 Bihar - 229 - - 2617 - Chhattisgarh 10063 2083074 20701 78339 175098 22351 Gujarat 45155 430371 9531 73496 492741 6704 Haryana 7215 778499 1079 60419 50811 8409 Karnataka 535177 62939 1176 68645 759797 11068 Maharashtra 103672 82224 7931 1389734 1279207 9205 Odisha 1032 306948 29743 1084 10127 9342 Rajasthan 44707 73735 16493 234114 2908 12421 Sikkim - - - - - - Tamil Nadu 12302 781957 6356 2200 155991 709 UP - 4659 - - 56217 - Uttarakhand - NA - - NA - Grand Total 3240487 4211739 12997 3989632 4729348 11854
Source Ministry of Agriculture Note T- Target A- Achievement
Table 93 State wise Physical and Financial Targets amp Achievements during 2008-09
State 2008-09
Physical (ha) Financial (Rs in lakh) T A A T A A
AP 85209 123581 14503 972731 1083556 11139 Bihar - 313 - - 2153 - Chhattisgarh 13633 3057361 22426 95445 206025 21586 Gujarat 33563 53427 15918 489861 739585 15098 Haryana 32404 2230169 6882 120728 127771 10583 Karnataka 84167 926223 11005 731866 584508 7987 Maharashtra 128758 100410 7798 1474806 1344402 9116 Odisha 3752 249553 6651 33794 29278 8664 Rajasthan 40231 77729 19321 238231 300915 12631 Sikkim - - - - - - Tamil Nadu - 1159735 - - 236721 - UP 1378 128748 9343 150 23512 15675 Uttarakhand - - - - - - Grand Total 423095 516338 12204 4172462 4678426 11213
Source Ministry of Agriculture Note T- Target A- Achievement
Impact Evaluation Study on ldquoNational Mission on Micro Irrigation (NMMI)rdquo
138
Table 94 State wise Physical and Financial Targets amp Achievements during 2009-10
State 2009-10
Physical (ha) Financial (Rs in lakh) T A A T A A
AP 114453 138341 12087 143107 178287 12458 Bihar NA 10748 - NA 1083 - Chhattisgarh 17636 1577119 8943 125198 119345 9533 Gujarat 33326 662491 19879 444727 542648 12202 Haryana 1576 325767 20670 21169 38539 18205 Karnataka 81311 10820517 13308 63813 868532 13611 Maharashtra 84673 94507 11161 1070708 1322628 12353 Odisha 7578 12776 16859 5284 87116 16487 Rajasthan 85211 95556 11214 569315 607335 10668 Sikkim - - - - - - Tamil Nadu - 1800803 - - 25583 - UP - 197413 - - 38114 - Uttarakhand - - - - - - Grand Total 425764 55475277 13030 4353157 5664040 13011
Source Ministry of Agriculture Note T- Target A- Achievement
Table 95 State wise Physical and Financial Targets amp Achievements during 2010-11
State 2010-11
Physical (ha) Financial (Rs in lakh) T A A T A A
AP 165500 122758 7417 24000 24000 100 Bihar - 1348504 - - 82588 NA Chhattisgarh 28780 2183093 7585 1019 1801 17674 Gujarat 80338 78294 9746 12000 1200002 100 Haryana 4426 93402 21103 136081 140227 10305 Karnataka 72700 87447 12028 9254 894525 9666 Maharashtra 11802508 11802508 100 22237 2226538 10013 Odisha 934092 1201396 12862 810 69682 8603 Rajasthan 148000 147613 9974 12000 11620 9683 Sikkim - - - - - - Tamil Nadu 35000 2615316 7472 6591 779718 1183 UP 5590 3108632 5561 8123 383 4715 Uttarakhand - - - - - - Grand Total 667700 640069 9586 9008411 917368 10183
Source Ministry of Agriculture Note T- Target A- Achievement
Impact Evaluation Study on ldquoNational Mission on Micro Irrigation (NMMI)rdquo
139
Table 96 State wise Physical and Financial Targets amp Achievements during 2011-12
State 2011-12
Physical (ha) Financial (Rs in lakh) T A A T A A
AP 88951 105063 11811 28720 28720 10000 Bihar 1961 2329428 118788 450 216683 48152 Chhattisgarh 17174 1839363 10710 3500 3500 10000 Gujarat 130294 6510182 4997 16664 1669505 10019 Haryana 6118 578608 9457 1993 166661 8362 Karnataka 63169 58013 9184 10965 9165 8358 Maharashtra 271935 11599894 4266 24980 24980 10000 Odisha 11523 1183659 10272 823 89288 10849 Rajasthan 107072 122183 11411 13095 128239 9793 Sikkim - 50969 - 400 400 10000 Tamil Nadu - 2755054 - 6625 6625 10000 UP - 379086 - - 44088 - Uttarakhand - NA - 75 - - Grand Total 698197 55752143 7985 108290 10807615 9980
Source Ministry of Agriculture Note T- Target A- Achievement
Table 97 State wise Physical and Financial Targets amp Achievements during 2012-13
State 2012-13 (March 13)
Physical (ha) Financial (Rs in lakh) T A A T A A
AP 131685 76065 5776 2899332 270209 9320 Bihar 50571 41372 8181 5200 5340 10269 Chhattisgarh 19118 14017 7332 3172 26778 8442 Gujarat 103381 96232 9308 18200 18201 10001 Haryana 9277 6538 7048 3000 257105 8570 Karnataka 107127 88605 8271 14065 1512195 10751 Maharashtra 127751 76620 5998 15018 15221 10135 Odisha 17516 19605 11193 2000 168953 8448 Rajasthan 98400 78535 7981 11000 1034708 9406 Sikkim 392 - - 200 - - Tamil Nadu 37320 26538 7111 8300 13235 15946 UP 11245 2143 1906 595 393 6605 Uttarakhand 1005 215 2139 150 70 4667 Grand Total 714788 526485 7366 10989332 11188831 10182
Impact Evaluation Study on ldquoNational Mission on Micro Irrigation (NMMI)rdquo
140
Annexure III Questionnaires
Beneficiary Farmerrsquos Questionnaire
1 General information Name of Farmer ( कसान का नाम) ----------------------------------------- Age (उ ) ------ Yrs
Village (गाव) ---------------------------------Block( लॉक)---------------------------------------------
District(िजला)------------------------------------State(रा य (---------------------------------------- Contact No (Mob)----------------------------- Landline (with STD code) -------- ------------------- E-mail id-----------------------------------------------------------------------------------------------------
2 Education status ( श ा क ि थ त)
1 Not educated(अ श त) 2 Primary( ाथ मक) 3 High school (हाई कल) 4 Sr Secondary (व र ठमा य मक) 5Graduate and above( नातकऔरऊपर)
3 Gender ( लग) - 1 Male(प ष) 2 Female (म हला)
4 Categories of farmers( कसान का जा त वग) - 1Gen(सामा य)2 OBC (अ य पछड़ा वग) 3 ST (अनस चत जनजा त) 4 SC)अनस चत जा त)
5 Land holding (भ म धारण) 1 Own land ( वयक )helliphelliphellip Acre 2 Leased in ( कराए
ल )helliphellip Acre 3Leased out ( कराय द )helliphellip Acre
6 Land holding Category of farmers (Tick ()) 1 Marginal (सीमा त)(lt 25 Acre) 2Small (छोट) (25-5 Acre) 3 Semi medium (अध - म यम )
(5-10 Acre) 4Medium (म यम) (10-25 Acre) 5 Large(बड़) (ge25Acre)
7 When the MI system was installed MI उपकरण कब लगाया गया------------------ (DDMMYY) ------ Yr
8 How did you get to know about the MI schemeआपको स म सचाई योजना कबार म
जानकार कस ह ई
Other Farmers
Advertisements व ापन Extension worker
Supplier
Any other (Specify) Radio Newspaper TV Pamphlet
Code 1 2 3 4 5 6 7 8
Impact Evaluation Study on ldquoNational Mission on Micro Irrigation (NMMI)rdquo
141
9 Which crops do you grow (आप कौन सी फसल पदा करत ह) S No
Crops फसल Name of the crop फसलकानाम
Spacing (mxm) अतराल
Area Covered (Acre)
Area Covered under MI(Acre)
Drip Sprinkler
1 Horticultural बागवानी
a Fruits फल
Veg सि जया
Flowerफल
Othersअ य
2 Non-Horticultural a b
Total Area (Acre)
10 Plantcrop management techniques used या आपन कोई फसल बधन क तकनीक इ तमाल
क ह a 1-Yes 2-No if yes then
b Area utilization (Acre)जमीन का उपयोग S No Land Before NMMI After NMMI
1 Agriculture a Horticulture crops b Field crops
2 Permanent waste Barren बजर एव अनपयोगी जमीन
3 Total Area (Acre)
8 Introduction of new crops amp spacing followed due to MI अपनाई गयी नयी फसल और
अ तराल S No Crop Spacing (mxm) 1 2
9 Irrigation Water Detailsपानी का ववरण
a Source ोत Bore well Canals Farm Ponds Water body Any other Code 1 2 3 4 helliphelliphelliphelliphelliphelliphelliphelliphelliphelliphelliphelliphelliphelliphelliphelliphelliphelliphelliphellip
b Water table helliphelliphelliphellipFt
SNo Intercropping before MI MI क पहल अतर फसल (Crops)
Intercropping after MI MI क बाद अतर फसल (Crops)
Crop Spacing (mxm) Crop Spacing (mxm) 1
2
3
Impact Evaluation Study on ldquoNational Mission on Micro Irrigation (NMMI)rdquo
142
10 Quality ofsoiland Irrigation water मटट और सचाई क पानी क गणव ता
Have you got soil amp water tested 1-yes 2-No if yes then S No Soil quality Response S No Water quality Response
i pH i pH ii EC iii EC
11 Why did you adopt NMMI schemeआप न इस योजना को य अपनाया Code Reasons Code Reasons 1 Because of subsidyअनदान क कारण 2 Quality of produceउ पाद क गणव ता 3 Water savingपानी क बचत 4 Proper utilization of land
जमीन का ठ उपयोग 5 Labor savingमजदर क बचत 6 Time savingसमय क बचत 7 Fertilizer savingउवरक क बचत 8 Early fruitingज द फलन 9 More productionअ धक उ पादन 10 Other specify_______________________
12 Impact of MI SNo Particulars Units Before MI After MI
a Irrigated Area स चत Acre
b Cost of irrigation सचाई क लागत RsAcre
c Electricity used बजल काउपयोग Hrsday
d Fertilizer usedउवरकोकाउपयोग KgAcre
e Productivity
b Fruits फल QtlsAcre
c Veg सि जया QtlsAcre
d Flowerफल QtlsAcre
e Othersअ य QtlsAcre
Non-Horticultural QtlsAcre f Incomeआय RsAcre
13 Have you got training of MI system या आपको NMMI योजना का श ण मला ह1-yes 2-No If Yes then
i By whom you got training of MI system Agencies SAUs
KVKs State Govt agencies
Kisan call centers
PFDC System supplier Others(Specify)
Code 1 2 3 4 5 6
ii Training Details (Duration (अव ध)helliphelliphellipDays)
S No Particulars 1-Yes 2-No 1 Is training material provided या श ण साम ी द जातीह
Impact Evaluation Study on ldquoNational Mission on Micro Irrigation (NMMI)rdquo
143
SAU= State Agricultural University PFDC= Precision Farming Development Centre iii Promotional activities
Awareness descriptionजाग कताकावणन 1-Yes 2-No
a Publicity of the MI Scheme in local language
इस योजना का चार थानीय भाषा म होता ह
b Whether there is a dedicated website for MI Scheme in the State
या आप क रा य म इस योजना को सम पत कोई वबसाईट ह
c Whether online applications are received
या आप क रा य म ऑनलाइन अिजया ल जाती ह
d Are you aware about package of practices being adopted for MI
या आप स म सचाई क इ तमाल करन क काय णाल को समझत ह
14 Subsidy Detailsअनदान का ववरण i
Financial assistanceआ थक सहायता
Govt () Beneficiary लाभाि वत()
Total system cost (Rs)उपकरण क लागत
Drip
Sprinkler
ii Time taken in subsidy disbursement (Days) अनदा नत राशी मलन म लगा समय ( दन म) i Application to Sanction -helliphelliphelliphelliphellipdays
ii Sanction to Installation -helliphelliphelliphelliphellipdays
2 Topic covered in the training श ण
क म
i Operation of the systemउपकरण क काय णाल
ii Maintenance of the systemउपकरण का रखरखाव
iii Package of practices for the cropsफसल क उगान क प त
iv Opportunities for Introduction of new crop नयी फसल क प रचय क ग जाइश
v Other related schemesकोई अ य स ब धत योजना
3 Have you joined any field visit या कसी खत का मआइना कया ह
4 Are you satisfied with the Learning या आपको मल पर श ण स आप सत ठ ह
Impact Evaluation Study on ldquoNational Mission on Micro Irrigation (NMMI)rdquo
144
15 Finance a Source of beneficiary share of MIलाभाि वत क ह स का ोत
1Own sources
2Banks Namehelliphelliphelliphelliphelliphelliphellip
3KCC 4Money lenders
5Any other helliphelliphelliphelliphelliphelliphelliphelliphelliphelliphelliphelliphelliphelliphelliphellip
b Rate of Interest (if money borrowed then) याज क दर (उधार लन क ि थ त म)
16 Availability of electricity बजल क उपल धता helliphelliphelliphellipHrs day
17 Power of the pump set you are using प प सट क मताhelliphelliphelliphellipHP
18 Type of fertilizer used by the farmer उपयोग म लए गए उवरक का कार
i 1 Organic 2 Inorganic 3 Both ii 1 Liquid 2Water soluble 3Solid
19 Type of Irrigation Filters used by the farmers कसान वारा इ तमाल कय जान वाल सचाई फ टर क कार
Type of Filters फ टर क कार Code
Hydro-cyclone Filterहाइ ो-साय लोन फ़ टर 1
Screen filters न फ़ टर 2
Sand Media Filtersसड मी डया फ़ टर 3
Disc Filters ड क फ़ टर 4
Any other specifyअ य ( वशष ववरण)_________________________________________
20 Employment opportunities(रोजगार क अवसर) S No Particular No of man days
before NMMI No of man days after NMMI
1 Pre harvest practices कटाई क पहल क या
2 Harvesting कटाई
3 Post-harvest handling कटाई क बाद क या
Interest rate याज दर 3-7 7-10 10-12 12-15 gt15
Code 1 2 3 4 5
Impact Evaluation Study on ldquoNational Mission on Micro Irrigation (NMMI)rdquo
145
21 Assessment of System Design णाल का आकलन
Particulars 1-Yes2-No
a Whether various system components supplied to you are as per the BIS
या आपको दए गए उपकरण क सभी ह स BISमानक क अन प ह
b Whether pump size is proper to the field plot size wrt crop water requirements
या आपक वारा लगाय गए पप का आकार आप क खत क आकार और उसम बोई गयी फसल एव उपल ध पानी क अन प ह
c Does this MI system meet your requirements
या यह MI उपकरण आपक ज रत को परा करता ह
d Is this design layout is as per your project proposal
या इस उपकरण का खाका आप क ताव क अन प ह
e Whether after sales service has been received by you from the MI system suppliers या आपको उपकरण उपल ध करान वाल न उपकरण बचन क बाद कोई सवा दान क ह
f Whether the MI systems were found to be functional in the field
या MI उपकरण खत म सचा प स काम कर रहा ह
22 System supplier
i BrandManufacturer of MI equipment usedउपकरण का नमाताhelliphelliphelliphelliphelliphelliphelliphelliphelliphelliphelliphelliphelliphelliphelliphelliphelliphelliphelliphelliphelliphelliphelliphelliphelliphelliphelliphelliphelliphelliphelliphelliphelliphelliphelliphelliphellip
ii Reasons for buying from them उनस खर दन का कारण Local Govt official Other farmers company reps Advertisements
Code 1 2 3 4
iii After sales services ब क बाद द जान वाल सवाए
Impact Evaluation Study on ldquoNational Mission on Micro Irrigation (NMMI)rdquo
146
i Is it provided by the vendor व ता वारा द जाती ह 1-Yes2-No if yes then
ii Level of satisfaction of the serviceसवा स सत ठ का तर
iii Warranty 1-Yes2-No if yes thenवारट य द ह तो
lt6 Months 1 Yr 1-2 Yr 2-3 Yr gt3 Yr Code 1 2 3 4 5
23 Difficulty faced by the farmer in NMMI
schemeNMMIयोजनाकोअपनानमउठाईगयीपरशा नया S No Particulars 1-Yes 2-No 1 Procedure related या स स ब धत
2 Quality issuesगणव ता स स ब धत
3 Higher prices charged under scheme of the system then available in marketउपकरण क बाज़ार भाव स अ धक क़ मत
4 Delay in system supply (Committed date vs Actual date ) उपकरण क आप त म दर
5 Other charges (Not covered in the scheme additional money paid) अ त र त भगतान
6 After sale services are not up to the mark बचन क बाद द गयी सवाए सतोषजनक नह
7 Other specify__________________________________________________________
24 Would you like to recommend this scheme to others या आप इस योजना को अपनान क
सलाह अ य को दग 1-Yes 2-No
Share your experiencesअपना अनभव बताए helliphelliphelliphelliphelliphelliphelliphelliphelliphelliphelliphelliphelliphelliphelliphelliphelliphelliphelliphelliphelliphelliphelliphelliphelliphelliphelliphelliphelliphelliphelliphelliphelliphelliphelliphelliphelliphelliphelliphellip helliphelliphelliphelliphelliphelliphelliphelliphelliphelliphelliphelliphelliphelliphelliphelliphelliphelliphelliphelliphelliphelliphelliphelliphelliphelliphelliphelliphelliphelliphelliphelliphelliphelliphelliphelliphelliphelliphelliphellip
1timely 2 Late 3 Irregular
1Satisfied 2 Not satisfied 3 Indifferent
Impact Evaluation Study on ldquoNational Mission on Micro Irrigation (NMMI)rdquo
147
25 Any other socio economic benefits you would like to mention कोई अ य सामिजक- आ थक लाभ i helliphelliphelliphelliphelliphelliphelliphelliphelliphelliphelliphelliphelliphelliphelliphelliphelliphelliphelliphelliphelliphelliphelliphelliphelliphelliphelliphelliphelliphelliphelliphelliphelliphellip
ii helliphelliphelliphelliphelliphelliphelliphelliphelliphelliphelliphelliphelliphelliphelliphelliphelliphelliphelliphelliphelliphelliphelliphelliphelliphelliphelliphelliphelliphelliphelliphelliphellip 26 Any suggestion for the better implementation of NMMI Scheme
NMMI योजना को सह तर क स लाग करन क लए आप क या सझाव ह
i helliphelliphelliphelliphelliphelliphelliphelliphelliphelliphelliphelliphelliphelliphelliphelliphelliphelliphelliphelliphelliphelliphelliphelliphelliphelliphelliphelliphelliphelliphelliphelliphelliphelliphellip ii helliphelliphelliphelliphelliphelliphelliphelliphelliphelliphelliphelliphelliphelliphelliphelliphelliphelliphelliphelliphelliphelliphelliphelliphelliphelliphelliphelliphelliphelliphelliphelliphellip
iii helliphelliphelliphelliphelliphelliphelliphelliphelliphelliphelliphelliphelliphelliphelliphelliphelliphelliphelliphelliphelliphelliphelliphelliphelliphelliphelliphelliphelliphelliphelliphelliphelliphelliphellip
27 Whether MI System is installed in the entire land holding Yes No 28 Any MI demonstration nearby (Yes No) 29 Type of Sprinkle (1-Portable 2-semi-permanent 3-rain gun) 30 Type of Drip (1-Inline 2-online) 31 Observations of the investigator
Condition of the MI System at the time of visit (1-Functional 2-Not Functional)
i Overall design (1-Good 2-Satisfactory 3-Bad) ii General condition of the field (1-Good condition 2-Average condition 3- Bad
condition) iii Whether Farmers are using flood irrigation along with MI system (1-Yes 2-No) iv Whether choice of drip sprinkler MI system match with the crop requirement
(1-Yes 2-No) Signature of farmer Investigatorrsquos Name कसान का ह ता र जाचकता का ह ता र
Date दनाक
Impact Evaluation Study on ldquoNational Mission on Micro Irrigation (NMMI)rdquo
148
Non-beneficiary Farmerrsquos Questionnaire)
1 General information Name of Farmer ( कसान का नाम) ----------------------------------------- Age (उ ) --------- Yrs
Village (गाव) ---------------------------------- Block( लॉक)--------------------------------------------
District(िजला)------------------------------------State(रा य----------------------------------------- Contact No (Mob)----------------------------- Landline (with STD code) -------- ------------------- E-mail id------------------------------------------------------------------------------------------------------
2 Education status ( श ा क ि थ त)
1 Not educated(अ श त) 2 Primary( ाथ मक( 3 High school (हाई कल) 4 Sr Secondary (व र ठमा य मक) 5Graduate and above( नातकऔरऊपर)
3 Gender ( लग) - 1 Male(प ष) 2 Female (म हला) 4 Categories of farmers( कसान का जा त वग) - 1Gen(सामा य)2 OBC (अ य पछड़ावग)
3 ST (अनस चत जनजा त) 4 SC)अनस चत जा त)
5 Land holding (भ म धारण) 1 Own land ( वयक )helliphelliphellip Acre 2 Leased in ( कराए ल )helliphellip Acre 3Leased out
( कराय द )helliphellip Acre
6 Land holding Category of farmers (Tick ()) 1 Marginal (सीमा त)(lt 25 Acre) 2Small (छोट) (25-5 Acre) 3 Semi medium (अध - म यम ) (5-10 Acre) 4Medium
(म यम) (10-25 Acre) 5 Large (बड़) (ge25Acre)
7 Are you aware about the NMMI scheme याआप NMMI योजना क बार म जानत ह 1-Yes 2-No
If Yes then how did you get to know about the MI scheme आप को स म सचाई योजना क बार म जानकार कस ह ई
Other Farmers
Advertisements व ापन Extension worker
Supplier Any other (Specify)
Radio Newspaper TV Pamphlet Code 8 9 10 11 12 13 14 8
8 Which crops do you grow (आप कौन सी फसल पदा करत ह)
S No Crops फसल Name of the crop फसल का नाम Spacing(mxm) Area Covered (Ha)
3 Horticultural बागवानी
f Fruits फल
g Veg सि जया
h Flowerफल
i Others अ य
4 Non-Horticultural a b
Total Area (Ha)
a Area utilization(Acre)जमीन का उपयोग S No Land Response 4 Agriculture c Horticulture crops
d Field crops 5 Permanent waste Barren बजर एव अनपयोगी जमीन
Impact Evaluation Study on ldquoNational Mission on Micro Irrigation (NMMI)rdquo
149
6 Total Area (Acre)
10 Irrigation Water Detailsपानीका ववरण
a Source ोत Bore well Canals Farm Ponds Water body Any other Code 5 6 7 8 helliphelliphelliphelliphelliphelliphelliphelliphelliphelliphelliphelliphelliphelliphelliphelliphelliphelliphelliphellip
b Water table helliphelliphelliphellipFt
11 Why did you not taken advantage of NMMI scheme आपन NMMIयोजनाकालाभ य नह लया
Code Reasons Code Reasons 11 Less aware of subsidy
अनदान क बार म अन भ 12 Less technical knowledge
तक नक ान नह 13 Lengthy procedureल बी या 14 High capital cost involvedअ धक लागत 15 Not economicalआ थक नह 16 EmittersrsquoNozzlesrsquo frequent clogging
ट ट का बार बार अव होना 17 Application yet not cleared अभीअज पास नह ह यी
18 Any other Specify________________________ ____________________________
12 Have you participated in any training program of NMMI याआपको NMMI योजनाका श ण मला ह1-Yes 2-No If Yes then
a By whom you got training of MI system
Agencies SAUs KVKs
State Govt agencies
Kisan call centers
PFDC System supplier Others(Specify)
Code 1 2 3 4 5 6
b Training Details (Duration (अव ध)helliphelliphellipDays)
SAU= State Agricultural University PFDC= Precision Farming Development Centre
c Promotional activities
Awareness descriptionजाग कता का वणन 1-Yes 2-No
e Publicity of the MI Scheme in local language इस योजना का चार थानीय भाषा म होता ह
f Whether there is a dedicated website for MI Scheme in the State
S No Particulars 1-Yes 2-No 5 Is training material provided या श ण साम ी द जाती ह
6 Topic covered in the training श ण क
म
vi Operation of the systemउपकरण क काय णाल
vii Maintenance of the systemउपकरण का रखरखाव
viii Package of practices for the cropsफसल क उगान क प त
ix Opportunities for Introduction of new crop नयी फसल क प रचय क ग जाइश
x Other related schemesकोई अ य स ब धत योजना
7 Have you joined any field visit या कसी खत का मआइना कया ह
8 Are you satisfied with the Learning या आपको मल पर श ण स आप सत ठ ह
Impact Evaluation Study on ldquoNational Mission on Micro Irrigation (NMMI)rdquo
150
या आपक रा य म इस योजना को सम पत कोई वबसाईट ह g Whether online applications are received
या आप क रा य म ऑनलाइन अिजया ल जाती ह
h Are you aware about package of practices being adopted for MI या आप स म सचाई क इ तमाल करन क काय णाल को समझत ह
13 Availability of electricity बजल क उपल धता helliphelliphelliphellipHrs day
14 Type of fertilizer used by the farmer उपयोग म लए गए उवरक का कार a 1 Organic 2 Inorganic 3 Both b 1 Liquid 2Water soluble 3Solid
15 Difficulty faced by the farmer in NMMI scheme NMMIयोजना को अपनान म उठाई गयी परशा नया S No Particulars 1-Yes 2-No 8 Procedure related या स स ब धत
9 Quality issuesगणव ता स स ब धत
10 Higher prices charged under scheme of the system then available in marketउपकरण क बाज़ार भाव सअ धक क़ मत
11 Delay in system supply (Committed date vs Actual date ) उपकरण क आप त म दर
12 Other charges (Not covered in the scheme additional money paid) अ त र त भगतान
13 After sale services are not up to the mark बचन क बाद द गयी सवाए सतोषजनक नह
14 Other specify__________________________________________________________
16 Do you like to adopt this scheme in near future या आप इस योजना को भ व य म अपनाना चाहग 1-Yes 2-No Why helliphelliphelliphelliphelliphelliphelliphelliphelliphelliphelliphelliphelliphelliphelliphelliphelliphelliphelliphelliphelliphelliphelliphelliphelliphelliphelliphelliphelliphelliphelliphelliphelliphelliphelliphelliphelliphelliphelliphelliphelliphelliphelliphellip helliphelliphelliphelliphelliphelliphelliphelliphelliphelliphelliphelliphelliphelliphelliphelliphelliphelliphelliphelliphelliphelliphelliphelliphelliphelliphelliphelliphelliphelliphelliphelliphelliphelliphelliphelliphelliphelliphelliphelliphelliphelliphelliphellip
17 Would you like make any suggestion for the better implementation of NMMI Scheme NMMI योजना को सह तर क स लाग करन क लए आपक या सझाव ह
i helliphelliphelliphelliphelliphelliphelliphelliphelliphelliphelliphelliphelliphelliphelliphelliphelliphelliphelliphelliphelliphelliphelliphelliphelliphelliphelliphelliphelliphelliphelliphelliphelliphelliphellip ii helliphelliphelliphelliphelliphelliphelliphelliphelliphelliphelliphelliphelliphelliphelliphelliphelliphelliphelliphelliphelliphelliphelliphelliphelliphelliphelliphelliphelliphelliphelliphelliphellip
iii helliphelliphelliphelliphelliphelliphelliphelliphelliphelliphelliphelliphelliphelliphelliphelliphelliphelliphelliphelliphelliphelliphelliphelliphelliphelliphelliphelliphelliphelliphelliphelliphelliphelliphellip Signature of farmer Investigatorrsquos Name कसानकाह ता र जाचकताकाह ता र
Date दनाक
Impact Evaluation Study on ldquoNational Mission on Micro Irrigation (NMMI)rdquo
151
Annexure IV Reason of higher cost of drip in Gujarat During the survey in 13 states 5892 sampled farmers holding 1481058 hectares of land were interacted Analysis of data reveals that average unit cost of drip irrigation system ranges between from 5445736 Rsha to 7208631 Rsha The average cost of drip system installation was found to be highest in Gujarat followed by Chhattisgarh Tamil Nadu Maharashtra Sikkim UP Karnataka Rajasthan Andhra Pradesh Haryana Bihar and Odisha Analysis was carried out to find out reasons for higher average unit cost of drip irrigation system in Gujarat as compared to other States Following reason are given in support
I The per cent of area coverage under sprinkler irrigation system in Gujarat is 1169 and in other states it is 8830 per cent The average cost of sprinkler irrigation system is Rs 18000 ha against Rs 55000 Rsha of drip irrigation system
II The more per cent of area coverage under drip irrigation system in Gujarat lead to higher average cost
III Figure- 1 shows area coverage under 0-10 m2 spacing it could be seen from the figure that Gujarat is far ahead from other states in term of area coverage in close spacing crops When area covered under other spaced crops is compared UP stand at 1st position in term of area coverage under wide space crops and Gujarat cover very least as can be seen from figure1
Figure 15 Area coverage under close spacing crops (spacing range lt10 m2)
Impact Evaluation Study on ldquoNational Mission on Micro Irrigation (NMMI)rdquo
152
IV When compared average unit cost per ha of drip irrigation system as per NMMI guideline the average unit cost in closed spacing crops (0-10 m2) stand at 264 times higher than the average unit cost of wide spacing crops (Spacing range more than 10 m2)
Figure 17 Spacing wise unit cost (Rsha) of drip irrigation system as per NMMI guideline
Figure 16 Area coverage under wide spacing crops (spacing range more than spacing range 10 m2
Impact Evaluation Study on ldquoNational Mission on Micro Irrigation (NMMI)rdquo
153
It is also pertinent to mention that financial assistant for installation of drip system in Gujarat is given at actual unit cost rather than as recommended in NMMI guideline which is being adopted in all states other than Gujarat In Gujarat the additional amount is given by state exchequer which escalates invoice value resulting in higher average cost
Impact Evaluation Study on ldquoNational Mission on Micro Irrigation (NMMI)rdquo
154

2
i
i
PREFACE
The growing need for food security and increased population has resulted in higher demand for irrigation water which could only be met by judicious use of available water resources The Government therefore launched a Centrally Sponsored Scheme on Micro Irrigation in January 2006 with the an objective to increase the area under improved methods of irrigation for better water use efficiency to provide stimulus to agricultural growth The scheme was further upscaled into Mission Mode in 2010 as the National Mission on Micro Irrigation (NMMI) The Mission has now completed almost 8 years and has made significant progress in achieving its objectives The Department of Agricultural and Cooperation in association with National Committee on Plasticulture Applications in Horticulture (NCPAH) therefore selected Ms Global AgriSystem Pvt Ltd to undertake the Impact Evaluation Study in 13 selected States The study was carried out in 64 districts of the country and more than 7400 beneficiaries and non-beneficiaries were interviewed The study reveals that the scheme has benefitted the farmers in term of enhanced productivity and reduced cost on electricity and fertilizers The average productivity of fruits and vegetables has increased about 4230 percent and 5280 percent respectively Besides the Scheme has also succeeded in reducing the irrigation cost which was found to have been reduced by 20-50 percent with average of 3230 percent Use of micro irrigation system has also helped the farmers in cutting down the electrical consumption which was found to have been reduced by about 31 percent Successful implementation of the Scheme has also led to average reduction in fertilizer usage with average reduction of about 28 percent in total fertilizer consumption in the surveyed states The study received continuous support and encouragement from Mr Sanjeev Chopra Joint Secretary amp Mission Director (MIDH) MoA Government of India and I extend my heartfelt thanks to Mr Chopra for his continuous support and guidance in preparing this report We gratefully extend our appreciation to Mr Krish S Iyengar Executive Director and Mr Naresh Modi Mr Alok Mishra Mr Rohit Lall of the National Committee of Plasticulture Application in Horticulture (NCPAH) for sparing their valuable time to guide us during the entire project duration We also appreciate the help provided by Mrs Sadhna Khanna under Secretary MoA GoI and Dr Jose C Samuel Chief Consultant (NHM)
ii
It would have been impossible to complete this study without the support of 7400 farmers and other stakeholders such as system suppliers financial institutions NGOs PRIs etc spread over 13 states We extend our gratitude to these farmers who deserve special appreciation for extending their willing cooperation in giving their valuable time responding to the questionnaire and share their views and concerns during the field study We also take opportunity to thank State Agriculture as well as Horticulture Department amp other stakeholders of the 13 States where the study was undertaken Members of the team have put in lots of hard work and duly deserve appreciation for carrying out the survey Prof BK Sikka Agro Economist and Prof JN Raina eminent Soil Scientist deserve our special appreciation for their guidance
If the study helps the policy makers to make this scheme more effective and useful we would feel that the effort has been worth it
Gokul Patnaik (Chairman)
i
Table of Contents Contents Executive Summary I
1 Introduction 1
11 Project Background 1
12 Salient Features of the Scheme 2
13 The Assignment 4
14 Objectives of the Study 4
2 Approach and Methodology 5
21 Approach 5
22 Methodology 6
221 Sources of Data Collection 7
222 Sampling 8
223 The Sample Design 8
224 Selection of Beneficiaries and Non-beneficiaries 9
23 Limitations of the Study 11
3 Assessment of Current Status 13
31 Performance of MI Scheme 13
32 State wise Performance 15
33 Targets and Achievements 15
34 Performance of Scheme for Area Coverage as Compared to Potential 21
35 Pattern of Assistance 22
351 Indicative Cost of Installing Micro Irrigation System 22
352 State-wise Pattern of Assistance 23
353 Quantum of Subsidy and Adoption of MI System by Farmers 24
354 State Implementing Agencies 25
355 Extent of Convergence with Other Schemes 26
356 Food Security and the Micro Irrigation Scheme 27
36 Mission Structure Review 29
361 National Level 29
362 State Level Micro Irrigation Committee (SMIC) 30
ii
363 District Level Micro Irrigation Committee (DMIC) 33
364 Improving Efficacy of the Institutional Mechanism 34
37 Role of Panchayati Raj Institutions (PRIs) in NMMI Scheme 35
4 Primary Survey Respondentsrsquo Profile and Findings 36
41 Demographic Profile (Sampled Beneficiaries amp Non-beneficiaries) 36
411 Size of Land Holding 36
412 Categories of Farmers 38
413 Gender 39
414 Educational Status 39
415 Status of Communication Facilities 41
42 Results and Discussions 42
421 Quality of soil and irrigation water 42
422 Sources of Irrigation 44
423 Water Table 45
424 Sources of Awareness about NMMI Scheme 46
425 Reasons for Non-adoption of Micro Irrigation Systems 48
426 Willingness of Non Beneficiaries to Adopt MI System 49
427 Progress of Installation of MI System 50
428 Average Cost of Installing the MI System 50
429 Factors Influencing Farmers to Adopt MI system 51
4210 Subsidy Disbursement 52
4211 Sources of Margin Money 53
4212 Interest Rates on Borrowing 53
4213 Type of MI system and Area Coverage 54
4214 System Demonstration 64
4215 Training and Capacity Building 64
4216 Availability of Electricity 68
4217 Capacity of Pump Sets 69
4218 Irrigation Filters 69
4219 Type of Emitters in drip system 72
4220 Type of Sprinkler 73
4221 Farmersrsquo opinion on System Supply and Installation related constraints 74
4222 After Sales Service 75
iii
4223 Warranty 77
4224 Promotional Activities 78
43 Observations of Field Staff on MI System 79
44 Assessment of the System Design 80
45 System Suppliers 82
5 Impact Evaluation 87
51 Crop Diversification 87
52 Area Expansion under Micro Irrigation 89
53 Increase in Irrigated Area due to Water Saving 89
54 Development of marginal and wasteland by beneficiaries 90
55 Dripper spacing 91
56 Reduction in Cost of Irrigation 94
57 Electricity Consumption 94
58 Economy in Fertilizer Use 95
59 Increase in Crop Productivity 96
510 Reduction in these Cost of Inputs of Irrigation amp Productivity Enhancement Crop-wise 98
511 Introduction of New Crops 102
512 Increase in Farmerrsquos Income 104
513 Benefit-Cost Ratio 105
514 Increase in Area 108
515 Potential area that can be brought under Micro Irrigation 109
516 Employment Opportunities 110
5161 On Farm Employment Generation 111
5162 Off-Farm Employment Generation 111
517 Impact on Employment 111
6 Conclusions amp Recommendations 113
References 125
Appendices 127
iv
Annexure I Processes of Implementation 127
Annexure II State wise Physical amp Financial Targets amp Achievements 136
Annexure III Questionnaires 140
List of Tables
Table 1 Methodology Adopted for Impact Assessment 6 Table 2Sampling Plan 8 Table 3 State wise List of Sampled Districts Covered in the Study 9 Table 4 State wise Sample Distribution for the Study 10 Table 5 Year wise Area under Different MI Systems of Sampled Beneficiaries 14 Table 6 Comparison of Subsidy between Pre and Post NMMI Scheme 14 Table 7 State wise Cumulative Physical amp Financial Targets and Achievements 16 Table 8 Year wise Cumulative Physical and Financial Targets and Achievements 17 Table 9 Year amp State wise Physical Targets and Achievements (lsquo000rsquo ha) 19 Table 10 Year and State wise Financial Targets and Achievements (Rs Crores) 20 Table 11 Potential and Actual area under Drip amp Sprinkler Irrigation 21 Table 12 State wise Quantum of Subsidy to Different Categories of Farmers 23 Table 13 State wise Quantum of Subsidy and Area Coverage 24 Table 14 State-Implementing Agencies for NMMI 25 Table 15 Performance of the Functioning of SMICs in Sampled States 32 Table 16 Performance of the Functioning of DMICs in Sampled States 34 Table 17 Land Holding Status of Beneficiary and Non Beneficiary Farmers 37 Table 18 Size and Distribution of Operational Holdings 38 Table 19 Category wise Proportion of Beneficiary and Non Beneficiary Farmers 38 Table 20 Gender Status of Beneficiaries and Non Beneficiaries 39 Table 21 Education Status of Beneficiaries and Non-beneficiaries 40 Table 22 Mobile Phone Ownership 41 Table 23 Extent of Soil Salinity (in sampled states) and Beneficiaryrsquos Responses on Soil and Water
Testing 43 Table 24 Extent of Awareness about Important Soil and Water Quality Parameters 44 Table 25 Source of Irrigation Water 45 Table 26 State wise Water Table Depth 45 Table 27 Sources of Awareness Reported by Beneficiaries () 47 Table 28 Source of Awareness of Scheme Reported by Non-beneficiary () 48 Table 29 Reasons for Non-adoption of NMMI Scheme () 49 Table 30 Willingness of Non-beneficiaries to Install MI System 49 Table 31 Year of Installation of MI System () 50 Table 32 Average Cost of Installing MI System (Rsha) 50 Table 33 Reasons for Adoption of Micro Irrigation Systems 51 Table 34 Farmerrsquos Responses for Time Taken to Sanction Subsidy () 52 Table 35 Source of Finance for Meeting Beneficiary Share for Installation of MI System 53 Table 36 Rate of Interest Paid by the Beneficiaries on Borrowed Funds 54 Table 37 Proportion of Farmers having Drip and Sprinkler MI Systems 54 Table 38 Drip amp Sprinkler System wise Area Coverage by Sampled Beneficiaries 55 Table 39 Crop wise Area Coverage under Drip and Sprinkler Systems in AP (Sampled Beneficiaries) 56
v
Table 40 Crop wise Area Coverage under Drip and Sprinkler Systems in Bihar (Sampled Beneficiaries) 56
Table 41 Crop wise Area Coverage under Drip and Sprinkler Systems in Chhattisgarh (Sampled Beneficiaries) 57
Table 42 Crop wise Area Coverage under Drip and Sprinkler Systems in Gujarat (Sampled Beneficiaries) 58
Table 43 Crop wise Area Coverage under Drip and Sprinkler Systems in Haryana (Sampled Beneficiaries) 58
Table 44 Crop wise Area Coverage under Drip and Sprinkler Systems in Karnataka (Sampled Beneficiaries) 59
Table 45 Crop wise Area Coverage under Drip and Sprinkler Systems in Maharashtra (Sampled Beneficiaries) 59
Table 46 Crop wise Area Coverage under Drip and Sprinkler Systems in Odisha (Sampled Beneficiaries) 60
Table 47 Crop wise area Coverage under Drip and Sprinkler Systems in Rajasthan (Sampled Beneficiaries) 61
Table 48 Crop wise Area Coverage under Drip and Sprinkler Systems in Sikkim (Sampled Beneficiaries) 61
Table 49 Crop wise Area Coverage under Drip and Sprinkler Systems in Tamil Nadu (Sampled Beneficiaries) 62
Table 50 Crop wise Area Coverage under Drip and Sprinkler Systems in UP (Sampled Beneficiaries) 63 Table 51 Crop wise Area Coverage under Drip and Sprinkler Systems in Uttarakhand (Sampled
Beneficiaries) 63 Table 52 Exposure of Beneficiary Farmers to MI Demonstrations 64 Table 53 Topic Covered in Training for Beneficiary Farmers 66 Table 54 Institution for Training as Reported by Respondents ( Beneficiaries) 67 Table 55 Availability of Electricity (Beneficiaries and Non Beneficiaries) 68 Table 56 Capacity of Pump Sets Used by Beneficiaries 69 Table 57 Type of Irrigation Filters Used by Farmers 71 Table 58 Type of Emitters Used by Beneficiaries 73 Table 59 Type of Sprinklers Used by Beneficiaries 74 Table 60 Constraints Faced by Beneficiary Farmers () 75 Table 61 Status Reported by Beneficiaries Regarding lsquoAfter Sales Servicesrsquo 76 Table 62 Status of Warranty for MI System () 77 Table 63 Awareness about Promotional Activities 78 Table 64 Observations of Surveyors regarding MI System Status at the Time of Field Visit 79 Table 65 Assessment of the System Design 81 Table 66 State Wise List of Registered MI System Suppliers 83 Table 67 Impact on Crop Diversification and Usage of Marginal and Degraded Land by
Beneficiaryrsquos data 88 Table 68 Increase reported by Beneficiaries in Irrigated Area (ha) after Installation of MI System 90 Table 69 Marginal Degraded Land brought under Cultivation after Installation of MI System by
Beneficiaries 91 Table 70 Spacing followed by Sampled Beneficiaries for Fruit Crops (m) 92 Table 71 Spacing followed by Sampled Beneficiaries for Vegetables Flowers and Other Crops (m) 93 Table 72 Reduction in Cost of Irrigation with MI system 94 Table 73 Reduction in Electricity Consumption 95 Table 74 Reduction in Fertilizer Consumption 96
vi
Table 75 Productivity Enhancement of Fruit Crops (MTha) 97 Table 76 Productivity Enhancement of Vegetable Crops (MTha) 97 Table 77 Crop wise Details of Reduction in Cost - Fruits 98 Table 78 Crop wise Details of Reduction in Cost - Vegetables 99 Table 79 Crop wise Details of Reduction in Cost - Flowers 101 Table 80 Crop wise Details of Reduction in Cost - Non-horticulture Crops 101 Table 81 Crops Adopted after Installation of MI System 102 Table 82 Extent of Adoption of New Crops after Installation of MI System 103 Table 83 Increase in Farmerrsquos Income 104 Table 84 Benefit Cost Ratio of MI System for Important Fruit Crops 106 Table 85 Benefit Cost Ratio of MI System for Important Vegetable Crops 107 Table 86 Benefit Cost Ratio of MI System for Important Floriculture Crops 108 Table 87 Percent Increase in Irrigated Area on Installation of MI System 108 Table 88 District wise Potential for Installation of MI System in Study Area 109 Table 89 Change in Manpower Requirement for Cultivation (per ha per crop cycle) 112 Table 90 State wise Physical and Financial Target amp Achievements during 2005-06 136 Table 91 State wise Physical and Financial Targets amp Achievements during 2006-07 136 Table 92 State wise Physical and Financial Targets amp Achievements during 2007-08 137 Table 93 State wise Physical and Financial Targets amp Achievements during 2008-09 137 Table 94 State wise Physical and Financial Targets amp Achievements during 2009-10 138 Table 95 State wise Physical and Financial Targets amp Achievements during 2010-11 138 Table 96 State wise Physical and Financial Targets amp Achievements during 2011-12 139 Table 97 State wise Physical and Financial Targets amp Achievements during 2012-13 139
List of Figures Figure 1 Percentage Annual Allocation (share in availability) of Water 1 Figure 2 States Covered for Study (Star Marked) 5 Figure 3 Physical and Financial Performance of NMMI Scheme 13 Figure 4 State wise Central Subsidy (Rs Crores) and Area Coverage (lsquo000rsquo ha) under NMMI 15 Figure 5 Year wise Targets and Achievements 17 Figure 6 State wise Cumulative Targets and Achievements (2005-06 to 2012-13) 18 Figure 7 Proportion of Area under Drip and Sprinkler Irrigation 22 Figure 8 Level of Satisfaction regarding lsquoAfter Sale Servicesrsquo 77 Figure 9 Increase in Irrigated Area () among Beneficiaries after Adoption of MI 90 Figure 10 Reduction in Fertilizer Consumption () 96 Figure 11 Extent of Adoption of New Crops by Beneficiaries () 103 Figure 12 Increase in the Income of Beneficiaries () 104 Figure 13 Subsidy Process under GGRC 130 Figure 14 Subsidy Process under APMIP 131
vii
Abbreviations Acronyms
AampC Agriculture amp Cooperation AP Andhra Pradesh APMIP Andhra Pradesh Micro Irrigation Project BIS Bureau of Indian Standards CHRBKB Chhattisgarh Rajya Beej and Krishi Vikas Ltd CIPET Central Institute of Plastic Engineering and Technology CSS Centrally Sponsored Scheme CWC Central Water Commission DMIC District Micro Irrigation Committee DoA Directorate of Agriculture DoH Directorate of Horticulture DRDA District Rural Development Agency EC Electrical Conductivity FGD Focused Group Discussion GAPL Global AgriSystem Pvt Ltd GGRC Gujarat Green Revolution Company GoI Government of India HDC Horticulture Development Society HDPE High Density Polyethylene HP Horse Power IA Implementing Agency ICT Information amp Communication Technology IEC Information Education amp Communication KGK Krishi Gyan Kendra KVK Krishi Vigyan Kendra MI Micro Irrigation MI System Micro Irrigation System Mha Million hectare Mhm Million hectare metre MIDH MoA Mission for Integrated Development Ministry of Agriculture MoWR Ministry of Water Resources NCPAH National Committee on Plasticulture Applications in Horticulture NHM National Horticulture Mission NMMI National Mission on Micro Irrigation PFDC Precision Farming Development Centre RKVY Rashtriya Krishi Vikas Yojana SAU State Agricultural University SC Scheduled Cast SMIC State Micro Irrigation Committee SPV Special Purpose Vehicle ST Scheduled Tribes ToR Terms of Reference UP Uttar Pradesh
Impact Evaluation Study of ldquoNational Mission on Micro Irrigation (NMMI)rdquo
I
Executive Summary Micro irrigation technologies (MI) are being promoted in India by the central and state governments by providing different kinds of financial institutional and technical support These technologies are promoted primarily as (1) a means to save water in irrigated agriculture (2) as a strategy to increase income and reduce poverty and (3) to enhance the food and nutritional security of rural households Despite the reported significant economic advantages and the concerted support of the government and NGOs the current area under micro irrigation in India remains an insignificant proportion of its potential Rising demand for irrigation water in the face of its inefficient use and concerns of growing water scarcity which has brought into renewed focus for conserving water and combating water scarcity including efforts in improving water use efficiency with the available water resources The real thrust on promoting MI adoption largely started with the recommendations of the Report of the Task Force on Micro Irrigation in 2004 The report sought to increase the emphasis on MI technology and recommended the Centrally Sponsored Scheme (CSS) in 2005-06 The Scheme was further upscaled into Mission Mode in 2010 to accelerate the rate of adoption of micro irrigation technologies under central sector programs
Government of India Ministry of Agriculture Department of Agriculture and Cooperation assigned the study on ldquoImpact Evaluation of National Mission on Micro Irrigation (NMMI)rdquo to access the performance of the programme implementation and access the impact of this Scheme on increase in farmersrsquo income through adoption of the MI system
The study was conducted in 13 states comprising of 64 districts in the sampled states namely Andhra Pradesh (AP) Bihar Chhattisgarh Gujarat Haryana Karnataka Maharashtra Odisha Rajasthan Tamil Nadu Sikkim Uttar Pradesh (UP) and Uttarakhand The field survey to get first-hand information was conducted for a total sample of 7400 comprising beneficiary and non-beneficiary farmers in these selected states by adopting stratifiedndashpurposive-sampling design Apart from this information was also collected from MI system suppliers and government officials under State Horticulture Mission and related departments Owing to promotional schemes introduced by the state and central governments the area under micro irrigation has increased from 11817 ha in 2005-06 to over 361
Impact Evaluation Study of ldquoNational Mission on Micro Irrigation (NMMI)rdquo
II
million ha in 2012-131 under NMMI in the country Despite having many advantages over conventional method of irrigation the area under micro-irrigation presently occupies only about 571 percent of the total potential area As per the available data only 285 percent of total irrigated area is under drip irrigation and 286 percent is under sprinkler irrigation Findings of the Study
A Current Status
i The Scheme since its inception in 2005-06 has made rapid stride across the country It has succeeded in bringing about 356 million ha area under micro irrigation in the sampled 13 states2 The physical targets for the period 2005-06 to 2012-13 were fixed to the extent of 383 million ha out of which 356 million ha has been brought under MI The Targets and achievements for financial outlay were Rs50128 and Rs50065 crores respectively The overall physical and financial achievements thus come out to be 9299 amp 9987 percent The extent of achievements however varied among different states States like Bihar Karnataka Odisha Rajasthan and Sikkim achieved more than 90 percent of the set physical and financial targets Uttarakhand could achieve only 21 percent of physical and 31 percent of the financial targets Other States such as AP Chhattisgarh Gujarat Haryana Maharashtra and Tamil Nadu succeeded to achieve more than 70 of their physical targets
ii AP Gujarat amp Maharashtra are leading states in the every aspect of performance the different activities involved in the process streamlined in the guideline of NMMI While Bihar UP Sikkim amp Uttarakhand states are lacking in terms of the functions mentioned in the guidelines
B Pattern of Assistance (subsidy)
i Most of the states are giving subsidy of more than 70 percent for installation of MI system However comparison of various states and analysis clearly demonstrates that increased subsidy had no significant impact on the increase of area coverage under MI system Farmers in
1 NCPAH 2 Ministry of Agriculture
Impact Evaluation Study of ldquoNational Mission on Micro Irrigation (NMMI)rdquo
III
Maharashtra Gujarat and Haryana were 223 140 and 100 percent respectively in case of sampled beneficiaries while pertinent subsidy component in these states was 60 50 and 90 percent respectively Similarly area coverage in Rajasthan Tamil Nadu and Bihar was noted to be 73 45 and 31 percent respectively and the corresponding figures for subsidy were 90 75 and 90 percent The aforesaid observation clearly suggests that increase in subsidy component beyond a limit has little or no impact on area coverage under MI system The relationship between area expansion under MI and quantum of subsidy has been computed considering beneficiariesrsquo data on area expansion in different states before and after adoption of MI system Hence the relationship of subsidies with area expansion as such does not refer to any specific year
ii The efficiency of scheme implementing agency is very high as most of the farmers have reported that their applications are processed and sanctioned in less than 40 days as against 60 days specified in the guidelines Similarly in most of the sample states beneficiaries are reported to be satisfied with respect to the procedure for filing the application till disbursement of the subsidy amount
iii Presently subsidy is limited to maximum area of 5 hectare per beneficiary which is an impediment to the growth of area under micro-irrigation The data on size and distribution of operational land holdings in the country also suggest that medium and large farmers accounted about 15 percent of total land holdings but occupying more than 5542 percent of the total area Therefore increase in the limit of maximum area per beneficiary would lead to combat water scarcity as well as the sustainable agriculture
iv All the states have reported convergence of Mission interventions with different schemes of the Government of India and State level programmes Most of the districts have converged NFSM and other programmes such as RKVY ICDP Farm Mechanization NHM etc
C Sources of Awareness and Reasons of Non-adoption
i The major sources of awareness about the NMMI scheme were MI system suppliers followed by fellow farmers and extension workers
Impact Evaluation Study of ldquoNational Mission on Micro Irrigation (NMMI)rdquo
IV
ii The non-beneficiaries farmers had mix responses for not adopting the scheme because of lack of awareness regarding subsidies lack of technical knowledge high capital cost and system being not economic for their crops and therefore not required
iii As per primary survey of the sampled beneficiaries about 59 percent of the respondents were small amp marginal farmers and 13 percent were women farmers who have taken the advantage of the Scheme
D System Cost and Sources of Fund
i On an average the cost of system per hectare incurred by the beneficiaries ranged between Rs 5445736 to Rs 7208631 in drip system and Rs 20481 to Rs 28171 in sprinkler irrigation system depending on the cropping pattern crop spacing etc
ii Almost in all states farmer beneficiaries use their own funds for contributing margin money (9866) Other sources albeit a small proportion constitutes banking KCC amp money lenders
iii Most of the farmers borrowed money at less than 10 percent of rate of interest from banks and KCCs
E Technical Observations about MI System
i It was observed that about 64 percent of the beneficiaries installed drip system 34 percent sprinkler system and 2 percent have installed both the systems in their fields The highest proportion of drip was observed in Karnataka because of higher proportion of area under horticulture crops whereas adoption of sprinkler was higher in Bihar because of higher proportion of area under field crops
ii The majority of the beneficiaries (about 6887) farmers of all the 13 states have got their soil and water tested In Gujarat UP Maharashtra amp Rajasthan soil testing adopted by 6927 5275 7337 and 7913 of respondents respectively
iii More than 70 percent of the respondent farmers of AP Gujarat Sikkim and Odisha were using in-line drip irrigation system whereas more than 45
Impact Evaluation Study of ldquoNational Mission on Micro Irrigation (NMMI)rdquo
V
percent beneficiaries of Haryana and Uttarakhand reported to practice on-line drip irrigation system
iv The farmers were using screen filters centrifugal separators hydro-cyclone filter disc filter sand media filters depending on the need The data reveals that screen filters are being commonly used by the beneficiaries in most of the sampled states except Haryana where more than 65 percent beneficiaries are using hydrocyclone and screen filters in combination due to the water quality as they are using canal water Moreover additional subsidy is being provided on hydrocyclone type of filters to ensure the complete removal of organic and inorganic contaminants
v The farmers in almost all the states reported that components of MI System met the BIS norms The average figure for all the sampled states where system components were as per the BIS norms came out to be around 98 percent
vi It was informed that the systems were well designed except in case of Sikkim and Odisha where the systems were functional but not able to meet the farmers expectation in totality
F After Sales Services
i On an average 91 of the beneficiaries across the sampled states reported that after sales services are being provided to them amp also they receive the services at the required time Most of the sampled beneficiaries revealed that they are getting warranty of the MI system
ii In almost all the states the sampled beneficiaries revealed that no technical support guidance on agronomic practices are extended to the users as they generally tell to take the help of extension agencies
G Impact Analysis
i The irrigated area has increased in all the surveyed states after the introduction of NMMI Scheme The Irrigated area within the 5892 sampled beneficiaries of the 13 states before adoption of MI system was found to be 1332086 ha which became 1444147 ha after adoption of MI system It is therefore concluded that total percentage increase in irrigated area with
Impact Evaluation Study of ldquoNational Mission on Micro Irrigation (NMMI)rdquo
VI
the sampled beneficiaries in 13 states after adoption of MI system was noted to be 841 from same source of water Maharashtra has topped the list with 2228 growth in irrigated area followed by Chhattisgarh
ii Farmers of all the states have shown an increase in area under horticulture crops after the adoption of the MI system The cropped area after implementation of CSS for promotion of MI during 2005-06 and subsequently NMMI has shown an increase which may be due to utilization of degraded marginal land into cultivable land amp increase in cropping intensity
iii Scheme has performed well in terms of reduction in input cost and significant cost saving has been observed for irrigation in all the surveyed states Irrigation cost is reduced by 20-50 with average of 323 Reduction in electricity consumption after installation of MI system Average electricity consumption has been reduced by about 31 after using the micro irrigation system Saving of fertilizers with averages reduction of about 28 in total fertilizer consumption in the surveyed states Fertilizer saving vary from 7- 42
iv Micro irrigation has generated benefits to the farmers in terms of enhancement of the productivity The average productivity of fruits and vegetables has increased about 423 and 528 respectively mainly because of crop spacing judicious use of water and other inputs etc
v The overall benefits accrued from the micro irrigation system are reflected in the income enhancement of the farmers All the surveyed states reported increase in farmerrsquos income in the range of 20 to 68 with an average increase of 485
vi Benefit Cost (BC) ratio of installing micro irrigation system is greater than ldquo1rdquo across the states and across the crops which signifies the importance of MI system in net income enhancement of the farmers The BC ratio was observed to be highest in Odisha among fruits amp vegetables whereas in flowers Rajasthan amp Haryana beneficiary farmers achieved higher BC ratio
vii The positive outcomes have made the food security effective due to the increase in the production and productivity of different crops and increased area under irrigation from same source of water Area under horticulture crops as well as nutritional security has also enhanced
Impact Evaluation Study of ldquoNational Mission on Micro Irrigation (NMMI)rdquo
VII
H Employment Generation
i Beneficiaries of all the states under study have shown decrease in utilization of the labor in pre-harvest practices that is labor saving on irrigation weeding fertilization and other operations It shows that the use of human labor after the use of micro irrigation has decreased significantly and ranges between 741 to 1875 percent But in post-harvest operations right from harvesting to handling and disposal of the produce there is an increase in labor utilization and it ranges between 2119 to 5023 percent due to the increase in the production which requires more of the labor for harvesting assembling and grading handling transportation and disposal of the produce
I Training and Capacity Building
i Among the surveyed states more than 90 percent of the sampled beneficiary farmers in the state of Haryana Karnataka Sikkim amp Tamil Nadu had training on different aspects of MI System whereas farmers of Bihar amp Odisha only 20 amp 52 percent of the beneficiaries have received the training
ii Results of survey revealed that the system suppliers manufacturers are the major sources for imparting training as more than 90 percent of the farmers received training from them Very less proportion of the respondents reported to have training from other sources such as SAUs KVKs etc The participant beneficiaries revealed that the duration of training period generally was of 1-2 days Almost all the respondents of Tamil Nadu UP Chhattisgarh Haryana were given training materials during the training while few beneficiaries of the Bihar and Uttarakhand Karnataka were provided such training materials
iii Key areas for training were operation and maintenance of the system adoption of package practices under MI and opportunities for introducing new crops Demonstration was other means of motivation and capacity building It was also found to be a good means of promotion
J Promotional Activities
i The farmers of the majority of the states acknowledged that the implementing agencies are promoting NMMI schemes in local language
Impact Evaluation Study of ldquoNational Mission on Micro Irrigation (NMMI)rdquo
VIII
however were not aware of the dedicated website for MI scheme in their state It is due to the fact that most farmers do not have access or willingness to use internet for information gathering
ii It was noted that maximum beneficiaries of Haryana (98) followed by Sikkim (80) Rajasthan (64) and Uttarakhand (63) have visited the demonstration trials laid out in the nearby areas
Thus it may be concluded that positive outcomes in terms of crop productivity enhancement due to implementation of MI Scheme have contributed significantly to food and nutritional security requirements The NMMI has helped to widen the food basket of the country with significant contributions coming from the bringing more area under irrigation and with judicious use of water New farm practices and innovations with support of government have encouraged the farmers to shift toward new crops giving higher income
It is noteworthy that the incremental net returns were observed to be generally higher for cash crops such as fruits vegetables groundnut cotton etc than for food crops viz bajra and wheat
Recommendations and Policy Implications
Given the vast potential benefits of micro-irrigation and fast decline of availability of water for irrigation in the country a number of technical and policy interventions are required to be introduced so as to increase the adoption of micro-irrigation in India The needed recommendations and interventions are presented below
A Scheme Related
1) The rate of subsidy provided under NMMI through central government is fixed uniformly for different categories of farmer with a limit of 5 hectare This needs to be restructured as about 15 of the large and medium farmersrsquo accounts for more than 5542 of the land in India Therefore this limit of five hectares needs to be enhanced for extending the subsidy
2) States often compete with each other to increase the subsidy component However it has been noted that higher subsidy does not necessarily lead to more area coverage under MI system as the highest increase in area under MI has been achieved by states which offer subsidy in the range of 50-75 percent eg Maharashtra Chhattisgarh Gujarat and Odisha In case of AP which increased subsidy from 70 to 90 percent in 2011-12 the additional area to come under MI in
Impact Evaluation Study of ldquoNational Mission on Micro Irrigation (NMMI)rdquo
IX
fact decreased as compared to the previous years It is therefore recommended that the states should be advised to seriously consider that the quantum of subsidy should preferably be not more than 50-70 percent including state and central share
3) No uniform pattern is being followed by states for implementation of this scheme It has been observed that in some states more than one department are involved in parallel eg Karnataka where it is being implemented by both agriculture and horticulture departments In such cases there is often lack of coordination which adversely affects the outcome of the scheme It has also been observed that where a single department is designated as the implementing agency (eg horticulture or agriculture) it does not pay adequate attention to the crops coming under the purview of other departments Perhaps one of the best implementation strategies is to designate an independent Special Purpose Vehicle (SPV) on the pattern of Gujarat (GGRC) and AP (APMIP) States may be encouraged to replicate such a strategy
4) The penetration of MI is only 5 of the irrigated area even in the states under study where there is a lot of emphasis on NMMI penetration is only 1118 percent of the potential (identified by various studies ref India Stat) It is proposed that NMMI may fix a target of achieving 25 of the potential during XII plan by addressing various constraints such as
a One of the major reasons for the slow growth of micro-irrigation in India is the high initial investment In spite of availability of subsidy from state agencies majority of the farmers are reluctant to invest in micro-irrigation system even in horticulture crops which is highly suitable for drip irrigation Therefore micro-irrigation system should be planned and designed based firmly on location specific parameters to reduce the cost of installation as well as promoting low cost technology so that poor farmers can also participate
b Capacity building activities for operation and maintenance of system crop diversification using most economical and appropriate Package of Practices etc need to be made an integral part of the programme and be made mandatory for each and every beneficiary The tool to deliver could be MI system supplier in co-ordination with SAU and extension department of the state
Impact Evaluation Study of ldquoNational Mission on Micro Irrigation (NMMI)rdquo
X
5) Micro irrigation System is mostly promoted through subsidy schemes and not as an on-farm water and land management strategy In certain states under subsidy scheme the requisite consideration have not been given in respect of field size shape topography type and location of water source seasonal fluctuations type of soil and crop to be grown As a result in certain cases the subsidy may not match the specific situation of an individual farmer consequently the system may not match the site specific situations of an individual farmers consequently the system may not operate to the complete satisfaction of the farmer
B Technology Related
1) There is a need to establish a Central Testing Facility (CTF) to deal comprehensively with the design development and testing of all equipments devices machines used in micro irrigation systems using state-of art technology It is suggested that the Government may consider contacting regular and random technical audit of the system to cover about 2-3 percent beneficiaries within first and second year of the installation This will keep check on to quality and suppliers will be more vigilant to supply good quality of system
2) It is suggested that the implementing agencies should be more vigilant regarding warranty and after sales service of the system provided by the suppliers It is proposed that 10 percent of the subsidy may be released after one year subject to satisfactory performance of the system as certified by the beneficiary Maintenance manual in vernacular language should be made available to the beneficiaries at the time of installation of the system
3) It is observed that the cost of micro-irrigation accessories such as emitters filters laterals etc vary between shops and places Sometimes farmers do face problem in getting spare parts in time It is necessary to provide quality materials in time for farmers for the speedy adoption of micro-irrigation
4) Inadequate information about the operation maintenance as well as the usefulness of micro irrigation is one of the main reasons for its uneven spread across regions in India Farmers still do not have full knowledge regarding the usefulness of the micro irrigation Even the adopters do not know fully how much of subsidy is available per hectare for different crops
5) Clogging of drippers mainly due to poor quality of water helps in bacterial growth which can be controlled by using chlorination which acts as a powerful oxidizing agent and vigorously attack micro-organisms such as algae fungi and bacteria
Impact Evaluation Study of ldquoNational Mission on Micro Irrigation (NMMI)rdquo
XI
Also acid is injected into drip irrigation system to lower the pH of the irrigation water and this helps in preventing the precipitation of salts such as calcium carbonate magnesium carbonate or ferric oxide It has been observed during the course of survey that the availability of sulphuric acid in the nearby towns is a major constraint and farmers are forced to purchase new spares by discarding clogged drippers It is therefore recommended that system suppliers should make acid available to the growers as part of their after sales service obligation Therefore studies need to be carried out to device efficient eco friendly de-clogging measures so that farmers do not suffer from such problems
C Awareness and Capacity Building
1) The extension network currently operated mainly by government agencies does not seem to be making significant impact on the adoption of this technology Therefore there is a need to revamp the entire extension network by involving the MI system manufactures in order to increase amp improvise the existing quality of extension services
2) MI system manufacturers should be involved intensively in promoting micro-irrigation by introducing frequent demonstration at farmersrsquo field and strategic locations in the district state The MI system manufacturers should be involved in providing advice on agronomic packages to the farmers so as to encourage the adoption of micro irrigation at a large scale
3) Since MI system suppliers are one of the major sources of creating awareness among potential beneficiaries their involvement in laying down demonstration may be increased Similarly imparting training on technical and operational aspects of the system be included as mandatory part of the training of the farmers by the system suppliers The training may also include aspects of package of practices which may be standardized by the SAUs amp other related organization and supplied to system suppliers for further dissemination to the farmers
4) Awareness on MI system is low in states like Bihar UP and Odisha Special drive is needed for exposure visits trainings to make them aware about the benefits and operation of the system The number of demonstration farms should also be increased
5) It is understood from the field study that the officials who are involved in promoting micro-irrigation technology under the GoI Scheme have inadequate knowledge about the technical and other details of MI Therefore the state
Impact Evaluation Study of ldquoNational Mission on Micro Irrigation (NMMI)rdquo
XII
government extension staffs need to undergo lsquoRefresher Courses and exposure visitsrsquo to have basics of micro-irrigation thereby enabling their role in the implementation of the scheme
D Follow up Actions
1) Though micro-irrigation has been in use in different States since mid-eighties State-wise potential area is not estimated as of today Therefore it is essential to prepare State-wise and crop-wise potential area for MI A detailed estimate on State-wise potential would be useful to fix the target to be achieved and further to develop the road map for MI adoption in the country
2) It is evident from field study that capital cost required to install micro irrigation system is relatively high Because of this reason considerable percentage of farmers have expressed that they are unable to adopt this technology for low value crops There has been a significant development in the MI technology and efforts should be on developing and popularizing low cost technologies This would help reducing the cost of the system and increasing the adoption of micro-irrigation at a large scale
3) At least one percent of the outlay on micro-irrigation needs to be earmarked for research on micro-irrigation technology and development of package of practices as well as crop diversification potential
4) The information regarding all the activities under NMMI scheme at national and state level should be under public domain Although presently very few farmers are using internet based information yet this is becoming popular and it is expected that in next few years websites and internet will become a major source of information particularly among younger population Therefore the website of NCPAH be made more popular and content may also be increased to include PoP and crop diversification
Impact Evaluation Study of ldquoNational Mission on Micro Irrigation (NMMI)rdquo
1
1 Introduction 11 Project Background Water is one of the most critical inputs for agriculture however the share of water availability to the agriculture sector is declining at an alarming rate due to its ever increasing demand for the energy industry and domestic purposes Much of the available irrigation water in India is applied through the conventional surface irrigation methods which involve huge conveyance and distribution losses resulting in low overall irrigation efficiencies (35-40) The poor irrigation efficiency of these systems not only reduce the anticipated outcomes from investments in the water resources but also create environmental problems like lowering of water table due to over-exploitation of sub-surface water resources water-logging and soil salinity thereby adversely affecting the crop yields
Figure 1 Percentage Annual Allocation (share in availability) of Water
Source Central Water Commission MoWR GoI
On the other hand the situation of cropping under irrigated and rain fed conditions is quite decimal There is a decimal chance of further enhancement to the area under irrigation which calls for improving the water use efficiency of the available water resources which can be accomplished through the proven water saving technologies such as micro irrigation systems The term micro irrigation describes irrigation systems that deliver water through small devices directly in the plant root zone at prescribed rate at regular interval of time
Impact Evaluation Study of ldquoNational Mission on Micro Irrigation (NMMI)rdquo
2
In countries like Israel the water-use efficiency in agriculture sector has been improved in physical (technical) terms of water use per tonne of output (or hectare irrigated) due to improvements in agricultural water use efficiency As a consequence the share of agriculture in total water use fell from over 70 percent in 1980 to 57 percent by 2005 and further it is projected to decline to 52 percent by 20253 Even in Indian scenario Micro-irrigation (MI) methods have been found to have significant water saving and crop productivity benefits Studies have claimed water saving of 40 ndash 80 percent and productivity gains up to 100 percent (Raina et al 1999 2013 Sivanappan 1994 Palanisami et al 2011) Keeping these advantages in view the Government of India (GoI) constituted a Task Force in 2004 to assess the potential of MI technologies in the country The Report of the Task Force sought to increase the emphasis on MI technology and recommended a broader framework viewing adoption of MI technologies as a part of the overall water management strategy It also recommended allocation of more financial resources of subsidies for MI adoption with state governments contributing 10 percent of the cost while the central funds would account for 40 percent and advised greater flexibility for states to determine their appropriate implementation structure and institutional mechanisms for subsidy disbursement The main objectives of the National Mission on Micro Irrigation are as follows
To increase the area under micro irrigation through improved technologies To enhance the water use efficiency in the country To increase the productivity of crops and farmersrsquo income To establish convergence amp synergy among on-going Government
programmes To promote develop and disseminate micro irrigation technology for
agriculture horticulture development with modern scientific knowledge To create employment opportunities for skilled and unskilled person especially
unemployed youth
12 Salient Features of the Scheme NMMI is a Centrally Sponsored Scheme in which 40 of the cost of the MI system is borne by the Central Government 10 by the State Government and the remaining amount is borne by the beneficiary either through his her own resources or loan
3 OEDC-FAO Agricultural Outlook 2012-2021
Impact Evaluation Study of ldquoNational Mission on Micro Irrigation (NMMI)rdquo
3
from financial institutions In respect of small and marginal farmers the share of Central Government increases by 10 to make 50 of the cost of the system The main features of the scheme are
All categories of farmers are eligible to avail assistance under this scheme Assistance to farmers is limited to a maximum area of five (5) ha per
beneficiary Assistance for laying down demonstration on farmers field are given 75
subsidy for a maximum area of 05 ha per demonstrate and is met entirely by the Central Government
Assistance is available for both drip and sprinkler irrigation for wide spaced as well as close spaced crops However assistance for sprinkler irrigation system is available only for those crops where drip irrigation is uneconomical
Assistance is available for irrigation systems for protected cultivation including greenhouses polyhouses and shade net houses
The subsidy amount is calculated taking into consideration cost of fertigation with fertilizer tank venturi systems sand filters media filters hydro-cyclone filters sand separators and other different type of filters and valves required for MI system
Panchayati Raj Institutions (PRIs) are involved in promoting the scheme identification of priority areas identification of beneficiaries and organizing interactive meetings with the representatives of micro irrigation industry
At the National Level the Executive Committee of NMMI reviews the progress of NMMI and approve the Annual Action Plans of States At the State level the State Micro Irrigation Committee (SMIC) oversees the implementation of the Mission programme in districts The District Micro Irrigation Committee (DMIC) coordinates the implementation of NMMI programme at the District level NCPAH coordinate and monitor the programme of NMMI in different States
The scheme is implemented by an implementing Agency (IA) at the State level duly appointed by the State Government Funds are released directly to the IA on the basis of approved plans for each year
The IA prepares the Annual Action Plan for the State on the basis of the district plans and get it forwarded by SMIC for approval of the Executive Committee (EC) of NMMI
The State Level Micro Irrigation Committee (SMIC) undertakes registration of System Manufacturers who are authorized to supply systems to the farmers under the NMMI subsidy scheme One of the important criteria for registration is that these manufacturers should be able to supply the systems as Bureau of
Impact Evaluation Study of ldquoNational Mission on Micro Irrigation (NMMI)rdquo
4
Indian Standards (BIS) marking and provide proper after sales service to the satisfaction of the farmers
13 The Assignment NMMI has now been in operation effectively for more than six years and the government feels that this is the right time to asses and quantify the impact of Scheme The Govt of India Ministry of Agriculture Department of Agriculture and Cooperation Krishi Bhawan New Delhi has engaged Global AgriSystem through open bid to carry out an Impact Evaluation Study of National Mission on Micro Irrigation (NMMI) Scheme 14 Objectives of the Study The ldquoNational Mission on Micro Irrigation (NMMI)rdquo was to be evaluated in terms of water saving increase in area production and productivity of major crops so as to serve various objectives of National Food Security crop diversification with the changing food consumption habits saving of various inputs such as fertilizer power etc that are of paramount importance to the country The prime purpose objectives of the study are as follows
i Transparency in identification of beneficiaries prioritizing for release of funds in order of the application approval of system suppliers timely release of financial assistance dovetailing of various MI schemes effectiveness of various MI technologies methodology adopted for record keeping auditing and effectiveness of the state implementing agencies
ii Overall performance of the programme implementation and whether the programme is being implemented as the operational guidelines of NMMI in various states
iii Employment generated due to the implementation of NMMI and efforts laid for the development of human resources wrt Micro Irrigation between FY 2005-06 to 2011-12
Impact Evaluation Study of ldquoNational Mission on Micro Irrigation (NMMI)rdquo
5
2 Approach and Methodology The evaluation study of the ldquoNational Mission on Micro Irrigationrdquo (NMMI) scheme requires a wholesome approach to find out proper impact of the scheme at the ground level Keeping in view the scope of work given ToRrsquos and with the understanding of the objectives the approach and methodologies adopted by the Consultants are summarized in the following paragraphs 21 Approach The approach adopted for the present impact evaluation study is based on use of both the secondary as well as primary data collected from 13 states conducting interviews of various stakeholders (Figure 2)
Figure 2 States Covered for Study (Star Marked)
Impact Evaluation Study of ldquoNational Mission on Micro Irrigation (NMMI)rdquo
6
The study comprised primarily adopting the following steps
Beneficiaries who availed the assistance to install MI system and non-beneficiaries from the same area village who did not install MI
Mobilisation of the study team Continuous contact and consultations with the various concern agencies and
the Client Sharing of information throughout the study period with the Client and flexibility to respond to desired changes and directions
Collection and review of reports documents government policies plans and programs
Development of questionnaires and checklists for primary data collection Interaction and interview with policy makers planners bureaucrats
development workers traders and etc Field survey in the selected areas Analysis of secondary and primary data using appropriate tools Survey of beneficiaries amp non-beneficiaries to arrive at a comparative analysis
of the advantages derived by the adopters
22 Methodology Based on above approach following methodology is adopted to carry out the evaluation study
Table 1 Methodology Adopted for Impact Assessment
Sl No Description of the Method Description of the Units Covered
1 Survey Method a Sample
Survey Selected beneficiary and non-beneficiary households
2
Rapid Appraisal Method a Focus group
discussions Beneficiary and non-beneficiary households
b Semi Structured interviews with key informants
Various implementing agencies at district and block levels Manufacturers service providers Non-Governmental Organizations(NGOs) Financial Institutions Village elders community leaders and Knowledgeable persons
Source GAPL
Impact Evaluation Study of ldquoNational Mission on Micro Irrigation (NMMI)rdquo
7
221 Sources of Data Collection
The primary data has been collected through participatory discussions and structural interviews semi- structured questionnaires for covering various evaluation parameters from various stakeholders
Farmers Officials of horticultureagriculture departments Officials of Irrigation department Scientists from Krishi Vigyan Kendras and agricultural universities Banks amp other financial institutions Social mobilizers Pradhan Opinion leadersprogressive farmers Industry
Secondary data regarding physical and financial targets amp achievements was obtained from Ministry of Agriculture amp NCPAH Other sources of published data such as NHB statistics Published research in the reputed journals GoI publications as well as Statistics from State and District level have been utilized for secondary data
Task 1 Review of Secondary Information
A desk review of secondary data regarding overall area under irrigation research work on potential of MI cropping pattern and land use progress position regarding distribution Similarly physical and financial performance relating to various components of the Scheme has been collected from MoA NCPAH and State Government agencies The information collected has thereafter been analyzed for reaching to conclusions
Task 2 Field Research and Primary Data
In depth field study has been carried out to find out stakeholdersrsquo perception and impact assessment of the scheme Field study included three segments
i A detailed survey of farmers( both beneficiaries and non-beneficiaries) through a structured questionnaire and PRA techniques
ii Implementing agencies and officials to assess the efficiency and efficacy of implementation of the scheme
iii Institutions ndash an interaction with officials of the agriculture universities to understand current technologies in micro-irrigation their adaptability to India agriculture and sustainability in the long rum
Impact Evaluation Study of ldquoNational Mission on Micro Irrigation (NMMI)rdquo
8
Task 3 Developing the Sampling Plan for primary survey and the Associated Fieldwork Schedules 222 Sampling The evaluation study was conducted in the given 13 states The detailed sampling plan followed for the evaluation study was as under
Table 2Sampling Plan
Sl No
Stage of Sampling
Sampling Unit
Criteria for Selection of
Sample Units
Sample Method Adopted
Description of the Sample Units
Number of Sample Units
1 I Stage Agro climatic regions
As per state classification Micro units Best and average
performing See Table 4
2 II Stage District
Level of Micro Irrigation coverage as proxy for development
Stratified Purposive Sampling
Additional area brought under irrigation
Best and average performing districts in ratio of 7525
4-6 districts in plain areas and 2-3 in hilly states In all 64 districts have been selected
2 III Stage Blocks Level of Development
Stratified Purposive Sampling
Additional area brought under irrigation in the block
Best and average performing blocks in ratio of 7525
5-8 blocks in plains and 5-7 in hilly states covering from each sample district A total of 398 blocks were finally selected
3 IV Stage Villages Coverage of Programmes
Stratified Purposive cum cluster Sampling
Best and average geographical connectivity
4 V Stage Households
Beneficiaries on random basis amp non beneficiaries from similar conditions
Stratified Purposive Random Sampling
Proportionate sample according to size of holding and area under micro irrigation
7400 farmers including 5892 beneficiary household from 13 states
Source GAPL
223 The Sample Design Multi-stage - stratified - purposive ndashrandom sampling design has been adopted in the study The samples have been collected from all the identified states The consultant has applied Stratified Random Sampling Method The sample is representative and has been covering all categories of farmers The sampling has been taken into account the extent of implementation of NMMI Scheme in the State
Impact Evaluation Study of ldquoNational Mission on Micro Irrigation (NMMI)rdquo
9
Selection of districts and blocks Selection has been done in a manner so as a representative data emerged from that particular sampled state The sample has covered selected districts in 13 states as per the ToR The details of sample size both of beneficiaries and a non-beneficiary across the states has been summarized in Table 4
Districts have been selected from each selected region of the state Four to seven districts (two to four from hilly states) from each state have been selected The selected districts were ranked as per their performances where one district each from the high good average amp poor performance were included for drawing samples as summarized in the following table
Table 3 State wise List of Sampled Districts Covered in the Study
S No
States Districts
1st 2nd 3rd 4th 5th 6th 7th 1 AP Anantpur Medak Nalgonda Adilabad Nellore Krishna Vishakhapatnam 2 Bihar WestChamparan Rohtas Gaya Madhepura 3 Chhattisgarh Durg Sarguja Kanker Jashpur 4 Gujarat Banaskantha Bhavnagar Jamnagar Bharuch Mehsana Anand 5 Haryana Bhiwani Sirsa Fatehabad Karnal 6 Karnataka Belgaum Hasan Bidar Chitradurga Mysore Bellary 7 Maharashtra Jalgaon Ahmednagar Jalna Kolhapur Wardha Ratnagiri 8 Odisha Ganjam Mayurbhanj Boundh Nayagarh Bhadrak 9 Rajasthan Jalore S Madhopur Jodhpur Jhalawar Hanumangarh Udaipur 10 Tamil Nadu Erode Tirunelveli The Nilgiris Thiruvarur Villupuram
11 UP Jhansi Balia Saharanpur Siddharth Nagar Kannauj Aligarh
12 Sikkim Gangtok Mangan 13 Uttarakhand U S Nagar Haridwar Nainital
Source GAPL
Further blocks were selected on the basis of coverage in area under irrigation which is taken as a proxy of development of micro irrigation infrastructure From each sample district 5-8 blocks - best and average performed blocks (7525 ratio) were selected randomly among those where MI systems have been installed 224 Selection of Beneficiaries and Non-beneficiaries Villages have been purposively selected on the basis of coverage of the programme The selection of the sampled beneficiary farmerhouseholds has been made randomly for each selected village A complete list of beneficiaries are drawn and divided into various size classes In the each selected village the households were finalized on the
Impact Evaluation Study of ldquoNational Mission on Micro Irrigation (NMMI)rdquo
10
basis of their farm holding socio-economic status and coverage of programmes Besides this non-beneficiaries were also selected to identify reasons for their non-participation in the programmes and also to compare the benefits drawn by beneficiaries compared to this category This in fact facilitated the impact evaluation study based on lsquowith and withoutrsquo approach The farmers selected for the primary survey include various categories of farmers Besides it also includes PRIs and district amp state level concerned functionaries It is pertinent to mention here that the sampling design has taken care that the beneficiaries selected are representative of overall population of the beneficiaries at State and District levels The total sample comprises of beneficiaries and non-beneficiaries in the ratio of 8020
Table 4 State wise Sample Distribution for the Study
Sl No
Name of State UT
Sample Districts
Sample Blocks district
Farmers per
block
Total respondents
Beneficiaries Non
beneficiaries
1 AP 7 6 20 840 672 168 2 Bihar 4 8 20 644 516 128 3 Chhattisgarh 4 6 20 480 384 96 4 Gujarat 6 6 20 720 576 144 5 Haryana 4 5 20 401 320 81 6 Karnataka 6 6 20 720 576 144 7 Maharashtra 6 7 20 881 672 169 8 Odisha 5 6 20 600 480 120 9 Rajasthan 6 6 20 712 574 138
10 Tamil Nadu 5 6 20 575 455 120 11 UP 6 7 20 695 527 168 12 Sikkim 2 5 6 60 50 10 13 Uttarakhand 3 6 6 112 90 22
Total 64 7400 5892 1508
Task 4 Validation of Sampling Plan and Questionnaires
Field research has been carried out on the predefined and approved questionnaires in active consultations with DAC The final sampling plan and questionnaires and field survey plans have been validated by DAC
Task 5 Pilot Testing amp Survey Preparation
In order to validate that the questionnaire were able to gather information as per design and to train the supervisors of the survey team a pilot survey was undertaken in Uttarakhand and Maharashtra The main purpose of pilot testing the survey was to check the validity of the questionnaire by finding questions or words that might be misinterpreted misread or misunderstood as well as to check the functionality of the
Impact Evaluation Study of ldquoNational Mission on Micro Irrigation (NMMI)rdquo
11
questionnaire in the field Training of the interviewers and supervisors which is one of the most important stages prior to conduct of field work was done to familiarize the interviewers with the survey instruments Task 6 Constituting Field Work Teams and Briefing Meeting with Field Supervisors and Felid Investigators
On acceptance of the final questionnaires and the sample plan the field teams were gathered in Delhi and a briefing meeting and training session had been held for the field research teams
Task 7 Primary Data Collection Exercise
During the fieldwork face to face interviews were held with various types of respondents including State Agriculture Horticulture departments and other stake holder as mentioned above were interviewed with structured information schedules and information was collected accordingly
Task 8 Stakeholder Discussion
Participatory discussion was arranged with various stakeholders at various levels as follows
I Stage At inception stage to discuss and finalize work plan questionnaire and methodology
II Stage After completion of field survey to discuss preliminary finding
III Stage After submission of DPR to discuss the recommendation and finalize the report
Task 9 Data Entry Analysis of Secondary and Primary Data and Report Writing
Both primary and secondary data is being collected compiled and tabulated and analyzed to arrive at appropriate conclusions 23 Limitations of the Study The study was conducted for 13 states and the consultant completed this study under certain limitations which were as follows
a Like any study based on sampling method the findings of the response of respondents have been extrapolated to the entire scheme for the purpose of
Impact Evaluation Study of ldquoNational Mission on Micro Irrigation (NMMI)rdquo
12
studying the achievements amp objectives of the scheme impact of the scheme and methodology of the implementation of the scheme etc
b It took almost more than one month to get the comments on the Inception Report as well as questionnaires which led to delays in the mobilization of the field work
c The consultant and the survey team got stuck during the study period due to the complications amp coordination between state amp central government authorities
d Due to natural disaster taking place in Uttarakhand the districts to be covered were changed as it was difficult to reach the selected districts
e The field work coincides with rainy season and this year there were heavy rains in few states which also hampered the field study Moreover the information regarding beneficiaries of the selected states was not provided in time therefore the survey team had to visit those areas more than one time For example in case of Haryana the survey team visited state authorities with list of districts identified for survey by consultant in consideration with MoA and NCPAH but the state authorities did not agree and wanted some time to suggest changes and therefore survey team had to wait which led to delay
f In the states like UP and Tamil Nadu the state government officials did not cooperate to provide information of beneficiaries in the beginning and consultants had to mobilize GoI authorities to send communication for co-operation which caused delay in starting field work
g In the state of UP the designed sample size has not been achieved for covering 168 farmers (beneficiaries) as number of beneficiary farmers in selected districts was less therefore the sample size has been constraint accordingly
In spite of these limitations efforts were made by the consultant to complete the study in time
Impact Evaluation Study on ldquoNational Mission on Micro Irrigation (NMMI)rdquo
13
3 Assessment of Current Status 31 Performance of MI Scheme Micro Irrigation industry in India is driven by the assistance from the central and the state governments The NMMI has given major impetus to the growth of the industry In fact the growth of the MI industry can be viewed as per growth of fund allocation to MI scheme The trend of area coverage and total subsidy advanced in the states under study has been shown in the figure 3
Annual subsidy advanced has shown increasing trends continuously except for the year 2008-09 whereas the growth of area coverage has witnessed some fluctuations in the year 2007-08 and 2012-13 Despite this fluctuation the growth in the area coverage is not proportional to the growth in fund spent The both trend lines witness convergence in growth up to 2009-10 but there after witnessed the divergence in growth
The fund spent has witnessed sudden jump after the conversion of the NMMI scheme from CSS in the year 2010-11 The fund spent has increase by about 62 percent from 2009-10 to 2010-11 and the increase in area coverage is 1538 percent in corresponding period This fact was further analyzed and the main reason for high subsidy amount is the reason of revision in the cost norm per hectare and more area coverage under drip system
The cumulative area coverage since the launch of scheme to 2012-13 in the states under study is about 356 Million ha and the total subsidy advanced till 2012-13 stood at Rs 5006 crores in the same states
Figure 3 Physical and Financial Performance of NMMI Scheme
Source Ministry of Agriculture
Impact Evaluation Study on ldquoNational Mission on Micro Irrigation (NMMI)rdquo
14
Table 5 Year wise Area under Different MI Systems of Sampled Beneficiaries
Year Area under Drip
Irrigation (ha) Area Under Sprinkler
Irrigation (ha) 2000 223 162 2001 445 000 2005 101 000 2006 15279 546 2007 17656 8282 2008 60209 21929 2009 64467 22961 2010 76567 46818 2011 128797 78328 2012 421496 202578 2013 30784 31355
Source GAPL survey
The above table depicts that the year wise area under drip is expanding more in comparison to the area under sprinklers that leads to higher system cost This may be the reason for splitting lines of physical and financial achievements after 2009 in the figure 2 It may also be inferred from the table 5 that subsidy has been increased in most of the states that caused increase in financial achievement than physical achievement which led to splitting trend line of physical and financial achievements
Table 6 Comparison of Subsidy between Pre and Post NMMI Scheme
SNo State
Total Subsidy of the farmers ()
Pre NMMI Scheme
Post NMMI Scheme Small amp
Marginal Farmers
General Farmers
1 AP 70 90 75 2 Bihar 90 90 80 3 Chhattisgarh 70 75 50 4 Gujarat 50 50 50 5 Haryana 90 90 90 6 Karnataka 75 80 50 7 Maharashtra 50 60 50 8 Odisha 70 90 80 9 Rajasthan 70 70 70
10 Sikkim 60 60 11 Tamil Nadu 65 100 75 12 UP 50 90 75 13 Uttarakhand 50 60 60
Impact Evaluation Study on ldquoNational Mission on Micro Irrigation (NMMI)rdquo
15
32 State wise Performance
AP and Gujarat were the pioneer states which harnessed the benefits of the scheme with area coverage of about 678 thousands and 504 thousands ha In 2006-07 more states were brought under the scheme and by the end of 2007-08 all the states under study except Sikkim and Uttarakhand were covered during 2011-12 The states of AP followed by Maharashtra are top in the list of area coverage as well as total subsidy advanced under MI The total cumulative central subsidy advanced and total area covered since the launch of the scheme is shown in the graph
Figure 4 State wise Central Subsidy (Rs Crores) and Area Coverage (lsquo000rsquo ha) under NMMI
Source Ministry of Agriculture
33 Targets and Achievements The states under study have achieved 9987 financial targets but the achievement of physical targets stood at 9299 The states of Gujarat and Maharashtra have achieved 100 financial targets but have not met the physical targets In Gujarat the financial utilization is 10026 due to inclusion of interest amount The state of Bihar Karnataka Odisha Rajasthan and Sikkim which have achieved more than 100 physical targets without utilizing the total allotted fund
Impact Evaluation Study on ldquoNational Mission on Micro Irrigation (NMMI)rdquo
16
It is pertinent to mention that achievements are exceeding the value of 100 percent Since the preceding year unspent balance has been brought forward to next year The scheme was launched in 2011-12 in Sikkim and Uttarakhand and the Sikkim has performed much better in physical target achievement as compared to Uttarakhand In fact Sikkim is the top performer in physical target achievements whereas the Uttarakhand is least one among the states under study as the scheme is launched few years back only The state wise cumulative (2005-06 to 2012-13) physical and financial targets vs achievement are given in the table below
Table 7 State wise Cumulative Physical amp Financial Targets and Achievements
State Physical (lsquo000rsquoha) Financial (Rs in lakh)
Target Achievement
Achievement Target Achievement
Achievement AP 87116 77205 8862 13714800 13517558 9856 Bihar 6676 7880 11804 813210 726062 8928 Chhattisgarh 13515 12602 9324 1371370 1323969 9654 Gujarat 46102 43172 9364 7247100 7265900 10026 Haryana 6638 5783 8712 882086 804293 9118 Karnataka 51096 53668 10503 6088932 5981226 9823 Maharashtra 94179 69605 7391 11542800 11542800 10000 Odisha 5406 6302 11658 506200 468763 9260 Rajasthan 57640 66307 11504 5039296 4946894 9817 Tamil Nadu 11897 11767 9890 2961660 2937490 9918 UP 2712 1883 6941 279904 254098 9078 Uttarakhand 101 022 2139 22500 7000 3111 Sikkim 039 051 13002 60000 40000 6667 Total 383117 356246 9299 50128009 50064490 9987
Source Ministry of Agriculture The major inferences drawn from table below are as follows
The scheme made rapid stride after the launch and achieved more than 80 of the targets both physical and financial in 2006-07 and the physical and financial targets have been achieved more than 100 in the subsequent year ie 2007-08 to 2009-10
The financial target achievement has been more than 100 on 2007-08 onwards except for the year 2011-12 whereas the physical target achievement has been declined after 2009-10
The Scheme has performed best in terms of both physical and financial targets achievement with around 130 achievement
The year wise cumulative (2005-06 to 2012-13) physical and financial targets vs achievement is given in table below
Impact Evaluation Study on ldquoNational Mission on Micro Irrigation (NMMI)rdquo
17
Table 8 Year wise Cumulative Physical and Financial Targets and Achievements
SNo Year Physical Financial
Target (Ha)
Achievement (Ha)
Achievement
Target (Rs)
Achievement (Rs)
Achievement
1 2005-06 18022300 1181700 656 2328415 163517 702 2 2006-07 39736500 33430060 8413 4457599 3659033 8209 3 2007-08 32404870 42117390 12997 3989632 4729348 11854 4 2008-09 42309500 51633800 12204 4172462 4678426 11213 5 2009-10 42576400 55475277 13030 4353157 5664040 13011 6 2010-11 66770000 64006900 9586 9008411 9173680 10183 7 2011-12 69819700 55752143 7985 10829000 10807615 9980 8 2012-13 71478800 52648500 7366 10989300 11188800 10182
Total 383118070 356245770 9299 50127976 50064459 9987 Source Ministry of Agriculture
Figure 5 Year wise Targets and Achievements
Impact Evaluation Study on ldquoNational Mission on Micro Irrigation (NMMI)rdquo
18
Figure 6 State wise Cumulative Targets and Achievements (2005-06 to 2012-13)
The performance of the scheme in different states and in different tenure can be sum up as under
The scheme created a good imprint in 2006-07 and achieved 8213 and 8209 of physical and financial targets respectively in the states under study In this year state of Gujarat Karnataka Maharashtra and Rajasthan achieved more than 100 of physical targets
The performance of scheme contributed to be extremely well in the year 2007-08 to 2009-10 and registered more than 100 achievement of both physical as well as financial target
Impact Evaluation Study on ldquoNational Mission on Micro Irrigation (NMMI)rdquo
19
Table 9 Year amp State wise Physical Targets and Achievements (lsquo000rsquo ha)
State 2005-06 2006-07 2007-08 2008-09 2009-10 2010-11 2011-12 2012-13 (March 13)
T A T A T A T A T A T A T A T A AP 4552 678 19346 8462 4639 11485 8521 12358 11445 13834 16550 12276 8895 10506 13169 7607 Bihar - - 1422 - - 023 - 031 - 011 - 1349 196 2329 5057 4137 Chhattisgarh - - 2875 460 1006 2083 1363 3057 1764 1577 2878 2183 1717 1839 1912 1402 Gujarat 1672 504 1825 2434 4516 4304 3356 5343 3333 6625 8034 7829 13029 6510 10338 9623 Haryana - - 537 282 722 778 3240 2230 158 326 443 934 612 579 928 654 Karnataka 2523 - 2374 3885 5352 6294 8417 9262 8131 10821 7270 8745 6317 5801 10713 8861 Maharashtra 4186 - 6512 10826 10367 8222 12876 10041 8467 9451 11803 11803 27194 11600 12775 7662 Odisha - - 331 122 103 307 375 250 758 1278 934 1201 1152 1184 1752 1961 Rajasthan 1303 - 3975 6772 4471 7374 4023 7773 8521 9556 14800 14761 10707 12218 9840 7854 Tamil Nadu 2895 - 540 - 1230 782 - 1160 - 1801 3500 2615 - 2755 3732 2654 Uttar Pradesh 891 - - 186 - 466 138 129 - 197 559 311 - 379 1125 214 Uttarakhand - - - - - - - - - - - - - - 101 022 Sikkim - - - - - - - - - - - - - 051 039 - Sub Total 18022 1182 39737 33430 32405 42117 42310 51634 42576 55475 66770 64007 69820 55752 71479 52649 Source Ministry of Agriculture
Impact Evaluation Study on ldquoNational Mission on Micro Irrigation (NMMI)rdquo
20
Table 10 Year and State wise Financial Targets and Achievements (Rs Crores)
State 2005-06 2006-07 2007-08 2008-09 2009-10 2010-11 2011-12 2012-13 (March 13)
T A T A T A T A T A T A T A T A AP 6129 934 19520 11277 5748 14559 9727 10836 14311 17829 24000 24000 28720 28720 28993 27021 Bihar - - 2482 - - 026 - 022 - 011 - 826 450 2167 5200 5340 Chhattisgarh - - 3033 256 783 1751 954 2060 1252 1193 1019 1801 3500 3500 3172 2678 Gujarat 2182 701 3356 3931 7350 4927 4899 7396 4447 5426 12000 12000 16664 16695 18200 18201 Haryana - - 444 232 604 508 1207 1278 212 385 1361 1402 1993 1667 3000 2571 Karnataka 3584 - 2457 4452 6865 7598 7319 5845 6381 8685 9254 8945 10965 9165 14065 15122 Maharashtra 4808 - 8797 13466 13897 12792 14748 13444 10707 13226 22237 22265 24980 24980 15018 15221 Odisha - - 454 143 108 101 338 293 528 871 810 697 823 893 2000 1690 Rajasthan 1048 - 2833 2687 2341 2908 2382 3009 5693 6073 12000 11620 13095 12824 11000 10347 Tamil Nadu 4291 - 1201 - 2200 1560 - 2367 - 2558 6591 7797 6625 6625 8300 13235 UP 1242 - - 146 - 562 150 235 - 381 812 383 - 441 595 393 Uttarakhand - - - - - - - - - - - - 075 - 150 070 Sikkim - - - - - - - - - - - - 400 400 200 - Sub Total 23284 1635 44576 36590 39896 47293 41725 46784 43532 56640 90084 91737 108290 108076 109893 111888
T Target A Achievement Source Ministry of Agriculture
Impact Evaluation Study on ldquoNational Mission on Micro Irrigation (NMMI)rdquo
21
34 Performance of Scheme for Area Coverage as Compared to Potential
Potential of different MI Systems in terms of drip and sprinkler has been assessed by various researchers by using the secondary data For assessing the potential of MI in different states the variables considered were state-wise and source-wise irrigation area cropped area and crops wise suitability for different MI systems Potential area is calculated on the basis of area already brought under MI system from the existing irrigated area While calculating potential area in sampled states we have also considered area under paddy which may diversify into horticultural and other cash crops in future For the purpose of arriving at some conclusion regarding performance of MI under the states data on potential area and actual area brought under drip and sprinkler irrigation in the states (NCPAH) has been analyzed
Table 11 Potential and Cumulative area under Drip amp Sprinkler Irrigation
StatesUTs
Total (Area in ldquo000 ha) Drip (Area in ldquo000 ha) Sprinkler (Area in ldquo000 ha)
PotentialIrrigated area
Cumulative area under
MI till 2012-13
Balance Potential area for
MI
Potential
area ()
Potential area
Cumulative area under
drip till 2012-13
Balance Potential
Area
Potential area ()
Potential area for
Sprinkler
Cumulative area under
sprinkler till 2012-13
Balance Potential
Area
Potential area ()
AP 6785 77100 601400 8864 506840 57605 449235 6621 171661 19495 152166 2243 Bihar 5158 7867 507933 9847 11863 181 11682 226 503937 7686 496251 9621 Chhattisgarh 1648 15655 149145 9050 12525 1172 11353 689 152275 14483 137792 8361 Gujarat 4137 43669 370031 8944 230017 24260 205757 4974 183683 19409 164274 3971 Haryana 5680 5753 562247 9899 149384 1539 147845 2603 418616 4214 414402 7296 Karnataka 4137 41485 372215 8997 156379 15697 140682 3401 257321 25788 231533 5597 Maharashtra 3806 64797 315803 8298 229882 45609 184273 4842 150718 19188 131530 3456 Odisha 1437 5199 138501 9638 28740 1042 27698 1927 114960 4157 110803 7711 Rajasthan 8903 64423 825877 9276 89030 6421 82609 928 801270 58002 743268 8349 Tamil Nadu 3519 11760 340140 9666 343103 11530 331573 9422 8797 230 8567 243 UP 19354 1869 1933531 9990 1035439 1004 1034435 5345 899961 865 899096 4646
Source Directorate of Economics amp Statistics MoA GoI NCPAH (excluding Uttarakhand amp Sikkim) Note - Analysis by GAPL It has been assessed that there is potential of bringing area under MI system is around 6117 million ha in the states under study (excluding Sikkim amp Uttarakhand) Out of this about 3490 million ha is having potential for sprinkler irrigation for crops like cereals pulses and oilseeds in addition to fodder crops The potential area for drip has been estimated in the study to be around 2627 million ha suitable for cotton sugarcane fruits and vegetables spices and condiments and some pulses crops like red gram etc The percentage of actual area against the potential estimated under drip irrigation in different states varied between 6621 in Andhra Pradesh followed by Uttar Pradesh (5345) Gujarat (4974) and Maharashtra with 4842 In case of sprinkler irrigation the percentage of actual area against the potential estimated was 243 (Tamil Nadu) and
Impact Evaluation Study on ldquoNational Mission on Micro Irrigation (NMMI)rdquo
22
the highest of 9621 (Bihar) Compared to the potential of 6117 million ha in the all eleven states the present area under MI accounts for 339 million ha (166 million ha under drip and 173 million ha under sprinkler) which is about 555 (Table 11) The present figures thus reflect the extent of MI systems covered under different government programme as well as own investment by the farmers However the actual area under MI may vary according to the extent of use by the farmers
Figure 7 Proportion of Area under Drip and Sprinkler Irrigation
Source GAPL Analysis
35 Pattern of Assistance
351 Indicative Cost of Installing Micro Irrigation System
As per the guidelines of NMMI the States have been categorized in the following categories
Category A States where more than 20000 hectares have been brought under drip irrigation come under lsquoArsquo Category This would include the States of AP Gujarat Karnataka Maharashtra Madhya Pradesh Punjab Rajasthan and Tamil Nadu
Category B All the states except those covered under the category lsquoArsquo and those falling in the Himalayan belt would come under this category
Category C All the North Eastern States Sikkim Himachal Pradesh Jammu amp Kashmir Uttarakhand and Darjeeling district of West Bengal
Impact Evaluation Study on ldquoNational Mission on Micro Irrigation (NMMI)rdquo
23
Keeping in view the level of awareness proximity to the manufacturing units distance involved in transportation potential for drip irrigation the cost of drip system in Category lsquoBrsquo States is estimated to be 15 higher than Category lsquoArsquo States while for Category lsquoCrsquo States it is estimated to be 25 higher than Category lsquoArsquo States Cooperative SocietiesSelf Help GroupsIncorporated Companies are also entitled to avail assistance on behalf of its members In such cases the individual beneficiary receives assistance through the Cooperative Society SHGIncorporate company and not directly 352 State-wise Pattern of Assistance It was observed that the states are giving subsidy on MI ranging from 50 percent to 100 percent depending on the size of the holding and category of the farmers in different states However the central share is same across the states It may be seen from the Table 12that in Tamil Nadu the quantum of subsidy is 100 percent for small amp marginal farmers whereas in AP for SCST farmers the quantum is cent percent
Table 12 State wise Quantum of Subsidy to Different Categories of Farmers
SNo State
Percentage of subsidy to small
amp marginal farmers
Percentage of subsidy to other farmers
Remarks
1 AP 90 75
APMIP arranges the following Micro Irrigation systems to farmers with government subsidy (SCST 100 subsidy) (others 90 75 60) for Drip (Inline amp Online) Semi-Permanent Sprinklers and Rain Guns
2 Bihar 90 80 About 98 area is under sprinkler irrigation 3 Chhattisgarh 75 50 About 93 area is under sprinkler irrigation
4 Gujarat 50 50 Uniform pattern of subsidy Gujarat Green Revolution Company Limited (GGRC)
5 Haryana 90 90 Additional subsidy is provided for hydro-cyclone filters
6 Karnataka 80 50 For the first 2 ha out of 5 ha per beneficiary ceiling on the area to be undertaken under the scheme
7 Maharashtra 60 50 25 per cent of the beneficiaries are small and marginal farmers
8 Odisha 90 80 Subsidy rate under NMMI wef 2013-14
9 Rajasthan 70 70 90 for drip 70 for sprinkler(mini) 60amp 50 for portable sprinkler for SCST and General Category respectively
10 Sikkim 60 60 NMMI scheme was launched in 2011-12
11 Tamil Nadu 100 75 ldquoTamil Nadu Horticulture Development Agencyrdquo (TANHODA) Subsidy effective from 2511 2011
12 UP 90 75 Subsidy rate under NMMI wef 2012-13 13 Uttarakhand 60 60 NMMI scheme was launched in 2011-12
Note The Central Government share in total subsidy is 50 for small marginal OBC SCST amp women categories and 40 for general categories Sources State Level Nodal Agencies
Impact Evaluation Study on ldquoNational Mission on Micro Irrigation (NMMI)rdquo
24
353 Quantum of Subsidy and Adoption of MI System by Farmers Increase in area under MI has not been found to be significantly higher in case of the states giving higher subsidy quantum and vice versa The Data on area coverage under MI System amp extent of subsidy provided clearly demonstrates that increasing the extent of subsidy had no significant impact on area coverage under MI system The case in point pertains to increase in area under MI in Maharashtra and Gujarat where the subsidy for small amp marginal is 60 percent and 50 percent respectively whereas the area increase was 223 and 140 percent respectively Similarly area coverage in Haryana Tamil Nadu and Bihar was noted to be 73 45 and 31 percent respectively the corresponding figures for subsidy were 90 75 and 90 percent The increase in area under MI was only 13 and 73 percent respectively for UP amp Rajasthan where subsidy level was 90 and 70 percent as per the data available from implementing agencies The aforesaid observation clearly suggests that increasing the subsidy component had no impact on area coverage under MI system The relationship between area expansion under MI and quantum of subsidy has been computed considering beneficiariesrsquo data on area expansion in different states before and after adoption of MI system A critical perusal of data on area coverage collected by our team and also the one quoted by India Statistics portal vis-a-vis the magnitude of subsidies suggests that the states should be advised to seriously consider that the quantum of subsidy to be restricted between 50-70 percent including state and central share and depicted in the table 13
Table 13 State wise Quantum of Subsidy and Area Coverage
State
Total Cultivated
Area (000 ha)
Net Irrigated
area (000 ha)
Area under NMMI
(000 ha)
Percent Irrigated
Area under MI
Area under MI Percent Increase
(Beneficiaries)
Quantum of Subsidy
() for General
Category
Quantum of Subsidy () for Small amp Marginal farmers
AP 1341500 503400 77090 1531 1240 7500 9000 Bihar 617900 303000 7870 260 310 8000 9000 Chhattisgarh 494900 135600 15650 1154 1500 5000 7500 Gujarat 1068100 423300 43660 1031 1400 5000 5000 Haryana 364000 288700 5750 199 1000 9000 9000 Karnataka 1172200 349000 41490 1189 260 5000 8000 Maharashtra 1877200 325600 64790 1990 2230 5000 6000 Odisha 555900 128400 5190 404 1100 8000 9000 Rajasthan 1958400 666100 64420 967 730 7000 7000 Sikkim 8200 1400 NA NA 070 6000 6000 Tamil Nadu 596900 291200 11760 404 450 7500 10000 UP 1780800 1338600 1860 014 130 7500 9000 Uttarakhand 76600 33600 NA NA 160 6000 6000
Source GAPL Analysis As per records of Directorate of Economics and Statistics As per records of NCPAH As per our survey in the sampled states
Impact Evaluation Study on ldquoNational Mission on Micro Irrigation (NMMI)rdquo
25
354 State Implementing Agencies The NMMI scheme is being implemented by specially designated agencies by the respective state governments and is provided one percent of the annual outlay actual release of funds for administering and monitoring the scheme at district level It has been observed that Directorate of Horticulture is the implementing agency for NMMI in nine states The scheme is implemented by Directorate of Agriculture in Maharashtra and Chhattisgarh Rajya Beej amp Krishi Vikas Ltd (CHRBKV) in Chhattisgarh In case of AP and Gujarat the scheme is being implemented by AP Micro Irrigation Project (APMIP) and Gujarat Green Revolution Company (GGRC) respectively
Table 14 State-Implementing Agencies for NMMI
State Implementing Agency Focus Nature of Association
AP APMIP Micro Irrigation SPV- relatively autonomous unit within Horticulture Department
Bihar DoH Agriculture amp Horticulture Government Department
Chhattisgarh CHRBKB Agriculture amp Horticulture Government Department
Gujarat GGRC Micro Irrigation Registered Under Companys Act Public Ltd
Haryana DoH Agriculture amp Horticulture Government Department
Karnataka DoA ampDoH Agriculture amp Horticulture Government Departments
Maharashtra DoA Agriculture amp Horticulture
Government Department
Odisha Horticulture
Development Society (OHDC)
Nodal Agency for NHM
Registered under Society Registration Act
Rajasthan Rajasthan Horticulture Development Society
(RHDS)
Agriculture amp Horticulture
Horticulture Development Society (RHDC)
Tamil Nadu DoH Agriculture amp Horticulture Government Department
UP DoH Agriculture amp Horticulture
Government Department
Sikkim DoH Agriculture amp Horticulture Government Department
Uttarakhand DoH Agriculture amp Horticulture Government Department
Source State Departments
Micro irrigation has been an integral component in some of the schemes of Horticulture Division such as schemes for area expansion The quantum of subsidy varies in these schemes as compared to NMMI scheme This goes against the principle of convergence of schemes It is recommended that assistance for micro irrigation component on pattern of NMMI may be made available under ongoing area expansion schemes
Impact Evaluation Study on ldquoNational Mission on Micro Irrigation (NMMI)rdquo
26
It has been observed that the scheme implemented by the state departments such as horticulture agriculture and others are not fully yielding the desired results because of the following
1) The state departments are also occupied with their own targets and other related activities and are not able to devote desirable time for the implementation of NMMI activities
2) This also creates bias toward their own field such as horticulture department may not give due consideration to field crops etc
3) The extension workers of state departments are involved in providing extension services training and field demonstrations etc of their parent department which affects their working
It is being proposed that separate institute may be created in the line of AP and Gujarat model so that effectiveness transparency monitoring and targets are fully achieved The subsidy process flow charts for AP amp Gujarat are given in Annexure I The consultant has no bias against state departments or government institutions but for meeting the objectives of NMMI such recommendations have been proposed
355 Extent of Convergence with Other Schemes
One of the objectives NMMI scheme is to establish convergence and synergy among different on- going programmes in the country During the course of the study it was observed that in case of NMMI scheme there has been convergence among various on- going programmes such as National Food Security Mission (NFSM) NHM RADP RKVY Integrated Scheme of Oilseeds Pulses Oil palm and Maize (ISOPOM) Technology Mission on Cotton (TMC) and number of state level schemes being implemented by respective states
Rainfed Area Development Programme (RADP) - A Sub-Scheme under Rashtriya Krishi Vikas Yojana (RKVY) The basic premise of the proposed programme is to encourage exploitation of the potential of different farming systems based upon the natural resource assetsendowments (ponds land development nursery etc) created either by the farmers or through schemes like MGNREGA RKVY NHM and Watershed Projects This may act as a catalyst to accomplish the ultimate objective of enhancing productivity minimizing the risk of crop losses due to uncertainties of weather conditions harnessing efficiency of resources assuring food and livelihood income security at farm level and strengthen the farmersrsquo capacity to adapt to climatic changes Therefore converging the upgraded utilities developed through watershed development programmes MGNREGA in terms of water harvesting and micro water storages through effective application and distribution systems like improved conveyance field channels pressurized irrigation water lifting devices etc
Impact Evaluation Study on ldquoNational Mission on Micro Irrigation (NMMI)rdquo
27
to enhance the potential of farming systems The subsidy under this scheme is also extended for installation of pressurized micro irrigation as per norms of NMMI only if not possible through convergence All the States have reported convergence of Mission interventions with different schemes of the Government of India and State level programmes Most of the districts have converged NFSM interventions with programmes such as RKVY ICDP Farm Mechanization NHM Micro-Irrigation and other State programmes 356 Food Security and the Micro Irrigation Scheme To achieve required food production with increasing population India has to enhance the current irrigation potential of 91 M ha to 160 M ha but the total water resources estimated are 230 M hm4 to cater the need to the non-agricultural uses also The country is likely to be water stressed in the coming years Therefore hand in hand with technologies for water harvesting and storage technologies for precision water application methods need to be adopted The food security primarily has the three objectives of ensuring production of adequate food supplies maximizing stability in the flow of supplies and securing access to available supplies on the part of those who need them Access to food has two defined components to it One interventions aimed at boosting agricultural productivity and the second adopting strategies to promote employment social protection measures cash transfers to the poor to improve their access to the available food India has already in place social protection as a component of food security As mentioned earlier several projects for utilization of surface water as well as ground water resources have been undertaken However in some cases the unplanned development has led to over exploitation of the resource affecting the physical sustainability The adverse impact of such unplanned development is evident from the alarming decline in water table in some areas The developmental activities for utilization of water resources as also the development in other sectors particularly industrial sector coupled with urbanization have resulted in water pollution ndash both surface water as well as ground water Further the utilization of the created facilities is far from optimal as the water sector in India suffers from (a) relatively low water use efficiency and (b) increasing gap between the created irrigation potential and the utilized irrigation potential
In this regard it may also be important to note that the future development of water resources are bound to be more challenging as the easy options particularly from the
4Micro Irrigation Management in Cotton CICR Technical Bulletin No 31
Impact Evaluation Study on ldquoNational Mission on Micro Irrigation (NMMI)rdquo
28
topographical and geological considerations have since been tapped Further the future water resources development projects would need rigorous environmental and social evaluations In view of above mentioned challenges and particularly to address the two serious issues namely ldquofood securityrdquo and ldquoimpact of climate changerdquo initiatives have been taken by the Ministry of Water Resources to identify the most appropriate approach for water resources management and also to assign priorities Despite variations in availability of water both within and over the years the long term average available water resources of the country may be considered to remain unchanged Therefore the increasing demand for water for various purposes are bound to result in competition among the ldquousesrdquo as well as among the ldquouser groupsrdquo and with time such competitions are becoming fiercer and fiercer The conflicts among the ldquousers groupsrdquo are visible in the form of increasing inter-State issues The prioritization of water uses for different purposes at different point of in the planning process as also during the operation is becoming more and more challenging in view of conflicting social and economic considerations Such changing scenario calls for identification of most appropriate strategies for effectively addressing the future challenges At the current cereal intake of 143 kgs per capitalannum cereal requirement for household consumption will be around 192 million tons in 2020 The requirement will be more if the increase in household demand due to income growth is also considered At 5 per cent per annum growth in total expenditure and population of 1343 billion household cereal demand works out to 221 million tons in 2020 and for food grains 241 million tons With a grossing factor of 114 the total (household plus non-household) demand for cereals may be around 253 million tons The above cereal demand projections are made with the assumption of stability of tastes and preferences in food consumption If the trend of food grain production as witnessed during the last two decades is sustained the production of additional 57 million tons of cereals and 76 million tons of total food grains in the coming two decades may not be out of reach for India The demand projections may turn out to be on a higher side if the secular trend of change in consumer preferences away from cereal consumption persists Demand for superior food items such as dairy and animal husbandry products sugar fruits and vegetables are expected to grow much faster during the coming decades The estimated demand in 2020 for milk and milk products will be around 166 million tons edible oils 11 million tons meat fish and eggs 11 million tons sugar and gur 25 million tons and fruits and vegetables 113 million tons It may be noted that food grains pulses oilseeds sugar fruits and vegetables poultry dairy meat fish etc constitute the bulk of the output in the agriculture sector The performance of agriculture is important for availability and access to food as more than 55
Impact Evaluation Study on ldquoNational Mission on Micro Irrigation (NMMI)rdquo
29
per cent people in the country are dependent on this sector There are both short run and long run problems in agriculture Farmersrsquo suicides continue unabated even increasing in some states as growth rate in yield is on the decline Farming is fast becoming a non-viable activity Further scope for increase in net sown area is limited Land degradation in the form of depletion of soil fertility erosion and water logging has increased There has been decline in the surface irrigation expansion rate and a fall in the level of the ground water table Exposure of domestic agriculture to international competition has resulted in a high order of volatility in prices Disparities in productivity across regions and crops and between rain fed and irrigated areas has increased Long term factors like steeper decline in per capita land availability and shrinking of farm size are also responsible for the agrarian crisis Land issues such as SEZs land going to non-agriculture alienation of tribal land etc are becoming important The Steering Committee report on agriculture for the Eleventh Plan (GoI 2007) has identified the possible reasons for deceleration in agriculture since the mid- 1990s According to the report the major sources of agricultural growth are public and private investment in agriculture and rural infrastructure including irrigation technological change diversification of agriculture and fertilizersA major challenge to food security comes from dietary diversification of the poor If cereal pricing is left to the market forces government playing the facilitating role land may be released from rice and wheat cultivation to meet the growing demand for non-cereal crops such as oilseeds fruits and vegetables in accordance with diet diversification The micro irrigation system is a proven technology that helps in improving the productivity of crops by judicious use of water MI system has resulted in improving the productivity of wheat maize and pulses by 2405 1348 and 2869 respectively Area under horticulture crops as well as nutritional security has also enhanced The positive outcomes on the food security due to the increase in the production amp productivity of different crops and increased area under irrigation from same source of water However keeping in view the growth population of the country we need to boost the production that can be possible with the help of innovation amp transparency in the irrigation system in NMMI scheme 36 Mission Structure Review 361 National Level National Level The Horticulture Division in the Department of Agriculture amp Cooperation Ministry of Agriculture coordinates the overall activities and review the progress of implementation of the Mission in the country The Executive Committee (EC) of is chaired
Impact Evaluation Study on ldquoNational Mission on Micro Irrigation (NMMI)rdquo
30
by Secretary (AampC) Department of Agriculture amp Cooperation to oversee the activities of the Mission and to approve the State Annual Action Plans besides projects on technology transfer etc National Committee on Plasticulture Applications in Horticulture (NCPAH) is entrusted in the monitoring and reviewing the progress of the scheme Executive Committee (EC) reallocates resources across States and approves programmes on the basis of approved subsidy norms EC is empowered to approve special interventions for tackling emergent requirements EC can also constitute Sub-Committee (SC) Empowered Committee (EMC) and delegate power to SC EMC for emergent requirements like revision of cost norms inclusion of equipment etc if required based on the recommendations of EC of NMMI 362 State Level Micro Irrigation Committee (SMIC) At the State level State Micro Irrigation Committee (SMIC) under the Chairmanship of Agriculture Production Commissioner Principal Secretary (Horticulture Agriculture) oversees the implementation of the scheme in their respective States The Panchayati Raj Institutions in the State are also member of the SMIC represented in the SMIC and involved in the implementation of the Scheme The Chairman at his discretion can co-opt officials experts as invitees The SMIC meeting is held once in every quarter The state level micro irrigation committees have been assigned to perform the following functions as per the guidelines
1 Organise base line survey and feasibility studies in different parts of the state covering various crops and technologies
2 Ensure smooth implementation of Micro irrigation programme in different districts of the state
3 Ensure allocation of state share required for implementing the scheme and make it available to the implementing Agency
4 Finalise and forward the consolidated actions plans of the Districts to DAC
5 Register the System Manufacturers and circulate the list of System Manufacturerrsquos registered with SMIC along with the quoted price to the District Micro Irrigation Committee (DMIC) and Implementing agencies They will also indicate the quantum of money to be paid by the beneficiariesbanks to the manufacturers before installing the system
6 Mobilize credit requirement of the farmers through the Financial Institutions for installing Micro Irrigation System
7 Organise various training and extension programmes for farmers officials NGOrsquos entrepreneurs etc involving PFDCs
Impact Evaluation Study on ldquoNational Mission on Micro Irrigation (NMMI)rdquo
31
8 Host a website indicating the details and status of the progress of NMMI scheme in different districts of the state
During the course of discussions qualitative assessment was made on the basis of these parameters such as organise base line survey and feasibility studies in different parts of the state covering various crops and technologies are regularly prepared and accordingly assessment has been made Similarly the same criterion was adopted in other parameters to arrive at final assessment and these were summarized in the table 15 It may be seen from the table that the states of AP Gujarat Maharashtra are performing better than other states as far as their functions and responsibilities are concerned whereas Bihar and UP are the laagered states in this regard It may be premature to comment on the performance of Sikkim and Uttarakhand states because the scheme is recently implemented
Impact Evaluation Study on ldquoNational Mission on Micro Irrigation (NMMI)rdquo
32
Table 15 Performance of the Functioning of SMICs in Sampled States
Functions States
Base line survey and feasibility
studies
Implementation
Allocation of the State Share Action Plan
Registration of the System Suppliers
Mobilize Credit for Farmers
Capacity Building
Programme
Website Hosting Assessment
AP Medium High High High High Low-medium Medium Medium Medium-high
Bihar Low Low Low Low-medium Low-medium Low Low Low Low
Chhattisgarh Low-medium Medium Medium Medium High Low-medium Low-medium Low-medium Medium Gujarat Medium High High High High Low-medium Medium Medium Medium-high Haryana Low-medium Medium Low-medium High Low-medium Low-medium Low-medium Medium Low-medium Karnataka Low-medium Medium High High High Low-medium Medium High Medium-high Maharashtra Medium Medium High High High Low-medium Medium Medium Medium-high Odisha Low-medium Medium Low-medium High High Low-medium Low-medium Low-medium Medium Rajasthan Low-medium Medium High High High Low-medium Medium Medium Medium-high Tamil Nadu Medium Medium Medium High High Low-medium Medium High Medium-high UP Low Low Low Low Low-medium Low Low Low Low
Sikkim Low Low Low Low-
medium Low-medium Low Low Low Low
Uttarakhand Low Low Low High Medium Low Low Low Low Source GAPL analysis
Note High Response is more than 80 Medium Response is between 50 to 70 Low Response is below 50
Impact Evaluation Study on ldquoNational Mission on Micro Irrigation (NMMI)rdquo
33
The above table shows the assessment of performance amp functioning configuration The scales are used to represent the intensity of the functions ongoing into the sampled state The registration of the system suppliers are scaled as per the number of manufacturers in proportion to the size of the state It has been observed that AP Gujarat amp Maharashtra are leading states in the every aspect of the different activities involved in the process streamlined those are mentioned in the NMMI guidelines It has further been observed that Bihar UP Sikkim amp Uttarakhand states are lacking in terms of the functions mentioned in the guidelines There are still many dots to be connected in these states to get the desired and satisfactory results 363 District Level Micro Irrigation Committee (DMIC) At the District level District Micro Irrigation Committee (DMIC) headed by the Chief Executive Officer (CEO) of Zila Parishad District Rural Development Agency (DRDA) Collector of the District with members representatives from concerned departments viz Agriculture Horticulture Rural Development Irrigation and Water Resources Growersrsquo Association Krishi Vigyan Kendras (KVKs) and local lead Banks are responsible for implementing the NMMI programme in the district The DMIC meeting is held once in every month The DMIC performs the following functions as per the guidelines
1 Forward the District Action Plan to SMIC for compilation of State Action Plan and forward it to the Ministry of Agriculture
2 Mobilize credit requirement of the farmers through the Financial Institutions for installing Micro Irrigation System
3 Monitor and review the physical amp financial progress of implementation of Mission programme
4 Review the submission of utilization certificate by the implementing agency
5 Provide Feedback to SMIC on monthly basis by 6th7th of each month
It was observed that DMIC in almost all the states are preparing their district plans regularly and in time except for Bihar UP Sikkim and Uttarakhand and accordingly assessment has been made Similarly the same criterion was adopted in other parameters to arrive at final assessment The table below shows the extent of functioning at the district level It is also portraying almost the same picture that is being shown under the state level
Impact Evaluation Study on ldquoNational Mission on Micro Irrigation (NMMI)rdquo
34
Table 16 Performance of the Functioning of DMICs in Sampled States
Functions States
District Plan
Mobilizing Credit Review amp
Monitoring
Submission of
Utilization Certificates
Monthly Feedback amp Reporting
Own Assessment
AP High Low-medium High Medium High Medium-high Bihar Medium Low Low-medium Low Low-medium Low Chhattisgarh High Low-medium Medium Low-medium Medium Low-medium Gujarat High Medium High Medium High Medium-high Haryana High Low Medium Medium Medium Medium Karnataka High Medium High Medium High Medium-high Maharashtra High Medium High Medium High Medium-high Odisha High Low-medium Low-medium Low-medium Medium Medium Rajasthan High Low-medium High Medium High Medim-high Tamil Nadu High Low-medium Medium Medium Medium Medium UP Medium Low Low-medium Low Low-medium Low Sikkim Medium Low Low-medium Low Low-medium Low Uttarakhand Medium Low Low-medium Low Low-medium Low
Source GAPL analysis
Note High Response is more than 80 Medium Response is between 50 to 70 Low Response is below 50 364 Improving Efficacy of the Institutional Mechanism The following measures may be taken to improve the efficacy of the institutions involved in the implementation of the scheme
1 The utilization certificates to be submitted in time for the prompt release of the funds
2 SPV on the pattern AP state and separate institute like GGRC in Gujarat may be adopted for improving the efficiency and transparency
3 The meeting of various committees formed under the programme should be held regularly The meetings of the SMIC should be convened on quarterly basis and the same may also not tagged with other meetings in order to give proper focus on the implementation of the programme
4 Human Resource Development is one of the key factors for successful implementation of other sub components of any programme The capacity building at all levels -farmers field level workers technical officers and scientists and developing orientation skills of all the stake holders in the context of changing needs of agriculture to be intensified More training programmes for all the stakeholders should be organized
Impact Evaluation Study on ldquoNational Mission on Micro Irrigation (NMMI)rdquo
35
37 Role of Panchayati Raj Institutions (PRIs) in NMMI Scheme Panchayats have been entrusted mainly in identification of the beneficiaries in their respective jurisdiction The interested farmer put his application to the Panchayat and after verification the case is recommended Panchayati Raj Institutions are involved in the following activities i Selection of crops and identification of priority areas for implementation
ii Authorization of beneficiaries compilation of application forms proforma invoices and
creation of local initiatives in promotion of micro irrigation technology iii Organization of interactive meetings with the representatives of MI industry iv Training extension and awareness creation (added as per GoI notification dated 208
2013)
However during the course of discussions it was observed that PRIs role is not only limited to compilation of necessary documents required for submission of application forms but also involved in Information-Communication-Education (IEC) activities as shown it the
The major activities and roles of PRIs practiced in different sampled states are as follows
A Issues no objection certificate on first come first serve basis Gram Panchayat informs to Gram Sabha regarding the selection of NMMI beneficiaries as well as verification of the land ownership
B Verification amp certification of the farmersrsquo ownership amp domicile involved in IEC activities Issues no objection certificate on first come first serve basis
C Verification amp certification of farmersrsquo domicile Issues no objection certificate on first come first serve basis
D Verification amp certification of the farmersrsquo ownership amp domicile involved in IEC activities recommendation of farmersrsquo Issues no objection certificate on first come first serve basis
E It is suggested that Panchayati Raj Institutions are required to be more effective in their roles amp responsibilities as per the guidelines for which sensitization exercises through training and capacity building programmes may be initiated
Impact Evaluation Study on ldquoNational Mission on Micro Irrigation (NMMI)rdquo
36
4 Primary Survey Respondentsrsquo Profile and Findings Primary survey of 7400 farmers was conducted in 13 states as per the sampling plan detailed in chapter 2 The coverage is quite systematic amp comprehensive hence no distortion in the findings is expected due to disproportionate representation of any specific category
The purpose of analyzing the profiles of different respondents and deriving the findings was to evaluate the overall impact created by the scheme and to find the gap between planned objectives and outcome after the execution of the scheme along with identifying the best possible solution to fill the gap if any 41 Demographic Profile (Sampled Beneficiaries amp Non-beneficiaries) The socio economic conditions of the target group indicate their basic characteristics which may be instrumental in the adoption of new technologies and interventions The demographic profile of the farmers covered in the survey in terms of their education profile gender category etc is presented in the following section 411 Size of Land Holding The benefit of the NMMI scheme is extended to the farmers on the basis of size of holding As per the norms at least 33 percent of the allocation is to be utilized for the small marginal and women farmers Similarly the quantum of the subsidy is more for small and marginal farmers The beneficiaries in case of small and marginal farmers are eligible for subsidy up to 60 percent of the cost of drip sprinkler irrigation system and the remaining 40 percent have to borne by the farmers However in the case of general categories of the farmers subsidy assistance is 50 percent of the cost of the system which is shared in the ratio of 401050 by the central state government and the beneficiaries The states are free to provide additional subsidy to the beneficiaries from their own resources Keeping the above factor in view the sampled farmers were categorized as per the prescribed guidelines (Table 18) into three categories based on their land holdings such as marginal amp small farmer under 2 hectares medium between 2-10 hectares and large above 10 hectares The results on distribution of the farmers according to their land holding category have been presented in the table 17 for both beneficiaries and non-beneficiaries
Impact Evaluation Study on ldquoNational Mission on Micro Irrigation (NMMI)rdquo
37
Table 17 Land Holding Status of Beneficiary and Non Beneficiary Farmers
State
Beneficiaries Non Beneficiaries
Total Beneficiaries
Category of Farmers () Total Non-Beneficiary
Category of Farmers (`) Marginal amp
Small Medium Large Marginal amp Small Medium Large
AP 672 9241 759 000 168 9643 357 000 Bihar 516 1105 7945 950 128 5391 4453 156 Chhattisgarh 384 8359 1589 052 96 9375 625 000 Gujarat 576 4132 566 208 144 5833 3819 348 Haryana 320 3344 6062 594 81 4568 5185 247 Karnataka 576 7691 2292 017 144 8333 1667 000 Maharashtra 672 8304 1666 030 169 8343 1657 000 Odisha 480 5250 4708 042 120 5500 4417 083 Rajasthan 574 3711 6028 261 138 6884 2899 217 Sikkim 50 10000 000 000 10 9000 1000 000 Tamil Nadu 455 8286 1714 000 120 8333 1667 000 UP 527 3397 6546 057 168 6667 3273 060 Uttarakhand 90 5000 4667 333 22 7727 2273 000 Total 5892 5874 3943 183 1508 7308 2600 092 Source GAPL survey
Marginal small and medium category of farmers accounted for 5874 and 3944 percent of the beneficiaries where as 183 percent farmers are reported to be under large category among beneficiaries while among non-beneficiaries 73 percent farmers fall under the category of marginal-small farmers and 26 percent are under medium land holding category The distribution of large farmers among non-beneficiaries are not observed in Andhra Pradesh Chhattisgarh Karnataka Maharashtra Sikkim Tamil Nadu and Uttarakhand
The above table reveals that the proportion of a small and marginal farmers are observed to be highest in Sikkim followed by Andhra Pradesh Chhattisgarh Maharashtra and Tamil Nadu among the sampled farmers The proportion of medium and large farmers accounted for 3943 percent of the total beneficiaries
The data on size and distribution of operational land holdings in the country (Table 18) also suggest that medium and large farmers accounted about 15 percent of total land holdings thus occupying approximately 5542 percent of the total area The average size of land holding with the medium and large category of farmers was also noted to be 608 and 1810 hectare respectively
Impact Evaluation Study on ldquoNational Mission on Micro Irrigation (NMMI)rdquo
38
Table 18 Size and Distribution of Operational Holdings
SNo Category of Holding Size Group (Ha) Holding
()
Total Area Coverage
()
Average Size (Ha)
1 Marginal lt 10 671 225 039 2 Small 10 - 20 1791 2208 142
Sub Total 8501 4458 3 Semi Medium 20 - 40 1004 2363 271 4 Medium 40 - 100 425 212 576 5 Large gt 1000 07 1059 1738
Sub Total 1499 5542 Total 100 100 115
Source Agriculture Census -2010
In light of these facts the present limit of area up to 5 hectare under NMMI scheme needs to be re-looked and calls for relaxation of farm size limitations in providing subsidies This will not only increase the area under MI and improve the water use efficiency but will also contribute significantly towards food security on sustainable basis 412 Categories of Farmers The NMMI scheme is extended to all the categories of the farmers and the mission has earmarked the total allocation to SCST farmers as per their proportion to the population in the district The following table summarizes the categories on their category both for beneficiaries and non-beneficiaries
Table 19 Category wise Proportion of Beneficiary and Non Beneficiary Farmers
State Beneficiaries Non Beneficiaries
Total Beneficiaries
Farmers Categories () Total Non-Beneficiaries
Farmers Categories () Gen OBC ST SC Gen OBC ST SC
AP 672 2768 5074 1116 1042 168 3750 4345 1131 774 Bihar 516 3643 5853 213 291 128 2734 6641 391 234 Chhattisgarh 384 3438 2891 3307 365 96 1563 3854 3646 938 Gujarat 576 7222 2083 556 139 144 7569 2083 208 139 Haryana 320 8219 1656 000 125 81 6914 2716 000 370 Karnataka 576 6424 2049 712 816 144 6111 2431 903 556 Maharashtra 672 7574 2247 104 074 169 7633 2012 178 178 Odisha 480 5458 3354 917 271 120 5500 2667 1500 333 Rajasthan 574 3711 5279 714 296 138 3043 6522 290 145 Sikkim 50 2400 2200 5400 000 10 7000 2000 1000 000 Tamil Nadu 455 4044 5187 066 703 120 5750 3583 000 667 UP 527 4156 5408 019 417 168 2679 6131 119 1071 Uttarakhand 90 5444 1556 111 2889 22 4545 2273 000 3182 Total 5892 5097 3744 696 463 1508 4867 3919 683 531
Impact Evaluation Study on ldquoNational Mission on Micro Irrigation (NMMI)rdquo
39
It may also be seen from the above table which shows coverage of different categories of farmers selected for primary survey on random basis the implementing agencies in various states under study were able to provide the benefits of NMMI scheme to all the categories of the farmers based on its norms 413 Gender The role of the women in agriculture is more than 60 percent for conducting different farm activities like tending of animals farm operations ( except ploughing ) and other farms house activities In the guidelines of the NMMI schemes a special mention has been made for the benefits to be extended under the scheme to the women farmers Therefore the coverage of number of male and female beneficiaries in the survey is presented in the following table
Table 20 Gender Status of Beneficiaries and Non Beneficiaries
State
Beneficiaries Non Beneficiaries Total
Beneficiaries Gender () Total Non-
Beneficiary Gender ()
Male Female Male Female AP 672 8348 1652 168 9702 298 Bihar 516 9399 601 128 9688 313 Chhattisgarh 384 8932 1068 96 9271 729 Gujarat 576 9427 573 144 9792 208 Haryana 320 3781 6219 81 10000 000 Karnataka 576 8628 1372 144 9931 069 Maharashtra 672 9345 655 169 9822 178 Odisha 480 8896 1104 120 9833 167 Rajasthan 574 9059 941 138 9710 290 Sikkim 50 8800 1200 10 9000 1000 Tamil Nadu 455 8835 1165 120 9833 167 UP 527 8843 1157 168 9821 179 Uttarakhand 90 8667 1333 22 10000 000
Total 5892 8681 1319 1508 9768 236 Source GAPL Survey It may be seen from the above that proportion of male among the entire sampled respondent is higher than 85 percent in case of beneficiaries and non-beneficiaries both This may be due to the fact that in most cases the land is generally in the name of head of the family and being a patriarchic society land ownership rests with the male gender 414 Educational Status Education plays an important role in the development and the same is true for the NMMI schemes Therefore the education status of sampled farmers both beneficiaries and non-beneficiaries was enquired This information is summarized in table below
Impact Evaluation Study on ldquoNational Mission on Micro Irrigation (NMMI)rdquo
40
Table 21 Education Status of Beneficiaries and Non-beneficiaries
State
Beneficiary Non Beneficiary
Total Beneficiary
Education status () Total No of Non-
Beneficiary
Education status ( ) Not
Educated Primary High
School Sr
Secondary Graduate
and Above
Not Educated
Primary High school
Sr Secondary
Graduate and
above AP 672 223 2232 4435 2515 595 168 060 1964 5298 2321 357 Bihar 516 659 2035 3120 1667 2519 128 1016 2891 2813 1328 1953 Chhattisgarh 384 1120 3568 2526 1589 1198 96 521 4167 3125 1771 417 Gujarat 576 1128 2917 3073 1632 1250 144 1389 2986 3194 1042 1389 Haryana 320 2094 1438 2469 1438 2563 81 370 2716 3210 1852 1852 Karnataka 576 313 3090 4288 1354 955 144 625 3681 3264 1667 764 Maharashtra 672 298 2321 4003 1622 1756 169 414 2249 4201 1775 1361 Odisha 480 688 2708 3229 1750 1625 120 917 3250 3167 1250 1417 Rajasthan 574 784 4268 3937 557 453 138 1232 4275 4275 217 000 Sikkim 50 200 1600 3000 2000 3200 10 1000 1000 3000 2000 3000 Tamil Nadu 455 352 2374 4505 1165 1604 120 583 3917 4500 917 083 UP 527 607 3454 4023 1195 721 168 476 2560 4107 2024 833 Uttarakhand 90 1111 1889 2000 3556 1444 22 3636 1364 2727 1818 455 Avg Total 5892 677 2766 3664 1556 1336 1508 729 3037 3806 1499 928
Source GAPL Survey
Impact Evaluation Study on ldquoNational Mission on Micro Irrigation (NMMI)rdquo
41
In most of the sampled areas the most of the farmers are educated except in Haryana where about 21 percent of the beneficiaries reported to be not educated The higher proportion of graduate among beneficiaries in most of the states as compared to non-beneficiaries clearly indicates that educated and informed farmers are more likely to adopt MI Systems
415 Status of Communication Facilities
Communication Media is an important tool of flow of information particularly in agriculture as pre and post-harvest operation are time bound as well as subject to use of resources Quick and authentic information are required for weather forecast agriculture operations and practices information about the markets for disposal etc Numbers of portals such as AGMARKNET have been launched to benefit the farming community
Table 22 Mobile Phone Ownership
State Beneficiary having
Mobile () Non Beneficiary
having Mobile () AP 1979 1190 Bihar 8043 6016 Chhattisgarh 3854 625 Gujarat 8767 6597 Haryana 6719 5926 Karnataka 2934 903 Maharashtra 2426 414 Odisha 3333 1917 Rajasthan 5505 5507 Sikkim 7400 9000 Tamil Nadu 2462 250 UP 1195 1607 Uttarakhand 3556 1364 TOTAL 4189 2699
The consultants have captured the status of mobile ownership among beneficiaries as well as non-beneficiaries for the comparison purpose The following facts have been observed from the table above
40 percent of the farmers are having access to mobile phones The table further reveals that the maximum number of beneficiaries possessing mobile phones were in Gujarat (88) followed by Bihar (80) Sikkim (74) and Haryana (67)
This is an encouraging trend as farmers are making use of the Information and Communication Technology
Less than 27 percent of the non-beneficiaries have access to the mobile phones whereas the average of mobile holders among beneficiaries was noted to be around 42 percent
Impact Evaluation Study on ldquoNational Mission on Micro Irrigation (NMMI)rdquo
42
In may further be added here that total number of mobile users as per ldquoIndia Mobile Landscaperdquo (IML) 2013 study were 5548 crores and out of this about 298 crores (537) are 22 percent are in rural areas
Further if we analyze the overall scenario of mobile penetration it comes to about 25 percent The penetration of this technology was noted to be much higher in case of beneficiaries using mobiles
The field observations gathered from the farmers of sampled states correlates that with increase in income due to MI technologies the beneficiary farmers have started use of this technology
It shows that the different positive attributes of MI technology enabling adopters to access the technology updating themselves with the mobile technology that lead the beneficiaries towards attaining better social status due to increase of their income and purchasing power As for the availability of email IDs with the sampled farmers is concerned negligible number of farmers had this mode of communication 42 Results and Discussions 421 Quality of soil and irrigation water Irrigation with saline water through the conventional methods like flooding results in accumulation of salts in soil profile resulting in reduced availability of water to plants poor to delayed germination and slow vegetative growth rate However with the use of micro-irrigation systems (dripsprinkler) the saline water is applied frequently in lesser amounts due to which the evaporation losses of irrigation water are very less which prevents the accumulation of salts and keep their concentrations well below the harmful limit in crop root zone Thus at places where the fresh water resources are limited alternative non-conventional water resources like saline water aquifer may be exploited to feed the expansion drive for irrigation In this context the scientific use of saline water in conjunction with adaptable water use technologies has been advocated as a perfect proxy for irrigation The electrical conductivity of saline soils is gt 4 dSm and pH is gt 80 In the areas having problems of soil salinity the soil and water testing are specifically important to adopt the appropriate measures to draw full advantage of the micro irrigation system The data on extent of saline soils in the sampled states coupled with the farmers responses on getting their soils and water tested are cited in table 23 It has been documented that clogging factor in MI system is minor moderate and severe in water samples having EC values lt 080 08-31 and gt 31 dSm respectively Such values for pH have been reported to be lt70 70-80 and gt 80 (Patil 2001)
Impact Evaluation Study on ldquoNational Mission on Micro Irrigation (NMMI)rdquo
43
Table 23 Extent of Soil Salinity (in sampled states) and Beneficiaryrsquos Responses on Soil and Water Testing
State Status (000 ha)
Total Beneficiaries
Percent Response of the sample beneficiaries on
soil amp water testing Saline soils
Sodic Soil
Total Yes No
AP 7760 19661 27421 672 6146 3854 Bihar 4730 10585 15315 516 6705 3295 Chhattisgarh NA NA NA 384 6458 3542 Gujarat 168057 54143 222200 576 6927 3073 Haryana 4916 18340 23256 320 7781 2219 Karnataka 189 14814 15003 576 6910 3090 Maharashtra 18409 42267 60676 672 7336 2664 Odisha 14714 000 14714 480 6375 3625 Rajasthan 19557 17937 37494 574 7913 2087 Sikkim NA NA NA 50 5400 4600 Tamil Nadu 1323 35478 36801 455 5758 4242 UP 2199 134697 136896 527 5275 4725 Uttarakhand 000 000 000 90 7778 2222 Total 241854 347922 589776 5892 6887 3113 Source Central Soil Salinity Research Institute Karnal Haryana-20105
In the sampled states magnitude of soil salinity was noted to be highest in Gujarat followed by UP which was followed by Maharashtra and Rajasthan There is thus a strong need to launch special drives to motivate the farmers to get their soil and water samples tested This may enable them to adopt the recommended measures to prevent the clogging of emitters and enhance the crop productivity with the adoption of MI systems As per the guidelines of NMMI It is mandatory to conduct soil and water tests by MI system suppliers registered under the scheme Though about 6887 of sampled beneficiaries of all the 13 sampled states have got their soil amp water tested In Gujarat UP Maharashtra amp Rajasthan soil testing adopted by 6927 5275 7337 and 7913 of respondents respectively
It was further investigated if beneficiaries are aware about the importance of soil and water quality on the performance of the MI systems the results are presented in the table below
5Technical Bulletin CSSRIKarnal22010 Computerized Database on Salt Affected Soils in India AK Mandal RC Sharma Gurbachan Singh and JC Dagar 2010
Impact Evaluation Study on ldquoNational Mission on Micro Irrigation (NMMI)rdquo
44
Table 24 Extent of Awareness about Important Soil and Water Quality Parameters
State
Total Beneficiary
Soil quality testing Water quality testing pH EC pH EC
Yes ()
No ()
Yes ()
No ()
Yes ()
No ()
Yes ()
No ()
AP 672 238 9762 030 9970 000 10000 000 10000 Bihar 516 097 9903 058 9942 058 9942 058 9942 Chhattisgarh 384 000 10000 000 10000 000 10000 000 10000 Gujarat 576 521 9479 382 9618 434 9566 434 9566 Haryana 320 000 10000 000 10000 000 10000 000 10000 Karnataka 576 000 000 000 000 000 000 000 000 Maharashtra 672 313 9688 238 9762 283 9717 238 9762 Odisha 480 333 9667 333 9667 146 9854 146 9854 Rajasthan 574 9913 087 9913 087 9861 139 9843 157 Sikkim 50 1400 8600 000 10000 000 10000 000 10000 Tamil Nadu 455 000 000 000 000 000 000 000 000 UP 527 5275 4725 3226 6774 3529 6471 4288 5712 Uttarakhand 90 000 10000 000 10000 000 10000 000 10000 Total 5892 1599 6651 1354 6896 1368 6882 1429 6821
Source GAPL Survey
It has also been noted that farmers in most of the sampled states were not even aware of the importance of soil and water testing (Table 24)There is thus a dire need to create awareness about the importance of soil and water testing among farmers and make them aware of consequent clogging of emitters 422 Sources of Irrigation There are number of water sources in different parts of the states country such as bore well canals ponds tube wells etc from which the farmers get the irrigation water for their fields In this context information on the availability of water sources was compiled The following inferences have been drawn
Bore well is the most preferred source of water supply among the users of MI systems proportion being about 82 as may be seen from the table below
Further it may be seen that 100 percent of the farmers of Karnataka and AP have own bore wells followed by the farmers of Bihar UP Tamil Nadu Odisha Chhattisgarh Rajasthan and Gujarat The other important sources are canal well and spring water
Over 62 percent farmers of Sikkim reported to have farm ponds at their farms and remaining 38 percent from spring water which is an exception as compared to other states covered in the survey
Impact Evaluation Study on ldquoNational Mission on Micro Irrigation (NMMI)rdquo
45
It may also be inferred that more than 92 percent (bore well well and farm pond) of the beneficiaries have owned water sources which facilitates them to operate the MI systems as per the crop needs
Table 25 Source of Irrigation Water ()
State Total Beneficiary
Bore well Well Farm
Ponds Canals Bore well amp Canals
Canals amp Farm Ponds Others
AP 672 9970 000 000 000 000 000 030 Bihar 516 9845 000 019 058 078 000 000 Chhattisgarh 384 8464 000 026 000 000 000 1510 Gujarat 576 7517 2309 035 069 000 000 069 Haryana 320 4625 000 281 313 781 1406 2594 Karnataka 576 10000 000 000 000 000 000 000 Maharashtra 672 3958 5342 119 446 074 000 060 Odisha 480 9250 750 000 000 000 000 000 Rajasthan 574 7631 976 000 697 314 279 105 Sikkim 50 000 000 6200 000 000 000 3800 Tamil Nadu 455 9495 264 000 242 000 000 000 UP 527 9696 304 000 000 000 000 000 Uttarakhand 90 7667 000 000 000 000 000 2333 Total 5892 8181 1039 088 166 088 104 334 Source GAPL Survey
423 Water Table The cost of irrigation depends on the depth of the water available from the ground water sources In this regard the beneficiaries were asked to narrate the depth of the water table at their farms The pertinent data has been summarized in Table 26 which helps in the selection of appropriate capacity of the pump for smooth and efficient functioning of the system
Table 26 State wise Water Table Depth
State Total Beneficiaries
Water availability depth () 0-50 Ft 50-100 Ft 100-150 Ft 150-200 Ft 200-250 Ft gt250 Ft
AP 672 030 060 104 1845 7723 238 Bihar 516 4574 5000 426 000 000 000 Chhattisgarh 384 1198 1563 4661 1615 703 260 Gujarat 576 833 3090 1337 1424 660 2656 Haryana 320 2875 3438 1625 1000 438 625 Karnataka 576 000 538 972 1771 6493 226 Maharashtra 672 4613 2649 997 1280 357 104 Orissa 480 9792 208 000 000 000 000 Rajasthan 574 767 1760 3397 1446 348 2282 Sikkim 50 - - - - - - Tamil Nadu 455 000 1319 2396 5758 484 044 UP 527 3397 5028 1480 076 019 000 Uttarakhand 90 889 2444 667 000 778 5222 Total 5892 2436 2167 1439 1421 1775 677
Note The beneficiaries of Sikkim are not aware of the depth of water availability Source GAPL Survey
Impact Evaluation Study on ldquoNational Mission on Micro Irrigation (NMMI)rdquo
46
424 Sources of Awareness about NMMI Scheme The Table 27 shows that the mix trend among the farmers and the major sources of awareness was through fellow farmers service providers suppliers extension workers etc The highest proportion of awareness revealed in Chhattisgarh was through fellow farmers in Uttarakhand UP and Sikkim through extension workers It is interesting to note that the suppliersrepresentatives of the manufacturers are the major sources of awareness to the beneficiaries This may be due to the reason that the supplier of the system have their own interest in this competitive trade and motivate as well as facilitate the farmers in applying for the benefit
Impact Evaluation Study on ldquoNational Mission on Micro Irrigation (NMMI)rdquo
47
Table 27 Sources of Awareness Reported by Beneficiaries ()
State Total
Beneficiaries Fellow
Farmers Radio Newspaper TV Pamphlet
Extension worker
Supplier Fellow
Farmers amp Supplier
Fellow Farmers amp Extension
worker
Fellow Farmers amp Newspaper
Extension worker amp Supplier
Others
AP 672 2664 000 015 060 030 2217 4628 149 149 000 089 000 Bihar 516 2597 000 019 000 000 562 3450 1667 407 000 155 1143 Chhattisgarh 384 5365 000 000 000 000 130 3411 859 078 000 052 104 Gujarat 576 2153 000 122 156 069 226 1563 3941 694 226 035 816 Haryana 320 1813 094 000 000 000 6938 531 125 250 094 000 156 Karnataka 576 2396 017 017 017 000 069 1684 3663 694 1111 278 052 Maharashtra 672 2515 045 119 045 000 908 2247 3051 551 253 164 104 Orissa 480 2479 021 250 146 000 208 2021 3479 583 354 333 125 Rajasthan 574 3136 000 122 017 105 2596 3972 017 000 017 000 017 Sikkim 50 1600 000 000 000 000 4000 200 1200 1400 1000 000 600 Tamil Nadu 455 1516 154 000 000 000 088 1582 3934 703 1407 242 374 UP 527 2220 000 000 000 000 5674 1727 228 057 019 019 057 Uttarakhand 90 889 444 333 000 222 5444 1889 000 111 000 000 667 Total 5892 2561 032 068 042 024 1721 2514 1937 390 314 124 273
Note Other source of awareness includes multiple sources of different combinations Source GAPL Survey
Impact Evaluation Study on ldquoNational Mission on Micro Irrigation (NMMI)rdquo
48
Following the same pattern of the sources of awareness for beneficiary farmers the same was asked from the non-beneficiary farmers and their responses are summarized in the Table 28
Almost 1149 non adopters out of sampled 1508 are aware about the scheme that is about 76 percent It may be seen from the following table that the major sources of awareness for no adopters are other farmers suppliers and extension workers It may also be seen here that the awareness in most of the states is more than 70 percent except for Uttarakhand Rajasthan and Gujarat
Table 28 Source of Awareness of Scheme Reported by Non-beneficiary ()
State Total Beneficiaries
Other Farmers Radio Newspaper TV Extension
worker Supplier
Other Farmers
and Supplier
Other Farmers amp Newspaper
Others
AP 116 4655 172 690 086 1207 1638 517 431 603 Bihar 95 5684 000 000 000 526 2632 947 211 000 Chhattisgarh 53 9434 000 000 000 000 189 000 189 189 Gujarat 95 4737 105 000 105 000 316 3368 421 947 Haryana 69 7971 000 000 000 1014 435 290 290 000 Karnataka 126 5794 000 000 000 000 397 2381 1349 079 Maharashtra 154 5000 065 195 065 584 1429 1883 584 195 Odisha 98 4898 000 102 000 204 714 2551 1122 408 Rajasthan 95 6632 000 316 000 947 2000 105 000 000 Sikkim 10 5000 000 000 000 000 2000 3000 000 000 Tamil Nadu 106 3774 000 000 000 000 1226 2642 2358 000 UP 120 7583 000 000 167 1917 083 250 000 000 Uttarakhand 12 000 000 000 000 5000 5000 000 000 000 Total 1149 5701 035 131 044 653 1097 1462 661 218
Note The total number of non-beneficiaries in the above table is only those who are aware about the NMMI scheme Source GAPL Survey
425 Reasons for Non-adoption of Micro Irrigation Systems
The non-beneficiaries farmers were further asked the reasons for not adopting this technology Table 29 reveals following mix responses such as
Lack of awareness regarding subsidies lack of technical knowledge high capital cost and system is not required perception that the system is not economical therefore not required for the cropping pattern adopted by them
The 50 percent farmers from Sikkim reported that they have applied for the benefit but have not received the sanction so far
The farmers of Sikkim (50) Tamil Nadu (30) Odisha amp Rajasthan (23) and Karnataka (20) also reported that they have applied for the grant of subsidy for the installation of the system but have yet to receive the sanction
Impact Evaluation Study on ldquoNational Mission on Micro Irrigation (NMMI)rdquo
49
Table 29 Reasons for Non-adoption of NMMI Scheme ()
State Total non-Beneficiaries
Less awareness
about subsidy
Lack of technical
knowledge
Lengthy procedure
High capital
cost
Application pending
for clearance
Not required
Less awareness
about subsidy amp technical
knowledge
Less awareness
about subsidy amp
Lengthy procedure
Others
AP 168 595 536 000 3036 536 060 1964 179 3095 Bihar 128 938 2266 156 1250 938 313 1328 234 2578 Chhattisgarh 96 208 208 000 4479 000 000 625 000 4479 Gujarat 144 139 278 069 3889 1042 208 069 903 3403 Haryana 81 1975 000 000 1975 000 741 3827 000 1481 Karnataka 144 1875 2014 1944 2222 1944 000 000 000 000 Maharashtra 169 237 1124 059 3846 2367 118 769 592 888 Odisha 120 167 2250 000 3167 2333 000 083 167 1833 Rajasthan 138 1087 1232 145 2029 072 000 1957 362 3116 Sikkim 10 000 4000 000 000 5000 1000 000 000 000 Tamil Nadu 120 1000 2917 1583 1500 3000 000 000 000 000 UP 168 595 119 000 2679 060 179 3333 179 2857 Uttarakhand 22 909 000 909 455 909 000 000 2273 4545 Total 1508 756 1174 365 2712 1174 133 1227 292 2168
Source GAPL Survey 426 Willingness of Non Beneficiaries to Adopt MI System
In order to understand willingness of the non-beneficiary farmers for installation of micro irrigation system in their farms a specific question was raised during interviews The responses have been compiled in the following table which shows that more than three-fourth of the farmers of all the states are willing to install micro irrigation systems except in case of Chhattisgarh where more than half of the respondents reported that they are not willing to adopt the system This response shows that when awareness of the benefits of micro irrigation systems is created (it seems during the interview respondents realized the advantages) most non-beneficiaries indicated their willingness to adopt MI
Table 30 Willingness of Non-beneficiaries to Install MI System ()
State Total Non-Beneficiaries
Response in Percent Yes No
AP 168 9762 238 Bihar 128 9922 078 Chhattisgarh 96 4583 5417 Gujarat 144 7708 2292 Haryana 81 9136 864 Karnataka 144 9792 208 Maharashtra 169 9704 296 Odisha 120 9667 333 Rajasthan 138 9203 797 Sikkim 10 8000 2000 Tamil Nadu 120 8917 1083 UP 168 8036 1964 Uttarakhand 22 9545 455
Source GAPL Survey
Impact Evaluation Study on ldquoNational Mission on Micro Irrigation (NMMI)rdquo
50
427 Progress of Installation of MI System The sampled beneficiaries were asked when they installed the system in their respective fields The results are presented in the following table
Table 31 Year of Installation of MI System ()
States 2005-06 2006-07 2007-08 2008-09 2009-10 2010-11 2011-12 2012-13 AP 104 149 060 521 1667 3170 3080 1250 Bihar NA NA NA NA 329 1860 7287 523 Chhattisgarh NA 911 2188 1458 859 2578 1979 026 Gujarat 017 191 903 1146 1233 2465 3733 313 Haryana NA 469 969 813 969 2031 4750 NA Karnataka NA 382 938 1406 1719 1476 2951 1128 Maharashtra NA 699 595 1205 2396 2857 2158 089 Odisha NA 354 396 854 1125 1333 4271 1667 Rajasthan NA 505 540 575 836 2509 4808 226 Sikkim NA NA NA NA NA NA 7400 2600 UP NA 1575 1973 474 1120 702 3510 645 Uttarakhand NA NA NA NA NA NA 2889 7111 Tamil Nadu NA NA 088 2264 879 2044 2330 2396
Source GAPL Survey
The above table reveals that in the beginning of the scheme the response was slow and gradually picked up The momentum of adoption got accelerated after the up gradation of the scheme into the mission mode in 2010 428 Average Cost of Installing the MI System The state wise average system costs as reported by the respondents have been compiled in the table below
Table 32 Average Cost of Installing MI System (Rsha)
State Drip Sprinkler
AP 61474 20572 Bihar 61109 21380 Chhattisgarh 68797 25418 Gujarat 72086 26390 Haryana 66355 25699 Karnataka 59452 27062 Maharashtra 60531 21102 Odisha 54457 20860 Rajasthan 63258 28171 Sikkim 59654 22143 Tamil Nadu 60676 24450 UP 61766 20481 Uttarakhand 59373 25932
Source GAPL Survey
Impact Evaluation Study on ldquoNational Mission on Micro Irrigation (NMMI)rdquo
51
The following facts may be observed by analyzing the responses of sampled beneficiaries
On an average the cost of system incurred by the beneficiaries of various states ranged between Rs 5445736 Rsha to Rs 7208631 Rsha for drip system depending on the crop type spacing material components used etc
As per the NMMI guidelines the indicative cost for installation of drip system for
wide space crops varies from Rs 18820 to Rs 63598 per hectare whereas for close space crops it falls in the range of Rs 74437 to Rs 97598 per hectare
Comparatively high cost incurred by the sampled farmers in Gujarat is probably attributed to the fact that more area under drip is occupied by close spaced (0-10 m2 spacing) crops Detailed analysis of higher average cost of drip in Gujarat is given in annexure IV The average cost of sprinkler in the sampled states varied between Rs 20481 to Rs 28171per hectare which falls near the specified indicative cost of overhead sprinkler systems
429 Factors Influencing Farmers to Adopt MI system To validate the outcome of the slated objectives of the scheme the beneficiaries were asked to give the reasons for adoption of the scheme and the same are presented in the following table
Table 33 Reasons for Adoption of Micro Irrigation Systems ()
State Total Beneficiaries
Because of
Subsidy
Quality of
Produce
Water Saving
Proper Utilization
of Land
Labor Saving
Time Saving
Fertilizer Saving
Early Fruiting
Higher Production
AP 672 2113 1622 5298 2917 3333 5744 2054 1637 1295 Bihar 516 2054 1143 9012 1415 4089 9244 2500 116 3779 Chhattisgarh 384 599 651 9766 1693 2370 8464 4063 1667 7083 Gujarat 576 3524 1667 8090 938 5486 2118 3507 052 2969 Haryana 320 9813 5938 9969 5719 9313 9656 9563 4281 8500 Karnataka 576 469 712 8455 2396 6719 5434 3715 434 2292 Maharashtra 672 3006 1042 7589 1458 4375 4524 2813 699 2113 Odisha 480 1229 667 7813 1938 3896 4896 1854 458 4438 Rajasthan 574 523 1359 7735 2979 4843 3066 1969 557 244 Sikkim 50 000 800 9600 4400 7200 5000 4400 600 1800 Tamil Nadu 455 1319 1297 7121 2000 5099 6571 4308 462 2308 UP 527 5617 3435 8235 3416 7002 6983 5977 2732 5617 Uttarakhand 90 3111 1222 5111 556 111 000 3000 000 6667 Total 5892 2529 1621 7890 2323 4963 5667 3557 1042 3340
Note Multiple Responses have been given to this question
It may be seen from the above table that in all nine reasons were revealed by the farmers for adopting the scheme which include (a) water saving (b) time saving (c) labor saving (d) fertilizer saving (e) higher production (f) because of subsidy (g) proper utilization of land (h) quality of produce and (i) early fruiting
Impact Evaluation Study on ldquoNational Mission on Micro Irrigation (NMMI)rdquo
52
It may further be observed that majority of the farmers reported that due to MI system they are able to save the water time and labor It is also revealed that the farmers are not installing the system because of subsidy only but also on account of other benefits In Haryana (98) ampUP (56) farmers have installed MI system due to the subsidy It is therefore concluded from here that higher amount of subsidy is not leading to more area under micro irrigation but it is due to other reasons such as reduction in cost of cultivation and higher production because of judicious use of irrigation as well as shifting towards high value income crops 4210 Subsidy Disbursement As per the operational guidelines of NMMI scheme the system in the beneficiariesrsquo field should be installed within sixty days from the date of filing the application Similarly the amount of subsidy should also be released to the suppliers service providers within 60 days Most of the farmers of Chhattisgarh (96) followed by Haryana Karnataka Tamil Nadu and Sikkim have reported that their applications are processed in less than 20 days and more than 90 percent of the farmers across states have reported that they got the sanction letter less than 40 days Only in case of Uttarakhand 50 percent of the farmers reported they got sanction after 100 days which resulted mainly due to the delayed receipt of money from the concerned quarters The following table further reveals that the 97 percent of the farmers of Bihar followed by Chhattisgarh (90) Haryana (85) amp Karnataka (78) and about 70 percent of the farmers of Odisha and Sikkim got their system installed in less than 20 days About 60 percent of Gujarat farmers 50 percent of Maharashtra followed by Tamil Nadu (48) and AP (45) reported that they got their system installed in 20-40 days
Table 34 Farmerrsquos Responses for Time Taken to Sanction Subsidy ()
State Total Beneficiary
Application to Sanction(Days) Sanction to installation (Days)
0-20 20-40 40-60 60-80 80-100 gt100 0-20 20-40 40-60 60-80 80-100 gt100 AP 672 5342 4583 074 000 000 000 4955 4524 506 000 000 015 Bihar 516 5252 4128 388 174 058 000 9690 291 000 019 000 000 Chhattisgarh 384 9583 417 000 000 000 000 8984 911 078 000 000 026 Gujarat 576 4878 4826 243 052 000 000 3281 6024 434 174 000 087 Haryana 320 9000 750 000 156 094 000 8469 1344 000 188 000 000 Karnataka 576 8559 1441 000 000 000 000 7830 1597 556 000 000 017 Maharashtra 672 4628 5372 000 000 000 000 4807 4926 253 015 000 000 Odisha 480 6229 3417 229 125 000 000 7104 2854 021 021 000 000 Rajasthan 574 5610 4338 052 000 000 000 5035 4669 244 052 000 000 Sikkim 50 6600 3400 000 000 000 000 7200 2800 000 000 000 000 Tamil Nadu 455 7385 2527 088 000 000 000 4593 4791 505 110 000 000 UP 527 4858 5047 076 000 000 019 2543 4269 1139 1537 285 228 Uttarakhand 90 000 222 667 1333 2333 5444 444 1111 6111 2333 000 000 Total 5892 6139 3557 114 059 046 085 5813 3461 448 219 025 034
Source GAPL survey
Impact Evaluation Study on ldquoNational Mission on Micro Irrigation (NMMI)rdquo
53
4211 Sources of Margin Money The contribution of the cost of MI system has to be borne by the farmers depending on the quantum of the subsidy available It was observed that in almost all the states beneficiary farmers contribute their own funds for contributing margin money Other sources albeit a small proportion constitutes banking KCC amp money lenders It may be seen from the following table that a very few beneficiaries have availed the bank loan for margin money
Table 35 Source of Finance for Meeting Beneficiary Share for Installation of MI System
State Total
Beneficiary
Source of Beneficiary Share of MI ()
Own sources
Bank KCC Money Lenders
AP 672 9807 000 104 089 Bihar 516 10000 000 000 000 Chhattisgarh 384 10000 000 000 000 Gujarat 576 9583 417 000 000 Haryana 320 9344 031 438 063 Karnataka 576 10000 000 000 000 Maharashtra 672 9911 060 030 000 Odisha 480 9979 000 021 000 Rajasthan 574 10000 000 000 000 Sikkim 50 10000 000 000 000 Tamil Nadu 455 10000 000 000 000 UP 527 9734 000 133 133 Uttarakhand 90 10000 000 000 000 Total 5892 9866 049 053 025
Source GAPL Survey
4212 Interest Rates on Borrowing
The number of beneficiaries who borrowed funds from different sources was less than 2 percent and only 049 percent borrowed from banks as stated above The beneficiaries borrowed money from various sources on differential rates of interest and their responses have been summarized in the following table which reveals that most of the farmers who borrowed money at less than 10 percent of rate of interest from banks amp KCCs
Impact Evaluation Study on ldquoNational Mission on Micro Irrigation (NMMI)rdquo
54
Table 36 Rate of Interest Paid by the Beneficiaries on Borrowed Funds
State No of Beneficiaries
10 amp less 10-12 12-15 gt15 AP 13 0 0 0 Bihar 0 0 0 0 Chhattisgarh 0 0 0 0 Gujarat 4 16 4 0 Haryana 14 3 2 1 Karnataka 0 0 0 0 Maharashtra 4 1 1 0 Odisha 1 0 0 0 Rajasthan 0 0 0 0 Sikkim 0 0 0 0 Tamil Nadu 0 0 0 0 UP 14 0 0 0 Uttarakhand 0 0 0 0 Total 50 20 7 1
4213 Type of MI system and Area Coverage 42131 Technology wise area coverage The emitting devices (inline or online emitters) are designed to discharge water at prescribed rates depending on the specific requirements of various crops In the sprinkler irrigation system water is discharge under pressure in the air through a set of nozzles attached to a network of high density polyethylene (HDPE) pipes simulating rainfall and are suitable where the plant density is very high It is widely used in field crops The sprinkler irrigation system may be portable semi-permanent or large systems (Rain guns) The cost of all the system varies across the states
Table 37 Proportion of Farmers having Drip and Sprinkler MI Systems
State Total No of Beneficiaries
Drip Sprinkler Both AP 672 499 7426 166 2470 7 104 Bihar 516 6 116 450 821 60 1163 Chhattisgarh 384 152 3958 227 5911 5 130 Gujarat 576 452 7847 115 1997 9 156 Haryana 320 228 7125 82 2563 10 313 Karnataka 576 571 9913 4 069 1 017 Maharashtra 672 589 8765 72 1071 11 164 Odisha 480 114 2375 349 7271 17 354 Rajasthan 574 354 6167 216 3763 4 070 Sikkim 50 40 8000 9 1800 1 200 Tamil Nadu 455 385 8462 69 1516 1 022 UP 527 311 5901 214 4061 2 038 Uttarakhand 90 58 6444 32 3556 0 000 Grand Total 5892 3759 6380 2005 3403 128 217
Source GAPL Survey
Impact Evaluation Study on ldquoNational Mission on Micro Irrigation (NMMI)rdquo
55
The data on area coverage under drip and sprinkler irrigation system with the beneficiary farmers in the sampled states are cited in Table 37 It is evident that drip system is more popular than sprinkler in most of the states under study The data documents that on and average area coverage under drip was about to 64 34 sprinkler and about 2 of the beneficiaries have reported both the system The respective area coverage under drip in Karnataka Tamil Nadu Sikkim AP Gujarat and Maharashtra reported more than 75 area under drip However in case of sprinkler irrigation system Bihar registered highest area under the system followed by Odisha and Chhattisgarh The inference may be drawn here that the technology wise area coverage is shifting more towards the horticulture crops and less for the field crops
Table 38 Drip amp Sprinkler System wise Area Coverage by Sampled Beneficiaries
Technology wise area coverage (ha)
State Total Area
under MI
Area under Drip
Area under Drip
Area under Sprinkler
Area under Sprinkler
AP 72431 54869 7575 17562 2425 Bihar 78034 7357 943 70676 9057 Chhattisgarh 67933 27161 3998 40773 6002 Gujarat 120259 87156 7247 33103 2753 Haryana 64800 53741 8293 11058 1707 Karnataka 76113 76113 10000 000 000 Maharashtra 86433 76210 8817 10222 1183 Odisha 85221 29212 3428 56009 6572 Rajasthan 67101 58554 8726 8546 1274 Sikkim 3132 2728 8708 405 1292 Tamil Nadu 53953 47468 8798 6485 1202 UP 81932 55069 6721 26864 3279 Uttarakhand 8347 7021 8412 1325 1588
Source GAPL Survey 42132 The Crop wise Area Coverage The crop wise area coverage was computed from the total area under drip and sprinkler irrigation system the pertinent results are enumerated in table below Andhra Pradesh
In the state of AP major fruit crops under drip system were noted to be mango citrus and banana which covered around 5491 of total area under drip Among vegetable crops brinjal chilli and tomato occupied comparatively higher area under drip than other vegetable crops Vegetables occupied around 3424 area under drip Flower maize and sugarcane covered around 1085 of area under drip irrigation with sampled beneficiaries Out of total area under MI in AP 2424 of the area was noted under sprinkler system About 4406 of area under sprinkler was occupied by vegetable crops whereas other
Impact Evaluation Study on ldquoNational Mission on Micro Irrigation (NMMI)rdquo
56
crops such as cotton maize and ground nut consists of about 5594 of the total area under sprinkler
Table 39 Crop wise Area Coverage under Drip and Sprinkler Systems in AP (Sampled Beneficiaries)
Drip Fruit Vegetable Other Crop
Name Area(ha) of Area Name Area(ha) of Area Name Area(ha) of Area Mango 7885 1437 Brinjal 9552 1741 Flower 096 017 Banana 4898 893 Chilli 3524 642 Maize 2268 413 Citrus Fruits
14379 2621 Tomato 3293 600 Sugarcane 1346 245
Others 2964 540 Others 2420 441 Pulses 933 170 Cotton 455 083 Other 857 156 Total 30126 5491 18789 3423 5954 914
Sprinkler Name Area(ha) of Area Name Area(ha) of Area Brinjal 3219 1833 Groundnut 2550 1452 Chilli 1550 883 Cotton 4249 2420 Okra 1230 701 Maize 911 518 Tomato 1738 990 Other 2115 1204 Total 7738 4406 9824 5594
Source GAPL Primary Survey 2013 Bihar
In the state of Bihar major fruit crops under drip system were noted to be mango which covered around 60 of total area under drip Among vegetable crops Okra and potato have occupied comparatively higher area under drip than other vegetable crops Vegetables occupied around 34 area under drip Sugarcane has covered around 275 of area under drip irrigation with sampled beneficiaries
Table 40 Crop wise Area Coverage under Drip and Sprinkler Systems in Bihar (Sampled Beneficiaries)
Drip Fruit Vegetable Other Crop
Name Area (Ha) of Area Name Area (Ha) of Area Name Area (Ha) of Area Mango 4383 5957 Potato 834 1133 Marigold 040 055 Litchi 093 127 Okra 931 1265 Sugarcane 202 275 Kadam 061 083 Others Crop 732 996 Others 081 110 Total 4618 6276 2497 3394 243 330
Sprinkler Name Area (Ha) of Area Name Area (Ha) of Area Name Area (Ha) of Area Blackberry 121 017 Potato 11251 1592 Wheat 13533 1915 Brinjal 2408 341 Sugarcane 10846 1535 Cauliflower 2311 327 Maize 16475 2331 Okra 1801 255 Menthol 2137 302 Tomato 1740 246 Other Crop 6160 872 Others Crop 1894 268 Total 121 017 21404 3028 49151 6954 Source GAPL Primary Survey 2013
Impact Evaluation Study on ldquoNational Mission on Micro Irrigation (NMMI)rdquo
57
Chhattisgarh
In the state of Chhattisgarh major fruit crops under drip system were noted to be banana Papaya and watermelon which covered around 345 of total area under drip Among vegetable crops Cucumber brinjal tomato and bitter gourd occupied comparatively higher area under drip than other vegetable crops Vegetables occupied around 9655 area under drip Out of total area under MI in Chhattisgarh 3998 of the area was noted under sprinkler system About 2562 of area under sprinkler was occupied by vegetable crops whereas other crops such as wheat gram and soybean consist of about 7438 of the total area
Table 41 Crop wise Area Coverage under Drip and Sprinkler Systems in Chhattisgarh (Sampled Beneficiaries)
Drip Sprinkler Fruit Vegetable Vegetable Other Crop
Name Area (ha)
of Area Name Area(ha) of
Area Name Area (ha)
of Area Name Area
(ha) of Area
Banana 340 125 Tomato 6462 2379 Okra 2865 703 Wheat 9348 2293 Papaya 374 138 Cucumber 3887 1431 Tomato 3115 764 Pulses 9576 2349 Watermelon 223 082 Brinjal 2414 889 Bottle Gourd 1319 324 Other
Crop 11402 2796
Bitter Gourd 3416 1258 Others Crop 3148 772 Others Crop 10045 3698 Total 937 345 26224 9655 10447 2562 30325 7438
Source GAPL Primary Survey 2013 Gujarat
In the state of Gujarat major fruit crops under drip system were noted to be banana Papaya and pomegranate which covered around 1225 of total area under drip Among vegetable crops Chili tomato potato and onion occupied comparatively higher area under drip than other vegetable crops Vegetables occupied around 1636 area under drip Flower cotton sugarcane and caster covered around 7139 of area under drip irrigation with sampled beneficiaries Out of total area under MI in Gujarat 2752 of the area was noted under sprinkler system About 2574 of area under sprinkler was occupied by fruits and vegetable crops whereas other crops such as flower cotton groundnut and caster consist of about 7427 of the total area
Impact Evaluation Study on ldquoNational Mission on Micro Irrigation (NMMI)rdquo
58
Table 42 Crop wise Area Coverage under Drip and Sprinkler Systems in Gujarat (Sampled Beneficiaries)
Drip Fruit Vegetable Other Crop
Name Area(ha) of Area Name Area(ha) of Area Name Area(ha) of Area Banana 6303 723 Chilli 5274 605 Flower 020 002 Papaya 1113 128 Tomato 3337 383 Caster 6414 736 Pomegranate 1072 123 Potato 2113 242 Cotton 49859 5721 Others 2185 251 Onion 2408 276 Sugarcane 1417 163 Others Crop 1129 130 Other Crop 4512 518 Total 10674 1225 14260 1636 62222 7139
Sprinkler Name Area(ha) of Area Name Area(ha) of Area Name Area(ha) of Area
Pomegranate 890 269 Potato 6322 1910 Flower 182 055 Water Melon 101 031 Others Crop 1204 364 Cotton 5099 1540 Ground nut 4800 1450 Caster 3217 972 Bajra 5783 1747 Other Crop 5503 1662 Total 992 300 7526 2274 24585 7427
Source GAPL Primary Survey 2013 Haryana
In the state of Haryana major fruit crops under drip system were noted to be Kinnow lemon strawberry and watermelon which covered around 7771 of total area under drip Among vegetable crops tomato potato and cucumber occupied comparatively higher area under drip than other vegetable crops Vegetables occupied around 1905 area under drip Flower and cotton covered around 324 and 396 of area respectively under drip irrigation with sampled beneficiaries Out of total area under MI in Haryana 1706 of the area was noted under sprinkler system About 9250 of area under sprinkler was occupied by fruits and vegetable crops whereas other crops such as cotton and wheat consist of about 750 of the total area under sprinkler
Table 43 Crop wise Area Coverage under Drip and Sprinkler Systems in Haryana (Sampled Beneficiaries) Drip
Fruit Vegetable Other Crop Name Area(ha) of Area Name Area(ha) of Area Name Area(ha) of Area Kinnow 36321 6759 Tomato 2408 448 Flower 344 064 Lemon 1781 331 Cucumber 1568 292 Cotton 1396 260 Water Melon 1396 260 Potato 2355 438 Strawberry 1012 188 Others Crop 3905 727 Other Crops 1255 233 Total 41764 7771 10237 1905 1740 324
Sprinkler Name Area(ha) of Area Name Area(ha) of Area Name Area(ha) of Area Musk Melon 283 256 Tomato 3693 3339 Cotton 364 329 Water Melon 152 137 Potato 1194 1080 Wheat 465 421 Chilli 1113 1006 Others Crop 3794 3431 Total 435 393 9794 8856 830 750
Source GAPL Primary Survey 2013
Impact Evaluation Study on ldquoNational Mission on Micro Irrigation (NMMI)rdquo
59
Karnataka
In the state of Karnataka major fruit crops under drip system were noted to be banana areca nut pomegranate and mango which covered around 8425 of total area under drip Among vegetable crops tomato chilli and ginger occupied comparatively higher area under drip than other vegetable crops Vegetables occupied around 1161 area under drip Turmeric Pepper and others crops covered around 1396 1331 and 425 of area under drip irrigation with sampled beneficiaries Table 44 Crop wise Area Coverage under Drip and Sprinkler Systems in Karnataka (Sampled Beneficiaries)
Drip Fruit Vegetable Other Crop
Name Area (Ha)
of Area
Name Area (Ha)
of Area
Name Area (Ha)
of Area
Banana 26716 3510 Tomato 3790 498 Turmeric 1396 183 Pomegranate 7684 1010 Chilli 2252 296 Pepper 1331 175 Areca nut 8503 1117 Ginger 1076 141 Other Crop 425 056 Mango 5704 749 Others Crop 1718 226 Others 15516 2039 Total 64124 8425 8837 1161 3153 414 Source GAPL Primary Survey 2013
Maharashtra
In the state of Maharashtra major fruit crops under drip system were noted to be banana mango citrus fruits and grapes which covered around 4283 of total area under drip Among vegetable crops tomato brinjal and chili occupied comparatively higher area under drip than other vegetable crops Vegetables occupied around 757 area under drip Flower sugarcane cotton and other crops covered around 061 2012 2697 and 190 of area under drip irrigation with sampled beneficiaries Under sprinkler system about 158 of area occupied by vegetable crops whereas other crops such as flower cotton ground nut black gram and soybean consist of about 9842 of the total area
Table 45 Crop wise Area Coverage under Drip and Sprinkler Systems in Maharashtra (Sampled Beneficiaries)
Drip Sprinkler Fruit Vegetable Other Crop Vegetable Other Crop
Name Area (Ha)
of Area Name Area
(Ha) of Area Name Area
(Ha) of Area Name Area
(Ha) of Area Name Area
(Ha) of Area
Banana 12043 1580 Brinjal 2590 340 Flower 465 061 Brinjal 051 049 Flower 081 079 Mango 7838 1028 Tomato 1718 225 Cotton 20553 2697 Peas 040 040 Cotton 3497 3421 Grapes 587 077 Chilli 1055 138 Sugarcane 15334 2012 Tomato 071 069 Soybean 2929 2865 Citrus Fruits
4110 539 Others 405 053 Other Crop 1446 190 Ground nut
946 925
Others 8066 1058 Black Gram
1384 1354
Others 1224 1198 Total 32643 4283 5768 757 37799 4960 162 158 10060 9842
Source GAPL Primary Survey 2013
Impact Evaluation Study on ldquoNational Mission on Micro Irrigation (NMMI)rdquo
60
Odisha
In the state of Odisha major fruit crops under drip system were noted to be mango banana and cashew nut which covered around 7090 of total area under drip Among vegetable crops tomato brinjal and Okra occupied comparatively higher area under drip than other vegetable crops Vegetables occupied around 2515 area under drip Flower moong and sugarcane covered around 395 of area under drip irrigation with sampled beneficiaries Under sprinkler system about 8741 of area was occupied by fruits and vegetable crops whereas other crops such as moong maize sugarcane and others crop consist of about 455 148 217 and 439 of the total area
Table 46 Crop wise Area Coverage under Drip and Sprinkler Systems in Odisha (Sampled Beneficiaries)
Drip Fruit Vegetable Other Crop
Name Area (Ha) of Area Name Area (Ha) of Area Name Area (Ha) of Area Mango 8771 3002 Tomato 1803 617 Flower 121 042 Banana 3602 1233 Brinjal 1497 513 Moong 364 125 Cashew nut 2165 741 Okra 1042 357 Sugarcane 202 069 Others 6174 2113 Others Crop 3005 1029 Other Crop 465 159 Total 20711 7090 7347 2515 1153 395
Sprinkler Name Area (Ha) of Area Name Area (Ha) of Area Name Area (Ha) of Area
Pineapple 182 033 Brinjal 10350 1848 Moong 2550 455 Watermelon 324 058 Tomato 9410 1680 Maize 830 148 Okra 6297 1124 Sugarcane 1214 217 Cauliflower 5585 997 Other Crop 2459 439 Others Crop 16809 3001 Total 506 090 48451 8651 7052 1259
Source GAPL Primary Survey 2013
Rajasthan
In the state of Rajasthan major fruit crops under drip system were noted to be kinnow orange and mango which covered around 43 of total area under drip Among vegetable crops onion carrot and tomato occupied comparatively higher area under drip than other vegetable crops Vegetables occupied around 24 area under drip Flower cotton arandi and guar covered around 32 of area under drip irrigation with sampled beneficiaries Out of total area under MI in Rajasthan more of the area was noted under sprinkler system About 56 of area under sprinkler was occupied by fruits and vegetable crops whereas other crops such as flower wheat Mustard and cotton consist of about 44 of the total area
Impact Evaluation Study on ldquoNational Mission on Micro Irrigation (NMMI)rdquo
61
Table 47 Crop wise area Coverage under Drip and Sprinkler Systems in Rajasthan (Sampled Beneficiaries)
Drip Fruit Vegetable Other Crop
Name Area of Area Name Area of Area Name Area of Area Kinnow 6523 1114 Onion 5315 908 Flower 656 112 Orange 13019 2223 Tomato 2832 484 Cotton 11881 2029 Lemon 1854 317 Cauliflower 1510 258 Arandi 1730 295 Mango 1017 174 Others Crop 4396 751 Guwar 1463 250 Other Crops 3149 538 Other Crop 3209 548 Total 25563 4366 14052 2400 18939 3234
Sprinkler Name Area of Area Name Area of Area Name Area of Area Lemon 202 237 Carrot 3954 4626 Mustard 2488 2912 Others Crop 623 729 Wheat 647 757 Other Crop 631 739 Total 202 237 4577 5356 3767 4407 Source GAPL Primary Survey 2013
Sikkim
In the state of Sikkim major fruit crops under drip system were noted to be orange and guava which covered around 41 of total area under drip Among vegetable crops tomato and brinjal occupied comparatively higher area under drip than other vegetable crops Vegetables occupied around 42 area under drip Wheat and mustard covered around 313 of area under drip irrigation with sampled beneficiaries Out of total area under MI in About 70 of area under sprinkler was occupied by the vegetable crops whereas other crops such as wheat and turmeric consist of about 30 of the total area Table 48 Crop wise Area Coverage under Drip and Sprinkler Systems in Sikkim (Sampled Beneficiaries)
Drip Fruit Vegetable Other Crop
Name Area (Ha)
of Area Name Area
(Ha) of Area Name Area
(Ha) of Area
Orange 939 3442 Tomato 555 2036 Large Cardamom
142 519
Guava 182 668 Brinjal 263 964 Turmeric 243 890 Other Crop 333 1220 Other Crop 071 260 Total 1121 4110 1151 4221 455 1669
Sprinkler
Name Area of Area Name
Area (Ha)
of Area Name
Area (Ha)
of Area
Tomato 081 2000 Turmeric 081 2000 Cauliflower 081 2000 Other Crop 040 1000 Barackoli 081 2000 Others Crop 040 1000 Total 283 7000 121 3000 Source GAPL Primary Survey 2013
Impact Evaluation Study on ldquoNational Mission on Micro Irrigation (NMMI)rdquo
62
Tamil Nadu
In the state of Tamil Nadu major fruit crops under drip system were noted to be banana tapioca coconut and aonla which covered around 5528 of total area under drip Among vegetable crops tomato chili and brinjal occupied comparatively higher area under drip than other vegetable crops Vegetables occupied around 1780 area under drip Turmeric and sugarcane covered around 2692 of area under drip irrigation with sampled beneficiaries Out of total area under MI in Tamil Nadu 1202 of the area was noted under sprinkler system About 9923 of area under sprinkler was occupied by fruits and vegetable crops whereas other crops such as turmeric consist of about 078 of the total area Table 49 Crop wise Area Coverage under Drip and Sprinkler Systems in Tamil Nadu (Sampled Beneficiaries)
Drip Fruit Vegetable Other Crop
Name Area (Ha) of Area Name Area (Ha) of Area Name Area (Ha) of Area Banana 7875 1659 Chilli 2025 427 Turmeric 9501 2002 Tapioca 4994 1052 Brinjal 1720 362 Sugarcane 3278 691 Coconut 4953 1044 Tomato 1761 371 000 Aonla 3458 728 Others Crop 2944 620 Others Crop 4958 1045 Total 26238 5528 8451 1780 12779 2692
Sprinkler Name Area (Ha) of Area Name Area (Ha) of Area Name Area (Ha) of Area Carrot 081 125 Chilli 3197 4930 Turmeric 051 078 Potato 1740 2683 Carrot 1234 1903 Others Crop 182 281 Total 081 125 6354 9797 051 078 Source GAPL Primary Survey 2013 Uttar Pradesh In the state of UP major fruit crops under drip system were noted to be banana mango and guava which covered around 81 of total area under drip Among vegetable crops tomato potato and chili occupied comparatively higher area under drip than other vegetable crops Vegetables occupied around 19 area under drip Maize wheat and other crops covered around 144 of area under drip irrigation with sampled beneficiaries Out of total area under MI in UP about one-third of the area was noted under sprinkler system About 88 of area under sprinkler was occupied by fruits and vegetable crops whereas other crops such as wheat consist of about 12 of the total area
Impact Evaluation Study on ldquoNational Mission on Micro Irrigation (NMMI)rdquo
63
Table 50 Crop wise Area Coverage under Drip and Sprinkler Systems in UP (Sampled Beneficiaries)
Drip Fruit Vegetable Other Crop
Name Area of Area Name Area of Area Name Area of Area Banana 13173 2392 Potato 2752 500 Maize 263 048 Guava 12363 2245 Tomato 2863 520 Sunflower 020 004 Mango 16431 2984 Chilli 1295 235 Litchi 1538 279 Cabbage 911 165 Others Crop 951 173 Others Crop 2509 456 Total 44456 8073 10330 1876 283 051
Sprinkler Name Area of Area Name Area of Area Name Area of Area Strawberry 040 015 Peas 9611 3578 Flower 081 030 Tomato 4037 1503 Wheat 2703 1006 Brinjal 2529 942 Other Crop 314 117 Okra 1457 542 Others Crop 6091 2267 Total 040 015 23725 8832 3098 1153 Source GAPL Primary Survey 2013 Uttarakhand In the state of Uttarakhand major fruit crops under drip system were noted to be peach mango litchi and guava which covered around 96 of total area under drip Among vegetable crops only peas occupied around 201 area under drip Out of total area under MI in Uttarakhand about one-fourth of the area was noted under sprinkler system About 100 of area under sprinkler was occupied by vegetable crops
Table 51 Crop wise Area Coverage under Drip and Sprinkler Systems in Uttarakhand (Sampled Beneficiaries)
Drip Sprinkler Fruit Vegetable Other Crop Vegetable
Name Area (Ha)
of Area Name Area
(Ha) of Area Name Area
(Ha) of Area Name Area
(Ha) of Area
Mango 3217 4582 Peas 101 144 Popular Tree
202 288 Peas 1062 8015
Peach 1356 1931 Tomato 263 1985 Guava 1477 2104 Litchi 668 951 Total 6718 9568 101 144 202 288 1325 10000 Source GAPL Primary Survey 2013
The above tables also shows that crops as brinjal chilli Okra flower tomato bottle gourd pomegranate etc are irrigated with micro sprinkler irrigation system by the beneficiaries However during the course of discussion with experts it was observed that irrigation through this system is not recommended because it harms the crop at the flowering stage Therefore it is recommended that farmers should be advised at the time of installation to use drip irrigation for such crops or they may avoid use of sprinkler during flowering stage and irrigate through alternative means
Impact Evaluation Study on ldquoNational Mission on Micro Irrigation (NMMI)rdquo
64
4214 System Demonstration The outcome demonstration particularly in rural area where exposure is limited remains an important instrument in educating the rural folks because only physical or concrete evidence is convincing for them Seen evidence can be easily and correctly interpreted when in fact interpretation may be difficult thus gives better results NMMI scheme has a component of demonstrations at the farmersrsquo fields to educate the farmers of that particular cluster In this regard the farmers were asked whether they have exposure to any field visit demonstration MI system
Table 52 Exposure of Beneficiary Farmers to MI Demonstrations
State Participated () Yes No
AP 1250 8750 Bihar 3721 6279 Chhattisgarh 4896 5104 Gujarat 2830 7170 Haryana 9844 156 Karnataka 2726 7274 Maharashtra 4747 5253 Odisha 4167 5833 Rajasthan 6463 3537 Sikkim 8000 2000 Tamil Nadu 2330 7670 UP 2144 7856 Uttarakhand 6333 3667
Source GAPL Survey
It may be seen from the above table that the beneficiaries of Haryana (98) followed by Sikkim (80) Rajasthan (64) and Uttarakhand (63) attended the demonstration nearby their areas Whereas majority of the farmers AP UP Tamil Nadu Karnataka Gujarat Bihar have reported that they have not visited any demonstration It is therefore suggested that more efforts may be put to expose the farmers regarding demonstration of MI system and its benefits 4215 Training and Capacity Building The training and capacity building is an integral component of the MI initiatives This component has been inbuilt to upgrade the capacity building of farmers and field functionaries through training and demonstrations carried out by state agricultural universities Precision Farming Development Centers (PFDCs) and the industry In light of
Impact Evaluation Study on ldquoNational Mission on Micro Irrigation (NMMI)rdquo
65
these observations our survey gave due attention to the training component and the obtained results are enumerated in table 53 The data revealed that almost all the respondents of Tamil Nadu UP Chhattisgarh Haryana were given training materials during the training while few beneficiaries of the Bihar Uttarakhand amp Karnataka received such training materials It has also been noted that farmers were imparted training on operation and maintenance of the system adoption of package practices under MI opportunities for introducing new crops with the help of micro irrigation system As far as field visits are concerned most of the beneficiaries reported that they have visited the fields of progressive farmers and demonstration fields except for Chhattisgarh Rajasthan and Uttarakhand where few farmers have reported that they have visited the demonstration fields
Impact Evaluation Study on ldquoNational Mission on Micro Irrigation (NMMI)rdquo
66
Table 53 Topic Covered in Training for Beneficiary Farmers ()
State Total
Beneficiary
Training Material Provided
Topic Covered in the Training
Joined Any Field Visit
Satisfied with the Learning
Operation of the System
Maintenance of the System
Package of Practices for
the Crops
Opportunities for Introduction
of New Crop
Other Related Schemes
Yes No Yes No Yes No Yes No Yes No Yes No Yes No Yes No AP 672 7188 878 7991 074 7917 149 7113 952 5580 2485 6592 1473 6696 3304 7307 759 Bihar 516 950 1047 1977 019 1977 019 1453 543 601 1395 194 1802 446 9360 620 019 Chhattisgarh 384 9714 208 9922 000 9896 026 9766 156 7057 2865 7083 2839 8073 1927 7995 078 Gujarat 576 4531 313 4705 139 4653 174 3264 1580 1094 3750 1510 3333 3767 6233 3715 052 Haryana 309 9363 637 9385 615 9341 659 9099 901 6286 3714 6154 3846 8330 1670 9319 681 Karnataka 576 2638 6357 8937 057 8748 247 4459 4535 2979 6015 1575 7419 4592 5408 5047 342 Maharashtra 672 7188 878 7991 074 7917 149 7113 952 5580 2485 6592 1473 6696 3304 7307 759 Odisha 480 5878 253 6131 000 6116 015 5193 938 3929 2202 4926 1205 5744 4256 6086 045 Rajasthan 574 8171 261 8432 000 8223 209 8031 401 6707 1725 7038 1394 679 2735 6951 314 Sikkim 50 4771 438 5146 063 5167 042 4479 729 2396 2813 2833 2375 4333 5667 5000 208 Tamil Nadu 455 9965 035 9965 035 9931 069 9080 920 6059 3941 5955 4045 8507 1493 9670 330 UP 527 9800 000 9800 000 9800 000 8400 1400 5000 4800 4800 5000 8000 2000 9800 000 Uttarakhand 90 667 2667 2889 444 2889 444 778 2556 556 2778 444 2889 1111 2222 1556 1778
Source GAPL Survey
Impact Evaluation Study on ldquoNational Mission on Micro Irrigation (NMMI)rdquo
67
The farmers were asked whether they are satisfied from the training they received The beneficiaries of almost all the states gave positive response in this regard It is recommended that training on innovative techniques relevant to the MI Systems should cover topics such as high density plantation canopy management intercropping and use of mulch materials The beneficiaries were further asked about the institutions from which they have got the training about the MI system The obtained responses of the sampled beneficiaries are presented in the following table
Table 54 Institution for Training as Reported by Respondents ( Beneficiaries)
State Total Responses
SAUs KVKs PFDC
State Govt
Agencies
System Supplier Others
SAUs KVKs amp State Govt
Agencies
SAUs KVKs amp System Supplier
State Govt
Agencies amp System Supplier
AP 542 073 3229 6605 018 000 000 074 Bihar 103 1359 291 7961 000 000 291 097 Chhattisgarh 381 1365 079 4331 000 131 3832 262 Gujarat 279 359 430 9176 000 036 000 000 Haryana 309 194 906 8641 032 000 032 194 Karnataka 575 504 522 8974 000 000 000 000 Maharashtra 412 1360 437 7597 024 024 097 461 Odisha 250 240 160 8800 040 040 680 040 Rajasthan 484 534 331 9029 000 000 000 103 Sikkim 49 612 6531 2449 000 000 204 204 Tamil Nadu 427 211 000 9789 000 000 000 000 UP 474 211 211 9557 000 000 000 021 Uttarakhand 30 333 667 8667 000 000 000 333
Source GAPL Survey sharing of source technical Information regarding micro irrigation system scheme Note The duration of training has been reported to be of 1-2 days as revealed by the participant beneficiaries It may be seen from the above table that the system suppliers manufacturers are the major sources who imparted the training as more than 90 percent of the farmers of Tamil Nadu UP Gujarat Rajasthan and Karnataka received the training from suppliers Other sources of training are state government agencies and SAUsKVKs PFDC etc Most of the manufacturers imparted training at the time of system installation However it was revealed by the beneficiaries that after installation training on system operation is not provided to them as per their needs As such most of the farmers fail to draw full advantage of the MI system There is thus a dire need to provide technical support for system operation after installation It is recommended that regular trainings under MI system may be made mandatory on the part of system suppliers after the installation of the system as they are closely associated with the beneficiaries and have in-depth knowledge of the installed system
Impact Evaluation Study on ldquoNational Mission on Micro Irrigation (NMMI)rdquo
68
4216 Availability of Electricity The micro irrigation system runs on power and is a pre requisite for the installation of system therefore availability of power is an important parameter in this regard The following table shows the availability of electricity among all the states
Table 55 Availability of Electricity (Beneficiaries and Non Beneficiaries)
Beneficiaries Non Beneficiaries
State Total
Beneficiary
Availability of electricity () Availability of electricity () 0-4
HrsDay 4-8
HrsDay 8-12
HrsDay 12-16
HrsDay 16-20
HrsDay 20-24
HrsDay Total Non-
beneficiaries 0-4
HrsDay 4-8
HrsDay 8-12
HrsDay 12-16
HrsDay 16-20
HrsDay
AP 672 104 7113 2768 015 000 000 168 179 7560 2202 060 000 Bihar 516 1492 7888 581 039 000 000 128 1094 4844 2578 1484 000 Chhattisgarh 384 7943 1979 000 078 000 000 96 000 313 2083 5729 1875 Gujarat 576 000 9010 573 260 156 000 144 139 069 9722 069 000 Haryana 320 094 1719 6719 1438 000 031 81 123 1728 7284 864 000 Karnataka 576 000 9410 590 000 000 000 144 139 9444 556 000 000 Maharashtra 672 015 1994 7366 625 000 000 169 059 3018 6331 592 000 Odisha 480 083 1563 3104 4354 896 000 120 250 2250 2750 4500 250 Rajasthan 574 1690 6429 1376 505 000 000 138 145 9348 435 072 000 Sikkim 50 000 10000 000 000 000 000 10 000 8000 000 000 000 Tamil Nadu 455 000 10000 000 000 000 000 120 000 10000 000 000 000 UP 527 000 2068 7078 816 038 000 168 119 2143 6905 833 000 Uttarakhand 90 333 8778 000 000 889 000 22 1364 5909 2273 000 455
Source GAPL Survey
It may be seen that the supply of electricity in different states only one farmer among the beneficiaries that two of Haryana reported that the electricity available for 24 hrs It may further be seen that 100 percent of the farmers of Sikkim and Tamil Nadu reported to get electricity for 4-8 hrs in a day In other states it was observed that electricity is available for less than 16 hrs a day and out of which maximum reported to be between 12-16 hrs a days It may further be seen that farmers of Tamil Nadu Karnataka Rajasthan Sikkim and AP reported that they are getting electricity for 8 hrs whereas rest of the farmers reported that they are getting electricity up to 16 hrs a day The availability of electricity to beneficiaries and non-beneficiaries are showing the same trend
Impact Evaluation Study on ldquoNational Mission on Micro Irrigation (NMMI)rdquo
69
4217 Capacity of Pump Sets It may be seen from the following table that the majority of the farmers are using pump sets ranging upto 5 hp In AP and Maharashtra about 74 and 63 percent of beneficiaries reported that they are using the pump sets of 5-10 hp at their farms However about 59 54 41 percent farmers of Gujarat Haryana and UP respectively revealed that that they are having the pump sets of more than 10 hp The variations in the capacities of installed pump sets are attributed to the depth of water farm size type of MI system installed Most of the farmers reported that pump sets of appropriate capacity have been installed which thoroughly meet the system requirements and they are not facing any problem to irrigate the crops as per their requirements
Table 56 Capacity of Pump Sets Used by Beneficiaries
States Total
Beneficiary Power of the Pump Set ()
0-5 hp 5-10 hp 10-15 hp AP 672 2307 7426 267 Bihar 516 9845 097 058 Chhattisgarh 384 9896 000 104 Gujarat 576 347 3715 5938 Haryana 320 469 4094 5437 Karnataka 576 6319 3681 000 Maharashtra 672 2842 6295 863 Odisha 480 6771 3000 229 Rajasthan 574 8449 436 1115 Sikkim 50 6200 3800 000 Tamil Nadu 455 3275 6725 000 UP 527 493 5446 4061 Uttarakhand 90 4111 4444 1445
Source GAPL Survey 4218 Irrigation Filters Clean water is crucial for proper and effective long term operation of micro irrigation systems Water filtration is important for all irrigation systems Clogging of nozzles emittersdrippers reduce the efficiency of the MI system which ultimately results in increase in energy consumption and maintenance as well as cost of irrigation Filters can help extend the life of and lower the maintenance on sprinkler system For drip systems they are a necessity to prevent emitters from becoming plugged The yield is also affected because of clogging In drip and sprinkler irrigation the quality of water being pumped into the irrigation system is the most important factor in filter selection Filtration may be accomplished through use of filters They are sand separators media filter screen filter disc filter and settling basin
Impact Evaluation Study on ldquoNational Mission on Micro Irrigation (NMMI)rdquo
70
Sand separator or hydro cyclone filter is a type of filter that separates the particles from water according to the principle of gravitational settling and centrifugal force These are effective to remove suspended particles which have specific gravity more than 265 gcc (JISL) and are larger than 75 micron Such filters are suited for water type where a lot of sand is present in the water as they dont clog up nearly as quickly as other types of filters The dirty water enters the filter where it is swirled around the inside of a cylinder These filters are reasonably inexpensive very simple and are very effective for removing sand from water
Screen filters are probably the most common filters and in most case the least expensive and are excellent for removing hard particulates from water such as sand They are not so good at removing organic materials such as algae mold slime and other unmentionables These non-solid materials tend to embed themselves into the screen material from where they are very difficult to remove In other cases they simply slide through the holes in the screen by temporarily deforming their shape Screen filters are cleaned by flushing them with a stream of water or removing the screen and cleaning it by hand
Media filters clean the water by forcing it through a container filled with a small sharp edgedgranulated media In most cases the media material is uniform sized crushed silica sand The water passes through the small spaces between the media grains and the debris is stopped when it cant pass through these spaces Media filters are best for removing organic material from the water Media filters are the type of filters most commonly used for high volume cleaning of water from rivers and lakes Disc filters are a cross between a screen filter and a media filter with many of the advantages of both Disc filters are good at removing both particulates like sand and organic matter The pertinent information has been summarized in the following table below
Impact Evaluation Study on ldquoNational Mission on Micro Irrigation (NMMI)rdquo
71
Table 57 Type of Irrigation Filters Used by Farmers
Type of Irrigation Filters used by the Farmers () State Total
Beneficiary Total
Responses Hydro-cyclone
Filter
Screen filters
Sand Media Filters
Disc Filters
Hydro-cyclone
Filter ampScreen
filters
Hydro-cyclone Filter amp
Sand Media Filters
Hydro-cyclone Filter amp
Disc Filters
Screen filters
amp Sand Media Filters
Screen filters amp Disc Filters
Sand Media Filters ampDisc Filters
Hydro-cyclone Filter amp Screen
filters amp Sand
Media Filters
Hydro-cyclone Filter amp Screen
filters amp Disc
Filters
AP 672 672 015 9583 402 000 000 000 000 000 000 000 000 000 Bihar 516 6 000 8333 000 000 000 000 000 000 1667 000 000 000 Chhattisgarh 384 156 449 3141 000 5449 000 000 385 000 577 000 000 000 Gujarat 576 517 2244 1876 019 1973 348 019 2340 019 1103 058 000 000 Haryana 320 320 125 219 000 000 6469 125 031 1875 000 000 1094 063 Karnataka 576 576 035 7969 417 1580 000 000 000 000 000 000 000 000 Maharashtra 672 670 149 8478 075 1045 000 000 000 060 030 164 000 000 Odisha 480 480 021 9438 021 396 000 000 000 104 021 000 000 000 Rajasthan 574 568 141 8680 1056 000 000 018 000 053 035 018 000 000 Sikkim 50 50 000 9800 000 200 000 000 000 000 000 000 000 000 Tamil Nadu 455 455 044 8725 637 593 000 000 000 000 000 000 000 000 UP 527 524 248 8473 000 000 1240 000 000 038 000 000 000 000 Uttarakhand 90 90 000 10000 000 000 000 000 000 000 000 000 000 000
Source GAPL Survey
Impact Evaluation Study on ldquoNational Mission on Micro Irrigation (NMMI)rdquo
72
Different types of filters are mainly used for drip irrigation system whereas its use for sprinkler system is required under very specific water quality characteristics Some beneficiaries reported that they were using filters in sprinkler systems to check the plugging etc The beneficiary farmers using drip irrigation system were asked about the type of filters being used by them It may be seen from the table 58 that farmers are using screen filters centrifugal separators hydro-cyclone filter disc filter sand media filters depending on the need The data cited in the above table reveal that screen filters are being commonly used by the beneficiaries in most of the sampled states except Haryana where screen filters are being used in combination with hydrocyclone filters The combined use of filters in Haryana is attributed to the fact that additional subsidy is being given on hydro-cyclone type of filters In fact a combination of three filters (hydro-cyclone screen amp sand filter) is also being used by some beneficiaries of Haryana The use of such combinations may be ascribed to the fact that since Haryana government is extending financial assistance to construct water storage tanks as such many farmers prefer to store the water in such structures The incidence of different types of contaminations is higher in the stored water thus farmers are using combination of three types of filters to ensure the removal of all types of organic and inorganic materials Disc filters are used by about 55 percent farmers of Chhattisgarh followed by Gujarat (20) Karnataka (16) About 10 percent of the farmers of Rajasthan followed by 6 percent Tamil Nadu and 4 from AP are using sand filters may be because they are getting water from canals which has high dirt load of organic and inorganic materials The size of filter installed with MI system depends on the area being irrigated and the quantum of water being pumped It has been noted by the field staff that in most of the cases size of filters was appropriate as per the area soil and water quality characteristics 4219 Type of Emitters in drip system There are two categories of emitters usually installed with drip system in the field
a) In-line emitters These are used in row crops such as vegetables where water needs to be applied effectively near the root zone area
b) On-line emitters These are suitable to orchard crops such as apples mangoes etc These drippers are fixed on the laterals and can be opened for cleaning It provides uniform water distribution in the root zone The drippers may clog with physical impurities like minerals amp salts and also due to poor maintenance Further rodents and insects can damage lateral pipes of the drip irrigation system
Drip irrigation system left above the ground tends to clog less as in underground system chances of deposition of algae and soil particles is high It is also easy to lift while
Impact Evaluation Study on ldquoNational Mission on Micro Irrigation (NMMI)rdquo
73
preparing the fields for seed sowing or transplantation of seedlings Use of plastic mulch in conjunction with drip irrigation system has been reported to be more beneficial in saving water and improving the crop yields It was assessed during the course of study whether the sampled beneficiaries were using in-line or on-line drip system the pertinent data on type of emitters are cited in the following table
Table 58 Type of Emitters Used by Beneficiaries
State Total
Responses Inline Online
in Inline Online
AP 512 414 98 8086 1914 Bihar 6 4 2 6667 3333 Chhattisgarh 153 98 55 6405 3595 Gujarat 450 344 106 7644 2356 Haryana 236 128 102 5424 4576 Karnataka 575 359 216 6243 3757 Maharashtra 577 366 211 6343 3657 Odisha 118 84 34 7119 2881 Rajasthan 118 79 39 6695 3305 Sikkim 45 34 11 7556 2444 Tamil Nadu 384 256 128 6667 3333 UP 322 220 102 6832 3168 Uttarakhand 30 12 18 4000 6000
Source GAPL Survey It may be seen from the above table that more than 70 percent of the respondent farmers of AP Gujarat Sikkim and Odisha were using in-line drip irrigation system whereas more than 45 percent beneficiaries of Haryana and Uttarakhand reported to practice on-line drip irrigation system 4220 Type of Sprinkler Under sprinkler irrigation water is sprinkled under pressure on to the crop through a set of nozzles attached to network of pipes in the form of rainfall The sprinkler system sets unlike drip system are moveable Hence one sprinkler set could cover more than one hectare by shifting from one place to another Assistance for sprinkler irrigation is limited to only those crops where drip irrigation is uneconomical
Impact Evaluation Study on ldquoNational Mission on Micro Irrigation (NMMI)rdquo
74
Table 59 Type of Sprinklers Used by Beneficiaries
State Total Responses Percentage
Portable MiniMicro Rain gun AP 160 2072 7928 000 Bihar 510 9471 529 000 Chhattisgarh 231 7745 2251 000 Gujarat 126 8810 1111 079 Haryana 84 9524 476 000 Karnataka 87 3218 6667 114 Maharashtra 95 9368 632 000 Odisha 362 9613 387 000 Rajasthan 356 7556 2444 000 Sikkim 10 8000 2000 000 Tamil Nadu 71 9718 282 000 UP 205 9707 293 000 Uttarakhand 60 8833 1167 000
Source GAPL Survey It may be seen from the above table that majority of the beneficiaries of Tamil Nadu Rajasthan Odisha Bihar Maharashtra Gujarat and Uttarakhand states were using portable sprinkler irrigation system The use of rain gun was reported by one farmer only in Gujarat as it is most suitable to the large area under cultivation It is noted to be appropriate type of sprinkler system for larger areas as it can rotate 30 to 360 circle covering 25 meter radius with a discharge rate 175 lps 4221 Farmersrsquo opinion on System Supply and Installation related constraints The farmers were asked to reveal the difficulties faced by them right from the filing of application till receiving the after sales service including procedures quality of the systems supplied prices charged by empanelled system suppliers delay in installation after the placement of orders and any additional charges claimed by the supplies The response of the beneficiaries has been summarized in the table below
Impact Evaluation Study on ldquoNational Mission on Micro Irrigation (NMMI)rdquo
75
Table 60 Constraints Faced by Beneficiary Farmers ()
State Total
Beneficiaries
Procedure Related
Quality Issues
Higher Prices Charged
under Scheme then Available
in Market
Delay in System Supply
(Committed date vs Actual
date
Other Charges (Not covered in
the scheme additional
money paid) Yes No Yes No Yes No Yes No Yes No
AP 672 000 10000 060 9940 060 9940 060 9940 015 9985 Bihar 516 078 9922 155 9845 155 9845 252 9748 717 9283 Chhattisgarh 384 026 9974 000 10000 000 10000 000 10000 000 10000 Gujarat 576 25 975 313 9688 191 9809 278 9722 139 9861 Haryana 320 094 9906 094 9906 063 9938 281 9719 000 10000 Karnataka 576 000 10000 000 10000 000 10000 000 10000 000 10000 Maharashtra 672 030 9970 089 9911 074 9926 104 9896 074 9926 Odisha 480 000 10000 000 10000 000 10000 479 9521 021 9979 Rajasthan 574 1359 8641 854 9146 1045 8955 1045 8955 1045 8955 Sikkim 50 000 10000 200 9800 000 10000 000 10000 000 10000 Tamil Nadu 455 000 10000 000 10000 000 10000 000 10000 000 10000 UP 527 152 9848 209 9791 114 9886 285 9715 019 9981 Uttarakhand 90 3556 6444 3889 6111 5444 4556 3556 6444 889 9111 Total 5892 233 9767 229 9771 246 9754 304 9696 205 9795
Source GAPL Survey It is evident from the data that in most of the sample states beneficiaries did not face much of the difficulties related to the procedures quality prices delay in system installation etc 4222 After Sales Service The information on magnitude and quality of after sales services being provided by the suppliers has been summarized in table 61 On an average 91 percent of the beneficiaries across the sampled states reported that after sales services are being provided to them However about 34 percent beneficiaries from Bihar and 22 percent beneficiaries from Gujarat amp Maharashtra each informed that they did not receive the after sales services As for the timely and regular availability of after sales services is concerned about 87 percent beneficiaries reported that they receive the services at the required time
Impact Evaluation Study on ldquoNational Mission on Micro Irrigation (NMMI)rdquo
76
Table 61 Status Reported by Beneficiaries Regarding lsquoAfter Sales Servicesrsquo
State Total Beneficiary Provided by the vendor () If yes then ()
Yes No Timely Late Irregular AP 672 10000 000 8051 1949 000 Bihar 516 6570 3430 8378 1563 059 Chhattisgarh 384 10000 000 10000 000 000 Gujarat 576 7778 2222 8973 558 469 Haryana 320 10000 000 9156 438 406 Karnataka 576 9896 104 9045 920 035 Maharashtra 672 7768 2232 7854 1897 249 Odisha 480 9229 771 8871 880 248 Rajasthan 574 9582 418 9327 618 055 Sikkim 50 10000 000 9800 200 000 Tamil Nadu 455 9890 110 8813 1187 000 UP 527 9772 228 8854 1126 019 Uttarakhand 90 10000 000 2000 2222 5778 Total 5892 9085 915 8697 1083 220
Source GAPL Survey
The respondents were further enquired regarding the level of satisfaction with respect to after sale services and their responses are given in the Figure 8 It is well evident that on an average 87 percent of the beneficiaries across the entire 13 states received the after sales services to their complete satisfaction
During the course of field survey the respondents were asked whether this system supplier have given after sale service for the MI system installed at their farms The results regarding this issue have been summarized in above table It may be seen from the table that the farmers of Chhattisgarh AP Sikkim and Uttarakhand have reported that 100 percent after sale service was provided to them whereas two-third of the farmers reported regarding after sale service The farmers of the most of the states have got the benefit of this service
It is suggested that the implementing agencies should be more vigilant regarding warranty and after sales service of the system provided by the suppliers The question of releasing 10 percent of the cost of the system after one year subject to satisfactory performance of the system as certified by the beneficiary may be considered Maintenance manual in vernacular language should be made available to the beneficiaries at the time of installation of the system
Impact Evaluation Study on ldquoNational Mission on Micro Irrigation (NMMI)rdquo
77
Figure 8 Level of Satisfaction regarding lsquoAfter Sale Servicesrsquo
Source GAPL Survey
4223 Warranty As per the norms of NMMI the system suppliers are supposed to extend warranty to the beneficiaries regarding MI system installed at their farms In this regard the beneficiaries were asked regarding issue of warranty to them and their replies are summarized in table 62
Table 62 Status of Warranty for MI System ()
State Total
Beneficiary Warranty () If yes then () Yes No lt6 Months 1 Yr 1-2 Yr 2-3 Yr gt3 Yr
AP 672 10000 000 000 104 565 6533 2798 Bihar 516 3527 6473 000 165 275 5769 3791 Chhattisgarh 384 9948 052 000 000 052 890 9058 Gujarat 576 9948 052 000 017 035 070 9878 Haryana 320 10000 000 000 000 031 9969 000 Karnataka 576 10000 000 000 017 087 8906 990 Maharashtra 672 10000 000 000 238 491 3557 5714 Odisha 480 10000 000 000 021 167 2042 7771 Rajasthan 574 10000 000 000 087 3101 976 5836 Sikkim 50 10000 000 000 9000 000 800 200 Tamil Nadu 455 10000 000 000 022 044 7736 2198 UP 527 9981 019 000 019 646 8422 913 Uttarakhand 90 10000 000 667 3556 1667 4111 000 Source GAPL Survey
It may be seen from the above table that the beneficiaries of all the states under study have reported that they have got the warranty as per the requirement except for Bihar
Impact Evaluation Study on ldquoNational Mission on Micro Irrigation (NMMI)rdquo
78
were majority of the farmers reported that they did not get this benefit The farmers were further asked the duration of the warranty issue to them by the company Almost all the farmers of Chhattisgarh and Gujarat have reported that they received this facility for three years and the farmers of other state reported that they got warranty for their system for less than two years It is important that system suppliers should give two years warranty as per the guidelines of the scheme and it is proposed that in order to enforce this clause 5 percent subsidy may be released after the completion of warranty period 4224 Promotional Activities NMMI agencies are promoting the adoption of micro irrigation and its benefits to the growersrsquo awareness through various promotional tools such as publicity through newspapers radios TV and other sources which are summarized in the following table
Table 63 Awareness about Promotional Activities ()
State Total
Beneficiary
Publicity of the MI Scheme in local
language
Awareness of the dedicated website for MI Scheme in
the State
Awareness of the package of
practices being adopted for MI
Yes No Yes No Yes No AP 672 9866 134 9226 774 9940 060 Bihar 516 9128 872 000 10000 9729 271 Chhattisgarh 384 9948 052 9453 547 9844 208 Gujarat 576 7604 2396 7118 2882 8854 1146 Haryana 320 9719 281 6688 3313 9656 344 Karnataka 576 9965 035 2587 7413 9965 035 Maharashtra 672 9628 372 9003 997 9940 060 Odisha 480 9813 188 083 9917 9917 083 Rajasthan 574 9826 174 645 9355 9303 697 Sikkim 50 10000 000 200 9800 9800 200 Tamil Nadu 455 10000 000 9868 132 9956 044 UP 527 8235 1765 2694 7306 9127 873 Uttarakhand 90 9444 556 8000 2000 8444 1556 Total 5892 9411 589 5204 4796 9637 367 Source GAPL Survey
It may be seen from the above table that the farmers of the majority of the states that the implement agencies are promoting NMMI schemes in local language and almost 100 percent results were observed in Tamil Nadu Sikkim Odisha Rajasthan Chhattisgarh Karnataka and Maharashtra It is interesting to note that awareness of the dedicated website for MI scheme was limited
Impact Evaluation Study on ldquoNational Mission on Micro Irrigation (NMMI)rdquo
79
The beneficiaries were further asked whether they are aware of the package and practices being adopted for MI and the response were found to be very positive This reveals that the beneficiaries who have installed micro irrigation in their farm are aware of the package and practices to be followed for taking full advantage of the MI system supported cultivation
43 Observations of Field Staff on MI System In addition to farmersrsquo investigation the field survey team also visited the fields to observe the design and working of the system The field investigators have highlighted their observations regarding the condition of the MI system overall designing of the system installed and general conditions of the field The results regarding the observations of the field staffs are given in the following table below
Table 64 Observations of Surveyors regarding MI System Status at the Time of Field Visit
State
Overall Design
Drip Sprinkle MI System
match crop requirement
General Condition of the System
Flood Irrigation
along with MI System
Design () () System Condition ( `) () Good Satisfactory Bad Yes No Good Average Bad Yes No
AP 5982 4018 0 9777 223 5759 4226 015 6205 3795 Bihar 6298 3702 0 7791 2209 4942 5019 039 7558 2442 Chhattisgarh 7760 2240 0 9792 208 7188 2813 0 9844 156 Gujarat 6892 3038 069 9688 313 6094 3785 122 5278 4722 Haryana 9656 344 0 10000 0 9875 125 0 9781 219 Karnataka 5538 4462 0 9983 017 5417 4583 0 8090 1910 Maharashtra 6637 3363 0 9881 119 5536 4360 104 4970 5030 Odisha 4917 5083 0 9625 375 6500 3479 021 7813 2188 Rajasthan 8833 1167 0 9146 854 7648 2352 0 8153 1847 Sikkim 3600 6400 0 10000 0 6600 3400 0 6600 3400 Tamil Nadu 5582 4418 0 9912 088 4549 5451 0 8044 1956 UP 7381 2581 038 9791 209 5142 4801 057 8861 1139 Uttarakhand 9667 333 0 9222 778 8556 1444 0 9556 444 Total 6767 3223 010 9571 429 6124 3841 036 7463 2537
Source GAPL Survey It may be seen from the above table that in almost all the states under study the overall designing of the system was found to be satisfactory Majority of the field staff observed that system designs met the farmersrsquo requirements however in the state of Bihar only about 78 percent of the MI Systems were designed which could meet the crop requirements Remaining 22 percent of the systems have not been designed perfectly which could meet the water requirements of different crops It has also been observed by
Impact Evaluation Study on ldquoNational Mission on Micro Irrigation (NMMI)rdquo
80
the field investigators that some of the farmers have adopted innovative plant management techniques especially high density plantation in fruit crops and intercropping In almost all the states the sampled beneficiaries also revealed that no technical support guidance on agronomic practices are extended to the users by MI system suppliers as they generally tell the beneficiaries to take the help of extension agencies It was also observed that most of the beneficiary farmers have been using both the techniques of water application that is flood and the micro irrigation 44 Assessment of the System Design
Selection of MI Companies participating in NMMI at State level are based on the following parameters
a Manufacturing capacities of various equipment
b Financial strength of the company
c Dealer network
d Working experience in projects
e Availability of technical manpower
At the time of registration of the manufacturers it is mandatory that the quality of the system should be of BIS standards and the design must meet the requirements of the farmers in terms of its suitability to crops and field situations The conditions for providing after sale service and the warranty of the system are also laid at the time of registration To validate these parameters the beneficiaries were inquired regarding such issues and their responses are summarized in the table 65
The data indicate that the farmers in almost all the states reported that components of MI System met the BIS norms The average figure for all the sample states where system components were as per the BIS norms came out to be around 98 percent There is a need that variations reported in terms of not having BIS components as per NMMI guidelines may be brought to the notice of respective implementing agencies for further necessary action In more than 95 percent cases size of pumps was reported to be as per crop water amp plot size requirements except for the state of Bihar where around 18 percent respondents gave a negative reply
Impact Evaluation Study on ldquoNational Mission on Micro Irrigation (NMMI)rdquo
81
Table 65 Assessment of the System Design ()
State Total
Beneficiary
System components supplied are as per the
BIS
Pump size is proper to the field plot size wrt crop water requirements
MI system meets requirements
Design layout is as per project proposal
After sales service has been provided by the
MI system suppliers
MI systems found to be functional in
the field
Yes No Yes No Yes No Yes No Yes No Yes No AP 672 9970 030 9955 045 9955 045 9970 030 9940 060 9926 074 Bihar 516 9476 524 8217 1783 9845 155 8740 1047 6337 3663 6880 3120 Chhattisgarh 384 9974 026 10000 000 9974 026 10000 000 7396 2604 7552 2448 Gujarat 576 9722 278 9861 139 9635 365 9618 365 9520 480 9427 573 Haryana 320 10000 - 9938 063 9875 125 10000 000 9375 625 9281 719 Karnataka 576 10000 - 10000 000 10000 000 10000 000 10000 000 9549 451 Maharashtra 672 9732 268 9970 030 9985 015 9717 283 7842 2158 9821 179 Odisha 480 9896 104 9958 042 9958 042 9896 104 8646 1354 6667 3333 Rajasthan 574 9599 400 9425 575 9077 923 9408 610 9181 836 8798 1202 Sikkim 50 9600 400 10000 000 10000 000 10000 000 10000 000 9000 1000 Tamil Nadu 455 10000 - 10000 000 10000 000 10000 000 10000 000 9055 945 UP 527 9526 474 9962 038 9829 171 9943 057 9791 209 6603 1499 Uttarakhand 90 9778 222 8778 1222 7222 2778 9222 778 4889 5111 8222 1778
Source GAPL Survey
Impact Evaluation Study on ldquoNational Mission on Micro Irrigation (NMMI)rdquo
82
It was also observed by the field investigators that more than 15 percent reported that the MI system were non-functional in Bihar Chhattisgarh Odisha amp Uttarakhand due to crop season and fear of theft amp damage from rodents It was found that standard designs as regards spacing layout etc have been used in almost all the cases without any variation taking into account the shape size water quality soil conditions etc On an average 98 percent of the farmers reported that MI System installed in their fields meet their requirements however around 28 percent of the farmers in Uttarakhand responded that systems has not been installed as per their requirements Almost 100 percent of the beneficiaries reported that the system design layout is as per project proposal except farmers of Bihar where 10 percent farmers reported that system has not been laid out as per the design in the project proposal In the states of Bihar Chhattisgarh amp Uttarakhand the beneficiaries about 40-50 percent of the beneficiaries reported that they are not being provided after sales service 45 System Suppliers The global micro irrigation systems market is one of the fastest growing segments of agriculture sector The growth of this market is fueled by the government initiatives for adoption of micro irrigation systems in order to conserve water for optimum use The growth of micro irrigation systems is particularly higher in Asia Pacific and Africa due to the increased problems of water scarcity and farmer awareness towards increasing the crop yield with the help of micro irrigation systems India and China are expected to drive growth in the global micro-irrigation systems market which is seen reaching $48 billion by 2018 at a CAGR of 18 per cent from 2012 to 2018 Out of the total 695 million hectares (425 million ha sprinkler and 27 million ha drip) of cultivated area in India only 571 percent of the area is under drip and sprinkler irrigation This represents strong potential for the growth of micro irrigation systems in this region6 This low penetration offers growth opportunities in future All the benefits provided by the micro irrigation systems over flood irrigation coupled with the governmental initiatives to increase the MI system penetration are responsible for the MIS growth in India Also all such drivers are likely to help the market to grow in future as well
6As per Indian Taskforce Report of 2004
Impact Evaluation Study on ldquoNational Mission on Micro Irrigation (NMMI)rdquo
83
After initial scrutiny a committee consisting of experts examines the facilities at manufacturing site for verification of establishment details The list of the registered system suppliers is given below in table
Table 66 State Wise List of Registered MI System Suppliers
SNo State Name Suppliers Name
1 Andhra Pradesh
Ms EPC Industries Ltd (A Mahindra Group of Company) Ms Jain Irrigation Systems Ltd Ms Premier Irrigation Equipment Ltd Ms Rungta Irrigation Ltd Ms Greenfield Irrigation Ltd Ms Sudhakar Plastic Ltd Ms Nagarjuna Palma India Ltd Ms Kumar Enterprises Ms Nandi Plasticisers Ltd Ms Godavari Polymers Pvt Ltd Ms Haritha Irrigation Products Pvt Ltd Ms Netafem Irrigation India Pvt Ltd Ms Megha Agrotech Private Ltd Ms Satya Sai Polymers
2 Bihar
Ms Jain Irrigation Systems Ltd Ms EPC Industries Ltd (A Mahindra Group of Company) Ms Aaram Plastics Pvt Ltd Ms Sai Irrigation Ms Kishan Enterprise Ms Venkatesh Irrigation Ms Premier Irrigation Adritec Pvt Ltd Ms Netafim Irrigation India Pvt Ltd
3 Chhattisgarh Ms Netafim Irrigation India Pvt Ltd Ms Paras Drip Irrigation Ms Jain Irrigation Systems Ltd
4 Gujarat
Ms Dutron Polymers Ltd Ms Harvel Agua India Pvt Ltd Ms Jain Irrigation Systems Ltd Ms Netafim Irrigation India Pvt Ltd Ms Paragon Synthetics amp Polymers Ltd Ms Parixit Industries Limited Ms EPC Industries Ltd (A Mahindra Group of Company) Ms Plastro Plasson Industries (I) Ltd Ms Captain Irrigation System Ms Finolex Plasson Industries Pvt Ltd Ms Kothari Industries Ms Premier Irrigation Adritec Private Ltd Ms Transchem Agritech Ltd
5 Haryana Ms Jain Irrigation Systems Ltd Ms Netafim Irrigation India Pvt Ltd
Impact Evaluation Study on ldquoNational Mission on Micro Irrigation (NMMI)rdquo
84
Ms Balaji Agro-Systems Pvt Ltd Ms Ajay Industrial CorporationLtd Ms Apollo Pipes Ltd Ms Pioneer Plastics Industries Ltd Ms Rungta Irrigation Ltd Ms Nagarjuna fertilizers and chemicals limited Ms Harwel Agro India Limited Ms Finolex Plastic India Ltd Ms Vindhya Pipes amp plastics Ltd Ms Rungta Irrigation Ltd Ms Nirmal Polyfab Pvt Ltd
6 Karnataka
Ms Finolex Plasson Industries Ltd Ms Metro Drip Irrigation (P) Limited Ms EPC Industries Ltd (A Mahindra Group of Company) Ms Megha Agro Tech Pvt Ltd Ms Pioneer Plastic Industries Ltd Ms Jain Irrigation Systems Ltd Ms Agroplast Karnataka
7 Maharashtra
Ms Alphaplast Irrigation System Ms Aquaguard Plastics And Polymers Ms Datta Irrigation Company Ms Donga Watertech Ms Drip India Ms EPC Industries Ltd (A Mahindra Group of Company) Ms Finolex Plasson Industries Ltd Ms Godavari Polymers Ms Greengold Irrigation Ms Jain Irrigation Systems Ltd Ms Jaldhara Drip Irrigation Pvt Ltd Ms Kothari Agritech Pvt Ltd Ms Mohak Agro Industries Ms Nagarjuna fertilizers and chemicals limited Ms Neer Irrigation Ms Netafim Irrigation India Pvt Ltd Ms Nimbus Pipes Ltd Ms Paras Drip Irrigation
8 Odisha
Ms Jain irrigation system Ltd Ms Netafim Irrigation India Pvt Ltd Ms Premier Irrigation Adritec Pvt Ltd Ms Rungta Irrigation Ltd Ms Oasis Irrigation Equipment Co Ltd Ms Nagarjuna Fertilizers amp Chemicals Limited Ms Sujay Irrigation Pvt Ltd Ms Finolex Plasson Industries Pvt Ltd Ms Kirti Industries (India) Ltd Ms Relpol Plastic Products Ltd
9 Rajasthan Ms Netafim Irrigation India Pvt Ltd
Impact Evaluation Study on ldquoNational Mission on Micro Irrigation (NMMI)rdquo
85
Ms Khushboo Polymers Pvt Ltd Ms Shree Irrigation Systems P Ltd Ms Excellent Irrigation P Ltd Ms EPC Industries Ltd (A Mahindra Group of Company) Ms Purma Plast Ltd Ms Jamna Industries Ms Dinesh Irrigation P Ltd Ms Aaram Plastic Pvt Ltd Ms Jain irrigation system Ltd
10 Sikkim Ms Jain Irrigation Systems Ltd Ms Netafim Irrigation India Pvt Ltd
11 Tamil Nadu
Ms Agro Plast Ms AGS Irrigation (P) Ltd Ms Alpha Irritech Pvt Ltd Ms EPC Industries Ltd (A Mahindra Group of Company) Ms Elgi Ultra Industries Ltd Ms Finolex Plasson Industries Ltd Ms Jain Irrigation Systems Ltd Ms Krishi Irrigation Pvt Ltd Ms Mega Agrotech Pvt Ltd Ms Netafim Irrigation India Pvt Ltd Ms Parixit Industries Limited Ms Pragati Irrigation Systems Pvt Ltd Ms Premier Irrigation Adritec Pvt Ltd Ms Rungta Irrigation Ltd Ms Sujay Irrigation Private Limited
12 Uttar Pradesh
Ms Jain irrigation system Ltd Ms Nagarjuna fertilizers and chemicals limited Ms Sterling Irrigation Ltd Ms EPC Industries Ltd (A Mahindra Group of Company) Ms Netafim Irrigation India Pvt Ltd
13 Uttarakhand
Ms Jain Irrigation Systems Ltd Ms Netafim Irrigation India Pvt Ltd Ms Harvel Agua India Pvt Ltd Ms Pioneer Plastics Industries Ltd Ms Premier Irrigation Adritec Private Ltd
The success of the micro irrigation system is solely dependent on the quality of material used and after sale service Therefore the NMMI guidelines have given due consideration to this very component and have made it mandatory to register the system manufacturers and the same is done by State Micro Irrigation Committee (SMIC) Only those manufacturing companies which insure the quality of the product as per BIS and can promptly provide after sale service are registered for three years The registered company need to declare the technical details of the components proposed to be supplied and which would be verified by the technical committee Further frequent surveillance by
Impact Evaluation Study on ldquoNational Mission on Micro Irrigation (NMMI)rdquo
86
inspection team comprising from NCPAH PFDC CIPET Irrigation Association of India is necessary The Manufacturers have to insure the network for providing after sale services in their area of operation They have to further provide operation and maintenance manuals in vernacular language at the time of installation They should also have the facilities to provide technical guidance on agronomic practices system maintenance schedules spare parts warrantee etc Free after sale service shall be provided by manufacture or authorized distributors for at least three years It has been observed almost all the states that the material supplied to the farmersbeneficiaries is of BIS and also gives warranty for three years However during the course of the investigation it was reported by beneficiaries that the after sale service is provided only in the initial phase and simple instructions are given for using the system No technical support guidance on agronomic practices are extended to the users as they generally tell the beneficiaries to take the help of extension agencies The distributors dealers operating in various sampled states reported that they get the subsidy within 15-20 days of applying but sometime they face the delay in release of subsidy due to non-availability of funds under scheme at district state level Further they also reported that due to delay in trial run inspection also leads to delay in release of the subsidy It is suggested that it would be better if subsidy is directly passed on to the beneficiaries to expedite the release disbursement of subsidy under the scheme
Impact Evaluation Study on ldquoNational Mission on Micro Irrigation (NMMI)rdquo
87
5 Impact Evaluation A number of studies have been conducted to assess the impact of micro irrigation particularly that of drip which have shown encouraging results of farm variables It has also helped in bringing crop diversification from rain fed crops to horticulture crops and have also brought cultivable wastelands under high value such as horticulture crops reduction in cost of production higher yield etc The impact of the scheme on various parameters detailed below has been evaluated to arrive at conclusion about achievement of the scheme objectives as well as general benefit to the agricultural economy of the country Some sequences are in following paragraphs
1 Area Expansion under MI and additional area irrigated by installing MI in place of conventional irrigation and waste marginal land development with the same amount of water
2 Savings in labor fertilizers and electricity thereby reducing cost of cultivation 3 Study of productivity enhancement for various crops 4 Whether the adoption of MI has given rise to crop diversification adoption of high
value crops etc 5 Innovative crop management techniques facilitated through adoption of MI which
are canopy management high density plantation inter cropping etc 6 Contribution of MI towards National food security
51 Crop Diversification
Crop diversification in India is generally viewed as a shift from traditionally grown crops to more remunerative crops With the advent of modern agricultural technology especially during the period of the Green Revolution in the late sixties and early seventies there is a continuous surge for diversified agriculture in terms of crops primarily on economic considerations
Crop diversification is intended to give a wider choice in the production of a variety of crops in a given area so as to expand production related activities on various crops and also to minimize risk The survey has measured impact of installation of MI systems on crop diversification The result of the beneficiariesrsquo responses is summarised in the following table
Impact Evaluation Study on ldquoNational Mission on Micro Irrigation (NMMI)rdquo
88
Table 67 Impact on Crop Diversification and Usage of Marginal and Degraded Land by Beneficiaryrsquos data
SNo State Total
cultivable area (Ha)
Horticulture Crop Area (Ha) Field crop Area (Ha) Marginal degraded Land
( Waste Land) (Ha)
Area Before
MI
Area After MI
Change in Area
Area Before
MI
Area After MI
Change in Area
Area Area after MI
Change in area Before
MI 1 AP 149122 39388 88038 12351 68932 59550 -1361 16953 1534 -9095
2 Bihar 140742 37989 54002 4215 95641 86619 -943 202 121 -4000
3 Chhattisgarh 58406 8719 33495 28415 46502 24211 -4794 1016 700 -3108
4 Gujarat 167639 32040 44131 3773 122983 120072 -237 8373 3436 -5897
5 Haryana 135990 19628 64972 23102 133613 71018 -4685 769 000 -10000
6 Karnataka 111046 68571 85818 2515 34908 23447 -3283 2570 1781 -3071
7 Maharashtra 133667 17384 43304 14910 96225 82488 -1428 22659 7875 -6524
8 Odisha 141309 58179 92107 5832 76276 44435 -4174 7657 4767 -3774
9 Rajasthan 162365 65643 102036 5544 83881 52539 -3736 16410 7790 -5253
10 Sikkim 7327 6149 6639 797 1020 587 -4246 101 101 000
11 Tamil Nadu 76488 44887 53142 1839 32862 23306 -2908 299 040 -8649
12 UP 164662 23078 79251 24341 134278 85249 -3651 2942 162 -9450
13 Uttarakhand 32295 9075 9278 223 18707 18727 011 4573 4290 -619 Source GAPL Survey
Impact Evaluation Study on ldquoNational Mission on Micro Irrigation (NMMI)rdquo
89
It may be observed from above table that the farmers of all the states have shown increase in area under horticulture crops after the adoption of the system The highest increase has been observed in Haryana followed by Chhattisgarh UP Maharashtra and AP whereas the lowest in case of Uttarakhand and Sikkim which may be because of the reason that both the states have proportionately higher area under horticulture crops 52 Area Expansion under Micro Irrigation The GoI MI scheme has succeeded in bringing around 3812 lakh ha under micro irrigation with total subsidy amounting to Rs 546801 crores since the launch of the scheme in 2005-06 in India This represents about 257 of the total cultivated area in the country and 569 of the total irrigated area of the country The area expansion under MI system in the country has grown at 36 23 and 18 respectively for last three years (as per official records) Eventually the growth trend is quite impressive yet overall proportion of land under MI is quite low and as such more efforts such as creating awareness among the farmers through electronic and print media exhibition fares PRIs etc need to be initiated to bring the significant area under MI 53 Increase in Irrigated Area due to Water Saving Drip irrigation is being practiced in the different parts of the country since 80s to improve the water use efficiency water savings and productivity enhancement Through the saving of water due to adoption of MI technologies it is possible for beneficiaries to increase the area under cultivation by way of efficient use of water In order to understand that how much additional area has been brought under irrigation the irrigated area before and after installation of MI was taken into consideration (Table 68) In order to have better comprehension of area increased due to MI the percent increase in different schemes was given a graphical shape (Figure 9) After adoption of MI system sampled beneficiaries were able to bring their irrigated area under irrigation from same source of water which otherwise was not being utilized for cultivation due to limited availability of water The Irrigated area within the 5892 sampled beneficiaries of the 13 states before adoption of MI system was found to be 1332086 ha which 1444147 became ha after adoption of MI system It is therefore concluded that total percentage increase in irrigated area with the sampled beneficiaries in 13 states after adoption of MI system was noted to be 841
Impact Evaluation Study on ldquoNational Mission on Micro Irrigation (NMMI)rdquo
90
Table 68 Increase reported by Beneficiaries in Irrigated Area (ha) after Installation of MI System
State Total Irrigated Area before
installation of Micro Irrigation system (ha)
Total Irrigated Area after installation of Micro Irrigation
system (ha)
increase in irrigated Area
AP 101343 113941 1243 Bihar 229656 236802 311 Chhattisgarh 49474 57196 1561 Gujarat 135891 155007 1407 Haryana 123368 136263 1045 Karnataka 103805 106492 259 Maharashtra 102551 125400 2228 Odisha 124189 138310 1137 Rajasthan 100577 107850 723 Sikkim 6040 6081 067 Tamil Nadu 70956 74116 445 Uttar Pradesh 158370 160415 129 Uttarakhand 25862 26275 160 Grand Total 1332086 1444147 841
Source GAPL Survey
Figure 9 Increase in Irrigated Area () among Beneficiaries after Adoption of MI
54 Development of marginal and wasteland by beneficiaries
Degraded land which can be brought under vegetative cover with reasonable effort and which is currently under-utilized and land which is deteriorating for lack of appropriate water and soil management or on account of natural causes The total cultivable waste land in the country at present is about 1283 million hectares Based on the feedback received from the sampled beneficiaries it was observed that during survey in the sampled states beneficiaries sampled farmers were able to convert
Impact Evaluation Study on ldquoNational Mission on Micro Irrigation (NMMI)rdquo
91
their marginal amp rainfed land into cultivable land due to efficient use of water resources available with them In 13 surveyed states 5892 sampled farmers holding 1481058 hectares of land reveals that around 84540 ha of land was not being used for cultivation as they were either waste or degraded land Farmers reported that after adoption of MI system they were able to bring around 51943 ha of land under cultivation The data reveals that adoption of MI system has helped the sampled beneficiaries in bringing around 371 of land under cultivation Maximum and minimum area conversion with the beneficiaries was noted in Andhra Pradesh and Sikkim respectively
Table 69 Marginal Degraded Land brought under Cultivation after Installation of MI System by Beneficiaries
States Total no of
Sampled Beneficiaries
Total area of Sampled
beneficiaries (Ha)
No of sampled farmer with
wastedegraded
Area under wastedegraded
land before NMMI (ha)
Converted area after
adoption of NMMI (ha)
AP 672 149122 242 16953 15419 Bihar 516 140742 2 202 081 Chhattisgarh 384 58406 8 1016 318 Gujarat 576 167639 57 8374 4939 Haryana 320 13599 2 769 769 Karnataka 576 111046 11 2572 789 Maharashtra 672 133667 126 22666 14791 Odisha 480 141309 70 7660 2893 Rajasthan 574 162365 39 16410 8620 Sikkim 50 7327 4 101 000 UP 527 76488 32 2942 2780 Uttarakhand 90 164662 46 4575 284 Tamil Nadu 455 32295 10 300 260 Total 5892 1481058 649 84540 51943
Source GAPL Survey
55 Dripper spacing The dripper spacing is important as it accommodates higher plant population resulting more number of fruits which increases total yield and net returns It is also a factor to commensurate water requirement and root zone of the plant However wide dripper spacing saves more water total irrigation time minimized the diseases and weeds incidence as compared to closer dripper spacing in each years The recommended spacing for different crops under Micro Irrigation system has been presented in the following tables below During the course of field survey the beneficiary farmers were asked to specify the spacing of the crops they are following The responses of the farmers are given in the table 70 amp 71 for different crops in sampled states
Impact Evaluation Study on ldquoNational Mission on Micro Irrigation (NMMI)rdquo
92
Table 70 Spacing followed by Sampled Beneficiaries for Fruit Crops (m)
SNo State Fruits
Banana Lemon Mango Papaya Watermelon Orange Litchi Guava Pomegranate Grapes Coconut Cashewnut Aonla 1 AP 15 15 55 99 1818 66 2 Bihar 1010 55 3 Chhattisgarh 1818 1506 4 Gujarat 1818 1818 5 Haryana 0404 1010 88 6 Karnataka 22 88 22 44 315 7 Maharashtra 1515 1010 33 88 77 8 Odisha 22 66 55 22 7575 77 9 Rajasthan 66 66 5555 66 55
10 Sikkim 1515 55 33 11 Tamil Nadu 22 55 66 66 55 12 UP 1515 66 1010 1010 1010 13 Uttarakhand 88 33
Source GAPL Survey
Impact Evaluation Study on ldquoNational Mission on Micro Irrigation (NMMI)rdquo
93
Table 71 Spacing followed by Sampled Beneficiaries for Vegetables Flowers and Other Crops (m)
SNo State Vegetables Flowers and other important Crops
Brinjal Okra Tomato Potato Cucumber Onion Cabbage Cauliflower Chili Cotton Sugarcane Groundnut Lilli Rose 1 AP 0606 0404 1204 1212 1205 1515 11 2 Bihar 21 055022 1509 3 Chhattisgarh 1503 0502 1503 4 Gujarat 1404 06015 07015 1404 1505 07005 5 Haryana 105 102 0501 0606 103 0505 6 Karnataka 1206 1206 1806 0609 7 Maharashtra 0606 1204 1204 1503 15075 1205 8 Odisha 06045 045045 0603 045030 0603 9 Rajasthan 1030 1020 025025 055055 066066 1030
10 Sikkim 108 66 108 11 Tamil Nadu 0606 06045 1503 1212 24075 12 UP 06075 0604 1204 07503 1509 13 Uttarakhand
Source GAPL Survey
It may be seen that crop spacing is more or less as per recommendations In few cases the spacing is even less It is clearly indicates that farmers adopting MI system also adopt proper practices
Impact Evaluation Study on ldquoNational Mission on Micro Irrigation (NMMI)rdquo
94
56 Reduction in Cost of Irrigation The data cited in table 73 indicate the cost of irrigation incurred by beneficiary farmers before and after installation of MI system It is well evident that Irrigation cost was reduced by 20-50 percent with the use of MI system The states of Gujarat Haryana and Rajasthan have witnessed more than 40 cost reduction The reduction in cost resulted primarily because of savings in the man power and electricity consumption
Table 72 Reduction in Cost of Irrigation with MI system
State Cost of Irrigation before MI ( Rs ha)
Cost of irrigation after MI (Rs ha) decrease in cost
AP 7200 5721 2050 Bihar 8734 6234 2860 Chhattisgarh 5602 3557 3650 Gujarat 11046 5599 4930 Haryana 7346 3749 4900 Karnataka 8215 6182 2470 Maharashtra 11204 7736 3100 Odisha 8895 6541 2650 Rajasthan 7193 3925 4540 Sikkim 3932 2836 2790 Tamil Nadu 6368 4792 2480 UP 6657 4819 2760 Uttarakhand 10693 8203 2330
Source GAPL Survey
57 Electricity Consumption The figures on consumption of electricity before and after installation of MI system by the beneficiary farmers have been tabulated in Table 73 The data clearly indicate that savings of electricity across the sampled states varied from 151 to 494 percent average being 306 percent It is pertinent to mention here that in the states of Bihar and Chhattisgarh almost all the beneficiaries have been using diesel kerosene to operate their pump sets For these two states reduction in consumption of electricity has been computed considering the reduction in use of diesel kerosene The variations in the extent of electricity savings among different states may be attributed to the type of system installed besides depth of water and area brought under MI
Impact Evaluation Study on ldquoNational Mission on Micro Irrigation (NMMI)rdquo
95
Table 73 Reduction in Electricity Consumption
State Electricity used
before MI( hrday) Electricity used
after MI( hrday) saving of electricity
AP 679 528 2233 Bihar 5000 3000 4000 Chhattisgarh 4500 2800 3778 Gujarat 678 407 3992 Haryana 835 423 4939 Karnataka 590 432 2675 Maharashtra 703 468 3348 Odisha 798 619 2246 Rajasthan 864 501 4208 Sikkim 262 170 3511 Tamil Nadu 578 491 1510 UP 225 184 1843 Uttarakhand 301 211 2989 Total 537 373 3065
Source GAPL Survey Diesel Kerosene consumed (ltrs day) for Bihar and Chhattisgarh
58 Economy in Fertilizer Use The information on use of fertilizers before and after installation of MI system was sought from the beneficiary farmers the obtained data have been enumerated in Table 74 In order to comprehend the information on fertilizers saving across the 13 states the data on fertilizer saving was given a graphical presentation (Figure 10) It is well evident that MI system resulted in significant savings of fertilizers The extent of fertilizer saving in the states under study varied from 759 to 4383 percent with an average savings of about 28 percent The obtained results are in-conformity with the various research findings wherein fertilizer savings through drip fertigation have been reported in the range of 30-35 percent (Raina et al 2013)The exceptionally low fertilizer savings observed in Bihar are attributed to the fact that more than 90 percent area in Bihar is under sprinkler irrigation
Impact Evaluation Study on ldquoNational Mission on Micro Irrigation (NMMI)rdquo
96
Table 74 Reduction in Fertilizer Consumption
States Fertilizer Consumption(
Kgha) Before MI
Fertilizer Consumption( Kgha)
after MI
saving of Fertilizer
AP 24152 17185 2885 Bihar 18198 16816 759 Chhattisgarh 28872 17219 4036 Gujarat 15893 9103 4273 Haryana 20297 12682 3752 Karnataka 21549 15471 2821 Maharashtra 31005 23887 2296 Odisha 27240 21547 2090 Rajasthan 29523 16582 4383 Sikkim 15860 9380 4086 Tamil Nadu 21147 15421 2708 UP 24220 18704 2277 Uttarakhand 10620 8712 1796 Total 23526 16826 2848
Source GAPL Survey
Figure 10 Reduction in Fertilizer Consumption ()
59 Increase in Crop Productivity
Micro irrigation has generated benefits to the farmers in terms of enhancement of the productivity The average productivity Fruit crops have increased about 423 percent (Table 75) with maximum enhancement in the state of Gujarat followed by Rajasthan which was followed by Chhattisgarh In fact the productivity enhancement in these states was comparable
Impact Evaluation Study on ldquoNational Mission on Micro Irrigation (NMMI)rdquo
97
Table 75 Productivity Enhancement of Fruit Crops (MTha)
State Before MI After MI increase AP 732 874 1937 Bihar 273 315 1518 Chhattisgarh 012 020 6200 Gujarat 515 893 7348 Haryana 586 810 3825 Karnataka 4532 5810 2820 Maharashtra 2166 3232 4918 Odisha 2741 3699 3497 Rajasthan 538 917 7056 Sikkim 543 580 682 Tamil Nadu 2473 2902 1736 UP 710 953 3414 Uttarakhand 585 775 3242 Total 1352 1925 4234
Source GAPL Survey The average productivity of the vegetables has increased by 528 after using the MI irrigation system (Table 76) The states of Chhattisgarh Gujarat and Sikkim registered tremendous increase in vegetable productivity after using micro irrigation system
Table 76 Productivity Enhancement of Vegetable Crops (MTha)
State Before MI After MI increase
AP 991 1329 3409 Bihar 1122 1476 3162 Chhattisgarh 2779 5526 9885 Gujarat 709 1196 6859 Haryana 2066 2523 2213 Karnataka 1109 1430 2900 Maharashtra 348 448 2876 Odisha 1088 1395 2819 Rajasthan 607 846 3942 Sikkim 1894 3157 6662 Tamil Nadu 1137 1437 2640 UP 825 1079 3071 Uttarakhand 317 475 4965 Total 1140 1741 5276
Source GAPL Survey
The data on crop wise productivity enhancement in different states has also been enumerated and explained in the next section
Impact Evaluation Study on ldquoNational Mission on Micro Irrigation (NMMI)rdquo
98
510 Reduction in these Cost of Inputs of Irrigation amp Productivity Enhancement Crop-wise
MI technology is introduced mainly to increase the water use efficiency in agriculture and also provides many other socio-economic benefits in the society The use of MI has led to significant reduction cost of irrigation electricity saving fertilizer saving amp productivity enhancement As per the data collected from the sample beneficiaries significant increase has been observed in terms of reduction in different costs for different crops and enhancing the productivity The same trend is observed in fruits vegetables flowers and other non-horticulture crops The detailed state and crop wise impact percentages of the reduction in irrigation cost electricity savings fertilizer saving and increase in productivity of the sampled beneficiaries are as follows
Table 77 Crop wise Details of Reduction in Cost - Fruits
State Fruit Reduction in Irrigation Cost ( )
Electricity saved ( )
Fertilizer saved ( )
Productivity enhancement ( )
AP
Banana 2987 3660 2833 2089 Guava 1087 2830 2651 3521 Lemon 2839 3339 2676 1708 Mango 2338 3301 3157 3051 Orange 3160 3571 3233 3478
Bihar
Guava 2308 1827 2000 1250 Kadam 1228 2250 1385 1563 Mango 1731 1450 1167 1211 Litchi 2857 1180 1429 1077
Chhattisgarh Banana 2500 2460 1667 5000 Papaya 3889 2850 3333 8750
Gujarat
Banana 4490 4712 3954 4344 Papaya 4692 4000 4565 6235 Pomegranate 4565 2895 4407 4000 Watermelon 5682 5750 4068 5000
Haryana Kinnow 4847 4005 3945 2500 Strawberry 4196 3837 4110 2000 Watermelon 3421 4565 4150 5000
Karnataka
Banana 2769 2030 2743 3380 Mango 2576 3472 2636 2673 Papaya 2836 3622 2907 2441 Pomegranate 2250 2363 3038 3520 Fig 1250 3333 2222 2500 Areca nut 2918 3276 3085 2205
Maharashtra
Banana 3070 3069 3122 5215 Cashew nut 3117 1940 4247 4000 Grapes 3016 2069 2047 7143 Mango 3553 2815 2895 1672 Mousami 4375 2000 2000 8750 Orange 4689 3059 2766 3000 Sweet Orange 3553 3137 2198 3627 Areca nut 1833 3500 5000 3333
Impact Evaluation Study on ldquoNational Mission on Micro Irrigation (NMMI)rdquo
99
Odisha
Aonla 3529 3889 2500 3333 Banana 3577 3391 3124 2447 Cashew nut 2713 3131 3120 3062 Guava 3481 3692 3216 4430 Mango 3576 3551 3027 3039 Papaya 2806 2903 3532 1768 Chikoo 667 2500 4000 1111
Rajasthan
Bel 5714 5000 5714 1550 Guava 1965 4746 4077 5000 Kinnow 5869 4982 4904 4648 Lemon 3052 4519 3560 4118 Mango 3053 4839 3282 6000 Orange 2565 4187 3535 4229
Sikkim Banana 3750 4000 3000 000 Orange 3933 2766 4087 4000 Litchi 5000 2000 4000 000
Tamil Nadu
Aonla 2313 3298 2817 4032 Banana 3684 3495 2607 2990 Cashew nut 3579 3333 2222 3333 Coconut 2882 3511 2714 3333 Mango 2410 3418 2926 2697 Tapioca 3258 3422 2429 3327
UP
Banana 2961 6000 2746 4792 Guava 2555 3636 2350 2147 Mango 2463 3957 2415 3373 Litchi 2753 4167 2717 3393
Uttarakhand
Guava 2167 NA 1638 NA Mango 2281 3636 1633 NA Peach 2293 NA 2855 NA Litchi 2892 3333 2044 NA
Source GAPL Survey
It may be seen from the above table that among the fruit crops highest reduction in irrigation cost was observed in Kinnow crop in Rajasthan amp lowest in guava in AP whereas maximum saving in electricity was observed in Haryana and saving in fertilizer in a Bel in Rajasthan and further highest increase in productivity is witnessed in Papaya in Chhattisgarh
Table 78 Crop wise Details of Reduction in Cost - Vegetables
State Vegetables Name
Reduction in Irrigation Cost ( )
Electricity Saved ( )
Fertilizer saved ( )
Productivity enhancement ( )
AP
Brinjal 2470 3450 2932 1950 Chilli 2104 3213 2662 2580 Okra 1545 3079 3337 2654 Tomato 2100 3458 3280 2837
Bihar
Brinjal 1931 2780 1073 1522 Cauliflower 1850 3244 1415 760 Okra 2188 2250 1283 1671 Potato 2282 4655 1006 1105
Chhattisgarh Cauliflower 3438 3480 4065 7377 Tomato 4420 4750 4580 11454
Impact Evaluation Study on ldquoNational Mission on Micro Irrigation (NMMI)rdquo
100
Bitter Gourd 4934 3690 4746 11081 Okra 4365 4250 4484 8642
Gujarat
Chilli 4532 4341 4393 4708 Fennel 3000 5000 5625 2000 Onion 4983 4792 4094 2435 Potato 4523 4547 3602 3504 Tomato 5102 4620 4245 7962
Haryana
Chilli 4364 4470 3264 5000 Cucumber 5494 6081 3989 4122 Potato 4406 5809 3321 1651 Tomato 4833 5161 3556 5632
Karnataka Chilli 3088 3021 2839 3187 Ginger 2941 3651 2906 2450 Tomato 2275 3218 2971 1870
Maharashtra Brinjal 3041 3870 2604 2195 Chilli 2702 3268 3672 3310 Tomato 2763 3641 2940 3184
Odisha
Bitter Gourd 3629 3660 3024 2826 Bottle Gourd 4040 3435 2700 2916 Brinjal 2979 3164 3084 2804 Cauliflower 3141 3291 2980 2542 Okra 3399 3302 2982 3216 Tomato 2978 3179 3225 3534
Rajasthan
Brinjal 6452 2500 5429 NA Carrot 5718 2965 4789 2097 Onion 3713 3840 3992 3117 Tomato 2950 4526 3520 4619
Sikkim Brinjal 2200 4118 3818 6949 Cauliflower 4500 2000 4250 769 Tomato 3542 3729 4161 6889
Tamil Nadu Brinjal 2930 3264 2973 3407 Chilli 3049 3633 2902 2551 Tomato 2545 3495 3167 2176
UP
Brinjal 2336 4032 2153 2481 Chilli 2473 5000 2052 3130 Peas 2155 3752 3005 3254 Potato 2897 4412 2591 2802 Tomato 2521 3721 2420 2822
Uttarakhand Peas 2572 NA 1672 NA Tomato NA 3333 2018 NA
Source GAPL Survey It may be seen from the above table that among the vegetable crops highest reduction in irrigation cost was observed in brinjal in Rajasthan amp lowest in lady finger in AP whereas maximum saving in electricity was observed in Haryana for cucumber amp potato and saving in fertilizer for fennel in Gujarat and further highest increase in productivity is witnessed in Chhattisgarh for tomato
Impact Evaluation Study on ldquoNational Mission on Micro Irrigation (NMMI)rdquo
101
Table 79 Crop wise Details of Reduction in Cost - Flowers
State Crop Reduction in
Irrigation Cost ( )
Electricity saved( )
Fertilizer saved ( )
Productivity enhancement
( ) AP Lilli 3333 3750 4182 4560 Bihar Marigold 4643 3100 3333 5000
Gujarat Jasmine 5000 6250 3333 3333 Marigold 2000 7500 5556 4200
Haryana Gerbera 6725 8636 3250 3670 Rose 4316 5938 5676 4690
Maharashtra Marigold 3448 3571 2761 4250 Rose 1045 2143 4375 4690
Odisha Rajanigandha 4667 5000 3000 2400 Rajasthan Rose 3611 5000 2970 2500 UP Marigold 2000 3400 2000 2750 Source GAPL Survey It may be seen from the above table that among the flowers highest reduction in irrigation cost amp electricity saving was observed in Gerbera in Haryana whereas saving in fertilizer for rose in Haryana and highest increase in productivity was witnessed in Bihar for marigold
Table 80 Crop wise Details of Reduction in Cost - Non-horticulture Crops
State Non Horticulture Crops
Reduction in Irrigation Cost
( )
Electricity saved( )
Fertilizer saved ( )
Productivity enhancement
( )
AP
Cotton 2820 3524 2354 1770 Ground nut 2924 3828 2136 2274 Maize 1579 3067 3096 2199 Sugarcane 2285 3325 3130 1853
Bihar Maize 1874 1575 1126 1484 Sugarcane 2096 2250 1553 050 Wheat 1721 1860 998 852
Chhattisgarh Gram 2799 1450 2830 2050 Soybean 3978 1635 4356 1805 Wheat 2313 2145 2017 4443
Gujarat
Caster 4617 5172 3757 3580 Cotton 4540 4659 4396 3719 Ground nut 4871 4684 4027 3496 Sugarcane 4875 4865 4216 21611 Wheat 4082 4015 3681 3025
Haryana Cotton 4435 4439 3093 101 Mustard 4167 4286 3611 000 Wheat 4935 4497 3858 212
Karnataka Sugarcane 2771 2568 2723 1264
Maharashtra
Cotton 3370 2928 2991 3475 Ground nut 3355 3333 3312 2587 Soybean 3528 2280 3085 4080 Sugarcane 3712 3815 2848 3877
Odisha Moong 2178 2869 3589 3689 Sugarcane 2624 3309 3201 4849
Rajasthan Arandi 3684 4000 3916 4313
Impact Evaluation Study on ldquoNational Mission on Micro Irrigation (NMMI)rdquo
102
Cotton 5118 3750 4708 2765 Guwar 5605 4375 5250 4889 Mustard 3283 4373 4313 3433 Wheat 3025 3666 3923 3631
Sikkim Mustard 4286 2000 3600 000 Wheat 3333 2759 3600 556
Tamil Nadu Sugarcane 2879 3427 2873 990
UP Maize 2732 4662 2334 470 Sugarcane 2316 2200 3050 2877 Wheat 2538 3776 2484 4116
Uttarakhand Sugarcane 2562 2385 2088 2950 Source GAPL Survey It may be seen from the table 77 that among the non-horticulture crops also reduction in irrigation cost saving in electricity saving in fertilizer and increase in productivity was witnessed From the above it may be concluded that with the adoption of micro irrigation technologies significant increase has been observed in productivity enhancement in all the states for all the major crops being cultivated under the scheme Further reduction in input factors such as irrigation cost saving in electricity amp saving in fertilizer was also observed 511 Introduction of New Crops During the course of the study and field survey it was observed that the beneficiaries have switched to new crops mostly high value as enlisted in table 82 below with the adoption of micro irrigation technology In the fruit crops high density plantations having drip irrigation system have been adopted by some of the farmers
Table 81 Crops Adopted after Installation of MI System
Fruits Aonla Areca nut Banana Cashew nut Sapota Coconut Grapes Guava Litchi Mango Mosambi Orange Papaya Pineapple Pomegranate Strawberry Sweet orange watermelon
Vegetables Broccoli Bitter gourd Bottle gourd Brinjal Cabbage Capsicum Cauliflower Cucumber Chilli Ginger Okra Onion Spinach Papaya Potato Radish Tomato
Floricultural Marigold Tuberose (Rajnigandha) Rose Lilly
Other crop Cotton Groundnut Sunflower Turmeric Arhar Black gram Maize Moong Mustard Pulses Soyabean Sugarcane Urad Wheat
Impact Evaluation Study on ldquoNational Mission on Micro Irrigation (NMMI)rdquo
103
Table 82 Extent of Adoption of New Crops after Installation of MI System
State Total
Beneficiary No of Farmers
Introduced New Crops Farmers
Introduced New Crop () AP 672 278 4137 Bihar 516 8 155 Chhattisgarh 384 206 5365 Gujarat 576 67 1163 Haryana 320 315 9844 Karnataka 576 154 2674 Maharashtra 672 126 1875 Odisha 480 221 4604 Rajasthan 574 3 052 Sikkim 50 26 5200 Tamil Nadu 455 53 1165 UP 527 330 6262 Uttarakhand 90 2 222 Total 5892 1789 3036
Figure 11 Extent of Adoption of New Crops by Beneficiaries ()
It may be seen from the above table that almost all the beneficiaries of Haryana have shifted towards new crops with the adoption MI system followed by UP Sikkim Chhattisgarh Odisha and AP The lowest response was observed in Rajasthan Bihar and Uttarakhand which is due to the fact that MI systems in majority of the cases have been installed to irrigate horticultural crops
It is therefore recommended that special drives be taken to motivate the farmers in the state of Bihar Uttarakhand amp Rajasthan for crop diversification to accrue the full advantage of MI system
Impact Evaluation Study on ldquoNational Mission on Micro Irrigation (NMMI)rdquo
104
512 Increase in Farmerrsquos Income
The overall benefits accrued from the micro irrigation system are reflected in the income enhancement of the farmers All the surveyed states reported increase in farmerrsquos income by 20- 68 with an average increase of 485 The maximum increase in income has been reported in Gujarat followed by Chhattisgarh
Table 83 Increase in Farmerrsquos Income
State Income ( Rs ha)
before MI Income ( Rs ha)
after MI
Increase
in Income AP 60273 79929 3261 Bihar 31132 41333 3277 Chhattisgarh 62785 105059 6733 Gujarat 55703 93593 6802 Haryana 73917 117532 5901 Karnataka 82303 105061 2765 Maharashtra 68459 99786 4576 Odisha 61846 85660 3850 Rajasthan 125753 191731 5247 Sikkim 81510 111891 3727 Tamil Nadu 74100 98800 3333 UP 58495 87391 4940 Uttarakhand 140098 168234 2008 Total 976374 1386001 4195
Source GAPL Survey
Figure 12 Increase in the Income of Beneficiaries ()
Impact Evaluation Study on ldquoNational Mission on Micro Irrigation (NMMI)rdquo
105
513 Benefit-Cost Ratio The BC ratio has been based on the estimates of incremental return income from MI system that is taken into account the increase in individual farmerrsquos income and MI system cost and crop wise average increase in income and average MI cost for each state were worked out from the same MI system cost has been amortized equally for 10 years considering the economic life of the system for the same period The income enhancement of the beneficiary farmers after installation of the MI system has been attributed to MI system The Benefit-cost analysis was carried out for important crops in all the 13 states under study on the basis of data collected from sampled beneficiaries This ratio gives the estimates of returns on the investment made in MI system Performance in term of BC ratio varies from state to state even for the same crop due to varied reasons like agro-climatic conditions agronomic practices soil productivity system cost marketing of produce etc the BC ratio of installing micro irrigation system is above one across the states and across the crops which signifies the importance of MI system in net income enhancement of the farmers The state wise BC ratio of installing MI system for different crops is given in the table for important fruits vegetables amp flowers grown in the states under study
Impact Evaluation Study on ldquoNational Mission on Micro Irrigation (NMMI)rdquo
106
Table 84 Benefit Cost Ratio of MI System for Important Fruit Crops
Fruits AP Bihar Chhattisgarh Gujarat Haryana Karnataka Maharashtra Odisha Rajasthan Sikkim Tamil Nadu UP Uttarakhand Aonla - - - - - - - - 269 - 294 234 - Areca nut - - - - - 259 221 - - - - - - Banana 266 - 266 187 - 277 291 182 - 272 290 276 - Bel - - - - - - - - 209 - - - - Blackberry - 171 - - - - - - - - - - - Carrot - - - - - - - - - - 291 - - Cashew nut - - - - - - 270 259 - - 264 - - Coconut 226 - - - - 263 244 272 - - 251 - - Cucumber - - - - 206 131 - - - - - - - Custard Apple - - - - - 219 - - - - - - - Fig - - - - - 266 - - - - - - - Grapes - - - - - 258 293 - - - - - - Guava 242 297 - 269 212 204 294 256 229 294 - 286 276 Kadam - 121 - - - - - - - - - - - Kinnow - - - - 284 - - - 231 - - - - Lemon 267 - - 280 - 288 148 298 231 - 209 236 - Litchi - 111 - - - - - 252 - 267 - 272 227 Mango 284 226 - 292 - 257 265 245 273 - 275 295 287 Musk Melon - - - - 227 - - - - - - - - Oil Palm 229 - - - - - - 278 - - - - - Orange 240 - - - - - 215 - 287 280 - - - Papaya 133 125 242 - - 279 234 268 - - 230 274 - Peach - - - - - - - - - - - - 219 Pineapple - - - - - - 241 298 - - - - - Pomegranate 234 - - 242 - 209 266 231 297 - - - - Sapota - - - - - 294 - 299 - - 245 - - Strawberry - - - - 119 - - - - - - 297 - Tapioca - - - - - - - - - - 223 - - Water Melon - - 257 211 221 288 267 298 - - - - - Source GAPL Survey
Impact Evaluation Study on ldquoNational Mission on Micro Irrigation (NMMI)rdquo
107
Table 85 Benefit Cost Ratio of MI System for Important Vegetable Crops
Vegetable AP Bihar Chhattisgarh Gujarat Haryana Karnataka Maharashtra Odisha Rajasthan Sikkim Tamil Nadu UP Uttarakhand Alovera 145 - - - - - - - - - - - Arabi - - - - - - 178 - - - - - Bitter Gourd 200 268 214 295 - - 239 - - 286 258 - Boda 112 251 - - - - - - - - - - Bottle Gourd 124 190 234 239 - - 267 133 - - 257 - Brinjal 215 218 144 145 185 215 298 238 230 257 166 257 - Broccoli - - 017 - - - - - - - - - Cabbage - 274 217 - - 250 218 - 167 275 222 - Capsicum 262 262 - 274 - - 161 - - - 229 - Carrot - - - 206 - - - 251 - - - - Cauliflower 117 - - 288 268 - 256 229 229 285 274 - Chilli 156 172 210 265 258 233 273 228 179 259 181 282 - Cucumber - 162 - 132 198 - 149 222 - - - - Fennel - - 281 - - - - - - - - - Garlic - - - 069 - - - 246 - - - - Ginger 220 - - - - 236 - 226 - - - - - Kundru - 125 - - - - - - - - - - Okra 170 219 238 189 174 281 271 287 - 225 232 279 - Lemon - - - - - - 224 - - - - - Methi - - - 190 - - - - - - - - Onion - 236 176 210 - 270 293 239 - 251 193 - Palak - - - - - - - - - - 183 - Pointed Gourd - - 182 - - - - - - - - - Peas - - - 197 - 236 298 - - - 235 269 Potato 182 248 260 226 270 233 - 261 282 - 158 286 - Pumpkin 135 146 013 - - - - 182 - 159 - - Radish - - - - - - - - - - 238 - Cluster Bean - 174 - - - - - - - - - - Round Guard - - - 254 - - - - - - - - Tomato 252 265 242 200 230 208 294 214 294 238 232 278 Sponge Guard - 137 - - - - - 274 - - - - Turmeric 179 - - - - - - - - - - - SourceGAPLSurvey
Impact Evaluation Study on ldquoNational Mission on Micro Irrigation (NMMI)rdquo
108
Table 86 Benefit Cost Ratio of MI System for Important Floriculture Crops
State Flower Name BC Ratio AP Lilli 121 Bihar Marigold 218
Gujarat Jasmine 272 Marigold 167
Haryana Gerbera 292 Rose 141
Karnataka Marigold 225 Rose 160
Odisha Rajnigandha 255 Rajasthan Rose 294 UP Marigold 276 Uttarakhand Gladiolus 272
Performance in terms of BC ratio varies from state to state and crop to crop Thus it may be concluded that these analysis confirm that the farmers are getting higher income with the adoption of MI technology 514 Increase in Area The irrigated area has increased in all the surveyed states after the introduction of NMMI Scheme Irrigated area has been increased by 841 for total surveyed farmers in the given states The state of Maharashtra has topped the list with 2228 growth in irrigated area followed by Chhattisgarh There has been very little growth in case of Sikkim UP Uttarakhand amp Karnataka
Table 87 Percent Increase in Irrigated Area on Installation of MI System
State Irrigated Area (Ha) Percent
Increase in Irrigated
Area Before MI After MI
AP 101302 113895 1243 Bihar 129482 140935 885 Chhattisgarh 49454 57172 1561 Gujarat 135837 154944 1407 Haryana 123318 136208 1045 Karnataka 103763 106449 259 Maharashtra 102510 125349 2228 Odisha 124139 138254 1137 Rajasthan 100536 107806 723 Sikkim 6038 6079 067 Tamil Nadu 70928 74086 445 UP 158306 160350 129 Uttarakhand 25852 26265 160
Impact Evaluation Study on ldquoNational Mission on Micro Irrigation (NMMI)rdquo
109
515 Potential area that can be brought under Micro Irrigation The potential for Micro Irrigation for each surveyed district has been worked out on the basis of field survey and secondary information
The following information has been taken account to work out MI potential from Secondary sources
A Total Irrigated area B Paddy area C Area under MI
Total Potential area has been worked out by subtracting the area under MI and Paddy from total irrigated area of the district considering that paddy area has no potential for the MI system This potential area has been depicted as percentage of total irrigated area The district wise potential for MI as well as the crop potential is given in the table below
Table 88 District wise Potential for Installation of MI System in Study Area
State District
Area Based on Secondary Data Potential Crops Under MI
Irrigated Area
(ldquo000 ha)
Area under MI (ldquo000 ha)
MI Potential
Area (ldquo000 ha)
MI Potential Area ()
Fruits Vegetables Other Crops
AP
Adilabad 10152 2544 7608 7494
Mango Citrus and Banana
Brinjal Chilli Tomato and Okra
Maize Sugarcane Cotton and Ground Nut
Anantpur 24721 12773 11948 4833 Krishna 18067 1572 16495 9130 Medak 9955 4946 5009 5031 Nalgonda 27570 7180 20390 7396 Nellore 8464 2158 6306 7450 Vishakhapatnam 22077 825 21252 9627
Bihar
Gaya 4979 253 4726 9492 Mango Kadam and Litchi
Okra Potato Cauliflower and Brinjal
Sugarcane Wheat and Maize
Madhepura 48788 095 48693 9980 Rohtas 8601 339 8262 9605 W Champaran 6238 542 5696 9131
Chhattisgarh
Durg 7750 2768 4982 6428 Banana Papaya and Watermelon
Cauliflower Tomato Bitter Gourd and Okra
Wheat Gram and Soybean
Jashpur 1109 068 1041 9387 Kanker 1377 1222 155 1130
Sarguja 1194 303 891 7462
Gujarat
Anand 10410 238 10172 9771 Banana Papaya Pomegranate and Watermelon
Chilli Tomato Onion Potato and Fennel
Cotton Sugarcane Wheat Groundnut and Caster
Banaskantha 39630 8150 31480 7943 Bharuch 9264 1073 8191 8842 Bhavnagar 16880 2788 14093 8349 Jamnagar 8330 1728 6602 7926 Mehsana 19698 624 19074 9683
Haryana
Bhiwani 24937 2429 22508 9026 Kinnow Lemon Watermelon and Muskmelon
Tomato Cucumber and Potato
Cotton and Wheat
Fatehabad 11443 110 11333 9904 Karnal 12960 086 12874 9934
Sirsa 14587 631 13956 9567
Karnataka Belgaum 45594 4394 41200 9036 Banana Areca Tomato Pepper and
Impact Evaluation Study on ldquoNational Mission on Micro Irrigation (NMMI)rdquo
110
Bellary 7348 397 6951 9459 nut Pomegranate Mango and Papaya
Chilli and Ginger
Turmeric Bidar 5873 2322 3551 6046 Chitradurga 2243 2963 1520 6788 Hassan 8661 1175 7486 8643 Mysore 13194 1376 11818 8957
Maharashtra
Ahemadnagar 26000 3049 22951 8827
Banana Mango Citrus and Grapes
Tomato Chilli and Brinjal
Cotton Sugarcane and Soybean
Jalgaon 23909 7611 16298 6817 Jalna 7850 2660 5180 6611 Kolhapur 27500 453 27047 9835 Ratnagiri 1500 111 1389 9262 Wardha 1630 1630 810 4971
Odisha
Bhadrak 2775 104 2671 9625 Mango Banana Cashew nut and Papaya
Tomato Brinjal Okra Bottle gourd and Cauliflower
Moong and Sugarcane
Ganjam 3600 299 3301 9168 Mayurbhanj 4105 553 3552 8654 Nayagarh 2966 164 2802 9447 Boudh NA 201 NA NA
Rajasthan
Hanumangarh 31071 1505 29566 9516 Orange Kinnow Mango Bel Guava and Lemon
Onion Carrot and Tomato
Cotton Arandi Guar Mustard and Wheat
Jalore 29081 11897 17184 5909 Jhalawar 23349 1569 21780 9328 Jodhpur 31000 5712 25288 8157 S Madhopur 19448 676 18772 9652 Udaipur 7139 580 6559 9187
Sikkim
East Gangtok 697 NA
NA NA Orange and Guava
Tomato Brinjal Cauliflower and Barackoli
Wheat Mustard and Turmeric Mangaon 135
NA NA NA
Tamil Nadu
Erode 13195 1090 12105 9174 Banana Tapioca Coconut Aonla and Carrot
Chili Brinjal Tomato Potato Carrot and Turmeric
Sunflower
Nilgiri 650 213 437 6729 Thiruvarur 6036 094 5942 9844 Tirunelveli 6429 299 6130 9534
Villupuram 14167 550 13617 9611
UP
Aligarh 16441 005 16436 9997
Banana Mango and Guava
Tomato Potato Chilli Peas Brinjal and Arbi
Maize and Wheat
Ballia 11578 025 11553 9979 Jhansi 17920 099 17821 9944 Kannauj 13016 019 12997 9985 Saharanpur 21567 078 21489 9964 Siddharth Nagar 10212 038 10174 9963
Uttarakhand
Udhamsingh Nagar 15330 NA - - Mango Peach Litchi and Guava
Peas and Tomato Haridwar 6088 NA - -
Nainital 3780 NA - -
Source Data Portal India and GAPL Field Survey Analysis
516 Employment Opportunities
The NMMI has helped to widen the food basket of the country with significant contributions coming from the bringing more area under irrigation and with judicious use of water New farm practices and innovations with support of government have encouraged the farmers to shift toward high value a crop which in turn gives better income and more employment opportunities
Impact Evaluation Study on ldquoNational Mission on Micro Irrigation (NMMI)rdquo
111
5161 On Farm Employment Generation Following are the sectors of on farm employment opportunities for farmers and related stakeholders being generated through implementation of NMMI
Higher production requires more man days for operations like harvesting on farm handling and logistics
Soil water quality and inputs testing laboratory service center Plant protection service center (Pest surveillance diagnostic and control services
including Integrated Pest Management) Maintenance repairs and custom hiring of agricultural implements and machinery
including micro irrigation systems (sprinkler and drip) Agri Service Centre includes at least the above three activities (Group Activity)
5162 Off-Farm Employment Generation
With the initiation of National Mission on Micro Irrigation (NMMI) not only the farm employment has increased but it has generated lot of off-farm opportunities which would further give more employment in the future This initiative also aims at farm mechanization which not only includes tractors and its implements but also use of other components such as pumps micro irrigation etc An attempt has been made in this section to estimate the additional employment generated from various initiatives available under mission Apart from this indirect labors for the logistic service are also generated to accomplish the above mentioned activities Each of the suppliers has 5-7 skilled and semi-skilled employees to support in installation of the system training after sales service etc Services of casual labor are also hired during the time of installing the system which results in indirect opportunities 517 Impact on Employment The implementation of NMMI scheme in the different states generated employment opportunities mainly due to increase in production which requires more of the man days as well as post handling operations micro irrigation resulted in considerable savings of labor as is evident from the data cited in table 93 This is true for pre-harvest practices The increased yield due to MI systems called for involvement of more labor for handling the harvesting and post-harvest operations
The basis for computing the manpower involved before and after installation of MI system related primarily to application of irrigations hoeing weeding fertilizer insecticide pesticide applications harvesting threshing assembling cleaning grading packaging transportation logistics etc It may be seen from the above table that in all the states under study have shown decrease in utilization of the labor in pre-harvest practices that is labor saving on irrigation weeding fertilization and other operations It shows that the use of
Impact Evaluation Study on ldquoNational Mission on Micro Irrigation (NMMI)rdquo
112
human labor after the use of micro irrigation has decrease significantly and ranges between 741 to 1875 percent
The employment generations through adoption of micro irrigation in the farms by the farmers before the adoption of the MI and after the installation and results have been presented in the following table below
Table 89 Change in Manpower Requirement for Cultivation (per ha per crop cycle)
State Pre harvest practices Harvesting Post-harvest handling Total Man dayscrops No of man days
before NMMI
No of man days after
NMMI
Change in man Power
()
No of man days
before NMMI
No of man days after
NMMI
Change in man Power
()
No of man days
before NMMI
No of man days after
NMMI
Change in man Power
()
No of man days
before NMMI
No of man days after
NMMI
Change in man Power
() AP 49 41 -1633 36 42 1667 16 19 1875 101 102 099 Bihar 52 45 -1346 29 35 2069 13 16 2308 94 96 213 Chhattisgarh 59 50 -1525 31 36 1613 20 24 2000 110 110 000 Gujarat 48 39 -1875 35 41 1714 20 24 2000 103 104 097 Haryana 40 35 -1250 30 35 1667 16 21 3125 86 91 581 Karnataka 48 42 -1250 34 40 1765 19 23 2105 101 105 396 Maharashtra 58 52 -1034 33 39 1818 23 29 2609 114 120 526 Odisha 46 41 -1087 32 37 1563 18 19 556 96 97 104 Rajasthan 58 53 -862 25 33 3200 18 20 1111 101 106 495 Sikkim 54 50 -741 29 33 1379 19 24 2632 102 107 490 Tamil Nadu 50 44 -1200 27 32 1852 21 23 952 98 99 102 UP 55 46 -1636 25 32 2800 20 24 2000 100 102 200 Uttarakhand 47 41 -1277 29 36 2414 23 29 2609 99 106 707
The table further reveals that in post-harvest operations right from harvesting to handling and disposal of the produce there is an increase in labor utilization and it ranges between 2119 to 5023 percent From here it may be concluded that the decrease in utilization of the labor in the pre harvest activities are offset by the increase in the production which requires more of the labor for harvesting assembling and grading handling transportation and disposal of the produce
Impact Evaluation Study on ldquoNational Mission on Micro Irrigation (NMMI)rdquo
113
6 Conclusions amp Recommendations Micro irrigation technologies are being promoted in India by the central and state governments by providing different kinds of financial institutional and technical support These technologies are promoted primarily because of (1) as a means to save water in irrigated agriculture (2) as a strategy to increase income and reduce poverty and (3) to enhance the food and nutritional security of rural households Despite the reported significant economic advantages and the concerted support of the government and NGOs the current micro irrigation area in India remains an insignificant proportion of its potential Rising demand for irrigation water in the face of its inefficient use amid concerns of growing water scarcity has brought into renewed focus the need for conserving water and improving water use efficiency
The real thrust on promoting MI adoption largely started with the recommendations of the Report of the Task Force on Micro Irrigation in 2004Their report sought to increase the emphasis on MI technology and recommended a broader framework viewing MI technologies as a part of the overall water management strategy It also recommended that more financial resources for subsidies with state governments taking up 10 percent of the cost while the central funds would account for 40 percent and advised greater flexibility for states to determine their appropriate implementation structure and institutional mechanisms for subsidy disbursement (Ministry of Agriculture 2004) Based on these recommendations in 2006 the Centrally Sponsored Scheme (CSS) on MI was launched The `National Mission on Micro Irrigationrsquo (NMMI) in 2010 revising and reformulating the Centrally Sponsored Scheme (CSS) on Micro-Irrigation which was introduced
In this study an attempt is made to study the Impact Evaluation of micro irrigation in 13 states of India by using the available information and field surveys of 7400 respondents inclusive of both adopters and non-adopters
Owing to promotional schemes introduced by the state and central governments the area under micro irrigation has increased from 11817 ha in 2005-06 to over 361 million ha in 2012-13 In spite of having many advantages over conventional method of irrigation the area under micro-irrigation presently occupies only about 571 percent of the total irrigated area As per the latest information only 285 percent of total irrigated area under drip irrigation and 286 percent is under sprinkler irrigation
Government of India Ministry of Agriculture Department of Agriculture and Cooperation assigned the study on ldquoImpact Evaluation of National Mission on Micro Irrigationrdquo (NMMI) scheme to access the performance of the programme implementation and access the impact of this scheme on increase in farmersrsquo income through adoption of the MI system The study was conducted in 13 states comprising of 64 districts from the sampled states namely AP Bihar Chhattisgarh Gujarat Haryana Karnataka Maharashtra Odisha
Impact Evaluation Study on ldquoNational Mission on Micro Irrigation (NMMI)rdquo
114
Rajasthan Tamil Nadu Uttar Pradesh Sikkim and Uttarakhand The field survey to get the first hand information was conducted for a total sample of 7400 comprising beneficiary and non-beneficiary farmers in these selected states through adopting stratifiedndashpurposive-sampling design Apart from this information was also collected from system suppliers government officials
Major Outcomes of the Study
A Current Status i The Scheme since its inception in 2005-06 has made rapid stride across the
country It has succeeded in bringing about 356 million ha area under micro irrigation in the sampled 13 states7 The physical targets for the period 2005-06 to 2012-13 were fixed to the extent of 383 million ha out of which 356 million ha has been brought under MI The Targets and achievements for financial outlay were Rs50128 and Rs50065 crores respectively The overall physical and financial achievements thus come out to be 9299 amp 9987 percent The extent of achievements however varied among different states States like Bihar Karnataka Odisha Rajasthan and Sikkim achieved more than 90 percent of the set physical targets Uttarakhand could achieve only 21 percent of physical and 31 percent of the financial targets Other States such as AP Chhattisgarh Gujarat Haryana Maharashtra and Tamil Nadu succeeded to achieve more than 70 of their physical targets
ii AP Gujarat amp Maharashtra are leading states in the every aspect of performance the different activities involved in the process streamlined in the guideline of NMMI While Bihar UP Sikkim amp Uttarakhand states are lacking in terms of the functions mentioned in the guidelines
B Pattern of Assistance
i Most of the states are giving subsidy of more than 70 percent for installation of
MI system However comparison of various states and analysis clearly demonstrates that increased subsidy had no significant impact on the increase of area coverage under MI system Farmers in Maharashtra Gujarat and Haryana were 223 140 and 100 percent respectively in case of sampled beneficiaries while pertinent subsidy component in these states was 60 50 and 90 percent respectively Similarly area coverage in Rajasthan Tamil Nadu and Bihar was noted to be 73 45 and 31 percent respectively and the corresponding figures
7 Ministry of Agriculture
Impact Evaluation Study on ldquoNational Mission on Micro Irrigation (NMMI)rdquo
115
for subsidy were 90 75 and 90 percent The aforesaid observation clearly suggests that increase in subsidy component beyond a limit has little or no impact on area coverage under MI system The relationship between area expansion under MI and quantum of subsidy has been computed considering beneficiariesrsquo data on area expansion in different states before and after adoption of MI system Hence the relationship of subsidies with area expansion as such does not refer to any specific year
ii The efficiency of scheme implementing agency is very high as most of the farmers have reported that their applications are processed and sanctioned in less than 40 days as against 60 days specified in the guidelines Similarly in most of the sample states beneficiaries are reported to be satisfied with respect to the procedure for filing the application till disbursement of the subsidy amount
iii Presently subsidy is limited to maximum area of 5 hectare per beneficiaries which is an impediment to the growth of area under micro-irrigation The data on size and distribution of operational land holdings in the country also suggest that medium and large farmers accounted about 15 percent of total land holdings thus occupying approximately 5542 percent of the total area
iv All the states have reported convergence of Mission interventions with different schemes of the Government of India and State level programmes Most of the districts have converged NFSM interventions with programmes such as RKVY ICDP Farm Mechanization NHM and other programmes
C Sources of Awareness and Reasons of Non-adoption i The major sources of awareness about the NMMI scheme were through service
providers suppliers followed by fellow farmers extension workers
ii The non-beneficiaries farmers had mix responses for not adopting the scheme because of lack of awareness regarding subsidies lack of technical knowledge high capital cost and system being not economical therefore not required
iii As per primary survey of the sampled beneficiaries about 59 percent of the respondents were small amp marginal farmers and 13 percent were women farmers who have taken the advantage of the Scheme
Impact Evaluation Study on ldquoNational Mission on Micro Irrigation (NMMI)rdquo
116
D System Cost and Sources of Fund i On an average the cost of system per hectare incurred by the beneficiaries
ranged between Rs 5445736 to Rs 7208631 in drip system and Rs 20481 to Rs 28171 in sprinkler irrigation system depending on the cropping pattern crop spacing etc in the states under study
ii Almost in all states farmer beneficiaries use their own funds for contributing margin money (9866) Other sources albeit a small proportion constitutes banking KCC amp money lenders
iii Most of the farmers borrowed money at less than 10 percent of rate of interest from banks and KCCs
E Technical Observations about MI System i It was observed that about 64 percent of the beneficiaries installed drip system
34 percent sprinkler system and 2 percent have installed both the systems in their fields The highest proportion of drip was observed in Karnataka whereas adoption of sprinkler was higher in Bihar
ii The majority of the beneficiaries (about 6887) farmers of all the 13 states have got their soil and water tested In Gujarat UP Maharashtra amp Rajasthan soil testing adopted by 6927 5275 7337 and 7913 of respondents respectively
iii More than 70 percent of the respondent farmers of AP Gujarat Sikkim and Odisha were using in-line drip irrigation system whereas more than forty five percent beneficiaries of Haryana and Uttarakhand reported to practice on-line drip irrigation system
iv The farmers were using screen filters centrifugal separators hydro-cyclone filter disc filter sand media filters depending on the need The data reveals that screen filters are being commonly used by the beneficiaries in most of the sampled states except Haryana where more than 65 percent beneficiaries are using hydro-cyclone and screen filters in combination due to the water quality as they are using canal water
v There is an increasing emphasis on conserving water and using it more efficiently Micro irrigation technologies based on drip and sprinkler irrigation systems provide some hope for achieving this The government has been
Impact Evaluation Study on ldquoNational Mission on Micro Irrigation (NMMI)rdquo
117
providing substantial financial incentives in the form of capital cost subsidies to farmers to invest in these technologies Most drip equipment sales in the study areas are subsidy driven Manufacturers and market estimates suggest that most of the MI system sales are subsidy linked Partly as a result of the existing subsidy delivery mechanism drip technology has failed to capture the kind of market that would have been expected given the many advantages and water saving potential the technology offers
vi The farmers in almost all the states reported that components of MI System met the BIS norms The average figure for all the sampled states where system components were as per the BIS norms came out to be around 98 percent
vii As far as overall designing of the system is concerned it was found that the systems were well designed except in case of Sikkim and Odisha where the systems were functional but not able to meet the farmers expectation It is therefore suggested that extensive involvement of the extension staff may be ensured to install the system as per requirement of ground conditions and once the system is installed regular monitoring particularly during the warranty period of the installation be carried out so that defects if any be got rectified by the suppliers
F After Sales Service
i On an average 91 of the beneficiaries across the sampled states reported that
after sales services are being provided to them amp also they receive the services at the required time Most of the sampled beneficiaries revealed that they are getting warranty of the MI system
ii In almost all the states the sampled beneficiaries revealed that no technical support guidance on agronomic practices are extended to the users as they generally tell to take the help of extension agencies
G Impact Analysis i The irrigated area has increased in all the surveyed states after the introduction
of NMMI Scheme The Irrigated area within the 5892 sampled beneficiaries of the 13 states before adoption of MI system was found to be 1332086 ha which became 1444147 ha after adoption of MI system It is therefore concluded that total percentage increase in irrigated area with the sampled beneficiaries in 13 states after adoption of MI system was noted to be 841 from same source of water Maharashtra has topped the list with 2228 growth in irrigated area
Impact Evaluation Study on ldquoNational Mission on Micro Irrigation (NMMI)rdquo
118
ii Farmers of all the states have shown an increase in area under horticulture crops after the adoption of the system The cropped area after implementation of NMMI has shown an increase which may be due to utilization of degraded marginal land into cultivable land amp increase in cropping intensity
iii Scheme has performed well in terms of reduction in irrigation cost and significant cost saving has been observed for irrigation in all the surveyed states Irrigation cost is reduced by 20-50 with average of 323 Reduction in electricity consumption after installation of MI system Average electricity consumption has been reduced by about 31 after using the micro irrigation system Saving of fertilizers with averages reduction of about 28 in total fertilizer consumption in the surveyed states Fertilizer saving vary from 7- 42
iv Micro irrigation has generated benefits to the farmers in terms of enhancement of the productivity The average productivity of fruits and vegetables has increased about 423 and 528 respectively
v The overall benefits accrued from the micro irrigation system are reflected in the income enhancement of the farmers All the surveyed states reported increase in farmerrsquos income in the range of 20 to 68 with an average increase of 485
vi Given the high benefit-cost ratios which is more than one in almost all crops and states we also find that the present form for delivery of public support in the nature of a capital cost subsidy is constraining both to the widespread adoption of the technology by farmers and to innovation in technology development and marketing This has made the entire gamut of manufacturing sales adoption and use of drip technology subservient to government support The present study has put forward an alternate system wherein the subsidy is given directly to farmers willing to invest in a drip system With a given amount of funds available the proposed model can provide subsidies to a much larger number of farmers can bring a much larger area under drip irrigation resulting in lower subsidy outgo per hectare of drip irrigated area would still incentivise the farmers to invest in drip systems lower the cost of subsidy outgo easy to manage and govern less prone to interference and whims and fancies of officials and lead to more efficient use of available subsidy without distorting the market Thus on all indicators the proposed subsidy scheme of direct delivery far outweighs the existing subsidy scheme of subsidizing the manufacturers in the name of the farmersBC ratio of installing micro irrigation system is above one across the states and across the crops which signifies the importance of MI system in net income enhancement of the farmers The BC ratio was observed to
Impact Evaluation Study on ldquoNational Mission on Micro Irrigation (NMMI)rdquo
119
be highest in Odisha among fruits amp vegetables whereas in flowers Rajasthan amp Haryana beneficiary farmers achieved higher BC ratio
vii The positive outcomes have made the food security effective due to the increase in the production and productivity of different crops and increased area under irrigation from same source of water Area under horticulture crops as well as nutritional security has also enhanced
viii The NMMI has helped to widen the food basket of the country with significant contributions coming from the bringing more area under irrigation and with judicious use of water New farm practices and innovations with support of government have encouraged the farmers to shift toward crops giving higher income
H Employment Generation i Beneficiaries of all the states under study have shown decrease in utilization of
the labor in pre-harvest practices that is labor saving on irrigation weeding fertilization and other operations It shows that the use of human labor after the use of micro irrigation has decreased significantly and ranges between 741 to 1875 percent But in post-harvest operations right from harvesting to handling and disposal of the produce there is an increase in labor utilization and it ranges between 2119 to 5023 percent due to the increase in the production which requires more of the labor for harvesting assembling and grading handling transportation and disposal of the produce
I Training and Capacity Building i Among the surveyed states more than 90 percent of the sampled beneficiary
farmers in the state of Haryana Karnataka Sikkim amp Tamil Nadu had training on different aspects of MI System whereas farmers of Bihar amp Odisha only 20 amp 52 percent of the beneficiaries have received the training
ii Results of survey revealed that the system suppliers manufacturers are the major sources for imparting training as more than 90 percent of the farmers received training from them Very less proportion of the respondents reported to have training from other sources such as SAUs KVKs etc The participant beneficiaries revealed that the duration of training period generally was of 1-2 days Almost all the respondents of Tamil Nadu UP Chhattisgarh Haryana were given training materials during the training while few beneficiaries of the Bihar and Uttarakhand Karnataka were provided such training materials
Impact Evaluation Study on ldquoNational Mission on Micro Irrigation (NMMI)rdquo
120
iii Key areas for training were operation and maintenance of the system adoption
of package practices under MI and opportunities for introducing new crops Demonstration was other means of motivation and capacity building It was also found to be a good means of promotion
J Promotional Activities
i The farmers of the majority of the states acknowledged that the implementing
agencies are promoting NMMI schemes in local language however were not aware of the dedicated website for MI scheme in their state It is due to the fact that farmers do not have access or willingness to use internet for information gathering
ii On farm demonstrations particularly in rural area where exposure is limited are very important means in educating the rural folks It was noted that maximum beneficiaries of Haryana (98) followed by Sikkim (80) Rajasthan (64) and Uttarakhand (63) have visited the demonstration laid out in the nearby areas Whereas majority of the farmers of AP UP TN Karnataka Gujarat Bihar have reported that they have not visited any demonstration farm It is therefore suggested that more efforts may be put to expose the farmers regarding demonstration of MI system and its benefits
Thus it may be concluded that positive outcomes in terms of crop productivity enhancement due to implementation of MI Scheme have contributed significantly to the food requirements The NMMI has helped to widen the food basket of the country with significant contributions coming for bringing more area under irrigation and with judicious use of water New farm practices and innovations with support of government have encouraged the farmers to shift forward crop giving higher income
It is noteworthy that the incremental net returns were observed to be generally higher for cash crops such as fruits vegetables ground nut cotton etc than for food crops viz bajra and wheat This is in conformation with the results of research studies
Key Recommendations and Policy Implications
For the food security and sustainability to match the growing population priorities are to bring more area under irrigation through judicious use of irrigation water Keeping this aspect in view the Government of India launched the Central Sponsored Scheme for Micro Irrigation in 2005-06 which was up scaled as National Mission on Micro Irrigation in 2010 Micro irrigation system being capital intensive in nature and the adoption cannot be increased without providing subsidy Subsidy can be a necessary condition for encouraging the adoption of micro-irrigation but cannot be a sufficient condition for sustaining the
Impact Evaluation Study on ldquoNational Mission on Micro Irrigation (NMMI)rdquo
121
growth of it as many other factors determine the adoption of the same Even though subsidy is not needed to enhance the economic viability of the system it is still needed to enhance the incentive for the widespread adoption of MI particularly among the resource poor farmers (marginal and small categories) Therefore there is a need to find out the ways and means to convince the farmers about the economic and social feasibility of micro-irrigation Since it involves relatively higher amount of fixed investment farmers often ask the questions regarding the payback period viability water saving and the productivity gains It appears that these questions arise mainly because of poor exposure about the social and economic advantages of the technology Thus efforts are needed to convince the farmers through quality extension network as Indiarsquos highly successful green revolution was also the result of extension innovations as much as technology Considering the fast decline of irrigation potential and competing demand for water from different sectors all possible efforts are needed to increase the adoption of water saving technologies so as to avoid water scarcity in the future
Given the vast potential benefits of micro-irrigation and fast decline of availability of water for irrigation in the country a number of technical and policy interventions are required to be introduced so as to increase the adoption of micro-irrigation in India The needed recommendations and interventions are presented below
A Scheme Related 1) The rate of subsidy provided under NMMI through central government is fixed
uniformly for different categories of farmer with a limit of 5 hectare This needs to be restructured as about 15 of the large and medium farmersrsquo accounts for more than 5542 of the land in India Therefore this limit of five hectares needs to be enhanced for extending the subsidy
2) States often compete with each other to increase the subsidy component However it has been noted that higher subsidy does not necessarily lead to more area coverage under MI system as the highest increase in area under MI has been achieved by states which offer subsidy in the range of 50-75 percent eg Maharashtra Chhattisgarh Gujarat and Odisha In case of AP which increased subsidy from 70 to 90 percent in 2011-12 the additional area to come under MI in fact decreased as compared to the previous years It is therefore recommended that the states should be advised to seriously consider that the quantum of subsidy should preferably be not more than 50-70 percent including state and central share
3) No uniform pattern is being followed by states for implementation of this scheme It has been observed that in some states more than one department are involved in parallel eg Karnataka where it is being implemented by both agriculture and horticulture departments In such cases there is often lack of coordination which adversely affects
Impact Evaluation Study on ldquoNational Mission on Micro Irrigation (NMMI)rdquo
122
the outcome of the scheme It has also been observed that where a single department is designated as the implementing agency (eg horticulture or agriculture) it does not pay adequate attention to the crops coming under the purview of other departments Perhaps one of the best implementation strategies is to designate an independent Special Purpose Vehicle (SPV) on the pattern of Gujarat (GGRC) and AP (APMIP) States may be encouraged to replicate such a strategy
4) One of the major reasons for the slow growth of micro-irrigation in India is the high initial investment In spite of availability of subsidy from state agencies majority of the farmers are reluctant to invest in micro-irrigation system even in horticulture crops which is highly suitable for drip irrigation Therefore micro-irrigation system should be tailored made ie planned and designed based firmly on location specific parameters to reduce the cost of installation
5) Micro irrigation System is mostly promoted through subsidy schemes and not as an on-farm water and land management strategy In certain states under subsidy scheme the requisite consideration have not been given in respect of field size shape topography type and location of water source seasonal fluctuations type of soil and crop to be grown As a result in certain cases the subsidy may not match the specific situation of an individual farmer consequently the system may not match the site specific situations of an individual farmers consequently the system may not operate to the complete satisfaction of the farmer
B Technology Related 1) There is a need to establish a Central Testing Facility (CTF) to deal comprehensively with
the design development and testing of all equipments devices machines used in micro irrigation systems using state-of art technology It is suggested that the Govt may consider contacting regular and random technical audit of the system to cover about 2-3 percent beneficiaries within first and second year of the installation This will keep check on to quality and suppliers will be more vigilant to supply good quality of system
2) It is suggested that the implementing agencies should be more vigilant regarding warranty and after sales service of the system provided by the suppliers The question of releasing 10 percent of the cost of the system after one year subject to satisfactory performance of the system as certified by the beneficiary may be considered Maintenance manual in vernacular language should be made available to the beneficiaries at the time of installation of the system
3) It is observed that the cost of micro-irrigation accessories such as emitters filters laterals etc vary between shops and places Sometimes farmers do face problem in
Impact Evaluation Study on ldquoNational Mission on Micro Irrigation (NMMI)rdquo
123
getting spare parts in time It is necessary to provide quality materials in time for farmers for the speedy adoption of micro-irrigation
4) Inadequate information about the operation maintenance as well as the usefulness of micro irrigation is one of the main reasons for its uneven spread across regions in India Farmers still do not have full knowledge regarding the usefulness of the micro irrigation Even the adopters do not know fully how much of subsidy is available per hectare for different crops
5) Clogging of drippers mainly due to poor quality of water helps in bacterial growth which can be controlled by using chlorination which acts as a powerful oxidizing agent and vigorously attack micro-organisms such as algae fungi and bacteria Also acid is injected into drip irrigation system to lower the pH of the irrigation water and this helps in preventing the precipitation of salts such as calcium carbonate magnesium carbonate or ferric oxide It has been observed during the course of survey that the availability of sulphuric acid in the nearby towns is a major constraint and farmers are forced to purchase new spares by discarding clogged drippers Recently some farmers have started applying phosphoric acid to get dual benefit such as flushing of impurities and adding P fertilizer to the soil but the same is not recommended and also not very effective It is therefore recommended that system suppliers should make acid available to the growers as part of their after sales service obligation It is realized that the normal acid treatment does not help to mitigate the problem Therefore studies need to be carried out to devise de-logging measures in such areas
C Awareness and Capacity Building
1) The extension network currently operated mainly by government agencies does not
seem to be making significant impact on the adoption of this technology Therefore there is a need to revamp the entire extension network by involving the MI system manufactures in order to increase amp improvise the existing quality of extension services
2) System manufacturers should be involved intensively in promoting micro-irrigation by introducing frequent demonstration at farmersrsquo field and strategic locations in the district state The micro Irrigation system manufacturers should be involved in providing advice on agronomic packages to the farmers so as to encourage the adoption of micro irrigation at a large scale
3) Since MI system suppliers are one of the major sources of creating awareness among potential beneficiaries their involvement in laying down demonstration may be increased Similarly imparting training on technical and operational aspects of the system should be included as mandatory part of the training of the farmers by the
Impact Evaluation Study on ldquoNational Mission on Micro Irrigation (NMMI)rdquo
124
system suppliers The training may also include aspects of packages of practices which may be standardized by the SAUs amp other related organization and supplied to system suppliers for further dissemination to the farmers
4) Awareness on MI system is low in states like Bihar UP and Odisha Special drive is needed for exposure visits trainings to make them aware about the benefits and operation of the system The number of demonstration farms should also be increased
5) It is understood from the field study that the officials who are involved in promoting micro-irrigation technology under the GoI Scheme have inadequate knowledge about the technical and other details of MI Therefore the state government extension staff need to undergo lsquoRefresher Courses and exposure visitsrsquo to have basics of micro-irrigation thereby enabling their role in the implementation of the scheme
D Follow up Action 1) Though micro-irrigation has been in use in different States since mid-eighties State-
wise potential area is not estimated as of today Therefore it is essential to prepare State-wise and crop-wise potential area for MI A detailed estimate on State-wise potential would be useful to fix the target to be achieved and further to develop a road map for MP adoption in the country
2) It is evident from field study that capital cost required to install micro irrigation system is relatively high Because of this reason considerable percentage of farmers have expressed that they are unable to adopt this technology for low value crops There has been a significant development in the MI technology and efforts should be on developing and popularizing low cost technologies This would help reducing the cost of the system and increasing the adoption of micro-irrigation at a large scale and at least one percent of the outlay on micro-irrigation needs to be earmarked for micro-irrigation research
The information regarding all the activities under NMMI scheme at national and state level should be under public domain The information available at NCPAH website is qualitative and it should be quantitative to make it more clear and informative Similarly information at state level is hardly available in the website and it should be mandatory for implementing agencies to host their websites as is being done in case of Tamil Nadu
Impact Evaluation Study on ldquoNational Mission on Micro Irrigation (NMMI)rdquo
125
References Ahuja Usha Ram Singh PKJoshi and Neelu Nanwani 2012 Micro Irrigation Economics and Outreach in Haryana Chandrasekaran M and D Suresh Kumar 012 Micro Irrigation Economics and Outreach in Tamil Nadu
Dhawan BD 2000 Drip Irrigation Evaluating Returns Economic and Political Weekly 35 42 (Oct 14-20 2000) pp 3775-3780 Dhawan B D 2002 Technological change in irrigated agriculture A study of water saving methods New Delhi Commonwealth Publishers Government of India 2010 National Mission on Micro Irrigation Operational Guidelines New Delhi Ministry of Agriculture November 2010 Government of India 2004 Report of the Task Force on Micro irrigation Ministry of Agriculture New Delhi January 2004 INCID 1994 Drip Irrigation in India New Delhi Indian National Committee on Irrigation and Drainage Malik DP and MS Luhach 2002 Economic dimensions of drip irrigation in context of fruit Crops Paper presented at International Workshop on Economics of Water and Agriculture held at Institute of Food Agriculture and Environmental Sciences The Hebrew University Jerusalem Israel 18-20 December NABCONS 2009 Evaluation study of centrally sponsored scheme on Micro Irrigation Mumbai NABARD Consultancy Services Namara R E Upadhyay B Nagar R K 2005 Adoption and impacts of micro irrigation technologies Empirical results from selected localities of Maharashtra and Gujarat states of India Research Report 93 Colombo Sri Lanka International Water Management Institute Narayanamoorthy A 2012 Drip Method of Irrigation in Maharashtra Status Economics and Outreach I Narayanamoorthy A 2009 Drip and Sprinkler Irrigation in India Benefits Potential and Future Directions in Amarasinghe U T Shah RPS Malik (eds) Strategic Linking of the National River Linking Project (NRLP) of India Series 1 International Water Management Institute Colombo Narayanamoorthy A 2004 Impact assessment of drip irrigation in India The case of sugarcane Development Policy Review 22(4) 443-462 Narayanamoorthy A 2003 Averting water crises by drip method of irrigation A study of two water intensive crops Indian Journal of Agricultural Economics 58 (3) 427-437 Narayanamoorthy A 2001 Impact of drip irrigation on sugarcane cultivation in Maharashtra Agro Economic Research Centre Gokhale Institute of Politics and Economics Pune India Narayanamoorthy A 1997 Economic analyses of drip irrigation An empirical analysis from Maharashtra Indian Journal of Agricultural Economics 52 (4) 728-739 Narayanamoorthy A 1996 Evaluation of drip irrigation system in Maharashtra Mimeographed series No 42 Agro Economic Research Centre Gokhale Institute of Politics and Economics Pune India Malik RPS and MS Rathore2012 AgWater Solutions Project Case Study Accelerating Adoption of Drip Irrigation in Madhya Pradesh India
Impact Evaluation Study on ldquoNational Mission on Micro Irrigation (NMMI)rdquo
126
Palanisami K S Raman Kadiri Mohan 2012 Micro Irrigation- Economics and Outreach Macmillan Publishers India Ltd for International Water Management Institute Palanisami K Kadiri Mohan K R Kakumanu S Raman 2011 Spread and Economics of Micro irrigation in India Evidence from Nine States Economic and Political Weekly XLVI Nos 2627 June 25 2011 Patil RG (2001) water filtration for micro irrigation system In Micro irrigation Eds HP singh SP Kaushik Ashwani Kumar TS Murthy Jose C PP 574 Phansalkar SJ 2002 Appropriate Irrigation Technologies promoted by IDE A Socio Economic Assessment Raina JN Thakur BC and ML Verma (1999) Effect of drip irrigation and polyethylene mulch on yield quality and water use efficiency of tomato (Lycopersicon esculentum) Indian J Agric Sci 69 (6) 430-33 Raina JN Suman SKumar P and RSSephia (2013) Effect of Drip Fertigation With and Without Mulch on Soil Hydrothermal Regimes Growth Yield and Quality of Apple (Malus domestica Borkh Comm in Soil Sci amp Pl Annual 44 1-11 Regassa E Namara Bhawana Upadhyay and R K Nagar 2005 Adoption and Impacts of Micro irrigation Technologies Empirical Results from Selected Localities of Maharashtra and Gujarat States of India Research Report 93 Colombo Sri Lanka International Water Management Institute Sankaranarayanan KP Nalayini M Sabesh S Usha Rani R P Nachane and N Gopalakrishnan 2011 Low Cost Drip ndash Cost Effective and Precision Irrigation Tool in Bt Cotton Technical Bulletin No12011 Coimbatore Sharma RC (1998) Nature Extent and Classification In Agricultural Salinity Management in India Central Soil Salinity Research Institute Karnal UpadhyayB2003 Drip irrigation An appropriate technology for women Appropriate Technology Vol 30 (4) Verma S Tsephal S and Jose T 2004 Pepsee systems Grass root innovation underground stress Water policy 6 (2004) 1-16 Verma SR Impact of Agricultural Mechanization on Production Productivity Cropping Intensity Income Generation and Employment of Labor Status of Farm Mechanization of India 133-153 (wwwagricoopnicin)
Impact Evaluation Study on ldquoNational Mission on Micro Irrigation (NMMI)rdquo
127
Appendices Annexure I Processes of Implementation
Process for Implementation of Micro Irrigation Scheme
The Block Development Officer will receive Gram Sabha approved applications with the required documents on basis of ldquofirst come first servedrdquo basis from the farmers interested in availing benefit under the scheme through Village Horticulture Extension Officer Horticulture Development Officer and other sources such as regional workersdealers of registered manufacturing companies Action Block Development Officer At Block Development level the compiled applications will be put in a register according to priority and registered number and date will be assigned The registration number and date will be informed to beneficiary in written (Form-One) Action Block Development Officer Within three days of receiving the application a visit to farmerrsquos field will be made with Village Horticulture Extension Officer to confirm the information entered in application and field notes will be compiled in a folder (Form-Two) Action Block Development Officer Time Limit Three days After the field visits the applications will be arranged in an ordered list and sent to District Horticulture Office along with application form-three A copy of list and application will remain with Block Development Officer (Form-Three) Action Block Development Officer Time Limit Four days At district level development block wise received list will be registered and kept in same order in block wise registers From every Block Development list each application will be accepted in order Time Limit Three days Action Member Secretary District Micro Irrigation Committee (DMIC) The estimation of proposed area and cost will be made according to received applications district level integrated Action Plan will be formulated and District Micro Irrigation Committeersquos sanction proposal will be sent to State Micro Irrigation Committee Time Limit Ten days Action Member Secretary State Micro Irrigation Committee (SMIC) On the basis of district level Action Plans state level Action Plan will be prepared and after approval from State Micro Irrigation Committee (SMIC) will be sent to central governmentrsquos Department of Agriculture amp Cooperation New Delhi Time Limit Ten days Action Member Secretary State Micro Irrigation Committee (SMIC) Part-Two The information received about district wise Action Plan approved by central governmentrsquos Department of Agriculture amp Cooperation will be shared with DMIC Time Limit Three days Action Member Secretary State Micro Irrigation Committee (SMIC)
(a) After receiving information about approved Action Plan for district each block wise registered application will be forwarded to manufacturing companies which were selected by farmers for survey drawingdesign etc in an order (Form- Four) Time Limit Three days Action Member Secretary District Micro Irrigation Committee (DMIC)
Impact Evaluation Study on ldquoNational Mission on Micro Irrigation (NMMI)rdquo
128
(b) After getting the approval from the bank bank loan application will be send to the micro irrigation Company for the further required action Micro Irrigation Company will prepare drawing design etc of the farmerrsquos field in which system has to be established and make them available to Block Development Officer and Senior Horticulture Development Officer Time Limit Three days Action Micro Irrigation Company After receiving documents from Micro Irrigation Company Block Development Officer will visit concerned farmerrsquos field and will make initial physical verification of irrigation water and available energy for the proposed system which is to be established After initial physical verification required documents along with recommendation of Block Development Officer should be sent to Member Secretary DMIC (Form Five) Time Limit Three days Action Block Development Officer After receiving approved applications from Block Development Officer within stipulated time limit Member Secretary DMIC will issue administrative approval and give work orders to micro irrigation Company to accomplish work (Form- Six) Time Limit Three days after receiving applications Action Member Secretary District Micro Irrigation Committee (DMIC) After receiving work direction from Member Secretary District Micro Irrigation Committee (DMIC) Micro Irrigation Company will establish system in working condition at the site selected by concerned farmer It will give required training to farmer and manual in Hindi The satisfaction certificate will then be obtained from farmer should be sent to Member Secretary along with bills (Form- Seven) Time Limit Seven days Action Micro Irrigation Company After receiving information about system establishment from micro irrigation companies group of nominated officers from DMIC will physically verify the established system and report will be presented in prescribed form After receiving correct physical verification report the approved grant payment will be issued in prescribed form (Form-Nine) and action for payment will be ensured (Form- Eight) Time Limit Ten days Action Nominated Group for physical verification
Note (1) The process of making payments to the suppliers of materials under scheme should be made after physical verification and other necessary formalities have been completed The payment should be made according to priority (2) During physical verification concerned officials will see that system has been established according to the drawingdesign presented initially by micro irrigation Company The standard material has been provided in prescribed quantity The distribution of irrigated water is uniform at all the places The farmer has been trained to operate the system maintain it etc and manual in Hindi has been provided If during physical verification the facts are presented showing incomplete provision of system and supply of non-standard material Member Secretary will have a responsibility to inform micro irrigation Company that it should establish the system according to the presented proposal The physical verification of system should be done again before taking action to make payment to company Time Limit 3 days Action Member Secretary DMIC It will be responsibility of Head DMIC that the above action is taken in stipulated time Action Head DMIC
Impact Evaluation Study on ldquoNational Mission on Micro Irrigation (NMMI)rdquo
129
The person getting benefit out of micro irrigation scheme has to submit an affidavit on a 5 rupees stamp paper along with the necessary forms to the Assistant Director Horticulture Joint Member Secretary District Micro Irrigation Committee declaring that he will not transfer the dripsprinkler system to any other farmer neither sells it (Form- Ten) Action Beneficiary Answerable Block Development Officer The beneficiaries of this scheme will have to give in written that they or any member of their family (if combined) has not taken benefit from any Govt state Govt scheme of providing dripsprinkler for irrigation (Form- Eleven) Action Beneficiary Answerable Block Development Officer
Impact Evaluation Study on ldquoNational Mission on Micro Irrigation (NMMI)rdquo
130
Figure 13 Subsidy Process under GGRC Source Kumar amp Pullabhotla
Farmers
Approaches to MI Companies of
their choice
Application is submitted to GGRC with design and cost
estimation and 5 advance money by farmer
Get cost estimate for the installation after survey
Work Order released with 25 money to MI companies by
GGRCBank
Tri-party agreement (TPA) Collection of Management ChargesDifferent Amount
Submission of Performa Invoice for advanse payment
Installation amp trial run of MIS Third party inspection Issuance of
Insurance Cirtificate Submission of Final Bill
Payment of Balance Amount (75) by GGRCBank to MI
comp
Impact Evaluation Study on ldquoNational Mission on Micro Irrigation (NMMI)rdquo
131
Figure 14 Subsidy Process under APMIP
Source Adapted from Horticulture Department Note Abbreviations used MIAO ndash Micro-irrigation Area Officer AOHO ndash AgricultureHorticulture officer MCO ndash Micro-irrigation coordinators
Farmers
Application submitted to MIAOAgri OffHorti Off
Application form forwarded for village revenue officersquos
signature along with title deed
Forwarded to MI Company (Choice of company indicated
by farmer at the time of submission of application)
Company prepares the
design amp survey
Sent back to AOHO or
MIAO
Forwarded to AOHOMIAO who sends it
to Mandal Co-ordination Office
Will inform through MIAO to farmer of how much to
pay
Application + farmers DD (30 or farmerrsquos share)
submitted to MIAO
At district office administrative sanction
after scrutiny of documents
10 of cost released to
company as mobilization fund
Material delivery and installation to be undertaken by company within 15 days
Upon receiving completion certificate 85 of cost released to company
MCO has to inspect and furnish completion certificete
along with photograph
5 of cost is held as a guarantee for providing service Released
to company if bank guarantee is furnished
Impact Evaluation Study on ldquoNational Mission on Micro Irrigation (NMMI)rdquo
132
Box 1 Online Micro Irrigation Farmerrsquos Subsidy Management System in Tamil Nadu Subsidy Management System
Online Micro Irrigation Farmerrsquos Subsidy Management System in Tamil Nadu Subsidy Management System
With a mission to improve and increase the performance the Micro Irrigation (MI) for Horticulture and Non Horticulture crops across every region in all states of India web based software for centralized subsidy allocation and management monitoring software is developed This software was developed by Maruti Computers Private Limited (MCL) Chennai is proved to be very successful after its implementation in the state of Tamil Nadu This web based application software is an end-to-end tool which simplifies and facilitates the entire process of release of subsidy to the beneficiaries This system provides required information to all stake holders in a very transparent manner and provides paperless office and e-governance functionalities This software was developed with latest technologies and fully complies with current guidelines of Central Government MI Scheme The software is continually updated with the changes in rules and regulations and for the technology changes This software addresses the core need for this application - speedy processing of farmerrsquos subsidy requests in a transparent manner
Overview
The software was developed as per the guidelines of the MI Scheme This software is available in multiple languages For a specific state this is available in bilingual languages for various applications and annexure This will enable the beneficiary to understand the content of the application in the local language and fill without any errors
To increase the accuracy and correctness of the information submitted by the farmers software enables them to re-verify the entire data to be submitted by them System helps the applicant to correct the data before submitting to department On completion of various applications at their convenience the beneficiary can submit the application on-line
Once the entire application is in complete form system accepts the application for further processing A unique16 digit Application Id is generated by the system and with Id of the application The authorities will be able to identify the district taluka block etc along with date amp time seal The Beneficiary farmers may also submit their application online with the help of designated agencies (District Agriculture and Horticulture departments) or Sugar Mills or Micro Irrigation Companies who are all one of the stake holders of the scheme
The software and the data within the software are highly secured with access control privileges for various levels of users Data within the system cannot be manipulated or altered where they lack authority The software can generate various types of MIS reports and all stake holders The Government of India who is the sponsor of the scheme can generate reports on demand for monitoring the scheme The system has intelligence to identify and mark duplicate application Through this facility duplicate or fraudulent applicants are identified and removed from further processing The software is user friendly menu driven open-ended for future enhancements and is secure
Subsidy Processing and Monitoring The fully completed applications are then processed by the District Technical Committee Their decision of approving or rejecting the applications is fed online On approval a work order for installing the system is issued to the respective Micro Irrigation companies The Micro Irrigation companies after installing the system in the field they submit the completion certificate and their Invoice online Subsequently check Measurement done for the implementation of the system is then fed online Once check measurement is submitted Invoice submitted by the MI Companies gets approved for release of their payment and subsidy to the beneficiary
Process flow The software is built with Business Process Management (BPM) concepts BPM provides the workflow or process management capability ndash that helps an organization to formulate a step by step flow of a process and stipulate conditions for flow from one step to another It also provides tight security as who can move from one step to another
Impact Evaluation Study on ldquoNational Mission on Micro Irrigation (NMMI)rdquo
133
Box 2 Possibilities for Modifications
Possibilities for Modifications
The administrator of the system can make majority of operational changes without any programming changes The system is built on a rule driven and data driven architecture Hence by changing the data and rules the system behavior can be modified Process flow control can be managed by changing the business process flow with use of Ganges
The software application will be continuously updated MCL for the following items
-Central Government and state regulations
-Software upgrades for technology related items
Setting up of a company ndash Special Purpose Vehicle (SPV) to deal with the Micro Irrigation scheme in the states
Both the APMIP and GGRC models are different to the other State Implementing Agencies (SIA) in nature process and functioning the A key contrasting feature of this process between the two models is that under the GGRC system the farmer directly approaches the MI firm of his choice usually through a dealer whereas in the SIAAPMIP system the farmerrsquos point of contact is the local officer who has jurisdiction in the area The farmer indicates his choice of the company at the time of submitting his application and a number of additional approvals are needed before the company receives the farmerrsquos demand and proceeds to prepare the cost estimate This feature adds another layer of delay and unnecessary scrutiny in the subsidy disbursement process This is not the case under the GGRC model
Both APMIP and GGRC are independent and are not under any specific state department such as agriculture or horticulture has no crop specific crop bias
In many instances in these models the MI dealer or firm has an incentive to take up the responsibility of much of the administrative procedures such as collecting the relevant documents facilitating access to bank documentation (in case the farmer wants to avail of credit) submitting the application to the implementation authorities etc in order to speed up their own business
The GGRC encourages the suppliers to motivate the farmer for timely submission of application under MI Schemersquo and educate the farmer for availing loan procedures of Bank
Impact Evaluation Study on ldquoNational Mission on Micro Irrigation (NMMI)rdquo
134
under MI scheme This design reduces some transactional costs of availing the subsidy from farmers to MI suppliers and enhances efficiency
The implementing agency as the private sector also encourages devoting some of its own resources to promote and educate the farmers about the subsidy scheme and its guidelines in addition to the public extension efforts
Both these models however allow for various checks to scrutinize such misappropriation of subsidy through their design of the payment process and via third party verification procedures
Both APMIP and GGRC follow similar procedures for collecting the farmerrsquos share of the cost of the MI system and incorporate provisions to safeguard farmersrsquo interests The farmer pays his share to the implementing agency rather than directly to the MI firm Both the agencies releases only some portion of the amount to the supplier prior to the delivery and installation of the system as a mobilization fund
Only after the system has been installed a trial run undertaken and verified by a third party monitoring agency and with the farmer acknowledging the system performance is the complete amount (farmerrsquos contribution along with the subsidy component) released to the supplier
In view of above the GGRC model and to some extent the APMIP model incorporate useful design elements that align incentives for suppliers (of MI technology as well as credit and insurance suppliers) in a manner that is advantageous to farmers
Set up an SPV on the lines of GGRC (Gujarat) and APMIP (Andhra Pradesh) Dedicated and trained staff Timely subsidy disbursal Detailed information of the scheme to farmers All the paper work Demonstrations Warranty After Sales Services Monitoring of the companies operating in the state Monitoring of the companies operating in the state Regular training of farmers Agronomic support to farmers Make available loans and insurance to farmers
The above diagram clearly states the advantages of having the Special Purpose Vehicle (SPV) for Micro Irrigation There will be dedicated and trained staff to deal with the farmersrsquo queries and to work on the MI scheme full time The funds which do not come on time or are not properly managed will be taken care of by the SPV Often the farmers complain of not getting information on time or the complication of the Govt processes This will be dealt with once the SPV is there The SPV will help people with the paperwork and other
Impact Evaluation Study on ldquoNational Mission on Micro Irrigation (NMMI)rdquo
135
official documentation Regular demonstrations will be held and so will the work of creating awareness amongst the farmers about MI will be done The work of the registered companies will be monitored and it will be ensured that warranty and after sales service be provided to the customers The company will conduct regular training programs not only on MI but also on several other advanced topics of horticulture In addition the company will have agronomists to guide the farmers for obtaining higher yield The loan and insurance problems faced by the farmers will also be taken care of by the company by making arrangements which would be convenient to the farmers
Impact Evaluation Study on ldquoNational Mission on Micro Irrigation (NMMI)rdquo
136
Annexure II State wise Physical amp Financial Targets amp Achievements
Table 90 State wise Physical and Financial Target amp Achievements during 2005-06
State 2005-06
Physical (ha) Financial (Rs in lakh) T A A T A A
AP 45521 6775 1488 612923 934 1524 Bihar - - - - - - Chhattisgarh - - - - - - Gujarat 16720 5042 3016 218201 70117 3213 Haryana - - - - - - Karnataka 25234 - - 35841 - - Maharashtra 41856 - - 480809 - - Odisha - - - - - - Rajasthan - - - 104802 - - Sikkim - - - - - - Tamil Nadu 28950 - - - - - UP 8910 - - 124174 - - Uttarakhand - - - - - - Grand Total 180223 11817 656 2328415 163517 702
Source Ministry of Agriculture Note T- Target A- Achievement
Table 91 State wise Physical and Financial Targets amp Achievements during 2006-07
State 2006-07
Physical (ha) Financial (Rs in lakh) T A A T A A
AP 193459 84623 4374 1951968 11277 5777 Bihar 14223 - - 24821 - - Chhattisgarh 28748 4600 16 303288 25621 845 Gujarat 18247 24338 13338 33559 393095 11714 Haryana 5365 2823 5262 44389 23179 5222 Karnataka 23737 38850 16367 245675 445169 1812 Maharashtra 65119 108260 16625 879655 1346637 15309 Odisha 3314 1222 3687 45426 14319 3152 Rajasthan 39751 67721 17036 283334 268746 9485 Sikkim - - - - - - Tamil Nadu 5402 - - 120064 - - UP - 18636 - - - - Uttarakhand - - - - - - Grand Total 397365 3343006 8413 4457599 3659033 8209
Source Ministry of Agriculture Note T- Target A- Achievement
Impact Evaluation Study on ldquoNational Mission on Micro Irrigation (NMMI)rdquo
137
Table 92 State wise Physical and Financial Targets amp Achievements during 2007-08
State 2007-08
Physical (ha) Financial (Rs in lakh) T A A T A A
AP 46385 114846 24759 574776 1455942 25331 Bihar - 229 - - 2617 - Chhattisgarh 10063 2083074 20701 78339 175098 22351 Gujarat 45155 430371 9531 73496 492741 6704 Haryana 7215 778499 1079 60419 50811 8409 Karnataka 535177 62939 1176 68645 759797 11068 Maharashtra 103672 82224 7931 1389734 1279207 9205 Odisha 1032 306948 29743 1084 10127 9342 Rajasthan 44707 73735 16493 234114 2908 12421 Sikkim - - - - - - Tamil Nadu 12302 781957 6356 2200 155991 709 UP - 4659 - - 56217 - Uttarakhand - NA - - NA - Grand Total 3240487 4211739 12997 3989632 4729348 11854
Source Ministry of Agriculture Note T- Target A- Achievement
Table 93 State wise Physical and Financial Targets amp Achievements during 2008-09
State 2008-09
Physical (ha) Financial (Rs in lakh) T A A T A A
AP 85209 123581 14503 972731 1083556 11139 Bihar - 313 - - 2153 - Chhattisgarh 13633 3057361 22426 95445 206025 21586 Gujarat 33563 53427 15918 489861 739585 15098 Haryana 32404 2230169 6882 120728 127771 10583 Karnataka 84167 926223 11005 731866 584508 7987 Maharashtra 128758 100410 7798 1474806 1344402 9116 Odisha 3752 249553 6651 33794 29278 8664 Rajasthan 40231 77729 19321 238231 300915 12631 Sikkim - - - - - - Tamil Nadu - 1159735 - - 236721 - UP 1378 128748 9343 150 23512 15675 Uttarakhand - - - - - - Grand Total 423095 516338 12204 4172462 4678426 11213
Source Ministry of Agriculture Note T- Target A- Achievement
Impact Evaluation Study on ldquoNational Mission on Micro Irrigation (NMMI)rdquo
138
Table 94 State wise Physical and Financial Targets amp Achievements during 2009-10
State 2009-10
Physical (ha) Financial (Rs in lakh) T A A T A A
AP 114453 138341 12087 143107 178287 12458 Bihar NA 10748 - NA 1083 - Chhattisgarh 17636 1577119 8943 125198 119345 9533 Gujarat 33326 662491 19879 444727 542648 12202 Haryana 1576 325767 20670 21169 38539 18205 Karnataka 81311 10820517 13308 63813 868532 13611 Maharashtra 84673 94507 11161 1070708 1322628 12353 Odisha 7578 12776 16859 5284 87116 16487 Rajasthan 85211 95556 11214 569315 607335 10668 Sikkim - - - - - - Tamil Nadu - 1800803 - - 25583 - UP - 197413 - - 38114 - Uttarakhand - - - - - - Grand Total 425764 55475277 13030 4353157 5664040 13011
Source Ministry of Agriculture Note T- Target A- Achievement
Table 95 State wise Physical and Financial Targets amp Achievements during 2010-11
State 2010-11
Physical (ha) Financial (Rs in lakh) T A A T A A
AP 165500 122758 7417 24000 24000 100 Bihar - 1348504 - - 82588 NA Chhattisgarh 28780 2183093 7585 1019 1801 17674 Gujarat 80338 78294 9746 12000 1200002 100 Haryana 4426 93402 21103 136081 140227 10305 Karnataka 72700 87447 12028 9254 894525 9666 Maharashtra 11802508 11802508 100 22237 2226538 10013 Odisha 934092 1201396 12862 810 69682 8603 Rajasthan 148000 147613 9974 12000 11620 9683 Sikkim - - - - - - Tamil Nadu 35000 2615316 7472 6591 779718 1183 UP 5590 3108632 5561 8123 383 4715 Uttarakhand - - - - - - Grand Total 667700 640069 9586 9008411 917368 10183
Source Ministry of Agriculture Note T- Target A- Achievement
Impact Evaluation Study on ldquoNational Mission on Micro Irrigation (NMMI)rdquo
139
Table 96 State wise Physical and Financial Targets amp Achievements during 2011-12
State 2011-12
Physical (ha) Financial (Rs in lakh) T A A T A A
AP 88951 105063 11811 28720 28720 10000 Bihar 1961 2329428 118788 450 216683 48152 Chhattisgarh 17174 1839363 10710 3500 3500 10000 Gujarat 130294 6510182 4997 16664 1669505 10019 Haryana 6118 578608 9457 1993 166661 8362 Karnataka 63169 58013 9184 10965 9165 8358 Maharashtra 271935 11599894 4266 24980 24980 10000 Odisha 11523 1183659 10272 823 89288 10849 Rajasthan 107072 122183 11411 13095 128239 9793 Sikkim - 50969 - 400 400 10000 Tamil Nadu - 2755054 - 6625 6625 10000 UP - 379086 - - 44088 - Uttarakhand - NA - 75 - - Grand Total 698197 55752143 7985 108290 10807615 9980
Source Ministry of Agriculture Note T- Target A- Achievement
Table 97 State wise Physical and Financial Targets amp Achievements during 2012-13
State 2012-13 (March 13)
Physical (ha) Financial (Rs in lakh) T A A T A A
AP 131685 76065 5776 2899332 270209 9320 Bihar 50571 41372 8181 5200 5340 10269 Chhattisgarh 19118 14017 7332 3172 26778 8442 Gujarat 103381 96232 9308 18200 18201 10001 Haryana 9277 6538 7048 3000 257105 8570 Karnataka 107127 88605 8271 14065 1512195 10751 Maharashtra 127751 76620 5998 15018 15221 10135 Odisha 17516 19605 11193 2000 168953 8448 Rajasthan 98400 78535 7981 11000 1034708 9406 Sikkim 392 - - 200 - - Tamil Nadu 37320 26538 7111 8300 13235 15946 UP 11245 2143 1906 595 393 6605 Uttarakhand 1005 215 2139 150 70 4667 Grand Total 714788 526485 7366 10989332 11188831 10182
Impact Evaluation Study on ldquoNational Mission on Micro Irrigation (NMMI)rdquo
140
Annexure III Questionnaires
Beneficiary Farmerrsquos Questionnaire
1 General information Name of Farmer ( कसान का नाम) ----------------------------------------- Age (उ ) ------ Yrs
Village (गाव) ---------------------------------Block( लॉक)---------------------------------------------
District(िजला)------------------------------------State(रा य (---------------------------------------- Contact No (Mob)----------------------------- Landline (with STD code) -------- ------------------- E-mail id-----------------------------------------------------------------------------------------------------
2 Education status ( श ा क ि थ त)
1 Not educated(अ श त) 2 Primary( ाथ मक) 3 High school (हाई कल) 4 Sr Secondary (व र ठमा य मक) 5Graduate and above( नातकऔरऊपर)
3 Gender ( लग) - 1 Male(प ष) 2 Female (म हला)
4 Categories of farmers( कसान का जा त वग) - 1Gen(सामा य)2 OBC (अ य पछड़ा वग) 3 ST (अनस चत जनजा त) 4 SC)अनस चत जा त)
5 Land holding (भ म धारण) 1 Own land ( वयक )helliphelliphellip Acre 2 Leased in ( कराए
ल )helliphellip Acre 3Leased out ( कराय द )helliphellip Acre
6 Land holding Category of farmers (Tick ()) 1 Marginal (सीमा त)(lt 25 Acre) 2Small (छोट) (25-5 Acre) 3 Semi medium (अध - म यम )
(5-10 Acre) 4Medium (म यम) (10-25 Acre) 5 Large(बड़) (ge25Acre)
7 When the MI system was installed MI उपकरण कब लगाया गया------------------ (DDMMYY) ------ Yr
8 How did you get to know about the MI schemeआपको स म सचाई योजना कबार म
जानकार कस ह ई
Other Farmers
Advertisements व ापन Extension worker
Supplier
Any other (Specify) Radio Newspaper TV Pamphlet
Code 1 2 3 4 5 6 7 8
Impact Evaluation Study on ldquoNational Mission on Micro Irrigation (NMMI)rdquo
141
9 Which crops do you grow (आप कौन सी फसल पदा करत ह) S No
Crops फसल Name of the crop फसलकानाम
Spacing (mxm) अतराल
Area Covered (Acre)
Area Covered under MI(Acre)
Drip Sprinkler
1 Horticultural बागवानी
a Fruits फल
Veg सि जया
Flowerफल
Othersअ य
2 Non-Horticultural a b
Total Area (Acre)
10 Plantcrop management techniques used या आपन कोई फसल बधन क तकनीक इ तमाल
क ह a 1-Yes 2-No if yes then
b Area utilization (Acre)जमीन का उपयोग S No Land Before NMMI After NMMI
1 Agriculture a Horticulture crops b Field crops
2 Permanent waste Barren बजर एव अनपयोगी जमीन
3 Total Area (Acre)
8 Introduction of new crops amp spacing followed due to MI अपनाई गयी नयी फसल और
अ तराल S No Crop Spacing (mxm) 1 2
9 Irrigation Water Detailsपानी का ववरण
a Source ोत Bore well Canals Farm Ponds Water body Any other Code 1 2 3 4 helliphelliphelliphelliphelliphelliphelliphelliphelliphelliphelliphelliphelliphelliphelliphelliphelliphelliphelliphellip
b Water table helliphelliphelliphellipFt
SNo Intercropping before MI MI क पहल अतर फसल (Crops)
Intercropping after MI MI क बाद अतर फसल (Crops)
Crop Spacing (mxm) Crop Spacing (mxm) 1
2
3
Impact Evaluation Study on ldquoNational Mission on Micro Irrigation (NMMI)rdquo
142
10 Quality ofsoiland Irrigation water मटट और सचाई क पानी क गणव ता
Have you got soil amp water tested 1-yes 2-No if yes then S No Soil quality Response S No Water quality Response
i pH i pH ii EC iii EC
11 Why did you adopt NMMI schemeआप न इस योजना को य अपनाया Code Reasons Code Reasons 1 Because of subsidyअनदान क कारण 2 Quality of produceउ पाद क गणव ता 3 Water savingपानी क बचत 4 Proper utilization of land
जमीन का ठ उपयोग 5 Labor savingमजदर क बचत 6 Time savingसमय क बचत 7 Fertilizer savingउवरक क बचत 8 Early fruitingज द फलन 9 More productionअ धक उ पादन 10 Other specify_______________________
12 Impact of MI SNo Particulars Units Before MI After MI
a Irrigated Area स चत Acre
b Cost of irrigation सचाई क लागत RsAcre
c Electricity used बजल काउपयोग Hrsday
d Fertilizer usedउवरकोकाउपयोग KgAcre
e Productivity
b Fruits फल QtlsAcre
c Veg सि जया QtlsAcre
d Flowerफल QtlsAcre
e Othersअ य QtlsAcre
Non-Horticultural QtlsAcre f Incomeआय RsAcre
13 Have you got training of MI system या आपको NMMI योजना का श ण मला ह1-yes 2-No If Yes then
i By whom you got training of MI system Agencies SAUs
KVKs State Govt agencies
Kisan call centers
PFDC System supplier Others(Specify)
Code 1 2 3 4 5 6
ii Training Details (Duration (अव ध)helliphelliphellipDays)
S No Particulars 1-Yes 2-No 1 Is training material provided या श ण साम ी द जातीह
Impact Evaluation Study on ldquoNational Mission on Micro Irrigation (NMMI)rdquo
143
SAU= State Agricultural University PFDC= Precision Farming Development Centre iii Promotional activities
Awareness descriptionजाग कताकावणन 1-Yes 2-No
a Publicity of the MI Scheme in local language
इस योजना का चार थानीय भाषा म होता ह
b Whether there is a dedicated website for MI Scheme in the State
या आप क रा य म इस योजना को सम पत कोई वबसाईट ह
c Whether online applications are received
या आप क रा य म ऑनलाइन अिजया ल जाती ह
d Are you aware about package of practices being adopted for MI
या आप स म सचाई क इ तमाल करन क काय णाल को समझत ह
14 Subsidy Detailsअनदान का ववरण i
Financial assistanceआ थक सहायता
Govt () Beneficiary लाभाि वत()
Total system cost (Rs)उपकरण क लागत
Drip
Sprinkler
ii Time taken in subsidy disbursement (Days) अनदा नत राशी मलन म लगा समय ( दन म) i Application to Sanction -helliphelliphelliphelliphellipdays
ii Sanction to Installation -helliphelliphelliphelliphellipdays
2 Topic covered in the training श ण
क म
i Operation of the systemउपकरण क काय णाल
ii Maintenance of the systemउपकरण का रखरखाव
iii Package of practices for the cropsफसल क उगान क प त
iv Opportunities for Introduction of new crop नयी फसल क प रचय क ग जाइश
v Other related schemesकोई अ य स ब धत योजना
3 Have you joined any field visit या कसी खत का मआइना कया ह
4 Are you satisfied with the Learning या आपको मल पर श ण स आप सत ठ ह
Impact Evaluation Study on ldquoNational Mission on Micro Irrigation (NMMI)rdquo
144
15 Finance a Source of beneficiary share of MIलाभाि वत क ह स का ोत
1Own sources
2Banks Namehelliphelliphelliphelliphelliphelliphellip
3KCC 4Money lenders
5Any other helliphelliphelliphelliphelliphelliphelliphelliphelliphelliphelliphelliphelliphelliphelliphellip
b Rate of Interest (if money borrowed then) याज क दर (उधार लन क ि थ त म)
16 Availability of electricity बजल क उपल धता helliphelliphelliphellipHrs day
17 Power of the pump set you are using प प सट क मताhelliphelliphelliphellipHP
18 Type of fertilizer used by the farmer उपयोग म लए गए उवरक का कार
i 1 Organic 2 Inorganic 3 Both ii 1 Liquid 2Water soluble 3Solid
19 Type of Irrigation Filters used by the farmers कसान वारा इ तमाल कय जान वाल सचाई फ टर क कार
Type of Filters फ टर क कार Code
Hydro-cyclone Filterहाइ ो-साय लोन फ़ टर 1
Screen filters न फ़ टर 2
Sand Media Filtersसड मी डया फ़ टर 3
Disc Filters ड क फ़ टर 4
Any other specifyअ य ( वशष ववरण)_________________________________________
20 Employment opportunities(रोजगार क अवसर) S No Particular No of man days
before NMMI No of man days after NMMI
1 Pre harvest practices कटाई क पहल क या
2 Harvesting कटाई
3 Post-harvest handling कटाई क बाद क या
Interest rate याज दर 3-7 7-10 10-12 12-15 gt15
Code 1 2 3 4 5
Impact Evaluation Study on ldquoNational Mission on Micro Irrigation (NMMI)rdquo
145
21 Assessment of System Design णाल का आकलन
Particulars 1-Yes2-No
a Whether various system components supplied to you are as per the BIS
या आपको दए गए उपकरण क सभी ह स BISमानक क अन प ह
b Whether pump size is proper to the field plot size wrt crop water requirements
या आपक वारा लगाय गए पप का आकार आप क खत क आकार और उसम बोई गयी फसल एव उपल ध पानी क अन प ह
c Does this MI system meet your requirements
या यह MI उपकरण आपक ज रत को परा करता ह
d Is this design layout is as per your project proposal
या इस उपकरण का खाका आप क ताव क अन प ह
e Whether after sales service has been received by you from the MI system suppliers या आपको उपकरण उपल ध करान वाल न उपकरण बचन क बाद कोई सवा दान क ह
f Whether the MI systems were found to be functional in the field
या MI उपकरण खत म सचा प स काम कर रहा ह
22 System supplier
i BrandManufacturer of MI equipment usedउपकरण का नमाताhelliphelliphelliphelliphelliphelliphelliphelliphelliphelliphelliphelliphelliphelliphelliphelliphelliphelliphelliphelliphelliphelliphelliphelliphelliphelliphelliphelliphelliphelliphelliphelliphelliphelliphelliphelliphellip
ii Reasons for buying from them उनस खर दन का कारण Local Govt official Other farmers company reps Advertisements
Code 1 2 3 4
iii After sales services ब क बाद द जान वाल सवाए
Impact Evaluation Study on ldquoNational Mission on Micro Irrigation (NMMI)rdquo
146
i Is it provided by the vendor व ता वारा द जाती ह 1-Yes2-No if yes then
ii Level of satisfaction of the serviceसवा स सत ठ का तर
iii Warranty 1-Yes2-No if yes thenवारट य द ह तो
lt6 Months 1 Yr 1-2 Yr 2-3 Yr gt3 Yr Code 1 2 3 4 5
23 Difficulty faced by the farmer in NMMI
schemeNMMIयोजनाकोअपनानमउठाईगयीपरशा नया S No Particulars 1-Yes 2-No 1 Procedure related या स स ब धत
2 Quality issuesगणव ता स स ब धत
3 Higher prices charged under scheme of the system then available in marketउपकरण क बाज़ार भाव स अ धक क़ मत
4 Delay in system supply (Committed date vs Actual date ) उपकरण क आप त म दर
5 Other charges (Not covered in the scheme additional money paid) अ त र त भगतान
6 After sale services are not up to the mark बचन क बाद द गयी सवाए सतोषजनक नह
7 Other specify__________________________________________________________
24 Would you like to recommend this scheme to others या आप इस योजना को अपनान क
सलाह अ य को दग 1-Yes 2-No
Share your experiencesअपना अनभव बताए helliphelliphelliphelliphelliphelliphelliphelliphelliphelliphelliphelliphelliphelliphelliphelliphelliphelliphelliphelliphelliphelliphelliphelliphelliphelliphelliphelliphelliphelliphelliphelliphelliphelliphelliphelliphelliphelliphelliphellip helliphelliphelliphelliphelliphelliphelliphelliphelliphelliphelliphelliphelliphelliphelliphelliphelliphelliphelliphelliphelliphelliphelliphelliphelliphelliphelliphelliphelliphelliphelliphelliphelliphelliphelliphelliphelliphelliphelliphellip
1timely 2 Late 3 Irregular
1Satisfied 2 Not satisfied 3 Indifferent
Impact Evaluation Study on ldquoNational Mission on Micro Irrigation (NMMI)rdquo
147
25 Any other socio economic benefits you would like to mention कोई अ य सामिजक- आ थक लाभ i helliphelliphelliphelliphelliphelliphelliphelliphelliphelliphelliphelliphelliphelliphelliphelliphelliphelliphelliphelliphelliphelliphelliphelliphelliphelliphelliphelliphelliphelliphelliphelliphelliphellip
ii helliphelliphelliphelliphelliphelliphelliphelliphelliphelliphelliphelliphelliphelliphelliphelliphelliphelliphelliphelliphelliphelliphelliphelliphelliphelliphelliphelliphelliphelliphelliphelliphellip 26 Any suggestion for the better implementation of NMMI Scheme
NMMI योजना को सह तर क स लाग करन क लए आप क या सझाव ह
i helliphelliphelliphelliphelliphelliphelliphelliphelliphelliphelliphelliphelliphelliphelliphelliphelliphelliphelliphelliphelliphelliphelliphelliphelliphelliphelliphelliphelliphelliphelliphelliphelliphelliphellip ii helliphelliphelliphelliphelliphelliphelliphelliphelliphelliphelliphelliphelliphelliphelliphelliphelliphelliphelliphelliphelliphelliphelliphelliphelliphelliphelliphelliphelliphelliphelliphelliphellip
iii helliphelliphelliphelliphelliphelliphelliphelliphelliphelliphelliphelliphelliphelliphelliphelliphelliphelliphelliphelliphelliphelliphelliphelliphelliphelliphelliphelliphelliphelliphelliphelliphelliphelliphellip
27 Whether MI System is installed in the entire land holding Yes No 28 Any MI demonstration nearby (Yes No) 29 Type of Sprinkle (1-Portable 2-semi-permanent 3-rain gun) 30 Type of Drip (1-Inline 2-online) 31 Observations of the investigator
Condition of the MI System at the time of visit (1-Functional 2-Not Functional)
i Overall design (1-Good 2-Satisfactory 3-Bad) ii General condition of the field (1-Good condition 2-Average condition 3- Bad
condition) iii Whether Farmers are using flood irrigation along with MI system (1-Yes 2-No) iv Whether choice of drip sprinkler MI system match with the crop requirement
(1-Yes 2-No) Signature of farmer Investigatorrsquos Name कसान का ह ता र जाचकता का ह ता र
Date दनाक
Impact Evaluation Study on ldquoNational Mission on Micro Irrigation (NMMI)rdquo
148
Non-beneficiary Farmerrsquos Questionnaire)
1 General information Name of Farmer ( कसान का नाम) ----------------------------------------- Age (उ ) --------- Yrs
Village (गाव) ---------------------------------- Block( लॉक)--------------------------------------------
District(िजला)------------------------------------State(रा य----------------------------------------- Contact No (Mob)----------------------------- Landline (with STD code) -------- ------------------- E-mail id------------------------------------------------------------------------------------------------------
2 Education status ( श ा क ि थ त)
1 Not educated(अ श त) 2 Primary( ाथ मक( 3 High school (हाई कल) 4 Sr Secondary (व र ठमा य मक) 5Graduate and above( नातकऔरऊपर)
3 Gender ( लग) - 1 Male(प ष) 2 Female (म हला) 4 Categories of farmers( कसान का जा त वग) - 1Gen(सामा य)2 OBC (अ य पछड़ावग)
3 ST (अनस चत जनजा त) 4 SC)अनस चत जा त)
5 Land holding (भ म धारण) 1 Own land ( वयक )helliphelliphellip Acre 2 Leased in ( कराए ल )helliphellip Acre 3Leased out
( कराय द )helliphellip Acre
6 Land holding Category of farmers (Tick ()) 1 Marginal (सीमा त)(lt 25 Acre) 2Small (छोट) (25-5 Acre) 3 Semi medium (अध - म यम ) (5-10 Acre) 4Medium
(म यम) (10-25 Acre) 5 Large (बड़) (ge25Acre)
7 Are you aware about the NMMI scheme याआप NMMI योजना क बार म जानत ह 1-Yes 2-No
If Yes then how did you get to know about the MI scheme आप को स म सचाई योजना क बार म जानकार कस ह ई
Other Farmers
Advertisements व ापन Extension worker
Supplier Any other (Specify)
Radio Newspaper TV Pamphlet Code 8 9 10 11 12 13 14 8
8 Which crops do you grow (आप कौन सी फसल पदा करत ह)
S No Crops फसल Name of the crop फसल का नाम Spacing(mxm) Area Covered (Ha)
3 Horticultural बागवानी
f Fruits फल
g Veg सि जया
h Flowerफल
i Others अ य
4 Non-Horticultural a b
Total Area (Ha)
a Area utilization(Acre)जमीन का उपयोग S No Land Response 4 Agriculture c Horticulture crops
d Field crops 5 Permanent waste Barren बजर एव अनपयोगी जमीन
Impact Evaluation Study on ldquoNational Mission on Micro Irrigation (NMMI)rdquo
149
6 Total Area (Acre)
10 Irrigation Water Detailsपानीका ववरण
a Source ोत Bore well Canals Farm Ponds Water body Any other Code 5 6 7 8 helliphelliphelliphelliphelliphelliphelliphelliphelliphelliphelliphelliphelliphelliphelliphelliphelliphelliphelliphellip
b Water table helliphelliphelliphellipFt
11 Why did you not taken advantage of NMMI scheme आपन NMMIयोजनाकालाभ य नह लया
Code Reasons Code Reasons 11 Less aware of subsidy
अनदान क बार म अन भ 12 Less technical knowledge
तक नक ान नह 13 Lengthy procedureल बी या 14 High capital cost involvedअ धक लागत 15 Not economicalआ थक नह 16 EmittersrsquoNozzlesrsquo frequent clogging
ट ट का बार बार अव होना 17 Application yet not cleared अभीअज पास नह ह यी
18 Any other Specify________________________ ____________________________
12 Have you participated in any training program of NMMI याआपको NMMI योजनाका श ण मला ह1-Yes 2-No If Yes then
a By whom you got training of MI system
Agencies SAUs KVKs
State Govt agencies
Kisan call centers
PFDC System supplier Others(Specify)
Code 1 2 3 4 5 6
b Training Details (Duration (अव ध)helliphelliphellipDays)
SAU= State Agricultural University PFDC= Precision Farming Development Centre
c Promotional activities
Awareness descriptionजाग कता का वणन 1-Yes 2-No
e Publicity of the MI Scheme in local language इस योजना का चार थानीय भाषा म होता ह
f Whether there is a dedicated website for MI Scheme in the State
S No Particulars 1-Yes 2-No 5 Is training material provided या श ण साम ी द जाती ह
6 Topic covered in the training श ण क
म
vi Operation of the systemउपकरण क काय णाल
vii Maintenance of the systemउपकरण का रखरखाव
viii Package of practices for the cropsफसल क उगान क प त
ix Opportunities for Introduction of new crop नयी फसल क प रचय क ग जाइश
x Other related schemesकोई अ य स ब धत योजना
7 Have you joined any field visit या कसी खत का मआइना कया ह
8 Are you satisfied with the Learning या आपको मल पर श ण स आप सत ठ ह
Impact Evaluation Study on ldquoNational Mission on Micro Irrigation (NMMI)rdquo
150
या आपक रा य म इस योजना को सम पत कोई वबसाईट ह g Whether online applications are received
या आप क रा य म ऑनलाइन अिजया ल जाती ह
h Are you aware about package of practices being adopted for MI या आप स म सचाई क इ तमाल करन क काय णाल को समझत ह
13 Availability of electricity बजल क उपल धता helliphelliphelliphellipHrs day
14 Type of fertilizer used by the farmer उपयोग म लए गए उवरक का कार a 1 Organic 2 Inorganic 3 Both b 1 Liquid 2Water soluble 3Solid
15 Difficulty faced by the farmer in NMMI scheme NMMIयोजना को अपनान म उठाई गयी परशा नया S No Particulars 1-Yes 2-No 8 Procedure related या स स ब धत
9 Quality issuesगणव ता स स ब धत
10 Higher prices charged under scheme of the system then available in marketउपकरण क बाज़ार भाव सअ धक क़ मत
11 Delay in system supply (Committed date vs Actual date ) उपकरण क आप त म दर
12 Other charges (Not covered in the scheme additional money paid) अ त र त भगतान
13 After sale services are not up to the mark बचन क बाद द गयी सवाए सतोषजनक नह
14 Other specify__________________________________________________________
16 Do you like to adopt this scheme in near future या आप इस योजना को भ व य म अपनाना चाहग 1-Yes 2-No Why helliphelliphelliphelliphelliphelliphelliphelliphelliphelliphelliphelliphelliphelliphelliphelliphelliphelliphelliphelliphelliphelliphelliphelliphelliphelliphelliphelliphelliphelliphelliphelliphelliphelliphelliphelliphelliphelliphelliphelliphelliphelliphelliphellip helliphelliphelliphelliphelliphelliphelliphelliphelliphelliphelliphelliphelliphelliphelliphelliphelliphelliphelliphelliphelliphelliphelliphelliphelliphelliphelliphelliphelliphelliphelliphelliphelliphelliphelliphelliphelliphelliphelliphelliphelliphelliphelliphellip
17 Would you like make any suggestion for the better implementation of NMMI Scheme NMMI योजना को सह तर क स लाग करन क लए आपक या सझाव ह
i helliphelliphelliphelliphelliphelliphelliphelliphelliphelliphelliphelliphelliphelliphelliphelliphelliphelliphelliphelliphelliphelliphelliphelliphelliphelliphelliphelliphelliphelliphelliphelliphelliphelliphellip ii helliphelliphelliphelliphelliphelliphelliphelliphelliphelliphelliphelliphelliphelliphelliphelliphelliphelliphelliphelliphelliphelliphelliphelliphelliphelliphelliphelliphelliphelliphelliphelliphellip
iii helliphelliphelliphelliphelliphelliphelliphelliphelliphelliphelliphelliphelliphelliphelliphelliphelliphelliphelliphelliphelliphelliphelliphelliphelliphelliphelliphelliphelliphelliphelliphelliphelliphelliphellip Signature of farmer Investigatorrsquos Name कसानकाह ता र जाचकताकाह ता र
Date दनाक
Impact Evaluation Study on ldquoNational Mission on Micro Irrigation (NMMI)rdquo
151
Annexure IV Reason of higher cost of drip in Gujarat During the survey in 13 states 5892 sampled farmers holding 1481058 hectares of land were interacted Analysis of data reveals that average unit cost of drip irrigation system ranges between from 5445736 Rsha to 7208631 Rsha The average cost of drip system installation was found to be highest in Gujarat followed by Chhattisgarh Tamil Nadu Maharashtra Sikkim UP Karnataka Rajasthan Andhra Pradesh Haryana Bihar and Odisha Analysis was carried out to find out reasons for higher average unit cost of drip irrigation system in Gujarat as compared to other States Following reason are given in support
I The per cent of area coverage under sprinkler irrigation system in Gujarat is 1169 and in other states it is 8830 per cent The average cost of sprinkler irrigation system is Rs 18000 ha against Rs 55000 Rsha of drip irrigation system
II The more per cent of area coverage under drip irrigation system in Gujarat lead to higher average cost
III Figure- 1 shows area coverage under 0-10 m2 spacing it could be seen from the figure that Gujarat is far ahead from other states in term of area coverage in close spacing crops When area covered under other spaced crops is compared UP stand at 1st position in term of area coverage under wide space crops and Gujarat cover very least as can be seen from figure1
Figure 15 Area coverage under close spacing crops (spacing range lt10 m2)
Impact Evaluation Study on ldquoNational Mission on Micro Irrigation (NMMI)rdquo
152
IV When compared average unit cost per ha of drip irrigation system as per NMMI guideline the average unit cost in closed spacing crops (0-10 m2) stand at 264 times higher than the average unit cost of wide spacing crops (Spacing range more than 10 m2)
Figure 17 Spacing wise unit cost (Rsha) of drip irrigation system as per NMMI guideline
Figure 16 Area coverage under wide spacing crops (spacing range more than spacing range 10 m2
Impact Evaluation Study on ldquoNational Mission on Micro Irrigation (NMMI)rdquo
153
It is also pertinent to mention that financial assistant for installation of drip system in Gujarat is given at actual unit cost rather than as recommended in NMMI guideline which is being adopted in all states other than Gujarat In Gujarat the additional amount is given by state exchequer which escalates invoice value resulting in higher average cost
Impact Evaluation Study on ldquoNational Mission on Micro Irrigation (NMMI)rdquo
154
i
i
PREFACE
The growing need for food security and increased population has resulted in higher demand for irrigation water which could only be met by judicious use of available water resources The Government therefore launched a Centrally Sponsored Scheme on Micro Irrigation in January 2006 with the an objective to increase the area under improved methods of irrigation for better water use efficiency to provide stimulus to agricultural growth The scheme was further upscaled into Mission Mode in 2010 as the National Mission on Micro Irrigation (NMMI) The Mission has now completed almost 8 years and has made significant progress in achieving its objectives The Department of Agricultural and Cooperation in association with National Committee on Plasticulture Applications in Horticulture (NCPAH) therefore selected Ms Global AgriSystem Pvt Ltd to undertake the Impact Evaluation Study in 13 selected States The study was carried out in 64 districts of the country and more than 7400 beneficiaries and non-beneficiaries were interviewed The study reveals that the scheme has benefitted the farmers in term of enhanced productivity and reduced cost on electricity and fertilizers The average productivity of fruits and vegetables has increased about 4230 percent and 5280 percent respectively Besides the Scheme has also succeeded in reducing the irrigation cost which was found to have been reduced by 20-50 percent with average of 3230 percent Use of micro irrigation system has also helped the farmers in cutting down the electrical consumption which was found to have been reduced by about 31 percent Successful implementation of the Scheme has also led to average reduction in fertilizer usage with average reduction of about 28 percent in total fertilizer consumption in the surveyed states The study received continuous support and encouragement from Mr Sanjeev Chopra Joint Secretary amp Mission Director (MIDH) MoA Government of India and I extend my heartfelt thanks to Mr Chopra for his continuous support and guidance in preparing this report We gratefully extend our appreciation to Mr Krish S Iyengar Executive Director and Mr Naresh Modi Mr Alok Mishra Mr Rohit Lall of the National Committee of Plasticulture Application in Horticulture (NCPAH) for sparing their valuable time to guide us during the entire project duration We also appreciate the help provided by Mrs Sadhna Khanna under Secretary MoA GoI and Dr Jose C Samuel Chief Consultant (NHM)
ii
It would have been impossible to complete this study without the support of 7400 farmers and other stakeholders such as system suppliers financial institutions NGOs PRIs etc spread over 13 states We extend our gratitude to these farmers who deserve special appreciation for extending their willing cooperation in giving their valuable time responding to the questionnaire and share their views and concerns during the field study We also take opportunity to thank State Agriculture as well as Horticulture Department amp other stakeholders of the 13 States where the study was undertaken Members of the team have put in lots of hard work and duly deserve appreciation for carrying out the survey Prof BK Sikka Agro Economist and Prof JN Raina eminent Soil Scientist deserve our special appreciation for their guidance
If the study helps the policy makers to make this scheme more effective and useful we would feel that the effort has been worth it
Gokul Patnaik (Chairman)
i
Table of Contents Contents Executive Summary I
1 Introduction 1
11 Project Background 1
12 Salient Features of the Scheme 2
13 The Assignment 4
14 Objectives of the Study 4
2 Approach and Methodology 5
21 Approach 5
22 Methodology 6
221 Sources of Data Collection 7
222 Sampling 8
223 The Sample Design 8
224 Selection of Beneficiaries and Non-beneficiaries 9
23 Limitations of the Study 11
3 Assessment of Current Status 13
31 Performance of MI Scheme 13
32 State wise Performance 15
33 Targets and Achievements 15
34 Performance of Scheme for Area Coverage as Compared to Potential 21
35 Pattern of Assistance 22
351 Indicative Cost of Installing Micro Irrigation System 22
352 State-wise Pattern of Assistance 23
353 Quantum of Subsidy and Adoption of MI System by Farmers 24
354 State Implementing Agencies 25
355 Extent of Convergence with Other Schemes 26
356 Food Security and the Micro Irrigation Scheme 27
36 Mission Structure Review 29
361 National Level 29
362 State Level Micro Irrigation Committee (SMIC) 30
ii
363 District Level Micro Irrigation Committee (DMIC) 33
364 Improving Efficacy of the Institutional Mechanism 34
37 Role of Panchayati Raj Institutions (PRIs) in NMMI Scheme 35
4 Primary Survey Respondentsrsquo Profile and Findings 36
41 Demographic Profile (Sampled Beneficiaries amp Non-beneficiaries) 36
411 Size of Land Holding 36
412 Categories of Farmers 38
413 Gender 39
414 Educational Status 39
415 Status of Communication Facilities 41
42 Results and Discussions 42
421 Quality of soil and irrigation water 42
422 Sources of Irrigation 44
423 Water Table 45
424 Sources of Awareness about NMMI Scheme 46
425 Reasons for Non-adoption of Micro Irrigation Systems 48
426 Willingness of Non Beneficiaries to Adopt MI System 49
427 Progress of Installation of MI System 50
428 Average Cost of Installing the MI System 50
429 Factors Influencing Farmers to Adopt MI system 51
4210 Subsidy Disbursement 52
4211 Sources of Margin Money 53
4212 Interest Rates on Borrowing 53
4213 Type of MI system and Area Coverage 54
4214 System Demonstration 64
4215 Training and Capacity Building 64
4216 Availability of Electricity 68
4217 Capacity of Pump Sets 69
4218 Irrigation Filters 69
4219 Type of Emitters in drip system 72
4220 Type of Sprinkler 73
4221 Farmersrsquo opinion on System Supply and Installation related constraints 74
4222 After Sales Service 75
iii
4223 Warranty 77
4224 Promotional Activities 78
43 Observations of Field Staff on MI System 79
44 Assessment of the System Design 80
45 System Suppliers 82
5 Impact Evaluation 87
51 Crop Diversification 87
52 Area Expansion under Micro Irrigation 89
53 Increase in Irrigated Area due to Water Saving 89
54 Development of marginal and wasteland by beneficiaries 90
55 Dripper spacing 91
56 Reduction in Cost of Irrigation 94
57 Electricity Consumption 94
58 Economy in Fertilizer Use 95
59 Increase in Crop Productivity 96
510 Reduction in these Cost of Inputs of Irrigation amp Productivity Enhancement Crop-wise 98
511 Introduction of New Crops 102
512 Increase in Farmerrsquos Income 104
513 Benefit-Cost Ratio 105
514 Increase in Area 108
515 Potential area that can be brought under Micro Irrigation 109
516 Employment Opportunities 110
5161 On Farm Employment Generation 111
5162 Off-Farm Employment Generation 111
517 Impact on Employment 111
6 Conclusions amp Recommendations 113
References 125
Appendices 127
iv
Annexure I Processes of Implementation 127
Annexure II State wise Physical amp Financial Targets amp Achievements 136
Annexure III Questionnaires 140
List of Tables
Table 1 Methodology Adopted for Impact Assessment 6 Table 2Sampling Plan 8 Table 3 State wise List of Sampled Districts Covered in the Study 9 Table 4 State wise Sample Distribution for the Study 10 Table 5 Year wise Area under Different MI Systems of Sampled Beneficiaries 14 Table 6 Comparison of Subsidy between Pre and Post NMMI Scheme 14 Table 7 State wise Cumulative Physical amp Financial Targets and Achievements 16 Table 8 Year wise Cumulative Physical and Financial Targets and Achievements 17 Table 9 Year amp State wise Physical Targets and Achievements (lsquo000rsquo ha) 19 Table 10 Year and State wise Financial Targets and Achievements (Rs Crores) 20 Table 11 Potential and Actual area under Drip amp Sprinkler Irrigation 21 Table 12 State wise Quantum of Subsidy to Different Categories of Farmers 23 Table 13 State wise Quantum of Subsidy and Area Coverage 24 Table 14 State-Implementing Agencies for NMMI 25 Table 15 Performance of the Functioning of SMICs in Sampled States 32 Table 16 Performance of the Functioning of DMICs in Sampled States 34 Table 17 Land Holding Status of Beneficiary and Non Beneficiary Farmers 37 Table 18 Size and Distribution of Operational Holdings 38 Table 19 Category wise Proportion of Beneficiary and Non Beneficiary Farmers 38 Table 20 Gender Status of Beneficiaries and Non Beneficiaries 39 Table 21 Education Status of Beneficiaries and Non-beneficiaries 40 Table 22 Mobile Phone Ownership 41 Table 23 Extent of Soil Salinity (in sampled states) and Beneficiaryrsquos Responses on Soil and Water
Testing 43 Table 24 Extent of Awareness about Important Soil and Water Quality Parameters 44 Table 25 Source of Irrigation Water 45 Table 26 State wise Water Table Depth 45 Table 27 Sources of Awareness Reported by Beneficiaries () 47 Table 28 Source of Awareness of Scheme Reported by Non-beneficiary () 48 Table 29 Reasons for Non-adoption of NMMI Scheme () 49 Table 30 Willingness of Non-beneficiaries to Install MI System 49 Table 31 Year of Installation of MI System () 50 Table 32 Average Cost of Installing MI System (Rsha) 50 Table 33 Reasons for Adoption of Micro Irrigation Systems 51 Table 34 Farmerrsquos Responses for Time Taken to Sanction Subsidy () 52 Table 35 Source of Finance for Meeting Beneficiary Share for Installation of MI System 53 Table 36 Rate of Interest Paid by the Beneficiaries on Borrowed Funds 54 Table 37 Proportion of Farmers having Drip and Sprinkler MI Systems 54 Table 38 Drip amp Sprinkler System wise Area Coverage by Sampled Beneficiaries 55 Table 39 Crop wise Area Coverage under Drip and Sprinkler Systems in AP (Sampled Beneficiaries) 56
v
Table 40 Crop wise Area Coverage under Drip and Sprinkler Systems in Bihar (Sampled Beneficiaries) 56
Table 41 Crop wise Area Coverage under Drip and Sprinkler Systems in Chhattisgarh (Sampled Beneficiaries) 57
Table 42 Crop wise Area Coverage under Drip and Sprinkler Systems in Gujarat (Sampled Beneficiaries) 58
Table 43 Crop wise Area Coverage under Drip and Sprinkler Systems in Haryana (Sampled Beneficiaries) 58
Table 44 Crop wise Area Coverage under Drip and Sprinkler Systems in Karnataka (Sampled Beneficiaries) 59
Table 45 Crop wise Area Coverage under Drip and Sprinkler Systems in Maharashtra (Sampled Beneficiaries) 59
Table 46 Crop wise Area Coverage under Drip and Sprinkler Systems in Odisha (Sampled Beneficiaries) 60
Table 47 Crop wise area Coverage under Drip and Sprinkler Systems in Rajasthan (Sampled Beneficiaries) 61
Table 48 Crop wise Area Coverage under Drip and Sprinkler Systems in Sikkim (Sampled Beneficiaries) 61
Table 49 Crop wise Area Coverage under Drip and Sprinkler Systems in Tamil Nadu (Sampled Beneficiaries) 62
Table 50 Crop wise Area Coverage under Drip and Sprinkler Systems in UP (Sampled Beneficiaries) 63 Table 51 Crop wise Area Coverage under Drip and Sprinkler Systems in Uttarakhand (Sampled
Beneficiaries) 63 Table 52 Exposure of Beneficiary Farmers to MI Demonstrations 64 Table 53 Topic Covered in Training for Beneficiary Farmers 66 Table 54 Institution for Training as Reported by Respondents ( Beneficiaries) 67 Table 55 Availability of Electricity (Beneficiaries and Non Beneficiaries) 68 Table 56 Capacity of Pump Sets Used by Beneficiaries 69 Table 57 Type of Irrigation Filters Used by Farmers 71 Table 58 Type of Emitters Used by Beneficiaries 73 Table 59 Type of Sprinklers Used by Beneficiaries 74 Table 60 Constraints Faced by Beneficiary Farmers () 75 Table 61 Status Reported by Beneficiaries Regarding lsquoAfter Sales Servicesrsquo 76 Table 62 Status of Warranty for MI System () 77 Table 63 Awareness about Promotional Activities 78 Table 64 Observations of Surveyors regarding MI System Status at the Time of Field Visit 79 Table 65 Assessment of the System Design 81 Table 66 State Wise List of Registered MI System Suppliers 83 Table 67 Impact on Crop Diversification and Usage of Marginal and Degraded Land by
Beneficiaryrsquos data 88 Table 68 Increase reported by Beneficiaries in Irrigated Area (ha) after Installation of MI System 90 Table 69 Marginal Degraded Land brought under Cultivation after Installation of MI System by
Beneficiaries 91 Table 70 Spacing followed by Sampled Beneficiaries for Fruit Crops (m) 92 Table 71 Spacing followed by Sampled Beneficiaries for Vegetables Flowers and Other Crops (m) 93 Table 72 Reduction in Cost of Irrigation with MI system 94 Table 73 Reduction in Electricity Consumption 95 Table 74 Reduction in Fertilizer Consumption 96
vi
Table 75 Productivity Enhancement of Fruit Crops (MTha) 97 Table 76 Productivity Enhancement of Vegetable Crops (MTha) 97 Table 77 Crop wise Details of Reduction in Cost - Fruits 98 Table 78 Crop wise Details of Reduction in Cost - Vegetables 99 Table 79 Crop wise Details of Reduction in Cost - Flowers 101 Table 80 Crop wise Details of Reduction in Cost - Non-horticulture Crops 101 Table 81 Crops Adopted after Installation of MI System 102 Table 82 Extent of Adoption of New Crops after Installation of MI System 103 Table 83 Increase in Farmerrsquos Income 104 Table 84 Benefit Cost Ratio of MI System for Important Fruit Crops 106 Table 85 Benefit Cost Ratio of MI System for Important Vegetable Crops 107 Table 86 Benefit Cost Ratio of MI System for Important Floriculture Crops 108 Table 87 Percent Increase in Irrigated Area on Installation of MI System 108 Table 88 District wise Potential for Installation of MI System in Study Area 109 Table 89 Change in Manpower Requirement for Cultivation (per ha per crop cycle) 112 Table 90 State wise Physical and Financial Target amp Achievements during 2005-06 136 Table 91 State wise Physical and Financial Targets amp Achievements during 2006-07 136 Table 92 State wise Physical and Financial Targets amp Achievements during 2007-08 137 Table 93 State wise Physical and Financial Targets amp Achievements during 2008-09 137 Table 94 State wise Physical and Financial Targets amp Achievements during 2009-10 138 Table 95 State wise Physical and Financial Targets amp Achievements during 2010-11 138 Table 96 State wise Physical and Financial Targets amp Achievements during 2011-12 139 Table 97 State wise Physical and Financial Targets amp Achievements during 2012-13 139
List of Figures Figure 1 Percentage Annual Allocation (share in availability) of Water 1 Figure 2 States Covered for Study (Star Marked) 5 Figure 3 Physical and Financial Performance of NMMI Scheme 13 Figure 4 State wise Central Subsidy (Rs Crores) and Area Coverage (lsquo000rsquo ha) under NMMI 15 Figure 5 Year wise Targets and Achievements 17 Figure 6 State wise Cumulative Targets and Achievements (2005-06 to 2012-13) 18 Figure 7 Proportion of Area under Drip and Sprinkler Irrigation 22 Figure 8 Level of Satisfaction regarding lsquoAfter Sale Servicesrsquo 77 Figure 9 Increase in Irrigated Area () among Beneficiaries after Adoption of MI 90 Figure 10 Reduction in Fertilizer Consumption () 96 Figure 11 Extent of Adoption of New Crops by Beneficiaries () 103 Figure 12 Increase in the Income of Beneficiaries () 104 Figure 13 Subsidy Process under GGRC 130 Figure 14 Subsidy Process under APMIP 131
vii
Abbreviations Acronyms
AampC Agriculture amp Cooperation AP Andhra Pradesh APMIP Andhra Pradesh Micro Irrigation Project BIS Bureau of Indian Standards CHRBKB Chhattisgarh Rajya Beej and Krishi Vikas Ltd CIPET Central Institute of Plastic Engineering and Technology CSS Centrally Sponsored Scheme CWC Central Water Commission DMIC District Micro Irrigation Committee DoA Directorate of Agriculture DoH Directorate of Horticulture DRDA District Rural Development Agency EC Electrical Conductivity FGD Focused Group Discussion GAPL Global AgriSystem Pvt Ltd GGRC Gujarat Green Revolution Company GoI Government of India HDC Horticulture Development Society HDPE High Density Polyethylene HP Horse Power IA Implementing Agency ICT Information amp Communication Technology IEC Information Education amp Communication KGK Krishi Gyan Kendra KVK Krishi Vigyan Kendra MI Micro Irrigation MI System Micro Irrigation System Mha Million hectare Mhm Million hectare metre MIDH MoA Mission for Integrated Development Ministry of Agriculture MoWR Ministry of Water Resources NCPAH National Committee on Plasticulture Applications in Horticulture NHM National Horticulture Mission NMMI National Mission on Micro Irrigation PFDC Precision Farming Development Centre RKVY Rashtriya Krishi Vikas Yojana SAU State Agricultural University SC Scheduled Cast SMIC State Micro Irrigation Committee SPV Special Purpose Vehicle ST Scheduled Tribes ToR Terms of Reference UP Uttar Pradesh
Impact Evaluation Study of ldquoNational Mission on Micro Irrigation (NMMI)rdquo
I
Executive Summary Micro irrigation technologies (MI) are being promoted in India by the central and state governments by providing different kinds of financial institutional and technical support These technologies are promoted primarily as (1) a means to save water in irrigated agriculture (2) as a strategy to increase income and reduce poverty and (3) to enhance the food and nutritional security of rural households Despite the reported significant economic advantages and the concerted support of the government and NGOs the current area under micro irrigation in India remains an insignificant proportion of its potential Rising demand for irrigation water in the face of its inefficient use and concerns of growing water scarcity which has brought into renewed focus for conserving water and combating water scarcity including efforts in improving water use efficiency with the available water resources The real thrust on promoting MI adoption largely started with the recommendations of the Report of the Task Force on Micro Irrigation in 2004 The report sought to increase the emphasis on MI technology and recommended the Centrally Sponsored Scheme (CSS) in 2005-06 The Scheme was further upscaled into Mission Mode in 2010 to accelerate the rate of adoption of micro irrigation technologies under central sector programs
Government of India Ministry of Agriculture Department of Agriculture and Cooperation assigned the study on ldquoImpact Evaluation of National Mission on Micro Irrigation (NMMI)rdquo to access the performance of the programme implementation and access the impact of this Scheme on increase in farmersrsquo income through adoption of the MI system
The study was conducted in 13 states comprising of 64 districts in the sampled states namely Andhra Pradesh (AP) Bihar Chhattisgarh Gujarat Haryana Karnataka Maharashtra Odisha Rajasthan Tamil Nadu Sikkim Uttar Pradesh (UP) and Uttarakhand The field survey to get first-hand information was conducted for a total sample of 7400 comprising beneficiary and non-beneficiary farmers in these selected states by adopting stratifiedndashpurposive-sampling design Apart from this information was also collected from MI system suppliers and government officials under State Horticulture Mission and related departments Owing to promotional schemes introduced by the state and central governments the area under micro irrigation has increased from 11817 ha in 2005-06 to over 361
Impact Evaluation Study of ldquoNational Mission on Micro Irrigation (NMMI)rdquo
II
million ha in 2012-131 under NMMI in the country Despite having many advantages over conventional method of irrigation the area under micro-irrigation presently occupies only about 571 percent of the total potential area As per the available data only 285 percent of total irrigated area is under drip irrigation and 286 percent is under sprinkler irrigation Findings of the Study
A Current Status
i The Scheme since its inception in 2005-06 has made rapid stride across the country It has succeeded in bringing about 356 million ha area under micro irrigation in the sampled 13 states2 The physical targets for the period 2005-06 to 2012-13 were fixed to the extent of 383 million ha out of which 356 million ha has been brought under MI The Targets and achievements for financial outlay were Rs50128 and Rs50065 crores respectively The overall physical and financial achievements thus come out to be 9299 amp 9987 percent The extent of achievements however varied among different states States like Bihar Karnataka Odisha Rajasthan and Sikkim achieved more than 90 percent of the set physical and financial targets Uttarakhand could achieve only 21 percent of physical and 31 percent of the financial targets Other States such as AP Chhattisgarh Gujarat Haryana Maharashtra and Tamil Nadu succeeded to achieve more than 70 of their physical targets
ii AP Gujarat amp Maharashtra are leading states in the every aspect of performance the different activities involved in the process streamlined in the guideline of NMMI While Bihar UP Sikkim amp Uttarakhand states are lacking in terms of the functions mentioned in the guidelines
B Pattern of Assistance (subsidy)
i Most of the states are giving subsidy of more than 70 percent for installation of MI system However comparison of various states and analysis clearly demonstrates that increased subsidy had no significant impact on the increase of area coverage under MI system Farmers in
1 NCPAH 2 Ministry of Agriculture
Impact Evaluation Study of ldquoNational Mission on Micro Irrigation (NMMI)rdquo
III
Maharashtra Gujarat and Haryana were 223 140 and 100 percent respectively in case of sampled beneficiaries while pertinent subsidy component in these states was 60 50 and 90 percent respectively Similarly area coverage in Rajasthan Tamil Nadu and Bihar was noted to be 73 45 and 31 percent respectively and the corresponding figures for subsidy were 90 75 and 90 percent The aforesaid observation clearly suggests that increase in subsidy component beyond a limit has little or no impact on area coverage under MI system The relationship between area expansion under MI and quantum of subsidy has been computed considering beneficiariesrsquo data on area expansion in different states before and after adoption of MI system Hence the relationship of subsidies with area expansion as such does not refer to any specific year
ii The efficiency of scheme implementing agency is very high as most of the farmers have reported that their applications are processed and sanctioned in less than 40 days as against 60 days specified in the guidelines Similarly in most of the sample states beneficiaries are reported to be satisfied with respect to the procedure for filing the application till disbursement of the subsidy amount
iii Presently subsidy is limited to maximum area of 5 hectare per beneficiary which is an impediment to the growth of area under micro-irrigation The data on size and distribution of operational land holdings in the country also suggest that medium and large farmers accounted about 15 percent of total land holdings but occupying more than 5542 percent of the total area Therefore increase in the limit of maximum area per beneficiary would lead to combat water scarcity as well as the sustainable agriculture
iv All the states have reported convergence of Mission interventions with different schemes of the Government of India and State level programmes Most of the districts have converged NFSM and other programmes such as RKVY ICDP Farm Mechanization NHM etc
C Sources of Awareness and Reasons of Non-adoption
i The major sources of awareness about the NMMI scheme were MI system suppliers followed by fellow farmers and extension workers
Impact Evaluation Study of ldquoNational Mission on Micro Irrigation (NMMI)rdquo
IV
ii The non-beneficiaries farmers had mix responses for not adopting the scheme because of lack of awareness regarding subsidies lack of technical knowledge high capital cost and system being not economic for their crops and therefore not required
iii As per primary survey of the sampled beneficiaries about 59 percent of the respondents were small amp marginal farmers and 13 percent were women farmers who have taken the advantage of the Scheme
D System Cost and Sources of Fund
i On an average the cost of system per hectare incurred by the beneficiaries ranged between Rs 5445736 to Rs 7208631 in drip system and Rs 20481 to Rs 28171 in sprinkler irrigation system depending on the cropping pattern crop spacing etc
ii Almost in all states farmer beneficiaries use their own funds for contributing margin money (9866) Other sources albeit a small proportion constitutes banking KCC amp money lenders
iii Most of the farmers borrowed money at less than 10 percent of rate of interest from banks and KCCs
E Technical Observations about MI System
i It was observed that about 64 percent of the beneficiaries installed drip system 34 percent sprinkler system and 2 percent have installed both the systems in their fields The highest proportion of drip was observed in Karnataka because of higher proportion of area under horticulture crops whereas adoption of sprinkler was higher in Bihar because of higher proportion of area under field crops
ii The majority of the beneficiaries (about 6887) farmers of all the 13 states have got their soil and water tested In Gujarat UP Maharashtra amp Rajasthan soil testing adopted by 6927 5275 7337 and 7913 of respondents respectively
iii More than 70 percent of the respondent farmers of AP Gujarat Sikkim and Odisha were using in-line drip irrigation system whereas more than 45
Impact Evaluation Study of ldquoNational Mission on Micro Irrigation (NMMI)rdquo
V
percent beneficiaries of Haryana and Uttarakhand reported to practice on-line drip irrigation system
iv The farmers were using screen filters centrifugal separators hydro-cyclone filter disc filter sand media filters depending on the need The data reveals that screen filters are being commonly used by the beneficiaries in most of the sampled states except Haryana where more than 65 percent beneficiaries are using hydrocyclone and screen filters in combination due to the water quality as they are using canal water Moreover additional subsidy is being provided on hydrocyclone type of filters to ensure the complete removal of organic and inorganic contaminants
v The farmers in almost all the states reported that components of MI System met the BIS norms The average figure for all the sampled states where system components were as per the BIS norms came out to be around 98 percent
vi It was informed that the systems were well designed except in case of Sikkim and Odisha where the systems were functional but not able to meet the farmers expectation in totality
F After Sales Services
i On an average 91 of the beneficiaries across the sampled states reported that after sales services are being provided to them amp also they receive the services at the required time Most of the sampled beneficiaries revealed that they are getting warranty of the MI system
ii In almost all the states the sampled beneficiaries revealed that no technical support guidance on agronomic practices are extended to the users as they generally tell to take the help of extension agencies
G Impact Analysis
i The irrigated area has increased in all the surveyed states after the introduction of NMMI Scheme The Irrigated area within the 5892 sampled beneficiaries of the 13 states before adoption of MI system was found to be 1332086 ha which became 1444147 ha after adoption of MI system It is therefore concluded that total percentage increase in irrigated area with
Impact Evaluation Study of ldquoNational Mission on Micro Irrigation (NMMI)rdquo
VI
the sampled beneficiaries in 13 states after adoption of MI system was noted to be 841 from same source of water Maharashtra has topped the list with 2228 growth in irrigated area followed by Chhattisgarh
ii Farmers of all the states have shown an increase in area under horticulture crops after the adoption of the MI system The cropped area after implementation of CSS for promotion of MI during 2005-06 and subsequently NMMI has shown an increase which may be due to utilization of degraded marginal land into cultivable land amp increase in cropping intensity
iii Scheme has performed well in terms of reduction in input cost and significant cost saving has been observed for irrigation in all the surveyed states Irrigation cost is reduced by 20-50 with average of 323 Reduction in electricity consumption after installation of MI system Average electricity consumption has been reduced by about 31 after using the micro irrigation system Saving of fertilizers with averages reduction of about 28 in total fertilizer consumption in the surveyed states Fertilizer saving vary from 7- 42
iv Micro irrigation has generated benefits to the farmers in terms of enhancement of the productivity The average productivity of fruits and vegetables has increased about 423 and 528 respectively mainly because of crop spacing judicious use of water and other inputs etc
v The overall benefits accrued from the micro irrigation system are reflected in the income enhancement of the farmers All the surveyed states reported increase in farmerrsquos income in the range of 20 to 68 with an average increase of 485
vi Benefit Cost (BC) ratio of installing micro irrigation system is greater than ldquo1rdquo across the states and across the crops which signifies the importance of MI system in net income enhancement of the farmers The BC ratio was observed to be highest in Odisha among fruits amp vegetables whereas in flowers Rajasthan amp Haryana beneficiary farmers achieved higher BC ratio
vii The positive outcomes have made the food security effective due to the increase in the production and productivity of different crops and increased area under irrigation from same source of water Area under horticulture crops as well as nutritional security has also enhanced
Impact Evaluation Study of ldquoNational Mission on Micro Irrigation (NMMI)rdquo
VII
H Employment Generation
i Beneficiaries of all the states under study have shown decrease in utilization of the labor in pre-harvest practices that is labor saving on irrigation weeding fertilization and other operations It shows that the use of human labor after the use of micro irrigation has decreased significantly and ranges between 741 to 1875 percent But in post-harvest operations right from harvesting to handling and disposal of the produce there is an increase in labor utilization and it ranges between 2119 to 5023 percent due to the increase in the production which requires more of the labor for harvesting assembling and grading handling transportation and disposal of the produce
I Training and Capacity Building
i Among the surveyed states more than 90 percent of the sampled beneficiary farmers in the state of Haryana Karnataka Sikkim amp Tamil Nadu had training on different aspects of MI System whereas farmers of Bihar amp Odisha only 20 amp 52 percent of the beneficiaries have received the training
ii Results of survey revealed that the system suppliers manufacturers are the major sources for imparting training as more than 90 percent of the farmers received training from them Very less proportion of the respondents reported to have training from other sources such as SAUs KVKs etc The participant beneficiaries revealed that the duration of training period generally was of 1-2 days Almost all the respondents of Tamil Nadu UP Chhattisgarh Haryana were given training materials during the training while few beneficiaries of the Bihar and Uttarakhand Karnataka were provided such training materials
iii Key areas for training were operation and maintenance of the system adoption of package practices under MI and opportunities for introducing new crops Demonstration was other means of motivation and capacity building It was also found to be a good means of promotion
J Promotional Activities
i The farmers of the majority of the states acknowledged that the implementing agencies are promoting NMMI schemes in local language
Impact Evaluation Study of ldquoNational Mission on Micro Irrigation (NMMI)rdquo
VIII
however were not aware of the dedicated website for MI scheme in their state It is due to the fact that most farmers do not have access or willingness to use internet for information gathering
ii It was noted that maximum beneficiaries of Haryana (98) followed by Sikkim (80) Rajasthan (64) and Uttarakhand (63) have visited the demonstration trials laid out in the nearby areas
Thus it may be concluded that positive outcomes in terms of crop productivity enhancement due to implementation of MI Scheme have contributed significantly to food and nutritional security requirements The NMMI has helped to widen the food basket of the country with significant contributions coming from the bringing more area under irrigation and with judicious use of water New farm practices and innovations with support of government have encouraged the farmers to shift toward new crops giving higher income
It is noteworthy that the incremental net returns were observed to be generally higher for cash crops such as fruits vegetables groundnut cotton etc than for food crops viz bajra and wheat
Recommendations and Policy Implications
Given the vast potential benefits of micro-irrigation and fast decline of availability of water for irrigation in the country a number of technical and policy interventions are required to be introduced so as to increase the adoption of micro-irrigation in India The needed recommendations and interventions are presented below
A Scheme Related
1) The rate of subsidy provided under NMMI through central government is fixed uniformly for different categories of farmer with a limit of 5 hectare This needs to be restructured as about 15 of the large and medium farmersrsquo accounts for more than 5542 of the land in India Therefore this limit of five hectares needs to be enhanced for extending the subsidy
2) States often compete with each other to increase the subsidy component However it has been noted that higher subsidy does not necessarily lead to more area coverage under MI system as the highest increase in area under MI has been achieved by states which offer subsidy in the range of 50-75 percent eg Maharashtra Chhattisgarh Gujarat and Odisha In case of AP which increased subsidy from 70 to 90 percent in 2011-12 the additional area to come under MI in
Impact Evaluation Study of ldquoNational Mission on Micro Irrigation (NMMI)rdquo
IX
fact decreased as compared to the previous years It is therefore recommended that the states should be advised to seriously consider that the quantum of subsidy should preferably be not more than 50-70 percent including state and central share
3) No uniform pattern is being followed by states for implementation of this scheme It has been observed that in some states more than one department are involved in parallel eg Karnataka where it is being implemented by both agriculture and horticulture departments In such cases there is often lack of coordination which adversely affects the outcome of the scheme It has also been observed that where a single department is designated as the implementing agency (eg horticulture or agriculture) it does not pay adequate attention to the crops coming under the purview of other departments Perhaps one of the best implementation strategies is to designate an independent Special Purpose Vehicle (SPV) on the pattern of Gujarat (GGRC) and AP (APMIP) States may be encouraged to replicate such a strategy
4) The penetration of MI is only 5 of the irrigated area even in the states under study where there is a lot of emphasis on NMMI penetration is only 1118 percent of the potential (identified by various studies ref India Stat) It is proposed that NMMI may fix a target of achieving 25 of the potential during XII plan by addressing various constraints such as
a One of the major reasons for the slow growth of micro-irrigation in India is the high initial investment In spite of availability of subsidy from state agencies majority of the farmers are reluctant to invest in micro-irrigation system even in horticulture crops which is highly suitable for drip irrigation Therefore micro-irrigation system should be planned and designed based firmly on location specific parameters to reduce the cost of installation as well as promoting low cost technology so that poor farmers can also participate
b Capacity building activities for operation and maintenance of system crop diversification using most economical and appropriate Package of Practices etc need to be made an integral part of the programme and be made mandatory for each and every beneficiary The tool to deliver could be MI system supplier in co-ordination with SAU and extension department of the state
Impact Evaluation Study of ldquoNational Mission on Micro Irrigation (NMMI)rdquo
X
5) Micro irrigation System is mostly promoted through subsidy schemes and not as an on-farm water and land management strategy In certain states under subsidy scheme the requisite consideration have not been given in respect of field size shape topography type and location of water source seasonal fluctuations type of soil and crop to be grown As a result in certain cases the subsidy may not match the specific situation of an individual farmer consequently the system may not match the site specific situations of an individual farmers consequently the system may not operate to the complete satisfaction of the farmer
B Technology Related
1) There is a need to establish a Central Testing Facility (CTF) to deal comprehensively with the design development and testing of all equipments devices machines used in micro irrigation systems using state-of art technology It is suggested that the Government may consider contacting regular and random technical audit of the system to cover about 2-3 percent beneficiaries within first and second year of the installation This will keep check on to quality and suppliers will be more vigilant to supply good quality of system
2) It is suggested that the implementing agencies should be more vigilant regarding warranty and after sales service of the system provided by the suppliers It is proposed that 10 percent of the subsidy may be released after one year subject to satisfactory performance of the system as certified by the beneficiary Maintenance manual in vernacular language should be made available to the beneficiaries at the time of installation of the system
3) It is observed that the cost of micro-irrigation accessories such as emitters filters laterals etc vary between shops and places Sometimes farmers do face problem in getting spare parts in time It is necessary to provide quality materials in time for farmers for the speedy adoption of micro-irrigation
4) Inadequate information about the operation maintenance as well as the usefulness of micro irrigation is one of the main reasons for its uneven spread across regions in India Farmers still do not have full knowledge regarding the usefulness of the micro irrigation Even the adopters do not know fully how much of subsidy is available per hectare for different crops
5) Clogging of drippers mainly due to poor quality of water helps in bacterial growth which can be controlled by using chlorination which acts as a powerful oxidizing agent and vigorously attack micro-organisms such as algae fungi and bacteria
Impact Evaluation Study of ldquoNational Mission on Micro Irrigation (NMMI)rdquo
XI
Also acid is injected into drip irrigation system to lower the pH of the irrigation water and this helps in preventing the precipitation of salts such as calcium carbonate magnesium carbonate or ferric oxide It has been observed during the course of survey that the availability of sulphuric acid in the nearby towns is a major constraint and farmers are forced to purchase new spares by discarding clogged drippers It is therefore recommended that system suppliers should make acid available to the growers as part of their after sales service obligation Therefore studies need to be carried out to device efficient eco friendly de-clogging measures so that farmers do not suffer from such problems
C Awareness and Capacity Building
1) The extension network currently operated mainly by government agencies does not seem to be making significant impact on the adoption of this technology Therefore there is a need to revamp the entire extension network by involving the MI system manufactures in order to increase amp improvise the existing quality of extension services
2) MI system manufacturers should be involved intensively in promoting micro-irrigation by introducing frequent demonstration at farmersrsquo field and strategic locations in the district state The MI system manufacturers should be involved in providing advice on agronomic packages to the farmers so as to encourage the adoption of micro irrigation at a large scale
3) Since MI system suppliers are one of the major sources of creating awareness among potential beneficiaries their involvement in laying down demonstration may be increased Similarly imparting training on technical and operational aspects of the system be included as mandatory part of the training of the farmers by the system suppliers The training may also include aspects of package of practices which may be standardized by the SAUs amp other related organization and supplied to system suppliers for further dissemination to the farmers
4) Awareness on MI system is low in states like Bihar UP and Odisha Special drive is needed for exposure visits trainings to make them aware about the benefits and operation of the system The number of demonstration farms should also be increased
5) It is understood from the field study that the officials who are involved in promoting micro-irrigation technology under the GoI Scheme have inadequate knowledge about the technical and other details of MI Therefore the state
Impact Evaluation Study of ldquoNational Mission on Micro Irrigation (NMMI)rdquo
XII
government extension staffs need to undergo lsquoRefresher Courses and exposure visitsrsquo to have basics of micro-irrigation thereby enabling their role in the implementation of the scheme
D Follow up Actions
1) Though micro-irrigation has been in use in different States since mid-eighties State-wise potential area is not estimated as of today Therefore it is essential to prepare State-wise and crop-wise potential area for MI A detailed estimate on State-wise potential would be useful to fix the target to be achieved and further to develop the road map for MI adoption in the country
2) It is evident from field study that capital cost required to install micro irrigation system is relatively high Because of this reason considerable percentage of farmers have expressed that they are unable to adopt this technology for low value crops There has been a significant development in the MI technology and efforts should be on developing and popularizing low cost technologies This would help reducing the cost of the system and increasing the adoption of micro-irrigation at a large scale
3) At least one percent of the outlay on micro-irrigation needs to be earmarked for research on micro-irrigation technology and development of package of practices as well as crop diversification potential
4) The information regarding all the activities under NMMI scheme at national and state level should be under public domain Although presently very few farmers are using internet based information yet this is becoming popular and it is expected that in next few years websites and internet will become a major source of information particularly among younger population Therefore the website of NCPAH be made more popular and content may also be increased to include PoP and crop diversification
Impact Evaluation Study of ldquoNational Mission on Micro Irrigation (NMMI)rdquo
1
1 Introduction 11 Project Background Water is one of the most critical inputs for agriculture however the share of water availability to the agriculture sector is declining at an alarming rate due to its ever increasing demand for the energy industry and domestic purposes Much of the available irrigation water in India is applied through the conventional surface irrigation methods which involve huge conveyance and distribution losses resulting in low overall irrigation efficiencies (35-40) The poor irrigation efficiency of these systems not only reduce the anticipated outcomes from investments in the water resources but also create environmental problems like lowering of water table due to over-exploitation of sub-surface water resources water-logging and soil salinity thereby adversely affecting the crop yields
Figure 1 Percentage Annual Allocation (share in availability) of Water
Source Central Water Commission MoWR GoI
On the other hand the situation of cropping under irrigated and rain fed conditions is quite decimal There is a decimal chance of further enhancement to the area under irrigation which calls for improving the water use efficiency of the available water resources which can be accomplished through the proven water saving technologies such as micro irrigation systems The term micro irrigation describes irrigation systems that deliver water through small devices directly in the plant root zone at prescribed rate at regular interval of time
Impact Evaluation Study of ldquoNational Mission on Micro Irrigation (NMMI)rdquo
2
In countries like Israel the water-use efficiency in agriculture sector has been improved in physical (technical) terms of water use per tonne of output (or hectare irrigated) due to improvements in agricultural water use efficiency As a consequence the share of agriculture in total water use fell from over 70 percent in 1980 to 57 percent by 2005 and further it is projected to decline to 52 percent by 20253 Even in Indian scenario Micro-irrigation (MI) methods have been found to have significant water saving and crop productivity benefits Studies have claimed water saving of 40 ndash 80 percent and productivity gains up to 100 percent (Raina et al 1999 2013 Sivanappan 1994 Palanisami et al 2011) Keeping these advantages in view the Government of India (GoI) constituted a Task Force in 2004 to assess the potential of MI technologies in the country The Report of the Task Force sought to increase the emphasis on MI technology and recommended a broader framework viewing adoption of MI technologies as a part of the overall water management strategy It also recommended allocation of more financial resources of subsidies for MI adoption with state governments contributing 10 percent of the cost while the central funds would account for 40 percent and advised greater flexibility for states to determine their appropriate implementation structure and institutional mechanisms for subsidy disbursement The main objectives of the National Mission on Micro Irrigation are as follows
To increase the area under micro irrigation through improved technologies To enhance the water use efficiency in the country To increase the productivity of crops and farmersrsquo income To establish convergence amp synergy among on-going Government
programmes To promote develop and disseminate micro irrigation technology for
agriculture horticulture development with modern scientific knowledge To create employment opportunities for skilled and unskilled person especially
unemployed youth
12 Salient Features of the Scheme NMMI is a Centrally Sponsored Scheme in which 40 of the cost of the MI system is borne by the Central Government 10 by the State Government and the remaining amount is borne by the beneficiary either through his her own resources or loan
3 OEDC-FAO Agricultural Outlook 2012-2021
Impact Evaluation Study of ldquoNational Mission on Micro Irrigation (NMMI)rdquo
3
from financial institutions In respect of small and marginal farmers the share of Central Government increases by 10 to make 50 of the cost of the system The main features of the scheme are
All categories of farmers are eligible to avail assistance under this scheme Assistance to farmers is limited to a maximum area of five (5) ha per
beneficiary Assistance for laying down demonstration on farmers field are given 75
subsidy for a maximum area of 05 ha per demonstrate and is met entirely by the Central Government
Assistance is available for both drip and sprinkler irrigation for wide spaced as well as close spaced crops However assistance for sprinkler irrigation system is available only for those crops where drip irrigation is uneconomical
Assistance is available for irrigation systems for protected cultivation including greenhouses polyhouses and shade net houses
The subsidy amount is calculated taking into consideration cost of fertigation with fertilizer tank venturi systems sand filters media filters hydro-cyclone filters sand separators and other different type of filters and valves required for MI system
Panchayati Raj Institutions (PRIs) are involved in promoting the scheme identification of priority areas identification of beneficiaries and organizing interactive meetings with the representatives of micro irrigation industry
At the National Level the Executive Committee of NMMI reviews the progress of NMMI and approve the Annual Action Plans of States At the State level the State Micro Irrigation Committee (SMIC) oversees the implementation of the Mission programme in districts The District Micro Irrigation Committee (DMIC) coordinates the implementation of NMMI programme at the District level NCPAH coordinate and monitor the programme of NMMI in different States
The scheme is implemented by an implementing Agency (IA) at the State level duly appointed by the State Government Funds are released directly to the IA on the basis of approved plans for each year
The IA prepares the Annual Action Plan for the State on the basis of the district plans and get it forwarded by SMIC for approval of the Executive Committee (EC) of NMMI
The State Level Micro Irrigation Committee (SMIC) undertakes registration of System Manufacturers who are authorized to supply systems to the farmers under the NMMI subsidy scheme One of the important criteria for registration is that these manufacturers should be able to supply the systems as Bureau of
Impact Evaluation Study of ldquoNational Mission on Micro Irrigation (NMMI)rdquo
4
Indian Standards (BIS) marking and provide proper after sales service to the satisfaction of the farmers
13 The Assignment NMMI has now been in operation effectively for more than six years and the government feels that this is the right time to asses and quantify the impact of Scheme The Govt of India Ministry of Agriculture Department of Agriculture and Cooperation Krishi Bhawan New Delhi has engaged Global AgriSystem through open bid to carry out an Impact Evaluation Study of National Mission on Micro Irrigation (NMMI) Scheme 14 Objectives of the Study The ldquoNational Mission on Micro Irrigation (NMMI)rdquo was to be evaluated in terms of water saving increase in area production and productivity of major crops so as to serve various objectives of National Food Security crop diversification with the changing food consumption habits saving of various inputs such as fertilizer power etc that are of paramount importance to the country The prime purpose objectives of the study are as follows
i Transparency in identification of beneficiaries prioritizing for release of funds in order of the application approval of system suppliers timely release of financial assistance dovetailing of various MI schemes effectiveness of various MI technologies methodology adopted for record keeping auditing and effectiveness of the state implementing agencies
ii Overall performance of the programme implementation and whether the programme is being implemented as the operational guidelines of NMMI in various states
iii Employment generated due to the implementation of NMMI and efforts laid for the development of human resources wrt Micro Irrigation between FY 2005-06 to 2011-12
Impact Evaluation Study of ldquoNational Mission on Micro Irrigation (NMMI)rdquo
5
2 Approach and Methodology The evaluation study of the ldquoNational Mission on Micro Irrigationrdquo (NMMI) scheme requires a wholesome approach to find out proper impact of the scheme at the ground level Keeping in view the scope of work given ToRrsquos and with the understanding of the objectives the approach and methodologies adopted by the Consultants are summarized in the following paragraphs 21 Approach The approach adopted for the present impact evaluation study is based on use of both the secondary as well as primary data collected from 13 states conducting interviews of various stakeholders (Figure 2)
Figure 2 States Covered for Study (Star Marked)
Impact Evaluation Study of ldquoNational Mission on Micro Irrigation (NMMI)rdquo
6
The study comprised primarily adopting the following steps
Beneficiaries who availed the assistance to install MI system and non-beneficiaries from the same area village who did not install MI
Mobilisation of the study team Continuous contact and consultations with the various concern agencies and
the Client Sharing of information throughout the study period with the Client and flexibility to respond to desired changes and directions
Collection and review of reports documents government policies plans and programs
Development of questionnaires and checklists for primary data collection Interaction and interview with policy makers planners bureaucrats
development workers traders and etc Field survey in the selected areas Analysis of secondary and primary data using appropriate tools Survey of beneficiaries amp non-beneficiaries to arrive at a comparative analysis
of the advantages derived by the adopters
22 Methodology Based on above approach following methodology is adopted to carry out the evaluation study
Table 1 Methodology Adopted for Impact Assessment
Sl No Description of the Method Description of the Units Covered
1 Survey Method a Sample
Survey Selected beneficiary and non-beneficiary households
2
Rapid Appraisal Method a Focus group
discussions Beneficiary and non-beneficiary households
b Semi Structured interviews with key informants
Various implementing agencies at district and block levels Manufacturers service providers Non-Governmental Organizations(NGOs) Financial Institutions Village elders community leaders and Knowledgeable persons
Source GAPL
Impact Evaluation Study of ldquoNational Mission on Micro Irrigation (NMMI)rdquo
7
221 Sources of Data Collection
The primary data has been collected through participatory discussions and structural interviews semi- structured questionnaires for covering various evaluation parameters from various stakeholders
Farmers Officials of horticultureagriculture departments Officials of Irrigation department Scientists from Krishi Vigyan Kendras and agricultural universities Banks amp other financial institutions Social mobilizers Pradhan Opinion leadersprogressive farmers Industry
Secondary data regarding physical and financial targets amp achievements was obtained from Ministry of Agriculture amp NCPAH Other sources of published data such as NHB statistics Published research in the reputed journals GoI publications as well as Statistics from State and District level have been utilized for secondary data
Task 1 Review of Secondary Information
A desk review of secondary data regarding overall area under irrigation research work on potential of MI cropping pattern and land use progress position regarding distribution Similarly physical and financial performance relating to various components of the Scheme has been collected from MoA NCPAH and State Government agencies The information collected has thereafter been analyzed for reaching to conclusions
Task 2 Field Research and Primary Data
In depth field study has been carried out to find out stakeholdersrsquo perception and impact assessment of the scheme Field study included three segments
i A detailed survey of farmers( both beneficiaries and non-beneficiaries) through a structured questionnaire and PRA techniques
ii Implementing agencies and officials to assess the efficiency and efficacy of implementation of the scheme
iii Institutions ndash an interaction with officials of the agriculture universities to understand current technologies in micro-irrigation their adaptability to India agriculture and sustainability in the long rum
Impact Evaluation Study of ldquoNational Mission on Micro Irrigation (NMMI)rdquo
8
Task 3 Developing the Sampling Plan for primary survey and the Associated Fieldwork Schedules 222 Sampling The evaluation study was conducted in the given 13 states The detailed sampling plan followed for the evaluation study was as under
Table 2Sampling Plan
Sl No
Stage of Sampling
Sampling Unit
Criteria for Selection of
Sample Units
Sample Method Adopted
Description of the Sample Units
Number of Sample Units
1 I Stage Agro climatic regions
As per state classification Micro units Best and average
performing See Table 4
2 II Stage District
Level of Micro Irrigation coverage as proxy for development
Stratified Purposive Sampling
Additional area brought under irrigation
Best and average performing districts in ratio of 7525
4-6 districts in plain areas and 2-3 in hilly states In all 64 districts have been selected
2 III Stage Blocks Level of Development
Stratified Purposive Sampling
Additional area brought under irrigation in the block
Best and average performing blocks in ratio of 7525
5-8 blocks in plains and 5-7 in hilly states covering from each sample district A total of 398 blocks were finally selected
3 IV Stage Villages Coverage of Programmes
Stratified Purposive cum cluster Sampling
Best and average geographical connectivity
4 V Stage Households
Beneficiaries on random basis amp non beneficiaries from similar conditions
Stratified Purposive Random Sampling
Proportionate sample according to size of holding and area under micro irrigation
7400 farmers including 5892 beneficiary household from 13 states
Source GAPL
223 The Sample Design Multi-stage - stratified - purposive ndashrandom sampling design has been adopted in the study The samples have been collected from all the identified states The consultant has applied Stratified Random Sampling Method The sample is representative and has been covering all categories of farmers The sampling has been taken into account the extent of implementation of NMMI Scheme in the State
Impact Evaluation Study of ldquoNational Mission on Micro Irrigation (NMMI)rdquo
9
Selection of districts and blocks Selection has been done in a manner so as a representative data emerged from that particular sampled state The sample has covered selected districts in 13 states as per the ToR The details of sample size both of beneficiaries and a non-beneficiary across the states has been summarized in Table 4
Districts have been selected from each selected region of the state Four to seven districts (two to four from hilly states) from each state have been selected The selected districts were ranked as per their performances where one district each from the high good average amp poor performance were included for drawing samples as summarized in the following table
Table 3 State wise List of Sampled Districts Covered in the Study
S No
States Districts
1st 2nd 3rd 4th 5th 6th 7th 1 AP Anantpur Medak Nalgonda Adilabad Nellore Krishna Vishakhapatnam 2 Bihar WestChamparan Rohtas Gaya Madhepura 3 Chhattisgarh Durg Sarguja Kanker Jashpur 4 Gujarat Banaskantha Bhavnagar Jamnagar Bharuch Mehsana Anand 5 Haryana Bhiwani Sirsa Fatehabad Karnal 6 Karnataka Belgaum Hasan Bidar Chitradurga Mysore Bellary 7 Maharashtra Jalgaon Ahmednagar Jalna Kolhapur Wardha Ratnagiri 8 Odisha Ganjam Mayurbhanj Boundh Nayagarh Bhadrak 9 Rajasthan Jalore S Madhopur Jodhpur Jhalawar Hanumangarh Udaipur 10 Tamil Nadu Erode Tirunelveli The Nilgiris Thiruvarur Villupuram
11 UP Jhansi Balia Saharanpur Siddharth Nagar Kannauj Aligarh
12 Sikkim Gangtok Mangan 13 Uttarakhand U S Nagar Haridwar Nainital
Source GAPL
Further blocks were selected on the basis of coverage in area under irrigation which is taken as a proxy of development of micro irrigation infrastructure From each sample district 5-8 blocks - best and average performed blocks (7525 ratio) were selected randomly among those where MI systems have been installed 224 Selection of Beneficiaries and Non-beneficiaries Villages have been purposively selected on the basis of coverage of the programme The selection of the sampled beneficiary farmerhouseholds has been made randomly for each selected village A complete list of beneficiaries are drawn and divided into various size classes In the each selected village the households were finalized on the
Impact Evaluation Study of ldquoNational Mission on Micro Irrigation (NMMI)rdquo
10
basis of their farm holding socio-economic status and coverage of programmes Besides this non-beneficiaries were also selected to identify reasons for their non-participation in the programmes and also to compare the benefits drawn by beneficiaries compared to this category This in fact facilitated the impact evaluation study based on lsquowith and withoutrsquo approach The farmers selected for the primary survey include various categories of farmers Besides it also includes PRIs and district amp state level concerned functionaries It is pertinent to mention here that the sampling design has taken care that the beneficiaries selected are representative of overall population of the beneficiaries at State and District levels The total sample comprises of beneficiaries and non-beneficiaries in the ratio of 8020
Table 4 State wise Sample Distribution for the Study
Sl No
Name of State UT
Sample Districts
Sample Blocks district
Farmers per
block
Total respondents
Beneficiaries Non
beneficiaries
1 AP 7 6 20 840 672 168 2 Bihar 4 8 20 644 516 128 3 Chhattisgarh 4 6 20 480 384 96 4 Gujarat 6 6 20 720 576 144 5 Haryana 4 5 20 401 320 81 6 Karnataka 6 6 20 720 576 144 7 Maharashtra 6 7 20 881 672 169 8 Odisha 5 6 20 600 480 120 9 Rajasthan 6 6 20 712 574 138
10 Tamil Nadu 5 6 20 575 455 120 11 UP 6 7 20 695 527 168 12 Sikkim 2 5 6 60 50 10 13 Uttarakhand 3 6 6 112 90 22
Total 64 7400 5892 1508
Task 4 Validation of Sampling Plan and Questionnaires
Field research has been carried out on the predefined and approved questionnaires in active consultations with DAC The final sampling plan and questionnaires and field survey plans have been validated by DAC
Task 5 Pilot Testing amp Survey Preparation
In order to validate that the questionnaire were able to gather information as per design and to train the supervisors of the survey team a pilot survey was undertaken in Uttarakhand and Maharashtra The main purpose of pilot testing the survey was to check the validity of the questionnaire by finding questions or words that might be misinterpreted misread or misunderstood as well as to check the functionality of the
Impact Evaluation Study of ldquoNational Mission on Micro Irrigation (NMMI)rdquo
11
questionnaire in the field Training of the interviewers and supervisors which is one of the most important stages prior to conduct of field work was done to familiarize the interviewers with the survey instruments Task 6 Constituting Field Work Teams and Briefing Meeting with Field Supervisors and Felid Investigators
On acceptance of the final questionnaires and the sample plan the field teams were gathered in Delhi and a briefing meeting and training session had been held for the field research teams
Task 7 Primary Data Collection Exercise
During the fieldwork face to face interviews were held with various types of respondents including State Agriculture Horticulture departments and other stake holder as mentioned above were interviewed with structured information schedules and information was collected accordingly
Task 8 Stakeholder Discussion
Participatory discussion was arranged with various stakeholders at various levels as follows
I Stage At inception stage to discuss and finalize work plan questionnaire and methodology
II Stage After completion of field survey to discuss preliminary finding
III Stage After submission of DPR to discuss the recommendation and finalize the report
Task 9 Data Entry Analysis of Secondary and Primary Data and Report Writing
Both primary and secondary data is being collected compiled and tabulated and analyzed to arrive at appropriate conclusions 23 Limitations of the Study The study was conducted for 13 states and the consultant completed this study under certain limitations which were as follows
a Like any study based on sampling method the findings of the response of respondents have been extrapolated to the entire scheme for the purpose of
Impact Evaluation Study of ldquoNational Mission on Micro Irrigation (NMMI)rdquo
12
studying the achievements amp objectives of the scheme impact of the scheme and methodology of the implementation of the scheme etc
b It took almost more than one month to get the comments on the Inception Report as well as questionnaires which led to delays in the mobilization of the field work
c The consultant and the survey team got stuck during the study period due to the complications amp coordination between state amp central government authorities
d Due to natural disaster taking place in Uttarakhand the districts to be covered were changed as it was difficult to reach the selected districts
e The field work coincides with rainy season and this year there were heavy rains in few states which also hampered the field study Moreover the information regarding beneficiaries of the selected states was not provided in time therefore the survey team had to visit those areas more than one time For example in case of Haryana the survey team visited state authorities with list of districts identified for survey by consultant in consideration with MoA and NCPAH but the state authorities did not agree and wanted some time to suggest changes and therefore survey team had to wait which led to delay
f In the states like UP and Tamil Nadu the state government officials did not cooperate to provide information of beneficiaries in the beginning and consultants had to mobilize GoI authorities to send communication for co-operation which caused delay in starting field work
g In the state of UP the designed sample size has not been achieved for covering 168 farmers (beneficiaries) as number of beneficiary farmers in selected districts was less therefore the sample size has been constraint accordingly
In spite of these limitations efforts were made by the consultant to complete the study in time
Impact Evaluation Study on ldquoNational Mission on Micro Irrigation (NMMI)rdquo
13
3 Assessment of Current Status 31 Performance of MI Scheme Micro Irrigation industry in India is driven by the assistance from the central and the state governments The NMMI has given major impetus to the growth of the industry In fact the growth of the MI industry can be viewed as per growth of fund allocation to MI scheme The trend of area coverage and total subsidy advanced in the states under study has been shown in the figure 3
Annual subsidy advanced has shown increasing trends continuously except for the year 2008-09 whereas the growth of area coverage has witnessed some fluctuations in the year 2007-08 and 2012-13 Despite this fluctuation the growth in the area coverage is not proportional to the growth in fund spent The both trend lines witness convergence in growth up to 2009-10 but there after witnessed the divergence in growth
The fund spent has witnessed sudden jump after the conversion of the NMMI scheme from CSS in the year 2010-11 The fund spent has increase by about 62 percent from 2009-10 to 2010-11 and the increase in area coverage is 1538 percent in corresponding period This fact was further analyzed and the main reason for high subsidy amount is the reason of revision in the cost norm per hectare and more area coverage under drip system
The cumulative area coverage since the launch of scheme to 2012-13 in the states under study is about 356 Million ha and the total subsidy advanced till 2012-13 stood at Rs 5006 crores in the same states
Figure 3 Physical and Financial Performance of NMMI Scheme
Source Ministry of Agriculture
Impact Evaluation Study on ldquoNational Mission on Micro Irrigation (NMMI)rdquo
14
Table 5 Year wise Area under Different MI Systems of Sampled Beneficiaries
Year Area under Drip
Irrigation (ha) Area Under Sprinkler
Irrigation (ha) 2000 223 162 2001 445 000 2005 101 000 2006 15279 546 2007 17656 8282 2008 60209 21929 2009 64467 22961 2010 76567 46818 2011 128797 78328 2012 421496 202578 2013 30784 31355
Source GAPL survey
The above table depicts that the year wise area under drip is expanding more in comparison to the area under sprinklers that leads to higher system cost This may be the reason for splitting lines of physical and financial achievements after 2009 in the figure 2 It may also be inferred from the table 5 that subsidy has been increased in most of the states that caused increase in financial achievement than physical achievement which led to splitting trend line of physical and financial achievements
Table 6 Comparison of Subsidy between Pre and Post NMMI Scheme
SNo State
Total Subsidy of the farmers ()
Pre NMMI Scheme
Post NMMI Scheme Small amp
Marginal Farmers
General Farmers
1 AP 70 90 75 2 Bihar 90 90 80 3 Chhattisgarh 70 75 50 4 Gujarat 50 50 50 5 Haryana 90 90 90 6 Karnataka 75 80 50 7 Maharashtra 50 60 50 8 Odisha 70 90 80 9 Rajasthan 70 70 70
10 Sikkim 60 60 11 Tamil Nadu 65 100 75 12 UP 50 90 75 13 Uttarakhand 50 60 60
Impact Evaluation Study on ldquoNational Mission on Micro Irrigation (NMMI)rdquo
15
32 State wise Performance
AP and Gujarat were the pioneer states which harnessed the benefits of the scheme with area coverage of about 678 thousands and 504 thousands ha In 2006-07 more states were brought under the scheme and by the end of 2007-08 all the states under study except Sikkim and Uttarakhand were covered during 2011-12 The states of AP followed by Maharashtra are top in the list of area coverage as well as total subsidy advanced under MI The total cumulative central subsidy advanced and total area covered since the launch of the scheme is shown in the graph
Figure 4 State wise Central Subsidy (Rs Crores) and Area Coverage (lsquo000rsquo ha) under NMMI
Source Ministry of Agriculture
33 Targets and Achievements The states under study have achieved 9987 financial targets but the achievement of physical targets stood at 9299 The states of Gujarat and Maharashtra have achieved 100 financial targets but have not met the physical targets In Gujarat the financial utilization is 10026 due to inclusion of interest amount The state of Bihar Karnataka Odisha Rajasthan and Sikkim which have achieved more than 100 physical targets without utilizing the total allotted fund
Impact Evaluation Study on ldquoNational Mission on Micro Irrigation (NMMI)rdquo
16
It is pertinent to mention that achievements are exceeding the value of 100 percent Since the preceding year unspent balance has been brought forward to next year The scheme was launched in 2011-12 in Sikkim and Uttarakhand and the Sikkim has performed much better in physical target achievement as compared to Uttarakhand In fact Sikkim is the top performer in physical target achievements whereas the Uttarakhand is least one among the states under study as the scheme is launched few years back only The state wise cumulative (2005-06 to 2012-13) physical and financial targets vs achievement are given in the table below
Table 7 State wise Cumulative Physical amp Financial Targets and Achievements
State Physical (lsquo000rsquoha) Financial (Rs in lakh)
Target Achievement
Achievement Target Achievement
Achievement AP 87116 77205 8862 13714800 13517558 9856 Bihar 6676 7880 11804 813210 726062 8928 Chhattisgarh 13515 12602 9324 1371370 1323969 9654 Gujarat 46102 43172 9364 7247100 7265900 10026 Haryana 6638 5783 8712 882086 804293 9118 Karnataka 51096 53668 10503 6088932 5981226 9823 Maharashtra 94179 69605 7391 11542800 11542800 10000 Odisha 5406 6302 11658 506200 468763 9260 Rajasthan 57640 66307 11504 5039296 4946894 9817 Tamil Nadu 11897 11767 9890 2961660 2937490 9918 UP 2712 1883 6941 279904 254098 9078 Uttarakhand 101 022 2139 22500 7000 3111 Sikkim 039 051 13002 60000 40000 6667 Total 383117 356246 9299 50128009 50064490 9987
Source Ministry of Agriculture The major inferences drawn from table below are as follows
The scheme made rapid stride after the launch and achieved more than 80 of the targets both physical and financial in 2006-07 and the physical and financial targets have been achieved more than 100 in the subsequent year ie 2007-08 to 2009-10
The financial target achievement has been more than 100 on 2007-08 onwards except for the year 2011-12 whereas the physical target achievement has been declined after 2009-10
The Scheme has performed best in terms of both physical and financial targets achievement with around 130 achievement
The year wise cumulative (2005-06 to 2012-13) physical and financial targets vs achievement is given in table below
Impact Evaluation Study on ldquoNational Mission on Micro Irrigation (NMMI)rdquo
17
Table 8 Year wise Cumulative Physical and Financial Targets and Achievements
SNo Year Physical Financial
Target (Ha)
Achievement (Ha)
Achievement
Target (Rs)
Achievement (Rs)
Achievement
1 2005-06 18022300 1181700 656 2328415 163517 702 2 2006-07 39736500 33430060 8413 4457599 3659033 8209 3 2007-08 32404870 42117390 12997 3989632 4729348 11854 4 2008-09 42309500 51633800 12204 4172462 4678426 11213 5 2009-10 42576400 55475277 13030 4353157 5664040 13011 6 2010-11 66770000 64006900 9586 9008411 9173680 10183 7 2011-12 69819700 55752143 7985 10829000 10807615 9980 8 2012-13 71478800 52648500 7366 10989300 11188800 10182
Total 383118070 356245770 9299 50127976 50064459 9987 Source Ministry of Agriculture
Figure 5 Year wise Targets and Achievements
Impact Evaluation Study on ldquoNational Mission on Micro Irrigation (NMMI)rdquo
18
Figure 6 State wise Cumulative Targets and Achievements (2005-06 to 2012-13)
The performance of the scheme in different states and in different tenure can be sum up as under
The scheme created a good imprint in 2006-07 and achieved 8213 and 8209 of physical and financial targets respectively in the states under study In this year state of Gujarat Karnataka Maharashtra and Rajasthan achieved more than 100 of physical targets
The performance of scheme contributed to be extremely well in the year 2007-08 to 2009-10 and registered more than 100 achievement of both physical as well as financial target
Impact Evaluation Study on ldquoNational Mission on Micro Irrigation (NMMI)rdquo
19
Table 9 Year amp State wise Physical Targets and Achievements (lsquo000rsquo ha)
State 2005-06 2006-07 2007-08 2008-09 2009-10 2010-11 2011-12 2012-13 (March 13)
T A T A T A T A T A T A T A T A AP 4552 678 19346 8462 4639 11485 8521 12358 11445 13834 16550 12276 8895 10506 13169 7607 Bihar - - 1422 - - 023 - 031 - 011 - 1349 196 2329 5057 4137 Chhattisgarh - - 2875 460 1006 2083 1363 3057 1764 1577 2878 2183 1717 1839 1912 1402 Gujarat 1672 504 1825 2434 4516 4304 3356 5343 3333 6625 8034 7829 13029 6510 10338 9623 Haryana - - 537 282 722 778 3240 2230 158 326 443 934 612 579 928 654 Karnataka 2523 - 2374 3885 5352 6294 8417 9262 8131 10821 7270 8745 6317 5801 10713 8861 Maharashtra 4186 - 6512 10826 10367 8222 12876 10041 8467 9451 11803 11803 27194 11600 12775 7662 Odisha - - 331 122 103 307 375 250 758 1278 934 1201 1152 1184 1752 1961 Rajasthan 1303 - 3975 6772 4471 7374 4023 7773 8521 9556 14800 14761 10707 12218 9840 7854 Tamil Nadu 2895 - 540 - 1230 782 - 1160 - 1801 3500 2615 - 2755 3732 2654 Uttar Pradesh 891 - - 186 - 466 138 129 - 197 559 311 - 379 1125 214 Uttarakhand - - - - - - - - - - - - - - 101 022 Sikkim - - - - - - - - - - - - - 051 039 - Sub Total 18022 1182 39737 33430 32405 42117 42310 51634 42576 55475 66770 64007 69820 55752 71479 52649 Source Ministry of Agriculture
Impact Evaluation Study on ldquoNational Mission on Micro Irrigation (NMMI)rdquo
20
Table 10 Year and State wise Financial Targets and Achievements (Rs Crores)
State 2005-06 2006-07 2007-08 2008-09 2009-10 2010-11 2011-12 2012-13 (March 13)
T A T A T A T A T A T A T A T A AP 6129 934 19520 11277 5748 14559 9727 10836 14311 17829 24000 24000 28720 28720 28993 27021 Bihar - - 2482 - - 026 - 022 - 011 - 826 450 2167 5200 5340 Chhattisgarh - - 3033 256 783 1751 954 2060 1252 1193 1019 1801 3500 3500 3172 2678 Gujarat 2182 701 3356 3931 7350 4927 4899 7396 4447 5426 12000 12000 16664 16695 18200 18201 Haryana - - 444 232 604 508 1207 1278 212 385 1361 1402 1993 1667 3000 2571 Karnataka 3584 - 2457 4452 6865 7598 7319 5845 6381 8685 9254 8945 10965 9165 14065 15122 Maharashtra 4808 - 8797 13466 13897 12792 14748 13444 10707 13226 22237 22265 24980 24980 15018 15221 Odisha - - 454 143 108 101 338 293 528 871 810 697 823 893 2000 1690 Rajasthan 1048 - 2833 2687 2341 2908 2382 3009 5693 6073 12000 11620 13095 12824 11000 10347 Tamil Nadu 4291 - 1201 - 2200 1560 - 2367 - 2558 6591 7797 6625 6625 8300 13235 UP 1242 - - 146 - 562 150 235 - 381 812 383 - 441 595 393 Uttarakhand - - - - - - - - - - - - 075 - 150 070 Sikkim - - - - - - - - - - - - 400 400 200 - Sub Total 23284 1635 44576 36590 39896 47293 41725 46784 43532 56640 90084 91737 108290 108076 109893 111888
T Target A Achievement Source Ministry of Agriculture
Impact Evaluation Study on ldquoNational Mission on Micro Irrigation (NMMI)rdquo
21
34 Performance of Scheme for Area Coverage as Compared to Potential
Potential of different MI Systems in terms of drip and sprinkler has been assessed by various researchers by using the secondary data For assessing the potential of MI in different states the variables considered were state-wise and source-wise irrigation area cropped area and crops wise suitability for different MI systems Potential area is calculated on the basis of area already brought under MI system from the existing irrigated area While calculating potential area in sampled states we have also considered area under paddy which may diversify into horticultural and other cash crops in future For the purpose of arriving at some conclusion regarding performance of MI under the states data on potential area and actual area brought under drip and sprinkler irrigation in the states (NCPAH) has been analyzed
Table 11 Potential and Cumulative area under Drip amp Sprinkler Irrigation
StatesUTs
Total (Area in ldquo000 ha) Drip (Area in ldquo000 ha) Sprinkler (Area in ldquo000 ha)
PotentialIrrigated area
Cumulative area under
MI till 2012-13
Balance Potential area for
MI
Potential
area ()
Potential area
Cumulative area under
drip till 2012-13
Balance Potential
Area
Potential area ()
Potential area for
Sprinkler
Cumulative area under
sprinkler till 2012-13
Balance Potential
Area
Potential area ()
AP 6785 77100 601400 8864 506840 57605 449235 6621 171661 19495 152166 2243 Bihar 5158 7867 507933 9847 11863 181 11682 226 503937 7686 496251 9621 Chhattisgarh 1648 15655 149145 9050 12525 1172 11353 689 152275 14483 137792 8361 Gujarat 4137 43669 370031 8944 230017 24260 205757 4974 183683 19409 164274 3971 Haryana 5680 5753 562247 9899 149384 1539 147845 2603 418616 4214 414402 7296 Karnataka 4137 41485 372215 8997 156379 15697 140682 3401 257321 25788 231533 5597 Maharashtra 3806 64797 315803 8298 229882 45609 184273 4842 150718 19188 131530 3456 Odisha 1437 5199 138501 9638 28740 1042 27698 1927 114960 4157 110803 7711 Rajasthan 8903 64423 825877 9276 89030 6421 82609 928 801270 58002 743268 8349 Tamil Nadu 3519 11760 340140 9666 343103 11530 331573 9422 8797 230 8567 243 UP 19354 1869 1933531 9990 1035439 1004 1034435 5345 899961 865 899096 4646
Source Directorate of Economics amp Statistics MoA GoI NCPAH (excluding Uttarakhand amp Sikkim) Note - Analysis by GAPL It has been assessed that there is potential of bringing area under MI system is around 6117 million ha in the states under study (excluding Sikkim amp Uttarakhand) Out of this about 3490 million ha is having potential for sprinkler irrigation for crops like cereals pulses and oilseeds in addition to fodder crops The potential area for drip has been estimated in the study to be around 2627 million ha suitable for cotton sugarcane fruits and vegetables spices and condiments and some pulses crops like red gram etc The percentage of actual area against the potential estimated under drip irrigation in different states varied between 6621 in Andhra Pradesh followed by Uttar Pradesh (5345) Gujarat (4974) and Maharashtra with 4842 In case of sprinkler irrigation the percentage of actual area against the potential estimated was 243 (Tamil Nadu) and
Impact Evaluation Study on ldquoNational Mission on Micro Irrigation (NMMI)rdquo
22
the highest of 9621 (Bihar) Compared to the potential of 6117 million ha in the all eleven states the present area under MI accounts for 339 million ha (166 million ha under drip and 173 million ha under sprinkler) which is about 555 (Table 11) The present figures thus reflect the extent of MI systems covered under different government programme as well as own investment by the farmers However the actual area under MI may vary according to the extent of use by the farmers
Figure 7 Proportion of Area under Drip and Sprinkler Irrigation
Source GAPL Analysis
35 Pattern of Assistance
351 Indicative Cost of Installing Micro Irrigation System
As per the guidelines of NMMI the States have been categorized in the following categories
Category A States where more than 20000 hectares have been brought under drip irrigation come under lsquoArsquo Category This would include the States of AP Gujarat Karnataka Maharashtra Madhya Pradesh Punjab Rajasthan and Tamil Nadu
Category B All the states except those covered under the category lsquoArsquo and those falling in the Himalayan belt would come under this category
Category C All the North Eastern States Sikkim Himachal Pradesh Jammu amp Kashmir Uttarakhand and Darjeeling district of West Bengal
Impact Evaluation Study on ldquoNational Mission on Micro Irrigation (NMMI)rdquo
23
Keeping in view the level of awareness proximity to the manufacturing units distance involved in transportation potential for drip irrigation the cost of drip system in Category lsquoBrsquo States is estimated to be 15 higher than Category lsquoArsquo States while for Category lsquoCrsquo States it is estimated to be 25 higher than Category lsquoArsquo States Cooperative SocietiesSelf Help GroupsIncorporated Companies are also entitled to avail assistance on behalf of its members In such cases the individual beneficiary receives assistance through the Cooperative Society SHGIncorporate company and not directly 352 State-wise Pattern of Assistance It was observed that the states are giving subsidy on MI ranging from 50 percent to 100 percent depending on the size of the holding and category of the farmers in different states However the central share is same across the states It may be seen from the Table 12that in Tamil Nadu the quantum of subsidy is 100 percent for small amp marginal farmers whereas in AP for SCST farmers the quantum is cent percent
Table 12 State wise Quantum of Subsidy to Different Categories of Farmers
SNo State
Percentage of subsidy to small
amp marginal farmers
Percentage of subsidy to other farmers
Remarks
1 AP 90 75
APMIP arranges the following Micro Irrigation systems to farmers with government subsidy (SCST 100 subsidy) (others 90 75 60) for Drip (Inline amp Online) Semi-Permanent Sprinklers and Rain Guns
2 Bihar 90 80 About 98 area is under sprinkler irrigation 3 Chhattisgarh 75 50 About 93 area is under sprinkler irrigation
4 Gujarat 50 50 Uniform pattern of subsidy Gujarat Green Revolution Company Limited (GGRC)
5 Haryana 90 90 Additional subsidy is provided for hydro-cyclone filters
6 Karnataka 80 50 For the first 2 ha out of 5 ha per beneficiary ceiling on the area to be undertaken under the scheme
7 Maharashtra 60 50 25 per cent of the beneficiaries are small and marginal farmers
8 Odisha 90 80 Subsidy rate under NMMI wef 2013-14
9 Rajasthan 70 70 90 for drip 70 for sprinkler(mini) 60amp 50 for portable sprinkler for SCST and General Category respectively
10 Sikkim 60 60 NMMI scheme was launched in 2011-12
11 Tamil Nadu 100 75 ldquoTamil Nadu Horticulture Development Agencyrdquo (TANHODA) Subsidy effective from 2511 2011
12 UP 90 75 Subsidy rate under NMMI wef 2012-13 13 Uttarakhand 60 60 NMMI scheme was launched in 2011-12
Note The Central Government share in total subsidy is 50 for small marginal OBC SCST amp women categories and 40 for general categories Sources State Level Nodal Agencies
Impact Evaluation Study on ldquoNational Mission on Micro Irrigation (NMMI)rdquo
24
353 Quantum of Subsidy and Adoption of MI System by Farmers Increase in area under MI has not been found to be significantly higher in case of the states giving higher subsidy quantum and vice versa The Data on area coverage under MI System amp extent of subsidy provided clearly demonstrates that increasing the extent of subsidy had no significant impact on area coverage under MI system The case in point pertains to increase in area under MI in Maharashtra and Gujarat where the subsidy for small amp marginal is 60 percent and 50 percent respectively whereas the area increase was 223 and 140 percent respectively Similarly area coverage in Haryana Tamil Nadu and Bihar was noted to be 73 45 and 31 percent respectively the corresponding figures for subsidy were 90 75 and 90 percent The increase in area under MI was only 13 and 73 percent respectively for UP amp Rajasthan where subsidy level was 90 and 70 percent as per the data available from implementing agencies The aforesaid observation clearly suggests that increasing the subsidy component had no impact on area coverage under MI system The relationship between area expansion under MI and quantum of subsidy has been computed considering beneficiariesrsquo data on area expansion in different states before and after adoption of MI system A critical perusal of data on area coverage collected by our team and also the one quoted by India Statistics portal vis-a-vis the magnitude of subsidies suggests that the states should be advised to seriously consider that the quantum of subsidy to be restricted between 50-70 percent including state and central share and depicted in the table 13
Table 13 State wise Quantum of Subsidy and Area Coverage
State
Total Cultivated
Area (000 ha)
Net Irrigated
area (000 ha)
Area under NMMI
(000 ha)
Percent Irrigated
Area under MI
Area under MI Percent Increase
(Beneficiaries)
Quantum of Subsidy
() for General
Category
Quantum of Subsidy () for Small amp Marginal farmers
AP 1341500 503400 77090 1531 1240 7500 9000 Bihar 617900 303000 7870 260 310 8000 9000 Chhattisgarh 494900 135600 15650 1154 1500 5000 7500 Gujarat 1068100 423300 43660 1031 1400 5000 5000 Haryana 364000 288700 5750 199 1000 9000 9000 Karnataka 1172200 349000 41490 1189 260 5000 8000 Maharashtra 1877200 325600 64790 1990 2230 5000 6000 Odisha 555900 128400 5190 404 1100 8000 9000 Rajasthan 1958400 666100 64420 967 730 7000 7000 Sikkim 8200 1400 NA NA 070 6000 6000 Tamil Nadu 596900 291200 11760 404 450 7500 10000 UP 1780800 1338600 1860 014 130 7500 9000 Uttarakhand 76600 33600 NA NA 160 6000 6000
Source GAPL Analysis As per records of Directorate of Economics and Statistics As per records of NCPAH As per our survey in the sampled states
Impact Evaluation Study on ldquoNational Mission on Micro Irrigation (NMMI)rdquo
25
354 State Implementing Agencies The NMMI scheme is being implemented by specially designated agencies by the respective state governments and is provided one percent of the annual outlay actual release of funds for administering and monitoring the scheme at district level It has been observed that Directorate of Horticulture is the implementing agency for NMMI in nine states The scheme is implemented by Directorate of Agriculture in Maharashtra and Chhattisgarh Rajya Beej amp Krishi Vikas Ltd (CHRBKV) in Chhattisgarh In case of AP and Gujarat the scheme is being implemented by AP Micro Irrigation Project (APMIP) and Gujarat Green Revolution Company (GGRC) respectively
Table 14 State-Implementing Agencies for NMMI
State Implementing Agency Focus Nature of Association
AP APMIP Micro Irrigation SPV- relatively autonomous unit within Horticulture Department
Bihar DoH Agriculture amp Horticulture Government Department
Chhattisgarh CHRBKB Agriculture amp Horticulture Government Department
Gujarat GGRC Micro Irrigation Registered Under Companys Act Public Ltd
Haryana DoH Agriculture amp Horticulture Government Department
Karnataka DoA ampDoH Agriculture amp Horticulture Government Departments
Maharashtra DoA Agriculture amp Horticulture
Government Department
Odisha Horticulture
Development Society (OHDC)
Nodal Agency for NHM
Registered under Society Registration Act
Rajasthan Rajasthan Horticulture Development Society
(RHDS)
Agriculture amp Horticulture
Horticulture Development Society (RHDC)
Tamil Nadu DoH Agriculture amp Horticulture Government Department
UP DoH Agriculture amp Horticulture
Government Department
Sikkim DoH Agriculture amp Horticulture Government Department
Uttarakhand DoH Agriculture amp Horticulture Government Department
Source State Departments
Micro irrigation has been an integral component in some of the schemes of Horticulture Division such as schemes for area expansion The quantum of subsidy varies in these schemes as compared to NMMI scheme This goes against the principle of convergence of schemes It is recommended that assistance for micro irrigation component on pattern of NMMI may be made available under ongoing area expansion schemes
Impact Evaluation Study on ldquoNational Mission on Micro Irrigation (NMMI)rdquo
26
It has been observed that the scheme implemented by the state departments such as horticulture agriculture and others are not fully yielding the desired results because of the following
1) The state departments are also occupied with their own targets and other related activities and are not able to devote desirable time for the implementation of NMMI activities
2) This also creates bias toward their own field such as horticulture department may not give due consideration to field crops etc
3) The extension workers of state departments are involved in providing extension services training and field demonstrations etc of their parent department which affects their working
It is being proposed that separate institute may be created in the line of AP and Gujarat model so that effectiveness transparency monitoring and targets are fully achieved The subsidy process flow charts for AP amp Gujarat are given in Annexure I The consultant has no bias against state departments or government institutions but for meeting the objectives of NMMI such recommendations have been proposed
355 Extent of Convergence with Other Schemes
One of the objectives NMMI scheme is to establish convergence and synergy among different on- going programmes in the country During the course of the study it was observed that in case of NMMI scheme there has been convergence among various on- going programmes such as National Food Security Mission (NFSM) NHM RADP RKVY Integrated Scheme of Oilseeds Pulses Oil palm and Maize (ISOPOM) Technology Mission on Cotton (TMC) and number of state level schemes being implemented by respective states
Rainfed Area Development Programme (RADP) - A Sub-Scheme under Rashtriya Krishi Vikas Yojana (RKVY) The basic premise of the proposed programme is to encourage exploitation of the potential of different farming systems based upon the natural resource assetsendowments (ponds land development nursery etc) created either by the farmers or through schemes like MGNREGA RKVY NHM and Watershed Projects This may act as a catalyst to accomplish the ultimate objective of enhancing productivity minimizing the risk of crop losses due to uncertainties of weather conditions harnessing efficiency of resources assuring food and livelihood income security at farm level and strengthen the farmersrsquo capacity to adapt to climatic changes Therefore converging the upgraded utilities developed through watershed development programmes MGNREGA in terms of water harvesting and micro water storages through effective application and distribution systems like improved conveyance field channels pressurized irrigation water lifting devices etc
Impact Evaluation Study on ldquoNational Mission on Micro Irrigation (NMMI)rdquo
27
to enhance the potential of farming systems The subsidy under this scheme is also extended for installation of pressurized micro irrigation as per norms of NMMI only if not possible through convergence All the States have reported convergence of Mission interventions with different schemes of the Government of India and State level programmes Most of the districts have converged NFSM interventions with programmes such as RKVY ICDP Farm Mechanization NHM Micro-Irrigation and other State programmes 356 Food Security and the Micro Irrigation Scheme To achieve required food production with increasing population India has to enhance the current irrigation potential of 91 M ha to 160 M ha but the total water resources estimated are 230 M hm4 to cater the need to the non-agricultural uses also The country is likely to be water stressed in the coming years Therefore hand in hand with technologies for water harvesting and storage technologies for precision water application methods need to be adopted The food security primarily has the three objectives of ensuring production of adequate food supplies maximizing stability in the flow of supplies and securing access to available supplies on the part of those who need them Access to food has two defined components to it One interventions aimed at boosting agricultural productivity and the second adopting strategies to promote employment social protection measures cash transfers to the poor to improve their access to the available food India has already in place social protection as a component of food security As mentioned earlier several projects for utilization of surface water as well as ground water resources have been undertaken However in some cases the unplanned development has led to over exploitation of the resource affecting the physical sustainability The adverse impact of such unplanned development is evident from the alarming decline in water table in some areas The developmental activities for utilization of water resources as also the development in other sectors particularly industrial sector coupled with urbanization have resulted in water pollution ndash both surface water as well as ground water Further the utilization of the created facilities is far from optimal as the water sector in India suffers from (a) relatively low water use efficiency and (b) increasing gap between the created irrigation potential and the utilized irrigation potential
In this regard it may also be important to note that the future development of water resources are bound to be more challenging as the easy options particularly from the
4Micro Irrigation Management in Cotton CICR Technical Bulletin No 31
Impact Evaluation Study on ldquoNational Mission on Micro Irrigation (NMMI)rdquo
28
topographical and geological considerations have since been tapped Further the future water resources development projects would need rigorous environmental and social evaluations In view of above mentioned challenges and particularly to address the two serious issues namely ldquofood securityrdquo and ldquoimpact of climate changerdquo initiatives have been taken by the Ministry of Water Resources to identify the most appropriate approach for water resources management and also to assign priorities Despite variations in availability of water both within and over the years the long term average available water resources of the country may be considered to remain unchanged Therefore the increasing demand for water for various purposes are bound to result in competition among the ldquousesrdquo as well as among the ldquouser groupsrdquo and with time such competitions are becoming fiercer and fiercer The conflicts among the ldquousers groupsrdquo are visible in the form of increasing inter-State issues The prioritization of water uses for different purposes at different point of in the planning process as also during the operation is becoming more and more challenging in view of conflicting social and economic considerations Such changing scenario calls for identification of most appropriate strategies for effectively addressing the future challenges At the current cereal intake of 143 kgs per capitalannum cereal requirement for household consumption will be around 192 million tons in 2020 The requirement will be more if the increase in household demand due to income growth is also considered At 5 per cent per annum growth in total expenditure and population of 1343 billion household cereal demand works out to 221 million tons in 2020 and for food grains 241 million tons With a grossing factor of 114 the total (household plus non-household) demand for cereals may be around 253 million tons The above cereal demand projections are made with the assumption of stability of tastes and preferences in food consumption If the trend of food grain production as witnessed during the last two decades is sustained the production of additional 57 million tons of cereals and 76 million tons of total food grains in the coming two decades may not be out of reach for India The demand projections may turn out to be on a higher side if the secular trend of change in consumer preferences away from cereal consumption persists Demand for superior food items such as dairy and animal husbandry products sugar fruits and vegetables are expected to grow much faster during the coming decades The estimated demand in 2020 for milk and milk products will be around 166 million tons edible oils 11 million tons meat fish and eggs 11 million tons sugar and gur 25 million tons and fruits and vegetables 113 million tons It may be noted that food grains pulses oilseeds sugar fruits and vegetables poultry dairy meat fish etc constitute the bulk of the output in the agriculture sector The performance of agriculture is important for availability and access to food as more than 55
Impact Evaluation Study on ldquoNational Mission on Micro Irrigation (NMMI)rdquo
29
per cent people in the country are dependent on this sector There are both short run and long run problems in agriculture Farmersrsquo suicides continue unabated even increasing in some states as growth rate in yield is on the decline Farming is fast becoming a non-viable activity Further scope for increase in net sown area is limited Land degradation in the form of depletion of soil fertility erosion and water logging has increased There has been decline in the surface irrigation expansion rate and a fall in the level of the ground water table Exposure of domestic agriculture to international competition has resulted in a high order of volatility in prices Disparities in productivity across regions and crops and between rain fed and irrigated areas has increased Long term factors like steeper decline in per capita land availability and shrinking of farm size are also responsible for the agrarian crisis Land issues such as SEZs land going to non-agriculture alienation of tribal land etc are becoming important The Steering Committee report on agriculture for the Eleventh Plan (GoI 2007) has identified the possible reasons for deceleration in agriculture since the mid- 1990s According to the report the major sources of agricultural growth are public and private investment in agriculture and rural infrastructure including irrigation technological change diversification of agriculture and fertilizersA major challenge to food security comes from dietary diversification of the poor If cereal pricing is left to the market forces government playing the facilitating role land may be released from rice and wheat cultivation to meet the growing demand for non-cereal crops such as oilseeds fruits and vegetables in accordance with diet diversification The micro irrigation system is a proven technology that helps in improving the productivity of crops by judicious use of water MI system has resulted in improving the productivity of wheat maize and pulses by 2405 1348 and 2869 respectively Area under horticulture crops as well as nutritional security has also enhanced The positive outcomes on the food security due to the increase in the production amp productivity of different crops and increased area under irrigation from same source of water However keeping in view the growth population of the country we need to boost the production that can be possible with the help of innovation amp transparency in the irrigation system in NMMI scheme 36 Mission Structure Review 361 National Level National Level The Horticulture Division in the Department of Agriculture amp Cooperation Ministry of Agriculture coordinates the overall activities and review the progress of implementation of the Mission in the country The Executive Committee (EC) of is chaired
Impact Evaluation Study on ldquoNational Mission on Micro Irrigation (NMMI)rdquo
30
by Secretary (AampC) Department of Agriculture amp Cooperation to oversee the activities of the Mission and to approve the State Annual Action Plans besides projects on technology transfer etc National Committee on Plasticulture Applications in Horticulture (NCPAH) is entrusted in the monitoring and reviewing the progress of the scheme Executive Committee (EC) reallocates resources across States and approves programmes on the basis of approved subsidy norms EC is empowered to approve special interventions for tackling emergent requirements EC can also constitute Sub-Committee (SC) Empowered Committee (EMC) and delegate power to SC EMC for emergent requirements like revision of cost norms inclusion of equipment etc if required based on the recommendations of EC of NMMI 362 State Level Micro Irrigation Committee (SMIC) At the State level State Micro Irrigation Committee (SMIC) under the Chairmanship of Agriculture Production Commissioner Principal Secretary (Horticulture Agriculture) oversees the implementation of the scheme in their respective States The Panchayati Raj Institutions in the State are also member of the SMIC represented in the SMIC and involved in the implementation of the Scheme The Chairman at his discretion can co-opt officials experts as invitees The SMIC meeting is held once in every quarter The state level micro irrigation committees have been assigned to perform the following functions as per the guidelines
1 Organise base line survey and feasibility studies in different parts of the state covering various crops and technologies
2 Ensure smooth implementation of Micro irrigation programme in different districts of the state
3 Ensure allocation of state share required for implementing the scheme and make it available to the implementing Agency
4 Finalise and forward the consolidated actions plans of the Districts to DAC
5 Register the System Manufacturers and circulate the list of System Manufacturerrsquos registered with SMIC along with the quoted price to the District Micro Irrigation Committee (DMIC) and Implementing agencies They will also indicate the quantum of money to be paid by the beneficiariesbanks to the manufacturers before installing the system
6 Mobilize credit requirement of the farmers through the Financial Institutions for installing Micro Irrigation System
7 Organise various training and extension programmes for farmers officials NGOrsquos entrepreneurs etc involving PFDCs
Impact Evaluation Study on ldquoNational Mission on Micro Irrigation (NMMI)rdquo
31
8 Host a website indicating the details and status of the progress of NMMI scheme in different districts of the state
During the course of discussions qualitative assessment was made on the basis of these parameters such as organise base line survey and feasibility studies in different parts of the state covering various crops and technologies are regularly prepared and accordingly assessment has been made Similarly the same criterion was adopted in other parameters to arrive at final assessment and these were summarized in the table 15 It may be seen from the table that the states of AP Gujarat Maharashtra are performing better than other states as far as their functions and responsibilities are concerned whereas Bihar and UP are the laagered states in this regard It may be premature to comment on the performance of Sikkim and Uttarakhand states because the scheme is recently implemented
Impact Evaluation Study on ldquoNational Mission on Micro Irrigation (NMMI)rdquo
32
Table 15 Performance of the Functioning of SMICs in Sampled States
Functions States
Base line survey and feasibility
studies
Implementation
Allocation of the State Share Action Plan
Registration of the System Suppliers
Mobilize Credit for Farmers
Capacity Building
Programme
Website Hosting Assessment
AP Medium High High High High Low-medium Medium Medium Medium-high
Bihar Low Low Low Low-medium Low-medium Low Low Low Low
Chhattisgarh Low-medium Medium Medium Medium High Low-medium Low-medium Low-medium Medium Gujarat Medium High High High High Low-medium Medium Medium Medium-high Haryana Low-medium Medium Low-medium High Low-medium Low-medium Low-medium Medium Low-medium Karnataka Low-medium Medium High High High Low-medium Medium High Medium-high Maharashtra Medium Medium High High High Low-medium Medium Medium Medium-high Odisha Low-medium Medium Low-medium High High Low-medium Low-medium Low-medium Medium Rajasthan Low-medium Medium High High High Low-medium Medium Medium Medium-high Tamil Nadu Medium Medium Medium High High Low-medium Medium High Medium-high UP Low Low Low Low Low-medium Low Low Low Low
Sikkim Low Low Low Low-
medium Low-medium Low Low Low Low
Uttarakhand Low Low Low High Medium Low Low Low Low Source GAPL analysis
Note High Response is more than 80 Medium Response is between 50 to 70 Low Response is below 50
Impact Evaluation Study on ldquoNational Mission on Micro Irrigation (NMMI)rdquo
33
The above table shows the assessment of performance amp functioning configuration The scales are used to represent the intensity of the functions ongoing into the sampled state The registration of the system suppliers are scaled as per the number of manufacturers in proportion to the size of the state It has been observed that AP Gujarat amp Maharashtra are leading states in the every aspect of the different activities involved in the process streamlined those are mentioned in the NMMI guidelines It has further been observed that Bihar UP Sikkim amp Uttarakhand states are lacking in terms of the functions mentioned in the guidelines There are still many dots to be connected in these states to get the desired and satisfactory results 363 District Level Micro Irrigation Committee (DMIC) At the District level District Micro Irrigation Committee (DMIC) headed by the Chief Executive Officer (CEO) of Zila Parishad District Rural Development Agency (DRDA) Collector of the District with members representatives from concerned departments viz Agriculture Horticulture Rural Development Irrigation and Water Resources Growersrsquo Association Krishi Vigyan Kendras (KVKs) and local lead Banks are responsible for implementing the NMMI programme in the district The DMIC meeting is held once in every month The DMIC performs the following functions as per the guidelines
1 Forward the District Action Plan to SMIC for compilation of State Action Plan and forward it to the Ministry of Agriculture
2 Mobilize credit requirement of the farmers through the Financial Institutions for installing Micro Irrigation System
3 Monitor and review the physical amp financial progress of implementation of Mission programme
4 Review the submission of utilization certificate by the implementing agency
5 Provide Feedback to SMIC on monthly basis by 6th7th of each month
It was observed that DMIC in almost all the states are preparing their district plans regularly and in time except for Bihar UP Sikkim and Uttarakhand and accordingly assessment has been made Similarly the same criterion was adopted in other parameters to arrive at final assessment The table below shows the extent of functioning at the district level It is also portraying almost the same picture that is being shown under the state level
Impact Evaluation Study on ldquoNational Mission on Micro Irrigation (NMMI)rdquo
34
Table 16 Performance of the Functioning of DMICs in Sampled States
Functions States
District Plan
Mobilizing Credit Review amp
Monitoring
Submission of
Utilization Certificates
Monthly Feedback amp Reporting
Own Assessment
AP High Low-medium High Medium High Medium-high Bihar Medium Low Low-medium Low Low-medium Low Chhattisgarh High Low-medium Medium Low-medium Medium Low-medium Gujarat High Medium High Medium High Medium-high Haryana High Low Medium Medium Medium Medium Karnataka High Medium High Medium High Medium-high Maharashtra High Medium High Medium High Medium-high Odisha High Low-medium Low-medium Low-medium Medium Medium Rajasthan High Low-medium High Medium High Medim-high Tamil Nadu High Low-medium Medium Medium Medium Medium UP Medium Low Low-medium Low Low-medium Low Sikkim Medium Low Low-medium Low Low-medium Low Uttarakhand Medium Low Low-medium Low Low-medium Low
Source GAPL analysis
Note High Response is more than 80 Medium Response is between 50 to 70 Low Response is below 50 364 Improving Efficacy of the Institutional Mechanism The following measures may be taken to improve the efficacy of the institutions involved in the implementation of the scheme
1 The utilization certificates to be submitted in time for the prompt release of the funds
2 SPV on the pattern AP state and separate institute like GGRC in Gujarat may be adopted for improving the efficiency and transparency
3 The meeting of various committees formed under the programme should be held regularly The meetings of the SMIC should be convened on quarterly basis and the same may also not tagged with other meetings in order to give proper focus on the implementation of the programme
4 Human Resource Development is one of the key factors for successful implementation of other sub components of any programme The capacity building at all levels -farmers field level workers technical officers and scientists and developing orientation skills of all the stake holders in the context of changing needs of agriculture to be intensified More training programmes for all the stakeholders should be organized
Impact Evaluation Study on ldquoNational Mission on Micro Irrigation (NMMI)rdquo
35
37 Role of Panchayati Raj Institutions (PRIs) in NMMI Scheme Panchayats have been entrusted mainly in identification of the beneficiaries in their respective jurisdiction The interested farmer put his application to the Panchayat and after verification the case is recommended Panchayati Raj Institutions are involved in the following activities i Selection of crops and identification of priority areas for implementation
ii Authorization of beneficiaries compilation of application forms proforma invoices and
creation of local initiatives in promotion of micro irrigation technology iii Organization of interactive meetings with the representatives of MI industry iv Training extension and awareness creation (added as per GoI notification dated 208
2013)
However during the course of discussions it was observed that PRIs role is not only limited to compilation of necessary documents required for submission of application forms but also involved in Information-Communication-Education (IEC) activities as shown it the
The major activities and roles of PRIs practiced in different sampled states are as follows
A Issues no objection certificate on first come first serve basis Gram Panchayat informs to Gram Sabha regarding the selection of NMMI beneficiaries as well as verification of the land ownership
B Verification amp certification of the farmersrsquo ownership amp domicile involved in IEC activities Issues no objection certificate on first come first serve basis
C Verification amp certification of farmersrsquo domicile Issues no objection certificate on first come first serve basis
D Verification amp certification of the farmersrsquo ownership amp domicile involved in IEC activities recommendation of farmersrsquo Issues no objection certificate on first come first serve basis
E It is suggested that Panchayati Raj Institutions are required to be more effective in their roles amp responsibilities as per the guidelines for which sensitization exercises through training and capacity building programmes may be initiated
Impact Evaluation Study on ldquoNational Mission on Micro Irrigation (NMMI)rdquo
36
4 Primary Survey Respondentsrsquo Profile and Findings Primary survey of 7400 farmers was conducted in 13 states as per the sampling plan detailed in chapter 2 The coverage is quite systematic amp comprehensive hence no distortion in the findings is expected due to disproportionate representation of any specific category
The purpose of analyzing the profiles of different respondents and deriving the findings was to evaluate the overall impact created by the scheme and to find the gap between planned objectives and outcome after the execution of the scheme along with identifying the best possible solution to fill the gap if any 41 Demographic Profile (Sampled Beneficiaries amp Non-beneficiaries) The socio economic conditions of the target group indicate their basic characteristics which may be instrumental in the adoption of new technologies and interventions The demographic profile of the farmers covered in the survey in terms of their education profile gender category etc is presented in the following section 411 Size of Land Holding The benefit of the NMMI scheme is extended to the farmers on the basis of size of holding As per the norms at least 33 percent of the allocation is to be utilized for the small marginal and women farmers Similarly the quantum of the subsidy is more for small and marginal farmers The beneficiaries in case of small and marginal farmers are eligible for subsidy up to 60 percent of the cost of drip sprinkler irrigation system and the remaining 40 percent have to borne by the farmers However in the case of general categories of the farmers subsidy assistance is 50 percent of the cost of the system which is shared in the ratio of 401050 by the central state government and the beneficiaries The states are free to provide additional subsidy to the beneficiaries from their own resources Keeping the above factor in view the sampled farmers were categorized as per the prescribed guidelines (Table 18) into three categories based on their land holdings such as marginal amp small farmer under 2 hectares medium between 2-10 hectares and large above 10 hectares The results on distribution of the farmers according to their land holding category have been presented in the table 17 for both beneficiaries and non-beneficiaries
Impact Evaluation Study on ldquoNational Mission on Micro Irrigation (NMMI)rdquo
37
Table 17 Land Holding Status of Beneficiary and Non Beneficiary Farmers
State
Beneficiaries Non Beneficiaries
Total Beneficiaries
Category of Farmers () Total Non-Beneficiary
Category of Farmers (`) Marginal amp
Small Medium Large Marginal amp Small Medium Large
AP 672 9241 759 000 168 9643 357 000 Bihar 516 1105 7945 950 128 5391 4453 156 Chhattisgarh 384 8359 1589 052 96 9375 625 000 Gujarat 576 4132 566 208 144 5833 3819 348 Haryana 320 3344 6062 594 81 4568 5185 247 Karnataka 576 7691 2292 017 144 8333 1667 000 Maharashtra 672 8304 1666 030 169 8343 1657 000 Odisha 480 5250 4708 042 120 5500 4417 083 Rajasthan 574 3711 6028 261 138 6884 2899 217 Sikkim 50 10000 000 000 10 9000 1000 000 Tamil Nadu 455 8286 1714 000 120 8333 1667 000 UP 527 3397 6546 057 168 6667 3273 060 Uttarakhand 90 5000 4667 333 22 7727 2273 000 Total 5892 5874 3943 183 1508 7308 2600 092 Source GAPL survey
Marginal small and medium category of farmers accounted for 5874 and 3944 percent of the beneficiaries where as 183 percent farmers are reported to be under large category among beneficiaries while among non-beneficiaries 73 percent farmers fall under the category of marginal-small farmers and 26 percent are under medium land holding category The distribution of large farmers among non-beneficiaries are not observed in Andhra Pradesh Chhattisgarh Karnataka Maharashtra Sikkim Tamil Nadu and Uttarakhand
The above table reveals that the proportion of a small and marginal farmers are observed to be highest in Sikkim followed by Andhra Pradesh Chhattisgarh Maharashtra and Tamil Nadu among the sampled farmers The proportion of medium and large farmers accounted for 3943 percent of the total beneficiaries
The data on size and distribution of operational land holdings in the country (Table 18) also suggest that medium and large farmers accounted about 15 percent of total land holdings thus occupying approximately 5542 percent of the total area The average size of land holding with the medium and large category of farmers was also noted to be 608 and 1810 hectare respectively
Impact Evaluation Study on ldquoNational Mission on Micro Irrigation (NMMI)rdquo
38
Table 18 Size and Distribution of Operational Holdings
SNo Category of Holding Size Group (Ha) Holding
()
Total Area Coverage
()
Average Size (Ha)
1 Marginal lt 10 671 225 039 2 Small 10 - 20 1791 2208 142
Sub Total 8501 4458 3 Semi Medium 20 - 40 1004 2363 271 4 Medium 40 - 100 425 212 576 5 Large gt 1000 07 1059 1738
Sub Total 1499 5542 Total 100 100 115
Source Agriculture Census -2010
In light of these facts the present limit of area up to 5 hectare under NMMI scheme needs to be re-looked and calls for relaxation of farm size limitations in providing subsidies This will not only increase the area under MI and improve the water use efficiency but will also contribute significantly towards food security on sustainable basis 412 Categories of Farmers The NMMI scheme is extended to all the categories of the farmers and the mission has earmarked the total allocation to SCST farmers as per their proportion to the population in the district The following table summarizes the categories on their category both for beneficiaries and non-beneficiaries
Table 19 Category wise Proportion of Beneficiary and Non Beneficiary Farmers
State Beneficiaries Non Beneficiaries
Total Beneficiaries
Farmers Categories () Total Non-Beneficiaries
Farmers Categories () Gen OBC ST SC Gen OBC ST SC
AP 672 2768 5074 1116 1042 168 3750 4345 1131 774 Bihar 516 3643 5853 213 291 128 2734 6641 391 234 Chhattisgarh 384 3438 2891 3307 365 96 1563 3854 3646 938 Gujarat 576 7222 2083 556 139 144 7569 2083 208 139 Haryana 320 8219 1656 000 125 81 6914 2716 000 370 Karnataka 576 6424 2049 712 816 144 6111 2431 903 556 Maharashtra 672 7574 2247 104 074 169 7633 2012 178 178 Odisha 480 5458 3354 917 271 120 5500 2667 1500 333 Rajasthan 574 3711 5279 714 296 138 3043 6522 290 145 Sikkim 50 2400 2200 5400 000 10 7000 2000 1000 000 Tamil Nadu 455 4044 5187 066 703 120 5750 3583 000 667 UP 527 4156 5408 019 417 168 2679 6131 119 1071 Uttarakhand 90 5444 1556 111 2889 22 4545 2273 000 3182 Total 5892 5097 3744 696 463 1508 4867 3919 683 531
Impact Evaluation Study on ldquoNational Mission on Micro Irrigation (NMMI)rdquo
39
It may also be seen from the above table which shows coverage of different categories of farmers selected for primary survey on random basis the implementing agencies in various states under study were able to provide the benefits of NMMI scheme to all the categories of the farmers based on its norms 413 Gender The role of the women in agriculture is more than 60 percent for conducting different farm activities like tending of animals farm operations ( except ploughing ) and other farms house activities In the guidelines of the NMMI schemes a special mention has been made for the benefits to be extended under the scheme to the women farmers Therefore the coverage of number of male and female beneficiaries in the survey is presented in the following table
Table 20 Gender Status of Beneficiaries and Non Beneficiaries
State
Beneficiaries Non Beneficiaries Total
Beneficiaries Gender () Total Non-
Beneficiary Gender ()
Male Female Male Female AP 672 8348 1652 168 9702 298 Bihar 516 9399 601 128 9688 313 Chhattisgarh 384 8932 1068 96 9271 729 Gujarat 576 9427 573 144 9792 208 Haryana 320 3781 6219 81 10000 000 Karnataka 576 8628 1372 144 9931 069 Maharashtra 672 9345 655 169 9822 178 Odisha 480 8896 1104 120 9833 167 Rajasthan 574 9059 941 138 9710 290 Sikkim 50 8800 1200 10 9000 1000 Tamil Nadu 455 8835 1165 120 9833 167 UP 527 8843 1157 168 9821 179 Uttarakhand 90 8667 1333 22 10000 000
Total 5892 8681 1319 1508 9768 236 Source GAPL Survey It may be seen from the above that proportion of male among the entire sampled respondent is higher than 85 percent in case of beneficiaries and non-beneficiaries both This may be due to the fact that in most cases the land is generally in the name of head of the family and being a patriarchic society land ownership rests with the male gender 414 Educational Status Education plays an important role in the development and the same is true for the NMMI schemes Therefore the education status of sampled farmers both beneficiaries and non-beneficiaries was enquired This information is summarized in table below
Impact Evaluation Study on ldquoNational Mission on Micro Irrigation (NMMI)rdquo
40
Table 21 Education Status of Beneficiaries and Non-beneficiaries
State
Beneficiary Non Beneficiary
Total Beneficiary
Education status () Total No of Non-
Beneficiary
Education status ( ) Not
Educated Primary High
School Sr
Secondary Graduate
and Above
Not Educated
Primary High school
Sr Secondary
Graduate and
above AP 672 223 2232 4435 2515 595 168 060 1964 5298 2321 357 Bihar 516 659 2035 3120 1667 2519 128 1016 2891 2813 1328 1953 Chhattisgarh 384 1120 3568 2526 1589 1198 96 521 4167 3125 1771 417 Gujarat 576 1128 2917 3073 1632 1250 144 1389 2986 3194 1042 1389 Haryana 320 2094 1438 2469 1438 2563 81 370 2716 3210 1852 1852 Karnataka 576 313 3090 4288 1354 955 144 625 3681 3264 1667 764 Maharashtra 672 298 2321 4003 1622 1756 169 414 2249 4201 1775 1361 Odisha 480 688 2708 3229 1750 1625 120 917 3250 3167 1250 1417 Rajasthan 574 784 4268 3937 557 453 138 1232 4275 4275 217 000 Sikkim 50 200 1600 3000 2000 3200 10 1000 1000 3000 2000 3000 Tamil Nadu 455 352 2374 4505 1165 1604 120 583 3917 4500 917 083 UP 527 607 3454 4023 1195 721 168 476 2560 4107 2024 833 Uttarakhand 90 1111 1889 2000 3556 1444 22 3636 1364 2727 1818 455 Avg Total 5892 677 2766 3664 1556 1336 1508 729 3037 3806 1499 928
Source GAPL Survey
Impact Evaluation Study on ldquoNational Mission on Micro Irrigation (NMMI)rdquo
41
In most of the sampled areas the most of the farmers are educated except in Haryana where about 21 percent of the beneficiaries reported to be not educated The higher proportion of graduate among beneficiaries in most of the states as compared to non-beneficiaries clearly indicates that educated and informed farmers are more likely to adopt MI Systems
415 Status of Communication Facilities
Communication Media is an important tool of flow of information particularly in agriculture as pre and post-harvest operation are time bound as well as subject to use of resources Quick and authentic information are required for weather forecast agriculture operations and practices information about the markets for disposal etc Numbers of portals such as AGMARKNET have been launched to benefit the farming community
Table 22 Mobile Phone Ownership
State Beneficiary having
Mobile () Non Beneficiary
having Mobile () AP 1979 1190 Bihar 8043 6016 Chhattisgarh 3854 625 Gujarat 8767 6597 Haryana 6719 5926 Karnataka 2934 903 Maharashtra 2426 414 Odisha 3333 1917 Rajasthan 5505 5507 Sikkim 7400 9000 Tamil Nadu 2462 250 UP 1195 1607 Uttarakhand 3556 1364 TOTAL 4189 2699
The consultants have captured the status of mobile ownership among beneficiaries as well as non-beneficiaries for the comparison purpose The following facts have been observed from the table above
40 percent of the farmers are having access to mobile phones The table further reveals that the maximum number of beneficiaries possessing mobile phones were in Gujarat (88) followed by Bihar (80) Sikkim (74) and Haryana (67)
This is an encouraging trend as farmers are making use of the Information and Communication Technology
Less than 27 percent of the non-beneficiaries have access to the mobile phones whereas the average of mobile holders among beneficiaries was noted to be around 42 percent
Impact Evaluation Study on ldquoNational Mission on Micro Irrigation (NMMI)rdquo
42
In may further be added here that total number of mobile users as per ldquoIndia Mobile Landscaperdquo (IML) 2013 study were 5548 crores and out of this about 298 crores (537) are 22 percent are in rural areas
Further if we analyze the overall scenario of mobile penetration it comes to about 25 percent The penetration of this technology was noted to be much higher in case of beneficiaries using mobiles
The field observations gathered from the farmers of sampled states correlates that with increase in income due to MI technologies the beneficiary farmers have started use of this technology
It shows that the different positive attributes of MI technology enabling adopters to access the technology updating themselves with the mobile technology that lead the beneficiaries towards attaining better social status due to increase of their income and purchasing power As for the availability of email IDs with the sampled farmers is concerned negligible number of farmers had this mode of communication 42 Results and Discussions 421 Quality of soil and irrigation water Irrigation with saline water through the conventional methods like flooding results in accumulation of salts in soil profile resulting in reduced availability of water to plants poor to delayed germination and slow vegetative growth rate However with the use of micro-irrigation systems (dripsprinkler) the saline water is applied frequently in lesser amounts due to which the evaporation losses of irrigation water are very less which prevents the accumulation of salts and keep their concentrations well below the harmful limit in crop root zone Thus at places where the fresh water resources are limited alternative non-conventional water resources like saline water aquifer may be exploited to feed the expansion drive for irrigation In this context the scientific use of saline water in conjunction with adaptable water use technologies has been advocated as a perfect proxy for irrigation The electrical conductivity of saline soils is gt 4 dSm and pH is gt 80 In the areas having problems of soil salinity the soil and water testing are specifically important to adopt the appropriate measures to draw full advantage of the micro irrigation system The data on extent of saline soils in the sampled states coupled with the farmers responses on getting their soils and water tested are cited in table 23 It has been documented that clogging factor in MI system is minor moderate and severe in water samples having EC values lt 080 08-31 and gt 31 dSm respectively Such values for pH have been reported to be lt70 70-80 and gt 80 (Patil 2001)
Impact Evaluation Study on ldquoNational Mission on Micro Irrigation (NMMI)rdquo
43
Table 23 Extent of Soil Salinity (in sampled states) and Beneficiaryrsquos Responses on Soil and Water Testing
State Status (000 ha)
Total Beneficiaries
Percent Response of the sample beneficiaries on
soil amp water testing Saline soils
Sodic Soil
Total Yes No
AP 7760 19661 27421 672 6146 3854 Bihar 4730 10585 15315 516 6705 3295 Chhattisgarh NA NA NA 384 6458 3542 Gujarat 168057 54143 222200 576 6927 3073 Haryana 4916 18340 23256 320 7781 2219 Karnataka 189 14814 15003 576 6910 3090 Maharashtra 18409 42267 60676 672 7336 2664 Odisha 14714 000 14714 480 6375 3625 Rajasthan 19557 17937 37494 574 7913 2087 Sikkim NA NA NA 50 5400 4600 Tamil Nadu 1323 35478 36801 455 5758 4242 UP 2199 134697 136896 527 5275 4725 Uttarakhand 000 000 000 90 7778 2222 Total 241854 347922 589776 5892 6887 3113 Source Central Soil Salinity Research Institute Karnal Haryana-20105
In the sampled states magnitude of soil salinity was noted to be highest in Gujarat followed by UP which was followed by Maharashtra and Rajasthan There is thus a strong need to launch special drives to motivate the farmers to get their soil and water samples tested This may enable them to adopt the recommended measures to prevent the clogging of emitters and enhance the crop productivity with the adoption of MI systems As per the guidelines of NMMI It is mandatory to conduct soil and water tests by MI system suppliers registered under the scheme Though about 6887 of sampled beneficiaries of all the 13 sampled states have got their soil amp water tested In Gujarat UP Maharashtra amp Rajasthan soil testing adopted by 6927 5275 7337 and 7913 of respondents respectively
It was further investigated if beneficiaries are aware about the importance of soil and water quality on the performance of the MI systems the results are presented in the table below
5Technical Bulletin CSSRIKarnal22010 Computerized Database on Salt Affected Soils in India AK Mandal RC Sharma Gurbachan Singh and JC Dagar 2010
Impact Evaluation Study on ldquoNational Mission on Micro Irrigation (NMMI)rdquo
44
Table 24 Extent of Awareness about Important Soil and Water Quality Parameters
State
Total Beneficiary
Soil quality testing Water quality testing pH EC pH EC
Yes ()
No ()
Yes ()
No ()
Yes ()
No ()
Yes ()
No ()
AP 672 238 9762 030 9970 000 10000 000 10000 Bihar 516 097 9903 058 9942 058 9942 058 9942 Chhattisgarh 384 000 10000 000 10000 000 10000 000 10000 Gujarat 576 521 9479 382 9618 434 9566 434 9566 Haryana 320 000 10000 000 10000 000 10000 000 10000 Karnataka 576 000 000 000 000 000 000 000 000 Maharashtra 672 313 9688 238 9762 283 9717 238 9762 Odisha 480 333 9667 333 9667 146 9854 146 9854 Rajasthan 574 9913 087 9913 087 9861 139 9843 157 Sikkim 50 1400 8600 000 10000 000 10000 000 10000 Tamil Nadu 455 000 000 000 000 000 000 000 000 UP 527 5275 4725 3226 6774 3529 6471 4288 5712 Uttarakhand 90 000 10000 000 10000 000 10000 000 10000 Total 5892 1599 6651 1354 6896 1368 6882 1429 6821
Source GAPL Survey
It has also been noted that farmers in most of the sampled states were not even aware of the importance of soil and water testing (Table 24)There is thus a dire need to create awareness about the importance of soil and water testing among farmers and make them aware of consequent clogging of emitters 422 Sources of Irrigation There are number of water sources in different parts of the states country such as bore well canals ponds tube wells etc from which the farmers get the irrigation water for their fields In this context information on the availability of water sources was compiled The following inferences have been drawn
Bore well is the most preferred source of water supply among the users of MI systems proportion being about 82 as may be seen from the table below
Further it may be seen that 100 percent of the farmers of Karnataka and AP have own bore wells followed by the farmers of Bihar UP Tamil Nadu Odisha Chhattisgarh Rajasthan and Gujarat The other important sources are canal well and spring water
Over 62 percent farmers of Sikkim reported to have farm ponds at their farms and remaining 38 percent from spring water which is an exception as compared to other states covered in the survey
Impact Evaluation Study on ldquoNational Mission on Micro Irrigation (NMMI)rdquo
45
It may also be inferred that more than 92 percent (bore well well and farm pond) of the beneficiaries have owned water sources which facilitates them to operate the MI systems as per the crop needs
Table 25 Source of Irrigation Water ()
State Total Beneficiary
Bore well Well Farm
Ponds Canals Bore well amp Canals
Canals amp Farm Ponds Others
AP 672 9970 000 000 000 000 000 030 Bihar 516 9845 000 019 058 078 000 000 Chhattisgarh 384 8464 000 026 000 000 000 1510 Gujarat 576 7517 2309 035 069 000 000 069 Haryana 320 4625 000 281 313 781 1406 2594 Karnataka 576 10000 000 000 000 000 000 000 Maharashtra 672 3958 5342 119 446 074 000 060 Odisha 480 9250 750 000 000 000 000 000 Rajasthan 574 7631 976 000 697 314 279 105 Sikkim 50 000 000 6200 000 000 000 3800 Tamil Nadu 455 9495 264 000 242 000 000 000 UP 527 9696 304 000 000 000 000 000 Uttarakhand 90 7667 000 000 000 000 000 2333 Total 5892 8181 1039 088 166 088 104 334 Source GAPL Survey
423 Water Table The cost of irrigation depends on the depth of the water available from the ground water sources In this regard the beneficiaries were asked to narrate the depth of the water table at their farms The pertinent data has been summarized in Table 26 which helps in the selection of appropriate capacity of the pump for smooth and efficient functioning of the system
Table 26 State wise Water Table Depth
State Total Beneficiaries
Water availability depth () 0-50 Ft 50-100 Ft 100-150 Ft 150-200 Ft 200-250 Ft gt250 Ft
AP 672 030 060 104 1845 7723 238 Bihar 516 4574 5000 426 000 000 000 Chhattisgarh 384 1198 1563 4661 1615 703 260 Gujarat 576 833 3090 1337 1424 660 2656 Haryana 320 2875 3438 1625 1000 438 625 Karnataka 576 000 538 972 1771 6493 226 Maharashtra 672 4613 2649 997 1280 357 104 Orissa 480 9792 208 000 000 000 000 Rajasthan 574 767 1760 3397 1446 348 2282 Sikkim 50 - - - - - - Tamil Nadu 455 000 1319 2396 5758 484 044 UP 527 3397 5028 1480 076 019 000 Uttarakhand 90 889 2444 667 000 778 5222 Total 5892 2436 2167 1439 1421 1775 677
Note The beneficiaries of Sikkim are not aware of the depth of water availability Source GAPL Survey
Impact Evaluation Study on ldquoNational Mission on Micro Irrigation (NMMI)rdquo
46
424 Sources of Awareness about NMMI Scheme The Table 27 shows that the mix trend among the farmers and the major sources of awareness was through fellow farmers service providers suppliers extension workers etc The highest proportion of awareness revealed in Chhattisgarh was through fellow farmers in Uttarakhand UP and Sikkim through extension workers It is interesting to note that the suppliersrepresentatives of the manufacturers are the major sources of awareness to the beneficiaries This may be due to the reason that the supplier of the system have their own interest in this competitive trade and motivate as well as facilitate the farmers in applying for the benefit
Impact Evaluation Study on ldquoNational Mission on Micro Irrigation (NMMI)rdquo
47
Table 27 Sources of Awareness Reported by Beneficiaries ()
State Total
Beneficiaries Fellow
Farmers Radio Newspaper TV Pamphlet
Extension worker
Supplier Fellow
Farmers amp Supplier
Fellow Farmers amp Extension
worker
Fellow Farmers amp Newspaper
Extension worker amp Supplier
Others
AP 672 2664 000 015 060 030 2217 4628 149 149 000 089 000 Bihar 516 2597 000 019 000 000 562 3450 1667 407 000 155 1143 Chhattisgarh 384 5365 000 000 000 000 130 3411 859 078 000 052 104 Gujarat 576 2153 000 122 156 069 226 1563 3941 694 226 035 816 Haryana 320 1813 094 000 000 000 6938 531 125 250 094 000 156 Karnataka 576 2396 017 017 017 000 069 1684 3663 694 1111 278 052 Maharashtra 672 2515 045 119 045 000 908 2247 3051 551 253 164 104 Orissa 480 2479 021 250 146 000 208 2021 3479 583 354 333 125 Rajasthan 574 3136 000 122 017 105 2596 3972 017 000 017 000 017 Sikkim 50 1600 000 000 000 000 4000 200 1200 1400 1000 000 600 Tamil Nadu 455 1516 154 000 000 000 088 1582 3934 703 1407 242 374 UP 527 2220 000 000 000 000 5674 1727 228 057 019 019 057 Uttarakhand 90 889 444 333 000 222 5444 1889 000 111 000 000 667 Total 5892 2561 032 068 042 024 1721 2514 1937 390 314 124 273
Note Other source of awareness includes multiple sources of different combinations Source GAPL Survey
Impact Evaluation Study on ldquoNational Mission on Micro Irrigation (NMMI)rdquo
48
Following the same pattern of the sources of awareness for beneficiary farmers the same was asked from the non-beneficiary farmers and their responses are summarized in the Table 28
Almost 1149 non adopters out of sampled 1508 are aware about the scheme that is about 76 percent It may be seen from the following table that the major sources of awareness for no adopters are other farmers suppliers and extension workers It may also be seen here that the awareness in most of the states is more than 70 percent except for Uttarakhand Rajasthan and Gujarat
Table 28 Source of Awareness of Scheme Reported by Non-beneficiary ()
State Total Beneficiaries
Other Farmers Radio Newspaper TV Extension
worker Supplier
Other Farmers
and Supplier
Other Farmers amp Newspaper
Others
AP 116 4655 172 690 086 1207 1638 517 431 603 Bihar 95 5684 000 000 000 526 2632 947 211 000 Chhattisgarh 53 9434 000 000 000 000 189 000 189 189 Gujarat 95 4737 105 000 105 000 316 3368 421 947 Haryana 69 7971 000 000 000 1014 435 290 290 000 Karnataka 126 5794 000 000 000 000 397 2381 1349 079 Maharashtra 154 5000 065 195 065 584 1429 1883 584 195 Odisha 98 4898 000 102 000 204 714 2551 1122 408 Rajasthan 95 6632 000 316 000 947 2000 105 000 000 Sikkim 10 5000 000 000 000 000 2000 3000 000 000 Tamil Nadu 106 3774 000 000 000 000 1226 2642 2358 000 UP 120 7583 000 000 167 1917 083 250 000 000 Uttarakhand 12 000 000 000 000 5000 5000 000 000 000 Total 1149 5701 035 131 044 653 1097 1462 661 218
Note The total number of non-beneficiaries in the above table is only those who are aware about the NMMI scheme Source GAPL Survey
425 Reasons for Non-adoption of Micro Irrigation Systems
The non-beneficiaries farmers were further asked the reasons for not adopting this technology Table 29 reveals following mix responses such as
Lack of awareness regarding subsidies lack of technical knowledge high capital cost and system is not required perception that the system is not economical therefore not required for the cropping pattern adopted by them
The 50 percent farmers from Sikkim reported that they have applied for the benefit but have not received the sanction so far
The farmers of Sikkim (50) Tamil Nadu (30) Odisha amp Rajasthan (23) and Karnataka (20) also reported that they have applied for the grant of subsidy for the installation of the system but have yet to receive the sanction
Impact Evaluation Study on ldquoNational Mission on Micro Irrigation (NMMI)rdquo
49
Table 29 Reasons for Non-adoption of NMMI Scheme ()
State Total non-Beneficiaries
Less awareness
about subsidy
Lack of technical
knowledge
Lengthy procedure
High capital
cost
Application pending
for clearance
Not required
Less awareness
about subsidy amp technical
knowledge
Less awareness
about subsidy amp
Lengthy procedure
Others
AP 168 595 536 000 3036 536 060 1964 179 3095 Bihar 128 938 2266 156 1250 938 313 1328 234 2578 Chhattisgarh 96 208 208 000 4479 000 000 625 000 4479 Gujarat 144 139 278 069 3889 1042 208 069 903 3403 Haryana 81 1975 000 000 1975 000 741 3827 000 1481 Karnataka 144 1875 2014 1944 2222 1944 000 000 000 000 Maharashtra 169 237 1124 059 3846 2367 118 769 592 888 Odisha 120 167 2250 000 3167 2333 000 083 167 1833 Rajasthan 138 1087 1232 145 2029 072 000 1957 362 3116 Sikkim 10 000 4000 000 000 5000 1000 000 000 000 Tamil Nadu 120 1000 2917 1583 1500 3000 000 000 000 000 UP 168 595 119 000 2679 060 179 3333 179 2857 Uttarakhand 22 909 000 909 455 909 000 000 2273 4545 Total 1508 756 1174 365 2712 1174 133 1227 292 2168
Source GAPL Survey 426 Willingness of Non Beneficiaries to Adopt MI System
In order to understand willingness of the non-beneficiary farmers for installation of micro irrigation system in their farms a specific question was raised during interviews The responses have been compiled in the following table which shows that more than three-fourth of the farmers of all the states are willing to install micro irrigation systems except in case of Chhattisgarh where more than half of the respondents reported that they are not willing to adopt the system This response shows that when awareness of the benefits of micro irrigation systems is created (it seems during the interview respondents realized the advantages) most non-beneficiaries indicated their willingness to adopt MI
Table 30 Willingness of Non-beneficiaries to Install MI System ()
State Total Non-Beneficiaries
Response in Percent Yes No
AP 168 9762 238 Bihar 128 9922 078 Chhattisgarh 96 4583 5417 Gujarat 144 7708 2292 Haryana 81 9136 864 Karnataka 144 9792 208 Maharashtra 169 9704 296 Odisha 120 9667 333 Rajasthan 138 9203 797 Sikkim 10 8000 2000 Tamil Nadu 120 8917 1083 UP 168 8036 1964 Uttarakhand 22 9545 455
Source GAPL Survey
Impact Evaluation Study on ldquoNational Mission on Micro Irrigation (NMMI)rdquo
50
427 Progress of Installation of MI System The sampled beneficiaries were asked when they installed the system in their respective fields The results are presented in the following table
Table 31 Year of Installation of MI System ()
States 2005-06 2006-07 2007-08 2008-09 2009-10 2010-11 2011-12 2012-13 AP 104 149 060 521 1667 3170 3080 1250 Bihar NA NA NA NA 329 1860 7287 523 Chhattisgarh NA 911 2188 1458 859 2578 1979 026 Gujarat 017 191 903 1146 1233 2465 3733 313 Haryana NA 469 969 813 969 2031 4750 NA Karnataka NA 382 938 1406 1719 1476 2951 1128 Maharashtra NA 699 595 1205 2396 2857 2158 089 Odisha NA 354 396 854 1125 1333 4271 1667 Rajasthan NA 505 540 575 836 2509 4808 226 Sikkim NA NA NA NA NA NA 7400 2600 UP NA 1575 1973 474 1120 702 3510 645 Uttarakhand NA NA NA NA NA NA 2889 7111 Tamil Nadu NA NA 088 2264 879 2044 2330 2396
Source GAPL Survey
The above table reveals that in the beginning of the scheme the response was slow and gradually picked up The momentum of adoption got accelerated after the up gradation of the scheme into the mission mode in 2010 428 Average Cost of Installing the MI System The state wise average system costs as reported by the respondents have been compiled in the table below
Table 32 Average Cost of Installing MI System (Rsha)
State Drip Sprinkler
AP 61474 20572 Bihar 61109 21380 Chhattisgarh 68797 25418 Gujarat 72086 26390 Haryana 66355 25699 Karnataka 59452 27062 Maharashtra 60531 21102 Odisha 54457 20860 Rajasthan 63258 28171 Sikkim 59654 22143 Tamil Nadu 60676 24450 UP 61766 20481 Uttarakhand 59373 25932
Source GAPL Survey
Impact Evaluation Study on ldquoNational Mission on Micro Irrigation (NMMI)rdquo
51
The following facts may be observed by analyzing the responses of sampled beneficiaries
On an average the cost of system incurred by the beneficiaries of various states ranged between Rs 5445736 Rsha to Rs 7208631 Rsha for drip system depending on the crop type spacing material components used etc
As per the NMMI guidelines the indicative cost for installation of drip system for
wide space crops varies from Rs 18820 to Rs 63598 per hectare whereas for close space crops it falls in the range of Rs 74437 to Rs 97598 per hectare
Comparatively high cost incurred by the sampled farmers in Gujarat is probably attributed to the fact that more area under drip is occupied by close spaced (0-10 m2 spacing) crops Detailed analysis of higher average cost of drip in Gujarat is given in annexure IV The average cost of sprinkler in the sampled states varied between Rs 20481 to Rs 28171per hectare which falls near the specified indicative cost of overhead sprinkler systems
429 Factors Influencing Farmers to Adopt MI system To validate the outcome of the slated objectives of the scheme the beneficiaries were asked to give the reasons for adoption of the scheme and the same are presented in the following table
Table 33 Reasons for Adoption of Micro Irrigation Systems ()
State Total Beneficiaries
Because of
Subsidy
Quality of
Produce
Water Saving
Proper Utilization
of Land
Labor Saving
Time Saving
Fertilizer Saving
Early Fruiting
Higher Production
AP 672 2113 1622 5298 2917 3333 5744 2054 1637 1295 Bihar 516 2054 1143 9012 1415 4089 9244 2500 116 3779 Chhattisgarh 384 599 651 9766 1693 2370 8464 4063 1667 7083 Gujarat 576 3524 1667 8090 938 5486 2118 3507 052 2969 Haryana 320 9813 5938 9969 5719 9313 9656 9563 4281 8500 Karnataka 576 469 712 8455 2396 6719 5434 3715 434 2292 Maharashtra 672 3006 1042 7589 1458 4375 4524 2813 699 2113 Odisha 480 1229 667 7813 1938 3896 4896 1854 458 4438 Rajasthan 574 523 1359 7735 2979 4843 3066 1969 557 244 Sikkim 50 000 800 9600 4400 7200 5000 4400 600 1800 Tamil Nadu 455 1319 1297 7121 2000 5099 6571 4308 462 2308 UP 527 5617 3435 8235 3416 7002 6983 5977 2732 5617 Uttarakhand 90 3111 1222 5111 556 111 000 3000 000 6667 Total 5892 2529 1621 7890 2323 4963 5667 3557 1042 3340
Note Multiple Responses have been given to this question
It may be seen from the above table that in all nine reasons were revealed by the farmers for adopting the scheme which include (a) water saving (b) time saving (c) labor saving (d) fertilizer saving (e) higher production (f) because of subsidy (g) proper utilization of land (h) quality of produce and (i) early fruiting
Impact Evaluation Study on ldquoNational Mission on Micro Irrigation (NMMI)rdquo
52
It may further be observed that majority of the farmers reported that due to MI system they are able to save the water time and labor It is also revealed that the farmers are not installing the system because of subsidy only but also on account of other benefits In Haryana (98) ampUP (56) farmers have installed MI system due to the subsidy It is therefore concluded from here that higher amount of subsidy is not leading to more area under micro irrigation but it is due to other reasons such as reduction in cost of cultivation and higher production because of judicious use of irrigation as well as shifting towards high value income crops 4210 Subsidy Disbursement As per the operational guidelines of NMMI scheme the system in the beneficiariesrsquo field should be installed within sixty days from the date of filing the application Similarly the amount of subsidy should also be released to the suppliers service providers within 60 days Most of the farmers of Chhattisgarh (96) followed by Haryana Karnataka Tamil Nadu and Sikkim have reported that their applications are processed in less than 20 days and more than 90 percent of the farmers across states have reported that they got the sanction letter less than 40 days Only in case of Uttarakhand 50 percent of the farmers reported they got sanction after 100 days which resulted mainly due to the delayed receipt of money from the concerned quarters The following table further reveals that the 97 percent of the farmers of Bihar followed by Chhattisgarh (90) Haryana (85) amp Karnataka (78) and about 70 percent of the farmers of Odisha and Sikkim got their system installed in less than 20 days About 60 percent of Gujarat farmers 50 percent of Maharashtra followed by Tamil Nadu (48) and AP (45) reported that they got their system installed in 20-40 days
Table 34 Farmerrsquos Responses for Time Taken to Sanction Subsidy ()
State Total Beneficiary
Application to Sanction(Days) Sanction to installation (Days)
0-20 20-40 40-60 60-80 80-100 gt100 0-20 20-40 40-60 60-80 80-100 gt100 AP 672 5342 4583 074 000 000 000 4955 4524 506 000 000 015 Bihar 516 5252 4128 388 174 058 000 9690 291 000 019 000 000 Chhattisgarh 384 9583 417 000 000 000 000 8984 911 078 000 000 026 Gujarat 576 4878 4826 243 052 000 000 3281 6024 434 174 000 087 Haryana 320 9000 750 000 156 094 000 8469 1344 000 188 000 000 Karnataka 576 8559 1441 000 000 000 000 7830 1597 556 000 000 017 Maharashtra 672 4628 5372 000 000 000 000 4807 4926 253 015 000 000 Odisha 480 6229 3417 229 125 000 000 7104 2854 021 021 000 000 Rajasthan 574 5610 4338 052 000 000 000 5035 4669 244 052 000 000 Sikkim 50 6600 3400 000 000 000 000 7200 2800 000 000 000 000 Tamil Nadu 455 7385 2527 088 000 000 000 4593 4791 505 110 000 000 UP 527 4858 5047 076 000 000 019 2543 4269 1139 1537 285 228 Uttarakhand 90 000 222 667 1333 2333 5444 444 1111 6111 2333 000 000 Total 5892 6139 3557 114 059 046 085 5813 3461 448 219 025 034
Source GAPL survey
Impact Evaluation Study on ldquoNational Mission on Micro Irrigation (NMMI)rdquo
53
4211 Sources of Margin Money The contribution of the cost of MI system has to be borne by the farmers depending on the quantum of the subsidy available It was observed that in almost all the states beneficiary farmers contribute their own funds for contributing margin money Other sources albeit a small proportion constitutes banking KCC amp money lenders It may be seen from the following table that a very few beneficiaries have availed the bank loan for margin money
Table 35 Source of Finance for Meeting Beneficiary Share for Installation of MI System
State Total
Beneficiary
Source of Beneficiary Share of MI ()
Own sources
Bank KCC Money Lenders
AP 672 9807 000 104 089 Bihar 516 10000 000 000 000 Chhattisgarh 384 10000 000 000 000 Gujarat 576 9583 417 000 000 Haryana 320 9344 031 438 063 Karnataka 576 10000 000 000 000 Maharashtra 672 9911 060 030 000 Odisha 480 9979 000 021 000 Rajasthan 574 10000 000 000 000 Sikkim 50 10000 000 000 000 Tamil Nadu 455 10000 000 000 000 UP 527 9734 000 133 133 Uttarakhand 90 10000 000 000 000 Total 5892 9866 049 053 025
Source GAPL Survey
4212 Interest Rates on Borrowing
The number of beneficiaries who borrowed funds from different sources was less than 2 percent and only 049 percent borrowed from banks as stated above The beneficiaries borrowed money from various sources on differential rates of interest and their responses have been summarized in the following table which reveals that most of the farmers who borrowed money at less than 10 percent of rate of interest from banks amp KCCs
Impact Evaluation Study on ldquoNational Mission on Micro Irrigation (NMMI)rdquo
54
Table 36 Rate of Interest Paid by the Beneficiaries on Borrowed Funds
State No of Beneficiaries
10 amp less 10-12 12-15 gt15 AP 13 0 0 0 Bihar 0 0 0 0 Chhattisgarh 0 0 0 0 Gujarat 4 16 4 0 Haryana 14 3 2 1 Karnataka 0 0 0 0 Maharashtra 4 1 1 0 Odisha 1 0 0 0 Rajasthan 0 0 0 0 Sikkim 0 0 0 0 Tamil Nadu 0 0 0 0 UP 14 0 0 0 Uttarakhand 0 0 0 0 Total 50 20 7 1
4213 Type of MI system and Area Coverage 42131 Technology wise area coverage The emitting devices (inline or online emitters) are designed to discharge water at prescribed rates depending on the specific requirements of various crops In the sprinkler irrigation system water is discharge under pressure in the air through a set of nozzles attached to a network of high density polyethylene (HDPE) pipes simulating rainfall and are suitable where the plant density is very high It is widely used in field crops The sprinkler irrigation system may be portable semi-permanent or large systems (Rain guns) The cost of all the system varies across the states
Table 37 Proportion of Farmers having Drip and Sprinkler MI Systems
State Total No of Beneficiaries
Drip Sprinkler Both AP 672 499 7426 166 2470 7 104 Bihar 516 6 116 450 821 60 1163 Chhattisgarh 384 152 3958 227 5911 5 130 Gujarat 576 452 7847 115 1997 9 156 Haryana 320 228 7125 82 2563 10 313 Karnataka 576 571 9913 4 069 1 017 Maharashtra 672 589 8765 72 1071 11 164 Odisha 480 114 2375 349 7271 17 354 Rajasthan 574 354 6167 216 3763 4 070 Sikkim 50 40 8000 9 1800 1 200 Tamil Nadu 455 385 8462 69 1516 1 022 UP 527 311 5901 214 4061 2 038 Uttarakhand 90 58 6444 32 3556 0 000 Grand Total 5892 3759 6380 2005 3403 128 217
Source GAPL Survey
Impact Evaluation Study on ldquoNational Mission on Micro Irrigation (NMMI)rdquo
55
The data on area coverage under drip and sprinkler irrigation system with the beneficiary farmers in the sampled states are cited in Table 37 It is evident that drip system is more popular than sprinkler in most of the states under study The data documents that on and average area coverage under drip was about to 64 34 sprinkler and about 2 of the beneficiaries have reported both the system The respective area coverage under drip in Karnataka Tamil Nadu Sikkim AP Gujarat and Maharashtra reported more than 75 area under drip However in case of sprinkler irrigation system Bihar registered highest area under the system followed by Odisha and Chhattisgarh The inference may be drawn here that the technology wise area coverage is shifting more towards the horticulture crops and less for the field crops
Table 38 Drip amp Sprinkler System wise Area Coverage by Sampled Beneficiaries
Technology wise area coverage (ha)
State Total Area
under MI
Area under Drip
Area under Drip
Area under Sprinkler
Area under Sprinkler
AP 72431 54869 7575 17562 2425 Bihar 78034 7357 943 70676 9057 Chhattisgarh 67933 27161 3998 40773 6002 Gujarat 120259 87156 7247 33103 2753 Haryana 64800 53741 8293 11058 1707 Karnataka 76113 76113 10000 000 000 Maharashtra 86433 76210 8817 10222 1183 Odisha 85221 29212 3428 56009 6572 Rajasthan 67101 58554 8726 8546 1274 Sikkim 3132 2728 8708 405 1292 Tamil Nadu 53953 47468 8798 6485 1202 UP 81932 55069 6721 26864 3279 Uttarakhand 8347 7021 8412 1325 1588
Source GAPL Survey 42132 The Crop wise Area Coverage The crop wise area coverage was computed from the total area under drip and sprinkler irrigation system the pertinent results are enumerated in table below Andhra Pradesh
In the state of AP major fruit crops under drip system were noted to be mango citrus and banana which covered around 5491 of total area under drip Among vegetable crops brinjal chilli and tomato occupied comparatively higher area under drip than other vegetable crops Vegetables occupied around 3424 area under drip Flower maize and sugarcane covered around 1085 of area under drip irrigation with sampled beneficiaries Out of total area under MI in AP 2424 of the area was noted under sprinkler system About 4406 of area under sprinkler was occupied by vegetable crops whereas other
Impact Evaluation Study on ldquoNational Mission on Micro Irrigation (NMMI)rdquo
56
crops such as cotton maize and ground nut consists of about 5594 of the total area under sprinkler
Table 39 Crop wise Area Coverage under Drip and Sprinkler Systems in AP (Sampled Beneficiaries)
Drip Fruit Vegetable Other Crop
Name Area(ha) of Area Name Area(ha) of Area Name Area(ha) of Area Mango 7885 1437 Brinjal 9552 1741 Flower 096 017 Banana 4898 893 Chilli 3524 642 Maize 2268 413 Citrus Fruits
14379 2621 Tomato 3293 600 Sugarcane 1346 245
Others 2964 540 Others 2420 441 Pulses 933 170 Cotton 455 083 Other 857 156 Total 30126 5491 18789 3423 5954 914
Sprinkler Name Area(ha) of Area Name Area(ha) of Area Brinjal 3219 1833 Groundnut 2550 1452 Chilli 1550 883 Cotton 4249 2420 Okra 1230 701 Maize 911 518 Tomato 1738 990 Other 2115 1204 Total 7738 4406 9824 5594
Source GAPL Primary Survey 2013 Bihar
In the state of Bihar major fruit crops under drip system were noted to be mango which covered around 60 of total area under drip Among vegetable crops Okra and potato have occupied comparatively higher area under drip than other vegetable crops Vegetables occupied around 34 area under drip Sugarcane has covered around 275 of area under drip irrigation with sampled beneficiaries
Table 40 Crop wise Area Coverage under Drip and Sprinkler Systems in Bihar (Sampled Beneficiaries)
Drip Fruit Vegetable Other Crop
Name Area (Ha) of Area Name Area (Ha) of Area Name Area (Ha) of Area Mango 4383 5957 Potato 834 1133 Marigold 040 055 Litchi 093 127 Okra 931 1265 Sugarcane 202 275 Kadam 061 083 Others Crop 732 996 Others 081 110 Total 4618 6276 2497 3394 243 330
Sprinkler Name Area (Ha) of Area Name Area (Ha) of Area Name Area (Ha) of Area Blackberry 121 017 Potato 11251 1592 Wheat 13533 1915 Brinjal 2408 341 Sugarcane 10846 1535 Cauliflower 2311 327 Maize 16475 2331 Okra 1801 255 Menthol 2137 302 Tomato 1740 246 Other Crop 6160 872 Others Crop 1894 268 Total 121 017 21404 3028 49151 6954 Source GAPL Primary Survey 2013
Impact Evaluation Study on ldquoNational Mission on Micro Irrigation (NMMI)rdquo
57
Chhattisgarh
In the state of Chhattisgarh major fruit crops under drip system were noted to be banana Papaya and watermelon which covered around 345 of total area under drip Among vegetable crops Cucumber brinjal tomato and bitter gourd occupied comparatively higher area under drip than other vegetable crops Vegetables occupied around 9655 area under drip Out of total area under MI in Chhattisgarh 3998 of the area was noted under sprinkler system About 2562 of area under sprinkler was occupied by vegetable crops whereas other crops such as wheat gram and soybean consist of about 7438 of the total area
Table 41 Crop wise Area Coverage under Drip and Sprinkler Systems in Chhattisgarh (Sampled Beneficiaries)
Drip Sprinkler Fruit Vegetable Vegetable Other Crop
Name Area (ha)
of Area Name Area(ha) of
Area Name Area (ha)
of Area Name Area
(ha) of Area
Banana 340 125 Tomato 6462 2379 Okra 2865 703 Wheat 9348 2293 Papaya 374 138 Cucumber 3887 1431 Tomato 3115 764 Pulses 9576 2349 Watermelon 223 082 Brinjal 2414 889 Bottle Gourd 1319 324 Other
Crop 11402 2796
Bitter Gourd 3416 1258 Others Crop 3148 772 Others Crop 10045 3698 Total 937 345 26224 9655 10447 2562 30325 7438
Source GAPL Primary Survey 2013 Gujarat
In the state of Gujarat major fruit crops under drip system were noted to be banana Papaya and pomegranate which covered around 1225 of total area under drip Among vegetable crops Chili tomato potato and onion occupied comparatively higher area under drip than other vegetable crops Vegetables occupied around 1636 area under drip Flower cotton sugarcane and caster covered around 7139 of area under drip irrigation with sampled beneficiaries Out of total area under MI in Gujarat 2752 of the area was noted under sprinkler system About 2574 of area under sprinkler was occupied by fruits and vegetable crops whereas other crops such as flower cotton groundnut and caster consist of about 7427 of the total area
Impact Evaluation Study on ldquoNational Mission on Micro Irrigation (NMMI)rdquo
58
Table 42 Crop wise Area Coverage under Drip and Sprinkler Systems in Gujarat (Sampled Beneficiaries)
Drip Fruit Vegetable Other Crop
Name Area(ha) of Area Name Area(ha) of Area Name Area(ha) of Area Banana 6303 723 Chilli 5274 605 Flower 020 002 Papaya 1113 128 Tomato 3337 383 Caster 6414 736 Pomegranate 1072 123 Potato 2113 242 Cotton 49859 5721 Others 2185 251 Onion 2408 276 Sugarcane 1417 163 Others Crop 1129 130 Other Crop 4512 518 Total 10674 1225 14260 1636 62222 7139
Sprinkler Name Area(ha) of Area Name Area(ha) of Area Name Area(ha) of Area
Pomegranate 890 269 Potato 6322 1910 Flower 182 055 Water Melon 101 031 Others Crop 1204 364 Cotton 5099 1540 Ground nut 4800 1450 Caster 3217 972 Bajra 5783 1747 Other Crop 5503 1662 Total 992 300 7526 2274 24585 7427
Source GAPL Primary Survey 2013 Haryana
In the state of Haryana major fruit crops under drip system were noted to be Kinnow lemon strawberry and watermelon which covered around 7771 of total area under drip Among vegetable crops tomato potato and cucumber occupied comparatively higher area under drip than other vegetable crops Vegetables occupied around 1905 area under drip Flower and cotton covered around 324 and 396 of area respectively under drip irrigation with sampled beneficiaries Out of total area under MI in Haryana 1706 of the area was noted under sprinkler system About 9250 of area under sprinkler was occupied by fruits and vegetable crops whereas other crops such as cotton and wheat consist of about 750 of the total area under sprinkler
Table 43 Crop wise Area Coverage under Drip and Sprinkler Systems in Haryana (Sampled Beneficiaries) Drip
Fruit Vegetable Other Crop Name Area(ha) of Area Name Area(ha) of Area Name Area(ha) of Area Kinnow 36321 6759 Tomato 2408 448 Flower 344 064 Lemon 1781 331 Cucumber 1568 292 Cotton 1396 260 Water Melon 1396 260 Potato 2355 438 Strawberry 1012 188 Others Crop 3905 727 Other Crops 1255 233 Total 41764 7771 10237 1905 1740 324
Sprinkler Name Area(ha) of Area Name Area(ha) of Area Name Area(ha) of Area Musk Melon 283 256 Tomato 3693 3339 Cotton 364 329 Water Melon 152 137 Potato 1194 1080 Wheat 465 421 Chilli 1113 1006 Others Crop 3794 3431 Total 435 393 9794 8856 830 750
Source GAPL Primary Survey 2013
Impact Evaluation Study on ldquoNational Mission on Micro Irrigation (NMMI)rdquo
59
Karnataka
In the state of Karnataka major fruit crops under drip system were noted to be banana areca nut pomegranate and mango which covered around 8425 of total area under drip Among vegetable crops tomato chilli and ginger occupied comparatively higher area under drip than other vegetable crops Vegetables occupied around 1161 area under drip Turmeric Pepper and others crops covered around 1396 1331 and 425 of area under drip irrigation with sampled beneficiaries Table 44 Crop wise Area Coverage under Drip and Sprinkler Systems in Karnataka (Sampled Beneficiaries)
Drip Fruit Vegetable Other Crop
Name Area (Ha)
of Area
Name Area (Ha)
of Area
Name Area (Ha)
of Area
Banana 26716 3510 Tomato 3790 498 Turmeric 1396 183 Pomegranate 7684 1010 Chilli 2252 296 Pepper 1331 175 Areca nut 8503 1117 Ginger 1076 141 Other Crop 425 056 Mango 5704 749 Others Crop 1718 226 Others 15516 2039 Total 64124 8425 8837 1161 3153 414 Source GAPL Primary Survey 2013
Maharashtra
In the state of Maharashtra major fruit crops under drip system were noted to be banana mango citrus fruits and grapes which covered around 4283 of total area under drip Among vegetable crops tomato brinjal and chili occupied comparatively higher area under drip than other vegetable crops Vegetables occupied around 757 area under drip Flower sugarcane cotton and other crops covered around 061 2012 2697 and 190 of area under drip irrigation with sampled beneficiaries Under sprinkler system about 158 of area occupied by vegetable crops whereas other crops such as flower cotton ground nut black gram and soybean consist of about 9842 of the total area
Table 45 Crop wise Area Coverage under Drip and Sprinkler Systems in Maharashtra (Sampled Beneficiaries)
Drip Sprinkler Fruit Vegetable Other Crop Vegetable Other Crop
Name Area (Ha)
of Area Name Area
(Ha) of Area Name Area
(Ha) of Area Name Area
(Ha) of Area Name Area
(Ha) of Area
Banana 12043 1580 Brinjal 2590 340 Flower 465 061 Brinjal 051 049 Flower 081 079 Mango 7838 1028 Tomato 1718 225 Cotton 20553 2697 Peas 040 040 Cotton 3497 3421 Grapes 587 077 Chilli 1055 138 Sugarcane 15334 2012 Tomato 071 069 Soybean 2929 2865 Citrus Fruits
4110 539 Others 405 053 Other Crop 1446 190 Ground nut
946 925
Others 8066 1058 Black Gram
1384 1354
Others 1224 1198 Total 32643 4283 5768 757 37799 4960 162 158 10060 9842
Source GAPL Primary Survey 2013
Impact Evaluation Study on ldquoNational Mission on Micro Irrigation (NMMI)rdquo
60
Odisha
In the state of Odisha major fruit crops under drip system were noted to be mango banana and cashew nut which covered around 7090 of total area under drip Among vegetable crops tomato brinjal and Okra occupied comparatively higher area under drip than other vegetable crops Vegetables occupied around 2515 area under drip Flower moong and sugarcane covered around 395 of area under drip irrigation with sampled beneficiaries Under sprinkler system about 8741 of area was occupied by fruits and vegetable crops whereas other crops such as moong maize sugarcane and others crop consist of about 455 148 217 and 439 of the total area
Table 46 Crop wise Area Coverage under Drip and Sprinkler Systems in Odisha (Sampled Beneficiaries)
Drip Fruit Vegetable Other Crop
Name Area (Ha) of Area Name Area (Ha) of Area Name Area (Ha) of Area Mango 8771 3002 Tomato 1803 617 Flower 121 042 Banana 3602 1233 Brinjal 1497 513 Moong 364 125 Cashew nut 2165 741 Okra 1042 357 Sugarcane 202 069 Others 6174 2113 Others Crop 3005 1029 Other Crop 465 159 Total 20711 7090 7347 2515 1153 395
Sprinkler Name Area (Ha) of Area Name Area (Ha) of Area Name Area (Ha) of Area
Pineapple 182 033 Brinjal 10350 1848 Moong 2550 455 Watermelon 324 058 Tomato 9410 1680 Maize 830 148 Okra 6297 1124 Sugarcane 1214 217 Cauliflower 5585 997 Other Crop 2459 439 Others Crop 16809 3001 Total 506 090 48451 8651 7052 1259
Source GAPL Primary Survey 2013
Rajasthan
In the state of Rajasthan major fruit crops under drip system were noted to be kinnow orange and mango which covered around 43 of total area under drip Among vegetable crops onion carrot and tomato occupied comparatively higher area under drip than other vegetable crops Vegetables occupied around 24 area under drip Flower cotton arandi and guar covered around 32 of area under drip irrigation with sampled beneficiaries Out of total area under MI in Rajasthan more of the area was noted under sprinkler system About 56 of area under sprinkler was occupied by fruits and vegetable crops whereas other crops such as flower wheat Mustard and cotton consist of about 44 of the total area
Impact Evaluation Study on ldquoNational Mission on Micro Irrigation (NMMI)rdquo
61
Table 47 Crop wise area Coverage under Drip and Sprinkler Systems in Rajasthan (Sampled Beneficiaries)
Drip Fruit Vegetable Other Crop
Name Area of Area Name Area of Area Name Area of Area Kinnow 6523 1114 Onion 5315 908 Flower 656 112 Orange 13019 2223 Tomato 2832 484 Cotton 11881 2029 Lemon 1854 317 Cauliflower 1510 258 Arandi 1730 295 Mango 1017 174 Others Crop 4396 751 Guwar 1463 250 Other Crops 3149 538 Other Crop 3209 548 Total 25563 4366 14052 2400 18939 3234
Sprinkler Name Area of Area Name Area of Area Name Area of Area Lemon 202 237 Carrot 3954 4626 Mustard 2488 2912 Others Crop 623 729 Wheat 647 757 Other Crop 631 739 Total 202 237 4577 5356 3767 4407 Source GAPL Primary Survey 2013
Sikkim
In the state of Sikkim major fruit crops under drip system were noted to be orange and guava which covered around 41 of total area under drip Among vegetable crops tomato and brinjal occupied comparatively higher area under drip than other vegetable crops Vegetables occupied around 42 area under drip Wheat and mustard covered around 313 of area under drip irrigation with sampled beneficiaries Out of total area under MI in About 70 of area under sprinkler was occupied by the vegetable crops whereas other crops such as wheat and turmeric consist of about 30 of the total area Table 48 Crop wise Area Coverage under Drip and Sprinkler Systems in Sikkim (Sampled Beneficiaries)
Drip Fruit Vegetable Other Crop
Name Area (Ha)
of Area Name Area
(Ha) of Area Name Area
(Ha) of Area
Orange 939 3442 Tomato 555 2036 Large Cardamom
142 519
Guava 182 668 Brinjal 263 964 Turmeric 243 890 Other Crop 333 1220 Other Crop 071 260 Total 1121 4110 1151 4221 455 1669
Sprinkler
Name Area of Area Name
Area (Ha)
of Area Name
Area (Ha)
of Area
Tomato 081 2000 Turmeric 081 2000 Cauliflower 081 2000 Other Crop 040 1000 Barackoli 081 2000 Others Crop 040 1000 Total 283 7000 121 3000 Source GAPL Primary Survey 2013
Impact Evaluation Study on ldquoNational Mission on Micro Irrigation (NMMI)rdquo
62
Tamil Nadu
In the state of Tamil Nadu major fruit crops under drip system were noted to be banana tapioca coconut and aonla which covered around 5528 of total area under drip Among vegetable crops tomato chili and brinjal occupied comparatively higher area under drip than other vegetable crops Vegetables occupied around 1780 area under drip Turmeric and sugarcane covered around 2692 of area under drip irrigation with sampled beneficiaries Out of total area under MI in Tamil Nadu 1202 of the area was noted under sprinkler system About 9923 of area under sprinkler was occupied by fruits and vegetable crops whereas other crops such as turmeric consist of about 078 of the total area Table 49 Crop wise Area Coverage under Drip and Sprinkler Systems in Tamil Nadu (Sampled Beneficiaries)
Drip Fruit Vegetable Other Crop
Name Area (Ha) of Area Name Area (Ha) of Area Name Area (Ha) of Area Banana 7875 1659 Chilli 2025 427 Turmeric 9501 2002 Tapioca 4994 1052 Brinjal 1720 362 Sugarcane 3278 691 Coconut 4953 1044 Tomato 1761 371 000 Aonla 3458 728 Others Crop 2944 620 Others Crop 4958 1045 Total 26238 5528 8451 1780 12779 2692
Sprinkler Name Area (Ha) of Area Name Area (Ha) of Area Name Area (Ha) of Area Carrot 081 125 Chilli 3197 4930 Turmeric 051 078 Potato 1740 2683 Carrot 1234 1903 Others Crop 182 281 Total 081 125 6354 9797 051 078 Source GAPL Primary Survey 2013 Uttar Pradesh In the state of UP major fruit crops under drip system were noted to be banana mango and guava which covered around 81 of total area under drip Among vegetable crops tomato potato and chili occupied comparatively higher area under drip than other vegetable crops Vegetables occupied around 19 area under drip Maize wheat and other crops covered around 144 of area under drip irrigation with sampled beneficiaries Out of total area under MI in UP about one-third of the area was noted under sprinkler system About 88 of area under sprinkler was occupied by fruits and vegetable crops whereas other crops such as wheat consist of about 12 of the total area
Impact Evaluation Study on ldquoNational Mission on Micro Irrigation (NMMI)rdquo
63
Table 50 Crop wise Area Coverage under Drip and Sprinkler Systems in UP (Sampled Beneficiaries)
Drip Fruit Vegetable Other Crop
Name Area of Area Name Area of Area Name Area of Area Banana 13173 2392 Potato 2752 500 Maize 263 048 Guava 12363 2245 Tomato 2863 520 Sunflower 020 004 Mango 16431 2984 Chilli 1295 235 Litchi 1538 279 Cabbage 911 165 Others Crop 951 173 Others Crop 2509 456 Total 44456 8073 10330 1876 283 051
Sprinkler Name Area of Area Name Area of Area Name Area of Area Strawberry 040 015 Peas 9611 3578 Flower 081 030 Tomato 4037 1503 Wheat 2703 1006 Brinjal 2529 942 Other Crop 314 117 Okra 1457 542 Others Crop 6091 2267 Total 040 015 23725 8832 3098 1153 Source GAPL Primary Survey 2013 Uttarakhand In the state of Uttarakhand major fruit crops under drip system were noted to be peach mango litchi and guava which covered around 96 of total area under drip Among vegetable crops only peas occupied around 201 area under drip Out of total area under MI in Uttarakhand about one-fourth of the area was noted under sprinkler system About 100 of area under sprinkler was occupied by vegetable crops
Table 51 Crop wise Area Coverage under Drip and Sprinkler Systems in Uttarakhand (Sampled Beneficiaries)
Drip Sprinkler Fruit Vegetable Other Crop Vegetable
Name Area (Ha)
of Area Name Area
(Ha) of Area Name Area
(Ha) of Area Name Area
(Ha) of Area
Mango 3217 4582 Peas 101 144 Popular Tree
202 288 Peas 1062 8015
Peach 1356 1931 Tomato 263 1985 Guava 1477 2104 Litchi 668 951 Total 6718 9568 101 144 202 288 1325 10000 Source GAPL Primary Survey 2013
The above tables also shows that crops as brinjal chilli Okra flower tomato bottle gourd pomegranate etc are irrigated with micro sprinkler irrigation system by the beneficiaries However during the course of discussion with experts it was observed that irrigation through this system is not recommended because it harms the crop at the flowering stage Therefore it is recommended that farmers should be advised at the time of installation to use drip irrigation for such crops or they may avoid use of sprinkler during flowering stage and irrigate through alternative means
Impact Evaluation Study on ldquoNational Mission on Micro Irrigation (NMMI)rdquo
64
4214 System Demonstration The outcome demonstration particularly in rural area where exposure is limited remains an important instrument in educating the rural folks because only physical or concrete evidence is convincing for them Seen evidence can be easily and correctly interpreted when in fact interpretation may be difficult thus gives better results NMMI scheme has a component of demonstrations at the farmersrsquo fields to educate the farmers of that particular cluster In this regard the farmers were asked whether they have exposure to any field visit demonstration MI system
Table 52 Exposure of Beneficiary Farmers to MI Demonstrations
State Participated () Yes No
AP 1250 8750 Bihar 3721 6279 Chhattisgarh 4896 5104 Gujarat 2830 7170 Haryana 9844 156 Karnataka 2726 7274 Maharashtra 4747 5253 Odisha 4167 5833 Rajasthan 6463 3537 Sikkim 8000 2000 Tamil Nadu 2330 7670 UP 2144 7856 Uttarakhand 6333 3667
Source GAPL Survey
It may be seen from the above table that the beneficiaries of Haryana (98) followed by Sikkim (80) Rajasthan (64) and Uttarakhand (63) attended the demonstration nearby their areas Whereas majority of the farmers AP UP Tamil Nadu Karnataka Gujarat Bihar have reported that they have not visited any demonstration It is therefore suggested that more efforts may be put to expose the farmers regarding demonstration of MI system and its benefits 4215 Training and Capacity Building The training and capacity building is an integral component of the MI initiatives This component has been inbuilt to upgrade the capacity building of farmers and field functionaries through training and demonstrations carried out by state agricultural universities Precision Farming Development Centers (PFDCs) and the industry In light of
Impact Evaluation Study on ldquoNational Mission on Micro Irrigation (NMMI)rdquo
65
these observations our survey gave due attention to the training component and the obtained results are enumerated in table 53 The data revealed that almost all the respondents of Tamil Nadu UP Chhattisgarh Haryana were given training materials during the training while few beneficiaries of the Bihar Uttarakhand amp Karnataka received such training materials It has also been noted that farmers were imparted training on operation and maintenance of the system adoption of package practices under MI opportunities for introducing new crops with the help of micro irrigation system As far as field visits are concerned most of the beneficiaries reported that they have visited the fields of progressive farmers and demonstration fields except for Chhattisgarh Rajasthan and Uttarakhand where few farmers have reported that they have visited the demonstration fields
Impact Evaluation Study on ldquoNational Mission on Micro Irrigation (NMMI)rdquo
66
Table 53 Topic Covered in Training for Beneficiary Farmers ()
State Total
Beneficiary
Training Material Provided
Topic Covered in the Training
Joined Any Field Visit
Satisfied with the Learning
Operation of the System
Maintenance of the System
Package of Practices for
the Crops
Opportunities for Introduction
of New Crop
Other Related Schemes
Yes No Yes No Yes No Yes No Yes No Yes No Yes No Yes No AP 672 7188 878 7991 074 7917 149 7113 952 5580 2485 6592 1473 6696 3304 7307 759 Bihar 516 950 1047 1977 019 1977 019 1453 543 601 1395 194 1802 446 9360 620 019 Chhattisgarh 384 9714 208 9922 000 9896 026 9766 156 7057 2865 7083 2839 8073 1927 7995 078 Gujarat 576 4531 313 4705 139 4653 174 3264 1580 1094 3750 1510 3333 3767 6233 3715 052 Haryana 309 9363 637 9385 615 9341 659 9099 901 6286 3714 6154 3846 8330 1670 9319 681 Karnataka 576 2638 6357 8937 057 8748 247 4459 4535 2979 6015 1575 7419 4592 5408 5047 342 Maharashtra 672 7188 878 7991 074 7917 149 7113 952 5580 2485 6592 1473 6696 3304 7307 759 Odisha 480 5878 253 6131 000 6116 015 5193 938 3929 2202 4926 1205 5744 4256 6086 045 Rajasthan 574 8171 261 8432 000 8223 209 8031 401 6707 1725 7038 1394 679 2735 6951 314 Sikkim 50 4771 438 5146 063 5167 042 4479 729 2396 2813 2833 2375 4333 5667 5000 208 Tamil Nadu 455 9965 035 9965 035 9931 069 9080 920 6059 3941 5955 4045 8507 1493 9670 330 UP 527 9800 000 9800 000 9800 000 8400 1400 5000 4800 4800 5000 8000 2000 9800 000 Uttarakhand 90 667 2667 2889 444 2889 444 778 2556 556 2778 444 2889 1111 2222 1556 1778
Source GAPL Survey
Impact Evaluation Study on ldquoNational Mission on Micro Irrigation (NMMI)rdquo
67
The farmers were asked whether they are satisfied from the training they received The beneficiaries of almost all the states gave positive response in this regard It is recommended that training on innovative techniques relevant to the MI Systems should cover topics such as high density plantation canopy management intercropping and use of mulch materials The beneficiaries were further asked about the institutions from which they have got the training about the MI system The obtained responses of the sampled beneficiaries are presented in the following table
Table 54 Institution for Training as Reported by Respondents ( Beneficiaries)
State Total Responses
SAUs KVKs PFDC
State Govt
Agencies
System Supplier Others
SAUs KVKs amp State Govt
Agencies
SAUs KVKs amp System Supplier
State Govt
Agencies amp System Supplier
AP 542 073 3229 6605 018 000 000 074 Bihar 103 1359 291 7961 000 000 291 097 Chhattisgarh 381 1365 079 4331 000 131 3832 262 Gujarat 279 359 430 9176 000 036 000 000 Haryana 309 194 906 8641 032 000 032 194 Karnataka 575 504 522 8974 000 000 000 000 Maharashtra 412 1360 437 7597 024 024 097 461 Odisha 250 240 160 8800 040 040 680 040 Rajasthan 484 534 331 9029 000 000 000 103 Sikkim 49 612 6531 2449 000 000 204 204 Tamil Nadu 427 211 000 9789 000 000 000 000 UP 474 211 211 9557 000 000 000 021 Uttarakhand 30 333 667 8667 000 000 000 333
Source GAPL Survey sharing of source technical Information regarding micro irrigation system scheme Note The duration of training has been reported to be of 1-2 days as revealed by the participant beneficiaries It may be seen from the above table that the system suppliers manufacturers are the major sources who imparted the training as more than 90 percent of the farmers of Tamil Nadu UP Gujarat Rajasthan and Karnataka received the training from suppliers Other sources of training are state government agencies and SAUsKVKs PFDC etc Most of the manufacturers imparted training at the time of system installation However it was revealed by the beneficiaries that after installation training on system operation is not provided to them as per their needs As such most of the farmers fail to draw full advantage of the MI system There is thus a dire need to provide technical support for system operation after installation It is recommended that regular trainings under MI system may be made mandatory on the part of system suppliers after the installation of the system as they are closely associated with the beneficiaries and have in-depth knowledge of the installed system
Impact Evaluation Study on ldquoNational Mission on Micro Irrigation (NMMI)rdquo
68
4216 Availability of Electricity The micro irrigation system runs on power and is a pre requisite for the installation of system therefore availability of power is an important parameter in this regard The following table shows the availability of electricity among all the states
Table 55 Availability of Electricity (Beneficiaries and Non Beneficiaries)
Beneficiaries Non Beneficiaries
State Total
Beneficiary
Availability of electricity () Availability of electricity () 0-4
HrsDay 4-8
HrsDay 8-12
HrsDay 12-16
HrsDay 16-20
HrsDay 20-24
HrsDay Total Non-
beneficiaries 0-4
HrsDay 4-8
HrsDay 8-12
HrsDay 12-16
HrsDay 16-20
HrsDay
AP 672 104 7113 2768 015 000 000 168 179 7560 2202 060 000 Bihar 516 1492 7888 581 039 000 000 128 1094 4844 2578 1484 000 Chhattisgarh 384 7943 1979 000 078 000 000 96 000 313 2083 5729 1875 Gujarat 576 000 9010 573 260 156 000 144 139 069 9722 069 000 Haryana 320 094 1719 6719 1438 000 031 81 123 1728 7284 864 000 Karnataka 576 000 9410 590 000 000 000 144 139 9444 556 000 000 Maharashtra 672 015 1994 7366 625 000 000 169 059 3018 6331 592 000 Odisha 480 083 1563 3104 4354 896 000 120 250 2250 2750 4500 250 Rajasthan 574 1690 6429 1376 505 000 000 138 145 9348 435 072 000 Sikkim 50 000 10000 000 000 000 000 10 000 8000 000 000 000 Tamil Nadu 455 000 10000 000 000 000 000 120 000 10000 000 000 000 UP 527 000 2068 7078 816 038 000 168 119 2143 6905 833 000 Uttarakhand 90 333 8778 000 000 889 000 22 1364 5909 2273 000 455
Source GAPL Survey
It may be seen that the supply of electricity in different states only one farmer among the beneficiaries that two of Haryana reported that the electricity available for 24 hrs It may further be seen that 100 percent of the farmers of Sikkim and Tamil Nadu reported to get electricity for 4-8 hrs in a day In other states it was observed that electricity is available for less than 16 hrs a day and out of which maximum reported to be between 12-16 hrs a days It may further be seen that farmers of Tamil Nadu Karnataka Rajasthan Sikkim and AP reported that they are getting electricity for 8 hrs whereas rest of the farmers reported that they are getting electricity up to 16 hrs a day The availability of electricity to beneficiaries and non-beneficiaries are showing the same trend
Impact Evaluation Study on ldquoNational Mission on Micro Irrigation (NMMI)rdquo
69
4217 Capacity of Pump Sets It may be seen from the following table that the majority of the farmers are using pump sets ranging upto 5 hp In AP and Maharashtra about 74 and 63 percent of beneficiaries reported that they are using the pump sets of 5-10 hp at their farms However about 59 54 41 percent farmers of Gujarat Haryana and UP respectively revealed that that they are having the pump sets of more than 10 hp The variations in the capacities of installed pump sets are attributed to the depth of water farm size type of MI system installed Most of the farmers reported that pump sets of appropriate capacity have been installed which thoroughly meet the system requirements and they are not facing any problem to irrigate the crops as per their requirements
Table 56 Capacity of Pump Sets Used by Beneficiaries
States Total
Beneficiary Power of the Pump Set ()
0-5 hp 5-10 hp 10-15 hp AP 672 2307 7426 267 Bihar 516 9845 097 058 Chhattisgarh 384 9896 000 104 Gujarat 576 347 3715 5938 Haryana 320 469 4094 5437 Karnataka 576 6319 3681 000 Maharashtra 672 2842 6295 863 Odisha 480 6771 3000 229 Rajasthan 574 8449 436 1115 Sikkim 50 6200 3800 000 Tamil Nadu 455 3275 6725 000 UP 527 493 5446 4061 Uttarakhand 90 4111 4444 1445
Source GAPL Survey 4218 Irrigation Filters Clean water is crucial for proper and effective long term operation of micro irrigation systems Water filtration is important for all irrigation systems Clogging of nozzles emittersdrippers reduce the efficiency of the MI system which ultimately results in increase in energy consumption and maintenance as well as cost of irrigation Filters can help extend the life of and lower the maintenance on sprinkler system For drip systems they are a necessity to prevent emitters from becoming plugged The yield is also affected because of clogging In drip and sprinkler irrigation the quality of water being pumped into the irrigation system is the most important factor in filter selection Filtration may be accomplished through use of filters They are sand separators media filter screen filter disc filter and settling basin
Impact Evaluation Study on ldquoNational Mission on Micro Irrigation (NMMI)rdquo
70
Sand separator or hydro cyclone filter is a type of filter that separates the particles from water according to the principle of gravitational settling and centrifugal force These are effective to remove suspended particles which have specific gravity more than 265 gcc (JISL) and are larger than 75 micron Such filters are suited for water type where a lot of sand is present in the water as they dont clog up nearly as quickly as other types of filters The dirty water enters the filter where it is swirled around the inside of a cylinder These filters are reasonably inexpensive very simple and are very effective for removing sand from water
Screen filters are probably the most common filters and in most case the least expensive and are excellent for removing hard particulates from water such as sand They are not so good at removing organic materials such as algae mold slime and other unmentionables These non-solid materials tend to embed themselves into the screen material from where they are very difficult to remove In other cases they simply slide through the holes in the screen by temporarily deforming their shape Screen filters are cleaned by flushing them with a stream of water or removing the screen and cleaning it by hand
Media filters clean the water by forcing it through a container filled with a small sharp edgedgranulated media In most cases the media material is uniform sized crushed silica sand The water passes through the small spaces between the media grains and the debris is stopped when it cant pass through these spaces Media filters are best for removing organic material from the water Media filters are the type of filters most commonly used for high volume cleaning of water from rivers and lakes Disc filters are a cross between a screen filter and a media filter with many of the advantages of both Disc filters are good at removing both particulates like sand and organic matter The pertinent information has been summarized in the following table below
Impact Evaluation Study on ldquoNational Mission on Micro Irrigation (NMMI)rdquo
71
Table 57 Type of Irrigation Filters Used by Farmers
Type of Irrigation Filters used by the Farmers () State Total
Beneficiary Total
Responses Hydro-cyclone
Filter
Screen filters
Sand Media Filters
Disc Filters
Hydro-cyclone
Filter ampScreen
filters
Hydro-cyclone Filter amp
Sand Media Filters
Hydro-cyclone Filter amp
Disc Filters
Screen filters
amp Sand Media Filters
Screen filters amp Disc Filters
Sand Media Filters ampDisc Filters
Hydro-cyclone Filter amp Screen
filters amp Sand
Media Filters
Hydro-cyclone Filter amp Screen
filters amp Disc
Filters
AP 672 672 015 9583 402 000 000 000 000 000 000 000 000 000 Bihar 516 6 000 8333 000 000 000 000 000 000 1667 000 000 000 Chhattisgarh 384 156 449 3141 000 5449 000 000 385 000 577 000 000 000 Gujarat 576 517 2244 1876 019 1973 348 019 2340 019 1103 058 000 000 Haryana 320 320 125 219 000 000 6469 125 031 1875 000 000 1094 063 Karnataka 576 576 035 7969 417 1580 000 000 000 000 000 000 000 000 Maharashtra 672 670 149 8478 075 1045 000 000 000 060 030 164 000 000 Odisha 480 480 021 9438 021 396 000 000 000 104 021 000 000 000 Rajasthan 574 568 141 8680 1056 000 000 018 000 053 035 018 000 000 Sikkim 50 50 000 9800 000 200 000 000 000 000 000 000 000 000 Tamil Nadu 455 455 044 8725 637 593 000 000 000 000 000 000 000 000 UP 527 524 248 8473 000 000 1240 000 000 038 000 000 000 000 Uttarakhand 90 90 000 10000 000 000 000 000 000 000 000 000 000 000
Source GAPL Survey
Impact Evaluation Study on ldquoNational Mission on Micro Irrigation (NMMI)rdquo
72
Different types of filters are mainly used for drip irrigation system whereas its use for sprinkler system is required under very specific water quality characteristics Some beneficiaries reported that they were using filters in sprinkler systems to check the plugging etc The beneficiary farmers using drip irrigation system were asked about the type of filters being used by them It may be seen from the table 58 that farmers are using screen filters centrifugal separators hydro-cyclone filter disc filter sand media filters depending on the need The data cited in the above table reveal that screen filters are being commonly used by the beneficiaries in most of the sampled states except Haryana where screen filters are being used in combination with hydrocyclone filters The combined use of filters in Haryana is attributed to the fact that additional subsidy is being given on hydro-cyclone type of filters In fact a combination of three filters (hydro-cyclone screen amp sand filter) is also being used by some beneficiaries of Haryana The use of such combinations may be ascribed to the fact that since Haryana government is extending financial assistance to construct water storage tanks as such many farmers prefer to store the water in such structures The incidence of different types of contaminations is higher in the stored water thus farmers are using combination of three types of filters to ensure the removal of all types of organic and inorganic materials Disc filters are used by about 55 percent farmers of Chhattisgarh followed by Gujarat (20) Karnataka (16) About 10 percent of the farmers of Rajasthan followed by 6 percent Tamil Nadu and 4 from AP are using sand filters may be because they are getting water from canals which has high dirt load of organic and inorganic materials The size of filter installed with MI system depends on the area being irrigated and the quantum of water being pumped It has been noted by the field staff that in most of the cases size of filters was appropriate as per the area soil and water quality characteristics 4219 Type of Emitters in drip system There are two categories of emitters usually installed with drip system in the field
a) In-line emitters These are used in row crops such as vegetables where water needs to be applied effectively near the root zone area
b) On-line emitters These are suitable to orchard crops such as apples mangoes etc These drippers are fixed on the laterals and can be opened for cleaning It provides uniform water distribution in the root zone The drippers may clog with physical impurities like minerals amp salts and also due to poor maintenance Further rodents and insects can damage lateral pipes of the drip irrigation system
Drip irrigation system left above the ground tends to clog less as in underground system chances of deposition of algae and soil particles is high It is also easy to lift while
Impact Evaluation Study on ldquoNational Mission on Micro Irrigation (NMMI)rdquo
73
preparing the fields for seed sowing or transplantation of seedlings Use of plastic mulch in conjunction with drip irrigation system has been reported to be more beneficial in saving water and improving the crop yields It was assessed during the course of study whether the sampled beneficiaries were using in-line or on-line drip system the pertinent data on type of emitters are cited in the following table
Table 58 Type of Emitters Used by Beneficiaries
State Total
Responses Inline Online
in Inline Online
AP 512 414 98 8086 1914 Bihar 6 4 2 6667 3333 Chhattisgarh 153 98 55 6405 3595 Gujarat 450 344 106 7644 2356 Haryana 236 128 102 5424 4576 Karnataka 575 359 216 6243 3757 Maharashtra 577 366 211 6343 3657 Odisha 118 84 34 7119 2881 Rajasthan 118 79 39 6695 3305 Sikkim 45 34 11 7556 2444 Tamil Nadu 384 256 128 6667 3333 UP 322 220 102 6832 3168 Uttarakhand 30 12 18 4000 6000
Source GAPL Survey It may be seen from the above table that more than 70 percent of the respondent farmers of AP Gujarat Sikkim and Odisha were using in-line drip irrigation system whereas more than 45 percent beneficiaries of Haryana and Uttarakhand reported to practice on-line drip irrigation system 4220 Type of Sprinkler Under sprinkler irrigation water is sprinkled under pressure on to the crop through a set of nozzles attached to network of pipes in the form of rainfall The sprinkler system sets unlike drip system are moveable Hence one sprinkler set could cover more than one hectare by shifting from one place to another Assistance for sprinkler irrigation is limited to only those crops where drip irrigation is uneconomical
Impact Evaluation Study on ldquoNational Mission on Micro Irrigation (NMMI)rdquo
74
Table 59 Type of Sprinklers Used by Beneficiaries
State Total Responses Percentage
Portable MiniMicro Rain gun AP 160 2072 7928 000 Bihar 510 9471 529 000 Chhattisgarh 231 7745 2251 000 Gujarat 126 8810 1111 079 Haryana 84 9524 476 000 Karnataka 87 3218 6667 114 Maharashtra 95 9368 632 000 Odisha 362 9613 387 000 Rajasthan 356 7556 2444 000 Sikkim 10 8000 2000 000 Tamil Nadu 71 9718 282 000 UP 205 9707 293 000 Uttarakhand 60 8833 1167 000
Source GAPL Survey It may be seen from the above table that majority of the beneficiaries of Tamil Nadu Rajasthan Odisha Bihar Maharashtra Gujarat and Uttarakhand states were using portable sprinkler irrigation system The use of rain gun was reported by one farmer only in Gujarat as it is most suitable to the large area under cultivation It is noted to be appropriate type of sprinkler system for larger areas as it can rotate 30 to 360 circle covering 25 meter radius with a discharge rate 175 lps 4221 Farmersrsquo opinion on System Supply and Installation related constraints The farmers were asked to reveal the difficulties faced by them right from the filing of application till receiving the after sales service including procedures quality of the systems supplied prices charged by empanelled system suppliers delay in installation after the placement of orders and any additional charges claimed by the supplies The response of the beneficiaries has been summarized in the table below
Impact Evaluation Study on ldquoNational Mission on Micro Irrigation (NMMI)rdquo
75
Table 60 Constraints Faced by Beneficiary Farmers ()
State Total
Beneficiaries
Procedure Related
Quality Issues
Higher Prices Charged
under Scheme then Available
in Market
Delay in System Supply
(Committed date vs Actual
date
Other Charges (Not covered in
the scheme additional
money paid) Yes No Yes No Yes No Yes No Yes No
AP 672 000 10000 060 9940 060 9940 060 9940 015 9985 Bihar 516 078 9922 155 9845 155 9845 252 9748 717 9283 Chhattisgarh 384 026 9974 000 10000 000 10000 000 10000 000 10000 Gujarat 576 25 975 313 9688 191 9809 278 9722 139 9861 Haryana 320 094 9906 094 9906 063 9938 281 9719 000 10000 Karnataka 576 000 10000 000 10000 000 10000 000 10000 000 10000 Maharashtra 672 030 9970 089 9911 074 9926 104 9896 074 9926 Odisha 480 000 10000 000 10000 000 10000 479 9521 021 9979 Rajasthan 574 1359 8641 854 9146 1045 8955 1045 8955 1045 8955 Sikkim 50 000 10000 200 9800 000 10000 000 10000 000 10000 Tamil Nadu 455 000 10000 000 10000 000 10000 000 10000 000 10000 UP 527 152 9848 209 9791 114 9886 285 9715 019 9981 Uttarakhand 90 3556 6444 3889 6111 5444 4556 3556 6444 889 9111 Total 5892 233 9767 229 9771 246 9754 304 9696 205 9795
Source GAPL Survey It is evident from the data that in most of the sample states beneficiaries did not face much of the difficulties related to the procedures quality prices delay in system installation etc 4222 After Sales Service The information on magnitude and quality of after sales services being provided by the suppliers has been summarized in table 61 On an average 91 percent of the beneficiaries across the sampled states reported that after sales services are being provided to them However about 34 percent beneficiaries from Bihar and 22 percent beneficiaries from Gujarat amp Maharashtra each informed that they did not receive the after sales services As for the timely and regular availability of after sales services is concerned about 87 percent beneficiaries reported that they receive the services at the required time
Impact Evaluation Study on ldquoNational Mission on Micro Irrigation (NMMI)rdquo
76
Table 61 Status Reported by Beneficiaries Regarding lsquoAfter Sales Servicesrsquo
State Total Beneficiary Provided by the vendor () If yes then ()
Yes No Timely Late Irregular AP 672 10000 000 8051 1949 000 Bihar 516 6570 3430 8378 1563 059 Chhattisgarh 384 10000 000 10000 000 000 Gujarat 576 7778 2222 8973 558 469 Haryana 320 10000 000 9156 438 406 Karnataka 576 9896 104 9045 920 035 Maharashtra 672 7768 2232 7854 1897 249 Odisha 480 9229 771 8871 880 248 Rajasthan 574 9582 418 9327 618 055 Sikkim 50 10000 000 9800 200 000 Tamil Nadu 455 9890 110 8813 1187 000 UP 527 9772 228 8854 1126 019 Uttarakhand 90 10000 000 2000 2222 5778 Total 5892 9085 915 8697 1083 220
Source GAPL Survey
The respondents were further enquired regarding the level of satisfaction with respect to after sale services and their responses are given in the Figure 8 It is well evident that on an average 87 percent of the beneficiaries across the entire 13 states received the after sales services to their complete satisfaction
During the course of field survey the respondents were asked whether this system supplier have given after sale service for the MI system installed at their farms The results regarding this issue have been summarized in above table It may be seen from the table that the farmers of Chhattisgarh AP Sikkim and Uttarakhand have reported that 100 percent after sale service was provided to them whereas two-third of the farmers reported regarding after sale service The farmers of the most of the states have got the benefit of this service
It is suggested that the implementing agencies should be more vigilant regarding warranty and after sales service of the system provided by the suppliers The question of releasing 10 percent of the cost of the system after one year subject to satisfactory performance of the system as certified by the beneficiary may be considered Maintenance manual in vernacular language should be made available to the beneficiaries at the time of installation of the system
Impact Evaluation Study on ldquoNational Mission on Micro Irrigation (NMMI)rdquo
77
Figure 8 Level of Satisfaction regarding lsquoAfter Sale Servicesrsquo
Source GAPL Survey
4223 Warranty As per the norms of NMMI the system suppliers are supposed to extend warranty to the beneficiaries regarding MI system installed at their farms In this regard the beneficiaries were asked regarding issue of warranty to them and their replies are summarized in table 62
Table 62 Status of Warranty for MI System ()
State Total
Beneficiary Warranty () If yes then () Yes No lt6 Months 1 Yr 1-2 Yr 2-3 Yr gt3 Yr
AP 672 10000 000 000 104 565 6533 2798 Bihar 516 3527 6473 000 165 275 5769 3791 Chhattisgarh 384 9948 052 000 000 052 890 9058 Gujarat 576 9948 052 000 017 035 070 9878 Haryana 320 10000 000 000 000 031 9969 000 Karnataka 576 10000 000 000 017 087 8906 990 Maharashtra 672 10000 000 000 238 491 3557 5714 Odisha 480 10000 000 000 021 167 2042 7771 Rajasthan 574 10000 000 000 087 3101 976 5836 Sikkim 50 10000 000 000 9000 000 800 200 Tamil Nadu 455 10000 000 000 022 044 7736 2198 UP 527 9981 019 000 019 646 8422 913 Uttarakhand 90 10000 000 667 3556 1667 4111 000 Source GAPL Survey
It may be seen from the above table that the beneficiaries of all the states under study have reported that they have got the warranty as per the requirement except for Bihar
Impact Evaluation Study on ldquoNational Mission on Micro Irrigation (NMMI)rdquo
78
were majority of the farmers reported that they did not get this benefit The farmers were further asked the duration of the warranty issue to them by the company Almost all the farmers of Chhattisgarh and Gujarat have reported that they received this facility for three years and the farmers of other state reported that they got warranty for their system for less than two years It is important that system suppliers should give two years warranty as per the guidelines of the scheme and it is proposed that in order to enforce this clause 5 percent subsidy may be released after the completion of warranty period 4224 Promotional Activities NMMI agencies are promoting the adoption of micro irrigation and its benefits to the growersrsquo awareness through various promotional tools such as publicity through newspapers radios TV and other sources which are summarized in the following table
Table 63 Awareness about Promotional Activities ()
State Total
Beneficiary
Publicity of the MI Scheme in local
language
Awareness of the dedicated website for MI Scheme in
the State
Awareness of the package of
practices being adopted for MI
Yes No Yes No Yes No AP 672 9866 134 9226 774 9940 060 Bihar 516 9128 872 000 10000 9729 271 Chhattisgarh 384 9948 052 9453 547 9844 208 Gujarat 576 7604 2396 7118 2882 8854 1146 Haryana 320 9719 281 6688 3313 9656 344 Karnataka 576 9965 035 2587 7413 9965 035 Maharashtra 672 9628 372 9003 997 9940 060 Odisha 480 9813 188 083 9917 9917 083 Rajasthan 574 9826 174 645 9355 9303 697 Sikkim 50 10000 000 200 9800 9800 200 Tamil Nadu 455 10000 000 9868 132 9956 044 UP 527 8235 1765 2694 7306 9127 873 Uttarakhand 90 9444 556 8000 2000 8444 1556 Total 5892 9411 589 5204 4796 9637 367 Source GAPL Survey
It may be seen from the above table that the farmers of the majority of the states that the implement agencies are promoting NMMI schemes in local language and almost 100 percent results were observed in Tamil Nadu Sikkim Odisha Rajasthan Chhattisgarh Karnataka and Maharashtra It is interesting to note that awareness of the dedicated website for MI scheme was limited
Impact Evaluation Study on ldquoNational Mission on Micro Irrigation (NMMI)rdquo
79
The beneficiaries were further asked whether they are aware of the package and practices being adopted for MI and the response were found to be very positive This reveals that the beneficiaries who have installed micro irrigation in their farm are aware of the package and practices to be followed for taking full advantage of the MI system supported cultivation
43 Observations of Field Staff on MI System In addition to farmersrsquo investigation the field survey team also visited the fields to observe the design and working of the system The field investigators have highlighted their observations regarding the condition of the MI system overall designing of the system installed and general conditions of the field The results regarding the observations of the field staffs are given in the following table below
Table 64 Observations of Surveyors regarding MI System Status at the Time of Field Visit
State
Overall Design
Drip Sprinkle MI System
match crop requirement
General Condition of the System
Flood Irrigation
along with MI System
Design () () System Condition ( `) () Good Satisfactory Bad Yes No Good Average Bad Yes No
AP 5982 4018 0 9777 223 5759 4226 015 6205 3795 Bihar 6298 3702 0 7791 2209 4942 5019 039 7558 2442 Chhattisgarh 7760 2240 0 9792 208 7188 2813 0 9844 156 Gujarat 6892 3038 069 9688 313 6094 3785 122 5278 4722 Haryana 9656 344 0 10000 0 9875 125 0 9781 219 Karnataka 5538 4462 0 9983 017 5417 4583 0 8090 1910 Maharashtra 6637 3363 0 9881 119 5536 4360 104 4970 5030 Odisha 4917 5083 0 9625 375 6500 3479 021 7813 2188 Rajasthan 8833 1167 0 9146 854 7648 2352 0 8153 1847 Sikkim 3600 6400 0 10000 0 6600 3400 0 6600 3400 Tamil Nadu 5582 4418 0 9912 088 4549 5451 0 8044 1956 UP 7381 2581 038 9791 209 5142 4801 057 8861 1139 Uttarakhand 9667 333 0 9222 778 8556 1444 0 9556 444 Total 6767 3223 010 9571 429 6124 3841 036 7463 2537
Source GAPL Survey It may be seen from the above table that in almost all the states under study the overall designing of the system was found to be satisfactory Majority of the field staff observed that system designs met the farmersrsquo requirements however in the state of Bihar only about 78 percent of the MI Systems were designed which could meet the crop requirements Remaining 22 percent of the systems have not been designed perfectly which could meet the water requirements of different crops It has also been observed by
Impact Evaluation Study on ldquoNational Mission on Micro Irrigation (NMMI)rdquo
80
the field investigators that some of the farmers have adopted innovative plant management techniques especially high density plantation in fruit crops and intercropping In almost all the states the sampled beneficiaries also revealed that no technical support guidance on agronomic practices are extended to the users by MI system suppliers as they generally tell the beneficiaries to take the help of extension agencies It was also observed that most of the beneficiary farmers have been using both the techniques of water application that is flood and the micro irrigation 44 Assessment of the System Design
Selection of MI Companies participating in NMMI at State level are based on the following parameters
a Manufacturing capacities of various equipment
b Financial strength of the company
c Dealer network
d Working experience in projects
e Availability of technical manpower
At the time of registration of the manufacturers it is mandatory that the quality of the system should be of BIS standards and the design must meet the requirements of the farmers in terms of its suitability to crops and field situations The conditions for providing after sale service and the warranty of the system are also laid at the time of registration To validate these parameters the beneficiaries were inquired regarding such issues and their responses are summarized in the table 65
The data indicate that the farmers in almost all the states reported that components of MI System met the BIS norms The average figure for all the sample states where system components were as per the BIS norms came out to be around 98 percent There is a need that variations reported in terms of not having BIS components as per NMMI guidelines may be brought to the notice of respective implementing agencies for further necessary action In more than 95 percent cases size of pumps was reported to be as per crop water amp plot size requirements except for the state of Bihar where around 18 percent respondents gave a negative reply
Impact Evaluation Study on ldquoNational Mission on Micro Irrigation (NMMI)rdquo
81
Table 65 Assessment of the System Design ()
State Total
Beneficiary
System components supplied are as per the
BIS
Pump size is proper to the field plot size wrt crop water requirements
MI system meets requirements
Design layout is as per project proposal
After sales service has been provided by the
MI system suppliers
MI systems found to be functional in
the field
Yes No Yes No Yes No Yes No Yes No Yes No AP 672 9970 030 9955 045 9955 045 9970 030 9940 060 9926 074 Bihar 516 9476 524 8217 1783 9845 155 8740 1047 6337 3663 6880 3120 Chhattisgarh 384 9974 026 10000 000 9974 026 10000 000 7396 2604 7552 2448 Gujarat 576 9722 278 9861 139 9635 365 9618 365 9520 480 9427 573 Haryana 320 10000 - 9938 063 9875 125 10000 000 9375 625 9281 719 Karnataka 576 10000 - 10000 000 10000 000 10000 000 10000 000 9549 451 Maharashtra 672 9732 268 9970 030 9985 015 9717 283 7842 2158 9821 179 Odisha 480 9896 104 9958 042 9958 042 9896 104 8646 1354 6667 3333 Rajasthan 574 9599 400 9425 575 9077 923 9408 610 9181 836 8798 1202 Sikkim 50 9600 400 10000 000 10000 000 10000 000 10000 000 9000 1000 Tamil Nadu 455 10000 - 10000 000 10000 000 10000 000 10000 000 9055 945 UP 527 9526 474 9962 038 9829 171 9943 057 9791 209 6603 1499 Uttarakhand 90 9778 222 8778 1222 7222 2778 9222 778 4889 5111 8222 1778
Source GAPL Survey
Impact Evaluation Study on ldquoNational Mission on Micro Irrigation (NMMI)rdquo
82
It was also observed by the field investigators that more than 15 percent reported that the MI system were non-functional in Bihar Chhattisgarh Odisha amp Uttarakhand due to crop season and fear of theft amp damage from rodents It was found that standard designs as regards spacing layout etc have been used in almost all the cases without any variation taking into account the shape size water quality soil conditions etc On an average 98 percent of the farmers reported that MI System installed in their fields meet their requirements however around 28 percent of the farmers in Uttarakhand responded that systems has not been installed as per their requirements Almost 100 percent of the beneficiaries reported that the system design layout is as per project proposal except farmers of Bihar where 10 percent farmers reported that system has not been laid out as per the design in the project proposal In the states of Bihar Chhattisgarh amp Uttarakhand the beneficiaries about 40-50 percent of the beneficiaries reported that they are not being provided after sales service 45 System Suppliers The global micro irrigation systems market is one of the fastest growing segments of agriculture sector The growth of this market is fueled by the government initiatives for adoption of micro irrigation systems in order to conserve water for optimum use The growth of micro irrigation systems is particularly higher in Asia Pacific and Africa due to the increased problems of water scarcity and farmer awareness towards increasing the crop yield with the help of micro irrigation systems India and China are expected to drive growth in the global micro-irrigation systems market which is seen reaching $48 billion by 2018 at a CAGR of 18 per cent from 2012 to 2018 Out of the total 695 million hectares (425 million ha sprinkler and 27 million ha drip) of cultivated area in India only 571 percent of the area is under drip and sprinkler irrigation This represents strong potential for the growth of micro irrigation systems in this region6 This low penetration offers growth opportunities in future All the benefits provided by the micro irrigation systems over flood irrigation coupled with the governmental initiatives to increase the MI system penetration are responsible for the MIS growth in India Also all such drivers are likely to help the market to grow in future as well
6As per Indian Taskforce Report of 2004
Impact Evaluation Study on ldquoNational Mission on Micro Irrigation (NMMI)rdquo
83
After initial scrutiny a committee consisting of experts examines the facilities at manufacturing site for verification of establishment details The list of the registered system suppliers is given below in table
Table 66 State Wise List of Registered MI System Suppliers
SNo State Name Suppliers Name
1 Andhra Pradesh
Ms EPC Industries Ltd (A Mahindra Group of Company) Ms Jain Irrigation Systems Ltd Ms Premier Irrigation Equipment Ltd Ms Rungta Irrigation Ltd Ms Greenfield Irrigation Ltd Ms Sudhakar Plastic Ltd Ms Nagarjuna Palma India Ltd Ms Kumar Enterprises Ms Nandi Plasticisers Ltd Ms Godavari Polymers Pvt Ltd Ms Haritha Irrigation Products Pvt Ltd Ms Netafem Irrigation India Pvt Ltd Ms Megha Agrotech Private Ltd Ms Satya Sai Polymers
2 Bihar
Ms Jain Irrigation Systems Ltd Ms EPC Industries Ltd (A Mahindra Group of Company) Ms Aaram Plastics Pvt Ltd Ms Sai Irrigation Ms Kishan Enterprise Ms Venkatesh Irrigation Ms Premier Irrigation Adritec Pvt Ltd Ms Netafim Irrigation India Pvt Ltd
3 Chhattisgarh Ms Netafim Irrigation India Pvt Ltd Ms Paras Drip Irrigation Ms Jain Irrigation Systems Ltd
4 Gujarat
Ms Dutron Polymers Ltd Ms Harvel Agua India Pvt Ltd Ms Jain Irrigation Systems Ltd Ms Netafim Irrigation India Pvt Ltd Ms Paragon Synthetics amp Polymers Ltd Ms Parixit Industries Limited Ms EPC Industries Ltd (A Mahindra Group of Company) Ms Plastro Plasson Industries (I) Ltd Ms Captain Irrigation System Ms Finolex Plasson Industries Pvt Ltd Ms Kothari Industries Ms Premier Irrigation Adritec Private Ltd Ms Transchem Agritech Ltd
5 Haryana Ms Jain Irrigation Systems Ltd Ms Netafim Irrigation India Pvt Ltd
Impact Evaluation Study on ldquoNational Mission on Micro Irrigation (NMMI)rdquo
84
Ms Balaji Agro-Systems Pvt Ltd Ms Ajay Industrial CorporationLtd Ms Apollo Pipes Ltd Ms Pioneer Plastics Industries Ltd Ms Rungta Irrigation Ltd Ms Nagarjuna fertilizers and chemicals limited Ms Harwel Agro India Limited Ms Finolex Plastic India Ltd Ms Vindhya Pipes amp plastics Ltd Ms Rungta Irrigation Ltd Ms Nirmal Polyfab Pvt Ltd
6 Karnataka
Ms Finolex Plasson Industries Ltd Ms Metro Drip Irrigation (P) Limited Ms EPC Industries Ltd (A Mahindra Group of Company) Ms Megha Agro Tech Pvt Ltd Ms Pioneer Plastic Industries Ltd Ms Jain Irrigation Systems Ltd Ms Agroplast Karnataka
7 Maharashtra
Ms Alphaplast Irrigation System Ms Aquaguard Plastics And Polymers Ms Datta Irrigation Company Ms Donga Watertech Ms Drip India Ms EPC Industries Ltd (A Mahindra Group of Company) Ms Finolex Plasson Industries Ltd Ms Godavari Polymers Ms Greengold Irrigation Ms Jain Irrigation Systems Ltd Ms Jaldhara Drip Irrigation Pvt Ltd Ms Kothari Agritech Pvt Ltd Ms Mohak Agro Industries Ms Nagarjuna fertilizers and chemicals limited Ms Neer Irrigation Ms Netafim Irrigation India Pvt Ltd Ms Nimbus Pipes Ltd Ms Paras Drip Irrigation
8 Odisha
Ms Jain irrigation system Ltd Ms Netafim Irrigation India Pvt Ltd Ms Premier Irrigation Adritec Pvt Ltd Ms Rungta Irrigation Ltd Ms Oasis Irrigation Equipment Co Ltd Ms Nagarjuna Fertilizers amp Chemicals Limited Ms Sujay Irrigation Pvt Ltd Ms Finolex Plasson Industries Pvt Ltd Ms Kirti Industries (India) Ltd Ms Relpol Plastic Products Ltd
9 Rajasthan Ms Netafim Irrigation India Pvt Ltd
Impact Evaluation Study on ldquoNational Mission on Micro Irrigation (NMMI)rdquo
85
Ms Khushboo Polymers Pvt Ltd Ms Shree Irrigation Systems P Ltd Ms Excellent Irrigation P Ltd Ms EPC Industries Ltd (A Mahindra Group of Company) Ms Purma Plast Ltd Ms Jamna Industries Ms Dinesh Irrigation P Ltd Ms Aaram Plastic Pvt Ltd Ms Jain irrigation system Ltd
10 Sikkim Ms Jain Irrigation Systems Ltd Ms Netafim Irrigation India Pvt Ltd
11 Tamil Nadu
Ms Agro Plast Ms AGS Irrigation (P) Ltd Ms Alpha Irritech Pvt Ltd Ms EPC Industries Ltd (A Mahindra Group of Company) Ms Elgi Ultra Industries Ltd Ms Finolex Plasson Industries Ltd Ms Jain Irrigation Systems Ltd Ms Krishi Irrigation Pvt Ltd Ms Mega Agrotech Pvt Ltd Ms Netafim Irrigation India Pvt Ltd Ms Parixit Industries Limited Ms Pragati Irrigation Systems Pvt Ltd Ms Premier Irrigation Adritec Pvt Ltd Ms Rungta Irrigation Ltd Ms Sujay Irrigation Private Limited
12 Uttar Pradesh
Ms Jain irrigation system Ltd Ms Nagarjuna fertilizers and chemicals limited Ms Sterling Irrigation Ltd Ms EPC Industries Ltd (A Mahindra Group of Company) Ms Netafim Irrigation India Pvt Ltd
13 Uttarakhand
Ms Jain Irrigation Systems Ltd Ms Netafim Irrigation India Pvt Ltd Ms Harvel Agua India Pvt Ltd Ms Pioneer Plastics Industries Ltd Ms Premier Irrigation Adritec Private Ltd
The success of the micro irrigation system is solely dependent on the quality of material used and after sale service Therefore the NMMI guidelines have given due consideration to this very component and have made it mandatory to register the system manufacturers and the same is done by State Micro Irrigation Committee (SMIC) Only those manufacturing companies which insure the quality of the product as per BIS and can promptly provide after sale service are registered for three years The registered company need to declare the technical details of the components proposed to be supplied and which would be verified by the technical committee Further frequent surveillance by
Impact Evaluation Study on ldquoNational Mission on Micro Irrigation (NMMI)rdquo
86
inspection team comprising from NCPAH PFDC CIPET Irrigation Association of India is necessary The Manufacturers have to insure the network for providing after sale services in their area of operation They have to further provide operation and maintenance manuals in vernacular language at the time of installation They should also have the facilities to provide technical guidance on agronomic practices system maintenance schedules spare parts warrantee etc Free after sale service shall be provided by manufacture or authorized distributors for at least three years It has been observed almost all the states that the material supplied to the farmersbeneficiaries is of BIS and also gives warranty for three years However during the course of the investigation it was reported by beneficiaries that the after sale service is provided only in the initial phase and simple instructions are given for using the system No technical support guidance on agronomic practices are extended to the users as they generally tell the beneficiaries to take the help of extension agencies The distributors dealers operating in various sampled states reported that they get the subsidy within 15-20 days of applying but sometime they face the delay in release of subsidy due to non-availability of funds under scheme at district state level Further they also reported that due to delay in trial run inspection also leads to delay in release of the subsidy It is suggested that it would be better if subsidy is directly passed on to the beneficiaries to expedite the release disbursement of subsidy under the scheme
Impact Evaluation Study on ldquoNational Mission on Micro Irrigation (NMMI)rdquo
87
5 Impact Evaluation A number of studies have been conducted to assess the impact of micro irrigation particularly that of drip which have shown encouraging results of farm variables It has also helped in bringing crop diversification from rain fed crops to horticulture crops and have also brought cultivable wastelands under high value such as horticulture crops reduction in cost of production higher yield etc The impact of the scheme on various parameters detailed below has been evaluated to arrive at conclusion about achievement of the scheme objectives as well as general benefit to the agricultural economy of the country Some sequences are in following paragraphs
1 Area Expansion under MI and additional area irrigated by installing MI in place of conventional irrigation and waste marginal land development with the same amount of water
2 Savings in labor fertilizers and electricity thereby reducing cost of cultivation 3 Study of productivity enhancement for various crops 4 Whether the adoption of MI has given rise to crop diversification adoption of high
value crops etc 5 Innovative crop management techniques facilitated through adoption of MI which
are canopy management high density plantation inter cropping etc 6 Contribution of MI towards National food security
51 Crop Diversification
Crop diversification in India is generally viewed as a shift from traditionally grown crops to more remunerative crops With the advent of modern agricultural technology especially during the period of the Green Revolution in the late sixties and early seventies there is a continuous surge for diversified agriculture in terms of crops primarily on economic considerations
Crop diversification is intended to give a wider choice in the production of a variety of crops in a given area so as to expand production related activities on various crops and also to minimize risk The survey has measured impact of installation of MI systems on crop diversification The result of the beneficiariesrsquo responses is summarised in the following table
Impact Evaluation Study on ldquoNational Mission on Micro Irrigation (NMMI)rdquo
88
Table 67 Impact on Crop Diversification and Usage of Marginal and Degraded Land by Beneficiaryrsquos data
SNo State Total
cultivable area (Ha)
Horticulture Crop Area (Ha) Field crop Area (Ha) Marginal degraded Land
( Waste Land) (Ha)
Area Before
MI
Area After MI
Change in Area
Area Before
MI
Area After MI
Change in Area
Area Area after MI
Change in area Before
MI 1 AP 149122 39388 88038 12351 68932 59550 -1361 16953 1534 -9095
2 Bihar 140742 37989 54002 4215 95641 86619 -943 202 121 -4000
3 Chhattisgarh 58406 8719 33495 28415 46502 24211 -4794 1016 700 -3108
4 Gujarat 167639 32040 44131 3773 122983 120072 -237 8373 3436 -5897
5 Haryana 135990 19628 64972 23102 133613 71018 -4685 769 000 -10000
6 Karnataka 111046 68571 85818 2515 34908 23447 -3283 2570 1781 -3071
7 Maharashtra 133667 17384 43304 14910 96225 82488 -1428 22659 7875 -6524
8 Odisha 141309 58179 92107 5832 76276 44435 -4174 7657 4767 -3774
9 Rajasthan 162365 65643 102036 5544 83881 52539 -3736 16410 7790 -5253
10 Sikkim 7327 6149 6639 797 1020 587 -4246 101 101 000
11 Tamil Nadu 76488 44887 53142 1839 32862 23306 -2908 299 040 -8649
12 UP 164662 23078 79251 24341 134278 85249 -3651 2942 162 -9450
13 Uttarakhand 32295 9075 9278 223 18707 18727 011 4573 4290 -619 Source GAPL Survey
Impact Evaluation Study on ldquoNational Mission on Micro Irrigation (NMMI)rdquo
89
It may be observed from above table that the farmers of all the states have shown increase in area under horticulture crops after the adoption of the system The highest increase has been observed in Haryana followed by Chhattisgarh UP Maharashtra and AP whereas the lowest in case of Uttarakhand and Sikkim which may be because of the reason that both the states have proportionately higher area under horticulture crops 52 Area Expansion under Micro Irrigation The GoI MI scheme has succeeded in bringing around 3812 lakh ha under micro irrigation with total subsidy amounting to Rs 546801 crores since the launch of the scheme in 2005-06 in India This represents about 257 of the total cultivated area in the country and 569 of the total irrigated area of the country The area expansion under MI system in the country has grown at 36 23 and 18 respectively for last three years (as per official records) Eventually the growth trend is quite impressive yet overall proportion of land under MI is quite low and as such more efforts such as creating awareness among the farmers through electronic and print media exhibition fares PRIs etc need to be initiated to bring the significant area under MI 53 Increase in Irrigated Area due to Water Saving Drip irrigation is being practiced in the different parts of the country since 80s to improve the water use efficiency water savings and productivity enhancement Through the saving of water due to adoption of MI technologies it is possible for beneficiaries to increase the area under cultivation by way of efficient use of water In order to understand that how much additional area has been brought under irrigation the irrigated area before and after installation of MI was taken into consideration (Table 68) In order to have better comprehension of area increased due to MI the percent increase in different schemes was given a graphical shape (Figure 9) After adoption of MI system sampled beneficiaries were able to bring their irrigated area under irrigation from same source of water which otherwise was not being utilized for cultivation due to limited availability of water The Irrigated area within the 5892 sampled beneficiaries of the 13 states before adoption of MI system was found to be 1332086 ha which 1444147 became ha after adoption of MI system It is therefore concluded that total percentage increase in irrigated area with the sampled beneficiaries in 13 states after adoption of MI system was noted to be 841
Impact Evaluation Study on ldquoNational Mission on Micro Irrigation (NMMI)rdquo
90
Table 68 Increase reported by Beneficiaries in Irrigated Area (ha) after Installation of MI System
State Total Irrigated Area before
installation of Micro Irrigation system (ha)
Total Irrigated Area after installation of Micro Irrigation
system (ha)
increase in irrigated Area
AP 101343 113941 1243 Bihar 229656 236802 311 Chhattisgarh 49474 57196 1561 Gujarat 135891 155007 1407 Haryana 123368 136263 1045 Karnataka 103805 106492 259 Maharashtra 102551 125400 2228 Odisha 124189 138310 1137 Rajasthan 100577 107850 723 Sikkim 6040 6081 067 Tamil Nadu 70956 74116 445 Uttar Pradesh 158370 160415 129 Uttarakhand 25862 26275 160 Grand Total 1332086 1444147 841
Source GAPL Survey
Figure 9 Increase in Irrigated Area () among Beneficiaries after Adoption of MI
54 Development of marginal and wasteland by beneficiaries
Degraded land which can be brought under vegetative cover with reasonable effort and which is currently under-utilized and land which is deteriorating for lack of appropriate water and soil management or on account of natural causes The total cultivable waste land in the country at present is about 1283 million hectares Based on the feedback received from the sampled beneficiaries it was observed that during survey in the sampled states beneficiaries sampled farmers were able to convert
Impact Evaluation Study on ldquoNational Mission on Micro Irrigation (NMMI)rdquo
91
their marginal amp rainfed land into cultivable land due to efficient use of water resources available with them In 13 surveyed states 5892 sampled farmers holding 1481058 hectares of land reveals that around 84540 ha of land was not being used for cultivation as they were either waste or degraded land Farmers reported that after adoption of MI system they were able to bring around 51943 ha of land under cultivation The data reveals that adoption of MI system has helped the sampled beneficiaries in bringing around 371 of land under cultivation Maximum and minimum area conversion with the beneficiaries was noted in Andhra Pradesh and Sikkim respectively
Table 69 Marginal Degraded Land brought under Cultivation after Installation of MI System by Beneficiaries
States Total no of
Sampled Beneficiaries
Total area of Sampled
beneficiaries (Ha)
No of sampled farmer with
wastedegraded
Area under wastedegraded
land before NMMI (ha)
Converted area after
adoption of NMMI (ha)
AP 672 149122 242 16953 15419 Bihar 516 140742 2 202 081 Chhattisgarh 384 58406 8 1016 318 Gujarat 576 167639 57 8374 4939 Haryana 320 13599 2 769 769 Karnataka 576 111046 11 2572 789 Maharashtra 672 133667 126 22666 14791 Odisha 480 141309 70 7660 2893 Rajasthan 574 162365 39 16410 8620 Sikkim 50 7327 4 101 000 UP 527 76488 32 2942 2780 Uttarakhand 90 164662 46 4575 284 Tamil Nadu 455 32295 10 300 260 Total 5892 1481058 649 84540 51943
Source GAPL Survey
55 Dripper spacing The dripper spacing is important as it accommodates higher plant population resulting more number of fruits which increases total yield and net returns It is also a factor to commensurate water requirement and root zone of the plant However wide dripper spacing saves more water total irrigation time minimized the diseases and weeds incidence as compared to closer dripper spacing in each years The recommended spacing for different crops under Micro Irrigation system has been presented in the following tables below During the course of field survey the beneficiary farmers were asked to specify the spacing of the crops they are following The responses of the farmers are given in the table 70 amp 71 for different crops in sampled states
Impact Evaluation Study on ldquoNational Mission on Micro Irrigation (NMMI)rdquo
92
Table 70 Spacing followed by Sampled Beneficiaries for Fruit Crops (m)
SNo State Fruits
Banana Lemon Mango Papaya Watermelon Orange Litchi Guava Pomegranate Grapes Coconut Cashewnut Aonla 1 AP 15 15 55 99 1818 66 2 Bihar 1010 55 3 Chhattisgarh 1818 1506 4 Gujarat 1818 1818 5 Haryana 0404 1010 88 6 Karnataka 22 88 22 44 315 7 Maharashtra 1515 1010 33 88 77 8 Odisha 22 66 55 22 7575 77 9 Rajasthan 66 66 5555 66 55
10 Sikkim 1515 55 33 11 Tamil Nadu 22 55 66 66 55 12 UP 1515 66 1010 1010 1010 13 Uttarakhand 88 33
Source GAPL Survey
Impact Evaluation Study on ldquoNational Mission on Micro Irrigation (NMMI)rdquo
93
Table 71 Spacing followed by Sampled Beneficiaries for Vegetables Flowers and Other Crops (m)
SNo State Vegetables Flowers and other important Crops
Brinjal Okra Tomato Potato Cucumber Onion Cabbage Cauliflower Chili Cotton Sugarcane Groundnut Lilli Rose 1 AP 0606 0404 1204 1212 1205 1515 11 2 Bihar 21 055022 1509 3 Chhattisgarh 1503 0502 1503 4 Gujarat 1404 06015 07015 1404 1505 07005 5 Haryana 105 102 0501 0606 103 0505 6 Karnataka 1206 1206 1806 0609 7 Maharashtra 0606 1204 1204 1503 15075 1205 8 Odisha 06045 045045 0603 045030 0603 9 Rajasthan 1030 1020 025025 055055 066066 1030
10 Sikkim 108 66 108 11 Tamil Nadu 0606 06045 1503 1212 24075 12 UP 06075 0604 1204 07503 1509 13 Uttarakhand
Source GAPL Survey
It may be seen that crop spacing is more or less as per recommendations In few cases the spacing is even less It is clearly indicates that farmers adopting MI system also adopt proper practices
Impact Evaluation Study on ldquoNational Mission on Micro Irrigation (NMMI)rdquo
94
56 Reduction in Cost of Irrigation The data cited in table 73 indicate the cost of irrigation incurred by beneficiary farmers before and after installation of MI system It is well evident that Irrigation cost was reduced by 20-50 percent with the use of MI system The states of Gujarat Haryana and Rajasthan have witnessed more than 40 cost reduction The reduction in cost resulted primarily because of savings in the man power and electricity consumption
Table 72 Reduction in Cost of Irrigation with MI system
State Cost of Irrigation before MI ( Rs ha)
Cost of irrigation after MI (Rs ha) decrease in cost
AP 7200 5721 2050 Bihar 8734 6234 2860 Chhattisgarh 5602 3557 3650 Gujarat 11046 5599 4930 Haryana 7346 3749 4900 Karnataka 8215 6182 2470 Maharashtra 11204 7736 3100 Odisha 8895 6541 2650 Rajasthan 7193 3925 4540 Sikkim 3932 2836 2790 Tamil Nadu 6368 4792 2480 UP 6657 4819 2760 Uttarakhand 10693 8203 2330
Source GAPL Survey
57 Electricity Consumption The figures on consumption of electricity before and after installation of MI system by the beneficiary farmers have been tabulated in Table 73 The data clearly indicate that savings of electricity across the sampled states varied from 151 to 494 percent average being 306 percent It is pertinent to mention here that in the states of Bihar and Chhattisgarh almost all the beneficiaries have been using diesel kerosene to operate their pump sets For these two states reduction in consumption of electricity has been computed considering the reduction in use of diesel kerosene The variations in the extent of electricity savings among different states may be attributed to the type of system installed besides depth of water and area brought under MI
Impact Evaluation Study on ldquoNational Mission on Micro Irrigation (NMMI)rdquo
95
Table 73 Reduction in Electricity Consumption
State Electricity used
before MI( hrday) Electricity used
after MI( hrday) saving of electricity
AP 679 528 2233 Bihar 5000 3000 4000 Chhattisgarh 4500 2800 3778 Gujarat 678 407 3992 Haryana 835 423 4939 Karnataka 590 432 2675 Maharashtra 703 468 3348 Odisha 798 619 2246 Rajasthan 864 501 4208 Sikkim 262 170 3511 Tamil Nadu 578 491 1510 UP 225 184 1843 Uttarakhand 301 211 2989 Total 537 373 3065
Source GAPL Survey Diesel Kerosene consumed (ltrs day) for Bihar and Chhattisgarh
58 Economy in Fertilizer Use The information on use of fertilizers before and after installation of MI system was sought from the beneficiary farmers the obtained data have been enumerated in Table 74 In order to comprehend the information on fertilizers saving across the 13 states the data on fertilizer saving was given a graphical presentation (Figure 10) It is well evident that MI system resulted in significant savings of fertilizers The extent of fertilizer saving in the states under study varied from 759 to 4383 percent with an average savings of about 28 percent The obtained results are in-conformity with the various research findings wherein fertilizer savings through drip fertigation have been reported in the range of 30-35 percent (Raina et al 2013)The exceptionally low fertilizer savings observed in Bihar are attributed to the fact that more than 90 percent area in Bihar is under sprinkler irrigation
Impact Evaluation Study on ldquoNational Mission on Micro Irrigation (NMMI)rdquo
96
Table 74 Reduction in Fertilizer Consumption
States Fertilizer Consumption(
Kgha) Before MI
Fertilizer Consumption( Kgha)
after MI
saving of Fertilizer
AP 24152 17185 2885 Bihar 18198 16816 759 Chhattisgarh 28872 17219 4036 Gujarat 15893 9103 4273 Haryana 20297 12682 3752 Karnataka 21549 15471 2821 Maharashtra 31005 23887 2296 Odisha 27240 21547 2090 Rajasthan 29523 16582 4383 Sikkim 15860 9380 4086 Tamil Nadu 21147 15421 2708 UP 24220 18704 2277 Uttarakhand 10620 8712 1796 Total 23526 16826 2848
Source GAPL Survey
Figure 10 Reduction in Fertilizer Consumption ()
59 Increase in Crop Productivity
Micro irrigation has generated benefits to the farmers in terms of enhancement of the productivity The average productivity Fruit crops have increased about 423 percent (Table 75) with maximum enhancement in the state of Gujarat followed by Rajasthan which was followed by Chhattisgarh In fact the productivity enhancement in these states was comparable
Impact Evaluation Study on ldquoNational Mission on Micro Irrigation (NMMI)rdquo
97
Table 75 Productivity Enhancement of Fruit Crops (MTha)
State Before MI After MI increase AP 732 874 1937 Bihar 273 315 1518 Chhattisgarh 012 020 6200 Gujarat 515 893 7348 Haryana 586 810 3825 Karnataka 4532 5810 2820 Maharashtra 2166 3232 4918 Odisha 2741 3699 3497 Rajasthan 538 917 7056 Sikkim 543 580 682 Tamil Nadu 2473 2902 1736 UP 710 953 3414 Uttarakhand 585 775 3242 Total 1352 1925 4234
Source GAPL Survey The average productivity of the vegetables has increased by 528 after using the MI irrigation system (Table 76) The states of Chhattisgarh Gujarat and Sikkim registered tremendous increase in vegetable productivity after using micro irrigation system
Table 76 Productivity Enhancement of Vegetable Crops (MTha)
State Before MI After MI increase
AP 991 1329 3409 Bihar 1122 1476 3162 Chhattisgarh 2779 5526 9885 Gujarat 709 1196 6859 Haryana 2066 2523 2213 Karnataka 1109 1430 2900 Maharashtra 348 448 2876 Odisha 1088 1395 2819 Rajasthan 607 846 3942 Sikkim 1894 3157 6662 Tamil Nadu 1137 1437 2640 UP 825 1079 3071 Uttarakhand 317 475 4965 Total 1140 1741 5276
Source GAPL Survey
The data on crop wise productivity enhancement in different states has also been enumerated and explained in the next section
Impact Evaluation Study on ldquoNational Mission on Micro Irrigation (NMMI)rdquo
98
510 Reduction in these Cost of Inputs of Irrigation amp Productivity Enhancement Crop-wise
MI technology is introduced mainly to increase the water use efficiency in agriculture and also provides many other socio-economic benefits in the society The use of MI has led to significant reduction cost of irrigation electricity saving fertilizer saving amp productivity enhancement As per the data collected from the sample beneficiaries significant increase has been observed in terms of reduction in different costs for different crops and enhancing the productivity The same trend is observed in fruits vegetables flowers and other non-horticulture crops The detailed state and crop wise impact percentages of the reduction in irrigation cost electricity savings fertilizer saving and increase in productivity of the sampled beneficiaries are as follows
Table 77 Crop wise Details of Reduction in Cost - Fruits
State Fruit Reduction in Irrigation Cost ( )
Electricity saved ( )
Fertilizer saved ( )
Productivity enhancement ( )
AP
Banana 2987 3660 2833 2089 Guava 1087 2830 2651 3521 Lemon 2839 3339 2676 1708 Mango 2338 3301 3157 3051 Orange 3160 3571 3233 3478
Bihar
Guava 2308 1827 2000 1250 Kadam 1228 2250 1385 1563 Mango 1731 1450 1167 1211 Litchi 2857 1180 1429 1077
Chhattisgarh Banana 2500 2460 1667 5000 Papaya 3889 2850 3333 8750
Gujarat
Banana 4490 4712 3954 4344 Papaya 4692 4000 4565 6235 Pomegranate 4565 2895 4407 4000 Watermelon 5682 5750 4068 5000
Haryana Kinnow 4847 4005 3945 2500 Strawberry 4196 3837 4110 2000 Watermelon 3421 4565 4150 5000
Karnataka
Banana 2769 2030 2743 3380 Mango 2576 3472 2636 2673 Papaya 2836 3622 2907 2441 Pomegranate 2250 2363 3038 3520 Fig 1250 3333 2222 2500 Areca nut 2918 3276 3085 2205
Maharashtra
Banana 3070 3069 3122 5215 Cashew nut 3117 1940 4247 4000 Grapes 3016 2069 2047 7143 Mango 3553 2815 2895 1672 Mousami 4375 2000 2000 8750 Orange 4689 3059 2766 3000 Sweet Orange 3553 3137 2198 3627 Areca nut 1833 3500 5000 3333
Impact Evaluation Study on ldquoNational Mission on Micro Irrigation (NMMI)rdquo
99
Odisha
Aonla 3529 3889 2500 3333 Banana 3577 3391 3124 2447 Cashew nut 2713 3131 3120 3062 Guava 3481 3692 3216 4430 Mango 3576 3551 3027 3039 Papaya 2806 2903 3532 1768 Chikoo 667 2500 4000 1111
Rajasthan
Bel 5714 5000 5714 1550 Guava 1965 4746 4077 5000 Kinnow 5869 4982 4904 4648 Lemon 3052 4519 3560 4118 Mango 3053 4839 3282 6000 Orange 2565 4187 3535 4229
Sikkim Banana 3750 4000 3000 000 Orange 3933 2766 4087 4000 Litchi 5000 2000 4000 000
Tamil Nadu
Aonla 2313 3298 2817 4032 Banana 3684 3495 2607 2990 Cashew nut 3579 3333 2222 3333 Coconut 2882 3511 2714 3333 Mango 2410 3418 2926 2697 Tapioca 3258 3422 2429 3327
UP
Banana 2961 6000 2746 4792 Guava 2555 3636 2350 2147 Mango 2463 3957 2415 3373 Litchi 2753 4167 2717 3393
Uttarakhand
Guava 2167 NA 1638 NA Mango 2281 3636 1633 NA Peach 2293 NA 2855 NA Litchi 2892 3333 2044 NA
Source GAPL Survey
It may be seen from the above table that among the fruit crops highest reduction in irrigation cost was observed in Kinnow crop in Rajasthan amp lowest in guava in AP whereas maximum saving in electricity was observed in Haryana and saving in fertilizer in a Bel in Rajasthan and further highest increase in productivity is witnessed in Papaya in Chhattisgarh
Table 78 Crop wise Details of Reduction in Cost - Vegetables
State Vegetables Name
Reduction in Irrigation Cost ( )
Electricity Saved ( )
Fertilizer saved ( )
Productivity enhancement ( )
AP
Brinjal 2470 3450 2932 1950 Chilli 2104 3213 2662 2580 Okra 1545 3079 3337 2654 Tomato 2100 3458 3280 2837
Bihar
Brinjal 1931 2780 1073 1522 Cauliflower 1850 3244 1415 760 Okra 2188 2250 1283 1671 Potato 2282 4655 1006 1105
Chhattisgarh Cauliflower 3438 3480 4065 7377 Tomato 4420 4750 4580 11454
Impact Evaluation Study on ldquoNational Mission on Micro Irrigation (NMMI)rdquo
100
Bitter Gourd 4934 3690 4746 11081 Okra 4365 4250 4484 8642
Gujarat
Chilli 4532 4341 4393 4708 Fennel 3000 5000 5625 2000 Onion 4983 4792 4094 2435 Potato 4523 4547 3602 3504 Tomato 5102 4620 4245 7962
Haryana
Chilli 4364 4470 3264 5000 Cucumber 5494 6081 3989 4122 Potato 4406 5809 3321 1651 Tomato 4833 5161 3556 5632
Karnataka Chilli 3088 3021 2839 3187 Ginger 2941 3651 2906 2450 Tomato 2275 3218 2971 1870
Maharashtra Brinjal 3041 3870 2604 2195 Chilli 2702 3268 3672 3310 Tomato 2763 3641 2940 3184
Odisha
Bitter Gourd 3629 3660 3024 2826 Bottle Gourd 4040 3435 2700 2916 Brinjal 2979 3164 3084 2804 Cauliflower 3141 3291 2980 2542 Okra 3399 3302 2982 3216 Tomato 2978 3179 3225 3534
Rajasthan
Brinjal 6452 2500 5429 NA Carrot 5718 2965 4789 2097 Onion 3713 3840 3992 3117 Tomato 2950 4526 3520 4619
Sikkim Brinjal 2200 4118 3818 6949 Cauliflower 4500 2000 4250 769 Tomato 3542 3729 4161 6889
Tamil Nadu Brinjal 2930 3264 2973 3407 Chilli 3049 3633 2902 2551 Tomato 2545 3495 3167 2176
UP
Brinjal 2336 4032 2153 2481 Chilli 2473 5000 2052 3130 Peas 2155 3752 3005 3254 Potato 2897 4412 2591 2802 Tomato 2521 3721 2420 2822
Uttarakhand Peas 2572 NA 1672 NA Tomato NA 3333 2018 NA
Source GAPL Survey It may be seen from the above table that among the vegetable crops highest reduction in irrigation cost was observed in brinjal in Rajasthan amp lowest in lady finger in AP whereas maximum saving in electricity was observed in Haryana for cucumber amp potato and saving in fertilizer for fennel in Gujarat and further highest increase in productivity is witnessed in Chhattisgarh for tomato
Impact Evaluation Study on ldquoNational Mission on Micro Irrigation (NMMI)rdquo
101
Table 79 Crop wise Details of Reduction in Cost - Flowers
State Crop Reduction in
Irrigation Cost ( )
Electricity saved( )
Fertilizer saved ( )
Productivity enhancement
( ) AP Lilli 3333 3750 4182 4560 Bihar Marigold 4643 3100 3333 5000
Gujarat Jasmine 5000 6250 3333 3333 Marigold 2000 7500 5556 4200
Haryana Gerbera 6725 8636 3250 3670 Rose 4316 5938 5676 4690
Maharashtra Marigold 3448 3571 2761 4250 Rose 1045 2143 4375 4690
Odisha Rajanigandha 4667 5000 3000 2400 Rajasthan Rose 3611 5000 2970 2500 UP Marigold 2000 3400 2000 2750 Source GAPL Survey It may be seen from the above table that among the flowers highest reduction in irrigation cost amp electricity saving was observed in Gerbera in Haryana whereas saving in fertilizer for rose in Haryana and highest increase in productivity was witnessed in Bihar for marigold
Table 80 Crop wise Details of Reduction in Cost - Non-horticulture Crops
State Non Horticulture Crops
Reduction in Irrigation Cost
( )
Electricity saved( )
Fertilizer saved ( )
Productivity enhancement
( )
AP
Cotton 2820 3524 2354 1770 Ground nut 2924 3828 2136 2274 Maize 1579 3067 3096 2199 Sugarcane 2285 3325 3130 1853
Bihar Maize 1874 1575 1126 1484 Sugarcane 2096 2250 1553 050 Wheat 1721 1860 998 852
Chhattisgarh Gram 2799 1450 2830 2050 Soybean 3978 1635 4356 1805 Wheat 2313 2145 2017 4443
Gujarat
Caster 4617 5172 3757 3580 Cotton 4540 4659 4396 3719 Ground nut 4871 4684 4027 3496 Sugarcane 4875 4865 4216 21611 Wheat 4082 4015 3681 3025
Haryana Cotton 4435 4439 3093 101 Mustard 4167 4286 3611 000 Wheat 4935 4497 3858 212
Karnataka Sugarcane 2771 2568 2723 1264
Maharashtra
Cotton 3370 2928 2991 3475 Ground nut 3355 3333 3312 2587 Soybean 3528 2280 3085 4080 Sugarcane 3712 3815 2848 3877
Odisha Moong 2178 2869 3589 3689 Sugarcane 2624 3309 3201 4849
Rajasthan Arandi 3684 4000 3916 4313
Impact Evaluation Study on ldquoNational Mission on Micro Irrigation (NMMI)rdquo
102
Cotton 5118 3750 4708 2765 Guwar 5605 4375 5250 4889 Mustard 3283 4373 4313 3433 Wheat 3025 3666 3923 3631
Sikkim Mustard 4286 2000 3600 000 Wheat 3333 2759 3600 556
Tamil Nadu Sugarcane 2879 3427 2873 990
UP Maize 2732 4662 2334 470 Sugarcane 2316 2200 3050 2877 Wheat 2538 3776 2484 4116
Uttarakhand Sugarcane 2562 2385 2088 2950 Source GAPL Survey It may be seen from the table 77 that among the non-horticulture crops also reduction in irrigation cost saving in electricity saving in fertilizer and increase in productivity was witnessed From the above it may be concluded that with the adoption of micro irrigation technologies significant increase has been observed in productivity enhancement in all the states for all the major crops being cultivated under the scheme Further reduction in input factors such as irrigation cost saving in electricity amp saving in fertilizer was also observed 511 Introduction of New Crops During the course of the study and field survey it was observed that the beneficiaries have switched to new crops mostly high value as enlisted in table 82 below with the adoption of micro irrigation technology In the fruit crops high density plantations having drip irrigation system have been adopted by some of the farmers
Table 81 Crops Adopted after Installation of MI System
Fruits Aonla Areca nut Banana Cashew nut Sapota Coconut Grapes Guava Litchi Mango Mosambi Orange Papaya Pineapple Pomegranate Strawberry Sweet orange watermelon
Vegetables Broccoli Bitter gourd Bottle gourd Brinjal Cabbage Capsicum Cauliflower Cucumber Chilli Ginger Okra Onion Spinach Papaya Potato Radish Tomato
Floricultural Marigold Tuberose (Rajnigandha) Rose Lilly
Other crop Cotton Groundnut Sunflower Turmeric Arhar Black gram Maize Moong Mustard Pulses Soyabean Sugarcane Urad Wheat
Impact Evaluation Study on ldquoNational Mission on Micro Irrigation (NMMI)rdquo
103
Table 82 Extent of Adoption of New Crops after Installation of MI System
State Total
Beneficiary No of Farmers
Introduced New Crops Farmers
Introduced New Crop () AP 672 278 4137 Bihar 516 8 155 Chhattisgarh 384 206 5365 Gujarat 576 67 1163 Haryana 320 315 9844 Karnataka 576 154 2674 Maharashtra 672 126 1875 Odisha 480 221 4604 Rajasthan 574 3 052 Sikkim 50 26 5200 Tamil Nadu 455 53 1165 UP 527 330 6262 Uttarakhand 90 2 222 Total 5892 1789 3036
Figure 11 Extent of Adoption of New Crops by Beneficiaries ()
It may be seen from the above table that almost all the beneficiaries of Haryana have shifted towards new crops with the adoption MI system followed by UP Sikkim Chhattisgarh Odisha and AP The lowest response was observed in Rajasthan Bihar and Uttarakhand which is due to the fact that MI systems in majority of the cases have been installed to irrigate horticultural crops
It is therefore recommended that special drives be taken to motivate the farmers in the state of Bihar Uttarakhand amp Rajasthan for crop diversification to accrue the full advantage of MI system
Impact Evaluation Study on ldquoNational Mission on Micro Irrigation (NMMI)rdquo
104
512 Increase in Farmerrsquos Income
The overall benefits accrued from the micro irrigation system are reflected in the income enhancement of the farmers All the surveyed states reported increase in farmerrsquos income by 20- 68 with an average increase of 485 The maximum increase in income has been reported in Gujarat followed by Chhattisgarh
Table 83 Increase in Farmerrsquos Income
State Income ( Rs ha)
before MI Income ( Rs ha)
after MI
Increase
in Income AP 60273 79929 3261 Bihar 31132 41333 3277 Chhattisgarh 62785 105059 6733 Gujarat 55703 93593 6802 Haryana 73917 117532 5901 Karnataka 82303 105061 2765 Maharashtra 68459 99786 4576 Odisha 61846 85660 3850 Rajasthan 125753 191731 5247 Sikkim 81510 111891 3727 Tamil Nadu 74100 98800 3333 UP 58495 87391 4940 Uttarakhand 140098 168234 2008 Total 976374 1386001 4195
Source GAPL Survey
Figure 12 Increase in the Income of Beneficiaries ()
Impact Evaluation Study on ldquoNational Mission on Micro Irrigation (NMMI)rdquo
105
513 Benefit-Cost Ratio The BC ratio has been based on the estimates of incremental return income from MI system that is taken into account the increase in individual farmerrsquos income and MI system cost and crop wise average increase in income and average MI cost for each state were worked out from the same MI system cost has been amortized equally for 10 years considering the economic life of the system for the same period The income enhancement of the beneficiary farmers after installation of the MI system has been attributed to MI system The Benefit-cost analysis was carried out for important crops in all the 13 states under study on the basis of data collected from sampled beneficiaries This ratio gives the estimates of returns on the investment made in MI system Performance in term of BC ratio varies from state to state even for the same crop due to varied reasons like agro-climatic conditions agronomic practices soil productivity system cost marketing of produce etc the BC ratio of installing micro irrigation system is above one across the states and across the crops which signifies the importance of MI system in net income enhancement of the farmers The state wise BC ratio of installing MI system for different crops is given in the table for important fruits vegetables amp flowers grown in the states under study
Impact Evaluation Study on ldquoNational Mission on Micro Irrigation (NMMI)rdquo
106
Table 84 Benefit Cost Ratio of MI System for Important Fruit Crops
Fruits AP Bihar Chhattisgarh Gujarat Haryana Karnataka Maharashtra Odisha Rajasthan Sikkim Tamil Nadu UP Uttarakhand Aonla - - - - - - - - 269 - 294 234 - Areca nut - - - - - 259 221 - - - - - - Banana 266 - 266 187 - 277 291 182 - 272 290 276 - Bel - - - - - - - - 209 - - - - Blackberry - 171 - - - - - - - - - - - Carrot - - - - - - - - - - 291 - - Cashew nut - - - - - - 270 259 - - 264 - - Coconut 226 - - - - 263 244 272 - - 251 - - Cucumber - - - - 206 131 - - - - - - - Custard Apple - - - - - 219 - - - - - - - Fig - - - - - 266 - - - - - - - Grapes - - - - - 258 293 - - - - - - Guava 242 297 - 269 212 204 294 256 229 294 - 286 276 Kadam - 121 - - - - - - - - - - - Kinnow - - - - 284 - - - 231 - - - - Lemon 267 - - 280 - 288 148 298 231 - 209 236 - Litchi - 111 - - - - - 252 - 267 - 272 227 Mango 284 226 - 292 - 257 265 245 273 - 275 295 287 Musk Melon - - - - 227 - - - - - - - - Oil Palm 229 - - - - - - 278 - - - - - Orange 240 - - - - - 215 - 287 280 - - - Papaya 133 125 242 - - 279 234 268 - - 230 274 - Peach - - - - - - - - - - - - 219 Pineapple - - - - - - 241 298 - - - - - Pomegranate 234 - - 242 - 209 266 231 297 - - - - Sapota - - - - - 294 - 299 - - 245 - - Strawberry - - - - 119 - - - - - - 297 - Tapioca - - - - - - - - - - 223 - - Water Melon - - 257 211 221 288 267 298 - - - - - Source GAPL Survey
Impact Evaluation Study on ldquoNational Mission on Micro Irrigation (NMMI)rdquo
107
Table 85 Benefit Cost Ratio of MI System for Important Vegetable Crops
Vegetable AP Bihar Chhattisgarh Gujarat Haryana Karnataka Maharashtra Odisha Rajasthan Sikkim Tamil Nadu UP Uttarakhand Alovera 145 - - - - - - - - - - - Arabi - - - - - - 178 - - - - - Bitter Gourd 200 268 214 295 - - 239 - - 286 258 - Boda 112 251 - - - - - - - - - - Bottle Gourd 124 190 234 239 - - 267 133 - - 257 - Brinjal 215 218 144 145 185 215 298 238 230 257 166 257 - Broccoli - - 017 - - - - - - - - - Cabbage - 274 217 - - 250 218 - 167 275 222 - Capsicum 262 262 - 274 - - 161 - - - 229 - Carrot - - - 206 - - - 251 - - - - Cauliflower 117 - - 288 268 - 256 229 229 285 274 - Chilli 156 172 210 265 258 233 273 228 179 259 181 282 - Cucumber - 162 - 132 198 - 149 222 - - - - Fennel - - 281 - - - - - - - - - Garlic - - - 069 - - - 246 - - - - Ginger 220 - - - - 236 - 226 - - - - - Kundru - 125 - - - - - - - - - - Okra 170 219 238 189 174 281 271 287 - 225 232 279 - Lemon - - - - - - 224 - - - - - Methi - - - 190 - - - - - - - - Onion - 236 176 210 - 270 293 239 - 251 193 - Palak - - - - - - - - - - 183 - Pointed Gourd - - 182 - - - - - - - - - Peas - - - 197 - 236 298 - - - 235 269 Potato 182 248 260 226 270 233 - 261 282 - 158 286 - Pumpkin 135 146 013 - - - - 182 - 159 - - Radish - - - - - - - - - - 238 - Cluster Bean - 174 - - - - - - - - - - Round Guard - - - 254 - - - - - - - - Tomato 252 265 242 200 230 208 294 214 294 238 232 278 Sponge Guard - 137 - - - - - 274 - - - - Turmeric 179 - - - - - - - - - - - SourceGAPLSurvey
Impact Evaluation Study on ldquoNational Mission on Micro Irrigation (NMMI)rdquo
108
Table 86 Benefit Cost Ratio of MI System for Important Floriculture Crops
State Flower Name BC Ratio AP Lilli 121 Bihar Marigold 218
Gujarat Jasmine 272 Marigold 167
Haryana Gerbera 292 Rose 141
Karnataka Marigold 225 Rose 160
Odisha Rajnigandha 255 Rajasthan Rose 294 UP Marigold 276 Uttarakhand Gladiolus 272
Performance in terms of BC ratio varies from state to state and crop to crop Thus it may be concluded that these analysis confirm that the farmers are getting higher income with the adoption of MI technology 514 Increase in Area The irrigated area has increased in all the surveyed states after the introduction of NMMI Scheme Irrigated area has been increased by 841 for total surveyed farmers in the given states The state of Maharashtra has topped the list with 2228 growth in irrigated area followed by Chhattisgarh There has been very little growth in case of Sikkim UP Uttarakhand amp Karnataka
Table 87 Percent Increase in Irrigated Area on Installation of MI System
State Irrigated Area (Ha) Percent
Increase in Irrigated
Area Before MI After MI
AP 101302 113895 1243 Bihar 129482 140935 885 Chhattisgarh 49454 57172 1561 Gujarat 135837 154944 1407 Haryana 123318 136208 1045 Karnataka 103763 106449 259 Maharashtra 102510 125349 2228 Odisha 124139 138254 1137 Rajasthan 100536 107806 723 Sikkim 6038 6079 067 Tamil Nadu 70928 74086 445 UP 158306 160350 129 Uttarakhand 25852 26265 160
Impact Evaluation Study on ldquoNational Mission on Micro Irrigation (NMMI)rdquo
109
515 Potential area that can be brought under Micro Irrigation The potential for Micro Irrigation for each surveyed district has been worked out on the basis of field survey and secondary information
The following information has been taken account to work out MI potential from Secondary sources
A Total Irrigated area B Paddy area C Area under MI
Total Potential area has been worked out by subtracting the area under MI and Paddy from total irrigated area of the district considering that paddy area has no potential for the MI system This potential area has been depicted as percentage of total irrigated area The district wise potential for MI as well as the crop potential is given in the table below
Table 88 District wise Potential for Installation of MI System in Study Area
State District
Area Based on Secondary Data Potential Crops Under MI
Irrigated Area
(ldquo000 ha)
Area under MI (ldquo000 ha)
MI Potential
Area (ldquo000 ha)
MI Potential Area ()
Fruits Vegetables Other Crops
AP
Adilabad 10152 2544 7608 7494
Mango Citrus and Banana
Brinjal Chilli Tomato and Okra
Maize Sugarcane Cotton and Ground Nut
Anantpur 24721 12773 11948 4833 Krishna 18067 1572 16495 9130 Medak 9955 4946 5009 5031 Nalgonda 27570 7180 20390 7396 Nellore 8464 2158 6306 7450 Vishakhapatnam 22077 825 21252 9627
Bihar
Gaya 4979 253 4726 9492 Mango Kadam and Litchi
Okra Potato Cauliflower and Brinjal
Sugarcane Wheat and Maize
Madhepura 48788 095 48693 9980 Rohtas 8601 339 8262 9605 W Champaran 6238 542 5696 9131
Chhattisgarh
Durg 7750 2768 4982 6428 Banana Papaya and Watermelon
Cauliflower Tomato Bitter Gourd and Okra
Wheat Gram and Soybean
Jashpur 1109 068 1041 9387 Kanker 1377 1222 155 1130
Sarguja 1194 303 891 7462
Gujarat
Anand 10410 238 10172 9771 Banana Papaya Pomegranate and Watermelon
Chilli Tomato Onion Potato and Fennel
Cotton Sugarcane Wheat Groundnut and Caster
Banaskantha 39630 8150 31480 7943 Bharuch 9264 1073 8191 8842 Bhavnagar 16880 2788 14093 8349 Jamnagar 8330 1728 6602 7926 Mehsana 19698 624 19074 9683
Haryana
Bhiwani 24937 2429 22508 9026 Kinnow Lemon Watermelon and Muskmelon
Tomato Cucumber and Potato
Cotton and Wheat
Fatehabad 11443 110 11333 9904 Karnal 12960 086 12874 9934
Sirsa 14587 631 13956 9567
Karnataka Belgaum 45594 4394 41200 9036 Banana Areca Tomato Pepper and
Impact Evaluation Study on ldquoNational Mission on Micro Irrigation (NMMI)rdquo
110
Bellary 7348 397 6951 9459 nut Pomegranate Mango and Papaya
Chilli and Ginger
Turmeric Bidar 5873 2322 3551 6046 Chitradurga 2243 2963 1520 6788 Hassan 8661 1175 7486 8643 Mysore 13194 1376 11818 8957
Maharashtra
Ahemadnagar 26000 3049 22951 8827
Banana Mango Citrus and Grapes
Tomato Chilli and Brinjal
Cotton Sugarcane and Soybean
Jalgaon 23909 7611 16298 6817 Jalna 7850 2660 5180 6611 Kolhapur 27500 453 27047 9835 Ratnagiri 1500 111 1389 9262 Wardha 1630 1630 810 4971
Odisha
Bhadrak 2775 104 2671 9625 Mango Banana Cashew nut and Papaya
Tomato Brinjal Okra Bottle gourd and Cauliflower
Moong and Sugarcane
Ganjam 3600 299 3301 9168 Mayurbhanj 4105 553 3552 8654 Nayagarh 2966 164 2802 9447 Boudh NA 201 NA NA
Rajasthan
Hanumangarh 31071 1505 29566 9516 Orange Kinnow Mango Bel Guava and Lemon
Onion Carrot and Tomato
Cotton Arandi Guar Mustard and Wheat
Jalore 29081 11897 17184 5909 Jhalawar 23349 1569 21780 9328 Jodhpur 31000 5712 25288 8157 S Madhopur 19448 676 18772 9652 Udaipur 7139 580 6559 9187
Sikkim
East Gangtok 697 NA
NA NA Orange and Guava
Tomato Brinjal Cauliflower and Barackoli
Wheat Mustard and Turmeric Mangaon 135
NA NA NA
Tamil Nadu
Erode 13195 1090 12105 9174 Banana Tapioca Coconut Aonla and Carrot
Chili Brinjal Tomato Potato Carrot and Turmeric
Sunflower
Nilgiri 650 213 437 6729 Thiruvarur 6036 094 5942 9844 Tirunelveli 6429 299 6130 9534
Villupuram 14167 550 13617 9611
UP
Aligarh 16441 005 16436 9997
Banana Mango and Guava
Tomato Potato Chilli Peas Brinjal and Arbi
Maize and Wheat
Ballia 11578 025 11553 9979 Jhansi 17920 099 17821 9944 Kannauj 13016 019 12997 9985 Saharanpur 21567 078 21489 9964 Siddharth Nagar 10212 038 10174 9963
Uttarakhand
Udhamsingh Nagar 15330 NA - - Mango Peach Litchi and Guava
Peas and Tomato Haridwar 6088 NA - -
Nainital 3780 NA - -
Source Data Portal India and GAPL Field Survey Analysis
516 Employment Opportunities
The NMMI has helped to widen the food basket of the country with significant contributions coming from the bringing more area under irrigation and with judicious use of water New farm practices and innovations with support of government have encouraged the farmers to shift toward high value a crop which in turn gives better income and more employment opportunities
Impact Evaluation Study on ldquoNational Mission on Micro Irrigation (NMMI)rdquo
111
5161 On Farm Employment Generation Following are the sectors of on farm employment opportunities for farmers and related stakeholders being generated through implementation of NMMI
Higher production requires more man days for operations like harvesting on farm handling and logistics
Soil water quality and inputs testing laboratory service center Plant protection service center (Pest surveillance diagnostic and control services
including Integrated Pest Management) Maintenance repairs and custom hiring of agricultural implements and machinery
including micro irrigation systems (sprinkler and drip) Agri Service Centre includes at least the above three activities (Group Activity)
5162 Off-Farm Employment Generation
With the initiation of National Mission on Micro Irrigation (NMMI) not only the farm employment has increased but it has generated lot of off-farm opportunities which would further give more employment in the future This initiative also aims at farm mechanization which not only includes tractors and its implements but also use of other components such as pumps micro irrigation etc An attempt has been made in this section to estimate the additional employment generated from various initiatives available under mission Apart from this indirect labors for the logistic service are also generated to accomplish the above mentioned activities Each of the suppliers has 5-7 skilled and semi-skilled employees to support in installation of the system training after sales service etc Services of casual labor are also hired during the time of installing the system which results in indirect opportunities 517 Impact on Employment The implementation of NMMI scheme in the different states generated employment opportunities mainly due to increase in production which requires more of the man days as well as post handling operations micro irrigation resulted in considerable savings of labor as is evident from the data cited in table 93 This is true for pre-harvest practices The increased yield due to MI systems called for involvement of more labor for handling the harvesting and post-harvest operations
The basis for computing the manpower involved before and after installation of MI system related primarily to application of irrigations hoeing weeding fertilizer insecticide pesticide applications harvesting threshing assembling cleaning grading packaging transportation logistics etc It may be seen from the above table that in all the states under study have shown decrease in utilization of the labor in pre-harvest practices that is labor saving on irrigation weeding fertilization and other operations It shows that the use of
Impact Evaluation Study on ldquoNational Mission on Micro Irrigation (NMMI)rdquo
112
human labor after the use of micro irrigation has decrease significantly and ranges between 741 to 1875 percent
The employment generations through adoption of micro irrigation in the farms by the farmers before the adoption of the MI and after the installation and results have been presented in the following table below
Table 89 Change in Manpower Requirement for Cultivation (per ha per crop cycle)
State Pre harvest practices Harvesting Post-harvest handling Total Man dayscrops No of man days
before NMMI
No of man days after
NMMI
Change in man Power
()
No of man days
before NMMI
No of man days after
NMMI
Change in man Power
()
No of man days
before NMMI
No of man days after
NMMI
Change in man Power
()
No of man days
before NMMI
No of man days after
NMMI
Change in man Power
() AP 49 41 -1633 36 42 1667 16 19 1875 101 102 099 Bihar 52 45 -1346 29 35 2069 13 16 2308 94 96 213 Chhattisgarh 59 50 -1525 31 36 1613 20 24 2000 110 110 000 Gujarat 48 39 -1875 35 41 1714 20 24 2000 103 104 097 Haryana 40 35 -1250 30 35 1667 16 21 3125 86 91 581 Karnataka 48 42 -1250 34 40 1765 19 23 2105 101 105 396 Maharashtra 58 52 -1034 33 39 1818 23 29 2609 114 120 526 Odisha 46 41 -1087 32 37 1563 18 19 556 96 97 104 Rajasthan 58 53 -862 25 33 3200 18 20 1111 101 106 495 Sikkim 54 50 -741 29 33 1379 19 24 2632 102 107 490 Tamil Nadu 50 44 -1200 27 32 1852 21 23 952 98 99 102 UP 55 46 -1636 25 32 2800 20 24 2000 100 102 200 Uttarakhand 47 41 -1277 29 36 2414 23 29 2609 99 106 707
The table further reveals that in post-harvest operations right from harvesting to handling and disposal of the produce there is an increase in labor utilization and it ranges between 2119 to 5023 percent From here it may be concluded that the decrease in utilization of the labor in the pre harvest activities are offset by the increase in the production which requires more of the labor for harvesting assembling and grading handling transportation and disposal of the produce
Impact Evaluation Study on ldquoNational Mission on Micro Irrigation (NMMI)rdquo
113
6 Conclusions amp Recommendations Micro irrigation technologies are being promoted in India by the central and state governments by providing different kinds of financial institutional and technical support These technologies are promoted primarily because of (1) as a means to save water in irrigated agriculture (2) as a strategy to increase income and reduce poverty and (3) to enhance the food and nutritional security of rural households Despite the reported significant economic advantages and the concerted support of the government and NGOs the current micro irrigation area in India remains an insignificant proportion of its potential Rising demand for irrigation water in the face of its inefficient use amid concerns of growing water scarcity has brought into renewed focus the need for conserving water and improving water use efficiency
The real thrust on promoting MI adoption largely started with the recommendations of the Report of the Task Force on Micro Irrigation in 2004Their report sought to increase the emphasis on MI technology and recommended a broader framework viewing MI technologies as a part of the overall water management strategy It also recommended that more financial resources for subsidies with state governments taking up 10 percent of the cost while the central funds would account for 40 percent and advised greater flexibility for states to determine their appropriate implementation structure and institutional mechanisms for subsidy disbursement (Ministry of Agriculture 2004) Based on these recommendations in 2006 the Centrally Sponsored Scheme (CSS) on MI was launched The `National Mission on Micro Irrigationrsquo (NMMI) in 2010 revising and reformulating the Centrally Sponsored Scheme (CSS) on Micro-Irrigation which was introduced
In this study an attempt is made to study the Impact Evaluation of micro irrigation in 13 states of India by using the available information and field surveys of 7400 respondents inclusive of both adopters and non-adopters
Owing to promotional schemes introduced by the state and central governments the area under micro irrigation has increased from 11817 ha in 2005-06 to over 361 million ha in 2012-13 In spite of having many advantages over conventional method of irrigation the area under micro-irrigation presently occupies only about 571 percent of the total irrigated area As per the latest information only 285 percent of total irrigated area under drip irrigation and 286 percent is under sprinkler irrigation
Government of India Ministry of Agriculture Department of Agriculture and Cooperation assigned the study on ldquoImpact Evaluation of National Mission on Micro Irrigationrdquo (NMMI) scheme to access the performance of the programme implementation and access the impact of this scheme on increase in farmersrsquo income through adoption of the MI system The study was conducted in 13 states comprising of 64 districts from the sampled states namely AP Bihar Chhattisgarh Gujarat Haryana Karnataka Maharashtra Odisha
Impact Evaluation Study on ldquoNational Mission on Micro Irrigation (NMMI)rdquo
114
Rajasthan Tamil Nadu Uttar Pradesh Sikkim and Uttarakhand The field survey to get the first hand information was conducted for a total sample of 7400 comprising beneficiary and non-beneficiary farmers in these selected states through adopting stratifiedndashpurposive-sampling design Apart from this information was also collected from system suppliers government officials
Major Outcomes of the Study
A Current Status i The Scheme since its inception in 2005-06 has made rapid stride across the
country It has succeeded in bringing about 356 million ha area under micro irrigation in the sampled 13 states7 The physical targets for the period 2005-06 to 2012-13 were fixed to the extent of 383 million ha out of which 356 million ha has been brought under MI The Targets and achievements for financial outlay were Rs50128 and Rs50065 crores respectively The overall physical and financial achievements thus come out to be 9299 amp 9987 percent The extent of achievements however varied among different states States like Bihar Karnataka Odisha Rajasthan and Sikkim achieved more than 90 percent of the set physical targets Uttarakhand could achieve only 21 percent of physical and 31 percent of the financial targets Other States such as AP Chhattisgarh Gujarat Haryana Maharashtra and Tamil Nadu succeeded to achieve more than 70 of their physical targets
ii AP Gujarat amp Maharashtra are leading states in the every aspect of performance the different activities involved in the process streamlined in the guideline of NMMI While Bihar UP Sikkim amp Uttarakhand states are lacking in terms of the functions mentioned in the guidelines
B Pattern of Assistance
i Most of the states are giving subsidy of more than 70 percent for installation of
MI system However comparison of various states and analysis clearly demonstrates that increased subsidy had no significant impact on the increase of area coverage under MI system Farmers in Maharashtra Gujarat and Haryana were 223 140 and 100 percent respectively in case of sampled beneficiaries while pertinent subsidy component in these states was 60 50 and 90 percent respectively Similarly area coverage in Rajasthan Tamil Nadu and Bihar was noted to be 73 45 and 31 percent respectively and the corresponding figures
7 Ministry of Agriculture
Impact Evaluation Study on ldquoNational Mission on Micro Irrigation (NMMI)rdquo
115
for subsidy were 90 75 and 90 percent The aforesaid observation clearly suggests that increase in subsidy component beyond a limit has little or no impact on area coverage under MI system The relationship between area expansion under MI and quantum of subsidy has been computed considering beneficiariesrsquo data on area expansion in different states before and after adoption of MI system Hence the relationship of subsidies with area expansion as such does not refer to any specific year
ii The efficiency of scheme implementing agency is very high as most of the farmers have reported that their applications are processed and sanctioned in less than 40 days as against 60 days specified in the guidelines Similarly in most of the sample states beneficiaries are reported to be satisfied with respect to the procedure for filing the application till disbursement of the subsidy amount
iii Presently subsidy is limited to maximum area of 5 hectare per beneficiaries which is an impediment to the growth of area under micro-irrigation The data on size and distribution of operational land holdings in the country also suggest that medium and large farmers accounted about 15 percent of total land holdings thus occupying approximately 5542 percent of the total area
iv All the states have reported convergence of Mission interventions with different schemes of the Government of India and State level programmes Most of the districts have converged NFSM interventions with programmes such as RKVY ICDP Farm Mechanization NHM and other programmes
C Sources of Awareness and Reasons of Non-adoption i The major sources of awareness about the NMMI scheme were through service
providers suppliers followed by fellow farmers extension workers
ii The non-beneficiaries farmers had mix responses for not adopting the scheme because of lack of awareness regarding subsidies lack of technical knowledge high capital cost and system being not economical therefore not required
iii As per primary survey of the sampled beneficiaries about 59 percent of the respondents were small amp marginal farmers and 13 percent were women farmers who have taken the advantage of the Scheme
Impact Evaluation Study on ldquoNational Mission on Micro Irrigation (NMMI)rdquo
116
D System Cost and Sources of Fund i On an average the cost of system per hectare incurred by the beneficiaries
ranged between Rs 5445736 to Rs 7208631 in drip system and Rs 20481 to Rs 28171 in sprinkler irrigation system depending on the cropping pattern crop spacing etc in the states under study
ii Almost in all states farmer beneficiaries use their own funds for contributing margin money (9866) Other sources albeit a small proportion constitutes banking KCC amp money lenders
iii Most of the farmers borrowed money at less than 10 percent of rate of interest from banks and KCCs
E Technical Observations about MI System i It was observed that about 64 percent of the beneficiaries installed drip system
34 percent sprinkler system and 2 percent have installed both the systems in their fields The highest proportion of drip was observed in Karnataka whereas adoption of sprinkler was higher in Bihar
ii The majority of the beneficiaries (about 6887) farmers of all the 13 states have got their soil and water tested In Gujarat UP Maharashtra amp Rajasthan soil testing adopted by 6927 5275 7337 and 7913 of respondents respectively
iii More than 70 percent of the respondent farmers of AP Gujarat Sikkim and Odisha were using in-line drip irrigation system whereas more than forty five percent beneficiaries of Haryana and Uttarakhand reported to practice on-line drip irrigation system
iv The farmers were using screen filters centrifugal separators hydro-cyclone filter disc filter sand media filters depending on the need The data reveals that screen filters are being commonly used by the beneficiaries in most of the sampled states except Haryana where more than 65 percent beneficiaries are using hydro-cyclone and screen filters in combination due to the water quality as they are using canal water
v There is an increasing emphasis on conserving water and using it more efficiently Micro irrigation technologies based on drip and sprinkler irrigation systems provide some hope for achieving this The government has been
Impact Evaluation Study on ldquoNational Mission on Micro Irrigation (NMMI)rdquo
117
providing substantial financial incentives in the form of capital cost subsidies to farmers to invest in these technologies Most drip equipment sales in the study areas are subsidy driven Manufacturers and market estimates suggest that most of the MI system sales are subsidy linked Partly as a result of the existing subsidy delivery mechanism drip technology has failed to capture the kind of market that would have been expected given the many advantages and water saving potential the technology offers
vi The farmers in almost all the states reported that components of MI System met the BIS norms The average figure for all the sampled states where system components were as per the BIS norms came out to be around 98 percent
vii As far as overall designing of the system is concerned it was found that the systems were well designed except in case of Sikkim and Odisha where the systems were functional but not able to meet the farmers expectation It is therefore suggested that extensive involvement of the extension staff may be ensured to install the system as per requirement of ground conditions and once the system is installed regular monitoring particularly during the warranty period of the installation be carried out so that defects if any be got rectified by the suppliers
F After Sales Service
i On an average 91 of the beneficiaries across the sampled states reported that
after sales services are being provided to them amp also they receive the services at the required time Most of the sampled beneficiaries revealed that they are getting warranty of the MI system
ii In almost all the states the sampled beneficiaries revealed that no technical support guidance on agronomic practices are extended to the users as they generally tell to take the help of extension agencies
G Impact Analysis i The irrigated area has increased in all the surveyed states after the introduction
of NMMI Scheme The Irrigated area within the 5892 sampled beneficiaries of the 13 states before adoption of MI system was found to be 1332086 ha which became 1444147 ha after adoption of MI system It is therefore concluded that total percentage increase in irrigated area with the sampled beneficiaries in 13 states after adoption of MI system was noted to be 841 from same source of water Maharashtra has topped the list with 2228 growth in irrigated area
Impact Evaluation Study on ldquoNational Mission on Micro Irrigation (NMMI)rdquo
118
ii Farmers of all the states have shown an increase in area under horticulture crops after the adoption of the system The cropped area after implementation of NMMI has shown an increase which may be due to utilization of degraded marginal land into cultivable land amp increase in cropping intensity
iii Scheme has performed well in terms of reduction in irrigation cost and significant cost saving has been observed for irrigation in all the surveyed states Irrigation cost is reduced by 20-50 with average of 323 Reduction in electricity consumption after installation of MI system Average electricity consumption has been reduced by about 31 after using the micro irrigation system Saving of fertilizers with averages reduction of about 28 in total fertilizer consumption in the surveyed states Fertilizer saving vary from 7- 42
iv Micro irrigation has generated benefits to the farmers in terms of enhancement of the productivity The average productivity of fruits and vegetables has increased about 423 and 528 respectively
v The overall benefits accrued from the micro irrigation system are reflected in the income enhancement of the farmers All the surveyed states reported increase in farmerrsquos income in the range of 20 to 68 with an average increase of 485
vi Given the high benefit-cost ratios which is more than one in almost all crops and states we also find that the present form for delivery of public support in the nature of a capital cost subsidy is constraining both to the widespread adoption of the technology by farmers and to innovation in technology development and marketing This has made the entire gamut of manufacturing sales adoption and use of drip technology subservient to government support The present study has put forward an alternate system wherein the subsidy is given directly to farmers willing to invest in a drip system With a given amount of funds available the proposed model can provide subsidies to a much larger number of farmers can bring a much larger area under drip irrigation resulting in lower subsidy outgo per hectare of drip irrigated area would still incentivise the farmers to invest in drip systems lower the cost of subsidy outgo easy to manage and govern less prone to interference and whims and fancies of officials and lead to more efficient use of available subsidy without distorting the market Thus on all indicators the proposed subsidy scheme of direct delivery far outweighs the existing subsidy scheme of subsidizing the manufacturers in the name of the farmersBC ratio of installing micro irrigation system is above one across the states and across the crops which signifies the importance of MI system in net income enhancement of the farmers The BC ratio was observed to
Impact Evaluation Study on ldquoNational Mission on Micro Irrigation (NMMI)rdquo
119
be highest in Odisha among fruits amp vegetables whereas in flowers Rajasthan amp Haryana beneficiary farmers achieved higher BC ratio
vii The positive outcomes have made the food security effective due to the increase in the production and productivity of different crops and increased area under irrigation from same source of water Area under horticulture crops as well as nutritional security has also enhanced
viii The NMMI has helped to widen the food basket of the country with significant contributions coming from the bringing more area under irrigation and with judicious use of water New farm practices and innovations with support of government have encouraged the farmers to shift toward crops giving higher income
H Employment Generation i Beneficiaries of all the states under study have shown decrease in utilization of
the labor in pre-harvest practices that is labor saving on irrigation weeding fertilization and other operations It shows that the use of human labor after the use of micro irrigation has decreased significantly and ranges between 741 to 1875 percent But in post-harvest operations right from harvesting to handling and disposal of the produce there is an increase in labor utilization and it ranges between 2119 to 5023 percent due to the increase in the production which requires more of the labor for harvesting assembling and grading handling transportation and disposal of the produce
I Training and Capacity Building i Among the surveyed states more than 90 percent of the sampled beneficiary
farmers in the state of Haryana Karnataka Sikkim amp Tamil Nadu had training on different aspects of MI System whereas farmers of Bihar amp Odisha only 20 amp 52 percent of the beneficiaries have received the training
ii Results of survey revealed that the system suppliers manufacturers are the major sources for imparting training as more than 90 percent of the farmers received training from them Very less proportion of the respondents reported to have training from other sources such as SAUs KVKs etc The participant beneficiaries revealed that the duration of training period generally was of 1-2 days Almost all the respondents of Tamil Nadu UP Chhattisgarh Haryana were given training materials during the training while few beneficiaries of the Bihar and Uttarakhand Karnataka were provided such training materials
Impact Evaluation Study on ldquoNational Mission on Micro Irrigation (NMMI)rdquo
120
iii Key areas for training were operation and maintenance of the system adoption
of package practices under MI and opportunities for introducing new crops Demonstration was other means of motivation and capacity building It was also found to be a good means of promotion
J Promotional Activities
i The farmers of the majority of the states acknowledged that the implementing
agencies are promoting NMMI schemes in local language however were not aware of the dedicated website for MI scheme in their state It is due to the fact that farmers do not have access or willingness to use internet for information gathering
ii On farm demonstrations particularly in rural area where exposure is limited are very important means in educating the rural folks It was noted that maximum beneficiaries of Haryana (98) followed by Sikkim (80) Rajasthan (64) and Uttarakhand (63) have visited the demonstration laid out in the nearby areas Whereas majority of the farmers of AP UP TN Karnataka Gujarat Bihar have reported that they have not visited any demonstration farm It is therefore suggested that more efforts may be put to expose the farmers regarding demonstration of MI system and its benefits
Thus it may be concluded that positive outcomes in terms of crop productivity enhancement due to implementation of MI Scheme have contributed significantly to the food requirements The NMMI has helped to widen the food basket of the country with significant contributions coming for bringing more area under irrigation and with judicious use of water New farm practices and innovations with support of government have encouraged the farmers to shift forward crop giving higher income
It is noteworthy that the incremental net returns were observed to be generally higher for cash crops such as fruits vegetables ground nut cotton etc than for food crops viz bajra and wheat This is in conformation with the results of research studies
Key Recommendations and Policy Implications
For the food security and sustainability to match the growing population priorities are to bring more area under irrigation through judicious use of irrigation water Keeping this aspect in view the Government of India launched the Central Sponsored Scheme for Micro Irrigation in 2005-06 which was up scaled as National Mission on Micro Irrigation in 2010 Micro irrigation system being capital intensive in nature and the adoption cannot be increased without providing subsidy Subsidy can be a necessary condition for encouraging the adoption of micro-irrigation but cannot be a sufficient condition for sustaining the
Impact Evaluation Study on ldquoNational Mission on Micro Irrigation (NMMI)rdquo
121
growth of it as many other factors determine the adoption of the same Even though subsidy is not needed to enhance the economic viability of the system it is still needed to enhance the incentive for the widespread adoption of MI particularly among the resource poor farmers (marginal and small categories) Therefore there is a need to find out the ways and means to convince the farmers about the economic and social feasibility of micro-irrigation Since it involves relatively higher amount of fixed investment farmers often ask the questions regarding the payback period viability water saving and the productivity gains It appears that these questions arise mainly because of poor exposure about the social and economic advantages of the technology Thus efforts are needed to convince the farmers through quality extension network as Indiarsquos highly successful green revolution was also the result of extension innovations as much as technology Considering the fast decline of irrigation potential and competing demand for water from different sectors all possible efforts are needed to increase the adoption of water saving technologies so as to avoid water scarcity in the future
Given the vast potential benefits of micro-irrigation and fast decline of availability of water for irrigation in the country a number of technical and policy interventions are required to be introduced so as to increase the adoption of micro-irrigation in India The needed recommendations and interventions are presented below
A Scheme Related 1) The rate of subsidy provided under NMMI through central government is fixed
uniformly for different categories of farmer with a limit of 5 hectare This needs to be restructured as about 15 of the large and medium farmersrsquo accounts for more than 5542 of the land in India Therefore this limit of five hectares needs to be enhanced for extending the subsidy
2) States often compete with each other to increase the subsidy component However it has been noted that higher subsidy does not necessarily lead to more area coverage under MI system as the highest increase in area under MI has been achieved by states which offer subsidy in the range of 50-75 percent eg Maharashtra Chhattisgarh Gujarat and Odisha In case of AP which increased subsidy from 70 to 90 percent in 2011-12 the additional area to come under MI in fact decreased as compared to the previous years It is therefore recommended that the states should be advised to seriously consider that the quantum of subsidy should preferably be not more than 50-70 percent including state and central share
3) No uniform pattern is being followed by states for implementation of this scheme It has been observed that in some states more than one department are involved in parallel eg Karnataka where it is being implemented by both agriculture and horticulture departments In such cases there is often lack of coordination which adversely affects
Impact Evaluation Study on ldquoNational Mission on Micro Irrigation (NMMI)rdquo
122
the outcome of the scheme It has also been observed that where a single department is designated as the implementing agency (eg horticulture or agriculture) it does not pay adequate attention to the crops coming under the purview of other departments Perhaps one of the best implementation strategies is to designate an independent Special Purpose Vehicle (SPV) on the pattern of Gujarat (GGRC) and AP (APMIP) States may be encouraged to replicate such a strategy
4) One of the major reasons for the slow growth of micro-irrigation in India is the high initial investment In spite of availability of subsidy from state agencies majority of the farmers are reluctant to invest in micro-irrigation system even in horticulture crops which is highly suitable for drip irrigation Therefore micro-irrigation system should be tailored made ie planned and designed based firmly on location specific parameters to reduce the cost of installation
5) Micro irrigation System is mostly promoted through subsidy schemes and not as an on-farm water and land management strategy In certain states under subsidy scheme the requisite consideration have not been given in respect of field size shape topography type and location of water source seasonal fluctuations type of soil and crop to be grown As a result in certain cases the subsidy may not match the specific situation of an individual farmer consequently the system may not match the site specific situations of an individual farmers consequently the system may not operate to the complete satisfaction of the farmer
B Technology Related 1) There is a need to establish a Central Testing Facility (CTF) to deal comprehensively with
the design development and testing of all equipments devices machines used in micro irrigation systems using state-of art technology It is suggested that the Govt may consider contacting regular and random technical audit of the system to cover about 2-3 percent beneficiaries within first and second year of the installation This will keep check on to quality and suppliers will be more vigilant to supply good quality of system
2) It is suggested that the implementing agencies should be more vigilant regarding warranty and after sales service of the system provided by the suppliers The question of releasing 10 percent of the cost of the system after one year subject to satisfactory performance of the system as certified by the beneficiary may be considered Maintenance manual in vernacular language should be made available to the beneficiaries at the time of installation of the system
3) It is observed that the cost of micro-irrigation accessories such as emitters filters laterals etc vary between shops and places Sometimes farmers do face problem in
Impact Evaluation Study on ldquoNational Mission on Micro Irrigation (NMMI)rdquo
123
getting spare parts in time It is necessary to provide quality materials in time for farmers for the speedy adoption of micro-irrigation
4) Inadequate information about the operation maintenance as well as the usefulness of micro irrigation is one of the main reasons for its uneven spread across regions in India Farmers still do not have full knowledge regarding the usefulness of the micro irrigation Even the adopters do not know fully how much of subsidy is available per hectare for different crops
5) Clogging of drippers mainly due to poor quality of water helps in bacterial growth which can be controlled by using chlorination which acts as a powerful oxidizing agent and vigorously attack micro-organisms such as algae fungi and bacteria Also acid is injected into drip irrigation system to lower the pH of the irrigation water and this helps in preventing the precipitation of salts such as calcium carbonate magnesium carbonate or ferric oxide It has been observed during the course of survey that the availability of sulphuric acid in the nearby towns is a major constraint and farmers are forced to purchase new spares by discarding clogged drippers Recently some farmers have started applying phosphoric acid to get dual benefit such as flushing of impurities and adding P fertilizer to the soil but the same is not recommended and also not very effective It is therefore recommended that system suppliers should make acid available to the growers as part of their after sales service obligation It is realized that the normal acid treatment does not help to mitigate the problem Therefore studies need to be carried out to devise de-logging measures in such areas
C Awareness and Capacity Building
1) The extension network currently operated mainly by government agencies does not
seem to be making significant impact on the adoption of this technology Therefore there is a need to revamp the entire extension network by involving the MI system manufactures in order to increase amp improvise the existing quality of extension services
2) System manufacturers should be involved intensively in promoting micro-irrigation by introducing frequent demonstration at farmersrsquo field and strategic locations in the district state The micro Irrigation system manufacturers should be involved in providing advice on agronomic packages to the farmers so as to encourage the adoption of micro irrigation at a large scale
3) Since MI system suppliers are one of the major sources of creating awareness among potential beneficiaries their involvement in laying down demonstration may be increased Similarly imparting training on technical and operational aspects of the system should be included as mandatory part of the training of the farmers by the
Impact Evaluation Study on ldquoNational Mission on Micro Irrigation (NMMI)rdquo
124
system suppliers The training may also include aspects of packages of practices which may be standardized by the SAUs amp other related organization and supplied to system suppliers for further dissemination to the farmers
4) Awareness on MI system is low in states like Bihar UP and Odisha Special drive is needed for exposure visits trainings to make them aware about the benefits and operation of the system The number of demonstration farms should also be increased
5) It is understood from the field study that the officials who are involved in promoting micro-irrigation technology under the GoI Scheme have inadequate knowledge about the technical and other details of MI Therefore the state government extension staff need to undergo lsquoRefresher Courses and exposure visitsrsquo to have basics of micro-irrigation thereby enabling their role in the implementation of the scheme
D Follow up Action 1) Though micro-irrigation has been in use in different States since mid-eighties State-
wise potential area is not estimated as of today Therefore it is essential to prepare State-wise and crop-wise potential area for MI A detailed estimate on State-wise potential would be useful to fix the target to be achieved and further to develop a road map for MP adoption in the country
2) It is evident from field study that capital cost required to install micro irrigation system is relatively high Because of this reason considerable percentage of farmers have expressed that they are unable to adopt this technology for low value crops There has been a significant development in the MI technology and efforts should be on developing and popularizing low cost technologies This would help reducing the cost of the system and increasing the adoption of micro-irrigation at a large scale and at least one percent of the outlay on micro-irrigation needs to be earmarked for micro-irrigation research
The information regarding all the activities under NMMI scheme at national and state level should be under public domain The information available at NCPAH website is qualitative and it should be quantitative to make it more clear and informative Similarly information at state level is hardly available in the website and it should be mandatory for implementing agencies to host their websites as is being done in case of Tamil Nadu
Impact Evaluation Study on ldquoNational Mission on Micro Irrigation (NMMI)rdquo
125
References Ahuja Usha Ram Singh PKJoshi and Neelu Nanwani 2012 Micro Irrigation Economics and Outreach in Haryana Chandrasekaran M and D Suresh Kumar 012 Micro Irrigation Economics and Outreach in Tamil Nadu
Dhawan BD 2000 Drip Irrigation Evaluating Returns Economic and Political Weekly 35 42 (Oct 14-20 2000) pp 3775-3780 Dhawan B D 2002 Technological change in irrigated agriculture A study of water saving methods New Delhi Commonwealth Publishers Government of India 2010 National Mission on Micro Irrigation Operational Guidelines New Delhi Ministry of Agriculture November 2010 Government of India 2004 Report of the Task Force on Micro irrigation Ministry of Agriculture New Delhi January 2004 INCID 1994 Drip Irrigation in India New Delhi Indian National Committee on Irrigation and Drainage Malik DP and MS Luhach 2002 Economic dimensions of drip irrigation in context of fruit Crops Paper presented at International Workshop on Economics of Water and Agriculture held at Institute of Food Agriculture and Environmental Sciences The Hebrew University Jerusalem Israel 18-20 December NABCONS 2009 Evaluation study of centrally sponsored scheme on Micro Irrigation Mumbai NABARD Consultancy Services Namara R E Upadhyay B Nagar R K 2005 Adoption and impacts of micro irrigation technologies Empirical results from selected localities of Maharashtra and Gujarat states of India Research Report 93 Colombo Sri Lanka International Water Management Institute Narayanamoorthy A 2012 Drip Method of Irrigation in Maharashtra Status Economics and Outreach I Narayanamoorthy A 2009 Drip and Sprinkler Irrigation in India Benefits Potential and Future Directions in Amarasinghe U T Shah RPS Malik (eds) Strategic Linking of the National River Linking Project (NRLP) of India Series 1 International Water Management Institute Colombo Narayanamoorthy A 2004 Impact assessment of drip irrigation in India The case of sugarcane Development Policy Review 22(4) 443-462 Narayanamoorthy A 2003 Averting water crises by drip method of irrigation A study of two water intensive crops Indian Journal of Agricultural Economics 58 (3) 427-437 Narayanamoorthy A 2001 Impact of drip irrigation on sugarcane cultivation in Maharashtra Agro Economic Research Centre Gokhale Institute of Politics and Economics Pune India Narayanamoorthy A 1997 Economic analyses of drip irrigation An empirical analysis from Maharashtra Indian Journal of Agricultural Economics 52 (4) 728-739 Narayanamoorthy A 1996 Evaluation of drip irrigation system in Maharashtra Mimeographed series No 42 Agro Economic Research Centre Gokhale Institute of Politics and Economics Pune India Malik RPS and MS Rathore2012 AgWater Solutions Project Case Study Accelerating Adoption of Drip Irrigation in Madhya Pradesh India
Impact Evaluation Study on ldquoNational Mission on Micro Irrigation (NMMI)rdquo
126
Palanisami K S Raman Kadiri Mohan 2012 Micro Irrigation- Economics and Outreach Macmillan Publishers India Ltd for International Water Management Institute Palanisami K Kadiri Mohan K R Kakumanu S Raman 2011 Spread and Economics of Micro irrigation in India Evidence from Nine States Economic and Political Weekly XLVI Nos 2627 June 25 2011 Patil RG (2001) water filtration for micro irrigation system In Micro irrigation Eds HP singh SP Kaushik Ashwani Kumar TS Murthy Jose C PP 574 Phansalkar SJ 2002 Appropriate Irrigation Technologies promoted by IDE A Socio Economic Assessment Raina JN Thakur BC and ML Verma (1999) Effect of drip irrigation and polyethylene mulch on yield quality and water use efficiency of tomato (Lycopersicon esculentum) Indian J Agric Sci 69 (6) 430-33 Raina JN Suman SKumar P and RSSephia (2013) Effect of Drip Fertigation With and Without Mulch on Soil Hydrothermal Regimes Growth Yield and Quality of Apple (Malus domestica Borkh Comm in Soil Sci amp Pl Annual 44 1-11 Regassa E Namara Bhawana Upadhyay and R K Nagar 2005 Adoption and Impacts of Micro irrigation Technologies Empirical Results from Selected Localities of Maharashtra and Gujarat States of India Research Report 93 Colombo Sri Lanka International Water Management Institute Sankaranarayanan KP Nalayini M Sabesh S Usha Rani R P Nachane and N Gopalakrishnan 2011 Low Cost Drip ndash Cost Effective and Precision Irrigation Tool in Bt Cotton Technical Bulletin No12011 Coimbatore Sharma RC (1998) Nature Extent and Classification In Agricultural Salinity Management in India Central Soil Salinity Research Institute Karnal UpadhyayB2003 Drip irrigation An appropriate technology for women Appropriate Technology Vol 30 (4) Verma S Tsephal S and Jose T 2004 Pepsee systems Grass root innovation underground stress Water policy 6 (2004) 1-16 Verma SR Impact of Agricultural Mechanization on Production Productivity Cropping Intensity Income Generation and Employment of Labor Status of Farm Mechanization of India 133-153 (wwwagricoopnicin)
Impact Evaluation Study on ldquoNational Mission on Micro Irrigation (NMMI)rdquo
127
Appendices Annexure I Processes of Implementation
Process for Implementation of Micro Irrigation Scheme
The Block Development Officer will receive Gram Sabha approved applications with the required documents on basis of ldquofirst come first servedrdquo basis from the farmers interested in availing benefit under the scheme through Village Horticulture Extension Officer Horticulture Development Officer and other sources such as regional workersdealers of registered manufacturing companies Action Block Development Officer At Block Development level the compiled applications will be put in a register according to priority and registered number and date will be assigned The registration number and date will be informed to beneficiary in written (Form-One) Action Block Development Officer Within three days of receiving the application a visit to farmerrsquos field will be made with Village Horticulture Extension Officer to confirm the information entered in application and field notes will be compiled in a folder (Form-Two) Action Block Development Officer Time Limit Three days After the field visits the applications will be arranged in an ordered list and sent to District Horticulture Office along with application form-three A copy of list and application will remain with Block Development Officer (Form-Three) Action Block Development Officer Time Limit Four days At district level development block wise received list will be registered and kept in same order in block wise registers From every Block Development list each application will be accepted in order Time Limit Three days Action Member Secretary District Micro Irrigation Committee (DMIC) The estimation of proposed area and cost will be made according to received applications district level integrated Action Plan will be formulated and District Micro Irrigation Committeersquos sanction proposal will be sent to State Micro Irrigation Committee Time Limit Ten days Action Member Secretary State Micro Irrigation Committee (SMIC) On the basis of district level Action Plans state level Action Plan will be prepared and after approval from State Micro Irrigation Committee (SMIC) will be sent to central governmentrsquos Department of Agriculture amp Cooperation New Delhi Time Limit Ten days Action Member Secretary State Micro Irrigation Committee (SMIC) Part-Two The information received about district wise Action Plan approved by central governmentrsquos Department of Agriculture amp Cooperation will be shared with DMIC Time Limit Three days Action Member Secretary State Micro Irrigation Committee (SMIC)
(a) After receiving information about approved Action Plan for district each block wise registered application will be forwarded to manufacturing companies which were selected by farmers for survey drawingdesign etc in an order (Form- Four) Time Limit Three days Action Member Secretary District Micro Irrigation Committee (DMIC)
Impact Evaluation Study on ldquoNational Mission on Micro Irrigation (NMMI)rdquo
128
(b) After getting the approval from the bank bank loan application will be send to the micro irrigation Company for the further required action Micro Irrigation Company will prepare drawing design etc of the farmerrsquos field in which system has to be established and make them available to Block Development Officer and Senior Horticulture Development Officer Time Limit Three days Action Micro Irrigation Company After receiving documents from Micro Irrigation Company Block Development Officer will visit concerned farmerrsquos field and will make initial physical verification of irrigation water and available energy for the proposed system which is to be established After initial physical verification required documents along with recommendation of Block Development Officer should be sent to Member Secretary DMIC (Form Five) Time Limit Three days Action Block Development Officer After receiving approved applications from Block Development Officer within stipulated time limit Member Secretary DMIC will issue administrative approval and give work orders to micro irrigation Company to accomplish work (Form- Six) Time Limit Three days after receiving applications Action Member Secretary District Micro Irrigation Committee (DMIC) After receiving work direction from Member Secretary District Micro Irrigation Committee (DMIC) Micro Irrigation Company will establish system in working condition at the site selected by concerned farmer It will give required training to farmer and manual in Hindi The satisfaction certificate will then be obtained from farmer should be sent to Member Secretary along with bills (Form- Seven) Time Limit Seven days Action Micro Irrigation Company After receiving information about system establishment from micro irrigation companies group of nominated officers from DMIC will physically verify the established system and report will be presented in prescribed form After receiving correct physical verification report the approved grant payment will be issued in prescribed form (Form-Nine) and action for payment will be ensured (Form- Eight) Time Limit Ten days Action Nominated Group for physical verification
Note (1) The process of making payments to the suppliers of materials under scheme should be made after physical verification and other necessary formalities have been completed The payment should be made according to priority (2) During physical verification concerned officials will see that system has been established according to the drawingdesign presented initially by micro irrigation Company The standard material has been provided in prescribed quantity The distribution of irrigated water is uniform at all the places The farmer has been trained to operate the system maintain it etc and manual in Hindi has been provided If during physical verification the facts are presented showing incomplete provision of system and supply of non-standard material Member Secretary will have a responsibility to inform micro irrigation Company that it should establish the system according to the presented proposal The physical verification of system should be done again before taking action to make payment to company Time Limit 3 days Action Member Secretary DMIC It will be responsibility of Head DMIC that the above action is taken in stipulated time Action Head DMIC
Impact Evaluation Study on ldquoNational Mission on Micro Irrigation (NMMI)rdquo
129
The person getting benefit out of micro irrigation scheme has to submit an affidavit on a 5 rupees stamp paper along with the necessary forms to the Assistant Director Horticulture Joint Member Secretary District Micro Irrigation Committee declaring that he will not transfer the dripsprinkler system to any other farmer neither sells it (Form- Ten) Action Beneficiary Answerable Block Development Officer The beneficiaries of this scheme will have to give in written that they or any member of their family (if combined) has not taken benefit from any Govt state Govt scheme of providing dripsprinkler for irrigation (Form- Eleven) Action Beneficiary Answerable Block Development Officer
Impact Evaluation Study on ldquoNational Mission on Micro Irrigation (NMMI)rdquo
130
Figure 13 Subsidy Process under GGRC Source Kumar amp Pullabhotla
Farmers
Approaches to MI Companies of
their choice
Application is submitted to GGRC with design and cost
estimation and 5 advance money by farmer
Get cost estimate for the installation after survey
Work Order released with 25 money to MI companies by
GGRCBank
Tri-party agreement (TPA) Collection of Management ChargesDifferent Amount
Submission of Performa Invoice for advanse payment
Installation amp trial run of MIS Third party inspection Issuance of
Insurance Cirtificate Submission of Final Bill
Payment of Balance Amount (75) by GGRCBank to MI
comp
Impact Evaluation Study on ldquoNational Mission on Micro Irrigation (NMMI)rdquo
131
Figure 14 Subsidy Process under APMIP
Source Adapted from Horticulture Department Note Abbreviations used MIAO ndash Micro-irrigation Area Officer AOHO ndash AgricultureHorticulture officer MCO ndash Micro-irrigation coordinators
Farmers
Application submitted to MIAOAgri OffHorti Off
Application form forwarded for village revenue officersquos
signature along with title deed
Forwarded to MI Company (Choice of company indicated
by farmer at the time of submission of application)
Company prepares the
design amp survey
Sent back to AOHO or
MIAO
Forwarded to AOHOMIAO who sends it
to Mandal Co-ordination Office
Will inform through MIAO to farmer of how much to
pay
Application + farmers DD (30 or farmerrsquos share)
submitted to MIAO
At district office administrative sanction
after scrutiny of documents
10 of cost released to
company as mobilization fund
Material delivery and installation to be undertaken by company within 15 days
Upon receiving completion certificate 85 of cost released to company
MCO has to inspect and furnish completion certificete
along with photograph
5 of cost is held as a guarantee for providing service Released
to company if bank guarantee is furnished
Impact Evaluation Study on ldquoNational Mission on Micro Irrigation (NMMI)rdquo
132
Box 1 Online Micro Irrigation Farmerrsquos Subsidy Management System in Tamil Nadu Subsidy Management System
Online Micro Irrigation Farmerrsquos Subsidy Management System in Tamil Nadu Subsidy Management System
With a mission to improve and increase the performance the Micro Irrigation (MI) for Horticulture and Non Horticulture crops across every region in all states of India web based software for centralized subsidy allocation and management monitoring software is developed This software was developed by Maruti Computers Private Limited (MCL) Chennai is proved to be very successful after its implementation in the state of Tamil Nadu This web based application software is an end-to-end tool which simplifies and facilitates the entire process of release of subsidy to the beneficiaries This system provides required information to all stake holders in a very transparent manner and provides paperless office and e-governance functionalities This software was developed with latest technologies and fully complies with current guidelines of Central Government MI Scheme The software is continually updated with the changes in rules and regulations and for the technology changes This software addresses the core need for this application - speedy processing of farmerrsquos subsidy requests in a transparent manner
Overview
The software was developed as per the guidelines of the MI Scheme This software is available in multiple languages For a specific state this is available in bilingual languages for various applications and annexure This will enable the beneficiary to understand the content of the application in the local language and fill without any errors
To increase the accuracy and correctness of the information submitted by the farmers software enables them to re-verify the entire data to be submitted by them System helps the applicant to correct the data before submitting to department On completion of various applications at their convenience the beneficiary can submit the application on-line
Once the entire application is in complete form system accepts the application for further processing A unique16 digit Application Id is generated by the system and with Id of the application The authorities will be able to identify the district taluka block etc along with date amp time seal The Beneficiary farmers may also submit their application online with the help of designated agencies (District Agriculture and Horticulture departments) or Sugar Mills or Micro Irrigation Companies who are all one of the stake holders of the scheme
The software and the data within the software are highly secured with access control privileges for various levels of users Data within the system cannot be manipulated or altered where they lack authority The software can generate various types of MIS reports and all stake holders The Government of India who is the sponsor of the scheme can generate reports on demand for monitoring the scheme The system has intelligence to identify and mark duplicate application Through this facility duplicate or fraudulent applicants are identified and removed from further processing The software is user friendly menu driven open-ended for future enhancements and is secure
Subsidy Processing and Monitoring The fully completed applications are then processed by the District Technical Committee Their decision of approving or rejecting the applications is fed online On approval a work order for installing the system is issued to the respective Micro Irrigation companies The Micro Irrigation companies after installing the system in the field they submit the completion certificate and their Invoice online Subsequently check Measurement done for the implementation of the system is then fed online Once check measurement is submitted Invoice submitted by the MI Companies gets approved for release of their payment and subsidy to the beneficiary
Process flow The software is built with Business Process Management (BPM) concepts BPM provides the workflow or process management capability ndash that helps an organization to formulate a step by step flow of a process and stipulate conditions for flow from one step to another It also provides tight security as who can move from one step to another
Impact Evaluation Study on ldquoNational Mission on Micro Irrigation (NMMI)rdquo
133
Box 2 Possibilities for Modifications
Possibilities for Modifications
The administrator of the system can make majority of operational changes without any programming changes The system is built on a rule driven and data driven architecture Hence by changing the data and rules the system behavior can be modified Process flow control can be managed by changing the business process flow with use of Ganges
The software application will be continuously updated MCL for the following items
-Central Government and state regulations
-Software upgrades for technology related items
Setting up of a company ndash Special Purpose Vehicle (SPV) to deal with the Micro Irrigation scheme in the states
Both the APMIP and GGRC models are different to the other State Implementing Agencies (SIA) in nature process and functioning the A key contrasting feature of this process between the two models is that under the GGRC system the farmer directly approaches the MI firm of his choice usually through a dealer whereas in the SIAAPMIP system the farmerrsquos point of contact is the local officer who has jurisdiction in the area The farmer indicates his choice of the company at the time of submitting his application and a number of additional approvals are needed before the company receives the farmerrsquos demand and proceeds to prepare the cost estimate This feature adds another layer of delay and unnecessary scrutiny in the subsidy disbursement process This is not the case under the GGRC model
Both APMIP and GGRC are independent and are not under any specific state department such as agriculture or horticulture has no crop specific crop bias
In many instances in these models the MI dealer or firm has an incentive to take up the responsibility of much of the administrative procedures such as collecting the relevant documents facilitating access to bank documentation (in case the farmer wants to avail of credit) submitting the application to the implementation authorities etc in order to speed up their own business
The GGRC encourages the suppliers to motivate the farmer for timely submission of application under MI Schemersquo and educate the farmer for availing loan procedures of Bank
Impact Evaluation Study on ldquoNational Mission on Micro Irrigation (NMMI)rdquo
134
under MI scheme This design reduces some transactional costs of availing the subsidy from farmers to MI suppliers and enhances efficiency
The implementing agency as the private sector also encourages devoting some of its own resources to promote and educate the farmers about the subsidy scheme and its guidelines in addition to the public extension efforts
Both these models however allow for various checks to scrutinize such misappropriation of subsidy through their design of the payment process and via third party verification procedures
Both APMIP and GGRC follow similar procedures for collecting the farmerrsquos share of the cost of the MI system and incorporate provisions to safeguard farmersrsquo interests The farmer pays his share to the implementing agency rather than directly to the MI firm Both the agencies releases only some portion of the amount to the supplier prior to the delivery and installation of the system as a mobilization fund
Only after the system has been installed a trial run undertaken and verified by a third party monitoring agency and with the farmer acknowledging the system performance is the complete amount (farmerrsquos contribution along with the subsidy component) released to the supplier
In view of above the GGRC model and to some extent the APMIP model incorporate useful design elements that align incentives for suppliers (of MI technology as well as credit and insurance suppliers) in a manner that is advantageous to farmers
Set up an SPV on the lines of GGRC (Gujarat) and APMIP (Andhra Pradesh) Dedicated and trained staff Timely subsidy disbursal Detailed information of the scheme to farmers All the paper work Demonstrations Warranty After Sales Services Monitoring of the companies operating in the state Monitoring of the companies operating in the state Regular training of farmers Agronomic support to farmers Make available loans and insurance to farmers
The above diagram clearly states the advantages of having the Special Purpose Vehicle (SPV) for Micro Irrigation There will be dedicated and trained staff to deal with the farmersrsquo queries and to work on the MI scheme full time The funds which do not come on time or are not properly managed will be taken care of by the SPV Often the farmers complain of not getting information on time or the complication of the Govt processes This will be dealt with once the SPV is there The SPV will help people with the paperwork and other
Impact Evaluation Study on ldquoNational Mission on Micro Irrigation (NMMI)rdquo
135
official documentation Regular demonstrations will be held and so will the work of creating awareness amongst the farmers about MI will be done The work of the registered companies will be monitored and it will be ensured that warranty and after sales service be provided to the customers The company will conduct regular training programs not only on MI but also on several other advanced topics of horticulture In addition the company will have agronomists to guide the farmers for obtaining higher yield The loan and insurance problems faced by the farmers will also be taken care of by the company by making arrangements which would be convenient to the farmers
Impact Evaluation Study on ldquoNational Mission on Micro Irrigation (NMMI)rdquo
136
Annexure II State wise Physical amp Financial Targets amp Achievements
Table 90 State wise Physical and Financial Target amp Achievements during 2005-06
State 2005-06
Physical (ha) Financial (Rs in lakh) T A A T A A
AP 45521 6775 1488 612923 934 1524 Bihar - - - - - - Chhattisgarh - - - - - - Gujarat 16720 5042 3016 218201 70117 3213 Haryana - - - - - - Karnataka 25234 - - 35841 - - Maharashtra 41856 - - 480809 - - Odisha - - - - - - Rajasthan - - - 104802 - - Sikkim - - - - - - Tamil Nadu 28950 - - - - - UP 8910 - - 124174 - - Uttarakhand - - - - - - Grand Total 180223 11817 656 2328415 163517 702
Source Ministry of Agriculture Note T- Target A- Achievement
Table 91 State wise Physical and Financial Targets amp Achievements during 2006-07
State 2006-07
Physical (ha) Financial (Rs in lakh) T A A T A A
AP 193459 84623 4374 1951968 11277 5777 Bihar 14223 - - 24821 - - Chhattisgarh 28748 4600 16 303288 25621 845 Gujarat 18247 24338 13338 33559 393095 11714 Haryana 5365 2823 5262 44389 23179 5222 Karnataka 23737 38850 16367 245675 445169 1812 Maharashtra 65119 108260 16625 879655 1346637 15309 Odisha 3314 1222 3687 45426 14319 3152 Rajasthan 39751 67721 17036 283334 268746 9485 Sikkim - - - - - - Tamil Nadu 5402 - - 120064 - - UP - 18636 - - - - Uttarakhand - - - - - - Grand Total 397365 3343006 8413 4457599 3659033 8209
Source Ministry of Agriculture Note T- Target A- Achievement
Impact Evaluation Study on ldquoNational Mission on Micro Irrigation (NMMI)rdquo
137
Table 92 State wise Physical and Financial Targets amp Achievements during 2007-08
State 2007-08
Physical (ha) Financial (Rs in lakh) T A A T A A
AP 46385 114846 24759 574776 1455942 25331 Bihar - 229 - - 2617 - Chhattisgarh 10063 2083074 20701 78339 175098 22351 Gujarat 45155 430371 9531 73496 492741 6704 Haryana 7215 778499 1079 60419 50811 8409 Karnataka 535177 62939 1176 68645 759797 11068 Maharashtra 103672 82224 7931 1389734 1279207 9205 Odisha 1032 306948 29743 1084 10127 9342 Rajasthan 44707 73735 16493 234114 2908 12421 Sikkim - - - - - - Tamil Nadu 12302 781957 6356 2200 155991 709 UP - 4659 - - 56217 - Uttarakhand - NA - - NA - Grand Total 3240487 4211739 12997 3989632 4729348 11854
Source Ministry of Agriculture Note T- Target A- Achievement
Table 93 State wise Physical and Financial Targets amp Achievements during 2008-09
State 2008-09
Physical (ha) Financial (Rs in lakh) T A A T A A
AP 85209 123581 14503 972731 1083556 11139 Bihar - 313 - - 2153 - Chhattisgarh 13633 3057361 22426 95445 206025 21586 Gujarat 33563 53427 15918 489861 739585 15098 Haryana 32404 2230169 6882 120728 127771 10583 Karnataka 84167 926223 11005 731866 584508 7987 Maharashtra 128758 100410 7798 1474806 1344402 9116 Odisha 3752 249553 6651 33794 29278 8664 Rajasthan 40231 77729 19321 238231 300915 12631 Sikkim - - - - - - Tamil Nadu - 1159735 - - 236721 - UP 1378 128748 9343 150 23512 15675 Uttarakhand - - - - - - Grand Total 423095 516338 12204 4172462 4678426 11213
Source Ministry of Agriculture Note T- Target A- Achievement
Impact Evaluation Study on ldquoNational Mission on Micro Irrigation (NMMI)rdquo
138
Table 94 State wise Physical and Financial Targets amp Achievements during 2009-10
State 2009-10
Physical (ha) Financial (Rs in lakh) T A A T A A
AP 114453 138341 12087 143107 178287 12458 Bihar NA 10748 - NA 1083 - Chhattisgarh 17636 1577119 8943 125198 119345 9533 Gujarat 33326 662491 19879 444727 542648 12202 Haryana 1576 325767 20670 21169 38539 18205 Karnataka 81311 10820517 13308 63813 868532 13611 Maharashtra 84673 94507 11161 1070708 1322628 12353 Odisha 7578 12776 16859 5284 87116 16487 Rajasthan 85211 95556 11214 569315 607335 10668 Sikkim - - - - - - Tamil Nadu - 1800803 - - 25583 - UP - 197413 - - 38114 - Uttarakhand - - - - - - Grand Total 425764 55475277 13030 4353157 5664040 13011
Source Ministry of Agriculture Note T- Target A- Achievement
Table 95 State wise Physical and Financial Targets amp Achievements during 2010-11
State 2010-11
Physical (ha) Financial (Rs in lakh) T A A T A A
AP 165500 122758 7417 24000 24000 100 Bihar - 1348504 - - 82588 NA Chhattisgarh 28780 2183093 7585 1019 1801 17674 Gujarat 80338 78294 9746 12000 1200002 100 Haryana 4426 93402 21103 136081 140227 10305 Karnataka 72700 87447 12028 9254 894525 9666 Maharashtra 11802508 11802508 100 22237 2226538 10013 Odisha 934092 1201396 12862 810 69682 8603 Rajasthan 148000 147613 9974 12000 11620 9683 Sikkim - - - - - - Tamil Nadu 35000 2615316 7472 6591 779718 1183 UP 5590 3108632 5561 8123 383 4715 Uttarakhand - - - - - - Grand Total 667700 640069 9586 9008411 917368 10183
Source Ministry of Agriculture Note T- Target A- Achievement
Impact Evaluation Study on ldquoNational Mission on Micro Irrigation (NMMI)rdquo
139
Table 96 State wise Physical and Financial Targets amp Achievements during 2011-12
State 2011-12
Physical (ha) Financial (Rs in lakh) T A A T A A
AP 88951 105063 11811 28720 28720 10000 Bihar 1961 2329428 118788 450 216683 48152 Chhattisgarh 17174 1839363 10710 3500 3500 10000 Gujarat 130294 6510182 4997 16664 1669505 10019 Haryana 6118 578608 9457 1993 166661 8362 Karnataka 63169 58013 9184 10965 9165 8358 Maharashtra 271935 11599894 4266 24980 24980 10000 Odisha 11523 1183659 10272 823 89288 10849 Rajasthan 107072 122183 11411 13095 128239 9793 Sikkim - 50969 - 400 400 10000 Tamil Nadu - 2755054 - 6625 6625 10000 UP - 379086 - - 44088 - Uttarakhand - NA - 75 - - Grand Total 698197 55752143 7985 108290 10807615 9980
Source Ministry of Agriculture Note T- Target A- Achievement
Table 97 State wise Physical and Financial Targets amp Achievements during 2012-13
State 2012-13 (March 13)
Physical (ha) Financial (Rs in lakh) T A A T A A
AP 131685 76065 5776 2899332 270209 9320 Bihar 50571 41372 8181 5200 5340 10269 Chhattisgarh 19118 14017 7332 3172 26778 8442 Gujarat 103381 96232 9308 18200 18201 10001 Haryana 9277 6538 7048 3000 257105 8570 Karnataka 107127 88605 8271 14065 1512195 10751 Maharashtra 127751 76620 5998 15018 15221 10135 Odisha 17516 19605 11193 2000 168953 8448 Rajasthan 98400 78535 7981 11000 1034708 9406 Sikkim 392 - - 200 - - Tamil Nadu 37320 26538 7111 8300 13235 15946 UP 11245 2143 1906 595 393 6605 Uttarakhand 1005 215 2139 150 70 4667 Grand Total 714788 526485 7366 10989332 11188831 10182
Impact Evaluation Study on ldquoNational Mission on Micro Irrigation (NMMI)rdquo
140
Annexure III Questionnaires
Beneficiary Farmerrsquos Questionnaire
1 General information Name of Farmer ( कसान का नाम) ----------------------------------------- Age (उ ) ------ Yrs
Village (गाव) ---------------------------------Block( लॉक)---------------------------------------------
District(िजला)------------------------------------State(रा य (---------------------------------------- Contact No (Mob)----------------------------- Landline (with STD code) -------- ------------------- E-mail id-----------------------------------------------------------------------------------------------------
2 Education status ( श ा क ि थ त)
1 Not educated(अ श त) 2 Primary( ाथ मक) 3 High school (हाई कल) 4 Sr Secondary (व र ठमा य मक) 5Graduate and above( नातकऔरऊपर)
3 Gender ( लग) - 1 Male(प ष) 2 Female (म हला)
4 Categories of farmers( कसान का जा त वग) - 1Gen(सामा य)2 OBC (अ य पछड़ा वग) 3 ST (अनस चत जनजा त) 4 SC)अनस चत जा त)
5 Land holding (भ म धारण) 1 Own land ( वयक )helliphelliphellip Acre 2 Leased in ( कराए
ल )helliphellip Acre 3Leased out ( कराय द )helliphellip Acre
6 Land holding Category of farmers (Tick ()) 1 Marginal (सीमा त)(lt 25 Acre) 2Small (छोट) (25-5 Acre) 3 Semi medium (अध - म यम )
(5-10 Acre) 4Medium (म यम) (10-25 Acre) 5 Large(बड़) (ge25Acre)
7 When the MI system was installed MI उपकरण कब लगाया गया------------------ (DDMMYY) ------ Yr
8 How did you get to know about the MI schemeआपको स म सचाई योजना कबार म
जानकार कस ह ई
Other Farmers
Advertisements व ापन Extension worker
Supplier
Any other (Specify) Radio Newspaper TV Pamphlet
Code 1 2 3 4 5 6 7 8
Impact Evaluation Study on ldquoNational Mission on Micro Irrigation (NMMI)rdquo
141
9 Which crops do you grow (आप कौन सी फसल पदा करत ह) S No
Crops फसल Name of the crop फसलकानाम
Spacing (mxm) अतराल
Area Covered (Acre)
Area Covered under MI(Acre)
Drip Sprinkler
1 Horticultural बागवानी
a Fruits फल
Veg सि जया
Flowerफल
Othersअ य
2 Non-Horticultural a b
Total Area (Acre)
10 Plantcrop management techniques used या आपन कोई फसल बधन क तकनीक इ तमाल
क ह a 1-Yes 2-No if yes then
b Area utilization (Acre)जमीन का उपयोग S No Land Before NMMI After NMMI
1 Agriculture a Horticulture crops b Field crops
2 Permanent waste Barren बजर एव अनपयोगी जमीन
3 Total Area (Acre)
8 Introduction of new crops amp spacing followed due to MI अपनाई गयी नयी फसल और
अ तराल S No Crop Spacing (mxm) 1 2
9 Irrigation Water Detailsपानी का ववरण
a Source ोत Bore well Canals Farm Ponds Water body Any other Code 1 2 3 4 helliphelliphelliphelliphelliphelliphelliphelliphelliphelliphelliphelliphelliphelliphelliphelliphelliphelliphelliphellip
b Water table helliphelliphelliphellipFt
SNo Intercropping before MI MI क पहल अतर फसल (Crops)
Intercropping after MI MI क बाद अतर फसल (Crops)
Crop Spacing (mxm) Crop Spacing (mxm) 1
2
3
Impact Evaluation Study on ldquoNational Mission on Micro Irrigation (NMMI)rdquo
142
10 Quality ofsoiland Irrigation water मटट और सचाई क पानी क गणव ता
Have you got soil amp water tested 1-yes 2-No if yes then S No Soil quality Response S No Water quality Response
i pH i pH ii EC iii EC
11 Why did you adopt NMMI schemeआप न इस योजना को य अपनाया Code Reasons Code Reasons 1 Because of subsidyअनदान क कारण 2 Quality of produceउ पाद क गणव ता 3 Water savingपानी क बचत 4 Proper utilization of land
जमीन का ठ उपयोग 5 Labor savingमजदर क बचत 6 Time savingसमय क बचत 7 Fertilizer savingउवरक क बचत 8 Early fruitingज द फलन 9 More productionअ धक उ पादन 10 Other specify_______________________
12 Impact of MI SNo Particulars Units Before MI After MI
a Irrigated Area स चत Acre
b Cost of irrigation सचाई क लागत RsAcre
c Electricity used बजल काउपयोग Hrsday
d Fertilizer usedउवरकोकाउपयोग KgAcre
e Productivity
b Fruits फल QtlsAcre
c Veg सि जया QtlsAcre
d Flowerफल QtlsAcre
e Othersअ य QtlsAcre
Non-Horticultural QtlsAcre f Incomeआय RsAcre
13 Have you got training of MI system या आपको NMMI योजना का श ण मला ह1-yes 2-No If Yes then
i By whom you got training of MI system Agencies SAUs
KVKs State Govt agencies
Kisan call centers
PFDC System supplier Others(Specify)
Code 1 2 3 4 5 6
ii Training Details (Duration (अव ध)helliphelliphellipDays)
S No Particulars 1-Yes 2-No 1 Is training material provided या श ण साम ी द जातीह
Impact Evaluation Study on ldquoNational Mission on Micro Irrigation (NMMI)rdquo
143
SAU= State Agricultural University PFDC= Precision Farming Development Centre iii Promotional activities
Awareness descriptionजाग कताकावणन 1-Yes 2-No
a Publicity of the MI Scheme in local language
इस योजना का चार थानीय भाषा म होता ह
b Whether there is a dedicated website for MI Scheme in the State
या आप क रा य म इस योजना को सम पत कोई वबसाईट ह
c Whether online applications are received
या आप क रा य म ऑनलाइन अिजया ल जाती ह
d Are you aware about package of practices being adopted for MI
या आप स म सचाई क इ तमाल करन क काय णाल को समझत ह
14 Subsidy Detailsअनदान का ववरण i
Financial assistanceआ थक सहायता
Govt () Beneficiary लाभाि वत()
Total system cost (Rs)उपकरण क लागत
Drip
Sprinkler
ii Time taken in subsidy disbursement (Days) अनदा नत राशी मलन म लगा समय ( दन म) i Application to Sanction -helliphelliphelliphelliphellipdays
ii Sanction to Installation -helliphelliphelliphelliphellipdays
2 Topic covered in the training श ण
क म
i Operation of the systemउपकरण क काय णाल
ii Maintenance of the systemउपकरण का रखरखाव
iii Package of practices for the cropsफसल क उगान क प त
iv Opportunities for Introduction of new crop नयी फसल क प रचय क ग जाइश
v Other related schemesकोई अ य स ब धत योजना
3 Have you joined any field visit या कसी खत का मआइना कया ह
4 Are you satisfied with the Learning या आपको मल पर श ण स आप सत ठ ह
Impact Evaluation Study on ldquoNational Mission on Micro Irrigation (NMMI)rdquo
144
15 Finance a Source of beneficiary share of MIलाभाि वत क ह स का ोत
1Own sources
2Banks Namehelliphelliphelliphelliphelliphelliphellip
3KCC 4Money lenders
5Any other helliphelliphelliphelliphelliphelliphelliphelliphelliphelliphelliphelliphelliphelliphelliphellip
b Rate of Interest (if money borrowed then) याज क दर (उधार लन क ि थ त म)
16 Availability of electricity बजल क उपल धता helliphelliphelliphellipHrs day
17 Power of the pump set you are using प प सट क मताhelliphelliphelliphellipHP
18 Type of fertilizer used by the farmer उपयोग म लए गए उवरक का कार
i 1 Organic 2 Inorganic 3 Both ii 1 Liquid 2Water soluble 3Solid
19 Type of Irrigation Filters used by the farmers कसान वारा इ तमाल कय जान वाल सचाई फ टर क कार
Type of Filters फ टर क कार Code
Hydro-cyclone Filterहाइ ो-साय लोन फ़ टर 1
Screen filters न फ़ टर 2
Sand Media Filtersसड मी डया फ़ टर 3
Disc Filters ड क फ़ टर 4
Any other specifyअ य ( वशष ववरण)_________________________________________
20 Employment opportunities(रोजगार क अवसर) S No Particular No of man days
before NMMI No of man days after NMMI
1 Pre harvest practices कटाई क पहल क या
2 Harvesting कटाई
3 Post-harvest handling कटाई क बाद क या
Interest rate याज दर 3-7 7-10 10-12 12-15 gt15
Code 1 2 3 4 5
Impact Evaluation Study on ldquoNational Mission on Micro Irrigation (NMMI)rdquo
145
21 Assessment of System Design णाल का आकलन
Particulars 1-Yes2-No
a Whether various system components supplied to you are as per the BIS
या आपको दए गए उपकरण क सभी ह स BISमानक क अन प ह
b Whether pump size is proper to the field plot size wrt crop water requirements
या आपक वारा लगाय गए पप का आकार आप क खत क आकार और उसम बोई गयी फसल एव उपल ध पानी क अन प ह
c Does this MI system meet your requirements
या यह MI उपकरण आपक ज रत को परा करता ह
d Is this design layout is as per your project proposal
या इस उपकरण का खाका आप क ताव क अन प ह
e Whether after sales service has been received by you from the MI system suppliers या आपको उपकरण उपल ध करान वाल न उपकरण बचन क बाद कोई सवा दान क ह
f Whether the MI systems were found to be functional in the field
या MI उपकरण खत म सचा प स काम कर रहा ह
22 System supplier
i BrandManufacturer of MI equipment usedउपकरण का नमाताhelliphelliphelliphelliphelliphelliphelliphelliphelliphelliphelliphelliphelliphelliphelliphelliphelliphelliphelliphelliphelliphelliphelliphelliphelliphelliphelliphelliphelliphelliphelliphelliphelliphelliphelliphelliphellip
ii Reasons for buying from them उनस खर दन का कारण Local Govt official Other farmers company reps Advertisements
Code 1 2 3 4
iii After sales services ब क बाद द जान वाल सवाए
Impact Evaluation Study on ldquoNational Mission on Micro Irrigation (NMMI)rdquo
146
i Is it provided by the vendor व ता वारा द जाती ह 1-Yes2-No if yes then
ii Level of satisfaction of the serviceसवा स सत ठ का तर
iii Warranty 1-Yes2-No if yes thenवारट य द ह तो
lt6 Months 1 Yr 1-2 Yr 2-3 Yr gt3 Yr Code 1 2 3 4 5
23 Difficulty faced by the farmer in NMMI
schemeNMMIयोजनाकोअपनानमउठाईगयीपरशा नया S No Particulars 1-Yes 2-No 1 Procedure related या स स ब धत
2 Quality issuesगणव ता स स ब धत
3 Higher prices charged under scheme of the system then available in marketउपकरण क बाज़ार भाव स अ धक क़ मत
4 Delay in system supply (Committed date vs Actual date ) उपकरण क आप त म दर
5 Other charges (Not covered in the scheme additional money paid) अ त र त भगतान
6 After sale services are not up to the mark बचन क बाद द गयी सवाए सतोषजनक नह
7 Other specify__________________________________________________________
24 Would you like to recommend this scheme to others या आप इस योजना को अपनान क
सलाह अ य को दग 1-Yes 2-No
Share your experiencesअपना अनभव बताए helliphelliphelliphelliphelliphelliphelliphelliphelliphelliphelliphelliphelliphelliphelliphelliphelliphelliphelliphelliphelliphelliphelliphelliphelliphelliphelliphelliphelliphelliphelliphelliphelliphelliphelliphelliphelliphelliphelliphellip helliphelliphelliphelliphelliphelliphelliphelliphelliphelliphelliphelliphelliphelliphelliphelliphelliphelliphelliphelliphelliphelliphelliphelliphelliphelliphelliphelliphelliphelliphelliphelliphelliphelliphelliphelliphelliphelliphelliphellip
1timely 2 Late 3 Irregular
1Satisfied 2 Not satisfied 3 Indifferent
Impact Evaluation Study on ldquoNational Mission on Micro Irrigation (NMMI)rdquo
147
25 Any other socio economic benefits you would like to mention कोई अ य सामिजक- आ थक लाभ i helliphelliphelliphelliphelliphelliphelliphelliphelliphelliphelliphelliphelliphelliphelliphelliphelliphelliphelliphelliphelliphelliphelliphelliphelliphelliphelliphelliphelliphelliphelliphelliphelliphellip
ii helliphelliphelliphelliphelliphelliphelliphelliphelliphelliphelliphelliphelliphelliphelliphelliphelliphelliphelliphelliphelliphelliphelliphelliphelliphelliphelliphelliphelliphelliphelliphelliphellip 26 Any suggestion for the better implementation of NMMI Scheme
NMMI योजना को सह तर क स लाग करन क लए आप क या सझाव ह
i helliphelliphelliphelliphelliphelliphelliphelliphelliphelliphelliphelliphelliphelliphelliphelliphelliphelliphelliphelliphelliphelliphelliphelliphelliphelliphelliphelliphelliphelliphelliphelliphelliphelliphellip ii helliphelliphelliphelliphelliphelliphelliphelliphelliphelliphelliphelliphelliphelliphelliphelliphelliphelliphelliphelliphelliphelliphelliphelliphelliphelliphelliphelliphelliphelliphelliphelliphellip
iii helliphelliphelliphelliphelliphelliphelliphelliphelliphelliphelliphelliphelliphelliphelliphelliphelliphelliphelliphelliphelliphelliphelliphelliphelliphelliphelliphelliphelliphelliphelliphelliphelliphelliphellip
27 Whether MI System is installed in the entire land holding Yes No 28 Any MI demonstration nearby (Yes No) 29 Type of Sprinkle (1-Portable 2-semi-permanent 3-rain gun) 30 Type of Drip (1-Inline 2-online) 31 Observations of the investigator
Condition of the MI System at the time of visit (1-Functional 2-Not Functional)
i Overall design (1-Good 2-Satisfactory 3-Bad) ii General condition of the field (1-Good condition 2-Average condition 3- Bad
condition) iii Whether Farmers are using flood irrigation along with MI system (1-Yes 2-No) iv Whether choice of drip sprinkler MI system match with the crop requirement
(1-Yes 2-No) Signature of farmer Investigatorrsquos Name कसान का ह ता र जाचकता का ह ता र
Date दनाक
Impact Evaluation Study on ldquoNational Mission on Micro Irrigation (NMMI)rdquo
148
Non-beneficiary Farmerrsquos Questionnaire)
1 General information Name of Farmer ( कसान का नाम) ----------------------------------------- Age (उ ) --------- Yrs
Village (गाव) ---------------------------------- Block( लॉक)--------------------------------------------
District(िजला)------------------------------------State(रा य----------------------------------------- Contact No (Mob)----------------------------- Landline (with STD code) -------- ------------------- E-mail id------------------------------------------------------------------------------------------------------
2 Education status ( श ा क ि थ त)
1 Not educated(अ श त) 2 Primary( ाथ मक( 3 High school (हाई कल) 4 Sr Secondary (व र ठमा य मक) 5Graduate and above( नातकऔरऊपर)
3 Gender ( लग) - 1 Male(प ष) 2 Female (म हला) 4 Categories of farmers( कसान का जा त वग) - 1Gen(सामा य)2 OBC (अ य पछड़ावग)
3 ST (अनस चत जनजा त) 4 SC)अनस चत जा त)
5 Land holding (भ म धारण) 1 Own land ( वयक )helliphelliphellip Acre 2 Leased in ( कराए ल )helliphellip Acre 3Leased out
( कराय द )helliphellip Acre
6 Land holding Category of farmers (Tick ()) 1 Marginal (सीमा त)(lt 25 Acre) 2Small (छोट) (25-5 Acre) 3 Semi medium (अध - म यम ) (5-10 Acre) 4Medium
(म यम) (10-25 Acre) 5 Large (बड़) (ge25Acre)
7 Are you aware about the NMMI scheme याआप NMMI योजना क बार म जानत ह 1-Yes 2-No
If Yes then how did you get to know about the MI scheme आप को स म सचाई योजना क बार म जानकार कस ह ई
Other Farmers
Advertisements व ापन Extension worker
Supplier Any other (Specify)
Radio Newspaper TV Pamphlet Code 8 9 10 11 12 13 14 8
8 Which crops do you grow (आप कौन सी फसल पदा करत ह)
S No Crops फसल Name of the crop फसल का नाम Spacing(mxm) Area Covered (Ha)
3 Horticultural बागवानी
f Fruits फल
g Veg सि जया
h Flowerफल
i Others अ य
4 Non-Horticultural a b
Total Area (Ha)
a Area utilization(Acre)जमीन का उपयोग S No Land Response 4 Agriculture c Horticulture crops
d Field crops 5 Permanent waste Barren बजर एव अनपयोगी जमीन
Impact Evaluation Study on ldquoNational Mission on Micro Irrigation (NMMI)rdquo
149
6 Total Area (Acre)
10 Irrigation Water Detailsपानीका ववरण
a Source ोत Bore well Canals Farm Ponds Water body Any other Code 5 6 7 8 helliphelliphelliphelliphelliphelliphelliphelliphelliphelliphelliphelliphelliphelliphelliphelliphelliphelliphelliphellip
b Water table helliphelliphelliphellipFt
11 Why did you not taken advantage of NMMI scheme आपन NMMIयोजनाकालाभ य नह लया
Code Reasons Code Reasons 11 Less aware of subsidy
अनदान क बार म अन भ 12 Less technical knowledge
तक नक ान नह 13 Lengthy procedureल बी या 14 High capital cost involvedअ धक लागत 15 Not economicalआ थक नह 16 EmittersrsquoNozzlesrsquo frequent clogging
ट ट का बार बार अव होना 17 Application yet not cleared अभीअज पास नह ह यी
18 Any other Specify________________________ ____________________________
12 Have you participated in any training program of NMMI याआपको NMMI योजनाका श ण मला ह1-Yes 2-No If Yes then
a By whom you got training of MI system
Agencies SAUs KVKs
State Govt agencies
Kisan call centers
PFDC System supplier Others(Specify)
Code 1 2 3 4 5 6
b Training Details (Duration (अव ध)helliphelliphellipDays)
SAU= State Agricultural University PFDC= Precision Farming Development Centre
c Promotional activities
Awareness descriptionजाग कता का वणन 1-Yes 2-No
e Publicity of the MI Scheme in local language इस योजना का चार थानीय भाषा म होता ह
f Whether there is a dedicated website for MI Scheme in the State
S No Particulars 1-Yes 2-No 5 Is training material provided या श ण साम ी द जाती ह
6 Topic covered in the training श ण क
म
vi Operation of the systemउपकरण क काय णाल
vii Maintenance of the systemउपकरण का रखरखाव
viii Package of practices for the cropsफसल क उगान क प त
ix Opportunities for Introduction of new crop नयी फसल क प रचय क ग जाइश
x Other related schemesकोई अ य स ब धत योजना
7 Have you joined any field visit या कसी खत का मआइना कया ह
8 Are you satisfied with the Learning या आपको मल पर श ण स आप सत ठ ह
Impact Evaluation Study on ldquoNational Mission on Micro Irrigation (NMMI)rdquo
150
या आपक रा य म इस योजना को सम पत कोई वबसाईट ह g Whether online applications are received
या आप क रा य म ऑनलाइन अिजया ल जाती ह
h Are you aware about package of practices being adopted for MI या आप स म सचाई क इ तमाल करन क काय णाल को समझत ह
13 Availability of electricity बजल क उपल धता helliphelliphelliphellipHrs day
14 Type of fertilizer used by the farmer उपयोग म लए गए उवरक का कार a 1 Organic 2 Inorganic 3 Both b 1 Liquid 2Water soluble 3Solid
15 Difficulty faced by the farmer in NMMI scheme NMMIयोजना को अपनान म उठाई गयी परशा नया S No Particulars 1-Yes 2-No 8 Procedure related या स स ब धत
9 Quality issuesगणव ता स स ब धत
10 Higher prices charged under scheme of the system then available in marketउपकरण क बाज़ार भाव सअ धक क़ मत
11 Delay in system supply (Committed date vs Actual date ) उपकरण क आप त म दर
12 Other charges (Not covered in the scheme additional money paid) अ त र त भगतान
13 After sale services are not up to the mark बचन क बाद द गयी सवाए सतोषजनक नह
14 Other specify__________________________________________________________
16 Do you like to adopt this scheme in near future या आप इस योजना को भ व य म अपनाना चाहग 1-Yes 2-No Why helliphelliphelliphelliphelliphelliphelliphelliphelliphelliphelliphelliphelliphelliphelliphelliphelliphelliphelliphelliphelliphelliphelliphelliphelliphelliphelliphelliphelliphelliphelliphelliphelliphelliphelliphelliphelliphelliphelliphelliphelliphelliphelliphellip helliphelliphelliphelliphelliphelliphelliphelliphelliphelliphelliphelliphelliphelliphelliphelliphelliphelliphelliphelliphelliphelliphelliphelliphelliphelliphelliphelliphelliphelliphelliphelliphelliphelliphelliphelliphelliphelliphelliphelliphelliphelliphelliphellip
17 Would you like make any suggestion for the better implementation of NMMI Scheme NMMI योजना को सह तर क स लाग करन क लए आपक या सझाव ह
i helliphelliphelliphelliphelliphelliphelliphelliphelliphelliphelliphelliphelliphelliphelliphelliphelliphelliphelliphelliphelliphelliphelliphelliphelliphelliphelliphelliphelliphelliphelliphelliphelliphelliphellip ii helliphelliphelliphelliphelliphelliphelliphelliphelliphelliphelliphelliphelliphelliphelliphelliphelliphelliphelliphelliphelliphelliphelliphelliphelliphelliphelliphelliphelliphelliphelliphelliphellip
iii helliphelliphelliphelliphelliphelliphelliphelliphelliphelliphelliphelliphelliphelliphelliphelliphelliphelliphelliphelliphelliphelliphelliphelliphelliphelliphelliphelliphelliphelliphelliphelliphelliphelliphellip Signature of farmer Investigatorrsquos Name कसानकाह ता र जाचकताकाह ता र
Date दनाक
Impact Evaluation Study on ldquoNational Mission on Micro Irrigation (NMMI)rdquo
151
Annexure IV Reason of higher cost of drip in Gujarat During the survey in 13 states 5892 sampled farmers holding 1481058 hectares of land were interacted Analysis of data reveals that average unit cost of drip irrigation system ranges between from 5445736 Rsha to 7208631 Rsha The average cost of drip system installation was found to be highest in Gujarat followed by Chhattisgarh Tamil Nadu Maharashtra Sikkim UP Karnataka Rajasthan Andhra Pradesh Haryana Bihar and Odisha Analysis was carried out to find out reasons for higher average unit cost of drip irrigation system in Gujarat as compared to other States Following reason are given in support
I The per cent of area coverage under sprinkler irrigation system in Gujarat is 1169 and in other states it is 8830 per cent The average cost of sprinkler irrigation system is Rs 18000 ha against Rs 55000 Rsha of drip irrigation system
II The more per cent of area coverage under drip irrigation system in Gujarat lead to higher average cost
III Figure- 1 shows area coverage under 0-10 m2 spacing it could be seen from the figure that Gujarat is far ahead from other states in term of area coverage in close spacing crops When area covered under other spaced crops is compared UP stand at 1st position in term of area coverage under wide space crops and Gujarat cover very least as can be seen from figure1
Figure 15 Area coverage under close spacing crops (spacing range lt10 m2)
Impact Evaluation Study on ldquoNational Mission on Micro Irrigation (NMMI)rdquo
152
IV When compared average unit cost per ha of drip irrigation system as per NMMI guideline the average unit cost in closed spacing crops (0-10 m2) stand at 264 times higher than the average unit cost of wide spacing crops (Spacing range more than 10 m2)
Figure 17 Spacing wise unit cost (Rsha) of drip irrigation system as per NMMI guideline
Figure 16 Area coverage under wide spacing crops (spacing range more than spacing range 10 m2
Impact Evaluation Study on ldquoNational Mission on Micro Irrigation (NMMI)rdquo
153
It is also pertinent to mention that financial assistant for installation of drip system in Gujarat is given at actual unit cost rather than as recommended in NMMI guideline which is being adopted in all states other than Gujarat In Gujarat the additional amount is given by state exchequer which escalates invoice value resulting in higher average cost
Impact Evaluation Study on ldquoNational Mission on Micro Irrigation (NMMI)rdquo
154

i
PREFACE
The growing need for food security and increased population has resulted in higher demand for irrigation water which could only be met by judicious use of available water resources The Government therefore launched a Centrally Sponsored Scheme on Micro Irrigation in January 2006 with the an objective to increase the area under improved methods of irrigation for better water use efficiency to provide stimulus to agricultural growth The scheme was further upscaled into Mission Mode in 2010 as the National Mission on Micro Irrigation (NMMI) The Mission has now completed almost 8 years and has made significant progress in achieving its objectives The Department of Agricultural and Cooperation in association with National Committee on Plasticulture Applications in Horticulture (NCPAH) therefore selected Ms Global AgriSystem Pvt Ltd to undertake the Impact Evaluation Study in 13 selected States The study was carried out in 64 districts of the country and more than 7400 beneficiaries and non-beneficiaries were interviewed The study reveals that the scheme has benefitted the farmers in term of enhanced productivity and reduced cost on electricity and fertilizers The average productivity of fruits and vegetables has increased about 4230 percent and 5280 percent respectively Besides the Scheme has also succeeded in reducing the irrigation cost which was found to have been reduced by 20-50 percent with average of 3230 percent Use of micro irrigation system has also helped the farmers in cutting down the electrical consumption which was found to have been reduced by about 31 percent Successful implementation of the Scheme has also led to average reduction in fertilizer usage with average reduction of about 28 percent in total fertilizer consumption in the surveyed states The study received continuous support and encouragement from Mr Sanjeev Chopra Joint Secretary amp Mission Director (MIDH) MoA Government of India and I extend my heartfelt thanks to Mr Chopra for his continuous support and guidance in preparing this report We gratefully extend our appreciation to Mr Krish S Iyengar Executive Director and Mr Naresh Modi Mr Alok Mishra Mr Rohit Lall of the National Committee of Plasticulture Application in Horticulture (NCPAH) for sparing their valuable time to guide us during the entire project duration We also appreciate the help provided by Mrs Sadhna Khanna under Secretary MoA GoI and Dr Jose C Samuel Chief Consultant (NHM)
ii
It would have been impossible to complete this study without the support of 7400 farmers and other stakeholders such as system suppliers financial institutions NGOs PRIs etc spread over 13 states We extend our gratitude to these farmers who deserve special appreciation for extending their willing cooperation in giving their valuable time responding to the questionnaire and share their views and concerns during the field study We also take opportunity to thank State Agriculture as well as Horticulture Department amp other stakeholders of the 13 States where the study was undertaken Members of the team have put in lots of hard work and duly deserve appreciation for carrying out the survey Prof BK Sikka Agro Economist and Prof JN Raina eminent Soil Scientist deserve our special appreciation for their guidance
If the study helps the policy makers to make this scheme more effective and useful we would feel that the effort has been worth it
Gokul Patnaik (Chairman)
i
Table of Contents Contents Executive Summary I
1 Introduction 1
11 Project Background 1
12 Salient Features of the Scheme 2
13 The Assignment 4
14 Objectives of the Study 4
2 Approach and Methodology 5
21 Approach 5
22 Methodology 6
221 Sources of Data Collection 7
222 Sampling 8
223 The Sample Design 8
224 Selection of Beneficiaries and Non-beneficiaries 9
23 Limitations of the Study 11
3 Assessment of Current Status 13
31 Performance of MI Scheme 13
32 State wise Performance 15
33 Targets and Achievements 15
34 Performance of Scheme for Area Coverage as Compared to Potential 21
35 Pattern of Assistance 22
351 Indicative Cost of Installing Micro Irrigation System 22
352 State-wise Pattern of Assistance 23
353 Quantum of Subsidy and Adoption of MI System by Farmers 24
354 State Implementing Agencies 25
355 Extent of Convergence with Other Schemes 26
356 Food Security and the Micro Irrigation Scheme 27
36 Mission Structure Review 29
361 National Level 29
362 State Level Micro Irrigation Committee (SMIC) 30
ii
363 District Level Micro Irrigation Committee (DMIC) 33
364 Improving Efficacy of the Institutional Mechanism 34
37 Role of Panchayati Raj Institutions (PRIs) in NMMI Scheme 35
4 Primary Survey Respondentsrsquo Profile and Findings 36
41 Demographic Profile (Sampled Beneficiaries amp Non-beneficiaries) 36
411 Size of Land Holding 36
412 Categories of Farmers 38
413 Gender 39
414 Educational Status 39
415 Status of Communication Facilities 41
42 Results and Discussions 42
421 Quality of soil and irrigation water 42
422 Sources of Irrigation 44
423 Water Table 45
424 Sources of Awareness about NMMI Scheme 46
425 Reasons for Non-adoption of Micro Irrigation Systems 48
426 Willingness of Non Beneficiaries to Adopt MI System 49
427 Progress of Installation of MI System 50
428 Average Cost of Installing the MI System 50
429 Factors Influencing Farmers to Adopt MI system 51
4210 Subsidy Disbursement 52
4211 Sources of Margin Money 53
4212 Interest Rates on Borrowing 53
4213 Type of MI system and Area Coverage 54
4214 System Demonstration 64
4215 Training and Capacity Building 64
4216 Availability of Electricity 68
4217 Capacity of Pump Sets 69
4218 Irrigation Filters 69
4219 Type of Emitters in drip system 72
4220 Type of Sprinkler 73
4221 Farmersrsquo opinion on System Supply and Installation related constraints 74
4222 After Sales Service 75
iii
4223 Warranty 77
4224 Promotional Activities 78
43 Observations of Field Staff on MI System 79
44 Assessment of the System Design 80
45 System Suppliers 82
5 Impact Evaluation 87
51 Crop Diversification 87
52 Area Expansion under Micro Irrigation 89
53 Increase in Irrigated Area due to Water Saving 89
54 Development of marginal and wasteland by beneficiaries 90
55 Dripper spacing 91
56 Reduction in Cost of Irrigation 94
57 Electricity Consumption 94
58 Economy in Fertilizer Use 95
59 Increase in Crop Productivity 96
510 Reduction in these Cost of Inputs of Irrigation amp Productivity Enhancement Crop-wise 98
511 Introduction of New Crops 102
512 Increase in Farmerrsquos Income 104
513 Benefit-Cost Ratio 105
514 Increase in Area 108
515 Potential area that can be brought under Micro Irrigation 109
516 Employment Opportunities 110
5161 On Farm Employment Generation 111
5162 Off-Farm Employment Generation 111
517 Impact on Employment 111
6 Conclusions amp Recommendations 113
References 125
Appendices 127
iv
Annexure I Processes of Implementation 127
Annexure II State wise Physical amp Financial Targets amp Achievements 136
Annexure III Questionnaires 140
List of Tables
Table 1 Methodology Adopted for Impact Assessment 6 Table 2Sampling Plan 8 Table 3 State wise List of Sampled Districts Covered in the Study 9 Table 4 State wise Sample Distribution for the Study 10 Table 5 Year wise Area under Different MI Systems of Sampled Beneficiaries 14 Table 6 Comparison of Subsidy between Pre and Post NMMI Scheme 14 Table 7 State wise Cumulative Physical amp Financial Targets and Achievements 16 Table 8 Year wise Cumulative Physical and Financial Targets and Achievements 17 Table 9 Year amp State wise Physical Targets and Achievements (lsquo000rsquo ha) 19 Table 10 Year and State wise Financial Targets and Achievements (Rs Crores) 20 Table 11 Potential and Actual area under Drip amp Sprinkler Irrigation 21 Table 12 State wise Quantum of Subsidy to Different Categories of Farmers 23 Table 13 State wise Quantum of Subsidy and Area Coverage 24 Table 14 State-Implementing Agencies for NMMI 25 Table 15 Performance of the Functioning of SMICs in Sampled States 32 Table 16 Performance of the Functioning of DMICs in Sampled States 34 Table 17 Land Holding Status of Beneficiary and Non Beneficiary Farmers 37 Table 18 Size and Distribution of Operational Holdings 38 Table 19 Category wise Proportion of Beneficiary and Non Beneficiary Farmers 38 Table 20 Gender Status of Beneficiaries and Non Beneficiaries 39 Table 21 Education Status of Beneficiaries and Non-beneficiaries 40 Table 22 Mobile Phone Ownership 41 Table 23 Extent of Soil Salinity (in sampled states) and Beneficiaryrsquos Responses on Soil and Water
Testing 43 Table 24 Extent of Awareness about Important Soil and Water Quality Parameters 44 Table 25 Source of Irrigation Water 45 Table 26 State wise Water Table Depth 45 Table 27 Sources of Awareness Reported by Beneficiaries () 47 Table 28 Source of Awareness of Scheme Reported by Non-beneficiary () 48 Table 29 Reasons for Non-adoption of NMMI Scheme () 49 Table 30 Willingness of Non-beneficiaries to Install MI System 49 Table 31 Year of Installation of MI System () 50 Table 32 Average Cost of Installing MI System (Rsha) 50 Table 33 Reasons for Adoption of Micro Irrigation Systems 51 Table 34 Farmerrsquos Responses for Time Taken to Sanction Subsidy () 52 Table 35 Source of Finance for Meeting Beneficiary Share for Installation of MI System 53 Table 36 Rate of Interest Paid by the Beneficiaries on Borrowed Funds 54 Table 37 Proportion of Farmers having Drip and Sprinkler MI Systems 54 Table 38 Drip amp Sprinkler System wise Area Coverage by Sampled Beneficiaries 55 Table 39 Crop wise Area Coverage under Drip and Sprinkler Systems in AP (Sampled Beneficiaries) 56
v
Table 40 Crop wise Area Coverage under Drip and Sprinkler Systems in Bihar (Sampled Beneficiaries) 56
Table 41 Crop wise Area Coverage under Drip and Sprinkler Systems in Chhattisgarh (Sampled Beneficiaries) 57
Table 42 Crop wise Area Coverage under Drip and Sprinkler Systems in Gujarat (Sampled Beneficiaries) 58
Table 43 Crop wise Area Coverage under Drip and Sprinkler Systems in Haryana (Sampled Beneficiaries) 58
Table 44 Crop wise Area Coverage under Drip and Sprinkler Systems in Karnataka (Sampled Beneficiaries) 59
Table 45 Crop wise Area Coverage under Drip and Sprinkler Systems in Maharashtra (Sampled Beneficiaries) 59
Table 46 Crop wise Area Coverage under Drip and Sprinkler Systems in Odisha (Sampled Beneficiaries) 60
Table 47 Crop wise area Coverage under Drip and Sprinkler Systems in Rajasthan (Sampled Beneficiaries) 61
Table 48 Crop wise Area Coverage under Drip and Sprinkler Systems in Sikkim (Sampled Beneficiaries) 61
Table 49 Crop wise Area Coverage under Drip and Sprinkler Systems in Tamil Nadu (Sampled Beneficiaries) 62
Table 50 Crop wise Area Coverage under Drip and Sprinkler Systems in UP (Sampled Beneficiaries) 63 Table 51 Crop wise Area Coverage under Drip and Sprinkler Systems in Uttarakhand (Sampled
Beneficiaries) 63 Table 52 Exposure of Beneficiary Farmers to MI Demonstrations 64 Table 53 Topic Covered in Training for Beneficiary Farmers 66 Table 54 Institution for Training as Reported by Respondents ( Beneficiaries) 67 Table 55 Availability of Electricity (Beneficiaries and Non Beneficiaries) 68 Table 56 Capacity of Pump Sets Used by Beneficiaries 69 Table 57 Type of Irrigation Filters Used by Farmers 71 Table 58 Type of Emitters Used by Beneficiaries 73 Table 59 Type of Sprinklers Used by Beneficiaries 74 Table 60 Constraints Faced by Beneficiary Farmers () 75 Table 61 Status Reported by Beneficiaries Regarding lsquoAfter Sales Servicesrsquo 76 Table 62 Status of Warranty for MI System () 77 Table 63 Awareness about Promotional Activities 78 Table 64 Observations of Surveyors regarding MI System Status at the Time of Field Visit 79 Table 65 Assessment of the System Design 81 Table 66 State Wise List of Registered MI System Suppliers 83 Table 67 Impact on Crop Diversification and Usage of Marginal and Degraded Land by
Beneficiaryrsquos data 88 Table 68 Increase reported by Beneficiaries in Irrigated Area (ha) after Installation of MI System 90 Table 69 Marginal Degraded Land brought under Cultivation after Installation of MI System by
Beneficiaries 91 Table 70 Spacing followed by Sampled Beneficiaries for Fruit Crops (m) 92 Table 71 Spacing followed by Sampled Beneficiaries for Vegetables Flowers and Other Crops (m) 93 Table 72 Reduction in Cost of Irrigation with MI system 94 Table 73 Reduction in Electricity Consumption 95 Table 74 Reduction in Fertilizer Consumption 96
vi
Table 75 Productivity Enhancement of Fruit Crops (MTha) 97 Table 76 Productivity Enhancement of Vegetable Crops (MTha) 97 Table 77 Crop wise Details of Reduction in Cost - Fruits 98 Table 78 Crop wise Details of Reduction in Cost - Vegetables 99 Table 79 Crop wise Details of Reduction in Cost - Flowers 101 Table 80 Crop wise Details of Reduction in Cost - Non-horticulture Crops 101 Table 81 Crops Adopted after Installation of MI System 102 Table 82 Extent of Adoption of New Crops after Installation of MI System 103 Table 83 Increase in Farmerrsquos Income 104 Table 84 Benefit Cost Ratio of MI System for Important Fruit Crops 106 Table 85 Benefit Cost Ratio of MI System for Important Vegetable Crops 107 Table 86 Benefit Cost Ratio of MI System for Important Floriculture Crops 108 Table 87 Percent Increase in Irrigated Area on Installation of MI System 108 Table 88 District wise Potential for Installation of MI System in Study Area 109 Table 89 Change in Manpower Requirement for Cultivation (per ha per crop cycle) 112 Table 90 State wise Physical and Financial Target amp Achievements during 2005-06 136 Table 91 State wise Physical and Financial Targets amp Achievements during 2006-07 136 Table 92 State wise Physical and Financial Targets amp Achievements during 2007-08 137 Table 93 State wise Physical and Financial Targets amp Achievements during 2008-09 137 Table 94 State wise Physical and Financial Targets amp Achievements during 2009-10 138 Table 95 State wise Physical and Financial Targets amp Achievements during 2010-11 138 Table 96 State wise Physical and Financial Targets amp Achievements during 2011-12 139 Table 97 State wise Physical and Financial Targets amp Achievements during 2012-13 139
List of Figures Figure 1 Percentage Annual Allocation (share in availability) of Water 1 Figure 2 States Covered for Study (Star Marked) 5 Figure 3 Physical and Financial Performance of NMMI Scheme 13 Figure 4 State wise Central Subsidy (Rs Crores) and Area Coverage (lsquo000rsquo ha) under NMMI 15 Figure 5 Year wise Targets and Achievements 17 Figure 6 State wise Cumulative Targets and Achievements (2005-06 to 2012-13) 18 Figure 7 Proportion of Area under Drip and Sprinkler Irrigation 22 Figure 8 Level of Satisfaction regarding lsquoAfter Sale Servicesrsquo 77 Figure 9 Increase in Irrigated Area () among Beneficiaries after Adoption of MI 90 Figure 10 Reduction in Fertilizer Consumption () 96 Figure 11 Extent of Adoption of New Crops by Beneficiaries () 103 Figure 12 Increase in the Income of Beneficiaries () 104 Figure 13 Subsidy Process under GGRC 130 Figure 14 Subsidy Process under APMIP 131
vii
Abbreviations Acronyms
AampC Agriculture amp Cooperation AP Andhra Pradesh APMIP Andhra Pradesh Micro Irrigation Project BIS Bureau of Indian Standards CHRBKB Chhattisgarh Rajya Beej and Krishi Vikas Ltd CIPET Central Institute of Plastic Engineering and Technology CSS Centrally Sponsored Scheme CWC Central Water Commission DMIC District Micro Irrigation Committee DoA Directorate of Agriculture DoH Directorate of Horticulture DRDA District Rural Development Agency EC Electrical Conductivity FGD Focused Group Discussion GAPL Global AgriSystem Pvt Ltd GGRC Gujarat Green Revolution Company GoI Government of India HDC Horticulture Development Society HDPE High Density Polyethylene HP Horse Power IA Implementing Agency ICT Information amp Communication Technology IEC Information Education amp Communication KGK Krishi Gyan Kendra KVK Krishi Vigyan Kendra MI Micro Irrigation MI System Micro Irrigation System Mha Million hectare Mhm Million hectare metre MIDH MoA Mission for Integrated Development Ministry of Agriculture MoWR Ministry of Water Resources NCPAH National Committee on Plasticulture Applications in Horticulture NHM National Horticulture Mission NMMI National Mission on Micro Irrigation PFDC Precision Farming Development Centre RKVY Rashtriya Krishi Vikas Yojana SAU State Agricultural University SC Scheduled Cast SMIC State Micro Irrigation Committee SPV Special Purpose Vehicle ST Scheduled Tribes ToR Terms of Reference UP Uttar Pradesh
Impact Evaluation Study of ldquoNational Mission on Micro Irrigation (NMMI)rdquo
I
Executive Summary Micro irrigation technologies (MI) are being promoted in India by the central and state governments by providing different kinds of financial institutional and technical support These technologies are promoted primarily as (1) a means to save water in irrigated agriculture (2) as a strategy to increase income and reduce poverty and (3) to enhance the food and nutritional security of rural households Despite the reported significant economic advantages and the concerted support of the government and NGOs the current area under micro irrigation in India remains an insignificant proportion of its potential Rising demand for irrigation water in the face of its inefficient use and concerns of growing water scarcity which has brought into renewed focus for conserving water and combating water scarcity including efforts in improving water use efficiency with the available water resources The real thrust on promoting MI adoption largely started with the recommendations of the Report of the Task Force on Micro Irrigation in 2004 The report sought to increase the emphasis on MI technology and recommended the Centrally Sponsored Scheme (CSS) in 2005-06 The Scheme was further upscaled into Mission Mode in 2010 to accelerate the rate of adoption of micro irrigation technologies under central sector programs
Government of India Ministry of Agriculture Department of Agriculture and Cooperation assigned the study on ldquoImpact Evaluation of National Mission on Micro Irrigation (NMMI)rdquo to access the performance of the programme implementation and access the impact of this Scheme on increase in farmersrsquo income through adoption of the MI system
The study was conducted in 13 states comprising of 64 districts in the sampled states namely Andhra Pradesh (AP) Bihar Chhattisgarh Gujarat Haryana Karnataka Maharashtra Odisha Rajasthan Tamil Nadu Sikkim Uttar Pradesh (UP) and Uttarakhand The field survey to get first-hand information was conducted for a total sample of 7400 comprising beneficiary and non-beneficiary farmers in these selected states by adopting stratifiedndashpurposive-sampling design Apart from this information was also collected from MI system suppliers and government officials under State Horticulture Mission and related departments Owing to promotional schemes introduced by the state and central governments the area under micro irrigation has increased from 11817 ha in 2005-06 to over 361
Impact Evaluation Study of ldquoNational Mission on Micro Irrigation (NMMI)rdquo
II
million ha in 2012-131 under NMMI in the country Despite having many advantages over conventional method of irrigation the area under micro-irrigation presently occupies only about 571 percent of the total potential area As per the available data only 285 percent of total irrigated area is under drip irrigation and 286 percent is under sprinkler irrigation Findings of the Study
A Current Status
i The Scheme since its inception in 2005-06 has made rapid stride across the country It has succeeded in bringing about 356 million ha area under micro irrigation in the sampled 13 states2 The physical targets for the period 2005-06 to 2012-13 were fixed to the extent of 383 million ha out of which 356 million ha has been brought under MI The Targets and achievements for financial outlay were Rs50128 and Rs50065 crores respectively The overall physical and financial achievements thus come out to be 9299 amp 9987 percent The extent of achievements however varied among different states States like Bihar Karnataka Odisha Rajasthan and Sikkim achieved more than 90 percent of the set physical and financial targets Uttarakhand could achieve only 21 percent of physical and 31 percent of the financial targets Other States such as AP Chhattisgarh Gujarat Haryana Maharashtra and Tamil Nadu succeeded to achieve more than 70 of their physical targets
ii AP Gujarat amp Maharashtra are leading states in the every aspect of performance the different activities involved in the process streamlined in the guideline of NMMI While Bihar UP Sikkim amp Uttarakhand states are lacking in terms of the functions mentioned in the guidelines
B Pattern of Assistance (subsidy)
i Most of the states are giving subsidy of more than 70 percent for installation of MI system However comparison of various states and analysis clearly demonstrates that increased subsidy had no significant impact on the increase of area coverage under MI system Farmers in
1 NCPAH 2 Ministry of Agriculture
Impact Evaluation Study of ldquoNational Mission on Micro Irrigation (NMMI)rdquo
III
Maharashtra Gujarat and Haryana were 223 140 and 100 percent respectively in case of sampled beneficiaries while pertinent subsidy component in these states was 60 50 and 90 percent respectively Similarly area coverage in Rajasthan Tamil Nadu and Bihar was noted to be 73 45 and 31 percent respectively and the corresponding figures for subsidy were 90 75 and 90 percent The aforesaid observation clearly suggests that increase in subsidy component beyond a limit has little or no impact on area coverage under MI system The relationship between area expansion under MI and quantum of subsidy has been computed considering beneficiariesrsquo data on area expansion in different states before and after adoption of MI system Hence the relationship of subsidies with area expansion as such does not refer to any specific year
ii The efficiency of scheme implementing agency is very high as most of the farmers have reported that their applications are processed and sanctioned in less than 40 days as against 60 days specified in the guidelines Similarly in most of the sample states beneficiaries are reported to be satisfied with respect to the procedure for filing the application till disbursement of the subsidy amount
iii Presently subsidy is limited to maximum area of 5 hectare per beneficiary which is an impediment to the growth of area under micro-irrigation The data on size and distribution of operational land holdings in the country also suggest that medium and large farmers accounted about 15 percent of total land holdings but occupying more than 5542 percent of the total area Therefore increase in the limit of maximum area per beneficiary would lead to combat water scarcity as well as the sustainable agriculture
iv All the states have reported convergence of Mission interventions with different schemes of the Government of India and State level programmes Most of the districts have converged NFSM and other programmes such as RKVY ICDP Farm Mechanization NHM etc
C Sources of Awareness and Reasons of Non-adoption
i The major sources of awareness about the NMMI scheme were MI system suppliers followed by fellow farmers and extension workers
Impact Evaluation Study of ldquoNational Mission on Micro Irrigation (NMMI)rdquo
IV
ii The non-beneficiaries farmers had mix responses for not adopting the scheme because of lack of awareness regarding subsidies lack of technical knowledge high capital cost and system being not economic for their crops and therefore not required
iii As per primary survey of the sampled beneficiaries about 59 percent of the respondents were small amp marginal farmers and 13 percent were women farmers who have taken the advantage of the Scheme
D System Cost and Sources of Fund
i On an average the cost of system per hectare incurred by the beneficiaries ranged between Rs 5445736 to Rs 7208631 in drip system and Rs 20481 to Rs 28171 in sprinkler irrigation system depending on the cropping pattern crop spacing etc
ii Almost in all states farmer beneficiaries use their own funds for contributing margin money (9866) Other sources albeit a small proportion constitutes banking KCC amp money lenders
iii Most of the farmers borrowed money at less than 10 percent of rate of interest from banks and KCCs
E Technical Observations about MI System
i It was observed that about 64 percent of the beneficiaries installed drip system 34 percent sprinkler system and 2 percent have installed both the systems in their fields The highest proportion of drip was observed in Karnataka because of higher proportion of area under horticulture crops whereas adoption of sprinkler was higher in Bihar because of higher proportion of area under field crops
ii The majority of the beneficiaries (about 6887) farmers of all the 13 states have got their soil and water tested In Gujarat UP Maharashtra amp Rajasthan soil testing adopted by 6927 5275 7337 and 7913 of respondents respectively
iii More than 70 percent of the respondent farmers of AP Gujarat Sikkim and Odisha were using in-line drip irrigation system whereas more than 45
Impact Evaluation Study of ldquoNational Mission on Micro Irrigation (NMMI)rdquo
V
percent beneficiaries of Haryana and Uttarakhand reported to practice on-line drip irrigation system
iv The farmers were using screen filters centrifugal separators hydro-cyclone filter disc filter sand media filters depending on the need The data reveals that screen filters are being commonly used by the beneficiaries in most of the sampled states except Haryana where more than 65 percent beneficiaries are using hydrocyclone and screen filters in combination due to the water quality as they are using canal water Moreover additional subsidy is being provided on hydrocyclone type of filters to ensure the complete removal of organic and inorganic contaminants
v The farmers in almost all the states reported that components of MI System met the BIS norms The average figure for all the sampled states where system components were as per the BIS norms came out to be around 98 percent
vi It was informed that the systems were well designed except in case of Sikkim and Odisha where the systems were functional but not able to meet the farmers expectation in totality
F After Sales Services
i On an average 91 of the beneficiaries across the sampled states reported that after sales services are being provided to them amp also they receive the services at the required time Most of the sampled beneficiaries revealed that they are getting warranty of the MI system
ii In almost all the states the sampled beneficiaries revealed that no technical support guidance on agronomic practices are extended to the users as they generally tell to take the help of extension agencies
G Impact Analysis
i The irrigated area has increased in all the surveyed states after the introduction of NMMI Scheme The Irrigated area within the 5892 sampled beneficiaries of the 13 states before adoption of MI system was found to be 1332086 ha which became 1444147 ha after adoption of MI system It is therefore concluded that total percentage increase in irrigated area with
Impact Evaluation Study of ldquoNational Mission on Micro Irrigation (NMMI)rdquo
VI
the sampled beneficiaries in 13 states after adoption of MI system was noted to be 841 from same source of water Maharashtra has topped the list with 2228 growth in irrigated area followed by Chhattisgarh
ii Farmers of all the states have shown an increase in area under horticulture crops after the adoption of the MI system The cropped area after implementation of CSS for promotion of MI during 2005-06 and subsequently NMMI has shown an increase which may be due to utilization of degraded marginal land into cultivable land amp increase in cropping intensity
iii Scheme has performed well in terms of reduction in input cost and significant cost saving has been observed for irrigation in all the surveyed states Irrigation cost is reduced by 20-50 with average of 323 Reduction in electricity consumption after installation of MI system Average electricity consumption has been reduced by about 31 after using the micro irrigation system Saving of fertilizers with averages reduction of about 28 in total fertilizer consumption in the surveyed states Fertilizer saving vary from 7- 42
iv Micro irrigation has generated benefits to the farmers in terms of enhancement of the productivity The average productivity of fruits and vegetables has increased about 423 and 528 respectively mainly because of crop spacing judicious use of water and other inputs etc
v The overall benefits accrued from the micro irrigation system are reflected in the income enhancement of the farmers All the surveyed states reported increase in farmerrsquos income in the range of 20 to 68 with an average increase of 485
vi Benefit Cost (BC) ratio of installing micro irrigation system is greater than ldquo1rdquo across the states and across the crops which signifies the importance of MI system in net income enhancement of the farmers The BC ratio was observed to be highest in Odisha among fruits amp vegetables whereas in flowers Rajasthan amp Haryana beneficiary farmers achieved higher BC ratio
vii The positive outcomes have made the food security effective due to the increase in the production and productivity of different crops and increased area under irrigation from same source of water Area under horticulture crops as well as nutritional security has also enhanced
Impact Evaluation Study of ldquoNational Mission on Micro Irrigation (NMMI)rdquo
VII
H Employment Generation
i Beneficiaries of all the states under study have shown decrease in utilization of the labor in pre-harvest practices that is labor saving on irrigation weeding fertilization and other operations It shows that the use of human labor after the use of micro irrigation has decreased significantly and ranges between 741 to 1875 percent But in post-harvest operations right from harvesting to handling and disposal of the produce there is an increase in labor utilization and it ranges between 2119 to 5023 percent due to the increase in the production which requires more of the labor for harvesting assembling and grading handling transportation and disposal of the produce
I Training and Capacity Building
i Among the surveyed states more than 90 percent of the sampled beneficiary farmers in the state of Haryana Karnataka Sikkim amp Tamil Nadu had training on different aspects of MI System whereas farmers of Bihar amp Odisha only 20 amp 52 percent of the beneficiaries have received the training
ii Results of survey revealed that the system suppliers manufacturers are the major sources for imparting training as more than 90 percent of the farmers received training from them Very less proportion of the respondents reported to have training from other sources such as SAUs KVKs etc The participant beneficiaries revealed that the duration of training period generally was of 1-2 days Almost all the respondents of Tamil Nadu UP Chhattisgarh Haryana were given training materials during the training while few beneficiaries of the Bihar and Uttarakhand Karnataka were provided such training materials
iii Key areas for training were operation and maintenance of the system adoption of package practices under MI and opportunities for introducing new crops Demonstration was other means of motivation and capacity building It was also found to be a good means of promotion
J Promotional Activities
i The farmers of the majority of the states acknowledged that the implementing agencies are promoting NMMI schemes in local language
Impact Evaluation Study of ldquoNational Mission on Micro Irrigation (NMMI)rdquo
VIII
however were not aware of the dedicated website for MI scheme in their state It is due to the fact that most farmers do not have access or willingness to use internet for information gathering
ii It was noted that maximum beneficiaries of Haryana (98) followed by Sikkim (80) Rajasthan (64) and Uttarakhand (63) have visited the demonstration trials laid out in the nearby areas
Thus it may be concluded that positive outcomes in terms of crop productivity enhancement due to implementation of MI Scheme have contributed significantly to food and nutritional security requirements The NMMI has helped to widen the food basket of the country with significant contributions coming from the bringing more area under irrigation and with judicious use of water New farm practices and innovations with support of government have encouraged the farmers to shift toward new crops giving higher income
It is noteworthy that the incremental net returns were observed to be generally higher for cash crops such as fruits vegetables groundnut cotton etc than for food crops viz bajra and wheat
Recommendations and Policy Implications
Given the vast potential benefits of micro-irrigation and fast decline of availability of water for irrigation in the country a number of technical and policy interventions are required to be introduced so as to increase the adoption of micro-irrigation in India The needed recommendations and interventions are presented below
A Scheme Related
1) The rate of subsidy provided under NMMI through central government is fixed uniformly for different categories of farmer with a limit of 5 hectare This needs to be restructured as about 15 of the large and medium farmersrsquo accounts for more than 5542 of the land in India Therefore this limit of five hectares needs to be enhanced for extending the subsidy
2) States often compete with each other to increase the subsidy component However it has been noted that higher subsidy does not necessarily lead to more area coverage under MI system as the highest increase in area under MI has been achieved by states which offer subsidy in the range of 50-75 percent eg Maharashtra Chhattisgarh Gujarat and Odisha In case of AP which increased subsidy from 70 to 90 percent in 2011-12 the additional area to come under MI in
Impact Evaluation Study of ldquoNational Mission on Micro Irrigation (NMMI)rdquo
IX
fact decreased as compared to the previous years It is therefore recommended that the states should be advised to seriously consider that the quantum of subsidy should preferably be not more than 50-70 percent including state and central share
3) No uniform pattern is being followed by states for implementation of this scheme It has been observed that in some states more than one department are involved in parallel eg Karnataka where it is being implemented by both agriculture and horticulture departments In such cases there is often lack of coordination which adversely affects the outcome of the scheme It has also been observed that where a single department is designated as the implementing agency (eg horticulture or agriculture) it does not pay adequate attention to the crops coming under the purview of other departments Perhaps one of the best implementation strategies is to designate an independent Special Purpose Vehicle (SPV) on the pattern of Gujarat (GGRC) and AP (APMIP) States may be encouraged to replicate such a strategy
4) The penetration of MI is only 5 of the irrigated area even in the states under study where there is a lot of emphasis on NMMI penetration is only 1118 percent of the potential (identified by various studies ref India Stat) It is proposed that NMMI may fix a target of achieving 25 of the potential during XII plan by addressing various constraints such as
a One of the major reasons for the slow growth of micro-irrigation in India is the high initial investment In spite of availability of subsidy from state agencies majority of the farmers are reluctant to invest in micro-irrigation system even in horticulture crops which is highly suitable for drip irrigation Therefore micro-irrigation system should be planned and designed based firmly on location specific parameters to reduce the cost of installation as well as promoting low cost technology so that poor farmers can also participate
b Capacity building activities for operation and maintenance of system crop diversification using most economical and appropriate Package of Practices etc need to be made an integral part of the programme and be made mandatory for each and every beneficiary The tool to deliver could be MI system supplier in co-ordination with SAU and extension department of the state
Impact Evaluation Study of ldquoNational Mission on Micro Irrigation (NMMI)rdquo
X
5) Micro irrigation System is mostly promoted through subsidy schemes and not as an on-farm water and land management strategy In certain states under subsidy scheme the requisite consideration have not been given in respect of field size shape topography type and location of water source seasonal fluctuations type of soil and crop to be grown As a result in certain cases the subsidy may not match the specific situation of an individual farmer consequently the system may not match the site specific situations of an individual farmers consequently the system may not operate to the complete satisfaction of the farmer
B Technology Related
1) There is a need to establish a Central Testing Facility (CTF) to deal comprehensively with the design development and testing of all equipments devices machines used in micro irrigation systems using state-of art technology It is suggested that the Government may consider contacting regular and random technical audit of the system to cover about 2-3 percent beneficiaries within first and second year of the installation This will keep check on to quality and suppliers will be more vigilant to supply good quality of system
2) It is suggested that the implementing agencies should be more vigilant regarding warranty and after sales service of the system provided by the suppliers It is proposed that 10 percent of the subsidy may be released after one year subject to satisfactory performance of the system as certified by the beneficiary Maintenance manual in vernacular language should be made available to the beneficiaries at the time of installation of the system
3) It is observed that the cost of micro-irrigation accessories such as emitters filters laterals etc vary between shops and places Sometimes farmers do face problem in getting spare parts in time It is necessary to provide quality materials in time for farmers for the speedy adoption of micro-irrigation
4) Inadequate information about the operation maintenance as well as the usefulness of micro irrigation is one of the main reasons for its uneven spread across regions in India Farmers still do not have full knowledge regarding the usefulness of the micro irrigation Even the adopters do not know fully how much of subsidy is available per hectare for different crops
5) Clogging of drippers mainly due to poor quality of water helps in bacterial growth which can be controlled by using chlorination which acts as a powerful oxidizing agent and vigorously attack micro-organisms such as algae fungi and bacteria
Impact Evaluation Study of ldquoNational Mission on Micro Irrigation (NMMI)rdquo
XI
Also acid is injected into drip irrigation system to lower the pH of the irrigation water and this helps in preventing the precipitation of salts such as calcium carbonate magnesium carbonate or ferric oxide It has been observed during the course of survey that the availability of sulphuric acid in the nearby towns is a major constraint and farmers are forced to purchase new spares by discarding clogged drippers It is therefore recommended that system suppliers should make acid available to the growers as part of their after sales service obligation Therefore studies need to be carried out to device efficient eco friendly de-clogging measures so that farmers do not suffer from such problems
C Awareness and Capacity Building
1) The extension network currently operated mainly by government agencies does not seem to be making significant impact on the adoption of this technology Therefore there is a need to revamp the entire extension network by involving the MI system manufactures in order to increase amp improvise the existing quality of extension services
2) MI system manufacturers should be involved intensively in promoting micro-irrigation by introducing frequent demonstration at farmersrsquo field and strategic locations in the district state The MI system manufacturers should be involved in providing advice on agronomic packages to the farmers so as to encourage the adoption of micro irrigation at a large scale
3) Since MI system suppliers are one of the major sources of creating awareness among potential beneficiaries their involvement in laying down demonstration may be increased Similarly imparting training on technical and operational aspects of the system be included as mandatory part of the training of the farmers by the system suppliers The training may also include aspects of package of practices which may be standardized by the SAUs amp other related organization and supplied to system suppliers for further dissemination to the farmers
4) Awareness on MI system is low in states like Bihar UP and Odisha Special drive is needed for exposure visits trainings to make them aware about the benefits and operation of the system The number of demonstration farms should also be increased
5) It is understood from the field study that the officials who are involved in promoting micro-irrigation technology under the GoI Scheme have inadequate knowledge about the technical and other details of MI Therefore the state
Impact Evaluation Study of ldquoNational Mission on Micro Irrigation (NMMI)rdquo
XII
government extension staffs need to undergo lsquoRefresher Courses and exposure visitsrsquo to have basics of micro-irrigation thereby enabling their role in the implementation of the scheme
D Follow up Actions
1) Though micro-irrigation has been in use in different States since mid-eighties State-wise potential area is not estimated as of today Therefore it is essential to prepare State-wise and crop-wise potential area for MI A detailed estimate on State-wise potential would be useful to fix the target to be achieved and further to develop the road map for MI adoption in the country
2) It is evident from field study that capital cost required to install micro irrigation system is relatively high Because of this reason considerable percentage of farmers have expressed that they are unable to adopt this technology for low value crops There has been a significant development in the MI technology and efforts should be on developing and popularizing low cost technologies This would help reducing the cost of the system and increasing the adoption of micro-irrigation at a large scale
3) At least one percent of the outlay on micro-irrigation needs to be earmarked for research on micro-irrigation technology and development of package of practices as well as crop diversification potential
4) The information regarding all the activities under NMMI scheme at national and state level should be under public domain Although presently very few farmers are using internet based information yet this is becoming popular and it is expected that in next few years websites and internet will become a major source of information particularly among younger population Therefore the website of NCPAH be made more popular and content may also be increased to include PoP and crop diversification
Impact Evaluation Study of ldquoNational Mission on Micro Irrigation (NMMI)rdquo
1
1 Introduction 11 Project Background Water is one of the most critical inputs for agriculture however the share of water availability to the agriculture sector is declining at an alarming rate due to its ever increasing demand for the energy industry and domestic purposes Much of the available irrigation water in India is applied through the conventional surface irrigation methods which involve huge conveyance and distribution losses resulting in low overall irrigation efficiencies (35-40) The poor irrigation efficiency of these systems not only reduce the anticipated outcomes from investments in the water resources but also create environmental problems like lowering of water table due to over-exploitation of sub-surface water resources water-logging and soil salinity thereby adversely affecting the crop yields
Figure 1 Percentage Annual Allocation (share in availability) of Water
Source Central Water Commission MoWR GoI
On the other hand the situation of cropping under irrigated and rain fed conditions is quite decimal There is a decimal chance of further enhancement to the area under irrigation which calls for improving the water use efficiency of the available water resources which can be accomplished through the proven water saving technologies such as micro irrigation systems The term micro irrigation describes irrigation systems that deliver water through small devices directly in the plant root zone at prescribed rate at regular interval of time
Impact Evaluation Study of ldquoNational Mission on Micro Irrigation (NMMI)rdquo
2
In countries like Israel the water-use efficiency in agriculture sector has been improved in physical (technical) terms of water use per tonne of output (or hectare irrigated) due to improvements in agricultural water use efficiency As a consequence the share of agriculture in total water use fell from over 70 percent in 1980 to 57 percent by 2005 and further it is projected to decline to 52 percent by 20253 Even in Indian scenario Micro-irrigation (MI) methods have been found to have significant water saving and crop productivity benefits Studies have claimed water saving of 40 ndash 80 percent and productivity gains up to 100 percent (Raina et al 1999 2013 Sivanappan 1994 Palanisami et al 2011) Keeping these advantages in view the Government of India (GoI) constituted a Task Force in 2004 to assess the potential of MI technologies in the country The Report of the Task Force sought to increase the emphasis on MI technology and recommended a broader framework viewing adoption of MI technologies as a part of the overall water management strategy It also recommended allocation of more financial resources of subsidies for MI adoption with state governments contributing 10 percent of the cost while the central funds would account for 40 percent and advised greater flexibility for states to determine their appropriate implementation structure and institutional mechanisms for subsidy disbursement The main objectives of the National Mission on Micro Irrigation are as follows
To increase the area under micro irrigation through improved technologies To enhance the water use efficiency in the country To increase the productivity of crops and farmersrsquo income To establish convergence amp synergy among on-going Government
programmes To promote develop and disseminate micro irrigation technology for
agriculture horticulture development with modern scientific knowledge To create employment opportunities for skilled and unskilled person especially
unemployed youth
12 Salient Features of the Scheme NMMI is a Centrally Sponsored Scheme in which 40 of the cost of the MI system is borne by the Central Government 10 by the State Government and the remaining amount is borne by the beneficiary either through his her own resources or loan
3 OEDC-FAO Agricultural Outlook 2012-2021
Impact Evaluation Study of ldquoNational Mission on Micro Irrigation (NMMI)rdquo
3
from financial institutions In respect of small and marginal farmers the share of Central Government increases by 10 to make 50 of the cost of the system The main features of the scheme are
All categories of farmers are eligible to avail assistance under this scheme Assistance to farmers is limited to a maximum area of five (5) ha per
beneficiary Assistance for laying down demonstration on farmers field are given 75
subsidy for a maximum area of 05 ha per demonstrate and is met entirely by the Central Government
Assistance is available for both drip and sprinkler irrigation for wide spaced as well as close spaced crops However assistance for sprinkler irrigation system is available only for those crops where drip irrigation is uneconomical
Assistance is available for irrigation systems for protected cultivation including greenhouses polyhouses and shade net houses
The subsidy amount is calculated taking into consideration cost of fertigation with fertilizer tank venturi systems sand filters media filters hydro-cyclone filters sand separators and other different type of filters and valves required for MI system
Panchayati Raj Institutions (PRIs) are involved in promoting the scheme identification of priority areas identification of beneficiaries and organizing interactive meetings with the representatives of micro irrigation industry
At the National Level the Executive Committee of NMMI reviews the progress of NMMI and approve the Annual Action Plans of States At the State level the State Micro Irrigation Committee (SMIC) oversees the implementation of the Mission programme in districts The District Micro Irrigation Committee (DMIC) coordinates the implementation of NMMI programme at the District level NCPAH coordinate and monitor the programme of NMMI in different States
The scheme is implemented by an implementing Agency (IA) at the State level duly appointed by the State Government Funds are released directly to the IA on the basis of approved plans for each year
The IA prepares the Annual Action Plan for the State on the basis of the district plans and get it forwarded by SMIC for approval of the Executive Committee (EC) of NMMI
The State Level Micro Irrigation Committee (SMIC) undertakes registration of System Manufacturers who are authorized to supply systems to the farmers under the NMMI subsidy scheme One of the important criteria for registration is that these manufacturers should be able to supply the systems as Bureau of
Impact Evaluation Study of ldquoNational Mission on Micro Irrigation (NMMI)rdquo
4
Indian Standards (BIS) marking and provide proper after sales service to the satisfaction of the farmers
13 The Assignment NMMI has now been in operation effectively for more than six years and the government feels that this is the right time to asses and quantify the impact of Scheme The Govt of India Ministry of Agriculture Department of Agriculture and Cooperation Krishi Bhawan New Delhi has engaged Global AgriSystem through open bid to carry out an Impact Evaluation Study of National Mission on Micro Irrigation (NMMI) Scheme 14 Objectives of the Study The ldquoNational Mission on Micro Irrigation (NMMI)rdquo was to be evaluated in terms of water saving increase in area production and productivity of major crops so as to serve various objectives of National Food Security crop diversification with the changing food consumption habits saving of various inputs such as fertilizer power etc that are of paramount importance to the country The prime purpose objectives of the study are as follows
i Transparency in identification of beneficiaries prioritizing for release of funds in order of the application approval of system suppliers timely release of financial assistance dovetailing of various MI schemes effectiveness of various MI technologies methodology adopted for record keeping auditing and effectiveness of the state implementing agencies
ii Overall performance of the programme implementation and whether the programme is being implemented as the operational guidelines of NMMI in various states
iii Employment generated due to the implementation of NMMI and efforts laid for the development of human resources wrt Micro Irrigation between FY 2005-06 to 2011-12
Impact Evaluation Study of ldquoNational Mission on Micro Irrigation (NMMI)rdquo
5
2 Approach and Methodology The evaluation study of the ldquoNational Mission on Micro Irrigationrdquo (NMMI) scheme requires a wholesome approach to find out proper impact of the scheme at the ground level Keeping in view the scope of work given ToRrsquos and with the understanding of the objectives the approach and methodologies adopted by the Consultants are summarized in the following paragraphs 21 Approach The approach adopted for the present impact evaluation study is based on use of both the secondary as well as primary data collected from 13 states conducting interviews of various stakeholders (Figure 2)
Figure 2 States Covered for Study (Star Marked)
Impact Evaluation Study of ldquoNational Mission on Micro Irrigation (NMMI)rdquo
6
The study comprised primarily adopting the following steps
Beneficiaries who availed the assistance to install MI system and non-beneficiaries from the same area village who did not install MI
Mobilisation of the study team Continuous contact and consultations with the various concern agencies and
the Client Sharing of information throughout the study period with the Client and flexibility to respond to desired changes and directions
Collection and review of reports documents government policies plans and programs
Development of questionnaires and checklists for primary data collection Interaction and interview with policy makers planners bureaucrats
development workers traders and etc Field survey in the selected areas Analysis of secondary and primary data using appropriate tools Survey of beneficiaries amp non-beneficiaries to arrive at a comparative analysis
of the advantages derived by the adopters
22 Methodology Based on above approach following methodology is adopted to carry out the evaluation study
Table 1 Methodology Adopted for Impact Assessment
Sl No Description of the Method Description of the Units Covered
1 Survey Method a Sample
Survey Selected beneficiary and non-beneficiary households
2
Rapid Appraisal Method a Focus group
discussions Beneficiary and non-beneficiary households
b Semi Structured interviews with key informants
Various implementing agencies at district and block levels Manufacturers service providers Non-Governmental Organizations(NGOs) Financial Institutions Village elders community leaders and Knowledgeable persons
Source GAPL
Impact Evaluation Study of ldquoNational Mission on Micro Irrigation (NMMI)rdquo
7
221 Sources of Data Collection
The primary data has been collected through participatory discussions and structural interviews semi- structured questionnaires for covering various evaluation parameters from various stakeholders
Farmers Officials of horticultureagriculture departments Officials of Irrigation department Scientists from Krishi Vigyan Kendras and agricultural universities Banks amp other financial institutions Social mobilizers Pradhan Opinion leadersprogressive farmers Industry
Secondary data regarding physical and financial targets amp achievements was obtained from Ministry of Agriculture amp NCPAH Other sources of published data such as NHB statistics Published research in the reputed journals GoI publications as well as Statistics from State and District level have been utilized for secondary data
Task 1 Review of Secondary Information
A desk review of secondary data regarding overall area under irrigation research work on potential of MI cropping pattern and land use progress position regarding distribution Similarly physical and financial performance relating to various components of the Scheme has been collected from MoA NCPAH and State Government agencies The information collected has thereafter been analyzed for reaching to conclusions
Task 2 Field Research and Primary Data
In depth field study has been carried out to find out stakeholdersrsquo perception and impact assessment of the scheme Field study included three segments
i A detailed survey of farmers( both beneficiaries and non-beneficiaries) through a structured questionnaire and PRA techniques
ii Implementing agencies and officials to assess the efficiency and efficacy of implementation of the scheme
iii Institutions ndash an interaction with officials of the agriculture universities to understand current technologies in micro-irrigation their adaptability to India agriculture and sustainability in the long rum
Impact Evaluation Study of ldquoNational Mission on Micro Irrigation (NMMI)rdquo
8
Task 3 Developing the Sampling Plan for primary survey and the Associated Fieldwork Schedules 222 Sampling The evaluation study was conducted in the given 13 states The detailed sampling plan followed for the evaluation study was as under
Table 2Sampling Plan
Sl No
Stage of Sampling
Sampling Unit
Criteria for Selection of
Sample Units
Sample Method Adopted
Description of the Sample Units
Number of Sample Units
1 I Stage Agro climatic regions
As per state classification Micro units Best and average
performing See Table 4
2 II Stage District
Level of Micro Irrigation coverage as proxy for development
Stratified Purposive Sampling
Additional area brought under irrigation
Best and average performing districts in ratio of 7525
4-6 districts in plain areas and 2-3 in hilly states In all 64 districts have been selected
2 III Stage Blocks Level of Development
Stratified Purposive Sampling
Additional area brought under irrigation in the block
Best and average performing blocks in ratio of 7525
5-8 blocks in plains and 5-7 in hilly states covering from each sample district A total of 398 blocks were finally selected
3 IV Stage Villages Coverage of Programmes
Stratified Purposive cum cluster Sampling
Best and average geographical connectivity
4 V Stage Households
Beneficiaries on random basis amp non beneficiaries from similar conditions
Stratified Purposive Random Sampling
Proportionate sample according to size of holding and area under micro irrigation
7400 farmers including 5892 beneficiary household from 13 states
Source GAPL
223 The Sample Design Multi-stage - stratified - purposive ndashrandom sampling design has been adopted in the study The samples have been collected from all the identified states The consultant has applied Stratified Random Sampling Method The sample is representative and has been covering all categories of farmers The sampling has been taken into account the extent of implementation of NMMI Scheme in the State
Impact Evaluation Study of ldquoNational Mission on Micro Irrigation (NMMI)rdquo
9
Selection of districts and blocks Selection has been done in a manner so as a representative data emerged from that particular sampled state The sample has covered selected districts in 13 states as per the ToR The details of sample size both of beneficiaries and a non-beneficiary across the states has been summarized in Table 4
Districts have been selected from each selected region of the state Four to seven districts (two to four from hilly states) from each state have been selected The selected districts were ranked as per their performances where one district each from the high good average amp poor performance were included for drawing samples as summarized in the following table
Table 3 State wise List of Sampled Districts Covered in the Study
S No
States Districts
1st 2nd 3rd 4th 5th 6th 7th 1 AP Anantpur Medak Nalgonda Adilabad Nellore Krishna Vishakhapatnam 2 Bihar WestChamparan Rohtas Gaya Madhepura 3 Chhattisgarh Durg Sarguja Kanker Jashpur 4 Gujarat Banaskantha Bhavnagar Jamnagar Bharuch Mehsana Anand 5 Haryana Bhiwani Sirsa Fatehabad Karnal 6 Karnataka Belgaum Hasan Bidar Chitradurga Mysore Bellary 7 Maharashtra Jalgaon Ahmednagar Jalna Kolhapur Wardha Ratnagiri 8 Odisha Ganjam Mayurbhanj Boundh Nayagarh Bhadrak 9 Rajasthan Jalore S Madhopur Jodhpur Jhalawar Hanumangarh Udaipur 10 Tamil Nadu Erode Tirunelveli The Nilgiris Thiruvarur Villupuram
11 UP Jhansi Balia Saharanpur Siddharth Nagar Kannauj Aligarh
12 Sikkim Gangtok Mangan 13 Uttarakhand U S Nagar Haridwar Nainital
Source GAPL
Further blocks were selected on the basis of coverage in area under irrigation which is taken as a proxy of development of micro irrigation infrastructure From each sample district 5-8 blocks - best and average performed blocks (7525 ratio) were selected randomly among those where MI systems have been installed 224 Selection of Beneficiaries and Non-beneficiaries Villages have been purposively selected on the basis of coverage of the programme The selection of the sampled beneficiary farmerhouseholds has been made randomly for each selected village A complete list of beneficiaries are drawn and divided into various size classes In the each selected village the households were finalized on the
Impact Evaluation Study of ldquoNational Mission on Micro Irrigation (NMMI)rdquo
10
basis of their farm holding socio-economic status and coverage of programmes Besides this non-beneficiaries were also selected to identify reasons for their non-participation in the programmes and also to compare the benefits drawn by beneficiaries compared to this category This in fact facilitated the impact evaluation study based on lsquowith and withoutrsquo approach The farmers selected for the primary survey include various categories of farmers Besides it also includes PRIs and district amp state level concerned functionaries It is pertinent to mention here that the sampling design has taken care that the beneficiaries selected are representative of overall population of the beneficiaries at State and District levels The total sample comprises of beneficiaries and non-beneficiaries in the ratio of 8020
Table 4 State wise Sample Distribution for the Study
Sl No
Name of State UT
Sample Districts
Sample Blocks district
Farmers per
block
Total respondents
Beneficiaries Non
beneficiaries
1 AP 7 6 20 840 672 168 2 Bihar 4 8 20 644 516 128 3 Chhattisgarh 4 6 20 480 384 96 4 Gujarat 6 6 20 720 576 144 5 Haryana 4 5 20 401 320 81 6 Karnataka 6 6 20 720 576 144 7 Maharashtra 6 7 20 881 672 169 8 Odisha 5 6 20 600 480 120 9 Rajasthan 6 6 20 712 574 138
10 Tamil Nadu 5 6 20 575 455 120 11 UP 6 7 20 695 527 168 12 Sikkim 2 5 6 60 50 10 13 Uttarakhand 3 6 6 112 90 22
Total 64 7400 5892 1508
Task 4 Validation of Sampling Plan and Questionnaires
Field research has been carried out on the predefined and approved questionnaires in active consultations with DAC The final sampling plan and questionnaires and field survey plans have been validated by DAC
Task 5 Pilot Testing amp Survey Preparation
In order to validate that the questionnaire were able to gather information as per design and to train the supervisors of the survey team a pilot survey was undertaken in Uttarakhand and Maharashtra The main purpose of pilot testing the survey was to check the validity of the questionnaire by finding questions or words that might be misinterpreted misread or misunderstood as well as to check the functionality of the
Impact Evaluation Study of ldquoNational Mission on Micro Irrigation (NMMI)rdquo
11
questionnaire in the field Training of the interviewers and supervisors which is one of the most important stages prior to conduct of field work was done to familiarize the interviewers with the survey instruments Task 6 Constituting Field Work Teams and Briefing Meeting with Field Supervisors and Felid Investigators
On acceptance of the final questionnaires and the sample plan the field teams were gathered in Delhi and a briefing meeting and training session had been held for the field research teams
Task 7 Primary Data Collection Exercise
During the fieldwork face to face interviews were held with various types of respondents including State Agriculture Horticulture departments and other stake holder as mentioned above were interviewed with structured information schedules and information was collected accordingly
Task 8 Stakeholder Discussion
Participatory discussion was arranged with various stakeholders at various levels as follows
I Stage At inception stage to discuss and finalize work plan questionnaire and methodology
II Stage After completion of field survey to discuss preliminary finding
III Stage After submission of DPR to discuss the recommendation and finalize the report
Task 9 Data Entry Analysis of Secondary and Primary Data and Report Writing
Both primary and secondary data is being collected compiled and tabulated and analyzed to arrive at appropriate conclusions 23 Limitations of the Study The study was conducted for 13 states and the consultant completed this study under certain limitations which were as follows
a Like any study based on sampling method the findings of the response of respondents have been extrapolated to the entire scheme for the purpose of
Impact Evaluation Study of ldquoNational Mission on Micro Irrigation (NMMI)rdquo
12
studying the achievements amp objectives of the scheme impact of the scheme and methodology of the implementation of the scheme etc
b It took almost more than one month to get the comments on the Inception Report as well as questionnaires which led to delays in the mobilization of the field work
c The consultant and the survey team got stuck during the study period due to the complications amp coordination between state amp central government authorities
d Due to natural disaster taking place in Uttarakhand the districts to be covered were changed as it was difficult to reach the selected districts
e The field work coincides with rainy season and this year there were heavy rains in few states which also hampered the field study Moreover the information regarding beneficiaries of the selected states was not provided in time therefore the survey team had to visit those areas more than one time For example in case of Haryana the survey team visited state authorities with list of districts identified for survey by consultant in consideration with MoA and NCPAH but the state authorities did not agree and wanted some time to suggest changes and therefore survey team had to wait which led to delay
f In the states like UP and Tamil Nadu the state government officials did not cooperate to provide information of beneficiaries in the beginning and consultants had to mobilize GoI authorities to send communication for co-operation which caused delay in starting field work
g In the state of UP the designed sample size has not been achieved for covering 168 farmers (beneficiaries) as number of beneficiary farmers in selected districts was less therefore the sample size has been constraint accordingly
In spite of these limitations efforts were made by the consultant to complete the study in time
Impact Evaluation Study on ldquoNational Mission on Micro Irrigation (NMMI)rdquo
13
3 Assessment of Current Status 31 Performance of MI Scheme Micro Irrigation industry in India is driven by the assistance from the central and the state governments The NMMI has given major impetus to the growth of the industry In fact the growth of the MI industry can be viewed as per growth of fund allocation to MI scheme The trend of area coverage and total subsidy advanced in the states under study has been shown in the figure 3
Annual subsidy advanced has shown increasing trends continuously except for the year 2008-09 whereas the growth of area coverage has witnessed some fluctuations in the year 2007-08 and 2012-13 Despite this fluctuation the growth in the area coverage is not proportional to the growth in fund spent The both trend lines witness convergence in growth up to 2009-10 but there after witnessed the divergence in growth
The fund spent has witnessed sudden jump after the conversion of the NMMI scheme from CSS in the year 2010-11 The fund spent has increase by about 62 percent from 2009-10 to 2010-11 and the increase in area coverage is 1538 percent in corresponding period This fact was further analyzed and the main reason for high subsidy amount is the reason of revision in the cost norm per hectare and more area coverage under drip system
The cumulative area coverage since the launch of scheme to 2012-13 in the states under study is about 356 Million ha and the total subsidy advanced till 2012-13 stood at Rs 5006 crores in the same states
Figure 3 Physical and Financial Performance of NMMI Scheme
Source Ministry of Agriculture
Impact Evaluation Study on ldquoNational Mission on Micro Irrigation (NMMI)rdquo
14
Table 5 Year wise Area under Different MI Systems of Sampled Beneficiaries
Year Area under Drip
Irrigation (ha) Area Under Sprinkler
Irrigation (ha) 2000 223 162 2001 445 000 2005 101 000 2006 15279 546 2007 17656 8282 2008 60209 21929 2009 64467 22961 2010 76567 46818 2011 128797 78328 2012 421496 202578 2013 30784 31355
Source GAPL survey
The above table depicts that the year wise area under drip is expanding more in comparison to the area under sprinklers that leads to higher system cost This may be the reason for splitting lines of physical and financial achievements after 2009 in the figure 2 It may also be inferred from the table 5 that subsidy has been increased in most of the states that caused increase in financial achievement than physical achievement which led to splitting trend line of physical and financial achievements
Table 6 Comparison of Subsidy between Pre and Post NMMI Scheme
SNo State
Total Subsidy of the farmers ()
Pre NMMI Scheme
Post NMMI Scheme Small amp
Marginal Farmers
General Farmers
1 AP 70 90 75 2 Bihar 90 90 80 3 Chhattisgarh 70 75 50 4 Gujarat 50 50 50 5 Haryana 90 90 90 6 Karnataka 75 80 50 7 Maharashtra 50 60 50 8 Odisha 70 90 80 9 Rajasthan 70 70 70
10 Sikkim 60 60 11 Tamil Nadu 65 100 75 12 UP 50 90 75 13 Uttarakhand 50 60 60
Impact Evaluation Study on ldquoNational Mission on Micro Irrigation (NMMI)rdquo
15
32 State wise Performance
AP and Gujarat were the pioneer states which harnessed the benefits of the scheme with area coverage of about 678 thousands and 504 thousands ha In 2006-07 more states were brought under the scheme and by the end of 2007-08 all the states under study except Sikkim and Uttarakhand were covered during 2011-12 The states of AP followed by Maharashtra are top in the list of area coverage as well as total subsidy advanced under MI The total cumulative central subsidy advanced and total area covered since the launch of the scheme is shown in the graph
Figure 4 State wise Central Subsidy (Rs Crores) and Area Coverage (lsquo000rsquo ha) under NMMI
Source Ministry of Agriculture
33 Targets and Achievements The states under study have achieved 9987 financial targets but the achievement of physical targets stood at 9299 The states of Gujarat and Maharashtra have achieved 100 financial targets but have not met the physical targets In Gujarat the financial utilization is 10026 due to inclusion of interest amount The state of Bihar Karnataka Odisha Rajasthan and Sikkim which have achieved more than 100 physical targets without utilizing the total allotted fund
Impact Evaluation Study on ldquoNational Mission on Micro Irrigation (NMMI)rdquo
16
It is pertinent to mention that achievements are exceeding the value of 100 percent Since the preceding year unspent balance has been brought forward to next year The scheme was launched in 2011-12 in Sikkim and Uttarakhand and the Sikkim has performed much better in physical target achievement as compared to Uttarakhand In fact Sikkim is the top performer in physical target achievements whereas the Uttarakhand is least one among the states under study as the scheme is launched few years back only The state wise cumulative (2005-06 to 2012-13) physical and financial targets vs achievement are given in the table below
Table 7 State wise Cumulative Physical amp Financial Targets and Achievements
State Physical (lsquo000rsquoha) Financial (Rs in lakh)
Target Achievement
Achievement Target Achievement
Achievement AP 87116 77205 8862 13714800 13517558 9856 Bihar 6676 7880 11804 813210 726062 8928 Chhattisgarh 13515 12602 9324 1371370 1323969 9654 Gujarat 46102 43172 9364 7247100 7265900 10026 Haryana 6638 5783 8712 882086 804293 9118 Karnataka 51096 53668 10503 6088932 5981226 9823 Maharashtra 94179 69605 7391 11542800 11542800 10000 Odisha 5406 6302 11658 506200 468763 9260 Rajasthan 57640 66307 11504 5039296 4946894 9817 Tamil Nadu 11897 11767 9890 2961660 2937490 9918 UP 2712 1883 6941 279904 254098 9078 Uttarakhand 101 022 2139 22500 7000 3111 Sikkim 039 051 13002 60000 40000 6667 Total 383117 356246 9299 50128009 50064490 9987
Source Ministry of Agriculture The major inferences drawn from table below are as follows
The scheme made rapid stride after the launch and achieved more than 80 of the targets both physical and financial in 2006-07 and the physical and financial targets have been achieved more than 100 in the subsequent year ie 2007-08 to 2009-10
The financial target achievement has been more than 100 on 2007-08 onwards except for the year 2011-12 whereas the physical target achievement has been declined after 2009-10
The Scheme has performed best in terms of both physical and financial targets achievement with around 130 achievement
The year wise cumulative (2005-06 to 2012-13) physical and financial targets vs achievement is given in table below
Impact Evaluation Study on ldquoNational Mission on Micro Irrigation (NMMI)rdquo
17
Table 8 Year wise Cumulative Physical and Financial Targets and Achievements
SNo Year Physical Financial
Target (Ha)
Achievement (Ha)
Achievement
Target (Rs)
Achievement (Rs)
Achievement
1 2005-06 18022300 1181700 656 2328415 163517 702 2 2006-07 39736500 33430060 8413 4457599 3659033 8209 3 2007-08 32404870 42117390 12997 3989632 4729348 11854 4 2008-09 42309500 51633800 12204 4172462 4678426 11213 5 2009-10 42576400 55475277 13030 4353157 5664040 13011 6 2010-11 66770000 64006900 9586 9008411 9173680 10183 7 2011-12 69819700 55752143 7985 10829000 10807615 9980 8 2012-13 71478800 52648500 7366 10989300 11188800 10182
Total 383118070 356245770 9299 50127976 50064459 9987 Source Ministry of Agriculture
Figure 5 Year wise Targets and Achievements
Impact Evaluation Study on ldquoNational Mission on Micro Irrigation (NMMI)rdquo
18
Figure 6 State wise Cumulative Targets and Achievements (2005-06 to 2012-13)
The performance of the scheme in different states and in different tenure can be sum up as under
The scheme created a good imprint in 2006-07 and achieved 8213 and 8209 of physical and financial targets respectively in the states under study In this year state of Gujarat Karnataka Maharashtra and Rajasthan achieved more than 100 of physical targets
The performance of scheme contributed to be extremely well in the year 2007-08 to 2009-10 and registered more than 100 achievement of both physical as well as financial target
Impact Evaluation Study on ldquoNational Mission on Micro Irrigation (NMMI)rdquo
19
Table 9 Year amp State wise Physical Targets and Achievements (lsquo000rsquo ha)
State 2005-06 2006-07 2007-08 2008-09 2009-10 2010-11 2011-12 2012-13 (March 13)
T A T A T A T A T A T A T A T A AP 4552 678 19346 8462 4639 11485 8521 12358 11445 13834 16550 12276 8895 10506 13169 7607 Bihar - - 1422 - - 023 - 031 - 011 - 1349 196 2329 5057 4137 Chhattisgarh - - 2875 460 1006 2083 1363 3057 1764 1577 2878 2183 1717 1839 1912 1402 Gujarat 1672 504 1825 2434 4516 4304 3356 5343 3333 6625 8034 7829 13029 6510 10338 9623 Haryana - - 537 282 722 778 3240 2230 158 326 443 934 612 579 928 654 Karnataka 2523 - 2374 3885 5352 6294 8417 9262 8131 10821 7270 8745 6317 5801 10713 8861 Maharashtra 4186 - 6512 10826 10367 8222 12876 10041 8467 9451 11803 11803 27194 11600 12775 7662 Odisha - - 331 122 103 307 375 250 758 1278 934 1201 1152 1184 1752 1961 Rajasthan 1303 - 3975 6772 4471 7374 4023 7773 8521 9556 14800 14761 10707 12218 9840 7854 Tamil Nadu 2895 - 540 - 1230 782 - 1160 - 1801 3500 2615 - 2755 3732 2654 Uttar Pradesh 891 - - 186 - 466 138 129 - 197 559 311 - 379 1125 214 Uttarakhand - - - - - - - - - - - - - - 101 022 Sikkim - - - - - - - - - - - - - 051 039 - Sub Total 18022 1182 39737 33430 32405 42117 42310 51634 42576 55475 66770 64007 69820 55752 71479 52649 Source Ministry of Agriculture
Impact Evaluation Study on ldquoNational Mission on Micro Irrigation (NMMI)rdquo
20
Table 10 Year and State wise Financial Targets and Achievements (Rs Crores)
State 2005-06 2006-07 2007-08 2008-09 2009-10 2010-11 2011-12 2012-13 (March 13)
T A T A T A T A T A T A T A T A AP 6129 934 19520 11277 5748 14559 9727 10836 14311 17829 24000 24000 28720 28720 28993 27021 Bihar - - 2482 - - 026 - 022 - 011 - 826 450 2167 5200 5340 Chhattisgarh - - 3033 256 783 1751 954 2060 1252 1193 1019 1801 3500 3500 3172 2678 Gujarat 2182 701 3356 3931 7350 4927 4899 7396 4447 5426 12000 12000 16664 16695 18200 18201 Haryana - - 444 232 604 508 1207 1278 212 385 1361 1402 1993 1667 3000 2571 Karnataka 3584 - 2457 4452 6865 7598 7319 5845 6381 8685 9254 8945 10965 9165 14065 15122 Maharashtra 4808 - 8797 13466 13897 12792 14748 13444 10707 13226 22237 22265 24980 24980 15018 15221 Odisha - - 454 143 108 101 338 293 528 871 810 697 823 893 2000 1690 Rajasthan 1048 - 2833 2687 2341 2908 2382 3009 5693 6073 12000 11620 13095 12824 11000 10347 Tamil Nadu 4291 - 1201 - 2200 1560 - 2367 - 2558 6591 7797 6625 6625 8300 13235 UP 1242 - - 146 - 562 150 235 - 381 812 383 - 441 595 393 Uttarakhand - - - - - - - - - - - - 075 - 150 070 Sikkim - - - - - - - - - - - - 400 400 200 - Sub Total 23284 1635 44576 36590 39896 47293 41725 46784 43532 56640 90084 91737 108290 108076 109893 111888
T Target A Achievement Source Ministry of Agriculture
Impact Evaluation Study on ldquoNational Mission on Micro Irrigation (NMMI)rdquo
21
34 Performance of Scheme for Area Coverage as Compared to Potential
Potential of different MI Systems in terms of drip and sprinkler has been assessed by various researchers by using the secondary data For assessing the potential of MI in different states the variables considered were state-wise and source-wise irrigation area cropped area and crops wise suitability for different MI systems Potential area is calculated on the basis of area already brought under MI system from the existing irrigated area While calculating potential area in sampled states we have also considered area under paddy which may diversify into horticultural and other cash crops in future For the purpose of arriving at some conclusion regarding performance of MI under the states data on potential area and actual area brought under drip and sprinkler irrigation in the states (NCPAH) has been analyzed
Table 11 Potential and Cumulative area under Drip amp Sprinkler Irrigation
StatesUTs
Total (Area in ldquo000 ha) Drip (Area in ldquo000 ha) Sprinkler (Area in ldquo000 ha)
PotentialIrrigated area
Cumulative area under
MI till 2012-13
Balance Potential area for
MI
Potential
area ()
Potential area
Cumulative area under
drip till 2012-13
Balance Potential
Area
Potential area ()
Potential area for
Sprinkler
Cumulative area under
sprinkler till 2012-13
Balance Potential
Area
Potential area ()
AP 6785 77100 601400 8864 506840 57605 449235 6621 171661 19495 152166 2243 Bihar 5158 7867 507933 9847 11863 181 11682 226 503937 7686 496251 9621 Chhattisgarh 1648 15655 149145 9050 12525 1172 11353 689 152275 14483 137792 8361 Gujarat 4137 43669 370031 8944 230017 24260 205757 4974 183683 19409 164274 3971 Haryana 5680 5753 562247 9899 149384 1539 147845 2603 418616 4214 414402 7296 Karnataka 4137 41485 372215 8997 156379 15697 140682 3401 257321 25788 231533 5597 Maharashtra 3806 64797 315803 8298 229882 45609 184273 4842 150718 19188 131530 3456 Odisha 1437 5199 138501 9638 28740 1042 27698 1927 114960 4157 110803 7711 Rajasthan 8903 64423 825877 9276 89030 6421 82609 928 801270 58002 743268 8349 Tamil Nadu 3519 11760 340140 9666 343103 11530 331573 9422 8797 230 8567 243 UP 19354 1869 1933531 9990 1035439 1004 1034435 5345 899961 865 899096 4646
Source Directorate of Economics amp Statistics MoA GoI NCPAH (excluding Uttarakhand amp Sikkim) Note - Analysis by GAPL It has been assessed that there is potential of bringing area under MI system is around 6117 million ha in the states under study (excluding Sikkim amp Uttarakhand) Out of this about 3490 million ha is having potential for sprinkler irrigation for crops like cereals pulses and oilseeds in addition to fodder crops The potential area for drip has been estimated in the study to be around 2627 million ha suitable for cotton sugarcane fruits and vegetables spices and condiments and some pulses crops like red gram etc The percentage of actual area against the potential estimated under drip irrigation in different states varied between 6621 in Andhra Pradesh followed by Uttar Pradesh (5345) Gujarat (4974) and Maharashtra with 4842 In case of sprinkler irrigation the percentage of actual area against the potential estimated was 243 (Tamil Nadu) and
Impact Evaluation Study on ldquoNational Mission on Micro Irrigation (NMMI)rdquo
22
the highest of 9621 (Bihar) Compared to the potential of 6117 million ha in the all eleven states the present area under MI accounts for 339 million ha (166 million ha under drip and 173 million ha under sprinkler) which is about 555 (Table 11) The present figures thus reflect the extent of MI systems covered under different government programme as well as own investment by the farmers However the actual area under MI may vary according to the extent of use by the farmers
Figure 7 Proportion of Area under Drip and Sprinkler Irrigation
Source GAPL Analysis
35 Pattern of Assistance
351 Indicative Cost of Installing Micro Irrigation System
As per the guidelines of NMMI the States have been categorized in the following categories
Category A States where more than 20000 hectares have been brought under drip irrigation come under lsquoArsquo Category This would include the States of AP Gujarat Karnataka Maharashtra Madhya Pradesh Punjab Rajasthan and Tamil Nadu
Category B All the states except those covered under the category lsquoArsquo and those falling in the Himalayan belt would come under this category
Category C All the North Eastern States Sikkim Himachal Pradesh Jammu amp Kashmir Uttarakhand and Darjeeling district of West Bengal
Impact Evaluation Study on ldquoNational Mission on Micro Irrigation (NMMI)rdquo
23
Keeping in view the level of awareness proximity to the manufacturing units distance involved in transportation potential for drip irrigation the cost of drip system in Category lsquoBrsquo States is estimated to be 15 higher than Category lsquoArsquo States while for Category lsquoCrsquo States it is estimated to be 25 higher than Category lsquoArsquo States Cooperative SocietiesSelf Help GroupsIncorporated Companies are also entitled to avail assistance on behalf of its members In such cases the individual beneficiary receives assistance through the Cooperative Society SHGIncorporate company and not directly 352 State-wise Pattern of Assistance It was observed that the states are giving subsidy on MI ranging from 50 percent to 100 percent depending on the size of the holding and category of the farmers in different states However the central share is same across the states It may be seen from the Table 12that in Tamil Nadu the quantum of subsidy is 100 percent for small amp marginal farmers whereas in AP for SCST farmers the quantum is cent percent
Table 12 State wise Quantum of Subsidy to Different Categories of Farmers
SNo State
Percentage of subsidy to small
amp marginal farmers
Percentage of subsidy to other farmers
Remarks
1 AP 90 75
APMIP arranges the following Micro Irrigation systems to farmers with government subsidy (SCST 100 subsidy) (others 90 75 60) for Drip (Inline amp Online) Semi-Permanent Sprinklers and Rain Guns
2 Bihar 90 80 About 98 area is under sprinkler irrigation 3 Chhattisgarh 75 50 About 93 area is under sprinkler irrigation
4 Gujarat 50 50 Uniform pattern of subsidy Gujarat Green Revolution Company Limited (GGRC)
5 Haryana 90 90 Additional subsidy is provided for hydro-cyclone filters
6 Karnataka 80 50 For the first 2 ha out of 5 ha per beneficiary ceiling on the area to be undertaken under the scheme
7 Maharashtra 60 50 25 per cent of the beneficiaries are small and marginal farmers
8 Odisha 90 80 Subsidy rate under NMMI wef 2013-14
9 Rajasthan 70 70 90 for drip 70 for sprinkler(mini) 60amp 50 for portable sprinkler for SCST and General Category respectively
10 Sikkim 60 60 NMMI scheme was launched in 2011-12
11 Tamil Nadu 100 75 ldquoTamil Nadu Horticulture Development Agencyrdquo (TANHODA) Subsidy effective from 2511 2011
12 UP 90 75 Subsidy rate under NMMI wef 2012-13 13 Uttarakhand 60 60 NMMI scheme was launched in 2011-12
Note The Central Government share in total subsidy is 50 for small marginal OBC SCST amp women categories and 40 for general categories Sources State Level Nodal Agencies
Impact Evaluation Study on ldquoNational Mission on Micro Irrigation (NMMI)rdquo
24
353 Quantum of Subsidy and Adoption of MI System by Farmers Increase in area under MI has not been found to be significantly higher in case of the states giving higher subsidy quantum and vice versa The Data on area coverage under MI System amp extent of subsidy provided clearly demonstrates that increasing the extent of subsidy had no significant impact on area coverage under MI system The case in point pertains to increase in area under MI in Maharashtra and Gujarat where the subsidy for small amp marginal is 60 percent and 50 percent respectively whereas the area increase was 223 and 140 percent respectively Similarly area coverage in Haryana Tamil Nadu and Bihar was noted to be 73 45 and 31 percent respectively the corresponding figures for subsidy were 90 75 and 90 percent The increase in area under MI was only 13 and 73 percent respectively for UP amp Rajasthan where subsidy level was 90 and 70 percent as per the data available from implementing agencies The aforesaid observation clearly suggests that increasing the subsidy component had no impact on area coverage under MI system The relationship between area expansion under MI and quantum of subsidy has been computed considering beneficiariesrsquo data on area expansion in different states before and after adoption of MI system A critical perusal of data on area coverage collected by our team and also the one quoted by India Statistics portal vis-a-vis the magnitude of subsidies suggests that the states should be advised to seriously consider that the quantum of subsidy to be restricted between 50-70 percent including state and central share and depicted in the table 13
Table 13 State wise Quantum of Subsidy and Area Coverage
State
Total Cultivated
Area (000 ha)
Net Irrigated
area (000 ha)
Area under NMMI
(000 ha)
Percent Irrigated
Area under MI
Area under MI Percent Increase
(Beneficiaries)
Quantum of Subsidy
() for General
Category
Quantum of Subsidy () for Small amp Marginal farmers
AP 1341500 503400 77090 1531 1240 7500 9000 Bihar 617900 303000 7870 260 310 8000 9000 Chhattisgarh 494900 135600 15650 1154 1500 5000 7500 Gujarat 1068100 423300 43660 1031 1400 5000 5000 Haryana 364000 288700 5750 199 1000 9000 9000 Karnataka 1172200 349000 41490 1189 260 5000 8000 Maharashtra 1877200 325600 64790 1990 2230 5000 6000 Odisha 555900 128400 5190 404 1100 8000 9000 Rajasthan 1958400 666100 64420 967 730 7000 7000 Sikkim 8200 1400 NA NA 070 6000 6000 Tamil Nadu 596900 291200 11760 404 450 7500 10000 UP 1780800 1338600 1860 014 130 7500 9000 Uttarakhand 76600 33600 NA NA 160 6000 6000
Source GAPL Analysis As per records of Directorate of Economics and Statistics As per records of NCPAH As per our survey in the sampled states
Impact Evaluation Study on ldquoNational Mission on Micro Irrigation (NMMI)rdquo
25
354 State Implementing Agencies The NMMI scheme is being implemented by specially designated agencies by the respective state governments and is provided one percent of the annual outlay actual release of funds for administering and monitoring the scheme at district level It has been observed that Directorate of Horticulture is the implementing agency for NMMI in nine states The scheme is implemented by Directorate of Agriculture in Maharashtra and Chhattisgarh Rajya Beej amp Krishi Vikas Ltd (CHRBKV) in Chhattisgarh In case of AP and Gujarat the scheme is being implemented by AP Micro Irrigation Project (APMIP) and Gujarat Green Revolution Company (GGRC) respectively
Table 14 State-Implementing Agencies for NMMI
State Implementing Agency Focus Nature of Association
AP APMIP Micro Irrigation SPV- relatively autonomous unit within Horticulture Department
Bihar DoH Agriculture amp Horticulture Government Department
Chhattisgarh CHRBKB Agriculture amp Horticulture Government Department
Gujarat GGRC Micro Irrigation Registered Under Companys Act Public Ltd
Haryana DoH Agriculture amp Horticulture Government Department
Karnataka DoA ampDoH Agriculture amp Horticulture Government Departments
Maharashtra DoA Agriculture amp Horticulture
Government Department
Odisha Horticulture
Development Society (OHDC)
Nodal Agency for NHM
Registered under Society Registration Act
Rajasthan Rajasthan Horticulture Development Society
(RHDS)
Agriculture amp Horticulture
Horticulture Development Society (RHDC)
Tamil Nadu DoH Agriculture amp Horticulture Government Department
UP DoH Agriculture amp Horticulture
Government Department
Sikkim DoH Agriculture amp Horticulture Government Department
Uttarakhand DoH Agriculture amp Horticulture Government Department
Source State Departments
Micro irrigation has been an integral component in some of the schemes of Horticulture Division such as schemes for area expansion The quantum of subsidy varies in these schemes as compared to NMMI scheme This goes against the principle of convergence of schemes It is recommended that assistance for micro irrigation component on pattern of NMMI may be made available under ongoing area expansion schemes
Impact Evaluation Study on ldquoNational Mission on Micro Irrigation (NMMI)rdquo
26
It has been observed that the scheme implemented by the state departments such as horticulture agriculture and others are not fully yielding the desired results because of the following
1) The state departments are also occupied with their own targets and other related activities and are not able to devote desirable time for the implementation of NMMI activities
2) This also creates bias toward their own field such as horticulture department may not give due consideration to field crops etc
3) The extension workers of state departments are involved in providing extension services training and field demonstrations etc of their parent department which affects their working
It is being proposed that separate institute may be created in the line of AP and Gujarat model so that effectiveness transparency monitoring and targets are fully achieved The subsidy process flow charts for AP amp Gujarat are given in Annexure I The consultant has no bias against state departments or government institutions but for meeting the objectives of NMMI such recommendations have been proposed
355 Extent of Convergence with Other Schemes
One of the objectives NMMI scheme is to establish convergence and synergy among different on- going programmes in the country During the course of the study it was observed that in case of NMMI scheme there has been convergence among various on- going programmes such as National Food Security Mission (NFSM) NHM RADP RKVY Integrated Scheme of Oilseeds Pulses Oil palm and Maize (ISOPOM) Technology Mission on Cotton (TMC) and number of state level schemes being implemented by respective states
Rainfed Area Development Programme (RADP) - A Sub-Scheme under Rashtriya Krishi Vikas Yojana (RKVY) The basic premise of the proposed programme is to encourage exploitation of the potential of different farming systems based upon the natural resource assetsendowments (ponds land development nursery etc) created either by the farmers or through schemes like MGNREGA RKVY NHM and Watershed Projects This may act as a catalyst to accomplish the ultimate objective of enhancing productivity minimizing the risk of crop losses due to uncertainties of weather conditions harnessing efficiency of resources assuring food and livelihood income security at farm level and strengthen the farmersrsquo capacity to adapt to climatic changes Therefore converging the upgraded utilities developed through watershed development programmes MGNREGA in terms of water harvesting and micro water storages through effective application and distribution systems like improved conveyance field channels pressurized irrigation water lifting devices etc
Impact Evaluation Study on ldquoNational Mission on Micro Irrigation (NMMI)rdquo
27
to enhance the potential of farming systems The subsidy under this scheme is also extended for installation of pressurized micro irrigation as per norms of NMMI only if not possible through convergence All the States have reported convergence of Mission interventions with different schemes of the Government of India and State level programmes Most of the districts have converged NFSM interventions with programmes such as RKVY ICDP Farm Mechanization NHM Micro-Irrigation and other State programmes 356 Food Security and the Micro Irrigation Scheme To achieve required food production with increasing population India has to enhance the current irrigation potential of 91 M ha to 160 M ha but the total water resources estimated are 230 M hm4 to cater the need to the non-agricultural uses also The country is likely to be water stressed in the coming years Therefore hand in hand with technologies for water harvesting and storage technologies for precision water application methods need to be adopted The food security primarily has the three objectives of ensuring production of adequate food supplies maximizing stability in the flow of supplies and securing access to available supplies on the part of those who need them Access to food has two defined components to it One interventions aimed at boosting agricultural productivity and the second adopting strategies to promote employment social protection measures cash transfers to the poor to improve their access to the available food India has already in place social protection as a component of food security As mentioned earlier several projects for utilization of surface water as well as ground water resources have been undertaken However in some cases the unplanned development has led to over exploitation of the resource affecting the physical sustainability The adverse impact of such unplanned development is evident from the alarming decline in water table in some areas The developmental activities for utilization of water resources as also the development in other sectors particularly industrial sector coupled with urbanization have resulted in water pollution ndash both surface water as well as ground water Further the utilization of the created facilities is far from optimal as the water sector in India suffers from (a) relatively low water use efficiency and (b) increasing gap between the created irrigation potential and the utilized irrigation potential
In this regard it may also be important to note that the future development of water resources are bound to be more challenging as the easy options particularly from the
4Micro Irrigation Management in Cotton CICR Technical Bulletin No 31
Impact Evaluation Study on ldquoNational Mission on Micro Irrigation (NMMI)rdquo
28
topographical and geological considerations have since been tapped Further the future water resources development projects would need rigorous environmental and social evaluations In view of above mentioned challenges and particularly to address the two serious issues namely ldquofood securityrdquo and ldquoimpact of climate changerdquo initiatives have been taken by the Ministry of Water Resources to identify the most appropriate approach for water resources management and also to assign priorities Despite variations in availability of water both within and over the years the long term average available water resources of the country may be considered to remain unchanged Therefore the increasing demand for water for various purposes are bound to result in competition among the ldquousesrdquo as well as among the ldquouser groupsrdquo and with time such competitions are becoming fiercer and fiercer The conflicts among the ldquousers groupsrdquo are visible in the form of increasing inter-State issues The prioritization of water uses for different purposes at different point of in the planning process as also during the operation is becoming more and more challenging in view of conflicting social and economic considerations Such changing scenario calls for identification of most appropriate strategies for effectively addressing the future challenges At the current cereal intake of 143 kgs per capitalannum cereal requirement for household consumption will be around 192 million tons in 2020 The requirement will be more if the increase in household demand due to income growth is also considered At 5 per cent per annum growth in total expenditure and population of 1343 billion household cereal demand works out to 221 million tons in 2020 and for food grains 241 million tons With a grossing factor of 114 the total (household plus non-household) demand for cereals may be around 253 million tons The above cereal demand projections are made with the assumption of stability of tastes and preferences in food consumption If the trend of food grain production as witnessed during the last two decades is sustained the production of additional 57 million tons of cereals and 76 million tons of total food grains in the coming two decades may not be out of reach for India The demand projections may turn out to be on a higher side if the secular trend of change in consumer preferences away from cereal consumption persists Demand for superior food items such as dairy and animal husbandry products sugar fruits and vegetables are expected to grow much faster during the coming decades The estimated demand in 2020 for milk and milk products will be around 166 million tons edible oils 11 million tons meat fish and eggs 11 million tons sugar and gur 25 million tons and fruits and vegetables 113 million tons It may be noted that food grains pulses oilseeds sugar fruits and vegetables poultry dairy meat fish etc constitute the bulk of the output in the agriculture sector The performance of agriculture is important for availability and access to food as more than 55
Impact Evaluation Study on ldquoNational Mission on Micro Irrigation (NMMI)rdquo
29
per cent people in the country are dependent on this sector There are both short run and long run problems in agriculture Farmersrsquo suicides continue unabated even increasing in some states as growth rate in yield is on the decline Farming is fast becoming a non-viable activity Further scope for increase in net sown area is limited Land degradation in the form of depletion of soil fertility erosion and water logging has increased There has been decline in the surface irrigation expansion rate and a fall in the level of the ground water table Exposure of domestic agriculture to international competition has resulted in a high order of volatility in prices Disparities in productivity across regions and crops and between rain fed and irrigated areas has increased Long term factors like steeper decline in per capita land availability and shrinking of farm size are also responsible for the agrarian crisis Land issues such as SEZs land going to non-agriculture alienation of tribal land etc are becoming important The Steering Committee report on agriculture for the Eleventh Plan (GoI 2007) has identified the possible reasons for deceleration in agriculture since the mid- 1990s According to the report the major sources of agricultural growth are public and private investment in agriculture and rural infrastructure including irrigation technological change diversification of agriculture and fertilizersA major challenge to food security comes from dietary diversification of the poor If cereal pricing is left to the market forces government playing the facilitating role land may be released from rice and wheat cultivation to meet the growing demand for non-cereal crops such as oilseeds fruits and vegetables in accordance with diet diversification The micro irrigation system is a proven technology that helps in improving the productivity of crops by judicious use of water MI system has resulted in improving the productivity of wheat maize and pulses by 2405 1348 and 2869 respectively Area under horticulture crops as well as nutritional security has also enhanced The positive outcomes on the food security due to the increase in the production amp productivity of different crops and increased area under irrigation from same source of water However keeping in view the growth population of the country we need to boost the production that can be possible with the help of innovation amp transparency in the irrigation system in NMMI scheme 36 Mission Structure Review 361 National Level National Level The Horticulture Division in the Department of Agriculture amp Cooperation Ministry of Agriculture coordinates the overall activities and review the progress of implementation of the Mission in the country The Executive Committee (EC) of is chaired
Impact Evaluation Study on ldquoNational Mission on Micro Irrigation (NMMI)rdquo
30
by Secretary (AampC) Department of Agriculture amp Cooperation to oversee the activities of the Mission and to approve the State Annual Action Plans besides projects on technology transfer etc National Committee on Plasticulture Applications in Horticulture (NCPAH) is entrusted in the monitoring and reviewing the progress of the scheme Executive Committee (EC) reallocates resources across States and approves programmes on the basis of approved subsidy norms EC is empowered to approve special interventions for tackling emergent requirements EC can also constitute Sub-Committee (SC) Empowered Committee (EMC) and delegate power to SC EMC for emergent requirements like revision of cost norms inclusion of equipment etc if required based on the recommendations of EC of NMMI 362 State Level Micro Irrigation Committee (SMIC) At the State level State Micro Irrigation Committee (SMIC) under the Chairmanship of Agriculture Production Commissioner Principal Secretary (Horticulture Agriculture) oversees the implementation of the scheme in their respective States The Panchayati Raj Institutions in the State are also member of the SMIC represented in the SMIC and involved in the implementation of the Scheme The Chairman at his discretion can co-opt officials experts as invitees The SMIC meeting is held once in every quarter The state level micro irrigation committees have been assigned to perform the following functions as per the guidelines
1 Organise base line survey and feasibility studies in different parts of the state covering various crops and technologies
2 Ensure smooth implementation of Micro irrigation programme in different districts of the state
3 Ensure allocation of state share required for implementing the scheme and make it available to the implementing Agency
4 Finalise and forward the consolidated actions plans of the Districts to DAC
5 Register the System Manufacturers and circulate the list of System Manufacturerrsquos registered with SMIC along with the quoted price to the District Micro Irrigation Committee (DMIC) and Implementing agencies They will also indicate the quantum of money to be paid by the beneficiariesbanks to the manufacturers before installing the system
6 Mobilize credit requirement of the farmers through the Financial Institutions for installing Micro Irrigation System
7 Organise various training and extension programmes for farmers officials NGOrsquos entrepreneurs etc involving PFDCs
Impact Evaluation Study on ldquoNational Mission on Micro Irrigation (NMMI)rdquo
31
8 Host a website indicating the details and status of the progress of NMMI scheme in different districts of the state
During the course of discussions qualitative assessment was made on the basis of these parameters such as organise base line survey and feasibility studies in different parts of the state covering various crops and technologies are regularly prepared and accordingly assessment has been made Similarly the same criterion was adopted in other parameters to arrive at final assessment and these were summarized in the table 15 It may be seen from the table that the states of AP Gujarat Maharashtra are performing better than other states as far as their functions and responsibilities are concerned whereas Bihar and UP are the laagered states in this regard It may be premature to comment on the performance of Sikkim and Uttarakhand states because the scheme is recently implemented
Impact Evaluation Study on ldquoNational Mission on Micro Irrigation (NMMI)rdquo
32
Table 15 Performance of the Functioning of SMICs in Sampled States
Functions States
Base line survey and feasibility
studies
Implementation
Allocation of the State Share Action Plan
Registration of the System Suppliers
Mobilize Credit for Farmers
Capacity Building
Programme
Website Hosting Assessment
AP Medium High High High High Low-medium Medium Medium Medium-high
Bihar Low Low Low Low-medium Low-medium Low Low Low Low
Chhattisgarh Low-medium Medium Medium Medium High Low-medium Low-medium Low-medium Medium Gujarat Medium High High High High Low-medium Medium Medium Medium-high Haryana Low-medium Medium Low-medium High Low-medium Low-medium Low-medium Medium Low-medium Karnataka Low-medium Medium High High High Low-medium Medium High Medium-high Maharashtra Medium Medium High High High Low-medium Medium Medium Medium-high Odisha Low-medium Medium Low-medium High High Low-medium Low-medium Low-medium Medium Rajasthan Low-medium Medium High High High Low-medium Medium Medium Medium-high Tamil Nadu Medium Medium Medium High High Low-medium Medium High Medium-high UP Low Low Low Low Low-medium Low Low Low Low
Sikkim Low Low Low Low-
medium Low-medium Low Low Low Low
Uttarakhand Low Low Low High Medium Low Low Low Low Source GAPL analysis
Note High Response is more than 80 Medium Response is between 50 to 70 Low Response is below 50
Impact Evaluation Study on ldquoNational Mission on Micro Irrigation (NMMI)rdquo
33
The above table shows the assessment of performance amp functioning configuration The scales are used to represent the intensity of the functions ongoing into the sampled state The registration of the system suppliers are scaled as per the number of manufacturers in proportion to the size of the state It has been observed that AP Gujarat amp Maharashtra are leading states in the every aspect of the different activities involved in the process streamlined those are mentioned in the NMMI guidelines It has further been observed that Bihar UP Sikkim amp Uttarakhand states are lacking in terms of the functions mentioned in the guidelines There are still many dots to be connected in these states to get the desired and satisfactory results 363 District Level Micro Irrigation Committee (DMIC) At the District level District Micro Irrigation Committee (DMIC) headed by the Chief Executive Officer (CEO) of Zila Parishad District Rural Development Agency (DRDA) Collector of the District with members representatives from concerned departments viz Agriculture Horticulture Rural Development Irrigation and Water Resources Growersrsquo Association Krishi Vigyan Kendras (KVKs) and local lead Banks are responsible for implementing the NMMI programme in the district The DMIC meeting is held once in every month The DMIC performs the following functions as per the guidelines
1 Forward the District Action Plan to SMIC for compilation of State Action Plan and forward it to the Ministry of Agriculture
2 Mobilize credit requirement of the farmers through the Financial Institutions for installing Micro Irrigation System
3 Monitor and review the physical amp financial progress of implementation of Mission programme
4 Review the submission of utilization certificate by the implementing agency
5 Provide Feedback to SMIC on monthly basis by 6th7th of each month
It was observed that DMIC in almost all the states are preparing their district plans regularly and in time except for Bihar UP Sikkim and Uttarakhand and accordingly assessment has been made Similarly the same criterion was adopted in other parameters to arrive at final assessment The table below shows the extent of functioning at the district level It is also portraying almost the same picture that is being shown under the state level
Impact Evaluation Study on ldquoNational Mission on Micro Irrigation (NMMI)rdquo
34
Table 16 Performance of the Functioning of DMICs in Sampled States
Functions States
District Plan
Mobilizing Credit Review amp
Monitoring
Submission of
Utilization Certificates
Monthly Feedback amp Reporting
Own Assessment
AP High Low-medium High Medium High Medium-high Bihar Medium Low Low-medium Low Low-medium Low Chhattisgarh High Low-medium Medium Low-medium Medium Low-medium Gujarat High Medium High Medium High Medium-high Haryana High Low Medium Medium Medium Medium Karnataka High Medium High Medium High Medium-high Maharashtra High Medium High Medium High Medium-high Odisha High Low-medium Low-medium Low-medium Medium Medium Rajasthan High Low-medium High Medium High Medim-high Tamil Nadu High Low-medium Medium Medium Medium Medium UP Medium Low Low-medium Low Low-medium Low Sikkim Medium Low Low-medium Low Low-medium Low Uttarakhand Medium Low Low-medium Low Low-medium Low
Source GAPL analysis
Note High Response is more than 80 Medium Response is between 50 to 70 Low Response is below 50 364 Improving Efficacy of the Institutional Mechanism The following measures may be taken to improve the efficacy of the institutions involved in the implementation of the scheme
1 The utilization certificates to be submitted in time for the prompt release of the funds
2 SPV on the pattern AP state and separate institute like GGRC in Gujarat may be adopted for improving the efficiency and transparency
3 The meeting of various committees formed under the programme should be held regularly The meetings of the SMIC should be convened on quarterly basis and the same may also not tagged with other meetings in order to give proper focus on the implementation of the programme
4 Human Resource Development is one of the key factors for successful implementation of other sub components of any programme The capacity building at all levels -farmers field level workers technical officers and scientists and developing orientation skills of all the stake holders in the context of changing needs of agriculture to be intensified More training programmes for all the stakeholders should be organized
Impact Evaluation Study on ldquoNational Mission on Micro Irrigation (NMMI)rdquo
35
37 Role of Panchayati Raj Institutions (PRIs) in NMMI Scheme Panchayats have been entrusted mainly in identification of the beneficiaries in their respective jurisdiction The interested farmer put his application to the Panchayat and after verification the case is recommended Panchayati Raj Institutions are involved in the following activities i Selection of crops and identification of priority areas for implementation
ii Authorization of beneficiaries compilation of application forms proforma invoices and
creation of local initiatives in promotion of micro irrigation technology iii Organization of interactive meetings with the representatives of MI industry iv Training extension and awareness creation (added as per GoI notification dated 208
2013)
However during the course of discussions it was observed that PRIs role is not only limited to compilation of necessary documents required for submission of application forms but also involved in Information-Communication-Education (IEC) activities as shown it the
The major activities and roles of PRIs practiced in different sampled states are as follows
A Issues no objection certificate on first come first serve basis Gram Panchayat informs to Gram Sabha regarding the selection of NMMI beneficiaries as well as verification of the land ownership
B Verification amp certification of the farmersrsquo ownership amp domicile involved in IEC activities Issues no objection certificate on first come first serve basis
C Verification amp certification of farmersrsquo domicile Issues no objection certificate on first come first serve basis
D Verification amp certification of the farmersrsquo ownership amp domicile involved in IEC activities recommendation of farmersrsquo Issues no objection certificate on first come first serve basis
E It is suggested that Panchayati Raj Institutions are required to be more effective in their roles amp responsibilities as per the guidelines for which sensitization exercises through training and capacity building programmes may be initiated
Impact Evaluation Study on ldquoNational Mission on Micro Irrigation (NMMI)rdquo
36
4 Primary Survey Respondentsrsquo Profile and Findings Primary survey of 7400 farmers was conducted in 13 states as per the sampling plan detailed in chapter 2 The coverage is quite systematic amp comprehensive hence no distortion in the findings is expected due to disproportionate representation of any specific category
The purpose of analyzing the profiles of different respondents and deriving the findings was to evaluate the overall impact created by the scheme and to find the gap between planned objectives and outcome after the execution of the scheme along with identifying the best possible solution to fill the gap if any 41 Demographic Profile (Sampled Beneficiaries amp Non-beneficiaries) The socio economic conditions of the target group indicate their basic characteristics which may be instrumental in the adoption of new technologies and interventions The demographic profile of the farmers covered in the survey in terms of their education profile gender category etc is presented in the following section 411 Size of Land Holding The benefit of the NMMI scheme is extended to the farmers on the basis of size of holding As per the norms at least 33 percent of the allocation is to be utilized for the small marginal and women farmers Similarly the quantum of the subsidy is more for small and marginal farmers The beneficiaries in case of small and marginal farmers are eligible for subsidy up to 60 percent of the cost of drip sprinkler irrigation system and the remaining 40 percent have to borne by the farmers However in the case of general categories of the farmers subsidy assistance is 50 percent of the cost of the system which is shared in the ratio of 401050 by the central state government and the beneficiaries The states are free to provide additional subsidy to the beneficiaries from their own resources Keeping the above factor in view the sampled farmers were categorized as per the prescribed guidelines (Table 18) into three categories based on their land holdings such as marginal amp small farmer under 2 hectares medium between 2-10 hectares and large above 10 hectares The results on distribution of the farmers according to their land holding category have been presented in the table 17 for both beneficiaries and non-beneficiaries
Impact Evaluation Study on ldquoNational Mission on Micro Irrigation (NMMI)rdquo
37
Table 17 Land Holding Status of Beneficiary and Non Beneficiary Farmers
State
Beneficiaries Non Beneficiaries
Total Beneficiaries
Category of Farmers () Total Non-Beneficiary
Category of Farmers (`) Marginal amp
Small Medium Large Marginal amp Small Medium Large
AP 672 9241 759 000 168 9643 357 000 Bihar 516 1105 7945 950 128 5391 4453 156 Chhattisgarh 384 8359 1589 052 96 9375 625 000 Gujarat 576 4132 566 208 144 5833 3819 348 Haryana 320 3344 6062 594 81 4568 5185 247 Karnataka 576 7691 2292 017 144 8333 1667 000 Maharashtra 672 8304 1666 030 169 8343 1657 000 Odisha 480 5250 4708 042 120 5500 4417 083 Rajasthan 574 3711 6028 261 138 6884 2899 217 Sikkim 50 10000 000 000 10 9000 1000 000 Tamil Nadu 455 8286 1714 000 120 8333 1667 000 UP 527 3397 6546 057 168 6667 3273 060 Uttarakhand 90 5000 4667 333 22 7727 2273 000 Total 5892 5874 3943 183 1508 7308 2600 092 Source GAPL survey
Marginal small and medium category of farmers accounted for 5874 and 3944 percent of the beneficiaries where as 183 percent farmers are reported to be under large category among beneficiaries while among non-beneficiaries 73 percent farmers fall under the category of marginal-small farmers and 26 percent are under medium land holding category The distribution of large farmers among non-beneficiaries are not observed in Andhra Pradesh Chhattisgarh Karnataka Maharashtra Sikkim Tamil Nadu and Uttarakhand
The above table reveals that the proportion of a small and marginal farmers are observed to be highest in Sikkim followed by Andhra Pradesh Chhattisgarh Maharashtra and Tamil Nadu among the sampled farmers The proportion of medium and large farmers accounted for 3943 percent of the total beneficiaries
The data on size and distribution of operational land holdings in the country (Table 18) also suggest that medium and large farmers accounted about 15 percent of total land holdings thus occupying approximately 5542 percent of the total area The average size of land holding with the medium and large category of farmers was also noted to be 608 and 1810 hectare respectively
Impact Evaluation Study on ldquoNational Mission on Micro Irrigation (NMMI)rdquo
38
Table 18 Size and Distribution of Operational Holdings
SNo Category of Holding Size Group (Ha) Holding
()
Total Area Coverage
()
Average Size (Ha)
1 Marginal lt 10 671 225 039 2 Small 10 - 20 1791 2208 142
Sub Total 8501 4458 3 Semi Medium 20 - 40 1004 2363 271 4 Medium 40 - 100 425 212 576 5 Large gt 1000 07 1059 1738
Sub Total 1499 5542 Total 100 100 115
Source Agriculture Census -2010
In light of these facts the present limit of area up to 5 hectare under NMMI scheme needs to be re-looked and calls for relaxation of farm size limitations in providing subsidies This will not only increase the area under MI and improve the water use efficiency but will also contribute significantly towards food security on sustainable basis 412 Categories of Farmers The NMMI scheme is extended to all the categories of the farmers and the mission has earmarked the total allocation to SCST farmers as per their proportion to the population in the district The following table summarizes the categories on their category both for beneficiaries and non-beneficiaries
Table 19 Category wise Proportion of Beneficiary and Non Beneficiary Farmers
State Beneficiaries Non Beneficiaries
Total Beneficiaries
Farmers Categories () Total Non-Beneficiaries
Farmers Categories () Gen OBC ST SC Gen OBC ST SC
AP 672 2768 5074 1116 1042 168 3750 4345 1131 774 Bihar 516 3643 5853 213 291 128 2734 6641 391 234 Chhattisgarh 384 3438 2891 3307 365 96 1563 3854 3646 938 Gujarat 576 7222 2083 556 139 144 7569 2083 208 139 Haryana 320 8219 1656 000 125 81 6914 2716 000 370 Karnataka 576 6424 2049 712 816 144 6111 2431 903 556 Maharashtra 672 7574 2247 104 074 169 7633 2012 178 178 Odisha 480 5458 3354 917 271 120 5500 2667 1500 333 Rajasthan 574 3711 5279 714 296 138 3043 6522 290 145 Sikkim 50 2400 2200 5400 000 10 7000 2000 1000 000 Tamil Nadu 455 4044 5187 066 703 120 5750 3583 000 667 UP 527 4156 5408 019 417 168 2679 6131 119 1071 Uttarakhand 90 5444 1556 111 2889 22 4545 2273 000 3182 Total 5892 5097 3744 696 463 1508 4867 3919 683 531
Impact Evaluation Study on ldquoNational Mission on Micro Irrigation (NMMI)rdquo
39
It may also be seen from the above table which shows coverage of different categories of farmers selected for primary survey on random basis the implementing agencies in various states under study were able to provide the benefits of NMMI scheme to all the categories of the farmers based on its norms 413 Gender The role of the women in agriculture is more than 60 percent for conducting different farm activities like tending of animals farm operations ( except ploughing ) and other farms house activities In the guidelines of the NMMI schemes a special mention has been made for the benefits to be extended under the scheme to the women farmers Therefore the coverage of number of male and female beneficiaries in the survey is presented in the following table
Table 20 Gender Status of Beneficiaries and Non Beneficiaries
State
Beneficiaries Non Beneficiaries Total
Beneficiaries Gender () Total Non-
Beneficiary Gender ()
Male Female Male Female AP 672 8348 1652 168 9702 298 Bihar 516 9399 601 128 9688 313 Chhattisgarh 384 8932 1068 96 9271 729 Gujarat 576 9427 573 144 9792 208 Haryana 320 3781 6219 81 10000 000 Karnataka 576 8628 1372 144 9931 069 Maharashtra 672 9345 655 169 9822 178 Odisha 480 8896 1104 120 9833 167 Rajasthan 574 9059 941 138 9710 290 Sikkim 50 8800 1200 10 9000 1000 Tamil Nadu 455 8835 1165 120 9833 167 UP 527 8843 1157 168 9821 179 Uttarakhand 90 8667 1333 22 10000 000
Total 5892 8681 1319 1508 9768 236 Source GAPL Survey It may be seen from the above that proportion of male among the entire sampled respondent is higher than 85 percent in case of beneficiaries and non-beneficiaries both This may be due to the fact that in most cases the land is generally in the name of head of the family and being a patriarchic society land ownership rests with the male gender 414 Educational Status Education plays an important role in the development and the same is true for the NMMI schemes Therefore the education status of sampled farmers both beneficiaries and non-beneficiaries was enquired This information is summarized in table below
Impact Evaluation Study on ldquoNational Mission on Micro Irrigation (NMMI)rdquo
40
Table 21 Education Status of Beneficiaries and Non-beneficiaries
State
Beneficiary Non Beneficiary
Total Beneficiary
Education status () Total No of Non-
Beneficiary
Education status ( ) Not
Educated Primary High
School Sr
Secondary Graduate
and Above
Not Educated
Primary High school
Sr Secondary
Graduate and
above AP 672 223 2232 4435 2515 595 168 060 1964 5298 2321 357 Bihar 516 659 2035 3120 1667 2519 128 1016 2891 2813 1328 1953 Chhattisgarh 384 1120 3568 2526 1589 1198 96 521 4167 3125 1771 417 Gujarat 576 1128 2917 3073 1632 1250 144 1389 2986 3194 1042 1389 Haryana 320 2094 1438 2469 1438 2563 81 370 2716 3210 1852 1852 Karnataka 576 313 3090 4288 1354 955 144 625 3681 3264 1667 764 Maharashtra 672 298 2321 4003 1622 1756 169 414 2249 4201 1775 1361 Odisha 480 688 2708 3229 1750 1625 120 917 3250 3167 1250 1417 Rajasthan 574 784 4268 3937 557 453 138 1232 4275 4275 217 000 Sikkim 50 200 1600 3000 2000 3200 10 1000 1000 3000 2000 3000 Tamil Nadu 455 352 2374 4505 1165 1604 120 583 3917 4500 917 083 UP 527 607 3454 4023 1195 721 168 476 2560 4107 2024 833 Uttarakhand 90 1111 1889 2000 3556 1444 22 3636 1364 2727 1818 455 Avg Total 5892 677 2766 3664 1556 1336 1508 729 3037 3806 1499 928
Source GAPL Survey
Impact Evaluation Study on ldquoNational Mission on Micro Irrigation (NMMI)rdquo
41
In most of the sampled areas the most of the farmers are educated except in Haryana where about 21 percent of the beneficiaries reported to be not educated The higher proportion of graduate among beneficiaries in most of the states as compared to non-beneficiaries clearly indicates that educated and informed farmers are more likely to adopt MI Systems
415 Status of Communication Facilities
Communication Media is an important tool of flow of information particularly in agriculture as pre and post-harvest operation are time bound as well as subject to use of resources Quick and authentic information are required for weather forecast agriculture operations and practices information about the markets for disposal etc Numbers of portals such as AGMARKNET have been launched to benefit the farming community
Table 22 Mobile Phone Ownership
State Beneficiary having
Mobile () Non Beneficiary
having Mobile () AP 1979 1190 Bihar 8043 6016 Chhattisgarh 3854 625 Gujarat 8767 6597 Haryana 6719 5926 Karnataka 2934 903 Maharashtra 2426 414 Odisha 3333 1917 Rajasthan 5505 5507 Sikkim 7400 9000 Tamil Nadu 2462 250 UP 1195 1607 Uttarakhand 3556 1364 TOTAL 4189 2699
The consultants have captured the status of mobile ownership among beneficiaries as well as non-beneficiaries for the comparison purpose The following facts have been observed from the table above
40 percent of the farmers are having access to mobile phones The table further reveals that the maximum number of beneficiaries possessing mobile phones were in Gujarat (88) followed by Bihar (80) Sikkim (74) and Haryana (67)
This is an encouraging trend as farmers are making use of the Information and Communication Technology
Less than 27 percent of the non-beneficiaries have access to the mobile phones whereas the average of mobile holders among beneficiaries was noted to be around 42 percent
Impact Evaluation Study on ldquoNational Mission on Micro Irrigation (NMMI)rdquo
42
In may further be added here that total number of mobile users as per ldquoIndia Mobile Landscaperdquo (IML) 2013 study were 5548 crores and out of this about 298 crores (537) are 22 percent are in rural areas
Further if we analyze the overall scenario of mobile penetration it comes to about 25 percent The penetration of this technology was noted to be much higher in case of beneficiaries using mobiles
The field observations gathered from the farmers of sampled states correlates that with increase in income due to MI technologies the beneficiary farmers have started use of this technology
It shows that the different positive attributes of MI technology enabling adopters to access the technology updating themselves with the mobile technology that lead the beneficiaries towards attaining better social status due to increase of their income and purchasing power As for the availability of email IDs with the sampled farmers is concerned negligible number of farmers had this mode of communication 42 Results and Discussions 421 Quality of soil and irrigation water Irrigation with saline water through the conventional methods like flooding results in accumulation of salts in soil profile resulting in reduced availability of water to plants poor to delayed germination and slow vegetative growth rate However with the use of micro-irrigation systems (dripsprinkler) the saline water is applied frequently in lesser amounts due to which the evaporation losses of irrigation water are very less which prevents the accumulation of salts and keep their concentrations well below the harmful limit in crop root zone Thus at places where the fresh water resources are limited alternative non-conventional water resources like saline water aquifer may be exploited to feed the expansion drive for irrigation In this context the scientific use of saline water in conjunction with adaptable water use technologies has been advocated as a perfect proxy for irrigation The electrical conductivity of saline soils is gt 4 dSm and pH is gt 80 In the areas having problems of soil salinity the soil and water testing are specifically important to adopt the appropriate measures to draw full advantage of the micro irrigation system The data on extent of saline soils in the sampled states coupled with the farmers responses on getting their soils and water tested are cited in table 23 It has been documented that clogging factor in MI system is minor moderate and severe in water samples having EC values lt 080 08-31 and gt 31 dSm respectively Such values for pH have been reported to be lt70 70-80 and gt 80 (Patil 2001)
Impact Evaluation Study on ldquoNational Mission on Micro Irrigation (NMMI)rdquo
43
Table 23 Extent of Soil Salinity (in sampled states) and Beneficiaryrsquos Responses on Soil and Water Testing
State Status (000 ha)
Total Beneficiaries
Percent Response of the sample beneficiaries on
soil amp water testing Saline soils
Sodic Soil
Total Yes No
AP 7760 19661 27421 672 6146 3854 Bihar 4730 10585 15315 516 6705 3295 Chhattisgarh NA NA NA 384 6458 3542 Gujarat 168057 54143 222200 576 6927 3073 Haryana 4916 18340 23256 320 7781 2219 Karnataka 189 14814 15003 576 6910 3090 Maharashtra 18409 42267 60676 672 7336 2664 Odisha 14714 000 14714 480 6375 3625 Rajasthan 19557 17937 37494 574 7913 2087 Sikkim NA NA NA 50 5400 4600 Tamil Nadu 1323 35478 36801 455 5758 4242 UP 2199 134697 136896 527 5275 4725 Uttarakhand 000 000 000 90 7778 2222 Total 241854 347922 589776 5892 6887 3113 Source Central Soil Salinity Research Institute Karnal Haryana-20105
In the sampled states magnitude of soil salinity was noted to be highest in Gujarat followed by UP which was followed by Maharashtra and Rajasthan There is thus a strong need to launch special drives to motivate the farmers to get their soil and water samples tested This may enable them to adopt the recommended measures to prevent the clogging of emitters and enhance the crop productivity with the adoption of MI systems As per the guidelines of NMMI It is mandatory to conduct soil and water tests by MI system suppliers registered under the scheme Though about 6887 of sampled beneficiaries of all the 13 sampled states have got their soil amp water tested In Gujarat UP Maharashtra amp Rajasthan soil testing adopted by 6927 5275 7337 and 7913 of respondents respectively
It was further investigated if beneficiaries are aware about the importance of soil and water quality on the performance of the MI systems the results are presented in the table below
5Technical Bulletin CSSRIKarnal22010 Computerized Database on Salt Affected Soils in India AK Mandal RC Sharma Gurbachan Singh and JC Dagar 2010
Impact Evaluation Study on ldquoNational Mission on Micro Irrigation (NMMI)rdquo
44
Table 24 Extent of Awareness about Important Soil and Water Quality Parameters
State
Total Beneficiary
Soil quality testing Water quality testing pH EC pH EC
Yes ()
No ()
Yes ()
No ()
Yes ()
No ()
Yes ()
No ()
AP 672 238 9762 030 9970 000 10000 000 10000 Bihar 516 097 9903 058 9942 058 9942 058 9942 Chhattisgarh 384 000 10000 000 10000 000 10000 000 10000 Gujarat 576 521 9479 382 9618 434 9566 434 9566 Haryana 320 000 10000 000 10000 000 10000 000 10000 Karnataka 576 000 000 000 000 000 000 000 000 Maharashtra 672 313 9688 238 9762 283 9717 238 9762 Odisha 480 333 9667 333 9667 146 9854 146 9854 Rajasthan 574 9913 087 9913 087 9861 139 9843 157 Sikkim 50 1400 8600 000 10000 000 10000 000 10000 Tamil Nadu 455 000 000 000 000 000 000 000 000 UP 527 5275 4725 3226 6774 3529 6471 4288 5712 Uttarakhand 90 000 10000 000 10000 000 10000 000 10000 Total 5892 1599 6651 1354 6896 1368 6882 1429 6821
Source GAPL Survey
It has also been noted that farmers in most of the sampled states were not even aware of the importance of soil and water testing (Table 24)There is thus a dire need to create awareness about the importance of soil and water testing among farmers and make them aware of consequent clogging of emitters 422 Sources of Irrigation There are number of water sources in different parts of the states country such as bore well canals ponds tube wells etc from which the farmers get the irrigation water for their fields In this context information on the availability of water sources was compiled The following inferences have been drawn
Bore well is the most preferred source of water supply among the users of MI systems proportion being about 82 as may be seen from the table below
Further it may be seen that 100 percent of the farmers of Karnataka and AP have own bore wells followed by the farmers of Bihar UP Tamil Nadu Odisha Chhattisgarh Rajasthan and Gujarat The other important sources are canal well and spring water
Over 62 percent farmers of Sikkim reported to have farm ponds at their farms and remaining 38 percent from spring water which is an exception as compared to other states covered in the survey
Impact Evaluation Study on ldquoNational Mission on Micro Irrigation (NMMI)rdquo
45
It may also be inferred that more than 92 percent (bore well well and farm pond) of the beneficiaries have owned water sources which facilitates them to operate the MI systems as per the crop needs
Table 25 Source of Irrigation Water ()
State Total Beneficiary
Bore well Well Farm
Ponds Canals Bore well amp Canals
Canals amp Farm Ponds Others
AP 672 9970 000 000 000 000 000 030 Bihar 516 9845 000 019 058 078 000 000 Chhattisgarh 384 8464 000 026 000 000 000 1510 Gujarat 576 7517 2309 035 069 000 000 069 Haryana 320 4625 000 281 313 781 1406 2594 Karnataka 576 10000 000 000 000 000 000 000 Maharashtra 672 3958 5342 119 446 074 000 060 Odisha 480 9250 750 000 000 000 000 000 Rajasthan 574 7631 976 000 697 314 279 105 Sikkim 50 000 000 6200 000 000 000 3800 Tamil Nadu 455 9495 264 000 242 000 000 000 UP 527 9696 304 000 000 000 000 000 Uttarakhand 90 7667 000 000 000 000 000 2333 Total 5892 8181 1039 088 166 088 104 334 Source GAPL Survey
423 Water Table The cost of irrigation depends on the depth of the water available from the ground water sources In this regard the beneficiaries were asked to narrate the depth of the water table at their farms The pertinent data has been summarized in Table 26 which helps in the selection of appropriate capacity of the pump for smooth and efficient functioning of the system
Table 26 State wise Water Table Depth
State Total Beneficiaries
Water availability depth () 0-50 Ft 50-100 Ft 100-150 Ft 150-200 Ft 200-250 Ft gt250 Ft
AP 672 030 060 104 1845 7723 238 Bihar 516 4574 5000 426 000 000 000 Chhattisgarh 384 1198 1563 4661 1615 703 260 Gujarat 576 833 3090 1337 1424 660 2656 Haryana 320 2875 3438 1625 1000 438 625 Karnataka 576 000 538 972 1771 6493 226 Maharashtra 672 4613 2649 997 1280 357 104 Orissa 480 9792 208 000 000 000 000 Rajasthan 574 767 1760 3397 1446 348 2282 Sikkim 50 - - - - - - Tamil Nadu 455 000 1319 2396 5758 484 044 UP 527 3397 5028 1480 076 019 000 Uttarakhand 90 889 2444 667 000 778 5222 Total 5892 2436 2167 1439 1421 1775 677
Note The beneficiaries of Sikkim are not aware of the depth of water availability Source GAPL Survey
Impact Evaluation Study on ldquoNational Mission on Micro Irrigation (NMMI)rdquo
46
424 Sources of Awareness about NMMI Scheme The Table 27 shows that the mix trend among the farmers and the major sources of awareness was through fellow farmers service providers suppliers extension workers etc The highest proportion of awareness revealed in Chhattisgarh was through fellow farmers in Uttarakhand UP and Sikkim through extension workers It is interesting to note that the suppliersrepresentatives of the manufacturers are the major sources of awareness to the beneficiaries This may be due to the reason that the supplier of the system have their own interest in this competitive trade and motivate as well as facilitate the farmers in applying for the benefit
Impact Evaluation Study on ldquoNational Mission on Micro Irrigation (NMMI)rdquo
47
Table 27 Sources of Awareness Reported by Beneficiaries ()
State Total
Beneficiaries Fellow
Farmers Radio Newspaper TV Pamphlet
Extension worker
Supplier Fellow
Farmers amp Supplier
Fellow Farmers amp Extension
worker
Fellow Farmers amp Newspaper
Extension worker amp Supplier
Others
AP 672 2664 000 015 060 030 2217 4628 149 149 000 089 000 Bihar 516 2597 000 019 000 000 562 3450 1667 407 000 155 1143 Chhattisgarh 384 5365 000 000 000 000 130 3411 859 078 000 052 104 Gujarat 576 2153 000 122 156 069 226 1563 3941 694 226 035 816 Haryana 320 1813 094 000 000 000 6938 531 125 250 094 000 156 Karnataka 576 2396 017 017 017 000 069 1684 3663 694 1111 278 052 Maharashtra 672 2515 045 119 045 000 908 2247 3051 551 253 164 104 Orissa 480 2479 021 250 146 000 208 2021 3479 583 354 333 125 Rajasthan 574 3136 000 122 017 105 2596 3972 017 000 017 000 017 Sikkim 50 1600 000 000 000 000 4000 200 1200 1400 1000 000 600 Tamil Nadu 455 1516 154 000 000 000 088 1582 3934 703 1407 242 374 UP 527 2220 000 000 000 000 5674 1727 228 057 019 019 057 Uttarakhand 90 889 444 333 000 222 5444 1889 000 111 000 000 667 Total 5892 2561 032 068 042 024 1721 2514 1937 390 314 124 273
Note Other source of awareness includes multiple sources of different combinations Source GAPL Survey
Impact Evaluation Study on ldquoNational Mission on Micro Irrigation (NMMI)rdquo
48
Following the same pattern of the sources of awareness for beneficiary farmers the same was asked from the non-beneficiary farmers and their responses are summarized in the Table 28
Almost 1149 non adopters out of sampled 1508 are aware about the scheme that is about 76 percent It may be seen from the following table that the major sources of awareness for no adopters are other farmers suppliers and extension workers It may also be seen here that the awareness in most of the states is more than 70 percent except for Uttarakhand Rajasthan and Gujarat
Table 28 Source of Awareness of Scheme Reported by Non-beneficiary ()
State Total Beneficiaries
Other Farmers Radio Newspaper TV Extension
worker Supplier
Other Farmers
and Supplier
Other Farmers amp Newspaper
Others
AP 116 4655 172 690 086 1207 1638 517 431 603 Bihar 95 5684 000 000 000 526 2632 947 211 000 Chhattisgarh 53 9434 000 000 000 000 189 000 189 189 Gujarat 95 4737 105 000 105 000 316 3368 421 947 Haryana 69 7971 000 000 000 1014 435 290 290 000 Karnataka 126 5794 000 000 000 000 397 2381 1349 079 Maharashtra 154 5000 065 195 065 584 1429 1883 584 195 Odisha 98 4898 000 102 000 204 714 2551 1122 408 Rajasthan 95 6632 000 316 000 947 2000 105 000 000 Sikkim 10 5000 000 000 000 000 2000 3000 000 000 Tamil Nadu 106 3774 000 000 000 000 1226 2642 2358 000 UP 120 7583 000 000 167 1917 083 250 000 000 Uttarakhand 12 000 000 000 000 5000 5000 000 000 000 Total 1149 5701 035 131 044 653 1097 1462 661 218
Note The total number of non-beneficiaries in the above table is only those who are aware about the NMMI scheme Source GAPL Survey
425 Reasons for Non-adoption of Micro Irrigation Systems
The non-beneficiaries farmers were further asked the reasons for not adopting this technology Table 29 reveals following mix responses such as
Lack of awareness regarding subsidies lack of technical knowledge high capital cost and system is not required perception that the system is not economical therefore not required for the cropping pattern adopted by them
The 50 percent farmers from Sikkim reported that they have applied for the benefit but have not received the sanction so far
The farmers of Sikkim (50) Tamil Nadu (30) Odisha amp Rajasthan (23) and Karnataka (20) also reported that they have applied for the grant of subsidy for the installation of the system but have yet to receive the sanction
Impact Evaluation Study on ldquoNational Mission on Micro Irrigation (NMMI)rdquo
49
Table 29 Reasons for Non-adoption of NMMI Scheme ()
State Total non-Beneficiaries
Less awareness
about subsidy
Lack of technical
knowledge
Lengthy procedure
High capital
cost
Application pending
for clearance
Not required
Less awareness
about subsidy amp technical
knowledge
Less awareness
about subsidy amp
Lengthy procedure
Others
AP 168 595 536 000 3036 536 060 1964 179 3095 Bihar 128 938 2266 156 1250 938 313 1328 234 2578 Chhattisgarh 96 208 208 000 4479 000 000 625 000 4479 Gujarat 144 139 278 069 3889 1042 208 069 903 3403 Haryana 81 1975 000 000 1975 000 741 3827 000 1481 Karnataka 144 1875 2014 1944 2222 1944 000 000 000 000 Maharashtra 169 237 1124 059 3846 2367 118 769 592 888 Odisha 120 167 2250 000 3167 2333 000 083 167 1833 Rajasthan 138 1087 1232 145 2029 072 000 1957 362 3116 Sikkim 10 000 4000 000 000 5000 1000 000 000 000 Tamil Nadu 120 1000 2917 1583 1500 3000 000 000 000 000 UP 168 595 119 000 2679 060 179 3333 179 2857 Uttarakhand 22 909 000 909 455 909 000 000 2273 4545 Total 1508 756 1174 365 2712 1174 133 1227 292 2168
Source GAPL Survey 426 Willingness of Non Beneficiaries to Adopt MI System
In order to understand willingness of the non-beneficiary farmers for installation of micro irrigation system in their farms a specific question was raised during interviews The responses have been compiled in the following table which shows that more than three-fourth of the farmers of all the states are willing to install micro irrigation systems except in case of Chhattisgarh where more than half of the respondents reported that they are not willing to adopt the system This response shows that when awareness of the benefits of micro irrigation systems is created (it seems during the interview respondents realized the advantages) most non-beneficiaries indicated their willingness to adopt MI
Table 30 Willingness of Non-beneficiaries to Install MI System ()
State Total Non-Beneficiaries
Response in Percent Yes No
AP 168 9762 238 Bihar 128 9922 078 Chhattisgarh 96 4583 5417 Gujarat 144 7708 2292 Haryana 81 9136 864 Karnataka 144 9792 208 Maharashtra 169 9704 296 Odisha 120 9667 333 Rajasthan 138 9203 797 Sikkim 10 8000 2000 Tamil Nadu 120 8917 1083 UP 168 8036 1964 Uttarakhand 22 9545 455
Source GAPL Survey
Impact Evaluation Study on ldquoNational Mission on Micro Irrigation (NMMI)rdquo
50
427 Progress of Installation of MI System The sampled beneficiaries were asked when they installed the system in their respective fields The results are presented in the following table
Table 31 Year of Installation of MI System ()
States 2005-06 2006-07 2007-08 2008-09 2009-10 2010-11 2011-12 2012-13 AP 104 149 060 521 1667 3170 3080 1250 Bihar NA NA NA NA 329 1860 7287 523 Chhattisgarh NA 911 2188 1458 859 2578 1979 026 Gujarat 017 191 903 1146 1233 2465 3733 313 Haryana NA 469 969 813 969 2031 4750 NA Karnataka NA 382 938 1406 1719 1476 2951 1128 Maharashtra NA 699 595 1205 2396 2857 2158 089 Odisha NA 354 396 854 1125 1333 4271 1667 Rajasthan NA 505 540 575 836 2509 4808 226 Sikkim NA NA NA NA NA NA 7400 2600 UP NA 1575 1973 474 1120 702 3510 645 Uttarakhand NA NA NA NA NA NA 2889 7111 Tamil Nadu NA NA 088 2264 879 2044 2330 2396
Source GAPL Survey
The above table reveals that in the beginning of the scheme the response was slow and gradually picked up The momentum of adoption got accelerated after the up gradation of the scheme into the mission mode in 2010 428 Average Cost of Installing the MI System The state wise average system costs as reported by the respondents have been compiled in the table below
Table 32 Average Cost of Installing MI System (Rsha)
State Drip Sprinkler
AP 61474 20572 Bihar 61109 21380 Chhattisgarh 68797 25418 Gujarat 72086 26390 Haryana 66355 25699 Karnataka 59452 27062 Maharashtra 60531 21102 Odisha 54457 20860 Rajasthan 63258 28171 Sikkim 59654 22143 Tamil Nadu 60676 24450 UP 61766 20481 Uttarakhand 59373 25932
Source GAPL Survey
Impact Evaluation Study on ldquoNational Mission on Micro Irrigation (NMMI)rdquo
51
The following facts may be observed by analyzing the responses of sampled beneficiaries
On an average the cost of system incurred by the beneficiaries of various states ranged between Rs 5445736 Rsha to Rs 7208631 Rsha for drip system depending on the crop type spacing material components used etc
As per the NMMI guidelines the indicative cost for installation of drip system for
wide space crops varies from Rs 18820 to Rs 63598 per hectare whereas for close space crops it falls in the range of Rs 74437 to Rs 97598 per hectare
Comparatively high cost incurred by the sampled farmers in Gujarat is probably attributed to the fact that more area under drip is occupied by close spaced (0-10 m2 spacing) crops Detailed analysis of higher average cost of drip in Gujarat is given in annexure IV The average cost of sprinkler in the sampled states varied between Rs 20481 to Rs 28171per hectare which falls near the specified indicative cost of overhead sprinkler systems
429 Factors Influencing Farmers to Adopt MI system To validate the outcome of the slated objectives of the scheme the beneficiaries were asked to give the reasons for adoption of the scheme and the same are presented in the following table
Table 33 Reasons for Adoption of Micro Irrigation Systems ()
State Total Beneficiaries
Because of
Subsidy
Quality of
Produce
Water Saving
Proper Utilization
of Land
Labor Saving
Time Saving
Fertilizer Saving
Early Fruiting
Higher Production
AP 672 2113 1622 5298 2917 3333 5744 2054 1637 1295 Bihar 516 2054 1143 9012 1415 4089 9244 2500 116 3779 Chhattisgarh 384 599 651 9766 1693 2370 8464 4063 1667 7083 Gujarat 576 3524 1667 8090 938 5486 2118 3507 052 2969 Haryana 320 9813 5938 9969 5719 9313 9656 9563 4281 8500 Karnataka 576 469 712 8455 2396 6719 5434 3715 434 2292 Maharashtra 672 3006 1042 7589 1458 4375 4524 2813 699 2113 Odisha 480 1229 667 7813 1938 3896 4896 1854 458 4438 Rajasthan 574 523 1359 7735 2979 4843 3066 1969 557 244 Sikkim 50 000 800 9600 4400 7200 5000 4400 600 1800 Tamil Nadu 455 1319 1297 7121 2000 5099 6571 4308 462 2308 UP 527 5617 3435 8235 3416 7002 6983 5977 2732 5617 Uttarakhand 90 3111 1222 5111 556 111 000 3000 000 6667 Total 5892 2529 1621 7890 2323 4963 5667 3557 1042 3340
Note Multiple Responses have been given to this question
It may be seen from the above table that in all nine reasons were revealed by the farmers for adopting the scheme which include (a) water saving (b) time saving (c) labor saving (d) fertilizer saving (e) higher production (f) because of subsidy (g) proper utilization of land (h) quality of produce and (i) early fruiting
Impact Evaluation Study on ldquoNational Mission on Micro Irrigation (NMMI)rdquo
52
It may further be observed that majority of the farmers reported that due to MI system they are able to save the water time and labor It is also revealed that the farmers are not installing the system because of subsidy only but also on account of other benefits In Haryana (98) ampUP (56) farmers have installed MI system due to the subsidy It is therefore concluded from here that higher amount of subsidy is not leading to more area under micro irrigation but it is due to other reasons such as reduction in cost of cultivation and higher production because of judicious use of irrigation as well as shifting towards high value income crops 4210 Subsidy Disbursement As per the operational guidelines of NMMI scheme the system in the beneficiariesrsquo field should be installed within sixty days from the date of filing the application Similarly the amount of subsidy should also be released to the suppliers service providers within 60 days Most of the farmers of Chhattisgarh (96) followed by Haryana Karnataka Tamil Nadu and Sikkim have reported that their applications are processed in less than 20 days and more than 90 percent of the farmers across states have reported that they got the sanction letter less than 40 days Only in case of Uttarakhand 50 percent of the farmers reported they got sanction after 100 days which resulted mainly due to the delayed receipt of money from the concerned quarters The following table further reveals that the 97 percent of the farmers of Bihar followed by Chhattisgarh (90) Haryana (85) amp Karnataka (78) and about 70 percent of the farmers of Odisha and Sikkim got their system installed in less than 20 days About 60 percent of Gujarat farmers 50 percent of Maharashtra followed by Tamil Nadu (48) and AP (45) reported that they got their system installed in 20-40 days
Table 34 Farmerrsquos Responses for Time Taken to Sanction Subsidy ()
State Total Beneficiary
Application to Sanction(Days) Sanction to installation (Days)
0-20 20-40 40-60 60-80 80-100 gt100 0-20 20-40 40-60 60-80 80-100 gt100 AP 672 5342 4583 074 000 000 000 4955 4524 506 000 000 015 Bihar 516 5252 4128 388 174 058 000 9690 291 000 019 000 000 Chhattisgarh 384 9583 417 000 000 000 000 8984 911 078 000 000 026 Gujarat 576 4878 4826 243 052 000 000 3281 6024 434 174 000 087 Haryana 320 9000 750 000 156 094 000 8469 1344 000 188 000 000 Karnataka 576 8559 1441 000 000 000 000 7830 1597 556 000 000 017 Maharashtra 672 4628 5372 000 000 000 000 4807 4926 253 015 000 000 Odisha 480 6229 3417 229 125 000 000 7104 2854 021 021 000 000 Rajasthan 574 5610 4338 052 000 000 000 5035 4669 244 052 000 000 Sikkim 50 6600 3400 000 000 000 000 7200 2800 000 000 000 000 Tamil Nadu 455 7385 2527 088 000 000 000 4593 4791 505 110 000 000 UP 527 4858 5047 076 000 000 019 2543 4269 1139 1537 285 228 Uttarakhand 90 000 222 667 1333 2333 5444 444 1111 6111 2333 000 000 Total 5892 6139 3557 114 059 046 085 5813 3461 448 219 025 034
Source GAPL survey
Impact Evaluation Study on ldquoNational Mission on Micro Irrigation (NMMI)rdquo
53
4211 Sources of Margin Money The contribution of the cost of MI system has to be borne by the farmers depending on the quantum of the subsidy available It was observed that in almost all the states beneficiary farmers contribute their own funds for contributing margin money Other sources albeit a small proportion constitutes banking KCC amp money lenders It may be seen from the following table that a very few beneficiaries have availed the bank loan for margin money
Table 35 Source of Finance for Meeting Beneficiary Share for Installation of MI System
State Total
Beneficiary
Source of Beneficiary Share of MI ()
Own sources
Bank KCC Money Lenders
AP 672 9807 000 104 089 Bihar 516 10000 000 000 000 Chhattisgarh 384 10000 000 000 000 Gujarat 576 9583 417 000 000 Haryana 320 9344 031 438 063 Karnataka 576 10000 000 000 000 Maharashtra 672 9911 060 030 000 Odisha 480 9979 000 021 000 Rajasthan 574 10000 000 000 000 Sikkim 50 10000 000 000 000 Tamil Nadu 455 10000 000 000 000 UP 527 9734 000 133 133 Uttarakhand 90 10000 000 000 000 Total 5892 9866 049 053 025
Source GAPL Survey
4212 Interest Rates on Borrowing
The number of beneficiaries who borrowed funds from different sources was less than 2 percent and only 049 percent borrowed from banks as stated above The beneficiaries borrowed money from various sources on differential rates of interest and their responses have been summarized in the following table which reveals that most of the farmers who borrowed money at less than 10 percent of rate of interest from banks amp KCCs
Impact Evaluation Study on ldquoNational Mission on Micro Irrigation (NMMI)rdquo
54
Table 36 Rate of Interest Paid by the Beneficiaries on Borrowed Funds
State No of Beneficiaries
10 amp less 10-12 12-15 gt15 AP 13 0 0 0 Bihar 0 0 0 0 Chhattisgarh 0 0 0 0 Gujarat 4 16 4 0 Haryana 14 3 2 1 Karnataka 0 0 0 0 Maharashtra 4 1 1 0 Odisha 1 0 0 0 Rajasthan 0 0 0 0 Sikkim 0 0 0 0 Tamil Nadu 0 0 0 0 UP 14 0 0 0 Uttarakhand 0 0 0 0 Total 50 20 7 1
4213 Type of MI system and Area Coverage 42131 Technology wise area coverage The emitting devices (inline or online emitters) are designed to discharge water at prescribed rates depending on the specific requirements of various crops In the sprinkler irrigation system water is discharge under pressure in the air through a set of nozzles attached to a network of high density polyethylene (HDPE) pipes simulating rainfall and are suitable where the plant density is very high It is widely used in field crops The sprinkler irrigation system may be portable semi-permanent or large systems (Rain guns) The cost of all the system varies across the states
Table 37 Proportion of Farmers having Drip and Sprinkler MI Systems
State Total No of Beneficiaries
Drip Sprinkler Both AP 672 499 7426 166 2470 7 104 Bihar 516 6 116 450 821 60 1163 Chhattisgarh 384 152 3958 227 5911 5 130 Gujarat 576 452 7847 115 1997 9 156 Haryana 320 228 7125 82 2563 10 313 Karnataka 576 571 9913 4 069 1 017 Maharashtra 672 589 8765 72 1071 11 164 Odisha 480 114 2375 349 7271 17 354 Rajasthan 574 354 6167 216 3763 4 070 Sikkim 50 40 8000 9 1800 1 200 Tamil Nadu 455 385 8462 69 1516 1 022 UP 527 311 5901 214 4061 2 038 Uttarakhand 90 58 6444 32 3556 0 000 Grand Total 5892 3759 6380 2005 3403 128 217
Source GAPL Survey
Impact Evaluation Study on ldquoNational Mission on Micro Irrigation (NMMI)rdquo
55
The data on area coverage under drip and sprinkler irrigation system with the beneficiary farmers in the sampled states are cited in Table 37 It is evident that drip system is more popular than sprinkler in most of the states under study The data documents that on and average area coverage under drip was about to 64 34 sprinkler and about 2 of the beneficiaries have reported both the system The respective area coverage under drip in Karnataka Tamil Nadu Sikkim AP Gujarat and Maharashtra reported more than 75 area under drip However in case of sprinkler irrigation system Bihar registered highest area under the system followed by Odisha and Chhattisgarh The inference may be drawn here that the technology wise area coverage is shifting more towards the horticulture crops and less for the field crops
Table 38 Drip amp Sprinkler System wise Area Coverage by Sampled Beneficiaries
Technology wise area coverage (ha)
State Total Area
under MI
Area under Drip
Area under Drip
Area under Sprinkler
Area under Sprinkler
AP 72431 54869 7575 17562 2425 Bihar 78034 7357 943 70676 9057 Chhattisgarh 67933 27161 3998 40773 6002 Gujarat 120259 87156 7247 33103 2753 Haryana 64800 53741 8293 11058 1707 Karnataka 76113 76113 10000 000 000 Maharashtra 86433 76210 8817 10222 1183 Odisha 85221 29212 3428 56009 6572 Rajasthan 67101 58554 8726 8546 1274 Sikkim 3132 2728 8708 405 1292 Tamil Nadu 53953 47468 8798 6485 1202 UP 81932 55069 6721 26864 3279 Uttarakhand 8347 7021 8412 1325 1588
Source GAPL Survey 42132 The Crop wise Area Coverage The crop wise area coverage was computed from the total area under drip and sprinkler irrigation system the pertinent results are enumerated in table below Andhra Pradesh
In the state of AP major fruit crops under drip system were noted to be mango citrus and banana which covered around 5491 of total area under drip Among vegetable crops brinjal chilli and tomato occupied comparatively higher area under drip than other vegetable crops Vegetables occupied around 3424 area under drip Flower maize and sugarcane covered around 1085 of area under drip irrigation with sampled beneficiaries Out of total area under MI in AP 2424 of the area was noted under sprinkler system About 4406 of area under sprinkler was occupied by vegetable crops whereas other
Impact Evaluation Study on ldquoNational Mission on Micro Irrigation (NMMI)rdquo
56
crops such as cotton maize and ground nut consists of about 5594 of the total area under sprinkler
Table 39 Crop wise Area Coverage under Drip and Sprinkler Systems in AP (Sampled Beneficiaries)
Drip Fruit Vegetable Other Crop
Name Area(ha) of Area Name Area(ha) of Area Name Area(ha) of Area Mango 7885 1437 Brinjal 9552 1741 Flower 096 017 Banana 4898 893 Chilli 3524 642 Maize 2268 413 Citrus Fruits
14379 2621 Tomato 3293 600 Sugarcane 1346 245
Others 2964 540 Others 2420 441 Pulses 933 170 Cotton 455 083 Other 857 156 Total 30126 5491 18789 3423 5954 914
Sprinkler Name Area(ha) of Area Name Area(ha) of Area Brinjal 3219 1833 Groundnut 2550 1452 Chilli 1550 883 Cotton 4249 2420 Okra 1230 701 Maize 911 518 Tomato 1738 990 Other 2115 1204 Total 7738 4406 9824 5594
Source GAPL Primary Survey 2013 Bihar
In the state of Bihar major fruit crops under drip system were noted to be mango which covered around 60 of total area under drip Among vegetable crops Okra and potato have occupied comparatively higher area under drip than other vegetable crops Vegetables occupied around 34 area under drip Sugarcane has covered around 275 of area under drip irrigation with sampled beneficiaries
Table 40 Crop wise Area Coverage under Drip and Sprinkler Systems in Bihar (Sampled Beneficiaries)
Drip Fruit Vegetable Other Crop
Name Area (Ha) of Area Name Area (Ha) of Area Name Area (Ha) of Area Mango 4383 5957 Potato 834 1133 Marigold 040 055 Litchi 093 127 Okra 931 1265 Sugarcane 202 275 Kadam 061 083 Others Crop 732 996 Others 081 110 Total 4618 6276 2497 3394 243 330
Sprinkler Name Area (Ha) of Area Name Area (Ha) of Area Name Area (Ha) of Area Blackberry 121 017 Potato 11251 1592 Wheat 13533 1915 Brinjal 2408 341 Sugarcane 10846 1535 Cauliflower 2311 327 Maize 16475 2331 Okra 1801 255 Menthol 2137 302 Tomato 1740 246 Other Crop 6160 872 Others Crop 1894 268 Total 121 017 21404 3028 49151 6954 Source GAPL Primary Survey 2013
Impact Evaluation Study on ldquoNational Mission on Micro Irrigation (NMMI)rdquo
57
Chhattisgarh
In the state of Chhattisgarh major fruit crops under drip system were noted to be banana Papaya and watermelon which covered around 345 of total area under drip Among vegetable crops Cucumber brinjal tomato and bitter gourd occupied comparatively higher area under drip than other vegetable crops Vegetables occupied around 9655 area under drip Out of total area under MI in Chhattisgarh 3998 of the area was noted under sprinkler system About 2562 of area under sprinkler was occupied by vegetable crops whereas other crops such as wheat gram and soybean consist of about 7438 of the total area
Table 41 Crop wise Area Coverage under Drip and Sprinkler Systems in Chhattisgarh (Sampled Beneficiaries)
Drip Sprinkler Fruit Vegetable Vegetable Other Crop
Name Area (ha)
of Area Name Area(ha) of
Area Name Area (ha)
of Area Name Area
(ha) of Area
Banana 340 125 Tomato 6462 2379 Okra 2865 703 Wheat 9348 2293 Papaya 374 138 Cucumber 3887 1431 Tomato 3115 764 Pulses 9576 2349 Watermelon 223 082 Brinjal 2414 889 Bottle Gourd 1319 324 Other
Crop 11402 2796
Bitter Gourd 3416 1258 Others Crop 3148 772 Others Crop 10045 3698 Total 937 345 26224 9655 10447 2562 30325 7438
Source GAPL Primary Survey 2013 Gujarat
In the state of Gujarat major fruit crops under drip system were noted to be banana Papaya and pomegranate which covered around 1225 of total area under drip Among vegetable crops Chili tomato potato and onion occupied comparatively higher area under drip than other vegetable crops Vegetables occupied around 1636 area under drip Flower cotton sugarcane and caster covered around 7139 of area under drip irrigation with sampled beneficiaries Out of total area under MI in Gujarat 2752 of the area was noted under sprinkler system About 2574 of area under sprinkler was occupied by fruits and vegetable crops whereas other crops such as flower cotton groundnut and caster consist of about 7427 of the total area
Impact Evaluation Study on ldquoNational Mission on Micro Irrigation (NMMI)rdquo
58
Table 42 Crop wise Area Coverage under Drip and Sprinkler Systems in Gujarat (Sampled Beneficiaries)
Drip Fruit Vegetable Other Crop
Name Area(ha) of Area Name Area(ha) of Area Name Area(ha) of Area Banana 6303 723 Chilli 5274 605 Flower 020 002 Papaya 1113 128 Tomato 3337 383 Caster 6414 736 Pomegranate 1072 123 Potato 2113 242 Cotton 49859 5721 Others 2185 251 Onion 2408 276 Sugarcane 1417 163 Others Crop 1129 130 Other Crop 4512 518 Total 10674 1225 14260 1636 62222 7139
Sprinkler Name Area(ha) of Area Name Area(ha) of Area Name Area(ha) of Area
Pomegranate 890 269 Potato 6322 1910 Flower 182 055 Water Melon 101 031 Others Crop 1204 364 Cotton 5099 1540 Ground nut 4800 1450 Caster 3217 972 Bajra 5783 1747 Other Crop 5503 1662 Total 992 300 7526 2274 24585 7427
Source GAPL Primary Survey 2013 Haryana
In the state of Haryana major fruit crops under drip system were noted to be Kinnow lemon strawberry and watermelon which covered around 7771 of total area under drip Among vegetable crops tomato potato and cucumber occupied comparatively higher area under drip than other vegetable crops Vegetables occupied around 1905 area under drip Flower and cotton covered around 324 and 396 of area respectively under drip irrigation with sampled beneficiaries Out of total area under MI in Haryana 1706 of the area was noted under sprinkler system About 9250 of area under sprinkler was occupied by fruits and vegetable crops whereas other crops such as cotton and wheat consist of about 750 of the total area under sprinkler
Table 43 Crop wise Area Coverage under Drip and Sprinkler Systems in Haryana (Sampled Beneficiaries) Drip
Fruit Vegetable Other Crop Name Area(ha) of Area Name Area(ha) of Area Name Area(ha) of Area Kinnow 36321 6759 Tomato 2408 448 Flower 344 064 Lemon 1781 331 Cucumber 1568 292 Cotton 1396 260 Water Melon 1396 260 Potato 2355 438 Strawberry 1012 188 Others Crop 3905 727 Other Crops 1255 233 Total 41764 7771 10237 1905 1740 324
Sprinkler Name Area(ha) of Area Name Area(ha) of Area Name Area(ha) of Area Musk Melon 283 256 Tomato 3693 3339 Cotton 364 329 Water Melon 152 137 Potato 1194 1080 Wheat 465 421 Chilli 1113 1006 Others Crop 3794 3431 Total 435 393 9794 8856 830 750
Source GAPL Primary Survey 2013
Impact Evaluation Study on ldquoNational Mission on Micro Irrigation (NMMI)rdquo
59
Karnataka
In the state of Karnataka major fruit crops under drip system were noted to be banana areca nut pomegranate and mango which covered around 8425 of total area under drip Among vegetable crops tomato chilli and ginger occupied comparatively higher area under drip than other vegetable crops Vegetables occupied around 1161 area under drip Turmeric Pepper and others crops covered around 1396 1331 and 425 of area under drip irrigation with sampled beneficiaries Table 44 Crop wise Area Coverage under Drip and Sprinkler Systems in Karnataka (Sampled Beneficiaries)
Drip Fruit Vegetable Other Crop
Name Area (Ha)
of Area
Name Area (Ha)
of Area
Name Area (Ha)
of Area
Banana 26716 3510 Tomato 3790 498 Turmeric 1396 183 Pomegranate 7684 1010 Chilli 2252 296 Pepper 1331 175 Areca nut 8503 1117 Ginger 1076 141 Other Crop 425 056 Mango 5704 749 Others Crop 1718 226 Others 15516 2039 Total 64124 8425 8837 1161 3153 414 Source GAPL Primary Survey 2013
Maharashtra
In the state of Maharashtra major fruit crops under drip system were noted to be banana mango citrus fruits and grapes which covered around 4283 of total area under drip Among vegetable crops tomato brinjal and chili occupied comparatively higher area under drip than other vegetable crops Vegetables occupied around 757 area under drip Flower sugarcane cotton and other crops covered around 061 2012 2697 and 190 of area under drip irrigation with sampled beneficiaries Under sprinkler system about 158 of area occupied by vegetable crops whereas other crops such as flower cotton ground nut black gram and soybean consist of about 9842 of the total area
Table 45 Crop wise Area Coverage under Drip and Sprinkler Systems in Maharashtra (Sampled Beneficiaries)
Drip Sprinkler Fruit Vegetable Other Crop Vegetable Other Crop
Name Area (Ha)
of Area Name Area
(Ha) of Area Name Area
(Ha) of Area Name Area
(Ha) of Area Name Area
(Ha) of Area
Banana 12043 1580 Brinjal 2590 340 Flower 465 061 Brinjal 051 049 Flower 081 079 Mango 7838 1028 Tomato 1718 225 Cotton 20553 2697 Peas 040 040 Cotton 3497 3421 Grapes 587 077 Chilli 1055 138 Sugarcane 15334 2012 Tomato 071 069 Soybean 2929 2865 Citrus Fruits
4110 539 Others 405 053 Other Crop 1446 190 Ground nut
946 925
Others 8066 1058 Black Gram
1384 1354
Others 1224 1198 Total 32643 4283 5768 757 37799 4960 162 158 10060 9842
Source GAPL Primary Survey 2013
Impact Evaluation Study on ldquoNational Mission on Micro Irrigation (NMMI)rdquo
60
Odisha
In the state of Odisha major fruit crops under drip system were noted to be mango banana and cashew nut which covered around 7090 of total area under drip Among vegetable crops tomato brinjal and Okra occupied comparatively higher area under drip than other vegetable crops Vegetables occupied around 2515 area under drip Flower moong and sugarcane covered around 395 of area under drip irrigation with sampled beneficiaries Under sprinkler system about 8741 of area was occupied by fruits and vegetable crops whereas other crops such as moong maize sugarcane and others crop consist of about 455 148 217 and 439 of the total area
Table 46 Crop wise Area Coverage under Drip and Sprinkler Systems in Odisha (Sampled Beneficiaries)
Drip Fruit Vegetable Other Crop
Name Area (Ha) of Area Name Area (Ha) of Area Name Area (Ha) of Area Mango 8771 3002 Tomato 1803 617 Flower 121 042 Banana 3602 1233 Brinjal 1497 513 Moong 364 125 Cashew nut 2165 741 Okra 1042 357 Sugarcane 202 069 Others 6174 2113 Others Crop 3005 1029 Other Crop 465 159 Total 20711 7090 7347 2515 1153 395
Sprinkler Name Area (Ha) of Area Name Area (Ha) of Area Name Area (Ha) of Area
Pineapple 182 033 Brinjal 10350 1848 Moong 2550 455 Watermelon 324 058 Tomato 9410 1680 Maize 830 148 Okra 6297 1124 Sugarcane 1214 217 Cauliflower 5585 997 Other Crop 2459 439 Others Crop 16809 3001 Total 506 090 48451 8651 7052 1259
Source GAPL Primary Survey 2013
Rajasthan
In the state of Rajasthan major fruit crops under drip system were noted to be kinnow orange and mango which covered around 43 of total area under drip Among vegetable crops onion carrot and tomato occupied comparatively higher area under drip than other vegetable crops Vegetables occupied around 24 area under drip Flower cotton arandi and guar covered around 32 of area under drip irrigation with sampled beneficiaries Out of total area under MI in Rajasthan more of the area was noted under sprinkler system About 56 of area under sprinkler was occupied by fruits and vegetable crops whereas other crops such as flower wheat Mustard and cotton consist of about 44 of the total area
Impact Evaluation Study on ldquoNational Mission on Micro Irrigation (NMMI)rdquo
61
Table 47 Crop wise area Coverage under Drip and Sprinkler Systems in Rajasthan (Sampled Beneficiaries)
Drip Fruit Vegetable Other Crop
Name Area of Area Name Area of Area Name Area of Area Kinnow 6523 1114 Onion 5315 908 Flower 656 112 Orange 13019 2223 Tomato 2832 484 Cotton 11881 2029 Lemon 1854 317 Cauliflower 1510 258 Arandi 1730 295 Mango 1017 174 Others Crop 4396 751 Guwar 1463 250 Other Crops 3149 538 Other Crop 3209 548 Total 25563 4366 14052 2400 18939 3234
Sprinkler Name Area of Area Name Area of Area Name Area of Area Lemon 202 237 Carrot 3954 4626 Mustard 2488 2912 Others Crop 623 729 Wheat 647 757 Other Crop 631 739 Total 202 237 4577 5356 3767 4407 Source GAPL Primary Survey 2013
Sikkim
In the state of Sikkim major fruit crops under drip system were noted to be orange and guava which covered around 41 of total area under drip Among vegetable crops tomato and brinjal occupied comparatively higher area under drip than other vegetable crops Vegetables occupied around 42 area under drip Wheat and mustard covered around 313 of area under drip irrigation with sampled beneficiaries Out of total area under MI in About 70 of area under sprinkler was occupied by the vegetable crops whereas other crops such as wheat and turmeric consist of about 30 of the total area Table 48 Crop wise Area Coverage under Drip and Sprinkler Systems in Sikkim (Sampled Beneficiaries)
Drip Fruit Vegetable Other Crop
Name Area (Ha)
of Area Name Area
(Ha) of Area Name Area
(Ha) of Area
Orange 939 3442 Tomato 555 2036 Large Cardamom
142 519
Guava 182 668 Brinjal 263 964 Turmeric 243 890 Other Crop 333 1220 Other Crop 071 260 Total 1121 4110 1151 4221 455 1669
Sprinkler
Name Area of Area Name
Area (Ha)
of Area Name
Area (Ha)
of Area
Tomato 081 2000 Turmeric 081 2000 Cauliflower 081 2000 Other Crop 040 1000 Barackoli 081 2000 Others Crop 040 1000 Total 283 7000 121 3000 Source GAPL Primary Survey 2013
Impact Evaluation Study on ldquoNational Mission on Micro Irrigation (NMMI)rdquo
62
Tamil Nadu
In the state of Tamil Nadu major fruit crops under drip system were noted to be banana tapioca coconut and aonla which covered around 5528 of total area under drip Among vegetable crops tomato chili and brinjal occupied comparatively higher area under drip than other vegetable crops Vegetables occupied around 1780 area under drip Turmeric and sugarcane covered around 2692 of area under drip irrigation with sampled beneficiaries Out of total area under MI in Tamil Nadu 1202 of the area was noted under sprinkler system About 9923 of area under sprinkler was occupied by fruits and vegetable crops whereas other crops such as turmeric consist of about 078 of the total area Table 49 Crop wise Area Coverage under Drip and Sprinkler Systems in Tamil Nadu (Sampled Beneficiaries)
Drip Fruit Vegetable Other Crop
Name Area (Ha) of Area Name Area (Ha) of Area Name Area (Ha) of Area Banana 7875 1659 Chilli 2025 427 Turmeric 9501 2002 Tapioca 4994 1052 Brinjal 1720 362 Sugarcane 3278 691 Coconut 4953 1044 Tomato 1761 371 000 Aonla 3458 728 Others Crop 2944 620 Others Crop 4958 1045 Total 26238 5528 8451 1780 12779 2692
Sprinkler Name Area (Ha) of Area Name Area (Ha) of Area Name Area (Ha) of Area Carrot 081 125 Chilli 3197 4930 Turmeric 051 078 Potato 1740 2683 Carrot 1234 1903 Others Crop 182 281 Total 081 125 6354 9797 051 078 Source GAPL Primary Survey 2013 Uttar Pradesh In the state of UP major fruit crops under drip system were noted to be banana mango and guava which covered around 81 of total area under drip Among vegetable crops tomato potato and chili occupied comparatively higher area under drip than other vegetable crops Vegetables occupied around 19 area under drip Maize wheat and other crops covered around 144 of area under drip irrigation with sampled beneficiaries Out of total area under MI in UP about one-third of the area was noted under sprinkler system About 88 of area under sprinkler was occupied by fruits and vegetable crops whereas other crops such as wheat consist of about 12 of the total area
Impact Evaluation Study on ldquoNational Mission on Micro Irrigation (NMMI)rdquo
63
Table 50 Crop wise Area Coverage under Drip and Sprinkler Systems in UP (Sampled Beneficiaries)
Drip Fruit Vegetable Other Crop
Name Area of Area Name Area of Area Name Area of Area Banana 13173 2392 Potato 2752 500 Maize 263 048 Guava 12363 2245 Tomato 2863 520 Sunflower 020 004 Mango 16431 2984 Chilli 1295 235 Litchi 1538 279 Cabbage 911 165 Others Crop 951 173 Others Crop 2509 456 Total 44456 8073 10330 1876 283 051
Sprinkler Name Area of Area Name Area of Area Name Area of Area Strawberry 040 015 Peas 9611 3578 Flower 081 030 Tomato 4037 1503 Wheat 2703 1006 Brinjal 2529 942 Other Crop 314 117 Okra 1457 542 Others Crop 6091 2267 Total 040 015 23725 8832 3098 1153 Source GAPL Primary Survey 2013 Uttarakhand In the state of Uttarakhand major fruit crops under drip system were noted to be peach mango litchi and guava which covered around 96 of total area under drip Among vegetable crops only peas occupied around 201 area under drip Out of total area under MI in Uttarakhand about one-fourth of the area was noted under sprinkler system About 100 of area under sprinkler was occupied by vegetable crops
Table 51 Crop wise Area Coverage under Drip and Sprinkler Systems in Uttarakhand (Sampled Beneficiaries)
Drip Sprinkler Fruit Vegetable Other Crop Vegetable
Name Area (Ha)
of Area Name Area
(Ha) of Area Name Area
(Ha) of Area Name Area
(Ha) of Area
Mango 3217 4582 Peas 101 144 Popular Tree
202 288 Peas 1062 8015
Peach 1356 1931 Tomato 263 1985 Guava 1477 2104 Litchi 668 951 Total 6718 9568 101 144 202 288 1325 10000 Source GAPL Primary Survey 2013
The above tables also shows that crops as brinjal chilli Okra flower tomato bottle gourd pomegranate etc are irrigated with micro sprinkler irrigation system by the beneficiaries However during the course of discussion with experts it was observed that irrigation through this system is not recommended because it harms the crop at the flowering stage Therefore it is recommended that farmers should be advised at the time of installation to use drip irrigation for such crops or they may avoid use of sprinkler during flowering stage and irrigate through alternative means
Impact Evaluation Study on ldquoNational Mission on Micro Irrigation (NMMI)rdquo
64
4214 System Demonstration The outcome demonstration particularly in rural area where exposure is limited remains an important instrument in educating the rural folks because only physical or concrete evidence is convincing for them Seen evidence can be easily and correctly interpreted when in fact interpretation may be difficult thus gives better results NMMI scheme has a component of demonstrations at the farmersrsquo fields to educate the farmers of that particular cluster In this regard the farmers were asked whether they have exposure to any field visit demonstration MI system
Table 52 Exposure of Beneficiary Farmers to MI Demonstrations
State Participated () Yes No
AP 1250 8750 Bihar 3721 6279 Chhattisgarh 4896 5104 Gujarat 2830 7170 Haryana 9844 156 Karnataka 2726 7274 Maharashtra 4747 5253 Odisha 4167 5833 Rajasthan 6463 3537 Sikkim 8000 2000 Tamil Nadu 2330 7670 UP 2144 7856 Uttarakhand 6333 3667
Source GAPL Survey
It may be seen from the above table that the beneficiaries of Haryana (98) followed by Sikkim (80) Rajasthan (64) and Uttarakhand (63) attended the demonstration nearby their areas Whereas majority of the farmers AP UP Tamil Nadu Karnataka Gujarat Bihar have reported that they have not visited any demonstration It is therefore suggested that more efforts may be put to expose the farmers regarding demonstration of MI system and its benefits 4215 Training and Capacity Building The training and capacity building is an integral component of the MI initiatives This component has been inbuilt to upgrade the capacity building of farmers and field functionaries through training and demonstrations carried out by state agricultural universities Precision Farming Development Centers (PFDCs) and the industry In light of
Impact Evaluation Study on ldquoNational Mission on Micro Irrigation (NMMI)rdquo
65
these observations our survey gave due attention to the training component and the obtained results are enumerated in table 53 The data revealed that almost all the respondents of Tamil Nadu UP Chhattisgarh Haryana were given training materials during the training while few beneficiaries of the Bihar Uttarakhand amp Karnataka received such training materials It has also been noted that farmers were imparted training on operation and maintenance of the system adoption of package practices under MI opportunities for introducing new crops with the help of micro irrigation system As far as field visits are concerned most of the beneficiaries reported that they have visited the fields of progressive farmers and demonstration fields except for Chhattisgarh Rajasthan and Uttarakhand where few farmers have reported that they have visited the demonstration fields
Impact Evaluation Study on ldquoNational Mission on Micro Irrigation (NMMI)rdquo
66
Table 53 Topic Covered in Training for Beneficiary Farmers ()
State Total
Beneficiary
Training Material Provided
Topic Covered in the Training
Joined Any Field Visit
Satisfied with the Learning
Operation of the System
Maintenance of the System
Package of Practices for
the Crops
Opportunities for Introduction
of New Crop
Other Related Schemes
Yes No Yes No Yes No Yes No Yes No Yes No Yes No Yes No AP 672 7188 878 7991 074 7917 149 7113 952 5580 2485 6592 1473 6696 3304 7307 759 Bihar 516 950 1047 1977 019 1977 019 1453 543 601 1395 194 1802 446 9360 620 019 Chhattisgarh 384 9714 208 9922 000 9896 026 9766 156 7057 2865 7083 2839 8073 1927 7995 078 Gujarat 576 4531 313 4705 139 4653 174 3264 1580 1094 3750 1510 3333 3767 6233 3715 052 Haryana 309 9363 637 9385 615 9341 659 9099 901 6286 3714 6154 3846 8330 1670 9319 681 Karnataka 576 2638 6357 8937 057 8748 247 4459 4535 2979 6015 1575 7419 4592 5408 5047 342 Maharashtra 672 7188 878 7991 074 7917 149 7113 952 5580 2485 6592 1473 6696 3304 7307 759 Odisha 480 5878 253 6131 000 6116 015 5193 938 3929 2202 4926 1205 5744 4256 6086 045 Rajasthan 574 8171 261 8432 000 8223 209 8031 401 6707 1725 7038 1394 679 2735 6951 314 Sikkim 50 4771 438 5146 063 5167 042 4479 729 2396 2813 2833 2375 4333 5667 5000 208 Tamil Nadu 455 9965 035 9965 035 9931 069 9080 920 6059 3941 5955 4045 8507 1493 9670 330 UP 527 9800 000 9800 000 9800 000 8400 1400 5000 4800 4800 5000 8000 2000 9800 000 Uttarakhand 90 667 2667 2889 444 2889 444 778 2556 556 2778 444 2889 1111 2222 1556 1778
Source GAPL Survey
Impact Evaluation Study on ldquoNational Mission on Micro Irrigation (NMMI)rdquo
67
The farmers were asked whether they are satisfied from the training they received The beneficiaries of almost all the states gave positive response in this regard It is recommended that training on innovative techniques relevant to the MI Systems should cover topics such as high density plantation canopy management intercropping and use of mulch materials The beneficiaries were further asked about the institutions from which they have got the training about the MI system The obtained responses of the sampled beneficiaries are presented in the following table
Table 54 Institution for Training as Reported by Respondents ( Beneficiaries)
State Total Responses
SAUs KVKs PFDC
State Govt
Agencies
System Supplier Others
SAUs KVKs amp State Govt
Agencies
SAUs KVKs amp System Supplier
State Govt
Agencies amp System Supplier
AP 542 073 3229 6605 018 000 000 074 Bihar 103 1359 291 7961 000 000 291 097 Chhattisgarh 381 1365 079 4331 000 131 3832 262 Gujarat 279 359 430 9176 000 036 000 000 Haryana 309 194 906 8641 032 000 032 194 Karnataka 575 504 522 8974 000 000 000 000 Maharashtra 412 1360 437 7597 024 024 097 461 Odisha 250 240 160 8800 040 040 680 040 Rajasthan 484 534 331 9029 000 000 000 103 Sikkim 49 612 6531 2449 000 000 204 204 Tamil Nadu 427 211 000 9789 000 000 000 000 UP 474 211 211 9557 000 000 000 021 Uttarakhand 30 333 667 8667 000 000 000 333
Source GAPL Survey sharing of source technical Information regarding micro irrigation system scheme Note The duration of training has been reported to be of 1-2 days as revealed by the participant beneficiaries It may be seen from the above table that the system suppliers manufacturers are the major sources who imparted the training as more than 90 percent of the farmers of Tamil Nadu UP Gujarat Rajasthan and Karnataka received the training from suppliers Other sources of training are state government agencies and SAUsKVKs PFDC etc Most of the manufacturers imparted training at the time of system installation However it was revealed by the beneficiaries that after installation training on system operation is not provided to them as per their needs As such most of the farmers fail to draw full advantage of the MI system There is thus a dire need to provide technical support for system operation after installation It is recommended that regular trainings under MI system may be made mandatory on the part of system suppliers after the installation of the system as they are closely associated with the beneficiaries and have in-depth knowledge of the installed system
Impact Evaluation Study on ldquoNational Mission on Micro Irrigation (NMMI)rdquo
68
4216 Availability of Electricity The micro irrigation system runs on power and is a pre requisite for the installation of system therefore availability of power is an important parameter in this regard The following table shows the availability of electricity among all the states
Table 55 Availability of Electricity (Beneficiaries and Non Beneficiaries)
Beneficiaries Non Beneficiaries
State Total
Beneficiary
Availability of electricity () Availability of electricity () 0-4
HrsDay 4-8
HrsDay 8-12
HrsDay 12-16
HrsDay 16-20
HrsDay 20-24
HrsDay Total Non-
beneficiaries 0-4
HrsDay 4-8
HrsDay 8-12
HrsDay 12-16
HrsDay 16-20
HrsDay
AP 672 104 7113 2768 015 000 000 168 179 7560 2202 060 000 Bihar 516 1492 7888 581 039 000 000 128 1094 4844 2578 1484 000 Chhattisgarh 384 7943 1979 000 078 000 000 96 000 313 2083 5729 1875 Gujarat 576 000 9010 573 260 156 000 144 139 069 9722 069 000 Haryana 320 094 1719 6719 1438 000 031 81 123 1728 7284 864 000 Karnataka 576 000 9410 590 000 000 000 144 139 9444 556 000 000 Maharashtra 672 015 1994 7366 625 000 000 169 059 3018 6331 592 000 Odisha 480 083 1563 3104 4354 896 000 120 250 2250 2750 4500 250 Rajasthan 574 1690 6429 1376 505 000 000 138 145 9348 435 072 000 Sikkim 50 000 10000 000 000 000 000 10 000 8000 000 000 000 Tamil Nadu 455 000 10000 000 000 000 000 120 000 10000 000 000 000 UP 527 000 2068 7078 816 038 000 168 119 2143 6905 833 000 Uttarakhand 90 333 8778 000 000 889 000 22 1364 5909 2273 000 455
Source GAPL Survey
It may be seen that the supply of electricity in different states only one farmer among the beneficiaries that two of Haryana reported that the electricity available for 24 hrs It may further be seen that 100 percent of the farmers of Sikkim and Tamil Nadu reported to get electricity for 4-8 hrs in a day In other states it was observed that electricity is available for less than 16 hrs a day and out of which maximum reported to be between 12-16 hrs a days It may further be seen that farmers of Tamil Nadu Karnataka Rajasthan Sikkim and AP reported that they are getting electricity for 8 hrs whereas rest of the farmers reported that they are getting electricity up to 16 hrs a day The availability of electricity to beneficiaries and non-beneficiaries are showing the same trend
Impact Evaluation Study on ldquoNational Mission on Micro Irrigation (NMMI)rdquo
69
4217 Capacity of Pump Sets It may be seen from the following table that the majority of the farmers are using pump sets ranging upto 5 hp In AP and Maharashtra about 74 and 63 percent of beneficiaries reported that they are using the pump sets of 5-10 hp at their farms However about 59 54 41 percent farmers of Gujarat Haryana and UP respectively revealed that that they are having the pump sets of more than 10 hp The variations in the capacities of installed pump sets are attributed to the depth of water farm size type of MI system installed Most of the farmers reported that pump sets of appropriate capacity have been installed which thoroughly meet the system requirements and they are not facing any problem to irrigate the crops as per their requirements
Table 56 Capacity of Pump Sets Used by Beneficiaries
States Total
Beneficiary Power of the Pump Set ()
0-5 hp 5-10 hp 10-15 hp AP 672 2307 7426 267 Bihar 516 9845 097 058 Chhattisgarh 384 9896 000 104 Gujarat 576 347 3715 5938 Haryana 320 469 4094 5437 Karnataka 576 6319 3681 000 Maharashtra 672 2842 6295 863 Odisha 480 6771 3000 229 Rajasthan 574 8449 436 1115 Sikkim 50 6200 3800 000 Tamil Nadu 455 3275 6725 000 UP 527 493 5446 4061 Uttarakhand 90 4111 4444 1445
Source GAPL Survey 4218 Irrigation Filters Clean water is crucial for proper and effective long term operation of micro irrigation systems Water filtration is important for all irrigation systems Clogging of nozzles emittersdrippers reduce the efficiency of the MI system which ultimately results in increase in energy consumption and maintenance as well as cost of irrigation Filters can help extend the life of and lower the maintenance on sprinkler system For drip systems they are a necessity to prevent emitters from becoming plugged The yield is also affected because of clogging In drip and sprinkler irrigation the quality of water being pumped into the irrigation system is the most important factor in filter selection Filtration may be accomplished through use of filters They are sand separators media filter screen filter disc filter and settling basin
Impact Evaluation Study on ldquoNational Mission on Micro Irrigation (NMMI)rdquo
70
Sand separator or hydro cyclone filter is a type of filter that separates the particles from water according to the principle of gravitational settling and centrifugal force These are effective to remove suspended particles which have specific gravity more than 265 gcc (JISL) and are larger than 75 micron Such filters are suited for water type where a lot of sand is present in the water as they dont clog up nearly as quickly as other types of filters The dirty water enters the filter where it is swirled around the inside of a cylinder These filters are reasonably inexpensive very simple and are very effective for removing sand from water
Screen filters are probably the most common filters and in most case the least expensive and are excellent for removing hard particulates from water such as sand They are not so good at removing organic materials such as algae mold slime and other unmentionables These non-solid materials tend to embed themselves into the screen material from where they are very difficult to remove In other cases they simply slide through the holes in the screen by temporarily deforming their shape Screen filters are cleaned by flushing them with a stream of water or removing the screen and cleaning it by hand
Media filters clean the water by forcing it through a container filled with a small sharp edgedgranulated media In most cases the media material is uniform sized crushed silica sand The water passes through the small spaces between the media grains and the debris is stopped when it cant pass through these spaces Media filters are best for removing organic material from the water Media filters are the type of filters most commonly used for high volume cleaning of water from rivers and lakes Disc filters are a cross between a screen filter and a media filter with many of the advantages of both Disc filters are good at removing both particulates like sand and organic matter The pertinent information has been summarized in the following table below
Impact Evaluation Study on ldquoNational Mission on Micro Irrigation (NMMI)rdquo
71
Table 57 Type of Irrigation Filters Used by Farmers
Type of Irrigation Filters used by the Farmers () State Total
Beneficiary Total
Responses Hydro-cyclone
Filter
Screen filters
Sand Media Filters
Disc Filters
Hydro-cyclone
Filter ampScreen
filters
Hydro-cyclone Filter amp
Sand Media Filters
Hydro-cyclone Filter amp
Disc Filters
Screen filters
amp Sand Media Filters
Screen filters amp Disc Filters
Sand Media Filters ampDisc Filters
Hydro-cyclone Filter amp Screen
filters amp Sand
Media Filters
Hydro-cyclone Filter amp Screen
filters amp Disc
Filters
AP 672 672 015 9583 402 000 000 000 000 000 000 000 000 000 Bihar 516 6 000 8333 000 000 000 000 000 000 1667 000 000 000 Chhattisgarh 384 156 449 3141 000 5449 000 000 385 000 577 000 000 000 Gujarat 576 517 2244 1876 019 1973 348 019 2340 019 1103 058 000 000 Haryana 320 320 125 219 000 000 6469 125 031 1875 000 000 1094 063 Karnataka 576 576 035 7969 417 1580 000 000 000 000 000 000 000 000 Maharashtra 672 670 149 8478 075 1045 000 000 000 060 030 164 000 000 Odisha 480 480 021 9438 021 396 000 000 000 104 021 000 000 000 Rajasthan 574 568 141 8680 1056 000 000 018 000 053 035 018 000 000 Sikkim 50 50 000 9800 000 200 000 000 000 000 000 000 000 000 Tamil Nadu 455 455 044 8725 637 593 000 000 000 000 000 000 000 000 UP 527 524 248 8473 000 000 1240 000 000 038 000 000 000 000 Uttarakhand 90 90 000 10000 000 000 000 000 000 000 000 000 000 000
Source GAPL Survey
Impact Evaluation Study on ldquoNational Mission on Micro Irrigation (NMMI)rdquo
72
Different types of filters are mainly used for drip irrigation system whereas its use for sprinkler system is required under very specific water quality characteristics Some beneficiaries reported that they were using filters in sprinkler systems to check the plugging etc The beneficiary farmers using drip irrigation system were asked about the type of filters being used by them It may be seen from the table 58 that farmers are using screen filters centrifugal separators hydro-cyclone filter disc filter sand media filters depending on the need The data cited in the above table reveal that screen filters are being commonly used by the beneficiaries in most of the sampled states except Haryana where screen filters are being used in combination with hydrocyclone filters The combined use of filters in Haryana is attributed to the fact that additional subsidy is being given on hydro-cyclone type of filters In fact a combination of three filters (hydro-cyclone screen amp sand filter) is also being used by some beneficiaries of Haryana The use of such combinations may be ascribed to the fact that since Haryana government is extending financial assistance to construct water storage tanks as such many farmers prefer to store the water in such structures The incidence of different types of contaminations is higher in the stored water thus farmers are using combination of three types of filters to ensure the removal of all types of organic and inorganic materials Disc filters are used by about 55 percent farmers of Chhattisgarh followed by Gujarat (20) Karnataka (16) About 10 percent of the farmers of Rajasthan followed by 6 percent Tamil Nadu and 4 from AP are using sand filters may be because they are getting water from canals which has high dirt load of organic and inorganic materials The size of filter installed with MI system depends on the area being irrigated and the quantum of water being pumped It has been noted by the field staff that in most of the cases size of filters was appropriate as per the area soil and water quality characteristics 4219 Type of Emitters in drip system There are two categories of emitters usually installed with drip system in the field
a) In-line emitters These are used in row crops such as vegetables where water needs to be applied effectively near the root zone area
b) On-line emitters These are suitable to orchard crops such as apples mangoes etc These drippers are fixed on the laterals and can be opened for cleaning It provides uniform water distribution in the root zone The drippers may clog with physical impurities like minerals amp salts and also due to poor maintenance Further rodents and insects can damage lateral pipes of the drip irrigation system
Drip irrigation system left above the ground tends to clog less as in underground system chances of deposition of algae and soil particles is high It is also easy to lift while
Impact Evaluation Study on ldquoNational Mission on Micro Irrigation (NMMI)rdquo
73
preparing the fields for seed sowing or transplantation of seedlings Use of plastic mulch in conjunction with drip irrigation system has been reported to be more beneficial in saving water and improving the crop yields It was assessed during the course of study whether the sampled beneficiaries were using in-line or on-line drip system the pertinent data on type of emitters are cited in the following table
Table 58 Type of Emitters Used by Beneficiaries
State Total
Responses Inline Online
in Inline Online
AP 512 414 98 8086 1914 Bihar 6 4 2 6667 3333 Chhattisgarh 153 98 55 6405 3595 Gujarat 450 344 106 7644 2356 Haryana 236 128 102 5424 4576 Karnataka 575 359 216 6243 3757 Maharashtra 577 366 211 6343 3657 Odisha 118 84 34 7119 2881 Rajasthan 118 79 39 6695 3305 Sikkim 45 34 11 7556 2444 Tamil Nadu 384 256 128 6667 3333 UP 322 220 102 6832 3168 Uttarakhand 30 12 18 4000 6000
Source GAPL Survey It may be seen from the above table that more than 70 percent of the respondent farmers of AP Gujarat Sikkim and Odisha were using in-line drip irrigation system whereas more than 45 percent beneficiaries of Haryana and Uttarakhand reported to practice on-line drip irrigation system 4220 Type of Sprinkler Under sprinkler irrigation water is sprinkled under pressure on to the crop through a set of nozzles attached to network of pipes in the form of rainfall The sprinkler system sets unlike drip system are moveable Hence one sprinkler set could cover more than one hectare by shifting from one place to another Assistance for sprinkler irrigation is limited to only those crops where drip irrigation is uneconomical
Impact Evaluation Study on ldquoNational Mission on Micro Irrigation (NMMI)rdquo
74
Table 59 Type of Sprinklers Used by Beneficiaries
State Total Responses Percentage
Portable MiniMicro Rain gun AP 160 2072 7928 000 Bihar 510 9471 529 000 Chhattisgarh 231 7745 2251 000 Gujarat 126 8810 1111 079 Haryana 84 9524 476 000 Karnataka 87 3218 6667 114 Maharashtra 95 9368 632 000 Odisha 362 9613 387 000 Rajasthan 356 7556 2444 000 Sikkim 10 8000 2000 000 Tamil Nadu 71 9718 282 000 UP 205 9707 293 000 Uttarakhand 60 8833 1167 000
Source GAPL Survey It may be seen from the above table that majority of the beneficiaries of Tamil Nadu Rajasthan Odisha Bihar Maharashtra Gujarat and Uttarakhand states were using portable sprinkler irrigation system The use of rain gun was reported by one farmer only in Gujarat as it is most suitable to the large area under cultivation It is noted to be appropriate type of sprinkler system for larger areas as it can rotate 30 to 360 circle covering 25 meter radius with a discharge rate 175 lps 4221 Farmersrsquo opinion on System Supply and Installation related constraints The farmers were asked to reveal the difficulties faced by them right from the filing of application till receiving the after sales service including procedures quality of the systems supplied prices charged by empanelled system suppliers delay in installation after the placement of orders and any additional charges claimed by the supplies The response of the beneficiaries has been summarized in the table below
Impact Evaluation Study on ldquoNational Mission on Micro Irrigation (NMMI)rdquo
75
Table 60 Constraints Faced by Beneficiary Farmers ()
State Total
Beneficiaries
Procedure Related
Quality Issues
Higher Prices Charged
under Scheme then Available
in Market
Delay in System Supply
(Committed date vs Actual
date
Other Charges (Not covered in
the scheme additional
money paid) Yes No Yes No Yes No Yes No Yes No
AP 672 000 10000 060 9940 060 9940 060 9940 015 9985 Bihar 516 078 9922 155 9845 155 9845 252 9748 717 9283 Chhattisgarh 384 026 9974 000 10000 000 10000 000 10000 000 10000 Gujarat 576 25 975 313 9688 191 9809 278 9722 139 9861 Haryana 320 094 9906 094 9906 063 9938 281 9719 000 10000 Karnataka 576 000 10000 000 10000 000 10000 000 10000 000 10000 Maharashtra 672 030 9970 089 9911 074 9926 104 9896 074 9926 Odisha 480 000 10000 000 10000 000 10000 479 9521 021 9979 Rajasthan 574 1359 8641 854 9146 1045 8955 1045 8955 1045 8955 Sikkim 50 000 10000 200 9800 000 10000 000 10000 000 10000 Tamil Nadu 455 000 10000 000 10000 000 10000 000 10000 000 10000 UP 527 152 9848 209 9791 114 9886 285 9715 019 9981 Uttarakhand 90 3556 6444 3889 6111 5444 4556 3556 6444 889 9111 Total 5892 233 9767 229 9771 246 9754 304 9696 205 9795
Source GAPL Survey It is evident from the data that in most of the sample states beneficiaries did not face much of the difficulties related to the procedures quality prices delay in system installation etc 4222 After Sales Service The information on magnitude and quality of after sales services being provided by the suppliers has been summarized in table 61 On an average 91 percent of the beneficiaries across the sampled states reported that after sales services are being provided to them However about 34 percent beneficiaries from Bihar and 22 percent beneficiaries from Gujarat amp Maharashtra each informed that they did not receive the after sales services As for the timely and regular availability of after sales services is concerned about 87 percent beneficiaries reported that they receive the services at the required time
Impact Evaluation Study on ldquoNational Mission on Micro Irrigation (NMMI)rdquo
76
Table 61 Status Reported by Beneficiaries Regarding lsquoAfter Sales Servicesrsquo
State Total Beneficiary Provided by the vendor () If yes then ()
Yes No Timely Late Irregular AP 672 10000 000 8051 1949 000 Bihar 516 6570 3430 8378 1563 059 Chhattisgarh 384 10000 000 10000 000 000 Gujarat 576 7778 2222 8973 558 469 Haryana 320 10000 000 9156 438 406 Karnataka 576 9896 104 9045 920 035 Maharashtra 672 7768 2232 7854 1897 249 Odisha 480 9229 771 8871 880 248 Rajasthan 574 9582 418 9327 618 055 Sikkim 50 10000 000 9800 200 000 Tamil Nadu 455 9890 110 8813 1187 000 UP 527 9772 228 8854 1126 019 Uttarakhand 90 10000 000 2000 2222 5778 Total 5892 9085 915 8697 1083 220
Source GAPL Survey
The respondents were further enquired regarding the level of satisfaction with respect to after sale services and their responses are given in the Figure 8 It is well evident that on an average 87 percent of the beneficiaries across the entire 13 states received the after sales services to their complete satisfaction
During the course of field survey the respondents were asked whether this system supplier have given after sale service for the MI system installed at their farms The results regarding this issue have been summarized in above table It may be seen from the table that the farmers of Chhattisgarh AP Sikkim and Uttarakhand have reported that 100 percent after sale service was provided to them whereas two-third of the farmers reported regarding after sale service The farmers of the most of the states have got the benefit of this service
It is suggested that the implementing agencies should be more vigilant regarding warranty and after sales service of the system provided by the suppliers The question of releasing 10 percent of the cost of the system after one year subject to satisfactory performance of the system as certified by the beneficiary may be considered Maintenance manual in vernacular language should be made available to the beneficiaries at the time of installation of the system
Impact Evaluation Study on ldquoNational Mission on Micro Irrigation (NMMI)rdquo
77
Figure 8 Level of Satisfaction regarding lsquoAfter Sale Servicesrsquo
Source GAPL Survey
4223 Warranty As per the norms of NMMI the system suppliers are supposed to extend warranty to the beneficiaries regarding MI system installed at their farms In this regard the beneficiaries were asked regarding issue of warranty to them and their replies are summarized in table 62
Table 62 Status of Warranty for MI System ()
State Total
Beneficiary Warranty () If yes then () Yes No lt6 Months 1 Yr 1-2 Yr 2-3 Yr gt3 Yr
AP 672 10000 000 000 104 565 6533 2798 Bihar 516 3527 6473 000 165 275 5769 3791 Chhattisgarh 384 9948 052 000 000 052 890 9058 Gujarat 576 9948 052 000 017 035 070 9878 Haryana 320 10000 000 000 000 031 9969 000 Karnataka 576 10000 000 000 017 087 8906 990 Maharashtra 672 10000 000 000 238 491 3557 5714 Odisha 480 10000 000 000 021 167 2042 7771 Rajasthan 574 10000 000 000 087 3101 976 5836 Sikkim 50 10000 000 000 9000 000 800 200 Tamil Nadu 455 10000 000 000 022 044 7736 2198 UP 527 9981 019 000 019 646 8422 913 Uttarakhand 90 10000 000 667 3556 1667 4111 000 Source GAPL Survey
It may be seen from the above table that the beneficiaries of all the states under study have reported that they have got the warranty as per the requirement except for Bihar
Impact Evaluation Study on ldquoNational Mission on Micro Irrigation (NMMI)rdquo
78
were majority of the farmers reported that they did not get this benefit The farmers were further asked the duration of the warranty issue to them by the company Almost all the farmers of Chhattisgarh and Gujarat have reported that they received this facility for three years and the farmers of other state reported that they got warranty for their system for less than two years It is important that system suppliers should give two years warranty as per the guidelines of the scheme and it is proposed that in order to enforce this clause 5 percent subsidy may be released after the completion of warranty period 4224 Promotional Activities NMMI agencies are promoting the adoption of micro irrigation and its benefits to the growersrsquo awareness through various promotional tools such as publicity through newspapers radios TV and other sources which are summarized in the following table
Table 63 Awareness about Promotional Activities ()
State Total
Beneficiary
Publicity of the MI Scheme in local
language
Awareness of the dedicated website for MI Scheme in
the State
Awareness of the package of
practices being adopted for MI
Yes No Yes No Yes No AP 672 9866 134 9226 774 9940 060 Bihar 516 9128 872 000 10000 9729 271 Chhattisgarh 384 9948 052 9453 547 9844 208 Gujarat 576 7604 2396 7118 2882 8854 1146 Haryana 320 9719 281 6688 3313 9656 344 Karnataka 576 9965 035 2587 7413 9965 035 Maharashtra 672 9628 372 9003 997 9940 060 Odisha 480 9813 188 083 9917 9917 083 Rajasthan 574 9826 174 645 9355 9303 697 Sikkim 50 10000 000 200 9800 9800 200 Tamil Nadu 455 10000 000 9868 132 9956 044 UP 527 8235 1765 2694 7306 9127 873 Uttarakhand 90 9444 556 8000 2000 8444 1556 Total 5892 9411 589 5204 4796 9637 367 Source GAPL Survey
It may be seen from the above table that the farmers of the majority of the states that the implement agencies are promoting NMMI schemes in local language and almost 100 percent results were observed in Tamil Nadu Sikkim Odisha Rajasthan Chhattisgarh Karnataka and Maharashtra It is interesting to note that awareness of the dedicated website for MI scheme was limited
Impact Evaluation Study on ldquoNational Mission on Micro Irrigation (NMMI)rdquo
79
The beneficiaries were further asked whether they are aware of the package and practices being adopted for MI and the response were found to be very positive This reveals that the beneficiaries who have installed micro irrigation in their farm are aware of the package and practices to be followed for taking full advantage of the MI system supported cultivation
43 Observations of Field Staff on MI System In addition to farmersrsquo investigation the field survey team also visited the fields to observe the design and working of the system The field investigators have highlighted their observations regarding the condition of the MI system overall designing of the system installed and general conditions of the field The results regarding the observations of the field staffs are given in the following table below
Table 64 Observations of Surveyors regarding MI System Status at the Time of Field Visit
State
Overall Design
Drip Sprinkle MI System
match crop requirement
General Condition of the System
Flood Irrigation
along with MI System
Design () () System Condition ( `) () Good Satisfactory Bad Yes No Good Average Bad Yes No
AP 5982 4018 0 9777 223 5759 4226 015 6205 3795 Bihar 6298 3702 0 7791 2209 4942 5019 039 7558 2442 Chhattisgarh 7760 2240 0 9792 208 7188 2813 0 9844 156 Gujarat 6892 3038 069 9688 313 6094 3785 122 5278 4722 Haryana 9656 344 0 10000 0 9875 125 0 9781 219 Karnataka 5538 4462 0 9983 017 5417 4583 0 8090 1910 Maharashtra 6637 3363 0 9881 119 5536 4360 104 4970 5030 Odisha 4917 5083 0 9625 375 6500 3479 021 7813 2188 Rajasthan 8833 1167 0 9146 854 7648 2352 0 8153 1847 Sikkim 3600 6400 0 10000 0 6600 3400 0 6600 3400 Tamil Nadu 5582 4418 0 9912 088 4549 5451 0 8044 1956 UP 7381 2581 038 9791 209 5142 4801 057 8861 1139 Uttarakhand 9667 333 0 9222 778 8556 1444 0 9556 444 Total 6767 3223 010 9571 429 6124 3841 036 7463 2537
Source GAPL Survey It may be seen from the above table that in almost all the states under study the overall designing of the system was found to be satisfactory Majority of the field staff observed that system designs met the farmersrsquo requirements however in the state of Bihar only about 78 percent of the MI Systems were designed which could meet the crop requirements Remaining 22 percent of the systems have not been designed perfectly which could meet the water requirements of different crops It has also been observed by
Impact Evaluation Study on ldquoNational Mission on Micro Irrigation (NMMI)rdquo
80
the field investigators that some of the farmers have adopted innovative plant management techniques especially high density plantation in fruit crops and intercropping In almost all the states the sampled beneficiaries also revealed that no technical support guidance on agronomic practices are extended to the users by MI system suppliers as they generally tell the beneficiaries to take the help of extension agencies It was also observed that most of the beneficiary farmers have been using both the techniques of water application that is flood and the micro irrigation 44 Assessment of the System Design
Selection of MI Companies participating in NMMI at State level are based on the following parameters
a Manufacturing capacities of various equipment
b Financial strength of the company
c Dealer network
d Working experience in projects
e Availability of technical manpower
At the time of registration of the manufacturers it is mandatory that the quality of the system should be of BIS standards and the design must meet the requirements of the farmers in terms of its suitability to crops and field situations The conditions for providing after sale service and the warranty of the system are also laid at the time of registration To validate these parameters the beneficiaries were inquired regarding such issues and their responses are summarized in the table 65
The data indicate that the farmers in almost all the states reported that components of MI System met the BIS norms The average figure for all the sample states where system components were as per the BIS norms came out to be around 98 percent There is a need that variations reported in terms of not having BIS components as per NMMI guidelines may be brought to the notice of respective implementing agencies for further necessary action In more than 95 percent cases size of pumps was reported to be as per crop water amp plot size requirements except for the state of Bihar where around 18 percent respondents gave a negative reply
Impact Evaluation Study on ldquoNational Mission on Micro Irrigation (NMMI)rdquo
81
Table 65 Assessment of the System Design ()
State Total
Beneficiary
System components supplied are as per the
BIS
Pump size is proper to the field plot size wrt crop water requirements
MI system meets requirements
Design layout is as per project proposal
After sales service has been provided by the
MI system suppliers
MI systems found to be functional in
the field
Yes No Yes No Yes No Yes No Yes No Yes No AP 672 9970 030 9955 045 9955 045 9970 030 9940 060 9926 074 Bihar 516 9476 524 8217 1783 9845 155 8740 1047 6337 3663 6880 3120 Chhattisgarh 384 9974 026 10000 000 9974 026 10000 000 7396 2604 7552 2448 Gujarat 576 9722 278 9861 139 9635 365 9618 365 9520 480 9427 573 Haryana 320 10000 - 9938 063 9875 125 10000 000 9375 625 9281 719 Karnataka 576 10000 - 10000 000 10000 000 10000 000 10000 000 9549 451 Maharashtra 672 9732 268 9970 030 9985 015 9717 283 7842 2158 9821 179 Odisha 480 9896 104 9958 042 9958 042 9896 104 8646 1354 6667 3333 Rajasthan 574 9599 400 9425 575 9077 923 9408 610 9181 836 8798 1202 Sikkim 50 9600 400 10000 000 10000 000 10000 000 10000 000 9000 1000 Tamil Nadu 455 10000 - 10000 000 10000 000 10000 000 10000 000 9055 945 UP 527 9526 474 9962 038 9829 171 9943 057 9791 209 6603 1499 Uttarakhand 90 9778 222 8778 1222 7222 2778 9222 778 4889 5111 8222 1778
Source GAPL Survey
Impact Evaluation Study on ldquoNational Mission on Micro Irrigation (NMMI)rdquo
82
It was also observed by the field investigators that more than 15 percent reported that the MI system were non-functional in Bihar Chhattisgarh Odisha amp Uttarakhand due to crop season and fear of theft amp damage from rodents It was found that standard designs as regards spacing layout etc have been used in almost all the cases without any variation taking into account the shape size water quality soil conditions etc On an average 98 percent of the farmers reported that MI System installed in their fields meet their requirements however around 28 percent of the farmers in Uttarakhand responded that systems has not been installed as per their requirements Almost 100 percent of the beneficiaries reported that the system design layout is as per project proposal except farmers of Bihar where 10 percent farmers reported that system has not been laid out as per the design in the project proposal In the states of Bihar Chhattisgarh amp Uttarakhand the beneficiaries about 40-50 percent of the beneficiaries reported that they are not being provided after sales service 45 System Suppliers The global micro irrigation systems market is one of the fastest growing segments of agriculture sector The growth of this market is fueled by the government initiatives for adoption of micro irrigation systems in order to conserve water for optimum use The growth of micro irrigation systems is particularly higher in Asia Pacific and Africa due to the increased problems of water scarcity and farmer awareness towards increasing the crop yield with the help of micro irrigation systems India and China are expected to drive growth in the global micro-irrigation systems market which is seen reaching $48 billion by 2018 at a CAGR of 18 per cent from 2012 to 2018 Out of the total 695 million hectares (425 million ha sprinkler and 27 million ha drip) of cultivated area in India only 571 percent of the area is under drip and sprinkler irrigation This represents strong potential for the growth of micro irrigation systems in this region6 This low penetration offers growth opportunities in future All the benefits provided by the micro irrigation systems over flood irrigation coupled with the governmental initiatives to increase the MI system penetration are responsible for the MIS growth in India Also all such drivers are likely to help the market to grow in future as well
6As per Indian Taskforce Report of 2004
Impact Evaluation Study on ldquoNational Mission on Micro Irrigation (NMMI)rdquo
83
After initial scrutiny a committee consisting of experts examines the facilities at manufacturing site for verification of establishment details The list of the registered system suppliers is given below in table
Table 66 State Wise List of Registered MI System Suppliers
SNo State Name Suppliers Name
1 Andhra Pradesh
Ms EPC Industries Ltd (A Mahindra Group of Company) Ms Jain Irrigation Systems Ltd Ms Premier Irrigation Equipment Ltd Ms Rungta Irrigation Ltd Ms Greenfield Irrigation Ltd Ms Sudhakar Plastic Ltd Ms Nagarjuna Palma India Ltd Ms Kumar Enterprises Ms Nandi Plasticisers Ltd Ms Godavari Polymers Pvt Ltd Ms Haritha Irrigation Products Pvt Ltd Ms Netafem Irrigation India Pvt Ltd Ms Megha Agrotech Private Ltd Ms Satya Sai Polymers
2 Bihar
Ms Jain Irrigation Systems Ltd Ms EPC Industries Ltd (A Mahindra Group of Company) Ms Aaram Plastics Pvt Ltd Ms Sai Irrigation Ms Kishan Enterprise Ms Venkatesh Irrigation Ms Premier Irrigation Adritec Pvt Ltd Ms Netafim Irrigation India Pvt Ltd
3 Chhattisgarh Ms Netafim Irrigation India Pvt Ltd Ms Paras Drip Irrigation Ms Jain Irrigation Systems Ltd
4 Gujarat
Ms Dutron Polymers Ltd Ms Harvel Agua India Pvt Ltd Ms Jain Irrigation Systems Ltd Ms Netafim Irrigation India Pvt Ltd Ms Paragon Synthetics amp Polymers Ltd Ms Parixit Industries Limited Ms EPC Industries Ltd (A Mahindra Group of Company) Ms Plastro Plasson Industries (I) Ltd Ms Captain Irrigation System Ms Finolex Plasson Industries Pvt Ltd Ms Kothari Industries Ms Premier Irrigation Adritec Private Ltd Ms Transchem Agritech Ltd
5 Haryana Ms Jain Irrigation Systems Ltd Ms Netafim Irrigation India Pvt Ltd
Impact Evaluation Study on ldquoNational Mission on Micro Irrigation (NMMI)rdquo
84
Ms Balaji Agro-Systems Pvt Ltd Ms Ajay Industrial CorporationLtd Ms Apollo Pipes Ltd Ms Pioneer Plastics Industries Ltd Ms Rungta Irrigation Ltd Ms Nagarjuna fertilizers and chemicals limited Ms Harwel Agro India Limited Ms Finolex Plastic India Ltd Ms Vindhya Pipes amp plastics Ltd Ms Rungta Irrigation Ltd Ms Nirmal Polyfab Pvt Ltd
6 Karnataka
Ms Finolex Plasson Industries Ltd Ms Metro Drip Irrigation (P) Limited Ms EPC Industries Ltd (A Mahindra Group of Company) Ms Megha Agro Tech Pvt Ltd Ms Pioneer Plastic Industries Ltd Ms Jain Irrigation Systems Ltd Ms Agroplast Karnataka
7 Maharashtra
Ms Alphaplast Irrigation System Ms Aquaguard Plastics And Polymers Ms Datta Irrigation Company Ms Donga Watertech Ms Drip India Ms EPC Industries Ltd (A Mahindra Group of Company) Ms Finolex Plasson Industries Ltd Ms Godavari Polymers Ms Greengold Irrigation Ms Jain Irrigation Systems Ltd Ms Jaldhara Drip Irrigation Pvt Ltd Ms Kothari Agritech Pvt Ltd Ms Mohak Agro Industries Ms Nagarjuna fertilizers and chemicals limited Ms Neer Irrigation Ms Netafim Irrigation India Pvt Ltd Ms Nimbus Pipes Ltd Ms Paras Drip Irrigation
8 Odisha
Ms Jain irrigation system Ltd Ms Netafim Irrigation India Pvt Ltd Ms Premier Irrigation Adritec Pvt Ltd Ms Rungta Irrigation Ltd Ms Oasis Irrigation Equipment Co Ltd Ms Nagarjuna Fertilizers amp Chemicals Limited Ms Sujay Irrigation Pvt Ltd Ms Finolex Plasson Industries Pvt Ltd Ms Kirti Industries (India) Ltd Ms Relpol Plastic Products Ltd
9 Rajasthan Ms Netafim Irrigation India Pvt Ltd
Impact Evaluation Study on ldquoNational Mission on Micro Irrigation (NMMI)rdquo
85
Ms Khushboo Polymers Pvt Ltd Ms Shree Irrigation Systems P Ltd Ms Excellent Irrigation P Ltd Ms EPC Industries Ltd (A Mahindra Group of Company) Ms Purma Plast Ltd Ms Jamna Industries Ms Dinesh Irrigation P Ltd Ms Aaram Plastic Pvt Ltd Ms Jain irrigation system Ltd
10 Sikkim Ms Jain Irrigation Systems Ltd Ms Netafim Irrigation India Pvt Ltd
11 Tamil Nadu
Ms Agro Plast Ms AGS Irrigation (P) Ltd Ms Alpha Irritech Pvt Ltd Ms EPC Industries Ltd (A Mahindra Group of Company) Ms Elgi Ultra Industries Ltd Ms Finolex Plasson Industries Ltd Ms Jain Irrigation Systems Ltd Ms Krishi Irrigation Pvt Ltd Ms Mega Agrotech Pvt Ltd Ms Netafim Irrigation India Pvt Ltd Ms Parixit Industries Limited Ms Pragati Irrigation Systems Pvt Ltd Ms Premier Irrigation Adritec Pvt Ltd Ms Rungta Irrigation Ltd Ms Sujay Irrigation Private Limited
12 Uttar Pradesh
Ms Jain irrigation system Ltd Ms Nagarjuna fertilizers and chemicals limited Ms Sterling Irrigation Ltd Ms EPC Industries Ltd (A Mahindra Group of Company) Ms Netafim Irrigation India Pvt Ltd
13 Uttarakhand
Ms Jain Irrigation Systems Ltd Ms Netafim Irrigation India Pvt Ltd Ms Harvel Agua India Pvt Ltd Ms Pioneer Plastics Industries Ltd Ms Premier Irrigation Adritec Private Ltd
The success of the micro irrigation system is solely dependent on the quality of material used and after sale service Therefore the NMMI guidelines have given due consideration to this very component and have made it mandatory to register the system manufacturers and the same is done by State Micro Irrigation Committee (SMIC) Only those manufacturing companies which insure the quality of the product as per BIS and can promptly provide after sale service are registered for three years The registered company need to declare the technical details of the components proposed to be supplied and which would be verified by the technical committee Further frequent surveillance by
Impact Evaluation Study on ldquoNational Mission on Micro Irrigation (NMMI)rdquo
86
inspection team comprising from NCPAH PFDC CIPET Irrigation Association of India is necessary The Manufacturers have to insure the network for providing after sale services in their area of operation They have to further provide operation and maintenance manuals in vernacular language at the time of installation They should also have the facilities to provide technical guidance on agronomic practices system maintenance schedules spare parts warrantee etc Free after sale service shall be provided by manufacture or authorized distributors for at least three years It has been observed almost all the states that the material supplied to the farmersbeneficiaries is of BIS and also gives warranty for three years However during the course of the investigation it was reported by beneficiaries that the after sale service is provided only in the initial phase and simple instructions are given for using the system No technical support guidance on agronomic practices are extended to the users as they generally tell the beneficiaries to take the help of extension agencies The distributors dealers operating in various sampled states reported that they get the subsidy within 15-20 days of applying but sometime they face the delay in release of subsidy due to non-availability of funds under scheme at district state level Further they also reported that due to delay in trial run inspection also leads to delay in release of the subsidy It is suggested that it would be better if subsidy is directly passed on to the beneficiaries to expedite the release disbursement of subsidy under the scheme
Impact Evaluation Study on ldquoNational Mission on Micro Irrigation (NMMI)rdquo
87
5 Impact Evaluation A number of studies have been conducted to assess the impact of micro irrigation particularly that of drip which have shown encouraging results of farm variables It has also helped in bringing crop diversification from rain fed crops to horticulture crops and have also brought cultivable wastelands under high value such as horticulture crops reduction in cost of production higher yield etc The impact of the scheme on various parameters detailed below has been evaluated to arrive at conclusion about achievement of the scheme objectives as well as general benefit to the agricultural economy of the country Some sequences are in following paragraphs
1 Area Expansion under MI and additional area irrigated by installing MI in place of conventional irrigation and waste marginal land development with the same amount of water
2 Savings in labor fertilizers and electricity thereby reducing cost of cultivation 3 Study of productivity enhancement for various crops 4 Whether the adoption of MI has given rise to crop diversification adoption of high
value crops etc 5 Innovative crop management techniques facilitated through adoption of MI which
are canopy management high density plantation inter cropping etc 6 Contribution of MI towards National food security
51 Crop Diversification
Crop diversification in India is generally viewed as a shift from traditionally grown crops to more remunerative crops With the advent of modern agricultural technology especially during the period of the Green Revolution in the late sixties and early seventies there is a continuous surge for diversified agriculture in terms of crops primarily on economic considerations
Crop diversification is intended to give a wider choice in the production of a variety of crops in a given area so as to expand production related activities on various crops and also to minimize risk The survey has measured impact of installation of MI systems on crop diversification The result of the beneficiariesrsquo responses is summarised in the following table
Impact Evaluation Study on ldquoNational Mission on Micro Irrigation (NMMI)rdquo
88
Table 67 Impact on Crop Diversification and Usage of Marginal and Degraded Land by Beneficiaryrsquos data
SNo State Total
cultivable area (Ha)
Horticulture Crop Area (Ha) Field crop Area (Ha) Marginal degraded Land
( Waste Land) (Ha)
Area Before
MI
Area After MI
Change in Area
Area Before
MI
Area After MI
Change in Area
Area Area after MI
Change in area Before
MI 1 AP 149122 39388 88038 12351 68932 59550 -1361 16953 1534 -9095
2 Bihar 140742 37989 54002 4215 95641 86619 -943 202 121 -4000
3 Chhattisgarh 58406 8719 33495 28415 46502 24211 -4794 1016 700 -3108
4 Gujarat 167639 32040 44131 3773 122983 120072 -237 8373 3436 -5897
5 Haryana 135990 19628 64972 23102 133613 71018 -4685 769 000 -10000
6 Karnataka 111046 68571 85818 2515 34908 23447 -3283 2570 1781 -3071
7 Maharashtra 133667 17384 43304 14910 96225 82488 -1428 22659 7875 -6524
8 Odisha 141309 58179 92107 5832 76276 44435 -4174 7657 4767 -3774
9 Rajasthan 162365 65643 102036 5544 83881 52539 -3736 16410 7790 -5253
10 Sikkim 7327 6149 6639 797 1020 587 -4246 101 101 000
11 Tamil Nadu 76488 44887 53142 1839 32862 23306 -2908 299 040 -8649
12 UP 164662 23078 79251 24341 134278 85249 -3651 2942 162 -9450
13 Uttarakhand 32295 9075 9278 223 18707 18727 011 4573 4290 -619 Source GAPL Survey
Impact Evaluation Study on ldquoNational Mission on Micro Irrigation (NMMI)rdquo
89
It may be observed from above table that the farmers of all the states have shown increase in area under horticulture crops after the adoption of the system The highest increase has been observed in Haryana followed by Chhattisgarh UP Maharashtra and AP whereas the lowest in case of Uttarakhand and Sikkim which may be because of the reason that both the states have proportionately higher area under horticulture crops 52 Area Expansion under Micro Irrigation The GoI MI scheme has succeeded in bringing around 3812 lakh ha under micro irrigation with total subsidy amounting to Rs 546801 crores since the launch of the scheme in 2005-06 in India This represents about 257 of the total cultivated area in the country and 569 of the total irrigated area of the country The area expansion under MI system in the country has grown at 36 23 and 18 respectively for last three years (as per official records) Eventually the growth trend is quite impressive yet overall proportion of land under MI is quite low and as such more efforts such as creating awareness among the farmers through electronic and print media exhibition fares PRIs etc need to be initiated to bring the significant area under MI 53 Increase in Irrigated Area due to Water Saving Drip irrigation is being practiced in the different parts of the country since 80s to improve the water use efficiency water savings and productivity enhancement Through the saving of water due to adoption of MI technologies it is possible for beneficiaries to increase the area under cultivation by way of efficient use of water In order to understand that how much additional area has been brought under irrigation the irrigated area before and after installation of MI was taken into consideration (Table 68) In order to have better comprehension of area increased due to MI the percent increase in different schemes was given a graphical shape (Figure 9) After adoption of MI system sampled beneficiaries were able to bring their irrigated area under irrigation from same source of water which otherwise was not being utilized for cultivation due to limited availability of water The Irrigated area within the 5892 sampled beneficiaries of the 13 states before adoption of MI system was found to be 1332086 ha which 1444147 became ha after adoption of MI system It is therefore concluded that total percentage increase in irrigated area with the sampled beneficiaries in 13 states after adoption of MI system was noted to be 841
Impact Evaluation Study on ldquoNational Mission on Micro Irrigation (NMMI)rdquo
90
Table 68 Increase reported by Beneficiaries in Irrigated Area (ha) after Installation of MI System
State Total Irrigated Area before
installation of Micro Irrigation system (ha)
Total Irrigated Area after installation of Micro Irrigation
system (ha)
increase in irrigated Area
AP 101343 113941 1243 Bihar 229656 236802 311 Chhattisgarh 49474 57196 1561 Gujarat 135891 155007 1407 Haryana 123368 136263 1045 Karnataka 103805 106492 259 Maharashtra 102551 125400 2228 Odisha 124189 138310 1137 Rajasthan 100577 107850 723 Sikkim 6040 6081 067 Tamil Nadu 70956 74116 445 Uttar Pradesh 158370 160415 129 Uttarakhand 25862 26275 160 Grand Total 1332086 1444147 841
Source GAPL Survey
Figure 9 Increase in Irrigated Area () among Beneficiaries after Adoption of MI
54 Development of marginal and wasteland by beneficiaries
Degraded land which can be brought under vegetative cover with reasonable effort and which is currently under-utilized and land which is deteriorating for lack of appropriate water and soil management or on account of natural causes The total cultivable waste land in the country at present is about 1283 million hectares Based on the feedback received from the sampled beneficiaries it was observed that during survey in the sampled states beneficiaries sampled farmers were able to convert
Impact Evaluation Study on ldquoNational Mission on Micro Irrigation (NMMI)rdquo
91
their marginal amp rainfed land into cultivable land due to efficient use of water resources available with them In 13 surveyed states 5892 sampled farmers holding 1481058 hectares of land reveals that around 84540 ha of land was not being used for cultivation as they were either waste or degraded land Farmers reported that after adoption of MI system they were able to bring around 51943 ha of land under cultivation The data reveals that adoption of MI system has helped the sampled beneficiaries in bringing around 371 of land under cultivation Maximum and minimum area conversion with the beneficiaries was noted in Andhra Pradesh and Sikkim respectively
Table 69 Marginal Degraded Land brought under Cultivation after Installation of MI System by Beneficiaries
States Total no of
Sampled Beneficiaries
Total area of Sampled
beneficiaries (Ha)
No of sampled farmer with
wastedegraded
Area under wastedegraded
land before NMMI (ha)
Converted area after
adoption of NMMI (ha)
AP 672 149122 242 16953 15419 Bihar 516 140742 2 202 081 Chhattisgarh 384 58406 8 1016 318 Gujarat 576 167639 57 8374 4939 Haryana 320 13599 2 769 769 Karnataka 576 111046 11 2572 789 Maharashtra 672 133667 126 22666 14791 Odisha 480 141309 70 7660 2893 Rajasthan 574 162365 39 16410 8620 Sikkim 50 7327 4 101 000 UP 527 76488 32 2942 2780 Uttarakhand 90 164662 46 4575 284 Tamil Nadu 455 32295 10 300 260 Total 5892 1481058 649 84540 51943
Source GAPL Survey
55 Dripper spacing The dripper spacing is important as it accommodates higher plant population resulting more number of fruits which increases total yield and net returns It is also a factor to commensurate water requirement and root zone of the plant However wide dripper spacing saves more water total irrigation time minimized the diseases and weeds incidence as compared to closer dripper spacing in each years The recommended spacing for different crops under Micro Irrigation system has been presented in the following tables below During the course of field survey the beneficiary farmers were asked to specify the spacing of the crops they are following The responses of the farmers are given in the table 70 amp 71 for different crops in sampled states
Impact Evaluation Study on ldquoNational Mission on Micro Irrigation (NMMI)rdquo
92
Table 70 Spacing followed by Sampled Beneficiaries for Fruit Crops (m)
SNo State Fruits
Banana Lemon Mango Papaya Watermelon Orange Litchi Guava Pomegranate Grapes Coconut Cashewnut Aonla 1 AP 15 15 55 99 1818 66 2 Bihar 1010 55 3 Chhattisgarh 1818 1506 4 Gujarat 1818 1818 5 Haryana 0404 1010 88 6 Karnataka 22 88 22 44 315 7 Maharashtra 1515 1010 33 88 77 8 Odisha 22 66 55 22 7575 77 9 Rajasthan 66 66 5555 66 55
10 Sikkim 1515 55 33 11 Tamil Nadu 22 55 66 66 55 12 UP 1515 66 1010 1010 1010 13 Uttarakhand 88 33
Source GAPL Survey
Impact Evaluation Study on ldquoNational Mission on Micro Irrigation (NMMI)rdquo
93
Table 71 Spacing followed by Sampled Beneficiaries for Vegetables Flowers and Other Crops (m)
SNo State Vegetables Flowers and other important Crops
Brinjal Okra Tomato Potato Cucumber Onion Cabbage Cauliflower Chili Cotton Sugarcane Groundnut Lilli Rose 1 AP 0606 0404 1204 1212 1205 1515 11 2 Bihar 21 055022 1509 3 Chhattisgarh 1503 0502 1503 4 Gujarat 1404 06015 07015 1404 1505 07005 5 Haryana 105 102 0501 0606 103 0505 6 Karnataka 1206 1206 1806 0609 7 Maharashtra 0606 1204 1204 1503 15075 1205 8 Odisha 06045 045045 0603 045030 0603 9 Rajasthan 1030 1020 025025 055055 066066 1030
10 Sikkim 108 66 108 11 Tamil Nadu 0606 06045 1503 1212 24075 12 UP 06075 0604 1204 07503 1509 13 Uttarakhand
Source GAPL Survey
It may be seen that crop spacing is more or less as per recommendations In few cases the spacing is even less It is clearly indicates that farmers adopting MI system also adopt proper practices
Impact Evaluation Study on ldquoNational Mission on Micro Irrigation (NMMI)rdquo
94
56 Reduction in Cost of Irrigation The data cited in table 73 indicate the cost of irrigation incurred by beneficiary farmers before and after installation of MI system It is well evident that Irrigation cost was reduced by 20-50 percent with the use of MI system The states of Gujarat Haryana and Rajasthan have witnessed more than 40 cost reduction The reduction in cost resulted primarily because of savings in the man power and electricity consumption
Table 72 Reduction in Cost of Irrigation with MI system
State Cost of Irrigation before MI ( Rs ha)
Cost of irrigation after MI (Rs ha) decrease in cost
AP 7200 5721 2050 Bihar 8734 6234 2860 Chhattisgarh 5602 3557 3650 Gujarat 11046 5599 4930 Haryana 7346 3749 4900 Karnataka 8215 6182 2470 Maharashtra 11204 7736 3100 Odisha 8895 6541 2650 Rajasthan 7193 3925 4540 Sikkim 3932 2836 2790 Tamil Nadu 6368 4792 2480 UP 6657 4819 2760 Uttarakhand 10693 8203 2330
Source GAPL Survey
57 Electricity Consumption The figures on consumption of electricity before and after installation of MI system by the beneficiary farmers have been tabulated in Table 73 The data clearly indicate that savings of electricity across the sampled states varied from 151 to 494 percent average being 306 percent It is pertinent to mention here that in the states of Bihar and Chhattisgarh almost all the beneficiaries have been using diesel kerosene to operate their pump sets For these two states reduction in consumption of electricity has been computed considering the reduction in use of diesel kerosene The variations in the extent of electricity savings among different states may be attributed to the type of system installed besides depth of water and area brought under MI
Impact Evaluation Study on ldquoNational Mission on Micro Irrigation (NMMI)rdquo
95
Table 73 Reduction in Electricity Consumption
State Electricity used
before MI( hrday) Electricity used
after MI( hrday) saving of electricity
AP 679 528 2233 Bihar 5000 3000 4000 Chhattisgarh 4500 2800 3778 Gujarat 678 407 3992 Haryana 835 423 4939 Karnataka 590 432 2675 Maharashtra 703 468 3348 Odisha 798 619 2246 Rajasthan 864 501 4208 Sikkim 262 170 3511 Tamil Nadu 578 491 1510 UP 225 184 1843 Uttarakhand 301 211 2989 Total 537 373 3065
Source GAPL Survey Diesel Kerosene consumed (ltrs day) for Bihar and Chhattisgarh
58 Economy in Fertilizer Use The information on use of fertilizers before and after installation of MI system was sought from the beneficiary farmers the obtained data have been enumerated in Table 74 In order to comprehend the information on fertilizers saving across the 13 states the data on fertilizer saving was given a graphical presentation (Figure 10) It is well evident that MI system resulted in significant savings of fertilizers The extent of fertilizer saving in the states under study varied from 759 to 4383 percent with an average savings of about 28 percent The obtained results are in-conformity with the various research findings wherein fertilizer savings through drip fertigation have been reported in the range of 30-35 percent (Raina et al 2013)The exceptionally low fertilizer savings observed in Bihar are attributed to the fact that more than 90 percent area in Bihar is under sprinkler irrigation
Impact Evaluation Study on ldquoNational Mission on Micro Irrigation (NMMI)rdquo
96
Table 74 Reduction in Fertilizer Consumption
States Fertilizer Consumption(
Kgha) Before MI
Fertilizer Consumption( Kgha)
after MI
saving of Fertilizer
AP 24152 17185 2885 Bihar 18198 16816 759 Chhattisgarh 28872 17219 4036 Gujarat 15893 9103 4273 Haryana 20297 12682 3752 Karnataka 21549 15471 2821 Maharashtra 31005 23887 2296 Odisha 27240 21547 2090 Rajasthan 29523 16582 4383 Sikkim 15860 9380 4086 Tamil Nadu 21147 15421 2708 UP 24220 18704 2277 Uttarakhand 10620 8712 1796 Total 23526 16826 2848
Source GAPL Survey
Figure 10 Reduction in Fertilizer Consumption ()
59 Increase in Crop Productivity
Micro irrigation has generated benefits to the farmers in terms of enhancement of the productivity The average productivity Fruit crops have increased about 423 percent (Table 75) with maximum enhancement in the state of Gujarat followed by Rajasthan which was followed by Chhattisgarh In fact the productivity enhancement in these states was comparable
Impact Evaluation Study on ldquoNational Mission on Micro Irrigation (NMMI)rdquo
97
Table 75 Productivity Enhancement of Fruit Crops (MTha)
State Before MI After MI increase AP 732 874 1937 Bihar 273 315 1518 Chhattisgarh 012 020 6200 Gujarat 515 893 7348 Haryana 586 810 3825 Karnataka 4532 5810 2820 Maharashtra 2166 3232 4918 Odisha 2741 3699 3497 Rajasthan 538 917 7056 Sikkim 543 580 682 Tamil Nadu 2473 2902 1736 UP 710 953 3414 Uttarakhand 585 775 3242 Total 1352 1925 4234
Source GAPL Survey The average productivity of the vegetables has increased by 528 after using the MI irrigation system (Table 76) The states of Chhattisgarh Gujarat and Sikkim registered tremendous increase in vegetable productivity after using micro irrigation system
Table 76 Productivity Enhancement of Vegetable Crops (MTha)
State Before MI After MI increase
AP 991 1329 3409 Bihar 1122 1476 3162 Chhattisgarh 2779 5526 9885 Gujarat 709 1196 6859 Haryana 2066 2523 2213 Karnataka 1109 1430 2900 Maharashtra 348 448 2876 Odisha 1088 1395 2819 Rajasthan 607 846 3942 Sikkim 1894 3157 6662 Tamil Nadu 1137 1437 2640 UP 825 1079 3071 Uttarakhand 317 475 4965 Total 1140 1741 5276
Source GAPL Survey
The data on crop wise productivity enhancement in different states has also been enumerated and explained in the next section
Impact Evaluation Study on ldquoNational Mission on Micro Irrigation (NMMI)rdquo
98
510 Reduction in these Cost of Inputs of Irrigation amp Productivity Enhancement Crop-wise
MI technology is introduced mainly to increase the water use efficiency in agriculture and also provides many other socio-economic benefits in the society The use of MI has led to significant reduction cost of irrigation electricity saving fertilizer saving amp productivity enhancement As per the data collected from the sample beneficiaries significant increase has been observed in terms of reduction in different costs for different crops and enhancing the productivity The same trend is observed in fruits vegetables flowers and other non-horticulture crops The detailed state and crop wise impact percentages of the reduction in irrigation cost electricity savings fertilizer saving and increase in productivity of the sampled beneficiaries are as follows
Table 77 Crop wise Details of Reduction in Cost - Fruits
State Fruit Reduction in Irrigation Cost ( )
Electricity saved ( )
Fertilizer saved ( )
Productivity enhancement ( )
AP
Banana 2987 3660 2833 2089 Guava 1087 2830 2651 3521 Lemon 2839 3339 2676 1708 Mango 2338 3301 3157 3051 Orange 3160 3571 3233 3478
Bihar
Guava 2308 1827 2000 1250 Kadam 1228 2250 1385 1563 Mango 1731 1450 1167 1211 Litchi 2857 1180 1429 1077
Chhattisgarh Banana 2500 2460 1667 5000 Papaya 3889 2850 3333 8750
Gujarat
Banana 4490 4712 3954 4344 Papaya 4692 4000 4565 6235 Pomegranate 4565 2895 4407 4000 Watermelon 5682 5750 4068 5000
Haryana Kinnow 4847 4005 3945 2500 Strawberry 4196 3837 4110 2000 Watermelon 3421 4565 4150 5000
Karnataka
Banana 2769 2030 2743 3380 Mango 2576 3472 2636 2673 Papaya 2836 3622 2907 2441 Pomegranate 2250 2363 3038 3520 Fig 1250 3333 2222 2500 Areca nut 2918 3276 3085 2205
Maharashtra
Banana 3070 3069 3122 5215 Cashew nut 3117 1940 4247 4000 Grapes 3016 2069 2047 7143 Mango 3553 2815 2895 1672 Mousami 4375 2000 2000 8750 Orange 4689 3059 2766 3000 Sweet Orange 3553 3137 2198 3627 Areca nut 1833 3500 5000 3333
Impact Evaluation Study on ldquoNational Mission on Micro Irrigation (NMMI)rdquo
99
Odisha
Aonla 3529 3889 2500 3333 Banana 3577 3391 3124 2447 Cashew nut 2713 3131 3120 3062 Guava 3481 3692 3216 4430 Mango 3576 3551 3027 3039 Papaya 2806 2903 3532 1768 Chikoo 667 2500 4000 1111
Rajasthan
Bel 5714 5000 5714 1550 Guava 1965 4746 4077 5000 Kinnow 5869 4982 4904 4648 Lemon 3052 4519 3560 4118 Mango 3053 4839 3282 6000 Orange 2565 4187 3535 4229
Sikkim Banana 3750 4000 3000 000 Orange 3933 2766 4087 4000 Litchi 5000 2000 4000 000
Tamil Nadu
Aonla 2313 3298 2817 4032 Banana 3684 3495 2607 2990 Cashew nut 3579 3333 2222 3333 Coconut 2882 3511 2714 3333 Mango 2410 3418 2926 2697 Tapioca 3258 3422 2429 3327
UP
Banana 2961 6000 2746 4792 Guava 2555 3636 2350 2147 Mango 2463 3957 2415 3373 Litchi 2753 4167 2717 3393
Uttarakhand
Guava 2167 NA 1638 NA Mango 2281 3636 1633 NA Peach 2293 NA 2855 NA Litchi 2892 3333 2044 NA
Source GAPL Survey
It may be seen from the above table that among the fruit crops highest reduction in irrigation cost was observed in Kinnow crop in Rajasthan amp lowest in guava in AP whereas maximum saving in electricity was observed in Haryana and saving in fertilizer in a Bel in Rajasthan and further highest increase in productivity is witnessed in Papaya in Chhattisgarh
Table 78 Crop wise Details of Reduction in Cost - Vegetables
State Vegetables Name
Reduction in Irrigation Cost ( )
Electricity Saved ( )
Fertilizer saved ( )
Productivity enhancement ( )
AP
Brinjal 2470 3450 2932 1950 Chilli 2104 3213 2662 2580 Okra 1545 3079 3337 2654 Tomato 2100 3458 3280 2837
Bihar
Brinjal 1931 2780 1073 1522 Cauliflower 1850 3244 1415 760 Okra 2188 2250 1283 1671 Potato 2282 4655 1006 1105
Chhattisgarh Cauliflower 3438 3480 4065 7377 Tomato 4420 4750 4580 11454
Impact Evaluation Study on ldquoNational Mission on Micro Irrigation (NMMI)rdquo
100
Bitter Gourd 4934 3690 4746 11081 Okra 4365 4250 4484 8642
Gujarat
Chilli 4532 4341 4393 4708 Fennel 3000 5000 5625 2000 Onion 4983 4792 4094 2435 Potato 4523 4547 3602 3504 Tomato 5102 4620 4245 7962
Haryana
Chilli 4364 4470 3264 5000 Cucumber 5494 6081 3989 4122 Potato 4406 5809 3321 1651 Tomato 4833 5161 3556 5632
Karnataka Chilli 3088 3021 2839 3187 Ginger 2941 3651 2906 2450 Tomato 2275 3218 2971 1870
Maharashtra Brinjal 3041 3870 2604 2195 Chilli 2702 3268 3672 3310 Tomato 2763 3641 2940 3184
Odisha
Bitter Gourd 3629 3660 3024 2826 Bottle Gourd 4040 3435 2700 2916 Brinjal 2979 3164 3084 2804 Cauliflower 3141 3291 2980 2542 Okra 3399 3302 2982 3216 Tomato 2978 3179 3225 3534
Rajasthan
Brinjal 6452 2500 5429 NA Carrot 5718 2965 4789 2097 Onion 3713 3840 3992 3117 Tomato 2950 4526 3520 4619
Sikkim Brinjal 2200 4118 3818 6949 Cauliflower 4500 2000 4250 769 Tomato 3542 3729 4161 6889
Tamil Nadu Brinjal 2930 3264 2973 3407 Chilli 3049 3633 2902 2551 Tomato 2545 3495 3167 2176
UP
Brinjal 2336 4032 2153 2481 Chilli 2473 5000 2052 3130 Peas 2155 3752 3005 3254 Potato 2897 4412 2591 2802 Tomato 2521 3721 2420 2822
Uttarakhand Peas 2572 NA 1672 NA Tomato NA 3333 2018 NA
Source GAPL Survey It may be seen from the above table that among the vegetable crops highest reduction in irrigation cost was observed in brinjal in Rajasthan amp lowest in lady finger in AP whereas maximum saving in electricity was observed in Haryana for cucumber amp potato and saving in fertilizer for fennel in Gujarat and further highest increase in productivity is witnessed in Chhattisgarh for tomato
Impact Evaluation Study on ldquoNational Mission on Micro Irrigation (NMMI)rdquo
101
Table 79 Crop wise Details of Reduction in Cost - Flowers
State Crop Reduction in
Irrigation Cost ( )
Electricity saved( )
Fertilizer saved ( )
Productivity enhancement
( ) AP Lilli 3333 3750 4182 4560 Bihar Marigold 4643 3100 3333 5000
Gujarat Jasmine 5000 6250 3333 3333 Marigold 2000 7500 5556 4200
Haryana Gerbera 6725 8636 3250 3670 Rose 4316 5938 5676 4690
Maharashtra Marigold 3448 3571 2761 4250 Rose 1045 2143 4375 4690
Odisha Rajanigandha 4667 5000 3000 2400 Rajasthan Rose 3611 5000 2970 2500 UP Marigold 2000 3400 2000 2750 Source GAPL Survey It may be seen from the above table that among the flowers highest reduction in irrigation cost amp electricity saving was observed in Gerbera in Haryana whereas saving in fertilizer for rose in Haryana and highest increase in productivity was witnessed in Bihar for marigold
Table 80 Crop wise Details of Reduction in Cost - Non-horticulture Crops
State Non Horticulture Crops
Reduction in Irrigation Cost
( )
Electricity saved( )
Fertilizer saved ( )
Productivity enhancement
( )
AP
Cotton 2820 3524 2354 1770 Ground nut 2924 3828 2136 2274 Maize 1579 3067 3096 2199 Sugarcane 2285 3325 3130 1853
Bihar Maize 1874 1575 1126 1484 Sugarcane 2096 2250 1553 050 Wheat 1721 1860 998 852
Chhattisgarh Gram 2799 1450 2830 2050 Soybean 3978 1635 4356 1805 Wheat 2313 2145 2017 4443
Gujarat
Caster 4617 5172 3757 3580 Cotton 4540 4659 4396 3719 Ground nut 4871 4684 4027 3496 Sugarcane 4875 4865 4216 21611 Wheat 4082 4015 3681 3025
Haryana Cotton 4435 4439 3093 101 Mustard 4167 4286 3611 000 Wheat 4935 4497 3858 212
Karnataka Sugarcane 2771 2568 2723 1264
Maharashtra
Cotton 3370 2928 2991 3475 Ground nut 3355 3333 3312 2587 Soybean 3528 2280 3085 4080 Sugarcane 3712 3815 2848 3877
Odisha Moong 2178 2869 3589 3689 Sugarcane 2624 3309 3201 4849
Rajasthan Arandi 3684 4000 3916 4313
Impact Evaluation Study on ldquoNational Mission on Micro Irrigation (NMMI)rdquo
102
Cotton 5118 3750 4708 2765 Guwar 5605 4375 5250 4889 Mustard 3283 4373 4313 3433 Wheat 3025 3666 3923 3631
Sikkim Mustard 4286 2000 3600 000 Wheat 3333 2759 3600 556
Tamil Nadu Sugarcane 2879 3427 2873 990
UP Maize 2732 4662 2334 470 Sugarcane 2316 2200 3050 2877 Wheat 2538 3776 2484 4116
Uttarakhand Sugarcane 2562 2385 2088 2950 Source GAPL Survey It may be seen from the table 77 that among the non-horticulture crops also reduction in irrigation cost saving in electricity saving in fertilizer and increase in productivity was witnessed From the above it may be concluded that with the adoption of micro irrigation technologies significant increase has been observed in productivity enhancement in all the states for all the major crops being cultivated under the scheme Further reduction in input factors such as irrigation cost saving in electricity amp saving in fertilizer was also observed 511 Introduction of New Crops During the course of the study and field survey it was observed that the beneficiaries have switched to new crops mostly high value as enlisted in table 82 below with the adoption of micro irrigation technology In the fruit crops high density plantations having drip irrigation system have been adopted by some of the farmers
Table 81 Crops Adopted after Installation of MI System
Fruits Aonla Areca nut Banana Cashew nut Sapota Coconut Grapes Guava Litchi Mango Mosambi Orange Papaya Pineapple Pomegranate Strawberry Sweet orange watermelon
Vegetables Broccoli Bitter gourd Bottle gourd Brinjal Cabbage Capsicum Cauliflower Cucumber Chilli Ginger Okra Onion Spinach Papaya Potato Radish Tomato
Floricultural Marigold Tuberose (Rajnigandha) Rose Lilly
Other crop Cotton Groundnut Sunflower Turmeric Arhar Black gram Maize Moong Mustard Pulses Soyabean Sugarcane Urad Wheat
Impact Evaluation Study on ldquoNational Mission on Micro Irrigation (NMMI)rdquo
103
Table 82 Extent of Adoption of New Crops after Installation of MI System
State Total
Beneficiary No of Farmers
Introduced New Crops Farmers
Introduced New Crop () AP 672 278 4137 Bihar 516 8 155 Chhattisgarh 384 206 5365 Gujarat 576 67 1163 Haryana 320 315 9844 Karnataka 576 154 2674 Maharashtra 672 126 1875 Odisha 480 221 4604 Rajasthan 574 3 052 Sikkim 50 26 5200 Tamil Nadu 455 53 1165 UP 527 330 6262 Uttarakhand 90 2 222 Total 5892 1789 3036
Figure 11 Extent of Adoption of New Crops by Beneficiaries ()
It may be seen from the above table that almost all the beneficiaries of Haryana have shifted towards new crops with the adoption MI system followed by UP Sikkim Chhattisgarh Odisha and AP The lowest response was observed in Rajasthan Bihar and Uttarakhand which is due to the fact that MI systems in majority of the cases have been installed to irrigate horticultural crops
It is therefore recommended that special drives be taken to motivate the farmers in the state of Bihar Uttarakhand amp Rajasthan for crop diversification to accrue the full advantage of MI system
Impact Evaluation Study on ldquoNational Mission on Micro Irrigation (NMMI)rdquo
104
512 Increase in Farmerrsquos Income
The overall benefits accrued from the micro irrigation system are reflected in the income enhancement of the farmers All the surveyed states reported increase in farmerrsquos income by 20- 68 with an average increase of 485 The maximum increase in income has been reported in Gujarat followed by Chhattisgarh
Table 83 Increase in Farmerrsquos Income
State Income ( Rs ha)
before MI Income ( Rs ha)
after MI
Increase
in Income AP 60273 79929 3261 Bihar 31132 41333 3277 Chhattisgarh 62785 105059 6733 Gujarat 55703 93593 6802 Haryana 73917 117532 5901 Karnataka 82303 105061 2765 Maharashtra 68459 99786 4576 Odisha 61846 85660 3850 Rajasthan 125753 191731 5247 Sikkim 81510 111891 3727 Tamil Nadu 74100 98800 3333 UP 58495 87391 4940 Uttarakhand 140098 168234 2008 Total 976374 1386001 4195
Source GAPL Survey
Figure 12 Increase in the Income of Beneficiaries ()
Impact Evaluation Study on ldquoNational Mission on Micro Irrigation (NMMI)rdquo
105
513 Benefit-Cost Ratio The BC ratio has been based on the estimates of incremental return income from MI system that is taken into account the increase in individual farmerrsquos income and MI system cost and crop wise average increase in income and average MI cost for each state were worked out from the same MI system cost has been amortized equally for 10 years considering the economic life of the system for the same period The income enhancement of the beneficiary farmers after installation of the MI system has been attributed to MI system The Benefit-cost analysis was carried out for important crops in all the 13 states under study on the basis of data collected from sampled beneficiaries This ratio gives the estimates of returns on the investment made in MI system Performance in term of BC ratio varies from state to state even for the same crop due to varied reasons like agro-climatic conditions agronomic practices soil productivity system cost marketing of produce etc the BC ratio of installing micro irrigation system is above one across the states and across the crops which signifies the importance of MI system in net income enhancement of the farmers The state wise BC ratio of installing MI system for different crops is given in the table for important fruits vegetables amp flowers grown in the states under study
Impact Evaluation Study on ldquoNational Mission on Micro Irrigation (NMMI)rdquo
106
Table 84 Benefit Cost Ratio of MI System for Important Fruit Crops
Fruits AP Bihar Chhattisgarh Gujarat Haryana Karnataka Maharashtra Odisha Rajasthan Sikkim Tamil Nadu UP Uttarakhand Aonla - - - - - - - - 269 - 294 234 - Areca nut - - - - - 259 221 - - - - - - Banana 266 - 266 187 - 277 291 182 - 272 290 276 - Bel - - - - - - - - 209 - - - - Blackberry - 171 - - - - - - - - - - - Carrot - - - - - - - - - - 291 - - Cashew nut - - - - - - 270 259 - - 264 - - Coconut 226 - - - - 263 244 272 - - 251 - - Cucumber - - - - 206 131 - - - - - - - Custard Apple - - - - - 219 - - - - - - - Fig - - - - - 266 - - - - - - - Grapes - - - - - 258 293 - - - - - - Guava 242 297 - 269 212 204 294 256 229 294 - 286 276 Kadam - 121 - - - - - - - - - - - Kinnow - - - - 284 - - - 231 - - - - Lemon 267 - - 280 - 288 148 298 231 - 209 236 - Litchi - 111 - - - - - 252 - 267 - 272 227 Mango 284 226 - 292 - 257 265 245 273 - 275 295 287 Musk Melon - - - - 227 - - - - - - - - Oil Palm 229 - - - - - - 278 - - - - - Orange 240 - - - - - 215 - 287 280 - - - Papaya 133 125 242 - - 279 234 268 - - 230 274 - Peach - - - - - - - - - - - - 219 Pineapple - - - - - - 241 298 - - - - - Pomegranate 234 - - 242 - 209 266 231 297 - - - - Sapota - - - - - 294 - 299 - - 245 - - Strawberry - - - - 119 - - - - - - 297 - Tapioca - - - - - - - - - - 223 - - Water Melon - - 257 211 221 288 267 298 - - - - - Source GAPL Survey
Impact Evaluation Study on ldquoNational Mission on Micro Irrigation (NMMI)rdquo
107
Table 85 Benefit Cost Ratio of MI System for Important Vegetable Crops
Vegetable AP Bihar Chhattisgarh Gujarat Haryana Karnataka Maharashtra Odisha Rajasthan Sikkim Tamil Nadu UP Uttarakhand Alovera 145 - - - - - - - - - - - Arabi - - - - - - 178 - - - - - Bitter Gourd 200 268 214 295 - - 239 - - 286 258 - Boda 112 251 - - - - - - - - - - Bottle Gourd 124 190 234 239 - - 267 133 - - 257 - Brinjal 215 218 144 145 185 215 298 238 230 257 166 257 - Broccoli - - 017 - - - - - - - - - Cabbage - 274 217 - - 250 218 - 167 275 222 - Capsicum 262 262 - 274 - - 161 - - - 229 - Carrot - - - 206 - - - 251 - - - - Cauliflower 117 - - 288 268 - 256 229 229 285 274 - Chilli 156 172 210 265 258 233 273 228 179 259 181 282 - Cucumber - 162 - 132 198 - 149 222 - - - - Fennel - - 281 - - - - - - - - - Garlic - - - 069 - - - 246 - - - - Ginger 220 - - - - 236 - 226 - - - - - Kundru - 125 - - - - - - - - - - Okra 170 219 238 189 174 281 271 287 - 225 232 279 - Lemon - - - - - - 224 - - - - - Methi - - - 190 - - - - - - - - Onion - 236 176 210 - 270 293 239 - 251 193 - Palak - - - - - - - - - - 183 - Pointed Gourd - - 182 - - - - - - - - - Peas - - - 197 - 236 298 - - - 235 269 Potato 182 248 260 226 270 233 - 261 282 - 158 286 - Pumpkin 135 146 013 - - - - 182 - 159 - - Radish - - - - - - - - - - 238 - Cluster Bean - 174 - - - - - - - - - - Round Guard - - - 254 - - - - - - - - Tomato 252 265 242 200 230 208 294 214 294 238 232 278 Sponge Guard - 137 - - - - - 274 - - - - Turmeric 179 - - - - - - - - - - - SourceGAPLSurvey
Impact Evaluation Study on ldquoNational Mission on Micro Irrigation (NMMI)rdquo
108
Table 86 Benefit Cost Ratio of MI System for Important Floriculture Crops
State Flower Name BC Ratio AP Lilli 121 Bihar Marigold 218
Gujarat Jasmine 272 Marigold 167
Haryana Gerbera 292 Rose 141
Karnataka Marigold 225 Rose 160
Odisha Rajnigandha 255 Rajasthan Rose 294 UP Marigold 276 Uttarakhand Gladiolus 272
Performance in terms of BC ratio varies from state to state and crop to crop Thus it may be concluded that these analysis confirm that the farmers are getting higher income with the adoption of MI technology 514 Increase in Area The irrigated area has increased in all the surveyed states after the introduction of NMMI Scheme Irrigated area has been increased by 841 for total surveyed farmers in the given states The state of Maharashtra has topped the list with 2228 growth in irrigated area followed by Chhattisgarh There has been very little growth in case of Sikkim UP Uttarakhand amp Karnataka
Table 87 Percent Increase in Irrigated Area on Installation of MI System
State Irrigated Area (Ha) Percent
Increase in Irrigated
Area Before MI After MI
AP 101302 113895 1243 Bihar 129482 140935 885 Chhattisgarh 49454 57172 1561 Gujarat 135837 154944 1407 Haryana 123318 136208 1045 Karnataka 103763 106449 259 Maharashtra 102510 125349 2228 Odisha 124139 138254 1137 Rajasthan 100536 107806 723 Sikkim 6038 6079 067 Tamil Nadu 70928 74086 445 UP 158306 160350 129 Uttarakhand 25852 26265 160
Impact Evaluation Study on ldquoNational Mission on Micro Irrigation (NMMI)rdquo
109
515 Potential area that can be brought under Micro Irrigation The potential for Micro Irrigation for each surveyed district has been worked out on the basis of field survey and secondary information
The following information has been taken account to work out MI potential from Secondary sources
A Total Irrigated area B Paddy area C Area under MI
Total Potential area has been worked out by subtracting the area under MI and Paddy from total irrigated area of the district considering that paddy area has no potential for the MI system This potential area has been depicted as percentage of total irrigated area The district wise potential for MI as well as the crop potential is given in the table below
Table 88 District wise Potential for Installation of MI System in Study Area
State District
Area Based on Secondary Data Potential Crops Under MI
Irrigated Area
(ldquo000 ha)
Area under MI (ldquo000 ha)
MI Potential
Area (ldquo000 ha)
MI Potential Area ()
Fruits Vegetables Other Crops
AP
Adilabad 10152 2544 7608 7494
Mango Citrus and Banana
Brinjal Chilli Tomato and Okra
Maize Sugarcane Cotton and Ground Nut
Anantpur 24721 12773 11948 4833 Krishna 18067 1572 16495 9130 Medak 9955 4946 5009 5031 Nalgonda 27570 7180 20390 7396 Nellore 8464 2158 6306 7450 Vishakhapatnam 22077 825 21252 9627
Bihar
Gaya 4979 253 4726 9492 Mango Kadam and Litchi
Okra Potato Cauliflower and Brinjal
Sugarcane Wheat and Maize
Madhepura 48788 095 48693 9980 Rohtas 8601 339 8262 9605 W Champaran 6238 542 5696 9131
Chhattisgarh
Durg 7750 2768 4982 6428 Banana Papaya and Watermelon
Cauliflower Tomato Bitter Gourd and Okra
Wheat Gram and Soybean
Jashpur 1109 068 1041 9387 Kanker 1377 1222 155 1130
Sarguja 1194 303 891 7462
Gujarat
Anand 10410 238 10172 9771 Banana Papaya Pomegranate and Watermelon
Chilli Tomato Onion Potato and Fennel
Cotton Sugarcane Wheat Groundnut and Caster
Banaskantha 39630 8150 31480 7943 Bharuch 9264 1073 8191 8842 Bhavnagar 16880 2788 14093 8349 Jamnagar 8330 1728 6602 7926 Mehsana 19698 624 19074 9683
Haryana
Bhiwani 24937 2429 22508 9026 Kinnow Lemon Watermelon and Muskmelon
Tomato Cucumber and Potato
Cotton and Wheat
Fatehabad 11443 110 11333 9904 Karnal 12960 086 12874 9934
Sirsa 14587 631 13956 9567
Karnataka Belgaum 45594 4394 41200 9036 Banana Areca Tomato Pepper and
Impact Evaluation Study on ldquoNational Mission on Micro Irrigation (NMMI)rdquo
110
Bellary 7348 397 6951 9459 nut Pomegranate Mango and Papaya
Chilli and Ginger
Turmeric Bidar 5873 2322 3551 6046 Chitradurga 2243 2963 1520 6788 Hassan 8661 1175 7486 8643 Mysore 13194 1376 11818 8957
Maharashtra
Ahemadnagar 26000 3049 22951 8827
Banana Mango Citrus and Grapes
Tomato Chilli and Brinjal
Cotton Sugarcane and Soybean
Jalgaon 23909 7611 16298 6817 Jalna 7850 2660 5180 6611 Kolhapur 27500 453 27047 9835 Ratnagiri 1500 111 1389 9262 Wardha 1630 1630 810 4971
Odisha
Bhadrak 2775 104 2671 9625 Mango Banana Cashew nut and Papaya
Tomato Brinjal Okra Bottle gourd and Cauliflower
Moong and Sugarcane
Ganjam 3600 299 3301 9168 Mayurbhanj 4105 553 3552 8654 Nayagarh 2966 164 2802 9447 Boudh NA 201 NA NA
Rajasthan
Hanumangarh 31071 1505 29566 9516 Orange Kinnow Mango Bel Guava and Lemon
Onion Carrot and Tomato
Cotton Arandi Guar Mustard and Wheat
Jalore 29081 11897 17184 5909 Jhalawar 23349 1569 21780 9328 Jodhpur 31000 5712 25288 8157 S Madhopur 19448 676 18772 9652 Udaipur 7139 580 6559 9187
Sikkim
East Gangtok 697 NA
NA NA Orange and Guava
Tomato Brinjal Cauliflower and Barackoli
Wheat Mustard and Turmeric Mangaon 135
NA NA NA
Tamil Nadu
Erode 13195 1090 12105 9174 Banana Tapioca Coconut Aonla and Carrot
Chili Brinjal Tomato Potato Carrot and Turmeric
Sunflower
Nilgiri 650 213 437 6729 Thiruvarur 6036 094 5942 9844 Tirunelveli 6429 299 6130 9534
Villupuram 14167 550 13617 9611
UP
Aligarh 16441 005 16436 9997
Banana Mango and Guava
Tomato Potato Chilli Peas Brinjal and Arbi
Maize and Wheat
Ballia 11578 025 11553 9979 Jhansi 17920 099 17821 9944 Kannauj 13016 019 12997 9985 Saharanpur 21567 078 21489 9964 Siddharth Nagar 10212 038 10174 9963
Uttarakhand
Udhamsingh Nagar 15330 NA - - Mango Peach Litchi and Guava
Peas and Tomato Haridwar 6088 NA - -
Nainital 3780 NA - -
Source Data Portal India and GAPL Field Survey Analysis
516 Employment Opportunities
The NMMI has helped to widen the food basket of the country with significant contributions coming from the bringing more area under irrigation and with judicious use of water New farm practices and innovations with support of government have encouraged the farmers to shift toward high value a crop which in turn gives better income and more employment opportunities
Impact Evaluation Study on ldquoNational Mission on Micro Irrigation (NMMI)rdquo
111
5161 On Farm Employment Generation Following are the sectors of on farm employment opportunities for farmers and related stakeholders being generated through implementation of NMMI
Higher production requires more man days for operations like harvesting on farm handling and logistics
Soil water quality and inputs testing laboratory service center Plant protection service center (Pest surveillance diagnostic and control services
including Integrated Pest Management) Maintenance repairs and custom hiring of agricultural implements and machinery
including micro irrigation systems (sprinkler and drip) Agri Service Centre includes at least the above three activities (Group Activity)
5162 Off-Farm Employment Generation
With the initiation of National Mission on Micro Irrigation (NMMI) not only the farm employment has increased but it has generated lot of off-farm opportunities which would further give more employment in the future This initiative also aims at farm mechanization which not only includes tractors and its implements but also use of other components such as pumps micro irrigation etc An attempt has been made in this section to estimate the additional employment generated from various initiatives available under mission Apart from this indirect labors for the logistic service are also generated to accomplish the above mentioned activities Each of the suppliers has 5-7 skilled and semi-skilled employees to support in installation of the system training after sales service etc Services of casual labor are also hired during the time of installing the system which results in indirect opportunities 517 Impact on Employment The implementation of NMMI scheme in the different states generated employment opportunities mainly due to increase in production which requires more of the man days as well as post handling operations micro irrigation resulted in considerable savings of labor as is evident from the data cited in table 93 This is true for pre-harvest practices The increased yield due to MI systems called for involvement of more labor for handling the harvesting and post-harvest operations
The basis for computing the manpower involved before and after installation of MI system related primarily to application of irrigations hoeing weeding fertilizer insecticide pesticide applications harvesting threshing assembling cleaning grading packaging transportation logistics etc It may be seen from the above table that in all the states under study have shown decrease in utilization of the labor in pre-harvest practices that is labor saving on irrigation weeding fertilization and other operations It shows that the use of
Impact Evaluation Study on ldquoNational Mission on Micro Irrigation (NMMI)rdquo
112
human labor after the use of micro irrigation has decrease significantly and ranges between 741 to 1875 percent
The employment generations through adoption of micro irrigation in the farms by the farmers before the adoption of the MI and after the installation and results have been presented in the following table below
Table 89 Change in Manpower Requirement for Cultivation (per ha per crop cycle)
State Pre harvest practices Harvesting Post-harvest handling Total Man dayscrops No of man days
before NMMI
No of man days after
NMMI
Change in man Power
()
No of man days
before NMMI
No of man days after
NMMI
Change in man Power
()
No of man days
before NMMI
No of man days after
NMMI
Change in man Power
()
No of man days
before NMMI
No of man days after
NMMI
Change in man Power
() AP 49 41 -1633 36 42 1667 16 19 1875 101 102 099 Bihar 52 45 -1346 29 35 2069 13 16 2308 94 96 213 Chhattisgarh 59 50 -1525 31 36 1613 20 24 2000 110 110 000 Gujarat 48 39 -1875 35 41 1714 20 24 2000 103 104 097 Haryana 40 35 -1250 30 35 1667 16 21 3125 86 91 581 Karnataka 48 42 -1250 34 40 1765 19 23 2105 101 105 396 Maharashtra 58 52 -1034 33 39 1818 23 29 2609 114 120 526 Odisha 46 41 -1087 32 37 1563 18 19 556 96 97 104 Rajasthan 58 53 -862 25 33 3200 18 20 1111 101 106 495 Sikkim 54 50 -741 29 33 1379 19 24 2632 102 107 490 Tamil Nadu 50 44 -1200 27 32 1852 21 23 952 98 99 102 UP 55 46 -1636 25 32 2800 20 24 2000 100 102 200 Uttarakhand 47 41 -1277 29 36 2414 23 29 2609 99 106 707
The table further reveals that in post-harvest operations right from harvesting to handling and disposal of the produce there is an increase in labor utilization and it ranges between 2119 to 5023 percent From here it may be concluded that the decrease in utilization of the labor in the pre harvest activities are offset by the increase in the production which requires more of the labor for harvesting assembling and grading handling transportation and disposal of the produce
Impact Evaluation Study on ldquoNational Mission on Micro Irrigation (NMMI)rdquo
113
6 Conclusions amp Recommendations Micro irrigation technologies are being promoted in India by the central and state governments by providing different kinds of financial institutional and technical support These technologies are promoted primarily because of (1) as a means to save water in irrigated agriculture (2) as a strategy to increase income and reduce poverty and (3) to enhance the food and nutritional security of rural households Despite the reported significant economic advantages and the concerted support of the government and NGOs the current micro irrigation area in India remains an insignificant proportion of its potential Rising demand for irrigation water in the face of its inefficient use amid concerns of growing water scarcity has brought into renewed focus the need for conserving water and improving water use efficiency
The real thrust on promoting MI adoption largely started with the recommendations of the Report of the Task Force on Micro Irrigation in 2004Their report sought to increase the emphasis on MI technology and recommended a broader framework viewing MI technologies as a part of the overall water management strategy It also recommended that more financial resources for subsidies with state governments taking up 10 percent of the cost while the central funds would account for 40 percent and advised greater flexibility for states to determine their appropriate implementation structure and institutional mechanisms for subsidy disbursement (Ministry of Agriculture 2004) Based on these recommendations in 2006 the Centrally Sponsored Scheme (CSS) on MI was launched The `National Mission on Micro Irrigationrsquo (NMMI) in 2010 revising and reformulating the Centrally Sponsored Scheme (CSS) on Micro-Irrigation which was introduced
In this study an attempt is made to study the Impact Evaluation of micro irrigation in 13 states of India by using the available information and field surveys of 7400 respondents inclusive of both adopters and non-adopters
Owing to promotional schemes introduced by the state and central governments the area under micro irrigation has increased from 11817 ha in 2005-06 to over 361 million ha in 2012-13 In spite of having many advantages over conventional method of irrigation the area under micro-irrigation presently occupies only about 571 percent of the total irrigated area As per the latest information only 285 percent of total irrigated area under drip irrigation and 286 percent is under sprinkler irrigation
Government of India Ministry of Agriculture Department of Agriculture and Cooperation assigned the study on ldquoImpact Evaluation of National Mission on Micro Irrigationrdquo (NMMI) scheme to access the performance of the programme implementation and access the impact of this scheme on increase in farmersrsquo income through adoption of the MI system The study was conducted in 13 states comprising of 64 districts from the sampled states namely AP Bihar Chhattisgarh Gujarat Haryana Karnataka Maharashtra Odisha
Impact Evaluation Study on ldquoNational Mission on Micro Irrigation (NMMI)rdquo
114
Rajasthan Tamil Nadu Uttar Pradesh Sikkim and Uttarakhand The field survey to get the first hand information was conducted for a total sample of 7400 comprising beneficiary and non-beneficiary farmers in these selected states through adopting stratifiedndashpurposive-sampling design Apart from this information was also collected from system suppliers government officials
Major Outcomes of the Study
A Current Status i The Scheme since its inception in 2005-06 has made rapid stride across the
country It has succeeded in bringing about 356 million ha area under micro irrigation in the sampled 13 states7 The physical targets for the period 2005-06 to 2012-13 were fixed to the extent of 383 million ha out of which 356 million ha has been brought under MI The Targets and achievements for financial outlay were Rs50128 and Rs50065 crores respectively The overall physical and financial achievements thus come out to be 9299 amp 9987 percent The extent of achievements however varied among different states States like Bihar Karnataka Odisha Rajasthan and Sikkim achieved more than 90 percent of the set physical targets Uttarakhand could achieve only 21 percent of physical and 31 percent of the financial targets Other States such as AP Chhattisgarh Gujarat Haryana Maharashtra and Tamil Nadu succeeded to achieve more than 70 of their physical targets
ii AP Gujarat amp Maharashtra are leading states in the every aspect of performance the different activities involved in the process streamlined in the guideline of NMMI While Bihar UP Sikkim amp Uttarakhand states are lacking in terms of the functions mentioned in the guidelines
B Pattern of Assistance
i Most of the states are giving subsidy of more than 70 percent for installation of
MI system However comparison of various states and analysis clearly demonstrates that increased subsidy had no significant impact on the increase of area coverage under MI system Farmers in Maharashtra Gujarat and Haryana were 223 140 and 100 percent respectively in case of sampled beneficiaries while pertinent subsidy component in these states was 60 50 and 90 percent respectively Similarly area coverage in Rajasthan Tamil Nadu and Bihar was noted to be 73 45 and 31 percent respectively and the corresponding figures
7 Ministry of Agriculture
Impact Evaluation Study on ldquoNational Mission on Micro Irrigation (NMMI)rdquo
115
for subsidy were 90 75 and 90 percent The aforesaid observation clearly suggests that increase in subsidy component beyond a limit has little or no impact on area coverage under MI system The relationship between area expansion under MI and quantum of subsidy has been computed considering beneficiariesrsquo data on area expansion in different states before and after adoption of MI system Hence the relationship of subsidies with area expansion as such does not refer to any specific year
ii The efficiency of scheme implementing agency is very high as most of the farmers have reported that their applications are processed and sanctioned in less than 40 days as against 60 days specified in the guidelines Similarly in most of the sample states beneficiaries are reported to be satisfied with respect to the procedure for filing the application till disbursement of the subsidy amount
iii Presently subsidy is limited to maximum area of 5 hectare per beneficiaries which is an impediment to the growth of area under micro-irrigation The data on size and distribution of operational land holdings in the country also suggest that medium and large farmers accounted about 15 percent of total land holdings thus occupying approximately 5542 percent of the total area
iv All the states have reported convergence of Mission interventions with different schemes of the Government of India and State level programmes Most of the districts have converged NFSM interventions with programmes such as RKVY ICDP Farm Mechanization NHM and other programmes
C Sources of Awareness and Reasons of Non-adoption i The major sources of awareness about the NMMI scheme were through service
providers suppliers followed by fellow farmers extension workers
ii The non-beneficiaries farmers had mix responses for not adopting the scheme because of lack of awareness regarding subsidies lack of technical knowledge high capital cost and system being not economical therefore not required
iii As per primary survey of the sampled beneficiaries about 59 percent of the respondents were small amp marginal farmers and 13 percent were women farmers who have taken the advantage of the Scheme
Impact Evaluation Study on ldquoNational Mission on Micro Irrigation (NMMI)rdquo
116
D System Cost and Sources of Fund i On an average the cost of system per hectare incurred by the beneficiaries
ranged between Rs 5445736 to Rs 7208631 in drip system and Rs 20481 to Rs 28171 in sprinkler irrigation system depending on the cropping pattern crop spacing etc in the states under study
ii Almost in all states farmer beneficiaries use their own funds for contributing margin money (9866) Other sources albeit a small proportion constitutes banking KCC amp money lenders
iii Most of the farmers borrowed money at less than 10 percent of rate of interest from banks and KCCs
E Technical Observations about MI System i It was observed that about 64 percent of the beneficiaries installed drip system
34 percent sprinkler system and 2 percent have installed both the systems in their fields The highest proportion of drip was observed in Karnataka whereas adoption of sprinkler was higher in Bihar
ii The majority of the beneficiaries (about 6887) farmers of all the 13 states have got their soil and water tested In Gujarat UP Maharashtra amp Rajasthan soil testing adopted by 6927 5275 7337 and 7913 of respondents respectively
iii More than 70 percent of the respondent farmers of AP Gujarat Sikkim and Odisha were using in-line drip irrigation system whereas more than forty five percent beneficiaries of Haryana and Uttarakhand reported to practice on-line drip irrigation system
iv The farmers were using screen filters centrifugal separators hydro-cyclone filter disc filter sand media filters depending on the need The data reveals that screen filters are being commonly used by the beneficiaries in most of the sampled states except Haryana where more than 65 percent beneficiaries are using hydro-cyclone and screen filters in combination due to the water quality as they are using canal water
v There is an increasing emphasis on conserving water and using it more efficiently Micro irrigation technologies based on drip and sprinkler irrigation systems provide some hope for achieving this The government has been
Impact Evaluation Study on ldquoNational Mission on Micro Irrigation (NMMI)rdquo
117
providing substantial financial incentives in the form of capital cost subsidies to farmers to invest in these technologies Most drip equipment sales in the study areas are subsidy driven Manufacturers and market estimates suggest that most of the MI system sales are subsidy linked Partly as a result of the existing subsidy delivery mechanism drip technology has failed to capture the kind of market that would have been expected given the many advantages and water saving potential the technology offers
vi The farmers in almost all the states reported that components of MI System met the BIS norms The average figure for all the sampled states where system components were as per the BIS norms came out to be around 98 percent
vii As far as overall designing of the system is concerned it was found that the systems were well designed except in case of Sikkim and Odisha where the systems were functional but not able to meet the farmers expectation It is therefore suggested that extensive involvement of the extension staff may be ensured to install the system as per requirement of ground conditions and once the system is installed regular monitoring particularly during the warranty period of the installation be carried out so that defects if any be got rectified by the suppliers
F After Sales Service
i On an average 91 of the beneficiaries across the sampled states reported that
after sales services are being provided to them amp also they receive the services at the required time Most of the sampled beneficiaries revealed that they are getting warranty of the MI system
ii In almost all the states the sampled beneficiaries revealed that no technical support guidance on agronomic practices are extended to the users as they generally tell to take the help of extension agencies
G Impact Analysis i The irrigated area has increased in all the surveyed states after the introduction
of NMMI Scheme The Irrigated area within the 5892 sampled beneficiaries of the 13 states before adoption of MI system was found to be 1332086 ha which became 1444147 ha after adoption of MI system It is therefore concluded that total percentage increase in irrigated area with the sampled beneficiaries in 13 states after adoption of MI system was noted to be 841 from same source of water Maharashtra has topped the list with 2228 growth in irrigated area
Impact Evaluation Study on ldquoNational Mission on Micro Irrigation (NMMI)rdquo
118
ii Farmers of all the states have shown an increase in area under horticulture crops after the adoption of the system The cropped area after implementation of NMMI has shown an increase which may be due to utilization of degraded marginal land into cultivable land amp increase in cropping intensity
iii Scheme has performed well in terms of reduction in irrigation cost and significant cost saving has been observed for irrigation in all the surveyed states Irrigation cost is reduced by 20-50 with average of 323 Reduction in electricity consumption after installation of MI system Average electricity consumption has been reduced by about 31 after using the micro irrigation system Saving of fertilizers with averages reduction of about 28 in total fertilizer consumption in the surveyed states Fertilizer saving vary from 7- 42
iv Micro irrigation has generated benefits to the farmers in terms of enhancement of the productivity The average productivity of fruits and vegetables has increased about 423 and 528 respectively
v The overall benefits accrued from the micro irrigation system are reflected in the income enhancement of the farmers All the surveyed states reported increase in farmerrsquos income in the range of 20 to 68 with an average increase of 485
vi Given the high benefit-cost ratios which is more than one in almost all crops and states we also find that the present form for delivery of public support in the nature of a capital cost subsidy is constraining both to the widespread adoption of the technology by farmers and to innovation in technology development and marketing This has made the entire gamut of manufacturing sales adoption and use of drip technology subservient to government support The present study has put forward an alternate system wherein the subsidy is given directly to farmers willing to invest in a drip system With a given amount of funds available the proposed model can provide subsidies to a much larger number of farmers can bring a much larger area under drip irrigation resulting in lower subsidy outgo per hectare of drip irrigated area would still incentivise the farmers to invest in drip systems lower the cost of subsidy outgo easy to manage and govern less prone to interference and whims and fancies of officials and lead to more efficient use of available subsidy without distorting the market Thus on all indicators the proposed subsidy scheme of direct delivery far outweighs the existing subsidy scheme of subsidizing the manufacturers in the name of the farmersBC ratio of installing micro irrigation system is above one across the states and across the crops which signifies the importance of MI system in net income enhancement of the farmers The BC ratio was observed to
Impact Evaluation Study on ldquoNational Mission on Micro Irrigation (NMMI)rdquo
119
be highest in Odisha among fruits amp vegetables whereas in flowers Rajasthan amp Haryana beneficiary farmers achieved higher BC ratio
vii The positive outcomes have made the food security effective due to the increase in the production and productivity of different crops and increased area under irrigation from same source of water Area under horticulture crops as well as nutritional security has also enhanced
viii The NMMI has helped to widen the food basket of the country with significant contributions coming from the bringing more area under irrigation and with judicious use of water New farm practices and innovations with support of government have encouraged the farmers to shift toward crops giving higher income
H Employment Generation i Beneficiaries of all the states under study have shown decrease in utilization of
the labor in pre-harvest practices that is labor saving on irrigation weeding fertilization and other operations It shows that the use of human labor after the use of micro irrigation has decreased significantly and ranges between 741 to 1875 percent But in post-harvest operations right from harvesting to handling and disposal of the produce there is an increase in labor utilization and it ranges between 2119 to 5023 percent due to the increase in the production which requires more of the labor for harvesting assembling and grading handling transportation and disposal of the produce
I Training and Capacity Building i Among the surveyed states more than 90 percent of the sampled beneficiary
farmers in the state of Haryana Karnataka Sikkim amp Tamil Nadu had training on different aspects of MI System whereas farmers of Bihar amp Odisha only 20 amp 52 percent of the beneficiaries have received the training
ii Results of survey revealed that the system suppliers manufacturers are the major sources for imparting training as more than 90 percent of the farmers received training from them Very less proportion of the respondents reported to have training from other sources such as SAUs KVKs etc The participant beneficiaries revealed that the duration of training period generally was of 1-2 days Almost all the respondents of Tamil Nadu UP Chhattisgarh Haryana were given training materials during the training while few beneficiaries of the Bihar and Uttarakhand Karnataka were provided such training materials
Impact Evaluation Study on ldquoNational Mission on Micro Irrigation (NMMI)rdquo
120
iii Key areas for training were operation and maintenance of the system adoption
of package practices under MI and opportunities for introducing new crops Demonstration was other means of motivation and capacity building It was also found to be a good means of promotion
J Promotional Activities
i The farmers of the majority of the states acknowledged that the implementing
agencies are promoting NMMI schemes in local language however were not aware of the dedicated website for MI scheme in their state It is due to the fact that farmers do not have access or willingness to use internet for information gathering
ii On farm demonstrations particularly in rural area where exposure is limited are very important means in educating the rural folks It was noted that maximum beneficiaries of Haryana (98) followed by Sikkim (80) Rajasthan (64) and Uttarakhand (63) have visited the demonstration laid out in the nearby areas Whereas majority of the farmers of AP UP TN Karnataka Gujarat Bihar have reported that they have not visited any demonstration farm It is therefore suggested that more efforts may be put to expose the farmers regarding demonstration of MI system and its benefits
Thus it may be concluded that positive outcomes in terms of crop productivity enhancement due to implementation of MI Scheme have contributed significantly to the food requirements The NMMI has helped to widen the food basket of the country with significant contributions coming for bringing more area under irrigation and with judicious use of water New farm practices and innovations with support of government have encouraged the farmers to shift forward crop giving higher income
It is noteworthy that the incremental net returns were observed to be generally higher for cash crops such as fruits vegetables ground nut cotton etc than for food crops viz bajra and wheat This is in conformation with the results of research studies
Key Recommendations and Policy Implications
For the food security and sustainability to match the growing population priorities are to bring more area under irrigation through judicious use of irrigation water Keeping this aspect in view the Government of India launched the Central Sponsored Scheme for Micro Irrigation in 2005-06 which was up scaled as National Mission on Micro Irrigation in 2010 Micro irrigation system being capital intensive in nature and the adoption cannot be increased without providing subsidy Subsidy can be a necessary condition for encouraging the adoption of micro-irrigation but cannot be a sufficient condition for sustaining the
Impact Evaluation Study on ldquoNational Mission on Micro Irrigation (NMMI)rdquo
121
growth of it as many other factors determine the adoption of the same Even though subsidy is not needed to enhance the economic viability of the system it is still needed to enhance the incentive for the widespread adoption of MI particularly among the resource poor farmers (marginal and small categories) Therefore there is a need to find out the ways and means to convince the farmers about the economic and social feasibility of micro-irrigation Since it involves relatively higher amount of fixed investment farmers often ask the questions regarding the payback period viability water saving and the productivity gains It appears that these questions arise mainly because of poor exposure about the social and economic advantages of the technology Thus efforts are needed to convince the farmers through quality extension network as Indiarsquos highly successful green revolution was also the result of extension innovations as much as technology Considering the fast decline of irrigation potential and competing demand for water from different sectors all possible efforts are needed to increase the adoption of water saving technologies so as to avoid water scarcity in the future
Given the vast potential benefits of micro-irrigation and fast decline of availability of water for irrigation in the country a number of technical and policy interventions are required to be introduced so as to increase the adoption of micro-irrigation in India The needed recommendations and interventions are presented below
A Scheme Related 1) The rate of subsidy provided under NMMI through central government is fixed
uniformly for different categories of farmer with a limit of 5 hectare This needs to be restructured as about 15 of the large and medium farmersrsquo accounts for more than 5542 of the land in India Therefore this limit of five hectares needs to be enhanced for extending the subsidy
2) States often compete with each other to increase the subsidy component However it has been noted that higher subsidy does not necessarily lead to more area coverage under MI system as the highest increase in area under MI has been achieved by states which offer subsidy in the range of 50-75 percent eg Maharashtra Chhattisgarh Gujarat and Odisha In case of AP which increased subsidy from 70 to 90 percent in 2011-12 the additional area to come under MI in fact decreased as compared to the previous years It is therefore recommended that the states should be advised to seriously consider that the quantum of subsidy should preferably be not more than 50-70 percent including state and central share
3) No uniform pattern is being followed by states for implementation of this scheme It has been observed that in some states more than one department are involved in parallel eg Karnataka where it is being implemented by both agriculture and horticulture departments In such cases there is often lack of coordination which adversely affects
Impact Evaluation Study on ldquoNational Mission on Micro Irrigation (NMMI)rdquo
122
the outcome of the scheme It has also been observed that where a single department is designated as the implementing agency (eg horticulture or agriculture) it does not pay adequate attention to the crops coming under the purview of other departments Perhaps one of the best implementation strategies is to designate an independent Special Purpose Vehicle (SPV) on the pattern of Gujarat (GGRC) and AP (APMIP) States may be encouraged to replicate such a strategy
4) One of the major reasons for the slow growth of micro-irrigation in India is the high initial investment In spite of availability of subsidy from state agencies majority of the farmers are reluctant to invest in micro-irrigation system even in horticulture crops which is highly suitable for drip irrigation Therefore micro-irrigation system should be tailored made ie planned and designed based firmly on location specific parameters to reduce the cost of installation
5) Micro irrigation System is mostly promoted through subsidy schemes and not as an on-farm water and land management strategy In certain states under subsidy scheme the requisite consideration have not been given in respect of field size shape topography type and location of water source seasonal fluctuations type of soil and crop to be grown As a result in certain cases the subsidy may not match the specific situation of an individual farmer consequently the system may not match the site specific situations of an individual farmers consequently the system may not operate to the complete satisfaction of the farmer
B Technology Related 1) There is a need to establish a Central Testing Facility (CTF) to deal comprehensively with
the design development and testing of all equipments devices machines used in micro irrigation systems using state-of art technology It is suggested that the Govt may consider contacting regular and random technical audit of the system to cover about 2-3 percent beneficiaries within first and second year of the installation This will keep check on to quality and suppliers will be more vigilant to supply good quality of system
2) It is suggested that the implementing agencies should be more vigilant regarding warranty and after sales service of the system provided by the suppliers The question of releasing 10 percent of the cost of the system after one year subject to satisfactory performance of the system as certified by the beneficiary may be considered Maintenance manual in vernacular language should be made available to the beneficiaries at the time of installation of the system
3) It is observed that the cost of micro-irrigation accessories such as emitters filters laterals etc vary between shops and places Sometimes farmers do face problem in
Impact Evaluation Study on ldquoNational Mission on Micro Irrigation (NMMI)rdquo
123
getting spare parts in time It is necessary to provide quality materials in time for farmers for the speedy adoption of micro-irrigation
4) Inadequate information about the operation maintenance as well as the usefulness of micro irrigation is one of the main reasons for its uneven spread across regions in India Farmers still do not have full knowledge regarding the usefulness of the micro irrigation Even the adopters do not know fully how much of subsidy is available per hectare for different crops
5) Clogging of drippers mainly due to poor quality of water helps in bacterial growth which can be controlled by using chlorination which acts as a powerful oxidizing agent and vigorously attack micro-organisms such as algae fungi and bacteria Also acid is injected into drip irrigation system to lower the pH of the irrigation water and this helps in preventing the precipitation of salts such as calcium carbonate magnesium carbonate or ferric oxide It has been observed during the course of survey that the availability of sulphuric acid in the nearby towns is a major constraint and farmers are forced to purchase new spares by discarding clogged drippers Recently some farmers have started applying phosphoric acid to get dual benefit such as flushing of impurities and adding P fertilizer to the soil but the same is not recommended and also not very effective It is therefore recommended that system suppliers should make acid available to the growers as part of their after sales service obligation It is realized that the normal acid treatment does not help to mitigate the problem Therefore studies need to be carried out to devise de-logging measures in such areas
C Awareness and Capacity Building
1) The extension network currently operated mainly by government agencies does not
seem to be making significant impact on the adoption of this technology Therefore there is a need to revamp the entire extension network by involving the MI system manufactures in order to increase amp improvise the existing quality of extension services
2) System manufacturers should be involved intensively in promoting micro-irrigation by introducing frequent demonstration at farmersrsquo field and strategic locations in the district state The micro Irrigation system manufacturers should be involved in providing advice on agronomic packages to the farmers so as to encourage the adoption of micro irrigation at a large scale
3) Since MI system suppliers are one of the major sources of creating awareness among potential beneficiaries their involvement in laying down demonstration may be increased Similarly imparting training on technical and operational aspects of the system should be included as mandatory part of the training of the farmers by the
Impact Evaluation Study on ldquoNational Mission on Micro Irrigation (NMMI)rdquo
124
system suppliers The training may also include aspects of packages of practices which may be standardized by the SAUs amp other related organization and supplied to system suppliers for further dissemination to the farmers
4) Awareness on MI system is low in states like Bihar UP and Odisha Special drive is needed for exposure visits trainings to make them aware about the benefits and operation of the system The number of demonstration farms should also be increased
5) It is understood from the field study that the officials who are involved in promoting micro-irrigation technology under the GoI Scheme have inadequate knowledge about the technical and other details of MI Therefore the state government extension staff need to undergo lsquoRefresher Courses and exposure visitsrsquo to have basics of micro-irrigation thereby enabling their role in the implementation of the scheme
D Follow up Action 1) Though micro-irrigation has been in use in different States since mid-eighties State-
wise potential area is not estimated as of today Therefore it is essential to prepare State-wise and crop-wise potential area for MI A detailed estimate on State-wise potential would be useful to fix the target to be achieved and further to develop a road map for MP adoption in the country
2) It is evident from field study that capital cost required to install micro irrigation system is relatively high Because of this reason considerable percentage of farmers have expressed that they are unable to adopt this technology for low value crops There has been a significant development in the MI technology and efforts should be on developing and popularizing low cost technologies This would help reducing the cost of the system and increasing the adoption of micro-irrigation at a large scale and at least one percent of the outlay on micro-irrigation needs to be earmarked for micro-irrigation research
The information regarding all the activities under NMMI scheme at national and state level should be under public domain The information available at NCPAH website is qualitative and it should be quantitative to make it more clear and informative Similarly information at state level is hardly available in the website and it should be mandatory for implementing agencies to host their websites as is being done in case of Tamil Nadu
Impact Evaluation Study on ldquoNational Mission on Micro Irrigation (NMMI)rdquo
125
References Ahuja Usha Ram Singh PKJoshi and Neelu Nanwani 2012 Micro Irrigation Economics and Outreach in Haryana Chandrasekaran M and D Suresh Kumar 012 Micro Irrigation Economics and Outreach in Tamil Nadu
Dhawan BD 2000 Drip Irrigation Evaluating Returns Economic and Political Weekly 35 42 (Oct 14-20 2000) pp 3775-3780 Dhawan B D 2002 Technological change in irrigated agriculture A study of water saving methods New Delhi Commonwealth Publishers Government of India 2010 National Mission on Micro Irrigation Operational Guidelines New Delhi Ministry of Agriculture November 2010 Government of India 2004 Report of the Task Force on Micro irrigation Ministry of Agriculture New Delhi January 2004 INCID 1994 Drip Irrigation in India New Delhi Indian National Committee on Irrigation and Drainage Malik DP and MS Luhach 2002 Economic dimensions of drip irrigation in context of fruit Crops Paper presented at International Workshop on Economics of Water and Agriculture held at Institute of Food Agriculture and Environmental Sciences The Hebrew University Jerusalem Israel 18-20 December NABCONS 2009 Evaluation study of centrally sponsored scheme on Micro Irrigation Mumbai NABARD Consultancy Services Namara R E Upadhyay B Nagar R K 2005 Adoption and impacts of micro irrigation technologies Empirical results from selected localities of Maharashtra and Gujarat states of India Research Report 93 Colombo Sri Lanka International Water Management Institute Narayanamoorthy A 2012 Drip Method of Irrigation in Maharashtra Status Economics and Outreach I Narayanamoorthy A 2009 Drip and Sprinkler Irrigation in India Benefits Potential and Future Directions in Amarasinghe U T Shah RPS Malik (eds) Strategic Linking of the National River Linking Project (NRLP) of India Series 1 International Water Management Institute Colombo Narayanamoorthy A 2004 Impact assessment of drip irrigation in India The case of sugarcane Development Policy Review 22(4) 443-462 Narayanamoorthy A 2003 Averting water crises by drip method of irrigation A study of two water intensive crops Indian Journal of Agricultural Economics 58 (3) 427-437 Narayanamoorthy A 2001 Impact of drip irrigation on sugarcane cultivation in Maharashtra Agro Economic Research Centre Gokhale Institute of Politics and Economics Pune India Narayanamoorthy A 1997 Economic analyses of drip irrigation An empirical analysis from Maharashtra Indian Journal of Agricultural Economics 52 (4) 728-739 Narayanamoorthy A 1996 Evaluation of drip irrigation system in Maharashtra Mimeographed series No 42 Agro Economic Research Centre Gokhale Institute of Politics and Economics Pune India Malik RPS and MS Rathore2012 AgWater Solutions Project Case Study Accelerating Adoption of Drip Irrigation in Madhya Pradesh India
Impact Evaluation Study on ldquoNational Mission on Micro Irrigation (NMMI)rdquo
126
Palanisami K S Raman Kadiri Mohan 2012 Micro Irrigation- Economics and Outreach Macmillan Publishers India Ltd for International Water Management Institute Palanisami K Kadiri Mohan K R Kakumanu S Raman 2011 Spread and Economics of Micro irrigation in India Evidence from Nine States Economic and Political Weekly XLVI Nos 2627 June 25 2011 Patil RG (2001) water filtration for micro irrigation system In Micro irrigation Eds HP singh SP Kaushik Ashwani Kumar TS Murthy Jose C PP 574 Phansalkar SJ 2002 Appropriate Irrigation Technologies promoted by IDE A Socio Economic Assessment Raina JN Thakur BC and ML Verma (1999) Effect of drip irrigation and polyethylene mulch on yield quality and water use efficiency of tomato (Lycopersicon esculentum) Indian J Agric Sci 69 (6) 430-33 Raina JN Suman SKumar P and RSSephia (2013) Effect of Drip Fertigation With and Without Mulch on Soil Hydrothermal Regimes Growth Yield and Quality of Apple (Malus domestica Borkh Comm in Soil Sci amp Pl Annual 44 1-11 Regassa E Namara Bhawana Upadhyay and R K Nagar 2005 Adoption and Impacts of Micro irrigation Technologies Empirical Results from Selected Localities of Maharashtra and Gujarat States of India Research Report 93 Colombo Sri Lanka International Water Management Institute Sankaranarayanan KP Nalayini M Sabesh S Usha Rani R P Nachane and N Gopalakrishnan 2011 Low Cost Drip ndash Cost Effective and Precision Irrigation Tool in Bt Cotton Technical Bulletin No12011 Coimbatore Sharma RC (1998) Nature Extent and Classification In Agricultural Salinity Management in India Central Soil Salinity Research Institute Karnal UpadhyayB2003 Drip irrigation An appropriate technology for women Appropriate Technology Vol 30 (4) Verma S Tsephal S and Jose T 2004 Pepsee systems Grass root innovation underground stress Water policy 6 (2004) 1-16 Verma SR Impact of Agricultural Mechanization on Production Productivity Cropping Intensity Income Generation and Employment of Labor Status of Farm Mechanization of India 133-153 (wwwagricoopnicin)
Impact Evaluation Study on ldquoNational Mission on Micro Irrigation (NMMI)rdquo
127
Appendices Annexure I Processes of Implementation
Process for Implementation of Micro Irrigation Scheme
The Block Development Officer will receive Gram Sabha approved applications with the required documents on basis of ldquofirst come first servedrdquo basis from the farmers interested in availing benefit under the scheme through Village Horticulture Extension Officer Horticulture Development Officer and other sources such as regional workersdealers of registered manufacturing companies Action Block Development Officer At Block Development level the compiled applications will be put in a register according to priority and registered number and date will be assigned The registration number and date will be informed to beneficiary in written (Form-One) Action Block Development Officer Within three days of receiving the application a visit to farmerrsquos field will be made with Village Horticulture Extension Officer to confirm the information entered in application and field notes will be compiled in a folder (Form-Two) Action Block Development Officer Time Limit Three days After the field visits the applications will be arranged in an ordered list and sent to District Horticulture Office along with application form-three A copy of list and application will remain with Block Development Officer (Form-Three) Action Block Development Officer Time Limit Four days At district level development block wise received list will be registered and kept in same order in block wise registers From every Block Development list each application will be accepted in order Time Limit Three days Action Member Secretary District Micro Irrigation Committee (DMIC) The estimation of proposed area and cost will be made according to received applications district level integrated Action Plan will be formulated and District Micro Irrigation Committeersquos sanction proposal will be sent to State Micro Irrigation Committee Time Limit Ten days Action Member Secretary State Micro Irrigation Committee (SMIC) On the basis of district level Action Plans state level Action Plan will be prepared and after approval from State Micro Irrigation Committee (SMIC) will be sent to central governmentrsquos Department of Agriculture amp Cooperation New Delhi Time Limit Ten days Action Member Secretary State Micro Irrigation Committee (SMIC) Part-Two The information received about district wise Action Plan approved by central governmentrsquos Department of Agriculture amp Cooperation will be shared with DMIC Time Limit Three days Action Member Secretary State Micro Irrigation Committee (SMIC)
(a) After receiving information about approved Action Plan for district each block wise registered application will be forwarded to manufacturing companies which were selected by farmers for survey drawingdesign etc in an order (Form- Four) Time Limit Three days Action Member Secretary District Micro Irrigation Committee (DMIC)
Impact Evaluation Study on ldquoNational Mission on Micro Irrigation (NMMI)rdquo
128
(b) After getting the approval from the bank bank loan application will be send to the micro irrigation Company for the further required action Micro Irrigation Company will prepare drawing design etc of the farmerrsquos field in which system has to be established and make them available to Block Development Officer and Senior Horticulture Development Officer Time Limit Three days Action Micro Irrigation Company After receiving documents from Micro Irrigation Company Block Development Officer will visit concerned farmerrsquos field and will make initial physical verification of irrigation water and available energy for the proposed system which is to be established After initial physical verification required documents along with recommendation of Block Development Officer should be sent to Member Secretary DMIC (Form Five) Time Limit Three days Action Block Development Officer After receiving approved applications from Block Development Officer within stipulated time limit Member Secretary DMIC will issue administrative approval and give work orders to micro irrigation Company to accomplish work (Form- Six) Time Limit Three days after receiving applications Action Member Secretary District Micro Irrigation Committee (DMIC) After receiving work direction from Member Secretary District Micro Irrigation Committee (DMIC) Micro Irrigation Company will establish system in working condition at the site selected by concerned farmer It will give required training to farmer and manual in Hindi The satisfaction certificate will then be obtained from farmer should be sent to Member Secretary along with bills (Form- Seven) Time Limit Seven days Action Micro Irrigation Company After receiving information about system establishment from micro irrigation companies group of nominated officers from DMIC will physically verify the established system and report will be presented in prescribed form After receiving correct physical verification report the approved grant payment will be issued in prescribed form (Form-Nine) and action for payment will be ensured (Form- Eight) Time Limit Ten days Action Nominated Group for physical verification
Note (1) The process of making payments to the suppliers of materials under scheme should be made after physical verification and other necessary formalities have been completed The payment should be made according to priority (2) During physical verification concerned officials will see that system has been established according to the drawingdesign presented initially by micro irrigation Company The standard material has been provided in prescribed quantity The distribution of irrigated water is uniform at all the places The farmer has been trained to operate the system maintain it etc and manual in Hindi has been provided If during physical verification the facts are presented showing incomplete provision of system and supply of non-standard material Member Secretary will have a responsibility to inform micro irrigation Company that it should establish the system according to the presented proposal The physical verification of system should be done again before taking action to make payment to company Time Limit 3 days Action Member Secretary DMIC It will be responsibility of Head DMIC that the above action is taken in stipulated time Action Head DMIC
Impact Evaluation Study on ldquoNational Mission on Micro Irrigation (NMMI)rdquo
129
The person getting benefit out of micro irrigation scheme has to submit an affidavit on a 5 rupees stamp paper along with the necessary forms to the Assistant Director Horticulture Joint Member Secretary District Micro Irrigation Committee declaring that he will not transfer the dripsprinkler system to any other farmer neither sells it (Form- Ten) Action Beneficiary Answerable Block Development Officer The beneficiaries of this scheme will have to give in written that they or any member of their family (if combined) has not taken benefit from any Govt state Govt scheme of providing dripsprinkler for irrigation (Form- Eleven) Action Beneficiary Answerable Block Development Officer
Impact Evaluation Study on ldquoNational Mission on Micro Irrigation (NMMI)rdquo
130
Figure 13 Subsidy Process under GGRC Source Kumar amp Pullabhotla
Farmers
Approaches to MI Companies of
their choice
Application is submitted to GGRC with design and cost
estimation and 5 advance money by farmer
Get cost estimate for the installation after survey
Work Order released with 25 money to MI companies by
GGRCBank
Tri-party agreement (TPA) Collection of Management ChargesDifferent Amount
Submission of Performa Invoice for advanse payment
Installation amp trial run of MIS Third party inspection Issuance of
Insurance Cirtificate Submission of Final Bill
Payment of Balance Amount (75) by GGRCBank to MI
comp
Impact Evaluation Study on ldquoNational Mission on Micro Irrigation (NMMI)rdquo
131
Figure 14 Subsidy Process under APMIP
Source Adapted from Horticulture Department Note Abbreviations used MIAO ndash Micro-irrigation Area Officer AOHO ndash AgricultureHorticulture officer MCO ndash Micro-irrigation coordinators
Farmers
Application submitted to MIAOAgri OffHorti Off
Application form forwarded for village revenue officersquos
signature along with title deed
Forwarded to MI Company (Choice of company indicated
by farmer at the time of submission of application)
Company prepares the
design amp survey
Sent back to AOHO or
MIAO
Forwarded to AOHOMIAO who sends it
to Mandal Co-ordination Office
Will inform through MIAO to farmer of how much to
pay
Application + farmers DD (30 or farmerrsquos share)
submitted to MIAO
At district office administrative sanction
after scrutiny of documents
10 of cost released to
company as mobilization fund
Material delivery and installation to be undertaken by company within 15 days
Upon receiving completion certificate 85 of cost released to company
MCO has to inspect and furnish completion certificete
along with photograph
5 of cost is held as a guarantee for providing service Released
to company if bank guarantee is furnished
Impact Evaluation Study on ldquoNational Mission on Micro Irrigation (NMMI)rdquo
132
Box 1 Online Micro Irrigation Farmerrsquos Subsidy Management System in Tamil Nadu Subsidy Management System
Online Micro Irrigation Farmerrsquos Subsidy Management System in Tamil Nadu Subsidy Management System
With a mission to improve and increase the performance the Micro Irrigation (MI) for Horticulture and Non Horticulture crops across every region in all states of India web based software for centralized subsidy allocation and management monitoring software is developed This software was developed by Maruti Computers Private Limited (MCL) Chennai is proved to be very successful after its implementation in the state of Tamil Nadu This web based application software is an end-to-end tool which simplifies and facilitates the entire process of release of subsidy to the beneficiaries This system provides required information to all stake holders in a very transparent manner and provides paperless office and e-governance functionalities This software was developed with latest technologies and fully complies with current guidelines of Central Government MI Scheme The software is continually updated with the changes in rules and regulations and for the technology changes This software addresses the core need for this application - speedy processing of farmerrsquos subsidy requests in a transparent manner
Overview
The software was developed as per the guidelines of the MI Scheme This software is available in multiple languages For a specific state this is available in bilingual languages for various applications and annexure This will enable the beneficiary to understand the content of the application in the local language and fill without any errors
To increase the accuracy and correctness of the information submitted by the farmers software enables them to re-verify the entire data to be submitted by them System helps the applicant to correct the data before submitting to department On completion of various applications at their convenience the beneficiary can submit the application on-line
Once the entire application is in complete form system accepts the application for further processing A unique16 digit Application Id is generated by the system and with Id of the application The authorities will be able to identify the district taluka block etc along with date amp time seal The Beneficiary farmers may also submit their application online with the help of designated agencies (District Agriculture and Horticulture departments) or Sugar Mills or Micro Irrigation Companies who are all one of the stake holders of the scheme
The software and the data within the software are highly secured with access control privileges for various levels of users Data within the system cannot be manipulated or altered where they lack authority The software can generate various types of MIS reports and all stake holders The Government of India who is the sponsor of the scheme can generate reports on demand for monitoring the scheme The system has intelligence to identify and mark duplicate application Through this facility duplicate or fraudulent applicants are identified and removed from further processing The software is user friendly menu driven open-ended for future enhancements and is secure
Subsidy Processing and Monitoring The fully completed applications are then processed by the District Technical Committee Their decision of approving or rejecting the applications is fed online On approval a work order for installing the system is issued to the respective Micro Irrigation companies The Micro Irrigation companies after installing the system in the field they submit the completion certificate and their Invoice online Subsequently check Measurement done for the implementation of the system is then fed online Once check measurement is submitted Invoice submitted by the MI Companies gets approved for release of their payment and subsidy to the beneficiary
Process flow The software is built with Business Process Management (BPM) concepts BPM provides the workflow or process management capability ndash that helps an organization to formulate a step by step flow of a process and stipulate conditions for flow from one step to another It also provides tight security as who can move from one step to another
Impact Evaluation Study on ldquoNational Mission on Micro Irrigation (NMMI)rdquo
133
Box 2 Possibilities for Modifications
Possibilities for Modifications
The administrator of the system can make majority of operational changes without any programming changes The system is built on a rule driven and data driven architecture Hence by changing the data and rules the system behavior can be modified Process flow control can be managed by changing the business process flow with use of Ganges
The software application will be continuously updated MCL for the following items
-Central Government and state regulations
-Software upgrades for technology related items
Setting up of a company ndash Special Purpose Vehicle (SPV) to deal with the Micro Irrigation scheme in the states
Both the APMIP and GGRC models are different to the other State Implementing Agencies (SIA) in nature process and functioning the A key contrasting feature of this process between the two models is that under the GGRC system the farmer directly approaches the MI firm of his choice usually through a dealer whereas in the SIAAPMIP system the farmerrsquos point of contact is the local officer who has jurisdiction in the area The farmer indicates his choice of the company at the time of submitting his application and a number of additional approvals are needed before the company receives the farmerrsquos demand and proceeds to prepare the cost estimate This feature adds another layer of delay and unnecessary scrutiny in the subsidy disbursement process This is not the case under the GGRC model
Both APMIP and GGRC are independent and are not under any specific state department such as agriculture or horticulture has no crop specific crop bias
In many instances in these models the MI dealer or firm has an incentive to take up the responsibility of much of the administrative procedures such as collecting the relevant documents facilitating access to bank documentation (in case the farmer wants to avail of credit) submitting the application to the implementation authorities etc in order to speed up their own business
The GGRC encourages the suppliers to motivate the farmer for timely submission of application under MI Schemersquo and educate the farmer for availing loan procedures of Bank
Impact Evaluation Study on ldquoNational Mission on Micro Irrigation (NMMI)rdquo
134
under MI scheme This design reduces some transactional costs of availing the subsidy from farmers to MI suppliers and enhances efficiency
The implementing agency as the private sector also encourages devoting some of its own resources to promote and educate the farmers about the subsidy scheme and its guidelines in addition to the public extension efforts
Both these models however allow for various checks to scrutinize such misappropriation of subsidy through their design of the payment process and via third party verification procedures
Both APMIP and GGRC follow similar procedures for collecting the farmerrsquos share of the cost of the MI system and incorporate provisions to safeguard farmersrsquo interests The farmer pays his share to the implementing agency rather than directly to the MI firm Both the agencies releases only some portion of the amount to the supplier prior to the delivery and installation of the system as a mobilization fund
Only after the system has been installed a trial run undertaken and verified by a third party monitoring agency and with the farmer acknowledging the system performance is the complete amount (farmerrsquos contribution along with the subsidy component) released to the supplier
In view of above the GGRC model and to some extent the APMIP model incorporate useful design elements that align incentives for suppliers (of MI technology as well as credit and insurance suppliers) in a manner that is advantageous to farmers
Set up an SPV on the lines of GGRC (Gujarat) and APMIP (Andhra Pradesh) Dedicated and trained staff Timely subsidy disbursal Detailed information of the scheme to farmers All the paper work Demonstrations Warranty After Sales Services Monitoring of the companies operating in the state Monitoring of the companies operating in the state Regular training of farmers Agronomic support to farmers Make available loans and insurance to farmers
The above diagram clearly states the advantages of having the Special Purpose Vehicle (SPV) for Micro Irrigation There will be dedicated and trained staff to deal with the farmersrsquo queries and to work on the MI scheme full time The funds which do not come on time or are not properly managed will be taken care of by the SPV Often the farmers complain of not getting information on time or the complication of the Govt processes This will be dealt with once the SPV is there The SPV will help people with the paperwork and other
Impact Evaluation Study on ldquoNational Mission on Micro Irrigation (NMMI)rdquo
135
official documentation Regular demonstrations will be held and so will the work of creating awareness amongst the farmers about MI will be done The work of the registered companies will be monitored and it will be ensured that warranty and after sales service be provided to the customers The company will conduct regular training programs not only on MI but also on several other advanced topics of horticulture In addition the company will have agronomists to guide the farmers for obtaining higher yield The loan and insurance problems faced by the farmers will also be taken care of by the company by making arrangements which would be convenient to the farmers
Impact Evaluation Study on ldquoNational Mission on Micro Irrigation (NMMI)rdquo
136
Annexure II State wise Physical amp Financial Targets amp Achievements
Table 90 State wise Physical and Financial Target amp Achievements during 2005-06
State 2005-06
Physical (ha) Financial (Rs in lakh) T A A T A A
AP 45521 6775 1488 612923 934 1524 Bihar - - - - - - Chhattisgarh - - - - - - Gujarat 16720 5042 3016 218201 70117 3213 Haryana - - - - - - Karnataka 25234 - - 35841 - - Maharashtra 41856 - - 480809 - - Odisha - - - - - - Rajasthan - - - 104802 - - Sikkim - - - - - - Tamil Nadu 28950 - - - - - UP 8910 - - 124174 - - Uttarakhand - - - - - - Grand Total 180223 11817 656 2328415 163517 702
Source Ministry of Agriculture Note T- Target A- Achievement
Table 91 State wise Physical and Financial Targets amp Achievements during 2006-07
State 2006-07
Physical (ha) Financial (Rs in lakh) T A A T A A
AP 193459 84623 4374 1951968 11277 5777 Bihar 14223 - - 24821 - - Chhattisgarh 28748 4600 16 303288 25621 845 Gujarat 18247 24338 13338 33559 393095 11714 Haryana 5365 2823 5262 44389 23179 5222 Karnataka 23737 38850 16367 245675 445169 1812 Maharashtra 65119 108260 16625 879655 1346637 15309 Odisha 3314 1222 3687 45426 14319 3152 Rajasthan 39751 67721 17036 283334 268746 9485 Sikkim - - - - - - Tamil Nadu 5402 - - 120064 - - UP - 18636 - - - - Uttarakhand - - - - - - Grand Total 397365 3343006 8413 4457599 3659033 8209
Source Ministry of Agriculture Note T- Target A- Achievement
Impact Evaluation Study on ldquoNational Mission on Micro Irrigation (NMMI)rdquo
137
Table 92 State wise Physical and Financial Targets amp Achievements during 2007-08
State 2007-08
Physical (ha) Financial (Rs in lakh) T A A T A A
AP 46385 114846 24759 574776 1455942 25331 Bihar - 229 - - 2617 - Chhattisgarh 10063 2083074 20701 78339 175098 22351 Gujarat 45155 430371 9531 73496 492741 6704 Haryana 7215 778499 1079 60419 50811 8409 Karnataka 535177 62939 1176 68645 759797 11068 Maharashtra 103672 82224 7931 1389734 1279207 9205 Odisha 1032 306948 29743 1084 10127 9342 Rajasthan 44707 73735 16493 234114 2908 12421 Sikkim - - - - - - Tamil Nadu 12302 781957 6356 2200 155991 709 UP - 4659 - - 56217 - Uttarakhand - NA - - NA - Grand Total 3240487 4211739 12997 3989632 4729348 11854
Source Ministry of Agriculture Note T- Target A- Achievement
Table 93 State wise Physical and Financial Targets amp Achievements during 2008-09
State 2008-09
Physical (ha) Financial (Rs in lakh) T A A T A A
AP 85209 123581 14503 972731 1083556 11139 Bihar - 313 - - 2153 - Chhattisgarh 13633 3057361 22426 95445 206025 21586 Gujarat 33563 53427 15918 489861 739585 15098 Haryana 32404 2230169 6882 120728 127771 10583 Karnataka 84167 926223 11005 731866 584508 7987 Maharashtra 128758 100410 7798 1474806 1344402 9116 Odisha 3752 249553 6651 33794 29278 8664 Rajasthan 40231 77729 19321 238231 300915 12631 Sikkim - - - - - - Tamil Nadu - 1159735 - - 236721 - UP 1378 128748 9343 150 23512 15675 Uttarakhand - - - - - - Grand Total 423095 516338 12204 4172462 4678426 11213
Source Ministry of Agriculture Note T- Target A- Achievement
Impact Evaluation Study on ldquoNational Mission on Micro Irrigation (NMMI)rdquo
138
Table 94 State wise Physical and Financial Targets amp Achievements during 2009-10
State 2009-10
Physical (ha) Financial (Rs in lakh) T A A T A A
AP 114453 138341 12087 143107 178287 12458 Bihar NA 10748 - NA 1083 - Chhattisgarh 17636 1577119 8943 125198 119345 9533 Gujarat 33326 662491 19879 444727 542648 12202 Haryana 1576 325767 20670 21169 38539 18205 Karnataka 81311 10820517 13308 63813 868532 13611 Maharashtra 84673 94507 11161 1070708 1322628 12353 Odisha 7578 12776 16859 5284 87116 16487 Rajasthan 85211 95556 11214 569315 607335 10668 Sikkim - - - - - - Tamil Nadu - 1800803 - - 25583 - UP - 197413 - - 38114 - Uttarakhand - - - - - - Grand Total 425764 55475277 13030 4353157 5664040 13011
Source Ministry of Agriculture Note T- Target A- Achievement
Table 95 State wise Physical and Financial Targets amp Achievements during 2010-11
State 2010-11
Physical (ha) Financial (Rs in lakh) T A A T A A
AP 165500 122758 7417 24000 24000 100 Bihar - 1348504 - - 82588 NA Chhattisgarh 28780 2183093 7585 1019 1801 17674 Gujarat 80338 78294 9746 12000 1200002 100 Haryana 4426 93402 21103 136081 140227 10305 Karnataka 72700 87447 12028 9254 894525 9666 Maharashtra 11802508 11802508 100 22237 2226538 10013 Odisha 934092 1201396 12862 810 69682 8603 Rajasthan 148000 147613 9974 12000 11620 9683 Sikkim - - - - - - Tamil Nadu 35000 2615316 7472 6591 779718 1183 UP 5590 3108632 5561 8123 383 4715 Uttarakhand - - - - - - Grand Total 667700 640069 9586 9008411 917368 10183
Source Ministry of Agriculture Note T- Target A- Achievement
Impact Evaluation Study on ldquoNational Mission on Micro Irrigation (NMMI)rdquo
139
Table 96 State wise Physical and Financial Targets amp Achievements during 2011-12
State 2011-12
Physical (ha) Financial (Rs in lakh) T A A T A A
AP 88951 105063 11811 28720 28720 10000 Bihar 1961 2329428 118788 450 216683 48152 Chhattisgarh 17174 1839363 10710 3500 3500 10000 Gujarat 130294 6510182 4997 16664 1669505 10019 Haryana 6118 578608 9457 1993 166661 8362 Karnataka 63169 58013 9184 10965 9165 8358 Maharashtra 271935 11599894 4266 24980 24980 10000 Odisha 11523 1183659 10272 823 89288 10849 Rajasthan 107072 122183 11411 13095 128239 9793 Sikkim - 50969 - 400 400 10000 Tamil Nadu - 2755054 - 6625 6625 10000 UP - 379086 - - 44088 - Uttarakhand - NA - 75 - - Grand Total 698197 55752143 7985 108290 10807615 9980
Source Ministry of Agriculture Note T- Target A- Achievement
Table 97 State wise Physical and Financial Targets amp Achievements during 2012-13
State 2012-13 (March 13)
Physical (ha) Financial (Rs in lakh) T A A T A A
AP 131685 76065 5776 2899332 270209 9320 Bihar 50571 41372 8181 5200 5340 10269 Chhattisgarh 19118 14017 7332 3172 26778 8442 Gujarat 103381 96232 9308 18200 18201 10001 Haryana 9277 6538 7048 3000 257105 8570 Karnataka 107127 88605 8271 14065 1512195 10751 Maharashtra 127751 76620 5998 15018 15221 10135 Odisha 17516 19605 11193 2000 168953 8448 Rajasthan 98400 78535 7981 11000 1034708 9406 Sikkim 392 - - 200 - - Tamil Nadu 37320 26538 7111 8300 13235 15946 UP 11245 2143 1906 595 393 6605 Uttarakhand 1005 215 2139 150 70 4667 Grand Total 714788 526485 7366 10989332 11188831 10182
Impact Evaluation Study on ldquoNational Mission on Micro Irrigation (NMMI)rdquo
140
Annexure III Questionnaires
Beneficiary Farmerrsquos Questionnaire
1 General information Name of Farmer ( कसान का नाम) ----------------------------------------- Age (उ ) ------ Yrs
Village (गाव) ---------------------------------Block( लॉक)---------------------------------------------
District(िजला)------------------------------------State(रा य (---------------------------------------- Contact No (Mob)----------------------------- Landline (with STD code) -------- ------------------- E-mail id-----------------------------------------------------------------------------------------------------
2 Education status ( श ा क ि थ त)
1 Not educated(अ श त) 2 Primary( ाथ मक) 3 High school (हाई कल) 4 Sr Secondary (व र ठमा य मक) 5Graduate and above( नातकऔरऊपर)
3 Gender ( लग) - 1 Male(प ष) 2 Female (म हला)
4 Categories of farmers( कसान का जा त वग) - 1Gen(सामा य)2 OBC (अ य पछड़ा वग) 3 ST (अनस चत जनजा त) 4 SC)अनस चत जा त)
5 Land holding (भ म धारण) 1 Own land ( वयक )helliphelliphellip Acre 2 Leased in ( कराए
ल )helliphellip Acre 3Leased out ( कराय द )helliphellip Acre
6 Land holding Category of farmers (Tick ()) 1 Marginal (सीमा त)(lt 25 Acre) 2Small (छोट) (25-5 Acre) 3 Semi medium (अध - म यम )
(5-10 Acre) 4Medium (म यम) (10-25 Acre) 5 Large(बड़) (ge25Acre)
7 When the MI system was installed MI उपकरण कब लगाया गया------------------ (DDMMYY) ------ Yr
8 How did you get to know about the MI schemeआपको स म सचाई योजना कबार म
जानकार कस ह ई
Other Farmers
Advertisements व ापन Extension worker
Supplier
Any other (Specify) Radio Newspaper TV Pamphlet
Code 1 2 3 4 5 6 7 8
Impact Evaluation Study on ldquoNational Mission on Micro Irrigation (NMMI)rdquo
141
9 Which crops do you grow (आप कौन सी फसल पदा करत ह) S No
Crops फसल Name of the crop फसलकानाम
Spacing (mxm) अतराल
Area Covered (Acre)
Area Covered under MI(Acre)
Drip Sprinkler
1 Horticultural बागवानी
a Fruits फल
Veg सि जया
Flowerफल
Othersअ य
2 Non-Horticultural a b
Total Area (Acre)
10 Plantcrop management techniques used या आपन कोई फसल बधन क तकनीक इ तमाल
क ह a 1-Yes 2-No if yes then
b Area utilization (Acre)जमीन का उपयोग S No Land Before NMMI After NMMI
1 Agriculture a Horticulture crops b Field crops
2 Permanent waste Barren बजर एव अनपयोगी जमीन
3 Total Area (Acre)
8 Introduction of new crops amp spacing followed due to MI अपनाई गयी नयी फसल और
अ तराल S No Crop Spacing (mxm) 1 2
9 Irrigation Water Detailsपानी का ववरण
a Source ोत Bore well Canals Farm Ponds Water body Any other Code 1 2 3 4 helliphelliphelliphelliphelliphelliphelliphelliphelliphelliphelliphelliphelliphelliphelliphelliphelliphelliphelliphellip
b Water table helliphelliphelliphellipFt
SNo Intercropping before MI MI क पहल अतर फसल (Crops)
Intercropping after MI MI क बाद अतर फसल (Crops)
Crop Spacing (mxm) Crop Spacing (mxm) 1
2
3
Impact Evaluation Study on ldquoNational Mission on Micro Irrigation (NMMI)rdquo
142
10 Quality ofsoiland Irrigation water मटट और सचाई क पानी क गणव ता
Have you got soil amp water tested 1-yes 2-No if yes then S No Soil quality Response S No Water quality Response
i pH i pH ii EC iii EC
11 Why did you adopt NMMI schemeआप न इस योजना को य अपनाया Code Reasons Code Reasons 1 Because of subsidyअनदान क कारण 2 Quality of produceउ पाद क गणव ता 3 Water savingपानी क बचत 4 Proper utilization of land
जमीन का ठ उपयोग 5 Labor savingमजदर क बचत 6 Time savingसमय क बचत 7 Fertilizer savingउवरक क बचत 8 Early fruitingज द फलन 9 More productionअ धक उ पादन 10 Other specify_______________________
12 Impact of MI SNo Particulars Units Before MI After MI
a Irrigated Area स चत Acre
b Cost of irrigation सचाई क लागत RsAcre
c Electricity used बजल काउपयोग Hrsday
d Fertilizer usedउवरकोकाउपयोग KgAcre
e Productivity
b Fruits फल QtlsAcre
c Veg सि जया QtlsAcre
d Flowerफल QtlsAcre
e Othersअ य QtlsAcre
Non-Horticultural QtlsAcre f Incomeआय RsAcre
13 Have you got training of MI system या आपको NMMI योजना का श ण मला ह1-yes 2-No If Yes then
i By whom you got training of MI system Agencies SAUs
KVKs State Govt agencies
Kisan call centers
PFDC System supplier Others(Specify)
Code 1 2 3 4 5 6
ii Training Details (Duration (अव ध)helliphelliphellipDays)
S No Particulars 1-Yes 2-No 1 Is training material provided या श ण साम ी द जातीह
Impact Evaluation Study on ldquoNational Mission on Micro Irrigation (NMMI)rdquo
143
SAU= State Agricultural University PFDC= Precision Farming Development Centre iii Promotional activities
Awareness descriptionजाग कताकावणन 1-Yes 2-No
a Publicity of the MI Scheme in local language
इस योजना का चार थानीय भाषा म होता ह
b Whether there is a dedicated website for MI Scheme in the State
या आप क रा य म इस योजना को सम पत कोई वबसाईट ह
c Whether online applications are received
या आप क रा य म ऑनलाइन अिजया ल जाती ह
d Are you aware about package of practices being adopted for MI
या आप स म सचाई क इ तमाल करन क काय णाल को समझत ह
14 Subsidy Detailsअनदान का ववरण i
Financial assistanceआ थक सहायता
Govt () Beneficiary लाभाि वत()
Total system cost (Rs)उपकरण क लागत
Drip
Sprinkler
ii Time taken in subsidy disbursement (Days) अनदा नत राशी मलन म लगा समय ( दन म) i Application to Sanction -helliphelliphelliphelliphellipdays
ii Sanction to Installation -helliphelliphelliphelliphellipdays
2 Topic covered in the training श ण
क म
i Operation of the systemउपकरण क काय णाल
ii Maintenance of the systemउपकरण का रखरखाव
iii Package of practices for the cropsफसल क उगान क प त
iv Opportunities for Introduction of new crop नयी फसल क प रचय क ग जाइश
v Other related schemesकोई अ य स ब धत योजना
3 Have you joined any field visit या कसी खत का मआइना कया ह
4 Are you satisfied with the Learning या आपको मल पर श ण स आप सत ठ ह
Impact Evaluation Study on ldquoNational Mission on Micro Irrigation (NMMI)rdquo
144
15 Finance a Source of beneficiary share of MIलाभाि वत क ह स का ोत
1Own sources
2Banks Namehelliphelliphelliphelliphelliphelliphellip
3KCC 4Money lenders
5Any other helliphelliphelliphelliphelliphelliphelliphelliphelliphelliphelliphelliphelliphelliphelliphellip
b Rate of Interest (if money borrowed then) याज क दर (उधार लन क ि थ त म)
16 Availability of electricity बजल क उपल धता helliphelliphelliphellipHrs day
17 Power of the pump set you are using प प सट क मताhelliphelliphelliphellipHP
18 Type of fertilizer used by the farmer उपयोग म लए गए उवरक का कार
i 1 Organic 2 Inorganic 3 Both ii 1 Liquid 2Water soluble 3Solid
19 Type of Irrigation Filters used by the farmers कसान वारा इ तमाल कय जान वाल सचाई फ टर क कार
Type of Filters फ टर क कार Code
Hydro-cyclone Filterहाइ ो-साय लोन फ़ टर 1
Screen filters न फ़ टर 2
Sand Media Filtersसड मी डया फ़ टर 3
Disc Filters ड क फ़ टर 4
Any other specifyअ य ( वशष ववरण)_________________________________________
20 Employment opportunities(रोजगार क अवसर) S No Particular No of man days
before NMMI No of man days after NMMI
1 Pre harvest practices कटाई क पहल क या
2 Harvesting कटाई
3 Post-harvest handling कटाई क बाद क या
Interest rate याज दर 3-7 7-10 10-12 12-15 gt15
Code 1 2 3 4 5
Impact Evaluation Study on ldquoNational Mission on Micro Irrigation (NMMI)rdquo
145
21 Assessment of System Design णाल का आकलन
Particulars 1-Yes2-No
a Whether various system components supplied to you are as per the BIS
या आपको दए गए उपकरण क सभी ह स BISमानक क अन प ह
b Whether pump size is proper to the field plot size wrt crop water requirements
या आपक वारा लगाय गए पप का आकार आप क खत क आकार और उसम बोई गयी फसल एव उपल ध पानी क अन प ह
c Does this MI system meet your requirements
या यह MI उपकरण आपक ज रत को परा करता ह
d Is this design layout is as per your project proposal
या इस उपकरण का खाका आप क ताव क अन प ह
e Whether after sales service has been received by you from the MI system suppliers या आपको उपकरण उपल ध करान वाल न उपकरण बचन क बाद कोई सवा दान क ह
f Whether the MI systems were found to be functional in the field
या MI उपकरण खत म सचा प स काम कर रहा ह
22 System supplier
i BrandManufacturer of MI equipment usedउपकरण का नमाताhelliphelliphelliphelliphelliphelliphelliphelliphelliphelliphelliphelliphelliphelliphelliphelliphelliphelliphelliphelliphelliphelliphelliphelliphelliphelliphelliphelliphelliphelliphelliphelliphelliphelliphelliphelliphellip
ii Reasons for buying from them उनस खर दन का कारण Local Govt official Other farmers company reps Advertisements
Code 1 2 3 4
iii After sales services ब क बाद द जान वाल सवाए
Impact Evaluation Study on ldquoNational Mission on Micro Irrigation (NMMI)rdquo
146
i Is it provided by the vendor व ता वारा द जाती ह 1-Yes2-No if yes then
ii Level of satisfaction of the serviceसवा स सत ठ का तर
iii Warranty 1-Yes2-No if yes thenवारट य द ह तो
lt6 Months 1 Yr 1-2 Yr 2-3 Yr gt3 Yr Code 1 2 3 4 5
23 Difficulty faced by the farmer in NMMI
schemeNMMIयोजनाकोअपनानमउठाईगयीपरशा नया S No Particulars 1-Yes 2-No 1 Procedure related या स स ब धत
2 Quality issuesगणव ता स स ब धत
3 Higher prices charged under scheme of the system then available in marketउपकरण क बाज़ार भाव स अ धक क़ मत
4 Delay in system supply (Committed date vs Actual date ) उपकरण क आप त म दर
5 Other charges (Not covered in the scheme additional money paid) अ त र त भगतान
6 After sale services are not up to the mark बचन क बाद द गयी सवाए सतोषजनक नह
7 Other specify__________________________________________________________
24 Would you like to recommend this scheme to others या आप इस योजना को अपनान क
सलाह अ य को दग 1-Yes 2-No
Share your experiencesअपना अनभव बताए helliphelliphelliphelliphelliphelliphelliphelliphelliphelliphelliphelliphelliphelliphelliphelliphelliphelliphelliphelliphelliphelliphelliphelliphelliphelliphelliphelliphelliphelliphelliphelliphelliphelliphelliphelliphelliphelliphelliphellip helliphelliphelliphelliphelliphelliphelliphelliphelliphelliphelliphelliphelliphelliphelliphelliphelliphelliphelliphelliphelliphelliphelliphelliphelliphelliphelliphelliphelliphelliphelliphelliphelliphelliphelliphelliphelliphelliphelliphellip
1timely 2 Late 3 Irregular
1Satisfied 2 Not satisfied 3 Indifferent
Impact Evaluation Study on ldquoNational Mission on Micro Irrigation (NMMI)rdquo
147
25 Any other socio economic benefits you would like to mention कोई अ य सामिजक- आ थक लाभ i helliphelliphelliphelliphelliphelliphelliphelliphelliphelliphelliphelliphelliphelliphelliphelliphelliphelliphelliphelliphelliphelliphelliphelliphelliphelliphelliphelliphelliphelliphelliphelliphelliphellip
ii helliphelliphelliphelliphelliphelliphelliphelliphelliphelliphelliphelliphelliphelliphelliphelliphelliphelliphelliphelliphelliphelliphelliphelliphelliphelliphelliphelliphelliphelliphelliphelliphellip 26 Any suggestion for the better implementation of NMMI Scheme
NMMI योजना को सह तर क स लाग करन क लए आप क या सझाव ह
i helliphelliphelliphelliphelliphelliphelliphelliphelliphelliphelliphelliphelliphelliphelliphelliphelliphelliphelliphelliphelliphelliphelliphelliphelliphelliphelliphelliphelliphelliphelliphelliphelliphelliphellip ii helliphelliphelliphelliphelliphelliphelliphelliphelliphelliphelliphelliphelliphelliphelliphelliphelliphelliphelliphelliphelliphelliphelliphelliphelliphelliphelliphelliphelliphelliphelliphelliphellip
iii helliphelliphelliphelliphelliphelliphelliphelliphelliphelliphelliphelliphelliphelliphelliphelliphelliphelliphelliphelliphelliphelliphelliphelliphelliphelliphelliphelliphelliphelliphelliphelliphelliphelliphellip
27 Whether MI System is installed in the entire land holding Yes No 28 Any MI demonstration nearby (Yes No) 29 Type of Sprinkle (1-Portable 2-semi-permanent 3-rain gun) 30 Type of Drip (1-Inline 2-online) 31 Observations of the investigator
Condition of the MI System at the time of visit (1-Functional 2-Not Functional)
i Overall design (1-Good 2-Satisfactory 3-Bad) ii General condition of the field (1-Good condition 2-Average condition 3- Bad
condition) iii Whether Farmers are using flood irrigation along with MI system (1-Yes 2-No) iv Whether choice of drip sprinkler MI system match with the crop requirement
(1-Yes 2-No) Signature of farmer Investigatorrsquos Name कसान का ह ता र जाचकता का ह ता र
Date दनाक
Impact Evaluation Study on ldquoNational Mission on Micro Irrigation (NMMI)rdquo
148
Non-beneficiary Farmerrsquos Questionnaire)
1 General information Name of Farmer ( कसान का नाम) ----------------------------------------- Age (उ ) --------- Yrs
Village (गाव) ---------------------------------- Block( लॉक)--------------------------------------------
District(िजला)------------------------------------State(रा य----------------------------------------- Contact No (Mob)----------------------------- Landline (with STD code) -------- ------------------- E-mail id------------------------------------------------------------------------------------------------------
2 Education status ( श ा क ि थ त)
1 Not educated(अ श त) 2 Primary( ाथ मक( 3 High school (हाई कल) 4 Sr Secondary (व र ठमा य मक) 5Graduate and above( नातकऔरऊपर)
3 Gender ( लग) - 1 Male(प ष) 2 Female (म हला) 4 Categories of farmers( कसान का जा त वग) - 1Gen(सामा य)2 OBC (अ य पछड़ावग)
3 ST (अनस चत जनजा त) 4 SC)अनस चत जा त)
5 Land holding (भ म धारण) 1 Own land ( वयक )helliphelliphellip Acre 2 Leased in ( कराए ल )helliphellip Acre 3Leased out
( कराय द )helliphellip Acre
6 Land holding Category of farmers (Tick ()) 1 Marginal (सीमा त)(lt 25 Acre) 2Small (छोट) (25-5 Acre) 3 Semi medium (अध - म यम ) (5-10 Acre) 4Medium
(म यम) (10-25 Acre) 5 Large (बड़) (ge25Acre)
7 Are you aware about the NMMI scheme याआप NMMI योजना क बार म जानत ह 1-Yes 2-No
If Yes then how did you get to know about the MI scheme आप को स म सचाई योजना क बार म जानकार कस ह ई
Other Farmers
Advertisements व ापन Extension worker
Supplier Any other (Specify)
Radio Newspaper TV Pamphlet Code 8 9 10 11 12 13 14 8
8 Which crops do you grow (आप कौन सी फसल पदा करत ह)
S No Crops फसल Name of the crop फसल का नाम Spacing(mxm) Area Covered (Ha)
3 Horticultural बागवानी
f Fruits फल
g Veg सि जया
h Flowerफल
i Others अ य
4 Non-Horticultural a b
Total Area (Ha)
a Area utilization(Acre)जमीन का उपयोग S No Land Response 4 Agriculture c Horticulture crops
d Field crops 5 Permanent waste Barren बजर एव अनपयोगी जमीन
Impact Evaluation Study on ldquoNational Mission on Micro Irrigation (NMMI)rdquo
149
6 Total Area (Acre)
10 Irrigation Water Detailsपानीका ववरण
a Source ोत Bore well Canals Farm Ponds Water body Any other Code 5 6 7 8 helliphelliphelliphelliphelliphelliphelliphelliphelliphelliphelliphelliphelliphelliphelliphelliphelliphelliphelliphellip
b Water table helliphelliphelliphellipFt
11 Why did you not taken advantage of NMMI scheme आपन NMMIयोजनाकालाभ य नह लया
Code Reasons Code Reasons 11 Less aware of subsidy
अनदान क बार म अन भ 12 Less technical knowledge
तक नक ान नह 13 Lengthy procedureल बी या 14 High capital cost involvedअ धक लागत 15 Not economicalआ थक नह 16 EmittersrsquoNozzlesrsquo frequent clogging
ट ट का बार बार अव होना 17 Application yet not cleared अभीअज पास नह ह यी
18 Any other Specify________________________ ____________________________
12 Have you participated in any training program of NMMI याआपको NMMI योजनाका श ण मला ह1-Yes 2-No If Yes then
a By whom you got training of MI system
Agencies SAUs KVKs
State Govt agencies
Kisan call centers
PFDC System supplier Others(Specify)
Code 1 2 3 4 5 6
b Training Details (Duration (अव ध)helliphelliphellipDays)
SAU= State Agricultural University PFDC= Precision Farming Development Centre
c Promotional activities
Awareness descriptionजाग कता का वणन 1-Yes 2-No
e Publicity of the MI Scheme in local language इस योजना का चार थानीय भाषा म होता ह
f Whether there is a dedicated website for MI Scheme in the State
S No Particulars 1-Yes 2-No 5 Is training material provided या श ण साम ी द जाती ह
6 Topic covered in the training श ण क
म
vi Operation of the systemउपकरण क काय णाल
vii Maintenance of the systemउपकरण का रखरखाव
viii Package of practices for the cropsफसल क उगान क प त
ix Opportunities for Introduction of new crop नयी फसल क प रचय क ग जाइश
x Other related schemesकोई अ य स ब धत योजना
7 Have you joined any field visit या कसी खत का मआइना कया ह
8 Are you satisfied with the Learning या आपको मल पर श ण स आप सत ठ ह
Impact Evaluation Study on ldquoNational Mission on Micro Irrigation (NMMI)rdquo
150
या आपक रा य म इस योजना को सम पत कोई वबसाईट ह g Whether online applications are received
या आप क रा य म ऑनलाइन अिजया ल जाती ह
h Are you aware about package of practices being adopted for MI या आप स म सचाई क इ तमाल करन क काय णाल को समझत ह
13 Availability of electricity बजल क उपल धता helliphelliphelliphellipHrs day
14 Type of fertilizer used by the farmer उपयोग म लए गए उवरक का कार a 1 Organic 2 Inorganic 3 Both b 1 Liquid 2Water soluble 3Solid
15 Difficulty faced by the farmer in NMMI scheme NMMIयोजना को अपनान म उठाई गयी परशा नया S No Particulars 1-Yes 2-No 8 Procedure related या स स ब धत
9 Quality issuesगणव ता स स ब धत
10 Higher prices charged under scheme of the system then available in marketउपकरण क बाज़ार भाव सअ धक क़ मत
11 Delay in system supply (Committed date vs Actual date ) उपकरण क आप त म दर
12 Other charges (Not covered in the scheme additional money paid) अ त र त भगतान
13 After sale services are not up to the mark बचन क बाद द गयी सवाए सतोषजनक नह
14 Other specify__________________________________________________________
16 Do you like to adopt this scheme in near future या आप इस योजना को भ व य म अपनाना चाहग 1-Yes 2-No Why helliphelliphelliphelliphelliphelliphelliphelliphelliphelliphelliphelliphelliphelliphelliphelliphelliphelliphelliphelliphelliphelliphelliphelliphelliphelliphelliphelliphelliphelliphelliphelliphelliphelliphelliphelliphelliphelliphelliphelliphelliphelliphelliphellip helliphelliphelliphelliphelliphelliphelliphelliphelliphelliphelliphelliphelliphelliphelliphelliphelliphelliphelliphelliphelliphelliphelliphelliphelliphelliphelliphelliphelliphelliphelliphelliphelliphelliphelliphelliphelliphelliphelliphelliphelliphelliphelliphellip
17 Would you like make any suggestion for the better implementation of NMMI Scheme NMMI योजना को सह तर क स लाग करन क लए आपक या सझाव ह
i helliphelliphelliphelliphelliphelliphelliphelliphelliphelliphelliphelliphelliphelliphelliphelliphelliphelliphelliphelliphelliphelliphelliphelliphelliphelliphelliphelliphelliphelliphelliphelliphelliphelliphellip ii helliphelliphelliphelliphelliphelliphelliphelliphelliphelliphelliphelliphelliphelliphelliphelliphelliphelliphelliphelliphelliphelliphelliphelliphelliphelliphelliphelliphelliphelliphelliphelliphellip
iii helliphelliphelliphelliphelliphelliphelliphelliphelliphelliphelliphelliphelliphelliphelliphelliphelliphelliphelliphelliphelliphelliphelliphelliphelliphelliphelliphelliphelliphelliphelliphelliphelliphelliphellip Signature of farmer Investigatorrsquos Name कसानकाह ता र जाचकताकाह ता र
Date दनाक
Impact Evaluation Study on ldquoNational Mission on Micro Irrigation (NMMI)rdquo
151
Annexure IV Reason of higher cost of drip in Gujarat During the survey in 13 states 5892 sampled farmers holding 1481058 hectares of land were interacted Analysis of data reveals that average unit cost of drip irrigation system ranges between from 5445736 Rsha to 7208631 Rsha The average cost of drip system installation was found to be highest in Gujarat followed by Chhattisgarh Tamil Nadu Maharashtra Sikkim UP Karnataka Rajasthan Andhra Pradesh Haryana Bihar and Odisha Analysis was carried out to find out reasons for higher average unit cost of drip irrigation system in Gujarat as compared to other States Following reason are given in support
I The per cent of area coverage under sprinkler irrigation system in Gujarat is 1169 and in other states it is 8830 per cent The average cost of sprinkler irrigation system is Rs 18000 ha against Rs 55000 Rsha of drip irrigation system
II The more per cent of area coverage under drip irrigation system in Gujarat lead to higher average cost
III Figure- 1 shows area coverage under 0-10 m2 spacing it could be seen from the figure that Gujarat is far ahead from other states in term of area coverage in close spacing crops When area covered under other spaced crops is compared UP stand at 1st position in term of area coverage under wide space crops and Gujarat cover very least as can be seen from figure1
Figure 15 Area coverage under close spacing crops (spacing range lt10 m2)
Impact Evaluation Study on ldquoNational Mission on Micro Irrigation (NMMI)rdquo
152
IV When compared average unit cost per ha of drip irrigation system as per NMMI guideline the average unit cost in closed spacing crops (0-10 m2) stand at 264 times higher than the average unit cost of wide spacing crops (Spacing range more than 10 m2)
Figure 17 Spacing wise unit cost (Rsha) of drip irrigation system as per NMMI guideline
Figure 16 Area coverage under wide spacing crops (spacing range more than spacing range 10 m2
Impact Evaluation Study on ldquoNational Mission on Micro Irrigation (NMMI)rdquo
153
It is also pertinent to mention that financial assistant for installation of drip system in Gujarat is given at actual unit cost rather than as recommended in NMMI guideline which is being adopted in all states other than Gujarat In Gujarat the additional amount is given by state exchequer which escalates invoice value resulting in higher average cost
Impact Evaluation Study on ldquoNational Mission on Micro Irrigation (NMMI)rdquo
154

ii
It would have been impossible to complete this study without the support of 7400 farmers and other stakeholders such as system suppliers financial institutions NGOs PRIs etc spread over 13 states We extend our gratitude to these farmers who deserve special appreciation for extending their willing cooperation in giving their valuable time responding to the questionnaire and share their views and concerns during the field study We also take opportunity to thank State Agriculture as well as Horticulture Department amp other stakeholders of the 13 States where the study was undertaken Members of the team have put in lots of hard work and duly deserve appreciation for carrying out the survey Prof BK Sikka Agro Economist and Prof JN Raina eminent Soil Scientist deserve our special appreciation for their guidance
If the study helps the policy makers to make this scheme more effective and useful we would feel that the effort has been worth it
Gokul Patnaik (Chairman)
i
Table of Contents Contents Executive Summary I
1 Introduction 1
11 Project Background 1
12 Salient Features of the Scheme 2
13 The Assignment 4
14 Objectives of the Study 4
2 Approach and Methodology 5
21 Approach 5
22 Methodology 6
221 Sources of Data Collection 7
222 Sampling 8
223 The Sample Design 8
224 Selection of Beneficiaries and Non-beneficiaries 9
23 Limitations of the Study 11
3 Assessment of Current Status 13
31 Performance of MI Scheme 13
32 State wise Performance 15
33 Targets and Achievements 15
34 Performance of Scheme for Area Coverage as Compared to Potential 21
35 Pattern of Assistance 22
351 Indicative Cost of Installing Micro Irrigation System 22
352 State-wise Pattern of Assistance 23
353 Quantum of Subsidy and Adoption of MI System by Farmers 24
354 State Implementing Agencies 25
355 Extent of Convergence with Other Schemes 26
356 Food Security and the Micro Irrigation Scheme 27
36 Mission Structure Review 29
361 National Level 29
362 State Level Micro Irrigation Committee (SMIC) 30
ii
363 District Level Micro Irrigation Committee (DMIC) 33
364 Improving Efficacy of the Institutional Mechanism 34
37 Role of Panchayati Raj Institutions (PRIs) in NMMI Scheme 35
4 Primary Survey Respondentsrsquo Profile and Findings 36
41 Demographic Profile (Sampled Beneficiaries amp Non-beneficiaries) 36
411 Size of Land Holding 36
412 Categories of Farmers 38
413 Gender 39
414 Educational Status 39
415 Status of Communication Facilities 41
42 Results and Discussions 42
421 Quality of soil and irrigation water 42
422 Sources of Irrigation 44
423 Water Table 45
424 Sources of Awareness about NMMI Scheme 46
425 Reasons for Non-adoption of Micro Irrigation Systems 48
426 Willingness of Non Beneficiaries to Adopt MI System 49
427 Progress of Installation of MI System 50
428 Average Cost of Installing the MI System 50
429 Factors Influencing Farmers to Adopt MI system 51
4210 Subsidy Disbursement 52
4211 Sources of Margin Money 53
4212 Interest Rates on Borrowing 53
4213 Type of MI system and Area Coverage 54
4214 System Demonstration 64
4215 Training and Capacity Building 64
4216 Availability of Electricity 68
4217 Capacity of Pump Sets 69
4218 Irrigation Filters 69
4219 Type of Emitters in drip system 72
4220 Type of Sprinkler 73
4221 Farmersrsquo opinion on System Supply and Installation related constraints 74
4222 After Sales Service 75
iii
4223 Warranty 77
4224 Promotional Activities 78
43 Observations of Field Staff on MI System 79
44 Assessment of the System Design 80
45 System Suppliers 82
5 Impact Evaluation 87
51 Crop Diversification 87
52 Area Expansion under Micro Irrigation 89
53 Increase in Irrigated Area due to Water Saving 89
54 Development of marginal and wasteland by beneficiaries 90
55 Dripper spacing 91
56 Reduction in Cost of Irrigation 94
57 Electricity Consumption 94
58 Economy in Fertilizer Use 95
59 Increase in Crop Productivity 96
510 Reduction in these Cost of Inputs of Irrigation amp Productivity Enhancement Crop-wise 98
511 Introduction of New Crops 102
512 Increase in Farmerrsquos Income 104
513 Benefit-Cost Ratio 105
514 Increase in Area 108
515 Potential area that can be brought under Micro Irrigation 109
516 Employment Opportunities 110
5161 On Farm Employment Generation 111
5162 Off-Farm Employment Generation 111
517 Impact on Employment 111
6 Conclusions amp Recommendations 113
References 125
Appendices 127
iv
Annexure I Processes of Implementation 127
Annexure II State wise Physical amp Financial Targets amp Achievements 136
Annexure III Questionnaires 140
List of Tables
Table 1 Methodology Adopted for Impact Assessment 6 Table 2Sampling Plan 8 Table 3 State wise List of Sampled Districts Covered in the Study 9 Table 4 State wise Sample Distribution for the Study 10 Table 5 Year wise Area under Different MI Systems of Sampled Beneficiaries 14 Table 6 Comparison of Subsidy between Pre and Post NMMI Scheme 14 Table 7 State wise Cumulative Physical amp Financial Targets and Achievements 16 Table 8 Year wise Cumulative Physical and Financial Targets and Achievements 17 Table 9 Year amp State wise Physical Targets and Achievements (lsquo000rsquo ha) 19 Table 10 Year and State wise Financial Targets and Achievements (Rs Crores) 20 Table 11 Potential and Actual area under Drip amp Sprinkler Irrigation 21 Table 12 State wise Quantum of Subsidy to Different Categories of Farmers 23 Table 13 State wise Quantum of Subsidy and Area Coverage 24 Table 14 State-Implementing Agencies for NMMI 25 Table 15 Performance of the Functioning of SMICs in Sampled States 32 Table 16 Performance of the Functioning of DMICs in Sampled States 34 Table 17 Land Holding Status of Beneficiary and Non Beneficiary Farmers 37 Table 18 Size and Distribution of Operational Holdings 38 Table 19 Category wise Proportion of Beneficiary and Non Beneficiary Farmers 38 Table 20 Gender Status of Beneficiaries and Non Beneficiaries 39 Table 21 Education Status of Beneficiaries and Non-beneficiaries 40 Table 22 Mobile Phone Ownership 41 Table 23 Extent of Soil Salinity (in sampled states) and Beneficiaryrsquos Responses on Soil and Water
Testing 43 Table 24 Extent of Awareness about Important Soil and Water Quality Parameters 44 Table 25 Source of Irrigation Water 45 Table 26 State wise Water Table Depth 45 Table 27 Sources of Awareness Reported by Beneficiaries () 47 Table 28 Source of Awareness of Scheme Reported by Non-beneficiary () 48 Table 29 Reasons for Non-adoption of NMMI Scheme () 49 Table 30 Willingness of Non-beneficiaries to Install MI System 49 Table 31 Year of Installation of MI System () 50 Table 32 Average Cost of Installing MI System (Rsha) 50 Table 33 Reasons for Adoption of Micro Irrigation Systems 51 Table 34 Farmerrsquos Responses for Time Taken to Sanction Subsidy () 52 Table 35 Source of Finance for Meeting Beneficiary Share for Installation of MI System 53 Table 36 Rate of Interest Paid by the Beneficiaries on Borrowed Funds 54 Table 37 Proportion of Farmers having Drip and Sprinkler MI Systems 54 Table 38 Drip amp Sprinkler System wise Area Coverage by Sampled Beneficiaries 55 Table 39 Crop wise Area Coverage under Drip and Sprinkler Systems in AP (Sampled Beneficiaries) 56
v
Table 40 Crop wise Area Coverage under Drip and Sprinkler Systems in Bihar (Sampled Beneficiaries) 56
Table 41 Crop wise Area Coverage under Drip and Sprinkler Systems in Chhattisgarh (Sampled Beneficiaries) 57
Table 42 Crop wise Area Coverage under Drip and Sprinkler Systems in Gujarat (Sampled Beneficiaries) 58
Table 43 Crop wise Area Coverage under Drip and Sprinkler Systems in Haryana (Sampled Beneficiaries) 58
Table 44 Crop wise Area Coverage under Drip and Sprinkler Systems in Karnataka (Sampled Beneficiaries) 59
Table 45 Crop wise Area Coverage under Drip and Sprinkler Systems in Maharashtra (Sampled Beneficiaries) 59
Table 46 Crop wise Area Coverage under Drip and Sprinkler Systems in Odisha (Sampled Beneficiaries) 60
Table 47 Crop wise area Coverage under Drip and Sprinkler Systems in Rajasthan (Sampled Beneficiaries) 61
Table 48 Crop wise Area Coverage under Drip and Sprinkler Systems in Sikkim (Sampled Beneficiaries) 61
Table 49 Crop wise Area Coverage under Drip and Sprinkler Systems in Tamil Nadu (Sampled Beneficiaries) 62
Table 50 Crop wise Area Coverage under Drip and Sprinkler Systems in UP (Sampled Beneficiaries) 63 Table 51 Crop wise Area Coverage under Drip and Sprinkler Systems in Uttarakhand (Sampled
Beneficiaries) 63 Table 52 Exposure of Beneficiary Farmers to MI Demonstrations 64 Table 53 Topic Covered in Training for Beneficiary Farmers 66 Table 54 Institution for Training as Reported by Respondents ( Beneficiaries) 67 Table 55 Availability of Electricity (Beneficiaries and Non Beneficiaries) 68 Table 56 Capacity of Pump Sets Used by Beneficiaries 69 Table 57 Type of Irrigation Filters Used by Farmers 71 Table 58 Type of Emitters Used by Beneficiaries 73 Table 59 Type of Sprinklers Used by Beneficiaries 74 Table 60 Constraints Faced by Beneficiary Farmers () 75 Table 61 Status Reported by Beneficiaries Regarding lsquoAfter Sales Servicesrsquo 76 Table 62 Status of Warranty for MI System () 77 Table 63 Awareness about Promotional Activities 78 Table 64 Observations of Surveyors regarding MI System Status at the Time of Field Visit 79 Table 65 Assessment of the System Design 81 Table 66 State Wise List of Registered MI System Suppliers 83 Table 67 Impact on Crop Diversification and Usage of Marginal and Degraded Land by
Beneficiaryrsquos data 88 Table 68 Increase reported by Beneficiaries in Irrigated Area (ha) after Installation of MI System 90 Table 69 Marginal Degraded Land brought under Cultivation after Installation of MI System by
Beneficiaries 91 Table 70 Spacing followed by Sampled Beneficiaries for Fruit Crops (m) 92 Table 71 Spacing followed by Sampled Beneficiaries for Vegetables Flowers and Other Crops (m) 93 Table 72 Reduction in Cost of Irrigation with MI system 94 Table 73 Reduction in Electricity Consumption 95 Table 74 Reduction in Fertilizer Consumption 96
vi
Table 75 Productivity Enhancement of Fruit Crops (MTha) 97 Table 76 Productivity Enhancement of Vegetable Crops (MTha) 97 Table 77 Crop wise Details of Reduction in Cost - Fruits 98 Table 78 Crop wise Details of Reduction in Cost - Vegetables 99 Table 79 Crop wise Details of Reduction in Cost - Flowers 101 Table 80 Crop wise Details of Reduction in Cost - Non-horticulture Crops 101 Table 81 Crops Adopted after Installation of MI System 102 Table 82 Extent of Adoption of New Crops after Installation of MI System 103 Table 83 Increase in Farmerrsquos Income 104 Table 84 Benefit Cost Ratio of MI System for Important Fruit Crops 106 Table 85 Benefit Cost Ratio of MI System for Important Vegetable Crops 107 Table 86 Benefit Cost Ratio of MI System for Important Floriculture Crops 108 Table 87 Percent Increase in Irrigated Area on Installation of MI System 108 Table 88 District wise Potential for Installation of MI System in Study Area 109 Table 89 Change in Manpower Requirement for Cultivation (per ha per crop cycle) 112 Table 90 State wise Physical and Financial Target amp Achievements during 2005-06 136 Table 91 State wise Physical and Financial Targets amp Achievements during 2006-07 136 Table 92 State wise Physical and Financial Targets amp Achievements during 2007-08 137 Table 93 State wise Physical and Financial Targets amp Achievements during 2008-09 137 Table 94 State wise Physical and Financial Targets amp Achievements during 2009-10 138 Table 95 State wise Physical and Financial Targets amp Achievements during 2010-11 138 Table 96 State wise Physical and Financial Targets amp Achievements during 2011-12 139 Table 97 State wise Physical and Financial Targets amp Achievements during 2012-13 139
List of Figures Figure 1 Percentage Annual Allocation (share in availability) of Water 1 Figure 2 States Covered for Study (Star Marked) 5 Figure 3 Physical and Financial Performance of NMMI Scheme 13 Figure 4 State wise Central Subsidy (Rs Crores) and Area Coverage (lsquo000rsquo ha) under NMMI 15 Figure 5 Year wise Targets and Achievements 17 Figure 6 State wise Cumulative Targets and Achievements (2005-06 to 2012-13) 18 Figure 7 Proportion of Area under Drip and Sprinkler Irrigation 22 Figure 8 Level of Satisfaction regarding lsquoAfter Sale Servicesrsquo 77 Figure 9 Increase in Irrigated Area () among Beneficiaries after Adoption of MI 90 Figure 10 Reduction in Fertilizer Consumption () 96 Figure 11 Extent of Adoption of New Crops by Beneficiaries () 103 Figure 12 Increase in the Income of Beneficiaries () 104 Figure 13 Subsidy Process under GGRC 130 Figure 14 Subsidy Process under APMIP 131
vii
Abbreviations Acronyms
AampC Agriculture amp Cooperation AP Andhra Pradesh APMIP Andhra Pradesh Micro Irrigation Project BIS Bureau of Indian Standards CHRBKB Chhattisgarh Rajya Beej and Krishi Vikas Ltd CIPET Central Institute of Plastic Engineering and Technology CSS Centrally Sponsored Scheme CWC Central Water Commission DMIC District Micro Irrigation Committee DoA Directorate of Agriculture DoH Directorate of Horticulture DRDA District Rural Development Agency EC Electrical Conductivity FGD Focused Group Discussion GAPL Global AgriSystem Pvt Ltd GGRC Gujarat Green Revolution Company GoI Government of India HDC Horticulture Development Society HDPE High Density Polyethylene HP Horse Power IA Implementing Agency ICT Information amp Communication Technology IEC Information Education amp Communication KGK Krishi Gyan Kendra KVK Krishi Vigyan Kendra MI Micro Irrigation MI System Micro Irrigation System Mha Million hectare Mhm Million hectare metre MIDH MoA Mission for Integrated Development Ministry of Agriculture MoWR Ministry of Water Resources NCPAH National Committee on Plasticulture Applications in Horticulture NHM National Horticulture Mission NMMI National Mission on Micro Irrigation PFDC Precision Farming Development Centre RKVY Rashtriya Krishi Vikas Yojana SAU State Agricultural University SC Scheduled Cast SMIC State Micro Irrigation Committee SPV Special Purpose Vehicle ST Scheduled Tribes ToR Terms of Reference UP Uttar Pradesh
Impact Evaluation Study of ldquoNational Mission on Micro Irrigation (NMMI)rdquo
I
Executive Summary Micro irrigation technologies (MI) are being promoted in India by the central and state governments by providing different kinds of financial institutional and technical support These technologies are promoted primarily as (1) a means to save water in irrigated agriculture (2) as a strategy to increase income and reduce poverty and (3) to enhance the food and nutritional security of rural households Despite the reported significant economic advantages and the concerted support of the government and NGOs the current area under micro irrigation in India remains an insignificant proportion of its potential Rising demand for irrigation water in the face of its inefficient use and concerns of growing water scarcity which has brought into renewed focus for conserving water and combating water scarcity including efforts in improving water use efficiency with the available water resources The real thrust on promoting MI adoption largely started with the recommendations of the Report of the Task Force on Micro Irrigation in 2004 The report sought to increase the emphasis on MI technology and recommended the Centrally Sponsored Scheme (CSS) in 2005-06 The Scheme was further upscaled into Mission Mode in 2010 to accelerate the rate of adoption of micro irrigation technologies under central sector programs
Government of India Ministry of Agriculture Department of Agriculture and Cooperation assigned the study on ldquoImpact Evaluation of National Mission on Micro Irrigation (NMMI)rdquo to access the performance of the programme implementation and access the impact of this Scheme on increase in farmersrsquo income through adoption of the MI system
The study was conducted in 13 states comprising of 64 districts in the sampled states namely Andhra Pradesh (AP) Bihar Chhattisgarh Gujarat Haryana Karnataka Maharashtra Odisha Rajasthan Tamil Nadu Sikkim Uttar Pradesh (UP) and Uttarakhand The field survey to get first-hand information was conducted for a total sample of 7400 comprising beneficiary and non-beneficiary farmers in these selected states by adopting stratifiedndashpurposive-sampling design Apart from this information was also collected from MI system suppliers and government officials under State Horticulture Mission and related departments Owing to promotional schemes introduced by the state and central governments the area under micro irrigation has increased from 11817 ha in 2005-06 to over 361
Impact Evaluation Study of ldquoNational Mission on Micro Irrigation (NMMI)rdquo
II
million ha in 2012-131 under NMMI in the country Despite having many advantages over conventional method of irrigation the area under micro-irrigation presently occupies only about 571 percent of the total potential area As per the available data only 285 percent of total irrigated area is under drip irrigation and 286 percent is under sprinkler irrigation Findings of the Study
A Current Status
i The Scheme since its inception in 2005-06 has made rapid stride across the country It has succeeded in bringing about 356 million ha area under micro irrigation in the sampled 13 states2 The physical targets for the period 2005-06 to 2012-13 were fixed to the extent of 383 million ha out of which 356 million ha has been brought under MI The Targets and achievements for financial outlay were Rs50128 and Rs50065 crores respectively The overall physical and financial achievements thus come out to be 9299 amp 9987 percent The extent of achievements however varied among different states States like Bihar Karnataka Odisha Rajasthan and Sikkim achieved more than 90 percent of the set physical and financial targets Uttarakhand could achieve only 21 percent of physical and 31 percent of the financial targets Other States such as AP Chhattisgarh Gujarat Haryana Maharashtra and Tamil Nadu succeeded to achieve more than 70 of their physical targets
ii AP Gujarat amp Maharashtra are leading states in the every aspect of performance the different activities involved in the process streamlined in the guideline of NMMI While Bihar UP Sikkim amp Uttarakhand states are lacking in terms of the functions mentioned in the guidelines
B Pattern of Assistance (subsidy)
i Most of the states are giving subsidy of more than 70 percent for installation of MI system However comparison of various states and analysis clearly demonstrates that increased subsidy had no significant impact on the increase of area coverage under MI system Farmers in
1 NCPAH 2 Ministry of Agriculture
Impact Evaluation Study of ldquoNational Mission on Micro Irrigation (NMMI)rdquo
III
Maharashtra Gujarat and Haryana were 223 140 and 100 percent respectively in case of sampled beneficiaries while pertinent subsidy component in these states was 60 50 and 90 percent respectively Similarly area coverage in Rajasthan Tamil Nadu and Bihar was noted to be 73 45 and 31 percent respectively and the corresponding figures for subsidy were 90 75 and 90 percent The aforesaid observation clearly suggests that increase in subsidy component beyond a limit has little or no impact on area coverage under MI system The relationship between area expansion under MI and quantum of subsidy has been computed considering beneficiariesrsquo data on area expansion in different states before and after adoption of MI system Hence the relationship of subsidies with area expansion as such does not refer to any specific year
ii The efficiency of scheme implementing agency is very high as most of the farmers have reported that their applications are processed and sanctioned in less than 40 days as against 60 days specified in the guidelines Similarly in most of the sample states beneficiaries are reported to be satisfied with respect to the procedure for filing the application till disbursement of the subsidy amount
iii Presently subsidy is limited to maximum area of 5 hectare per beneficiary which is an impediment to the growth of area under micro-irrigation The data on size and distribution of operational land holdings in the country also suggest that medium and large farmers accounted about 15 percent of total land holdings but occupying more than 5542 percent of the total area Therefore increase in the limit of maximum area per beneficiary would lead to combat water scarcity as well as the sustainable agriculture
iv All the states have reported convergence of Mission interventions with different schemes of the Government of India and State level programmes Most of the districts have converged NFSM and other programmes such as RKVY ICDP Farm Mechanization NHM etc
C Sources of Awareness and Reasons of Non-adoption
i The major sources of awareness about the NMMI scheme were MI system suppliers followed by fellow farmers and extension workers
Impact Evaluation Study of ldquoNational Mission on Micro Irrigation (NMMI)rdquo
IV
ii The non-beneficiaries farmers had mix responses for not adopting the scheme because of lack of awareness regarding subsidies lack of technical knowledge high capital cost and system being not economic for their crops and therefore not required
iii As per primary survey of the sampled beneficiaries about 59 percent of the respondents were small amp marginal farmers and 13 percent were women farmers who have taken the advantage of the Scheme
D System Cost and Sources of Fund
i On an average the cost of system per hectare incurred by the beneficiaries ranged between Rs 5445736 to Rs 7208631 in drip system and Rs 20481 to Rs 28171 in sprinkler irrigation system depending on the cropping pattern crop spacing etc
ii Almost in all states farmer beneficiaries use their own funds for contributing margin money (9866) Other sources albeit a small proportion constitutes banking KCC amp money lenders
iii Most of the farmers borrowed money at less than 10 percent of rate of interest from banks and KCCs
E Technical Observations about MI System
i It was observed that about 64 percent of the beneficiaries installed drip system 34 percent sprinkler system and 2 percent have installed both the systems in their fields The highest proportion of drip was observed in Karnataka because of higher proportion of area under horticulture crops whereas adoption of sprinkler was higher in Bihar because of higher proportion of area under field crops
ii The majority of the beneficiaries (about 6887) farmers of all the 13 states have got their soil and water tested In Gujarat UP Maharashtra amp Rajasthan soil testing adopted by 6927 5275 7337 and 7913 of respondents respectively
iii More than 70 percent of the respondent farmers of AP Gujarat Sikkim and Odisha were using in-line drip irrigation system whereas more than 45
Impact Evaluation Study of ldquoNational Mission on Micro Irrigation (NMMI)rdquo
V
percent beneficiaries of Haryana and Uttarakhand reported to practice on-line drip irrigation system
iv The farmers were using screen filters centrifugal separators hydro-cyclone filter disc filter sand media filters depending on the need The data reveals that screen filters are being commonly used by the beneficiaries in most of the sampled states except Haryana where more than 65 percent beneficiaries are using hydrocyclone and screen filters in combination due to the water quality as they are using canal water Moreover additional subsidy is being provided on hydrocyclone type of filters to ensure the complete removal of organic and inorganic contaminants
v The farmers in almost all the states reported that components of MI System met the BIS norms The average figure for all the sampled states where system components were as per the BIS norms came out to be around 98 percent
vi It was informed that the systems were well designed except in case of Sikkim and Odisha where the systems were functional but not able to meet the farmers expectation in totality
F After Sales Services
i On an average 91 of the beneficiaries across the sampled states reported that after sales services are being provided to them amp also they receive the services at the required time Most of the sampled beneficiaries revealed that they are getting warranty of the MI system
ii In almost all the states the sampled beneficiaries revealed that no technical support guidance on agronomic practices are extended to the users as they generally tell to take the help of extension agencies
G Impact Analysis
i The irrigated area has increased in all the surveyed states after the introduction of NMMI Scheme The Irrigated area within the 5892 sampled beneficiaries of the 13 states before adoption of MI system was found to be 1332086 ha which became 1444147 ha after adoption of MI system It is therefore concluded that total percentage increase in irrigated area with
Impact Evaluation Study of ldquoNational Mission on Micro Irrigation (NMMI)rdquo
VI
the sampled beneficiaries in 13 states after adoption of MI system was noted to be 841 from same source of water Maharashtra has topped the list with 2228 growth in irrigated area followed by Chhattisgarh
ii Farmers of all the states have shown an increase in area under horticulture crops after the adoption of the MI system The cropped area after implementation of CSS for promotion of MI during 2005-06 and subsequently NMMI has shown an increase which may be due to utilization of degraded marginal land into cultivable land amp increase in cropping intensity
iii Scheme has performed well in terms of reduction in input cost and significant cost saving has been observed for irrigation in all the surveyed states Irrigation cost is reduced by 20-50 with average of 323 Reduction in electricity consumption after installation of MI system Average electricity consumption has been reduced by about 31 after using the micro irrigation system Saving of fertilizers with averages reduction of about 28 in total fertilizer consumption in the surveyed states Fertilizer saving vary from 7- 42
iv Micro irrigation has generated benefits to the farmers in terms of enhancement of the productivity The average productivity of fruits and vegetables has increased about 423 and 528 respectively mainly because of crop spacing judicious use of water and other inputs etc
v The overall benefits accrued from the micro irrigation system are reflected in the income enhancement of the farmers All the surveyed states reported increase in farmerrsquos income in the range of 20 to 68 with an average increase of 485
vi Benefit Cost (BC) ratio of installing micro irrigation system is greater than ldquo1rdquo across the states and across the crops which signifies the importance of MI system in net income enhancement of the farmers The BC ratio was observed to be highest in Odisha among fruits amp vegetables whereas in flowers Rajasthan amp Haryana beneficiary farmers achieved higher BC ratio
vii The positive outcomes have made the food security effective due to the increase in the production and productivity of different crops and increased area under irrigation from same source of water Area under horticulture crops as well as nutritional security has also enhanced
Impact Evaluation Study of ldquoNational Mission on Micro Irrigation (NMMI)rdquo
VII
H Employment Generation
i Beneficiaries of all the states under study have shown decrease in utilization of the labor in pre-harvest practices that is labor saving on irrigation weeding fertilization and other operations It shows that the use of human labor after the use of micro irrigation has decreased significantly and ranges between 741 to 1875 percent But in post-harvest operations right from harvesting to handling and disposal of the produce there is an increase in labor utilization and it ranges between 2119 to 5023 percent due to the increase in the production which requires more of the labor for harvesting assembling and grading handling transportation and disposal of the produce
I Training and Capacity Building
i Among the surveyed states more than 90 percent of the sampled beneficiary farmers in the state of Haryana Karnataka Sikkim amp Tamil Nadu had training on different aspects of MI System whereas farmers of Bihar amp Odisha only 20 amp 52 percent of the beneficiaries have received the training
ii Results of survey revealed that the system suppliers manufacturers are the major sources for imparting training as more than 90 percent of the farmers received training from them Very less proportion of the respondents reported to have training from other sources such as SAUs KVKs etc The participant beneficiaries revealed that the duration of training period generally was of 1-2 days Almost all the respondents of Tamil Nadu UP Chhattisgarh Haryana were given training materials during the training while few beneficiaries of the Bihar and Uttarakhand Karnataka were provided such training materials
iii Key areas for training were operation and maintenance of the system adoption of package practices under MI and opportunities for introducing new crops Demonstration was other means of motivation and capacity building It was also found to be a good means of promotion
J Promotional Activities
i The farmers of the majority of the states acknowledged that the implementing agencies are promoting NMMI schemes in local language
Impact Evaluation Study of ldquoNational Mission on Micro Irrigation (NMMI)rdquo
VIII
however were not aware of the dedicated website for MI scheme in their state It is due to the fact that most farmers do not have access or willingness to use internet for information gathering
ii It was noted that maximum beneficiaries of Haryana (98) followed by Sikkim (80) Rajasthan (64) and Uttarakhand (63) have visited the demonstration trials laid out in the nearby areas
Thus it may be concluded that positive outcomes in terms of crop productivity enhancement due to implementation of MI Scheme have contributed significantly to food and nutritional security requirements The NMMI has helped to widen the food basket of the country with significant contributions coming from the bringing more area under irrigation and with judicious use of water New farm practices and innovations with support of government have encouraged the farmers to shift toward new crops giving higher income
It is noteworthy that the incremental net returns were observed to be generally higher for cash crops such as fruits vegetables groundnut cotton etc than for food crops viz bajra and wheat
Recommendations and Policy Implications
Given the vast potential benefits of micro-irrigation and fast decline of availability of water for irrigation in the country a number of technical and policy interventions are required to be introduced so as to increase the adoption of micro-irrigation in India The needed recommendations and interventions are presented below
A Scheme Related
1) The rate of subsidy provided under NMMI through central government is fixed uniformly for different categories of farmer with a limit of 5 hectare This needs to be restructured as about 15 of the large and medium farmersrsquo accounts for more than 5542 of the land in India Therefore this limit of five hectares needs to be enhanced for extending the subsidy
2) States often compete with each other to increase the subsidy component However it has been noted that higher subsidy does not necessarily lead to more area coverage under MI system as the highest increase in area under MI has been achieved by states which offer subsidy in the range of 50-75 percent eg Maharashtra Chhattisgarh Gujarat and Odisha In case of AP which increased subsidy from 70 to 90 percent in 2011-12 the additional area to come under MI in
Impact Evaluation Study of ldquoNational Mission on Micro Irrigation (NMMI)rdquo
IX
fact decreased as compared to the previous years It is therefore recommended that the states should be advised to seriously consider that the quantum of subsidy should preferably be not more than 50-70 percent including state and central share
3) No uniform pattern is being followed by states for implementation of this scheme It has been observed that in some states more than one department are involved in parallel eg Karnataka where it is being implemented by both agriculture and horticulture departments In such cases there is often lack of coordination which adversely affects the outcome of the scheme It has also been observed that where a single department is designated as the implementing agency (eg horticulture or agriculture) it does not pay adequate attention to the crops coming under the purview of other departments Perhaps one of the best implementation strategies is to designate an independent Special Purpose Vehicle (SPV) on the pattern of Gujarat (GGRC) and AP (APMIP) States may be encouraged to replicate such a strategy
4) The penetration of MI is only 5 of the irrigated area even in the states under study where there is a lot of emphasis on NMMI penetration is only 1118 percent of the potential (identified by various studies ref India Stat) It is proposed that NMMI may fix a target of achieving 25 of the potential during XII plan by addressing various constraints such as
a One of the major reasons for the slow growth of micro-irrigation in India is the high initial investment In spite of availability of subsidy from state agencies majority of the farmers are reluctant to invest in micro-irrigation system even in horticulture crops which is highly suitable for drip irrigation Therefore micro-irrigation system should be planned and designed based firmly on location specific parameters to reduce the cost of installation as well as promoting low cost technology so that poor farmers can also participate
b Capacity building activities for operation and maintenance of system crop diversification using most economical and appropriate Package of Practices etc need to be made an integral part of the programme and be made mandatory for each and every beneficiary The tool to deliver could be MI system supplier in co-ordination with SAU and extension department of the state
Impact Evaluation Study of ldquoNational Mission on Micro Irrigation (NMMI)rdquo
X
5) Micro irrigation System is mostly promoted through subsidy schemes and not as an on-farm water and land management strategy In certain states under subsidy scheme the requisite consideration have not been given in respect of field size shape topography type and location of water source seasonal fluctuations type of soil and crop to be grown As a result in certain cases the subsidy may not match the specific situation of an individual farmer consequently the system may not match the site specific situations of an individual farmers consequently the system may not operate to the complete satisfaction of the farmer
B Technology Related
1) There is a need to establish a Central Testing Facility (CTF) to deal comprehensively with the design development and testing of all equipments devices machines used in micro irrigation systems using state-of art technology It is suggested that the Government may consider contacting regular and random technical audit of the system to cover about 2-3 percent beneficiaries within first and second year of the installation This will keep check on to quality and suppliers will be more vigilant to supply good quality of system
2) It is suggested that the implementing agencies should be more vigilant regarding warranty and after sales service of the system provided by the suppliers It is proposed that 10 percent of the subsidy may be released after one year subject to satisfactory performance of the system as certified by the beneficiary Maintenance manual in vernacular language should be made available to the beneficiaries at the time of installation of the system
3) It is observed that the cost of micro-irrigation accessories such as emitters filters laterals etc vary between shops and places Sometimes farmers do face problem in getting spare parts in time It is necessary to provide quality materials in time for farmers for the speedy adoption of micro-irrigation
4) Inadequate information about the operation maintenance as well as the usefulness of micro irrigation is one of the main reasons for its uneven spread across regions in India Farmers still do not have full knowledge regarding the usefulness of the micro irrigation Even the adopters do not know fully how much of subsidy is available per hectare for different crops
5) Clogging of drippers mainly due to poor quality of water helps in bacterial growth which can be controlled by using chlorination which acts as a powerful oxidizing agent and vigorously attack micro-organisms such as algae fungi and bacteria
Impact Evaluation Study of ldquoNational Mission on Micro Irrigation (NMMI)rdquo
XI
Also acid is injected into drip irrigation system to lower the pH of the irrigation water and this helps in preventing the precipitation of salts such as calcium carbonate magnesium carbonate or ferric oxide It has been observed during the course of survey that the availability of sulphuric acid in the nearby towns is a major constraint and farmers are forced to purchase new spares by discarding clogged drippers It is therefore recommended that system suppliers should make acid available to the growers as part of their after sales service obligation Therefore studies need to be carried out to device efficient eco friendly de-clogging measures so that farmers do not suffer from such problems
C Awareness and Capacity Building
1) The extension network currently operated mainly by government agencies does not seem to be making significant impact on the adoption of this technology Therefore there is a need to revamp the entire extension network by involving the MI system manufactures in order to increase amp improvise the existing quality of extension services
2) MI system manufacturers should be involved intensively in promoting micro-irrigation by introducing frequent demonstration at farmersrsquo field and strategic locations in the district state The MI system manufacturers should be involved in providing advice on agronomic packages to the farmers so as to encourage the adoption of micro irrigation at a large scale
3) Since MI system suppliers are one of the major sources of creating awareness among potential beneficiaries their involvement in laying down demonstration may be increased Similarly imparting training on technical and operational aspects of the system be included as mandatory part of the training of the farmers by the system suppliers The training may also include aspects of package of practices which may be standardized by the SAUs amp other related organization and supplied to system suppliers for further dissemination to the farmers
4) Awareness on MI system is low in states like Bihar UP and Odisha Special drive is needed for exposure visits trainings to make them aware about the benefits and operation of the system The number of demonstration farms should also be increased
5) It is understood from the field study that the officials who are involved in promoting micro-irrigation technology under the GoI Scheme have inadequate knowledge about the technical and other details of MI Therefore the state
Impact Evaluation Study of ldquoNational Mission on Micro Irrigation (NMMI)rdquo
XII
government extension staffs need to undergo lsquoRefresher Courses and exposure visitsrsquo to have basics of micro-irrigation thereby enabling their role in the implementation of the scheme
D Follow up Actions
1) Though micro-irrigation has been in use in different States since mid-eighties State-wise potential area is not estimated as of today Therefore it is essential to prepare State-wise and crop-wise potential area for MI A detailed estimate on State-wise potential would be useful to fix the target to be achieved and further to develop the road map for MI adoption in the country
2) It is evident from field study that capital cost required to install micro irrigation system is relatively high Because of this reason considerable percentage of farmers have expressed that they are unable to adopt this technology for low value crops There has been a significant development in the MI technology and efforts should be on developing and popularizing low cost technologies This would help reducing the cost of the system and increasing the adoption of micro-irrigation at a large scale
3) At least one percent of the outlay on micro-irrigation needs to be earmarked for research on micro-irrigation technology and development of package of practices as well as crop diversification potential
4) The information regarding all the activities under NMMI scheme at national and state level should be under public domain Although presently very few farmers are using internet based information yet this is becoming popular and it is expected that in next few years websites and internet will become a major source of information particularly among younger population Therefore the website of NCPAH be made more popular and content may also be increased to include PoP and crop diversification
Impact Evaluation Study of ldquoNational Mission on Micro Irrigation (NMMI)rdquo
1
1 Introduction 11 Project Background Water is one of the most critical inputs for agriculture however the share of water availability to the agriculture sector is declining at an alarming rate due to its ever increasing demand for the energy industry and domestic purposes Much of the available irrigation water in India is applied through the conventional surface irrigation methods which involve huge conveyance and distribution losses resulting in low overall irrigation efficiencies (35-40) The poor irrigation efficiency of these systems not only reduce the anticipated outcomes from investments in the water resources but also create environmental problems like lowering of water table due to over-exploitation of sub-surface water resources water-logging and soil salinity thereby adversely affecting the crop yields
Figure 1 Percentage Annual Allocation (share in availability) of Water
Source Central Water Commission MoWR GoI
On the other hand the situation of cropping under irrigated and rain fed conditions is quite decimal There is a decimal chance of further enhancement to the area under irrigation which calls for improving the water use efficiency of the available water resources which can be accomplished through the proven water saving technologies such as micro irrigation systems The term micro irrigation describes irrigation systems that deliver water through small devices directly in the plant root zone at prescribed rate at regular interval of time
Impact Evaluation Study of ldquoNational Mission on Micro Irrigation (NMMI)rdquo
2
In countries like Israel the water-use efficiency in agriculture sector has been improved in physical (technical) terms of water use per tonne of output (or hectare irrigated) due to improvements in agricultural water use efficiency As a consequence the share of agriculture in total water use fell from over 70 percent in 1980 to 57 percent by 2005 and further it is projected to decline to 52 percent by 20253 Even in Indian scenario Micro-irrigation (MI) methods have been found to have significant water saving and crop productivity benefits Studies have claimed water saving of 40 ndash 80 percent and productivity gains up to 100 percent (Raina et al 1999 2013 Sivanappan 1994 Palanisami et al 2011) Keeping these advantages in view the Government of India (GoI) constituted a Task Force in 2004 to assess the potential of MI technologies in the country The Report of the Task Force sought to increase the emphasis on MI technology and recommended a broader framework viewing adoption of MI technologies as a part of the overall water management strategy It also recommended allocation of more financial resources of subsidies for MI adoption with state governments contributing 10 percent of the cost while the central funds would account for 40 percent and advised greater flexibility for states to determine their appropriate implementation structure and institutional mechanisms for subsidy disbursement The main objectives of the National Mission on Micro Irrigation are as follows
To increase the area under micro irrigation through improved technologies To enhance the water use efficiency in the country To increase the productivity of crops and farmersrsquo income To establish convergence amp synergy among on-going Government
programmes To promote develop and disseminate micro irrigation technology for
agriculture horticulture development with modern scientific knowledge To create employment opportunities for skilled and unskilled person especially
unemployed youth
12 Salient Features of the Scheme NMMI is a Centrally Sponsored Scheme in which 40 of the cost of the MI system is borne by the Central Government 10 by the State Government and the remaining amount is borne by the beneficiary either through his her own resources or loan
3 OEDC-FAO Agricultural Outlook 2012-2021
Impact Evaluation Study of ldquoNational Mission on Micro Irrigation (NMMI)rdquo
3
from financial institutions In respect of small and marginal farmers the share of Central Government increases by 10 to make 50 of the cost of the system The main features of the scheme are
All categories of farmers are eligible to avail assistance under this scheme Assistance to farmers is limited to a maximum area of five (5) ha per
beneficiary Assistance for laying down demonstration on farmers field are given 75
subsidy for a maximum area of 05 ha per demonstrate and is met entirely by the Central Government
Assistance is available for both drip and sprinkler irrigation for wide spaced as well as close spaced crops However assistance for sprinkler irrigation system is available only for those crops where drip irrigation is uneconomical
Assistance is available for irrigation systems for protected cultivation including greenhouses polyhouses and shade net houses
The subsidy amount is calculated taking into consideration cost of fertigation with fertilizer tank venturi systems sand filters media filters hydro-cyclone filters sand separators and other different type of filters and valves required for MI system
Panchayati Raj Institutions (PRIs) are involved in promoting the scheme identification of priority areas identification of beneficiaries and organizing interactive meetings with the representatives of micro irrigation industry
At the National Level the Executive Committee of NMMI reviews the progress of NMMI and approve the Annual Action Plans of States At the State level the State Micro Irrigation Committee (SMIC) oversees the implementation of the Mission programme in districts The District Micro Irrigation Committee (DMIC) coordinates the implementation of NMMI programme at the District level NCPAH coordinate and monitor the programme of NMMI in different States
The scheme is implemented by an implementing Agency (IA) at the State level duly appointed by the State Government Funds are released directly to the IA on the basis of approved plans for each year
The IA prepares the Annual Action Plan for the State on the basis of the district plans and get it forwarded by SMIC for approval of the Executive Committee (EC) of NMMI
The State Level Micro Irrigation Committee (SMIC) undertakes registration of System Manufacturers who are authorized to supply systems to the farmers under the NMMI subsidy scheme One of the important criteria for registration is that these manufacturers should be able to supply the systems as Bureau of
Impact Evaluation Study of ldquoNational Mission on Micro Irrigation (NMMI)rdquo
4
Indian Standards (BIS) marking and provide proper after sales service to the satisfaction of the farmers
13 The Assignment NMMI has now been in operation effectively for more than six years and the government feels that this is the right time to asses and quantify the impact of Scheme The Govt of India Ministry of Agriculture Department of Agriculture and Cooperation Krishi Bhawan New Delhi has engaged Global AgriSystem through open bid to carry out an Impact Evaluation Study of National Mission on Micro Irrigation (NMMI) Scheme 14 Objectives of the Study The ldquoNational Mission on Micro Irrigation (NMMI)rdquo was to be evaluated in terms of water saving increase in area production and productivity of major crops so as to serve various objectives of National Food Security crop diversification with the changing food consumption habits saving of various inputs such as fertilizer power etc that are of paramount importance to the country The prime purpose objectives of the study are as follows
i Transparency in identification of beneficiaries prioritizing for release of funds in order of the application approval of system suppliers timely release of financial assistance dovetailing of various MI schemes effectiveness of various MI technologies methodology adopted for record keeping auditing and effectiveness of the state implementing agencies
ii Overall performance of the programme implementation and whether the programme is being implemented as the operational guidelines of NMMI in various states
iii Employment generated due to the implementation of NMMI and efforts laid for the development of human resources wrt Micro Irrigation between FY 2005-06 to 2011-12
Impact Evaluation Study of ldquoNational Mission on Micro Irrigation (NMMI)rdquo
5
2 Approach and Methodology The evaluation study of the ldquoNational Mission on Micro Irrigationrdquo (NMMI) scheme requires a wholesome approach to find out proper impact of the scheme at the ground level Keeping in view the scope of work given ToRrsquos and with the understanding of the objectives the approach and methodologies adopted by the Consultants are summarized in the following paragraphs 21 Approach The approach adopted for the present impact evaluation study is based on use of both the secondary as well as primary data collected from 13 states conducting interviews of various stakeholders (Figure 2)
Figure 2 States Covered for Study (Star Marked)
Impact Evaluation Study of ldquoNational Mission on Micro Irrigation (NMMI)rdquo
6
The study comprised primarily adopting the following steps
Beneficiaries who availed the assistance to install MI system and non-beneficiaries from the same area village who did not install MI
Mobilisation of the study team Continuous contact and consultations with the various concern agencies and
the Client Sharing of information throughout the study period with the Client and flexibility to respond to desired changes and directions
Collection and review of reports documents government policies plans and programs
Development of questionnaires and checklists for primary data collection Interaction and interview with policy makers planners bureaucrats
development workers traders and etc Field survey in the selected areas Analysis of secondary and primary data using appropriate tools Survey of beneficiaries amp non-beneficiaries to arrive at a comparative analysis
of the advantages derived by the adopters
22 Methodology Based on above approach following methodology is adopted to carry out the evaluation study
Table 1 Methodology Adopted for Impact Assessment
Sl No Description of the Method Description of the Units Covered
1 Survey Method a Sample
Survey Selected beneficiary and non-beneficiary households
2
Rapid Appraisal Method a Focus group
discussions Beneficiary and non-beneficiary households
b Semi Structured interviews with key informants
Various implementing agencies at district and block levels Manufacturers service providers Non-Governmental Organizations(NGOs) Financial Institutions Village elders community leaders and Knowledgeable persons
Source GAPL
Impact Evaluation Study of ldquoNational Mission on Micro Irrigation (NMMI)rdquo
7
221 Sources of Data Collection
The primary data has been collected through participatory discussions and structural interviews semi- structured questionnaires for covering various evaluation parameters from various stakeholders
Farmers Officials of horticultureagriculture departments Officials of Irrigation department Scientists from Krishi Vigyan Kendras and agricultural universities Banks amp other financial institutions Social mobilizers Pradhan Opinion leadersprogressive farmers Industry
Secondary data regarding physical and financial targets amp achievements was obtained from Ministry of Agriculture amp NCPAH Other sources of published data such as NHB statistics Published research in the reputed journals GoI publications as well as Statistics from State and District level have been utilized for secondary data
Task 1 Review of Secondary Information
A desk review of secondary data regarding overall area under irrigation research work on potential of MI cropping pattern and land use progress position regarding distribution Similarly physical and financial performance relating to various components of the Scheme has been collected from MoA NCPAH and State Government agencies The information collected has thereafter been analyzed for reaching to conclusions
Task 2 Field Research and Primary Data
In depth field study has been carried out to find out stakeholdersrsquo perception and impact assessment of the scheme Field study included three segments
i A detailed survey of farmers( both beneficiaries and non-beneficiaries) through a structured questionnaire and PRA techniques
ii Implementing agencies and officials to assess the efficiency and efficacy of implementation of the scheme
iii Institutions ndash an interaction with officials of the agriculture universities to understand current technologies in micro-irrigation their adaptability to India agriculture and sustainability in the long rum
Impact Evaluation Study of ldquoNational Mission on Micro Irrigation (NMMI)rdquo
8
Task 3 Developing the Sampling Plan for primary survey and the Associated Fieldwork Schedules 222 Sampling The evaluation study was conducted in the given 13 states The detailed sampling plan followed for the evaluation study was as under
Table 2Sampling Plan
Sl No
Stage of Sampling
Sampling Unit
Criteria for Selection of
Sample Units
Sample Method Adopted
Description of the Sample Units
Number of Sample Units
1 I Stage Agro climatic regions
As per state classification Micro units Best and average
performing See Table 4
2 II Stage District
Level of Micro Irrigation coverage as proxy for development
Stratified Purposive Sampling
Additional area brought under irrigation
Best and average performing districts in ratio of 7525
4-6 districts in plain areas and 2-3 in hilly states In all 64 districts have been selected
2 III Stage Blocks Level of Development
Stratified Purposive Sampling
Additional area brought under irrigation in the block
Best and average performing blocks in ratio of 7525
5-8 blocks in plains and 5-7 in hilly states covering from each sample district A total of 398 blocks were finally selected
3 IV Stage Villages Coverage of Programmes
Stratified Purposive cum cluster Sampling
Best and average geographical connectivity
4 V Stage Households
Beneficiaries on random basis amp non beneficiaries from similar conditions
Stratified Purposive Random Sampling
Proportionate sample according to size of holding and area under micro irrigation
7400 farmers including 5892 beneficiary household from 13 states
Source GAPL
223 The Sample Design Multi-stage - stratified - purposive ndashrandom sampling design has been adopted in the study The samples have been collected from all the identified states The consultant has applied Stratified Random Sampling Method The sample is representative and has been covering all categories of farmers The sampling has been taken into account the extent of implementation of NMMI Scheme in the State
Impact Evaluation Study of ldquoNational Mission on Micro Irrigation (NMMI)rdquo
9
Selection of districts and blocks Selection has been done in a manner so as a representative data emerged from that particular sampled state The sample has covered selected districts in 13 states as per the ToR The details of sample size both of beneficiaries and a non-beneficiary across the states has been summarized in Table 4
Districts have been selected from each selected region of the state Four to seven districts (two to four from hilly states) from each state have been selected The selected districts were ranked as per their performances where one district each from the high good average amp poor performance were included for drawing samples as summarized in the following table
Table 3 State wise List of Sampled Districts Covered in the Study
S No
States Districts
1st 2nd 3rd 4th 5th 6th 7th 1 AP Anantpur Medak Nalgonda Adilabad Nellore Krishna Vishakhapatnam 2 Bihar WestChamparan Rohtas Gaya Madhepura 3 Chhattisgarh Durg Sarguja Kanker Jashpur 4 Gujarat Banaskantha Bhavnagar Jamnagar Bharuch Mehsana Anand 5 Haryana Bhiwani Sirsa Fatehabad Karnal 6 Karnataka Belgaum Hasan Bidar Chitradurga Mysore Bellary 7 Maharashtra Jalgaon Ahmednagar Jalna Kolhapur Wardha Ratnagiri 8 Odisha Ganjam Mayurbhanj Boundh Nayagarh Bhadrak 9 Rajasthan Jalore S Madhopur Jodhpur Jhalawar Hanumangarh Udaipur 10 Tamil Nadu Erode Tirunelveli The Nilgiris Thiruvarur Villupuram
11 UP Jhansi Balia Saharanpur Siddharth Nagar Kannauj Aligarh
12 Sikkim Gangtok Mangan 13 Uttarakhand U S Nagar Haridwar Nainital
Source GAPL
Further blocks were selected on the basis of coverage in area under irrigation which is taken as a proxy of development of micro irrigation infrastructure From each sample district 5-8 blocks - best and average performed blocks (7525 ratio) were selected randomly among those where MI systems have been installed 224 Selection of Beneficiaries and Non-beneficiaries Villages have been purposively selected on the basis of coverage of the programme The selection of the sampled beneficiary farmerhouseholds has been made randomly for each selected village A complete list of beneficiaries are drawn and divided into various size classes In the each selected village the households were finalized on the
Impact Evaluation Study of ldquoNational Mission on Micro Irrigation (NMMI)rdquo
10
basis of their farm holding socio-economic status and coverage of programmes Besides this non-beneficiaries were also selected to identify reasons for their non-participation in the programmes and also to compare the benefits drawn by beneficiaries compared to this category This in fact facilitated the impact evaluation study based on lsquowith and withoutrsquo approach The farmers selected for the primary survey include various categories of farmers Besides it also includes PRIs and district amp state level concerned functionaries It is pertinent to mention here that the sampling design has taken care that the beneficiaries selected are representative of overall population of the beneficiaries at State and District levels The total sample comprises of beneficiaries and non-beneficiaries in the ratio of 8020
Table 4 State wise Sample Distribution for the Study
Sl No
Name of State UT
Sample Districts
Sample Blocks district
Farmers per
block
Total respondents
Beneficiaries Non
beneficiaries
1 AP 7 6 20 840 672 168 2 Bihar 4 8 20 644 516 128 3 Chhattisgarh 4 6 20 480 384 96 4 Gujarat 6 6 20 720 576 144 5 Haryana 4 5 20 401 320 81 6 Karnataka 6 6 20 720 576 144 7 Maharashtra 6 7 20 881 672 169 8 Odisha 5 6 20 600 480 120 9 Rajasthan 6 6 20 712 574 138
10 Tamil Nadu 5 6 20 575 455 120 11 UP 6 7 20 695 527 168 12 Sikkim 2 5 6 60 50 10 13 Uttarakhand 3 6 6 112 90 22
Total 64 7400 5892 1508
Task 4 Validation of Sampling Plan and Questionnaires
Field research has been carried out on the predefined and approved questionnaires in active consultations with DAC The final sampling plan and questionnaires and field survey plans have been validated by DAC
Task 5 Pilot Testing amp Survey Preparation
In order to validate that the questionnaire were able to gather information as per design and to train the supervisors of the survey team a pilot survey was undertaken in Uttarakhand and Maharashtra The main purpose of pilot testing the survey was to check the validity of the questionnaire by finding questions or words that might be misinterpreted misread or misunderstood as well as to check the functionality of the
Impact Evaluation Study of ldquoNational Mission on Micro Irrigation (NMMI)rdquo
11
questionnaire in the field Training of the interviewers and supervisors which is one of the most important stages prior to conduct of field work was done to familiarize the interviewers with the survey instruments Task 6 Constituting Field Work Teams and Briefing Meeting with Field Supervisors and Felid Investigators
On acceptance of the final questionnaires and the sample plan the field teams were gathered in Delhi and a briefing meeting and training session had been held for the field research teams
Task 7 Primary Data Collection Exercise
During the fieldwork face to face interviews were held with various types of respondents including State Agriculture Horticulture departments and other stake holder as mentioned above were interviewed with structured information schedules and information was collected accordingly
Task 8 Stakeholder Discussion
Participatory discussion was arranged with various stakeholders at various levels as follows
I Stage At inception stage to discuss and finalize work plan questionnaire and methodology
II Stage After completion of field survey to discuss preliminary finding
III Stage After submission of DPR to discuss the recommendation and finalize the report
Task 9 Data Entry Analysis of Secondary and Primary Data and Report Writing
Both primary and secondary data is being collected compiled and tabulated and analyzed to arrive at appropriate conclusions 23 Limitations of the Study The study was conducted for 13 states and the consultant completed this study under certain limitations which were as follows
a Like any study based on sampling method the findings of the response of respondents have been extrapolated to the entire scheme for the purpose of
Impact Evaluation Study of ldquoNational Mission on Micro Irrigation (NMMI)rdquo
12
studying the achievements amp objectives of the scheme impact of the scheme and methodology of the implementation of the scheme etc
b It took almost more than one month to get the comments on the Inception Report as well as questionnaires which led to delays in the mobilization of the field work
c The consultant and the survey team got stuck during the study period due to the complications amp coordination between state amp central government authorities
d Due to natural disaster taking place in Uttarakhand the districts to be covered were changed as it was difficult to reach the selected districts
e The field work coincides with rainy season and this year there were heavy rains in few states which also hampered the field study Moreover the information regarding beneficiaries of the selected states was not provided in time therefore the survey team had to visit those areas more than one time For example in case of Haryana the survey team visited state authorities with list of districts identified for survey by consultant in consideration with MoA and NCPAH but the state authorities did not agree and wanted some time to suggest changes and therefore survey team had to wait which led to delay
f In the states like UP and Tamil Nadu the state government officials did not cooperate to provide information of beneficiaries in the beginning and consultants had to mobilize GoI authorities to send communication for co-operation which caused delay in starting field work
g In the state of UP the designed sample size has not been achieved for covering 168 farmers (beneficiaries) as number of beneficiary farmers in selected districts was less therefore the sample size has been constraint accordingly
In spite of these limitations efforts were made by the consultant to complete the study in time
Impact Evaluation Study on ldquoNational Mission on Micro Irrigation (NMMI)rdquo
13
3 Assessment of Current Status 31 Performance of MI Scheme Micro Irrigation industry in India is driven by the assistance from the central and the state governments The NMMI has given major impetus to the growth of the industry In fact the growth of the MI industry can be viewed as per growth of fund allocation to MI scheme The trend of area coverage and total subsidy advanced in the states under study has been shown in the figure 3
Annual subsidy advanced has shown increasing trends continuously except for the year 2008-09 whereas the growth of area coverage has witnessed some fluctuations in the year 2007-08 and 2012-13 Despite this fluctuation the growth in the area coverage is not proportional to the growth in fund spent The both trend lines witness convergence in growth up to 2009-10 but there after witnessed the divergence in growth
The fund spent has witnessed sudden jump after the conversion of the NMMI scheme from CSS in the year 2010-11 The fund spent has increase by about 62 percent from 2009-10 to 2010-11 and the increase in area coverage is 1538 percent in corresponding period This fact was further analyzed and the main reason for high subsidy amount is the reason of revision in the cost norm per hectare and more area coverage under drip system
The cumulative area coverage since the launch of scheme to 2012-13 in the states under study is about 356 Million ha and the total subsidy advanced till 2012-13 stood at Rs 5006 crores in the same states
Figure 3 Physical and Financial Performance of NMMI Scheme
Source Ministry of Agriculture
Impact Evaluation Study on ldquoNational Mission on Micro Irrigation (NMMI)rdquo
14
Table 5 Year wise Area under Different MI Systems of Sampled Beneficiaries
Year Area under Drip
Irrigation (ha) Area Under Sprinkler
Irrigation (ha) 2000 223 162 2001 445 000 2005 101 000 2006 15279 546 2007 17656 8282 2008 60209 21929 2009 64467 22961 2010 76567 46818 2011 128797 78328 2012 421496 202578 2013 30784 31355
Source GAPL survey
The above table depicts that the year wise area under drip is expanding more in comparison to the area under sprinklers that leads to higher system cost This may be the reason for splitting lines of physical and financial achievements after 2009 in the figure 2 It may also be inferred from the table 5 that subsidy has been increased in most of the states that caused increase in financial achievement than physical achievement which led to splitting trend line of physical and financial achievements
Table 6 Comparison of Subsidy between Pre and Post NMMI Scheme
SNo State
Total Subsidy of the farmers ()
Pre NMMI Scheme
Post NMMI Scheme Small amp
Marginal Farmers
General Farmers
1 AP 70 90 75 2 Bihar 90 90 80 3 Chhattisgarh 70 75 50 4 Gujarat 50 50 50 5 Haryana 90 90 90 6 Karnataka 75 80 50 7 Maharashtra 50 60 50 8 Odisha 70 90 80 9 Rajasthan 70 70 70
10 Sikkim 60 60 11 Tamil Nadu 65 100 75 12 UP 50 90 75 13 Uttarakhand 50 60 60
Impact Evaluation Study on ldquoNational Mission on Micro Irrigation (NMMI)rdquo
15
32 State wise Performance
AP and Gujarat were the pioneer states which harnessed the benefits of the scheme with area coverage of about 678 thousands and 504 thousands ha In 2006-07 more states were brought under the scheme and by the end of 2007-08 all the states under study except Sikkim and Uttarakhand were covered during 2011-12 The states of AP followed by Maharashtra are top in the list of area coverage as well as total subsidy advanced under MI The total cumulative central subsidy advanced and total area covered since the launch of the scheme is shown in the graph
Figure 4 State wise Central Subsidy (Rs Crores) and Area Coverage (lsquo000rsquo ha) under NMMI
Source Ministry of Agriculture
33 Targets and Achievements The states under study have achieved 9987 financial targets but the achievement of physical targets stood at 9299 The states of Gujarat and Maharashtra have achieved 100 financial targets but have not met the physical targets In Gujarat the financial utilization is 10026 due to inclusion of interest amount The state of Bihar Karnataka Odisha Rajasthan and Sikkim which have achieved more than 100 physical targets without utilizing the total allotted fund
Impact Evaluation Study on ldquoNational Mission on Micro Irrigation (NMMI)rdquo
16
It is pertinent to mention that achievements are exceeding the value of 100 percent Since the preceding year unspent balance has been brought forward to next year The scheme was launched in 2011-12 in Sikkim and Uttarakhand and the Sikkim has performed much better in physical target achievement as compared to Uttarakhand In fact Sikkim is the top performer in physical target achievements whereas the Uttarakhand is least one among the states under study as the scheme is launched few years back only The state wise cumulative (2005-06 to 2012-13) physical and financial targets vs achievement are given in the table below
Table 7 State wise Cumulative Physical amp Financial Targets and Achievements
State Physical (lsquo000rsquoha) Financial (Rs in lakh)
Target Achievement
Achievement Target Achievement
Achievement AP 87116 77205 8862 13714800 13517558 9856 Bihar 6676 7880 11804 813210 726062 8928 Chhattisgarh 13515 12602 9324 1371370 1323969 9654 Gujarat 46102 43172 9364 7247100 7265900 10026 Haryana 6638 5783 8712 882086 804293 9118 Karnataka 51096 53668 10503 6088932 5981226 9823 Maharashtra 94179 69605 7391 11542800 11542800 10000 Odisha 5406 6302 11658 506200 468763 9260 Rajasthan 57640 66307 11504 5039296 4946894 9817 Tamil Nadu 11897 11767 9890 2961660 2937490 9918 UP 2712 1883 6941 279904 254098 9078 Uttarakhand 101 022 2139 22500 7000 3111 Sikkim 039 051 13002 60000 40000 6667 Total 383117 356246 9299 50128009 50064490 9987
Source Ministry of Agriculture The major inferences drawn from table below are as follows
The scheme made rapid stride after the launch and achieved more than 80 of the targets both physical and financial in 2006-07 and the physical and financial targets have been achieved more than 100 in the subsequent year ie 2007-08 to 2009-10
The financial target achievement has been more than 100 on 2007-08 onwards except for the year 2011-12 whereas the physical target achievement has been declined after 2009-10
The Scheme has performed best in terms of both physical and financial targets achievement with around 130 achievement
The year wise cumulative (2005-06 to 2012-13) physical and financial targets vs achievement is given in table below
Impact Evaluation Study on ldquoNational Mission on Micro Irrigation (NMMI)rdquo
17
Table 8 Year wise Cumulative Physical and Financial Targets and Achievements
SNo Year Physical Financial
Target (Ha)
Achievement (Ha)
Achievement
Target (Rs)
Achievement (Rs)
Achievement
1 2005-06 18022300 1181700 656 2328415 163517 702 2 2006-07 39736500 33430060 8413 4457599 3659033 8209 3 2007-08 32404870 42117390 12997 3989632 4729348 11854 4 2008-09 42309500 51633800 12204 4172462 4678426 11213 5 2009-10 42576400 55475277 13030 4353157 5664040 13011 6 2010-11 66770000 64006900 9586 9008411 9173680 10183 7 2011-12 69819700 55752143 7985 10829000 10807615 9980 8 2012-13 71478800 52648500 7366 10989300 11188800 10182
Total 383118070 356245770 9299 50127976 50064459 9987 Source Ministry of Agriculture
Figure 5 Year wise Targets and Achievements
Impact Evaluation Study on ldquoNational Mission on Micro Irrigation (NMMI)rdquo
18
Figure 6 State wise Cumulative Targets and Achievements (2005-06 to 2012-13)
The performance of the scheme in different states and in different tenure can be sum up as under
The scheme created a good imprint in 2006-07 and achieved 8213 and 8209 of physical and financial targets respectively in the states under study In this year state of Gujarat Karnataka Maharashtra and Rajasthan achieved more than 100 of physical targets
The performance of scheme contributed to be extremely well in the year 2007-08 to 2009-10 and registered more than 100 achievement of both physical as well as financial target
Impact Evaluation Study on ldquoNational Mission on Micro Irrigation (NMMI)rdquo
19
Table 9 Year amp State wise Physical Targets and Achievements (lsquo000rsquo ha)
State 2005-06 2006-07 2007-08 2008-09 2009-10 2010-11 2011-12 2012-13 (March 13)
T A T A T A T A T A T A T A T A AP 4552 678 19346 8462 4639 11485 8521 12358 11445 13834 16550 12276 8895 10506 13169 7607 Bihar - - 1422 - - 023 - 031 - 011 - 1349 196 2329 5057 4137 Chhattisgarh - - 2875 460 1006 2083 1363 3057 1764 1577 2878 2183 1717 1839 1912 1402 Gujarat 1672 504 1825 2434 4516 4304 3356 5343 3333 6625 8034 7829 13029 6510 10338 9623 Haryana - - 537 282 722 778 3240 2230 158 326 443 934 612 579 928 654 Karnataka 2523 - 2374 3885 5352 6294 8417 9262 8131 10821 7270 8745 6317 5801 10713 8861 Maharashtra 4186 - 6512 10826 10367 8222 12876 10041 8467 9451 11803 11803 27194 11600 12775 7662 Odisha - - 331 122 103 307 375 250 758 1278 934 1201 1152 1184 1752 1961 Rajasthan 1303 - 3975 6772 4471 7374 4023 7773 8521 9556 14800 14761 10707 12218 9840 7854 Tamil Nadu 2895 - 540 - 1230 782 - 1160 - 1801 3500 2615 - 2755 3732 2654 Uttar Pradesh 891 - - 186 - 466 138 129 - 197 559 311 - 379 1125 214 Uttarakhand - - - - - - - - - - - - - - 101 022 Sikkim - - - - - - - - - - - - - 051 039 - Sub Total 18022 1182 39737 33430 32405 42117 42310 51634 42576 55475 66770 64007 69820 55752 71479 52649 Source Ministry of Agriculture
Impact Evaluation Study on ldquoNational Mission on Micro Irrigation (NMMI)rdquo
20
Table 10 Year and State wise Financial Targets and Achievements (Rs Crores)
State 2005-06 2006-07 2007-08 2008-09 2009-10 2010-11 2011-12 2012-13 (March 13)
T A T A T A T A T A T A T A T A AP 6129 934 19520 11277 5748 14559 9727 10836 14311 17829 24000 24000 28720 28720 28993 27021 Bihar - - 2482 - - 026 - 022 - 011 - 826 450 2167 5200 5340 Chhattisgarh - - 3033 256 783 1751 954 2060 1252 1193 1019 1801 3500 3500 3172 2678 Gujarat 2182 701 3356 3931 7350 4927 4899 7396 4447 5426 12000 12000 16664 16695 18200 18201 Haryana - - 444 232 604 508 1207 1278 212 385 1361 1402 1993 1667 3000 2571 Karnataka 3584 - 2457 4452 6865 7598 7319 5845 6381 8685 9254 8945 10965 9165 14065 15122 Maharashtra 4808 - 8797 13466 13897 12792 14748 13444 10707 13226 22237 22265 24980 24980 15018 15221 Odisha - - 454 143 108 101 338 293 528 871 810 697 823 893 2000 1690 Rajasthan 1048 - 2833 2687 2341 2908 2382 3009 5693 6073 12000 11620 13095 12824 11000 10347 Tamil Nadu 4291 - 1201 - 2200 1560 - 2367 - 2558 6591 7797 6625 6625 8300 13235 UP 1242 - - 146 - 562 150 235 - 381 812 383 - 441 595 393 Uttarakhand - - - - - - - - - - - - 075 - 150 070 Sikkim - - - - - - - - - - - - 400 400 200 - Sub Total 23284 1635 44576 36590 39896 47293 41725 46784 43532 56640 90084 91737 108290 108076 109893 111888
T Target A Achievement Source Ministry of Agriculture
Impact Evaluation Study on ldquoNational Mission on Micro Irrigation (NMMI)rdquo
21
34 Performance of Scheme for Area Coverage as Compared to Potential
Potential of different MI Systems in terms of drip and sprinkler has been assessed by various researchers by using the secondary data For assessing the potential of MI in different states the variables considered were state-wise and source-wise irrigation area cropped area and crops wise suitability for different MI systems Potential area is calculated on the basis of area already brought under MI system from the existing irrigated area While calculating potential area in sampled states we have also considered area under paddy which may diversify into horticultural and other cash crops in future For the purpose of arriving at some conclusion regarding performance of MI under the states data on potential area and actual area brought under drip and sprinkler irrigation in the states (NCPAH) has been analyzed
Table 11 Potential and Cumulative area under Drip amp Sprinkler Irrigation
StatesUTs
Total (Area in ldquo000 ha) Drip (Area in ldquo000 ha) Sprinkler (Area in ldquo000 ha)
PotentialIrrigated area
Cumulative area under
MI till 2012-13
Balance Potential area for
MI
Potential
area ()
Potential area
Cumulative area under
drip till 2012-13
Balance Potential
Area
Potential area ()
Potential area for
Sprinkler
Cumulative area under
sprinkler till 2012-13
Balance Potential
Area
Potential area ()
AP 6785 77100 601400 8864 506840 57605 449235 6621 171661 19495 152166 2243 Bihar 5158 7867 507933 9847 11863 181 11682 226 503937 7686 496251 9621 Chhattisgarh 1648 15655 149145 9050 12525 1172 11353 689 152275 14483 137792 8361 Gujarat 4137 43669 370031 8944 230017 24260 205757 4974 183683 19409 164274 3971 Haryana 5680 5753 562247 9899 149384 1539 147845 2603 418616 4214 414402 7296 Karnataka 4137 41485 372215 8997 156379 15697 140682 3401 257321 25788 231533 5597 Maharashtra 3806 64797 315803 8298 229882 45609 184273 4842 150718 19188 131530 3456 Odisha 1437 5199 138501 9638 28740 1042 27698 1927 114960 4157 110803 7711 Rajasthan 8903 64423 825877 9276 89030 6421 82609 928 801270 58002 743268 8349 Tamil Nadu 3519 11760 340140 9666 343103 11530 331573 9422 8797 230 8567 243 UP 19354 1869 1933531 9990 1035439 1004 1034435 5345 899961 865 899096 4646
Source Directorate of Economics amp Statistics MoA GoI NCPAH (excluding Uttarakhand amp Sikkim) Note - Analysis by GAPL It has been assessed that there is potential of bringing area under MI system is around 6117 million ha in the states under study (excluding Sikkim amp Uttarakhand) Out of this about 3490 million ha is having potential for sprinkler irrigation for crops like cereals pulses and oilseeds in addition to fodder crops The potential area for drip has been estimated in the study to be around 2627 million ha suitable for cotton sugarcane fruits and vegetables spices and condiments and some pulses crops like red gram etc The percentage of actual area against the potential estimated under drip irrigation in different states varied between 6621 in Andhra Pradesh followed by Uttar Pradesh (5345) Gujarat (4974) and Maharashtra with 4842 In case of sprinkler irrigation the percentage of actual area against the potential estimated was 243 (Tamil Nadu) and
Impact Evaluation Study on ldquoNational Mission on Micro Irrigation (NMMI)rdquo
22
the highest of 9621 (Bihar) Compared to the potential of 6117 million ha in the all eleven states the present area under MI accounts for 339 million ha (166 million ha under drip and 173 million ha under sprinkler) which is about 555 (Table 11) The present figures thus reflect the extent of MI systems covered under different government programme as well as own investment by the farmers However the actual area under MI may vary according to the extent of use by the farmers
Figure 7 Proportion of Area under Drip and Sprinkler Irrigation
Source GAPL Analysis
35 Pattern of Assistance
351 Indicative Cost of Installing Micro Irrigation System
As per the guidelines of NMMI the States have been categorized in the following categories
Category A States where more than 20000 hectares have been brought under drip irrigation come under lsquoArsquo Category This would include the States of AP Gujarat Karnataka Maharashtra Madhya Pradesh Punjab Rajasthan and Tamil Nadu
Category B All the states except those covered under the category lsquoArsquo and those falling in the Himalayan belt would come under this category
Category C All the North Eastern States Sikkim Himachal Pradesh Jammu amp Kashmir Uttarakhand and Darjeeling district of West Bengal
Impact Evaluation Study on ldquoNational Mission on Micro Irrigation (NMMI)rdquo
23
Keeping in view the level of awareness proximity to the manufacturing units distance involved in transportation potential for drip irrigation the cost of drip system in Category lsquoBrsquo States is estimated to be 15 higher than Category lsquoArsquo States while for Category lsquoCrsquo States it is estimated to be 25 higher than Category lsquoArsquo States Cooperative SocietiesSelf Help GroupsIncorporated Companies are also entitled to avail assistance on behalf of its members In such cases the individual beneficiary receives assistance through the Cooperative Society SHGIncorporate company and not directly 352 State-wise Pattern of Assistance It was observed that the states are giving subsidy on MI ranging from 50 percent to 100 percent depending on the size of the holding and category of the farmers in different states However the central share is same across the states It may be seen from the Table 12that in Tamil Nadu the quantum of subsidy is 100 percent for small amp marginal farmers whereas in AP for SCST farmers the quantum is cent percent
Table 12 State wise Quantum of Subsidy to Different Categories of Farmers
SNo State
Percentage of subsidy to small
amp marginal farmers
Percentage of subsidy to other farmers
Remarks
1 AP 90 75
APMIP arranges the following Micro Irrigation systems to farmers with government subsidy (SCST 100 subsidy) (others 90 75 60) for Drip (Inline amp Online) Semi-Permanent Sprinklers and Rain Guns
2 Bihar 90 80 About 98 area is under sprinkler irrigation 3 Chhattisgarh 75 50 About 93 area is under sprinkler irrigation
4 Gujarat 50 50 Uniform pattern of subsidy Gujarat Green Revolution Company Limited (GGRC)
5 Haryana 90 90 Additional subsidy is provided for hydro-cyclone filters
6 Karnataka 80 50 For the first 2 ha out of 5 ha per beneficiary ceiling on the area to be undertaken under the scheme
7 Maharashtra 60 50 25 per cent of the beneficiaries are small and marginal farmers
8 Odisha 90 80 Subsidy rate under NMMI wef 2013-14
9 Rajasthan 70 70 90 for drip 70 for sprinkler(mini) 60amp 50 for portable sprinkler for SCST and General Category respectively
10 Sikkim 60 60 NMMI scheme was launched in 2011-12
11 Tamil Nadu 100 75 ldquoTamil Nadu Horticulture Development Agencyrdquo (TANHODA) Subsidy effective from 2511 2011
12 UP 90 75 Subsidy rate under NMMI wef 2012-13 13 Uttarakhand 60 60 NMMI scheme was launched in 2011-12
Note The Central Government share in total subsidy is 50 for small marginal OBC SCST amp women categories and 40 for general categories Sources State Level Nodal Agencies
Impact Evaluation Study on ldquoNational Mission on Micro Irrigation (NMMI)rdquo
24
353 Quantum of Subsidy and Adoption of MI System by Farmers Increase in area under MI has not been found to be significantly higher in case of the states giving higher subsidy quantum and vice versa The Data on area coverage under MI System amp extent of subsidy provided clearly demonstrates that increasing the extent of subsidy had no significant impact on area coverage under MI system The case in point pertains to increase in area under MI in Maharashtra and Gujarat where the subsidy for small amp marginal is 60 percent and 50 percent respectively whereas the area increase was 223 and 140 percent respectively Similarly area coverage in Haryana Tamil Nadu and Bihar was noted to be 73 45 and 31 percent respectively the corresponding figures for subsidy were 90 75 and 90 percent The increase in area under MI was only 13 and 73 percent respectively for UP amp Rajasthan where subsidy level was 90 and 70 percent as per the data available from implementing agencies The aforesaid observation clearly suggests that increasing the subsidy component had no impact on area coverage under MI system The relationship between area expansion under MI and quantum of subsidy has been computed considering beneficiariesrsquo data on area expansion in different states before and after adoption of MI system A critical perusal of data on area coverage collected by our team and also the one quoted by India Statistics portal vis-a-vis the magnitude of subsidies suggests that the states should be advised to seriously consider that the quantum of subsidy to be restricted between 50-70 percent including state and central share and depicted in the table 13
Table 13 State wise Quantum of Subsidy and Area Coverage
State
Total Cultivated
Area (000 ha)
Net Irrigated
area (000 ha)
Area under NMMI
(000 ha)
Percent Irrigated
Area under MI
Area under MI Percent Increase
(Beneficiaries)
Quantum of Subsidy
() for General
Category
Quantum of Subsidy () for Small amp Marginal farmers
AP 1341500 503400 77090 1531 1240 7500 9000 Bihar 617900 303000 7870 260 310 8000 9000 Chhattisgarh 494900 135600 15650 1154 1500 5000 7500 Gujarat 1068100 423300 43660 1031 1400 5000 5000 Haryana 364000 288700 5750 199 1000 9000 9000 Karnataka 1172200 349000 41490 1189 260 5000 8000 Maharashtra 1877200 325600 64790 1990 2230 5000 6000 Odisha 555900 128400 5190 404 1100 8000 9000 Rajasthan 1958400 666100 64420 967 730 7000 7000 Sikkim 8200 1400 NA NA 070 6000 6000 Tamil Nadu 596900 291200 11760 404 450 7500 10000 UP 1780800 1338600 1860 014 130 7500 9000 Uttarakhand 76600 33600 NA NA 160 6000 6000
Source GAPL Analysis As per records of Directorate of Economics and Statistics As per records of NCPAH As per our survey in the sampled states
Impact Evaluation Study on ldquoNational Mission on Micro Irrigation (NMMI)rdquo
25
354 State Implementing Agencies The NMMI scheme is being implemented by specially designated agencies by the respective state governments and is provided one percent of the annual outlay actual release of funds for administering and monitoring the scheme at district level It has been observed that Directorate of Horticulture is the implementing agency for NMMI in nine states The scheme is implemented by Directorate of Agriculture in Maharashtra and Chhattisgarh Rajya Beej amp Krishi Vikas Ltd (CHRBKV) in Chhattisgarh In case of AP and Gujarat the scheme is being implemented by AP Micro Irrigation Project (APMIP) and Gujarat Green Revolution Company (GGRC) respectively
Table 14 State-Implementing Agencies for NMMI
State Implementing Agency Focus Nature of Association
AP APMIP Micro Irrigation SPV- relatively autonomous unit within Horticulture Department
Bihar DoH Agriculture amp Horticulture Government Department
Chhattisgarh CHRBKB Agriculture amp Horticulture Government Department
Gujarat GGRC Micro Irrigation Registered Under Companys Act Public Ltd
Haryana DoH Agriculture amp Horticulture Government Department
Karnataka DoA ampDoH Agriculture amp Horticulture Government Departments
Maharashtra DoA Agriculture amp Horticulture
Government Department
Odisha Horticulture
Development Society (OHDC)
Nodal Agency for NHM
Registered under Society Registration Act
Rajasthan Rajasthan Horticulture Development Society
(RHDS)
Agriculture amp Horticulture
Horticulture Development Society (RHDC)
Tamil Nadu DoH Agriculture amp Horticulture Government Department
UP DoH Agriculture amp Horticulture
Government Department
Sikkim DoH Agriculture amp Horticulture Government Department
Uttarakhand DoH Agriculture amp Horticulture Government Department
Source State Departments
Micro irrigation has been an integral component in some of the schemes of Horticulture Division such as schemes for area expansion The quantum of subsidy varies in these schemes as compared to NMMI scheme This goes against the principle of convergence of schemes It is recommended that assistance for micro irrigation component on pattern of NMMI may be made available under ongoing area expansion schemes
Impact Evaluation Study on ldquoNational Mission on Micro Irrigation (NMMI)rdquo
26
It has been observed that the scheme implemented by the state departments such as horticulture agriculture and others are not fully yielding the desired results because of the following
1) The state departments are also occupied with their own targets and other related activities and are not able to devote desirable time for the implementation of NMMI activities
2) This also creates bias toward their own field such as horticulture department may not give due consideration to field crops etc
3) The extension workers of state departments are involved in providing extension services training and field demonstrations etc of their parent department which affects their working
It is being proposed that separate institute may be created in the line of AP and Gujarat model so that effectiveness transparency monitoring and targets are fully achieved The subsidy process flow charts for AP amp Gujarat are given in Annexure I The consultant has no bias against state departments or government institutions but for meeting the objectives of NMMI such recommendations have been proposed
355 Extent of Convergence with Other Schemes
One of the objectives NMMI scheme is to establish convergence and synergy among different on- going programmes in the country During the course of the study it was observed that in case of NMMI scheme there has been convergence among various on- going programmes such as National Food Security Mission (NFSM) NHM RADP RKVY Integrated Scheme of Oilseeds Pulses Oil palm and Maize (ISOPOM) Technology Mission on Cotton (TMC) and number of state level schemes being implemented by respective states
Rainfed Area Development Programme (RADP) - A Sub-Scheme under Rashtriya Krishi Vikas Yojana (RKVY) The basic premise of the proposed programme is to encourage exploitation of the potential of different farming systems based upon the natural resource assetsendowments (ponds land development nursery etc) created either by the farmers or through schemes like MGNREGA RKVY NHM and Watershed Projects This may act as a catalyst to accomplish the ultimate objective of enhancing productivity minimizing the risk of crop losses due to uncertainties of weather conditions harnessing efficiency of resources assuring food and livelihood income security at farm level and strengthen the farmersrsquo capacity to adapt to climatic changes Therefore converging the upgraded utilities developed through watershed development programmes MGNREGA in terms of water harvesting and micro water storages through effective application and distribution systems like improved conveyance field channels pressurized irrigation water lifting devices etc
Impact Evaluation Study on ldquoNational Mission on Micro Irrigation (NMMI)rdquo
27
to enhance the potential of farming systems The subsidy under this scheme is also extended for installation of pressurized micro irrigation as per norms of NMMI only if not possible through convergence All the States have reported convergence of Mission interventions with different schemes of the Government of India and State level programmes Most of the districts have converged NFSM interventions with programmes such as RKVY ICDP Farm Mechanization NHM Micro-Irrigation and other State programmes 356 Food Security and the Micro Irrigation Scheme To achieve required food production with increasing population India has to enhance the current irrigation potential of 91 M ha to 160 M ha but the total water resources estimated are 230 M hm4 to cater the need to the non-agricultural uses also The country is likely to be water stressed in the coming years Therefore hand in hand with technologies for water harvesting and storage technologies for precision water application methods need to be adopted The food security primarily has the three objectives of ensuring production of adequate food supplies maximizing stability in the flow of supplies and securing access to available supplies on the part of those who need them Access to food has two defined components to it One interventions aimed at boosting agricultural productivity and the second adopting strategies to promote employment social protection measures cash transfers to the poor to improve their access to the available food India has already in place social protection as a component of food security As mentioned earlier several projects for utilization of surface water as well as ground water resources have been undertaken However in some cases the unplanned development has led to over exploitation of the resource affecting the physical sustainability The adverse impact of such unplanned development is evident from the alarming decline in water table in some areas The developmental activities for utilization of water resources as also the development in other sectors particularly industrial sector coupled with urbanization have resulted in water pollution ndash both surface water as well as ground water Further the utilization of the created facilities is far from optimal as the water sector in India suffers from (a) relatively low water use efficiency and (b) increasing gap between the created irrigation potential and the utilized irrigation potential
In this regard it may also be important to note that the future development of water resources are bound to be more challenging as the easy options particularly from the
4Micro Irrigation Management in Cotton CICR Technical Bulletin No 31
Impact Evaluation Study on ldquoNational Mission on Micro Irrigation (NMMI)rdquo
28
topographical and geological considerations have since been tapped Further the future water resources development projects would need rigorous environmental and social evaluations In view of above mentioned challenges and particularly to address the two serious issues namely ldquofood securityrdquo and ldquoimpact of climate changerdquo initiatives have been taken by the Ministry of Water Resources to identify the most appropriate approach for water resources management and also to assign priorities Despite variations in availability of water both within and over the years the long term average available water resources of the country may be considered to remain unchanged Therefore the increasing demand for water for various purposes are bound to result in competition among the ldquousesrdquo as well as among the ldquouser groupsrdquo and with time such competitions are becoming fiercer and fiercer The conflicts among the ldquousers groupsrdquo are visible in the form of increasing inter-State issues The prioritization of water uses for different purposes at different point of in the planning process as also during the operation is becoming more and more challenging in view of conflicting social and economic considerations Such changing scenario calls for identification of most appropriate strategies for effectively addressing the future challenges At the current cereal intake of 143 kgs per capitalannum cereal requirement for household consumption will be around 192 million tons in 2020 The requirement will be more if the increase in household demand due to income growth is also considered At 5 per cent per annum growth in total expenditure and population of 1343 billion household cereal demand works out to 221 million tons in 2020 and for food grains 241 million tons With a grossing factor of 114 the total (household plus non-household) demand for cereals may be around 253 million tons The above cereal demand projections are made with the assumption of stability of tastes and preferences in food consumption If the trend of food grain production as witnessed during the last two decades is sustained the production of additional 57 million tons of cereals and 76 million tons of total food grains in the coming two decades may not be out of reach for India The demand projections may turn out to be on a higher side if the secular trend of change in consumer preferences away from cereal consumption persists Demand for superior food items such as dairy and animal husbandry products sugar fruits and vegetables are expected to grow much faster during the coming decades The estimated demand in 2020 for milk and milk products will be around 166 million tons edible oils 11 million tons meat fish and eggs 11 million tons sugar and gur 25 million tons and fruits and vegetables 113 million tons It may be noted that food grains pulses oilseeds sugar fruits and vegetables poultry dairy meat fish etc constitute the bulk of the output in the agriculture sector The performance of agriculture is important for availability and access to food as more than 55
Impact Evaluation Study on ldquoNational Mission on Micro Irrigation (NMMI)rdquo
29
per cent people in the country are dependent on this sector There are both short run and long run problems in agriculture Farmersrsquo suicides continue unabated even increasing in some states as growth rate in yield is on the decline Farming is fast becoming a non-viable activity Further scope for increase in net sown area is limited Land degradation in the form of depletion of soil fertility erosion and water logging has increased There has been decline in the surface irrigation expansion rate and a fall in the level of the ground water table Exposure of domestic agriculture to international competition has resulted in a high order of volatility in prices Disparities in productivity across regions and crops and between rain fed and irrigated areas has increased Long term factors like steeper decline in per capita land availability and shrinking of farm size are also responsible for the agrarian crisis Land issues such as SEZs land going to non-agriculture alienation of tribal land etc are becoming important The Steering Committee report on agriculture for the Eleventh Plan (GoI 2007) has identified the possible reasons for deceleration in agriculture since the mid- 1990s According to the report the major sources of agricultural growth are public and private investment in agriculture and rural infrastructure including irrigation technological change diversification of agriculture and fertilizersA major challenge to food security comes from dietary diversification of the poor If cereal pricing is left to the market forces government playing the facilitating role land may be released from rice and wheat cultivation to meet the growing demand for non-cereal crops such as oilseeds fruits and vegetables in accordance with diet diversification The micro irrigation system is a proven technology that helps in improving the productivity of crops by judicious use of water MI system has resulted in improving the productivity of wheat maize and pulses by 2405 1348 and 2869 respectively Area under horticulture crops as well as nutritional security has also enhanced The positive outcomes on the food security due to the increase in the production amp productivity of different crops and increased area under irrigation from same source of water However keeping in view the growth population of the country we need to boost the production that can be possible with the help of innovation amp transparency in the irrigation system in NMMI scheme 36 Mission Structure Review 361 National Level National Level The Horticulture Division in the Department of Agriculture amp Cooperation Ministry of Agriculture coordinates the overall activities and review the progress of implementation of the Mission in the country The Executive Committee (EC) of is chaired
Impact Evaluation Study on ldquoNational Mission on Micro Irrigation (NMMI)rdquo
30
by Secretary (AampC) Department of Agriculture amp Cooperation to oversee the activities of the Mission and to approve the State Annual Action Plans besides projects on technology transfer etc National Committee on Plasticulture Applications in Horticulture (NCPAH) is entrusted in the monitoring and reviewing the progress of the scheme Executive Committee (EC) reallocates resources across States and approves programmes on the basis of approved subsidy norms EC is empowered to approve special interventions for tackling emergent requirements EC can also constitute Sub-Committee (SC) Empowered Committee (EMC) and delegate power to SC EMC for emergent requirements like revision of cost norms inclusion of equipment etc if required based on the recommendations of EC of NMMI 362 State Level Micro Irrigation Committee (SMIC) At the State level State Micro Irrigation Committee (SMIC) under the Chairmanship of Agriculture Production Commissioner Principal Secretary (Horticulture Agriculture) oversees the implementation of the scheme in their respective States The Panchayati Raj Institutions in the State are also member of the SMIC represented in the SMIC and involved in the implementation of the Scheme The Chairman at his discretion can co-opt officials experts as invitees The SMIC meeting is held once in every quarter The state level micro irrigation committees have been assigned to perform the following functions as per the guidelines
1 Organise base line survey and feasibility studies in different parts of the state covering various crops and technologies
2 Ensure smooth implementation of Micro irrigation programme in different districts of the state
3 Ensure allocation of state share required for implementing the scheme and make it available to the implementing Agency
4 Finalise and forward the consolidated actions plans of the Districts to DAC
5 Register the System Manufacturers and circulate the list of System Manufacturerrsquos registered with SMIC along with the quoted price to the District Micro Irrigation Committee (DMIC) and Implementing agencies They will also indicate the quantum of money to be paid by the beneficiariesbanks to the manufacturers before installing the system
6 Mobilize credit requirement of the farmers through the Financial Institutions for installing Micro Irrigation System
7 Organise various training and extension programmes for farmers officials NGOrsquos entrepreneurs etc involving PFDCs
Impact Evaluation Study on ldquoNational Mission on Micro Irrigation (NMMI)rdquo
31
8 Host a website indicating the details and status of the progress of NMMI scheme in different districts of the state
During the course of discussions qualitative assessment was made on the basis of these parameters such as organise base line survey and feasibility studies in different parts of the state covering various crops and technologies are regularly prepared and accordingly assessment has been made Similarly the same criterion was adopted in other parameters to arrive at final assessment and these were summarized in the table 15 It may be seen from the table that the states of AP Gujarat Maharashtra are performing better than other states as far as their functions and responsibilities are concerned whereas Bihar and UP are the laagered states in this regard It may be premature to comment on the performance of Sikkim and Uttarakhand states because the scheme is recently implemented
Impact Evaluation Study on ldquoNational Mission on Micro Irrigation (NMMI)rdquo
32
Table 15 Performance of the Functioning of SMICs in Sampled States
Functions States
Base line survey and feasibility
studies
Implementation
Allocation of the State Share Action Plan
Registration of the System Suppliers
Mobilize Credit for Farmers
Capacity Building
Programme
Website Hosting Assessment
AP Medium High High High High Low-medium Medium Medium Medium-high
Bihar Low Low Low Low-medium Low-medium Low Low Low Low
Chhattisgarh Low-medium Medium Medium Medium High Low-medium Low-medium Low-medium Medium Gujarat Medium High High High High Low-medium Medium Medium Medium-high Haryana Low-medium Medium Low-medium High Low-medium Low-medium Low-medium Medium Low-medium Karnataka Low-medium Medium High High High Low-medium Medium High Medium-high Maharashtra Medium Medium High High High Low-medium Medium Medium Medium-high Odisha Low-medium Medium Low-medium High High Low-medium Low-medium Low-medium Medium Rajasthan Low-medium Medium High High High Low-medium Medium Medium Medium-high Tamil Nadu Medium Medium Medium High High Low-medium Medium High Medium-high UP Low Low Low Low Low-medium Low Low Low Low
Sikkim Low Low Low Low-
medium Low-medium Low Low Low Low
Uttarakhand Low Low Low High Medium Low Low Low Low Source GAPL analysis
Note High Response is more than 80 Medium Response is between 50 to 70 Low Response is below 50
Impact Evaluation Study on ldquoNational Mission on Micro Irrigation (NMMI)rdquo
33
The above table shows the assessment of performance amp functioning configuration The scales are used to represent the intensity of the functions ongoing into the sampled state The registration of the system suppliers are scaled as per the number of manufacturers in proportion to the size of the state It has been observed that AP Gujarat amp Maharashtra are leading states in the every aspect of the different activities involved in the process streamlined those are mentioned in the NMMI guidelines It has further been observed that Bihar UP Sikkim amp Uttarakhand states are lacking in terms of the functions mentioned in the guidelines There are still many dots to be connected in these states to get the desired and satisfactory results 363 District Level Micro Irrigation Committee (DMIC) At the District level District Micro Irrigation Committee (DMIC) headed by the Chief Executive Officer (CEO) of Zila Parishad District Rural Development Agency (DRDA) Collector of the District with members representatives from concerned departments viz Agriculture Horticulture Rural Development Irrigation and Water Resources Growersrsquo Association Krishi Vigyan Kendras (KVKs) and local lead Banks are responsible for implementing the NMMI programme in the district The DMIC meeting is held once in every month The DMIC performs the following functions as per the guidelines
1 Forward the District Action Plan to SMIC for compilation of State Action Plan and forward it to the Ministry of Agriculture
2 Mobilize credit requirement of the farmers through the Financial Institutions for installing Micro Irrigation System
3 Monitor and review the physical amp financial progress of implementation of Mission programme
4 Review the submission of utilization certificate by the implementing agency
5 Provide Feedback to SMIC on monthly basis by 6th7th of each month
It was observed that DMIC in almost all the states are preparing their district plans regularly and in time except for Bihar UP Sikkim and Uttarakhand and accordingly assessment has been made Similarly the same criterion was adopted in other parameters to arrive at final assessment The table below shows the extent of functioning at the district level It is also portraying almost the same picture that is being shown under the state level
Impact Evaluation Study on ldquoNational Mission on Micro Irrigation (NMMI)rdquo
34
Table 16 Performance of the Functioning of DMICs in Sampled States
Functions States
District Plan
Mobilizing Credit Review amp
Monitoring
Submission of
Utilization Certificates
Monthly Feedback amp Reporting
Own Assessment
AP High Low-medium High Medium High Medium-high Bihar Medium Low Low-medium Low Low-medium Low Chhattisgarh High Low-medium Medium Low-medium Medium Low-medium Gujarat High Medium High Medium High Medium-high Haryana High Low Medium Medium Medium Medium Karnataka High Medium High Medium High Medium-high Maharashtra High Medium High Medium High Medium-high Odisha High Low-medium Low-medium Low-medium Medium Medium Rajasthan High Low-medium High Medium High Medim-high Tamil Nadu High Low-medium Medium Medium Medium Medium UP Medium Low Low-medium Low Low-medium Low Sikkim Medium Low Low-medium Low Low-medium Low Uttarakhand Medium Low Low-medium Low Low-medium Low
Source GAPL analysis
Note High Response is more than 80 Medium Response is between 50 to 70 Low Response is below 50 364 Improving Efficacy of the Institutional Mechanism The following measures may be taken to improve the efficacy of the institutions involved in the implementation of the scheme
1 The utilization certificates to be submitted in time for the prompt release of the funds
2 SPV on the pattern AP state and separate institute like GGRC in Gujarat may be adopted for improving the efficiency and transparency
3 The meeting of various committees formed under the programme should be held regularly The meetings of the SMIC should be convened on quarterly basis and the same may also not tagged with other meetings in order to give proper focus on the implementation of the programme
4 Human Resource Development is one of the key factors for successful implementation of other sub components of any programme The capacity building at all levels -farmers field level workers technical officers and scientists and developing orientation skills of all the stake holders in the context of changing needs of agriculture to be intensified More training programmes for all the stakeholders should be organized
Impact Evaluation Study on ldquoNational Mission on Micro Irrigation (NMMI)rdquo
35
37 Role of Panchayati Raj Institutions (PRIs) in NMMI Scheme Panchayats have been entrusted mainly in identification of the beneficiaries in their respective jurisdiction The interested farmer put his application to the Panchayat and after verification the case is recommended Panchayati Raj Institutions are involved in the following activities i Selection of crops and identification of priority areas for implementation
ii Authorization of beneficiaries compilation of application forms proforma invoices and
creation of local initiatives in promotion of micro irrigation technology iii Organization of interactive meetings with the representatives of MI industry iv Training extension and awareness creation (added as per GoI notification dated 208
2013)
However during the course of discussions it was observed that PRIs role is not only limited to compilation of necessary documents required for submission of application forms but also involved in Information-Communication-Education (IEC) activities as shown it the
The major activities and roles of PRIs practiced in different sampled states are as follows
A Issues no objection certificate on first come first serve basis Gram Panchayat informs to Gram Sabha regarding the selection of NMMI beneficiaries as well as verification of the land ownership
B Verification amp certification of the farmersrsquo ownership amp domicile involved in IEC activities Issues no objection certificate on first come first serve basis
C Verification amp certification of farmersrsquo domicile Issues no objection certificate on first come first serve basis
D Verification amp certification of the farmersrsquo ownership amp domicile involved in IEC activities recommendation of farmersrsquo Issues no objection certificate on first come first serve basis
E It is suggested that Panchayati Raj Institutions are required to be more effective in their roles amp responsibilities as per the guidelines for which sensitization exercises through training and capacity building programmes may be initiated
Impact Evaluation Study on ldquoNational Mission on Micro Irrigation (NMMI)rdquo
36
4 Primary Survey Respondentsrsquo Profile and Findings Primary survey of 7400 farmers was conducted in 13 states as per the sampling plan detailed in chapter 2 The coverage is quite systematic amp comprehensive hence no distortion in the findings is expected due to disproportionate representation of any specific category
The purpose of analyzing the profiles of different respondents and deriving the findings was to evaluate the overall impact created by the scheme and to find the gap between planned objectives and outcome after the execution of the scheme along with identifying the best possible solution to fill the gap if any 41 Demographic Profile (Sampled Beneficiaries amp Non-beneficiaries) The socio economic conditions of the target group indicate their basic characteristics which may be instrumental in the adoption of new technologies and interventions The demographic profile of the farmers covered in the survey in terms of their education profile gender category etc is presented in the following section 411 Size of Land Holding The benefit of the NMMI scheme is extended to the farmers on the basis of size of holding As per the norms at least 33 percent of the allocation is to be utilized for the small marginal and women farmers Similarly the quantum of the subsidy is more for small and marginal farmers The beneficiaries in case of small and marginal farmers are eligible for subsidy up to 60 percent of the cost of drip sprinkler irrigation system and the remaining 40 percent have to borne by the farmers However in the case of general categories of the farmers subsidy assistance is 50 percent of the cost of the system which is shared in the ratio of 401050 by the central state government and the beneficiaries The states are free to provide additional subsidy to the beneficiaries from their own resources Keeping the above factor in view the sampled farmers were categorized as per the prescribed guidelines (Table 18) into three categories based on their land holdings such as marginal amp small farmer under 2 hectares medium between 2-10 hectares and large above 10 hectares The results on distribution of the farmers according to their land holding category have been presented in the table 17 for both beneficiaries and non-beneficiaries
Impact Evaluation Study on ldquoNational Mission on Micro Irrigation (NMMI)rdquo
37
Table 17 Land Holding Status of Beneficiary and Non Beneficiary Farmers
State
Beneficiaries Non Beneficiaries
Total Beneficiaries
Category of Farmers () Total Non-Beneficiary
Category of Farmers (`) Marginal amp
Small Medium Large Marginal amp Small Medium Large
AP 672 9241 759 000 168 9643 357 000 Bihar 516 1105 7945 950 128 5391 4453 156 Chhattisgarh 384 8359 1589 052 96 9375 625 000 Gujarat 576 4132 566 208 144 5833 3819 348 Haryana 320 3344 6062 594 81 4568 5185 247 Karnataka 576 7691 2292 017 144 8333 1667 000 Maharashtra 672 8304 1666 030 169 8343 1657 000 Odisha 480 5250 4708 042 120 5500 4417 083 Rajasthan 574 3711 6028 261 138 6884 2899 217 Sikkim 50 10000 000 000 10 9000 1000 000 Tamil Nadu 455 8286 1714 000 120 8333 1667 000 UP 527 3397 6546 057 168 6667 3273 060 Uttarakhand 90 5000 4667 333 22 7727 2273 000 Total 5892 5874 3943 183 1508 7308 2600 092 Source GAPL survey
Marginal small and medium category of farmers accounted for 5874 and 3944 percent of the beneficiaries where as 183 percent farmers are reported to be under large category among beneficiaries while among non-beneficiaries 73 percent farmers fall under the category of marginal-small farmers and 26 percent are under medium land holding category The distribution of large farmers among non-beneficiaries are not observed in Andhra Pradesh Chhattisgarh Karnataka Maharashtra Sikkim Tamil Nadu and Uttarakhand
The above table reveals that the proportion of a small and marginal farmers are observed to be highest in Sikkim followed by Andhra Pradesh Chhattisgarh Maharashtra and Tamil Nadu among the sampled farmers The proportion of medium and large farmers accounted for 3943 percent of the total beneficiaries
The data on size and distribution of operational land holdings in the country (Table 18) also suggest that medium and large farmers accounted about 15 percent of total land holdings thus occupying approximately 5542 percent of the total area The average size of land holding with the medium and large category of farmers was also noted to be 608 and 1810 hectare respectively
Impact Evaluation Study on ldquoNational Mission on Micro Irrigation (NMMI)rdquo
38
Table 18 Size and Distribution of Operational Holdings
SNo Category of Holding Size Group (Ha) Holding
()
Total Area Coverage
()
Average Size (Ha)
1 Marginal lt 10 671 225 039 2 Small 10 - 20 1791 2208 142
Sub Total 8501 4458 3 Semi Medium 20 - 40 1004 2363 271 4 Medium 40 - 100 425 212 576 5 Large gt 1000 07 1059 1738
Sub Total 1499 5542 Total 100 100 115
Source Agriculture Census -2010
In light of these facts the present limit of area up to 5 hectare under NMMI scheme needs to be re-looked and calls for relaxation of farm size limitations in providing subsidies This will not only increase the area under MI and improve the water use efficiency but will also contribute significantly towards food security on sustainable basis 412 Categories of Farmers The NMMI scheme is extended to all the categories of the farmers and the mission has earmarked the total allocation to SCST farmers as per their proportion to the population in the district The following table summarizes the categories on their category both for beneficiaries and non-beneficiaries
Table 19 Category wise Proportion of Beneficiary and Non Beneficiary Farmers
State Beneficiaries Non Beneficiaries
Total Beneficiaries
Farmers Categories () Total Non-Beneficiaries
Farmers Categories () Gen OBC ST SC Gen OBC ST SC
AP 672 2768 5074 1116 1042 168 3750 4345 1131 774 Bihar 516 3643 5853 213 291 128 2734 6641 391 234 Chhattisgarh 384 3438 2891 3307 365 96 1563 3854 3646 938 Gujarat 576 7222 2083 556 139 144 7569 2083 208 139 Haryana 320 8219 1656 000 125 81 6914 2716 000 370 Karnataka 576 6424 2049 712 816 144 6111 2431 903 556 Maharashtra 672 7574 2247 104 074 169 7633 2012 178 178 Odisha 480 5458 3354 917 271 120 5500 2667 1500 333 Rajasthan 574 3711 5279 714 296 138 3043 6522 290 145 Sikkim 50 2400 2200 5400 000 10 7000 2000 1000 000 Tamil Nadu 455 4044 5187 066 703 120 5750 3583 000 667 UP 527 4156 5408 019 417 168 2679 6131 119 1071 Uttarakhand 90 5444 1556 111 2889 22 4545 2273 000 3182 Total 5892 5097 3744 696 463 1508 4867 3919 683 531
Impact Evaluation Study on ldquoNational Mission on Micro Irrigation (NMMI)rdquo
39
It may also be seen from the above table which shows coverage of different categories of farmers selected for primary survey on random basis the implementing agencies in various states under study were able to provide the benefits of NMMI scheme to all the categories of the farmers based on its norms 413 Gender The role of the women in agriculture is more than 60 percent for conducting different farm activities like tending of animals farm operations ( except ploughing ) and other farms house activities In the guidelines of the NMMI schemes a special mention has been made for the benefits to be extended under the scheme to the women farmers Therefore the coverage of number of male and female beneficiaries in the survey is presented in the following table
Table 20 Gender Status of Beneficiaries and Non Beneficiaries
State
Beneficiaries Non Beneficiaries Total
Beneficiaries Gender () Total Non-
Beneficiary Gender ()
Male Female Male Female AP 672 8348 1652 168 9702 298 Bihar 516 9399 601 128 9688 313 Chhattisgarh 384 8932 1068 96 9271 729 Gujarat 576 9427 573 144 9792 208 Haryana 320 3781 6219 81 10000 000 Karnataka 576 8628 1372 144 9931 069 Maharashtra 672 9345 655 169 9822 178 Odisha 480 8896 1104 120 9833 167 Rajasthan 574 9059 941 138 9710 290 Sikkim 50 8800 1200 10 9000 1000 Tamil Nadu 455 8835 1165 120 9833 167 UP 527 8843 1157 168 9821 179 Uttarakhand 90 8667 1333 22 10000 000
Total 5892 8681 1319 1508 9768 236 Source GAPL Survey It may be seen from the above that proportion of male among the entire sampled respondent is higher than 85 percent in case of beneficiaries and non-beneficiaries both This may be due to the fact that in most cases the land is generally in the name of head of the family and being a patriarchic society land ownership rests with the male gender 414 Educational Status Education plays an important role in the development and the same is true for the NMMI schemes Therefore the education status of sampled farmers both beneficiaries and non-beneficiaries was enquired This information is summarized in table below
Impact Evaluation Study on ldquoNational Mission on Micro Irrigation (NMMI)rdquo
40
Table 21 Education Status of Beneficiaries and Non-beneficiaries
State
Beneficiary Non Beneficiary
Total Beneficiary
Education status () Total No of Non-
Beneficiary
Education status ( ) Not
Educated Primary High
School Sr
Secondary Graduate
and Above
Not Educated
Primary High school
Sr Secondary
Graduate and
above AP 672 223 2232 4435 2515 595 168 060 1964 5298 2321 357 Bihar 516 659 2035 3120 1667 2519 128 1016 2891 2813 1328 1953 Chhattisgarh 384 1120 3568 2526 1589 1198 96 521 4167 3125 1771 417 Gujarat 576 1128 2917 3073 1632 1250 144 1389 2986 3194 1042 1389 Haryana 320 2094 1438 2469 1438 2563 81 370 2716 3210 1852 1852 Karnataka 576 313 3090 4288 1354 955 144 625 3681 3264 1667 764 Maharashtra 672 298 2321 4003 1622 1756 169 414 2249 4201 1775 1361 Odisha 480 688 2708 3229 1750 1625 120 917 3250 3167 1250 1417 Rajasthan 574 784 4268 3937 557 453 138 1232 4275 4275 217 000 Sikkim 50 200 1600 3000 2000 3200 10 1000 1000 3000 2000 3000 Tamil Nadu 455 352 2374 4505 1165 1604 120 583 3917 4500 917 083 UP 527 607 3454 4023 1195 721 168 476 2560 4107 2024 833 Uttarakhand 90 1111 1889 2000 3556 1444 22 3636 1364 2727 1818 455 Avg Total 5892 677 2766 3664 1556 1336 1508 729 3037 3806 1499 928
Source GAPL Survey
Impact Evaluation Study on ldquoNational Mission on Micro Irrigation (NMMI)rdquo
41
In most of the sampled areas the most of the farmers are educated except in Haryana where about 21 percent of the beneficiaries reported to be not educated The higher proportion of graduate among beneficiaries in most of the states as compared to non-beneficiaries clearly indicates that educated and informed farmers are more likely to adopt MI Systems
415 Status of Communication Facilities
Communication Media is an important tool of flow of information particularly in agriculture as pre and post-harvest operation are time bound as well as subject to use of resources Quick and authentic information are required for weather forecast agriculture operations and practices information about the markets for disposal etc Numbers of portals such as AGMARKNET have been launched to benefit the farming community
Table 22 Mobile Phone Ownership
State Beneficiary having
Mobile () Non Beneficiary
having Mobile () AP 1979 1190 Bihar 8043 6016 Chhattisgarh 3854 625 Gujarat 8767 6597 Haryana 6719 5926 Karnataka 2934 903 Maharashtra 2426 414 Odisha 3333 1917 Rajasthan 5505 5507 Sikkim 7400 9000 Tamil Nadu 2462 250 UP 1195 1607 Uttarakhand 3556 1364 TOTAL 4189 2699
The consultants have captured the status of mobile ownership among beneficiaries as well as non-beneficiaries for the comparison purpose The following facts have been observed from the table above
40 percent of the farmers are having access to mobile phones The table further reveals that the maximum number of beneficiaries possessing mobile phones were in Gujarat (88) followed by Bihar (80) Sikkim (74) and Haryana (67)
This is an encouraging trend as farmers are making use of the Information and Communication Technology
Less than 27 percent of the non-beneficiaries have access to the mobile phones whereas the average of mobile holders among beneficiaries was noted to be around 42 percent
Impact Evaluation Study on ldquoNational Mission on Micro Irrigation (NMMI)rdquo
42
In may further be added here that total number of mobile users as per ldquoIndia Mobile Landscaperdquo (IML) 2013 study were 5548 crores and out of this about 298 crores (537) are 22 percent are in rural areas
Further if we analyze the overall scenario of mobile penetration it comes to about 25 percent The penetration of this technology was noted to be much higher in case of beneficiaries using mobiles
The field observations gathered from the farmers of sampled states correlates that with increase in income due to MI technologies the beneficiary farmers have started use of this technology
It shows that the different positive attributes of MI technology enabling adopters to access the technology updating themselves with the mobile technology that lead the beneficiaries towards attaining better social status due to increase of their income and purchasing power As for the availability of email IDs with the sampled farmers is concerned negligible number of farmers had this mode of communication 42 Results and Discussions 421 Quality of soil and irrigation water Irrigation with saline water through the conventional methods like flooding results in accumulation of salts in soil profile resulting in reduced availability of water to plants poor to delayed germination and slow vegetative growth rate However with the use of micro-irrigation systems (dripsprinkler) the saline water is applied frequently in lesser amounts due to which the evaporation losses of irrigation water are very less which prevents the accumulation of salts and keep their concentrations well below the harmful limit in crop root zone Thus at places where the fresh water resources are limited alternative non-conventional water resources like saline water aquifer may be exploited to feed the expansion drive for irrigation In this context the scientific use of saline water in conjunction with adaptable water use technologies has been advocated as a perfect proxy for irrigation The electrical conductivity of saline soils is gt 4 dSm and pH is gt 80 In the areas having problems of soil salinity the soil and water testing are specifically important to adopt the appropriate measures to draw full advantage of the micro irrigation system The data on extent of saline soils in the sampled states coupled with the farmers responses on getting their soils and water tested are cited in table 23 It has been documented that clogging factor in MI system is minor moderate and severe in water samples having EC values lt 080 08-31 and gt 31 dSm respectively Such values for pH have been reported to be lt70 70-80 and gt 80 (Patil 2001)
Impact Evaluation Study on ldquoNational Mission on Micro Irrigation (NMMI)rdquo
43
Table 23 Extent of Soil Salinity (in sampled states) and Beneficiaryrsquos Responses on Soil and Water Testing
State Status (000 ha)
Total Beneficiaries
Percent Response of the sample beneficiaries on
soil amp water testing Saline soils
Sodic Soil
Total Yes No
AP 7760 19661 27421 672 6146 3854 Bihar 4730 10585 15315 516 6705 3295 Chhattisgarh NA NA NA 384 6458 3542 Gujarat 168057 54143 222200 576 6927 3073 Haryana 4916 18340 23256 320 7781 2219 Karnataka 189 14814 15003 576 6910 3090 Maharashtra 18409 42267 60676 672 7336 2664 Odisha 14714 000 14714 480 6375 3625 Rajasthan 19557 17937 37494 574 7913 2087 Sikkim NA NA NA 50 5400 4600 Tamil Nadu 1323 35478 36801 455 5758 4242 UP 2199 134697 136896 527 5275 4725 Uttarakhand 000 000 000 90 7778 2222 Total 241854 347922 589776 5892 6887 3113 Source Central Soil Salinity Research Institute Karnal Haryana-20105
In the sampled states magnitude of soil salinity was noted to be highest in Gujarat followed by UP which was followed by Maharashtra and Rajasthan There is thus a strong need to launch special drives to motivate the farmers to get their soil and water samples tested This may enable them to adopt the recommended measures to prevent the clogging of emitters and enhance the crop productivity with the adoption of MI systems As per the guidelines of NMMI It is mandatory to conduct soil and water tests by MI system suppliers registered under the scheme Though about 6887 of sampled beneficiaries of all the 13 sampled states have got their soil amp water tested In Gujarat UP Maharashtra amp Rajasthan soil testing adopted by 6927 5275 7337 and 7913 of respondents respectively
It was further investigated if beneficiaries are aware about the importance of soil and water quality on the performance of the MI systems the results are presented in the table below
5Technical Bulletin CSSRIKarnal22010 Computerized Database on Salt Affected Soils in India AK Mandal RC Sharma Gurbachan Singh and JC Dagar 2010
Impact Evaluation Study on ldquoNational Mission on Micro Irrigation (NMMI)rdquo
44
Table 24 Extent of Awareness about Important Soil and Water Quality Parameters
State
Total Beneficiary
Soil quality testing Water quality testing pH EC pH EC
Yes ()
No ()
Yes ()
No ()
Yes ()
No ()
Yes ()
No ()
AP 672 238 9762 030 9970 000 10000 000 10000 Bihar 516 097 9903 058 9942 058 9942 058 9942 Chhattisgarh 384 000 10000 000 10000 000 10000 000 10000 Gujarat 576 521 9479 382 9618 434 9566 434 9566 Haryana 320 000 10000 000 10000 000 10000 000 10000 Karnataka 576 000 000 000 000 000 000 000 000 Maharashtra 672 313 9688 238 9762 283 9717 238 9762 Odisha 480 333 9667 333 9667 146 9854 146 9854 Rajasthan 574 9913 087 9913 087 9861 139 9843 157 Sikkim 50 1400 8600 000 10000 000 10000 000 10000 Tamil Nadu 455 000 000 000 000 000 000 000 000 UP 527 5275 4725 3226 6774 3529 6471 4288 5712 Uttarakhand 90 000 10000 000 10000 000 10000 000 10000 Total 5892 1599 6651 1354 6896 1368 6882 1429 6821
Source GAPL Survey
It has also been noted that farmers in most of the sampled states were not even aware of the importance of soil and water testing (Table 24)There is thus a dire need to create awareness about the importance of soil and water testing among farmers and make them aware of consequent clogging of emitters 422 Sources of Irrigation There are number of water sources in different parts of the states country such as bore well canals ponds tube wells etc from which the farmers get the irrigation water for their fields In this context information on the availability of water sources was compiled The following inferences have been drawn
Bore well is the most preferred source of water supply among the users of MI systems proportion being about 82 as may be seen from the table below
Further it may be seen that 100 percent of the farmers of Karnataka and AP have own bore wells followed by the farmers of Bihar UP Tamil Nadu Odisha Chhattisgarh Rajasthan and Gujarat The other important sources are canal well and spring water
Over 62 percent farmers of Sikkim reported to have farm ponds at their farms and remaining 38 percent from spring water which is an exception as compared to other states covered in the survey
Impact Evaluation Study on ldquoNational Mission on Micro Irrigation (NMMI)rdquo
45
It may also be inferred that more than 92 percent (bore well well and farm pond) of the beneficiaries have owned water sources which facilitates them to operate the MI systems as per the crop needs
Table 25 Source of Irrigation Water ()
State Total Beneficiary
Bore well Well Farm
Ponds Canals Bore well amp Canals
Canals amp Farm Ponds Others
AP 672 9970 000 000 000 000 000 030 Bihar 516 9845 000 019 058 078 000 000 Chhattisgarh 384 8464 000 026 000 000 000 1510 Gujarat 576 7517 2309 035 069 000 000 069 Haryana 320 4625 000 281 313 781 1406 2594 Karnataka 576 10000 000 000 000 000 000 000 Maharashtra 672 3958 5342 119 446 074 000 060 Odisha 480 9250 750 000 000 000 000 000 Rajasthan 574 7631 976 000 697 314 279 105 Sikkim 50 000 000 6200 000 000 000 3800 Tamil Nadu 455 9495 264 000 242 000 000 000 UP 527 9696 304 000 000 000 000 000 Uttarakhand 90 7667 000 000 000 000 000 2333 Total 5892 8181 1039 088 166 088 104 334 Source GAPL Survey
423 Water Table The cost of irrigation depends on the depth of the water available from the ground water sources In this regard the beneficiaries were asked to narrate the depth of the water table at their farms The pertinent data has been summarized in Table 26 which helps in the selection of appropriate capacity of the pump for smooth and efficient functioning of the system
Table 26 State wise Water Table Depth
State Total Beneficiaries
Water availability depth () 0-50 Ft 50-100 Ft 100-150 Ft 150-200 Ft 200-250 Ft gt250 Ft
AP 672 030 060 104 1845 7723 238 Bihar 516 4574 5000 426 000 000 000 Chhattisgarh 384 1198 1563 4661 1615 703 260 Gujarat 576 833 3090 1337 1424 660 2656 Haryana 320 2875 3438 1625 1000 438 625 Karnataka 576 000 538 972 1771 6493 226 Maharashtra 672 4613 2649 997 1280 357 104 Orissa 480 9792 208 000 000 000 000 Rajasthan 574 767 1760 3397 1446 348 2282 Sikkim 50 - - - - - - Tamil Nadu 455 000 1319 2396 5758 484 044 UP 527 3397 5028 1480 076 019 000 Uttarakhand 90 889 2444 667 000 778 5222 Total 5892 2436 2167 1439 1421 1775 677
Note The beneficiaries of Sikkim are not aware of the depth of water availability Source GAPL Survey
Impact Evaluation Study on ldquoNational Mission on Micro Irrigation (NMMI)rdquo
46
424 Sources of Awareness about NMMI Scheme The Table 27 shows that the mix trend among the farmers and the major sources of awareness was through fellow farmers service providers suppliers extension workers etc The highest proportion of awareness revealed in Chhattisgarh was through fellow farmers in Uttarakhand UP and Sikkim through extension workers It is interesting to note that the suppliersrepresentatives of the manufacturers are the major sources of awareness to the beneficiaries This may be due to the reason that the supplier of the system have their own interest in this competitive trade and motivate as well as facilitate the farmers in applying for the benefit
Impact Evaluation Study on ldquoNational Mission on Micro Irrigation (NMMI)rdquo
47
Table 27 Sources of Awareness Reported by Beneficiaries ()
State Total
Beneficiaries Fellow
Farmers Radio Newspaper TV Pamphlet
Extension worker
Supplier Fellow
Farmers amp Supplier
Fellow Farmers amp Extension
worker
Fellow Farmers amp Newspaper
Extension worker amp Supplier
Others
AP 672 2664 000 015 060 030 2217 4628 149 149 000 089 000 Bihar 516 2597 000 019 000 000 562 3450 1667 407 000 155 1143 Chhattisgarh 384 5365 000 000 000 000 130 3411 859 078 000 052 104 Gujarat 576 2153 000 122 156 069 226 1563 3941 694 226 035 816 Haryana 320 1813 094 000 000 000 6938 531 125 250 094 000 156 Karnataka 576 2396 017 017 017 000 069 1684 3663 694 1111 278 052 Maharashtra 672 2515 045 119 045 000 908 2247 3051 551 253 164 104 Orissa 480 2479 021 250 146 000 208 2021 3479 583 354 333 125 Rajasthan 574 3136 000 122 017 105 2596 3972 017 000 017 000 017 Sikkim 50 1600 000 000 000 000 4000 200 1200 1400 1000 000 600 Tamil Nadu 455 1516 154 000 000 000 088 1582 3934 703 1407 242 374 UP 527 2220 000 000 000 000 5674 1727 228 057 019 019 057 Uttarakhand 90 889 444 333 000 222 5444 1889 000 111 000 000 667 Total 5892 2561 032 068 042 024 1721 2514 1937 390 314 124 273
Note Other source of awareness includes multiple sources of different combinations Source GAPL Survey
Impact Evaluation Study on ldquoNational Mission on Micro Irrigation (NMMI)rdquo
48
Following the same pattern of the sources of awareness for beneficiary farmers the same was asked from the non-beneficiary farmers and their responses are summarized in the Table 28
Almost 1149 non adopters out of sampled 1508 are aware about the scheme that is about 76 percent It may be seen from the following table that the major sources of awareness for no adopters are other farmers suppliers and extension workers It may also be seen here that the awareness in most of the states is more than 70 percent except for Uttarakhand Rajasthan and Gujarat
Table 28 Source of Awareness of Scheme Reported by Non-beneficiary ()
State Total Beneficiaries
Other Farmers Radio Newspaper TV Extension
worker Supplier
Other Farmers
and Supplier
Other Farmers amp Newspaper
Others
AP 116 4655 172 690 086 1207 1638 517 431 603 Bihar 95 5684 000 000 000 526 2632 947 211 000 Chhattisgarh 53 9434 000 000 000 000 189 000 189 189 Gujarat 95 4737 105 000 105 000 316 3368 421 947 Haryana 69 7971 000 000 000 1014 435 290 290 000 Karnataka 126 5794 000 000 000 000 397 2381 1349 079 Maharashtra 154 5000 065 195 065 584 1429 1883 584 195 Odisha 98 4898 000 102 000 204 714 2551 1122 408 Rajasthan 95 6632 000 316 000 947 2000 105 000 000 Sikkim 10 5000 000 000 000 000 2000 3000 000 000 Tamil Nadu 106 3774 000 000 000 000 1226 2642 2358 000 UP 120 7583 000 000 167 1917 083 250 000 000 Uttarakhand 12 000 000 000 000 5000 5000 000 000 000 Total 1149 5701 035 131 044 653 1097 1462 661 218
Note The total number of non-beneficiaries in the above table is only those who are aware about the NMMI scheme Source GAPL Survey
425 Reasons for Non-adoption of Micro Irrigation Systems
The non-beneficiaries farmers were further asked the reasons for not adopting this technology Table 29 reveals following mix responses such as
Lack of awareness regarding subsidies lack of technical knowledge high capital cost and system is not required perception that the system is not economical therefore not required for the cropping pattern adopted by them
The 50 percent farmers from Sikkim reported that they have applied for the benefit but have not received the sanction so far
The farmers of Sikkim (50) Tamil Nadu (30) Odisha amp Rajasthan (23) and Karnataka (20) also reported that they have applied for the grant of subsidy for the installation of the system but have yet to receive the sanction
Impact Evaluation Study on ldquoNational Mission on Micro Irrigation (NMMI)rdquo
49
Table 29 Reasons for Non-adoption of NMMI Scheme ()
State Total non-Beneficiaries
Less awareness
about subsidy
Lack of technical
knowledge
Lengthy procedure
High capital
cost
Application pending
for clearance
Not required
Less awareness
about subsidy amp technical
knowledge
Less awareness
about subsidy amp
Lengthy procedure
Others
AP 168 595 536 000 3036 536 060 1964 179 3095 Bihar 128 938 2266 156 1250 938 313 1328 234 2578 Chhattisgarh 96 208 208 000 4479 000 000 625 000 4479 Gujarat 144 139 278 069 3889 1042 208 069 903 3403 Haryana 81 1975 000 000 1975 000 741 3827 000 1481 Karnataka 144 1875 2014 1944 2222 1944 000 000 000 000 Maharashtra 169 237 1124 059 3846 2367 118 769 592 888 Odisha 120 167 2250 000 3167 2333 000 083 167 1833 Rajasthan 138 1087 1232 145 2029 072 000 1957 362 3116 Sikkim 10 000 4000 000 000 5000 1000 000 000 000 Tamil Nadu 120 1000 2917 1583 1500 3000 000 000 000 000 UP 168 595 119 000 2679 060 179 3333 179 2857 Uttarakhand 22 909 000 909 455 909 000 000 2273 4545 Total 1508 756 1174 365 2712 1174 133 1227 292 2168
Source GAPL Survey 426 Willingness of Non Beneficiaries to Adopt MI System
In order to understand willingness of the non-beneficiary farmers for installation of micro irrigation system in their farms a specific question was raised during interviews The responses have been compiled in the following table which shows that more than three-fourth of the farmers of all the states are willing to install micro irrigation systems except in case of Chhattisgarh where more than half of the respondents reported that they are not willing to adopt the system This response shows that when awareness of the benefits of micro irrigation systems is created (it seems during the interview respondents realized the advantages) most non-beneficiaries indicated their willingness to adopt MI
Table 30 Willingness of Non-beneficiaries to Install MI System ()
State Total Non-Beneficiaries
Response in Percent Yes No
AP 168 9762 238 Bihar 128 9922 078 Chhattisgarh 96 4583 5417 Gujarat 144 7708 2292 Haryana 81 9136 864 Karnataka 144 9792 208 Maharashtra 169 9704 296 Odisha 120 9667 333 Rajasthan 138 9203 797 Sikkim 10 8000 2000 Tamil Nadu 120 8917 1083 UP 168 8036 1964 Uttarakhand 22 9545 455
Source GAPL Survey
Impact Evaluation Study on ldquoNational Mission on Micro Irrigation (NMMI)rdquo
50
427 Progress of Installation of MI System The sampled beneficiaries were asked when they installed the system in their respective fields The results are presented in the following table
Table 31 Year of Installation of MI System ()
States 2005-06 2006-07 2007-08 2008-09 2009-10 2010-11 2011-12 2012-13 AP 104 149 060 521 1667 3170 3080 1250 Bihar NA NA NA NA 329 1860 7287 523 Chhattisgarh NA 911 2188 1458 859 2578 1979 026 Gujarat 017 191 903 1146 1233 2465 3733 313 Haryana NA 469 969 813 969 2031 4750 NA Karnataka NA 382 938 1406 1719 1476 2951 1128 Maharashtra NA 699 595 1205 2396 2857 2158 089 Odisha NA 354 396 854 1125 1333 4271 1667 Rajasthan NA 505 540 575 836 2509 4808 226 Sikkim NA NA NA NA NA NA 7400 2600 UP NA 1575 1973 474 1120 702 3510 645 Uttarakhand NA NA NA NA NA NA 2889 7111 Tamil Nadu NA NA 088 2264 879 2044 2330 2396
Source GAPL Survey
The above table reveals that in the beginning of the scheme the response was slow and gradually picked up The momentum of adoption got accelerated after the up gradation of the scheme into the mission mode in 2010 428 Average Cost of Installing the MI System The state wise average system costs as reported by the respondents have been compiled in the table below
Table 32 Average Cost of Installing MI System (Rsha)
State Drip Sprinkler
AP 61474 20572 Bihar 61109 21380 Chhattisgarh 68797 25418 Gujarat 72086 26390 Haryana 66355 25699 Karnataka 59452 27062 Maharashtra 60531 21102 Odisha 54457 20860 Rajasthan 63258 28171 Sikkim 59654 22143 Tamil Nadu 60676 24450 UP 61766 20481 Uttarakhand 59373 25932
Source GAPL Survey
Impact Evaluation Study on ldquoNational Mission on Micro Irrigation (NMMI)rdquo
51
The following facts may be observed by analyzing the responses of sampled beneficiaries
On an average the cost of system incurred by the beneficiaries of various states ranged between Rs 5445736 Rsha to Rs 7208631 Rsha for drip system depending on the crop type spacing material components used etc
As per the NMMI guidelines the indicative cost for installation of drip system for
wide space crops varies from Rs 18820 to Rs 63598 per hectare whereas for close space crops it falls in the range of Rs 74437 to Rs 97598 per hectare
Comparatively high cost incurred by the sampled farmers in Gujarat is probably attributed to the fact that more area under drip is occupied by close spaced (0-10 m2 spacing) crops Detailed analysis of higher average cost of drip in Gujarat is given in annexure IV The average cost of sprinkler in the sampled states varied between Rs 20481 to Rs 28171per hectare which falls near the specified indicative cost of overhead sprinkler systems
429 Factors Influencing Farmers to Adopt MI system To validate the outcome of the slated objectives of the scheme the beneficiaries were asked to give the reasons for adoption of the scheme and the same are presented in the following table
Table 33 Reasons for Adoption of Micro Irrigation Systems ()
State Total Beneficiaries
Because of
Subsidy
Quality of
Produce
Water Saving
Proper Utilization
of Land
Labor Saving
Time Saving
Fertilizer Saving
Early Fruiting
Higher Production
AP 672 2113 1622 5298 2917 3333 5744 2054 1637 1295 Bihar 516 2054 1143 9012 1415 4089 9244 2500 116 3779 Chhattisgarh 384 599 651 9766 1693 2370 8464 4063 1667 7083 Gujarat 576 3524 1667 8090 938 5486 2118 3507 052 2969 Haryana 320 9813 5938 9969 5719 9313 9656 9563 4281 8500 Karnataka 576 469 712 8455 2396 6719 5434 3715 434 2292 Maharashtra 672 3006 1042 7589 1458 4375 4524 2813 699 2113 Odisha 480 1229 667 7813 1938 3896 4896 1854 458 4438 Rajasthan 574 523 1359 7735 2979 4843 3066 1969 557 244 Sikkim 50 000 800 9600 4400 7200 5000 4400 600 1800 Tamil Nadu 455 1319 1297 7121 2000 5099 6571 4308 462 2308 UP 527 5617 3435 8235 3416 7002 6983 5977 2732 5617 Uttarakhand 90 3111 1222 5111 556 111 000 3000 000 6667 Total 5892 2529 1621 7890 2323 4963 5667 3557 1042 3340
Note Multiple Responses have been given to this question
It may be seen from the above table that in all nine reasons were revealed by the farmers for adopting the scheme which include (a) water saving (b) time saving (c) labor saving (d) fertilizer saving (e) higher production (f) because of subsidy (g) proper utilization of land (h) quality of produce and (i) early fruiting
Impact Evaluation Study on ldquoNational Mission on Micro Irrigation (NMMI)rdquo
52
It may further be observed that majority of the farmers reported that due to MI system they are able to save the water time and labor It is also revealed that the farmers are not installing the system because of subsidy only but also on account of other benefits In Haryana (98) ampUP (56) farmers have installed MI system due to the subsidy It is therefore concluded from here that higher amount of subsidy is not leading to more area under micro irrigation but it is due to other reasons such as reduction in cost of cultivation and higher production because of judicious use of irrigation as well as shifting towards high value income crops 4210 Subsidy Disbursement As per the operational guidelines of NMMI scheme the system in the beneficiariesrsquo field should be installed within sixty days from the date of filing the application Similarly the amount of subsidy should also be released to the suppliers service providers within 60 days Most of the farmers of Chhattisgarh (96) followed by Haryana Karnataka Tamil Nadu and Sikkim have reported that their applications are processed in less than 20 days and more than 90 percent of the farmers across states have reported that they got the sanction letter less than 40 days Only in case of Uttarakhand 50 percent of the farmers reported they got sanction after 100 days which resulted mainly due to the delayed receipt of money from the concerned quarters The following table further reveals that the 97 percent of the farmers of Bihar followed by Chhattisgarh (90) Haryana (85) amp Karnataka (78) and about 70 percent of the farmers of Odisha and Sikkim got their system installed in less than 20 days About 60 percent of Gujarat farmers 50 percent of Maharashtra followed by Tamil Nadu (48) and AP (45) reported that they got their system installed in 20-40 days
Table 34 Farmerrsquos Responses for Time Taken to Sanction Subsidy ()
State Total Beneficiary
Application to Sanction(Days) Sanction to installation (Days)
0-20 20-40 40-60 60-80 80-100 gt100 0-20 20-40 40-60 60-80 80-100 gt100 AP 672 5342 4583 074 000 000 000 4955 4524 506 000 000 015 Bihar 516 5252 4128 388 174 058 000 9690 291 000 019 000 000 Chhattisgarh 384 9583 417 000 000 000 000 8984 911 078 000 000 026 Gujarat 576 4878 4826 243 052 000 000 3281 6024 434 174 000 087 Haryana 320 9000 750 000 156 094 000 8469 1344 000 188 000 000 Karnataka 576 8559 1441 000 000 000 000 7830 1597 556 000 000 017 Maharashtra 672 4628 5372 000 000 000 000 4807 4926 253 015 000 000 Odisha 480 6229 3417 229 125 000 000 7104 2854 021 021 000 000 Rajasthan 574 5610 4338 052 000 000 000 5035 4669 244 052 000 000 Sikkim 50 6600 3400 000 000 000 000 7200 2800 000 000 000 000 Tamil Nadu 455 7385 2527 088 000 000 000 4593 4791 505 110 000 000 UP 527 4858 5047 076 000 000 019 2543 4269 1139 1537 285 228 Uttarakhand 90 000 222 667 1333 2333 5444 444 1111 6111 2333 000 000 Total 5892 6139 3557 114 059 046 085 5813 3461 448 219 025 034
Source GAPL survey
Impact Evaluation Study on ldquoNational Mission on Micro Irrigation (NMMI)rdquo
53
4211 Sources of Margin Money The contribution of the cost of MI system has to be borne by the farmers depending on the quantum of the subsidy available It was observed that in almost all the states beneficiary farmers contribute their own funds for contributing margin money Other sources albeit a small proportion constitutes banking KCC amp money lenders It may be seen from the following table that a very few beneficiaries have availed the bank loan for margin money
Table 35 Source of Finance for Meeting Beneficiary Share for Installation of MI System
State Total
Beneficiary
Source of Beneficiary Share of MI ()
Own sources
Bank KCC Money Lenders
AP 672 9807 000 104 089 Bihar 516 10000 000 000 000 Chhattisgarh 384 10000 000 000 000 Gujarat 576 9583 417 000 000 Haryana 320 9344 031 438 063 Karnataka 576 10000 000 000 000 Maharashtra 672 9911 060 030 000 Odisha 480 9979 000 021 000 Rajasthan 574 10000 000 000 000 Sikkim 50 10000 000 000 000 Tamil Nadu 455 10000 000 000 000 UP 527 9734 000 133 133 Uttarakhand 90 10000 000 000 000 Total 5892 9866 049 053 025
Source GAPL Survey
4212 Interest Rates on Borrowing
The number of beneficiaries who borrowed funds from different sources was less than 2 percent and only 049 percent borrowed from banks as stated above The beneficiaries borrowed money from various sources on differential rates of interest and their responses have been summarized in the following table which reveals that most of the farmers who borrowed money at less than 10 percent of rate of interest from banks amp KCCs
Impact Evaluation Study on ldquoNational Mission on Micro Irrigation (NMMI)rdquo
54
Table 36 Rate of Interest Paid by the Beneficiaries on Borrowed Funds
State No of Beneficiaries
10 amp less 10-12 12-15 gt15 AP 13 0 0 0 Bihar 0 0 0 0 Chhattisgarh 0 0 0 0 Gujarat 4 16 4 0 Haryana 14 3 2 1 Karnataka 0 0 0 0 Maharashtra 4 1 1 0 Odisha 1 0 0 0 Rajasthan 0 0 0 0 Sikkim 0 0 0 0 Tamil Nadu 0 0 0 0 UP 14 0 0 0 Uttarakhand 0 0 0 0 Total 50 20 7 1
4213 Type of MI system and Area Coverage 42131 Technology wise area coverage The emitting devices (inline or online emitters) are designed to discharge water at prescribed rates depending on the specific requirements of various crops In the sprinkler irrigation system water is discharge under pressure in the air through a set of nozzles attached to a network of high density polyethylene (HDPE) pipes simulating rainfall and are suitable where the plant density is very high It is widely used in field crops The sprinkler irrigation system may be portable semi-permanent or large systems (Rain guns) The cost of all the system varies across the states
Table 37 Proportion of Farmers having Drip and Sprinkler MI Systems
State Total No of Beneficiaries
Drip Sprinkler Both AP 672 499 7426 166 2470 7 104 Bihar 516 6 116 450 821 60 1163 Chhattisgarh 384 152 3958 227 5911 5 130 Gujarat 576 452 7847 115 1997 9 156 Haryana 320 228 7125 82 2563 10 313 Karnataka 576 571 9913 4 069 1 017 Maharashtra 672 589 8765 72 1071 11 164 Odisha 480 114 2375 349 7271 17 354 Rajasthan 574 354 6167 216 3763 4 070 Sikkim 50 40 8000 9 1800 1 200 Tamil Nadu 455 385 8462 69 1516 1 022 UP 527 311 5901 214 4061 2 038 Uttarakhand 90 58 6444 32 3556 0 000 Grand Total 5892 3759 6380 2005 3403 128 217
Source GAPL Survey
Impact Evaluation Study on ldquoNational Mission on Micro Irrigation (NMMI)rdquo
55
The data on area coverage under drip and sprinkler irrigation system with the beneficiary farmers in the sampled states are cited in Table 37 It is evident that drip system is more popular than sprinkler in most of the states under study The data documents that on and average area coverage under drip was about to 64 34 sprinkler and about 2 of the beneficiaries have reported both the system The respective area coverage under drip in Karnataka Tamil Nadu Sikkim AP Gujarat and Maharashtra reported more than 75 area under drip However in case of sprinkler irrigation system Bihar registered highest area under the system followed by Odisha and Chhattisgarh The inference may be drawn here that the technology wise area coverage is shifting more towards the horticulture crops and less for the field crops
Table 38 Drip amp Sprinkler System wise Area Coverage by Sampled Beneficiaries
Technology wise area coverage (ha)
State Total Area
under MI
Area under Drip
Area under Drip
Area under Sprinkler
Area under Sprinkler
AP 72431 54869 7575 17562 2425 Bihar 78034 7357 943 70676 9057 Chhattisgarh 67933 27161 3998 40773 6002 Gujarat 120259 87156 7247 33103 2753 Haryana 64800 53741 8293 11058 1707 Karnataka 76113 76113 10000 000 000 Maharashtra 86433 76210 8817 10222 1183 Odisha 85221 29212 3428 56009 6572 Rajasthan 67101 58554 8726 8546 1274 Sikkim 3132 2728 8708 405 1292 Tamil Nadu 53953 47468 8798 6485 1202 UP 81932 55069 6721 26864 3279 Uttarakhand 8347 7021 8412 1325 1588
Source GAPL Survey 42132 The Crop wise Area Coverage The crop wise area coverage was computed from the total area under drip and sprinkler irrigation system the pertinent results are enumerated in table below Andhra Pradesh
In the state of AP major fruit crops under drip system were noted to be mango citrus and banana which covered around 5491 of total area under drip Among vegetable crops brinjal chilli and tomato occupied comparatively higher area under drip than other vegetable crops Vegetables occupied around 3424 area under drip Flower maize and sugarcane covered around 1085 of area under drip irrigation with sampled beneficiaries Out of total area under MI in AP 2424 of the area was noted under sprinkler system About 4406 of area under sprinkler was occupied by vegetable crops whereas other
Impact Evaluation Study on ldquoNational Mission on Micro Irrigation (NMMI)rdquo
56
crops such as cotton maize and ground nut consists of about 5594 of the total area under sprinkler
Table 39 Crop wise Area Coverage under Drip and Sprinkler Systems in AP (Sampled Beneficiaries)
Drip Fruit Vegetable Other Crop
Name Area(ha) of Area Name Area(ha) of Area Name Area(ha) of Area Mango 7885 1437 Brinjal 9552 1741 Flower 096 017 Banana 4898 893 Chilli 3524 642 Maize 2268 413 Citrus Fruits
14379 2621 Tomato 3293 600 Sugarcane 1346 245
Others 2964 540 Others 2420 441 Pulses 933 170 Cotton 455 083 Other 857 156 Total 30126 5491 18789 3423 5954 914
Sprinkler Name Area(ha) of Area Name Area(ha) of Area Brinjal 3219 1833 Groundnut 2550 1452 Chilli 1550 883 Cotton 4249 2420 Okra 1230 701 Maize 911 518 Tomato 1738 990 Other 2115 1204 Total 7738 4406 9824 5594
Source GAPL Primary Survey 2013 Bihar
In the state of Bihar major fruit crops under drip system were noted to be mango which covered around 60 of total area under drip Among vegetable crops Okra and potato have occupied comparatively higher area under drip than other vegetable crops Vegetables occupied around 34 area under drip Sugarcane has covered around 275 of area under drip irrigation with sampled beneficiaries
Table 40 Crop wise Area Coverage under Drip and Sprinkler Systems in Bihar (Sampled Beneficiaries)
Drip Fruit Vegetable Other Crop
Name Area (Ha) of Area Name Area (Ha) of Area Name Area (Ha) of Area Mango 4383 5957 Potato 834 1133 Marigold 040 055 Litchi 093 127 Okra 931 1265 Sugarcane 202 275 Kadam 061 083 Others Crop 732 996 Others 081 110 Total 4618 6276 2497 3394 243 330
Sprinkler Name Area (Ha) of Area Name Area (Ha) of Area Name Area (Ha) of Area Blackberry 121 017 Potato 11251 1592 Wheat 13533 1915 Brinjal 2408 341 Sugarcane 10846 1535 Cauliflower 2311 327 Maize 16475 2331 Okra 1801 255 Menthol 2137 302 Tomato 1740 246 Other Crop 6160 872 Others Crop 1894 268 Total 121 017 21404 3028 49151 6954 Source GAPL Primary Survey 2013
Impact Evaluation Study on ldquoNational Mission on Micro Irrigation (NMMI)rdquo
57
Chhattisgarh
In the state of Chhattisgarh major fruit crops under drip system were noted to be banana Papaya and watermelon which covered around 345 of total area under drip Among vegetable crops Cucumber brinjal tomato and bitter gourd occupied comparatively higher area under drip than other vegetable crops Vegetables occupied around 9655 area under drip Out of total area under MI in Chhattisgarh 3998 of the area was noted under sprinkler system About 2562 of area under sprinkler was occupied by vegetable crops whereas other crops such as wheat gram and soybean consist of about 7438 of the total area
Table 41 Crop wise Area Coverage under Drip and Sprinkler Systems in Chhattisgarh (Sampled Beneficiaries)
Drip Sprinkler Fruit Vegetable Vegetable Other Crop
Name Area (ha)
of Area Name Area(ha) of
Area Name Area (ha)
of Area Name Area
(ha) of Area
Banana 340 125 Tomato 6462 2379 Okra 2865 703 Wheat 9348 2293 Papaya 374 138 Cucumber 3887 1431 Tomato 3115 764 Pulses 9576 2349 Watermelon 223 082 Brinjal 2414 889 Bottle Gourd 1319 324 Other
Crop 11402 2796
Bitter Gourd 3416 1258 Others Crop 3148 772 Others Crop 10045 3698 Total 937 345 26224 9655 10447 2562 30325 7438
Source GAPL Primary Survey 2013 Gujarat
In the state of Gujarat major fruit crops under drip system were noted to be banana Papaya and pomegranate which covered around 1225 of total area under drip Among vegetable crops Chili tomato potato and onion occupied comparatively higher area under drip than other vegetable crops Vegetables occupied around 1636 area under drip Flower cotton sugarcane and caster covered around 7139 of area under drip irrigation with sampled beneficiaries Out of total area under MI in Gujarat 2752 of the area was noted under sprinkler system About 2574 of area under sprinkler was occupied by fruits and vegetable crops whereas other crops such as flower cotton groundnut and caster consist of about 7427 of the total area
Impact Evaluation Study on ldquoNational Mission on Micro Irrigation (NMMI)rdquo
58
Table 42 Crop wise Area Coverage under Drip and Sprinkler Systems in Gujarat (Sampled Beneficiaries)
Drip Fruit Vegetable Other Crop
Name Area(ha) of Area Name Area(ha) of Area Name Area(ha) of Area Banana 6303 723 Chilli 5274 605 Flower 020 002 Papaya 1113 128 Tomato 3337 383 Caster 6414 736 Pomegranate 1072 123 Potato 2113 242 Cotton 49859 5721 Others 2185 251 Onion 2408 276 Sugarcane 1417 163 Others Crop 1129 130 Other Crop 4512 518 Total 10674 1225 14260 1636 62222 7139
Sprinkler Name Area(ha) of Area Name Area(ha) of Area Name Area(ha) of Area
Pomegranate 890 269 Potato 6322 1910 Flower 182 055 Water Melon 101 031 Others Crop 1204 364 Cotton 5099 1540 Ground nut 4800 1450 Caster 3217 972 Bajra 5783 1747 Other Crop 5503 1662 Total 992 300 7526 2274 24585 7427
Source GAPL Primary Survey 2013 Haryana
In the state of Haryana major fruit crops under drip system were noted to be Kinnow lemon strawberry and watermelon which covered around 7771 of total area under drip Among vegetable crops tomato potato and cucumber occupied comparatively higher area under drip than other vegetable crops Vegetables occupied around 1905 area under drip Flower and cotton covered around 324 and 396 of area respectively under drip irrigation with sampled beneficiaries Out of total area under MI in Haryana 1706 of the area was noted under sprinkler system About 9250 of area under sprinkler was occupied by fruits and vegetable crops whereas other crops such as cotton and wheat consist of about 750 of the total area under sprinkler
Table 43 Crop wise Area Coverage under Drip and Sprinkler Systems in Haryana (Sampled Beneficiaries) Drip
Fruit Vegetable Other Crop Name Area(ha) of Area Name Area(ha) of Area Name Area(ha) of Area Kinnow 36321 6759 Tomato 2408 448 Flower 344 064 Lemon 1781 331 Cucumber 1568 292 Cotton 1396 260 Water Melon 1396 260 Potato 2355 438 Strawberry 1012 188 Others Crop 3905 727 Other Crops 1255 233 Total 41764 7771 10237 1905 1740 324
Sprinkler Name Area(ha) of Area Name Area(ha) of Area Name Area(ha) of Area Musk Melon 283 256 Tomato 3693 3339 Cotton 364 329 Water Melon 152 137 Potato 1194 1080 Wheat 465 421 Chilli 1113 1006 Others Crop 3794 3431 Total 435 393 9794 8856 830 750
Source GAPL Primary Survey 2013
Impact Evaluation Study on ldquoNational Mission on Micro Irrigation (NMMI)rdquo
59
Karnataka
In the state of Karnataka major fruit crops under drip system were noted to be banana areca nut pomegranate and mango which covered around 8425 of total area under drip Among vegetable crops tomato chilli and ginger occupied comparatively higher area under drip than other vegetable crops Vegetables occupied around 1161 area under drip Turmeric Pepper and others crops covered around 1396 1331 and 425 of area under drip irrigation with sampled beneficiaries Table 44 Crop wise Area Coverage under Drip and Sprinkler Systems in Karnataka (Sampled Beneficiaries)
Drip Fruit Vegetable Other Crop
Name Area (Ha)
of Area
Name Area (Ha)
of Area
Name Area (Ha)
of Area
Banana 26716 3510 Tomato 3790 498 Turmeric 1396 183 Pomegranate 7684 1010 Chilli 2252 296 Pepper 1331 175 Areca nut 8503 1117 Ginger 1076 141 Other Crop 425 056 Mango 5704 749 Others Crop 1718 226 Others 15516 2039 Total 64124 8425 8837 1161 3153 414 Source GAPL Primary Survey 2013
Maharashtra
In the state of Maharashtra major fruit crops under drip system were noted to be banana mango citrus fruits and grapes which covered around 4283 of total area under drip Among vegetable crops tomato brinjal and chili occupied comparatively higher area under drip than other vegetable crops Vegetables occupied around 757 area under drip Flower sugarcane cotton and other crops covered around 061 2012 2697 and 190 of area under drip irrigation with sampled beneficiaries Under sprinkler system about 158 of area occupied by vegetable crops whereas other crops such as flower cotton ground nut black gram and soybean consist of about 9842 of the total area
Table 45 Crop wise Area Coverage under Drip and Sprinkler Systems in Maharashtra (Sampled Beneficiaries)
Drip Sprinkler Fruit Vegetable Other Crop Vegetable Other Crop
Name Area (Ha)
of Area Name Area
(Ha) of Area Name Area
(Ha) of Area Name Area
(Ha) of Area Name Area
(Ha) of Area
Banana 12043 1580 Brinjal 2590 340 Flower 465 061 Brinjal 051 049 Flower 081 079 Mango 7838 1028 Tomato 1718 225 Cotton 20553 2697 Peas 040 040 Cotton 3497 3421 Grapes 587 077 Chilli 1055 138 Sugarcane 15334 2012 Tomato 071 069 Soybean 2929 2865 Citrus Fruits
4110 539 Others 405 053 Other Crop 1446 190 Ground nut
946 925
Others 8066 1058 Black Gram
1384 1354
Others 1224 1198 Total 32643 4283 5768 757 37799 4960 162 158 10060 9842
Source GAPL Primary Survey 2013
Impact Evaluation Study on ldquoNational Mission on Micro Irrigation (NMMI)rdquo
60
Odisha
In the state of Odisha major fruit crops under drip system were noted to be mango banana and cashew nut which covered around 7090 of total area under drip Among vegetable crops tomato brinjal and Okra occupied comparatively higher area under drip than other vegetable crops Vegetables occupied around 2515 area under drip Flower moong and sugarcane covered around 395 of area under drip irrigation with sampled beneficiaries Under sprinkler system about 8741 of area was occupied by fruits and vegetable crops whereas other crops such as moong maize sugarcane and others crop consist of about 455 148 217 and 439 of the total area
Table 46 Crop wise Area Coverage under Drip and Sprinkler Systems in Odisha (Sampled Beneficiaries)
Drip Fruit Vegetable Other Crop
Name Area (Ha) of Area Name Area (Ha) of Area Name Area (Ha) of Area Mango 8771 3002 Tomato 1803 617 Flower 121 042 Banana 3602 1233 Brinjal 1497 513 Moong 364 125 Cashew nut 2165 741 Okra 1042 357 Sugarcane 202 069 Others 6174 2113 Others Crop 3005 1029 Other Crop 465 159 Total 20711 7090 7347 2515 1153 395
Sprinkler Name Area (Ha) of Area Name Area (Ha) of Area Name Area (Ha) of Area
Pineapple 182 033 Brinjal 10350 1848 Moong 2550 455 Watermelon 324 058 Tomato 9410 1680 Maize 830 148 Okra 6297 1124 Sugarcane 1214 217 Cauliflower 5585 997 Other Crop 2459 439 Others Crop 16809 3001 Total 506 090 48451 8651 7052 1259
Source GAPL Primary Survey 2013
Rajasthan
In the state of Rajasthan major fruit crops under drip system were noted to be kinnow orange and mango which covered around 43 of total area under drip Among vegetable crops onion carrot and tomato occupied comparatively higher area under drip than other vegetable crops Vegetables occupied around 24 area under drip Flower cotton arandi and guar covered around 32 of area under drip irrigation with sampled beneficiaries Out of total area under MI in Rajasthan more of the area was noted under sprinkler system About 56 of area under sprinkler was occupied by fruits and vegetable crops whereas other crops such as flower wheat Mustard and cotton consist of about 44 of the total area
Impact Evaluation Study on ldquoNational Mission on Micro Irrigation (NMMI)rdquo
61
Table 47 Crop wise area Coverage under Drip and Sprinkler Systems in Rajasthan (Sampled Beneficiaries)
Drip Fruit Vegetable Other Crop
Name Area of Area Name Area of Area Name Area of Area Kinnow 6523 1114 Onion 5315 908 Flower 656 112 Orange 13019 2223 Tomato 2832 484 Cotton 11881 2029 Lemon 1854 317 Cauliflower 1510 258 Arandi 1730 295 Mango 1017 174 Others Crop 4396 751 Guwar 1463 250 Other Crops 3149 538 Other Crop 3209 548 Total 25563 4366 14052 2400 18939 3234
Sprinkler Name Area of Area Name Area of Area Name Area of Area Lemon 202 237 Carrot 3954 4626 Mustard 2488 2912 Others Crop 623 729 Wheat 647 757 Other Crop 631 739 Total 202 237 4577 5356 3767 4407 Source GAPL Primary Survey 2013
Sikkim
In the state of Sikkim major fruit crops under drip system were noted to be orange and guava which covered around 41 of total area under drip Among vegetable crops tomato and brinjal occupied comparatively higher area under drip than other vegetable crops Vegetables occupied around 42 area under drip Wheat and mustard covered around 313 of area under drip irrigation with sampled beneficiaries Out of total area under MI in About 70 of area under sprinkler was occupied by the vegetable crops whereas other crops such as wheat and turmeric consist of about 30 of the total area Table 48 Crop wise Area Coverage under Drip and Sprinkler Systems in Sikkim (Sampled Beneficiaries)
Drip Fruit Vegetable Other Crop
Name Area (Ha)
of Area Name Area
(Ha) of Area Name Area
(Ha) of Area
Orange 939 3442 Tomato 555 2036 Large Cardamom
142 519
Guava 182 668 Brinjal 263 964 Turmeric 243 890 Other Crop 333 1220 Other Crop 071 260 Total 1121 4110 1151 4221 455 1669
Sprinkler
Name Area of Area Name
Area (Ha)
of Area Name
Area (Ha)
of Area
Tomato 081 2000 Turmeric 081 2000 Cauliflower 081 2000 Other Crop 040 1000 Barackoli 081 2000 Others Crop 040 1000 Total 283 7000 121 3000 Source GAPL Primary Survey 2013
Impact Evaluation Study on ldquoNational Mission on Micro Irrigation (NMMI)rdquo
62
Tamil Nadu
In the state of Tamil Nadu major fruit crops under drip system were noted to be banana tapioca coconut and aonla which covered around 5528 of total area under drip Among vegetable crops tomato chili and brinjal occupied comparatively higher area under drip than other vegetable crops Vegetables occupied around 1780 area under drip Turmeric and sugarcane covered around 2692 of area under drip irrigation with sampled beneficiaries Out of total area under MI in Tamil Nadu 1202 of the area was noted under sprinkler system About 9923 of area under sprinkler was occupied by fruits and vegetable crops whereas other crops such as turmeric consist of about 078 of the total area Table 49 Crop wise Area Coverage under Drip and Sprinkler Systems in Tamil Nadu (Sampled Beneficiaries)
Drip Fruit Vegetable Other Crop
Name Area (Ha) of Area Name Area (Ha) of Area Name Area (Ha) of Area Banana 7875 1659 Chilli 2025 427 Turmeric 9501 2002 Tapioca 4994 1052 Brinjal 1720 362 Sugarcane 3278 691 Coconut 4953 1044 Tomato 1761 371 000 Aonla 3458 728 Others Crop 2944 620 Others Crop 4958 1045 Total 26238 5528 8451 1780 12779 2692
Sprinkler Name Area (Ha) of Area Name Area (Ha) of Area Name Area (Ha) of Area Carrot 081 125 Chilli 3197 4930 Turmeric 051 078 Potato 1740 2683 Carrot 1234 1903 Others Crop 182 281 Total 081 125 6354 9797 051 078 Source GAPL Primary Survey 2013 Uttar Pradesh In the state of UP major fruit crops under drip system were noted to be banana mango and guava which covered around 81 of total area under drip Among vegetable crops tomato potato and chili occupied comparatively higher area under drip than other vegetable crops Vegetables occupied around 19 area under drip Maize wheat and other crops covered around 144 of area under drip irrigation with sampled beneficiaries Out of total area under MI in UP about one-third of the area was noted under sprinkler system About 88 of area under sprinkler was occupied by fruits and vegetable crops whereas other crops such as wheat consist of about 12 of the total area
Impact Evaluation Study on ldquoNational Mission on Micro Irrigation (NMMI)rdquo
63
Table 50 Crop wise Area Coverage under Drip and Sprinkler Systems in UP (Sampled Beneficiaries)
Drip Fruit Vegetable Other Crop
Name Area of Area Name Area of Area Name Area of Area Banana 13173 2392 Potato 2752 500 Maize 263 048 Guava 12363 2245 Tomato 2863 520 Sunflower 020 004 Mango 16431 2984 Chilli 1295 235 Litchi 1538 279 Cabbage 911 165 Others Crop 951 173 Others Crop 2509 456 Total 44456 8073 10330 1876 283 051
Sprinkler Name Area of Area Name Area of Area Name Area of Area Strawberry 040 015 Peas 9611 3578 Flower 081 030 Tomato 4037 1503 Wheat 2703 1006 Brinjal 2529 942 Other Crop 314 117 Okra 1457 542 Others Crop 6091 2267 Total 040 015 23725 8832 3098 1153 Source GAPL Primary Survey 2013 Uttarakhand In the state of Uttarakhand major fruit crops under drip system were noted to be peach mango litchi and guava which covered around 96 of total area under drip Among vegetable crops only peas occupied around 201 area under drip Out of total area under MI in Uttarakhand about one-fourth of the area was noted under sprinkler system About 100 of area under sprinkler was occupied by vegetable crops
Table 51 Crop wise Area Coverage under Drip and Sprinkler Systems in Uttarakhand (Sampled Beneficiaries)
Drip Sprinkler Fruit Vegetable Other Crop Vegetable
Name Area (Ha)
of Area Name Area
(Ha) of Area Name Area
(Ha) of Area Name Area
(Ha) of Area
Mango 3217 4582 Peas 101 144 Popular Tree
202 288 Peas 1062 8015
Peach 1356 1931 Tomato 263 1985 Guava 1477 2104 Litchi 668 951 Total 6718 9568 101 144 202 288 1325 10000 Source GAPL Primary Survey 2013
The above tables also shows that crops as brinjal chilli Okra flower tomato bottle gourd pomegranate etc are irrigated with micro sprinkler irrigation system by the beneficiaries However during the course of discussion with experts it was observed that irrigation through this system is not recommended because it harms the crop at the flowering stage Therefore it is recommended that farmers should be advised at the time of installation to use drip irrigation for such crops or they may avoid use of sprinkler during flowering stage and irrigate through alternative means
Impact Evaluation Study on ldquoNational Mission on Micro Irrigation (NMMI)rdquo
64
4214 System Demonstration The outcome demonstration particularly in rural area where exposure is limited remains an important instrument in educating the rural folks because only physical or concrete evidence is convincing for them Seen evidence can be easily and correctly interpreted when in fact interpretation may be difficult thus gives better results NMMI scheme has a component of demonstrations at the farmersrsquo fields to educate the farmers of that particular cluster In this regard the farmers were asked whether they have exposure to any field visit demonstration MI system
Table 52 Exposure of Beneficiary Farmers to MI Demonstrations
State Participated () Yes No
AP 1250 8750 Bihar 3721 6279 Chhattisgarh 4896 5104 Gujarat 2830 7170 Haryana 9844 156 Karnataka 2726 7274 Maharashtra 4747 5253 Odisha 4167 5833 Rajasthan 6463 3537 Sikkim 8000 2000 Tamil Nadu 2330 7670 UP 2144 7856 Uttarakhand 6333 3667
Source GAPL Survey
It may be seen from the above table that the beneficiaries of Haryana (98) followed by Sikkim (80) Rajasthan (64) and Uttarakhand (63) attended the demonstration nearby their areas Whereas majority of the farmers AP UP Tamil Nadu Karnataka Gujarat Bihar have reported that they have not visited any demonstration It is therefore suggested that more efforts may be put to expose the farmers regarding demonstration of MI system and its benefits 4215 Training and Capacity Building The training and capacity building is an integral component of the MI initiatives This component has been inbuilt to upgrade the capacity building of farmers and field functionaries through training and demonstrations carried out by state agricultural universities Precision Farming Development Centers (PFDCs) and the industry In light of
Impact Evaluation Study on ldquoNational Mission on Micro Irrigation (NMMI)rdquo
65
these observations our survey gave due attention to the training component and the obtained results are enumerated in table 53 The data revealed that almost all the respondents of Tamil Nadu UP Chhattisgarh Haryana were given training materials during the training while few beneficiaries of the Bihar Uttarakhand amp Karnataka received such training materials It has also been noted that farmers were imparted training on operation and maintenance of the system adoption of package practices under MI opportunities for introducing new crops with the help of micro irrigation system As far as field visits are concerned most of the beneficiaries reported that they have visited the fields of progressive farmers and demonstration fields except for Chhattisgarh Rajasthan and Uttarakhand where few farmers have reported that they have visited the demonstration fields
Impact Evaluation Study on ldquoNational Mission on Micro Irrigation (NMMI)rdquo
66
Table 53 Topic Covered in Training for Beneficiary Farmers ()
State Total
Beneficiary
Training Material Provided
Topic Covered in the Training
Joined Any Field Visit
Satisfied with the Learning
Operation of the System
Maintenance of the System
Package of Practices for
the Crops
Opportunities for Introduction
of New Crop
Other Related Schemes
Yes No Yes No Yes No Yes No Yes No Yes No Yes No Yes No AP 672 7188 878 7991 074 7917 149 7113 952 5580 2485 6592 1473 6696 3304 7307 759 Bihar 516 950 1047 1977 019 1977 019 1453 543 601 1395 194 1802 446 9360 620 019 Chhattisgarh 384 9714 208 9922 000 9896 026 9766 156 7057 2865 7083 2839 8073 1927 7995 078 Gujarat 576 4531 313 4705 139 4653 174 3264 1580 1094 3750 1510 3333 3767 6233 3715 052 Haryana 309 9363 637 9385 615 9341 659 9099 901 6286 3714 6154 3846 8330 1670 9319 681 Karnataka 576 2638 6357 8937 057 8748 247 4459 4535 2979 6015 1575 7419 4592 5408 5047 342 Maharashtra 672 7188 878 7991 074 7917 149 7113 952 5580 2485 6592 1473 6696 3304 7307 759 Odisha 480 5878 253 6131 000 6116 015 5193 938 3929 2202 4926 1205 5744 4256 6086 045 Rajasthan 574 8171 261 8432 000 8223 209 8031 401 6707 1725 7038 1394 679 2735 6951 314 Sikkim 50 4771 438 5146 063 5167 042 4479 729 2396 2813 2833 2375 4333 5667 5000 208 Tamil Nadu 455 9965 035 9965 035 9931 069 9080 920 6059 3941 5955 4045 8507 1493 9670 330 UP 527 9800 000 9800 000 9800 000 8400 1400 5000 4800 4800 5000 8000 2000 9800 000 Uttarakhand 90 667 2667 2889 444 2889 444 778 2556 556 2778 444 2889 1111 2222 1556 1778
Source GAPL Survey
Impact Evaluation Study on ldquoNational Mission on Micro Irrigation (NMMI)rdquo
67
The farmers were asked whether they are satisfied from the training they received The beneficiaries of almost all the states gave positive response in this regard It is recommended that training on innovative techniques relevant to the MI Systems should cover topics such as high density plantation canopy management intercropping and use of mulch materials The beneficiaries were further asked about the institutions from which they have got the training about the MI system The obtained responses of the sampled beneficiaries are presented in the following table
Table 54 Institution for Training as Reported by Respondents ( Beneficiaries)
State Total Responses
SAUs KVKs PFDC
State Govt
Agencies
System Supplier Others
SAUs KVKs amp State Govt
Agencies
SAUs KVKs amp System Supplier
State Govt
Agencies amp System Supplier
AP 542 073 3229 6605 018 000 000 074 Bihar 103 1359 291 7961 000 000 291 097 Chhattisgarh 381 1365 079 4331 000 131 3832 262 Gujarat 279 359 430 9176 000 036 000 000 Haryana 309 194 906 8641 032 000 032 194 Karnataka 575 504 522 8974 000 000 000 000 Maharashtra 412 1360 437 7597 024 024 097 461 Odisha 250 240 160 8800 040 040 680 040 Rajasthan 484 534 331 9029 000 000 000 103 Sikkim 49 612 6531 2449 000 000 204 204 Tamil Nadu 427 211 000 9789 000 000 000 000 UP 474 211 211 9557 000 000 000 021 Uttarakhand 30 333 667 8667 000 000 000 333
Source GAPL Survey sharing of source technical Information regarding micro irrigation system scheme Note The duration of training has been reported to be of 1-2 days as revealed by the participant beneficiaries It may be seen from the above table that the system suppliers manufacturers are the major sources who imparted the training as more than 90 percent of the farmers of Tamil Nadu UP Gujarat Rajasthan and Karnataka received the training from suppliers Other sources of training are state government agencies and SAUsKVKs PFDC etc Most of the manufacturers imparted training at the time of system installation However it was revealed by the beneficiaries that after installation training on system operation is not provided to them as per their needs As such most of the farmers fail to draw full advantage of the MI system There is thus a dire need to provide technical support for system operation after installation It is recommended that regular trainings under MI system may be made mandatory on the part of system suppliers after the installation of the system as they are closely associated with the beneficiaries and have in-depth knowledge of the installed system
Impact Evaluation Study on ldquoNational Mission on Micro Irrigation (NMMI)rdquo
68
4216 Availability of Electricity The micro irrigation system runs on power and is a pre requisite for the installation of system therefore availability of power is an important parameter in this regard The following table shows the availability of electricity among all the states
Table 55 Availability of Electricity (Beneficiaries and Non Beneficiaries)
Beneficiaries Non Beneficiaries
State Total
Beneficiary
Availability of electricity () Availability of electricity () 0-4
HrsDay 4-8
HrsDay 8-12
HrsDay 12-16
HrsDay 16-20
HrsDay 20-24
HrsDay Total Non-
beneficiaries 0-4
HrsDay 4-8
HrsDay 8-12
HrsDay 12-16
HrsDay 16-20
HrsDay
AP 672 104 7113 2768 015 000 000 168 179 7560 2202 060 000 Bihar 516 1492 7888 581 039 000 000 128 1094 4844 2578 1484 000 Chhattisgarh 384 7943 1979 000 078 000 000 96 000 313 2083 5729 1875 Gujarat 576 000 9010 573 260 156 000 144 139 069 9722 069 000 Haryana 320 094 1719 6719 1438 000 031 81 123 1728 7284 864 000 Karnataka 576 000 9410 590 000 000 000 144 139 9444 556 000 000 Maharashtra 672 015 1994 7366 625 000 000 169 059 3018 6331 592 000 Odisha 480 083 1563 3104 4354 896 000 120 250 2250 2750 4500 250 Rajasthan 574 1690 6429 1376 505 000 000 138 145 9348 435 072 000 Sikkim 50 000 10000 000 000 000 000 10 000 8000 000 000 000 Tamil Nadu 455 000 10000 000 000 000 000 120 000 10000 000 000 000 UP 527 000 2068 7078 816 038 000 168 119 2143 6905 833 000 Uttarakhand 90 333 8778 000 000 889 000 22 1364 5909 2273 000 455
Source GAPL Survey
It may be seen that the supply of electricity in different states only one farmer among the beneficiaries that two of Haryana reported that the electricity available for 24 hrs It may further be seen that 100 percent of the farmers of Sikkim and Tamil Nadu reported to get electricity for 4-8 hrs in a day In other states it was observed that electricity is available for less than 16 hrs a day and out of which maximum reported to be between 12-16 hrs a days It may further be seen that farmers of Tamil Nadu Karnataka Rajasthan Sikkim and AP reported that they are getting electricity for 8 hrs whereas rest of the farmers reported that they are getting electricity up to 16 hrs a day The availability of electricity to beneficiaries and non-beneficiaries are showing the same trend
Impact Evaluation Study on ldquoNational Mission on Micro Irrigation (NMMI)rdquo
69
4217 Capacity of Pump Sets It may be seen from the following table that the majority of the farmers are using pump sets ranging upto 5 hp In AP and Maharashtra about 74 and 63 percent of beneficiaries reported that they are using the pump sets of 5-10 hp at their farms However about 59 54 41 percent farmers of Gujarat Haryana and UP respectively revealed that that they are having the pump sets of more than 10 hp The variations in the capacities of installed pump sets are attributed to the depth of water farm size type of MI system installed Most of the farmers reported that pump sets of appropriate capacity have been installed which thoroughly meet the system requirements and they are not facing any problem to irrigate the crops as per their requirements
Table 56 Capacity of Pump Sets Used by Beneficiaries
States Total
Beneficiary Power of the Pump Set ()
0-5 hp 5-10 hp 10-15 hp AP 672 2307 7426 267 Bihar 516 9845 097 058 Chhattisgarh 384 9896 000 104 Gujarat 576 347 3715 5938 Haryana 320 469 4094 5437 Karnataka 576 6319 3681 000 Maharashtra 672 2842 6295 863 Odisha 480 6771 3000 229 Rajasthan 574 8449 436 1115 Sikkim 50 6200 3800 000 Tamil Nadu 455 3275 6725 000 UP 527 493 5446 4061 Uttarakhand 90 4111 4444 1445
Source GAPL Survey 4218 Irrigation Filters Clean water is crucial for proper and effective long term operation of micro irrigation systems Water filtration is important for all irrigation systems Clogging of nozzles emittersdrippers reduce the efficiency of the MI system which ultimately results in increase in energy consumption and maintenance as well as cost of irrigation Filters can help extend the life of and lower the maintenance on sprinkler system For drip systems they are a necessity to prevent emitters from becoming plugged The yield is also affected because of clogging In drip and sprinkler irrigation the quality of water being pumped into the irrigation system is the most important factor in filter selection Filtration may be accomplished through use of filters They are sand separators media filter screen filter disc filter and settling basin
Impact Evaluation Study on ldquoNational Mission on Micro Irrigation (NMMI)rdquo
70
Sand separator or hydro cyclone filter is a type of filter that separates the particles from water according to the principle of gravitational settling and centrifugal force These are effective to remove suspended particles which have specific gravity more than 265 gcc (JISL) and are larger than 75 micron Such filters are suited for water type where a lot of sand is present in the water as they dont clog up nearly as quickly as other types of filters The dirty water enters the filter where it is swirled around the inside of a cylinder These filters are reasonably inexpensive very simple and are very effective for removing sand from water
Screen filters are probably the most common filters and in most case the least expensive and are excellent for removing hard particulates from water such as sand They are not so good at removing organic materials such as algae mold slime and other unmentionables These non-solid materials tend to embed themselves into the screen material from where they are very difficult to remove In other cases they simply slide through the holes in the screen by temporarily deforming their shape Screen filters are cleaned by flushing them with a stream of water or removing the screen and cleaning it by hand
Media filters clean the water by forcing it through a container filled with a small sharp edgedgranulated media In most cases the media material is uniform sized crushed silica sand The water passes through the small spaces between the media grains and the debris is stopped when it cant pass through these spaces Media filters are best for removing organic material from the water Media filters are the type of filters most commonly used for high volume cleaning of water from rivers and lakes Disc filters are a cross between a screen filter and a media filter with many of the advantages of both Disc filters are good at removing both particulates like sand and organic matter The pertinent information has been summarized in the following table below
Impact Evaluation Study on ldquoNational Mission on Micro Irrigation (NMMI)rdquo
71
Table 57 Type of Irrigation Filters Used by Farmers
Type of Irrigation Filters used by the Farmers () State Total
Beneficiary Total
Responses Hydro-cyclone
Filter
Screen filters
Sand Media Filters
Disc Filters
Hydro-cyclone
Filter ampScreen
filters
Hydro-cyclone Filter amp
Sand Media Filters
Hydro-cyclone Filter amp
Disc Filters
Screen filters
amp Sand Media Filters
Screen filters amp Disc Filters
Sand Media Filters ampDisc Filters
Hydro-cyclone Filter amp Screen
filters amp Sand
Media Filters
Hydro-cyclone Filter amp Screen
filters amp Disc
Filters
AP 672 672 015 9583 402 000 000 000 000 000 000 000 000 000 Bihar 516 6 000 8333 000 000 000 000 000 000 1667 000 000 000 Chhattisgarh 384 156 449 3141 000 5449 000 000 385 000 577 000 000 000 Gujarat 576 517 2244 1876 019 1973 348 019 2340 019 1103 058 000 000 Haryana 320 320 125 219 000 000 6469 125 031 1875 000 000 1094 063 Karnataka 576 576 035 7969 417 1580 000 000 000 000 000 000 000 000 Maharashtra 672 670 149 8478 075 1045 000 000 000 060 030 164 000 000 Odisha 480 480 021 9438 021 396 000 000 000 104 021 000 000 000 Rajasthan 574 568 141 8680 1056 000 000 018 000 053 035 018 000 000 Sikkim 50 50 000 9800 000 200 000 000 000 000 000 000 000 000 Tamil Nadu 455 455 044 8725 637 593 000 000 000 000 000 000 000 000 UP 527 524 248 8473 000 000 1240 000 000 038 000 000 000 000 Uttarakhand 90 90 000 10000 000 000 000 000 000 000 000 000 000 000
Source GAPL Survey
Impact Evaluation Study on ldquoNational Mission on Micro Irrigation (NMMI)rdquo
72
Different types of filters are mainly used for drip irrigation system whereas its use for sprinkler system is required under very specific water quality characteristics Some beneficiaries reported that they were using filters in sprinkler systems to check the plugging etc The beneficiary farmers using drip irrigation system were asked about the type of filters being used by them It may be seen from the table 58 that farmers are using screen filters centrifugal separators hydro-cyclone filter disc filter sand media filters depending on the need The data cited in the above table reveal that screen filters are being commonly used by the beneficiaries in most of the sampled states except Haryana where screen filters are being used in combination with hydrocyclone filters The combined use of filters in Haryana is attributed to the fact that additional subsidy is being given on hydro-cyclone type of filters In fact a combination of three filters (hydro-cyclone screen amp sand filter) is also being used by some beneficiaries of Haryana The use of such combinations may be ascribed to the fact that since Haryana government is extending financial assistance to construct water storage tanks as such many farmers prefer to store the water in such structures The incidence of different types of contaminations is higher in the stored water thus farmers are using combination of three types of filters to ensure the removal of all types of organic and inorganic materials Disc filters are used by about 55 percent farmers of Chhattisgarh followed by Gujarat (20) Karnataka (16) About 10 percent of the farmers of Rajasthan followed by 6 percent Tamil Nadu and 4 from AP are using sand filters may be because they are getting water from canals which has high dirt load of organic and inorganic materials The size of filter installed with MI system depends on the area being irrigated and the quantum of water being pumped It has been noted by the field staff that in most of the cases size of filters was appropriate as per the area soil and water quality characteristics 4219 Type of Emitters in drip system There are two categories of emitters usually installed with drip system in the field
a) In-line emitters These are used in row crops such as vegetables where water needs to be applied effectively near the root zone area
b) On-line emitters These are suitable to orchard crops such as apples mangoes etc These drippers are fixed on the laterals and can be opened for cleaning It provides uniform water distribution in the root zone The drippers may clog with physical impurities like minerals amp salts and also due to poor maintenance Further rodents and insects can damage lateral pipes of the drip irrigation system
Drip irrigation system left above the ground tends to clog less as in underground system chances of deposition of algae and soil particles is high It is also easy to lift while
Impact Evaluation Study on ldquoNational Mission on Micro Irrigation (NMMI)rdquo
73
preparing the fields for seed sowing or transplantation of seedlings Use of plastic mulch in conjunction with drip irrigation system has been reported to be more beneficial in saving water and improving the crop yields It was assessed during the course of study whether the sampled beneficiaries were using in-line or on-line drip system the pertinent data on type of emitters are cited in the following table
Table 58 Type of Emitters Used by Beneficiaries
State Total
Responses Inline Online
in Inline Online
AP 512 414 98 8086 1914 Bihar 6 4 2 6667 3333 Chhattisgarh 153 98 55 6405 3595 Gujarat 450 344 106 7644 2356 Haryana 236 128 102 5424 4576 Karnataka 575 359 216 6243 3757 Maharashtra 577 366 211 6343 3657 Odisha 118 84 34 7119 2881 Rajasthan 118 79 39 6695 3305 Sikkim 45 34 11 7556 2444 Tamil Nadu 384 256 128 6667 3333 UP 322 220 102 6832 3168 Uttarakhand 30 12 18 4000 6000
Source GAPL Survey It may be seen from the above table that more than 70 percent of the respondent farmers of AP Gujarat Sikkim and Odisha were using in-line drip irrigation system whereas more than 45 percent beneficiaries of Haryana and Uttarakhand reported to practice on-line drip irrigation system 4220 Type of Sprinkler Under sprinkler irrigation water is sprinkled under pressure on to the crop through a set of nozzles attached to network of pipes in the form of rainfall The sprinkler system sets unlike drip system are moveable Hence one sprinkler set could cover more than one hectare by shifting from one place to another Assistance for sprinkler irrigation is limited to only those crops where drip irrigation is uneconomical
Impact Evaluation Study on ldquoNational Mission on Micro Irrigation (NMMI)rdquo
74
Table 59 Type of Sprinklers Used by Beneficiaries
State Total Responses Percentage
Portable MiniMicro Rain gun AP 160 2072 7928 000 Bihar 510 9471 529 000 Chhattisgarh 231 7745 2251 000 Gujarat 126 8810 1111 079 Haryana 84 9524 476 000 Karnataka 87 3218 6667 114 Maharashtra 95 9368 632 000 Odisha 362 9613 387 000 Rajasthan 356 7556 2444 000 Sikkim 10 8000 2000 000 Tamil Nadu 71 9718 282 000 UP 205 9707 293 000 Uttarakhand 60 8833 1167 000
Source GAPL Survey It may be seen from the above table that majority of the beneficiaries of Tamil Nadu Rajasthan Odisha Bihar Maharashtra Gujarat and Uttarakhand states were using portable sprinkler irrigation system The use of rain gun was reported by one farmer only in Gujarat as it is most suitable to the large area under cultivation It is noted to be appropriate type of sprinkler system for larger areas as it can rotate 30 to 360 circle covering 25 meter radius with a discharge rate 175 lps 4221 Farmersrsquo opinion on System Supply and Installation related constraints The farmers were asked to reveal the difficulties faced by them right from the filing of application till receiving the after sales service including procedures quality of the systems supplied prices charged by empanelled system suppliers delay in installation after the placement of orders and any additional charges claimed by the supplies The response of the beneficiaries has been summarized in the table below
Impact Evaluation Study on ldquoNational Mission on Micro Irrigation (NMMI)rdquo
75
Table 60 Constraints Faced by Beneficiary Farmers ()
State Total
Beneficiaries
Procedure Related
Quality Issues
Higher Prices Charged
under Scheme then Available
in Market
Delay in System Supply
(Committed date vs Actual
date
Other Charges (Not covered in
the scheme additional
money paid) Yes No Yes No Yes No Yes No Yes No
AP 672 000 10000 060 9940 060 9940 060 9940 015 9985 Bihar 516 078 9922 155 9845 155 9845 252 9748 717 9283 Chhattisgarh 384 026 9974 000 10000 000 10000 000 10000 000 10000 Gujarat 576 25 975 313 9688 191 9809 278 9722 139 9861 Haryana 320 094 9906 094 9906 063 9938 281 9719 000 10000 Karnataka 576 000 10000 000 10000 000 10000 000 10000 000 10000 Maharashtra 672 030 9970 089 9911 074 9926 104 9896 074 9926 Odisha 480 000 10000 000 10000 000 10000 479 9521 021 9979 Rajasthan 574 1359 8641 854 9146 1045 8955 1045 8955 1045 8955 Sikkim 50 000 10000 200 9800 000 10000 000 10000 000 10000 Tamil Nadu 455 000 10000 000 10000 000 10000 000 10000 000 10000 UP 527 152 9848 209 9791 114 9886 285 9715 019 9981 Uttarakhand 90 3556 6444 3889 6111 5444 4556 3556 6444 889 9111 Total 5892 233 9767 229 9771 246 9754 304 9696 205 9795
Source GAPL Survey It is evident from the data that in most of the sample states beneficiaries did not face much of the difficulties related to the procedures quality prices delay in system installation etc 4222 After Sales Service The information on magnitude and quality of after sales services being provided by the suppliers has been summarized in table 61 On an average 91 percent of the beneficiaries across the sampled states reported that after sales services are being provided to them However about 34 percent beneficiaries from Bihar and 22 percent beneficiaries from Gujarat amp Maharashtra each informed that they did not receive the after sales services As for the timely and regular availability of after sales services is concerned about 87 percent beneficiaries reported that they receive the services at the required time
Impact Evaluation Study on ldquoNational Mission on Micro Irrigation (NMMI)rdquo
76
Table 61 Status Reported by Beneficiaries Regarding lsquoAfter Sales Servicesrsquo
State Total Beneficiary Provided by the vendor () If yes then ()
Yes No Timely Late Irregular AP 672 10000 000 8051 1949 000 Bihar 516 6570 3430 8378 1563 059 Chhattisgarh 384 10000 000 10000 000 000 Gujarat 576 7778 2222 8973 558 469 Haryana 320 10000 000 9156 438 406 Karnataka 576 9896 104 9045 920 035 Maharashtra 672 7768 2232 7854 1897 249 Odisha 480 9229 771 8871 880 248 Rajasthan 574 9582 418 9327 618 055 Sikkim 50 10000 000 9800 200 000 Tamil Nadu 455 9890 110 8813 1187 000 UP 527 9772 228 8854 1126 019 Uttarakhand 90 10000 000 2000 2222 5778 Total 5892 9085 915 8697 1083 220
Source GAPL Survey
The respondents were further enquired regarding the level of satisfaction with respect to after sale services and their responses are given in the Figure 8 It is well evident that on an average 87 percent of the beneficiaries across the entire 13 states received the after sales services to their complete satisfaction
During the course of field survey the respondents were asked whether this system supplier have given after sale service for the MI system installed at their farms The results regarding this issue have been summarized in above table It may be seen from the table that the farmers of Chhattisgarh AP Sikkim and Uttarakhand have reported that 100 percent after sale service was provided to them whereas two-third of the farmers reported regarding after sale service The farmers of the most of the states have got the benefit of this service
It is suggested that the implementing agencies should be more vigilant regarding warranty and after sales service of the system provided by the suppliers The question of releasing 10 percent of the cost of the system after one year subject to satisfactory performance of the system as certified by the beneficiary may be considered Maintenance manual in vernacular language should be made available to the beneficiaries at the time of installation of the system
Impact Evaluation Study on ldquoNational Mission on Micro Irrigation (NMMI)rdquo
77
Figure 8 Level of Satisfaction regarding lsquoAfter Sale Servicesrsquo
Source GAPL Survey
4223 Warranty As per the norms of NMMI the system suppliers are supposed to extend warranty to the beneficiaries regarding MI system installed at their farms In this regard the beneficiaries were asked regarding issue of warranty to them and their replies are summarized in table 62
Table 62 Status of Warranty for MI System ()
State Total
Beneficiary Warranty () If yes then () Yes No lt6 Months 1 Yr 1-2 Yr 2-3 Yr gt3 Yr
AP 672 10000 000 000 104 565 6533 2798 Bihar 516 3527 6473 000 165 275 5769 3791 Chhattisgarh 384 9948 052 000 000 052 890 9058 Gujarat 576 9948 052 000 017 035 070 9878 Haryana 320 10000 000 000 000 031 9969 000 Karnataka 576 10000 000 000 017 087 8906 990 Maharashtra 672 10000 000 000 238 491 3557 5714 Odisha 480 10000 000 000 021 167 2042 7771 Rajasthan 574 10000 000 000 087 3101 976 5836 Sikkim 50 10000 000 000 9000 000 800 200 Tamil Nadu 455 10000 000 000 022 044 7736 2198 UP 527 9981 019 000 019 646 8422 913 Uttarakhand 90 10000 000 667 3556 1667 4111 000 Source GAPL Survey
It may be seen from the above table that the beneficiaries of all the states under study have reported that they have got the warranty as per the requirement except for Bihar
Impact Evaluation Study on ldquoNational Mission on Micro Irrigation (NMMI)rdquo
78
were majority of the farmers reported that they did not get this benefit The farmers were further asked the duration of the warranty issue to them by the company Almost all the farmers of Chhattisgarh and Gujarat have reported that they received this facility for three years and the farmers of other state reported that they got warranty for their system for less than two years It is important that system suppliers should give two years warranty as per the guidelines of the scheme and it is proposed that in order to enforce this clause 5 percent subsidy may be released after the completion of warranty period 4224 Promotional Activities NMMI agencies are promoting the adoption of micro irrigation and its benefits to the growersrsquo awareness through various promotional tools such as publicity through newspapers radios TV and other sources which are summarized in the following table
Table 63 Awareness about Promotional Activities ()
State Total
Beneficiary
Publicity of the MI Scheme in local
language
Awareness of the dedicated website for MI Scheme in
the State
Awareness of the package of
practices being adopted for MI
Yes No Yes No Yes No AP 672 9866 134 9226 774 9940 060 Bihar 516 9128 872 000 10000 9729 271 Chhattisgarh 384 9948 052 9453 547 9844 208 Gujarat 576 7604 2396 7118 2882 8854 1146 Haryana 320 9719 281 6688 3313 9656 344 Karnataka 576 9965 035 2587 7413 9965 035 Maharashtra 672 9628 372 9003 997 9940 060 Odisha 480 9813 188 083 9917 9917 083 Rajasthan 574 9826 174 645 9355 9303 697 Sikkim 50 10000 000 200 9800 9800 200 Tamil Nadu 455 10000 000 9868 132 9956 044 UP 527 8235 1765 2694 7306 9127 873 Uttarakhand 90 9444 556 8000 2000 8444 1556 Total 5892 9411 589 5204 4796 9637 367 Source GAPL Survey
It may be seen from the above table that the farmers of the majority of the states that the implement agencies are promoting NMMI schemes in local language and almost 100 percent results were observed in Tamil Nadu Sikkim Odisha Rajasthan Chhattisgarh Karnataka and Maharashtra It is interesting to note that awareness of the dedicated website for MI scheme was limited
Impact Evaluation Study on ldquoNational Mission on Micro Irrigation (NMMI)rdquo
79
The beneficiaries were further asked whether they are aware of the package and practices being adopted for MI and the response were found to be very positive This reveals that the beneficiaries who have installed micro irrigation in their farm are aware of the package and practices to be followed for taking full advantage of the MI system supported cultivation
43 Observations of Field Staff on MI System In addition to farmersrsquo investigation the field survey team also visited the fields to observe the design and working of the system The field investigators have highlighted their observations regarding the condition of the MI system overall designing of the system installed and general conditions of the field The results regarding the observations of the field staffs are given in the following table below
Table 64 Observations of Surveyors regarding MI System Status at the Time of Field Visit
State
Overall Design
Drip Sprinkle MI System
match crop requirement
General Condition of the System
Flood Irrigation
along with MI System
Design () () System Condition ( `) () Good Satisfactory Bad Yes No Good Average Bad Yes No
AP 5982 4018 0 9777 223 5759 4226 015 6205 3795 Bihar 6298 3702 0 7791 2209 4942 5019 039 7558 2442 Chhattisgarh 7760 2240 0 9792 208 7188 2813 0 9844 156 Gujarat 6892 3038 069 9688 313 6094 3785 122 5278 4722 Haryana 9656 344 0 10000 0 9875 125 0 9781 219 Karnataka 5538 4462 0 9983 017 5417 4583 0 8090 1910 Maharashtra 6637 3363 0 9881 119 5536 4360 104 4970 5030 Odisha 4917 5083 0 9625 375 6500 3479 021 7813 2188 Rajasthan 8833 1167 0 9146 854 7648 2352 0 8153 1847 Sikkim 3600 6400 0 10000 0 6600 3400 0 6600 3400 Tamil Nadu 5582 4418 0 9912 088 4549 5451 0 8044 1956 UP 7381 2581 038 9791 209 5142 4801 057 8861 1139 Uttarakhand 9667 333 0 9222 778 8556 1444 0 9556 444 Total 6767 3223 010 9571 429 6124 3841 036 7463 2537
Source GAPL Survey It may be seen from the above table that in almost all the states under study the overall designing of the system was found to be satisfactory Majority of the field staff observed that system designs met the farmersrsquo requirements however in the state of Bihar only about 78 percent of the MI Systems were designed which could meet the crop requirements Remaining 22 percent of the systems have not been designed perfectly which could meet the water requirements of different crops It has also been observed by
Impact Evaluation Study on ldquoNational Mission on Micro Irrigation (NMMI)rdquo
80
the field investigators that some of the farmers have adopted innovative plant management techniques especially high density plantation in fruit crops and intercropping In almost all the states the sampled beneficiaries also revealed that no technical support guidance on agronomic practices are extended to the users by MI system suppliers as they generally tell the beneficiaries to take the help of extension agencies It was also observed that most of the beneficiary farmers have been using both the techniques of water application that is flood and the micro irrigation 44 Assessment of the System Design
Selection of MI Companies participating in NMMI at State level are based on the following parameters
a Manufacturing capacities of various equipment
b Financial strength of the company
c Dealer network
d Working experience in projects
e Availability of technical manpower
At the time of registration of the manufacturers it is mandatory that the quality of the system should be of BIS standards and the design must meet the requirements of the farmers in terms of its suitability to crops and field situations The conditions for providing after sale service and the warranty of the system are also laid at the time of registration To validate these parameters the beneficiaries were inquired regarding such issues and their responses are summarized in the table 65
The data indicate that the farmers in almost all the states reported that components of MI System met the BIS norms The average figure for all the sample states where system components were as per the BIS norms came out to be around 98 percent There is a need that variations reported in terms of not having BIS components as per NMMI guidelines may be brought to the notice of respective implementing agencies for further necessary action In more than 95 percent cases size of pumps was reported to be as per crop water amp plot size requirements except for the state of Bihar where around 18 percent respondents gave a negative reply
Impact Evaluation Study on ldquoNational Mission on Micro Irrigation (NMMI)rdquo
81
Table 65 Assessment of the System Design ()
State Total
Beneficiary
System components supplied are as per the
BIS
Pump size is proper to the field plot size wrt crop water requirements
MI system meets requirements
Design layout is as per project proposal
After sales service has been provided by the
MI system suppliers
MI systems found to be functional in
the field
Yes No Yes No Yes No Yes No Yes No Yes No AP 672 9970 030 9955 045 9955 045 9970 030 9940 060 9926 074 Bihar 516 9476 524 8217 1783 9845 155 8740 1047 6337 3663 6880 3120 Chhattisgarh 384 9974 026 10000 000 9974 026 10000 000 7396 2604 7552 2448 Gujarat 576 9722 278 9861 139 9635 365 9618 365 9520 480 9427 573 Haryana 320 10000 - 9938 063 9875 125 10000 000 9375 625 9281 719 Karnataka 576 10000 - 10000 000 10000 000 10000 000 10000 000 9549 451 Maharashtra 672 9732 268 9970 030 9985 015 9717 283 7842 2158 9821 179 Odisha 480 9896 104 9958 042 9958 042 9896 104 8646 1354 6667 3333 Rajasthan 574 9599 400 9425 575 9077 923 9408 610 9181 836 8798 1202 Sikkim 50 9600 400 10000 000 10000 000 10000 000 10000 000 9000 1000 Tamil Nadu 455 10000 - 10000 000 10000 000 10000 000 10000 000 9055 945 UP 527 9526 474 9962 038 9829 171 9943 057 9791 209 6603 1499 Uttarakhand 90 9778 222 8778 1222 7222 2778 9222 778 4889 5111 8222 1778
Source GAPL Survey
Impact Evaluation Study on ldquoNational Mission on Micro Irrigation (NMMI)rdquo
82
It was also observed by the field investigators that more than 15 percent reported that the MI system were non-functional in Bihar Chhattisgarh Odisha amp Uttarakhand due to crop season and fear of theft amp damage from rodents It was found that standard designs as regards spacing layout etc have been used in almost all the cases without any variation taking into account the shape size water quality soil conditions etc On an average 98 percent of the farmers reported that MI System installed in their fields meet their requirements however around 28 percent of the farmers in Uttarakhand responded that systems has not been installed as per their requirements Almost 100 percent of the beneficiaries reported that the system design layout is as per project proposal except farmers of Bihar where 10 percent farmers reported that system has not been laid out as per the design in the project proposal In the states of Bihar Chhattisgarh amp Uttarakhand the beneficiaries about 40-50 percent of the beneficiaries reported that they are not being provided after sales service 45 System Suppliers The global micro irrigation systems market is one of the fastest growing segments of agriculture sector The growth of this market is fueled by the government initiatives for adoption of micro irrigation systems in order to conserve water for optimum use The growth of micro irrigation systems is particularly higher in Asia Pacific and Africa due to the increased problems of water scarcity and farmer awareness towards increasing the crop yield with the help of micro irrigation systems India and China are expected to drive growth in the global micro-irrigation systems market which is seen reaching $48 billion by 2018 at a CAGR of 18 per cent from 2012 to 2018 Out of the total 695 million hectares (425 million ha sprinkler and 27 million ha drip) of cultivated area in India only 571 percent of the area is under drip and sprinkler irrigation This represents strong potential for the growth of micro irrigation systems in this region6 This low penetration offers growth opportunities in future All the benefits provided by the micro irrigation systems over flood irrigation coupled with the governmental initiatives to increase the MI system penetration are responsible for the MIS growth in India Also all such drivers are likely to help the market to grow in future as well
6As per Indian Taskforce Report of 2004
Impact Evaluation Study on ldquoNational Mission on Micro Irrigation (NMMI)rdquo
83
After initial scrutiny a committee consisting of experts examines the facilities at manufacturing site for verification of establishment details The list of the registered system suppliers is given below in table
Table 66 State Wise List of Registered MI System Suppliers
SNo State Name Suppliers Name
1 Andhra Pradesh
Ms EPC Industries Ltd (A Mahindra Group of Company) Ms Jain Irrigation Systems Ltd Ms Premier Irrigation Equipment Ltd Ms Rungta Irrigation Ltd Ms Greenfield Irrigation Ltd Ms Sudhakar Plastic Ltd Ms Nagarjuna Palma India Ltd Ms Kumar Enterprises Ms Nandi Plasticisers Ltd Ms Godavari Polymers Pvt Ltd Ms Haritha Irrigation Products Pvt Ltd Ms Netafem Irrigation India Pvt Ltd Ms Megha Agrotech Private Ltd Ms Satya Sai Polymers
2 Bihar
Ms Jain Irrigation Systems Ltd Ms EPC Industries Ltd (A Mahindra Group of Company) Ms Aaram Plastics Pvt Ltd Ms Sai Irrigation Ms Kishan Enterprise Ms Venkatesh Irrigation Ms Premier Irrigation Adritec Pvt Ltd Ms Netafim Irrigation India Pvt Ltd
3 Chhattisgarh Ms Netafim Irrigation India Pvt Ltd Ms Paras Drip Irrigation Ms Jain Irrigation Systems Ltd
4 Gujarat
Ms Dutron Polymers Ltd Ms Harvel Agua India Pvt Ltd Ms Jain Irrigation Systems Ltd Ms Netafim Irrigation India Pvt Ltd Ms Paragon Synthetics amp Polymers Ltd Ms Parixit Industries Limited Ms EPC Industries Ltd (A Mahindra Group of Company) Ms Plastro Plasson Industries (I) Ltd Ms Captain Irrigation System Ms Finolex Plasson Industries Pvt Ltd Ms Kothari Industries Ms Premier Irrigation Adritec Private Ltd Ms Transchem Agritech Ltd
5 Haryana Ms Jain Irrigation Systems Ltd Ms Netafim Irrigation India Pvt Ltd
Impact Evaluation Study on ldquoNational Mission on Micro Irrigation (NMMI)rdquo
84
Ms Balaji Agro-Systems Pvt Ltd Ms Ajay Industrial CorporationLtd Ms Apollo Pipes Ltd Ms Pioneer Plastics Industries Ltd Ms Rungta Irrigation Ltd Ms Nagarjuna fertilizers and chemicals limited Ms Harwel Agro India Limited Ms Finolex Plastic India Ltd Ms Vindhya Pipes amp plastics Ltd Ms Rungta Irrigation Ltd Ms Nirmal Polyfab Pvt Ltd
6 Karnataka
Ms Finolex Plasson Industries Ltd Ms Metro Drip Irrigation (P) Limited Ms EPC Industries Ltd (A Mahindra Group of Company) Ms Megha Agro Tech Pvt Ltd Ms Pioneer Plastic Industries Ltd Ms Jain Irrigation Systems Ltd Ms Agroplast Karnataka
7 Maharashtra
Ms Alphaplast Irrigation System Ms Aquaguard Plastics And Polymers Ms Datta Irrigation Company Ms Donga Watertech Ms Drip India Ms EPC Industries Ltd (A Mahindra Group of Company) Ms Finolex Plasson Industries Ltd Ms Godavari Polymers Ms Greengold Irrigation Ms Jain Irrigation Systems Ltd Ms Jaldhara Drip Irrigation Pvt Ltd Ms Kothari Agritech Pvt Ltd Ms Mohak Agro Industries Ms Nagarjuna fertilizers and chemicals limited Ms Neer Irrigation Ms Netafim Irrigation India Pvt Ltd Ms Nimbus Pipes Ltd Ms Paras Drip Irrigation
8 Odisha
Ms Jain irrigation system Ltd Ms Netafim Irrigation India Pvt Ltd Ms Premier Irrigation Adritec Pvt Ltd Ms Rungta Irrigation Ltd Ms Oasis Irrigation Equipment Co Ltd Ms Nagarjuna Fertilizers amp Chemicals Limited Ms Sujay Irrigation Pvt Ltd Ms Finolex Plasson Industries Pvt Ltd Ms Kirti Industries (India) Ltd Ms Relpol Plastic Products Ltd
9 Rajasthan Ms Netafim Irrigation India Pvt Ltd
Impact Evaluation Study on ldquoNational Mission on Micro Irrigation (NMMI)rdquo
85
Ms Khushboo Polymers Pvt Ltd Ms Shree Irrigation Systems P Ltd Ms Excellent Irrigation P Ltd Ms EPC Industries Ltd (A Mahindra Group of Company) Ms Purma Plast Ltd Ms Jamna Industries Ms Dinesh Irrigation P Ltd Ms Aaram Plastic Pvt Ltd Ms Jain irrigation system Ltd
10 Sikkim Ms Jain Irrigation Systems Ltd Ms Netafim Irrigation India Pvt Ltd
11 Tamil Nadu
Ms Agro Plast Ms AGS Irrigation (P) Ltd Ms Alpha Irritech Pvt Ltd Ms EPC Industries Ltd (A Mahindra Group of Company) Ms Elgi Ultra Industries Ltd Ms Finolex Plasson Industries Ltd Ms Jain Irrigation Systems Ltd Ms Krishi Irrigation Pvt Ltd Ms Mega Agrotech Pvt Ltd Ms Netafim Irrigation India Pvt Ltd Ms Parixit Industries Limited Ms Pragati Irrigation Systems Pvt Ltd Ms Premier Irrigation Adritec Pvt Ltd Ms Rungta Irrigation Ltd Ms Sujay Irrigation Private Limited
12 Uttar Pradesh
Ms Jain irrigation system Ltd Ms Nagarjuna fertilizers and chemicals limited Ms Sterling Irrigation Ltd Ms EPC Industries Ltd (A Mahindra Group of Company) Ms Netafim Irrigation India Pvt Ltd
13 Uttarakhand
Ms Jain Irrigation Systems Ltd Ms Netafim Irrigation India Pvt Ltd Ms Harvel Agua India Pvt Ltd Ms Pioneer Plastics Industries Ltd Ms Premier Irrigation Adritec Private Ltd
The success of the micro irrigation system is solely dependent on the quality of material used and after sale service Therefore the NMMI guidelines have given due consideration to this very component and have made it mandatory to register the system manufacturers and the same is done by State Micro Irrigation Committee (SMIC) Only those manufacturing companies which insure the quality of the product as per BIS and can promptly provide after sale service are registered for three years The registered company need to declare the technical details of the components proposed to be supplied and which would be verified by the technical committee Further frequent surveillance by
Impact Evaluation Study on ldquoNational Mission on Micro Irrigation (NMMI)rdquo
86
inspection team comprising from NCPAH PFDC CIPET Irrigation Association of India is necessary The Manufacturers have to insure the network for providing after sale services in their area of operation They have to further provide operation and maintenance manuals in vernacular language at the time of installation They should also have the facilities to provide technical guidance on agronomic practices system maintenance schedules spare parts warrantee etc Free after sale service shall be provided by manufacture or authorized distributors for at least three years It has been observed almost all the states that the material supplied to the farmersbeneficiaries is of BIS and also gives warranty for three years However during the course of the investigation it was reported by beneficiaries that the after sale service is provided only in the initial phase and simple instructions are given for using the system No technical support guidance on agronomic practices are extended to the users as they generally tell the beneficiaries to take the help of extension agencies The distributors dealers operating in various sampled states reported that they get the subsidy within 15-20 days of applying but sometime they face the delay in release of subsidy due to non-availability of funds under scheme at district state level Further they also reported that due to delay in trial run inspection also leads to delay in release of the subsidy It is suggested that it would be better if subsidy is directly passed on to the beneficiaries to expedite the release disbursement of subsidy under the scheme
Impact Evaluation Study on ldquoNational Mission on Micro Irrigation (NMMI)rdquo
87
5 Impact Evaluation A number of studies have been conducted to assess the impact of micro irrigation particularly that of drip which have shown encouraging results of farm variables It has also helped in bringing crop diversification from rain fed crops to horticulture crops and have also brought cultivable wastelands under high value such as horticulture crops reduction in cost of production higher yield etc The impact of the scheme on various parameters detailed below has been evaluated to arrive at conclusion about achievement of the scheme objectives as well as general benefit to the agricultural economy of the country Some sequences are in following paragraphs
1 Area Expansion under MI and additional area irrigated by installing MI in place of conventional irrigation and waste marginal land development with the same amount of water
2 Savings in labor fertilizers and electricity thereby reducing cost of cultivation 3 Study of productivity enhancement for various crops 4 Whether the adoption of MI has given rise to crop diversification adoption of high
value crops etc 5 Innovative crop management techniques facilitated through adoption of MI which
are canopy management high density plantation inter cropping etc 6 Contribution of MI towards National food security
51 Crop Diversification
Crop diversification in India is generally viewed as a shift from traditionally grown crops to more remunerative crops With the advent of modern agricultural technology especially during the period of the Green Revolution in the late sixties and early seventies there is a continuous surge for diversified agriculture in terms of crops primarily on economic considerations
Crop diversification is intended to give a wider choice in the production of a variety of crops in a given area so as to expand production related activities on various crops and also to minimize risk The survey has measured impact of installation of MI systems on crop diversification The result of the beneficiariesrsquo responses is summarised in the following table
Impact Evaluation Study on ldquoNational Mission on Micro Irrigation (NMMI)rdquo
88
Table 67 Impact on Crop Diversification and Usage of Marginal and Degraded Land by Beneficiaryrsquos data
SNo State Total
cultivable area (Ha)
Horticulture Crop Area (Ha) Field crop Area (Ha) Marginal degraded Land
( Waste Land) (Ha)
Area Before
MI
Area After MI
Change in Area
Area Before
MI
Area After MI
Change in Area
Area Area after MI
Change in area Before
MI 1 AP 149122 39388 88038 12351 68932 59550 -1361 16953 1534 -9095
2 Bihar 140742 37989 54002 4215 95641 86619 -943 202 121 -4000
3 Chhattisgarh 58406 8719 33495 28415 46502 24211 -4794 1016 700 -3108
4 Gujarat 167639 32040 44131 3773 122983 120072 -237 8373 3436 -5897
5 Haryana 135990 19628 64972 23102 133613 71018 -4685 769 000 -10000
6 Karnataka 111046 68571 85818 2515 34908 23447 -3283 2570 1781 -3071
7 Maharashtra 133667 17384 43304 14910 96225 82488 -1428 22659 7875 -6524
8 Odisha 141309 58179 92107 5832 76276 44435 -4174 7657 4767 -3774
9 Rajasthan 162365 65643 102036 5544 83881 52539 -3736 16410 7790 -5253
10 Sikkim 7327 6149 6639 797 1020 587 -4246 101 101 000
11 Tamil Nadu 76488 44887 53142 1839 32862 23306 -2908 299 040 -8649
12 UP 164662 23078 79251 24341 134278 85249 -3651 2942 162 -9450
13 Uttarakhand 32295 9075 9278 223 18707 18727 011 4573 4290 -619 Source GAPL Survey
Impact Evaluation Study on ldquoNational Mission on Micro Irrigation (NMMI)rdquo
89
It may be observed from above table that the farmers of all the states have shown increase in area under horticulture crops after the adoption of the system The highest increase has been observed in Haryana followed by Chhattisgarh UP Maharashtra and AP whereas the lowest in case of Uttarakhand and Sikkim which may be because of the reason that both the states have proportionately higher area under horticulture crops 52 Area Expansion under Micro Irrigation The GoI MI scheme has succeeded in bringing around 3812 lakh ha under micro irrigation with total subsidy amounting to Rs 546801 crores since the launch of the scheme in 2005-06 in India This represents about 257 of the total cultivated area in the country and 569 of the total irrigated area of the country The area expansion under MI system in the country has grown at 36 23 and 18 respectively for last three years (as per official records) Eventually the growth trend is quite impressive yet overall proportion of land under MI is quite low and as such more efforts such as creating awareness among the farmers through electronic and print media exhibition fares PRIs etc need to be initiated to bring the significant area under MI 53 Increase in Irrigated Area due to Water Saving Drip irrigation is being practiced in the different parts of the country since 80s to improve the water use efficiency water savings and productivity enhancement Through the saving of water due to adoption of MI technologies it is possible for beneficiaries to increase the area under cultivation by way of efficient use of water In order to understand that how much additional area has been brought under irrigation the irrigated area before and after installation of MI was taken into consideration (Table 68) In order to have better comprehension of area increased due to MI the percent increase in different schemes was given a graphical shape (Figure 9) After adoption of MI system sampled beneficiaries were able to bring their irrigated area under irrigation from same source of water which otherwise was not being utilized for cultivation due to limited availability of water The Irrigated area within the 5892 sampled beneficiaries of the 13 states before adoption of MI system was found to be 1332086 ha which 1444147 became ha after adoption of MI system It is therefore concluded that total percentage increase in irrigated area with the sampled beneficiaries in 13 states after adoption of MI system was noted to be 841
Impact Evaluation Study on ldquoNational Mission on Micro Irrigation (NMMI)rdquo
90
Table 68 Increase reported by Beneficiaries in Irrigated Area (ha) after Installation of MI System
State Total Irrigated Area before
installation of Micro Irrigation system (ha)
Total Irrigated Area after installation of Micro Irrigation
system (ha)
increase in irrigated Area
AP 101343 113941 1243 Bihar 229656 236802 311 Chhattisgarh 49474 57196 1561 Gujarat 135891 155007 1407 Haryana 123368 136263 1045 Karnataka 103805 106492 259 Maharashtra 102551 125400 2228 Odisha 124189 138310 1137 Rajasthan 100577 107850 723 Sikkim 6040 6081 067 Tamil Nadu 70956 74116 445 Uttar Pradesh 158370 160415 129 Uttarakhand 25862 26275 160 Grand Total 1332086 1444147 841
Source GAPL Survey
Figure 9 Increase in Irrigated Area () among Beneficiaries after Adoption of MI
54 Development of marginal and wasteland by beneficiaries
Degraded land which can be brought under vegetative cover with reasonable effort and which is currently under-utilized and land which is deteriorating for lack of appropriate water and soil management or on account of natural causes The total cultivable waste land in the country at present is about 1283 million hectares Based on the feedback received from the sampled beneficiaries it was observed that during survey in the sampled states beneficiaries sampled farmers were able to convert
Impact Evaluation Study on ldquoNational Mission on Micro Irrigation (NMMI)rdquo
91
their marginal amp rainfed land into cultivable land due to efficient use of water resources available with them In 13 surveyed states 5892 sampled farmers holding 1481058 hectares of land reveals that around 84540 ha of land was not being used for cultivation as they were either waste or degraded land Farmers reported that after adoption of MI system they were able to bring around 51943 ha of land under cultivation The data reveals that adoption of MI system has helped the sampled beneficiaries in bringing around 371 of land under cultivation Maximum and minimum area conversion with the beneficiaries was noted in Andhra Pradesh and Sikkim respectively
Table 69 Marginal Degraded Land brought under Cultivation after Installation of MI System by Beneficiaries
States Total no of
Sampled Beneficiaries
Total area of Sampled
beneficiaries (Ha)
No of sampled farmer with
wastedegraded
Area under wastedegraded
land before NMMI (ha)
Converted area after
adoption of NMMI (ha)
AP 672 149122 242 16953 15419 Bihar 516 140742 2 202 081 Chhattisgarh 384 58406 8 1016 318 Gujarat 576 167639 57 8374 4939 Haryana 320 13599 2 769 769 Karnataka 576 111046 11 2572 789 Maharashtra 672 133667 126 22666 14791 Odisha 480 141309 70 7660 2893 Rajasthan 574 162365 39 16410 8620 Sikkim 50 7327 4 101 000 UP 527 76488 32 2942 2780 Uttarakhand 90 164662 46 4575 284 Tamil Nadu 455 32295 10 300 260 Total 5892 1481058 649 84540 51943
Source GAPL Survey
55 Dripper spacing The dripper spacing is important as it accommodates higher plant population resulting more number of fruits which increases total yield and net returns It is also a factor to commensurate water requirement and root zone of the plant However wide dripper spacing saves more water total irrigation time minimized the diseases and weeds incidence as compared to closer dripper spacing in each years The recommended spacing for different crops under Micro Irrigation system has been presented in the following tables below During the course of field survey the beneficiary farmers were asked to specify the spacing of the crops they are following The responses of the farmers are given in the table 70 amp 71 for different crops in sampled states
Impact Evaluation Study on ldquoNational Mission on Micro Irrigation (NMMI)rdquo
92
Table 70 Spacing followed by Sampled Beneficiaries for Fruit Crops (m)
SNo State Fruits
Banana Lemon Mango Papaya Watermelon Orange Litchi Guava Pomegranate Grapes Coconut Cashewnut Aonla 1 AP 15 15 55 99 1818 66 2 Bihar 1010 55 3 Chhattisgarh 1818 1506 4 Gujarat 1818 1818 5 Haryana 0404 1010 88 6 Karnataka 22 88 22 44 315 7 Maharashtra 1515 1010 33 88 77 8 Odisha 22 66 55 22 7575 77 9 Rajasthan 66 66 5555 66 55
10 Sikkim 1515 55 33 11 Tamil Nadu 22 55 66 66 55 12 UP 1515 66 1010 1010 1010 13 Uttarakhand 88 33
Source GAPL Survey
Impact Evaluation Study on ldquoNational Mission on Micro Irrigation (NMMI)rdquo
93
Table 71 Spacing followed by Sampled Beneficiaries for Vegetables Flowers and Other Crops (m)
SNo State Vegetables Flowers and other important Crops
Brinjal Okra Tomato Potato Cucumber Onion Cabbage Cauliflower Chili Cotton Sugarcane Groundnut Lilli Rose 1 AP 0606 0404 1204 1212 1205 1515 11 2 Bihar 21 055022 1509 3 Chhattisgarh 1503 0502 1503 4 Gujarat 1404 06015 07015 1404 1505 07005 5 Haryana 105 102 0501 0606 103 0505 6 Karnataka 1206 1206 1806 0609 7 Maharashtra 0606 1204 1204 1503 15075 1205 8 Odisha 06045 045045 0603 045030 0603 9 Rajasthan 1030 1020 025025 055055 066066 1030
10 Sikkim 108 66 108 11 Tamil Nadu 0606 06045 1503 1212 24075 12 UP 06075 0604 1204 07503 1509 13 Uttarakhand
Source GAPL Survey
It may be seen that crop spacing is more or less as per recommendations In few cases the spacing is even less It is clearly indicates that farmers adopting MI system also adopt proper practices
Impact Evaluation Study on ldquoNational Mission on Micro Irrigation (NMMI)rdquo
94
56 Reduction in Cost of Irrigation The data cited in table 73 indicate the cost of irrigation incurred by beneficiary farmers before and after installation of MI system It is well evident that Irrigation cost was reduced by 20-50 percent with the use of MI system The states of Gujarat Haryana and Rajasthan have witnessed more than 40 cost reduction The reduction in cost resulted primarily because of savings in the man power and electricity consumption
Table 72 Reduction in Cost of Irrigation with MI system
State Cost of Irrigation before MI ( Rs ha)
Cost of irrigation after MI (Rs ha) decrease in cost
AP 7200 5721 2050 Bihar 8734 6234 2860 Chhattisgarh 5602 3557 3650 Gujarat 11046 5599 4930 Haryana 7346 3749 4900 Karnataka 8215 6182 2470 Maharashtra 11204 7736 3100 Odisha 8895 6541 2650 Rajasthan 7193 3925 4540 Sikkim 3932 2836 2790 Tamil Nadu 6368 4792 2480 UP 6657 4819 2760 Uttarakhand 10693 8203 2330
Source GAPL Survey
57 Electricity Consumption The figures on consumption of electricity before and after installation of MI system by the beneficiary farmers have been tabulated in Table 73 The data clearly indicate that savings of electricity across the sampled states varied from 151 to 494 percent average being 306 percent It is pertinent to mention here that in the states of Bihar and Chhattisgarh almost all the beneficiaries have been using diesel kerosene to operate their pump sets For these two states reduction in consumption of electricity has been computed considering the reduction in use of diesel kerosene The variations in the extent of electricity savings among different states may be attributed to the type of system installed besides depth of water and area brought under MI
Impact Evaluation Study on ldquoNational Mission on Micro Irrigation (NMMI)rdquo
95
Table 73 Reduction in Electricity Consumption
State Electricity used
before MI( hrday) Electricity used
after MI( hrday) saving of electricity
AP 679 528 2233 Bihar 5000 3000 4000 Chhattisgarh 4500 2800 3778 Gujarat 678 407 3992 Haryana 835 423 4939 Karnataka 590 432 2675 Maharashtra 703 468 3348 Odisha 798 619 2246 Rajasthan 864 501 4208 Sikkim 262 170 3511 Tamil Nadu 578 491 1510 UP 225 184 1843 Uttarakhand 301 211 2989 Total 537 373 3065
Source GAPL Survey Diesel Kerosene consumed (ltrs day) for Bihar and Chhattisgarh
58 Economy in Fertilizer Use The information on use of fertilizers before and after installation of MI system was sought from the beneficiary farmers the obtained data have been enumerated in Table 74 In order to comprehend the information on fertilizers saving across the 13 states the data on fertilizer saving was given a graphical presentation (Figure 10) It is well evident that MI system resulted in significant savings of fertilizers The extent of fertilizer saving in the states under study varied from 759 to 4383 percent with an average savings of about 28 percent The obtained results are in-conformity with the various research findings wherein fertilizer savings through drip fertigation have been reported in the range of 30-35 percent (Raina et al 2013)The exceptionally low fertilizer savings observed in Bihar are attributed to the fact that more than 90 percent area in Bihar is under sprinkler irrigation
Impact Evaluation Study on ldquoNational Mission on Micro Irrigation (NMMI)rdquo
96
Table 74 Reduction in Fertilizer Consumption
States Fertilizer Consumption(
Kgha) Before MI
Fertilizer Consumption( Kgha)
after MI
saving of Fertilizer
AP 24152 17185 2885 Bihar 18198 16816 759 Chhattisgarh 28872 17219 4036 Gujarat 15893 9103 4273 Haryana 20297 12682 3752 Karnataka 21549 15471 2821 Maharashtra 31005 23887 2296 Odisha 27240 21547 2090 Rajasthan 29523 16582 4383 Sikkim 15860 9380 4086 Tamil Nadu 21147 15421 2708 UP 24220 18704 2277 Uttarakhand 10620 8712 1796 Total 23526 16826 2848
Source GAPL Survey
Figure 10 Reduction in Fertilizer Consumption ()
59 Increase in Crop Productivity
Micro irrigation has generated benefits to the farmers in terms of enhancement of the productivity The average productivity Fruit crops have increased about 423 percent (Table 75) with maximum enhancement in the state of Gujarat followed by Rajasthan which was followed by Chhattisgarh In fact the productivity enhancement in these states was comparable
Impact Evaluation Study on ldquoNational Mission on Micro Irrigation (NMMI)rdquo
97
Table 75 Productivity Enhancement of Fruit Crops (MTha)
State Before MI After MI increase AP 732 874 1937 Bihar 273 315 1518 Chhattisgarh 012 020 6200 Gujarat 515 893 7348 Haryana 586 810 3825 Karnataka 4532 5810 2820 Maharashtra 2166 3232 4918 Odisha 2741 3699 3497 Rajasthan 538 917 7056 Sikkim 543 580 682 Tamil Nadu 2473 2902 1736 UP 710 953 3414 Uttarakhand 585 775 3242 Total 1352 1925 4234
Source GAPL Survey The average productivity of the vegetables has increased by 528 after using the MI irrigation system (Table 76) The states of Chhattisgarh Gujarat and Sikkim registered tremendous increase in vegetable productivity after using micro irrigation system
Table 76 Productivity Enhancement of Vegetable Crops (MTha)
State Before MI After MI increase
AP 991 1329 3409 Bihar 1122 1476 3162 Chhattisgarh 2779 5526 9885 Gujarat 709 1196 6859 Haryana 2066 2523 2213 Karnataka 1109 1430 2900 Maharashtra 348 448 2876 Odisha 1088 1395 2819 Rajasthan 607 846 3942 Sikkim 1894 3157 6662 Tamil Nadu 1137 1437 2640 UP 825 1079 3071 Uttarakhand 317 475 4965 Total 1140 1741 5276
Source GAPL Survey
The data on crop wise productivity enhancement in different states has also been enumerated and explained in the next section
Impact Evaluation Study on ldquoNational Mission on Micro Irrigation (NMMI)rdquo
98
510 Reduction in these Cost of Inputs of Irrigation amp Productivity Enhancement Crop-wise
MI technology is introduced mainly to increase the water use efficiency in agriculture and also provides many other socio-economic benefits in the society The use of MI has led to significant reduction cost of irrigation electricity saving fertilizer saving amp productivity enhancement As per the data collected from the sample beneficiaries significant increase has been observed in terms of reduction in different costs for different crops and enhancing the productivity The same trend is observed in fruits vegetables flowers and other non-horticulture crops The detailed state and crop wise impact percentages of the reduction in irrigation cost electricity savings fertilizer saving and increase in productivity of the sampled beneficiaries are as follows
Table 77 Crop wise Details of Reduction in Cost - Fruits
State Fruit Reduction in Irrigation Cost ( )
Electricity saved ( )
Fertilizer saved ( )
Productivity enhancement ( )
AP
Banana 2987 3660 2833 2089 Guava 1087 2830 2651 3521 Lemon 2839 3339 2676 1708 Mango 2338 3301 3157 3051 Orange 3160 3571 3233 3478
Bihar
Guava 2308 1827 2000 1250 Kadam 1228 2250 1385 1563 Mango 1731 1450 1167 1211 Litchi 2857 1180 1429 1077
Chhattisgarh Banana 2500 2460 1667 5000 Papaya 3889 2850 3333 8750
Gujarat
Banana 4490 4712 3954 4344 Papaya 4692 4000 4565 6235 Pomegranate 4565 2895 4407 4000 Watermelon 5682 5750 4068 5000
Haryana Kinnow 4847 4005 3945 2500 Strawberry 4196 3837 4110 2000 Watermelon 3421 4565 4150 5000
Karnataka
Banana 2769 2030 2743 3380 Mango 2576 3472 2636 2673 Papaya 2836 3622 2907 2441 Pomegranate 2250 2363 3038 3520 Fig 1250 3333 2222 2500 Areca nut 2918 3276 3085 2205
Maharashtra
Banana 3070 3069 3122 5215 Cashew nut 3117 1940 4247 4000 Grapes 3016 2069 2047 7143 Mango 3553 2815 2895 1672 Mousami 4375 2000 2000 8750 Orange 4689 3059 2766 3000 Sweet Orange 3553 3137 2198 3627 Areca nut 1833 3500 5000 3333
Impact Evaluation Study on ldquoNational Mission on Micro Irrigation (NMMI)rdquo
99
Odisha
Aonla 3529 3889 2500 3333 Banana 3577 3391 3124 2447 Cashew nut 2713 3131 3120 3062 Guava 3481 3692 3216 4430 Mango 3576 3551 3027 3039 Papaya 2806 2903 3532 1768 Chikoo 667 2500 4000 1111
Rajasthan
Bel 5714 5000 5714 1550 Guava 1965 4746 4077 5000 Kinnow 5869 4982 4904 4648 Lemon 3052 4519 3560 4118 Mango 3053 4839 3282 6000 Orange 2565 4187 3535 4229
Sikkim Banana 3750 4000 3000 000 Orange 3933 2766 4087 4000 Litchi 5000 2000 4000 000
Tamil Nadu
Aonla 2313 3298 2817 4032 Banana 3684 3495 2607 2990 Cashew nut 3579 3333 2222 3333 Coconut 2882 3511 2714 3333 Mango 2410 3418 2926 2697 Tapioca 3258 3422 2429 3327
UP
Banana 2961 6000 2746 4792 Guava 2555 3636 2350 2147 Mango 2463 3957 2415 3373 Litchi 2753 4167 2717 3393
Uttarakhand
Guava 2167 NA 1638 NA Mango 2281 3636 1633 NA Peach 2293 NA 2855 NA Litchi 2892 3333 2044 NA
Source GAPL Survey
It may be seen from the above table that among the fruit crops highest reduction in irrigation cost was observed in Kinnow crop in Rajasthan amp lowest in guava in AP whereas maximum saving in electricity was observed in Haryana and saving in fertilizer in a Bel in Rajasthan and further highest increase in productivity is witnessed in Papaya in Chhattisgarh
Table 78 Crop wise Details of Reduction in Cost - Vegetables
State Vegetables Name
Reduction in Irrigation Cost ( )
Electricity Saved ( )
Fertilizer saved ( )
Productivity enhancement ( )
AP
Brinjal 2470 3450 2932 1950 Chilli 2104 3213 2662 2580 Okra 1545 3079 3337 2654 Tomato 2100 3458 3280 2837
Bihar
Brinjal 1931 2780 1073 1522 Cauliflower 1850 3244 1415 760 Okra 2188 2250 1283 1671 Potato 2282 4655 1006 1105
Chhattisgarh Cauliflower 3438 3480 4065 7377 Tomato 4420 4750 4580 11454
Impact Evaluation Study on ldquoNational Mission on Micro Irrigation (NMMI)rdquo
100
Bitter Gourd 4934 3690 4746 11081 Okra 4365 4250 4484 8642
Gujarat
Chilli 4532 4341 4393 4708 Fennel 3000 5000 5625 2000 Onion 4983 4792 4094 2435 Potato 4523 4547 3602 3504 Tomato 5102 4620 4245 7962
Haryana
Chilli 4364 4470 3264 5000 Cucumber 5494 6081 3989 4122 Potato 4406 5809 3321 1651 Tomato 4833 5161 3556 5632
Karnataka Chilli 3088 3021 2839 3187 Ginger 2941 3651 2906 2450 Tomato 2275 3218 2971 1870
Maharashtra Brinjal 3041 3870 2604 2195 Chilli 2702 3268 3672 3310 Tomato 2763 3641 2940 3184
Odisha
Bitter Gourd 3629 3660 3024 2826 Bottle Gourd 4040 3435 2700 2916 Brinjal 2979 3164 3084 2804 Cauliflower 3141 3291 2980 2542 Okra 3399 3302 2982 3216 Tomato 2978 3179 3225 3534
Rajasthan
Brinjal 6452 2500 5429 NA Carrot 5718 2965 4789 2097 Onion 3713 3840 3992 3117 Tomato 2950 4526 3520 4619
Sikkim Brinjal 2200 4118 3818 6949 Cauliflower 4500 2000 4250 769 Tomato 3542 3729 4161 6889
Tamil Nadu Brinjal 2930 3264 2973 3407 Chilli 3049 3633 2902 2551 Tomato 2545 3495 3167 2176
UP
Brinjal 2336 4032 2153 2481 Chilli 2473 5000 2052 3130 Peas 2155 3752 3005 3254 Potato 2897 4412 2591 2802 Tomato 2521 3721 2420 2822
Uttarakhand Peas 2572 NA 1672 NA Tomato NA 3333 2018 NA
Source GAPL Survey It may be seen from the above table that among the vegetable crops highest reduction in irrigation cost was observed in brinjal in Rajasthan amp lowest in lady finger in AP whereas maximum saving in electricity was observed in Haryana for cucumber amp potato and saving in fertilizer for fennel in Gujarat and further highest increase in productivity is witnessed in Chhattisgarh for tomato
Impact Evaluation Study on ldquoNational Mission on Micro Irrigation (NMMI)rdquo
101
Table 79 Crop wise Details of Reduction in Cost - Flowers
State Crop Reduction in
Irrigation Cost ( )
Electricity saved( )
Fertilizer saved ( )
Productivity enhancement
( ) AP Lilli 3333 3750 4182 4560 Bihar Marigold 4643 3100 3333 5000
Gujarat Jasmine 5000 6250 3333 3333 Marigold 2000 7500 5556 4200
Haryana Gerbera 6725 8636 3250 3670 Rose 4316 5938 5676 4690
Maharashtra Marigold 3448 3571 2761 4250 Rose 1045 2143 4375 4690
Odisha Rajanigandha 4667 5000 3000 2400 Rajasthan Rose 3611 5000 2970 2500 UP Marigold 2000 3400 2000 2750 Source GAPL Survey It may be seen from the above table that among the flowers highest reduction in irrigation cost amp electricity saving was observed in Gerbera in Haryana whereas saving in fertilizer for rose in Haryana and highest increase in productivity was witnessed in Bihar for marigold
Table 80 Crop wise Details of Reduction in Cost - Non-horticulture Crops
State Non Horticulture Crops
Reduction in Irrigation Cost
( )
Electricity saved( )
Fertilizer saved ( )
Productivity enhancement
( )
AP
Cotton 2820 3524 2354 1770 Ground nut 2924 3828 2136 2274 Maize 1579 3067 3096 2199 Sugarcane 2285 3325 3130 1853
Bihar Maize 1874 1575 1126 1484 Sugarcane 2096 2250 1553 050 Wheat 1721 1860 998 852
Chhattisgarh Gram 2799 1450 2830 2050 Soybean 3978 1635 4356 1805 Wheat 2313 2145 2017 4443
Gujarat
Caster 4617 5172 3757 3580 Cotton 4540 4659 4396 3719 Ground nut 4871 4684 4027 3496 Sugarcane 4875 4865 4216 21611 Wheat 4082 4015 3681 3025
Haryana Cotton 4435 4439 3093 101 Mustard 4167 4286 3611 000 Wheat 4935 4497 3858 212
Karnataka Sugarcane 2771 2568 2723 1264
Maharashtra
Cotton 3370 2928 2991 3475 Ground nut 3355 3333 3312 2587 Soybean 3528 2280 3085 4080 Sugarcane 3712 3815 2848 3877
Odisha Moong 2178 2869 3589 3689 Sugarcane 2624 3309 3201 4849
Rajasthan Arandi 3684 4000 3916 4313
Impact Evaluation Study on ldquoNational Mission on Micro Irrigation (NMMI)rdquo
102
Cotton 5118 3750 4708 2765 Guwar 5605 4375 5250 4889 Mustard 3283 4373 4313 3433 Wheat 3025 3666 3923 3631
Sikkim Mustard 4286 2000 3600 000 Wheat 3333 2759 3600 556
Tamil Nadu Sugarcane 2879 3427 2873 990
UP Maize 2732 4662 2334 470 Sugarcane 2316 2200 3050 2877 Wheat 2538 3776 2484 4116
Uttarakhand Sugarcane 2562 2385 2088 2950 Source GAPL Survey It may be seen from the table 77 that among the non-horticulture crops also reduction in irrigation cost saving in electricity saving in fertilizer and increase in productivity was witnessed From the above it may be concluded that with the adoption of micro irrigation technologies significant increase has been observed in productivity enhancement in all the states for all the major crops being cultivated under the scheme Further reduction in input factors such as irrigation cost saving in electricity amp saving in fertilizer was also observed 511 Introduction of New Crops During the course of the study and field survey it was observed that the beneficiaries have switched to new crops mostly high value as enlisted in table 82 below with the adoption of micro irrigation technology In the fruit crops high density plantations having drip irrigation system have been adopted by some of the farmers
Table 81 Crops Adopted after Installation of MI System
Fruits Aonla Areca nut Banana Cashew nut Sapota Coconut Grapes Guava Litchi Mango Mosambi Orange Papaya Pineapple Pomegranate Strawberry Sweet orange watermelon
Vegetables Broccoli Bitter gourd Bottle gourd Brinjal Cabbage Capsicum Cauliflower Cucumber Chilli Ginger Okra Onion Spinach Papaya Potato Radish Tomato
Floricultural Marigold Tuberose (Rajnigandha) Rose Lilly
Other crop Cotton Groundnut Sunflower Turmeric Arhar Black gram Maize Moong Mustard Pulses Soyabean Sugarcane Urad Wheat
Impact Evaluation Study on ldquoNational Mission on Micro Irrigation (NMMI)rdquo
103
Table 82 Extent of Adoption of New Crops after Installation of MI System
State Total
Beneficiary No of Farmers
Introduced New Crops Farmers
Introduced New Crop () AP 672 278 4137 Bihar 516 8 155 Chhattisgarh 384 206 5365 Gujarat 576 67 1163 Haryana 320 315 9844 Karnataka 576 154 2674 Maharashtra 672 126 1875 Odisha 480 221 4604 Rajasthan 574 3 052 Sikkim 50 26 5200 Tamil Nadu 455 53 1165 UP 527 330 6262 Uttarakhand 90 2 222 Total 5892 1789 3036
Figure 11 Extent of Adoption of New Crops by Beneficiaries ()
It may be seen from the above table that almost all the beneficiaries of Haryana have shifted towards new crops with the adoption MI system followed by UP Sikkim Chhattisgarh Odisha and AP The lowest response was observed in Rajasthan Bihar and Uttarakhand which is due to the fact that MI systems in majority of the cases have been installed to irrigate horticultural crops
It is therefore recommended that special drives be taken to motivate the farmers in the state of Bihar Uttarakhand amp Rajasthan for crop diversification to accrue the full advantage of MI system
Impact Evaluation Study on ldquoNational Mission on Micro Irrigation (NMMI)rdquo
104
512 Increase in Farmerrsquos Income
The overall benefits accrued from the micro irrigation system are reflected in the income enhancement of the farmers All the surveyed states reported increase in farmerrsquos income by 20- 68 with an average increase of 485 The maximum increase in income has been reported in Gujarat followed by Chhattisgarh
Table 83 Increase in Farmerrsquos Income
State Income ( Rs ha)
before MI Income ( Rs ha)
after MI
Increase
in Income AP 60273 79929 3261 Bihar 31132 41333 3277 Chhattisgarh 62785 105059 6733 Gujarat 55703 93593 6802 Haryana 73917 117532 5901 Karnataka 82303 105061 2765 Maharashtra 68459 99786 4576 Odisha 61846 85660 3850 Rajasthan 125753 191731 5247 Sikkim 81510 111891 3727 Tamil Nadu 74100 98800 3333 UP 58495 87391 4940 Uttarakhand 140098 168234 2008 Total 976374 1386001 4195
Source GAPL Survey
Figure 12 Increase in the Income of Beneficiaries ()
Impact Evaluation Study on ldquoNational Mission on Micro Irrigation (NMMI)rdquo
105
513 Benefit-Cost Ratio The BC ratio has been based on the estimates of incremental return income from MI system that is taken into account the increase in individual farmerrsquos income and MI system cost and crop wise average increase in income and average MI cost for each state were worked out from the same MI system cost has been amortized equally for 10 years considering the economic life of the system for the same period The income enhancement of the beneficiary farmers after installation of the MI system has been attributed to MI system The Benefit-cost analysis was carried out for important crops in all the 13 states under study on the basis of data collected from sampled beneficiaries This ratio gives the estimates of returns on the investment made in MI system Performance in term of BC ratio varies from state to state even for the same crop due to varied reasons like agro-climatic conditions agronomic practices soil productivity system cost marketing of produce etc the BC ratio of installing micro irrigation system is above one across the states and across the crops which signifies the importance of MI system in net income enhancement of the farmers The state wise BC ratio of installing MI system for different crops is given in the table for important fruits vegetables amp flowers grown in the states under study
Impact Evaluation Study on ldquoNational Mission on Micro Irrigation (NMMI)rdquo
106
Table 84 Benefit Cost Ratio of MI System for Important Fruit Crops
Fruits AP Bihar Chhattisgarh Gujarat Haryana Karnataka Maharashtra Odisha Rajasthan Sikkim Tamil Nadu UP Uttarakhand Aonla - - - - - - - - 269 - 294 234 - Areca nut - - - - - 259 221 - - - - - - Banana 266 - 266 187 - 277 291 182 - 272 290 276 - Bel - - - - - - - - 209 - - - - Blackberry - 171 - - - - - - - - - - - Carrot - - - - - - - - - - 291 - - Cashew nut - - - - - - 270 259 - - 264 - - Coconut 226 - - - - 263 244 272 - - 251 - - Cucumber - - - - 206 131 - - - - - - - Custard Apple - - - - - 219 - - - - - - - Fig - - - - - 266 - - - - - - - Grapes - - - - - 258 293 - - - - - - Guava 242 297 - 269 212 204 294 256 229 294 - 286 276 Kadam - 121 - - - - - - - - - - - Kinnow - - - - 284 - - - 231 - - - - Lemon 267 - - 280 - 288 148 298 231 - 209 236 - Litchi - 111 - - - - - 252 - 267 - 272 227 Mango 284 226 - 292 - 257 265 245 273 - 275 295 287 Musk Melon - - - - 227 - - - - - - - - Oil Palm 229 - - - - - - 278 - - - - - Orange 240 - - - - - 215 - 287 280 - - - Papaya 133 125 242 - - 279 234 268 - - 230 274 - Peach - - - - - - - - - - - - 219 Pineapple - - - - - - 241 298 - - - - - Pomegranate 234 - - 242 - 209 266 231 297 - - - - Sapota - - - - - 294 - 299 - - 245 - - Strawberry - - - - 119 - - - - - - 297 - Tapioca - - - - - - - - - - 223 - - Water Melon - - 257 211 221 288 267 298 - - - - - Source GAPL Survey
Impact Evaluation Study on ldquoNational Mission on Micro Irrigation (NMMI)rdquo
107
Table 85 Benefit Cost Ratio of MI System for Important Vegetable Crops
Vegetable AP Bihar Chhattisgarh Gujarat Haryana Karnataka Maharashtra Odisha Rajasthan Sikkim Tamil Nadu UP Uttarakhand Alovera 145 - - - - - - - - - - - Arabi - - - - - - 178 - - - - - Bitter Gourd 200 268 214 295 - - 239 - - 286 258 - Boda 112 251 - - - - - - - - - - Bottle Gourd 124 190 234 239 - - 267 133 - - 257 - Brinjal 215 218 144 145 185 215 298 238 230 257 166 257 - Broccoli - - 017 - - - - - - - - - Cabbage - 274 217 - - 250 218 - 167 275 222 - Capsicum 262 262 - 274 - - 161 - - - 229 - Carrot - - - 206 - - - 251 - - - - Cauliflower 117 - - 288 268 - 256 229 229 285 274 - Chilli 156 172 210 265 258 233 273 228 179 259 181 282 - Cucumber - 162 - 132 198 - 149 222 - - - - Fennel - - 281 - - - - - - - - - Garlic - - - 069 - - - 246 - - - - Ginger 220 - - - - 236 - 226 - - - - - Kundru - 125 - - - - - - - - - - Okra 170 219 238 189 174 281 271 287 - 225 232 279 - Lemon - - - - - - 224 - - - - - Methi - - - 190 - - - - - - - - Onion - 236 176 210 - 270 293 239 - 251 193 - Palak - - - - - - - - - - 183 - Pointed Gourd - - 182 - - - - - - - - - Peas - - - 197 - 236 298 - - - 235 269 Potato 182 248 260 226 270 233 - 261 282 - 158 286 - Pumpkin 135 146 013 - - - - 182 - 159 - - Radish - - - - - - - - - - 238 - Cluster Bean - 174 - - - - - - - - - - Round Guard - - - 254 - - - - - - - - Tomato 252 265 242 200 230 208 294 214 294 238 232 278 Sponge Guard - 137 - - - - - 274 - - - - Turmeric 179 - - - - - - - - - - - SourceGAPLSurvey
Impact Evaluation Study on ldquoNational Mission on Micro Irrigation (NMMI)rdquo
108
Table 86 Benefit Cost Ratio of MI System for Important Floriculture Crops
State Flower Name BC Ratio AP Lilli 121 Bihar Marigold 218
Gujarat Jasmine 272 Marigold 167
Haryana Gerbera 292 Rose 141
Karnataka Marigold 225 Rose 160
Odisha Rajnigandha 255 Rajasthan Rose 294 UP Marigold 276 Uttarakhand Gladiolus 272
Performance in terms of BC ratio varies from state to state and crop to crop Thus it may be concluded that these analysis confirm that the farmers are getting higher income with the adoption of MI technology 514 Increase in Area The irrigated area has increased in all the surveyed states after the introduction of NMMI Scheme Irrigated area has been increased by 841 for total surveyed farmers in the given states The state of Maharashtra has topped the list with 2228 growth in irrigated area followed by Chhattisgarh There has been very little growth in case of Sikkim UP Uttarakhand amp Karnataka
Table 87 Percent Increase in Irrigated Area on Installation of MI System
State Irrigated Area (Ha) Percent
Increase in Irrigated
Area Before MI After MI
AP 101302 113895 1243 Bihar 129482 140935 885 Chhattisgarh 49454 57172 1561 Gujarat 135837 154944 1407 Haryana 123318 136208 1045 Karnataka 103763 106449 259 Maharashtra 102510 125349 2228 Odisha 124139 138254 1137 Rajasthan 100536 107806 723 Sikkim 6038 6079 067 Tamil Nadu 70928 74086 445 UP 158306 160350 129 Uttarakhand 25852 26265 160
Impact Evaluation Study on ldquoNational Mission on Micro Irrigation (NMMI)rdquo
109
515 Potential area that can be brought under Micro Irrigation The potential for Micro Irrigation for each surveyed district has been worked out on the basis of field survey and secondary information
The following information has been taken account to work out MI potential from Secondary sources
A Total Irrigated area B Paddy area C Area under MI
Total Potential area has been worked out by subtracting the area under MI and Paddy from total irrigated area of the district considering that paddy area has no potential for the MI system This potential area has been depicted as percentage of total irrigated area The district wise potential for MI as well as the crop potential is given in the table below
Table 88 District wise Potential for Installation of MI System in Study Area
State District
Area Based on Secondary Data Potential Crops Under MI
Irrigated Area
(ldquo000 ha)
Area under MI (ldquo000 ha)
MI Potential
Area (ldquo000 ha)
MI Potential Area ()
Fruits Vegetables Other Crops
AP
Adilabad 10152 2544 7608 7494
Mango Citrus and Banana
Brinjal Chilli Tomato and Okra
Maize Sugarcane Cotton and Ground Nut
Anantpur 24721 12773 11948 4833 Krishna 18067 1572 16495 9130 Medak 9955 4946 5009 5031 Nalgonda 27570 7180 20390 7396 Nellore 8464 2158 6306 7450 Vishakhapatnam 22077 825 21252 9627
Bihar
Gaya 4979 253 4726 9492 Mango Kadam and Litchi
Okra Potato Cauliflower and Brinjal
Sugarcane Wheat and Maize
Madhepura 48788 095 48693 9980 Rohtas 8601 339 8262 9605 W Champaran 6238 542 5696 9131
Chhattisgarh
Durg 7750 2768 4982 6428 Banana Papaya and Watermelon
Cauliflower Tomato Bitter Gourd and Okra
Wheat Gram and Soybean
Jashpur 1109 068 1041 9387 Kanker 1377 1222 155 1130
Sarguja 1194 303 891 7462
Gujarat
Anand 10410 238 10172 9771 Banana Papaya Pomegranate and Watermelon
Chilli Tomato Onion Potato and Fennel
Cotton Sugarcane Wheat Groundnut and Caster
Banaskantha 39630 8150 31480 7943 Bharuch 9264 1073 8191 8842 Bhavnagar 16880 2788 14093 8349 Jamnagar 8330 1728 6602 7926 Mehsana 19698 624 19074 9683
Haryana
Bhiwani 24937 2429 22508 9026 Kinnow Lemon Watermelon and Muskmelon
Tomato Cucumber and Potato
Cotton and Wheat
Fatehabad 11443 110 11333 9904 Karnal 12960 086 12874 9934
Sirsa 14587 631 13956 9567
Karnataka Belgaum 45594 4394 41200 9036 Banana Areca Tomato Pepper and
Impact Evaluation Study on ldquoNational Mission on Micro Irrigation (NMMI)rdquo
110
Bellary 7348 397 6951 9459 nut Pomegranate Mango and Papaya
Chilli and Ginger
Turmeric Bidar 5873 2322 3551 6046 Chitradurga 2243 2963 1520 6788 Hassan 8661 1175 7486 8643 Mysore 13194 1376 11818 8957
Maharashtra
Ahemadnagar 26000 3049 22951 8827
Banana Mango Citrus and Grapes
Tomato Chilli and Brinjal
Cotton Sugarcane and Soybean
Jalgaon 23909 7611 16298 6817 Jalna 7850 2660 5180 6611 Kolhapur 27500 453 27047 9835 Ratnagiri 1500 111 1389 9262 Wardha 1630 1630 810 4971
Odisha
Bhadrak 2775 104 2671 9625 Mango Banana Cashew nut and Papaya
Tomato Brinjal Okra Bottle gourd and Cauliflower
Moong and Sugarcane
Ganjam 3600 299 3301 9168 Mayurbhanj 4105 553 3552 8654 Nayagarh 2966 164 2802 9447 Boudh NA 201 NA NA
Rajasthan
Hanumangarh 31071 1505 29566 9516 Orange Kinnow Mango Bel Guava and Lemon
Onion Carrot and Tomato
Cotton Arandi Guar Mustard and Wheat
Jalore 29081 11897 17184 5909 Jhalawar 23349 1569 21780 9328 Jodhpur 31000 5712 25288 8157 S Madhopur 19448 676 18772 9652 Udaipur 7139 580 6559 9187
Sikkim
East Gangtok 697 NA
NA NA Orange and Guava
Tomato Brinjal Cauliflower and Barackoli
Wheat Mustard and Turmeric Mangaon 135
NA NA NA
Tamil Nadu
Erode 13195 1090 12105 9174 Banana Tapioca Coconut Aonla and Carrot
Chili Brinjal Tomato Potato Carrot and Turmeric
Sunflower
Nilgiri 650 213 437 6729 Thiruvarur 6036 094 5942 9844 Tirunelveli 6429 299 6130 9534
Villupuram 14167 550 13617 9611
UP
Aligarh 16441 005 16436 9997
Banana Mango and Guava
Tomato Potato Chilli Peas Brinjal and Arbi
Maize and Wheat
Ballia 11578 025 11553 9979 Jhansi 17920 099 17821 9944 Kannauj 13016 019 12997 9985 Saharanpur 21567 078 21489 9964 Siddharth Nagar 10212 038 10174 9963
Uttarakhand
Udhamsingh Nagar 15330 NA - - Mango Peach Litchi and Guava
Peas and Tomato Haridwar 6088 NA - -
Nainital 3780 NA - -
Source Data Portal India and GAPL Field Survey Analysis
516 Employment Opportunities
The NMMI has helped to widen the food basket of the country with significant contributions coming from the bringing more area under irrigation and with judicious use of water New farm practices and innovations with support of government have encouraged the farmers to shift toward high value a crop which in turn gives better income and more employment opportunities
Impact Evaluation Study on ldquoNational Mission on Micro Irrigation (NMMI)rdquo
111
5161 On Farm Employment Generation Following are the sectors of on farm employment opportunities for farmers and related stakeholders being generated through implementation of NMMI
Higher production requires more man days for operations like harvesting on farm handling and logistics
Soil water quality and inputs testing laboratory service center Plant protection service center (Pest surveillance diagnostic and control services
including Integrated Pest Management) Maintenance repairs and custom hiring of agricultural implements and machinery
including micro irrigation systems (sprinkler and drip) Agri Service Centre includes at least the above three activities (Group Activity)
5162 Off-Farm Employment Generation
With the initiation of National Mission on Micro Irrigation (NMMI) not only the farm employment has increased but it has generated lot of off-farm opportunities which would further give more employment in the future This initiative also aims at farm mechanization which not only includes tractors and its implements but also use of other components such as pumps micro irrigation etc An attempt has been made in this section to estimate the additional employment generated from various initiatives available under mission Apart from this indirect labors for the logistic service are also generated to accomplish the above mentioned activities Each of the suppliers has 5-7 skilled and semi-skilled employees to support in installation of the system training after sales service etc Services of casual labor are also hired during the time of installing the system which results in indirect opportunities 517 Impact on Employment The implementation of NMMI scheme in the different states generated employment opportunities mainly due to increase in production which requires more of the man days as well as post handling operations micro irrigation resulted in considerable savings of labor as is evident from the data cited in table 93 This is true for pre-harvest practices The increased yield due to MI systems called for involvement of more labor for handling the harvesting and post-harvest operations
The basis for computing the manpower involved before and after installation of MI system related primarily to application of irrigations hoeing weeding fertilizer insecticide pesticide applications harvesting threshing assembling cleaning grading packaging transportation logistics etc It may be seen from the above table that in all the states under study have shown decrease in utilization of the labor in pre-harvest practices that is labor saving on irrigation weeding fertilization and other operations It shows that the use of
Impact Evaluation Study on ldquoNational Mission on Micro Irrigation (NMMI)rdquo
112
human labor after the use of micro irrigation has decrease significantly and ranges between 741 to 1875 percent
The employment generations through adoption of micro irrigation in the farms by the farmers before the adoption of the MI and after the installation and results have been presented in the following table below
Table 89 Change in Manpower Requirement for Cultivation (per ha per crop cycle)
State Pre harvest practices Harvesting Post-harvest handling Total Man dayscrops No of man days
before NMMI
No of man days after
NMMI
Change in man Power
()
No of man days
before NMMI
No of man days after
NMMI
Change in man Power
()
No of man days
before NMMI
No of man days after
NMMI
Change in man Power
()
No of man days
before NMMI
No of man days after
NMMI
Change in man Power
() AP 49 41 -1633 36 42 1667 16 19 1875 101 102 099 Bihar 52 45 -1346 29 35 2069 13 16 2308 94 96 213 Chhattisgarh 59 50 -1525 31 36 1613 20 24 2000 110 110 000 Gujarat 48 39 -1875 35 41 1714 20 24 2000 103 104 097 Haryana 40 35 -1250 30 35 1667 16 21 3125 86 91 581 Karnataka 48 42 -1250 34 40 1765 19 23 2105 101 105 396 Maharashtra 58 52 -1034 33 39 1818 23 29 2609 114 120 526 Odisha 46 41 -1087 32 37 1563 18 19 556 96 97 104 Rajasthan 58 53 -862 25 33 3200 18 20 1111 101 106 495 Sikkim 54 50 -741 29 33 1379 19 24 2632 102 107 490 Tamil Nadu 50 44 -1200 27 32 1852 21 23 952 98 99 102 UP 55 46 -1636 25 32 2800 20 24 2000 100 102 200 Uttarakhand 47 41 -1277 29 36 2414 23 29 2609 99 106 707
The table further reveals that in post-harvest operations right from harvesting to handling and disposal of the produce there is an increase in labor utilization and it ranges between 2119 to 5023 percent From here it may be concluded that the decrease in utilization of the labor in the pre harvest activities are offset by the increase in the production which requires more of the labor for harvesting assembling and grading handling transportation and disposal of the produce
Impact Evaluation Study on ldquoNational Mission on Micro Irrigation (NMMI)rdquo
113
6 Conclusions amp Recommendations Micro irrigation technologies are being promoted in India by the central and state governments by providing different kinds of financial institutional and technical support These technologies are promoted primarily because of (1) as a means to save water in irrigated agriculture (2) as a strategy to increase income and reduce poverty and (3) to enhance the food and nutritional security of rural households Despite the reported significant economic advantages and the concerted support of the government and NGOs the current micro irrigation area in India remains an insignificant proportion of its potential Rising demand for irrigation water in the face of its inefficient use amid concerns of growing water scarcity has brought into renewed focus the need for conserving water and improving water use efficiency
The real thrust on promoting MI adoption largely started with the recommendations of the Report of the Task Force on Micro Irrigation in 2004Their report sought to increase the emphasis on MI technology and recommended a broader framework viewing MI technologies as a part of the overall water management strategy It also recommended that more financial resources for subsidies with state governments taking up 10 percent of the cost while the central funds would account for 40 percent and advised greater flexibility for states to determine their appropriate implementation structure and institutional mechanisms for subsidy disbursement (Ministry of Agriculture 2004) Based on these recommendations in 2006 the Centrally Sponsored Scheme (CSS) on MI was launched The `National Mission on Micro Irrigationrsquo (NMMI) in 2010 revising and reformulating the Centrally Sponsored Scheme (CSS) on Micro-Irrigation which was introduced
In this study an attempt is made to study the Impact Evaluation of micro irrigation in 13 states of India by using the available information and field surveys of 7400 respondents inclusive of both adopters and non-adopters
Owing to promotional schemes introduced by the state and central governments the area under micro irrigation has increased from 11817 ha in 2005-06 to over 361 million ha in 2012-13 In spite of having many advantages over conventional method of irrigation the area under micro-irrigation presently occupies only about 571 percent of the total irrigated area As per the latest information only 285 percent of total irrigated area under drip irrigation and 286 percent is under sprinkler irrigation
Government of India Ministry of Agriculture Department of Agriculture and Cooperation assigned the study on ldquoImpact Evaluation of National Mission on Micro Irrigationrdquo (NMMI) scheme to access the performance of the programme implementation and access the impact of this scheme on increase in farmersrsquo income through adoption of the MI system The study was conducted in 13 states comprising of 64 districts from the sampled states namely AP Bihar Chhattisgarh Gujarat Haryana Karnataka Maharashtra Odisha
Impact Evaluation Study on ldquoNational Mission on Micro Irrigation (NMMI)rdquo
114
Rajasthan Tamil Nadu Uttar Pradesh Sikkim and Uttarakhand The field survey to get the first hand information was conducted for a total sample of 7400 comprising beneficiary and non-beneficiary farmers in these selected states through adopting stratifiedndashpurposive-sampling design Apart from this information was also collected from system suppliers government officials
Major Outcomes of the Study
A Current Status i The Scheme since its inception in 2005-06 has made rapid stride across the
country It has succeeded in bringing about 356 million ha area under micro irrigation in the sampled 13 states7 The physical targets for the period 2005-06 to 2012-13 were fixed to the extent of 383 million ha out of which 356 million ha has been brought under MI The Targets and achievements for financial outlay were Rs50128 and Rs50065 crores respectively The overall physical and financial achievements thus come out to be 9299 amp 9987 percent The extent of achievements however varied among different states States like Bihar Karnataka Odisha Rajasthan and Sikkim achieved more than 90 percent of the set physical targets Uttarakhand could achieve only 21 percent of physical and 31 percent of the financial targets Other States such as AP Chhattisgarh Gujarat Haryana Maharashtra and Tamil Nadu succeeded to achieve more than 70 of their physical targets
ii AP Gujarat amp Maharashtra are leading states in the every aspect of performance the different activities involved in the process streamlined in the guideline of NMMI While Bihar UP Sikkim amp Uttarakhand states are lacking in terms of the functions mentioned in the guidelines
B Pattern of Assistance
i Most of the states are giving subsidy of more than 70 percent for installation of
MI system However comparison of various states and analysis clearly demonstrates that increased subsidy had no significant impact on the increase of area coverage under MI system Farmers in Maharashtra Gujarat and Haryana were 223 140 and 100 percent respectively in case of sampled beneficiaries while pertinent subsidy component in these states was 60 50 and 90 percent respectively Similarly area coverage in Rajasthan Tamil Nadu and Bihar was noted to be 73 45 and 31 percent respectively and the corresponding figures
7 Ministry of Agriculture
Impact Evaluation Study on ldquoNational Mission on Micro Irrigation (NMMI)rdquo
115
for subsidy were 90 75 and 90 percent The aforesaid observation clearly suggests that increase in subsidy component beyond a limit has little or no impact on area coverage under MI system The relationship between area expansion under MI and quantum of subsidy has been computed considering beneficiariesrsquo data on area expansion in different states before and after adoption of MI system Hence the relationship of subsidies with area expansion as such does not refer to any specific year
ii The efficiency of scheme implementing agency is very high as most of the farmers have reported that their applications are processed and sanctioned in less than 40 days as against 60 days specified in the guidelines Similarly in most of the sample states beneficiaries are reported to be satisfied with respect to the procedure for filing the application till disbursement of the subsidy amount
iii Presently subsidy is limited to maximum area of 5 hectare per beneficiaries which is an impediment to the growth of area under micro-irrigation The data on size and distribution of operational land holdings in the country also suggest that medium and large farmers accounted about 15 percent of total land holdings thus occupying approximately 5542 percent of the total area
iv All the states have reported convergence of Mission interventions with different schemes of the Government of India and State level programmes Most of the districts have converged NFSM interventions with programmes such as RKVY ICDP Farm Mechanization NHM and other programmes
C Sources of Awareness and Reasons of Non-adoption i The major sources of awareness about the NMMI scheme were through service
providers suppliers followed by fellow farmers extension workers
ii The non-beneficiaries farmers had mix responses for not adopting the scheme because of lack of awareness regarding subsidies lack of technical knowledge high capital cost and system being not economical therefore not required
iii As per primary survey of the sampled beneficiaries about 59 percent of the respondents were small amp marginal farmers and 13 percent were women farmers who have taken the advantage of the Scheme
Impact Evaluation Study on ldquoNational Mission on Micro Irrigation (NMMI)rdquo
116
D System Cost and Sources of Fund i On an average the cost of system per hectare incurred by the beneficiaries
ranged between Rs 5445736 to Rs 7208631 in drip system and Rs 20481 to Rs 28171 in sprinkler irrigation system depending on the cropping pattern crop spacing etc in the states under study
ii Almost in all states farmer beneficiaries use their own funds for contributing margin money (9866) Other sources albeit a small proportion constitutes banking KCC amp money lenders
iii Most of the farmers borrowed money at less than 10 percent of rate of interest from banks and KCCs
E Technical Observations about MI System i It was observed that about 64 percent of the beneficiaries installed drip system
34 percent sprinkler system and 2 percent have installed both the systems in their fields The highest proportion of drip was observed in Karnataka whereas adoption of sprinkler was higher in Bihar
ii The majority of the beneficiaries (about 6887) farmers of all the 13 states have got their soil and water tested In Gujarat UP Maharashtra amp Rajasthan soil testing adopted by 6927 5275 7337 and 7913 of respondents respectively
iii More than 70 percent of the respondent farmers of AP Gujarat Sikkim and Odisha were using in-line drip irrigation system whereas more than forty five percent beneficiaries of Haryana and Uttarakhand reported to practice on-line drip irrigation system
iv The farmers were using screen filters centrifugal separators hydro-cyclone filter disc filter sand media filters depending on the need The data reveals that screen filters are being commonly used by the beneficiaries in most of the sampled states except Haryana where more than 65 percent beneficiaries are using hydro-cyclone and screen filters in combination due to the water quality as they are using canal water
v There is an increasing emphasis on conserving water and using it more efficiently Micro irrigation technologies based on drip and sprinkler irrigation systems provide some hope for achieving this The government has been
Impact Evaluation Study on ldquoNational Mission on Micro Irrigation (NMMI)rdquo
117
providing substantial financial incentives in the form of capital cost subsidies to farmers to invest in these technologies Most drip equipment sales in the study areas are subsidy driven Manufacturers and market estimates suggest that most of the MI system sales are subsidy linked Partly as a result of the existing subsidy delivery mechanism drip technology has failed to capture the kind of market that would have been expected given the many advantages and water saving potential the technology offers
vi The farmers in almost all the states reported that components of MI System met the BIS norms The average figure for all the sampled states where system components were as per the BIS norms came out to be around 98 percent
vii As far as overall designing of the system is concerned it was found that the systems were well designed except in case of Sikkim and Odisha where the systems were functional but not able to meet the farmers expectation It is therefore suggested that extensive involvement of the extension staff may be ensured to install the system as per requirement of ground conditions and once the system is installed regular monitoring particularly during the warranty period of the installation be carried out so that defects if any be got rectified by the suppliers
F After Sales Service
i On an average 91 of the beneficiaries across the sampled states reported that
after sales services are being provided to them amp also they receive the services at the required time Most of the sampled beneficiaries revealed that they are getting warranty of the MI system
ii In almost all the states the sampled beneficiaries revealed that no technical support guidance on agronomic practices are extended to the users as they generally tell to take the help of extension agencies
G Impact Analysis i The irrigated area has increased in all the surveyed states after the introduction
of NMMI Scheme The Irrigated area within the 5892 sampled beneficiaries of the 13 states before adoption of MI system was found to be 1332086 ha which became 1444147 ha after adoption of MI system It is therefore concluded that total percentage increase in irrigated area with the sampled beneficiaries in 13 states after adoption of MI system was noted to be 841 from same source of water Maharashtra has topped the list with 2228 growth in irrigated area
Impact Evaluation Study on ldquoNational Mission on Micro Irrigation (NMMI)rdquo
118
ii Farmers of all the states have shown an increase in area under horticulture crops after the adoption of the system The cropped area after implementation of NMMI has shown an increase which may be due to utilization of degraded marginal land into cultivable land amp increase in cropping intensity
iii Scheme has performed well in terms of reduction in irrigation cost and significant cost saving has been observed for irrigation in all the surveyed states Irrigation cost is reduced by 20-50 with average of 323 Reduction in electricity consumption after installation of MI system Average electricity consumption has been reduced by about 31 after using the micro irrigation system Saving of fertilizers with averages reduction of about 28 in total fertilizer consumption in the surveyed states Fertilizer saving vary from 7- 42
iv Micro irrigation has generated benefits to the farmers in terms of enhancement of the productivity The average productivity of fruits and vegetables has increased about 423 and 528 respectively
v The overall benefits accrued from the micro irrigation system are reflected in the income enhancement of the farmers All the surveyed states reported increase in farmerrsquos income in the range of 20 to 68 with an average increase of 485
vi Given the high benefit-cost ratios which is more than one in almost all crops and states we also find that the present form for delivery of public support in the nature of a capital cost subsidy is constraining both to the widespread adoption of the technology by farmers and to innovation in technology development and marketing This has made the entire gamut of manufacturing sales adoption and use of drip technology subservient to government support The present study has put forward an alternate system wherein the subsidy is given directly to farmers willing to invest in a drip system With a given amount of funds available the proposed model can provide subsidies to a much larger number of farmers can bring a much larger area under drip irrigation resulting in lower subsidy outgo per hectare of drip irrigated area would still incentivise the farmers to invest in drip systems lower the cost of subsidy outgo easy to manage and govern less prone to interference and whims and fancies of officials and lead to more efficient use of available subsidy without distorting the market Thus on all indicators the proposed subsidy scheme of direct delivery far outweighs the existing subsidy scheme of subsidizing the manufacturers in the name of the farmersBC ratio of installing micro irrigation system is above one across the states and across the crops which signifies the importance of MI system in net income enhancement of the farmers The BC ratio was observed to
Impact Evaluation Study on ldquoNational Mission on Micro Irrigation (NMMI)rdquo
119
be highest in Odisha among fruits amp vegetables whereas in flowers Rajasthan amp Haryana beneficiary farmers achieved higher BC ratio
vii The positive outcomes have made the food security effective due to the increase in the production and productivity of different crops and increased area under irrigation from same source of water Area under horticulture crops as well as nutritional security has also enhanced
viii The NMMI has helped to widen the food basket of the country with significant contributions coming from the bringing more area under irrigation and with judicious use of water New farm practices and innovations with support of government have encouraged the farmers to shift toward crops giving higher income
H Employment Generation i Beneficiaries of all the states under study have shown decrease in utilization of
the labor in pre-harvest practices that is labor saving on irrigation weeding fertilization and other operations It shows that the use of human labor after the use of micro irrigation has decreased significantly and ranges between 741 to 1875 percent But in post-harvest operations right from harvesting to handling and disposal of the produce there is an increase in labor utilization and it ranges between 2119 to 5023 percent due to the increase in the production which requires more of the labor for harvesting assembling and grading handling transportation and disposal of the produce
I Training and Capacity Building i Among the surveyed states more than 90 percent of the sampled beneficiary
farmers in the state of Haryana Karnataka Sikkim amp Tamil Nadu had training on different aspects of MI System whereas farmers of Bihar amp Odisha only 20 amp 52 percent of the beneficiaries have received the training
ii Results of survey revealed that the system suppliers manufacturers are the major sources for imparting training as more than 90 percent of the farmers received training from them Very less proportion of the respondents reported to have training from other sources such as SAUs KVKs etc The participant beneficiaries revealed that the duration of training period generally was of 1-2 days Almost all the respondents of Tamil Nadu UP Chhattisgarh Haryana were given training materials during the training while few beneficiaries of the Bihar and Uttarakhand Karnataka were provided such training materials
Impact Evaluation Study on ldquoNational Mission on Micro Irrigation (NMMI)rdquo
120
iii Key areas for training were operation and maintenance of the system adoption
of package practices under MI and opportunities for introducing new crops Demonstration was other means of motivation and capacity building It was also found to be a good means of promotion
J Promotional Activities
i The farmers of the majority of the states acknowledged that the implementing
agencies are promoting NMMI schemes in local language however were not aware of the dedicated website for MI scheme in their state It is due to the fact that farmers do not have access or willingness to use internet for information gathering
ii On farm demonstrations particularly in rural area where exposure is limited are very important means in educating the rural folks It was noted that maximum beneficiaries of Haryana (98) followed by Sikkim (80) Rajasthan (64) and Uttarakhand (63) have visited the demonstration laid out in the nearby areas Whereas majority of the farmers of AP UP TN Karnataka Gujarat Bihar have reported that they have not visited any demonstration farm It is therefore suggested that more efforts may be put to expose the farmers regarding demonstration of MI system and its benefits
Thus it may be concluded that positive outcomes in terms of crop productivity enhancement due to implementation of MI Scheme have contributed significantly to the food requirements The NMMI has helped to widen the food basket of the country with significant contributions coming for bringing more area under irrigation and with judicious use of water New farm practices and innovations with support of government have encouraged the farmers to shift forward crop giving higher income
It is noteworthy that the incremental net returns were observed to be generally higher for cash crops such as fruits vegetables ground nut cotton etc than for food crops viz bajra and wheat This is in conformation with the results of research studies
Key Recommendations and Policy Implications
For the food security and sustainability to match the growing population priorities are to bring more area under irrigation through judicious use of irrigation water Keeping this aspect in view the Government of India launched the Central Sponsored Scheme for Micro Irrigation in 2005-06 which was up scaled as National Mission on Micro Irrigation in 2010 Micro irrigation system being capital intensive in nature and the adoption cannot be increased without providing subsidy Subsidy can be a necessary condition for encouraging the adoption of micro-irrigation but cannot be a sufficient condition for sustaining the
Impact Evaluation Study on ldquoNational Mission on Micro Irrigation (NMMI)rdquo
121
growth of it as many other factors determine the adoption of the same Even though subsidy is not needed to enhance the economic viability of the system it is still needed to enhance the incentive for the widespread adoption of MI particularly among the resource poor farmers (marginal and small categories) Therefore there is a need to find out the ways and means to convince the farmers about the economic and social feasibility of micro-irrigation Since it involves relatively higher amount of fixed investment farmers often ask the questions regarding the payback period viability water saving and the productivity gains It appears that these questions arise mainly because of poor exposure about the social and economic advantages of the technology Thus efforts are needed to convince the farmers through quality extension network as Indiarsquos highly successful green revolution was also the result of extension innovations as much as technology Considering the fast decline of irrigation potential and competing demand for water from different sectors all possible efforts are needed to increase the adoption of water saving technologies so as to avoid water scarcity in the future
Given the vast potential benefits of micro-irrigation and fast decline of availability of water for irrigation in the country a number of technical and policy interventions are required to be introduced so as to increase the adoption of micro-irrigation in India The needed recommendations and interventions are presented below
A Scheme Related 1) The rate of subsidy provided under NMMI through central government is fixed
uniformly for different categories of farmer with a limit of 5 hectare This needs to be restructured as about 15 of the large and medium farmersrsquo accounts for more than 5542 of the land in India Therefore this limit of five hectares needs to be enhanced for extending the subsidy
2) States often compete with each other to increase the subsidy component However it has been noted that higher subsidy does not necessarily lead to more area coverage under MI system as the highest increase in area under MI has been achieved by states which offer subsidy in the range of 50-75 percent eg Maharashtra Chhattisgarh Gujarat and Odisha In case of AP which increased subsidy from 70 to 90 percent in 2011-12 the additional area to come under MI in fact decreased as compared to the previous years It is therefore recommended that the states should be advised to seriously consider that the quantum of subsidy should preferably be not more than 50-70 percent including state and central share
3) No uniform pattern is being followed by states for implementation of this scheme It has been observed that in some states more than one department are involved in parallel eg Karnataka where it is being implemented by both agriculture and horticulture departments In such cases there is often lack of coordination which adversely affects
Impact Evaluation Study on ldquoNational Mission on Micro Irrigation (NMMI)rdquo
122
the outcome of the scheme It has also been observed that where a single department is designated as the implementing agency (eg horticulture or agriculture) it does not pay adequate attention to the crops coming under the purview of other departments Perhaps one of the best implementation strategies is to designate an independent Special Purpose Vehicle (SPV) on the pattern of Gujarat (GGRC) and AP (APMIP) States may be encouraged to replicate such a strategy
4) One of the major reasons for the slow growth of micro-irrigation in India is the high initial investment In spite of availability of subsidy from state agencies majority of the farmers are reluctant to invest in micro-irrigation system even in horticulture crops which is highly suitable for drip irrigation Therefore micro-irrigation system should be tailored made ie planned and designed based firmly on location specific parameters to reduce the cost of installation
5) Micro irrigation System is mostly promoted through subsidy schemes and not as an on-farm water and land management strategy In certain states under subsidy scheme the requisite consideration have not been given in respect of field size shape topography type and location of water source seasonal fluctuations type of soil and crop to be grown As a result in certain cases the subsidy may not match the specific situation of an individual farmer consequently the system may not match the site specific situations of an individual farmers consequently the system may not operate to the complete satisfaction of the farmer
B Technology Related 1) There is a need to establish a Central Testing Facility (CTF) to deal comprehensively with
the design development and testing of all equipments devices machines used in micro irrigation systems using state-of art technology It is suggested that the Govt may consider contacting regular and random technical audit of the system to cover about 2-3 percent beneficiaries within first and second year of the installation This will keep check on to quality and suppliers will be more vigilant to supply good quality of system
2) It is suggested that the implementing agencies should be more vigilant regarding warranty and after sales service of the system provided by the suppliers The question of releasing 10 percent of the cost of the system after one year subject to satisfactory performance of the system as certified by the beneficiary may be considered Maintenance manual in vernacular language should be made available to the beneficiaries at the time of installation of the system
3) It is observed that the cost of micro-irrigation accessories such as emitters filters laterals etc vary between shops and places Sometimes farmers do face problem in
Impact Evaluation Study on ldquoNational Mission on Micro Irrigation (NMMI)rdquo
123
getting spare parts in time It is necessary to provide quality materials in time for farmers for the speedy adoption of micro-irrigation
4) Inadequate information about the operation maintenance as well as the usefulness of micro irrigation is one of the main reasons for its uneven spread across regions in India Farmers still do not have full knowledge regarding the usefulness of the micro irrigation Even the adopters do not know fully how much of subsidy is available per hectare for different crops
5) Clogging of drippers mainly due to poor quality of water helps in bacterial growth which can be controlled by using chlorination which acts as a powerful oxidizing agent and vigorously attack micro-organisms such as algae fungi and bacteria Also acid is injected into drip irrigation system to lower the pH of the irrigation water and this helps in preventing the precipitation of salts such as calcium carbonate magnesium carbonate or ferric oxide It has been observed during the course of survey that the availability of sulphuric acid in the nearby towns is a major constraint and farmers are forced to purchase new spares by discarding clogged drippers Recently some farmers have started applying phosphoric acid to get dual benefit such as flushing of impurities and adding P fertilizer to the soil but the same is not recommended and also not very effective It is therefore recommended that system suppliers should make acid available to the growers as part of their after sales service obligation It is realized that the normal acid treatment does not help to mitigate the problem Therefore studies need to be carried out to devise de-logging measures in such areas
C Awareness and Capacity Building
1) The extension network currently operated mainly by government agencies does not
seem to be making significant impact on the adoption of this technology Therefore there is a need to revamp the entire extension network by involving the MI system manufactures in order to increase amp improvise the existing quality of extension services
2) System manufacturers should be involved intensively in promoting micro-irrigation by introducing frequent demonstration at farmersrsquo field and strategic locations in the district state The micro Irrigation system manufacturers should be involved in providing advice on agronomic packages to the farmers so as to encourage the adoption of micro irrigation at a large scale
3) Since MI system suppliers are one of the major sources of creating awareness among potential beneficiaries their involvement in laying down demonstration may be increased Similarly imparting training on technical and operational aspects of the system should be included as mandatory part of the training of the farmers by the
Impact Evaluation Study on ldquoNational Mission on Micro Irrigation (NMMI)rdquo
124
system suppliers The training may also include aspects of packages of practices which may be standardized by the SAUs amp other related organization and supplied to system suppliers for further dissemination to the farmers
4) Awareness on MI system is low in states like Bihar UP and Odisha Special drive is needed for exposure visits trainings to make them aware about the benefits and operation of the system The number of demonstration farms should also be increased
5) It is understood from the field study that the officials who are involved in promoting micro-irrigation technology under the GoI Scheme have inadequate knowledge about the technical and other details of MI Therefore the state government extension staff need to undergo lsquoRefresher Courses and exposure visitsrsquo to have basics of micro-irrigation thereby enabling their role in the implementation of the scheme
D Follow up Action 1) Though micro-irrigation has been in use in different States since mid-eighties State-
wise potential area is not estimated as of today Therefore it is essential to prepare State-wise and crop-wise potential area for MI A detailed estimate on State-wise potential would be useful to fix the target to be achieved and further to develop a road map for MP adoption in the country
2) It is evident from field study that capital cost required to install micro irrigation system is relatively high Because of this reason considerable percentage of farmers have expressed that they are unable to adopt this technology for low value crops There has been a significant development in the MI technology and efforts should be on developing and popularizing low cost technologies This would help reducing the cost of the system and increasing the adoption of micro-irrigation at a large scale and at least one percent of the outlay on micro-irrigation needs to be earmarked for micro-irrigation research
The information regarding all the activities under NMMI scheme at national and state level should be under public domain The information available at NCPAH website is qualitative and it should be quantitative to make it more clear and informative Similarly information at state level is hardly available in the website and it should be mandatory for implementing agencies to host their websites as is being done in case of Tamil Nadu
Impact Evaluation Study on ldquoNational Mission on Micro Irrigation (NMMI)rdquo
125
References Ahuja Usha Ram Singh PKJoshi and Neelu Nanwani 2012 Micro Irrigation Economics and Outreach in Haryana Chandrasekaran M and D Suresh Kumar 012 Micro Irrigation Economics and Outreach in Tamil Nadu
Dhawan BD 2000 Drip Irrigation Evaluating Returns Economic and Political Weekly 35 42 (Oct 14-20 2000) pp 3775-3780 Dhawan B D 2002 Technological change in irrigated agriculture A study of water saving methods New Delhi Commonwealth Publishers Government of India 2010 National Mission on Micro Irrigation Operational Guidelines New Delhi Ministry of Agriculture November 2010 Government of India 2004 Report of the Task Force on Micro irrigation Ministry of Agriculture New Delhi January 2004 INCID 1994 Drip Irrigation in India New Delhi Indian National Committee on Irrigation and Drainage Malik DP and MS Luhach 2002 Economic dimensions of drip irrigation in context of fruit Crops Paper presented at International Workshop on Economics of Water and Agriculture held at Institute of Food Agriculture and Environmental Sciences The Hebrew University Jerusalem Israel 18-20 December NABCONS 2009 Evaluation study of centrally sponsored scheme on Micro Irrigation Mumbai NABARD Consultancy Services Namara R E Upadhyay B Nagar R K 2005 Adoption and impacts of micro irrigation technologies Empirical results from selected localities of Maharashtra and Gujarat states of India Research Report 93 Colombo Sri Lanka International Water Management Institute Narayanamoorthy A 2012 Drip Method of Irrigation in Maharashtra Status Economics and Outreach I Narayanamoorthy A 2009 Drip and Sprinkler Irrigation in India Benefits Potential and Future Directions in Amarasinghe U T Shah RPS Malik (eds) Strategic Linking of the National River Linking Project (NRLP) of India Series 1 International Water Management Institute Colombo Narayanamoorthy A 2004 Impact assessment of drip irrigation in India The case of sugarcane Development Policy Review 22(4) 443-462 Narayanamoorthy A 2003 Averting water crises by drip method of irrigation A study of two water intensive crops Indian Journal of Agricultural Economics 58 (3) 427-437 Narayanamoorthy A 2001 Impact of drip irrigation on sugarcane cultivation in Maharashtra Agro Economic Research Centre Gokhale Institute of Politics and Economics Pune India Narayanamoorthy A 1997 Economic analyses of drip irrigation An empirical analysis from Maharashtra Indian Journal of Agricultural Economics 52 (4) 728-739 Narayanamoorthy A 1996 Evaluation of drip irrigation system in Maharashtra Mimeographed series No 42 Agro Economic Research Centre Gokhale Institute of Politics and Economics Pune India Malik RPS and MS Rathore2012 AgWater Solutions Project Case Study Accelerating Adoption of Drip Irrigation in Madhya Pradesh India
Impact Evaluation Study on ldquoNational Mission on Micro Irrigation (NMMI)rdquo
126
Palanisami K S Raman Kadiri Mohan 2012 Micro Irrigation- Economics and Outreach Macmillan Publishers India Ltd for International Water Management Institute Palanisami K Kadiri Mohan K R Kakumanu S Raman 2011 Spread and Economics of Micro irrigation in India Evidence from Nine States Economic and Political Weekly XLVI Nos 2627 June 25 2011 Patil RG (2001) water filtration for micro irrigation system In Micro irrigation Eds HP singh SP Kaushik Ashwani Kumar TS Murthy Jose C PP 574 Phansalkar SJ 2002 Appropriate Irrigation Technologies promoted by IDE A Socio Economic Assessment Raina JN Thakur BC and ML Verma (1999) Effect of drip irrigation and polyethylene mulch on yield quality and water use efficiency of tomato (Lycopersicon esculentum) Indian J Agric Sci 69 (6) 430-33 Raina JN Suman SKumar P and RSSephia (2013) Effect of Drip Fertigation With and Without Mulch on Soil Hydrothermal Regimes Growth Yield and Quality of Apple (Malus domestica Borkh Comm in Soil Sci amp Pl Annual 44 1-11 Regassa E Namara Bhawana Upadhyay and R K Nagar 2005 Adoption and Impacts of Micro irrigation Technologies Empirical Results from Selected Localities of Maharashtra and Gujarat States of India Research Report 93 Colombo Sri Lanka International Water Management Institute Sankaranarayanan KP Nalayini M Sabesh S Usha Rani R P Nachane and N Gopalakrishnan 2011 Low Cost Drip ndash Cost Effective and Precision Irrigation Tool in Bt Cotton Technical Bulletin No12011 Coimbatore Sharma RC (1998) Nature Extent and Classification In Agricultural Salinity Management in India Central Soil Salinity Research Institute Karnal UpadhyayB2003 Drip irrigation An appropriate technology for women Appropriate Technology Vol 30 (4) Verma S Tsephal S and Jose T 2004 Pepsee systems Grass root innovation underground stress Water policy 6 (2004) 1-16 Verma SR Impact of Agricultural Mechanization on Production Productivity Cropping Intensity Income Generation and Employment of Labor Status of Farm Mechanization of India 133-153 (wwwagricoopnicin)
Impact Evaluation Study on ldquoNational Mission on Micro Irrigation (NMMI)rdquo
127
Appendices Annexure I Processes of Implementation
Process for Implementation of Micro Irrigation Scheme
The Block Development Officer will receive Gram Sabha approved applications with the required documents on basis of ldquofirst come first servedrdquo basis from the farmers interested in availing benefit under the scheme through Village Horticulture Extension Officer Horticulture Development Officer and other sources such as regional workersdealers of registered manufacturing companies Action Block Development Officer At Block Development level the compiled applications will be put in a register according to priority and registered number and date will be assigned The registration number and date will be informed to beneficiary in written (Form-One) Action Block Development Officer Within three days of receiving the application a visit to farmerrsquos field will be made with Village Horticulture Extension Officer to confirm the information entered in application and field notes will be compiled in a folder (Form-Two) Action Block Development Officer Time Limit Three days After the field visits the applications will be arranged in an ordered list and sent to District Horticulture Office along with application form-three A copy of list and application will remain with Block Development Officer (Form-Three) Action Block Development Officer Time Limit Four days At district level development block wise received list will be registered and kept in same order in block wise registers From every Block Development list each application will be accepted in order Time Limit Three days Action Member Secretary District Micro Irrigation Committee (DMIC) The estimation of proposed area and cost will be made according to received applications district level integrated Action Plan will be formulated and District Micro Irrigation Committeersquos sanction proposal will be sent to State Micro Irrigation Committee Time Limit Ten days Action Member Secretary State Micro Irrigation Committee (SMIC) On the basis of district level Action Plans state level Action Plan will be prepared and after approval from State Micro Irrigation Committee (SMIC) will be sent to central governmentrsquos Department of Agriculture amp Cooperation New Delhi Time Limit Ten days Action Member Secretary State Micro Irrigation Committee (SMIC) Part-Two The information received about district wise Action Plan approved by central governmentrsquos Department of Agriculture amp Cooperation will be shared with DMIC Time Limit Three days Action Member Secretary State Micro Irrigation Committee (SMIC)
(a) After receiving information about approved Action Plan for district each block wise registered application will be forwarded to manufacturing companies which were selected by farmers for survey drawingdesign etc in an order (Form- Four) Time Limit Three days Action Member Secretary District Micro Irrigation Committee (DMIC)
Impact Evaluation Study on ldquoNational Mission on Micro Irrigation (NMMI)rdquo
128
(b) After getting the approval from the bank bank loan application will be send to the micro irrigation Company for the further required action Micro Irrigation Company will prepare drawing design etc of the farmerrsquos field in which system has to be established and make them available to Block Development Officer and Senior Horticulture Development Officer Time Limit Three days Action Micro Irrigation Company After receiving documents from Micro Irrigation Company Block Development Officer will visit concerned farmerrsquos field and will make initial physical verification of irrigation water and available energy for the proposed system which is to be established After initial physical verification required documents along with recommendation of Block Development Officer should be sent to Member Secretary DMIC (Form Five) Time Limit Three days Action Block Development Officer After receiving approved applications from Block Development Officer within stipulated time limit Member Secretary DMIC will issue administrative approval and give work orders to micro irrigation Company to accomplish work (Form- Six) Time Limit Three days after receiving applications Action Member Secretary District Micro Irrigation Committee (DMIC) After receiving work direction from Member Secretary District Micro Irrigation Committee (DMIC) Micro Irrigation Company will establish system in working condition at the site selected by concerned farmer It will give required training to farmer and manual in Hindi The satisfaction certificate will then be obtained from farmer should be sent to Member Secretary along with bills (Form- Seven) Time Limit Seven days Action Micro Irrigation Company After receiving information about system establishment from micro irrigation companies group of nominated officers from DMIC will physically verify the established system and report will be presented in prescribed form After receiving correct physical verification report the approved grant payment will be issued in prescribed form (Form-Nine) and action for payment will be ensured (Form- Eight) Time Limit Ten days Action Nominated Group for physical verification
Note (1) The process of making payments to the suppliers of materials under scheme should be made after physical verification and other necessary formalities have been completed The payment should be made according to priority (2) During physical verification concerned officials will see that system has been established according to the drawingdesign presented initially by micro irrigation Company The standard material has been provided in prescribed quantity The distribution of irrigated water is uniform at all the places The farmer has been trained to operate the system maintain it etc and manual in Hindi has been provided If during physical verification the facts are presented showing incomplete provision of system and supply of non-standard material Member Secretary will have a responsibility to inform micro irrigation Company that it should establish the system according to the presented proposal The physical verification of system should be done again before taking action to make payment to company Time Limit 3 days Action Member Secretary DMIC It will be responsibility of Head DMIC that the above action is taken in stipulated time Action Head DMIC
Impact Evaluation Study on ldquoNational Mission on Micro Irrigation (NMMI)rdquo
129
The person getting benefit out of micro irrigation scheme has to submit an affidavit on a 5 rupees stamp paper along with the necessary forms to the Assistant Director Horticulture Joint Member Secretary District Micro Irrigation Committee declaring that he will not transfer the dripsprinkler system to any other farmer neither sells it (Form- Ten) Action Beneficiary Answerable Block Development Officer The beneficiaries of this scheme will have to give in written that they or any member of their family (if combined) has not taken benefit from any Govt state Govt scheme of providing dripsprinkler for irrigation (Form- Eleven) Action Beneficiary Answerable Block Development Officer
Impact Evaluation Study on ldquoNational Mission on Micro Irrigation (NMMI)rdquo
130
Figure 13 Subsidy Process under GGRC Source Kumar amp Pullabhotla
Farmers
Approaches to MI Companies of
their choice
Application is submitted to GGRC with design and cost
estimation and 5 advance money by farmer
Get cost estimate for the installation after survey
Work Order released with 25 money to MI companies by
GGRCBank
Tri-party agreement (TPA) Collection of Management ChargesDifferent Amount
Submission of Performa Invoice for advanse payment
Installation amp trial run of MIS Third party inspection Issuance of
Insurance Cirtificate Submission of Final Bill
Payment of Balance Amount (75) by GGRCBank to MI
comp
Impact Evaluation Study on ldquoNational Mission on Micro Irrigation (NMMI)rdquo
131
Figure 14 Subsidy Process under APMIP
Source Adapted from Horticulture Department Note Abbreviations used MIAO ndash Micro-irrigation Area Officer AOHO ndash AgricultureHorticulture officer MCO ndash Micro-irrigation coordinators
Farmers
Application submitted to MIAOAgri OffHorti Off
Application form forwarded for village revenue officersquos
signature along with title deed
Forwarded to MI Company (Choice of company indicated
by farmer at the time of submission of application)
Company prepares the
design amp survey
Sent back to AOHO or
MIAO
Forwarded to AOHOMIAO who sends it
to Mandal Co-ordination Office
Will inform through MIAO to farmer of how much to
pay
Application + farmers DD (30 or farmerrsquos share)
submitted to MIAO
At district office administrative sanction
after scrutiny of documents
10 of cost released to
company as mobilization fund
Material delivery and installation to be undertaken by company within 15 days
Upon receiving completion certificate 85 of cost released to company
MCO has to inspect and furnish completion certificete
along with photograph
5 of cost is held as a guarantee for providing service Released
to company if bank guarantee is furnished
Impact Evaluation Study on ldquoNational Mission on Micro Irrigation (NMMI)rdquo
132
Box 1 Online Micro Irrigation Farmerrsquos Subsidy Management System in Tamil Nadu Subsidy Management System
Online Micro Irrigation Farmerrsquos Subsidy Management System in Tamil Nadu Subsidy Management System
With a mission to improve and increase the performance the Micro Irrigation (MI) for Horticulture and Non Horticulture crops across every region in all states of India web based software for centralized subsidy allocation and management monitoring software is developed This software was developed by Maruti Computers Private Limited (MCL) Chennai is proved to be very successful after its implementation in the state of Tamil Nadu This web based application software is an end-to-end tool which simplifies and facilitates the entire process of release of subsidy to the beneficiaries This system provides required information to all stake holders in a very transparent manner and provides paperless office and e-governance functionalities This software was developed with latest technologies and fully complies with current guidelines of Central Government MI Scheme The software is continually updated with the changes in rules and regulations and for the technology changes This software addresses the core need for this application - speedy processing of farmerrsquos subsidy requests in a transparent manner
Overview
The software was developed as per the guidelines of the MI Scheme This software is available in multiple languages For a specific state this is available in bilingual languages for various applications and annexure This will enable the beneficiary to understand the content of the application in the local language and fill without any errors
To increase the accuracy and correctness of the information submitted by the farmers software enables them to re-verify the entire data to be submitted by them System helps the applicant to correct the data before submitting to department On completion of various applications at their convenience the beneficiary can submit the application on-line
Once the entire application is in complete form system accepts the application for further processing A unique16 digit Application Id is generated by the system and with Id of the application The authorities will be able to identify the district taluka block etc along with date amp time seal The Beneficiary farmers may also submit their application online with the help of designated agencies (District Agriculture and Horticulture departments) or Sugar Mills or Micro Irrigation Companies who are all one of the stake holders of the scheme
The software and the data within the software are highly secured with access control privileges for various levels of users Data within the system cannot be manipulated or altered where they lack authority The software can generate various types of MIS reports and all stake holders The Government of India who is the sponsor of the scheme can generate reports on demand for monitoring the scheme The system has intelligence to identify and mark duplicate application Through this facility duplicate or fraudulent applicants are identified and removed from further processing The software is user friendly menu driven open-ended for future enhancements and is secure
Subsidy Processing and Monitoring The fully completed applications are then processed by the District Technical Committee Their decision of approving or rejecting the applications is fed online On approval a work order for installing the system is issued to the respective Micro Irrigation companies The Micro Irrigation companies after installing the system in the field they submit the completion certificate and their Invoice online Subsequently check Measurement done for the implementation of the system is then fed online Once check measurement is submitted Invoice submitted by the MI Companies gets approved for release of their payment and subsidy to the beneficiary
Process flow The software is built with Business Process Management (BPM) concepts BPM provides the workflow or process management capability ndash that helps an organization to formulate a step by step flow of a process and stipulate conditions for flow from one step to another It also provides tight security as who can move from one step to another
Impact Evaluation Study on ldquoNational Mission on Micro Irrigation (NMMI)rdquo
133
Box 2 Possibilities for Modifications
Possibilities for Modifications
The administrator of the system can make majority of operational changes without any programming changes The system is built on a rule driven and data driven architecture Hence by changing the data and rules the system behavior can be modified Process flow control can be managed by changing the business process flow with use of Ganges
The software application will be continuously updated MCL for the following items
-Central Government and state regulations
-Software upgrades for technology related items
Setting up of a company ndash Special Purpose Vehicle (SPV) to deal with the Micro Irrigation scheme in the states
Both the APMIP and GGRC models are different to the other State Implementing Agencies (SIA) in nature process and functioning the A key contrasting feature of this process between the two models is that under the GGRC system the farmer directly approaches the MI firm of his choice usually through a dealer whereas in the SIAAPMIP system the farmerrsquos point of contact is the local officer who has jurisdiction in the area The farmer indicates his choice of the company at the time of submitting his application and a number of additional approvals are needed before the company receives the farmerrsquos demand and proceeds to prepare the cost estimate This feature adds another layer of delay and unnecessary scrutiny in the subsidy disbursement process This is not the case under the GGRC model
Both APMIP and GGRC are independent and are not under any specific state department such as agriculture or horticulture has no crop specific crop bias
In many instances in these models the MI dealer or firm has an incentive to take up the responsibility of much of the administrative procedures such as collecting the relevant documents facilitating access to bank documentation (in case the farmer wants to avail of credit) submitting the application to the implementation authorities etc in order to speed up their own business
The GGRC encourages the suppliers to motivate the farmer for timely submission of application under MI Schemersquo and educate the farmer for availing loan procedures of Bank
Impact Evaluation Study on ldquoNational Mission on Micro Irrigation (NMMI)rdquo
134
under MI scheme This design reduces some transactional costs of availing the subsidy from farmers to MI suppliers and enhances efficiency
The implementing agency as the private sector also encourages devoting some of its own resources to promote and educate the farmers about the subsidy scheme and its guidelines in addition to the public extension efforts
Both these models however allow for various checks to scrutinize such misappropriation of subsidy through their design of the payment process and via third party verification procedures
Both APMIP and GGRC follow similar procedures for collecting the farmerrsquos share of the cost of the MI system and incorporate provisions to safeguard farmersrsquo interests The farmer pays his share to the implementing agency rather than directly to the MI firm Both the agencies releases only some portion of the amount to the supplier prior to the delivery and installation of the system as a mobilization fund
Only after the system has been installed a trial run undertaken and verified by a third party monitoring agency and with the farmer acknowledging the system performance is the complete amount (farmerrsquos contribution along with the subsidy component) released to the supplier
In view of above the GGRC model and to some extent the APMIP model incorporate useful design elements that align incentives for suppliers (of MI technology as well as credit and insurance suppliers) in a manner that is advantageous to farmers
Set up an SPV on the lines of GGRC (Gujarat) and APMIP (Andhra Pradesh) Dedicated and trained staff Timely subsidy disbursal Detailed information of the scheme to farmers All the paper work Demonstrations Warranty After Sales Services Monitoring of the companies operating in the state Monitoring of the companies operating in the state Regular training of farmers Agronomic support to farmers Make available loans and insurance to farmers
The above diagram clearly states the advantages of having the Special Purpose Vehicle (SPV) for Micro Irrigation There will be dedicated and trained staff to deal with the farmersrsquo queries and to work on the MI scheme full time The funds which do not come on time or are not properly managed will be taken care of by the SPV Often the farmers complain of not getting information on time or the complication of the Govt processes This will be dealt with once the SPV is there The SPV will help people with the paperwork and other
Impact Evaluation Study on ldquoNational Mission on Micro Irrigation (NMMI)rdquo
135
official documentation Regular demonstrations will be held and so will the work of creating awareness amongst the farmers about MI will be done The work of the registered companies will be monitored and it will be ensured that warranty and after sales service be provided to the customers The company will conduct regular training programs not only on MI but also on several other advanced topics of horticulture In addition the company will have agronomists to guide the farmers for obtaining higher yield The loan and insurance problems faced by the farmers will also be taken care of by the company by making arrangements which would be convenient to the farmers
Impact Evaluation Study on ldquoNational Mission on Micro Irrigation (NMMI)rdquo
136
Annexure II State wise Physical amp Financial Targets amp Achievements
Table 90 State wise Physical and Financial Target amp Achievements during 2005-06
State 2005-06
Physical (ha) Financial (Rs in lakh) T A A T A A
AP 45521 6775 1488 612923 934 1524 Bihar - - - - - - Chhattisgarh - - - - - - Gujarat 16720 5042 3016 218201 70117 3213 Haryana - - - - - - Karnataka 25234 - - 35841 - - Maharashtra 41856 - - 480809 - - Odisha - - - - - - Rajasthan - - - 104802 - - Sikkim - - - - - - Tamil Nadu 28950 - - - - - UP 8910 - - 124174 - - Uttarakhand - - - - - - Grand Total 180223 11817 656 2328415 163517 702
Source Ministry of Agriculture Note T- Target A- Achievement
Table 91 State wise Physical and Financial Targets amp Achievements during 2006-07
State 2006-07
Physical (ha) Financial (Rs in lakh) T A A T A A
AP 193459 84623 4374 1951968 11277 5777 Bihar 14223 - - 24821 - - Chhattisgarh 28748 4600 16 303288 25621 845 Gujarat 18247 24338 13338 33559 393095 11714 Haryana 5365 2823 5262 44389 23179 5222 Karnataka 23737 38850 16367 245675 445169 1812 Maharashtra 65119 108260 16625 879655 1346637 15309 Odisha 3314 1222 3687 45426 14319 3152 Rajasthan 39751 67721 17036 283334 268746 9485 Sikkim - - - - - - Tamil Nadu 5402 - - 120064 - - UP - 18636 - - - - Uttarakhand - - - - - - Grand Total 397365 3343006 8413 4457599 3659033 8209
Source Ministry of Agriculture Note T- Target A- Achievement
Impact Evaluation Study on ldquoNational Mission on Micro Irrigation (NMMI)rdquo
137
Table 92 State wise Physical and Financial Targets amp Achievements during 2007-08
State 2007-08
Physical (ha) Financial (Rs in lakh) T A A T A A
AP 46385 114846 24759 574776 1455942 25331 Bihar - 229 - - 2617 - Chhattisgarh 10063 2083074 20701 78339 175098 22351 Gujarat 45155 430371 9531 73496 492741 6704 Haryana 7215 778499 1079 60419 50811 8409 Karnataka 535177 62939 1176 68645 759797 11068 Maharashtra 103672 82224 7931 1389734 1279207 9205 Odisha 1032 306948 29743 1084 10127 9342 Rajasthan 44707 73735 16493 234114 2908 12421 Sikkim - - - - - - Tamil Nadu 12302 781957 6356 2200 155991 709 UP - 4659 - - 56217 - Uttarakhand - NA - - NA - Grand Total 3240487 4211739 12997 3989632 4729348 11854
Source Ministry of Agriculture Note T- Target A- Achievement
Table 93 State wise Physical and Financial Targets amp Achievements during 2008-09
State 2008-09
Physical (ha) Financial (Rs in lakh) T A A T A A
AP 85209 123581 14503 972731 1083556 11139 Bihar - 313 - - 2153 - Chhattisgarh 13633 3057361 22426 95445 206025 21586 Gujarat 33563 53427 15918 489861 739585 15098 Haryana 32404 2230169 6882 120728 127771 10583 Karnataka 84167 926223 11005 731866 584508 7987 Maharashtra 128758 100410 7798 1474806 1344402 9116 Odisha 3752 249553 6651 33794 29278 8664 Rajasthan 40231 77729 19321 238231 300915 12631 Sikkim - - - - - - Tamil Nadu - 1159735 - - 236721 - UP 1378 128748 9343 150 23512 15675 Uttarakhand - - - - - - Grand Total 423095 516338 12204 4172462 4678426 11213
Source Ministry of Agriculture Note T- Target A- Achievement
Impact Evaluation Study on ldquoNational Mission on Micro Irrigation (NMMI)rdquo
138
Table 94 State wise Physical and Financial Targets amp Achievements during 2009-10
State 2009-10
Physical (ha) Financial (Rs in lakh) T A A T A A
AP 114453 138341 12087 143107 178287 12458 Bihar NA 10748 - NA 1083 - Chhattisgarh 17636 1577119 8943 125198 119345 9533 Gujarat 33326 662491 19879 444727 542648 12202 Haryana 1576 325767 20670 21169 38539 18205 Karnataka 81311 10820517 13308 63813 868532 13611 Maharashtra 84673 94507 11161 1070708 1322628 12353 Odisha 7578 12776 16859 5284 87116 16487 Rajasthan 85211 95556 11214 569315 607335 10668 Sikkim - - - - - - Tamil Nadu - 1800803 - - 25583 - UP - 197413 - - 38114 - Uttarakhand - - - - - - Grand Total 425764 55475277 13030 4353157 5664040 13011
Source Ministry of Agriculture Note T- Target A- Achievement
Table 95 State wise Physical and Financial Targets amp Achievements during 2010-11
State 2010-11
Physical (ha) Financial (Rs in lakh) T A A T A A
AP 165500 122758 7417 24000 24000 100 Bihar - 1348504 - - 82588 NA Chhattisgarh 28780 2183093 7585 1019 1801 17674 Gujarat 80338 78294 9746 12000 1200002 100 Haryana 4426 93402 21103 136081 140227 10305 Karnataka 72700 87447 12028 9254 894525 9666 Maharashtra 11802508 11802508 100 22237 2226538 10013 Odisha 934092 1201396 12862 810 69682 8603 Rajasthan 148000 147613 9974 12000 11620 9683 Sikkim - - - - - - Tamil Nadu 35000 2615316 7472 6591 779718 1183 UP 5590 3108632 5561 8123 383 4715 Uttarakhand - - - - - - Grand Total 667700 640069 9586 9008411 917368 10183
Source Ministry of Agriculture Note T- Target A- Achievement
Impact Evaluation Study on ldquoNational Mission on Micro Irrigation (NMMI)rdquo
139
Table 96 State wise Physical and Financial Targets amp Achievements during 2011-12
State 2011-12
Physical (ha) Financial (Rs in lakh) T A A T A A
AP 88951 105063 11811 28720 28720 10000 Bihar 1961 2329428 118788 450 216683 48152 Chhattisgarh 17174 1839363 10710 3500 3500 10000 Gujarat 130294 6510182 4997 16664 1669505 10019 Haryana 6118 578608 9457 1993 166661 8362 Karnataka 63169 58013 9184 10965 9165 8358 Maharashtra 271935 11599894 4266 24980 24980 10000 Odisha 11523 1183659 10272 823 89288 10849 Rajasthan 107072 122183 11411 13095 128239 9793 Sikkim - 50969 - 400 400 10000 Tamil Nadu - 2755054 - 6625 6625 10000 UP - 379086 - - 44088 - Uttarakhand - NA - 75 - - Grand Total 698197 55752143 7985 108290 10807615 9980
Source Ministry of Agriculture Note T- Target A- Achievement
Table 97 State wise Physical and Financial Targets amp Achievements during 2012-13
State 2012-13 (March 13)
Physical (ha) Financial (Rs in lakh) T A A T A A
AP 131685 76065 5776 2899332 270209 9320 Bihar 50571 41372 8181 5200 5340 10269 Chhattisgarh 19118 14017 7332 3172 26778 8442 Gujarat 103381 96232 9308 18200 18201 10001 Haryana 9277 6538 7048 3000 257105 8570 Karnataka 107127 88605 8271 14065 1512195 10751 Maharashtra 127751 76620 5998 15018 15221 10135 Odisha 17516 19605 11193 2000 168953 8448 Rajasthan 98400 78535 7981 11000 1034708 9406 Sikkim 392 - - 200 - - Tamil Nadu 37320 26538 7111 8300 13235 15946 UP 11245 2143 1906 595 393 6605 Uttarakhand 1005 215 2139 150 70 4667 Grand Total 714788 526485 7366 10989332 11188831 10182
Impact Evaluation Study on ldquoNational Mission on Micro Irrigation (NMMI)rdquo
140
Annexure III Questionnaires
Beneficiary Farmerrsquos Questionnaire
1 General information Name of Farmer ( कसान का नाम) ----------------------------------------- Age (उ ) ------ Yrs
Village (गाव) ---------------------------------Block( लॉक)---------------------------------------------
District(िजला)------------------------------------State(रा य (---------------------------------------- Contact No (Mob)----------------------------- Landline (with STD code) -------- ------------------- E-mail id-----------------------------------------------------------------------------------------------------
2 Education status ( श ा क ि थ त)
1 Not educated(अ श त) 2 Primary( ाथ मक) 3 High school (हाई कल) 4 Sr Secondary (व र ठमा य मक) 5Graduate and above( नातकऔरऊपर)
3 Gender ( लग) - 1 Male(प ष) 2 Female (म हला)
4 Categories of farmers( कसान का जा त वग) - 1Gen(सामा य)2 OBC (अ य पछड़ा वग) 3 ST (अनस चत जनजा त) 4 SC)अनस चत जा त)
5 Land holding (भ म धारण) 1 Own land ( वयक )helliphelliphellip Acre 2 Leased in ( कराए
ल )helliphellip Acre 3Leased out ( कराय द )helliphellip Acre
6 Land holding Category of farmers (Tick ()) 1 Marginal (सीमा त)(lt 25 Acre) 2Small (छोट) (25-5 Acre) 3 Semi medium (अध - म यम )
(5-10 Acre) 4Medium (म यम) (10-25 Acre) 5 Large(बड़) (ge25Acre)
7 When the MI system was installed MI उपकरण कब लगाया गया------------------ (DDMMYY) ------ Yr
8 How did you get to know about the MI schemeआपको स म सचाई योजना कबार म
जानकार कस ह ई
Other Farmers
Advertisements व ापन Extension worker
Supplier
Any other (Specify) Radio Newspaper TV Pamphlet
Code 1 2 3 4 5 6 7 8
Impact Evaluation Study on ldquoNational Mission on Micro Irrigation (NMMI)rdquo
141
9 Which crops do you grow (आप कौन सी फसल पदा करत ह) S No
Crops फसल Name of the crop फसलकानाम
Spacing (mxm) अतराल
Area Covered (Acre)
Area Covered under MI(Acre)
Drip Sprinkler
1 Horticultural बागवानी
a Fruits फल
Veg सि जया
Flowerफल
Othersअ य
2 Non-Horticultural a b
Total Area (Acre)
10 Plantcrop management techniques used या आपन कोई फसल बधन क तकनीक इ तमाल
क ह a 1-Yes 2-No if yes then
b Area utilization (Acre)जमीन का उपयोग S No Land Before NMMI After NMMI
1 Agriculture a Horticulture crops b Field crops
2 Permanent waste Barren बजर एव अनपयोगी जमीन
3 Total Area (Acre)
8 Introduction of new crops amp spacing followed due to MI अपनाई गयी नयी फसल और
अ तराल S No Crop Spacing (mxm) 1 2
9 Irrigation Water Detailsपानी का ववरण
a Source ोत Bore well Canals Farm Ponds Water body Any other Code 1 2 3 4 helliphelliphelliphelliphelliphelliphelliphelliphelliphelliphelliphelliphelliphelliphelliphelliphelliphelliphelliphellip
b Water table helliphelliphelliphellipFt
SNo Intercropping before MI MI क पहल अतर फसल (Crops)
Intercropping after MI MI क बाद अतर फसल (Crops)
Crop Spacing (mxm) Crop Spacing (mxm) 1
2
3
Impact Evaluation Study on ldquoNational Mission on Micro Irrigation (NMMI)rdquo
142
10 Quality ofsoiland Irrigation water मटट और सचाई क पानी क गणव ता
Have you got soil amp water tested 1-yes 2-No if yes then S No Soil quality Response S No Water quality Response
i pH i pH ii EC iii EC
11 Why did you adopt NMMI schemeआप न इस योजना को य अपनाया Code Reasons Code Reasons 1 Because of subsidyअनदान क कारण 2 Quality of produceउ पाद क गणव ता 3 Water savingपानी क बचत 4 Proper utilization of land
जमीन का ठ उपयोग 5 Labor savingमजदर क बचत 6 Time savingसमय क बचत 7 Fertilizer savingउवरक क बचत 8 Early fruitingज द फलन 9 More productionअ धक उ पादन 10 Other specify_______________________
12 Impact of MI SNo Particulars Units Before MI After MI
a Irrigated Area स चत Acre
b Cost of irrigation सचाई क लागत RsAcre
c Electricity used बजल काउपयोग Hrsday
d Fertilizer usedउवरकोकाउपयोग KgAcre
e Productivity
b Fruits फल QtlsAcre
c Veg सि जया QtlsAcre
d Flowerफल QtlsAcre
e Othersअ य QtlsAcre
Non-Horticultural QtlsAcre f Incomeआय RsAcre
13 Have you got training of MI system या आपको NMMI योजना का श ण मला ह1-yes 2-No If Yes then
i By whom you got training of MI system Agencies SAUs
KVKs State Govt agencies
Kisan call centers
PFDC System supplier Others(Specify)
Code 1 2 3 4 5 6
ii Training Details (Duration (अव ध)helliphelliphellipDays)
S No Particulars 1-Yes 2-No 1 Is training material provided या श ण साम ी द जातीह
Impact Evaluation Study on ldquoNational Mission on Micro Irrigation (NMMI)rdquo
143
SAU= State Agricultural University PFDC= Precision Farming Development Centre iii Promotional activities
Awareness descriptionजाग कताकावणन 1-Yes 2-No
a Publicity of the MI Scheme in local language
इस योजना का चार थानीय भाषा म होता ह
b Whether there is a dedicated website for MI Scheme in the State
या आप क रा य म इस योजना को सम पत कोई वबसाईट ह
c Whether online applications are received
या आप क रा य म ऑनलाइन अिजया ल जाती ह
d Are you aware about package of practices being adopted for MI
या आप स म सचाई क इ तमाल करन क काय णाल को समझत ह
14 Subsidy Detailsअनदान का ववरण i
Financial assistanceआ थक सहायता
Govt () Beneficiary लाभाि वत()
Total system cost (Rs)उपकरण क लागत
Drip
Sprinkler
ii Time taken in subsidy disbursement (Days) अनदा नत राशी मलन म लगा समय ( दन म) i Application to Sanction -helliphelliphelliphelliphellipdays
ii Sanction to Installation -helliphelliphelliphelliphellipdays
2 Topic covered in the training श ण
क म
i Operation of the systemउपकरण क काय णाल
ii Maintenance of the systemउपकरण का रखरखाव
iii Package of practices for the cropsफसल क उगान क प त
iv Opportunities for Introduction of new crop नयी फसल क प रचय क ग जाइश
v Other related schemesकोई अ य स ब धत योजना
3 Have you joined any field visit या कसी खत का मआइना कया ह
4 Are you satisfied with the Learning या आपको मल पर श ण स आप सत ठ ह
Impact Evaluation Study on ldquoNational Mission on Micro Irrigation (NMMI)rdquo
144
15 Finance a Source of beneficiary share of MIलाभाि वत क ह स का ोत
1Own sources
2Banks Namehelliphelliphelliphelliphelliphelliphellip
3KCC 4Money lenders
5Any other helliphelliphelliphelliphelliphelliphelliphelliphelliphelliphelliphelliphelliphelliphelliphellip
b Rate of Interest (if money borrowed then) याज क दर (उधार लन क ि थ त म)
16 Availability of electricity बजल क उपल धता helliphelliphelliphellipHrs day
17 Power of the pump set you are using प प सट क मताhelliphelliphelliphellipHP
18 Type of fertilizer used by the farmer उपयोग म लए गए उवरक का कार
i 1 Organic 2 Inorganic 3 Both ii 1 Liquid 2Water soluble 3Solid
19 Type of Irrigation Filters used by the farmers कसान वारा इ तमाल कय जान वाल सचाई फ टर क कार
Type of Filters फ टर क कार Code
Hydro-cyclone Filterहाइ ो-साय लोन फ़ टर 1
Screen filters न फ़ टर 2
Sand Media Filtersसड मी डया फ़ टर 3
Disc Filters ड क फ़ टर 4
Any other specifyअ य ( वशष ववरण)_________________________________________
20 Employment opportunities(रोजगार क अवसर) S No Particular No of man days
before NMMI No of man days after NMMI
1 Pre harvest practices कटाई क पहल क या
2 Harvesting कटाई
3 Post-harvest handling कटाई क बाद क या
Interest rate याज दर 3-7 7-10 10-12 12-15 gt15
Code 1 2 3 4 5
Impact Evaluation Study on ldquoNational Mission on Micro Irrigation (NMMI)rdquo
145
21 Assessment of System Design णाल का आकलन
Particulars 1-Yes2-No
a Whether various system components supplied to you are as per the BIS
या आपको दए गए उपकरण क सभी ह स BISमानक क अन प ह
b Whether pump size is proper to the field plot size wrt crop water requirements
या आपक वारा लगाय गए पप का आकार आप क खत क आकार और उसम बोई गयी फसल एव उपल ध पानी क अन प ह
c Does this MI system meet your requirements
या यह MI उपकरण आपक ज रत को परा करता ह
d Is this design layout is as per your project proposal
या इस उपकरण का खाका आप क ताव क अन प ह
e Whether after sales service has been received by you from the MI system suppliers या आपको उपकरण उपल ध करान वाल न उपकरण बचन क बाद कोई सवा दान क ह
f Whether the MI systems were found to be functional in the field
या MI उपकरण खत म सचा प स काम कर रहा ह
22 System supplier
i BrandManufacturer of MI equipment usedउपकरण का नमाताhelliphelliphelliphelliphelliphelliphelliphelliphelliphelliphelliphelliphelliphelliphelliphelliphelliphelliphelliphelliphelliphelliphelliphelliphelliphelliphelliphelliphelliphelliphelliphelliphelliphelliphelliphelliphellip
ii Reasons for buying from them उनस खर दन का कारण Local Govt official Other farmers company reps Advertisements
Code 1 2 3 4
iii After sales services ब क बाद द जान वाल सवाए
Impact Evaluation Study on ldquoNational Mission on Micro Irrigation (NMMI)rdquo
146
i Is it provided by the vendor व ता वारा द जाती ह 1-Yes2-No if yes then
ii Level of satisfaction of the serviceसवा स सत ठ का तर
iii Warranty 1-Yes2-No if yes thenवारट य द ह तो
lt6 Months 1 Yr 1-2 Yr 2-3 Yr gt3 Yr Code 1 2 3 4 5
23 Difficulty faced by the farmer in NMMI
schemeNMMIयोजनाकोअपनानमउठाईगयीपरशा नया S No Particulars 1-Yes 2-No 1 Procedure related या स स ब धत
2 Quality issuesगणव ता स स ब धत
3 Higher prices charged under scheme of the system then available in marketउपकरण क बाज़ार भाव स अ धक क़ मत
4 Delay in system supply (Committed date vs Actual date ) उपकरण क आप त म दर
5 Other charges (Not covered in the scheme additional money paid) अ त र त भगतान
6 After sale services are not up to the mark बचन क बाद द गयी सवाए सतोषजनक नह
7 Other specify__________________________________________________________
24 Would you like to recommend this scheme to others या आप इस योजना को अपनान क
सलाह अ य को दग 1-Yes 2-No
Share your experiencesअपना अनभव बताए helliphelliphelliphelliphelliphelliphelliphelliphelliphelliphelliphelliphelliphelliphelliphelliphelliphelliphelliphelliphelliphelliphelliphelliphelliphelliphelliphelliphelliphelliphelliphelliphelliphelliphelliphelliphelliphelliphelliphellip helliphelliphelliphelliphelliphelliphelliphelliphelliphelliphelliphelliphelliphelliphelliphelliphelliphelliphelliphelliphelliphelliphelliphelliphelliphelliphelliphelliphelliphelliphelliphelliphelliphelliphelliphelliphelliphelliphelliphellip
1timely 2 Late 3 Irregular
1Satisfied 2 Not satisfied 3 Indifferent
Impact Evaluation Study on ldquoNational Mission on Micro Irrigation (NMMI)rdquo
147
25 Any other socio economic benefits you would like to mention कोई अ य सामिजक- आ थक लाभ i helliphelliphelliphelliphelliphelliphelliphelliphelliphelliphelliphelliphelliphelliphelliphelliphelliphelliphelliphelliphelliphelliphelliphelliphelliphelliphelliphelliphelliphelliphelliphelliphelliphellip
ii helliphelliphelliphelliphelliphelliphelliphelliphelliphelliphelliphelliphelliphelliphelliphelliphelliphelliphelliphelliphelliphelliphelliphelliphelliphelliphelliphelliphelliphelliphelliphelliphellip 26 Any suggestion for the better implementation of NMMI Scheme
NMMI योजना को सह तर क स लाग करन क लए आप क या सझाव ह
i helliphelliphelliphelliphelliphelliphelliphelliphelliphelliphelliphelliphelliphelliphelliphelliphelliphelliphelliphelliphelliphelliphelliphelliphelliphelliphelliphelliphelliphelliphelliphelliphelliphelliphellip ii helliphelliphelliphelliphelliphelliphelliphelliphelliphelliphelliphelliphelliphelliphelliphelliphelliphelliphelliphelliphelliphelliphelliphelliphelliphelliphelliphelliphelliphelliphelliphelliphellip
iii helliphelliphelliphelliphelliphelliphelliphelliphelliphelliphelliphelliphelliphelliphelliphelliphelliphelliphelliphelliphelliphelliphelliphelliphelliphelliphelliphelliphelliphelliphelliphelliphelliphelliphellip
27 Whether MI System is installed in the entire land holding Yes No 28 Any MI demonstration nearby (Yes No) 29 Type of Sprinkle (1-Portable 2-semi-permanent 3-rain gun) 30 Type of Drip (1-Inline 2-online) 31 Observations of the investigator
Condition of the MI System at the time of visit (1-Functional 2-Not Functional)
i Overall design (1-Good 2-Satisfactory 3-Bad) ii General condition of the field (1-Good condition 2-Average condition 3- Bad
condition) iii Whether Farmers are using flood irrigation along with MI system (1-Yes 2-No) iv Whether choice of drip sprinkler MI system match with the crop requirement
(1-Yes 2-No) Signature of farmer Investigatorrsquos Name कसान का ह ता र जाचकता का ह ता र
Date दनाक
Impact Evaluation Study on ldquoNational Mission on Micro Irrigation (NMMI)rdquo
148
Non-beneficiary Farmerrsquos Questionnaire)
1 General information Name of Farmer ( कसान का नाम) ----------------------------------------- Age (उ ) --------- Yrs
Village (गाव) ---------------------------------- Block( लॉक)--------------------------------------------
District(िजला)------------------------------------State(रा य----------------------------------------- Contact No (Mob)----------------------------- Landline (with STD code) -------- ------------------- E-mail id------------------------------------------------------------------------------------------------------
2 Education status ( श ा क ि थ त)
1 Not educated(अ श त) 2 Primary( ाथ मक( 3 High school (हाई कल) 4 Sr Secondary (व र ठमा य मक) 5Graduate and above( नातकऔरऊपर)
3 Gender ( लग) - 1 Male(प ष) 2 Female (म हला) 4 Categories of farmers( कसान का जा त वग) - 1Gen(सामा य)2 OBC (अ य पछड़ावग)
3 ST (अनस चत जनजा त) 4 SC)अनस चत जा त)
5 Land holding (भ म धारण) 1 Own land ( वयक )helliphelliphellip Acre 2 Leased in ( कराए ल )helliphellip Acre 3Leased out
( कराय द )helliphellip Acre
6 Land holding Category of farmers (Tick ()) 1 Marginal (सीमा त)(lt 25 Acre) 2Small (छोट) (25-5 Acre) 3 Semi medium (अध - म यम ) (5-10 Acre) 4Medium
(म यम) (10-25 Acre) 5 Large (बड़) (ge25Acre)
7 Are you aware about the NMMI scheme याआप NMMI योजना क बार म जानत ह 1-Yes 2-No
If Yes then how did you get to know about the MI scheme आप को स म सचाई योजना क बार म जानकार कस ह ई
Other Farmers
Advertisements व ापन Extension worker
Supplier Any other (Specify)
Radio Newspaper TV Pamphlet Code 8 9 10 11 12 13 14 8
8 Which crops do you grow (आप कौन सी फसल पदा करत ह)
S No Crops फसल Name of the crop फसल का नाम Spacing(mxm) Area Covered (Ha)
3 Horticultural बागवानी
f Fruits फल
g Veg सि जया
h Flowerफल
i Others अ य
4 Non-Horticultural a b
Total Area (Ha)
a Area utilization(Acre)जमीन का उपयोग S No Land Response 4 Agriculture c Horticulture crops
d Field crops 5 Permanent waste Barren बजर एव अनपयोगी जमीन
Impact Evaluation Study on ldquoNational Mission on Micro Irrigation (NMMI)rdquo
149
6 Total Area (Acre)
10 Irrigation Water Detailsपानीका ववरण
a Source ोत Bore well Canals Farm Ponds Water body Any other Code 5 6 7 8 helliphelliphelliphelliphelliphelliphelliphelliphelliphelliphelliphelliphelliphelliphelliphelliphelliphelliphelliphellip
b Water table helliphelliphelliphellipFt
11 Why did you not taken advantage of NMMI scheme आपन NMMIयोजनाकालाभ य नह लया
Code Reasons Code Reasons 11 Less aware of subsidy
अनदान क बार म अन भ 12 Less technical knowledge
तक नक ान नह 13 Lengthy procedureल बी या 14 High capital cost involvedअ धक लागत 15 Not economicalआ थक नह 16 EmittersrsquoNozzlesrsquo frequent clogging
ट ट का बार बार अव होना 17 Application yet not cleared अभीअज पास नह ह यी
18 Any other Specify________________________ ____________________________
12 Have you participated in any training program of NMMI याआपको NMMI योजनाका श ण मला ह1-Yes 2-No If Yes then
a By whom you got training of MI system
Agencies SAUs KVKs
State Govt agencies
Kisan call centers
PFDC System supplier Others(Specify)
Code 1 2 3 4 5 6
b Training Details (Duration (अव ध)helliphelliphellipDays)
SAU= State Agricultural University PFDC= Precision Farming Development Centre
c Promotional activities
Awareness descriptionजाग कता का वणन 1-Yes 2-No
e Publicity of the MI Scheme in local language इस योजना का चार थानीय भाषा म होता ह
f Whether there is a dedicated website for MI Scheme in the State
S No Particulars 1-Yes 2-No 5 Is training material provided या श ण साम ी द जाती ह
6 Topic covered in the training श ण क
म
vi Operation of the systemउपकरण क काय णाल
vii Maintenance of the systemउपकरण का रखरखाव
viii Package of practices for the cropsफसल क उगान क प त
ix Opportunities for Introduction of new crop नयी फसल क प रचय क ग जाइश
x Other related schemesकोई अ य स ब धत योजना
7 Have you joined any field visit या कसी खत का मआइना कया ह
8 Are you satisfied with the Learning या आपको मल पर श ण स आप सत ठ ह
Impact Evaluation Study on ldquoNational Mission on Micro Irrigation (NMMI)rdquo
150
या आपक रा य म इस योजना को सम पत कोई वबसाईट ह g Whether online applications are received
या आप क रा य म ऑनलाइन अिजया ल जाती ह
h Are you aware about package of practices being adopted for MI या आप स म सचाई क इ तमाल करन क काय णाल को समझत ह
13 Availability of electricity बजल क उपल धता helliphelliphelliphellipHrs day
14 Type of fertilizer used by the farmer उपयोग म लए गए उवरक का कार a 1 Organic 2 Inorganic 3 Both b 1 Liquid 2Water soluble 3Solid
15 Difficulty faced by the farmer in NMMI scheme NMMIयोजना को अपनान म उठाई गयी परशा नया S No Particulars 1-Yes 2-No 8 Procedure related या स स ब धत
9 Quality issuesगणव ता स स ब धत
10 Higher prices charged under scheme of the system then available in marketउपकरण क बाज़ार भाव सअ धक क़ मत
11 Delay in system supply (Committed date vs Actual date ) उपकरण क आप त म दर
12 Other charges (Not covered in the scheme additional money paid) अ त र त भगतान
13 After sale services are not up to the mark बचन क बाद द गयी सवाए सतोषजनक नह
14 Other specify__________________________________________________________
16 Do you like to adopt this scheme in near future या आप इस योजना को भ व य म अपनाना चाहग 1-Yes 2-No Why helliphelliphelliphelliphelliphelliphelliphelliphelliphelliphelliphelliphelliphelliphelliphelliphelliphelliphelliphelliphelliphelliphelliphelliphelliphelliphelliphelliphelliphelliphelliphelliphelliphelliphelliphelliphelliphelliphelliphelliphelliphelliphelliphellip helliphelliphelliphelliphelliphelliphelliphelliphelliphelliphelliphelliphelliphelliphelliphelliphelliphelliphelliphelliphelliphelliphelliphelliphelliphelliphelliphelliphelliphelliphelliphelliphelliphelliphelliphelliphelliphelliphelliphelliphelliphelliphelliphellip
17 Would you like make any suggestion for the better implementation of NMMI Scheme NMMI योजना को सह तर क स लाग करन क लए आपक या सझाव ह
i helliphelliphelliphelliphelliphelliphelliphelliphelliphelliphelliphelliphelliphelliphelliphelliphelliphelliphelliphelliphelliphelliphelliphelliphelliphelliphelliphelliphelliphelliphelliphelliphelliphelliphellip ii helliphelliphelliphelliphelliphelliphelliphelliphelliphelliphelliphelliphelliphelliphelliphelliphelliphelliphelliphelliphelliphelliphelliphelliphelliphelliphelliphelliphelliphelliphelliphelliphellip
iii helliphelliphelliphelliphelliphelliphelliphelliphelliphelliphelliphelliphelliphelliphelliphelliphelliphelliphelliphelliphelliphelliphelliphelliphelliphelliphelliphelliphelliphelliphelliphelliphelliphelliphellip Signature of farmer Investigatorrsquos Name कसानकाह ता र जाचकताकाह ता र
Date दनाक
Impact Evaluation Study on ldquoNational Mission on Micro Irrigation (NMMI)rdquo
151
Annexure IV Reason of higher cost of drip in Gujarat During the survey in 13 states 5892 sampled farmers holding 1481058 hectares of land were interacted Analysis of data reveals that average unit cost of drip irrigation system ranges between from 5445736 Rsha to 7208631 Rsha The average cost of drip system installation was found to be highest in Gujarat followed by Chhattisgarh Tamil Nadu Maharashtra Sikkim UP Karnataka Rajasthan Andhra Pradesh Haryana Bihar and Odisha Analysis was carried out to find out reasons for higher average unit cost of drip irrigation system in Gujarat as compared to other States Following reason are given in support
I The per cent of area coverage under sprinkler irrigation system in Gujarat is 1169 and in other states it is 8830 per cent The average cost of sprinkler irrigation system is Rs 18000 ha against Rs 55000 Rsha of drip irrigation system
II The more per cent of area coverage under drip irrigation system in Gujarat lead to higher average cost
III Figure- 1 shows area coverage under 0-10 m2 spacing it could be seen from the figure that Gujarat is far ahead from other states in term of area coverage in close spacing crops When area covered under other spaced crops is compared UP stand at 1st position in term of area coverage under wide space crops and Gujarat cover very least as can be seen from figure1
Figure 15 Area coverage under close spacing crops (spacing range lt10 m2)
Impact Evaluation Study on ldquoNational Mission on Micro Irrigation (NMMI)rdquo
152
IV When compared average unit cost per ha of drip irrigation system as per NMMI guideline the average unit cost in closed spacing crops (0-10 m2) stand at 264 times higher than the average unit cost of wide spacing crops (Spacing range more than 10 m2)
Figure 17 Spacing wise unit cost (Rsha) of drip irrigation system as per NMMI guideline
Figure 16 Area coverage under wide spacing crops (spacing range more than spacing range 10 m2
Impact Evaluation Study on ldquoNational Mission on Micro Irrigation (NMMI)rdquo
153
It is also pertinent to mention that financial assistant for installation of drip system in Gujarat is given at actual unit cost rather than as recommended in NMMI guideline which is being adopted in all states other than Gujarat In Gujarat the additional amount is given by state exchequer which escalates invoice value resulting in higher average cost
Impact Evaluation Study on ldquoNational Mission on Micro Irrigation (NMMI)rdquo
154